User login
Official news magazine of the Society of Hospital Medicine
Copyright by Society of Hospital Medicine or related companies. All rights reserved. ISSN 1553-085X
nav[contains(@class, 'nav-ce-stack nav-ce-stack__large-screen')]
header[@id='header']
div[contains(@class, 'header__large-screen')]
div[contains(@class, 'read-next-article')]
div[contains(@class, 'main-prefix')]
div[contains(@class, 'nav-primary')]
nav[contains(@class, 'nav-primary')]
section[contains(@class, 'footer-nav-section-wrapper')]
footer[@id='footer']
section[contains(@class, 'nav-hidden')]
div[contains(@class, 'ce-card-content')]
nav[contains(@class, 'nav-ce-stack')]
div[contains(@class, 'view-medstat-quiz-listing-panes')]
div[contains(@class, 'pane-article-sidebar-latest-news')]
div[contains(@class, 'pane-pub-article-hospitalist')]

PFO closure reduces the risk of recurrent stroke compared to antiplatelet therapy alone
Background: Previous research on the use of PFO closure to prevent recurrent stroke has yielded mixed results.
Study design: Gore REDUCE, CLOSE, and RESPECT were all multicenter, randomized, open-label superiority trials, with blinded adjudication of endpoint events. RESPECT data reflected an exploratory analysis of an extended follow up period.
Setting: Gore REDUCE was a multinational study conducted at 63 sites in Europe and North America, from 2008-2015. CLOSE was conducted at 34 sites in France and Germany, from 2007 to 2016. RESPECT was conducted at 69 sites in the United States and Canada, from 2003 to 2011.
Synopsis: Three trials reexamined the impact of PFO closure with standard antiplatelet treatment, with a total of 2,307 patients between the ages of 16 and 60 years. CLOSE included only patients with a PFO and an associated atrial septal aneurysm or a large interatrial shunt. Gore REDUCE and RESPECT were both industry funded. All three trials found a statistically significant reduction in risk of recurrent ischemic stroke associated with PFO closure and antiplatelet therapy compared to antiplatelet therapy alone (CLOSE HR 0.03 [95% CI 0-0.26; P less than .001], RESPECT HR 0.55 [95% CI 0.31-0.999; P = .046], Gore REDUCE HR 0.23 [95% CI 0.09-0.62; P = .002]). Gore REDUCE and CLOSE identified increased rates of postprocedural atrial fibrillation or flutter (6.6% vs. 0.4% [P less than .001], 4.6% vs. 0.9% [P = .02], respectively). Serious adverse events related to the procedure or device ranged from 3.9-5.9%.
Bottom line: PFO closure combined with antiplatelet therapy in patients aged 60 years or younger, particularly in those with significant right-to-left shunts and atrial septal aneurysms, reduced the risk of recurrent ischemic stroke compared to antiplatelet therapy alone.
Citation: Mas JL. Derumeaux B. Guillon B, et al. Patent foramen ovale closure or anticoagulation vs. antiplatelets after stroke. N Engl J Med. 2017;377(11):1011-21.
Saver JL, Carroll JD, Thaler DE, et al. Long-term outcomes of patent foramen ovale closure or medical therapy after stroke. N Engl J Med. 2017;377(11):1022-32.
Søndergaard L, Kasner SE, Rhodes JF, et al. Patent foramen ovale closure or antiplatelet therapy for cryptogenic stroke. N Engl J Med. 2017;377(11):1033-42.
Transfusion threshold and bleeding risk in malignancy-related thrombocytopenia
Background: The association between platelet counts, risk of bleeding, and transfusions in patients with thrombocytopenia related to stem cell transplant (SCT) or chemotherapy is not clear, except at very low platelet counts.
Study design: Secondary analysis of a multicenter, randomized controlled trial, stratified by cause of thrombocytopenia: autologous or syngeneic SCT (AUTO), allogeneic SCT (ALLO), or chemotherapy for hematologic malignancy without SCT (CHEMO).
Setting: Twenty-six hospitals from 2004 to 2007.
Synopsis: The PLADO trial enrolled more than 1,200 patients aged 18 years and older expected to experience a period of hypoproliferative thrombocytopenia as a result of chemotherapy or SCT, and randomized them to low, medium, or high doses of prophylactic platelets. This secondary analysis assessed laboratory predictors of bleeding, and the effect of transfusion.
Of 1,077 patients who received platelet transfusions, there were no differences between dose groups for any bleeding outcomes. Over a wide range of platelet counts, the ALLO stratum had a higher risk of bleeding than other strata, with clinically significant bleeding on 21% of patient-days in the ALLO stratum, compared with 19% in the AUTO stratum and 11% in the CHEMO stratum (P less than .001). Risk for bleeding was significantly higher at platelet counts of equal to or less than 5x10⁹/L compared with platelet counts greater than or equal to 81x109/L. Higher aPTT and INR were also associated with higher risk of clinically significant bleeding. In a multipredictor model, only hematocrit was significantly associated with more severe bleeding. Neither platelet transfusion nor RBC transfusion reduced the risk of bleeding on the following day, although the authors note some possibility of confounding by indication.
Bottom line: Predictors of overall increased risk for bleeding in patients with secondary hypoproliferative thrombocytopenia were treatment stratum, platelet counts less than or equal to 5x10⁹/L, hematocrit less than 25%, INR greater than 1.2, and aPTT greater than 30 seconds. This study challenges the conventional wisdom that transfusions reduce bleeding risk in patients with secondary hypoproliferative thrombocytopenia.
Citation: Uhl L, Assmann SF, Hamza TH, et al. Laboratory predictors of bleeding and the effect of platelet and RBC transfusions on bleeding outcomes in the PLADO trial. Blood. 2017;130(10):1247-58.
CPAP adherence linked to reduced readmissions
Hospitalized patients with obstructive sleep apnea (OSA) who were nonadherent to continuous positive airway pressure (CPAP) treatment were more than three times as likely to be readmitted for complications, according to a study.
Since preventable causes of readmission like congestive heart failure, obstructive lung disease, and diabetes are connected to OSA, boosting adherence rates to sleep apnea treatment could be an effective way to mitigate these risks.
Investigators gathered data for 345 hospitalized patients with OSA who were admitted to the VA Long Beach (Calif.) Healthcare System between January 2007 and December 2015.
Both the adherent and nonadherent groups were mostly white males. The 183 adherent patients were, on average, slightly older than the patients in the nonadherent group (66.3 vs. 62.3 years), while the nonadherent group had a larger proportion of African Americans (19.1%) than did the adherent group (10.4%).
In an analysis of both groups, 28% of nonadherent patients were readmitted within 30 days of discharge, compared with 10.2% of those in the adherent group (P less than .001). Readmission rates were significantly higher for nonadherent patients brought in for all-causes (adjusted odds ratio, 3.52; P less than .001), as were their rates of cardiovascular-related readmission (AOR, 2.31; P = .02).
The cardiovascular-related readmissions were most often caused by atrial fibrillation (29%), myocardial ischemia (22.5%), and congestive heart failure (19.3%) in the group who were not using CPAP. In this same group, urologic problems (10.7%), infections (8.0%), and psychiatric issues (5.3%) were the most common causes for hospital readmissions.
Investigators were surprised to find that the rate of pulmonary-related readmissions was not higher among nonadherent patients, considering the shared characteristics of OSA and COPD.
While nonadherent patients had an adjusted rate of pulmonary-related readmissions of 3.66, the difference between nonadherent and adherent patients was not significant.
“Those with OSA and COPD are considered to have overlap syndrome and, without CPAP therapy, are at higher risk for COPD exacerbation requiring hospitalization, pulmonary hypertension, and mortality,” according to Dr. Truong and her colleagues. “However, the number of patients with pulmonary readmissions was very small, and analysis did not reach statistical or clinical significance.”
Given the single-center nature of the study, these findings have limited generalizability. The study may also have been underpowered to uncover certain differences between the two groups because of the small population size.
Investigators reported no relevant financial disclosures.
SOURCE: K. Truong et al. J Clin Sleep Med. 2018;14(2):183–9.
The comorbidities associated with obstructive sleep apnea (OSA), such as heart failure, coronary artery disease, diabetes, and stroke, can be detrimental to patients’ care and commonly lead to hospitalization. Not only are these diseases interfering with successful treatment, but financial penalties linked to 30-day readmissions have economic implications for hospitals as well. Increasing CPAP adherence, therefore, may be a low-cost tool to improve hospital outcomes. Dr. Truong and her colleagues find compelling data showing the association of CPAP adherence and reduced 30-day readmissions. However, more work is needed before we can fully back the idea that CPAP adherence will prevent readmissions. While many studies have shown associations between OSA and cardiovascular events, there are no large, randomized trials that show the cardiovascular benefit of CPAP. The current theory is that patients who are adherent to CPAP are more likely to be healthier individuals, which makes them less likely to exhibit the comorbidities that would cause readmissions. A large randomized trial is the next logical step, and with OSA costs estimated at $2,000 annually per patient, it is a step worth pursuing.
Lucas M. Donovan, MD, is a pulmonologist at the University of Washington, Seattle. Martha E. Billings, MD, is an assistant professor in the division of pulmonary and critical care medicine at the University of Washington, Seattle. They reported no conflicts of interest.
Hospitalized patients with obstructive sleep apnea (OSA) who were nonadherent to continuous positive airway pressure (CPAP) treatment were more than three times as likely to be readmitted for complications, according to a study.
Since preventable causes of readmission like congestive heart failure, obstructive lung disease, and diabetes are connected to OSA, boosting adherence rates to sleep apnea treatment could be an effective way to mitigate these risks.
Investigators gathered data for 345 hospitalized patients with OSA who were admitted to the VA Long Beach (Calif.) Healthcare System between January 2007 and December 2015.
Both the adherent and nonadherent groups were mostly white males. The 183 adherent patients were, on average, slightly older than the patients in the nonadherent group (66.3 vs. 62.3 years), while the nonadherent group had a larger proportion of African Americans (19.1%) than did the adherent group (10.4%).
In an analysis of both groups, 28% of nonadherent patients were readmitted within 30 days of discharge, compared with 10.2% of those in the adherent group (P less than .001). Readmission rates were significantly higher for nonadherent patients brought in for all-causes (adjusted odds ratio, 3.52; P less than .001), as were their rates of cardiovascular-related readmission (AOR, 2.31; P = .02).
The cardiovascular-related readmissions were most often caused by atrial fibrillation (29%), myocardial ischemia (22.5%), and congestive heart failure (19.3%) in the group who were not using CPAP. In this same group, urologic problems (10.7%), infections (8.0%), and psychiatric issues (5.3%) were the most common causes for hospital readmissions.
Investigators were surprised to find that the rate of pulmonary-related readmissions was not higher among nonadherent patients, considering the shared characteristics of OSA and COPD.
While nonadherent patients had an adjusted rate of pulmonary-related readmissions of 3.66, the difference between nonadherent and adherent patients was not significant.
“Those with OSA and COPD are considered to have overlap syndrome and, without CPAP therapy, are at higher risk for COPD exacerbation requiring hospitalization, pulmonary hypertension, and mortality,” according to Dr. Truong and her colleagues. “However, the number of patients with pulmonary readmissions was very small, and analysis did not reach statistical or clinical significance.”
Given the single-center nature of the study, these findings have limited generalizability. The study may also have been underpowered to uncover certain differences between the two groups because of the small population size.
Investigators reported no relevant financial disclosures.
SOURCE: K. Truong et al. J Clin Sleep Med. 2018;14(2):183–9.
FROM THE JOURNAL OF CLINICAL SLEEP MEDICINE
Key clinical point:
Major finding: CPAP-nonadherent patients were 3.5 times more likely to be readmitted within 30 days.
Study details: A retrospective study of 345 patients with obstructive sleep apnea who were hospitalized at a Veterans Affairs hospital between Jan. 1, 2007, and Dec. 31, 2015.
Disclosures: Investigators reported no relevant financial disclosures.
Source: K. Truong et al. J Clin Sleep Med. 2018;14(2):183-9.
A simplified risk prediction model for patients presenting with acute pulmonary embolism
Clinical question: Is there a simplified risk prediction model to identify those with low risk pulmonary embolism (PE) who can be treated as outpatients?
Background: Existing prognostic models for patients with acute PE are dependent on comorbidities, which can be challenging to use in a scoring system. Models that make use of acute clinical variables to predict morbidity or mortality may be of greater clinical utility.
Study design: Retrospective chart review with derivation and validation analysis.
Setting: Tertiary care hospital in Chennai, India.
Synopsis: The authors identified 400 patients with acute PE who met inclusion criteria. Using logistic regression and readily accessible clinical variables previously shown to be associated with acute PE mortality, the authors created the HOPPE prediction score: heart rate, PaO2, systolic blood pressure, diastolic blood pressure, and ECG score. Each variable was classified into three groups and assigned a point value that could be summed to a cumulative 30-day mortality risk score. In the derivation and validation cohorts, the low, intermediate, and high HOPPE scores were associated with a 30-day mortality of 0%, 7.5-8.5%, and 18.2-18.8%, respectively, with similar trends for secondary outcomes including right ventricular dysfunction, nonfatal cardiogenic shock, and cardiorespiratory arrest.
In comparison with the previously validated PESI score, the HOPPE score had significantly higher sensitivity, specificity, and discriminative power. The conclusions from this study were limited by its single institutional design.
Bottom line: The HOPPE score provides a risk assessment tool to identify those patients with acute PE who are at lowest and highest risk for morbidity and mortality.
Citation: Subramanian M et al. Derivation and validation of a novel prediction model to identify low-risk patients with acute pulmonary embolism. Am J Cardiol. 2017;120(4):676-81.
Dr. Pizza is a hospitalist, Beth Israel Deaconess Medical Center, and instructor in medicine, Harvard Medical School, Boston.
Diagnostic delays, morbidity, and epidural abscesses
Clinical question: What is the frequency of diagnostic delays in epidural abscesses, and what factors may contribute to these delays?
Background: Diagnostic evaluation of back pain can be challenging. Missed diagnosis of serious conditions such as epidural abscesses can lead to significant morbidity.

Setting: Veterans Affairs Electronic Medical Record database from more than 1,700 VA outpatient and inpatient facilities in the United States.
Synopsis: Of the 119 patients with a new diagnosis of spinal epidural abscess, 55.5% were felt to have experienced a diagnostic error, defined by the study authors as a missed opportunity to evaluate a red flag (e.g. weight loss, neurologic deficit, fever) in a timely or appropriate manner. There was a significant difference in the time to diagnosis between patients with and without a diagnostic error (4 versus 12 days, P less than .01). Of those cases involving diagnostic error, 60.6% were felt to have resulted in serious patient harm and 12.1% in patient death. The most commonly missed red flags were fever, focal neurological deficits, and signs of active infection.
Based on these findings, the authors suggest that future intervention focus on improving information gathering during patient-physician encounter and physician education about existing guidelines.
The limitations of this study include its use of data from a single health system, and the employment of chart reviews instead of a root cause analysis based on provider and patient interviews.
Bottom line: A delay in diagnosis resulting in patient harm or death may occur frequently in cases of epidural abscesses. Further work on targeted interventions to reduce error and prevent harm are needed.
Citation: Bhise V, Meyer A, Singh H, et al. Diagnosis of spinal epidural abscesses in the era of electronic health records. Am J Med. 2017;130(8):975-81.
Dr. Pizza is a hospitalist, Beth Israel Deaconess Medical Center, and instructor in medicine, Harvard Medical School, Boston.
Clinical question: What is the frequency of diagnostic delays in epidural abscesses, and what factors may contribute to these delays?
Background: Diagnostic evaluation of back pain can be challenging. Missed diagnosis of serious conditions such as epidural abscesses can lead to significant morbidity.
Setting: Veterans Affairs Electronic Medical Record database from more than 1,700 VA outpatient and inpatient facilities in the United States.
Synopsis: Of the 119 patients with a new diagnosis of spinal epidural abscess, 55.5% were felt to have experienced a diagnostic error, defined by the study authors as a missed opportunity to evaluate a red flag (e.g. weight loss, neurologic deficit, fever) in a timely or appropriate manner. There was a significant difference in the time to diagnosis between patients with and without a diagnostic error (4 versus 12 days, P less than .01). Of those cases involving diagnostic error, 60.6% were felt to have resulted in serious patient harm and 12.1% in patient death. The most commonly missed red flags were fever, focal neurological deficits, and signs of active infection.
Based on these findings, the authors suggest that future intervention focus on improving information gathering during patient-physician encounter and physician education about existing guidelines.
The limitations of this study include its use of data from a single health system, and the employment of chart reviews instead of a root cause analysis based on provider and patient interviews.
Bottom line: A delay in diagnosis resulting in patient harm or death may occur frequently in cases of epidural abscesses. Further work on targeted interventions to reduce error and prevent harm are needed.
Citation: Bhise V, Meyer A, Singh H, et al. Diagnosis of spinal epidural abscesses in the era of electronic health records. Am J Med. 2017;130(8):975-81.
Dr. Pizza is a hospitalist, Beth Israel Deaconess Medical Center, and instructor in medicine, Harvard Medical School, Boston.
Supplemental oxygen use for suspected myocardial infarction without hypoxemia
Background: Clinical guidelines recommend supplemental oxygen in patients with suspected acute myocardial infarction but data to support its use in patients without hypoxemia are limited.
Study design: Open-label, registry based randomized clinical trial.
Setting: Thirty-five hospitals in Sweden with acute cardiac care facilities.
Synopsis: Authors included 6,629 patients aged 30 and older who presented with symptoms suggestive of myocardial infarction. Patients with oxygen saturations 90% or greater were enrolled in the study and randomly assigned to either 6 liters per minute of face mask oxygen for 6-12 hours or ambient air. Median oxygen saturation was 99% in the treatment group and 97% in the ambient air group (P less than .0001). In an intention-to-treat model, 1 year after randomization there was no significant difference in all-cause mortality between the oxygen (5.0%) and ambient air (5.1%) groups (P = .80). There was no difference in the rate of rehospitalization with myocardial infarction or the composite endpoint of all-cause mortality and rehospitalizations for myocardial infarction at 30 days and 1 year. Limitations of this study include lower power than anticipated since calculations were based on a higher mortality rate than observed in this study, and the open-label protocol.
Bottom line: In patients who present with a suspected myocardial infarction without hypoxemia, oxygen therapy is not associated with improved all-cause mortality or decreased rehospitalizations for myocardial infarction.
Citation: Hofmann R, Jernberg T, Erlinge D, et al. Oxygen therapy in suspected acute myocardial infarction. N Engl J Med. 2017;377:1240-9.
Dr. Gala is a hospitalist, Beth Israel Deaconess Medical Center, and instructor in medicine, Harvard Medical School, Boston.
Flu increase may be slowing
A bit of revisionist history has outpatient influenza activity at a lower level than was reported last week, even though it hasn’t dropped.
The proportion of outpatient visits for influenza-like illness (ILI) for the week ending Feb. 10 was 7.5%, according to the Centers for Disease Control. That is lower than the 7.7% previously reported for the week ending Feb. 3, which would seem to be a drop, but the CDC also has revised that earlier number to 7.5%, so there is no change. (This is not the first time an earlier ILI level has been retroactively lowered: The figure reported for the week ending Jan. 13 was revised in the following report from 6.3% down to 6.0%.)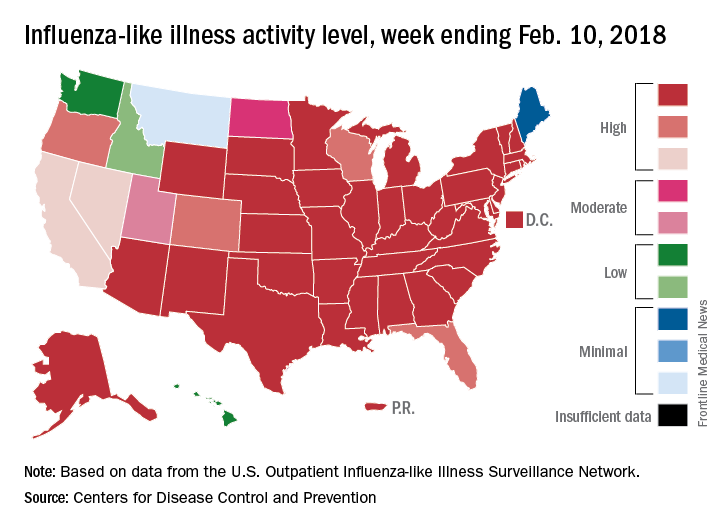
Hospital visits, however, continue to rise at record levels. The cumulative rate for the week ending Feb. 10 was 67.9 visits per 100,000 population, which is higher than the same week for the 2014-2015 (52.9 per 100,000) when flu hospitalizations for the season hit a high of 710,000. Flu-related pediatric deaths also went up, with 22 new reports; this brings the total to 84 for the 2017-2018 season.
FROM THE CDC WEEKLY U.S. INFLUENZA SURVEILLANCE REPORT
Anticoagulation use in new-onset secondary atrial fibrillation
Background: Data on the efficacy of anticoagulation to reduce stroke risk in patients with new-onset atrial fibrillation due to acute coronary syndrome (ACS), acute pulmonary disease (APD), and sepsis are limited.
Study design: Retrospective cohort study.
Setting: All hospitals in Quebec.
Synopsis: Authors included 2,304 patients aged 65 and older with new atrial fibrillation secondary to ACS, APD, and sepsis. Anticoagulation was started for 38.4%, 34.1%, and 27.7% of these patients and the incidence of stroke was 5.4%, 3.9%, and 5.8% in the ACS, APD, and sepsis populations, respectively. After 3 years, anticoagulation use was not associated with a lower risk of ischemic stroke in any cohort. In a multivariate analysis adjusted for the HAS-BLED score, anticoagulation was associated with a higher risk of bleeding in patients with APD (odds ratio, 1.72; 95% confidence interval, 1.23-2.39) but not in ACS or sepsis.
The major limitation of this study was the reliance on administrative data alone, making it difficult to confirm and capture all patients with transient atrial fibrillation.
Bottom line: Anticoagulation use in patients with secondary atrial fibrillation may not be associated with a reduction in ischemic strokes, but may be associated with an increased bleeding risk in patients with atrial fibrillation secondary to acute pulmonary disease.
Citation: Quon MJ et al. Anticoagulant use and risk of ischemic stroke and bleeding in patients with secondary atrial fibrillation associated with acute coronary syndromes, acute pulmonary disease, or sepsis. JACC: Clinical Electrophysiology. Article in Press.

Dr. Gala is a hospitalist, Beth Israel Deaconess Medical Center, and instructor in medicine, Harvard Medical School, Boston.
Background: Data on the efficacy of anticoagulation to reduce stroke risk in patients with new-onset atrial fibrillation due to acute coronary syndrome (ACS), acute pulmonary disease (APD), and sepsis are limited.
Study design: Retrospective cohort study.
Setting: All hospitals in Quebec.
Synopsis: Authors included 2,304 patients aged 65 and older with new atrial fibrillation secondary to ACS, APD, and sepsis. Anticoagulation was started for 38.4%, 34.1%, and 27.7% of these patients and the incidence of stroke was 5.4%, 3.9%, and 5.8% in the ACS, APD, and sepsis populations, respectively. After 3 years, anticoagulation use was not associated with a lower risk of ischemic stroke in any cohort. In a multivariate analysis adjusted for the HAS-BLED score, anticoagulation was associated with a higher risk of bleeding in patients with APD (odds ratio, 1.72; 95% confidence interval, 1.23-2.39) but not in ACS or sepsis.
The major limitation of this study was the reliance on administrative data alone, making it difficult to confirm and capture all patients with transient atrial fibrillation.
Bottom line: Anticoagulation use in patients with secondary atrial fibrillation may not be associated with a reduction in ischemic strokes, but may be associated with an increased bleeding risk in patients with atrial fibrillation secondary to acute pulmonary disease.
Citation: Quon MJ et al. Anticoagulant use and risk of ischemic stroke and bleeding in patients with secondary atrial fibrillation associated with acute coronary syndromes, acute pulmonary disease, or sepsis. JACC: Clinical Electrophysiology. Article in Press.
Dr. Gala is a hospitalist, Beth Israel Deaconess Medical Center, and instructor in medicine, Harvard Medical School, Boston.
Building a better U.S. health care system
Since 2010, when Democrats passed the Affordable Care Act – also known as Obamacare – without a single Republican vote, the GOP has vowed to repeal and replace it. With the election of Donald Trump in November 2016, Republicans gained control of the presidency and Congress and hoped to put Obamacare on the chopping block.

Although the Affordable Care Act’s (ACA’s) individual mandate was eliminated in the Tax Cuts and Jobs Act passed in late 2017, Republican leaders have been unable to secure the votes they need for a full repeal of Obamacare and a complete reboot of the American health care system. That may be, in part, because in the search for a better American health care system, there is no single right answer. In few places is that more clear than when making comparisons of health care systems across the world.
“Comparisons are fun, and everyone loves rankings,” said Ashish Jha, MD, MPH, a physician with the Harvard T.H. Chan School of Public Health and director of the Harvard Global Health Institute in Cambridge, Mass. Last fall Shah published an analysis on his personal blog comparing health care in the United States with that in seven high-income nations.1 It was prompted by a similar side-by-side comparison he participated in with other experts for the New York Times.2 “The most important part is we get to ask questions about things we care about, like ‘What do other countries do when they’re better than us?’ We’re not going to adopt any country’s model wholesale, but we can learn from them,” he said.
For instance, just 7.4% of people in Switzerland (according to data from the Organisation for Economic Cooperation and Development) skip medical tests, treatments, or follow-ups because of costs, compared with 21.3% in the United States. Meanwhile, the United States leads in innovation, producing 57% of new drugs (according to the Milken Institute), which is more than Switzerland’s 13% and Germany’s 6%.1
Although many Americans tend to think that health care in other developed nations is entirely single payer or government run, systems across Europe and the rest of the globe vary immensely in how they approach health care. One thing common among high-income nations, however, is some form of universal health care. In Canada, for example, the government funds health insurance for care delivered in the private sector. In Australia, public hospitals provide free inpatient care. In France, the Ministry of Health sets prices, budgets, and funding levels.2
“There are really two main purposes” when it comes to international comparisons, said Eric Schneider, MD, senior vice president for policy and research for the Commonwealth Fund. “The first is to understand how other countries perform, and the second is what lessons can we learn from the way care is financed, organized, and delivered in other nations and how we might import some of those ideas to the U.S. and improve policies here.”
The Affordable Care Act, Dr. Jha said, was something of the ultimate test for applying lessons learned in other countries and those put forward over the past decades in the United States by policy experts and leaders in health care thinking.
“The Affordable Care Act includes several ideas that are prevalent in other countries, particularly around how to expand insurance coverage and how to subsidize the poor so they can have good insurance coverage, too,” said Dr. Schneider. “The notion of essential health benefits, the mandate for insurance, the notion of subsidies, in some ways, these were all borrowed from abroad.”
For instance, health care in The Netherlands – which, like the United States, also relies on private health insurers – ranked among the highest of other high-income countries in the world in The Commonwealth Fund’s 2017 international comparison, published in July 2017.3 The Dutch have standardized their health benefits, reducing administrative burden for providers and making copayments more predictable for patients.
Dr. Schneider believes that the United States should continue to build on the progress of the Affordable Care Act – particularly since more than 20 million Americans have gained insurance coverage since the passage of the law (91% of Americans are insured today).4 And the ACA has renewed focus in the United States on improving and strengthening primary care and changing the incentives around care delivery.
Some Democrats and Republicans in Congress have started working on bipartisan solutions to solve some of the problems inherent in the ACA – or those engineered by those who oppose it.

That direction is, at least in part, a health care system with spending that continues to rank among the highest in the world.1,3 The United States spends more than 17% of its GDP on health care, compared with the 11.4% spent by Switzerland, which Jha ranked as having the best health care system among the high-income nations he evaluated.1Craig Garthwaite, a conservative health economist at Northwestern University’s Kellogg School of Management in Evanston, Ill., called the Swiss health care system a “better-functioning version of the Affordable Care Act” in the New York Times’ head-to-head debate.2
However, Dr. Lenchus noted that Switzerland’s system may not be scalable to a country the size of the United States. At 8.5 million people, Switzerland’s population is on par with that of New York City. The U.S. system must support more than 323 million people.
And international comparisons can be challenging for other reasons, as Dr. Jha wrote in a JAMA Viewpoint piece in August 2017 with coauthor Irene Papanicolas, PhD, of the London School of Economics, because they must account for the limitations of data, consider different values in national systems, and define the boundaries of the health system.5 For instance, Dr. Schneider said, some other high-income countries also invest more in housing, nutrition, and transportation than does the United States, which reduces the detrimental impact of social determinants of health, like poverty, poor nutrition, and homelessness.
Dr. Lenchus believes better health care in the United States hinges on more community-level investments and partnerships and on more focus on the social determinants of health. “To some degree, this country should be able to leverage the resources we have at a community level to improve the health of that community’s population,” he said. “Hospitalists are in a prime position to do that.”
Indeed, the Commonwealth Fund report concluded the United States excels on measures that involve the doctor-patient relationship – like end-of-life discussions and chronic disease management – and on preventive measures like screening mammography and adult influenza vaccination.
In a New England Journal of Medicine Perspective published in July 2017, Dr. Schneider and a coauthor outlined four strategies to improve health care in the United States, gleaned from comparisons abroad: ensure universal and adequate health insurance coverage, strengthen primary care, reduce administrative burden, and reduce income-related disparities.6
Regardless of how the United States goes about achieving a better health care system, Dr. Jha said we should stop the partisan rhetoric.
“Where I find a lot of consensus is we should have more competition and less monopoly,” he said. “Liberals and conservatives should be able to get together and say: We are really going to have competitive markets, and we should see the prices of health care services fall; we should see premiums come down, and it would make the coverage problem a lot easier to solve.”
References
1. Jha A. Judging health systems: focusing on what matters. An Ounce of Evidence. Published Sep 18, 2017. Last accessed Oct 19, 2017. https://blogs.sph.harvard.edu/ashish-jha/.
2. Carroll AE et al. The best health care system in the world: Which one would you pick? New York Times. Published Sep 18, 2017. Accessed Oct 19, 2017. https://www.nytimes.com/interactive/2017/09/18/upshot/best-health-care-system-country-bracket.html?action=click&contentCollection=upshot®ion=rank&module=package&version=highlights&contentPlacement=1&pgtype=sectionfront.
3. Schneider EC et al. Mirror, mirror 2017: International comparison reflects flaws and opportunities for better U.S. health care. The Commonwealth Fund. Published Jul 14, 2017. Accessed Oct 19, 2017. http://www.commonwealthfund.org/publications/fund-reports/2017/jul/mirror-mirror-international-comparisons-2017.
4. Martinez ME et al. Health insurance coverage: Early release of estimates from the national health interview survey, January-September 2016. Centers for Disease Control and Prevention, Division of Health Interview Statistics, National Center for Health Statistics. Published Feb, 2017. Accessed Oct 19, 2017. https://www.cdc.gov/nchs/data/nhis/earlyrelease/insur201702.pdf.
5. Papanicolas I et al. Challenges in international comparison of health care systems. JAMA. 2017 Aug 8;318(6):515-6. https://jamanetwork.com/journals/jama/article-abstract/2646461.
6. Schneider EC et al. From last to first – Could the U.S. health care system become the best in the world? N Engl J Med. 2017 Sep 7; 377(10):901-4.
Since 2010, when Democrats passed the Affordable Care Act – also known as Obamacare – without a single Republican vote, the GOP has vowed to repeal and replace it. With the election of Donald Trump in November 2016, Republicans gained control of the presidency and Congress and hoped to put Obamacare on the chopping block.
Although the Affordable Care Act’s (ACA’s) individual mandate was eliminated in the Tax Cuts and Jobs Act passed in late 2017, Republican leaders have been unable to secure the votes they need for a full repeal of Obamacare and a complete reboot of the American health care system. That may be, in part, because in the search for a better American health care system, there is no single right answer. In few places is that more clear than when making comparisons of health care systems across the world.
“Comparisons are fun, and everyone loves rankings,” said Ashish Jha, MD, MPH, a physician with the Harvard T.H. Chan School of Public Health and director of the Harvard Global Health Institute in Cambridge, Mass. Last fall Shah published an analysis on his personal blog comparing health care in the United States with that in seven high-income nations.1 It was prompted by a similar side-by-side comparison he participated in with other experts for the New York Times.2 “The most important part is we get to ask questions about things we care about, like ‘What do other countries do when they’re better than us?’ We’re not going to adopt any country’s model wholesale, but we can learn from them,” he said.
For instance, just 7.4% of people in Switzerland (according to data from the Organisation for Economic Cooperation and Development) skip medical tests, treatments, or follow-ups because of costs, compared with 21.3% in the United States. Meanwhile, the United States leads in innovation, producing 57% of new drugs (according to the Milken Institute), which is more than Switzerland’s 13% and Germany’s 6%.1
Although many Americans tend to think that health care in other developed nations is entirely single payer or government run, systems across Europe and the rest of the globe vary immensely in how they approach health care. One thing common among high-income nations, however, is some form of universal health care. In Canada, for example, the government funds health insurance for care delivered in the private sector. In Australia, public hospitals provide free inpatient care. In France, the Ministry of Health sets prices, budgets, and funding levels.2
“There are really two main purposes” when it comes to international comparisons, said Eric Schneider, MD, senior vice president for policy and research for the Commonwealth Fund. “The first is to understand how other countries perform, and the second is what lessons can we learn from the way care is financed, organized, and delivered in other nations and how we might import some of those ideas to the U.S. and improve policies here.”
The Affordable Care Act, Dr. Jha said, was something of the ultimate test for applying lessons learned in other countries and those put forward over the past decades in the United States by policy experts and leaders in health care thinking.
“The Affordable Care Act includes several ideas that are prevalent in other countries, particularly around how to expand insurance coverage and how to subsidize the poor so they can have good insurance coverage, too,” said Dr. Schneider. “The notion of essential health benefits, the mandate for insurance, the notion of subsidies, in some ways, these were all borrowed from abroad.”
For instance, health care in The Netherlands – which, like the United States, also relies on private health insurers – ranked among the highest of other high-income countries in the world in The Commonwealth Fund’s 2017 international comparison, published in July 2017.3 The Dutch have standardized their health benefits, reducing administrative burden for providers and making copayments more predictable for patients.
Dr. Schneider believes that the United States should continue to build on the progress of the Affordable Care Act – particularly since more than 20 million Americans have gained insurance coverage since the passage of the law (91% of Americans are insured today).4 And the ACA has renewed focus in the United States on improving and strengthening primary care and changing the incentives around care delivery.
Some Democrats and Republicans in Congress have started working on bipartisan solutions to solve some of the problems inherent in the ACA – or those engineered by those who oppose it.
That direction is, at least in part, a health care system with spending that continues to rank among the highest in the world.1,3 The United States spends more than 17% of its GDP on health care, compared with the 11.4% spent by Switzerland, which Jha ranked as having the best health care system among the high-income nations he evaluated.1Craig Garthwaite, a conservative health economist at Northwestern University’s Kellogg School of Management in Evanston, Ill., called the Swiss health care system a “better-functioning version of the Affordable Care Act” in the New York Times’ head-to-head debate.2
However, Dr. Lenchus noted that Switzerland’s system may not be scalable to a country the size of the United States. At 8.5 million people, Switzerland’s population is on par with that of New York City. The U.S. system must support more than 323 million people.
And international comparisons can be challenging for other reasons, as Dr. Jha wrote in a JAMA Viewpoint piece in August 2017 with coauthor Irene Papanicolas, PhD, of the London School of Economics, because they must account for the limitations of data, consider different values in national systems, and define the boundaries of the health system.5 For instance, Dr. Schneider said, some other high-income countries also invest more in housing, nutrition, and transportation than does the United States, which reduces the detrimental impact of social determinants of health, like poverty, poor nutrition, and homelessness.
Dr. Lenchus believes better health care in the United States hinges on more community-level investments and partnerships and on more focus on the social determinants of health. “To some degree, this country should be able to leverage the resources we have at a community level to improve the health of that community’s population,” he said. “Hospitalists are in a prime position to do that.”
Indeed, the Commonwealth Fund report concluded the United States excels on measures that involve the doctor-patient relationship – like end-of-life discussions and chronic disease management – and on preventive measures like screening mammography and adult influenza vaccination.
In a New England Journal of Medicine Perspective published in July 2017, Dr. Schneider and a coauthor outlined four strategies to improve health care in the United States, gleaned from comparisons abroad: ensure universal and adequate health insurance coverage, strengthen primary care, reduce administrative burden, and reduce income-related disparities.6
Regardless of how the United States goes about achieving a better health care system, Dr. Jha said we should stop the partisan rhetoric.
“Where I find a lot of consensus is we should have more competition and less monopoly,” he said. “Liberals and conservatives should be able to get together and say: We are really going to have competitive markets, and we should see the prices of health care services fall; we should see premiums come down, and it would make the coverage problem a lot easier to solve.”
References
1. Jha A. Judging health systems: focusing on what matters. An Ounce of Evidence. Published Sep 18, 2017. Last accessed Oct 19, 2017. https://blogs.sph.harvard.edu/ashish-jha/.
2. Carroll AE et al. The best health care system in the world: Which one would you pick? New York Times. Published Sep 18, 2017. Accessed Oct 19, 2017. https://www.nytimes.com/interactive/2017/09/18/upshot/best-health-care-system-country-bracket.html?action=click&contentCollection=upshot®ion=rank&module=package&version=highlights&contentPlacement=1&pgtype=sectionfront.
3. Schneider EC et al. Mirror, mirror 2017: International comparison reflects flaws and opportunities for better U.S. health care. The Commonwealth Fund. Published Jul 14, 2017. Accessed Oct 19, 2017. http://www.commonwealthfund.org/publications/fund-reports/2017/jul/mirror-mirror-international-comparisons-2017.
4. Martinez ME et al. Health insurance coverage: Early release of estimates from the national health interview survey, January-September 2016. Centers for Disease Control and Prevention, Division of Health Interview Statistics, National Center for Health Statistics. Published Feb, 2017. Accessed Oct 19, 2017. https://www.cdc.gov/nchs/data/nhis/earlyrelease/insur201702.pdf.
5. Papanicolas I et al. Challenges in international comparison of health care systems. JAMA. 2017 Aug 8;318(6):515-6. https://jamanetwork.com/journals/jama/article-abstract/2646461.
6. Schneider EC et al. From last to first – Could the U.S. health care system become the best in the world? N Engl J Med. 2017 Sep 7; 377(10):901-4.
Blood test approved for patients with concussions
The Food and Drug Administration approved a new blood test on Feb. 14 – the Banyan Brain Trauma Indicator – for assessing patients with mild traumatic brain injuries, also known as concussions.
Most traumatic brain injuries are classified as “mild,” and the majority of patients have negative CT scans, according to an FDA announcement. Within a matter of hours, this test can help predict which patients will have negative scans by measuring certain proteins released by brain tissue, thereby potentially eliminating unnecessary imaging – and the costs and radiation exposure that would go along with it.![]()
Read more in the FDA’s press release.