User login
Treating depression: What works besides meds?
› Recommend cognitive behavioral therapy, interpersonal therapy, or problem-solving therapy for the treatment of depression in patients of all ages. A
› Consider prescribing exercise as a stand-alone or adjunctive treatment for patients with depression. B
› Advise patients who ask about omega-3 fatty acid supplements that formulations with a high eicosapentaenoic acid (EPA) to docosahexaenoic acid (DHA) ratio (2:1) may be a useful “add-on” to their current regimen. B
Strength of recommendation (SOR)
A Good-quality patient-oriented evidence
B Inconsistent or limited-quality patient-oriented evidence
C Consensus, usual practice, opinion, disease-oriented evidence, case series
CASE 1 › Steve J, age 43, comes to your clinic looking uncharacteristically glum. He was recently downsized from his job and misses his former colleagues. His job loss has caused a financial strain for his family, and he admits to crying in the shower when he thinks about how his life has turned out. Mr. J tells you that he’s gotten a part-time job, but he’s already called in sick several times. On those sick days he “stayed in bed all day and slept.” He says that when he does go to work, he rarely interacts with his coworkers and his concentration is poor. He tells you he wakes up early in the morning on most days and cannot return to sleep, despite being “tired all the time.” He denies suicidal ideation. Mr. J has never felt this way before, which is what prompted his visit today, but he thinks it is “weak to take a pill to feel better.”
What nonpharmacologic options can you offer him?
CASE 2 › Kerri S is a 27-year-old mother of 2 who comes to your clinic to establish care. She tells you about a recent recurrence of depressed mood, which she feels is due to the stress of moving to the area. She is experiencing sleep-onset insomnia and concentration lapses. Her appetite is poor (self-reported 8-lb weight loss in 2 months) and she lacks the motivation to engage in her daily activities, saying, “I wouldn’t even get out of bed if my kids didn’t need me.” She notes that she is constantly irritable and has completely lost her sex drive. Unlike her prior depressive episode, she has not had any suicidal thoughts. Mrs. S was previously successfully treated with paroxetine, 20 mg/d, but she is not interested in restarting her medication because she is still breastfeeding her toddler.
Are there evidence-based options for her care that do not include medication?
Major depressive disorder (MDD) is widespread and often disabling, affecting nearly 8% of people ages 12 and older at any given time.1 Thus, it’s crucial to be familiar with the diverse array of evidence-based treatment options from which patients can choose. Although medications are an essential treatment option for patients with severe depression, their value for patients with mild to moderate depression is often limited.2 In addition, when antidepressants aren’t combined with psychosocial interventions, discontinuing them is associated with relapse.3
Fortunately, research has found that certain nonpharmacologic interventions—including psychotherapies, somatic therapies, and dietary supplements—can have either therapeutic or adjunctive benefits for treating depression, and can be provided in ways that are time- and cost-effective. This article reviews the evidence supporting several options in each of these treatment categories.
Evidence backs several types of psychotherapy
Several recent meta-analyses suggest that a variety of psychotherapeutic treatments may hold promise for your patients with depression.4,5 When analyses were limited to larger studies in order to decrease the risk of bias, cognitive behavioral therapy (CBT), interpersonal therapy (IPT), and problem-solving therapy (PST) all resulted in moderate to large improvement in depressive symptoms when compared to wait-list controls.4 These findings were echoed in a recent systematic review/meta-analysis that focused on depressed primary care patients. Linde et al5 found that the number needed to treat (NNT) to achieve one response (≥50% reduction in score on a depression scale) using any type of psychotherapy was 10, and the NNT to achieve one remission (scoring below a predefined score on a depression scale) was 15.
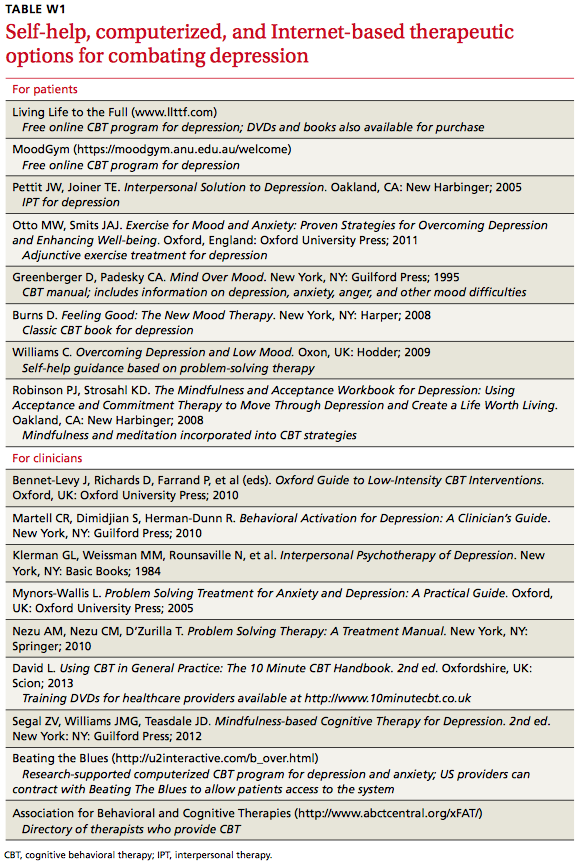
Psychotherapy can be effective when provided in individual and group settings,6 as well as via telephone, the Internet, or software programs.7 (For a list of self-help, computerized, and Internet-based resources, see TABLE W1 below.)
CBT has been studied for several decades and there’s strong evidence for its efficacy.6 Recent investigations have suggested that CBT delivered in less resource-intensive modes (such as via computer program, Internet, telephone, or videoconferencing) can be as effective as face-to-face CBT.6,8 CBT has been shown to be helpful for a wide range of patients,6 improves outcomes over standard primary care treatment,9 and provides a useful adjunct to medication in treatment-resistant severe depression.10
Behavioral activation (BA), which generally is included as a component of CBT, has received support as an independent treatment, and may produce therapeutic results similar to CBT11 and PST (which we’ll discuss in a bit).12 The core components of BA are scheduling pleasant activities and increasing the patient’s positive interactions with his or her environment by decreasing avoidance, withdrawal, and inactivity.11 Compared to CBT, BA is easier for clinicians to learn and incorporate into primary care visits, and it may be especially useful as an adjunctive or first-step intervention in outpatient clinics.11 Like CBT, BA can be effective in diverse patient groups13,14 and can be provided using novel delivery modes, such as via the Internet.15
IPT is a supportive, structured, brief therapy (12-16 visits) that focuses on helping patients identify and solve current situation- and relationship-based problems that stem from or contribute to their depression.16 Enhancing the patient’s interpersonal communication—including improving social skills, assertiveness, and appropriate expression of anger—is typically a component of IPT. Like CBT, IPT has been found to be effective for treating depression when administered in person, in group therapy, or via the phone or Internet, and across a broad age range.17-19
PST involves teaching patients a structured problem-solving process to decrease interpersonal strain and improve positive life experiences.20 Patients are taught to define their problem, generate and evaluate multiple solutions for it, implement a plan for the solution, and evaluate the results. In addition to being used to successfully treat adults,4,5 PST has been adapted effectively to treat adolescents16 and older adults.18
Somatic therapies are also an option
Exercise has long been considered a possible depression treatment due to its activity on endorphin, monoamine, and cortisol levels and via increased social and general activity. A 2013 Cochrane review of 39 randomized control trials (RCTs; N=2326) assessed whether exercise was effective for treating depression in adults.21 Thirty-five trials found a moderate effect size when specifically comparing exercise to no treatment or control interventions. The effect size was reduced, however, when analyses were restricted to trials with the highest methodological quality. There was no statistically significant difference when exercise was compared to pharmacologic treatment or psychotherapy.
Although the amount of research is meager, small but statistically significant improvements have also been found for older adults22 and children/adolescents.23 There is no consensus on the type, frequency, or intensity of exercise needed to achieve benefit. However, because nearly all studies for all age groups have found that exercise has no adverse psychological effects and substantial positive physical effects, exercise should be recommended to all patients with depression unless contraindicated.
Yoga (both exercise-based and meditation-based) has been evaluated both as a sole treatment and as an adjunctive treatment for depression. Several studies have supported the impact of yoga, particularly in pregnant women,24 although the evidence for its efficacy is inconsistent, with yoga frequently failing to improve upon the outcome of waitlist control.25 The evidence for meditation and mindfulness is more consistently positive, with these interventions equaling or exceeding “treatment as usual,” other psychotherapies, and antidepressants in numerous RCTs.25
Electroconvulsive therapy (ECT) has a substantial evidence base supporting its efficacy.26 ECT has been used for decades, although stigma, cardiac and memory risks, and risks of anesthesia often limit its use. Benefits of ECT include a rapid response relative to pharmacotherapy (>50% of patients respond by the end of the first week of ECT)27 and a strong response in older patients.28
In repetitive transcranial magnetic stimulation (rTMS), electromagnetic coils are placed on a patient’s head to deliver electromagnetic pulses that stimulate areas of the brain that regulate mood. Although rTMS is not widely available, a growing body of evidence supports its use for treating depression, including a meta-analysis of 34 RCTs that included 1383 patients.29 A multisite RCT (N=190) that was not industry-funded reported a 15% response rate and 60% maintenance of remission at 3 months (NNT=12).30 Although ECT is more effective than rTMS, rTMS appears useful for treatment-resistant depression, and can be used as an adjunctive treatment.29,31
Dietary supplements may be best used as adjuncts
St. John’s wort (Hypericum perforatum), which contains 2 bioactive ingredients (hyperforin and hypericin), has been effectively used to treat depression.32 A 2008 Cochrane review that was limited to high-quality trials involving patients meeting Diagnostic and Statistical Manual of Mental Disorders, 4th Edition criteria for depression identified 29 trials (N=5489), of which 18 involved comparisons with placebo and 17 with standard antidepressants.33 Patients’ depression was rated mild to moderate in 19 studies and moderate to severe in 9 studies. Trials examined 4 to 12 weeks of treatment with Hypericum extracts. This study (and several published since) provides strong clinical evidence supporting the efficacy of St. John’s wort for mild to moderate depression. There is insufficient evidence for its use for severe major depression.33TABLE 1 contains dosing information for St. John’s wort and other supplements used to treat depression.34-36
S-adenosyl-L-methionine (SAMe). In a 2003 systematic review,37 1600 mg/d of oral SAMe was found to significantly benefit patients with depression in 4 of 5 studies, as did parenteral SAMe (7 of 7 trials). Another review of 48 studies found SAMe was safe and effective for depression.38 SAMe has been proposed for use alone or in combination with an antidepressant.
Folate and folic acid. Low folate levels have been associated with a less robust response to antidepressants in patients with MDD,39 and higher folate levels appear to be associated with better antidepressant response.40 A 2003 Cochrane review suggested folate might have a role in treating depression.39 A 2009 study found folate supplementation could reduce depressive symptoms for patients with normal baseline folate levels as well as those with low levels.41 Although the evidence is equivocal, folate augmentation may enhance antidepressant efficacy or improve response/remission rates.41,42
It seems reasonable to check folate levels in depressed patients, and address deficiencies by instructing patients to increase their dietary intake of folate or to take supplements. Augmenting antidepressants with folate appears to be low-risk and possibly helpful in maintaining remission.
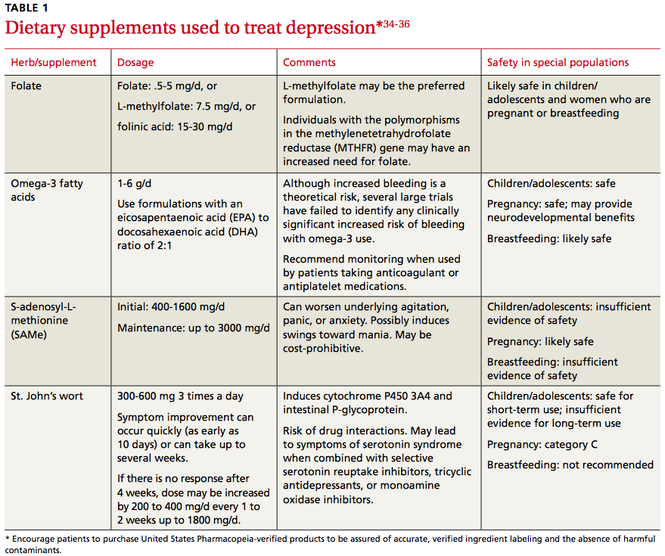
Omega-3 fatty acids. There is substantial evidence that omega-3 fatty acids can prevent and treat depression.43,44 Recent meta-analyses support the use of omega-3 fatty acids as monotherapy and augmentation, but only formulations that contain a high eicosapentaenoic acid (EPA) to docosahexaenoic acid (DHA) ratio (EPA/DHA 2:1).45,46 Omega-3 supplementation has been used with positive results in older adults, children,47 pregnant women,48 and women with postpartum depression.49 Although initial research into omega-3 treatment of depression appears promising, augmentation of standard antidepressant therapy may be a good conservative option.
Use a validated tool to monitor response to treatment
You can enhance outcomes for your patients with depression if you schedule routine follow-up visits with them to gauge adherence to recommendations, monitor response to treatment, and increase the intensity of care when response is inadequate.50 The most important aspect of monitoring response is to use a standardized instrument that quantifies symptoms at every visit.
The Patient Health Questionnaire 9-item depression assessment (PHQ-9)—which is free—has been validated for depression screening and monitoring of treatment response in primary care patients.51 A decrease of 5 points on the PHQ-9 is the minimum considered to be clinically significant.52 Other well-validated, although lengthier, self-report depression assessment and monitoring instruments include the Beck Depression Inventory-revised and the Zung Depression Scale.
CASE 1 › Mr. J is not enjoying his new job or engaging with new coworkers to replace the positive social experiences he had at his previous job. Together, you set a goal of increasing social involvement by having him make plans to see at least one friend per weekend. Because he indicates that he is unlikely to follow through with a therapy referral, you encourage him to try an online CBT program, start an exercise regimen, or take a SAMe supplement. Mr. Jackson agrees to try the CBT and exercise (moderate intensity, 30 minutes 3-4 times per week), but does not want to take SAMe. He agrees to an assessment of his folate levels, which are normal.
Mr. J starts the online CBT program, which reinforces the exercise and social activity prescription you provided. He establishes a regular exercise routine with a good friend. After one month, his mood has started to improve and he has added regular participation in a hobby (woodworking), as well as volunteer work, which he finds fulfilling. You plan to continue monitoring his depression and his adherence to the treatment plan.
CASE 2 › The recent move has decreased Mrs. S’s interactions with family and long-time friends. Because she had previously expressed interest in exercise, you encourage her to join a local “Mommy and Me” exercise and support group for mothers of toddlers. She is willing to participate in psychotherapy, so you provide a referral to a local therapist with expertise in IPT. You also discuss with Mrs. S the possible benefits of omega-3 fatty acid supplementation, which appears to be safe during breastfeeding.34
Mrs. S begins therapy and exercise classes, but can’t motivate herself to continue either of these activities. She becomes discouraged because she’s unable to easily find an omega-3 fatty acid supplement with the ratio you specified (EPA/DHA 2:1). When you see her 2 weeks later, her depression has worsened.
Because you are concerned her suicidality will return, you revisit the pros and cons of taking an antidepressant. Although small amounts of antidepressants can be passed from mother to infant via breastmilk, the amount varies by specific medication, as do the potential risks. Mrs. S decides to resume taking paroxetine 20 mg/d and eventually, once her motivation improves, she’s able to add psychotherapy and exercise to her maintenance/relapse prevention regimen. After you discuss with her the possibility that B vitamin supplementation may assist in maintenance of remission, she adds L-methylfolate 7.5 mg/day to her regimen.
CORRESPONDENCE
Michele M. Larzelere, PhD; LSUHSC Department of Family Medicine; 200 W. Esplanade Avenue, Suite 409; Kenner, LA 70065; [email protected]
1. Centers for Disease Control and Prevention (CDC). QuickStats: Prevalence of Current Depression Among Persons Aged ≥12 Years, by Age Group and Sex — United States, National Health and Nutrition Examination Survey, 2007–2010. CDC Morbidity and Mortality Weekly Report Web site. Available at: http://www.cdc.gov/mmwr/preview/mmwrhtml/mm6051a7.htm. Accessed June 11, 2015.
2. Fournier J, DeRubeis RJ, Hollon SD, et al. Antidepressant drug effects and depression severity: a patient-level meta-analysis. JAMA. 2010;303:47-53.
3. Dobson KS, Hollon SD, Dimidjian S, et al. Randomized trial of behavioral activation, cognitive therapy, and antidepressant medication in the prevention of relapse and recurrence in major depression. J Consult Clin Psychol. 2008;76:468-477.
4. Barth J, Munder T, Gerger H, et al. Comparative efficacy of seven psychotherapeutic interventions for patients with depression: A network meta-analysis. PLoS Med. 2013;10:e1001454.
5. Linde K, Sigterman K, Kriston L, et al. Effectiveness of psychological treatments for depressive disorders in primary care: systematic review and meta-analysis. Ann Fam Med. 2015;13:56-68.
6. DeRubeis RJ, Webb CA, Tang TZ, et al. Cognitive therapy. In: Dobson KS, ed. Handbook of Cognitive Behavioral Therapies, 3rd ed. New York, NY: Guilford; 2009:277-316.
7. Andersson G, Cuijpers P. Internet-based and other computerized psychological treatments for adult depression: a meta-analysis. Cogn Behav Ther. 2008;38:196-205.
8. Andersson G, Cuijpers P, Carlbring P, et al. Guided internet-based vs. face-to-face cognitive behavior therapy for psychiatric and somatic disorders: a systematic review and meta-analysis. World Psychiatry. 2014;13:288-295.
9. Twomey C, O’Reilly G, Byrne M. Effectiveness of cognitive behavioral therapy for anxiety and depression in primary care: a meta-analysis. Fam Pract. 2015;32:3-15.
10. Zhou X, Michael K, Liu Y, et al. Systematic review of management for treatment-resistant depression in adolescents. BMC Psychiatry. 2014;14:340.
11. Ekers D, Webster L, Van Straten A, et al. Behavioural activation for depression: An update of meta-analysis of effectiveness and sub group analysis. PLoS One. 2014;9:e100100.
12. Alexopoulos GS, Raue PJ, Kiosses DN, et al. Comparing engage with PST in late-life major depression: A preliminary report. Am J Geriatr Psychiatry. 2015;23:506-513.
13. Soucy Chartier I, Provencher MD. Behavioral activation for depression: Efficacy, effectiveness, and dissemination. J Affect Disord. 2013;145:292-299.
14. McCauley E, Gudmundson G, Schloredt K, et al. The Adolescent Behavior Activation Program: Adapting behavioral activation as a treatment for depression in adolescence. J Clin Child Adolesc Psychol. 2015;1-14. [Epub ahead of print].
15. Carlbring P, Hägglund M, Luthström A, et al. Internet-based behavioral activation and acceptance-based treatment for depression: a randomized controlled trial. J Affect Disord. 2013;148:331-337.
16. Markowitz JC, Weissman MM. Interpersonal psychotherapy: principles and applications. World Psychiatry. 2004; 3:136-139.
17. Kersting A, Kroker K, Schlicht S, et al. Efficacy of a cognitive-behavioral internet-based therapy in parents after the loss of a child during pregnancy: pilot data from a randomized controlled trial. Arch Womens Mental Health. 2011;14:465-477.
18. Francis J, Kumar A. Psychological treatment of late-life depression. Psychiatr Clin North Am. 2013;36:561-575.
19. Picardi A, Gaetano P. Psychotherapy of mood disorders. Clin Pract Epidemiol Ment Health. 2014;10:140-158.
20. Bell AC, D’Zurilla TJ. Problem-solving therapy for depression: a meta-analysis. Clin Psychol Review. 2009;29:348-353.
21. Cooney GM, Dwan K, Greig CA, et al. Exercise for depression. Cochrane Database Syst Rev. 2013;9:CD004366
22. Brindle C, Spanjers K, Patel S, et al. Effect of exercise on depression severity in older people: systematic review and meta-analysis of randomized controlled trials. B J Psychiatry. 2012;201:180-185.
23. Brown HE, Pearson N, Braithwaite RE, et al. Physical activity interventions and depression in children and adolescents: a systematic review and meta-analysis. Sports Med. 2013;43:195-206.
24. Gong H, Ni C, Shen X, et al. Yoga for prenatal depression: a systematic review and meta-analysis. BMC Psychiatry. 2015;15:14.
25. D’Silva S, Poscablo C, Habousha R, et al. Mind-body medicine therapies for a range of depression severity: a systematic review. Psychosomatics. 2012;53:407-423.
26. Lisanby SH. Electroconvulsive therapy for depression. N Engl J Med. 2007;357:1939-1945.
27. Husain MM, Rush AJ, Fink M, et al. Speed of response and remission in major depressive disorder with acute electroconvulsive therapy (ECT): a Consortium for Research in ECT (CORE) report. J Clin Psychiatry. 2004;65:485-491.
28. Rhebergen D, Huisman A, Bouckaert F, et al. Older age is associated with rapid remission of depression after electroconvulsive therapy: a latent class growth analysis. Am J Geriatr Psychiatry. 2015;23:274-282.
29. Slotema CW, Blom JD, Hoek HW, et al. Should we expand the toolbox of psychiatric treatment methods to include Repetitive Transcranial Magnetic Stimulation (rTMS)? A metaanalysis of the efficacy of rTMS in psychiatric disorders. J Clin Psychiatry. 2010;71:873-884.
30. George MS, Lisanby SH, Avery D, et al. Daily left prefrontal transcranial magnetic stimulation therapy for major depressive disorder: a sham-controlled randomized trial. Arch Gen Psychiatry. 2010;67:507-516
31. Liu B, Zhang Y, Zhang L, et al. Repetitive transcranial magnetic stimulation as an augmentative strategy for treatment-resistant depression, a meta-analysis of randomized, double-blind and sham controlled studies. BMC Psychiatry. 2014;14:342.
32. Brown RP, Gerberg PL, Muskin PR. Mood disorders. In: Brown RP, Gerbarg PL, Muskin P. How to Use Herbs, Nutrients and Yoga in Mental Health. New York, NY: WW Norton & Company; 2009.
33. Linde K, Berner MM, Kriston L. St John’s wort for major depression. Cochrane Database Syst Rev. 2008;(4):CD000448.
34. Natural Medicines Comprehensive Database. Natural Medicines Comprehensive Database Web site. Available at: http://naturaldatabase.therapeuticresearch.com/home.aspx. Accessed March 1, 2015.
35. Harris WS. Expert opinion: omega-3 fatty acids and bleeding-cause for concern? Am J Cardiol. 2007;99:44C-6C.
36. Freeman MP, Fava M, Lake J, et al. Complementary and alternative medicine in major depressive disorder: the American Psychiatric Association Task Force Report. J Clin Psychiatry. 2010;71:669-681.
37. Papakostas GI, Alpert JE, Fava M. S-adenosyl-methionine in depression: a comprehensive review of the literature. Curr Psychiatry Reports. 2003;5:460-466.
38. Brown RP, Gerbarg PL, Bottiglieri T. S-Adenosylmethionine (SAMe) for depression: biochemical and clinical evidence. Psychiatr Ann. 2002;32:29-44.
39. Taylor MJ, Carney S, Geddes J, et al. Folate for depressive disorders. Cochrane Database Syst Rev. 2003;(2):CD003390.
40. Alpert M, Silva RR, Pouget ER. Prediction of treatment response in geriatric depression from baseline folate level: interaction with an SSRI or a tricyclic antidepressant. J Clin Psychopharmacol. 2003;23:309-313.
41. Fava M, Mischoulon D. Folate in depression: efficacy, safety, differences in formulations, and clinical issues. J Clin Psychiatry. 2009;70(suppl 5):12-17.
42. Almeida OP, Ford AH, Hirani V, et al. B vitamins to enhance treatment response to antidepressants in middle-aged and older adults: results from the B-VITAGE randomised, double-blind, placebo-controlled trial. Br J Psychiatry. 2014;205:450-457.
43. Grosso G, Galvano F, Marventano S, et al. Omega-3 fatty acids and depression: scientific evidence and biological mechanisms. Oxid Med Cell Longev. 2014;2014:313570.
44. Appleton KM, Rogers PJ, Ness AR. Updated systematic review and meta-analysis of the effects of n-3 long-chain polyunsaturated fatty acids on depressed mood. Am J Clin Nutr. 2010;91:757-770.
45. Grosso G, Pajak A, Marventano S, et al. Role of omega-3 fatty acids in the treatment of depressive disorders: a comprehensive metaanalysis of randomized clinical trials. PLoS One. 2014;9:e96905.
46. Martins JG, Bentsen H, Puri BK. Eicosapentaenoic acid appears to be the key omega-3 fatty acid component associated with efficacy in major depressive disorder: a critique of Bloch and Hannestad and updated meta-analysis. Mol Psychiatry. 2012;17:1144-1149.
47. Nemets H, Nemets B, Apter A, et al. Omega-3 treatment of childhood depression: a controlled, double-blind pilot study. Am J Psychiatry. 2006;163:1098-1100.
48. Su KP, Huang SY, Chiu TH. Omega-3 fatty acids for major depressive disorder during pregnancy: Results from a randomized, double-blind, placebo-controlled trial. J Clin Psychiatry. 2008;69:644-651.
49. Freeman MP, Davis M, Sinha P, et al. Omega-3 fatty acids and supportive psychotherapy for perinatal depression: a randomized placebo-controlled study. J Affect Disord. 2008;110:142-148.
50. Mitchell J, Trangle M, Degnan B, et al. Institute for Clinical Systems Improvement (ICSI). Health Care Guideline: Adult depression in primary care. 16th ed. September 2013. Available at: https://www.icsi.org/_asset/fnhdm3/Depr-Interactive0512b.pdf. Accessed June 9, 2015.
51. Kroenke K, Spitzer RL, Williams JBW, et al. The Patient Health Questionnaire Somatic, Anxiety, and Depressive Symptom Scales: a systematic review. Gen Hosp Psychiatry. 2010;32:345-359.
52. Trivedi MH. Tools and strategies for ongoing assessment of depression:
a measurement-based approach to remission. J Clin Psychiatry. 2009;70:26-31.
› Recommend cognitive behavioral therapy, interpersonal therapy, or problem-solving therapy for the treatment of depression in patients of all ages. A
› Consider prescribing exercise as a stand-alone or adjunctive treatment for patients with depression. B
› Advise patients who ask about omega-3 fatty acid supplements that formulations with a high eicosapentaenoic acid (EPA) to docosahexaenoic acid (DHA) ratio (2:1) may be a useful “add-on” to their current regimen. B
Strength of recommendation (SOR)
A Good-quality patient-oriented evidence
B Inconsistent or limited-quality patient-oriented evidence
C Consensus, usual practice, opinion, disease-oriented evidence, case series
CASE 1 › Steve J, age 43, comes to your clinic looking uncharacteristically glum. He was recently downsized from his job and misses his former colleagues. His job loss has caused a financial strain for his family, and he admits to crying in the shower when he thinks about how his life has turned out. Mr. J tells you that he’s gotten a part-time job, but he’s already called in sick several times. On those sick days he “stayed in bed all day and slept.” He says that when he does go to work, he rarely interacts with his coworkers and his concentration is poor. He tells you he wakes up early in the morning on most days and cannot return to sleep, despite being “tired all the time.” He denies suicidal ideation. Mr. J has never felt this way before, which is what prompted his visit today, but he thinks it is “weak to take a pill to feel better.”
What nonpharmacologic options can you offer him?
CASE 2 › Kerri S is a 27-year-old mother of 2 who comes to your clinic to establish care. She tells you about a recent recurrence of depressed mood, which she feels is due to the stress of moving to the area. She is experiencing sleep-onset insomnia and concentration lapses. Her appetite is poor (self-reported 8-lb weight loss in 2 months) and she lacks the motivation to engage in her daily activities, saying, “I wouldn’t even get out of bed if my kids didn’t need me.” She notes that she is constantly irritable and has completely lost her sex drive. Unlike her prior depressive episode, she has not had any suicidal thoughts. Mrs. S was previously successfully treated with paroxetine, 20 mg/d, but she is not interested in restarting her medication because she is still breastfeeding her toddler.
Are there evidence-based options for her care that do not include medication?
Major depressive disorder (MDD) is widespread and often disabling, affecting nearly 8% of people ages 12 and older at any given time.1 Thus, it’s crucial to be familiar with the diverse array of evidence-based treatment options from which patients can choose. Although medications are an essential treatment option for patients with severe depression, their value for patients with mild to moderate depression is often limited.2 In addition, when antidepressants aren’t combined with psychosocial interventions, discontinuing them is associated with relapse.3
Fortunately, research has found that certain nonpharmacologic interventions—including psychotherapies, somatic therapies, and dietary supplements—can have either therapeutic or adjunctive benefits for treating depression, and can be provided in ways that are time- and cost-effective. This article reviews the evidence supporting several options in each of these treatment categories.
Evidence backs several types of psychotherapy
Several recent meta-analyses suggest that a variety of psychotherapeutic treatments may hold promise for your patients with depression.4,5 When analyses were limited to larger studies in order to decrease the risk of bias, cognitive behavioral therapy (CBT), interpersonal therapy (IPT), and problem-solving therapy (PST) all resulted in moderate to large improvement in depressive symptoms when compared to wait-list controls.4 These findings were echoed in a recent systematic review/meta-analysis that focused on depressed primary care patients. Linde et al5 found that the number needed to treat (NNT) to achieve one response (≥50% reduction in score on a depression scale) using any type of psychotherapy was 10, and the NNT to achieve one remission (scoring below a predefined score on a depression scale) was 15.
Psychotherapy can be effective when provided in individual and group settings,6 as well as via telephone, the Internet, or software programs.7 (For a list of self-help, computerized, and Internet-based resources, see TABLE W1 below.)
CBT has been studied for several decades and there’s strong evidence for its efficacy.6 Recent investigations have suggested that CBT delivered in less resource-intensive modes (such as via computer program, Internet, telephone, or videoconferencing) can be as effective as face-to-face CBT.6,8 CBT has been shown to be helpful for a wide range of patients,6 improves outcomes over standard primary care treatment,9 and provides a useful adjunct to medication in treatment-resistant severe depression.10
Behavioral activation (BA), which generally is included as a component of CBT, has received support as an independent treatment, and may produce therapeutic results similar to CBT11 and PST (which we’ll discuss in a bit).12 The core components of BA are scheduling pleasant activities and increasing the patient’s positive interactions with his or her environment by decreasing avoidance, withdrawal, and inactivity.11 Compared to CBT, BA is easier for clinicians to learn and incorporate into primary care visits, and it may be especially useful as an adjunctive or first-step intervention in outpatient clinics.11 Like CBT, BA can be effective in diverse patient groups13,14 and can be provided using novel delivery modes, such as via the Internet.15
IPT is a supportive, structured, brief therapy (12-16 visits) that focuses on helping patients identify and solve current situation- and relationship-based problems that stem from or contribute to their depression.16 Enhancing the patient’s interpersonal communication—including improving social skills, assertiveness, and appropriate expression of anger—is typically a component of IPT. Like CBT, IPT has been found to be effective for treating depression when administered in person, in group therapy, or via the phone or Internet, and across a broad age range.17-19
PST involves teaching patients a structured problem-solving process to decrease interpersonal strain and improve positive life experiences.20 Patients are taught to define their problem, generate and evaluate multiple solutions for it, implement a plan for the solution, and evaluate the results. In addition to being used to successfully treat adults,4,5 PST has been adapted effectively to treat adolescents16 and older adults.18
Somatic therapies are also an option
Exercise has long been considered a possible depression treatment due to its activity on endorphin, monoamine, and cortisol levels and via increased social and general activity. A 2013 Cochrane review of 39 randomized control trials (RCTs; N=2326) assessed whether exercise was effective for treating depression in adults.21 Thirty-five trials found a moderate effect size when specifically comparing exercise to no treatment or control interventions. The effect size was reduced, however, when analyses were restricted to trials with the highest methodological quality. There was no statistically significant difference when exercise was compared to pharmacologic treatment or psychotherapy.
Although the amount of research is meager, small but statistically significant improvements have also been found for older adults22 and children/adolescents.23 There is no consensus on the type, frequency, or intensity of exercise needed to achieve benefit. However, because nearly all studies for all age groups have found that exercise has no adverse psychological effects and substantial positive physical effects, exercise should be recommended to all patients with depression unless contraindicated.
Yoga (both exercise-based and meditation-based) has been evaluated both as a sole treatment and as an adjunctive treatment for depression. Several studies have supported the impact of yoga, particularly in pregnant women,24 although the evidence for its efficacy is inconsistent, with yoga frequently failing to improve upon the outcome of waitlist control.25 The evidence for meditation and mindfulness is more consistently positive, with these interventions equaling or exceeding “treatment as usual,” other psychotherapies, and antidepressants in numerous RCTs.25
Electroconvulsive therapy (ECT) has a substantial evidence base supporting its efficacy.26 ECT has been used for decades, although stigma, cardiac and memory risks, and risks of anesthesia often limit its use. Benefits of ECT include a rapid response relative to pharmacotherapy (>50% of patients respond by the end of the first week of ECT)27 and a strong response in older patients.28
In repetitive transcranial magnetic stimulation (rTMS), electromagnetic coils are placed on a patient’s head to deliver electromagnetic pulses that stimulate areas of the brain that regulate mood. Although rTMS is not widely available, a growing body of evidence supports its use for treating depression, including a meta-analysis of 34 RCTs that included 1383 patients.29 A multisite RCT (N=190) that was not industry-funded reported a 15% response rate and 60% maintenance of remission at 3 months (NNT=12).30 Although ECT is more effective than rTMS, rTMS appears useful for treatment-resistant depression, and can be used as an adjunctive treatment.29,31
Dietary supplements may be best used as adjuncts
St. John’s wort (Hypericum perforatum), which contains 2 bioactive ingredients (hyperforin and hypericin), has been effectively used to treat depression.32 A 2008 Cochrane review that was limited to high-quality trials involving patients meeting Diagnostic and Statistical Manual of Mental Disorders, 4th Edition criteria for depression identified 29 trials (N=5489), of which 18 involved comparisons with placebo and 17 with standard antidepressants.33 Patients’ depression was rated mild to moderate in 19 studies and moderate to severe in 9 studies. Trials examined 4 to 12 weeks of treatment with Hypericum extracts. This study (and several published since) provides strong clinical evidence supporting the efficacy of St. John’s wort for mild to moderate depression. There is insufficient evidence for its use for severe major depression.33TABLE 1 contains dosing information for St. John’s wort and other supplements used to treat depression.34-36
S-adenosyl-L-methionine (SAMe). In a 2003 systematic review,37 1600 mg/d of oral SAMe was found to significantly benefit patients with depression in 4 of 5 studies, as did parenteral SAMe (7 of 7 trials). Another review of 48 studies found SAMe was safe and effective for depression.38 SAMe has been proposed for use alone or in combination with an antidepressant.
Folate and folic acid. Low folate levels have been associated with a less robust response to antidepressants in patients with MDD,39 and higher folate levels appear to be associated with better antidepressant response.40 A 2003 Cochrane review suggested folate might have a role in treating depression.39 A 2009 study found folate supplementation could reduce depressive symptoms for patients with normal baseline folate levels as well as those with low levels.41 Although the evidence is equivocal, folate augmentation may enhance antidepressant efficacy or improve response/remission rates.41,42
It seems reasonable to check folate levels in depressed patients, and address deficiencies by instructing patients to increase their dietary intake of folate or to take supplements. Augmenting antidepressants with folate appears to be low-risk and possibly helpful in maintaining remission.
Omega-3 fatty acids. There is substantial evidence that omega-3 fatty acids can prevent and treat depression.43,44 Recent meta-analyses support the use of omega-3 fatty acids as monotherapy and augmentation, but only formulations that contain a high eicosapentaenoic acid (EPA) to docosahexaenoic acid (DHA) ratio (EPA/DHA 2:1).45,46 Omega-3 supplementation has been used with positive results in older adults, children,47 pregnant women,48 and women with postpartum depression.49 Although initial research into omega-3 treatment of depression appears promising, augmentation of standard antidepressant therapy may be a good conservative option.
Use a validated tool to monitor response to treatment
You can enhance outcomes for your patients with depression if you schedule routine follow-up visits with them to gauge adherence to recommendations, monitor response to treatment, and increase the intensity of care when response is inadequate.50 The most important aspect of monitoring response is to use a standardized instrument that quantifies symptoms at every visit.
The Patient Health Questionnaire 9-item depression assessment (PHQ-9)—which is free—has been validated for depression screening and monitoring of treatment response in primary care patients.51 A decrease of 5 points on the PHQ-9 is the minimum considered to be clinically significant.52 Other well-validated, although lengthier, self-report depression assessment and monitoring instruments include the Beck Depression Inventory-revised and the Zung Depression Scale.
CASE 1 › Mr. J is not enjoying his new job or engaging with new coworkers to replace the positive social experiences he had at his previous job. Together, you set a goal of increasing social involvement by having him make plans to see at least one friend per weekend. Because he indicates that he is unlikely to follow through with a therapy referral, you encourage him to try an online CBT program, start an exercise regimen, or take a SAMe supplement. Mr. Jackson agrees to try the CBT and exercise (moderate intensity, 30 minutes 3-4 times per week), but does not want to take SAMe. He agrees to an assessment of his folate levels, which are normal.
Mr. J starts the online CBT program, which reinforces the exercise and social activity prescription you provided. He establishes a regular exercise routine with a good friend. After one month, his mood has started to improve and he has added regular participation in a hobby (woodworking), as well as volunteer work, which he finds fulfilling. You plan to continue monitoring his depression and his adherence to the treatment plan.
CASE 2 › The recent move has decreased Mrs. S’s interactions with family and long-time friends. Because she had previously expressed interest in exercise, you encourage her to join a local “Mommy and Me” exercise and support group for mothers of toddlers. She is willing to participate in psychotherapy, so you provide a referral to a local therapist with expertise in IPT. You also discuss with Mrs. S the possible benefits of omega-3 fatty acid supplementation, which appears to be safe during breastfeeding.34
Mrs. S begins therapy and exercise classes, but can’t motivate herself to continue either of these activities. She becomes discouraged because she’s unable to easily find an omega-3 fatty acid supplement with the ratio you specified (EPA/DHA 2:1). When you see her 2 weeks later, her depression has worsened.
Because you are concerned her suicidality will return, you revisit the pros and cons of taking an antidepressant. Although small amounts of antidepressants can be passed from mother to infant via breastmilk, the amount varies by specific medication, as do the potential risks. Mrs. S decides to resume taking paroxetine 20 mg/d and eventually, once her motivation improves, she’s able to add psychotherapy and exercise to her maintenance/relapse prevention regimen. After you discuss with her the possibility that B vitamin supplementation may assist in maintenance of remission, she adds L-methylfolate 7.5 mg/day to her regimen.
CORRESPONDENCE
Michele M. Larzelere, PhD; LSUHSC Department of Family Medicine; 200 W. Esplanade Avenue, Suite 409; Kenner, LA 70065; [email protected]
1. Centers for Disease Control and Prevention (CDC). QuickStats: Prevalence of Current Depression Among Persons Aged ≥12 Years, by Age Group and Sex — United States, National Health and Nutrition Examination Survey, 2007–2010. CDC Morbidity and Mortality Weekly Report Web site. Available at: http://www.cdc.gov/mmwr/preview/mmwrhtml/mm6051a7.htm. Accessed June 11, 2015.
2. Fournier J, DeRubeis RJ, Hollon SD, et al. Antidepressant drug effects and depression severity: a patient-level meta-analysis. JAMA. 2010;303:47-53.
3. Dobson KS, Hollon SD, Dimidjian S, et al. Randomized trial of behavioral activation, cognitive therapy, and antidepressant medication in the prevention of relapse and recurrence in major depression. J Consult Clin Psychol. 2008;76:468-477.
4. Barth J, Munder T, Gerger H, et al. Comparative efficacy of seven psychotherapeutic interventions for patients with depression: A network meta-analysis. PLoS Med. 2013;10:e1001454.
5. Linde K, Sigterman K, Kriston L, et al. Effectiveness of psychological treatments for depressive disorders in primary care: systematic review and meta-analysis. Ann Fam Med. 2015;13:56-68.
6. DeRubeis RJ, Webb CA, Tang TZ, et al. Cognitive therapy. In: Dobson KS, ed. Handbook of Cognitive Behavioral Therapies, 3rd ed. New York, NY: Guilford; 2009:277-316.
7. Andersson G, Cuijpers P. Internet-based and other computerized psychological treatments for adult depression: a meta-analysis. Cogn Behav Ther. 2008;38:196-205.
8. Andersson G, Cuijpers P, Carlbring P, et al. Guided internet-based vs. face-to-face cognitive behavior therapy for psychiatric and somatic disorders: a systematic review and meta-analysis. World Psychiatry. 2014;13:288-295.
9. Twomey C, O’Reilly G, Byrne M. Effectiveness of cognitive behavioral therapy for anxiety and depression in primary care: a meta-analysis. Fam Pract. 2015;32:3-15.
10. Zhou X, Michael K, Liu Y, et al. Systematic review of management for treatment-resistant depression in adolescents. BMC Psychiatry. 2014;14:340.
11. Ekers D, Webster L, Van Straten A, et al. Behavioural activation for depression: An update of meta-analysis of effectiveness and sub group analysis. PLoS One. 2014;9:e100100.
12. Alexopoulos GS, Raue PJ, Kiosses DN, et al. Comparing engage with PST in late-life major depression: A preliminary report. Am J Geriatr Psychiatry. 2015;23:506-513.
13. Soucy Chartier I, Provencher MD. Behavioral activation for depression: Efficacy, effectiveness, and dissemination. J Affect Disord. 2013;145:292-299.
14. McCauley E, Gudmundson G, Schloredt K, et al. The Adolescent Behavior Activation Program: Adapting behavioral activation as a treatment for depression in adolescence. J Clin Child Adolesc Psychol. 2015;1-14. [Epub ahead of print].
15. Carlbring P, Hägglund M, Luthström A, et al. Internet-based behavioral activation and acceptance-based treatment for depression: a randomized controlled trial. J Affect Disord. 2013;148:331-337.
16. Markowitz JC, Weissman MM. Interpersonal psychotherapy: principles and applications. World Psychiatry. 2004; 3:136-139.
17. Kersting A, Kroker K, Schlicht S, et al. Efficacy of a cognitive-behavioral internet-based therapy in parents after the loss of a child during pregnancy: pilot data from a randomized controlled trial. Arch Womens Mental Health. 2011;14:465-477.
18. Francis J, Kumar A. Psychological treatment of late-life depression. Psychiatr Clin North Am. 2013;36:561-575.
19. Picardi A, Gaetano P. Psychotherapy of mood disorders. Clin Pract Epidemiol Ment Health. 2014;10:140-158.
20. Bell AC, D’Zurilla TJ. Problem-solving therapy for depression: a meta-analysis. Clin Psychol Review. 2009;29:348-353.
21. Cooney GM, Dwan K, Greig CA, et al. Exercise for depression. Cochrane Database Syst Rev. 2013;9:CD004366
22. Brindle C, Spanjers K, Patel S, et al. Effect of exercise on depression severity in older people: systematic review and meta-analysis of randomized controlled trials. B J Psychiatry. 2012;201:180-185.
23. Brown HE, Pearson N, Braithwaite RE, et al. Physical activity interventions and depression in children and adolescents: a systematic review and meta-analysis. Sports Med. 2013;43:195-206.
24. Gong H, Ni C, Shen X, et al. Yoga for prenatal depression: a systematic review and meta-analysis. BMC Psychiatry. 2015;15:14.
25. D’Silva S, Poscablo C, Habousha R, et al. Mind-body medicine therapies for a range of depression severity: a systematic review. Psychosomatics. 2012;53:407-423.
26. Lisanby SH. Electroconvulsive therapy for depression. N Engl J Med. 2007;357:1939-1945.
27. Husain MM, Rush AJ, Fink M, et al. Speed of response and remission in major depressive disorder with acute electroconvulsive therapy (ECT): a Consortium for Research in ECT (CORE) report. J Clin Psychiatry. 2004;65:485-491.
28. Rhebergen D, Huisman A, Bouckaert F, et al. Older age is associated with rapid remission of depression after electroconvulsive therapy: a latent class growth analysis. Am J Geriatr Psychiatry. 2015;23:274-282.
29. Slotema CW, Blom JD, Hoek HW, et al. Should we expand the toolbox of psychiatric treatment methods to include Repetitive Transcranial Magnetic Stimulation (rTMS)? A metaanalysis of the efficacy of rTMS in psychiatric disorders. J Clin Psychiatry. 2010;71:873-884.
30. George MS, Lisanby SH, Avery D, et al. Daily left prefrontal transcranial magnetic stimulation therapy for major depressive disorder: a sham-controlled randomized trial. Arch Gen Psychiatry. 2010;67:507-516
31. Liu B, Zhang Y, Zhang L, et al. Repetitive transcranial magnetic stimulation as an augmentative strategy for treatment-resistant depression, a meta-analysis of randomized, double-blind and sham controlled studies. BMC Psychiatry. 2014;14:342.
32. Brown RP, Gerberg PL, Muskin PR. Mood disorders. In: Brown RP, Gerbarg PL, Muskin P. How to Use Herbs, Nutrients and Yoga in Mental Health. New York, NY: WW Norton & Company; 2009.
33. Linde K, Berner MM, Kriston L. St John’s wort for major depression. Cochrane Database Syst Rev. 2008;(4):CD000448.
34. Natural Medicines Comprehensive Database. Natural Medicines Comprehensive Database Web site. Available at: http://naturaldatabase.therapeuticresearch.com/home.aspx. Accessed March 1, 2015.
35. Harris WS. Expert opinion: omega-3 fatty acids and bleeding-cause for concern? Am J Cardiol. 2007;99:44C-6C.
36. Freeman MP, Fava M, Lake J, et al. Complementary and alternative medicine in major depressive disorder: the American Psychiatric Association Task Force Report. J Clin Psychiatry. 2010;71:669-681.
37. Papakostas GI, Alpert JE, Fava M. S-adenosyl-methionine in depression: a comprehensive review of the literature. Curr Psychiatry Reports. 2003;5:460-466.
38. Brown RP, Gerbarg PL, Bottiglieri T. S-Adenosylmethionine (SAMe) for depression: biochemical and clinical evidence. Psychiatr Ann. 2002;32:29-44.
39. Taylor MJ, Carney S, Geddes J, et al. Folate for depressive disorders. Cochrane Database Syst Rev. 2003;(2):CD003390.
40. Alpert M, Silva RR, Pouget ER. Prediction of treatment response in geriatric depression from baseline folate level: interaction with an SSRI or a tricyclic antidepressant. J Clin Psychopharmacol. 2003;23:309-313.
41. Fava M, Mischoulon D. Folate in depression: efficacy, safety, differences in formulations, and clinical issues. J Clin Psychiatry. 2009;70(suppl 5):12-17.
42. Almeida OP, Ford AH, Hirani V, et al. B vitamins to enhance treatment response to antidepressants in middle-aged and older adults: results from the B-VITAGE randomised, double-blind, placebo-controlled trial. Br J Psychiatry. 2014;205:450-457.
43. Grosso G, Galvano F, Marventano S, et al. Omega-3 fatty acids and depression: scientific evidence and biological mechanisms. Oxid Med Cell Longev. 2014;2014:313570.
44. Appleton KM, Rogers PJ, Ness AR. Updated systematic review and meta-analysis of the effects of n-3 long-chain polyunsaturated fatty acids on depressed mood. Am J Clin Nutr. 2010;91:757-770.
45. Grosso G, Pajak A, Marventano S, et al. Role of omega-3 fatty acids in the treatment of depressive disorders: a comprehensive metaanalysis of randomized clinical trials. PLoS One. 2014;9:e96905.
46. Martins JG, Bentsen H, Puri BK. Eicosapentaenoic acid appears to be the key omega-3 fatty acid component associated with efficacy in major depressive disorder: a critique of Bloch and Hannestad and updated meta-analysis. Mol Psychiatry. 2012;17:1144-1149.
47. Nemets H, Nemets B, Apter A, et al. Omega-3 treatment of childhood depression: a controlled, double-blind pilot study. Am J Psychiatry. 2006;163:1098-1100.
48. Su KP, Huang SY, Chiu TH. Omega-3 fatty acids for major depressive disorder during pregnancy: Results from a randomized, double-blind, placebo-controlled trial. J Clin Psychiatry. 2008;69:644-651.
49. Freeman MP, Davis M, Sinha P, et al. Omega-3 fatty acids and supportive psychotherapy for perinatal depression: a randomized placebo-controlled study. J Affect Disord. 2008;110:142-148.
50. Mitchell J, Trangle M, Degnan B, et al. Institute for Clinical Systems Improvement (ICSI). Health Care Guideline: Adult depression in primary care. 16th ed. September 2013. Available at: https://www.icsi.org/_asset/fnhdm3/Depr-Interactive0512b.pdf. Accessed June 9, 2015.
51. Kroenke K, Spitzer RL, Williams JBW, et al. The Patient Health Questionnaire Somatic, Anxiety, and Depressive Symptom Scales: a systematic review. Gen Hosp Psychiatry. 2010;32:345-359.
52. Trivedi MH. Tools and strategies for ongoing assessment of depression:
a measurement-based approach to remission. J Clin Psychiatry. 2009;70:26-31.

Eruptive xanthoma
To the Editor: The article “Eruptive xanthoma” by Drs. Mahmoud Abdelghany and Samuel Massoud1 described the management of a patient with severe hypertriglyceridemia associated with skin lesions. The authors noted that both metformin and statin doses were increased upon diagnosis. In addition, insulin was initiated.
The Endocrine Society guidelines note that statins have a modest triglyceride-lowering effect, typically about 10% to 15%, and may be useful to modify cardiovascular risk in patients with moderately elevated triglyceride levels.2 In addition, they recommend fibrates as the first-line therapy for these patients, with the addition of fish oil, statins, or niacin as needed.
During the management of acute hypertriglyceridemia, the enzyme lipoprotein lipase needs to be activated to aid in the breakdown of triglycerides. This can be accomplished with therapies such as insulin,3 fibrates, and even heparin.4 In addition, medium-chain triglycerides (such as coconut or palm kernel) are cleared by the portal circulation, so they can be used for cooking in patients predisposed to severe hypertriglyceridemia.
- Abdelghany M, Massoud S. Eruptive xanthoma. Cleve Clin J Med 2015; 82:209–210.
- Berglund L, Brunzell JD, Goldberg AC, et al; Endocrine Society. Evaluation and treatment of hypertriglyceridemia: an Endocrine Society clinical practice guideline. J Clin Endocrinol Metab 2012; 97:2969–2989.
- Thuzar M, Shenoy VV, Malabu UH, Schrale R, Sangla KS. Extreme hypertriglyceridemia managed with insulin. J Clin Lipidol 2014; 8:630–634.
- Garg A, Simha V. Update on dyslipidemia. J Clin Endocrinol Metab 2007; 92:1581–1589.
- Shah AS, Wilson DP. Primary hypertriglyceridemia in children and adolescents. J Clin Lipidol 2015 (In press).
To the Editor: The article “Eruptive xanthoma” by Drs. Mahmoud Abdelghany and Samuel Massoud1 described the management of a patient with severe hypertriglyceridemia associated with skin lesions. The authors noted that both metformin and statin doses were increased upon diagnosis. In addition, insulin was initiated.
The Endocrine Society guidelines note that statins have a modest triglyceride-lowering effect, typically about 10% to 15%, and may be useful to modify cardiovascular risk in patients with moderately elevated triglyceride levels.2 In addition, they recommend fibrates as the first-line therapy for these patients, with the addition of fish oil, statins, or niacin as needed.
During the management of acute hypertriglyceridemia, the enzyme lipoprotein lipase needs to be activated to aid in the breakdown of triglycerides. This can be accomplished with therapies such as insulin,3 fibrates, and even heparin.4 In addition, medium-chain triglycerides (such as coconut or palm kernel) are cleared by the portal circulation, so they can be used for cooking in patients predisposed to severe hypertriglyceridemia.
- Abdelghany M, Massoud S. Eruptive xanthoma. Cleve Clin J Med 2015; 82:209–210.
- Berglund L, Brunzell JD, Goldberg AC, et al; Endocrine Society. Evaluation and treatment of hypertriglyceridemia: an Endocrine Society clinical practice guideline. J Clin Endocrinol Metab 2012; 97:2969–2989.
- Thuzar M, Shenoy VV, Malabu UH, Schrale R, Sangla KS. Extreme hypertriglyceridemia managed with insulin. J Clin Lipidol 2014; 8:630–634.
- Garg A, Simha V. Update on dyslipidemia. J Clin Endocrinol Metab 2007; 92:1581–1589.
- Shah AS, Wilson DP. Primary hypertriglyceridemia in children and adolescents. J Clin Lipidol 2015 (In press).
In reply: Eruptive xanthoma
In Reply: In our article, we described a patient who presented with markedly elevated triglyceride and hemoglobin A1c. Hypertriglyceridemia might be secondary to underlying diseases, including uncontrolled diabetes, or to inherited lipid disorders. In the optimal situation, our patient would have benefited most not only from strict control of his triglycerides and diabetes, but also from testing for inherited lipid disorders. Although insulin was initiated, he refused fibrates and genetic counseling, and he refused to be reassessed later. After 1 and 3 months, his clinical and laboratory findings had improved dramatically, deterring us from further intervention.
In Reply: In our article, we described a patient who presented with markedly elevated triglyceride and hemoglobin A1c. Hypertriglyceridemia might be secondary to underlying diseases, including uncontrolled diabetes, or to inherited lipid disorders. In the optimal situation, our patient would have benefited most not only from strict control of his triglycerides and diabetes, but also from testing for inherited lipid disorders. Although insulin was initiated, he refused fibrates and genetic counseling, and he refused to be reassessed later. After 1 and 3 months, his clinical and laboratory findings had improved dramatically, deterring us from further intervention.
In Reply: In our article, we described a patient who presented with markedly elevated triglyceride and hemoglobin A1c. Hypertriglyceridemia might be secondary to underlying diseases, including uncontrolled diabetes, or to inherited lipid disorders. In the optimal situation, our patient would have benefited most not only from strict control of his triglycerides and diabetes, but also from testing for inherited lipid disorders. Although insulin was initiated, he refused fibrates and genetic counseling, and he refused to be reassessed later. After 1 and 3 months, his clinical and laboratory findings had improved dramatically, deterring us from further intervention.
Risk of falls
To the Editor: Regarding the excellent review on reducing the risk of injurious falls in older adults,1 I would like to inquire whether the authors believe that fall-prone patients might benefit by wearing a bicycle helmet during some or all routine activities. Bicycle helmets are comfortable and lightweight, allow air circulation, and are designed to reduce the severity of head injury sustained in a fall or collision.
- Beegan L, MessingerRapport BJ. Stand by me! Reducing the risk of injurious falls in older adults. Cleve Clin J Med 2015; 82:301–307.
To the Editor: Regarding the excellent review on reducing the risk of injurious falls in older adults,1 I would like to inquire whether the authors believe that fall-prone patients might benefit by wearing a bicycle helmet during some or all routine activities. Bicycle helmets are comfortable and lightweight, allow air circulation, and are designed to reduce the severity of head injury sustained in a fall or collision.
To the Editor: Regarding the excellent review on reducing the risk of injurious falls in older adults,1 I would like to inquire whether the authors believe that fall-prone patients might benefit by wearing a bicycle helmet during some or all routine activities. Bicycle helmets are comfortable and lightweight, allow air circulation, and are designed to reduce the severity of head injury sustained in a fall or collision.
- Beegan L, MessingerRapport BJ. Stand by me! Reducing the risk of injurious falls in older adults. Cleve Clin J Med 2015; 82:301–307.
- Beegan L, MessingerRapport BJ. Stand by me! Reducing the risk of injurious falls in older adults. Cleve Clin J Med 2015; 82:301–307.
In reply: Risk of falls
In Reply: The query regarding bicycle helmet use as a preventive measure in elderly people at high risk of recurrent falls is interesting. Prior to our article going to press, we reviewed the literature and found no quality studies of helmet use in preventing brain injury at home or in residential facilities. The few studies of helmet use vs no helmet use focused on sports and suggested that the benefit of current helmet design may be more limited than previously thought. Although sports helmets reduce the risk of linear impact causing death, major injury, skull fracture, and (if a facial portion is present) facial injury, there is little protection against injury from rotational forces. Concussion, a form of mild brain injury, does not appear to be reduced by helmet use in sports.1 Additionally, 77% of soldiers hospitalized with traumatic brain injury were wearing a helmet at the time of injury.2
In addition to questioning the effectiveness of helmets in recurrent fallers, one has to consider the ability of a helmet to be fitted properly (for example, the fit will change after a haircut or change in hairstyle), the willingness of the individual to wear it, the ability of the patient or caregiver to attach it, and the impact of wearing a helmet on psychosocial interactions. Helmet use in a recurrent faller would have to be considered an individualized intervention amenable to caregiver and patient but without proven benefit.
- Benson BW, Hamilton GM, Meeuwisse WH, McCrory P, Dvorak J. Is protective equipment useful in preventing concussion? A systematic review of the literature. Br J Sports Med 2009; 43:i56–i67.
- Wojcik BE, Stein CR, Bagg K, Humphrey RJ, Orosco J. Traumatic brain injury hospitalizations of US army soldiers deployed to Afghanistan and Iraq. Am J Prev Med 2010; 38:S108–S116.
In Reply: The query regarding bicycle helmet use as a preventive measure in elderly people at high risk of recurrent falls is interesting. Prior to our article going to press, we reviewed the literature and found no quality studies of helmet use in preventing brain injury at home or in residential facilities. The few studies of helmet use vs no helmet use focused on sports and suggested that the benefit of current helmet design may be more limited than previously thought. Although sports helmets reduce the risk of linear impact causing death, major injury, skull fracture, and (if a facial portion is present) facial injury, there is little protection against injury from rotational forces. Concussion, a form of mild brain injury, does not appear to be reduced by helmet use in sports.1 Additionally, 77% of soldiers hospitalized with traumatic brain injury were wearing a helmet at the time of injury.2
In addition to questioning the effectiveness of helmets in recurrent fallers, one has to consider the ability of a helmet to be fitted properly (for example, the fit will change after a haircut or change in hairstyle), the willingness of the individual to wear it, the ability of the patient or caregiver to attach it, and the impact of wearing a helmet on psychosocial interactions. Helmet use in a recurrent faller would have to be considered an individualized intervention amenable to caregiver and patient but without proven benefit.
- Benson BW, Hamilton GM, Meeuwisse WH, McCrory P, Dvorak J. Is protective equipment useful in preventing concussion? A systematic review of the literature. Br J Sports Med 2009; 43:i56–i67.
- Wojcik BE, Stein CR, Bagg K, Humphrey RJ, Orosco J. Traumatic brain injury hospitalizations of US army soldiers deployed to Afghanistan and Iraq. Am J Prev Med 2010; 38:S108–S116.
The role of sentinel lymph node biopsy after excision of melanomas
To the Editor: I enjoyed the dermatology update in the May 2015 issue.1 I would like to inquire about the clinical management of the patient in case 3, a 58-yearold man with biopsy-proven malignant melanoma surrounded by intense inflammatory infiltrate. The tumor was excised with standard margins, but distal metastases developed 2 years later. The depth of invasion of the primary tumor was not revealed, but could this patient have benefited from sentinel lymph node biopsy immediately after the initial excision?
- Fernandez A. Dermatology update: the dawn of targeted treatment. Cleve Clin J Med 2015; 82:309–320.
To the Editor: I enjoyed the dermatology update in the May 2015 issue.1 I would like to inquire about the clinical management of the patient in case 3, a 58-yearold man with biopsy-proven malignant melanoma surrounded by intense inflammatory infiltrate. The tumor was excised with standard margins, but distal metastases developed 2 years later. The depth of invasion of the primary tumor was not revealed, but could this patient have benefited from sentinel lymph node biopsy immediately after the initial excision?
To the Editor: I enjoyed the dermatology update in the May 2015 issue.1 I would like to inquire about the clinical management of the patient in case 3, a 58-yearold man with biopsy-proven malignant melanoma surrounded by intense inflammatory infiltrate. The tumor was excised with standard margins, but distal metastases developed 2 years later. The depth of invasion of the primary tumor was not revealed, but could this patient have benefited from sentinel lymph node biopsy immediately after the initial excision?
- Fernandez A. Dermatology update: the dawn of targeted treatment. Cleve Clin J Med 2015; 82:309–320.
- Fernandez A. Dermatology update: the dawn of targeted treatment. Cleve Clin J Med 2015; 82:309–320.
In reply: The role of sentinel lymph node biopsy after excision of melanomas
In Reply: Thank you for your important question. Examination of the excision specimen of the patient’s primary cutaneous melanoma lesion demonstrated a Breslow depth of 1.92 mm. He did indeed undergo sentinel lymph node biopsy at the time of excision. Histologic examination of the biopsy specimen was negative for evidence of metastatic melanoma. Despite this, he obviously developed metastatic disease several years later.
As you allude to, sentinel lymph node biopsy is an important minimally invasive procedure in patients with melanoma. Morton et al1 compared it with nodal observation and found that in patients with at least intermediate-thickness cutaneous melanoma, sentinel node biopsy significantly prolonged disease-free survival for all patients and improved melanoma-specific survival rates for patients with nodal metastases from intermediate-thickness melanomas (1.2–3.5 mm).1 However, it remains an imperfect procedure, and a percentage of patients develop recurrence or metastasis despite a negative biopsy. In a recent study by Jones et al,2 16% of melanoma patients in a cohort with a negative sentinel node biopsy developed recurrence.2 In these unfortunate patients, medications such as CTLA-4 inhibitors and PD-1 inhibitors now offer hope for prolonged survival.
- Morton DL, Thompson JF, Cochran AJ, et al, for the MSLT Group. Final trial report of sentinel-node biopsy versus nodal observation in melanoma. N Engl J Med 2014; 370:599–609.
- Jones EL, Jones TS, Nathan Pearlman NW, et al. Long-term follow-up and survival of patients following a recurrence of melanoma after a negative sentinel lymph node biopsy result. JAMA Surg 2013; 148:456–461.
In Reply: Thank you for your important question. Examination of the excision specimen of the patient’s primary cutaneous melanoma lesion demonstrated a Breslow depth of 1.92 mm. He did indeed undergo sentinel lymph node biopsy at the time of excision. Histologic examination of the biopsy specimen was negative for evidence of metastatic melanoma. Despite this, he obviously developed metastatic disease several years later.
As you allude to, sentinel lymph node biopsy is an important minimally invasive procedure in patients with melanoma. Morton et al1 compared it with nodal observation and found that in patients with at least intermediate-thickness cutaneous melanoma, sentinel node biopsy significantly prolonged disease-free survival for all patients and improved melanoma-specific survival rates for patients with nodal metastases from intermediate-thickness melanomas (1.2–3.5 mm).1 However, it remains an imperfect procedure, and a percentage of patients develop recurrence or metastasis despite a negative biopsy. In a recent study by Jones et al,2 16% of melanoma patients in a cohort with a negative sentinel node biopsy developed recurrence.2 In these unfortunate patients, medications such as CTLA-4 inhibitors and PD-1 inhibitors now offer hope for prolonged survival.
- Morton DL, Thompson JF, Cochran AJ, et al, for the MSLT Group. Final trial report of sentinel-node biopsy versus nodal observation in melanoma. N Engl J Med 2014; 370:599–609.
- Jones EL, Jones TS, Nathan Pearlman NW, et al. Long-term follow-up and survival of patients following a recurrence of melanoma after a negative sentinel lymph node biopsy result. JAMA Surg 2013; 148:456–461.
Long-acting reversible contraception: Who, what, when, and how
› Suggest long-acting reversible contraception (LARC), including intrauterine devices (IUDs), as a first-line method of contraception to most women, including adolescents and nulliparous women. A
› Offer immediate post-placental insertion of LARC when counseling women who have barriers to seeking contraception at a postpartum visit or are unlikely to return for a postpartum visit. B
› Treat sexually transmitted infections in most cases without removing an IUD that is already in place. Consider removing the IUD, however, if there is no clinical improvement after 2 to 3 days of antibiotics. A
Strength of recommendation (SOR)
A Good-quality patient-oriented evidence
B Inconsistent or limited-quality patient-oriented evidence
C Consensus, usual practice, opinion, disease-oriented evidence, case series
The number of women using long-acting reversible contraception (LARC) in the United States has been increasing, with current use accounting for approximately 18% of reversible contraception, according to the National Survey of Family Growth.1,2 LARC includes any method of contraception that lasts ≥3 years, is easily reversed, and does not rely on the user to maintain efficacy. Five LARC devices are available in the United States: 4 intrauterine devices (IUDs) and one subdermal implant.
The number of women using LARC is surprisingly low, given that it is considered a first-line contraceptive method for most women and adolescents,3 and when compared with other forms of reversible contraception, is more efficacious,4-6 has higher satisfaction rates,7-9 and higher rates of continuation.9 In fact, the Contraceptive CHOICE Project—a St. Louis community-based research program promoting and enabling access to reversible contraceptive methods—has shown that when appropriate counseling is provided and cost barriers are removed, up to 79% of women choose LARC as their preferred method of contraception.10
CASES › Jenny, who is 16 years old, comes to your office with her mother to discuss contraceptive options. She is nulliparous, has regular menses, and, aside from a body mass index (BMI) of 28, has no medical problems. Her mother is concerned about Jenny becoming pregnant while she is still in high school.
Maria D, a 32-year-old G2P1, comes in for a prenatal visit with her husband. She tells you that after delivery she is interested in a long-acting contraceptive, but is planning on breastfeeding and does not want anything to interfere with that.
What LARC options do these and other patients have?
The 4 IUDs and one implant approved for use are all viable options depending on a patient’s preference and comorbidities (TABLE 1).3-9,11-15 The copper IUD is the oldest method of LARC available and the only one that is nonhormonal. It is approved by the Food and Drug Administration (FDA) for use up to 10 years,11 but studies support its effectiveness for up to 12 years.16
The remaining IUDs (Skyla, Liletta, Mirena) contain varying amounts of the progestin levonorgestrel (LNG), released by each device at a slightly different rate that declines over time. Skyla releases a significantly lower dose of hormone than Liletta or Mirena.12-14 Skyla and Liletta are FDA-approved for up to 3 years of use,12,13 and Liletta is currently undergoing trials to gain approval for use up to 5 years. Mirena is FDA-approved for use up to 5 years,14 but studies have shown that it can be effective for 7 years.4,16
The only implant available in the US is Nexplanon, a plastic rod containing 68 mg of etonorgestrel. It is inserted subdermally and is FDA-approved for use up to 3 years.15
Through systemic hormonal effects, the primary mechanism of action of the implant is prevention of ovulation. Additionally, the implant has been shown to inhibit endometrial proliferation and cervical mucus thickening, both of which may contribute to the implant’s overall effectiveness.17 In contrast, both the copper IUD and the LNG-IUDs work primarily by preventing fertilization. The LNG-IUDs also exhibit local hormonal effects (endometrial atrophy and thickened cervical mucus) that contribute to their effectiveness.17
Who is eligible for LARC?
LARC is suitable for the vast majority of women of reproductive age. For most multiparous women ≥20 years, all LARC devices are classified as category 1 (use without restriction) in the Centers for Disease Control and Prevention’s (CDC) US Medical Eligibility Criteria (US MEC).3 For women <20 years, the implant is also considered category 1, but IUDs in this age group are classified as category 2 (recommended with the caution that advantages usually outweigh risks) because of concerns about an increased risk of IUD expulsion and the increased prevalence of sexually transmitted infections (STIs) in adolescents.3 Contraindications to use of LARC vary depending on the method chosen (TABLE 1).3
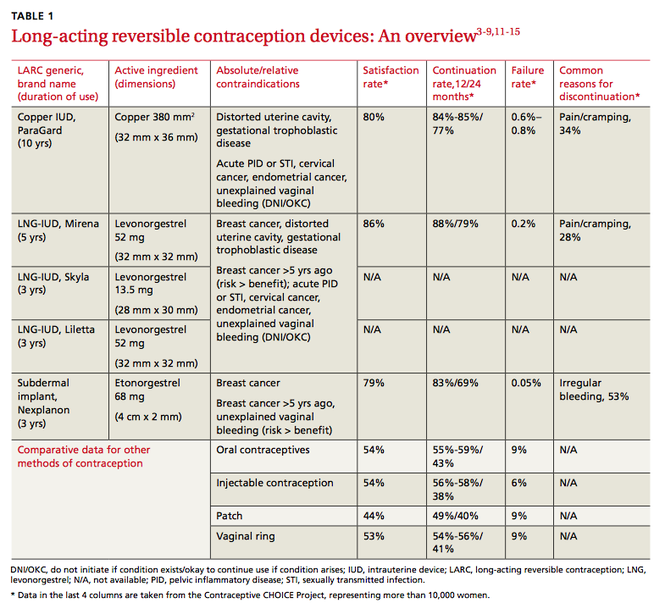
There has been concern about the efficacy of implants in overweight women because the original trials of subdermal implants excluded women >130% of ideal body weight. However, according to the Contraceptive CHOICE Project, overweight and obese women enrolled in its program did not experience reduced contraceptive efficacy when using the implant when compared with normal-weight women.18
When can LARC devices be inserted?
LARC device insertion is possible at any time during the menstrual cycle. An algorithm to guide initiation of LARC is available through the Reproductive Health Access Project’s Web site at http://www.reproductiveaccess.org/wp-content/uploads/2014/12/quickstart_algorithm.pdf.
Rule out pregnancy before placing any LARC device. The copper IUD can be inserted at any time during the menstrual cycle without the need for back-up contraception.11,19 In contrast, for LNG-IUDs, back-up contraception is recommended for 7 days unless the insertion is done during the first 7 days of the menstrual cycle.12-14,19
For the implant, recommendations about when to insert are based on a woman’s previous method of contraception (TABLE 2).15 If insertion is done at a time other than when recommended, advise patients to use barrier protection for 7 days after insertion.4,15,19
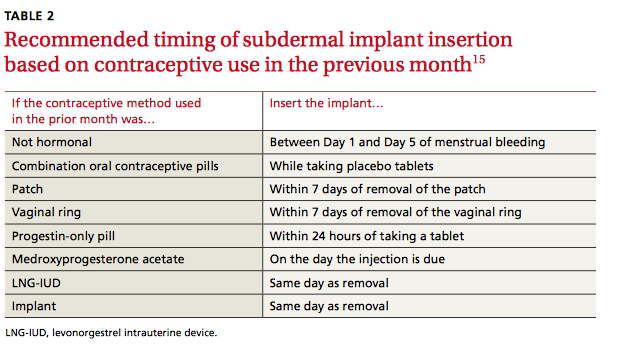
Other issues often arise and cause concern about whether and when a LARC device can be inserted, including the possibility of undiagnosed STI, time elapsed since delivery, and advisability of use when breastfeeding.
Sexually transmitted infections and IUDs
Whether or not a woman chooses to receive an IUD, follow routine CDC guidelines in determining if a patient is a candidate for STI screening.20 If a woman wants an IUD and routine screening is recommended, you can perform screening on the day of IUD insertion.4,19 For women with an IUD already in place who are diagnosed with an STI, treat the infection while leaving the IUD in place.19 For women with a known or suspected STI who do not have an IUD already, treat the STI before inserting the IUD. The American Congress of Obstetricians and Gynecologists (ACOG) advises postponing insertion of an IUD until a negative STI test result is obtained 3 to 4 weeks after treatment completion.4
Breastfeeding concerns and timing of insertion postpartum
The US MEC classifies insertion of the copper IUD as category 1 for all postpartum women, regardless of breastfeeding status, if placed >4 weeks postpartum or immediately postpartum (defined as within 10 minutes of the delivery of the placenta). IUD placement is category 2 (recommended with the caution that advantages usually outweigh risks) if placed ≥10 minutes after placental delivery (until 4 weeks postpartum) because of an increased risk of expulsion.3
The US MEC also considers use of the implant and LNG-IUDs in breastfeeding women as category 1 if the device is placed at ≥4 weeks postpartum. Insertion at <4 weeks postpartum is considered category 2 because of concerns for decreased breast milk supply.3 However, studies on whether progestin-containing LARC devices affect breastfeeding have yielded varying results. In one randomized controlled trial (RCT) of 69 breastfeeding women using the implant, breastfeeding duration and milk production were not dependent on the timing of insertion after delivery.21 Another RCT of 96 women using LNG-IUDs showed fewer women continued to breastfeed at 6 months when their LNG-IUD was inserted immediately postpartum, compared with waiting 6 weeks.22
In addition to a concern about breast milk supply, breastfeeding women have a higher risk for uterine perforation from IUDs, especially during the first 36 weeks after delivery.23
Several studies have shown that there is a lower repeat pregnancy rate among women who receive immediate postpartum LARC placement.24 However, even if IUD insertion is performed immediately postpartum, there is a higher expulsion rate than when the IUD is inserted ≥4 weeks postpartum. The expulsion rates for insertion <10 minutes after vaginal delivery range from 9.5% to 15% for the copper IUD to as high as 24% for the LNG-IUDs. Expulsion rates for all IUDs are slightly lower for cesarean delivery.4,25,26 ACOG supports immediate post-placental placement for women with barriers to postpartum care or limited access to contraception.4
How can I help my patients make an informed choice?
Provide counseling on efficacy, common adverse effects, risks, and complications.
Efficacy is high
The failure rate of LARC is equal to, or lower than, that of female sterilization and is significantly lower than that of oral contraceptives (TABLE 1).4-6 Not only are LARC devices extremely effective, they have a higher rate of satisfaction than any other reversible contraceptive (TABLE 1).7,8
Common adverse effects
The most common adverse effect seen with all LARC devices is an alteration in menstrual bleeding, and a frequent adverse effect with IUDs is pain. Vaginitis is less common and can be seen with any of the devices. The progestin-containing LARC devices are associated with hormonal effects: vaginitis, headache, weight gain, acne, breast pain, hair loss, and emotional lability.12-15
Copper IUD. Many women using the copper IUD experience either a transient increase in menstrual bleeding lasting for a few months or inter-menstrual bleeding that tends to continue for the duration of use.4,17 However, according to data from the Contraceptive CHOICE Project, the most common reason cited for early discontinuation of the copper IUD is pain and cramping.9
LNG-IUDs. Like the copper IUD, many users of LNG-IUDs experience an initial increase in menstrual bleeding. However, unlike the other LARC devices, 20% to 33% of Mirena users are likely to experience amenorrhea after one year of use and 70% at 2 years.4,14 According to package inserts, amenorrhea after 3 years is less common with both Skyla (12%) and Liletta (38%).12,13 As with the copper IUD, based on data from the Contraceptive CHOICE Project, the most common reason cited for early discontinuation of LNG-IUDs is pain and cramping.9
Subdermal implant. Changes in menses in women using the subdermal implant range from amenorrhea (22%) to prolonged bleeding (18%).15,17 Although it is difficult to predict which pattern a particular woman will experience, heavier women are more likely to have heavier bleeding patterns, and initial bleeding patterns are predictive of future ones.4 The most common reason women choose to discontinue use of the implant is abnormal bleeding.4,9,27,28
Newer IUDs do not increase risk of STIs
Many patients and clinicians erroneously believe that IUDs increase the risk of STIs and therefore assume that patients with a history of STI are not appropriate candidates for an IUD.29 There is a slightly increased risk of pelvic inflammatory disease (PID) in the first 21 days after insertion of an IUD. However, in contrast to older IUDs, currently available IUDs do not increase the general risk for STIs.17,30
Risk of infertility is nil
There is no risk of infertility from use of currently available LARCs. For those who want to become pregnant, fertility typically returns immediately after removal of the device, regardless of which method of LARC is used.11-15,30
Complications of IUD insertion
Uterine perforation. Uterine perforation occurs in 0.8 to 2.1 per 1000 women, usually at the time of IUD placement. If IUD strings are not visible during a speculum examination, locate the IUD with ultrasound.4,17,30 If the IUD is in the abdomen, refer to a gynecologist for laparoscopic removal and select another form of contraception for use in the interim.30
Expulsion. Rates of expulsion are low, occurring in less than 10% of women4,17 and are not affected by parity or BMI.31 Expulsion rates are higher when the IUD is inserted immediately postpartum.4,25,26 Adolescents also have a 2-fold higher risk of uterine expulsion than older women.31
Ectopic pregnancy. Although a woman’s overall risk of ectopic pregnancy is not increased by using an IUD,4 it is true that if a woman becomes pregnant with an IUD in place, the pregnancy is more likely to be ectopic. Thus, if pregnancy is confirmed in a woman with an IUD in place, rule out ectopic pregnancy.
The FDA and the World Health Organization recommend that if an intrauterine pregnancy is confirmed with an IUD in place and the strings are visible, the IUD should be removed.4 Although removing the IUD increases the risk of spontaneous abortion (SAB) as compared with pregnancies without an IUD in place, the risk of SAB is still lower than if the IUD is left in place.4 Additional risks of continuing a pregnancy with an IUD in place include increased risks of preterm labor, chorioamnionitis, and septic abortion.4,30
Complications of subdermal implant insertion
After insertion of the implant, women usually experience temporary bruising and soreness at the insertion site. Less than 1% of women develop an infection or hematoma.17 There is a low risk of nerve damage if the implant is inserted too deeply.15 Removal of the subdermal implant is recommended if pregnancy occurs.15
CASE DECISIONS › Jenny has been using oral contraceptive pills, but not regularly. You suggest that LARC may be a better option and counsel her that if she does choose an IUD or the implant, it is likely that her menses will change. You provide information and reassurance that LARC is safe to use in adolescents. Jenny says she would like to try an implant. Six months later, Jenny returns and says the implant is working well. She has some irregular bleeding, but it is not bothersome.
You review with Ms. D the types of LARC devices available and reassure her that all are safe to use once breastfeeding is established. Ms. D says she would like to use an IUD and elects to wait until her postpartum visit to have an IUD inserted. Ms. D returns 6 months after IUD insertion; breastfeeding is going well, and she has not had any menstrual bleeding since delivery.
CORRESPONDENCE
Karyn Kolman, MD, 2800 East Ajo Way, Room 3006, Tucson, AZ 85713; [email protected]
1. Daniels K, Daugherty J, Jones J. Current contraceptive status among women aged 15-44: United States 2011-2013. NCHS data brief, no. 173. Hyattsville, MD: National Center for Health Statistics, 2014.
2. Branum AM, Jones J. Trends in long-acting reversible contraception use among US women aged 15-44. NCHS data brief, no. 188. Hyattsville, MD: National Center for Health Statistics, 2015.
3. Centers for Disease Control and Prevention (CDC). US medical eligibility criteria for contraceptive use, 2010. MMWR Recomm Rep. 2010;59:1-86.
4. American College of Obstetricians and Gynecologists. ACOG Practice Bulletin No 121: Long-acting reversible contraception: Implants and intrauterine devices. Obstet Gynecol. 2011;118:184-196.
5. Pickle S, Wu J, Burbank-Schmitt E. Prevention of unintended pregnancy: a focus on long-acting reversible contraception. Prim Care. 2014;41:239-260.
6. Winner B, Peipert JF, Zhao Q, et al. Effectiveness of long-acting reversible contraception. N Engl J Med. 2012;366:1998-2007.
7. Peipert JF, Zhao Q, Allsworth JE, et al. Continuation and satisfaction of reversible contraception. Obstet Gynecol. 2011;117:1105-1113.
8. O’Neil-Callahan M, Peipert JF, Zhao Q, et al. Twenty-four-month continuation of reversible contraception. Obstet Gynecol. 2013;122:1083-1091.
9. Grunloh DS, Casner T, Secura GM, et al. Characteristics associated with discontinuation of long-acting reversible contraception within the first 6 months of use. Obstet Gynecol. 2011;117:705-719.
10. Birgisson NE, Zhao Q, Secura GM, et al. Preventing unintended pregnancy: the contraceptive CHOICE project in review. J Womens Health (Larchmt). 2015;24:349-353.
11. ParaGard T 380A. (intrauterine copper contraceptive) [package insert]. Sellersville, PA : Teva Pharmaceuticals USA, Inc., 2013.
12. Skyla (levonorgestrel-releasing intrauterine system) [package insert]. Wayne, NJ : Bayer HealthCare Pharmaceuticals, Inc., 2013.
13. Liletta (levonorgestrel-releasing intrauterine system) [package insert]. Parsippany, NJ : Actavis Pharma, Inc., 2015.
14. Mirena (levonorgestrel-releasing intrauterine system) [package insert]. Whippany, NJ : Bayer HealthCare Pharmaceuticals, Inc., 2014.
15. Nexplanon (etongestrel implant) [package insert]. Whitehouse Station, NJ: Merck & Co Inc.; 2014.
16. Wu JP, Pickle S. Extended use of the intrauterine device: a literature review and recommendations for clinical practice. Contraception. 2014;89:495-503.
17. Stoddard A, McNicholas C, Peipert JF. Efficacy and safety of long-acting reversible contraception. Drugs. 2011;71:969-980.
18. Xu H, Wade JA, Peipert JF, et al. Contraceptive failure rates of etonogestrel subdermal implants in overweight and obese women. Obstet Gynecol. 2012;120:21-26.
19. Centers for Disease Control and Prevention (CDC). US selected practice recommendations for contraceptive use. MMWR Recomm Rep. 2013;62:1-60.
20. Centers for Disease Control and Prevention (CDC). Sexually transmitted disease treatment guidelines. MMWR Recomm Rep. 2010;59:1-110.
21. Gurtcheff SE, Turok DK, Stoddard G, et al. Lactogenesis after early postpartum use of the contraceptive implant: a randomized controlled trial. Obstet Gynecol. 2011;117:1114-1121.
22. Chen BA, Reeves MF, Creinin MD, et al. Postplacental or delayed levonorgestrel intrauterine device insertion and breast-feeding duration. Contraception. 2011;84:499-504.
23. Heinemann K, Reed S, Moehner S, et al. Risk of uterine perforation with levonorgestrel-releasing and copper intrauterine devices in the European Active Surveillance Study on Intrauterine Devices. Contraception. 2015;91:274-279.
24. Tocce K, Sheeder J, Python J, et al. Long acting reversible contraception in postpartum adolescents: early initiation of etonogestrel implant is superior to IUDs in the outpatient setting. J Pediatr Adolesc Gynecol. 2012;25:59-63.
25. Mwalwanda CS, Black KI. Immediate post-partum initiation of intrauterine contraception and implants: a review of the safety and guidelines for use. Aust N Z J Obstet Gynaecol. 2013;53:331-337.
26. Sober, S, Schreiber CA. Postpartum contraception. Clin Obstet Gynecol. 2014;57:763-776.
27. Dickerson LM, Diaz VA, Jordon J, et al. Satisfaction, early removal, and side effects associated with long-acting reversible contraception. Fam Med. 2013;45:701-707.
28. Berenson AB, Tan A, Hirth JM. Complications and continuation rates associated with 2 types of long-acting contraception. Am J Obstet Gynecol. 2015;212:e1-e8.
29. Kavanaugh ML, Frowirth L, Jerman J, et al. Long-acting reversible contraception for adolescents and young adults: patient and provider perspectives. J Pediatr Adolesc Gynecol. 2013;86:86-95.
30. Espey E, Ogburn T. Long-acting reversible contraceptives: intrauterine devices and the contraceptive implant. Obstet Gynecol. 2011;117:705-719.
31. Madden T, McNicholas C, Zhao Q, et al. Association of age and parity with intrauterine device expulsion. Obstet Gynecol. 2014;124:718-726.
› Suggest long-acting reversible contraception (LARC), including intrauterine devices (IUDs), as a first-line method of contraception to most women, including adolescents and nulliparous women. A
› Offer immediate post-placental insertion of LARC when counseling women who have barriers to seeking contraception at a postpartum visit or are unlikely to return for a postpartum visit. B
› Treat sexually transmitted infections in most cases without removing an IUD that is already in place. Consider removing the IUD, however, if there is no clinical improvement after 2 to 3 days of antibiotics. A
Strength of recommendation (SOR)
A Good-quality patient-oriented evidence
B Inconsistent or limited-quality patient-oriented evidence
C Consensus, usual practice, opinion, disease-oriented evidence, case series
The number of women using long-acting reversible contraception (LARC) in the United States has been increasing, with current use accounting for approximately 18% of reversible contraception, according to the National Survey of Family Growth.1,2 LARC includes any method of contraception that lasts ≥3 years, is easily reversed, and does not rely on the user to maintain efficacy. Five LARC devices are available in the United States: 4 intrauterine devices (IUDs) and one subdermal implant.
The number of women using LARC is surprisingly low, given that it is considered a first-line contraceptive method for most women and adolescents,3 and when compared with other forms of reversible contraception, is more efficacious,4-6 has higher satisfaction rates,7-9 and higher rates of continuation.9 In fact, the Contraceptive CHOICE Project—a St. Louis community-based research program promoting and enabling access to reversible contraceptive methods—has shown that when appropriate counseling is provided and cost barriers are removed, up to 79% of women choose LARC as their preferred method of contraception.10
CASES › Jenny, who is 16 years old, comes to your office with her mother to discuss contraceptive options. She is nulliparous, has regular menses, and, aside from a body mass index (BMI) of 28, has no medical problems. Her mother is concerned about Jenny becoming pregnant while she is still in high school.
Maria D, a 32-year-old G2P1, comes in for a prenatal visit with her husband. She tells you that after delivery she is interested in a long-acting contraceptive, but is planning on breastfeeding and does not want anything to interfere with that.
What LARC options do these and other patients have?
The 4 IUDs and one implant approved for use are all viable options depending on a patient’s preference and comorbidities (TABLE 1).3-9,11-15 The copper IUD is the oldest method of LARC available and the only one that is nonhormonal. It is approved by the Food and Drug Administration (FDA) for use up to 10 years,11 but studies support its effectiveness for up to 12 years.16
The remaining IUDs (Skyla, Liletta, Mirena) contain varying amounts of the progestin levonorgestrel (LNG), released by each device at a slightly different rate that declines over time. Skyla releases a significantly lower dose of hormone than Liletta or Mirena.12-14 Skyla and Liletta are FDA-approved for up to 3 years of use,12,13 and Liletta is currently undergoing trials to gain approval for use up to 5 years. Mirena is FDA-approved for use up to 5 years,14 but studies have shown that it can be effective for 7 years.4,16
The only implant available in the US is Nexplanon, a plastic rod containing 68 mg of etonorgestrel. It is inserted subdermally and is FDA-approved for use up to 3 years.15
Through systemic hormonal effects, the primary mechanism of action of the implant is prevention of ovulation. Additionally, the implant has been shown to inhibit endometrial proliferation and cervical mucus thickening, both of which may contribute to the implant’s overall effectiveness.17 In contrast, both the copper IUD and the LNG-IUDs work primarily by preventing fertilization. The LNG-IUDs also exhibit local hormonal effects (endometrial atrophy and thickened cervical mucus) that contribute to their effectiveness.17
Who is eligible for LARC?
LARC is suitable for the vast majority of women of reproductive age. For most multiparous women ≥20 years, all LARC devices are classified as category 1 (use without restriction) in the Centers for Disease Control and Prevention’s (CDC) US Medical Eligibility Criteria (US MEC).3 For women <20 years, the implant is also considered category 1, but IUDs in this age group are classified as category 2 (recommended with the caution that advantages usually outweigh risks) because of concerns about an increased risk of IUD expulsion and the increased prevalence of sexually transmitted infections (STIs) in adolescents.3 Contraindications to use of LARC vary depending on the method chosen (TABLE 1).3
There has been concern about the efficacy of implants in overweight women because the original trials of subdermal implants excluded women >130% of ideal body weight. However, according to the Contraceptive CHOICE Project, overweight and obese women enrolled in its program did not experience reduced contraceptive efficacy when using the implant when compared with normal-weight women.18
When can LARC devices be inserted?
LARC device insertion is possible at any time during the menstrual cycle. An algorithm to guide initiation of LARC is available through the Reproductive Health Access Project’s Web site at http://www.reproductiveaccess.org/wp-content/uploads/2014/12/quickstart_algorithm.pdf.
Rule out pregnancy before placing any LARC device. The copper IUD can be inserted at any time during the menstrual cycle without the need for back-up contraception.11,19 In contrast, for LNG-IUDs, back-up contraception is recommended for 7 days unless the insertion is done during the first 7 days of the menstrual cycle.12-14,19
For the implant, recommendations about when to insert are based on a woman’s previous method of contraception (TABLE 2).15 If insertion is done at a time other than when recommended, advise patients to use barrier protection for 7 days after insertion.4,15,19
Other issues often arise and cause concern about whether and when a LARC device can be inserted, including the possibility of undiagnosed STI, time elapsed since delivery, and advisability of use when breastfeeding.
Sexually transmitted infections and IUDs
Whether or not a woman chooses to receive an IUD, follow routine CDC guidelines in determining if a patient is a candidate for STI screening.20 If a woman wants an IUD and routine screening is recommended, you can perform screening on the day of IUD insertion.4,19 For women with an IUD already in place who are diagnosed with an STI, treat the infection while leaving the IUD in place.19 For women with a known or suspected STI who do not have an IUD already, treat the STI before inserting the IUD. The American Congress of Obstetricians and Gynecologists (ACOG) advises postponing insertion of an IUD until a negative STI test result is obtained 3 to 4 weeks after treatment completion.4
Breastfeeding concerns and timing of insertion postpartum
The US MEC classifies insertion of the copper IUD as category 1 for all postpartum women, regardless of breastfeeding status, if placed >4 weeks postpartum or immediately postpartum (defined as within 10 minutes of the delivery of the placenta). IUD placement is category 2 (recommended with the caution that advantages usually outweigh risks) if placed ≥10 minutes after placental delivery (until 4 weeks postpartum) because of an increased risk of expulsion.3
The US MEC also considers use of the implant and LNG-IUDs in breastfeeding women as category 1 if the device is placed at ≥4 weeks postpartum. Insertion at <4 weeks postpartum is considered category 2 because of concerns for decreased breast milk supply.3 However, studies on whether progestin-containing LARC devices affect breastfeeding have yielded varying results. In one randomized controlled trial (RCT) of 69 breastfeeding women using the implant, breastfeeding duration and milk production were not dependent on the timing of insertion after delivery.21 Another RCT of 96 women using LNG-IUDs showed fewer women continued to breastfeed at 6 months when their LNG-IUD was inserted immediately postpartum, compared with waiting 6 weeks.22
In addition to a concern about breast milk supply, breastfeeding women have a higher risk for uterine perforation from IUDs, especially during the first 36 weeks after delivery.23
Several studies have shown that there is a lower repeat pregnancy rate among women who receive immediate postpartum LARC placement.24 However, even if IUD insertion is performed immediately postpartum, there is a higher expulsion rate than when the IUD is inserted ≥4 weeks postpartum. The expulsion rates for insertion <10 minutes after vaginal delivery range from 9.5% to 15% for the copper IUD to as high as 24% for the LNG-IUDs. Expulsion rates for all IUDs are slightly lower for cesarean delivery.4,25,26 ACOG supports immediate post-placental placement for women with barriers to postpartum care or limited access to contraception.4
How can I help my patients make an informed choice?
Provide counseling on efficacy, common adverse effects, risks, and complications.
Efficacy is high
The failure rate of LARC is equal to, or lower than, that of female sterilization and is significantly lower than that of oral contraceptives (TABLE 1).4-6 Not only are LARC devices extremely effective, they have a higher rate of satisfaction than any other reversible contraceptive (TABLE 1).7,8
Common adverse effects
The most common adverse effect seen with all LARC devices is an alteration in menstrual bleeding, and a frequent adverse effect with IUDs is pain. Vaginitis is less common and can be seen with any of the devices. The progestin-containing LARC devices are associated with hormonal effects: vaginitis, headache, weight gain, acne, breast pain, hair loss, and emotional lability.12-15
Copper IUD. Many women using the copper IUD experience either a transient increase in menstrual bleeding lasting for a few months or inter-menstrual bleeding that tends to continue for the duration of use.4,17 However, according to data from the Contraceptive CHOICE Project, the most common reason cited for early discontinuation of the copper IUD is pain and cramping.9
LNG-IUDs. Like the copper IUD, many users of LNG-IUDs experience an initial increase in menstrual bleeding. However, unlike the other LARC devices, 20% to 33% of Mirena users are likely to experience amenorrhea after one year of use and 70% at 2 years.4,14 According to package inserts, amenorrhea after 3 years is less common with both Skyla (12%) and Liletta (38%).12,13 As with the copper IUD, based on data from the Contraceptive CHOICE Project, the most common reason cited for early discontinuation of LNG-IUDs is pain and cramping.9
Subdermal implant. Changes in menses in women using the subdermal implant range from amenorrhea (22%) to prolonged bleeding (18%).15,17 Although it is difficult to predict which pattern a particular woman will experience, heavier women are more likely to have heavier bleeding patterns, and initial bleeding patterns are predictive of future ones.4 The most common reason women choose to discontinue use of the implant is abnormal bleeding.4,9,27,28
Newer IUDs do not increase risk of STIs
Many patients and clinicians erroneously believe that IUDs increase the risk of STIs and therefore assume that patients with a history of STI are not appropriate candidates for an IUD.29 There is a slightly increased risk of pelvic inflammatory disease (PID) in the first 21 days after insertion of an IUD. However, in contrast to older IUDs, currently available IUDs do not increase the general risk for STIs.17,30
Risk of infertility is nil
There is no risk of infertility from use of currently available LARCs. For those who want to become pregnant, fertility typically returns immediately after removal of the device, regardless of which method of LARC is used.11-15,30
Complications of IUD insertion
Uterine perforation. Uterine perforation occurs in 0.8 to 2.1 per 1000 women, usually at the time of IUD placement. If IUD strings are not visible during a speculum examination, locate the IUD with ultrasound.4,17,30 If the IUD is in the abdomen, refer to a gynecologist for laparoscopic removal and select another form of contraception for use in the interim.30
Expulsion. Rates of expulsion are low, occurring in less than 10% of women4,17 and are not affected by parity or BMI.31 Expulsion rates are higher when the IUD is inserted immediately postpartum.4,25,26 Adolescents also have a 2-fold higher risk of uterine expulsion than older women.31
Ectopic pregnancy. Although a woman’s overall risk of ectopic pregnancy is not increased by using an IUD,4 it is true that if a woman becomes pregnant with an IUD in place, the pregnancy is more likely to be ectopic. Thus, if pregnancy is confirmed in a woman with an IUD in place, rule out ectopic pregnancy.
The FDA and the World Health Organization recommend that if an intrauterine pregnancy is confirmed with an IUD in place and the strings are visible, the IUD should be removed.4 Although removing the IUD increases the risk of spontaneous abortion (SAB) as compared with pregnancies without an IUD in place, the risk of SAB is still lower than if the IUD is left in place.4 Additional risks of continuing a pregnancy with an IUD in place include increased risks of preterm labor, chorioamnionitis, and septic abortion.4,30
Complications of subdermal implant insertion
After insertion of the implant, women usually experience temporary bruising and soreness at the insertion site. Less than 1% of women develop an infection or hematoma.17 There is a low risk of nerve damage if the implant is inserted too deeply.15 Removal of the subdermal implant is recommended if pregnancy occurs.15
CASE DECISIONS › Jenny has been using oral contraceptive pills, but not regularly. You suggest that LARC may be a better option and counsel her that if she does choose an IUD or the implant, it is likely that her menses will change. You provide information and reassurance that LARC is safe to use in adolescents. Jenny says she would like to try an implant. Six months later, Jenny returns and says the implant is working well. She has some irregular bleeding, but it is not bothersome.
You review with Ms. D the types of LARC devices available and reassure her that all are safe to use once breastfeeding is established. Ms. D says she would like to use an IUD and elects to wait until her postpartum visit to have an IUD inserted. Ms. D returns 6 months after IUD insertion; breastfeeding is going well, and she has not had any menstrual bleeding since delivery.
CORRESPONDENCE
Karyn Kolman, MD, 2800 East Ajo Way, Room 3006, Tucson, AZ 85713; [email protected]
1. Daniels K, Daugherty J, Jones J. Current contraceptive status among women aged 15-44: United States 2011-2013. NCHS data brief, no. 173. Hyattsville, MD: National Center for Health Statistics, 2014.
2. Branum AM, Jones J. Trends in long-acting reversible contraception use among US women aged 15-44. NCHS data brief, no. 188. Hyattsville, MD: National Center for Health Statistics, 2015.
3. Centers for Disease Control and Prevention (CDC). US medical eligibility criteria for contraceptive use, 2010. MMWR Recomm Rep. 2010;59:1-86.
4. American College of Obstetricians and Gynecologists. ACOG Practice Bulletin No 121: Long-acting reversible contraception: Implants and intrauterine devices. Obstet Gynecol. 2011;118:184-196.
5. Pickle S, Wu J, Burbank-Schmitt E. Prevention of unintended pregnancy: a focus on long-acting reversible contraception. Prim Care. 2014;41:239-260.
6. Winner B, Peipert JF, Zhao Q, et al. Effectiveness of long-acting reversible contraception. N Engl J Med. 2012;366:1998-2007.
7. Peipert JF, Zhao Q, Allsworth JE, et al. Continuation and satisfaction of reversible contraception. Obstet Gynecol. 2011;117:1105-1113.
8. O’Neil-Callahan M, Peipert JF, Zhao Q, et al. Twenty-four-month continuation of reversible contraception. Obstet Gynecol. 2013;122:1083-1091.
9. Grunloh DS, Casner T, Secura GM, et al. Characteristics associated with discontinuation of long-acting reversible contraception within the first 6 months of use. Obstet Gynecol. 2011;117:705-719.
10. Birgisson NE, Zhao Q, Secura GM, et al. Preventing unintended pregnancy: the contraceptive CHOICE project in review. J Womens Health (Larchmt). 2015;24:349-353.
11. ParaGard T 380A. (intrauterine copper contraceptive) [package insert]. Sellersville, PA : Teva Pharmaceuticals USA, Inc., 2013.
12. Skyla (levonorgestrel-releasing intrauterine system) [package insert]. Wayne, NJ : Bayer HealthCare Pharmaceuticals, Inc., 2013.
13. Liletta (levonorgestrel-releasing intrauterine system) [package insert]. Parsippany, NJ : Actavis Pharma, Inc., 2015.
14. Mirena (levonorgestrel-releasing intrauterine system) [package insert]. Whippany, NJ : Bayer HealthCare Pharmaceuticals, Inc., 2014.
15. Nexplanon (etongestrel implant) [package insert]. Whitehouse Station, NJ: Merck & Co Inc.; 2014.
16. Wu JP, Pickle S. Extended use of the intrauterine device: a literature review and recommendations for clinical practice. Contraception. 2014;89:495-503.
17. Stoddard A, McNicholas C, Peipert JF. Efficacy and safety of long-acting reversible contraception. Drugs. 2011;71:969-980.
18. Xu H, Wade JA, Peipert JF, et al. Contraceptive failure rates of etonogestrel subdermal implants in overweight and obese women. Obstet Gynecol. 2012;120:21-26.
19. Centers for Disease Control and Prevention (CDC). US selected practice recommendations for contraceptive use. MMWR Recomm Rep. 2013;62:1-60.
20. Centers for Disease Control and Prevention (CDC). Sexually transmitted disease treatment guidelines. MMWR Recomm Rep. 2010;59:1-110.
21. Gurtcheff SE, Turok DK, Stoddard G, et al. Lactogenesis after early postpartum use of the contraceptive implant: a randomized controlled trial. Obstet Gynecol. 2011;117:1114-1121.
22. Chen BA, Reeves MF, Creinin MD, et al. Postplacental or delayed levonorgestrel intrauterine device insertion and breast-feeding duration. Contraception. 2011;84:499-504.
23. Heinemann K, Reed S, Moehner S, et al. Risk of uterine perforation with levonorgestrel-releasing and copper intrauterine devices in the European Active Surveillance Study on Intrauterine Devices. Contraception. 2015;91:274-279.
24. Tocce K, Sheeder J, Python J, et al. Long acting reversible contraception in postpartum adolescents: early initiation of etonogestrel implant is superior to IUDs in the outpatient setting. J Pediatr Adolesc Gynecol. 2012;25:59-63.
25. Mwalwanda CS, Black KI. Immediate post-partum initiation of intrauterine contraception and implants: a review of the safety and guidelines for use. Aust N Z J Obstet Gynaecol. 2013;53:331-337.
26. Sober, S, Schreiber CA. Postpartum contraception. Clin Obstet Gynecol. 2014;57:763-776.
27. Dickerson LM, Diaz VA, Jordon J, et al. Satisfaction, early removal, and side effects associated with long-acting reversible contraception. Fam Med. 2013;45:701-707.
28. Berenson AB, Tan A, Hirth JM. Complications and continuation rates associated with 2 types of long-acting contraception. Am J Obstet Gynecol. 2015;212:e1-e8.
29. Kavanaugh ML, Frowirth L, Jerman J, et al. Long-acting reversible contraception for adolescents and young adults: patient and provider perspectives. J Pediatr Adolesc Gynecol. 2013;86:86-95.
30. Espey E, Ogburn T. Long-acting reversible contraceptives: intrauterine devices and the contraceptive implant. Obstet Gynecol. 2011;117:705-719.
31. Madden T, McNicholas C, Zhao Q, et al. Association of age and parity with intrauterine device expulsion. Obstet Gynecol. 2014;124:718-726.
Treating pain in a patient with addiction

Delayed cancer diagnosis tied to care dissatisfaction

Photo courtesy of NIH
Patients who make 3 or more trips to the general practitioner (GP) before they are referred for cancer tests are more likely to be dissatisfied with subsequent care, according to research published in the European Journal of Cancer Care.
Researchers analyzed survey responses from nearly 60,000 cancer patients and found that about 23% had visited their GP 3 or more times before they were referred for cancer tests.
These patients were more likely than patients with 1 or 2 GP visits to report negative experiences with regard to many different aspects of their care.
“This research shows that first impressions go a long way in determining how cancer patients view their experience of cancer treatment,” said study author Georgios Lyratzopoulos, MD, of University College London in the UK.
“A negative experience of diagnosis can trigger loss of confidence in their care throughout the cancer journey. When they occur, diagnostic delays are largely due to cancer symptoms being extremely hard to distinguish from other diseases, combined with a lack of accurate and easy-to-use tests. New diagnostic tools to help doctors decide which patients need referring are vital to improve the care experience for even more cancer patients.”
Dr Lyratzopoulos and his colleagues initially analyzed survey data from 73,462 cancer patients, but 15,355 of those patients (21%) had not seen a GP prior to their cancer diagnosis.
Of the 58,107 patients who had at least 1 primary care consultation, 44,827 (77%) had seen their GP once or twice before referral for cancer tests, and 13,280 (23%) had seen the GP 3 or more times.
The researchers analyzed patients’ responses to 12 survey questions that assessed satisfaction with various aspects of their cancer care.
And results showed that patients who had seen their GP 3 or more times before referral were significantly more likely than patients with 1 to 2 GP visits to report negative experiences across 10 of the 12 aspects of care.
The 12 aspects of care and patient responses (for 3+ GP visits and 1-2 visits, respectively) were as follows:
- Dissatisfied with overall care: 16% vs 9% (adjusted* odds ratio [aOR]=1.44, P<0.001)
- Dissatisfied with the way they were informed of their cancer: 22% vs 14% (aOR=1.38, P<0.001)
- Dissatisfied with their involvement in decision-making: 32% vs 25% (aOR=1.13, P<0.001)
- Lack of confidence/trust in their doctors: 19% vs 12% (aOR=1.22, P<0.001)
- Lack of confidence/trust in their nurses: 36% vs 27% (aOR=1.22, P<0.001)
- Thought doctors/nurses deliberately withheld information: 16% vs 10% (aOR=1.27, P<0.001)
- Dissatisfied with staff support: 41% vs 27% (aOR=1.68, P<0.001)
- Dissatisfied with integration of various caregivers (GP, hospital doctors/nurses, specialist nurses, etc): 45% vs 32% (aOR=1.48, P<0.001)
- Dissatisfied with the amount of time they had to wait at appointments with their hospital doctor: 31% vs 28% (aOR=1.10, P=0.007)
- Said their GP did not receive enough information about their condition or hospital treatment: 8% vs 5% (aOR=1.36, P<0.001)
- Said they did not receive clear written information about what they should or should not do after leaving the hospital: 20% vs 14% (aOR=1.06, P=0.100)
- Said they did not receive the name of a Clinical Nurse Specialist who would be in charge of their care: 11% vs 9% (aOR=1.00, P=0.894).
“This is the first time we’ve had direct feedback from patients on such a large scale to show how the timeliness of their diagnosis colors their experience of the care they later receive,” said Sara Hiom, of Cancer Research UK, which supported this study.
“It’s another good reason to highlight the importance of diagnosing cancer as quickly as possible, not just to give patients the best chances of survival, but also to improve their experience of the care they receive throughout their cancer journey.” ![]()
*The odds ratio was adjusted for patient age, sex, ethnicity, cancer diagnosis, and response tendency (likelihood of giving a positive or negative response to questions).