User login
USPSTF recommends low-dose aspirin for preeclampsia prevention
The use of low-dose aspirin is advisable after 12 weeks of gestation in asymptomatic pregnant women at high risk for developing preeclampsia, according to a recommendation from the U.S. Preventive Services Task Force.
The recommendation, published online Sept. 8 in the Annals of Internal Medicine, is based on a review of new evidence suggesting that the net benefit of low-dose aspirin for preventing preeclampsia is of substantial magnitude. It updates a 1996 recommendation from the USPSTF, which concluded that there was insufficient evidence at that time to recommend for or against the routine use of aspirin for the prevention of preeclampsia.

The current evidence – including 15 randomized controlled trials used to assess the health benefits of low-dose aspirin, 13 randomized controlled trials used to evaluate preeclampsia incidence, and 19 randomized controlled trials and 2 good-quality observational studies used to evaluate harms associated with low-dose aspirin use – suggests that women at risk may benefit from low-dose aspirin beginning after 12 weeks of gestation.
Preeclampsia complicates 2%-8% of pregnancies worldwide, and accounts for 15% of preterm births and 12% of maternal deaths in the United States, according to the task force.
"The USPSTF found adequate evidence of a reduction in risk for preeclampsia, preterm birth, and IUGR [intrauterine growth restriction] in women at increased risk for preeclampsia who received low-dose aspirin, thus demonstrating substantial benefit. Low-dose aspirin (range, 60-150 mg/day) reduced the risk for preeclampsia by 24% in clinical trials [pooled relative risk, 0.76] and reduced the risk for preterm birth by 14% and IUGR by 20% [pooled relative risk, 0.86 and 0.80, respectively]," the updated recommendation stated (Ann. Intern. Med. 2014 Sept. 8 [doi:10.7326/m14-1884]).
Adequate evidence also indicates that low-dose aspirin is not associated with any increase in the risk of placental abruption, postpartum hemorrhage, fetal intracranial bleeding, or perinatal mortality.
"Evidence on long-term outcomes in offspring exposed in utero to low-dose aspirin is limited, but no developmental harms were identified by age 18 months in the one study reviewed," the task force wrote, concluding – with moderate certainty – that there is a substantial net benefit of daily low-dose aspirin use to reduce the risk for preeclampsia, preterm birth, and IUGR in women at high risk.
The decision to initiate low-dose aspirin therapy in this population is typically based on medical history; there are no validated methods for identifying women at high risk based on biomarkers, clinical diagnostic tests, or medical history. However, as part of the recommendation, the USPSTF provided a pragmatic approach that may help identify those at risk.
"Women with one or more risk factors should receive low-dose aspirin. Women with several moderate risk factors may also benefit from low-dose aspirin," the task force noted, adding that the evidence for the latter approach is less certain, and that clinicians should use clinical judgment and discuss the risks and benefits with patients.
The recommendation applies to asymptomatic women at risk in whom low-dose aspirin is not contraindicated, and defines women at high risk as those with a history of preeclampsia, especially those with an adverse outcome; chronic hypertension, renal disease, type 1 or 2 diabetes, or an autoimmune disease; and those with multifetal gestation, according to the updated recommendation.
Moderate risk factors include nulliparity, obesity, a family history of preeclampsia, age greater than or equal to 35 years, African American race, low socioeconomic status, low birth rate or small for gestational age, greater than 10-year pregnancy interval, or previous adverse pregnancy outcome.
As for appropriate dosing, the most common dosage across studies was 100 mg, but the two largest trials contributing to benefit estimates used 60 mg.
An 81-mg dose was not specifically evaluated, but is commonly available in the United States in tablet form, and is a reasonable dosage for preeclampsia prophylaxis, the task force said.
The updated recommendation is generally in keeping with those of other organizations, including the American College of Obstetricians and Gynecologists, the World Health Organization, the National Institute for Health and Clinical Excellence, the American Heart Association/American Stroke Association, and the American Academy of Family Physicians. For example, ACOG recommends initiating daily low-dose aspirin during the late first trimester in those with a history of early-onset preeclampsia and preterm delivery, or with a history of preeclampsia in more than one prior pregnancy (<cf number="\"2\"">“</cf>American College of Obstetricians and Gynecologists: Hypertension in Pregnancy [Washington, D.C.: American College of Obstetricians and Gynecologists, 2013]), and WHO recommends daily low-dose aspirin as early as 12 weeks for those at high risk ("WHO Recommendations for Prevention and Treatment of Pre-Eclampsia and Eclampsia" [Geneva: World Health Organization, 2011]).
The review by the USPSTF identified several research needs. For example, additional study is needed on the effects of low-dose aspirin on the development of preeclampsia and how patient response is affected by various risk factors. Research is also needed on how to improve clinicians’ ability to identify those at risk, and particularly those who would benefit most from prophylaxis. Study is needed on risk assessment tools, and on populations at particular risk, such as African American and nulliparous women.
Future trials should recruit adequate numbers of women from racial/ethnic populations that are at disproportionate risk.
"Larger studies on aspirin use in the first or early second trimester may improve the evidence base on optimal timing of low-dose aspirin preventive medication. Other areas of research include optimal therapies that individualize the aspirin dosage and timing of administration (e.g., morning vs. bedtime)," they concluded, noting that research is also needed to explore less-well-established risk factors, and to investigate whether preeclampsia prevention with low-dose aspirin affects long-term risk for cardiovascular disease, and whether there is any benefit to continuing low-dose aspirin after delivery in those at high risk.
The use of low-dose aspirin is advisable after 12 weeks of gestation in asymptomatic pregnant women at high risk for developing preeclampsia, according to a recommendation from the U.S. Preventive Services Task Force.
The recommendation, published online Sept. 8 in the Annals of Internal Medicine, is based on a review of new evidence suggesting that the net benefit of low-dose aspirin for preventing preeclampsia is of substantial magnitude. It updates a 1996 recommendation from the USPSTF, which concluded that there was insufficient evidence at that time to recommend for or against the routine use of aspirin for the prevention of preeclampsia.
The current evidence – including 15 randomized controlled trials used to assess the health benefits of low-dose aspirin, 13 randomized controlled trials used to evaluate preeclampsia incidence, and 19 randomized controlled trials and 2 good-quality observational studies used to evaluate harms associated with low-dose aspirin use – suggests that women at risk may benefit from low-dose aspirin beginning after 12 weeks of gestation.
Preeclampsia complicates 2%-8% of pregnancies worldwide, and accounts for 15% of preterm births and 12% of maternal deaths in the United States, according to the task force.
"The USPSTF found adequate evidence of a reduction in risk for preeclampsia, preterm birth, and IUGR [intrauterine growth restriction] in women at increased risk for preeclampsia who received low-dose aspirin, thus demonstrating substantial benefit. Low-dose aspirin (range, 60-150 mg/day) reduced the risk for preeclampsia by 24% in clinical trials [pooled relative risk, 0.76] and reduced the risk for preterm birth by 14% and IUGR by 20% [pooled relative risk, 0.86 and 0.80, respectively]," the updated recommendation stated (Ann. Intern. Med. 2014 Sept. 8 [doi:10.7326/m14-1884]).
Adequate evidence also indicates that low-dose aspirin is not associated with any increase in the risk of placental abruption, postpartum hemorrhage, fetal intracranial bleeding, or perinatal mortality.
"Evidence on long-term outcomes in offspring exposed in utero to low-dose aspirin is limited, but no developmental harms were identified by age 18 months in the one study reviewed," the task force wrote, concluding – with moderate certainty – that there is a substantial net benefit of daily low-dose aspirin use to reduce the risk for preeclampsia, preterm birth, and IUGR in women at high risk.
The decision to initiate low-dose aspirin therapy in this population is typically based on medical history; there are no validated methods for identifying women at high risk based on biomarkers, clinical diagnostic tests, or medical history. However, as part of the recommendation, the USPSTF provided a pragmatic approach that may help identify those at risk.
"Women with one or more risk factors should receive low-dose aspirin. Women with several moderate risk factors may also benefit from low-dose aspirin," the task force noted, adding that the evidence for the latter approach is less certain, and that clinicians should use clinical judgment and discuss the risks and benefits with patients.
The recommendation applies to asymptomatic women at risk in whom low-dose aspirin is not contraindicated, and defines women at high risk as those with a history of preeclampsia, especially those with an adverse outcome; chronic hypertension, renal disease, type 1 or 2 diabetes, or an autoimmune disease; and those with multifetal gestation, according to the updated recommendation.
Moderate risk factors include nulliparity, obesity, a family history of preeclampsia, age greater than or equal to 35 years, African American race, low socioeconomic status, low birth rate or small for gestational age, greater than 10-year pregnancy interval, or previous adverse pregnancy outcome.
As for appropriate dosing, the most common dosage across studies was 100 mg, but the two largest trials contributing to benefit estimates used 60 mg.
An 81-mg dose was not specifically evaluated, but is commonly available in the United States in tablet form, and is a reasonable dosage for preeclampsia prophylaxis, the task force said.
The updated recommendation is generally in keeping with those of other organizations, including the American College of Obstetricians and Gynecologists, the World Health Organization, the National Institute for Health and Clinical Excellence, the American Heart Association/American Stroke Association, and the American Academy of Family Physicians. For example, ACOG recommends initiating daily low-dose aspirin during the late first trimester in those with a history of early-onset preeclampsia and preterm delivery, or with a history of preeclampsia in more than one prior pregnancy (<cf number="\"2\"">“</cf>American College of Obstetricians and Gynecologists: Hypertension in Pregnancy [Washington, D.C.: American College of Obstetricians and Gynecologists, 2013]), and WHO recommends daily low-dose aspirin as early as 12 weeks for those at high risk ("WHO Recommendations for Prevention and Treatment of Pre-Eclampsia and Eclampsia" [Geneva: World Health Organization, 2011]).
The review by the USPSTF identified several research needs. For example, additional study is needed on the effects of low-dose aspirin on the development of preeclampsia and how patient response is affected by various risk factors. Research is also needed on how to improve clinicians’ ability to identify those at risk, and particularly those who would benefit most from prophylaxis. Study is needed on risk assessment tools, and on populations at particular risk, such as African American and nulliparous women.
Future trials should recruit adequate numbers of women from racial/ethnic populations that are at disproportionate risk.
"Larger studies on aspirin use in the first or early second trimester may improve the evidence base on optimal timing of low-dose aspirin preventive medication. Other areas of research include optimal therapies that individualize the aspirin dosage and timing of administration (e.g., morning vs. bedtime)," they concluded, noting that research is also needed to explore less-well-established risk factors, and to investigate whether preeclampsia prevention with low-dose aspirin affects long-term risk for cardiovascular disease, and whether there is any benefit to continuing low-dose aspirin after delivery in those at high risk.
FROM ANNALS OF INTERNAL MEDICINE

Psychiatry, free speech, school safety, and cannibalism
Over the past few days, an article has circulated about a 23-year-old middle school teacher in Cambridge, Md., who was suspended from his job because of two futuristic novels he wrote, including one about a school massacre 900 years in the future. The story was reported in The Atlantic under the headline, "In Maryland, a Soviet-Style Punishment for a Novelist."
The article, by Jeffrey Goldberg, said the young teacher had self-published his novels some time ago under a pseudonym. In addition to his being suspended, an "emergency medical evaluation" was ordered, his house was searched, and the school was swept for bombs by K-9 dogs. No charges have been filed as of this writing.
This response was deemed an "overreaction," and certainly has been good for book sales but probably not so much for the young man’s teaching career. The idea that artistic expression must conform to a specific standard or jeopardize one’s job leaves those with creative pursuits to worry and civil rights advocates to protest.
Soon after, the Los Angeles Times published an article stating that the issue was not the novels – the school knew about those in 2012 – but rather the content of a four-page letter the teacher had written to the school board suggesting that the teacher was suffering from some type of psychiatric condition and might have included indications that he was suicidal or dangerous. With this information, it was not as clear if the police response was an overreaction, and such determinations are generally made in hindsight: If a bomb is found, the decision was heroic, if not, it was an overreaction and a civil rights violation.
The case reminded me of the story about a New York City police officer who had Internet discussions about his desire to cook and eat women, including his ex-wife. While the officer never ate anyone, he was part of an online community called the Dark Fetish Network, which has of tens of thousands of registered users who discuss violent sexual fantasies. The officer, known in the media frenzy as Cannibal Cop, lost his job and was convicted of plotting to kidnap, a crime that could carry a life sentence. He reportedly had graphic discussions of plans to kill, roast, and eat specified victims, and he claimed that he had the means to do so. An investigation revealed that he did not own the implements that would enable him to carry out such a plan. His lawyer insisted that he was engaged in a role-playing fantasy, but he was convicted by a jury in 2012. In July, his conviction was overturned and he was released on bond. By that time, Cannibal Cop had served a year and a half in prison, with several months of it in solitary confinement.
Situations in which a person has done nothing illegal but has spoken or written words that indicate he or she might be a threat to public safety are fraught with concerns. While violent fantasies might be seen as "creepy" at a minimum, the criminal justice system is left to decide where the line is between fantasy and plan, and when a real threat exists. A person has the right to his dark fantasies, and the First Amendment right to free speech allows for discussion of those fantasies, while artistic endeavors allow for their expression. At the same time, if there are named or presumed victims, those individuals should not have to live with the terror of wondering if the fantasizer is going to act on the fantasies.
Invariably, psychiatrists end up being involved, even if the individual in question has no psychiatric history or obvious diagnosis. In a New York magazine article about the police officer titled, "A Dangerous Mind," Robert Kolker noted: "Pre-crime and psychiatry often go hand in hand. Legal instruments like institutionalization and sex-offender registration all share the goal of preventing crime from taking place, and for better or worse, they’re based on a psychiatric rationale."
As we all know, it can be difficult – if not impossible – to distinguish those who are having fantasies from those who are planning to commit a dangerous act. As psychiatrists, we deal with this uncertainty for patients who have suicidal thoughts on a regular basis. Often, even the patients don’t know for sure if they will act on their impulses. Fantasies that involve harming others are more unusual in clinical practice, and our risk assessment often begins with the stated intent of the individual. Our strongest predictor of future behavior continues to be past behavior, and neither the teacher nor the police officer in the stories above had criminal records.
To make it even more confusing, the Internet has added to the uncertainty; people have always had dangerous and fetishistic fantasies, but now there are ways others can learn the content of what was once very private. The risk, of course, is that fantasies and artistic endeavors become subject to both psychiatric scrutiny and criminal prosecution in a way that threatens civil rights and squelches creativity.
Dr. Miller is a coauthor of "Shrink Rap: Three Psychiatrists Explain Their Work" (Baltimore:The Johns Hopkins University Press, 2011).

Nostalgic for making diagnoses based on medical history alone? Me, neither
"It is clear that physicians take widely different attitudes towards investigations, some relying on them much more heavily than others."
– J.R. Hampton, et al., British Medical Journal, May 31, 1975
In 1975, a study was published in the British Medical Journal looking at new patients referred to a medical clinic. The study looked specifically at how a diagnosis was made for each new patient, and it concluded that in 66 out of 80 patients, a diagnosis was arrived at based on the history alone, that the physical exam was useful in an additional 7 patients, and that lab testing was useful in the last 7 patients (Br. Med. J. 1975;2:486-9). Since then, medical students have been taught that a good history will lead to the diagnosis about 80% of the time.
One of my professors in my internal medicine class taught me this aphorism. I thought he was brilliant. Surely, anyone who can come up with a diagnosis just by talking to a patient is a minor god? (He is a rheumatologist. He became my mentor, and is, in fact, one of the major influences in my choice of specialty.)
Medical school in the Philippines forces one to think that way anyhow. There is very little government-provided health care; everything else is paid for out of pocket. This means that every CBC I order, every electrolyte panel, every antinuclear antibody, every urinalysis, is charged to the patient. There are not enough hospital beds, ventilators, or MRI machines.
So patients waited a while before seeking medical attention, which means we took full advantage of a history that’s remarkably evolved, with classic, textbook physical exam findings. The general medicine wards were crammed with patients with jaundice, whether from hepatitis or from having the carcass of a dead ascaris worm lodged in their bile ducts. We saw fungating breast masses. Hyperthyroidism is not that hard to identify when the patient is in frank thyrotoxicosis. Patients with pulmonary tuberculosis had massive hemoptysis, buckets of blood, and acid-fast bacilli in the emergency department.
This is the environment in which I trained. Could I say then that I would be able to identify a problem just from taking a history alone? If you had months’, nay, years’ worth of history to work with, you’d be able to identify the problem, too. I’ll bet doctors who practiced in the 1960s and 1970s in the United States had similar experiences, having the benefit of witnessing full-blown cases of anything and everything.
Do I practice this way now? Not at all.
But that isn’t to say I don’t take a good enough history or physical exam, it’s just that patients seek medical attention earlier, and we have so many more resources at our disposal. We have the ability to detect illness before it wreaks havoc. (There are other, less charitable interpretations of this behavior, such as lack of time, patient expectations, etc. But that’s a topic for another time.)
I have a great deal of respect for my mentors who practice with very real limitations. I have no doubt they are better doctors than I am. And, of course, I feel nostalgic for the way we used to do things. It is easy to romanticize the sepia-toned snapshots of my third-world youth. But really, modernity is a blessing. We should celebrate our ability to find things early. Nostalgia is for meals and memories. Medicine is much more pedestrian than that.
Dr. Chan practices rheumatology in Pawtucket, R.I.

Method may fight inhibitor formation in hemophilia A

A new strategy may one day prevent hemophilia patients from developing antibodies that inhibit clotting factors.
With this method, plant cells “teach” the immune system to tolerate the clotting factor protein.
In mice with hemophilia A, the strategy prevented and reversed the formation of factor VIII (FVIII) inhibitors.
Henry Daniell, PhD, of the University of Pennsylvania School of Dental Medicine in Philadelphia, and his colleagues described the approach in Blood. The work was supported by the National Institutes of Health and Bayer.
“The only current treatments for inhibitor formation cost $1 million and are risky for patients,” Dr Daniell said. “Our technique, which uses plant-based capsules, has the potential to be a cost-effective and safe alternative.”
Developing the technique
Previous studies had shown that exposing the immune system to individual components of the clotting factor protein could induce tolerance to the whole protein.
FVIII is composed of a heavy chain and a light chain, with each containing 3 domains. For their study, the researchers used the whole heavy chain and the C2 domain of the light chain.
Dr Daniell and his colleagues developed a platform for delivering drugs and biotherapeutics that relies on genetically modifying plants so they express the protein of interest.
Trying that same method with the components of the FVIII molecule, the team first fused the heavy chain DNA with DNA encoding a cholera toxin subunit, a protein that can cross the intestinal wall and enter the bloodstream, and did the same with the C2 DNA.
They introduced the fused genes into tobacco chloroplasts, so that some plants expressed the heavy chain and cholera toxin proteins and others expressed the C2 and cholera toxin proteins. They then ground up the plant leaves and suspended them in a solution, mixing the heavy chain and C2 solutions together.
Testing in mice
The researchers fed the mixed solution to mice with hemophilia A twice a week for 2 months and compared them to mice that consumed unmodified plant material. The team then gave the mice infusions of FVIII.
As expected, the control mice formed high levels of inhibitors. But the mice fed the experimental plant material formed much lower levels of inhibitors—on average, 7 times lower.
Mice that consumed the experimental plants exhibited upregulation of cytokines associated with suppressing or regulating immune responses, while control mice showed upregulation of cytokines associated with triggering an immune response.
By transferring subsets of regulatory T cells taken from the mice that received the experimental plants into normal mice, the researchers were able to suppress inhibitor formation. This suggests the T cells were able to carry tolerance-inducing characteristics to the new population of animals.
“This gives us an explanation for the mechanism of how this tolerance is being created,” Dr Daniell said.
Finally, the researchers tried to reverse inhibitor formation. They fed the experimental plant material to mice that had already developed inhibitors.
Compared to a control group, the mice given the FVIII-containing plant material had their inhibitor formation slow and then reverse, decreasing 3- to 7-fold over 2 or 3 months of feeding.
This strategy holds promise for preventing and even reversing inhibitor formation in hemophiliacs receiving FVIII infusions. However, the researchers’ experiments showed that inhibitor levels could rise again as time passes.
“After some time, antibodies do develop if you stop giving them the plant material,” Dr Daniell said. “This is not a one-time treatment. You need to do it repetitively to maintain the tolerance.”
Dr Daniell and the Penn Center for Innovation are now working with a pharmaceutical company to test this oral tolerance strategy in other animal species, with plans to begin human trials shortly thereafter. For human use, the goal would be to use lettuce plants instead of tobacco plants. ![]()
Banked blood grows stiffer with age, study shows

Credit: Daniel Gay
The longer blood is stored, the less it is able to carry oxygen into the tiny microcapillaries of the body, according to a study published in Scientific Reports.
Using advanced optical techniques, researchers measured the stiffness of the membrane surrounding red blood cells.
They found that, even though the cells retain their shape and hemoglobin content, the membranes get stiffer over time, which steadily decreases the cells’ functionality.
“Our results show some surprising facts: Even though the blood looks good on the surface, its functionality is degrading steadily with time,” said study author Gabriel Popescu, PhD, of the University of Illinois at Urbana-Champaign.
Dr Popescu and his colleagues wanted to measure changes in red blood cells over time to help determine what effect older blood could have on a patient.
They used an optical technique called spatial light interference microscopy (SLIM), which was developed in Dr Popescu’s lab in 2011. It uses light to noninvasively measure cell mass and topology with nanoscale accuracy. Through software and hardware advances, the SLIM system today acquires images almost 100 times faster than it did 3 years ago.
The researchers took time-lapse images of red blood cells, measuring and charting their properties. In particular, the team was able to measure nanometer-scale motions of the cell membrane, which are indicative of the cell’s stiffness and function. The fainter the membrane motion, the less functional the cell.
The measurements revealed that a lot of characteristics stay the same over time. The cells retain their shape, mass, and hemoglobin content, for example.
However, the membranes become stiffer and less elastic as time passes. This is important because the cells need to be flexible enough to travel through tiny capillaries and permeable enough for oxygen to pass through.
“In microcirculation, such as that in the brain, cells need to squeeze though very narrow capillaries to carry oxygen,” said study author Basanta Bhaduri, PhD, of the University of Illinois at Urbana-Champaign.
“If they are not deformable enough, the oxygen transport is impeded to that particular organ, and major clinical problems may arise. This is the reason why new red blood cells are produced continuously by the bone marrow, such that no cells older than 100 days or so exist in our circulation.”
The researchers hope the SLIM imaging method will be used clinically to monitor stored blood before it is given to patients, since conventional white-light microscopes can be easily adapted for SLIM with a few extra components.
“These results can have a wide variety of clinical applications,” said author Krishna Tangella, MD, of the University of Illinois at Urbana-Champaign.
“Functional data from red blood cells would help physicians determine when to give red cell transfusions for patients with anemia. This study may help better utilization of red cell transfusions, which will not only decrease healthcare costs but also increase the quality of care.” ![]()
Overcoming an obstacle to RBC development

Researchers have discovered a natural barrier to hematopoiesis and a way to circumvent it, according to a paper published in Blood.
The group found that components of the exosome complex—exosc8 and exosc9—suppress red blood cell (RBC) maturation.
“From a fundamental perspective, this is very important because this mechanism counteracts the development of precursor cells into red blood cells, thereby establishing a balance between developed cells and the progenitor population,” said study author Emery Bresnick, PhD, of the UW School of Medicine and Public Health in Madison, Wisconsin.
“In the context of translation, if you want to maximize the output of end-stage red blood cells, which we’re not able to do at this time, our study provides a rational approach involving lowering the levels of these subunits.”
Specifically, the researchers found that GATA-1 and Foxo3 can repress the exosome components, thereby allowing for RBC maturation.
The barrier explained
Dr Bresnick and his colleagues noted that the primary obstacle in converting hematopoietic stem cells into RBCs involves late-stage maturation.
“The problem isn’t simply getting erythroid precursors produced by the bucket, but understanding how these cells systematically lose their nuclei and organelles to become a red blood cell, the final product,” Dr Bresnick said.
“This is the bottleneck, even in the stem cell world of embryonic and induced pluripotent stem cells. We know little about how the cell orchestrates the intricate processes that constitute late-stage maturation.”
At the end of RBC development, the erythroid precursor must eject its own genetic material via enucleation. Although it’s clear why enucleation is important (making the cell more flexible and allowing it to carry more oxygen), exactly how the cell does it has been unclear.
Besides ejecting the nucleus, the cell must be cleared of other organelles, such as the endoplasmic reticulum and mitochondria. This process (autophagy) is linked to a pair of transcription factors—GATA1 and Foxo3—that control gene expression important in RBC development.
Because they knew GATA1 and Foxo3 promote autophagy, Dr Bresnick and his colleagues wondered if the proteins these transcription factors repress play an important role in cell maturation.
This led them to identify exosc8 and exosc9, two units of the exosome that ultimately established the development barrier.
The researchers plan to continue studying the exosome because many RNAs in the cell are not degraded by the exosome. Determining exactly how the exosome decides what RNA to dispose of may provide an even better understanding of the newly discovered barrier.
“One goal we have is to establish the specific RNA targets the exosome is regulating that are responsible for the blockade,” Dr Bresnick said. “In doing so, we might even uncover targets that are easier to manipulate than the exosome itself.” ![]()
Health Canada approves dabigatran for VTE

Credit: Kevin MacKenzie
Health Canada has approved dabigatran etexilate (Pradaxa) for the treatment and prevention of venous thromboembolism (VTE).
Dabigatran is a novel, reversible, oral direct thrombin inhibitor that has been on the market for more than 5 years and is approved in more than 100 countries.
Health Canada’s latest approval of dabigatran is based on results from four phase 3 trials—RE-MEDY, RE-SONATE, and RE-COVER I and II.
The trials suggested that dabigatran given at 150 mg twice daily can treat and prevent a recurrence of deep vein thrombosis or pulmonary embolism.
RE-COVER I
In the first RE-COVER trial, dabigatran proved noninferior to warfarin for preventing VTE recurrence, and rates of major bleeding were similar between the treatment arms. However, patients were more likely to discontinue dabigatran due to adverse events.
VTE recurred in 2.4% of patients treated with dabigatran and 2.1% of patients who received warfarin (P<0.001 for noninferiority).
Bleeding events occurred in 16.1% of patients who received dabigatran and 21.9% of warfarin-treated patients (P<0.001). Major bleeding occurred in 1.6% and 1.9% of patients, respectively (P=0.38).
The numbers of deaths, acute coronary syndromes, and abnormal liver-function tests were similar between the treatment arms. But adverse events leading to treatment discontinuation occurred in 9.0% of dabigatran-treated patients and 6.8% of patients in the warfarin arm (P=0.05).
Results from RE-COVER were presented at ASH 2009 and published in NEJM.
RE-COVER II
The RE-COVER II trial suggested that dabigatran was noninferior to warfarin for preventing VTE recurrence and related deaths. This outcome occurred in 2.3% of dabigatran-treated patients and 2.2% of warfarin-treated patients (P<0.001 for noninferiority).
Major bleeding occurred 1.2% of patients who received dabigatran and 1.7% of patients who received warfarin. Any bleeding occurred in 15.6% and 22.1% of patients, respectively.
Overall, rates of death, adverse events, and acute coronary syndromes were similar between the treatment arms.
Results from RE-COVER II were published in Circulation in 2013.
RE-MEDY and RE-SONATE
The RE-MEDY and RE-SONATE trials were designed to evaluate dabigatran as extended VTE prophylaxis. Results of both trials were reported in a single NEJM article published in 2013.
The RE-MEDY trial showed that dabigatran was noninferior to warfarin as extended prophylaxis for recurrent VTE, and warfarin presented a significantly higher risk of bleeding.
VTE recurred in 1.8% of patients in the dabigatran arm and 1.3% of patients in the warfarin arm (P=0.01 for noninferiority). And the rate of clinically relevant or major bleeding was lower with dabigatran than with warfarin—at 5.6% and 10.2%, respectively (P<0.001).
Results of the RE-SONATE trial showed that dabigatran was superior to placebo for preventing recurrent VTE, although the drug significantly increased the risk of major or clinically relevant bleeding.
VTE recurred in 0.4% of patients in the dabigatran arm and 5.6% of patients in the placebo arm (P<0.001). Clinically relevant or major bleeding occurred in 5.3% of patients in the dabigatran and 1.8% of patients in the placebo arm (P=0.001).
Safety concerns with dabigatran
Over the years, the safety of dabigatran has been called into question, as serious bleeding events have been reported in patients taking the drug.
However, results of two investigations by the US Food and Drug Administration—one reported in 2012 and one reported this year—have suggested the benefits of dabigatran outweigh the risks.
Recently, a series of papers published in The BMJ raised concerns about dabigatran, claiming the drug’s developer underreported adverse events and withheld data showing that monitoring and dose adjustment could improve the safety of dabigatran without compromising its efficacy. The developer, Boehringer Ingelheim, denied these allegations.
For more information on dabigatran, see its product monograph. ![]()
ID Consult: National immunization coverage and measles
August was National Immunization Awareness Month. For most pediatricians, it is also a very busy month as patients prepare for the start of the new school year. So how are we doing?
On August 28, 2013, vaccination coverage of U.S. children aged 19-35 months was published in Morbidity and Mortality Weekly Review (2014; 63:741-8) based on results from the National Information Survey (NIS), which provides national, regional, state, and selected local area vaccination coverage estimates. NIS has monitored vaccination coverage since 1994 for all 50 states and assists in tracking the progress of achieving our national goals. It also can identify problem areas that may require special interventions. Survey data was obtained by a random telephone survey using both landline and cellular phones to households that have children born between January 2010 and May 2012. The verbal interview was followed by a survey mailed to the vaccine provider to confirm the verbal vaccine history.
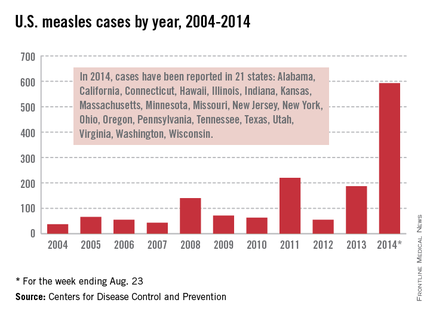
Highlights
Vaccination coverage of at least 90 %, a goal of Healthy People 2020, was achieved for receipt of one or more dose of MMR (91.9%); three or more doses of hepatitis B vaccine (HepB) (90.8 %); three or more doses of poliovirus vaccine (92.7%) and one or more doses of varicella vaccine (91.2%).
Coverage for the following vaccines failed to meet this goal: four or more doses of diphtheria, tetanus, and pertussis vaccine (DTaP) (83.1%); four or more doses of pneumococcal conjugate vaccine (PCV) (82%); and a full series of Haemophilus influenzae type b (Hib) (82%). Coverage for the remaining vaccines also fell short of their respective targeted goals: two or more doses of hepatitis A vaccine (54.7%; target 85%); rotavirus (72.6%; target 80%); and hepatitis B birth dose (74.2%; target 85%).
Compared with 2012, coverage remained stable for the four vaccines that achieved at least 90% coverage. For those that did not, rotavirus was the only vaccine in 2013 that had an increase (4%) in coverage. Of note, there was an increase in the birth dose of 2.6% for Hep B.
Children living at or below the poverty level had lower vaccination coverage, compared with those living at or above this level for several vaccines, including four or more doses of DTaP; full series of Hib vaccine, four or more doses of PCV, and rotavirus vaccine. Coverage was between 8% and 12.6% points lower for these vaccines.
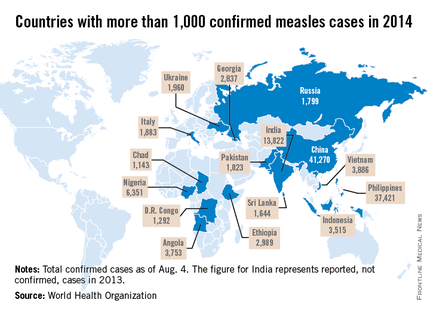
Measles
Let’s take a closer look at measles. Nationally, almost 92 % of children received at least one dose of MMR. However, coverage varied by state – an observation unchanged from 2012. New Hampshire had the highest coverage at 96.3% and three states had coverage of only 86% (Colorado, Ohio, and West Virginia). Overall 17 states had immunization rates less than 90%. Additionally, 1 in 12 children did not receive their first dose of MMR on time. Why the concern? In 2013, there were 187 cases of measles including 11 outbreaks. A total of 82% occurred in unvaccinated individuals, and another 9% were unaware of their immunization status.
As of Aug. 25, 2014, there were 595 cases of measles in the United States in 21 states, according to the Centers for Disease Control and Prevention’s National Center for Immunization and Respiratory Diseases. This is the highest number of cases reported since endemic measles was eliminated in 2000. There were as a result of 18 outbreaks, representing 89% of the reported cases. Cases are occurring even in states where immunization rates are reported to be at least 90% – a reminder that there can be pockets of low or nonimmunizing communities that leave its citizens vulnerable to outbreaks when a highly contagious virus is introduced.
Since endemic measles was eliminated 14 years ago in the United States, many health care providers have never seen a case of measles or may not realize the impact it once had on our public health system. Prior to the initiation of the measles vaccination program in 1963, 3-4 million cases of measles occurred annually in the United States with 400-500 deaths and 48,000 hospitalizations. Approximately another 1,000 individuals were left disabled secondary to measles encephalitis. Once the vaccine was introduced, the incidence of measles declined 98%, according to "Epidemiology and Prevention of Vaccine-Preventable Diseases," 12th ed., second printing. (Washington, D.C: Public Health Foundation, 2012). Between 1989 and 1991, there was a resurgence of measles resulting in approximately 55,000 cases, 11,000 hospitalizations, and 123 deaths. The resurgence was caused primarily by the failure to vaccinate uninsured children at the recommended 12-15 months of age. Children younger than 5 years of age accounted for 45% of all cases. The Vaccines for Children Program was created in 1993 as a direct response to the resurgence of measles. It would ensure that no child would contract a vaccine preventable disease because of inability to pay.

Measles remains endemic in multiple countries worldwide that are travel destinations for many Americans. In 2013, 99% of 159 U.S. cases were import related. An overwhelming majority of infections occurred in unvaccinated individuals. In 2014, this trend continues, with the majority of cases occurring in unvaccinated international travelers who return infected and spread disease to susceptible persons including children in their communities (MMWR 2014:63;496-9). Of the 288 cases reported in by May 23, 2014, 97% were associated with importations from 18 countries.
High immunization coverage must be maintained to prevent and sustain measles elimination in the United States. As a reminder, all children aged 6-11 months should receive one dose of MMR ideally 2 weeks prior to international travel. When the infant is at least 12 months of age, they should receive two additional doses of MMR or MMRV according to the routine immunization schedule. Those children older than 12 months of age should receive two doses of MMR. The second can be administered as soon as 4 weeks after the first dose. It is not uncommon for families to travel internationally and fail to mention it to you. Many have been told their child’s immunizations are up to date, not realizing that international travel may alter that definition. It behooves primary care providers to develop strategies to facilitate discussions regarding sharing international travel plans in a timely manner.
Dr. Word is a pediatric infectious disease specialist and director of the Houston Travel Medicine Clinic. She had no relevant financial disclosures. Write to Dr. Word at [email protected].
August was National Immunization Awareness Month. For most pediatricians, it is also a very busy month as patients prepare for the start of the new school year. So how are we doing?
On August 28, 2013, vaccination coverage of U.S. children aged 19-35 months was published in Morbidity and Mortality Weekly Review (2014; 63:741-8) based on results from the National Information Survey (NIS), which provides national, regional, state, and selected local area vaccination coverage estimates. NIS has monitored vaccination coverage since 1994 for all 50 states and assists in tracking the progress of achieving our national goals. It also can identify problem areas that may require special interventions. Survey data was obtained by a random telephone survey using both landline and cellular phones to households that have children born between January 2010 and May 2012. The verbal interview was followed by a survey mailed to the vaccine provider to confirm the verbal vaccine history.
Highlights
Vaccination coverage of at least 90 %, a goal of Healthy People 2020, was achieved for receipt of one or more dose of MMR (91.9%); three or more doses of hepatitis B vaccine (HepB) (90.8 %); three or more doses of poliovirus vaccine (92.7%) and one or more doses of varicella vaccine (91.2%).
Coverage for the following vaccines failed to meet this goal: four or more doses of diphtheria, tetanus, and pertussis vaccine (DTaP) (83.1%); four or more doses of pneumococcal conjugate vaccine (PCV) (82%); and a full series of Haemophilus influenzae type b (Hib) (82%). Coverage for the remaining vaccines also fell short of their respective targeted goals: two or more doses of hepatitis A vaccine (54.7%; target 85%); rotavirus (72.6%; target 80%); and hepatitis B birth dose (74.2%; target 85%).
Compared with 2012, coverage remained stable for the four vaccines that achieved at least 90% coverage. For those that did not, rotavirus was the only vaccine in 2013 that had an increase (4%) in coverage. Of note, there was an increase in the birth dose of 2.6% for Hep B.
Children living at or below the poverty level had lower vaccination coverage, compared with those living at or above this level for several vaccines, including four or more doses of DTaP; full series of Hib vaccine, four or more doses of PCV, and rotavirus vaccine. Coverage was between 8% and 12.6% points lower for these vaccines.
Measles
Let’s take a closer look at measles. Nationally, almost 92 % of children received at least one dose of MMR. However, coverage varied by state – an observation unchanged from 2012. New Hampshire had the highest coverage at 96.3% and three states had coverage of only 86% (Colorado, Ohio, and West Virginia). Overall 17 states had immunization rates less than 90%. Additionally, 1 in 12 children did not receive their first dose of MMR on time. Why the concern? In 2013, there were 187 cases of measles including 11 outbreaks. A total of 82% occurred in unvaccinated individuals, and another 9% were unaware of their immunization status.
As of Aug. 25, 2014, there were 595 cases of measles in the United States in 21 states, according to the Centers for Disease Control and Prevention’s National Center for Immunization and Respiratory Diseases. This is the highest number of cases reported since endemic measles was eliminated in 2000. There were as a result of 18 outbreaks, representing 89% of the reported cases. Cases are occurring even in states where immunization rates are reported to be at least 90% – a reminder that there can be pockets of low or nonimmunizing communities that leave its citizens vulnerable to outbreaks when a highly contagious virus is introduced.
Since endemic measles was eliminated 14 years ago in the United States, many health care providers have never seen a case of measles or may not realize the impact it once had on our public health system. Prior to the initiation of the measles vaccination program in 1963, 3-4 million cases of measles occurred annually in the United States with 400-500 deaths and 48,000 hospitalizations. Approximately another 1,000 individuals were left disabled secondary to measles encephalitis. Once the vaccine was introduced, the incidence of measles declined 98%, according to "Epidemiology and Prevention of Vaccine-Preventable Diseases," 12th ed., second printing. (Washington, D.C: Public Health Foundation, 2012). Between 1989 and 1991, there was a resurgence of measles resulting in approximately 55,000 cases, 11,000 hospitalizations, and 123 deaths. The resurgence was caused primarily by the failure to vaccinate uninsured children at the recommended 12-15 months of age. Children younger than 5 years of age accounted for 45% of all cases. The Vaccines for Children Program was created in 1993 as a direct response to the resurgence of measles. It would ensure that no child would contract a vaccine preventable disease because of inability to pay.
Measles remains endemic in multiple countries worldwide that are travel destinations for many Americans. In 2013, 99% of 159 U.S. cases were import related. An overwhelming majority of infections occurred in unvaccinated individuals. In 2014, this trend continues, with the majority of cases occurring in unvaccinated international travelers who return infected and spread disease to susceptible persons including children in their communities (MMWR 2014:63;496-9). Of the 288 cases reported in by May 23, 2014, 97% were associated with importations from 18 countries.
High immunization coverage must be maintained to prevent and sustain measles elimination in the United States. As a reminder, all children aged 6-11 months should receive one dose of MMR ideally 2 weeks prior to international travel. When the infant is at least 12 months of age, they should receive two additional doses of MMR or MMRV according to the routine immunization schedule. Those children older than 12 months of age should receive two doses of MMR. The second can be administered as soon as 4 weeks after the first dose. It is not uncommon for families to travel internationally and fail to mention it to you. Many have been told their child’s immunizations are up to date, not realizing that international travel may alter that definition. It behooves primary care providers to develop strategies to facilitate discussions regarding sharing international travel plans in a timely manner.
Dr. Word is a pediatric infectious disease specialist and director of the Houston Travel Medicine Clinic. She had no relevant financial disclosures. Write to Dr. Word at [email protected].
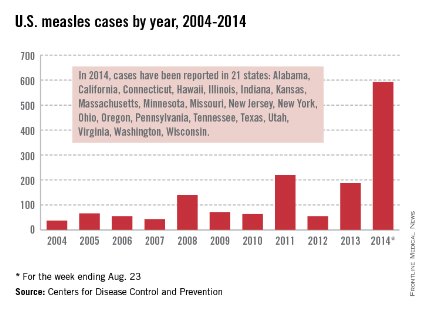
LISTEN NOW: Greg Maynard, MD, SFHM, Chats about SHM's Mentored Implementation Programs
Click here to listen to excerpts of our interview with Dr. Maynard
Click here to listen to excerpts of our interview with Dr. Maynard
Click here to listen to excerpts of our interview with Dr. Maynard
Right-sided living donor kidney transplant found safe
SAN FRANCISCO – The practice of preferentially using left instead of right kidneys in living donor kidney transplantation may no longer be justified in the era of contemporary laparoscopic surgery, suggests a national study reported at the 2014 World Transplant Congress.
"The current approach in many centers is to prefer left living donor nephrectomy due to longer vessel length...Right donor nephrectomy, at least in our center and I think in most centers, has generally been reserved for cases of multiple or complex vessels on the left or incidental anatomical abnormalities on the right like cysts or stones," commented presenting author Dr. Tim E. Taber of Indiana University in Indianapolis.

Only one in seven of the roughly 59,000 living donor kidney transplants studied was performed using a right kidney. However, most short- and long-term outcomes were statistically indistinguishable between recipients of left and right kidneys, and the differences that were significant were small, he reported at the congress sponsored by the American Society of Transplant Surgeons.
"Our [study] is the largest national analysis or most recent large data analysis done on this subject in today’s surgical era of established laparoscopic living donor nephrectomies. There may be a minor risk for slightly inferior outcomes with right versus left kidneys," Dr. Taber concluded.
"Right-donor nephrectomy continues to be performed with great reluctance," he added. Yet, "under the accepted principles of live-donor nephrectomy, with enough surgical expertise, right-donor nephrectomy can be performed successfully. Right kidneys seem to have a very small difference, if any, in outcomes as compared to left kidneys. Surgical expertise and experience should be tailored toward this aspect."
A session attendee from Brazil commented, "We [prefer] to choose the right kidney in situations where we have one artery on the right side and multiple arteries on the left side." In these cases, his group uses an approach to the vasculature adopted from pancreas transplantation. "We have identical results with the right and left side," he reported.
Dr. Lloyd E. Ratner, director of renal and pancreatic transplantation at Columbia University Medical Center in New York, who also attended the session, said, "I feel somewhat responsible for causing this problem with the right kidney because we were the ones that originally described the higher thrombosis rate with the right kidney with the laparoscopic donor nephrectomies. And I think it scared everyone off from this topic."
As several attendees noted, "there are surgical ways of getting around this," he agreed, offering two more options. "The first is that if we get a short vein, we’re not reluctant at all to put a piece of Dacron onto it, so you don’t even need to dig out the saphenous and cause additional time or morbidity to the patient. And the nice thing about the Dacron grafts is that they are corrugated and they don’t collapse. They also stretch, so you don’t need to cut them exactly precisely," he said.
"And number two is when you are stapling ... it’s often useful to be able to staple onto the cava and not get the vein in one staple byte." By using two passes in the appropriate configuration, "you actually get a cuff of cava, then you have plenty of vein," he explained.
In the study, Dr. Taber and colleagues retrospectively analyzed data from 58,599 adult living donor kidney transplants performed during 2000-2009 and captured in the United Network for Organ Sharing (UNOS) database. In 86% of cases, surgeons used the donor’s left kidney.
Recipients of left and right kidneys were statistically indistinguishable with respect to hospital length of stay, treatment for acute rejection within 6 months, acute rejection as a cause of graft failure, inadequate urine production in the first 24 hours, primary graft failure, graft thrombosis or surgical complication as a contributory cause of graft failure, and 1-year graft survival.
Those receiving a right kidney did have significant but small increases in rates of delayed graft function, as defined by the need for dialysis within 7 days of transplantation (5.7% vs. 4.2%), lack of decline in serum creatinine in the first 24 hours (19.7% vs. 16.4%), treatment for acute rejection within 1 year (12.7% vs. 11.8%), and graft thrombosis as the cause of graft failure (1.1% vs. 0.8%).
The Kaplan-Meier cumulative rate of graft survival was better for left kidneys than for right kidneys (P = .006), but "these are essentially superimposed numbers," said Dr. Taber, who disclosed no conflicts of interest related to the research.
The study had limitations, such as its retrospective design, lack of more detailed information about donor and recipient outcomes, and reliance on data as reported by centers, he acknowledged. Also, such large studies may pick up small differences that are not clinically meaningful.
"With ever-increasing demands for living donor transplantation, right-donor nephrectomies are being considered more often. Every effort should be made to leave the donor with the higher-functioning kidney, but at the same time maximizing the living donor pool," Dr. Taber concluded.
Dr. Taber disclosed no relevant conflicts of interest.
SAN FRANCISCO – The practice of preferentially using left instead of right kidneys in living donor kidney transplantation may no longer be justified in the era of contemporary laparoscopic surgery, suggests a national study reported at the 2014 World Transplant Congress.
"The current approach in many centers is to prefer left living donor nephrectomy due to longer vessel length...Right donor nephrectomy, at least in our center and I think in most centers, has generally been reserved for cases of multiple or complex vessels on the left or incidental anatomical abnormalities on the right like cysts or stones," commented presenting author Dr. Tim E. Taber of Indiana University in Indianapolis.
Only one in seven of the roughly 59,000 living donor kidney transplants studied was performed using a right kidney. However, most short- and long-term outcomes were statistically indistinguishable between recipients of left and right kidneys, and the differences that were significant were small, he reported at the congress sponsored by the American Society of Transplant Surgeons.
"Our [study] is the largest national analysis or most recent large data analysis done on this subject in today’s surgical era of established laparoscopic living donor nephrectomies. There may be a minor risk for slightly inferior outcomes with right versus left kidneys," Dr. Taber concluded.
"Right-donor nephrectomy continues to be performed with great reluctance," he added. Yet, "under the accepted principles of live-donor nephrectomy, with enough surgical expertise, right-donor nephrectomy can be performed successfully. Right kidneys seem to have a very small difference, if any, in outcomes as compared to left kidneys. Surgical expertise and experience should be tailored toward this aspect."
A session attendee from Brazil commented, "We [prefer] to choose the right kidney in situations where we have one artery on the right side and multiple arteries on the left side." In these cases, his group uses an approach to the vasculature adopted from pancreas transplantation. "We have identical results with the right and left side," he reported.
Dr. Lloyd E. Ratner, director of renal and pancreatic transplantation at Columbia University Medical Center in New York, who also attended the session, said, "I feel somewhat responsible for causing this problem with the right kidney because we were the ones that originally described the higher thrombosis rate with the right kidney with the laparoscopic donor nephrectomies. And I think it scared everyone off from this topic."
As several attendees noted, "there are surgical ways of getting around this," he agreed, offering two more options. "The first is that if we get a short vein, we’re not reluctant at all to put a piece of Dacron onto it, so you don’t even need to dig out the saphenous and cause additional time or morbidity to the patient. And the nice thing about the Dacron grafts is that they are corrugated and they don’t collapse. They also stretch, so you don’t need to cut them exactly precisely," he said.
"And number two is when you are stapling ... it’s often useful to be able to staple onto the cava and not get the vein in one staple byte." By using two passes in the appropriate configuration, "you actually get a cuff of cava, then you have plenty of vein," he explained.
In the study, Dr. Taber and colleagues retrospectively analyzed data from 58,599 adult living donor kidney transplants performed during 2000-2009 and captured in the United Network for Organ Sharing (UNOS) database. In 86% of cases, surgeons used the donor’s left kidney.
Recipients of left and right kidneys were statistically indistinguishable with respect to hospital length of stay, treatment for acute rejection within 6 months, acute rejection as a cause of graft failure, inadequate urine production in the first 24 hours, primary graft failure, graft thrombosis or surgical complication as a contributory cause of graft failure, and 1-year graft survival.
Those receiving a right kidney did have significant but small increases in rates of delayed graft function, as defined by the need for dialysis within 7 days of transplantation (5.7% vs. 4.2%), lack of decline in serum creatinine in the first 24 hours (19.7% vs. 16.4%), treatment for acute rejection within 1 year (12.7% vs. 11.8%), and graft thrombosis as the cause of graft failure (1.1% vs. 0.8%).
The Kaplan-Meier cumulative rate of graft survival was better for left kidneys than for right kidneys (P = .006), but "these are essentially superimposed numbers," said Dr. Taber, who disclosed no conflicts of interest related to the research.
The study had limitations, such as its retrospective design, lack of more detailed information about donor and recipient outcomes, and reliance on data as reported by centers, he acknowledged. Also, such large studies may pick up small differences that are not clinically meaningful.
"With ever-increasing demands for living donor transplantation, right-donor nephrectomies are being considered more often. Every effort should be made to leave the donor with the higher-functioning kidney, but at the same time maximizing the living donor pool," Dr. Taber concluded.
Dr. Taber disclosed no relevant conflicts of interest.
FROM THE 2014 WORLD TRANSPLANT CONGRESS
Key clinical point: Choices of kidney to transplant may not need to hinge on left or right donor organ as a deciding factor.
Major Finding: Recipients of left and right kidneys were statistically indistinguishable with respect to hospital length of stay, treatment for acute rejection within 6 months, acute rejection as a cause of graft failure, inadequate urine production in the first 24 hours, and primary graft failure for acute rejection.
Data Source: A national retrospective cohort study of 58,599 adult living donor kidney transplants done during 2000-2009
Disclosures: Dr. Taber disclosed no relevant conflicts of interest.
