User login
New insight into stem cell differentiation

Adam Engler, UC San Diego
Jacobs School of Engineering
The stiffness of the extracellular matrix may play a larger role in stem cell differentiation than we thought, according to a new study.
Scientists have recently suggested that protein tethering and matrix porosity, as well as matrix stiffness and ligand type, regulate stem cell differentiation.
However, new research published in Nature Materials indicates that matrix stiffness regulates stem cell differentiation independently of tethering and porosity.
Adam Engler, PhD, of the University of California, San Diego, and his colleagues discovered that human adipose stromal cells and mesenchymal stromal cells underwent osteogenic differentiation if placed in a stiff hydrogel. But the cells underwent adipogenesis if placed in a soft hydrogel.
The protein binding the stem cell to the hydrogel was not a factor in the differentiation process. Results suggested the protein layer was merely an adhesive.
The researchers found that stem cell differentiation is a response to the mechanical deformation of the hydrogel from the force exerted by the cell. With a series of experiments, the team showed that this happens whether the protein tethering the cell to the matrix is tight, loose, or nonexistent.
Across multiple samples using a stiff matrix, varying the degree of tethering made no significant difference in the rate of osteogenic or adipogenic differentiation.
Likewise, the size of the pores in the matrix had no effect on stem cell differentiation, as long as the stiffness of the hydrogel remained the same.
However, Dr Engler pointed out that matrix stiffness is only “one cue out of dozens that are important in stem cell differentiation.”
“That doesn’t mean the other cues are irrelevant,” he noted. “They may still push the cells into a specific cell type. We have just ruled out porosity and tethering, and further emphasized stiffness in this process.” ![]()
Current Options and Future Directions in the Systemic Treatment of Metastatic Melanoma
This article has been adapted from an article originally published in The Journal of Supportive and Community Oncology (jcso-online.com). Schindler K, Postow M. Current options and future directions in the systemic treatment of metastatic melanoma. J Community Support Oncol. 2014;12(1):20-26.
The incidence of melanoma, a highly aggressive tumor arising from melanocytes, continues to rise by about 3% a year in the U.S. with about 76,000 patients being diagnosed every year and 9,000 patients dying of the disease.1 Complete surgical resection is the standard for localized melanoma, with surgical excision margins depending on tumor thickness. For patients with involved sentinel lymph nodes, complete lymphadenectomy is typically recommended, although the benefits of completion lymphadenectomy are being evaluated in an ongoing randomized trial.2,3
For patients with surgically resected, high-risk melanoma, the only approved adjuvant therapy is interferon-a (IFN-a).4 Use of IFN-a, however, remains controversial because of the associated adverse effects (AEs) and controversial effects on overall survival (OS).5,6 Unfortunately, many patients with localized disease will ultimately experience a recurrence, and the prognosis of patients with metastatic disease is poor with a historical 5-year survival rate of 10%.7
Chemotherapy and interleukin 2
For more than 3 decades, conventional cytotoxic chemotherapy was used to treat metastatic melanoma. Typical agents included alkylating agents (dacarbazine, temozolomide, nitrosoureas), platinum analogs (cisplatin and carboplatin), and microtubular toxins (vinblastine and paclitaxel). Despite the clinical use and investigation of a number of these chemotherapies for patients with metastatic melanoma, the only treatment approved by the FDA is dacarbazine, which is administered intravenously every 3 to 4 weeks at a dose of 800 to 1,000 mg/m2.
Monotherapy with dacarbazine is generally well tolerated with only mild AEs such as nausea, myelosuppression, and fatigue. In a pooled analysis, the overall response rate (RR) for dacarbazine was approximately 9%.8 Temozolomide, the oral analog of dacarbazine, penetrates into the central nervous system and has been compared with dacarbazine in randomized trials. These agents are believed to have similar efficacy, but temozolomide has been associated with a higher rate of lymphopenia.9,10
Investigation of chemotherapy combinations such as cisplatin, vinblastine, and dacarbazine or carboplatin and paclitaxel have shown promising RRs but unfortunately no prolongation of OS compared with single-agent dacarbazine.11-13 Despite its modest efficacy, chemotherapy still has a place in the palliative treatment for some patients.
In addition to dacarbazine, the immunotherapeutic strategy, high-dose recombinant interleukin-2 (IL-2), had also been a mainstay treatment for advanced melanoma for many years. IL-2 is administered as an IV infusion every 8 hours at a dose of 600,000 to 720,000 IU/kg on days 1 to 5 and days 15 to 19, with a maximum of 14 such biphasic cycles. Because of the significant acute toxicity profile, including capillary leak syndrome, cardiovascular complications, and seizures, IL-2 treatment requires hospitalization and is generally only performed at specialized centers for patients with good performance status. Though the overall RR in pooled analysis was low at 16%, the durability of responses in some responders that appeared to last many years led to the FDA approval of IL-2 in 1998.14,15
IL-2 continues to be investigated. In a randomized trial, an improved RR and progression-free survival (PFS) were seen when IL-2 was combined with the glycoprotein 100 (gp100) peptide vaccine compared with IL-2 alone.16 Other approaches have sought to improve the safety of IL-2 by selectively delivering it to tumor sites. The fusion protein L19-IL2 couples IL-2 with the recombinant human vascular targeting antibody L19 and has preliminarily been shown to be safe in phase 1 evaluation and in combination with dacarbazine.17,18
Antibodies that block immunologic checkpoints
Melanoma has long been recognized as an immunogenic malignancy but the efficacy of immunotherapeutic strategies has generally been modest. The precise etiology of why immunotherapy historically was not more successful is not completely understood, but it is possible that patients with advanced malignancy have predominant immune inhibitory circuits that prevent otherwise effective antitumor immune responses.
In recent years, research has illuminated some of these immunologic inhibitory elements, termed “immunologic checkpoints,” which include cytotoxic T-lymphocyte antigen 4 (CTLA-4) and programmed death-1 (PD-1). Antibodies that target these checkpoints have resulted in durable responses in some patients and a unique pattern of immune-mediated AEs. Though an ongoing area of research, no pre- or on-treatment biomarkers have been sufficiently validated to enable specific patient selection for these therapies.
Antibodies Blocking CTLA-4
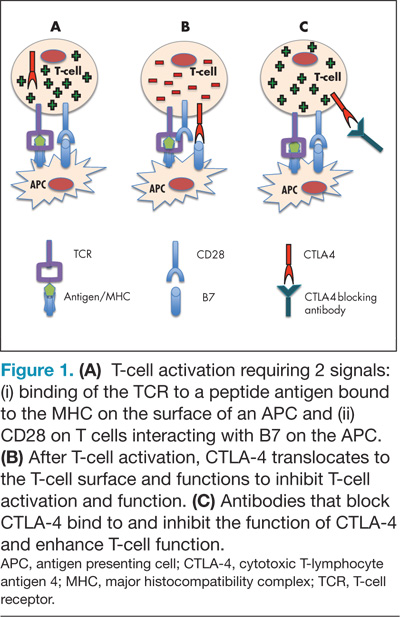
CTLA-4 is expressed on activated T cells and typically functions as a negative regulator of T-cell activity preserving normal immunologic homeostasis. Blocking CTLA-4 with therapeutic antibodies such as ipilimumab and tremelimumab prevents normal CTLA-4–mediated T-cell downregulation and thereby enhances the ability of T cells to exert their full antitumor immune effects (Figure 1). Ipilimumab was the first drug in the management of metastatic melanoma to show an improvement in OS in phase 3 studies, and although a phase 3 study of tremelimumab did not demonstrate an improvement in OS, durable responses were similarly seen.19-21
The first phase 3 trial investigating ipilimumab randomized previously pretreated patients with advanced melanoma to ipilimumab at a dose of 3 mg/kg with or without the gp100 peptide vaccine. The median OS was 10.0 months among patients receiving ipilimumab plus gp100, compared with 6.4 months among patients receiving gp100 alone. There was no difference in OS between the ipilimumab groups.19 The outcome of this study has led to the approval of ipilimumab at a dose of 3 mg/kg in patients with advanced melanoma by regulatory agencies in the U.S., European Union, and Australia.
For treatment-naive patients, a second phase 3 trial investigating dacarbazine in combination with ipilimumab compared with dacarbazine in combination with placebo also demonstrated improvement of OS in patients treated with dacarbazine in combination with ipilimumab.20 The estimated 1-year, 2-year, and 3-year survival rates were 47.3%, 28.5%, and 20.8%, respectively, in the dacarbazine plus ipilimumab group, compared with 36.3%, 17.9%, and 12.2% in the dacarbazine alone group. This second trial used a higher dose of ipilimumab (10 mg/kg) and though it confirmed ipilimumab’s beneficial effects on OS, ipilimumab is not approved at 10 mg/kg and is not routinely recommended to be used in combination with dacarbazine given hepatic toxicity concerns.
Though the median OS was improved in these phase 3 trials, perhaps the greatest activity of ipilimumab lies in the increased number of patients who can achieve long-term OS. In a recently published updated survival analysis, the 4-year survival rates for previously treated patients who received ipilimumab at 3 or 10 mg/kg were 18.2% and 19.7% to 28.4%. For treatment-naive patients receiving ipilimumab at 10 mg/kg, 4-year survival rates were between 37.7% and 49.5%.22 These values appear superior to historical data from prior chemotherapy trials.
An important consideration in the clinical use of CTLA-4 blocking antibodies is the possible occurrence of toxicities that differ from those associated with traditional chemotherapy. These AEs are termed immune-related AEs (irAEs), and they most commonly manifest as diarrhea, dermatitis, hepatitis, and endocrinopathies but less commonly can involve other organs, resulting in uveitis, nephritis, myopathy, and neuropathy.
In general, the onset of irAEs follows a certain pattern with cutaneous manifestations often presenting early in treatment, followed by gastrointestinal and hepatic events occurring about 2 months into therapy and endocrinopathies appearing even later.23 In rare cases, severe AEs (eg, perforating colitis, toxic epidermal necrolysis) can occur and may require hospitalization.24
Clinicians must be attentive to early signs of these AEs and promptly initiate immunosuppression with steroids or other immunosuppressive medications, which do not appear to diminish the antitumor immune effects.25 Established management algorithms exist to guide clinicians. Given the occasional need for immunosuppression in this patient population, awareness of the possibility of opportunistic or rare infections is also important.
In phase 3 evaluation, the number of patients who had long-term survival exceeded the number of patients who had a classically defined disease response to treatment. Durable stable disease and late responses have been observed clinically and may be responsible for some of the beneficial outcomes.26 If patients are asymptomatic and have minimal radiographic progression, it is reasonable to repeat imaging 1 to 2 months later to confirm progression before considering additional lines of therapy.
Antibodies Blocking the Programmed Death-1 Axis
Programmed death-1 (PD-1) is a receptor on the surface of T cells that is upregulated at later stages of T-cell activation as opposed to the early upregulation of CTLA-4. Normally, engagement of PD-1 attenuates T-cell activity at several phases of an immune response. Tumors are believed to escape immune attack by similarly inhibiting T-cell activity by upregulating one of the ligands of PD-1, PD-L1.27,28 Several antibodies that inhibit PD-1 activity, either by blocking the PD-1 molecule itself or PD-L1, are demonstrating significant promise in ongoing clinical trials.
Nivolumab (previously, BMS-936558) is a fully human monoclonal antibody targeting PD-1. In a large phase 1 study in patients with a variety of malignancies, nivolumab demonstrated a 31% RR in patients with advanced melanoma.29 Subsequent follow-up data indicates these responses are generally durable with a median duration of response of 24 months and a 3-year OS rate of 40%.30 Adverse effects of nivolumab appear less frequently than with CTLA-4 blockade but have included vitiligo, colitis, hepatitis, hypophysitis, and thyroiditis. Unique to PD-1 blockade appears to be the AE of an inflammatory pneumonitis, which can present with a dry cough, dyspnea, and ground-glass opacities and can be potentially lethal.29
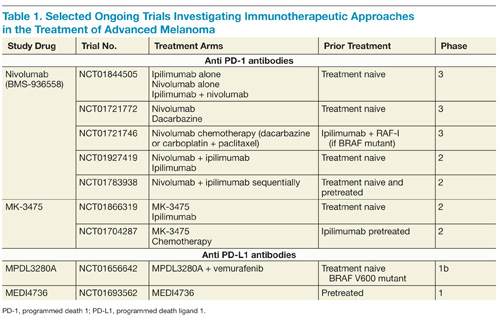
On the basis of complementary regulatory roles of CTLA-4 and PD-1 checkpoint inhibition, a trial investigating combined nivolumab and ipilimumab was completed. In the small group of patients treated, a high RR was seen with a generally acceptable safety profile.31 Ongoing phase 2 and 3 trials are assessing nivolumab alone and in combination with other agents for the treatment of advanced melanoma and other malignancies (Table 1).
Another PD-1 blocking antibody, MK-3475, has been evaluated in patients with advanced melanoma, and promising RRs have been described.32 In a small group of patients, the confirmed RR at a dose of 10 mg/kg every 2 weeks was 52% and appeared similar in patients who had and who had not been previously treated with ipilimumab. The AEs of MK-3475 seem to resemble nivolumab. MK-3475 is similarly being evaluated in large phase 2 and 3 trials for both patients with melanoma and additional malignancies.
In addition to antibodies targeting PD-1, clinical activity has also been observed with several different antibodies (BMS-936559, MPDL3280A, and MEDI4736) that target PD-L1. Though some data have been published for this therapeutic strategy,33 ongoing trials will continue to clarify the role of targeting PD-L1 in patients with advanced melanoma.
Targeted Therapies That Block Oncogenic Signaling Pathways
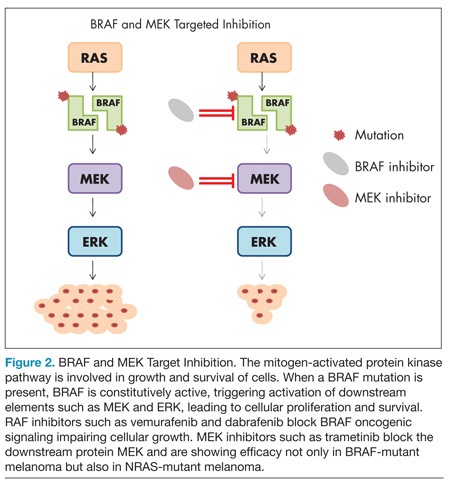
The mitogen-activated protein kinase (MAPK) pathway responds to extracellular growth signals and regulates cell proliferation and survival. In many patients with melanoma, the MAPK pathway is constitutively activated as a result of molecular alterations in genes encoding key regulators or components of the pathway such as BRAF, NRAS, and KIT.34,35 The most common mutation arising in melanoma is the BRAF mutation, occurring in nearly half of melanomas, and typically involves a missense mutation in which glutamic acid is substituted for valine at codon 600 (BRAF V600E mutation).36 Less frequent BRAF mutations include V600K, V600R, and K601E.37 Strategies that directly inhibit oncogenic BRAF or disable downstream elements such as MEK have recently shown dramatic results in patients with melanoma (Figure 2).
BRAF inhibitors
Vemurafenib is a potent inhibitor of mutated BRAF with marked antitumor effects against melanoma cell lines with the BRAF V600E mutation.38 The first striking results of tumor regression with this strategy in patients were seen in a phase 1 study in patients with melanoma characterized by a BRAF V600E mutation but not in patients whose melanomas did not have a BRAF mutation.39
Subsequent phase 3 trials confirmed the high RRs of this agent in patients with BRAF-mutant melanoma and demonstrated superiority in OS compared with dacarbazine chemotherapy.40 The results of this phase 3 trial led to the approval of vemurafenib by the FDA in August 2011 with treatment exclusively limited to patients with BRAF mutant melanoma. Updated OS data from this phase 3 study revealed a median OS of 13.2 months for vemurafenib, compared with 9.6 months for dacarbazine, with an overall RR in patients treated with vemurafenib of 57% and a median PFS of 6.9 months.41 General AEs with vemurafenib include arthralgia, fatigue, aminotransferase elevations, nausea and vomiting, and decreased kidney function. In general, toxicities are manageable with dose reduction or temporary drug cessation.
One characteristic of vemurafenib and other BRAF-targeted agents is the frequent development of hyperproliferative skin AEs. Skin lesions, including follicular and palmo-plantar hyperkeratosis, papillomas, and also cutaneous squamous-cell carcinomas and keratoacanthomas, have commonly been observed under treatment with vemurafenib, and close evaluation by a dermatologist is important.42 The mechanism of this phenomenon is believed to be a paradoxical activation of the MAPK pathway in nonmelanoma BRAF wild-type cells when systemic treatment with a BRAF inhibitor is administered.43
The phenomenon of hyperproliferation of non–BRAF-mutant tissues with ongoing BRAF-inhibitor therapy has also been seen in patients with lymphoproliferative disorders and may be a mechanism involved in the discovery that patients have a high rate of new primary melanomas while on therapy.44,45 These findings warrant special attention, particularly as BRAF inhibitors are undergoing evaluation as adjuvant therapy.
Another active BRAF kinase inhibitor with a similar efficacy profile as vemurafenib is dabrafenib, which was approved in May 2013 based on the demonstration of improved PFS in a phase 3 trial comparing dabrafenib 150 mg orally twice daily and dacarbazine 1,000 mg/m2 intravenously once every 3 weeks in previously untreated patients with BRAF V600E mutant melanoma. The median PFS times were 5.1 and 2.7 months in the dabrafenib and dacarbazine arms, respectively, with an objective RR of 52% in patients treated with dabrafenib.46 Follow-up time was too short to make a determination of the impact of dabrafenib on OS. In a separate study, dabrafenib was also shown to be effective for patients with brain metastases and remains an excellent therapeutic choice for this particular patient population.47
Generally, dabrafenib is believed to have similar efficacy to vemurafenib. Nevertheless, EAs with of dabrafenib differ somewhat from those observed with vemurafenib: The rate of proliferative skin lesions, including squamous cell carcinomas and keratoacanthomas appears to be lower for dabrafenib than vemurafenib. However, AEs particular to dabrafenib have been seen such as pyrexia, which were recorded in about 11% of patients.46
MEK inhibitors
Though targeting oncogenic BRAF directly has been incredibly successful for patients with BRAF-mutant metastatic melanoma, additional success has been observed by blocking the MAPK pathway at a downstream component, MEK. Trametinib is an MEK inhibitor that was approved by the FDA in June 2013 as a single agent for patients with BRAF V600E or V600K mutant melanoma. Trametinib is administered at a dose of 2 mg once daily and was shown to improve PFS and OS compared with dacarbazine and paclitaxel chemotherapies.47 Despite the improvement in PFS and OS compared with chemotherapy, the objective RR for trametinib was somewhat lower (22%) than that seen with BRAF inhibitors.
Trametinib also is associated with a different AE profile from BRAF inhibitors and includes diarrhea, peripheral edema, hypertension, and fatigue, typical of other MEK inhibitors as well.48 Asymptomatic and reversible reduction of the cardiac ejection fraction and ocular toxic effects also occur infrequently. Unlike with BRAF-inhibitor treatment, the development of cutaneous squamous-cell carcinomas or other hyperproliferative skin lesions was not noted.49
Despite the significant benefits of targeted therapy disrupting overly active MAPK signaling in patients with BRAF-mutant metastatic melanoma, almost all patients treated with these targeted inhibitors who achieve an initial response will ultimately progress. Several mechanisms of resistance have been proposed, and most relate to reactivation of the MAPK pathway.50,51 As a result, efforts to maintain suppression of the MAPK pathway have been pursued to delay the onset of resistance. In a phase 2 trial that combined dabrafenib with trametinib, there was a longer PFS than there was with dabrafenib monotherapy.52
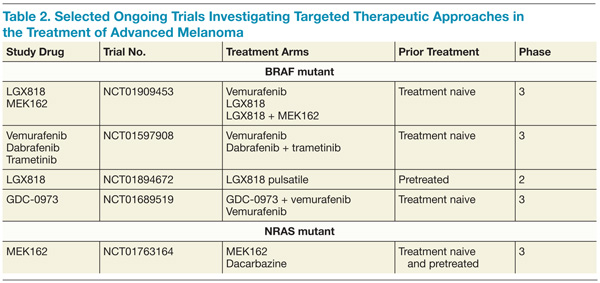
Furthermore, the addition of trametinib to dabrafenib reduced the incidence of squamous-cell carcinoma, providing further evidence that reactivation of the MAPK pathway is involved in these hyperproliferative skin lesions arising under BRAF-directed therapy. A higher rate of febrile episodes was seen, however. An ongoing phase 3 study is looking at whether or not combining BRAF and MEK inhibitors results in improved OS compared with single-agent BRAF. It is premature at this juncture to recommend combining dabrafenib and trametinib until the results of the ongoing phase 3 studies more thoroughly describe the risks and benefits of this approach (Table 2).
KIT inhibitors
In a subset of melanomas, particularly those that arise from mucosal, acral, or chronically sun-damaged skin, mutations are found in the receptor-tyrosine kinase KIT.35 A number of agents directed against KIT, such as imatinib, have been tested in clinical trials. Initial phase 2 studies revealed poor RRs with KIT inhibition in molecularly unselected patients.53-55 Subsequent studies selected patients with KIT genetic aberrations, including mutations and amplifications, and some responses were seen.56-58
Importantly, not all KIT genetic aberrations are believed to be considered equal. Preliminarily, it appears that mutations in exon 11 (L576P) and exon 13 (K642E) appear to be most closely associated with response and may be true driver mutations. Other KIT mutations may have less functional significance but additional research is needed. Imatinib is a reasonable therapeutic choice in patients with a KIT mutation, particularly when an L576P or K642E mutation is present.
conclusions
Since 2011, 4 new drugs—ipilimumab, vemurafenib, dabrafenib, and trametinib—have been approved for the treatment of metastatic melanoma. Exciting early data from PD-1 clinical trials suggest that agents that disrupt PD-1 may also become important therapeutic modalities. Future studies will continue to evaluate combinations of these therapeutic modalities, but caution should be exercised in combining these drugs prior to data from ongoing clinical trials revealing the true benefits and risks of combination therapy. Excessive toxicity was seen in an early phase trial when vemurafenib was combined with ipilimumab.59
Additional research will also explore biomarkers that may help clinicians apply immunotherapy to the most appropriate patients and better understand mechanisms of resistance to targeted therapies. Clinical trials of novel agents or combinations should be considered at every treatment juncture to continue the rapid pace of developing the most innovative and tailored treatment approaches.
Author disclosures
The authors report no actual or potential conflicts of interest with regard to this article.
Disclaimer
The opinions expressed herein are those of the authors and do not necessarily reflect those of Federal Practitioner, Frontline Medical Communications Inc., the U.S. Government, or any of its agencies. This article may discuss unlabeled or investigational use of certain drugs. Please review complete prescribing information for specific drugs or drug combinations—including indications, contraindications, warnings, and adverse effects—before administering pharmacologic therapy to patients.
1. Siegel R, Naishadham D, Jemal A. Cancer statistics, 2012. CA Cancer J Clin. 2012;62(1):10-29.
2. Garbe C, Peris K, Hauschild A, et al; European Dermatology Forum, European Association of Dermato-Oncology, European Organization of Research and Treatment of Cancer. Diagnosis and treatment of melanoma. European consensus-based interdisciplinary guideline—Update 2012. Eur J Cancer. 2012;48(15):2375-2390.
3. Coit DG, Andtbacka R, Bichakjian CK, et al; NCCN Melanoma Panel. Melanoma. J Natl Compr Canc Netw. 2009;7(3):250-275.
4. Molife R, Hancock BW. Adjuvant therapy of malignant melanoma. Crit Rev Oncol Hematol. 2002;44(1):81-102.
5. Wheatley K, Ives N, Hancock B, Gore M, Eggermont A, Suciu S. Does adjuvant interferon-alpha for high-risk melanoma provide a worthwhile benefit? A meta-analysis of the randomised trials. Cancer Treat Rev. 2003;29(4):241-252.
6. Mocellin S, Pasquali S, Rossi CR, Nitti D. Interferon alpha adjuvant therapy in patients with high-risk melanoma: A systematic review and meta-analysis. J Natl Cancer Inst. 2010;102(7):493-501.
7. Balch CM, Gershenwald JE, Soong SJ, et al. Final version of 2009 AJCC melanoma staging and classification. J Clin Oncol. 2009;27(36):6199-6206.
8. Luke JJ, Rubinstein LV, Smith GL, Ivy SP, Harris PJ. Similar efficacy for phase I trials in comparison with DTIC for advanced malignant melanoma: an analysis of melanoma outcomes in CTEP-sponsored phase I trials 1995-2011. Melanoma Res. 2013;23(2):152-158.
9. Middleton MR, Grob JJ, Aaronson N, et al. Randomized phase III study of temozolomide versus dacarbazine in the treatment of patients with advanced metastatic malignant melanoma. J Clin Oncol. 2000;18(1):158-166.
10. Teimouri F, Nikfar S, Abdollahi M. Efficacy and side effects of dacarbazine in comparison with temozolomide in the treatment of malignant melanoma: A meta-analysis consisting of 1314 patients. Melanoma Res. 2013;23(5):381-389.
11. Chapman PB, Einhorn LH, Meyers ML, et al. Phase III multicenter randomized trial of the Dartmouth regimen versus dacarbazine in patients with metastatic melanoma. J Clin Oncol. 1999;17(9):2745-2751.
12. Legha SS, Ring S, Papadopoulos N, Plager C, Chawla S, Benjamin R. A prospective evaluation of a triple-drug regimen containing cisplatin, vinblastine, and dacarbazine (CVD) for metastatic melanoma. Cancer. 1989;64(10):2024-2029.
13. Rao RD, Holtan SG, Ingle JN, et al. Combination of paclitaxel and carboplatin as second-line therapy for patients with metastatic melanoma. Cancer. 2006;106(2):375-382.
14. Atkins MB, Kunkel L, Sznol M, Rosenberg SA. High-dose recombinant interleukin-2 therapy in patients with metastatic melanoma: Long-term survival update. Cancer J Sci Am. 2000;6(suppl 1):S11-S14.
15. Atkins MB, Lotze MT, Dutcher JP, et al. High-dose recombinant interleukin 2 therapy for patients with metastatic melanoma: Analysis of 270 patients treated between 1985 and 1993. J Clin Oncol. 1999;17(7):2105-2116.
16. Schwartzentruber DJ, Lawson DH, Richards JM, et al. gp100 peptide vaccine and interleukin-2 in patients with advanced melanoma. N Engl J Med. 2011;364(22):2119-2127.
17. Johannsen M, Spitaleri G, Curigliano G, et al. The tumour-targeting human L19-IL2 immunocytokine: Preclinical safety studies, phase I clinical trial in patients with solid tumours and expansion into patients with advanced renal cell carcinoma. Eur J Cancer. 2010;46(16):2926-2935.
18. Eigentler TK, Weide B, de Braud F, et al. A dose-escalation and signal-generating study of the immunocytokine L19-IL2 in combination with dacarbazine for the therapy of patients with metastatic melanoma. Clin Cancer Res. 2011;17(24):7732-7742.
19. Hodi FS, O'Day SJ, McDermott DF, et al. Improved survival with ipilimumab in patients with metastatic melanoma. N Engl J Med. 2010;363(8):711-723.
20. Robert C, Thomas L, Bondarenko I, et al. Ipilimumab plus dacarbazine for previously untreated metastatic melanoma. N Engl J Med. 2011;364(26):2517-2526.
21. Ribas A, Kefford R, Marshall MA, et al. Phase III randomized clinical trial comparing tremelimumab with standard-of-care chemotherapy in patients with advanced melanoma. J Clin Oncol. 2013;31(5):616-622.
22. Wolchok JD, Weber JS, Maio M, et al. Four-year survival rates for patients with metastatic melanoma who received ipilimumab in phase II clinical trials. Ann Oncol. 2013;24(8):2174-2180.
23. Weber JS, Kähler KC, Hauschild A. Management of immune-related adverse events and kinetics of response with ipilimumab. J Clin Oncol. 2012;30(21):2691-2697.
24. Di Giacomo AM, Biagioli M, Maio M. The emerging toxicity profiles of anti-CTLA-4 antibodies across clinical indications. Semin Oncol. 2010;37(5):499-507.
25. Harmankaya K, Erasim C, Koelblinger C, et al. Continuous systemic corticosteroids do not affect the ongoing regression of metastatic melanoma for more than two years following ipilimumab therapy. Med Oncol. 2011;28(4):1140-1144.
26. Wolchok JD, Hoos A, O’Day S, et al. Guidelines for the evaluation of immune therapy activity in solid tumors: Immune-related response criteria. Clin Cancer Res. 2009;15(23):7412-7420.
27. Zou W, Chen L. Inhibitory B7-family molecules in the tumour microenvironment. Nat Rev Immunol. 2008;8(6):467-477.
28. Keir ME, Liang SC, Guleria I, et al. Tissue expression of PD-L1 mediates peripheral T cell tolerance. J Exp Med. 2006;203(4):883-895.
29. Topalian SL, Hodi FS, Brahmer JR, et al. Safety, activity, and immune correlates of anti-PD-1 antibody in cancer. N Engl J Med. 2012;366(26):2443-2454.
30. Sznol M, Kluger HM, Hodi FS, et al. Survival and long-term follow-up of safety and response in patients (pts) with advanced melanoma (MEL) in a phase I trial of nivolumab (anti-PD-1; BMS-936558; ONO-4538) [ASCO abstract CRA9006]. ASCO Meet Abstr. 2013;31(18_suppl):CRA9006. http://meetinglibrary.asco.org/content/80822. Accessed July 23, 2014.
31. Wolchok JD, Kluger H, Callahan MK, et al. Nivolumab plus ipilimumab in advanced melanoma. N Engl J Med. 2013;369(2):122-133.
32. Hamid O, Robert C, Daud A, et al. Safety and tumor responses with lambrolizumab (anti-PD-1) in melanoma. N Engl J Med. 2013;369(2):134-144.
33. Brahmer JR, Tykodi SS, Chow LQ, et al. Safety and activity of anti-PD-L1 antibody in patients with advanced cancer. N Engl J Med. 2012;366(26):2455-2465.
34. McCubrey JA, Steelman LS, Chappell WH, et al. Roles of the Raf/MEK/ERK pathway in cell growth, malignant transformation and drug resistance.
Biochim Biophys Acta. 2007;1773(8):1263-1284.
35. Curtin JA, Busam K, Pinkel D, Bastian BC. Somatic activation of KIT in distinct subtypes of melanoma. J Clin Oncol. 2006;24(26):4340-4346.
36. Davies H, Bignell GR, Cox C, et al. Mutations of the BRAF gene in human cancer. Nature. 2002;417(6892):949-954.
37. Long GV, Menzies AM, Nagrial AM, et al. Prognostic and clinicopathologic associations of oncogenic BRAF in metastatic melanoma. J Clin Oncol. 2011;29(10):1239-1246.
38. Bollag G, Hirth P, Tsai J, et al. Clinical efficacy of a RAF inhibitor needs broad target blockade in BRAF-mutant melanoma. Nature. 2010;467(7315):596-599.
39. Flaherty KT, Puzanov I, Kim KB, et al. Inhibition of mutated, activated BRAF in metastatic melanoma. N Engl J Med. 2010;363(9):809-819.
40. Chapman PB, Hauschild A, Robert C, et al; BRIM-3 Study Group. Improved survival with vemurafenib in melanoma with BRAF V600E mutation. N Engl J Med. 2011;364(26):2507-2516.
41. Chapman PB, Hauschild A, Robert C, et al. Updated overall survival (OS) results for BRIM-3, a phase III randomized, open-label, multicenter trial comparing BRAF inhibitor vemurafenib (vem) with dacarbazine (DTIC) in previously untreated patients with BRAF(V600E)-mutated melanoma [ASCO abstract 8502]. ASCO Meet Abstr. 2012;30(15_suppl):8502. http://meetinglibrary.asco.org/content/70533?media=vm. Accessed July 23, 2014.
42. Lacouture ME, O’Reilly K, Rosen N, Solit DB. Induction of cutaneous squamous cell carcinomas by RAF inhibitors: Cause for concern? J Clin Oncol. 2012;30(3):329-330.
43. Su F, Viros A, Milagre C, et al. RAS mutations in cutaneous squamous-cell carcinomas in patients treated with BRAF inhibitors. New Engl J Med. 2012;366(3):207-215.
44. Callahan MK, Rampal R, Harding JJ, et al. Progression of RAS-mutant leukemia during RAF inhibitor treatment. New Engl J Med. 2012;367(24):2316-2321.
45. Zimmer L, Hillen U, Livingstone E, et al. Atypical melanocytic proliferations and new primary melanomas in patients with advanced melanoma undergoing selective BRAF inhibition. J Clin Oncol. 2012;30(19):2375-2383.
46. Hauschild A, Grob JJ, Demidov LV, et al. Dabrafenib in BRAF-mutated metastatic melanoma: A multicentre, open-label phase 3 randomised clinical trial. Lancet 2012;380(9839):358-365.
47. Long GV, Trefzer U, Davies MA, et al. Dabrafenib in patients with Val600Glu or Val600Lys BRAF-mutant melanoma metastatic to the brain (BREAK-MB): A multicentre, open-label, phase 2 trial. Lancet Oncol. 2012;13(11):1087-1095.
48. Kirkwood JM, Bastholt L, Robert C, et al. Phase II, open-label, randomized trial of the MEK1/2 inhibitor selumetinib as monotherapy versus temozolomide in patients with advanced melanoma. Clin Cancer Res. 2012;18(2):555-567.
49. Flaherty KT, Robert C, Hersey P, et al; METRIC Study Group. Improved survival with MEK inhibition in BRAF-mutated melanoma. New Engl J Med. 2012;367(2):107-114.
50. Poulikakos PI, Persaud Y, Janakiraman M, et al. RAF inhibitor resistance is mediated by dimerization of aberrantly spliced BRAF(V600E). Nature. 2011;480(7377):387-390.
51. Nazarian R, Shi H, Wang Q, et al. Melanomas acquire resistance to B-RAF(V600E) inhibition by RTK or N-RAS upregulation. Nature. 2010;468(7326):973-977.
52. Flaherty KT, Infante JR, Daud A, et al. Combined BRAF and MEK inhibition in melanoma with BRAF V600 mutations. New Engl J Med. 2012;367(18):1694-1703.
53. Ugurel S, Hildenbrand R, Zimpfer A, et al. Lack of clinical efficacy of imatinib in metastatic melanoma. Br J Cancer. 2005;9(8):1398-1405.
54. Wyman K, Atkins MB, Prieto V, et al. Multicenter Phase II trial of high-dose imatinib mesylate in metastatic melanoma: Significant toxicity with no clinical efficacy. Cancer. 2006;106(9):2005-2011.
55. Kim KB, Eton O, Davis DW, et al. Phase II trial of imatinib mesylate in patients with metastatic melanoma. Br J Cancer. 2008;99(5):734-740.
56. Carvajal RD, Antonescu CR, Wolchok JD, et al. KIT as a therapeutic target in metastatic melanoma. JAMA. 2011;305(22):2327-2334.
57. Hodi FS, Corless CL, Giobbie-Hurder A, et al. Imatinib for melanomas harboring mutationally activated or amplified KIT arising on mucosal, acral, and chronically sun-damaged skin. J Clin Oncol. 2013;31(26):3182-3190.
58. Guo J, Si L, Kong Y, et al. Phase II, open-label, single-arm trial of imatinib mesylate in patients with metastatic melanoma harboring c-Kit mutation or amplification. J Clin Oncol. 2011;29(21):2904-2909.
59. Ribas A, Hodi FS, Callahan M, et al. Hepatotoxicity with combination of vemurafenib and ipilimumab. N Engl J Med. 2013;368(14):1365-1366.
This article has been adapted from an article originally published in The Journal of Supportive and Community Oncology (jcso-online.com). Schindler K, Postow M. Current options and future directions in the systemic treatment of metastatic melanoma. J Community Support Oncol. 2014;12(1):20-26.
The incidence of melanoma, a highly aggressive tumor arising from melanocytes, continues to rise by about 3% a year in the U.S. with about 76,000 patients being diagnosed every year and 9,000 patients dying of the disease.1 Complete surgical resection is the standard for localized melanoma, with surgical excision margins depending on tumor thickness. For patients with involved sentinel lymph nodes, complete lymphadenectomy is typically recommended, although the benefits of completion lymphadenectomy are being evaluated in an ongoing randomized trial.2,3
For patients with surgically resected, high-risk melanoma, the only approved adjuvant therapy is interferon-a (IFN-a).4 Use of IFN-a, however, remains controversial because of the associated adverse effects (AEs) and controversial effects on overall survival (OS).5,6 Unfortunately, many patients with localized disease will ultimately experience a recurrence, and the prognosis of patients with metastatic disease is poor with a historical 5-year survival rate of 10%.7
Chemotherapy and interleukin 2
For more than 3 decades, conventional cytotoxic chemotherapy was used to treat metastatic melanoma. Typical agents included alkylating agents (dacarbazine, temozolomide, nitrosoureas), platinum analogs (cisplatin and carboplatin), and microtubular toxins (vinblastine and paclitaxel). Despite the clinical use and investigation of a number of these chemotherapies for patients with metastatic melanoma, the only treatment approved by the FDA is dacarbazine, which is administered intravenously every 3 to 4 weeks at a dose of 800 to 1,000 mg/m2.
Monotherapy with dacarbazine is generally well tolerated with only mild AEs such as nausea, myelosuppression, and fatigue. In a pooled analysis, the overall response rate (RR) for dacarbazine was approximately 9%.8 Temozolomide, the oral analog of dacarbazine, penetrates into the central nervous system and has been compared with dacarbazine in randomized trials. These agents are believed to have similar efficacy, but temozolomide has been associated with a higher rate of lymphopenia.9,10
Investigation of chemotherapy combinations such as cisplatin, vinblastine, and dacarbazine or carboplatin and paclitaxel have shown promising RRs but unfortunately no prolongation of OS compared with single-agent dacarbazine.11-13 Despite its modest efficacy, chemotherapy still has a place in the palliative treatment for some patients.
In addition to dacarbazine, the immunotherapeutic strategy, high-dose recombinant interleukin-2 (IL-2), had also been a mainstay treatment for advanced melanoma for many years. IL-2 is administered as an IV infusion every 8 hours at a dose of 600,000 to 720,000 IU/kg on days 1 to 5 and days 15 to 19, with a maximum of 14 such biphasic cycles. Because of the significant acute toxicity profile, including capillary leak syndrome, cardiovascular complications, and seizures, IL-2 treatment requires hospitalization and is generally only performed at specialized centers for patients with good performance status. Though the overall RR in pooled analysis was low at 16%, the durability of responses in some responders that appeared to last many years led to the FDA approval of IL-2 in 1998.14,15
IL-2 continues to be investigated. In a randomized trial, an improved RR and progression-free survival (PFS) were seen when IL-2 was combined with the glycoprotein 100 (gp100) peptide vaccine compared with IL-2 alone.16 Other approaches have sought to improve the safety of IL-2 by selectively delivering it to tumor sites. The fusion protein L19-IL2 couples IL-2 with the recombinant human vascular targeting antibody L19 and has preliminarily been shown to be safe in phase 1 evaluation and in combination with dacarbazine.17,18
Antibodies that block immunologic checkpoints
Melanoma has long been recognized as an immunogenic malignancy but the efficacy of immunotherapeutic strategies has generally been modest. The precise etiology of why immunotherapy historically was not more successful is not completely understood, but it is possible that patients with advanced malignancy have predominant immune inhibitory circuits that prevent otherwise effective antitumor immune responses.
In recent years, research has illuminated some of these immunologic inhibitory elements, termed “immunologic checkpoints,” which include cytotoxic T-lymphocyte antigen 4 (CTLA-4) and programmed death-1 (PD-1). Antibodies that target these checkpoints have resulted in durable responses in some patients and a unique pattern of immune-mediated AEs. Though an ongoing area of research, no pre- or on-treatment biomarkers have been sufficiently validated to enable specific patient selection for these therapies.
Antibodies Blocking CTLA-4
CTLA-4 is expressed on activated T cells and typically functions as a negative regulator of T-cell activity preserving normal immunologic homeostasis. Blocking CTLA-4 with therapeutic antibodies such as ipilimumab and tremelimumab prevents normal CTLA-4–mediated T-cell downregulation and thereby enhances the ability of T cells to exert their full antitumor immune effects (Figure 1). Ipilimumab was the first drug in the management of metastatic melanoma to show an improvement in OS in phase 3 studies, and although a phase 3 study of tremelimumab did not demonstrate an improvement in OS, durable responses were similarly seen.19-21
The first phase 3 trial investigating ipilimumab randomized previously pretreated patients with advanced melanoma to ipilimumab at a dose of 3 mg/kg with or without the gp100 peptide vaccine. The median OS was 10.0 months among patients receiving ipilimumab plus gp100, compared with 6.4 months among patients receiving gp100 alone. There was no difference in OS between the ipilimumab groups.19 The outcome of this study has led to the approval of ipilimumab at a dose of 3 mg/kg in patients with advanced melanoma by regulatory agencies in the U.S., European Union, and Australia.
For treatment-naive patients, a second phase 3 trial investigating dacarbazine in combination with ipilimumab compared with dacarbazine in combination with placebo also demonstrated improvement of OS in patients treated with dacarbazine in combination with ipilimumab.20 The estimated 1-year, 2-year, and 3-year survival rates were 47.3%, 28.5%, and 20.8%, respectively, in the dacarbazine plus ipilimumab group, compared with 36.3%, 17.9%, and 12.2% in the dacarbazine alone group. This second trial used a higher dose of ipilimumab (10 mg/kg) and though it confirmed ipilimumab’s beneficial effects on OS, ipilimumab is not approved at 10 mg/kg and is not routinely recommended to be used in combination with dacarbazine given hepatic toxicity concerns.
Though the median OS was improved in these phase 3 trials, perhaps the greatest activity of ipilimumab lies in the increased number of patients who can achieve long-term OS. In a recently published updated survival analysis, the 4-year survival rates for previously treated patients who received ipilimumab at 3 or 10 mg/kg were 18.2% and 19.7% to 28.4%. For treatment-naive patients receiving ipilimumab at 10 mg/kg, 4-year survival rates were between 37.7% and 49.5%.22 These values appear superior to historical data from prior chemotherapy trials.
An important consideration in the clinical use of CTLA-4 blocking antibodies is the possible occurrence of toxicities that differ from those associated with traditional chemotherapy. These AEs are termed immune-related AEs (irAEs), and they most commonly manifest as diarrhea, dermatitis, hepatitis, and endocrinopathies but less commonly can involve other organs, resulting in uveitis, nephritis, myopathy, and neuropathy.
In general, the onset of irAEs follows a certain pattern with cutaneous manifestations often presenting early in treatment, followed by gastrointestinal and hepatic events occurring about 2 months into therapy and endocrinopathies appearing even later.23 In rare cases, severe AEs (eg, perforating colitis, toxic epidermal necrolysis) can occur and may require hospitalization.24
Clinicians must be attentive to early signs of these AEs and promptly initiate immunosuppression with steroids or other immunosuppressive medications, which do not appear to diminish the antitumor immune effects.25 Established management algorithms exist to guide clinicians. Given the occasional need for immunosuppression in this patient population, awareness of the possibility of opportunistic or rare infections is also important.
In phase 3 evaluation, the number of patients who had long-term survival exceeded the number of patients who had a classically defined disease response to treatment. Durable stable disease and late responses have been observed clinically and may be responsible for some of the beneficial outcomes.26 If patients are asymptomatic and have minimal radiographic progression, it is reasonable to repeat imaging 1 to 2 months later to confirm progression before considering additional lines of therapy.
Antibodies Blocking the Programmed Death-1 Axis
Programmed death-1 (PD-1) is a receptor on the surface of T cells that is upregulated at later stages of T-cell activation as opposed to the early upregulation of CTLA-4. Normally, engagement of PD-1 attenuates T-cell activity at several phases of an immune response. Tumors are believed to escape immune attack by similarly inhibiting T-cell activity by upregulating one of the ligands of PD-1, PD-L1.27,28 Several antibodies that inhibit PD-1 activity, either by blocking the PD-1 molecule itself or PD-L1, are demonstrating significant promise in ongoing clinical trials.
Nivolumab (previously, BMS-936558) is a fully human monoclonal antibody targeting PD-1. In a large phase 1 study in patients with a variety of malignancies, nivolumab demonstrated a 31% RR in patients with advanced melanoma.29 Subsequent follow-up data indicates these responses are generally durable with a median duration of response of 24 months and a 3-year OS rate of 40%.30 Adverse effects of nivolumab appear less frequently than with CTLA-4 blockade but have included vitiligo, colitis, hepatitis, hypophysitis, and thyroiditis. Unique to PD-1 blockade appears to be the AE of an inflammatory pneumonitis, which can present with a dry cough, dyspnea, and ground-glass opacities and can be potentially lethal.29
On the basis of complementary regulatory roles of CTLA-4 and PD-1 checkpoint inhibition, a trial investigating combined nivolumab and ipilimumab was completed. In the small group of patients treated, a high RR was seen with a generally acceptable safety profile.31 Ongoing phase 2 and 3 trials are assessing nivolumab alone and in combination with other agents for the treatment of advanced melanoma and other malignancies (Table 1).
Another PD-1 blocking antibody, MK-3475, has been evaluated in patients with advanced melanoma, and promising RRs have been described.32 In a small group of patients, the confirmed RR at a dose of 10 mg/kg every 2 weeks was 52% and appeared similar in patients who had and who had not been previously treated with ipilimumab. The AEs of MK-3475 seem to resemble nivolumab. MK-3475 is similarly being evaluated in large phase 2 and 3 trials for both patients with melanoma and additional malignancies.
In addition to antibodies targeting PD-1, clinical activity has also been observed with several different antibodies (BMS-936559, MPDL3280A, and MEDI4736) that target PD-L1. Though some data have been published for this therapeutic strategy,33 ongoing trials will continue to clarify the role of targeting PD-L1 in patients with advanced melanoma.
Targeted Therapies That Block Oncogenic Signaling Pathways
The mitogen-activated protein kinase (MAPK) pathway responds to extracellular growth signals and regulates cell proliferation and survival. In many patients with melanoma, the MAPK pathway is constitutively activated as a result of molecular alterations in genes encoding key regulators or components of the pathway such as BRAF, NRAS, and KIT.34,35 The most common mutation arising in melanoma is the BRAF mutation, occurring in nearly half of melanomas, and typically involves a missense mutation in which glutamic acid is substituted for valine at codon 600 (BRAF V600E mutation).36 Less frequent BRAF mutations include V600K, V600R, and K601E.37 Strategies that directly inhibit oncogenic BRAF or disable downstream elements such as MEK have recently shown dramatic results in patients with melanoma (Figure 2).
BRAF inhibitors
Vemurafenib is a potent inhibitor of mutated BRAF with marked antitumor effects against melanoma cell lines with the BRAF V600E mutation.38 The first striking results of tumor regression with this strategy in patients were seen in a phase 1 study in patients with melanoma characterized by a BRAF V600E mutation but not in patients whose melanomas did not have a BRAF mutation.39
Subsequent phase 3 trials confirmed the high RRs of this agent in patients with BRAF-mutant melanoma and demonstrated superiority in OS compared with dacarbazine chemotherapy.40 The results of this phase 3 trial led to the approval of vemurafenib by the FDA in August 2011 with treatment exclusively limited to patients with BRAF mutant melanoma. Updated OS data from this phase 3 study revealed a median OS of 13.2 months for vemurafenib, compared with 9.6 months for dacarbazine, with an overall RR in patients treated with vemurafenib of 57% and a median PFS of 6.9 months.41 General AEs with vemurafenib include arthralgia, fatigue, aminotransferase elevations, nausea and vomiting, and decreased kidney function. In general, toxicities are manageable with dose reduction or temporary drug cessation.
One characteristic of vemurafenib and other BRAF-targeted agents is the frequent development of hyperproliferative skin AEs. Skin lesions, including follicular and palmo-plantar hyperkeratosis, papillomas, and also cutaneous squamous-cell carcinomas and keratoacanthomas, have commonly been observed under treatment with vemurafenib, and close evaluation by a dermatologist is important.42 The mechanism of this phenomenon is believed to be a paradoxical activation of the MAPK pathway in nonmelanoma BRAF wild-type cells when systemic treatment with a BRAF inhibitor is administered.43
The phenomenon of hyperproliferation of non–BRAF-mutant tissues with ongoing BRAF-inhibitor therapy has also been seen in patients with lymphoproliferative disorders and may be a mechanism involved in the discovery that patients have a high rate of new primary melanomas while on therapy.44,45 These findings warrant special attention, particularly as BRAF inhibitors are undergoing evaluation as adjuvant therapy.
Another active BRAF kinase inhibitor with a similar efficacy profile as vemurafenib is dabrafenib, which was approved in May 2013 based on the demonstration of improved PFS in a phase 3 trial comparing dabrafenib 150 mg orally twice daily and dacarbazine 1,000 mg/m2 intravenously once every 3 weeks in previously untreated patients with BRAF V600E mutant melanoma. The median PFS times were 5.1 and 2.7 months in the dabrafenib and dacarbazine arms, respectively, with an objective RR of 52% in patients treated with dabrafenib.46 Follow-up time was too short to make a determination of the impact of dabrafenib on OS. In a separate study, dabrafenib was also shown to be effective for patients with brain metastases and remains an excellent therapeutic choice for this particular patient population.47
Generally, dabrafenib is believed to have similar efficacy to vemurafenib. Nevertheless, EAs with of dabrafenib differ somewhat from those observed with vemurafenib: The rate of proliferative skin lesions, including squamous cell carcinomas and keratoacanthomas appears to be lower for dabrafenib than vemurafenib. However, AEs particular to dabrafenib have been seen such as pyrexia, which were recorded in about 11% of patients.46
MEK inhibitors
Though targeting oncogenic BRAF directly has been incredibly successful for patients with BRAF-mutant metastatic melanoma, additional success has been observed by blocking the MAPK pathway at a downstream component, MEK. Trametinib is an MEK inhibitor that was approved by the FDA in June 2013 as a single agent for patients with BRAF V600E or V600K mutant melanoma. Trametinib is administered at a dose of 2 mg once daily and was shown to improve PFS and OS compared with dacarbazine and paclitaxel chemotherapies.47 Despite the improvement in PFS and OS compared with chemotherapy, the objective RR for trametinib was somewhat lower (22%) than that seen with BRAF inhibitors.
Trametinib also is associated with a different AE profile from BRAF inhibitors and includes diarrhea, peripheral edema, hypertension, and fatigue, typical of other MEK inhibitors as well.48 Asymptomatic and reversible reduction of the cardiac ejection fraction and ocular toxic effects also occur infrequently. Unlike with BRAF-inhibitor treatment, the development of cutaneous squamous-cell carcinomas or other hyperproliferative skin lesions was not noted.49
Despite the significant benefits of targeted therapy disrupting overly active MAPK signaling in patients with BRAF-mutant metastatic melanoma, almost all patients treated with these targeted inhibitors who achieve an initial response will ultimately progress. Several mechanisms of resistance have been proposed, and most relate to reactivation of the MAPK pathway.50,51 As a result, efforts to maintain suppression of the MAPK pathway have been pursued to delay the onset of resistance. In a phase 2 trial that combined dabrafenib with trametinib, there was a longer PFS than there was with dabrafenib monotherapy.52
Furthermore, the addition of trametinib to dabrafenib reduced the incidence of squamous-cell carcinoma, providing further evidence that reactivation of the MAPK pathway is involved in these hyperproliferative skin lesions arising under BRAF-directed therapy. A higher rate of febrile episodes was seen, however. An ongoing phase 3 study is looking at whether or not combining BRAF and MEK inhibitors results in improved OS compared with single-agent BRAF. It is premature at this juncture to recommend combining dabrafenib and trametinib until the results of the ongoing phase 3 studies more thoroughly describe the risks and benefits of this approach (Table 2).
KIT inhibitors
In a subset of melanomas, particularly those that arise from mucosal, acral, or chronically sun-damaged skin, mutations are found in the receptor-tyrosine kinase KIT.35 A number of agents directed against KIT, such as imatinib, have been tested in clinical trials. Initial phase 2 studies revealed poor RRs with KIT inhibition in molecularly unselected patients.53-55 Subsequent studies selected patients with KIT genetic aberrations, including mutations and amplifications, and some responses were seen.56-58
Importantly, not all KIT genetic aberrations are believed to be considered equal. Preliminarily, it appears that mutations in exon 11 (L576P) and exon 13 (K642E) appear to be most closely associated with response and may be true driver mutations. Other KIT mutations may have less functional significance but additional research is needed. Imatinib is a reasonable therapeutic choice in patients with a KIT mutation, particularly when an L576P or K642E mutation is present.
conclusions
Since 2011, 4 new drugs—ipilimumab, vemurafenib, dabrafenib, and trametinib—have been approved for the treatment of metastatic melanoma. Exciting early data from PD-1 clinical trials suggest that agents that disrupt PD-1 may also become important therapeutic modalities. Future studies will continue to evaluate combinations of these therapeutic modalities, but caution should be exercised in combining these drugs prior to data from ongoing clinical trials revealing the true benefits and risks of combination therapy. Excessive toxicity was seen in an early phase trial when vemurafenib was combined with ipilimumab.59
Additional research will also explore biomarkers that may help clinicians apply immunotherapy to the most appropriate patients and better understand mechanisms of resistance to targeted therapies. Clinical trials of novel agents or combinations should be considered at every treatment juncture to continue the rapid pace of developing the most innovative and tailored treatment approaches.
Author disclosures
The authors report no actual or potential conflicts of interest with regard to this article.
Disclaimer
The opinions expressed herein are those of the authors and do not necessarily reflect those of Federal Practitioner, Frontline Medical Communications Inc., the U.S. Government, or any of its agencies. This article may discuss unlabeled or investigational use of certain drugs. Please review complete prescribing information for specific drugs or drug combinations—including indications, contraindications, warnings, and adverse effects—before administering pharmacologic therapy to patients.
1. Siegel R, Naishadham D, Jemal A. Cancer statistics, 2012. CA Cancer J Clin. 2012;62(1):10-29.
2. Garbe C, Peris K, Hauschild A, et al; European Dermatology Forum, European Association of Dermato-Oncology, European Organization of Research and Treatment of Cancer. Diagnosis and treatment of melanoma. European consensus-based interdisciplinary guideline—Update 2012. Eur J Cancer. 2012;48(15):2375-2390.
3. Coit DG, Andtbacka R, Bichakjian CK, et al; NCCN Melanoma Panel. Melanoma. J Natl Compr Canc Netw. 2009;7(3):250-275.
4. Molife R, Hancock BW. Adjuvant therapy of malignant melanoma. Crit Rev Oncol Hematol. 2002;44(1):81-102.
5. Wheatley K, Ives N, Hancock B, Gore M, Eggermont A, Suciu S. Does adjuvant interferon-alpha for high-risk melanoma provide a worthwhile benefit? A meta-analysis of the randomised trials. Cancer Treat Rev. 2003;29(4):241-252.
6. Mocellin S, Pasquali S, Rossi CR, Nitti D. Interferon alpha adjuvant therapy in patients with high-risk melanoma: A systematic review and meta-analysis. J Natl Cancer Inst. 2010;102(7):493-501.
7. Balch CM, Gershenwald JE, Soong SJ, et al. Final version of 2009 AJCC melanoma staging and classification. J Clin Oncol. 2009;27(36):6199-6206.
8. Luke JJ, Rubinstein LV, Smith GL, Ivy SP, Harris PJ. Similar efficacy for phase I trials in comparison with DTIC for advanced malignant melanoma: an analysis of melanoma outcomes in CTEP-sponsored phase I trials 1995-2011. Melanoma Res. 2013;23(2):152-158.
9. Middleton MR, Grob JJ, Aaronson N, et al. Randomized phase III study of temozolomide versus dacarbazine in the treatment of patients with advanced metastatic malignant melanoma. J Clin Oncol. 2000;18(1):158-166.
10. Teimouri F, Nikfar S, Abdollahi M. Efficacy and side effects of dacarbazine in comparison with temozolomide in the treatment of malignant melanoma: A meta-analysis consisting of 1314 patients. Melanoma Res. 2013;23(5):381-389.
11. Chapman PB, Einhorn LH, Meyers ML, et al. Phase III multicenter randomized trial of the Dartmouth regimen versus dacarbazine in patients with metastatic melanoma. J Clin Oncol. 1999;17(9):2745-2751.
12. Legha SS, Ring S, Papadopoulos N, Plager C, Chawla S, Benjamin R. A prospective evaluation of a triple-drug regimen containing cisplatin, vinblastine, and dacarbazine (CVD) for metastatic melanoma. Cancer. 1989;64(10):2024-2029.
13. Rao RD, Holtan SG, Ingle JN, et al. Combination of paclitaxel and carboplatin as second-line therapy for patients with metastatic melanoma. Cancer. 2006;106(2):375-382.
14. Atkins MB, Kunkel L, Sznol M, Rosenberg SA. High-dose recombinant interleukin-2 therapy in patients with metastatic melanoma: Long-term survival update. Cancer J Sci Am. 2000;6(suppl 1):S11-S14.
15. Atkins MB, Lotze MT, Dutcher JP, et al. High-dose recombinant interleukin 2 therapy for patients with metastatic melanoma: Analysis of 270 patients treated between 1985 and 1993. J Clin Oncol. 1999;17(7):2105-2116.
16. Schwartzentruber DJ, Lawson DH, Richards JM, et al. gp100 peptide vaccine and interleukin-2 in patients with advanced melanoma. N Engl J Med. 2011;364(22):2119-2127.
17. Johannsen M, Spitaleri G, Curigliano G, et al. The tumour-targeting human L19-IL2 immunocytokine: Preclinical safety studies, phase I clinical trial in patients with solid tumours and expansion into patients with advanced renal cell carcinoma. Eur J Cancer. 2010;46(16):2926-2935.
18. Eigentler TK, Weide B, de Braud F, et al. A dose-escalation and signal-generating study of the immunocytokine L19-IL2 in combination with dacarbazine for the therapy of patients with metastatic melanoma. Clin Cancer Res. 2011;17(24):7732-7742.
19. Hodi FS, O'Day SJ, McDermott DF, et al. Improved survival with ipilimumab in patients with metastatic melanoma. N Engl J Med. 2010;363(8):711-723.
20. Robert C, Thomas L, Bondarenko I, et al. Ipilimumab plus dacarbazine for previously untreated metastatic melanoma. N Engl J Med. 2011;364(26):2517-2526.
21. Ribas A, Kefford R, Marshall MA, et al. Phase III randomized clinical trial comparing tremelimumab with standard-of-care chemotherapy in patients with advanced melanoma. J Clin Oncol. 2013;31(5):616-622.
22. Wolchok JD, Weber JS, Maio M, et al. Four-year survival rates for patients with metastatic melanoma who received ipilimumab in phase II clinical trials. Ann Oncol. 2013;24(8):2174-2180.
23. Weber JS, Kähler KC, Hauschild A. Management of immune-related adverse events and kinetics of response with ipilimumab. J Clin Oncol. 2012;30(21):2691-2697.
24. Di Giacomo AM, Biagioli M, Maio M. The emerging toxicity profiles of anti-CTLA-4 antibodies across clinical indications. Semin Oncol. 2010;37(5):499-507.
25. Harmankaya K, Erasim C, Koelblinger C, et al. Continuous systemic corticosteroids do not affect the ongoing regression of metastatic melanoma for more than two years following ipilimumab therapy. Med Oncol. 2011;28(4):1140-1144.
26. Wolchok JD, Hoos A, O’Day S, et al. Guidelines for the evaluation of immune therapy activity in solid tumors: Immune-related response criteria. Clin Cancer Res. 2009;15(23):7412-7420.
27. Zou W, Chen L. Inhibitory B7-family molecules in the tumour microenvironment. Nat Rev Immunol. 2008;8(6):467-477.
28. Keir ME, Liang SC, Guleria I, et al. Tissue expression of PD-L1 mediates peripheral T cell tolerance. J Exp Med. 2006;203(4):883-895.
29. Topalian SL, Hodi FS, Brahmer JR, et al. Safety, activity, and immune correlates of anti-PD-1 antibody in cancer. N Engl J Med. 2012;366(26):2443-2454.
30. Sznol M, Kluger HM, Hodi FS, et al. Survival and long-term follow-up of safety and response in patients (pts) with advanced melanoma (MEL) in a phase I trial of nivolumab (anti-PD-1; BMS-936558; ONO-4538) [ASCO abstract CRA9006]. ASCO Meet Abstr. 2013;31(18_suppl):CRA9006. http://meetinglibrary.asco.org/content/80822. Accessed July 23, 2014.
31. Wolchok JD, Kluger H, Callahan MK, et al. Nivolumab plus ipilimumab in advanced melanoma. N Engl J Med. 2013;369(2):122-133.
32. Hamid O, Robert C, Daud A, et al. Safety and tumor responses with lambrolizumab (anti-PD-1) in melanoma. N Engl J Med. 2013;369(2):134-144.
33. Brahmer JR, Tykodi SS, Chow LQ, et al. Safety and activity of anti-PD-L1 antibody in patients with advanced cancer. N Engl J Med. 2012;366(26):2455-2465.
34. McCubrey JA, Steelman LS, Chappell WH, et al. Roles of the Raf/MEK/ERK pathway in cell growth, malignant transformation and drug resistance.
Biochim Biophys Acta. 2007;1773(8):1263-1284.
35. Curtin JA, Busam K, Pinkel D, Bastian BC. Somatic activation of KIT in distinct subtypes of melanoma. J Clin Oncol. 2006;24(26):4340-4346.
36. Davies H, Bignell GR, Cox C, et al. Mutations of the BRAF gene in human cancer. Nature. 2002;417(6892):949-954.
37. Long GV, Menzies AM, Nagrial AM, et al. Prognostic and clinicopathologic associations of oncogenic BRAF in metastatic melanoma. J Clin Oncol. 2011;29(10):1239-1246.
38. Bollag G, Hirth P, Tsai J, et al. Clinical efficacy of a RAF inhibitor needs broad target blockade in BRAF-mutant melanoma. Nature. 2010;467(7315):596-599.
39. Flaherty KT, Puzanov I, Kim KB, et al. Inhibition of mutated, activated BRAF in metastatic melanoma. N Engl J Med. 2010;363(9):809-819.
40. Chapman PB, Hauschild A, Robert C, et al; BRIM-3 Study Group. Improved survival with vemurafenib in melanoma with BRAF V600E mutation. N Engl J Med. 2011;364(26):2507-2516.
41. Chapman PB, Hauschild A, Robert C, et al. Updated overall survival (OS) results for BRIM-3, a phase III randomized, open-label, multicenter trial comparing BRAF inhibitor vemurafenib (vem) with dacarbazine (DTIC) in previously untreated patients with BRAF(V600E)-mutated melanoma [ASCO abstract 8502]. ASCO Meet Abstr. 2012;30(15_suppl):8502. http://meetinglibrary.asco.org/content/70533?media=vm. Accessed July 23, 2014.
42. Lacouture ME, O’Reilly K, Rosen N, Solit DB. Induction of cutaneous squamous cell carcinomas by RAF inhibitors: Cause for concern? J Clin Oncol. 2012;30(3):329-330.
43. Su F, Viros A, Milagre C, et al. RAS mutations in cutaneous squamous-cell carcinomas in patients treated with BRAF inhibitors. New Engl J Med. 2012;366(3):207-215.
44. Callahan MK, Rampal R, Harding JJ, et al. Progression of RAS-mutant leukemia during RAF inhibitor treatment. New Engl J Med. 2012;367(24):2316-2321.
45. Zimmer L, Hillen U, Livingstone E, et al. Atypical melanocytic proliferations and new primary melanomas in patients with advanced melanoma undergoing selective BRAF inhibition. J Clin Oncol. 2012;30(19):2375-2383.
46. Hauschild A, Grob JJ, Demidov LV, et al. Dabrafenib in BRAF-mutated metastatic melanoma: A multicentre, open-label phase 3 randomised clinical trial. Lancet 2012;380(9839):358-365.
47. Long GV, Trefzer U, Davies MA, et al. Dabrafenib in patients with Val600Glu or Val600Lys BRAF-mutant melanoma metastatic to the brain (BREAK-MB): A multicentre, open-label, phase 2 trial. Lancet Oncol. 2012;13(11):1087-1095.
48. Kirkwood JM, Bastholt L, Robert C, et al. Phase II, open-label, randomized trial of the MEK1/2 inhibitor selumetinib as monotherapy versus temozolomide in patients with advanced melanoma. Clin Cancer Res. 2012;18(2):555-567.
49. Flaherty KT, Robert C, Hersey P, et al; METRIC Study Group. Improved survival with MEK inhibition in BRAF-mutated melanoma. New Engl J Med. 2012;367(2):107-114.
50. Poulikakos PI, Persaud Y, Janakiraman M, et al. RAF inhibitor resistance is mediated by dimerization of aberrantly spliced BRAF(V600E). Nature. 2011;480(7377):387-390.
51. Nazarian R, Shi H, Wang Q, et al. Melanomas acquire resistance to B-RAF(V600E) inhibition by RTK or N-RAS upregulation. Nature. 2010;468(7326):973-977.
52. Flaherty KT, Infante JR, Daud A, et al. Combined BRAF and MEK inhibition in melanoma with BRAF V600 mutations. New Engl J Med. 2012;367(18):1694-1703.
53. Ugurel S, Hildenbrand R, Zimpfer A, et al. Lack of clinical efficacy of imatinib in metastatic melanoma. Br J Cancer. 2005;9(8):1398-1405.
54. Wyman K, Atkins MB, Prieto V, et al. Multicenter Phase II trial of high-dose imatinib mesylate in metastatic melanoma: Significant toxicity with no clinical efficacy. Cancer. 2006;106(9):2005-2011.
55. Kim KB, Eton O, Davis DW, et al. Phase II trial of imatinib mesylate in patients with metastatic melanoma. Br J Cancer. 2008;99(5):734-740.
56. Carvajal RD, Antonescu CR, Wolchok JD, et al. KIT as a therapeutic target in metastatic melanoma. JAMA. 2011;305(22):2327-2334.
57. Hodi FS, Corless CL, Giobbie-Hurder A, et al. Imatinib for melanomas harboring mutationally activated or amplified KIT arising on mucosal, acral, and chronically sun-damaged skin. J Clin Oncol. 2013;31(26):3182-3190.
58. Guo J, Si L, Kong Y, et al. Phase II, open-label, single-arm trial of imatinib mesylate in patients with metastatic melanoma harboring c-Kit mutation or amplification. J Clin Oncol. 2011;29(21):2904-2909.
59. Ribas A, Hodi FS, Callahan M, et al. Hepatotoxicity with combination of vemurafenib and ipilimumab. N Engl J Med. 2013;368(14):1365-1366.
FDA approves bortezomib retreatment in MM
The US Food and Drug Administration (FDA) has approved bortezomib (Velcade) for the retreatment of adults with multiple myeloma (MM) who previously responded to bortezomib and relapsed at least 6 months after that treatment.
Bortezomib’s label has been updated to include dosing guidelines and safety and efficacy findings for single-agent bortezomib and bortezomib in combination with dexamethasone in patients previously treated with bortezomib.
Bortezomib retreatment may be started at the last dose the patient tolerated.
The FDA approved bortezomib retreatment based on results of the phase 2 RETRIEVE study and other supportive data.
The single-arm RETRIEVE trial included 130 MM patients aged 18 years and older who had previously responded to bortezomib-based therapy and relapsed at least 6 months after the treatment. The patients had received a median of 2 prior therapies (range, 1 to 7).
In this study, 94 of the patients received bortezomib in combination with dexamethasone.
One patient achieved complete response to treatment, and 49 achieved partial responses, for an overall response rate of 38.5%. The median duration of response was 6.5 months (range, 0.6 to 19.3 months).
The safety profile with bortezomib retreatment was consistent with the known safety profile of intravenous bortezomib in relapsed MM. Researchers did not observer cumulative toxicities upon retreatment.
The most common adverse event was thrombocytopenia, which occurred in 52% of patients. The incidence of grade 3 or higher thrombocytopenia was 24%.
Peripheral neuropathy was also common, occurring in 28% of patients. Grade 3 or higher peripheral neuropathy occurred in 6% of patients.
The rate of serious adverse events was 12.3%. The most commonly reported serious adverse events were thrombocytopenia (3.8%), diarrhea (2.3%), herpes zoster (1.5%), and pneumonia (1.5%). Adverse events leading to discontinuation occurred in 13% of patients.
Bortezomib is co-developed by Millennium/Takeda and Janssen Pharmaceutical Companies. Millennium is responsible for commercialization of bortezomib in the US. Janssen Pharmaceutical Companies are responsible for commercialization in Europe and the rest of the world.
Takeda Pharmaceutical Company Limited and Janssen Pharmaceutical K.K. co-promote bortezomib in Japan. Bortezomib is approved in more than 90 countries.
Secure Texting Improves Hospital Communication
Pagers, though reliable and familiar technology, can be suboptimal for facilitating healthcare team communication.[1, 2] Most paging systems utilize single‐function pagers and only allow one‐way communication, requiring recipients to disrupt workflow to respond to pages. Paging transmissions can also be intercepted, and the information presented on pager displays can be viewed by anyone in possession of the pager.
Smartphones allow for instantaneous two‐way and group communication through advanced technological features. Their use is widespread; over 81% of American physicians owned a smartphone in 2011.[3] Previous studies demonstrate that healthcare providers rate smartphone‐based email positively, and that team smartphones can facilitate communication between nurses and physicians.[4, 5] However, these studies specifically examined the utility of smartphone‐based email and voice calls, and did not include text messaging. Limitations of traditional smartphone‐based text messaging include Health Insurance Portability and Accountability Act (HIPAA) noncompliance and dependence on in‐hospital cellular reception, which can be unreliable. HIPAA is a 1996 US federal law that established a set of privacy and security rules governing not only what is considered protected health information (PHI), but also minimum standards for the protection of such information. HIPAA compliance is defined as meeting these minimum standards for physical, network, and process security.[6, 7] Though PHI is often transmitted via paging systems and commercial carrier‐based text messaging, these modalities are not secure and are thus not HIPAA‐compliant.
Text messaging applications that address these security and reliability issues have the potential to greatly enhance in‐hospital communication. We hypothesized that a smartphone‐based HIPAA‐compliant group messaging application could improve in‐hospital communication on the inpatient medicine service. To our knowledge, our study is the first to examine a HIPAA‐compliant text messaging system, and also the first to compare a combination paging/HIPAA‐compliant group messaging (HCGM) system with a paging‐only system in assessing healthcare provider perception of communication efficiency.
METHODS
Intervention
This study utilized Medigram (Medigram, Inc.,
Study Design
In an eight‐week prospective, cluster‐randomized, controlled trial conducted at Stanford Hospital (June 25, 2012August 17, 2012), three of five inpatient medicine teams were randomized to use Medigram in addition to the existing hospital paging system (HCGM teams); the remaining two teams were assigned to use hospital paging only (control teams). Each team included one attending physician, one resident, two interns, two medical students, and a case manager. According to prescheduled rotations, attendings rotated every two weeks, and residents, interns, and medical students rotated every four weeks. All rotations were either off‐service or off‐site, with the exception of two attendings who rotated between study teams but within their experimental designations. Case managers remained with the same team. Additionally, the satellite pharmacy was provided with an HCGM‐equipped smartphone to communicate with experimental teams.
Participation was voluntary, with a 96% participation rate (n=75). HCGM teams downloaded the free application onto their smartphones. Participants without smartphones were provided with one for the duration of the study. Proper application use was demonstrated by one researcher in a 10‐minute standardized presentation. HCGM teams were encouraged to use the application in lieu of paging, except when patient care could be compromised.
All participants completed linked baseline and post‐study surveys. Gift cards valued at $10 were provided on completion of each survey. Though participants were assigned to either HCGM or control groups based on the randomized assignment of their preset cluster (hospital team) to an HCGM or control group, analysis was performed on the individual level due to the hospital's set rotation schedule, which resulted in dynamic, frequently changing clusters. We also compared average length of stay and time of discharge for patients treated by control versus HCGM teams. Clinical outcome data were obtained from the hospital's database using Midas+ Statit Solutions (Midas+ Statit Solutions Group, Tucson, AZ). Survey and clinical outcome data were analyzed in Stata (StataCorp, College Station, TX) and R (R Foundation for Statistical Computing, Vienna, Austria).
Survey Design and Analysis
Identical, anonymous baseline surveys were administered to control and HCGM teams. These surveys assessed attitudes toward the hospital paging system using a 5‐point Likert scale (1=low, 5=high) to evaluate perceived measures of effectiveness, workflow integration, and overall satisfaction. Wilcoxon rank sum tests were used to compare control and HCGM group responses to these questions. Free response questions asked participants to list the most effective and ineffective aspects of the paging system.
Post‐study surveys included all baseline survey questions, as well as questions about personal texting behavior. Post‐study HCGM surveys also included a parallel set of questions rating the HCGM application on the same measures of perceived effectiveness, workflow integration, and overall satisfaction. Wilcoxon signed rank tests were used to compare HCGM participants' baseline evaluations of paging to their post‐study evaluations of the HCGM application. Baseline and post‐study surveys were linked by the last four digits of respondent cell phone numbers. To compare control and HCGM group perceptions of the hospital paging system at study completion, post‐study survey responses were evaluated using Wilcoxon rank sum tests. The family‐wise error rate was left unadjusted due to concerns around inflated type II errors, given the high degree of correlation between survey questions.
All free response questions were analyzed using thematic analysis and grounded theory. After reviewing responses to each question, a list of overarching themes was constructed. Two researchers then independently reviewed each free‐response entry to assign it to one or more of these themes (some responses included several ideas with distinct themes). Entries with concordant theme assignments (90%) were coded as such; nonconcordant entries required an additional round of review to reach concordance. Finally, objective outcome measures including length of stay and time of discharge were analyzed by two‐sample t test.
| Control Group | HCGM Group | |
|---|---|---|
| ||
| Paired surveys collected (completion rate) | 22 (85%) | 41 (84%) |
| Average age 95% CI | 30.10 1.71 | 30.95 2.94 |
| Gender | ||
| Male | 13 (59%) | 24 (59%) |
| Female | 9 (41%) | 17 (41%) |
| Role | ||
| Medical students | 6 (27%) | 11 (27%) |
| Interns (PGY 1) | 7 (32%) | 12 (29%) |
| Residents (PGY2 and 3) | 3 (14%) | 6 (15%) |
| Attending physicians | 5 (23%) | 5 (12%) |
| Case managers | 1 (5%) | 3 (7%) |
| Pharmacists | 0 (0%) | 4 (10%) |
Information Security
The HCGM application in this study features 256‐bit encryption technology and requires a six‐digit password to access texts. For added security, a study‐dedicated server (HP ProLiant DL 180 G6; Hewlett‐Packard Co., Palo Alto, CA) with 4‐TB hard drive capacity (4 Seagate Barracuda ST1000DM003 1 TB 7200 RPM internal hard drives; Seagate Technology PLC, Cupertino, CA) was installed in the Stanford School of Medicine Data Center to store encrypted text messages. Data stored on the phones/server were accessible only to study participants, not researchers. These security measures were approved by Stanford Hospital and Stanford School of Medicine's security and privacy review process.
Hospital Paging System
Stanford Hospital and Clinics is a quaternary care academic medical center with 613 beds, 49 operating rooms, and over 25,000 inpatient admissions per year.[8] The institution uses one‐way alphanumeric pagers (primary model: Daviscomm BR802 Flex Pager from USA Mobility, secondary model: Sun Telecom Titan 3 Plus from USA Mobility; USA Mobility Inc., Springfield, VA). USA Mobility operates the largest one‐ and two‐way paging networks in the United States.[9]
RESULTS
Of 26 control and 49 HCGM group members participating in the study, linked baseline and post‐study surveys were collected for 22 control and 41 HCGM participants (completion rates of 84.6% and 83.7%, respectively). To minimize recall bias, surveys not completed within a prespecified timeframe upon entering or leaving a team (two days attendings, four days others) were excluded.
Control and HCGM Group Characteristics
Control and HCGM groups were well matched demographically (Table 1). The average ages of control and HCGM group members were 30.10 and 30.95, respectively. Both groups were 59% male and 41% female.
| What do you find effective about the current hospital paging system? | What do you find ineffective about the current hospital paging system? | ||||
|---|---|---|---|---|---|
| Theme | No. of Respondents, (% of Total) | Response Example | Theme | No. of Respondents, (% of Total) | Response Example |
| |||||
| Reliability of message transmission | 17 (30.4%) | Everyone is able to receive the pages I send, regardless of service | Time wasted waiting for a response | 17 (29.3%) | Inefficient use of time waiting for reply |
| Ability to text page | 14 (25.0%) | Text paging allows targeted questions | One‐way nature of communication | 14 (24.1%) | Cannot text back instantly |
| Ease of use | 8 (14.3%) | Easy to use | Needing to find a computer to send a text page | 12 (20.7%) | Have to find an available computer to send a page |
| Search function | 5 (8.9%) | Search function is pretty effective in finding the people you're looking for | Character limitation | 10 (17.2%) | Length of text allowed too short |
| Ubiquity | 5 (8.9%) | Everyone is on paging system | Search function | 6 (10.3%) | Delay in looking people up in the system |
| Speed | 4 (7.1%) | Fast | Finding a phone to return a page | 5 (8.6%) | When you receive a page you need to find a phone |
| Loud alerts | 4 (7.1%) | Pager loud enough to hear all the time | Receipt of page uncertain | 3 (5.2%) | Unknown if page received |
| Staff responsiveness to pages | 4 (7.1%) | I know MD has to be onsite or covering the pager so someone eventually will call back | Sender's pager number not always included in page | 3 (5.2%) | Not everyone puts their pager number when they page. Then it's impossible to get back to them. |
| Brevity of messages | 3 (5.4%) | Requires very brief messages (easier for recipient) | Needing to remain near a phone while waiting for a page response | 3 (5.2%) | Wait by a phone for someone to call back; sometimes they do not call back |
| Helpful page operators | 2 (3.6%) | Page operators very helpful | Reliability of message transmission | 3 (5.2%) | Sometimes messages don't go through |
| Other | 10 (17.9%) | It's online and allows paging from anywhere there's internet access | Other | 11 (19.0%) | You cannot text with patient info on it |
A similar distribution of team member roles was observed in both groups, with two exceptions. First, the proportion of attending respondents in the HCGM group was lower than in the control group. This was due to the fact that several HCGM attendings entered discrepant ID codes on their surveys, thus making it impossible to link baseline and post‐study responses; these data were excluded. Additionally, two HCGM attendings were on service for four, rather than the standard two weeks, meaning two additional data points from unique attendings could not be obtained. Second, the experimental group included four pharmacists, whereas the control group did not. As a sensitivity test, we analyzed the data excluding the pharmacists, and this did not change our results.
Baseline Evaluations of the Hospital Paging System
At baseline, there were no significant differences between control and HCGM participants' perceptions of paging effectiveness (see Supporting Table 1, in the online version of this article). On a 5‐point rating scale (1=low, 5=high), 63 subjects rated their overall satisfaction with the paging system an average of 2.79 (95% confidence interval: 2.55‐3.03).
In free response questions, components of the paging system most frequently cited as effective included: reliability of message transmission, alphanumeric text paging, and ease of use (30.4%, 25.0%, and 14.3% of 56 respondents, respectively) (Table 2). Ineffective aspects included: time wasted waiting for responses to pages, the unidirectional nature of pagers, and needing to find a computer to send a text page (29.3%, 24.1%, and 20.7% of 58 respondents, respectively) (Table 2).
| Question | Baseline Average Rating of Paging System* | Post‐Study Average Rating of HCGM Application | P Value |
|---|---|---|---|
| |||
| Rate the effectiveness of each in allowing you to | |||
| Communicate your thoughts clearly | 3.194 | 3.806 | 0.010 |
| Communicate your thoughts efficiently | 3.200 | 3.829 | 0.009 |
| Send messages to other hospital staff | 3.543 | 3.571 | 0.480 |
| Receive messages/stay informed in real time | 3.222 | 3.306 | 0.405 |
| Rate the effectiveness of each in integrating into your workflow during | |||
| Work rounds | 2.313 | 3.000 | 0.018 |
| Patient discharge | 2.448 | 3.276 | 0.012 |
| Patient admissions | 2.862 | 2.621 | 0.238 |
| Teaching sessions | 2.292 | 2.458 | 0.448 |
| Overall satisfaction | 2.811 | 3.459 | 0.003 |
Baseline Utilization of Text Messaging
The majority of participants were familiar with text messaging and regularly used it personally and professionally prior to the start of the study. 90.5% of participants (n = 63) reported sending an average of 1 personal text messages per day, with the largest proportion (39.7%) sending 1‐5 texts per day (see Supporting Figure 1A in the online version of this article). 58.1% of respondents (n=62) reported sending an average of 1 text messages per day related to patient care (see Supporting Figure 1B in the online version of this article), with the largest fraction (58.3%) sending 1‐5 texts per day.
HCGM Adoption and Usage Patterns
Active use of HCGM was defined as using the application to send or receive an average of 1 text messages per day. Of HCGM participants, 67% self‐reported 1 week of active use of the application, indicating a strong compliance rate. Among non‐attendings, 70% reported sending 1 or more texts to other team members per day; this percentage increased to 86% among those whose attendings texted them at least once per day (47% of non‐attendings). Respondents who text frequently in their personal lives (>5 texts/day) were more likely to use the application; 90% of these respondents sent 1 or more HCGM texts per day.
Among 12 subjects who did not report sending or receiving 1 HCGM text/day, the top three reasons were: other team members were not using it (67%), no need to use it given the close proximity of other team members (67%), and other (33%). A Wilcoxon rank sum test was used to compare the ages of active versus nonactive users; no significant age difference was found (P=0.200).
To provide an objective measure of application adoption, usage data for each HCGM participant were obtained from the application developers. Because much of the study's first week was spent onboarding and instructing participant, the first week was not included in the analysis. Of 43 individuals enrolled in the study for at least one of the seven remaining weeks, 56% sent a total of 5 texts, 44% sent 10 texts, and 28% sent 20 texts. HCGM users on three teams sent an aggregate mean of 123 texts/week. Data on number of messages received by each user were not available.
Perceived Effectiveness: Paging Versus HCGM
In post‐study surveys, HCGM participants rated HCGM significantly higher (P<0.05) than paging (Table 3) in terms of ability to communicate thoughts clearly (P=0.010) and efficiently (P=0.009). HCGM was also deemed more effective at integrating into workflow during rounds (P=0.018) and patient discharge (P=0.012). Overall satisfaction with HCGM was also significantly higher (P=0.003).
| Control (n=22) | HCGM (n=41) | |||||
|---|---|---|---|---|---|---|
| Baseline Mean | Post‐Study Mean | P Value* | Baseline Mean | Post‐Study Mean | P Value* | |
| ||||||
| Rate the effectiveness of each in allowing you to | ||||||
| Communicate your thoughts clearly | 2.905 | 2.619 | 0.103 | 3.250 | 2.850 | 0.004 |
| Communicate your thoughts efficiently | 2.952 | 2.762 | 0.106 | 3.250 | 2.825 | 0.018 |
| Send messages to other hospital staff | 3.762 | 3.190 | 0.019 | 3.550 | 3.450 | 0.253 |
| Receive messages/stay informed in real time | 3.667 | 2.857 | 0.002 | 3.300 | 2.900 | 0.031 |
| Rate the effectiveness of each in integrating into your workflow during | ||||||
| Work rounds | 2.429 | 2.476 | 0.303 | 2.410 | 2.718 | 0.078 |
| Patient discharge | 2.500 | 2.350 | 0.251 | 2.472 | 2.861 | 0.071 |
| Patient admissions | 2.905 | 2.524 | 0.020 | 2.889 | 3.000 | 0.384 |
| Teaching sessions | 2.143 | 2.200 | 0.386 | 2.367 | 2.400 | 0.418 |
Comparison of Pre‐ and Post‐study Perceived Effectiveness of the Hospital Paging System
In post‐study evaluations, both control and HCGM participants rated the paging system's effectiveness less favorably (P<0.05) compared to baseline in terms of ability to receive messages/stay informed in real time (control P=0.002, HCGM P=0.031) (Table 4). Controls also reported a decrease from baseline in perceived effectiveness of paging in terms of ability to send messages (P=0.019) and integrate into workflow during patient admissions (P=0.020). HCGM participants found paging less effective at communicating thoughts clearly (P=0.004) and efficiently (P=0.018). No significant differences existed between control and HCGM groups' average assessments of paging at the conclusion of the study (see Supporting Table 2, in the online version of this article).
| What do you find effective about the Medigram system? | What do you find ineffective about the Medigram system? | ||||
|---|---|---|---|---|---|
| Theme | No. of Respondents, (% of Total) | Response Example | Theme | No. of Respondents, (% of Total) | Response Example |
| |||||
| Ease of use | 11 (32.4%) | Easy to use | Lack of ubiquity | 10 (30.3%) | Not enough people using it |
| Group texting feature | 11 (32.4%) | Ability to communicate with entire teameveryone seeing same message | Inconsistent usage | 8 (24.2%) | No one used it reliably |
| Speed | 8 (23.5%) | Faster than a page to send a message | Reliability of message transmission | 5 (15.2%) | Big negative is it requires Wi‐Fi |
| Accessibility | 5 (14.7%) | Able to get messages across quickly and anywhere without a computer | Missed message alerts | 4 (12.1%) | Unable to reliably know message was received if phone on silent |
| Efficiency | 4 (11.8%) | Very efficient way to communicate | Password login | 3 (9.1%) | Having to type a 6‐digit password in |
| Real‐time communication | 2 (5.9%) | Real‐time results | User interface | 2 (6.1%) | Interface is a little convoluted |
| No character limitation | 2 (5.9%) | No limit on words | Other | 10 (30.3%) | Not sure if all of the texts were relevant |
| Other | 4 (11.8%) | Great UI | |||
HCGM User Experience
When asked if they would recommend using an HCGM system to facilitate communication on the internal medicine wards, 85% of HCGM participants replied yes, 15% reported not sure, and 0% reported no. Based on free response entries, HCGM's most effective features (Table 5) included ease of use, group texting capacity, and speed (32.4%, 32.4%, and 23.5% of 34 respondents, respectively); its most ineffective aspects (Table 5) included lack of ubiquity, inconsistent usage by those with access to the application, and reliability of message transmission (30.3%, 24.2%, and 15.2% of 33 respondents, respectively).
DISCUSSION
We are the first to report that smartphone‐based, HIPAA‐compliant, group messaging applications improve provider perception of in‐hospital communication, while providing the information security that paging and commercial cellular networks do not. HCGM participants rated the application more favorably than paging in terms of clarity and efficiency of communication. These findings may be attributed to the expanded functionality offered by the application, including no character limit per HCGM text, the ability to use special characters such as slashes and ampersands, group texting, and the ability to reply immediately. HCGM may result in more efficient communication by facilitating direct two‐way communication via smartphones, whereas sending or returning pages requires a landline or computer.
HCGM participants rated the application higher than paging in terms of workflow integration during rounds and patient discharge, but not during patient admissions and teaching sessions. We had hypothesized that HCGM would integrate better into participants' workflows because HCGM texts could be replied to immediately. The reasons for the equivalence of HCGM and paging for workflow integration during patient admissions and teaching sessions may have been due to weak Wi‐Fi in certain areas of the hospital, and may warrant further investigation.
Analysis of HCGM utilization indicated that there were factors that made participants more or less likely to use the application. Individuals who reported that their attendings used HCGM regularly were more likely to use it themselves. Attending usage may legitimize use of HCGM for housestaff and medical students, who may otherwise feel that texting appears unprofessional. Participants who texted frequently in their personal lives were also more likely to utilize HCGM regularly, perhaps due to increased familiarity with/affinity for the platform.
HCGM participants who did not utilize the application regularly most often cited the fact that other team members did not use it. Among all users, the most frequently noted ineffective aspects of the application were its lack of ubiquity (HCGM was made available only to the small subset of individuals involved in the study) and inconsistent usage by those who did have access to the application. These findings suggest that HCGM effectiveness may be maximized with unrestricted access and mandated use; patchwork implementation, as in this study, detracts from perceived effectiveness.
Though objective outcome measures (average length of stay and average time of discharge) for patients of control attendings and HCGM attendings were examined, no significant differences were observed (P=0.089 and 0.494, respectively). These results may be due to the small size and short duration of the study.
Limitations
Our study had several limitations. HCGM was available only to individuals in the experimental arm of the study; most members of the internal medicine department and all other departments were not reachable through the application. This lack of ubiquity was a frequently cited frustration. Among individuals to whom HCGM was made available, barriers to adoption included: close proximity to would‐be message recipients, concern that smartphone usage in front of patients might appear unprofessional, and inconsistent or dropped service (weak or no Wi‐Fi signal in some areas). A technical problem with the Android platform midway through the study served as a potential frustration to several participants.
Due to the aforementioned issues, some participants used the HCGM application in a very limited way. We also did not replace hospital pagers (infeasible in this hospital setting); the HCGM application was added as a supplemental system. Future studies might explore the replacement of paging systems with HCGM‐type applications, as well as delve further into quantitative patient care outcomes.
It should be noted that the start of the study unintentionally coincided with the start of new interns and medical students in the hospital. Although it is possible that their relative unfamiliarity with the hospital may have made them more amenable to adopting a new technology, it is also possible that they may have been less likely to do so in the midst of such a major transitional period. Finally, this was a single‐site study, and as such, its findings may not be broadly generalizable. More research on such interventions is warranted, particularly in the context of current insecure communication methods such as paging that may make hospital‐wide adoption of new methods of secure communication, such as HCGM, mandatory.
CONCLUSION
Our study is the first to demonstrate that HCGM applications improve healthcare provider perception of multiple measures of in‐hospital communication, including efficiency of communication, workflow integration, and overall satisfaction. Notably, 85% of HCGM team respondents said they would recommend using an HCGM system on the wards. As smartphone use is expected to continue to increase among physicians and the general population, it is increasingly important to understand how to utilize these powerful communication tools to improve healthcare in an effective and secure manner.
Acknowledgements
The authors would like to thank the Stanford Medicine Residency Program and Stanford Hospital and Clinics for allowing them to perform the study, as well as Medigram, Inc., for supplying gift cards to incentivize survey completion and loaner iPhones to allow individuals without smartphones to participate in the study.
Disclosures: Stanford University School of Medicine's Medical Scholars Program provided financial support to the first author over the course of the study. Medigram, Inc. funded gift cards given to both control and HCGM participants upon survey completion and provided loaner iPhones to allow individuals without smartphones to participate in the study. Medigram, Inc. has also paid the fee for OnlineOpen to provide open access to this article. This study received an institutional review board exemption as quality improvement research. Participation was voluntary, and all participants signed a consent form. The authors report no conflicts of interest.
- . Communication systems in healthcare. Clin Biochem Rev. 2006;27:89–98.
- , , . Alphanumeric paging: a potential source of problems in patient care and communication. J Surg Educ. 2011;68:447–451.
- Manhattan Research. Taking the pulse: US market research report. Available at: http://manhattanresearch.com/Products‐and‐Services/Physician/Physician‐Research‐Modules. Accessed February 6, 2013.
- , , , et al. The use of wireless e‐mail to improve healthcare team communication. J Am Med Inform Assoc. 2009;16:705–713.
- , , , et al. The use of smartphones for clinical communication on internal medicine wards. J Hosp Med. 2010;5:553–559.
- US Department of Health and Human Services. Summary of the HIPAA privacy rule. Available at: http://www.hhs.gov/ocr/privacy/hipaa/understanding/summary/. Accessed May 11, 2013.
- United States Department of Health and Human Services. Summary of the HIPAA security rule. Available at: http://www.hhs.gov/ocr/privacy/hipaa/understanding/srsummary.html. Accessed May 11, 2013.
- Stanford University. Stanford facts: about Stanford. Available at: http://facts.stanford.edu/about/hospital. Accessed October 12, 2013.
- Wikinvest. USA mobility. Available at: http://www.wikinvest.com/stock/USA_Mobility_(USMO). Accessed February 6, 2013.
Pagers, though reliable and familiar technology, can be suboptimal for facilitating healthcare team communication.[1, 2] Most paging systems utilize single‐function pagers and only allow one‐way communication, requiring recipients to disrupt workflow to respond to pages. Paging transmissions can also be intercepted, and the information presented on pager displays can be viewed by anyone in possession of the pager.
Smartphones allow for instantaneous two‐way and group communication through advanced technological features. Their use is widespread; over 81% of American physicians owned a smartphone in 2011.[3] Previous studies demonstrate that healthcare providers rate smartphone‐based email positively, and that team smartphones can facilitate communication between nurses and physicians.[4, 5] However, these studies specifically examined the utility of smartphone‐based email and voice calls, and did not include text messaging. Limitations of traditional smartphone‐based text messaging include Health Insurance Portability and Accountability Act (HIPAA) noncompliance and dependence on in‐hospital cellular reception, which can be unreliable. HIPAA is a 1996 US federal law that established a set of privacy and security rules governing not only what is considered protected health information (PHI), but also minimum standards for the protection of such information. HIPAA compliance is defined as meeting these minimum standards for physical, network, and process security.[6, 7] Though PHI is often transmitted via paging systems and commercial carrier‐based text messaging, these modalities are not secure and are thus not HIPAA‐compliant.
Text messaging applications that address these security and reliability issues have the potential to greatly enhance in‐hospital communication. We hypothesized that a smartphone‐based HIPAA‐compliant group messaging application could improve in‐hospital communication on the inpatient medicine service. To our knowledge, our study is the first to examine a HIPAA‐compliant text messaging system, and also the first to compare a combination paging/HIPAA‐compliant group messaging (HCGM) system with a paging‐only system in assessing healthcare provider perception of communication efficiency.
METHODS
Intervention
This study utilized Medigram (Medigram, Inc.,
Study Design
In an eight‐week prospective, cluster‐randomized, controlled trial conducted at Stanford Hospital (June 25, 2012August 17, 2012), three of five inpatient medicine teams were randomized to use Medigram in addition to the existing hospital paging system (HCGM teams); the remaining two teams were assigned to use hospital paging only (control teams). Each team included one attending physician, one resident, two interns, two medical students, and a case manager. According to prescheduled rotations, attendings rotated every two weeks, and residents, interns, and medical students rotated every four weeks. All rotations were either off‐service or off‐site, with the exception of two attendings who rotated between study teams but within their experimental designations. Case managers remained with the same team. Additionally, the satellite pharmacy was provided with an HCGM‐equipped smartphone to communicate with experimental teams.
Participation was voluntary, with a 96% participation rate (n=75). HCGM teams downloaded the free application onto their smartphones. Participants without smartphones were provided with one for the duration of the study. Proper application use was demonstrated by one researcher in a 10‐minute standardized presentation. HCGM teams were encouraged to use the application in lieu of paging, except when patient care could be compromised.
All participants completed linked baseline and post‐study surveys. Gift cards valued at $10 were provided on completion of each survey. Though participants were assigned to either HCGM or control groups based on the randomized assignment of their preset cluster (hospital team) to an HCGM or control group, analysis was performed on the individual level due to the hospital's set rotation schedule, which resulted in dynamic, frequently changing clusters. We also compared average length of stay and time of discharge for patients treated by control versus HCGM teams. Clinical outcome data were obtained from the hospital's database using Midas+ Statit Solutions (Midas+ Statit Solutions Group, Tucson, AZ). Survey and clinical outcome data were analyzed in Stata (StataCorp, College Station, TX) and R (R Foundation for Statistical Computing, Vienna, Austria).
Survey Design and Analysis
Identical, anonymous baseline surveys were administered to control and HCGM teams. These surveys assessed attitudes toward the hospital paging system using a 5‐point Likert scale (1=low, 5=high) to evaluate perceived measures of effectiveness, workflow integration, and overall satisfaction. Wilcoxon rank sum tests were used to compare control and HCGM group responses to these questions. Free response questions asked participants to list the most effective and ineffective aspects of the paging system.
Post‐study surveys included all baseline survey questions, as well as questions about personal texting behavior. Post‐study HCGM surveys also included a parallel set of questions rating the HCGM application on the same measures of perceived effectiveness, workflow integration, and overall satisfaction. Wilcoxon signed rank tests were used to compare HCGM participants' baseline evaluations of paging to their post‐study evaluations of the HCGM application. Baseline and post‐study surveys were linked by the last four digits of respondent cell phone numbers. To compare control and HCGM group perceptions of the hospital paging system at study completion, post‐study survey responses were evaluated using Wilcoxon rank sum tests. The family‐wise error rate was left unadjusted due to concerns around inflated type II errors, given the high degree of correlation between survey questions.
All free response questions were analyzed using thematic analysis and grounded theory. After reviewing responses to each question, a list of overarching themes was constructed. Two researchers then independently reviewed each free‐response entry to assign it to one or more of these themes (some responses included several ideas with distinct themes). Entries with concordant theme assignments (90%) were coded as such; nonconcordant entries required an additional round of review to reach concordance. Finally, objective outcome measures including length of stay and time of discharge were analyzed by two‐sample t test.
| Control Group | HCGM Group | |
|---|---|---|
| ||
| Paired surveys collected (completion rate) | 22 (85%) | 41 (84%) |
| Average age 95% CI | 30.10 1.71 | 30.95 2.94 |
| Gender | ||
| Male | 13 (59%) | 24 (59%) |
| Female | 9 (41%) | 17 (41%) |
| Role | ||
| Medical students | 6 (27%) | 11 (27%) |
| Interns (PGY 1) | 7 (32%) | 12 (29%) |
| Residents (PGY2 and 3) | 3 (14%) | 6 (15%) |
| Attending physicians | 5 (23%) | 5 (12%) |
| Case managers | 1 (5%) | 3 (7%) |
| Pharmacists | 0 (0%) | 4 (10%) |
Information Security
The HCGM application in this study features 256‐bit encryption technology and requires a six‐digit password to access texts. For added security, a study‐dedicated server (HP ProLiant DL 180 G6; Hewlett‐Packard Co., Palo Alto, CA) with 4‐TB hard drive capacity (4 Seagate Barracuda ST1000DM003 1 TB 7200 RPM internal hard drives; Seagate Technology PLC, Cupertino, CA) was installed in the Stanford School of Medicine Data Center to store encrypted text messages. Data stored on the phones/server were accessible only to study participants, not researchers. These security measures were approved by Stanford Hospital and Stanford School of Medicine's security and privacy review process.
Hospital Paging System
Stanford Hospital and Clinics is a quaternary care academic medical center with 613 beds, 49 operating rooms, and over 25,000 inpatient admissions per year.[8] The institution uses one‐way alphanumeric pagers (primary model: Daviscomm BR802 Flex Pager from USA Mobility, secondary model: Sun Telecom Titan 3 Plus from USA Mobility; USA Mobility Inc., Springfield, VA). USA Mobility operates the largest one‐ and two‐way paging networks in the United States.[9]
RESULTS
Of 26 control and 49 HCGM group members participating in the study, linked baseline and post‐study surveys were collected for 22 control and 41 HCGM participants (completion rates of 84.6% and 83.7%, respectively). To minimize recall bias, surveys not completed within a prespecified timeframe upon entering or leaving a team (two days attendings, four days others) were excluded.
Control and HCGM Group Characteristics
Control and HCGM groups were well matched demographically (Table 1). The average ages of control and HCGM group members were 30.10 and 30.95, respectively. Both groups were 59% male and 41% female.
| What do you find effective about the current hospital paging system? | What do you find ineffective about the current hospital paging system? | ||||
|---|---|---|---|---|---|
| Theme | No. of Respondents, (% of Total) | Response Example | Theme | No. of Respondents, (% of Total) | Response Example |
| |||||
| Reliability of message transmission | 17 (30.4%) | Everyone is able to receive the pages I send, regardless of service | Time wasted waiting for a response | 17 (29.3%) | Inefficient use of time waiting for reply |
| Ability to text page | 14 (25.0%) | Text paging allows targeted questions | One‐way nature of communication | 14 (24.1%) | Cannot text back instantly |
| Ease of use | 8 (14.3%) | Easy to use | Needing to find a computer to send a text page | 12 (20.7%) | Have to find an available computer to send a page |
| Search function | 5 (8.9%) | Search function is pretty effective in finding the people you're looking for | Character limitation | 10 (17.2%) | Length of text allowed too short |
| Ubiquity | 5 (8.9%) | Everyone is on paging system | Search function | 6 (10.3%) | Delay in looking people up in the system |
| Speed | 4 (7.1%) | Fast | Finding a phone to return a page | 5 (8.6%) | When you receive a page you need to find a phone |
| Loud alerts | 4 (7.1%) | Pager loud enough to hear all the time | Receipt of page uncertain | 3 (5.2%) | Unknown if page received |
| Staff responsiveness to pages | 4 (7.1%) | I know MD has to be onsite or covering the pager so someone eventually will call back | Sender's pager number not always included in page | 3 (5.2%) | Not everyone puts their pager number when they page. Then it's impossible to get back to them. |
| Brevity of messages | 3 (5.4%) | Requires very brief messages (easier for recipient) | Needing to remain near a phone while waiting for a page response | 3 (5.2%) | Wait by a phone for someone to call back; sometimes they do not call back |
| Helpful page operators | 2 (3.6%) | Page operators very helpful | Reliability of message transmission | 3 (5.2%) | Sometimes messages don't go through |
| Other | 10 (17.9%) | It's online and allows paging from anywhere there's internet access | Other | 11 (19.0%) | You cannot text with patient info on it |
A similar distribution of team member roles was observed in both groups, with two exceptions. First, the proportion of attending respondents in the HCGM group was lower than in the control group. This was due to the fact that several HCGM attendings entered discrepant ID codes on their surveys, thus making it impossible to link baseline and post‐study responses; these data were excluded. Additionally, two HCGM attendings were on service for four, rather than the standard two weeks, meaning two additional data points from unique attendings could not be obtained. Second, the experimental group included four pharmacists, whereas the control group did not. As a sensitivity test, we analyzed the data excluding the pharmacists, and this did not change our results.
Baseline Evaluations of the Hospital Paging System
At baseline, there were no significant differences between control and HCGM participants' perceptions of paging effectiveness (see Supporting Table 1, in the online version of this article). On a 5‐point rating scale (1=low, 5=high), 63 subjects rated their overall satisfaction with the paging system an average of 2.79 (95% confidence interval: 2.55‐3.03).
In free response questions, components of the paging system most frequently cited as effective included: reliability of message transmission, alphanumeric text paging, and ease of use (30.4%, 25.0%, and 14.3% of 56 respondents, respectively) (Table 2). Ineffective aspects included: time wasted waiting for responses to pages, the unidirectional nature of pagers, and needing to find a computer to send a text page (29.3%, 24.1%, and 20.7% of 58 respondents, respectively) (Table 2).
| Question | Baseline Average Rating of Paging System* | Post‐Study Average Rating of HCGM Application | P Value |
|---|---|---|---|
| |||
| Rate the effectiveness of each in allowing you to | |||
| Communicate your thoughts clearly | 3.194 | 3.806 | 0.010 |
| Communicate your thoughts efficiently | 3.200 | 3.829 | 0.009 |
| Send messages to other hospital staff | 3.543 | 3.571 | 0.480 |
| Receive messages/stay informed in real time | 3.222 | 3.306 | 0.405 |
| Rate the effectiveness of each in integrating into your workflow during | |||
| Work rounds | 2.313 | 3.000 | 0.018 |
| Patient discharge | 2.448 | 3.276 | 0.012 |
| Patient admissions | 2.862 | 2.621 | 0.238 |
| Teaching sessions | 2.292 | 2.458 | 0.448 |
| Overall satisfaction | 2.811 | 3.459 | 0.003 |
Baseline Utilization of Text Messaging
The majority of participants were familiar with text messaging and regularly used it personally and professionally prior to the start of the study. 90.5% of participants (n = 63) reported sending an average of 1 personal text messages per day, with the largest proportion (39.7%) sending 1‐5 texts per day (see Supporting Figure 1A in the online version of this article). 58.1% of respondents (n=62) reported sending an average of 1 text messages per day related to patient care (see Supporting Figure 1B in the online version of this article), with the largest fraction (58.3%) sending 1‐5 texts per day.
HCGM Adoption and Usage Patterns
Active use of HCGM was defined as using the application to send or receive an average of 1 text messages per day. Of HCGM participants, 67% self‐reported 1 week of active use of the application, indicating a strong compliance rate. Among non‐attendings, 70% reported sending 1 or more texts to other team members per day; this percentage increased to 86% among those whose attendings texted them at least once per day (47% of non‐attendings). Respondents who text frequently in their personal lives (>5 texts/day) were more likely to use the application; 90% of these respondents sent 1 or more HCGM texts per day.
Among 12 subjects who did not report sending or receiving 1 HCGM text/day, the top three reasons were: other team members were not using it (67%), no need to use it given the close proximity of other team members (67%), and other (33%). A Wilcoxon rank sum test was used to compare the ages of active versus nonactive users; no significant age difference was found (P=0.200).
To provide an objective measure of application adoption, usage data for each HCGM participant were obtained from the application developers. Because much of the study's first week was spent onboarding and instructing participant, the first week was not included in the analysis. Of 43 individuals enrolled in the study for at least one of the seven remaining weeks, 56% sent a total of 5 texts, 44% sent 10 texts, and 28% sent 20 texts. HCGM users on three teams sent an aggregate mean of 123 texts/week. Data on number of messages received by each user were not available.
Perceived Effectiveness: Paging Versus HCGM
In post‐study surveys, HCGM participants rated HCGM significantly higher (P<0.05) than paging (Table 3) in terms of ability to communicate thoughts clearly (P=0.010) and efficiently (P=0.009). HCGM was also deemed more effective at integrating into workflow during rounds (P=0.018) and patient discharge (P=0.012). Overall satisfaction with HCGM was also significantly higher (P=0.003).
| Control (n=22) | HCGM (n=41) | |||||
|---|---|---|---|---|---|---|
| Baseline Mean | Post‐Study Mean | P Value* | Baseline Mean | Post‐Study Mean | P Value* | |
| ||||||
| Rate the effectiveness of each in allowing you to | ||||||
| Communicate your thoughts clearly | 2.905 | 2.619 | 0.103 | 3.250 | 2.850 | 0.004 |
| Communicate your thoughts efficiently | 2.952 | 2.762 | 0.106 | 3.250 | 2.825 | 0.018 |
| Send messages to other hospital staff | 3.762 | 3.190 | 0.019 | 3.550 | 3.450 | 0.253 |
| Receive messages/stay informed in real time | 3.667 | 2.857 | 0.002 | 3.300 | 2.900 | 0.031 |
| Rate the effectiveness of each in integrating into your workflow during | ||||||
| Work rounds | 2.429 | 2.476 | 0.303 | 2.410 | 2.718 | 0.078 |
| Patient discharge | 2.500 | 2.350 | 0.251 | 2.472 | 2.861 | 0.071 |
| Patient admissions | 2.905 | 2.524 | 0.020 | 2.889 | 3.000 | 0.384 |
| Teaching sessions | 2.143 | 2.200 | 0.386 | 2.367 | 2.400 | 0.418 |
Comparison of Pre‐ and Post‐study Perceived Effectiveness of the Hospital Paging System
In post‐study evaluations, both control and HCGM participants rated the paging system's effectiveness less favorably (P<0.05) compared to baseline in terms of ability to receive messages/stay informed in real time (control P=0.002, HCGM P=0.031) (Table 4). Controls also reported a decrease from baseline in perceived effectiveness of paging in terms of ability to send messages (P=0.019) and integrate into workflow during patient admissions (P=0.020). HCGM participants found paging less effective at communicating thoughts clearly (P=0.004) and efficiently (P=0.018). No significant differences existed between control and HCGM groups' average assessments of paging at the conclusion of the study (see Supporting Table 2, in the online version of this article).
| What do you find effective about the Medigram system? | What do you find ineffective about the Medigram system? | ||||
|---|---|---|---|---|---|
| Theme | No. of Respondents, (% of Total) | Response Example | Theme | No. of Respondents, (% of Total) | Response Example |
| |||||
| Ease of use | 11 (32.4%) | Easy to use | Lack of ubiquity | 10 (30.3%) | Not enough people using it |
| Group texting feature | 11 (32.4%) | Ability to communicate with entire teameveryone seeing same message | Inconsistent usage | 8 (24.2%) | No one used it reliably |
| Speed | 8 (23.5%) | Faster than a page to send a message | Reliability of message transmission | 5 (15.2%) | Big negative is it requires Wi‐Fi |
| Accessibility | 5 (14.7%) | Able to get messages across quickly and anywhere without a computer | Missed message alerts | 4 (12.1%) | Unable to reliably know message was received if phone on silent |
| Efficiency | 4 (11.8%) | Very efficient way to communicate | Password login | 3 (9.1%) | Having to type a 6‐digit password in |
| Real‐time communication | 2 (5.9%) | Real‐time results | User interface | 2 (6.1%) | Interface is a little convoluted |
| No character limitation | 2 (5.9%) | No limit on words | Other | 10 (30.3%) | Not sure if all of the texts were relevant |
| Other | 4 (11.8%) | Great UI | |||
HCGM User Experience
When asked if they would recommend using an HCGM system to facilitate communication on the internal medicine wards, 85% of HCGM participants replied yes, 15% reported not sure, and 0% reported no. Based on free response entries, HCGM's most effective features (Table 5) included ease of use, group texting capacity, and speed (32.4%, 32.4%, and 23.5% of 34 respondents, respectively); its most ineffective aspects (Table 5) included lack of ubiquity, inconsistent usage by those with access to the application, and reliability of message transmission (30.3%, 24.2%, and 15.2% of 33 respondents, respectively).
DISCUSSION
We are the first to report that smartphone‐based, HIPAA‐compliant, group messaging applications improve provider perception of in‐hospital communication, while providing the information security that paging and commercial cellular networks do not. HCGM participants rated the application more favorably than paging in terms of clarity and efficiency of communication. These findings may be attributed to the expanded functionality offered by the application, including no character limit per HCGM text, the ability to use special characters such as slashes and ampersands, group texting, and the ability to reply immediately. HCGM may result in more efficient communication by facilitating direct two‐way communication via smartphones, whereas sending or returning pages requires a landline or computer.
HCGM participants rated the application higher than paging in terms of workflow integration during rounds and patient discharge, but not during patient admissions and teaching sessions. We had hypothesized that HCGM would integrate better into participants' workflows because HCGM texts could be replied to immediately. The reasons for the equivalence of HCGM and paging for workflow integration during patient admissions and teaching sessions may have been due to weak Wi‐Fi in certain areas of the hospital, and may warrant further investigation.
Analysis of HCGM utilization indicated that there were factors that made participants more or less likely to use the application. Individuals who reported that their attendings used HCGM regularly were more likely to use it themselves. Attending usage may legitimize use of HCGM for housestaff and medical students, who may otherwise feel that texting appears unprofessional. Participants who texted frequently in their personal lives were also more likely to utilize HCGM regularly, perhaps due to increased familiarity with/affinity for the platform.
HCGM participants who did not utilize the application regularly most often cited the fact that other team members did not use it. Among all users, the most frequently noted ineffective aspects of the application were its lack of ubiquity (HCGM was made available only to the small subset of individuals involved in the study) and inconsistent usage by those who did have access to the application. These findings suggest that HCGM effectiveness may be maximized with unrestricted access and mandated use; patchwork implementation, as in this study, detracts from perceived effectiveness.
Though objective outcome measures (average length of stay and average time of discharge) for patients of control attendings and HCGM attendings were examined, no significant differences were observed (P=0.089 and 0.494, respectively). These results may be due to the small size and short duration of the study.
Limitations
Our study had several limitations. HCGM was available only to individuals in the experimental arm of the study; most members of the internal medicine department and all other departments were not reachable through the application. This lack of ubiquity was a frequently cited frustration. Among individuals to whom HCGM was made available, barriers to adoption included: close proximity to would‐be message recipients, concern that smartphone usage in front of patients might appear unprofessional, and inconsistent or dropped service (weak or no Wi‐Fi signal in some areas). A technical problem with the Android platform midway through the study served as a potential frustration to several participants.
Due to the aforementioned issues, some participants used the HCGM application in a very limited way. We also did not replace hospital pagers (infeasible in this hospital setting); the HCGM application was added as a supplemental system. Future studies might explore the replacement of paging systems with HCGM‐type applications, as well as delve further into quantitative patient care outcomes.
It should be noted that the start of the study unintentionally coincided with the start of new interns and medical students in the hospital. Although it is possible that their relative unfamiliarity with the hospital may have made them more amenable to adopting a new technology, it is also possible that they may have been less likely to do so in the midst of such a major transitional period. Finally, this was a single‐site study, and as such, its findings may not be broadly generalizable. More research on such interventions is warranted, particularly in the context of current insecure communication methods such as paging that may make hospital‐wide adoption of new methods of secure communication, such as HCGM, mandatory.
CONCLUSION
Our study is the first to demonstrate that HCGM applications improve healthcare provider perception of multiple measures of in‐hospital communication, including efficiency of communication, workflow integration, and overall satisfaction. Notably, 85% of HCGM team respondents said they would recommend using an HCGM system on the wards. As smartphone use is expected to continue to increase among physicians and the general population, it is increasingly important to understand how to utilize these powerful communication tools to improve healthcare in an effective and secure manner.
Acknowledgements
The authors would like to thank the Stanford Medicine Residency Program and Stanford Hospital and Clinics for allowing them to perform the study, as well as Medigram, Inc., for supplying gift cards to incentivize survey completion and loaner iPhones to allow individuals without smartphones to participate in the study.
Disclosures: Stanford University School of Medicine's Medical Scholars Program provided financial support to the first author over the course of the study. Medigram, Inc. funded gift cards given to both control and HCGM participants upon survey completion and provided loaner iPhones to allow individuals without smartphones to participate in the study. Medigram, Inc. has also paid the fee for OnlineOpen to provide open access to this article. This study received an institutional review board exemption as quality improvement research. Participation was voluntary, and all participants signed a consent form. The authors report no conflicts of interest.
- . Communication systems in healthcare. Clin Biochem Rev. 2006;27:89–98.
- , , . Alphanumeric paging: a potential source of problems in patient care and communication. J Surg Educ. 2011;68:447–451.
- Manhattan Research. Taking the pulse: US market research report. Available at: http://manhattanresearch.com/Products‐and‐Services/Physician/Physician‐Research‐Modules. Accessed February 6, 2013.
- , , , et al. The use of wireless e‐mail to improve healthcare team communication. J Am Med Inform Assoc. 2009;16:705–713.
- , , , et al. The use of smartphones for clinical communication on internal medicine wards. J Hosp Med. 2010;5:553–559.
- US Department of Health and Human Services. Summary of the HIPAA privacy rule. Available at: http://www.hhs.gov/ocr/privacy/hipaa/understanding/summary/. Accessed May 11, 2013.
- United States Department of Health and Human Services. Summary of the HIPAA security rule. Available at: http://www.hhs.gov/ocr/privacy/hipaa/understanding/srsummary.html. Accessed May 11, 2013.
- Stanford University. Stanford facts: about Stanford. Available at: http://facts.stanford.edu/about/hospital. Accessed October 12, 2013.
- Wikinvest. USA mobility. Available at: http://www.wikinvest.com/stock/USA_Mobility_(USMO). Accessed February 6, 2013.
© 2014 The Authors Journal of Hospital Medicine published by Wiley Periodicals, Inc. on behalf of Society of Hospital Medicine
Generating Mortality Predictions
The systematic deployment of prediction rules within health systems remains a challenge, although such decision aids have been available for decades.[1, 2] We previously developed and validated a prediction rule for 30‐day mortality in a retrospective cohort, noting that the mortality risk is associated with a number of other clinical events.[3] These relationships suggest risk strata, defined by the predicted probability of 30‐day mortality, and could trigger a number of coordinated care processes proportional to the level of risk.[4] For example, patients within the higher‐risk strata could be considered for placement into an intermediate or intensive care unit (ICU), be monitored more closely by physician and nurse team members for clinical deterioration, be seen by a physician within a few days of hospital discharge, and be considered for advance care planning discussions.[3, 4, 5, 6, 7] Patients within the lower‐risk strata might not need the same intensity of these processes routinely unless some other indication were present.
However attractive this conceptual framework may be, its realization is dependent on the willingness of clinical staff to generate predictions consistently on a substantial portion of the patient population, and on the accuracy of the predictions when the risk factors are determined with some level of uncertainty at the beginning of the hospitalization.[2, 8] Skepticism is justified, because the work involved in completing the prediction rule might be incompatible with existing workflow. A patient might not be scored if the emergency physician lacks time or if technical issues arise with the information system and computation process.[9] There is also a generic concern that the predictions will prove to be less accurate outside of the original study population.[8, 9, 10] A more specific concern for our rule is how well present on admission diagnoses can be determined during the relatively short emergency department or presurgery evaluation period. For example, a final diagnosis of heart failure might not be established until later in the hospitalization, after the results of diagnostic testing and clinical response to treatment are known. Moreover, our retrospective prediction rule requires an assessment of the presence or absence of sepsis and respiratory failure. These diagnoses appear to be susceptible to secular trends in medical record coding practices, suggesting the rule's accuracy might not be stable over time.[11]
We report the feasibility of having emergency physicians and the surgical preparation center team generate mortality predictions before an inpatient bed is assigned. We evaluate and report the accuracy of these prospective predictions.
METHODS
The study population consisted of all patients 18 years of age or less than 100 years who were admitted from the emergency department or assigned an inpatient bed following elective surgery at a tertiary, community teaching hospital in the Midwestern United States from September 1, 2012 through February 15, 2013. Although patients entering the hospital from these 2 pathways would be expected to have different levels of mortality risk, we used the original prediction rule for both because such distinctions were not made in its derivation and validation. Patients were not considered if they were admitted for childbirth or other obstetrical reasons, admitted directly from physician offices, the cardiac catheterization laboratory, hemodialysis unit, or from another hospital. The site institutional review board approved this study.
The implementation process began with presentations to the administrative and medical staff leadership on the accuracy of the retrospectively generated mortality predictions and risk of other adverse events.[3] The chief medical and nursing officers became project champions, secured internal funding for the technical components, and arranged to have 2 project comanagers available. A multidisciplinary task force endorsed the implementation details at biweekly meetings throughout the planning year. The leadership of the emergency department and surgical preparation center committed their colleagues to generate the predictions. The support of the emergency leadership was contingent on the completion of the entire prediction generating process in a very short time (within the time a physician could hold his/her breath). The chief medical officer, with the support of the leadership of the hospitalists and emergency physicians, made the administrative decision that a prediction must be generated prior to the assignment of a hospital room.
During the consensus‐building phase, a Web‐based application was developed to generate the predictions. Emergency physicians and surgical preparation staff were trained on the definitions of the risk factors (see Supporting Information, Appendix, in the online version of this article) and how to use the Web application. Three supporting databases were created. Each midnight, a past medical history database was updated, identifying those who had been discharged from the study hospital in the previous 365 days, and whether or not their diagnoses included atrial fibrillation, leukemia/lymphoma, metastatic cancer, cancer other than leukemia, lymphoma, cognitive disorder, or other neurological conditions (eg, Parkinson's, multiple sclerosis, epilepsy, coma, and stupor). Similarly, a clinical laboratory results database was created and updated real time through an HL7 (Health Level Seven, a standard data exchange format[12]) interface with the laboratory information system for the following tests performed in the preceding 30 days at a hospital‐affiliated facility: hemoglobin, platelet count, white blood count, serum troponin, blood urea nitrogen, serum albumin, serum lactate, arterial pH, arterial partial pressure of oxygen values. The third database, admission‐discharge‐transfer, was created and updated every 15 minutes to identify patients currently in the emergency room or scheduled for surgery. When a patient registration event was added to this database, the Web application created a record, retrieved all relevant data, and displayed the patient name for scoring. When the decision for hospitalization was made, the clinician selected the patient's name and reviewed the pre‐populated medical diagnoses of interest, which could be overwritten based on his/her own assessment (Figure 1A,B). The clinician then indicated (yes, no, or unknown) if the patient currently had or was being treated for each of the following: injury, heart failure, sepsis, respiratory failure, and whether or not the admitting service would be medicine (ie, nonsurgical, nonobstetrical). We considered unknown status to indicate the patient did not have the condition. When laboratory values were not available, a normal value was imputed using a previously developed algorithm.[3] Two additional questions, not used in the current prediction process, were answered to provide data for a future analysis: 1 concerning the change in the patient's condition while in the emergency department and the other concerning the presence of abnormal vital signs. The probability of 30‐day mortality was calculated via the Web application using the risk information supplied and the scoring weights (ie, parameter estimates) provided in the Appendices of our original publication.[3] Predictions were updated every minute as new laboratory values became available, and flagged with an alert if a more severe score resulted.

For the analyses of this study, the last prospective prediction viewed by emergency department personnel, a hospital bed manager, or surgical suite staff prior to arrival on the nursing unit is the one referenced as prospective. Once the patient had been discharged from the hospital, we generated a second mortality prediction based on previously published parameter estimates applied to risk factor data ascertained retrospectively as was done in the original article[3]; we subsequently refer to this prediction as retrospective. We will report on the group of patients who had both prospective and retrospective scores (1 patient had a prospective but not retrospective score available).
The prediction scores were made available to the clinical teams gradually during the study period. All scores were viewable by the midpoint of the study for emergency department admissions and near the end of the study for elective‐surgery patients. Only 2 changes in care processes based on level of risk were introduced during the study period. The first required initial placement of patients having a probability of dying of 0.3 or greater into an intensive or intermediate care unit unless the patient or family requested a less aggressive approach. The second occurred in the final 2 months of the study when a large multispecialty practice began routinely arranging for high‐risk patients to be seen within 3 or 7 days of hospital discharge.
Statistical Analyses
SAS version 9.3 (SAS Institute Inc., Cary, NC) was used to build the datasets and perform the analyses. Feasibility was evaluated by the number of patients who were candidates for prospective scoring with a score available at the time of admission. The validity was assessed with the primary outcome of death within 30 days from the date of hospital admission, as determined from hospital administrative data and the Social Security Death Index. The primary statistical metric is the area under the receiver operating characteristic curve (AROC) and the corresponding 95% Wald confidence limits. We needed some context for understanding the performance of the prospective predictions, assuming the accuracy could deteriorate due to the instability of the prediction rule over time and/or due to imperfect clinical information at the time the risk factors were determined. Accordingly, we also calculated an AROC based on retrospectively derived covariates (but using the same set of parameter estimates) as done in our original publication so we could gauge the stability of the original prediction rule. However, the motivation was not to determine whether retrospective versus prospective predictions were more accurate, given that only prospective predictions are useful in the context of developing real‐time care processes. Rather, we wanted to know if the prospective predictions would be sufficiently accurate for use in clinical practice. A priori, we assumed the prospective predictions should have an AROC of approximately 0.80. Therefore, a target sample size of 8660 hospitalizations was determined to be adequate to assess validity, assuming a 30‐day mortality rate of 5%, a desired lower 95% confidence boundary for the area under the prospective curve at or above 0.80, with a total confidence interval width of 0.07.[13] Calibration was assessed by comparing the actual proportion of patients dying (with 95% binomial confidence intervals) with the mean predicted mortality level within 5 percentile increments of predicted risk.
Risk Strata
We categorize the probability of 30‐day mortality into strata, with the understanding that the thresholds for defining these are a work in progress. Our hospital currently has 5 strata ranging from level 1 (highest mortality risk) to level 5 (lowest risk). The corresponding thresholds (at probabilities of death of 0.005, 0.02, 0.07, 0.20) were determined by visual inspection of the event rates and slope of curves displayed in Figure 1 of the original publication.[3]
Relationship to Secondary Clinical Outcomes of Interest
The choice of clinical care processes triggered per level of risk may be informed by understanding the frequency of events that increase with the mortality risk. We therefore examined the AROC from logistic regression models for the following outcomes using the prospectively generated probability as an explanatory variable: unplanned transfer to an ICU within the first 24 hours for patients not admitted to an ICU initially, ICU use at some point during the hospitalization, the development of a condition not present on admission (complication), receipt of palliative care by the end of the hospitalization, death during the hospitalization, 30‐day readmission, and death within 180 days. The definition of these outcomes and statistical approach used has been previously reported.[3]
RESULTS
Mortality predictions were generated on demand for 7291 out of 7777 (93.8%) eligible patients admitted from the emergency department, and for 2021 out of 2250 (89.8%) eligible elective surgical cases, for a total of 9312 predictions generated out of a possible 10,027 hospitalizations (92.9%). Table 1 displays the characteristics of the study population. The mean age was 65.2 years and 53.8% were women. The most common risk factors were atrial fibrillation (16.4%) and cancer (14.6%). Orders for a comfort care approach (rather than curative) were entered within 4 hours of admission for 32/9312 patients (0.34%), and 9/9312 (0.1%) were hospice patients on admission.
| Risk Factors | No. | Without Imputation | No. | With Imputation |
|---|---|---|---|---|
| ||||
| Clinical laboratory values within preceding 30 days | ||||
| Maximum serum blood urea nitrogen (mg/dL) | 8,484 | 22.7 (17.7) | 9,312 | 22.3 (16.9) |
| Minimum hemoglobin, g/dL, | 8,750 | 12.5 (2.4) | 9,312 | 12.4 (2.4) |
| Minimum platelet count, 1,000/UL | 8,737 | 224.1 (87.4) | 9,312 | 225.2 (84.7) |
| Maximum white blood count, 1,000/UL | 8,750 | 10.3 (5.8) | 9,312 | 10.3 (5.6) |
| Maximum serum lactate, mEq/L | 1,749 | 2.2 (1.8) | 9,312 | 0.7 (1.1) |
| Minimum serum albumin, g/dL | 4,057 | 3.4 (0.7) | 9,312 | 3.2 (0.5) |
| Minimum arterial pH | 509 | 7.36 (0.10) | 9,312 | 7.36 (0.02) |
| Minimum arterial pO2, mm Hg | 509 | 73.6 (25.2) | 9,312 | 98.6 (8.4) |
| Maximum serum troponin, ng/mL | 3,217 | 0.5 (9.3) | 9,312 | 0.2 (5.4) |
| Demographics and diagnoses | ||||
| Age, y | 9,312 | 65.2 (17.0) | ||
| Female sex | 9,312 | 5,006 (53.8%) | ||
| Previous hospitalization within past 365 days | 9,312 | 3,995 (42.9%) | ||
| Emergent admission | 9,312 | 7,288 (78.3%) | ||
| Admitted to a medicine service | 9,312 | 5,840 (62.7%) | ||
| Current or past atrial fibrillation | 9,312 | 1,526 (16.4%) | ||
| Current or past cancer without metastases, excluding leukemia or lymphoma | 9,312 | 1,356 (14.6%) | ||
| Current or past history of leukemia or lymphoma | 9,312 | 145 (1.6%) | ||
| Current or past metastatic cancer | 9,312 | 363 (3.9%) | ||
| Current or past cognitive deficiency | 9,312 | 844 (9.1%) | ||
| Current or past history of other neurological conditions (eg, Parkinson's disease, multiple sclerosis, epilepsy, coma, stupor, brain damage) | 9,312 | 952 (10.2%) | ||
| Injury such as fractures or trauma at the time of admission | 9,312 | 656 (7.0%) | ||
| Sepsis at the time of admission | 9,312 | 406 (4.4%) | ||
| Heart failure at the time of admission | 9,312 | 776 (8.3%) | ||
| Respiratory failure on admission | 9,312 | 557 (6.0%) | ||
| Outcomes of interest | ||||
| Unplanned transfer to an ICU (for those not admitted to an ICU) within 24 hours of admission | 8,377 | 86 (1.0%) | ||
| Ever in an ICU during the hospitalization | 9,312 | 1,267 (13.6%) | ||
| Development of a condition not present on admission (complication) | 9,312 | 834 (9.0%) | ||
| Within hospital mortality | 9,312 | 188 (2.0%) | ||
| Mortality within 30 days of admission | 9,312 | 466 (5.0%) | ||
| Mortality within 180 days of admission | 9,312 | 1,070 (11.5%) | ||
| Receipt of palliative care by the end of the hospitalization | 9,312 | 314 (3.4%) | ||
| Readmitted to the hospital within 30 days of discharge (patients alive at discharge) | 9,124 | 1,302 (14.3%) | ||
| Readmitted to the hospital within 30 days of discharge (patients alive on admission) | 9,312 | 1,302 (14.0%) | ||
Evaluation of Prediction Accuracy
The AROC for 30‐day mortality was 0.850 (95% confidence interval [CI]: 0.833‐0.866) for prospectively collected covariates, and 0.870 (95% CI: 0.855‐0.885) for retrospectively determined risk factors. These AROCs are not substantively different from each other, demonstrating comparable prediction performance. Calibration was excellent, as indicated in Figure 2, in which the predicted level of risk lay within the 95% confidence limits of the actual 30‐day mortality for 19 out of 20 intervals of 5 percentile increments.
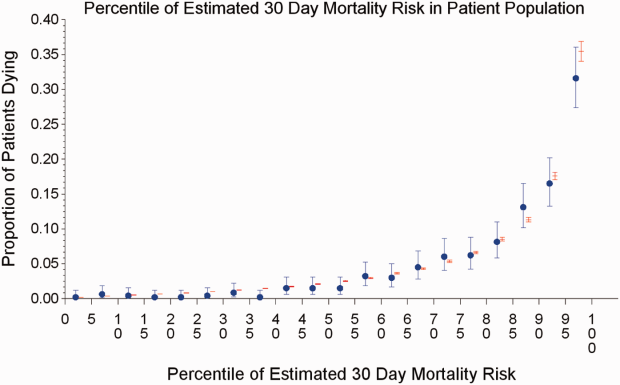
Relationship to Secondary Clinical Outcomes of Interest
The relationship between the prospectively generated probability of dying within 30 days and other events is quantified by the AROC displayed in Table 2. The 30‐day mortality risk has a strong association with the receipt of palliative care by hospital discharge, in‐hospital mortality, and 180‐day mortality, a fair association with the risk for 30‐day readmissions and unplanned transfers to intensive care, and weak associations with receipt of intensive unit care ever within the hospitalization or the development of a new diagnosis that was not present on admission (complication). The frequency of these events per mortality risk strata is shown in Table 3. The level 1 stratum contains a higher frequency of these events, whereas the level 5 stratum contains relatively few, reflecting the Pareto principle by which a relatively small proportion of patients contribute a disproportionate frequency of the events of interest.
| |
| In‐hospital mortality | 0.841 (0.8140.869) |
| 180day mortality | 0.836 (0.8250.848) |
| Receipt of palliative care by discharge | 0.875 (0.8580.891) |
| 30day readmission (patients alive at discharge) | 0.649 (0.6340.664) |
| Unplanned transfer to an ICU (for those not admitted to an ICU) within 24 hours | 0.643 (0.5900.696) |
| Ever in an ICU during the hospitalization | 0.605 (0.5880.621) |
| Development of a condition not present on admission (complication) | 0.555 (0.5350.575) |
| Risk Strata | 30‐Day Mortality, Count/Cases (%) | Unplanned Transfers to ICU Within 24 Hours, Count/Cases (%) | Diagnosis Not Present on Admission, Complication, Count/Cases (%) | Palliative Status at Discharge, Count/Cases (%) | Death in Hospital, Count/Cases (%) |
|---|---|---|---|---|---|
| Risk Strata | Ever in ICU, Count/Cases (%) | 30‐Day Readmission, Count/Cases (%) | Death or Readmission Within 30 Days, Count/Cases (%) | 180‐Day Mortality, Count/Cases (%) | |
| |||||
| 1 | 155/501 (30.9%) | 6/358 (1.7%) | 58/501 (11.6%) | 110/501 (22.0%) | 72/501 (14.4%) |
| 2 | 166/1,316 (12.6%) | 22/1,166 (1.9%) | 148/1,316 (11.3%) | 121/1,316 (9.2%) | 58/1,316 (4.4%) |
| 3 | 117/2,977 (3.9%) | 35/2,701 (1.3%) | 271/2,977 (9.1%) | 75/2,977 (2.5%) | 43/2,977 (1.4%) |
| 4 | 24/3,350 (0.7%) | 20/3,042 (0.7%) | 293/3,350 (8.8%) | 6/3,350 (0.2%) | 13/3,350 (0.4%) |
| 5 | 4/1,168 (0.3%) | 3/1,110 (0.3%) | 64/1,168 (5.5%) | 2/1,168 (0.2%) | 2/1,168 (0.2%) |
| Total | 466/9,312 (5.0%) | 86/8,377 (1.0%) | 834/9,312 (9.0%) | 314/9,312 (3.4%) | 188/9,312 (2.0%) |
| 1 | 165/501 (32.9%) | 106/429 (24.7%) | 243/501 (48.5%) | 240/501 (47.9%) | |
| 2 | 213/1,316 (16.2%) | 275/1,258 (21.9%) | 418/1,316 (31.8%) | 403/1,316 (30.6%) | |
| 3 | 412/2,977 (13.8%) | 521/2,934 (17.8%) | 612/2,977 (20.6%) | 344/2,977 (11.6%) | |
| 4 | 406/3,350 (12.1%) | 348/3,337 (10.4%) | 368/3,350 (11.0%) | 77/3,350 (2.3%) | |
| 5 | 71/1,168 (6.1%) | 52/1,166 (4.5%) | 56/1,168 (4.8%) | 6/1,168 (0.5%) | |
| Total | 1,267/9,312 (13.6%) | 1,302/9,124 (14.3%) | 1,697/9,312 (18.2%) | 1,070/9,312 (11.5%) | |
DISCUSSION
Emergency physicians and surgical preparation center nurses generated predictions by the time of hospital admission for over 90% of the target population during usual workflow, without the addition of staff or resources. The discrimination of the prospectively generated predictions was very good to excellent, with an AROC of 0.850 (95% CI: 0.833‐0.866), similar to that obtained from the retrospective version. Calibration was excellent. The prospectively calculated mortality risk was associated with a number of other events. As shown in Table 3, the differing frequency of events within the risk strata support the development of differing intensities of multidisciplinary strategies according to the level of risk.[5] Our study provides useful experience for others who anticipate generating real‐time predictions. We consider the key reasons for success to be the considerable time spent achieving consensus, the technical development of the Web application, the brief clinician time required for the scoring process, the leadership of the chief medical and nursing officers, and the requirement that a prediction be generated before assignment of a hospital room.
Our study has a number of limitations, some of which were noted in our original publication, and although still relevant, will not be repeated here for space considerations. This is a single‐site study that used a prediction rule developed by the same site, albeit on a patient population 4 to 5 years earlier. It is not known how well the specific rule might perform in other hospital populations; any such use should therefore be accompanied by independent validation studies prior to implementation. Our successful experience should motivate future validation studies. Second, because the prognoses of patients scored from the emergency department are likely to be worse than those of elective surgery patients, our rule should be recalibrated for each subgroup separately. We plan to do this in the near future, as well as consider additional risk factors. Third, the other events of interest might be predicted more accurately if rules specifically developed for each were deployed. The mortality risk by itself is unlikely to be a sufficiently accurate predictor, particularly for complications and intensive care use, for reasons outlined in our original publication.[3] However, the varying levels of events within the higher versus lower strata should be noted by the clinical team as they design their team‐based processes. A follow‐up visit with a physician within a few days of discharge could address the concurrent risk of dying as well as readmission, for example. Finally, it is too early to determine if the availability of mortality predictions from this rule will benefit patients.[2, 8, 10] During the study period, we implemented only 2 new care processes based on the level of risk. This lack of interventions allowed us to evaluate the prediction accuracy with minimal additional confounding, but at the expense of not yet knowing the clinical impact of this work. After the study period, we implemented a number of other interventions and plan on evaluating their effectiveness in the future. We are also considering an evaluation of the potential information gained by updating the predictions throughout the course of the hospitalization.[14]
In conclusion, it is feasible to have a reasonably accurate prediction of mortality risk for most adult patients at the beginning of their hospitalizations. The availability of this prognostic information provides an opportunity to develop proactive care plans for high‐ and low‐risk subsets of patients.
Acknowledgements
The authors acknowledge the technical assistance of Nehal Sanghvi and Ben Sutton in the development of the Web application and related databases, and the support of the Chief Nursing Officer, Joyce Young, RN, PhD, the emergency department medical staff, Mohammad Salameh, MD, David Vandenberg, MD, and the surgical preparation center staff.
Disclosure: Nothing to report.
- , , , et al. Multifactorial index of cardiac risk in noncardiac surgical procedures. N Engl J Med. 1977;297:845–850.
- , . Methodological standards for the development of clinical decision rules in emergency medicine. Ann Emerg Med. 1999;33:437–447.
- , , , , . Mortality predictions on admission as a context for organizing care activities. J Hosp Med. 2013;8:229–235.
- , . The simple clinical score predicts mortality for 30 days after admission to an acute medical unit. QJM. 2006;99:771–781.
- , , , et al. Allocating scare resources in real‐time to reduce heart failure readmissions: a prospective, controlled study. BMJ Qual Saf. 2013;22:998–1005.
- , . Interventions to decrease hospital readmissions: keys for cost‐effectiveness. JAMA Intern Med. 2013;173:695–698.
- , , , et.al. A validated value‐based model to improve hospital‐wide perioperative outcomes. Ann Surg. 2010;252:486–498.
- , . Why is a good clinical prediction rule so hard to find? Arch Intern Med. 2011;171:1701–1702.
- , , , , , . Early detection of impending physiologic deterioration among patients who are not in intensive care: development of predictive models using data from an automated electronic medical record. J Hosp Med. 2012;7(5):388–395.
- , , . Predicting death: an empirical evaluation of predictive tools for mortality. Arch Intern Med. 2011;171:1721–1726.
- , , , , . Association of diagnostic coding with trends in hospitalizations and mortality of patients with pneumonia, 2003–2009. JAMA. 2012;307:1405–1413.
- Health Level Seven International website. Available at: http://www.hl7.org/. Accessed June 21, 2014.
- . Bounding sample size projections for the area under a ROC curve. J Stat Plan Inference. 2009;139:711–721.
- , , , , . Derivation and validation of a model to predict daily risk of death in hospital. Med Care. 2011;49:734–743.
The systematic deployment of prediction rules within health systems remains a challenge, although such decision aids have been available for decades.[1, 2] We previously developed and validated a prediction rule for 30‐day mortality in a retrospective cohort, noting that the mortality risk is associated with a number of other clinical events.[3] These relationships suggest risk strata, defined by the predicted probability of 30‐day mortality, and could trigger a number of coordinated care processes proportional to the level of risk.[4] For example, patients within the higher‐risk strata could be considered for placement into an intermediate or intensive care unit (ICU), be monitored more closely by physician and nurse team members for clinical deterioration, be seen by a physician within a few days of hospital discharge, and be considered for advance care planning discussions.[3, 4, 5, 6, 7] Patients within the lower‐risk strata might not need the same intensity of these processes routinely unless some other indication were present.
However attractive this conceptual framework may be, its realization is dependent on the willingness of clinical staff to generate predictions consistently on a substantial portion of the patient population, and on the accuracy of the predictions when the risk factors are determined with some level of uncertainty at the beginning of the hospitalization.[2, 8] Skepticism is justified, because the work involved in completing the prediction rule might be incompatible with existing workflow. A patient might not be scored if the emergency physician lacks time or if technical issues arise with the information system and computation process.[9] There is also a generic concern that the predictions will prove to be less accurate outside of the original study population.[8, 9, 10] A more specific concern for our rule is how well present on admission diagnoses can be determined during the relatively short emergency department or presurgery evaluation period. For example, a final diagnosis of heart failure might not be established until later in the hospitalization, after the results of diagnostic testing and clinical response to treatment are known. Moreover, our retrospective prediction rule requires an assessment of the presence or absence of sepsis and respiratory failure. These diagnoses appear to be susceptible to secular trends in medical record coding practices, suggesting the rule's accuracy might not be stable over time.[11]
We report the feasibility of having emergency physicians and the surgical preparation center team generate mortality predictions before an inpatient bed is assigned. We evaluate and report the accuracy of these prospective predictions.
METHODS
The study population consisted of all patients 18 years of age or less than 100 years who were admitted from the emergency department or assigned an inpatient bed following elective surgery at a tertiary, community teaching hospital in the Midwestern United States from September 1, 2012 through February 15, 2013. Although patients entering the hospital from these 2 pathways would be expected to have different levels of mortality risk, we used the original prediction rule for both because such distinctions were not made in its derivation and validation. Patients were not considered if they were admitted for childbirth or other obstetrical reasons, admitted directly from physician offices, the cardiac catheterization laboratory, hemodialysis unit, or from another hospital. The site institutional review board approved this study.
The implementation process began with presentations to the administrative and medical staff leadership on the accuracy of the retrospectively generated mortality predictions and risk of other adverse events.[3] The chief medical and nursing officers became project champions, secured internal funding for the technical components, and arranged to have 2 project comanagers available. A multidisciplinary task force endorsed the implementation details at biweekly meetings throughout the planning year. The leadership of the emergency department and surgical preparation center committed their colleagues to generate the predictions. The support of the emergency leadership was contingent on the completion of the entire prediction generating process in a very short time (within the time a physician could hold his/her breath). The chief medical officer, with the support of the leadership of the hospitalists and emergency physicians, made the administrative decision that a prediction must be generated prior to the assignment of a hospital room.
During the consensus‐building phase, a Web‐based application was developed to generate the predictions. Emergency physicians and surgical preparation staff were trained on the definitions of the risk factors (see Supporting Information, Appendix, in the online version of this article) and how to use the Web application. Three supporting databases were created. Each midnight, a past medical history database was updated, identifying those who had been discharged from the study hospital in the previous 365 days, and whether or not their diagnoses included atrial fibrillation, leukemia/lymphoma, metastatic cancer, cancer other than leukemia, lymphoma, cognitive disorder, or other neurological conditions (eg, Parkinson's, multiple sclerosis, epilepsy, coma, and stupor). Similarly, a clinical laboratory results database was created and updated real time through an HL7 (Health Level Seven, a standard data exchange format[12]) interface with the laboratory information system for the following tests performed in the preceding 30 days at a hospital‐affiliated facility: hemoglobin, platelet count, white blood count, serum troponin, blood urea nitrogen, serum albumin, serum lactate, arterial pH, arterial partial pressure of oxygen values. The third database, admission‐discharge‐transfer, was created and updated every 15 minutes to identify patients currently in the emergency room or scheduled for surgery. When a patient registration event was added to this database, the Web application created a record, retrieved all relevant data, and displayed the patient name for scoring. When the decision for hospitalization was made, the clinician selected the patient's name and reviewed the pre‐populated medical diagnoses of interest, which could be overwritten based on his/her own assessment (Figure 1A,B). The clinician then indicated (yes, no, or unknown) if the patient currently had or was being treated for each of the following: injury, heart failure, sepsis, respiratory failure, and whether or not the admitting service would be medicine (ie, nonsurgical, nonobstetrical). We considered unknown status to indicate the patient did not have the condition. When laboratory values were not available, a normal value was imputed using a previously developed algorithm.[3] Two additional questions, not used in the current prediction process, were answered to provide data for a future analysis: 1 concerning the change in the patient's condition while in the emergency department and the other concerning the presence of abnormal vital signs. The probability of 30‐day mortality was calculated via the Web application using the risk information supplied and the scoring weights (ie, parameter estimates) provided in the Appendices of our original publication.[3] Predictions were updated every minute as new laboratory values became available, and flagged with an alert if a more severe score resulted.
For the analyses of this study, the last prospective prediction viewed by emergency department personnel, a hospital bed manager, or surgical suite staff prior to arrival on the nursing unit is the one referenced as prospective. Once the patient had been discharged from the hospital, we generated a second mortality prediction based on previously published parameter estimates applied to risk factor data ascertained retrospectively as was done in the original article[3]; we subsequently refer to this prediction as retrospective. We will report on the group of patients who had both prospective and retrospective scores (1 patient had a prospective but not retrospective score available).
The prediction scores were made available to the clinical teams gradually during the study period. All scores were viewable by the midpoint of the study for emergency department admissions and near the end of the study for elective‐surgery patients. Only 2 changes in care processes based on level of risk were introduced during the study period. The first required initial placement of patients having a probability of dying of 0.3 or greater into an intensive or intermediate care unit unless the patient or family requested a less aggressive approach. The second occurred in the final 2 months of the study when a large multispecialty practice began routinely arranging for high‐risk patients to be seen within 3 or 7 days of hospital discharge.
Statistical Analyses
SAS version 9.3 (SAS Institute Inc., Cary, NC) was used to build the datasets and perform the analyses. Feasibility was evaluated by the number of patients who were candidates for prospective scoring with a score available at the time of admission. The validity was assessed with the primary outcome of death within 30 days from the date of hospital admission, as determined from hospital administrative data and the Social Security Death Index. The primary statistical metric is the area under the receiver operating characteristic curve (AROC) and the corresponding 95% Wald confidence limits. We needed some context for understanding the performance of the prospective predictions, assuming the accuracy could deteriorate due to the instability of the prediction rule over time and/or due to imperfect clinical information at the time the risk factors were determined. Accordingly, we also calculated an AROC based on retrospectively derived covariates (but using the same set of parameter estimates) as done in our original publication so we could gauge the stability of the original prediction rule. However, the motivation was not to determine whether retrospective versus prospective predictions were more accurate, given that only prospective predictions are useful in the context of developing real‐time care processes. Rather, we wanted to know if the prospective predictions would be sufficiently accurate for use in clinical practice. A priori, we assumed the prospective predictions should have an AROC of approximately 0.80. Therefore, a target sample size of 8660 hospitalizations was determined to be adequate to assess validity, assuming a 30‐day mortality rate of 5%, a desired lower 95% confidence boundary for the area under the prospective curve at or above 0.80, with a total confidence interval width of 0.07.[13] Calibration was assessed by comparing the actual proportion of patients dying (with 95% binomial confidence intervals) with the mean predicted mortality level within 5 percentile increments of predicted risk.
Risk Strata
We categorize the probability of 30‐day mortality into strata, with the understanding that the thresholds for defining these are a work in progress. Our hospital currently has 5 strata ranging from level 1 (highest mortality risk) to level 5 (lowest risk). The corresponding thresholds (at probabilities of death of 0.005, 0.02, 0.07, 0.20) were determined by visual inspection of the event rates and slope of curves displayed in Figure 1 of the original publication.[3]
Relationship to Secondary Clinical Outcomes of Interest
The choice of clinical care processes triggered per level of risk may be informed by understanding the frequency of events that increase with the mortality risk. We therefore examined the AROC from logistic regression models for the following outcomes using the prospectively generated probability as an explanatory variable: unplanned transfer to an ICU within the first 24 hours for patients not admitted to an ICU initially, ICU use at some point during the hospitalization, the development of a condition not present on admission (complication), receipt of palliative care by the end of the hospitalization, death during the hospitalization, 30‐day readmission, and death within 180 days. The definition of these outcomes and statistical approach used has been previously reported.[3]
RESULTS
Mortality predictions were generated on demand for 7291 out of 7777 (93.8%) eligible patients admitted from the emergency department, and for 2021 out of 2250 (89.8%) eligible elective surgical cases, for a total of 9312 predictions generated out of a possible 10,027 hospitalizations (92.9%). Table 1 displays the characteristics of the study population. The mean age was 65.2 years and 53.8% were women. The most common risk factors were atrial fibrillation (16.4%) and cancer (14.6%). Orders for a comfort care approach (rather than curative) were entered within 4 hours of admission for 32/9312 patients (0.34%), and 9/9312 (0.1%) were hospice patients on admission.
| Risk Factors | No. | Without Imputation | No. | With Imputation |
|---|---|---|---|---|
| ||||
| Clinical laboratory values within preceding 30 days | ||||
| Maximum serum blood urea nitrogen (mg/dL) | 8,484 | 22.7 (17.7) | 9,312 | 22.3 (16.9) |
| Minimum hemoglobin, g/dL, | 8,750 | 12.5 (2.4) | 9,312 | 12.4 (2.4) |
| Minimum platelet count, 1,000/UL | 8,737 | 224.1 (87.4) | 9,312 | 225.2 (84.7) |
| Maximum white blood count, 1,000/UL | 8,750 | 10.3 (5.8) | 9,312 | 10.3 (5.6) |
| Maximum serum lactate, mEq/L | 1,749 | 2.2 (1.8) | 9,312 | 0.7 (1.1) |
| Minimum serum albumin, g/dL | 4,057 | 3.4 (0.7) | 9,312 | 3.2 (0.5) |
| Minimum arterial pH | 509 | 7.36 (0.10) | 9,312 | 7.36 (0.02) |
| Minimum arterial pO2, mm Hg | 509 | 73.6 (25.2) | 9,312 | 98.6 (8.4) |
| Maximum serum troponin, ng/mL | 3,217 | 0.5 (9.3) | 9,312 | 0.2 (5.4) |
| Demographics and diagnoses | ||||
| Age, y | 9,312 | 65.2 (17.0) | ||
| Female sex | 9,312 | 5,006 (53.8%) | ||
| Previous hospitalization within past 365 days | 9,312 | 3,995 (42.9%) | ||
| Emergent admission | 9,312 | 7,288 (78.3%) | ||
| Admitted to a medicine service | 9,312 | 5,840 (62.7%) | ||
| Current or past atrial fibrillation | 9,312 | 1,526 (16.4%) | ||
| Current or past cancer without metastases, excluding leukemia or lymphoma | 9,312 | 1,356 (14.6%) | ||
| Current or past history of leukemia or lymphoma | 9,312 | 145 (1.6%) | ||
| Current or past metastatic cancer | 9,312 | 363 (3.9%) | ||
| Current or past cognitive deficiency | 9,312 | 844 (9.1%) | ||
| Current or past history of other neurological conditions (eg, Parkinson's disease, multiple sclerosis, epilepsy, coma, stupor, brain damage) | 9,312 | 952 (10.2%) | ||
| Injury such as fractures or trauma at the time of admission | 9,312 | 656 (7.0%) | ||
| Sepsis at the time of admission | 9,312 | 406 (4.4%) | ||
| Heart failure at the time of admission | 9,312 | 776 (8.3%) | ||
| Respiratory failure on admission | 9,312 | 557 (6.0%) | ||
| Outcomes of interest | ||||
| Unplanned transfer to an ICU (for those not admitted to an ICU) within 24 hours of admission | 8,377 | 86 (1.0%) | ||
| Ever in an ICU during the hospitalization | 9,312 | 1,267 (13.6%) | ||
| Development of a condition not present on admission (complication) | 9,312 | 834 (9.0%) | ||
| Within hospital mortality | 9,312 | 188 (2.0%) | ||
| Mortality within 30 days of admission | 9,312 | 466 (5.0%) | ||
| Mortality within 180 days of admission | 9,312 | 1,070 (11.5%) | ||
| Receipt of palliative care by the end of the hospitalization | 9,312 | 314 (3.4%) | ||
| Readmitted to the hospital within 30 days of discharge (patients alive at discharge) | 9,124 | 1,302 (14.3%) | ||
| Readmitted to the hospital within 30 days of discharge (patients alive on admission) | 9,312 | 1,302 (14.0%) | ||
Evaluation of Prediction Accuracy
The AROC for 30‐day mortality was 0.850 (95% confidence interval [CI]: 0.833‐0.866) for prospectively collected covariates, and 0.870 (95% CI: 0.855‐0.885) for retrospectively determined risk factors. These AROCs are not substantively different from each other, demonstrating comparable prediction performance. Calibration was excellent, as indicated in Figure 2, in which the predicted level of risk lay within the 95% confidence limits of the actual 30‐day mortality for 19 out of 20 intervals of 5 percentile increments.
Relationship to Secondary Clinical Outcomes of Interest
The relationship between the prospectively generated probability of dying within 30 days and other events is quantified by the AROC displayed in Table 2. The 30‐day mortality risk has a strong association with the receipt of palliative care by hospital discharge, in‐hospital mortality, and 180‐day mortality, a fair association with the risk for 30‐day readmissions and unplanned transfers to intensive care, and weak associations with receipt of intensive unit care ever within the hospitalization or the development of a new diagnosis that was not present on admission (complication). The frequency of these events per mortality risk strata is shown in Table 3. The level 1 stratum contains a higher frequency of these events, whereas the level 5 stratum contains relatively few, reflecting the Pareto principle by which a relatively small proportion of patients contribute a disproportionate frequency of the events of interest.
| |
| In‐hospital mortality | 0.841 (0.8140.869) |
| 180day mortality | 0.836 (0.8250.848) |
| Receipt of palliative care by discharge | 0.875 (0.8580.891) |
| 30day readmission (patients alive at discharge) | 0.649 (0.6340.664) |
| Unplanned transfer to an ICU (for those not admitted to an ICU) within 24 hours | 0.643 (0.5900.696) |
| Ever in an ICU during the hospitalization | 0.605 (0.5880.621) |
| Development of a condition not present on admission (complication) | 0.555 (0.5350.575) |
| Risk Strata | 30‐Day Mortality, Count/Cases (%) | Unplanned Transfers to ICU Within 24 Hours, Count/Cases (%) | Diagnosis Not Present on Admission, Complication, Count/Cases (%) | Palliative Status at Discharge, Count/Cases (%) | Death in Hospital, Count/Cases (%) |
|---|---|---|---|---|---|
| Risk Strata | Ever in ICU, Count/Cases (%) | 30‐Day Readmission, Count/Cases (%) | Death or Readmission Within 30 Days, Count/Cases (%) | 180‐Day Mortality, Count/Cases (%) | |
| |||||
| 1 | 155/501 (30.9%) | 6/358 (1.7%) | 58/501 (11.6%) | 110/501 (22.0%) | 72/501 (14.4%) |
| 2 | 166/1,316 (12.6%) | 22/1,166 (1.9%) | 148/1,316 (11.3%) | 121/1,316 (9.2%) | 58/1,316 (4.4%) |
| 3 | 117/2,977 (3.9%) | 35/2,701 (1.3%) | 271/2,977 (9.1%) | 75/2,977 (2.5%) | 43/2,977 (1.4%) |
| 4 | 24/3,350 (0.7%) | 20/3,042 (0.7%) | 293/3,350 (8.8%) | 6/3,350 (0.2%) | 13/3,350 (0.4%) |
| 5 | 4/1,168 (0.3%) | 3/1,110 (0.3%) | 64/1,168 (5.5%) | 2/1,168 (0.2%) | 2/1,168 (0.2%) |
| Total | 466/9,312 (5.0%) | 86/8,377 (1.0%) | 834/9,312 (9.0%) | 314/9,312 (3.4%) | 188/9,312 (2.0%) |
| 1 | 165/501 (32.9%) | 106/429 (24.7%) | 243/501 (48.5%) | 240/501 (47.9%) | |
| 2 | 213/1,316 (16.2%) | 275/1,258 (21.9%) | 418/1,316 (31.8%) | 403/1,316 (30.6%) | |
| 3 | 412/2,977 (13.8%) | 521/2,934 (17.8%) | 612/2,977 (20.6%) | 344/2,977 (11.6%) | |
| 4 | 406/3,350 (12.1%) | 348/3,337 (10.4%) | 368/3,350 (11.0%) | 77/3,350 (2.3%) | |
| 5 | 71/1,168 (6.1%) | 52/1,166 (4.5%) | 56/1,168 (4.8%) | 6/1,168 (0.5%) | |
| Total | 1,267/9,312 (13.6%) | 1,302/9,124 (14.3%) | 1,697/9,312 (18.2%) | 1,070/9,312 (11.5%) | |
DISCUSSION
Emergency physicians and surgical preparation center nurses generated predictions by the time of hospital admission for over 90% of the target population during usual workflow, without the addition of staff or resources. The discrimination of the prospectively generated predictions was very good to excellent, with an AROC of 0.850 (95% CI: 0.833‐0.866), similar to that obtained from the retrospective version. Calibration was excellent. The prospectively calculated mortality risk was associated with a number of other events. As shown in Table 3, the differing frequency of events within the risk strata support the development of differing intensities of multidisciplinary strategies according to the level of risk.[5] Our study provides useful experience for others who anticipate generating real‐time predictions. We consider the key reasons for success to be the considerable time spent achieving consensus, the technical development of the Web application, the brief clinician time required for the scoring process, the leadership of the chief medical and nursing officers, and the requirement that a prediction be generated before assignment of a hospital room.
Our study has a number of limitations, some of which were noted in our original publication, and although still relevant, will not be repeated here for space considerations. This is a single‐site study that used a prediction rule developed by the same site, albeit on a patient population 4 to 5 years earlier. It is not known how well the specific rule might perform in other hospital populations; any such use should therefore be accompanied by independent validation studies prior to implementation. Our successful experience should motivate future validation studies. Second, because the prognoses of patients scored from the emergency department are likely to be worse than those of elective surgery patients, our rule should be recalibrated for each subgroup separately. We plan to do this in the near future, as well as consider additional risk factors. Third, the other events of interest might be predicted more accurately if rules specifically developed for each were deployed. The mortality risk by itself is unlikely to be a sufficiently accurate predictor, particularly for complications and intensive care use, for reasons outlined in our original publication.[3] However, the varying levels of events within the higher versus lower strata should be noted by the clinical team as they design their team‐based processes. A follow‐up visit with a physician within a few days of discharge could address the concurrent risk of dying as well as readmission, for example. Finally, it is too early to determine if the availability of mortality predictions from this rule will benefit patients.[2, 8, 10] During the study period, we implemented only 2 new care processes based on the level of risk. This lack of interventions allowed us to evaluate the prediction accuracy with minimal additional confounding, but at the expense of not yet knowing the clinical impact of this work. After the study period, we implemented a number of other interventions and plan on evaluating their effectiveness in the future. We are also considering an evaluation of the potential information gained by updating the predictions throughout the course of the hospitalization.[14]
In conclusion, it is feasible to have a reasonably accurate prediction of mortality risk for most adult patients at the beginning of their hospitalizations. The availability of this prognostic information provides an opportunity to develop proactive care plans for high‐ and low‐risk subsets of patients.
Acknowledgements
The authors acknowledge the technical assistance of Nehal Sanghvi and Ben Sutton in the development of the Web application and related databases, and the support of the Chief Nursing Officer, Joyce Young, RN, PhD, the emergency department medical staff, Mohammad Salameh, MD, David Vandenberg, MD, and the surgical preparation center staff.
Disclosure: Nothing to report.
- , , , et al. Multifactorial index of cardiac risk in noncardiac surgical procedures. N Engl J Med. 1977;297:845–850.
- , . Methodological standards for the development of clinical decision rules in emergency medicine. Ann Emerg Med. 1999;33:437–447.
- , , , , . Mortality predictions on admission as a context for organizing care activities. J Hosp Med. 2013;8:229–235.
- , . The simple clinical score predicts mortality for 30 days after admission to an acute medical unit. QJM. 2006;99:771–781.
- , , , et al. Allocating scare resources in real‐time to reduce heart failure readmissions: a prospective, controlled study. BMJ Qual Saf. 2013;22:998–1005.
- , . Interventions to decrease hospital readmissions: keys for cost‐effectiveness. JAMA Intern Med. 2013;173:695–698.
- , , , et.al. A validated value‐based model to improve hospital‐wide perioperative outcomes. Ann Surg. 2010;252:486–498.
- , . Why is a good clinical prediction rule so hard to find? Arch Intern Med. 2011;171:1701–1702.
- , , , , , . Early detection of impending physiologic deterioration among patients who are not in intensive care: development of predictive models using data from an automated electronic medical record. J Hosp Med. 2012;7(5):388–395.
- , , . Predicting death: an empirical evaluation of predictive tools for mortality. Arch Intern Med. 2011;171:1721–1726.
- , , , , . Association of diagnostic coding with trends in hospitalizations and mortality of patients with pneumonia, 2003–2009. JAMA. 2012;307:1405–1413.
- Health Level Seven International website. Available at: http://www.hl7.org/. Accessed June 21, 2014.
- . Bounding sample size projections for the area under a ROC curve. J Stat Plan Inference. 2009;139:711–721.
- , , , , . Derivation and validation of a model to predict daily risk of death in hospital. Med Care. 2011;49:734–743.
© 2014 Society of Hospital Medicine
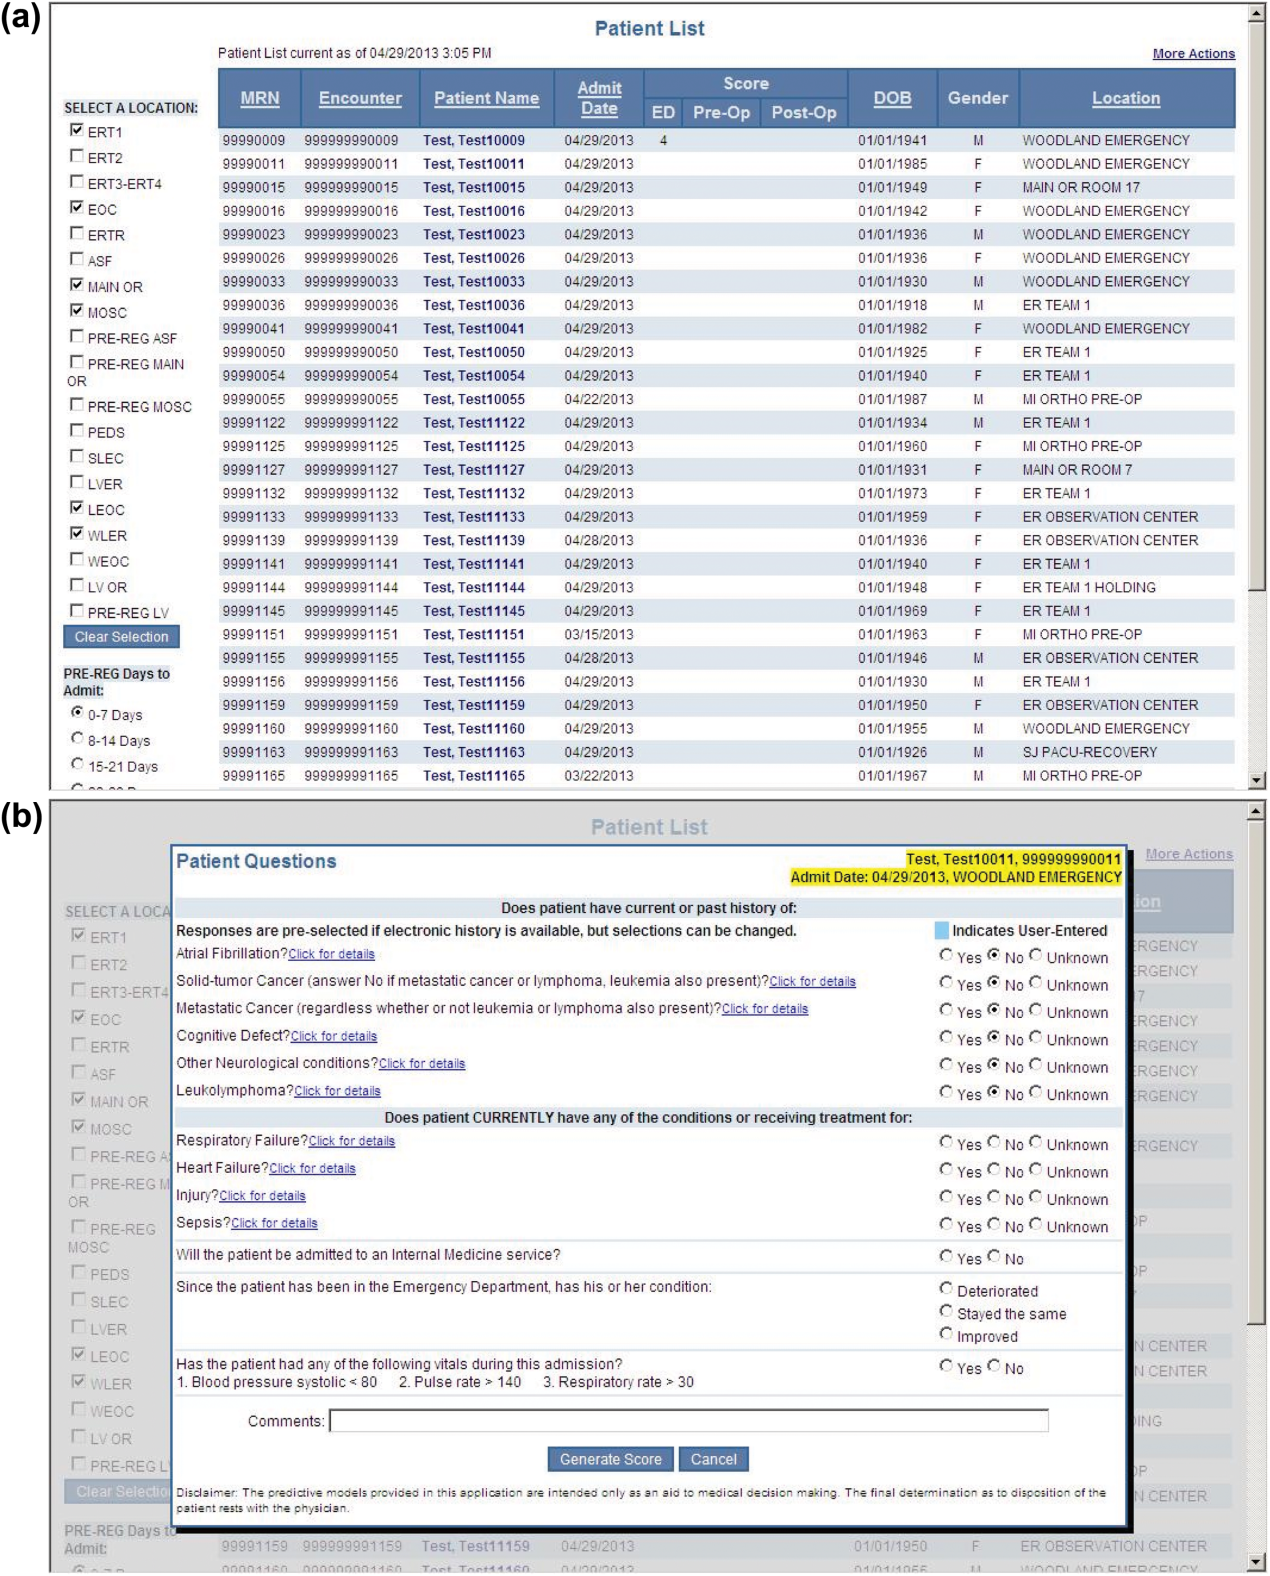
Method could speed up cancer diagnosis

Credit: NIGMS
A new technique could enable faster diagnosis of cancer and various prenatal conditions, according to a paper published in Proceedings of the National Academy of Sciences.
The method, known as convex lens-induced confinement (CLIC), allows researchers to load long strands of DNA into a tunable, nanoscale imaging chamber in ways that maintain their structural identity and under conditions that are similar to those in the human body.
CLIC lets researchers map large genomes rapidly and identify specific gene sequences from single cells with single-molecule resolution, a process that is critical to diagnosing diseases like cancer.
“Current practices of genomic analysis typically require tens of thousands of cells worth of genomic material to obtain the information we need, but this new approach works with single cells,” said study author Rob Sladek, MD, of McGill University in Montreal, Canada.
“CLIC will allow researchers to avoid having to spend time stitching together maps of entire genomes, as we do under current techniques, and promises to make genomic analysis a much simpler and more efficient process.”
The CLIC imaging chamber can sit on top of a standard inverted fluorescence microscope, and strands of DNA can be loaded into the chamber from above, which allows the strands to maintain their integrity.
Existing tools used for genomic analysis rely on side-loading DNA under pressure into nanochannels in the imaging chamber. This breaks the DNA molecules into small pieces, making it a challenge to reconstruct the genome.
CLIC, on the other hand, is “like squeezing many soft spaghetti noodles into long, narrow tubes without breaking them,” according to study author Sabrina Leslie, PhD, also of McGill University.
“Once these long strands of DNA are gently squeezed down into nanochannels from a nanoscale bath above, they become effectively rigid, which means that we can map positions along uniformly stretched strands of DNA, while holding them still,” she said.
“This means diagnostics can be performed quickly, one cell at a time, which is critical for diagnosing many prenatal conditions and the onset of cancer.” ![]()
Drug gets fast track designation for MF

Credit: Peter Anderson
The US Food and Drug Administration (FDA) is expediting its review of pacritinib, a tyrosine kinase inhibitor with activity against JAK2 and FLT3, by granting the drug fast track designation.
Pacritinib is under review as a treatment for patients with intermediate- and high-risk myelofibrosis (MF), including those with disease-related or treatment-induced thrombocytopenia and those who cannot tolerate or do not respond well to other JAK2 therapy.
The FDA’s fast track process is designed to expedite the review of drugs to treat serious conditions and fill an unmet medical need.
The program enables a company—in this case, CTI BioPharma—to submit sections of a new drug application on a rolling basis as data becomes available.
That way, the FDA can review sections of the application as they are received, rather than waiting until every section of the application is completed before the entire application can be reviewed. This often leads to faster approval.
Pacritinib is currently under investigation in two phase 3 clinical trials, known as the PERSIST program, for patients with MF.
One of these trials, known as PERSIST-1, includes a broad set of patients without limitations on platelet counts. The other, PERSIST-2, includes patients with low platelet counts.
PERSIST-1
In July 2014, CTI Biopharma completed enrollment in the PERSIST-1 trial, which was designed to enroll approximately 320 patients.
This randomized trial was designed to compared the efficacy and safety of pacritinib with that of best available therapy, other than JAK inhibitors, in patients with primary MF, post-polycythemia vera MF, or post-essential thrombocythemia MF, without exclusion for low platelet counts.
The primary endpoint is the percentage of patients achieving at least a 35% reduction in spleen volume, measured by MRI or CT from baseline to 24 weeks of treatment.
PERSIST-2
In March 2014, CTI announced the initiation of the PERSIST-2 trial, a comparison of pacritinib and best available therapy, including approved JAK2 inhibitors that are dosed according to product label, in patients with MF whose platelet counts are 100,000/uL or lower.
The trial is designed to enroll up to 300 patients in North America, Europe, Australia, and New Zealand. In October 2013, CTI reached agreement with the FDA on a special protocol assessment for the trial, a written agreement between CTI and the FDA regarding the planned design, endpoints, and statistical analysis approach of the trial to be used in support of a potential new drug application.
Under the special protocol assessment, the trial will have two primary endpoints. The first is the percentage of patients achieving a 35% or greater reduction in spleen volume, measured by MRI or CT scan from baseline to 24 weeks of treatment.
The second primary endpoint is the percentage of patients achieving a total symptom score reduction of 50% or greater using 6 key symptoms, as measured by the modified Myeloproliferative Neoplasm Symptom Assessment (MPN-SAF TSS 2.0) diary from baseline to 24 weeks.
More details on the PERSIST-1 and PERSIST-2 trials can be found at www.clinicaltrials.gov. ![]()
ACIP and 2014 flu vaccine
The effectiveness of influenza vaccine is recognized to vary widely from season to season. At least two factors are critical for determining the likelihood that flu vaccine will be successful in preventing illness.
First, the demographics of who is being immunized (primarily age and presence of comorbidity) and second, the "match" between the circulating flu viruses and that year’s flu vaccine. When the flu vaccine is a poor match with circulating viruses, less benefit from flu vaccination will be observed; in years when the "match" between vaccine and circulating virus is good, substantial reduction in influenza respiratory illness in children and adults is observed. Recently, a second influenza B antigen has been added (creating quadrivalent vaccines) to improve the match with influenza B strains that may circulate in the community.

In February 2014, the Centers for Disease Control and Prevention reported midseason vaccine effectiveness estimates (MMWR 2014 Feb 21;63:137-42).
The major circulating virus was influenza A "2009 H1N1" virus and the "match" between vaccine strains and circulating strains was considered good. The CDC’s midseason vaccine effectiveness estimate was 61% for all age groups (95% confidence interval, 52%-68%), reinforcing the value of influenza vaccine for disease prevention in both children and adults. Flu vaccine reduced the risk of seeking medical attention for flulike illness by 60% for both children and adults.
Another factor that may determine the effectiveness of influenza vaccine in children is whether the individual receives live attenuated influenza vaccine (LAIV) or trivalent or quadrivalent inactivated influenza vaccine (IIV). The CDC has been considering the question "should LAIV be recommended preferentially over IIV in healthy children 2-8 years of age?" based on data from a limited number of studies. Canada, United Kingdom, Israel, and Germany have each expressed a preference for LAIV in their recent recommendations. The CDC working group evaluated published studies primarily restricted to those focused on healthy children, those with both LAIV and IIV cohorts, those studying the U.S. licensed and similar vaccines, and those in English. Their literature review identified five randomized trials and five additional observational studies. Lab-confirmed influenza in symptomatic children was the primary outcome; influenza related mortality and hospitalization also were considered.
The efficacy of LAIV was originally established in four randomized, placebo-controlled clinical trials. Each study was completed over two influenza seasons.
In the Belshe study (N. Engl. J. Med. 1998;338:1405-12), the efficacy compared with placebo was 93% in the first season and 100% in the second (after revaccination).
In a second study (Pediatrics 2006;118:2298-312), efficacy compared to placebo was 85% in the first season and 89% in the second (after revaccination).
Subsequently, randomized studies comparing LAIV with IIV in children younger than 8 years of age demonstrating the relative benefits of LAIV were reported (N. Engl. J. Med. 2007;356:685-96; Pediatr. Infect. Dis. J. 2006 ;25:870-9). A reduction greater than or equal to 50% in laboratory-confirmed influenza cases in the LAIV cohorts compared with the trivalent inactivated vaccine groups was observed. Greater efficacy was reported both in groups that were influenza vaccine naive as well as those with prior immunization. No reductions in hospitalization and medically-attended acute respiratory illness were reported for the LAIV cohorts; however, the quality of the data was judged to be less robust than for laboratory-confirmed disease. For children aged 9-18 years, no differences in laboratory-confirmed influenza were reported.
The mechanism for improved efficacy of LAIV in young children (2-8 years) is largely unknown. LAIV may elicit long-lasting and broader humoral and cellular responses that more closely resembles natural immunity. It also has been hypothesized that LAIV is more immunogenic than IIV as a priming vaccine, and IIV is more effective in boosting preexisting immunity. It is possible that is one explanation for why LAIV is more effective in young children, and that no differences are observed in older children and adults. It also has been suggested that LAIV may elicit an antibody that is more broadly protective against mismatched influenza strains.
In June, the Advisory Committee on Immunization Practices (ACIP) proposed new recommendations regarding the use of LAIV and IIV for young healthy children. ACIP affirmed that both LAIV and IIV are effective in prevention of influenza in children, but recommended that LAIV be used for healthy children aged 2-8 years when both vaccines are available and there are no contraindications or precautions to its use. When LAIV is not immediately available, IIV should be used. Vaccination should not be delayed to procure LAIV.
ACIP restated previous contraindications and precautions to administration of LAIV. Those with contraindications to LAIV should receive inactivated vaccine. These include:
• Children less than 2 years of age and adults older than 49 years of age.
• Children aged 2-17 years receiving aspirin, persons with allergic reactions to vaccine or vaccine components, pregnant women, immunosuppressed persons, and persons with egg allergy.
• Children aged 2-4 years who have had a wheezing episode noted in the medical record or whose parents report that a health care provider informed them of wheezing or asthma within the last 12 months.
• Individuals who have taken antiviral medications within the previous 48 hours.
Administration to children less than 8 years of age with chronic medical conditions (specifically those associated with increased risk of influenza complications) is considered a precaution as safety has not been established.
Immunization for all children beginning at 6 months of age is still the essential message. However, when both LAIV and IIV (trivalent [TIV] or quadrivalent inactivated influenza vaccines [QIV]) are available, the advisory committee recommended LAIV as a preference in healthy children aged 2-8 years. If only TIV or QIV is available, administration of either one is recommended as delays in receipt are of greater concern than are the differences in vaccine formulations. This recommendation, if approved by the CDC director, will not be official until it is published in the 2014-2015 influenza prevention and control recommendations in the MMWR. In anticipation of this new recommendation, the manufacturer has stated that it will be producing 18 million doses of quadrivalent LAIV for the U.S. market for the 2014-2015 season, up from the 13 million it produced last season. More information when available also will be posted on the CDC influenza website and the American Academy of Pediatrics website.
Dr. Pelton is chief of pediatric infectious disease and coordinator of the maternal-child HIV program at Boston Medical Center. He said that he had no relevant financial disclosures.
The effectiveness of influenza vaccine is recognized to vary widely from season to season. At least two factors are critical for determining the likelihood that flu vaccine will be successful in preventing illness.
First, the demographics of who is being immunized (primarily age and presence of comorbidity) and second, the "match" between the circulating flu viruses and that year’s flu vaccine. When the flu vaccine is a poor match with circulating viruses, less benefit from flu vaccination will be observed; in years when the "match" between vaccine and circulating virus is good, substantial reduction in influenza respiratory illness in children and adults is observed. Recently, a second influenza B antigen has been added (creating quadrivalent vaccines) to improve the match with influenza B strains that may circulate in the community.
In February 2014, the Centers for Disease Control and Prevention reported midseason vaccine effectiveness estimates (MMWR 2014 Feb 21;63:137-42).
The major circulating virus was influenza A "2009 H1N1" virus and the "match" between vaccine strains and circulating strains was considered good. The CDC’s midseason vaccine effectiveness estimate was 61% for all age groups (95% confidence interval, 52%-68%), reinforcing the value of influenza vaccine for disease prevention in both children and adults. Flu vaccine reduced the risk of seeking medical attention for flulike illness by 60% for both children and adults.
Another factor that may determine the effectiveness of influenza vaccine in children is whether the individual receives live attenuated influenza vaccine (LAIV) or trivalent or quadrivalent inactivated influenza vaccine (IIV). The CDC has been considering the question "should LAIV be recommended preferentially over IIV in healthy children 2-8 years of age?" based on data from a limited number of studies. Canada, United Kingdom, Israel, and Germany have each expressed a preference for LAIV in their recent recommendations. The CDC working group evaluated published studies primarily restricted to those focused on healthy children, those with both LAIV and IIV cohorts, those studying the U.S. licensed and similar vaccines, and those in English. Their literature review identified five randomized trials and five additional observational studies. Lab-confirmed influenza in symptomatic children was the primary outcome; influenza related mortality and hospitalization also were considered.
The efficacy of LAIV was originally established in four randomized, placebo-controlled clinical trials. Each study was completed over two influenza seasons.
In the Belshe study (N. Engl. J. Med. 1998;338:1405-12), the efficacy compared with placebo was 93% in the first season and 100% in the second (after revaccination).
In a second study (Pediatrics 2006;118:2298-312), efficacy compared to placebo was 85% in the first season and 89% in the second (after revaccination).
Subsequently, randomized studies comparing LAIV with IIV in children younger than 8 years of age demonstrating the relative benefits of LAIV were reported (N. Engl. J. Med. 2007;356:685-96; Pediatr. Infect. Dis. J. 2006 ;25:870-9). A reduction greater than or equal to 50% in laboratory-confirmed influenza cases in the LAIV cohorts compared with the trivalent inactivated vaccine groups was observed. Greater efficacy was reported both in groups that were influenza vaccine naive as well as those with prior immunization. No reductions in hospitalization and medically-attended acute respiratory illness were reported for the LAIV cohorts; however, the quality of the data was judged to be less robust than for laboratory-confirmed disease. For children aged 9-18 years, no differences in laboratory-confirmed influenza were reported.
The mechanism for improved efficacy of LAIV in young children (2-8 years) is largely unknown. LAIV may elicit long-lasting and broader humoral and cellular responses that more closely resembles natural immunity. It also has been hypothesized that LAIV is more immunogenic than IIV as a priming vaccine, and IIV is more effective in boosting preexisting immunity. It is possible that is one explanation for why LAIV is more effective in young children, and that no differences are observed in older children and adults. It also has been suggested that LAIV may elicit an antibody that is more broadly protective against mismatched influenza strains.
In June, the Advisory Committee on Immunization Practices (ACIP) proposed new recommendations regarding the use of LAIV and IIV for young healthy children. ACIP affirmed that both LAIV and IIV are effective in prevention of influenza in children, but recommended that LAIV be used for healthy children aged 2-8 years when both vaccines are available and there are no contraindications or precautions to its use. When LAIV is not immediately available, IIV should be used. Vaccination should not be delayed to procure LAIV.
ACIP restated previous contraindications and precautions to administration of LAIV. Those with contraindications to LAIV should receive inactivated vaccine. These include:
• Children less than 2 years of age and adults older than 49 years of age.
• Children aged 2-17 years receiving aspirin, persons with allergic reactions to vaccine or vaccine components, pregnant women, immunosuppressed persons, and persons with egg allergy.
• Children aged 2-4 years who have had a wheezing episode noted in the medical record or whose parents report that a health care provider informed them of wheezing or asthma within the last 12 months.
• Individuals who have taken antiviral medications within the previous 48 hours.
Administration to children less than 8 years of age with chronic medical conditions (specifically those associated with increased risk of influenza complications) is considered a precaution as safety has not been established.
Immunization for all children beginning at 6 months of age is still the essential message. However, when both LAIV and IIV (trivalent [TIV] or quadrivalent inactivated influenza vaccines [QIV]) are available, the advisory committee recommended LAIV as a preference in healthy children aged 2-8 years. If only TIV or QIV is available, administration of either one is recommended as delays in receipt are of greater concern than are the differences in vaccine formulations. This recommendation, if approved by the CDC director, will not be official until it is published in the 2014-2015 influenza prevention and control recommendations in the MMWR. In anticipation of this new recommendation, the manufacturer has stated that it will be producing 18 million doses of quadrivalent LAIV for the U.S. market for the 2014-2015 season, up from the 13 million it produced last season. More information when available also will be posted on the CDC influenza website and the American Academy of Pediatrics website.
Dr. Pelton is chief of pediatric infectious disease and coordinator of the maternal-child HIV program at Boston Medical Center. He said that he had no relevant financial disclosures.

Study challenges traditional cancer classification

a tumor sample in a test tube
Credit: Rhoda Baer
Defining cancers by molecular criteria rather than their tissue of origin can provide patients with more accurate diagnoses, researchers have reported in Cell.
The group analyzed the molecular characteristics of more than 3500 samples of 12 different cancers and reclassified them according to the new information.
For 5 of the cancer types, including acute myeloid leukemia (AML), the molecular classification largely matched the tissue-of-origin classification.
For the remaining malignancies, that was not the case.
“This genomic study not only challenges our existing system of classifying cancers based on tissue type, but also provides a massive new data resource for further exploration, as well as a comprehensive list of the molecular features distinguishing each of the newly described cancer classes,” said study author Christopher Benz, MD, of the University of California, San Francisco.
The researchers said each molecular subtype they identified may reflect tumors arising from distinct cell types. For example, the data showed a marked difference between cancers of epithelial and non-epithelial origins.
“We think the subtypes reflect, primarily, the cell of origin,” said study author Joshua Stuart, PhD, of the University of California, Santa Cruz.
“Another factor is the nature of the genomic lesion, and third is the microenvironment of the cell and how surrounding cells influence it. We are disentangling the signals from these different factors so we can gauge each one for its prognostic power.”
Identifying molecular subtypes
The researchers performed an integrative analysis using 5 genome-wide platforms and 1 proteomic platform on 3527 specimens from 12 cancer types.
This included AML, glioblastoma multiforme, serous ovarian carcinoma, colon and rectal adenocarcinomas, lung squamous cell carcinoma, breast cancer, endometrial cancer, renal cell carcinoma, bladder urothelial adenocarcinoma, lung adenocarcinoma, and head and neck squamous cell carcinoma.
The group’s analyses allowed them to classify these cancer types into 11 major cellular/molecular subtypes. Two of the initial 13 subtypes (numbers 11 and 12) were eliminated from further analysis because they included fewer than 10 samples.
Five of the classification types—C5-renal cell carcinoma, C6-endometrial cancer, C9-serous ovarian carcinoma, C10-glioblastoma multiforme, and C13-AML—showed near 1-to-1 relationships with the tissue site of origin. However, there were a few cases of reclassification here and there, such as a case of breast cancer that fell in the AML subtype.
Another subtype stayed pretty true to its tissues of origin. C7-colon adenocarcinoma/rectal adenocarcinoma was composed mainly of colon and rectal adenocarcinomas but also included a case of endometrial cancer.
The C1-lung adenocarcinoma-enriched subtype was predominantly composed of non-small cell lung adenocarcinoma samples. But it also included cases of bladder cancer, breast cancer, colon adenocarcinoma, glioblastoma multiforme, head and neck squamous cell carcinoma, renal cell carcinoma, lung squamous cell carcinoma , serous ovarian carcinoma, and endometrial cancer.
The C2-squamous-like subtype consisted largely of head and neck squamous cell carcinoma and lung squamous cell carcinoma but also included bladder urothelial adenocarcinoma and breast cancer.
Breast cancers were further divided into the C3-breast cancer/luminal subtype and the C4-breast cancer/basal subtype. The C4 subtype also included lung adenocarcinoma and lung squamous cell carcinoma.
The researchers noted that breast cancers were present in 7 of the subtype classifications. And while this study confirmed known differences between the subtypes of breast cancer, the team was surprised to discover that basal-like breast cancers actually constitute their own cancer class.
“Even though these basal-like cancers arise in the breast, on the molecular level, they have more in common with ovarian cancers and cancers of squamous-cell origin than with other subtypes of breast cancer,” said study author Christina Yau, PhD, of the University of California, San Francisco.
Like breast cancers, bladder cancers were present in 7 of the subtype classifications. There were 1 or 2 cases in C5, C10, C11, and C12. But most bladder cancer samples fell into 1 of 3 categories: C1-lung adenocarcinoma-enriched, C2-squamous-like, and C8-bladder urothelial adenocarcinoma.
Although the C8-bladder urothelial adenocarcinoma subtype consisted largely of bladder cancer, it also included breast cancer, head and neck squamous cell carcinoma, lung adenocarcinoma, and lung squamous cell carcinoma.
These findings may help explain why patients with bladder cancer “often respond very differently when treated with the same systemic therapy for their seemingly identical cancer type,” Dr Benz said.
In fact, the researchers found the bladder cancers that clustered with other tumor types had a worse prognosis.
Next steps
The researchers noted that follow-up studies are needed to validate these findings, but this analysis lays the groundwork for classifying tumors into molecularly defined subtypes. The new classification scheme could be used to enroll patients in clinical trials and could lead to different treatment options based on molecular subtypes.
“We can now say what the telltale signatures of the subtypes are, so you can classify a patient’s tumor just based on the gene expression data, or just based on mutation data, if that’s what you have,” Dr Stuart said. “Having a molecular map like this could help get a patient into the right clinical trial.”
The researchers believe the percentage of tumors that should be reclassified based on molecular signatures is likely to grow as more samples and tumor types are analyzed. This study suggested that 1 in 10 cancers could be reclassified in clinically meaningful ways, but the researchers said their next analysis will include 21 tumor types instead of 12.
“We’re just appreciating the tip of the iceberg when considering the potential of this multiplatform type of genomic analysis,” Dr Benz said. “It could be that as many as 30% or 50% of cancers need to be reclassified.”
The data sets and results from this study have been made available to other researchers through the Synapse website. ![]()
Two new tests can detect CJD

Credit: Elise Amendola
Two groups of scientists have developed new tests to diagnose Creutzfeldt-Jakob disease (CJD).
One test uses samples collected from nasal passages to detect sporadic CJD, and the other uses urine samples to identify variant CJD.
The researchers said these tests provide simple methods for differentiating CJD from other diseases and could help prevent the transmission of CJD via blood
transfusions, transplants, or contaminated surgical instruments.
Both tests are described in The New England Journal of Medicine.
Nasal test for sporadic CJD
In one NEJM article, Byron Caughey, PhD, of the National Institute of Allergy and Infectious Diseases in Rockville, Maryland, and his colleagues detailed their results with the nasal test.
The researchers collected 31 nasal samples from patients with sporadic CJD and 43 samples from patients who had other neurologic diseases or no neurologic disease. The team brushed the inside of a subject’s nose to collect olfactory neurons connected to the brain.
Testing these samples allowed the researchers to correctly identify 30 of the 31 sporadic CJD patients (97% sensitivity). The tests also correctly showed negative results for all 43 of the non-CJD patients (100% specificity).
By comparison, tests using cerebral spinal fluid, which is currently used to detect sporadic CJD, were 77% sensitive and 100% specific. And these results took twice as long to obtain.
While continuing to validate the new testing method in CJD patients, the scientists are looking to expand their research to diagnose forms of prion diseases in sheep, cattle, and wildlife. The team also hopes to replace the nasal brush with an even simpler swabbing approach.
Urine test for variant CJD
In another NEJM article, Fabio Moda, PhD, of the University of Texas Medical School at Houston, and his colleagues described results observed with their urine test.
The team noted that the infectious agent in transmissible spongiform encephalopathies appears to be composed exclusively of the misfolded form of the prion protein, PrPSc. So they set out to determine if they could detect PrPSc in the urine of patients with CJD.
The researchers analyzed urine samples from healthy individuals (n=52) and patients with variant CJD (n=68), sporadic CJD (n=14), genetic forms of prion disease (n=4), other neurodegenerative disorders (n=50), and nondegenerative neurologic disorders (n=50).
The group found they could only detect PrPSc in samples from patients with variant CJD. They found “minute quantities” of PrPSc in 13 of the 14 urine samples from variant CJD patients, but PrPSc was not present in any of the samples from the other patients or the healthy individuals.
This suggests the test has a sensitivity of 92.9% and a specificity of 100%. ![]()