User login
Battling Multidrug Resistant UTIs With Methenamine Hippurate
Recently, Federal Practitioner talked with Rebecca McAllister, MS, FNP-BC, about her role in treating complicated urinary tract infections (UTIs) in elderly patients at the Community Living Center of the Bay Pines VA Healthcare System in Florida. The original July 2014 Case in Point, “Recurrent Multidrug Resistant Urinary Tract Infections in Geriatric Patients,” discussed 4 case studies, which suggested the safety and efficacy of treatment with methenamine hippurate.
Federal Practitioner: Much of the focus in your article was on the use of methenamine in Norway and Sweden and a lack thereof in the U.S. How are multidrug resistant UTIs generally treated in the U.S., and how could this be handled differently?
Rebecca McAllister, MS, FNP-BC: Because of the increased rates of bacterial resistance, treating recurrent UTIs prophylactically with low-dose antibiotics is no longer the standard of care. Currently, multidrug resistant UTIs are treated with broad-spectrum antibiotics, that organisms are susceptible to. The promise of methenamine relies on the bacteria not developing resistance to it; in turn, long-term use in patients does not contribute to developing resistance.
FP: Is methenamine hippurate readily available within the VA, and what are the guidelines surrounding its use?
RM: Methenamine is on the VA formulary available in 1-gm doses. Standard guidelines per Micromedex are for prophylaxis of recurrent UTIs, as mentioned in the article, and contraindicates use in patients with impaired renal function, although specific parameters are not identified, because testing was never done with geriatric patients.
FP: Of the 4 patients discussed in the article, 3 were aged > 89 years and the fourth was aged exactly 89 years. Was this a coincidence, or does the success of methenamine in this oldest-old cohort highlight UTI recurrence rate late in life, the failed efficacy of other drugs over time, or both?
RM: The success of methenamine highlights both UTI recurrence rate late in life and the failed efficacy of other drugs over time. The primary patient group in these case studies was composed of homebound veterans.
FP: At the beginning of the discussion portion of your article, following 4 case studies, you mention, “Patients with similar profiles to those discussed in this report were treated with less dramatic results.” How do you, as a family nurse practitioner, consider treatment a success, and how might this differ from expectations set by a medical facility?
RM: As is always the challenge with preventive interventions, it is difficult to measure what does not happen. Successful treatment for recurrent UTIs is lack of recurrence, also asymptomatic colonization vs a symptomatic UTI, which can be measured by a urinalysis is a success. In the oldest of the old, delayed hospitalization for urosepsis, reduced risk of falls, and increased mortality are also successes. Cost savings to the health care system by administering an inexpensive preventive medication vs very expensive IV antibiotic therapy, another success. The observed changes in bacterial resistance in patients treated with methenamine offers great hope in the battle against bacteria.
Ms. McAllister coauthored the July 2014 article, “Recurrent Multidrug Resistant Urinary Tract Infections in Geriatric Patients,” with Janice Allwood, MS, ARNP, CUNP.
Ms. McAllister is a Community Living Center family nurse practitioner and Ms. Allwood is an advanced registered nurse practitioner in Urology Surgery, both at the Bay Pines VA Healthcare System in Florida.

Malaria prophylaxis appears safe, effective in kids

Credit: Malayaka house
Year-round prophylaxis with a newer antimalaria treatment can reduce the risk of malaria in young children without posing a risk of serious adverse events, according to a study published in PLOS Medicine.
The researchers found that dihydroartemisinin-piperaquine (DP), an artemisinin-based combination therapy, was the most effective of 3 treatments at reducing malaria risk in children aged 6 months to 24 months.
The other 2 treatments, the antifolates sulfadoxine-pyrimethamine (SP) and trimethoprim-sulfamethoxazole (TS), have been in use longer than DP. And, in many locations, the malaria parasite has developed a resistance to them.
The researchers conducted this study to determine if the benefits of malaria prophylaxis outweighed the potential risk of anemia and other side effects from the drugs.
And they found the benefits did outweigh the risks. There was no significant increase in grade 3/4 adverse events with any of the treatments when compared to a control group.
The researchers also wanted to look specifically at the effects of year-round treatment. They noted that most previous studies of malaria prophylaxis have been limited to areas where there is only a seasonal risk of the disease. But this study took place in Uganda, where the risk persists throughout the year.
“Our study showed that preventive drug treatment can greatly reduce malaria in young children in areas where there are year-round high rates of transmission,” said study author Grant Dorsey, MD, of the University of California, San Francisco.
To make this discovery, the researchers studied 393 children from Tororo, Uganda. Beginning at 6 months of age, the children were randomized to 1 of 4 groups: monthly DP, monthly SP, daily TS, or a group that didn’t receive any prophylaxis, which is the standard medical practice in the area.
Treatments were given at home without supervision. Piperaquine levels were used as a measure of compliance in the DP arm.
All of the families involved in the study received insecticide-treated bed nets to put over the children when they slept. By 24 months of age, 352 children were still taking part in the study.
There were 3.02 malaria episodes per person-year in the DP group, 5.21 in the TS group, 6.73 in the SP group, and 6.95 in the control group. Protective efficacy measured 58% for the DP group, 28% for the TS group, and 7% for the SP group.
Piperaquine levels were below the detection limit 52% of the time when malaria was diagnosed in the DP group, which suggests non-adherence to treatment.
Between the groups, there was no significant difference in the rate of grade 3/4 adverse events related to treatment. There were 8 such events in the SP group, 8 in the TS group, and 3 in the DP group. Events included elevated temperature, anemia, neutropenia, thrombocytopenia, and elevated ALT/AST.
Considering all grade 3/4 adverse events regardless of their relationship to treatment, the researchers found the overall incidence was significantly lower in the DP group, but not the SP or TS groups, compared to the control group. The same was true for the incidence of elevated temperature, anemia, and thrombocytopenia.
After discontinuing the children’s treatment at 24 months of age, the researchers followed the children until age 3 and found no difference in malaria rates between the groups.
The team said these results suggest monthly administration of DP is a safe and effective option for reducing malaria among infants in regions with year-round transmission and high resistance to antifolates.
The findings also help to allay any concerns that continuous treatment might interfere with the children’s ability to develop an immune response against malaria, thereby making them more likely to contract the disease after treatment stops.
The researchers noted, however, that additional research is needed to evaluate the preventive efficacy of DP in other areas, maintain surveillance for potential selection of drug-resistant parasites, and evaluate the role of preventative treatment in the context of other malaria control interventions. ![]()
Protein-targeting drug could treat cancers, other diseases

surrounding fused cells
Credit: IRB Barcelona
Experiments in mice suggest the mitochondrial chaperone TRAP-1 is involved in the development of cancers and age-related diseases.
Previous research showed that TRAP-1 is overexpressed in leukemia, lymphoma, and many other cancers.
The new research, published in Cell Reports, clarifies TRAP-1’s role in cancers and age-related conditions. It also suggests gamitrinib, a novel agent targeting TRAP-1, could prove useful in treating these diseases.
TRAP-1 is a member of the heat shock protein 90 (HSP90) family, chaperone proteins that guide the physical formation of other proteins and serve a regulatory function within mitochondria. Tumors use HSP90 proteins like TRAP-1 to help survive therapeutic attack.
To further investigate the effects of TRAP-1, researchers bred TRAP-1 knockout mice. The team found the mice compensate for losing the protein by switching to alternative cellular mechanisms for making energy.
“We see this astounding change in TRAP-1 knockout mice, where they show fewer signs of aging and are less likely to develop cancers,” said Dario C. Altieri, MD, of The Wistar Institute in Philadelphia, Pennsylvania.
“Our findings provide an unexpected explanation for how TRAP-1 and related proteins regulate metabolism within our cells. We usually link the reprogramming of metabolic pathways with human diseases, such as cancer. What we didn’t expect to see were healthier mice with fewer tumors.”
Dr Altieri and his colleagues created the TRAP-1 knockout mice as part of their ongoing investigation into their novel drug, gamitrinib, which targets TRAP-1 in the mitochondria of tumor cells.
“In tumors, the loss of TRAP-1 is devastating, triggering a host of catastrophic defects, including metabolic problems that ultimately result in the death of the tumor cells,” Dr Altieri said. ”Mice that lack TRAP-1 from the start, however, have 3 weeks in the womb to compensate for the loss of the protein.”
The researchers found that, in the knockout mice, the loss of TRAP-1 causes mitochondrial proteins to misfold, which triggers a compensatory response that causes cells to consume more oxygen and metabolize more sugar. This prompts the mitochondria to produce deregulated levels of ATP.
This increased mitochondrial activity actually creates a moderate boost in oxidative stress (free radical damage) and the associated DNA damage. While DNA damage may seem counterproductive to longevity and good health, the low level of DNA damage actually reduces cell proliferation, slowing growth to allow the cell’s natural repair mechanisms to take effect.
According to Dr Altieri, his group’s observations provide a mechanistic foundation for the role of chaperone molecules like HSP90 in the regulation of bioenergetics in mitochondria—how cells produce and use the chemical energy they need to survive and grow.
Their results explain some contradictory findings in the scientific literature regarding the regulation of bioenergetics and show how compensatory mechanisms can arise when these chaperone molecules are taken out of the equation.
“Our findings strengthen the case for targeting HSP90 in tumor cells, but they also open up a fascinating array of questions that may have implications for metabolism and longevity,” Dr Altieri said. “I predict that the TRAP-1 knockout mouse will be a valuable tool for answering these questions.” ![]()
STAP cell researcher commits suicide

Credit: NIH
An author of the retracted Nature papers on STAP cells (stimulus-triggered acquisition of pluripotency cells) has committed suicide at the age of 52.
Yoshiki Sasai, MD, PhD, was found dead at the RIKEN Center for Developmental Biology in Kobe, Japan, where he was deputy director.
Dr Sasai reportedly hanged himself and left several suicide notes.
Members of the scientific community have expressed shock and sadness upon learning of Dr Sasai’s death.
RIKEN President Ryoji Noyori, PhD, said he was “overcome with grief” when he heard the unfortunate news.
“The scientific world has lost a talented and dedicated researcher, who earned our deep respect for the advanced research he carried out over many years,” Dr Noyori said.
Nature’s editor-in-chief, Phil Campbell, PhD, echoed that sentiment, saying, “Yoshiki Sasai was an exceptional scientist, and he has left an extraordinary legacy of pioneering work across many fields within stem cell and developmental biology.”
Dr Sasai was a respected expert on embryonic stem cells, but the STAP cell scandal damaged his reputation and reportedly took a toll on his health. According to a spokesperson at RIKEN, Dr Sasai was hospitalized for stress and required counseling in the wake of the scandal.
Dr Sasai had worked closely with the lead author of the STAP cell papers, Haruko Obokata, PhD, although he said his main duty was editing the papers.
The papers, an article and a letter, were published in Nature in January. They recounted the creation of STAP cells—inducing pluripotency in somatic cells by exposing them to a low-pH environment.
Not long after the papers were published, members of the scientific community began to question the validity of the research. They voiced concerns about published images, possible plagiarism, and an inability to replicate the experiments described.
So RIKEN launched an investigation. In April, the investigative committee concluded that Dr Obokata was guilty of research misconduct, while Dr Sasai and another author from RIKEN, Teruhiko Wakayama, PhD, were guilty of negligence.
RIKEN also said the researchers would be disciplined, although details were not released.
At a subsequent news conference, Dr Sasai said the Nature papers should be retracted because of the errors and inconsistencies, but the data do indicate the STAP cell phenomenon is real.
Likewise, Dr Obokata insisted the phenomenon is real and appealed the findings of RIKEN’s investigation. But RIKEN said another investigation was not warranted and called for a retraction of the papers. In July, Nature published retractions.
A RIKEN group is still attempting to recreate the STAP cell phenomenon, with Dr Obokata’s help. RIKEN plans to release an interim report on this attempt soon.
Other researchers said they have tried and failed to replicate the STAP cell experiments. One group reported their failed attempt in F1000Research. ![]()
Readmissions in Primary Care Clinics
Reducing hospital readmissions is a national healthcare priority. In October 2012, the Centers for Medicare and Medicaid Services (CMS) enacted financial penalties on hospitals with higher than average risk‐adjusted readmissions, offering an incentive pool of $850 million in the first year.[1] As a result, a wide range of activities to understand and reduce readmissions among patients with congestive heart failure (CHF), acute myocardial infarction (AMI), and pneumonia have emerged.[2, 3, 4, 5] Some have proposed that to effectively reduce hospital readmissions, a community of inpatient and outpatient providers and local support organizations must coordinate efforts.[6, 7] In fact, CMS has recognized the important role of community support groups and outpatient providers in safe discharge transitions in 2 ways. First, in 2011 CMS launched the Community‐based Care Transitions Program to fund community‐based organizations to assist Medicare patients with care transitions.[8] Second, CMS introduced 2 new reimbursement codes for primary care providers (PCPs) to perform care coordination immediately after hospital discharge.[9] Both of these new payment programs represent an evolving perspective that reducing hospital readmissions requires active participation among outpatient partners.
As leaders of the outpatient care team, PCPs play a significant role in reducing hospital readmissions. One way in which PCPs can begin to understand the magnitude of the issue within their clinic is to evaluate the clinic's 30‐day readmission rates. Currently, CMS calculates readmission rates at the hospital level. However, understanding these rates at the clinic level is critical for developing strategies for improvement across the care continuum. Our current understanding of effective outpatient interventions to reduce hospital readmission is limited.[3] As clinics introduce and refine strategies to reduce readmissions, tracking the impact of these strategies on readmission rates will be critical for identifying effective outpatient interventions. Clinics with similar patient case‐mix can also benchmark readmission rates, sharing best practices from clinics with lower‐than‐expected rates.
There are no available studies or proposed methodologies to guide primary care clinics in calculating their 30‐day readmission rates. A particularly difficult challenge is obtaining the admission information when patients may be admitted to 1 of several area hospitals. For large integrated delivery networks where primary care patients are relatively loyal to the network of physicians and hospitals, an opportunity exists to explore the data. Furthermore, variations in readmission rates across primary care specialties (such as internal medicine and family practice) are not well understood. In this study, we set out to develop a methodology for calculating all‐cause 30‐day hospital readmission rates at the level of individual primary care practices and to identify factors associated with variations in these rates.
METHODS
Study Design
We conducted a retrospective observational study of adult primary care patients at the University of California, San Francisco (UCSF) who were hospitalized at UCSF Medical Center between July 1, 2009 and June 30, 2012. UCSF Medical Center is comprised of Moffitt‐Long Hospital (a 600‐bed facility) and UCSF‐Mount Zion Hospital (a 90‐bed facility) located in San Francisco, CA. The patient population was limited to adults ages 18 and over with a PCP at UCSF. UCSF has 7 adult primary care clinics: General Internal Medicine (IM), Family Practice (FP), Women's Health, Geriatrics, a combined IM/FP clinic, Human Immunodeficiency Virus (HIV) Primary Care, and a Concierge Internal Medicine clinic staffed by IM physicians. Between 2009 and 2011, all clinics completed the process of enpanelment, or defining the population of patients for which each PCP and the clinic is responsible. We obtained the list of patient and PCP assignments at each of the 7 clinics across the time period of study. We then obtained UCSF Medical Center hospital claims data for this group, including dates of admission and discharge, patient age, sex, race/ethnicity, language, insurance, admitting service, diagnosis codes, information on intensive care unit stay, and discharge disposition. Hospital claims data are housed in Transition Systems International (Boston, MA) administrative databases, a cost‐accounting system that collects data abstracted from patient charts upon discharge from UCSF Medical Center.
All‐cause 30‐day hospital readmission rates were calculated for each primary care clinic, using an adaptation of the CMS definition. First, we defined index discharges as the first discharge for an individual patient in any given 30‐day interval. Only 1 index discharge is flagged for each 30‐day interval. The first admission within 30 days after the index discharge was flagged as the readmission. Consistent with CMS methodology, only the first readmission in the 30‐day period was counted. We included all inpatient and observation status admissions and excluded patients who died during the index encounter, left against medical advice, or transferred to another acute care hospital after the index encounter.
We used secondary diagnosis codes in the administrative data to classify comorbidities by the Elixhauser methodology.[10] All but 1 adult primary care clinic at UCSF are faculty‐only clinics, whereby the assigned PCP is an attending physician. In the general internal medicine clinic, an attending or a resident can serve as the PCP, and approximately 20% of IM clinic patients have a resident as their PCP. For the IM clinic, we classified patients' PCP as attending, resident, or departed. The latter category refers to patients whose PCPs were residents who had graduated or faculty who had departed and had not been assigned to a new PCP prior to the index admission or readmission.
Statistical Analysis
We built a model to predict readmissions using the demographic and clinical variables with [2] P<0.20 in an initial bivariate analysis, and then removed, with backward selection, the least significant variables until only those with P0.05 remained. Age, log‐length of stay (LOS), and intensive care unit stay were forced in the model, as studies evaluating factors related to readmissions have often included these as important covariates.[11, 12, 13, 14] Results were expressed as adjusted odds ratio (OR) with 95% confidence interval (CI). All analyses were carried out using SAS version 9.2 (SAS Institute, Inc., Cary, NC).
This study was exempt from review by the institutional review board of UCSF.
RESULTS
During the study period, there were 12,564 discharges from UCSF Medical Center for primary care patients belonging to the 7 clinics. Of these, 8685 were index discharges and 1032 were readmissions within 30 days. Table 1 shows the characteristics of the patients who had at least 1 admission during the study period. In all but 2 clinics (HIV Primary Care and Concierge Internal Medicine), there were more women hospitalized than men. Age and gender differences across clinics are consistent with the patient populations served by these clinics, with Women's Health having more female patients and younger patients hospitalized compared to Geriatrics.
| General Internal Medicine | Family Practice | Women's Health | Geriatrics | Combined IM/FP | HIV Primary Care | Concierge IM | |
|---|---|---|---|---|---|---|---|
| |||||||
| Panel size | 26,521 | 10,495 | 8,526 | 190 | 4,109 | 1,039 | 706 |
| FTE attending MD and NP providers | 18.8 | 7.3 | 4.5 | 1.7 | 5.0 | 2.3 | 2.1 |
| Mean panel size per FTE | 1,311 | 1,448 | 1,895 | 112 | 822 | 452 | 336 |
| Clinic visits in FY 2012 | 50,362 | 20,647 | 11,014 | 4,425 | 8,120 | 4,182 | 1,713 |
| No. of index discharges | 5,388 | 1,204 | 983 | 409 | 339 | 249 | 113 |
| No. of readmissions | 718 | 104 | 76 | 56 | 30 | 37 | 11 |
| No. of patients discharged during study period | 4,063 | 1,003 | 818 | 289* | 290 | 185 | 84 |
| % Male | 40.1% | 33.9% | 4.3% | 35.3% | 33.8% | 69.7% | 52.4% |
| Average age (SD), y | 60.4 (18.6) | 52.0 (19.0) | 47.0 (15.7) | 83.2 (6.9) | 46.3 (16.9) | 49.5 (9.9) | 64.5 (15.6) |
| Age range, y | 19104 | 1896 | 1997 | 6399 | 1890 | 2273 | 2092 |
| Race | |||||||
| % White | 42.2% | 41.3% | 58.8% | 61.9% | 49.3% | 61.0% | 91.7% |
| % Black | 16.3% | 8.5% | 7.5% | 7.3% | 10.0% | 27.6% | 0.0% |
| % Asian | 23.6% | 31.4% | 19.0% | 17.0% | 16.6% | 2.2% | 4.8% |
| % Native America/ Alaskan Native | 0.7% | 1.6% | 0.7% | 0.7% | 0.7% | 0.5% | 0.0% |
| % Other | 16.3% | 15.7% | 13.1% | 12.5% | 18.3% | 8.1% | 2.4% |
| Not available | 1.0% | 1.6% | 1.0% | 0.7% | 5.2% | 0.5% | 1.2% |
| Ethnicity | |||||||
| % Hispanic | 8.8% | 10.6% | 5.0% | 6.2% | 8.3% | 4.9% | 0.0% |
| % Non‐Hispanic | 73.8% | 74.5% | 81.8% | 73.0% | 74.5% | 84.9% | 75.0% |
| Not available | 17.4% | 15.0% | 13.2% | 20.8% | 17.2% | 10.3% | 25.0% |
| Language | |||||||
| % English | 69.7% | 75.6% | 88.8% | 69.6% | 85.9% | 89.7% | 89.3% |
| % Spanish | 3.8% | 1.9% | 0.6% | 4.2% | 1.0% | 0.5% | 0.0% |
| % Chinese (Mandarin or Cantonese) | 8.0% | 6.7% | 1.2% | 4.8% | 2.1% | 0.0% | 0.0% |
| % Russian | 1.7% | 0.6% | 0.1% | 0.4% | 1.0% | 0.0% | 0.0% |
| % Vietnamese | 1.0% | 1.4% | 0.0% | 0.4% | 0.0% | 0.0% | 0.0% |
| % Other | 11.7% | 9.3% | 5.6% | 18.0% | 6.9% | 8.1% | 4.8% |
| Not available | 4.1% | 4.6% | 3.7% | 2.8% | 3.1% | 1.6% | 6.0% |
| Insurance type | |||||||
| % Private | 35.4% | 58.7% | 77.4% | 10.7% | 63.8% | 36.8% | 66.7% |
| % Medicare | 22.0% | 17.2% | 12.0% | 67.8% | 14.8% | 8.7% | 33.3% |
| % Medicaid | 15.5% | 12.5% | 3.1% | 1.4% | 12.8% | 24.3% | 0.0% |
| % Dual eligible | 24.4% | 8.8% | 5.4% | 19.4% | 6.6% | 27.6% | 0.0% |
| % Self‐pay/other | 2.6% | 2.9% | 2.2% | 0.7% | 2.1% | 2.7% | 0.0% |
All‐cause 30‐day readmission rates varied across practices, with HIV Primary Care being the highest at 14.9%, followed by Geriatrics at 13.7%, General Internal Medicine at 13.3%, Concierge Internal Medicine at 9.7%, combined IM/FP at 8.9%, Family Practice at 8.6%, and Women's Health at 7.7% (Figure 1). Despite HIV Primary Care having the highest readmission rate, the number of index discharges during the 3‐year period was relatively low (249) compared to General Internal Medicine (5388). For the index admission, the top 5 admitting services were medicine, obstetrics, cardiology, orthopedic surgery, and general surgery (Table 2). Medicine was the primary admitting service for patients in the following clinics: General Internal Medicine, Geriatrics, HIV Primary Care, and Concierge Internal Medicine. Obstetrics was the primary admitting service for patients in the Family Practice, Women's Health, and combined IM/FP clinics. Vaginal delivery was the top discharge diagnosis‐related group (DRG) for patients in the General Internal Medicine, Family Practice, Women's Health, and combined IM/FP clinics. The top discharge DRG was urinary tract infection for Geriatrics, HIV for the HIV clinic (13.6%), and chemotherapy (8.0%) for Concierge Internal Medicine. Average LOS varied from 4.7 days for patients in the HIV Primary Care clinic to 2.8 days for patients in the Concierge Internal Medicine clinic. Average LOS was 3.4, 3.1, and 3.2 days in the Family Practice, Women's Health, and Geriatrics clinics, respectively, and 3.8 days in the General Internal Medicine and combined IM/FP clinics. For all clinics except Geriatrics, the majority of patients were discharged home without home health. A larger proportion of patients in the Geriatrics clinic were discharged home with home health or discharged to a skilled nursing facility.

| General Internal Medicine, N=5,388 | Family Practice, N=1,204 | Women's Health, N=983 | Geriatrics, N=409 | Combined IM/FP, N=339 | HIV Primary Care, N=249 | Concierge IM, N=113 | |
|---|---|---|---|---|---|---|---|
| |||||||
| Top 5 admitting services | |||||||
| Medicine | 41.8% | 25.0% | 15.2% | 56.4% | 23.5% | 59.7% | 19.0% |
| Obstetrics | 7.5% | 24.7% | 38.7% | 0.0% | 35.6% | 2.1% | 9.0% |
| Cardiology | 15.1% | 10.9% | 6.2% | 16.5% | 10.3% | 6.5% | 17.0% |
| Orthopedic surgery | 8.3% | 8.3% | 8.2% | 7.3% | 5.3% | 4.8% | 12.0% |
| Adult general surgery | 7.2% | 9.8% | 10.0% | 6.0% | 5.0% | 5.8% | 7.0% |
| Top 5 discharge diagnoses | |||||||
| Vaginal delivery | 3.5% | 13.6% | 20.6% | 0.0% | 17.9% | 0.3% | 3.0% |
| Major joint replacement | 3.5% | 3.4% | 4.8% | 4.3% | 3.8% | 0.7% | 5.0% |
| Vaginal delivery with complications | 1.3% | 5.0% | 6.9% | 0.0% | 4.1% | 1.0% | 2.0% |
| Simple pneumonia and pleurisy | 2.8% | 1.2% | 0.6% | 3.8% | 0.3% | 2.1% | 0.0% |
| Urinary tract infection | 2.0% | 1.5% | 1.4% | 6.2% | 0.9% | 2.4% | 1.0% |
| Discharge disposition | |||||||
| % Home | 69.1% | 74.6% | 76.6% | 47.8% | 69.9% | 78.6% | 68.4% |
| % Home with home health | 19.4% | 16.5% | 17.8% | 24.1% | 21.7% | 11.8% | 18.8% |
| % Skilled nursing facility | 7.2% | 4.9% | 3.0% | 18.9% | 3.3% | 5.0% | 0.8% |
| % Other | 4.3% | 4.0% | 2.6% | 9.2% | 5.1% | 4.6% | 12.0% |
| Average length of stay (SD) | 3.8 (5.6) | 3.4 (7.5) | 3.1 (3.7) | 3.2 (3.7) | 3.8 (5.2) | 4.7 (6.5) | 2.8 (2.8) |
| % Discharges with ICU stay | 11.0% | 10.6% | 5.9% | 8.5% | 9.2% | 11.1% | 15.8% |
Factors associated with variation in readmission rates included: male gender (OR: 1.21, 95% CI: 1.051.40), Medicare (OR: 1.31, 95% CI: 1.051.64; Ref=private) and dual‐eligible Medicare‐Medicaid insurance (OR: 1.26, 95% CI: 1.011.56), unknown primary language (OR: 0.06, 95% CI: 0.020.25; Ref=English), and the following comorbidities: peripheral vascular disease, renal failure, lymphoma, fluid and electrolyte disorders, and anemia. Multivariable logistic regression modeling results are listed in Table 3. Patients having a resident PCP showed no increased odds of readmission (OR: 1.13, 95% CI: 0.931.37; Ref=attending PCP). However, patients with a graduated resident PCP or departed faculty PCP awaiting transfer to a new PCP had an OR of 1.59 (95% CI: 1.162.17) compared with having a current faculty PCP. The C‐statistic for this model was 0.67.
| Adjusted Odds Ratio (95% CI) | |
|---|---|
| |
| Age | |
| <65 years | Ref |
| >65 years | 0.91 (0.751.10) |
| Clinic | |
| General Internal Medicine | 1.24 (0.991.56) |
| Family Practice | Ref |
| Women's Health | 1.13 (0.821.56) |
| Geriatrics | 1.20 (0.841.74) |
| Combined Internal Medicine/Family Practice | 1.13 (0.731.74) |
| HIV Primary Care | 1.24 (0.811.89) |
| Concierge Internal Medicine | 1.06 (0.542.07) |
| Sex | |
| Female | Ref |
| Male | 1.21 (1.051.40) |
| Insurance | |
| Private | Ref |
| Medicaid | 1.09 (0.871.37) |
| Medicare | 1.31 (1.051.64) |
| Dual eligible MedicareMedicaid | 1.26 (1.011.56) |
| Self/other | 1.20 (0.741.94) |
| Language | |
| English | Ref |
| Spanish | 1.02 (0.701.47) |
| Chinese | 1.13 (0.871.47) |
| Other | 0.87 (0.701.08) |
| Unknown | 0.06 (0.020.25) |
| Comorbidities | |
| Pulmonary circulation disease | 1.51 (0.982.32) |
| Peripheral vascular disease | 1.50 (1.141.98) |
| Renal failure | 1.31 (1.091.58) |
| Lymphoma | 2.50 (1.434.36) |
| Fluid and electrolyte disorders | 1.27 (1.071.52) |
| Deficiency anemia | 1.25 (1.041.51) |
| Physician | |
| Attending | Ref |
| Resident | 1.13 (0.931.37) |
| Departed PCP (internal medicine only) | 1.59 (1.162.17) |
| ICU stay | 1.03 (0.831.28) |
| LOS (log) | 1.02 (0.981.06) |
| Admitting service | |
| Medicine | Ref |
| Obstetrics | 0.41 (0.300.56) |
| Cardiology | 1.12 (0.911.37) |
| Orthopedic surgery | 0.36 (0.250.51) |
| Adult general surgery | 0.64 (0.470.87) |
| Other services | 0.76 (0.630.92) |
DISCUSSION
In this study we introduce a complementary way to view hospital readmissions, from the perspective of primary care practices. We found variation in readmission rates across primary care practices. After controlling for admitting service, clinic, provider, and patient factors, the specific characteristics of male gender, patients with Medicare or Medicare with Medicaid, and patients in our General Internal Medicine clinic with a departed PCP were independent risk factors for hospital readmission. Patients with specific comorbidities were also at increased risk for admissions, including those with peripheral vascular disease, renal failure, lymphoma, fluid and electrolyte disorders, and anemia. Because this is the first study viewing readmissions from the perspective of primary care practices, our findings are unique in the literature. However, hospital‐based studies have found similar relationships between readmission rates and these specific comorbidities.[11, 12, 15] Unlike other studies, our study cohort did not show CHF as an independent risk factor. We hypothesize this is because in 2008, UCSF Medical Center introduced an inpatient‐based intervention to reduce readmissions in patients with heart failure. By 2011, the readmission rates of patients with heart failure (primary or secondary diagnoses) had dropped by 30%. The success of this program, focused only on patients with heart failure, likely affected our analysis of comorbidities as risk factors for readmissions.
Models developed to predict hospital readmissions, overall and for specific disease conditions, have inconsistently identified predictive factors, and there is not a specific set of variables that dominate.[16, 17, 18, 19] A recent review of readmission risk prediction models suggested that models that take into account psychosocial factors such as social support, substance abuse, and functional status improved model performance.[16] We hypothesize that the reason why male gender was significant in our model may be related to lack of social support, especially among those who may be single or widowed. Other studies have also showed male gender as a predictor for hospital readmissions.[14, 20]
People with Medicare as the primary payor or Medicare with Medicaid also tended to have higher risk of readmission. We believe that this may be a proxy for the combined effect of age, multiple comorbidities, and psychosocial factors. In a multicenter study of general medicine inpatients, Medicare, but not age, was also found to be a predictive variable.[21] Unlike other studies, our study did not find Medicaid alone as a significant predictive variable for readmissions.[15, 21] One explanation may be that in hospital‐based studies, people with Medicaid who are at high risk for readmission may be high‐risk because they do not have a PCP or good access to outpatient care. In our study, all patients have a PCP in 1 of the UCSF clinics, and access to care is improved with this established relationship. These other studies did not examine Medicare‐Medicaid dual eligibility status. Our results are consistent with a national study on avoidable hospital admissions that showed the dual eligibility population experiencing 60% higher avoidable admission rates compared to the Medicaid‐only population.[22]
An interesting finding was that there were no statistically significant differences in readmissions among patients who report a language other than English as their primary language. Although language barriers and health literacy can affect a patient's ability to understand discharge instructions, the use of translators at UCSF Medical Center may have decreased the risk of readmissions. For a small number of patients whose primary language was not recorded (unknown language in our model), they appeared to have a lower risk of readmissions. Language preferences are recorded by our admitting staff during the process of admission. This step may have been skipped after hours or if the patient was not able to answer the question. However, we do not have a good hypothesis as to why these patients may have a reduced risk of readmissions.
Having a departed PCP in the General Internal Medicine clinic was an independent predictor of readmissions. These patients have access to primary care; they can schedule acute appointments with covering providers for new medical issues or follow‐up of chronic conditions. However, until they are transferred to a new PCP, they do not have a provider who is proactively managing their preventive and chronic disease care, including follow‐up and coordinating care after hospital discharge. Our study is not the first to suggest adverse outcomes for patients who are in transition from 1 primary care provider to the next.[23] Studies conducted in General Internal Medicine clinics have shown missed opportunities for cancer screening and overlooked test results during the transition period,[24] and as many as one‐fifth of patients whom residents identified as high‐risk were lost to follow‐up.[25] However, our study is the first to show the link between PCP transition in a teaching clinic and hospital readmissions. This finding underscores the importance of continuity of care in the optimal management of patients following hospital discharge.
There are several limitations to this study. First, our study only considers hospitalizations to UCSF Medical Center, potentially undercounting readmissions to area hospitals. Because our study population are patients with PCPs at UCSF, these patients tend to seek specialty and acute care at UCSF Medical Center as well. We obtained payor data from our medical group (Hill Physicians), which covers our largest private payors, to understand whether our results can be applied on a global basis. We found that in 87.4% of index admissions with readmissions from January 1, 2010 through May 30, 2012, the readmission occurred at UCSF Medical Center. We conducted a similar analysis with CMS data from October 1, 2008 to June 30, 2011, the latest data we have from CMS. For patients with UCSF PCPs and a diagnosis of AMI or CHF, 100% were readmitted back to UCSF Medical Center. For patients with UCSF PCPs and a diagnosis of pneumonia, 89% were readmitted back to UCSF Medical Center. Given that only a small percentage of patients with PCPs at UCSF present for readmission at other area hospitals, we believe that limiting our analysis to UCSF Medical Center is reasonable.
In our study, we did not remove vaginal deliveries or Caesarian sections prior to building the model. Primary care physicians and their clinic leadership are accustomed to taking a population‐health perspective. We anticipate they would be interested in designing interventions and addressing readmission for the entire primary care panel. Although readmissions after delivery are not frequent, they can still occur, and interventions should not necessarily exclude this population. We did run a sensitivity analysis by removing vaginal delivery and Caesarian sections from the analysis. As expected, readmission rates for all practices increased except for Geriatrics. However, the independent predictors of readmissions did not change.
Our study is based on a population of patients at 1 urban academic medical center and may not be generalizable across all delivery systems. Our population is racially and ethnically diverse, and many do not speak English as their primary language. The study also spans different types of primary care clinics, capturing a wide range of ages and case mix. As PCP assignments fluctuate over time, there may be errors with PCP attribution in the UCSF Medical Center data systems. We do not believe errors in PCP attribution would differ across primary care practices. Because the primary care practices' performance reports on quality measures are based on PCP assignment, each clinic regularly updates their clinic panels and has specific protocols to address errors with PCP attribution.
Finally, our study includes only the variables that we were able to extract from administrative claims. Other explanatory variables that have been suggested as important for evaluation, such as social support, functional assessment, access to care, hospital discharge process, and posthospitalization follow‐up, were not included. Each of these could be explored in future studies.
This study offers a unique perspective of hospital readmission by introducing a new methodology for primary care clinics to calculate and evaluate their all‐cause 30‐day readmission rates. Although this methodology is not intended to provide real‐time feedback to clinics on readmitted patients, it opens the door for benchmarking based on specific case‐mix indices. Another direction for future research is to design robust evaluations of the impact of interventions, both inpatient and outpatient, on primary care clinic readmission rates. Finally, future research should replicate this analysis across teaching clinics to identify whether provider turnover is a consistent independent predictor of hospital readmissions.
This study also has implications for inpatient interventions. For example, discharging physicians may consider proactively identifying whether the patient has a continuous primary care provider. Patients who are in between PCPs may need closer follow‐up after discharge, until they re‐establish with a new PCP. This can be accomplished through a postdischarge clinic visit, either run by inpatient providers or covering physicians in the primary care clinic. In addition, the discharging physician may work with the case manager to increase the level of care coordination. The case manager could contact the primary care clinic and proactively ask for immediate PCP re‐assignment. Once a new PCP has been identified, the discharging physician could consider a warm hand‐off. With a warm hand‐off, the new PCP may feel more comfortable managing problems that may arise after hospital discharge, and especially before the first outpatient visit with the new PCP. Future research can test whether these interventions could effectively reduce hospital readmissions across a broad primary care population.
CONCLUSION
Primary care providers and their clinics play an important role in managing population health, decreasing healthcare spending, and keeping patients out of the hospital. In this study, we introduce a tool in which primary care clinics can begin to understand their hospital readmission rates. This may be particularly valuable as primary care providers enter global payment arrangements such as accountable care organizations or bundled payments and are responsible for a population of patients across the continuum of care. We found significant variation in readmission rates between different primary care practices, but much of this variation appears to be due to differences between practices in patient demographics, comorbidities, and hospitalization factors. Our study is the first to show the association between provider transitions and higher hospital readmissions. Continuity of care is critical for the optimal management of patients following hospital discharge. More attention will need to be focused on providing good continuity outpatient care for patients at high risk for readmissions.
Acknowledgements
The authors acknowledge Janelle Lee, MBA, MHA, DrPH, for her assistance with extracting the hospital claims data at UCSF Medical Center.
Disclosure: Dr. Tang and Ms. Maselli were supported by a University of California, Center for Health Quality and Innovation grant. The authors report no conflicts of interest.
- , . Medicare's new hospital value‐based purchasing program is likely to have only a small impact on hospital payments. Health Aff. 2012;31:1932–1940.
- , , , et al. Contemporary evidence about hospital strategies for reducing 30‐day readmissions. J Am Coll Cardiol. 2012;60:607–614.
- , , , , . Interventions to reduce 30‐day rehospitalization: a systematic review. Ann Intern Med. 2011;155:520–528.
- , , . Reducing hospital readmissions: lessons from top‐performing hospitals. The Commonwealth Fund Synthesis Report. Available at: http://www.commonwealthfund.org/publications/case‐studies/2011/apr/reducing‐hospital‐readmissions. Published April 6, 2011. Accessed February 8, 2013.
- , . Effective Interventions to Reduce Rehospitalizations: A Survey of the Published Evidence. Cambridge, MA: Institute for Healthcare Improvement; 2009.
- , , . Recasting readmissions by placing the hospital role in community context. JAMA. 2013;309:351–352.
- , , , . Hospitalists and care transitions: the divorce of inpatient and outpatient care. Health Affairs. 2008;27:1315–1327.
- Center for Medicare and Medicaid Innovation. Community‐based Care Transitions Program. Available at: http://innovation.cms.gov/initiatives/CCTP/#collapse‐tableDetails. Accessed February 8, 2013.
- , , . Medicare's transitional care payment—a step toward the medical home. N Engl J Med. 2013;368:692–694.
- , , . Volume thresholds and hospital characteristics in the United States. Health Aff (Millwood). 2003;22:167–177.
- , , , , , . Thirty‐day rehospitalizations after acute myocardial infarction: a cohort study. Ann Intern Med. 2012;157:11–18.
- , , . Rehospitalizations among patients in the Medicare fee‐for‐service program. N Engl J Med. 2009;360:1418–1428.
- , , , et al. Associations between reduced hospital length of stay and 30‐day readmission rate and mortality: 14‐year experience in 129 Veterans Affairs hospitals. Ann Intern Med. 2012;157:837–845.
- , , , et al. Readmission after hospitalization for congestive heart failure among Medicare beneficiaries. Arch Intern Med. 1997;157:99–104.
- , , , . Redefining readmission risk factors for general medicine patients. J Hosp Med. 2011;6:54–60.
- , , , et al. Risk prediction models for hospital readmission: a systematic review. JAMA. 2011;206:1688–1698.
- , , , et al. Statistical models and patient predictors of readmission for heart failure: a systematic review. Arch Intern Med. 2008;168:1371–1386.
- , , , . Statistical models and patient predictors of readmission for acute myocardial infarction: a systematic review. Circ Cardiovasc Qual Outcomes. 2009;2:500–507.
- , , , et al. Predictors of hospital readmission after stroke: a systematic review. Stroke. 2010;41:2525–2533.
- , , , , . Risk factors for 30‐day hospital readmission in patients ≥65 years of age. Proc (Bayl Univ Med Cent). 2008;21:363–372.
- , , , et al. Hospital readmission in general medicine patients: a prediction model. J Gen Intern Med. 2010;25:211–219.
- , , . Users of Medicaid home and community‐based services are especially vulnerable to costly avoidable hospital admissions. Health Affairs. 2012;31:1167–1175.
- , . Academic year‐end transfers of outpatients from outgoing to incoming residents: an unaddressed patient safety issue. JAMA. 2009;302:1327–1329.
- , , , , , . The revolving door of resident continuity practice: identifying gaps in transitions of care. J Gen Intern Med. 2011;26:995–998.
- , , , et al. Outcomes for resident‐identified high‐risk patients and resident perspectives of year‐end continuity clinic handoffs. J Gen Intern Med. 2012;27:1438–1444.
Reducing hospital readmissions is a national healthcare priority. In October 2012, the Centers for Medicare and Medicaid Services (CMS) enacted financial penalties on hospitals with higher than average risk‐adjusted readmissions, offering an incentive pool of $850 million in the first year.[1] As a result, a wide range of activities to understand and reduce readmissions among patients with congestive heart failure (CHF), acute myocardial infarction (AMI), and pneumonia have emerged.[2, 3, 4, 5] Some have proposed that to effectively reduce hospital readmissions, a community of inpatient and outpatient providers and local support organizations must coordinate efforts.[6, 7] In fact, CMS has recognized the important role of community support groups and outpatient providers in safe discharge transitions in 2 ways. First, in 2011 CMS launched the Community‐based Care Transitions Program to fund community‐based organizations to assist Medicare patients with care transitions.[8] Second, CMS introduced 2 new reimbursement codes for primary care providers (PCPs) to perform care coordination immediately after hospital discharge.[9] Both of these new payment programs represent an evolving perspective that reducing hospital readmissions requires active participation among outpatient partners.
As leaders of the outpatient care team, PCPs play a significant role in reducing hospital readmissions. One way in which PCPs can begin to understand the magnitude of the issue within their clinic is to evaluate the clinic's 30‐day readmission rates. Currently, CMS calculates readmission rates at the hospital level. However, understanding these rates at the clinic level is critical for developing strategies for improvement across the care continuum. Our current understanding of effective outpatient interventions to reduce hospital readmission is limited.[3] As clinics introduce and refine strategies to reduce readmissions, tracking the impact of these strategies on readmission rates will be critical for identifying effective outpatient interventions. Clinics with similar patient case‐mix can also benchmark readmission rates, sharing best practices from clinics with lower‐than‐expected rates.
There are no available studies or proposed methodologies to guide primary care clinics in calculating their 30‐day readmission rates. A particularly difficult challenge is obtaining the admission information when patients may be admitted to 1 of several area hospitals. For large integrated delivery networks where primary care patients are relatively loyal to the network of physicians and hospitals, an opportunity exists to explore the data. Furthermore, variations in readmission rates across primary care specialties (such as internal medicine and family practice) are not well understood. In this study, we set out to develop a methodology for calculating all‐cause 30‐day hospital readmission rates at the level of individual primary care practices and to identify factors associated with variations in these rates.
METHODS
Study Design
We conducted a retrospective observational study of adult primary care patients at the University of California, San Francisco (UCSF) who were hospitalized at UCSF Medical Center between July 1, 2009 and June 30, 2012. UCSF Medical Center is comprised of Moffitt‐Long Hospital (a 600‐bed facility) and UCSF‐Mount Zion Hospital (a 90‐bed facility) located in San Francisco, CA. The patient population was limited to adults ages 18 and over with a PCP at UCSF. UCSF has 7 adult primary care clinics: General Internal Medicine (IM), Family Practice (FP), Women's Health, Geriatrics, a combined IM/FP clinic, Human Immunodeficiency Virus (HIV) Primary Care, and a Concierge Internal Medicine clinic staffed by IM physicians. Between 2009 and 2011, all clinics completed the process of enpanelment, or defining the population of patients for which each PCP and the clinic is responsible. We obtained the list of patient and PCP assignments at each of the 7 clinics across the time period of study. We then obtained UCSF Medical Center hospital claims data for this group, including dates of admission and discharge, patient age, sex, race/ethnicity, language, insurance, admitting service, diagnosis codes, information on intensive care unit stay, and discharge disposition. Hospital claims data are housed in Transition Systems International (Boston, MA) administrative databases, a cost‐accounting system that collects data abstracted from patient charts upon discharge from UCSF Medical Center.
All‐cause 30‐day hospital readmission rates were calculated for each primary care clinic, using an adaptation of the CMS definition. First, we defined index discharges as the first discharge for an individual patient in any given 30‐day interval. Only 1 index discharge is flagged for each 30‐day interval. The first admission within 30 days after the index discharge was flagged as the readmission. Consistent with CMS methodology, only the first readmission in the 30‐day period was counted. We included all inpatient and observation status admissions and excluded patients who died during the index encounter, left against medical advice, or transferred to another acute care hospital after the index encounter.
We used secondary diagnosis codes in the administrative data to classify comorbidities by the Elixhauser methodology.[10] All but 1 adult primary care clinic at UCSF are faculty‐only clinics, whereby the assigned PCP is an attending physician. In the general internal medicine clinic, an attending or a resident can serve as the PCP, and approximately 20% of IM clinic patients have a resident as their PCP. For the IM clinic, we classified patients' PCP as attending, resident, or departed. The latter category refers to patients whose PCPs were residents who had graduated or faculty who had departed and had not been assigned to a new PCP prior to the index admission or readmission.
Statistical Analysis
We built a model to predict readmissions using the demographic and clinical variables with [2] P<0.20 in an initial bivariate analysis, and then removed, with backward selection, the least significant variables until only those with P0.05 remained. Age, log‐length of stay (LOS), and intensive care unit stay were forced in the model, as studies evaluating factors related to readmissions have often included these as important covariates.[11, 12, 13, 14] Results were expressed as adjusted odds ratio (OR) with 95% confidence interval (CI). All analyses were carried out using SAS version 9.2 (SAS Institute, Inc., Cary, NC).
This study was exempt from review by the institutional review board of UCSF.
RESULTS
During the study period, there were 12,564 discharges from UCSF Medical Center for primary care patients belonging to the 7 clinics. Of these, 8685 were index discharges and 1032 were readmissions within 30 days. Table 1 shows the characteristics of the patients who had at least 1 admission during the study period. In all but 2 clinics (HIV Primary Care and Concierge Internal Medicine), there were more women hospitalized than men. Age and gender differences across clinics are consistent with the patient populations served by these clinics, with Women's Health having more female patients and younger patients hospitalized compared to Geriatrics.
| General Internal Medicine | Family Practice | Women's Health | Geriatrics | Combined IM/FP | HIV Primary Care | Concierge IM | |
|---|---|---|---|---|---|---|---|
| |||||||
| Panel size | 26,521 | 10,495 | 8,526 | 190 | 4,109 | 1,039 | 706 |
| FTE attending MD and NP providers | 18.8 | 7.3 | 4.5 | 1.7 | 5.0 | 2.3 | 2.1 |
| Mean panel size per FTE | 1,311 | 1,448 | 1,895 | 112 | 822 | 452 | 336 |
| Clinic visits in FY 2012 | 50,362 | 20,647 | 11,014 | 4,425 | 8,120 | 4,182 | 1,713 |
| No. of index discharges | 5,388 | 1,204 | 983 | 409 | 339 | 249 | 113 |
| No. of readmissions | 718 | 104 | 76 | 56 | 30 | 37 | 11 |
| No. of patients discharged during study period | 4,063 | 1,003 | 818 | 289* | 290 | 185 | 84 |
| % Male | 40.1% | 33.9% | 4.3% | 35.3% | 33.8% | 69.7% | 52.4% |
| Average age (SD), y | 60.4 (18.6) | 52.0 (19.0) | 47.0 (15.7) | 83.2 (6.9) | 46.3 (16.9) | 49.5 (9.9) | 64.5 (15.6) |
| Age range, y | 19104 | 1896 | 1997 | 6399 | 1890 | 2273 | 2092 |
| Race | |||||||
| % White | 42.2% | 41.3% | 58.8% | 61.9% | 49.3% | 61.0% | 91.7% |
| % Black | 16.3% | 8.5% | 7.5% | 7.3% | 10.0% | 27.6% | 0.0% |
| % Asian | 23.6% | 31.4% | 19.0% | 17.0% | 16.6% | 2.2% | 4.8% |
| % Native America/ Alaskan Native | 0.7% | 1.6% | 0.7% | 0.7% | 0.7% | 0.5% | 0.0% |
| % Other | 16.3% | 15.7% | 13.1% | 12.5% | 18.3% | 8.1% | 2.4% |
| Not available | 1.0% | 1.6% | 1.0% | 0.7% | 5.2% | 0.5% | 1.2% |
| Ethnicity | |||||||
| % Hispanic | 8.8% | 10.6% | 5.0% | 6.2% | 8.3% | 4.9% | 0.0% |
| % Non‐Hispanic | 73.8% | 74.5% | 81.8% | 73.0% | 74.5% | 84.9% | 75.0% |
| Not available | 17.4% | 15.0% | 13.2% | 20.8% | 17.2% | 10.3% | 25.0% |
| Language | |||||||
| % English | 69.7% | 75.6% | 88.8% | 69.6% | 85.9% | 89.7% | 89.3% |
| % Spanish | 3.8% | 1.9% | 0.6% | 4.2% | 1.0% | 0.5% | 0.0% |
| % Chinese (Mandarin or Cantonese) | 8.0% | 6.7% | 1.2% | 4.8% | 2.1% | 0.0% | 0.0% |
| % Russian | 1.7% | 0.6% | 0.1% | 0.4% | 1.0% | 0.0% | 0.0% |
| % Vietnamese | 1.0% | 1.4% | 0.0% | 0.4% | 0.0% | 0.0% | 0.0% |
| % Other | 11.7% | 9.3% | 5.6% | 18.0% | 6.9% | 8.1% | 4.8% |
| Not available | 4.1% | 4.6% | 3.7% | 2.8% | 3.1% | 1.6% | 6.0% |
| Insurance type | |||||||
| % Private | 35.4% | 58.7% | 77.4% | 10.7% | 63.8% | 36.8% | 66.7% |
| % Medicare | 22.0% | 17.2% | 12.0% | 67.8% | 14.8% | 8.7% | 33.3% |
| % Medicaid | 15.5% | 12.5% | 3.1% | 1.4% | 12.8% | 24.3% | 0.0% |
| % Dual eligible | 24.4% | 8.8% | 5.4% | 19.4% | 6.6% | 27.6% | 0.0% |
| % Self‐pay/other | 2.6% | 2.9% | 2.2% | 0.7% | 2.1% | 2.7% | 0.0% |
All‐cause 30‐day readmission rates varied across practices, with HIV Primary Care being the highest at 14.9%, followed by Geriatrics at 13.7%, General Internal Medicine at 13.3%, Concierge Internal Medicine at 9.7%, combined IM/FP at 8.9%, Family Practice at 8.6%, and Women's Health at 7.7% (Figure 1). Despite HIV Primary Care having the highest readmission rate, the number of index discharges during the 3‐year period was relatively low (249) compared to General Internal Medicine (5388). For the index admission, the top 5 admitting services were medicine, obstetrics, cardiology, orthopedic surgery, and general surgery (Table 2). Medicine was the primary admitting service for patients in the following clinics: General Internal Medicine, Geriatrics, HIV Primary Care, and Concierge Internal Medicine. Obstetrics was the primary admitting service for patients in the Family Practice, Women's Health, and combined IM/FP clinics. Vaginal delivery was the top discharge diagnosis‐related group (DRG) for patients in the General Internal Medicine, Family Practice, Women's Health, and combined IM/FP clinics. The top discharge DRG was urinary tract infection for Geriatrics, HIV for the HIV clinic (13.6%), and chemotherapy (8.0%) for Concierge Internal Medicine. Average LOS varied from 4.7 days for patients in the HIV Primary Care clinic to 2.8 days for patients in the Concierge Internal Medicine clinic. Average LOS was 3.4, 3.1, and 3.2 days in the Family Practice, Women's Health, and Geriatrics clinics, respectively, and 3.8 days in the General Internal Medicine and combined IM/FP clinics. For all clinics except Geriatrics, the majority of patients were discharged home without home health. A larger proportion of patients in the Geriatrics clinic were discharged home with home health or discharged to a skilled nursing facility.
| General Internal Medicine, N=5,388 | Family Practice, N=1,204 | Women's Health, N=983 | Geriatrics, N=409 | Combined IM/FP, N=339 | HIV Primary Care, N=249 | Concierge IM, N=113 | |
|---|---|---|---|---|---|---|---|
| |||||||
| Top 5 admitting services | |||||||
| Medicine | 41.8% | 25.0% | 15.2% | 56.4% | 23.5% | 59.7% | 19.0% |
| Obstetrics | 7.5% | 24.7% | 38.7% | 0.0% | 35.6% | 2.1% | 9.0% |
| Cardiology | 15.1% | 10.9% | 6.2% | 16.5% | 10.3% | 6.5% | 17.0% |
| Orthopedic surgery | 8.3% | 8.3% | 8.2% | 7.3% | 5.3% | 4.8% | 12.0% |
| Adult general surgery | 7.2% | 9.8% | 10.0% | 6.0% | 5.0% | 5.8% | 7.0% |
| Top 5 discharge diagnoses | |||||||
| Vaginal delivery | 3.5% | 13.6% | 20.6% | 0.0% | 17.9% | 0.3% | 3.0% |
| Major joint replacement | 3.5% | 3.4% | 4.8% | 4.3% | 3.8% | 0.7% | 5.0% |
| Vaginal delivery with complications | 1.3% | 5.0% | 6.9% | 0.0% | 4.1% | 1.0% | 2.0% |
| Simple pneumonia and pleurisy | 2.8% | 1.2% | 0.6% | 3.8% | 0.3% | 2.1% | 0.0% |
| Urinary tract infection | 2.0% | 1.5% | 1.4% | 6.2% | 0.9% | 2.4% | 1.0% |
| Discharge disposition | |||||||
| % Home | 69.1% | 74.6% | 76.6% | 47.8% | 69.9% | 78.6% | 68.4% |
| % Home with home health | 19.4% | 16.5% | 17.8% | 24.1% | 21.7% | 11.8% | 18.8% |
| % Skilled nursing facility | 7.2% | 4.9% | 3.0% | 18.9% | 3.3% | 5.0% | 0.8% |
| % Other | 4.3% | 4.0% | 2.6% | 9.2% | 5.1% | 4.6% | 12.0% |
| Average length of stay (SD) | 3.8 (5.6) | 3.4 (7.5) | 3.1 (3.7) | 3.2 (3.7) | 3.8 (5.2) | 4.7 (6.5) | 2.8 (2.8) |
| % Discharges with ICU stay | 11.0% | 10.6% | 5.9% | 8.5% | 9.2% | 11.1% | 15.8% |
Factors associated with variation in readmission rates included: male gender (OR: 1.21, 95% CI: 1.051.40), Medicare (OR: 1.31, 95% CI: 1.051.64; Ref=private) and dual‐eligible Medicare‐Medicaid insurance (OR: 1.26, 95% CI: 1.011.56), unknown primary language (OR: 0.06, 95% CI: 0.020.25; Ref=English), and the following comorbidities: peripheral vascular disease, renal failure, lymphoma, fluid and electrolyte disorders, and anemia. Multivariable logistic regression modeling results are listed in Table 3. Patients having a resident PCP showed no increased odds of readmission (OR: 1.13, 95% CI: 0.931.37; Ref=attending PCP). However, patients with a graduated resident PCP or departed faculty PCP awaiting transfer to a new PCP had an OR of 1.59 (95% CI: 1.162.17) compared with having a current faculty PCP. The C‐statistic for this model was 0.67.
| Adjusted Odds Ratio (95% CI) | |
|---|---|
| |
| Age | |
| <65 years | Ref |
| >65 years | 0.91 (0.751.10) |
| Clinic | |
| General Internal Medicine | 1.24 (0.991.56) |
| Family Practice | Ref |
| Women's Health | 1.13 (0.821.56) |
| Geriatrics | 1.20 (0.841.74) |
| Combined Internal Medicine/Family Practice | 1.13 (0.731.74) |
| HIV Primary Care | 1.24 (0.811.89) |
| Concierge Internal Medicine | 1.06 (0.542.07) |
| Sex | |
| Female | Ref |
| Male | 1.21 (1.051.40) |
| Insurance | |
| Private | Ref |
| Medicaid | 1.09 (0.871.37) |
| Medicare | 1.31 (1.051.64) |
| Dual eligible MedicareMedicaid | 1.26 (1.011.56) |
| Self/other | 1.20 (0.741.94) |
| Language | |
| English | Ref |
| Spanish | 1.02 (0.701.47) |
| Chinese | 1.13 (0.871.47) |
| Other | 0.87 (0.701.08) |
| Unknown | 0.06 (0.020.25) |
| Comorbidities | |
| Pulmonary circulation disease | 1.51 (0.982.32) |
| Peripheral vascular disease | 1.50 (1.141.98) |
| Renal failure | 1.31 (1.091.58) |
| Lymphoma | 2.50 (1.434.36) |
| Fluid and electrolyte disorders | 1.27 (1.071.52) |
| Deficiency anemia | 1.25 (1.041.51) |
| Physician | |
| Attending | Ref |
| Resident | 1.13 (0.931.37) |
| Departed PCP (internal medicine only) | 1.59 (1.162.17) |
| ICU stay | 1.03 (0.831.28) |
| LOS (log) | 1.02 (0.981.06) |
| Admitting service | |
| Medicine | Ref |
| Obstetrics | 0.41 (0.300.56) |
| Cardiology | 1.12 (0.911.37) |
| Orthopedic surgery | 0.36 (0.250.51) |
| Adult general surgery | 0.64 (0.470.87) |
| Other services | 0.76 (0.630.92) |
DISCUSSION
In this study we introduce a complementary way to view hospital readmissions, from the perspective of primary care practices. We found variation in readmission rates across primary care practices. After controlling for admitting service, clinic, provider, and patient factors, the specific characteristics of male gender, patients with Medicare or Medicare with Medicaid, and patients in our General Internal Medicine clinic with a departed PCP were independent risk factors for hospital readmission. Patients with specific comorbidities were also at increased risk for admissions, including those with peripheral vascular disease, renal failure, lymphoma, fluid and electrolyte disorders, and anemia. Because this is the first study viewing readmissions from the perspective of primary care practices, our findings are unique in the literature. However, hospital‐based studies have found similar relationships between readmission rates and these specific comorbidities.[11, 12, 15] Unlike other studies, our study cohort did not show CHF as an independent risk factor. We hypothesize this is because in 2008, UCSF Medical Center introduced an inpatient‐based intervention to reduce readmissions in patients with heart failure. By 2011, the readmission rates of patients with heart failure (primary or secondary diagnoses) had dropped by 30%. The success of this program, focused only on patients with heart failure, likely affected our analysis of comorbidities as risk factors for readmissions.
Models developed to predict hospital readmissions, overall and for specific disease conditions, have inconsistently identified predictive factors, and there is not a specific set of variables that dominate.[16, 17, 18, 19] A recent review of readmission risk prediction models suggested that models that take into account psychosocial factors such as social support, substance abuse, and functional status improved model performance.[16] We hypothesize that the reason why male gender was significant in our model may be related to lack of social support, especially among those who may be single or widowed. Other studies have also showed male gender as a predictor for hospital readmissions.[14, 20]
People with Medicare as the primary payor or Medicare with Medicaid also tended to have higher risk of readmission. We believe that this may be a proxy for the combined effect of age, multiple comorbidities, and psychosocial factors. In a multicenter study of general medicine inpatients, Medicare, but not age, was also found to be a predictive variable.[21] Unlike other studies, our study did not find Medicaid alone as a significant predictive variable for readmissions.[15, 21] One explanation may be that in hospital‐based studies, people with Medicaid who are at high risk for readmission may be high‐risk because they do not have a PCP or good access to outpatient care. In our study, all patients have a PCP in 1 of the UCSF clinics, and access to care is improved with this established relationship. These other studies did not examine Medicare‐Medicaid dual eligibility status. Our results are consistent with a national study on avoidable hospital admissions that showed the dual eligibility population experiencing 60% higher avoidable admission rates compared to the Medicaid‐only population.[22]
An interesting finding was that there were no statistically significant differences in readmissions among patients who report a language other than English as their primary language. Although language barriers and health literacy can affect a patient's ability to understand discharge instructions, the use of translators at UCSF Medical Center may have decreased the risk of readmissions. For a small number of patients whose primary language was not recorded (unknown language in our model), they appeared to have a lower risk of readmissions. Language preferences are recorded by our admitting staff during the process of admission. This step may have been skipped after hours or if the patient was not able to answer the question. However, we do not have a good hypothesis as to why these patients may have a reduced risk of readmissions.
Having a departed PCP in the General Internal Medicine clinic was an independent predictor of readmissions. These patients have access to primary care; they can schedule acute appointments with covering providers for new medical issues or follow‐up of chronic conditions. However, until they are transferred to a new PCP, they do not have a provider who is proactively managing their preventive and chronic disease care, including follow‐up and coordinating care after hospital discharge. Our study is not the first to suggest adverse outcomes for patients who are in transition from 1 primary care provider to the next.[23] Studies conducted in General Internal Medicine clinics have shown missed opportunities for cancer screening and overlooked test results during the transition period,[24] and as many as one‐fifth of patients whom residents identified as high‐risk were lost to follow‐up.[25] However, our study is the first to show the link between PCP transition in a teaching clinic and hospital readmissions. This finding underscores the importance of continuity of care in the optimal management of patients following hospital discharge.
There are several limitations to this study. First, our study only considers hospitalizations to UCSF Medical Center, potentially undercounting readmissions to area hospitals. Because our study population are patients with PCPs at UCSF, these patients tend to seek specialty and acute care at UCSF Medical Center as well. We obtained payor data from our medical group (Hill Physicians), which covers our largest private payors, to understand whether our results can be applied on a global basis. We found that in 87.4% of index admissions with readmissions from January 1, 2010 through May 30, 2012, the readmission occurred at UCSF Medical Center. We conducted a similar analysis with CMS data from October 1, 2008 to June 30, 2011, the latest data we have from CMS. For patients with UCSF PCPs and a diagnosis of AMI or CHF, 100% were readmitted back to UCSF Medical Center. For patients with UCSF PCPs and a diagnosis of pneumonia, 89% were readmitted back to UCSF Medical Center. Given that only a small percentage of patients with PCPs at UCSF present for readmission at other area hospitals, we believe that limiting our analysis to UCSF Medical Center is reasonable.
In our study, we did not remove vaginal deliveries or Caesarian sections prior to building the model. Primary care physicians and their clinic leadership are accustomed to taking a population‐health perspective. We anticipate they would be interested in designing interventions and addressing readmission for the entire primary care panel. Although readmissions after delivery are not frequent, they can still occur, and interventions should not necessarily exclude this population. We did run a sensitivity analysis by removing vaginal delivery and Caesarian sections from the analysis. As expected, readmission rates for all practices increased except for Geriatrics. However, the independent predictors of readmissions did not change.
Our study is based on a population of patients at 1 urban academic medical center and may not be generalizable across all delivery systems. Our population is racially and ethnically diverse, and many do not speak English as their primary language. The study also spans different types of primary care clinics, capturing a wide range of ages and case mix. As PCP assignments fluctuate over time, there may be errors with PCP attribution in the UCSF Medical Center data systems. We do not believe errors in PCP attribution would differ across primary care practices. Because the primary care practices' performance reports on quality measures are based on PCP assignment, each clinic regularly updates their clinic panels and has specific protocols to address errors with PCP attribution.
Finally, our study includes only the variables that we were able to extract from administrative claims. Other explanatory variables that have been suggested as important for evaluation, such as social support, functional assessment, access to care, hospital discharge process, and posthospitalization follow‐up, were not included. Each of these could be explored in future studies.
This study offers a unique perspective of hospital readmission by introducing a new methodology for primary care clinics to calculate and evaluate their all‐cause 30‐day readmission rates. Although this methodology is not intended to provide real‐time feedback to clinics on readmitted patients, it opens the door for benchmarking based on specific case‐mix indices. Another direction for future research is to design robust evaluations of the impact of interventions, both inpatient and outpatient, on primary care clinic readmission rates. Finally, future research should replicate this analysis across teaching clinics to identify whether provider turnover is a consistent independent predictor of hospital readmissions.
This study also has implications for inpatient interventions. For example, discharging physicians may consider proactively identifying whether the patient has a continuous primary care provider. Patients who are in between PCPs may need closer follow‐up after discharge, until they re‐establish with a new PCP. This can be accomplished through a postdischarge clinic visit, either run by inpatient providers or covering physicians in the primary care clinic. In addition, the discharging physician may work with the case manager to increase the level of care coordination. The case manager could contact the primary care clinic and proactively ask for immediate PCP re‐assignment. Once a new PCP has been identified, the discharging physician could consider a warm hand‐off. With a warm hand‐off, the new PCP may feel more comfortable managing problems that may arise after hospital discharge, and especially before the first outpatient visit with the new PCP. Future research can test whether these interventions could effectively reduce hospital readmissions across a broad primary care population.
CONCLUSION
Primary care providers and their clinics play an important role in managing population health, decreasing healthcare spending, and keeping patients out of the hospital. In this study, we introduce a tool in which primary care clinics can begin to understand their hospital readmission rates. This may be particularly valuable as primary care providers enter global payment arrangements such as accountable care organizations or bundled payments and are responsible for a population of patients across the continuum of care. We found significant variation in readmission rates between different primary care practices, but much of this variation appears to be due to differences between practices in patient demographics, comorbidities, and hospitalization factors. Our study is the first to show the association between provider transitions and higher hospital readmissions. Continuity of care is critical for the optimal management of patients following hospital discharge. More attention will need to be focused on providing good continuity outpatient care for patients at high risk for readmissions.
Acknowledgements
The authors acknowledge Janelle Lee, MBA, MHA, DrPH, for her assistance with extracting the hospital claims data at UCSF Medical Center.
Disclosure: Dr. Tang and Ms. Maselli were supported by a University of California, Center for Health Quality and Innovation grant. The authors report no conflicts of interest.
- , . Medicare's new hospital value‐based purchasing program is likely to have only a small impact on hospital payments. Health Aff. 2012;31:1932–1940.
- , , , et al. Contemporary evidence about hospital strategies for reducing 30‐day readmissions. J Am Coll Cardiol. 2012;60:607–614.
- , , , , . Interventions to reduce 30‐day rehospitalization: a systematic review. Ann Intern Med. 2011;155:520–528.
- , , . Reducing hospital readmissions: lessons from top‐performing hospitals. The Commonwealth Fund Synthesis Report. Available at: http://www.commonwealthfund.org/publications/case‐studies/2011/apr/reducing‐hospital‐readmissions. Published April 6, 2011. Accessed February 8, 2013.
- , . Effective Interventions to Reduce Rehospitalizations: A Survey of the Published Evidence. Cambridge, MA: Institute for Healthcare Improvement; 2009.
- , , . Recasting readmissions by placing the hospital role in community context. JAMA. 2013;309:351–352.
- , , , . Hospitalists and care transitions: the divorce of inpatient and outpatient care. Health Affairs. 2008;27:1315–1327.
- Center for Medicare and Medicaid Innovation. Community‐based Care Transitions Program. Available at: http://innovation.cms.gov/initiatives/CCTP/#collapse‐tableDetails. Accessed February 8, 2013.
- , , . Medicare's transitional care payment—a step toward the medical home. N Engl J Med. 2013;368:692–694.
- , , . Volume thresholds and hospital characteristics in the United States. Health Aff (Millwood). 2003;22:167–177.
- , , , , , . Thirty‐day rehospitalizations after acute myocardial infarction: a cohort study. Ann Intern Med. 2012;157:11–18.
- , , . Rehospitalizations among patients in the Medicare fee‐for‐service program. N Engl J Med. 2009;360:1418–1428.
- , , , et al. Associations between reduced hospital length of stay and 30‐day readmission rate and mortality: 14‐year experience in 129 Veterans Affairs hospitals. Ann Intern Med. 2012;157:837–845.
- , , , et al. Readmission after hospitalization for congestive heart failure among Medicare beneficiaries. Arch Intern Med. 1997;157:99–104.
- , , , . Redefining readmission risk factors for general medicine patients. J Hosp Med. 2011;6:54–60.
- , , , et al. Risk prediction models for hospital readmission: a systematic review. JAMA. 2011;206:1688–1698.
- , , , et al. Statistical models and patient predictors of readmission for heart failure: a systematic review. Arch Intern Med. 2008;168:1371–1386.
- , , , . Statistical models and patient predictors of readmission for acute myocardial infarction: a systematic review. Circ Cardiovasc Qual Outcomes. 2009;2:500–507.
- , , , et al. Predictors of hospital readmission after stroke: a systematic review. Stroke. 2010;41:2525–2533.
- , , , , . Risk factors for 30‐day hospital readmission in patients ≥65 years of age. Proc (Bayl Univ Med Cent). 2008;21:363–372.
- , , , et al. Hospital readmission in general medicine patients: a prediction model. J Gen Intern Med. 2010;25:211–219.
- , , . Users of Medicaid home and community‐based services are especially vulnerable to costly avoidable hospital admissions. Health Affairs. 2012;31:1167–1175.
- , . Academic year‐end transfers of outpatients from outgoing to incoming residents: an unaddressed patient safety issue. JAMA. 2009;302:1327–1329.
- , , , , , . The revolving door of resident continuity practice: identifying gaps in transitions of care. J Gen Intern Med. 2011;26:995–998.
- , , , et al. Outcomes for resident‐identified high‐risk patients and resident perspectives of year‐end continuity clinic handoffs. J Gen Intern Med. 2012;27:1438–1444.
© 2014 Society of Hospital Medicine
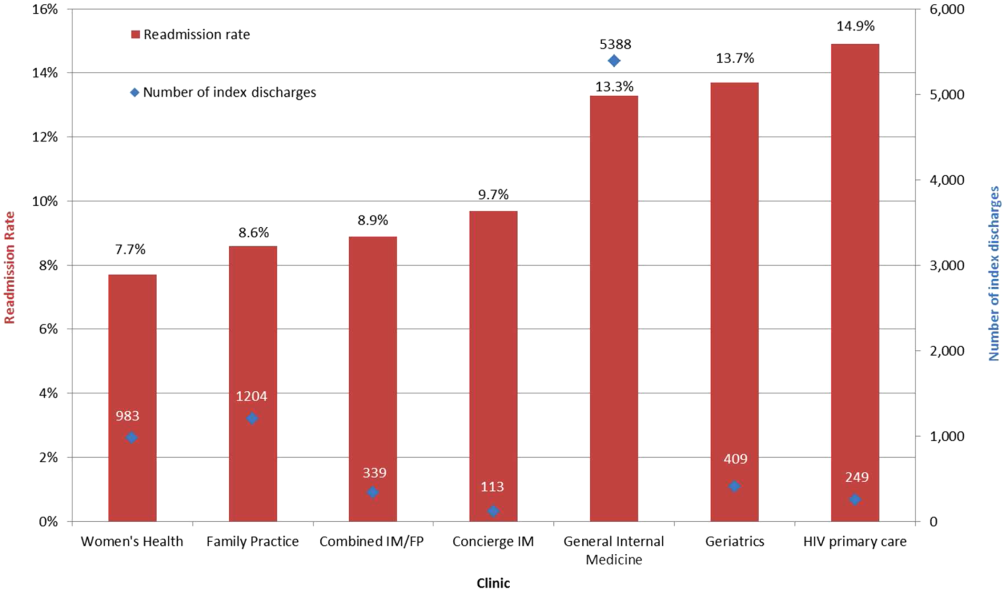
Trends in Blood‐Product Transfusion
Although potentially life saving, blood‐product transfusion is costly and associated with transfusion‐related adverse events, including death on rare occasions. Studies in varied patient populations have demonstrated that a restrictive red blood cell transfusion strategy reduces the number of transfusion‐related adverse effects and can result in improved short‐term survival.[1, 2, 3] In 2011, more than 20 million blood products were transfused in the United States, which resulted in more than 50,000 transfusion‐related adverse reactions (0.24%).[4] With a mean cost of greater than $50 per unit of plasma and $500 per unit of apheresis platelets,[4] the cost of blood transfusion is well in excess of $1 billion per year. Blood‐product transfusion is the most frequent inpatient procedure,[5] and inpatient blood‐product transfusion contributes to the bulk of transfusions nationwide. To study the utilization of blood‐product transfusion in the inpatient population, we studied the temporal trend of inpatient blood‐product transfusions in the United States from 2002 to 2011 using data from the Nationwide Inpatient Sample (NIS), Healthcare Cost and Utilization Project, Agency for Healthcare Research and Quality.[4] The NIS, the largest inpatient care database in the United States, includes approximately a 20% stratified sample of US community hospital admissions and is weighted at discharge level to permit population‐level estimates.[6] We utilized this database to identify the total number of blood‐product transfusions and discharges between 2002 and 2011. We calculated the rate of all blood‐product transfusions, which include packed red blood cell, platelets, and other blood components, using the International Classification of DiseasesNinth Revision, Clinical Modification Procedural Clinical Classification Software code 222.[7] Trend analysis and calculation of average annual percent change were done using the Joinpoint Regression Program version 4.0.4 (National Cancer Institute, Bethesda, MD).[8] This software uses trend data and calculates the best fit lines to create the simplest joinpoint model that the data allow. The model can be expressed as a figure where several different multisegmented trend lines are connected together at the joinpoints. Trend over a fixed prespecified interval was computed as average annual percent change, and the Monte Carlo permutation method was used to test for apparent change in the trends.[9, 10] The study was exempted by the institutional review board of the University of Nebraska Medical Center.
Between 2002 and 2011, there were a total of 24,641,581 blood‐product transfusions among 389,761,571 hospitalizations. The rate of transfusion per 100 hospitalizations increased by 2.9% from 2002 to 2011 (4.6% in 2002 [n=1,767,111] to 7.5% in 2011 [n=2,929,312]) (Figure 1). The average annual percent change from 2002 to 2011 was 5.6% (95% confidence interval [CI]: 3.7‐7.6), which was statistically significant at P0.05. A statistically significant change in trend (joinpoint) was observed in 2004. The annual percent change was 11.2% (95% CI: 0.323.4) from 2002 to 2004 and 4.1% (95% CI: 3.05.1) from 2004 to 2011, both of which were statistically significant at P0.05 (Figure 2).
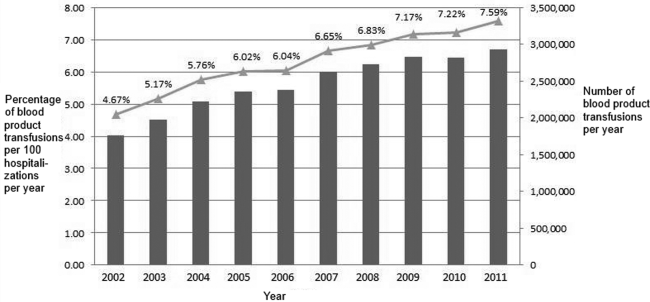
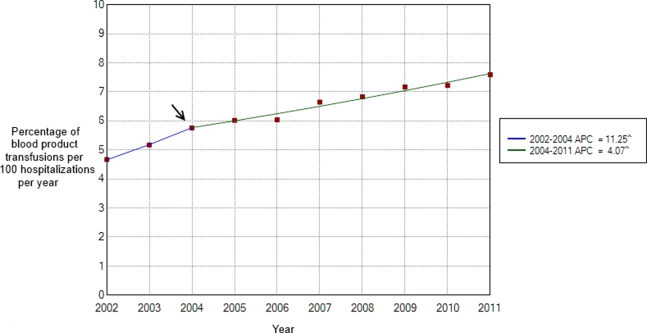
Our study demonstrates an overall increasing trend in the inpatient blood‐product transfusions over the past decade. However, the rate of increase seems to have slowed down since 2004. The National Blood Collection and Utilization Survey[4] demonstrated a decrease of 11.6% in the total number of all components transfused in the United States between 2008 and 2011. Our data are different from the survey, which also included blood transfusions in outpatient settings, emergency departments, and pediatric patients. The rising proportion of aging population with multiple comorbidities and cancers, increases in hematopoietic stem cell/solid organ transplants and chemotherapy, as well as widespread availability of blood products presumably contributed to the continued increase observed in our inpatient data after 2004. Nevertheless, the declining trend in the rate of the increased blood‐product transfusion usage seen after 2004 is encouraging. Increased awareness of restrictive transfusion strategy, coupled with efforts by professional bodies to improve the adoption of restrictive strategies, is most likely responsible for this.[3, 11, 12] As the clinical classification software procedure code 222 lumps together all the different types of blood products, we were unable to study the transfusion trend among each different type of blood products. In conclusion, further efforts need to be directed at increasing the awareness of clinicians, especially hospitalists, about the benefits of a restrictive transfusion policy and decreasing the rate of blood product use in the inpatient service. Furthermore, studies elaborating the patient population who are being transfused and the factors influencing the transfusion trends can provide useful insights to optimize blood‐product utilization and control resource consumption.
Disclosure
Nothing to report.
- , , . Outcomes using lower vs higher hemoglobin thresholds for red blood cell transfusion. JAMA. 2013;309(1):83–84.
- , , , et al. Transfusion strategies for acute upper gastrointestinal bleeding. N Engl J Med. 2013;368(1):11–21.
- , , , . Evidence review: periprocedural use of blood products. J Hosp Med. 2013;8(11):647–652.
- The 2011 National Blood Collection and Utilization Survey Report. Washington, DC: U.S. Department of Health and Human Services, Office of the Assistant Secretary for Health; 2013.
- , , , et al. HCUP facts and figures: statistics on hospital‐based care in the United States. 2009. Agency for Healthcare Research and Quality, Rockville, MD. Available at: http://www.hcup‐us.ahrq.gov/reports.jsp. Accessed January 2, 2014.
- HCUP Nationwide Inpatient Sample (NIS). Healthcare Cost and Utilization Project. 2009–2011. Agency for Healthcare Research and Quality, Rockville, MD. Available at: www.hcup‐us.ahrq.gov/nisoverview.jsp. Accessed December 15, 2013.
- HCUP Clinical Classifications Software (CCS) for ICD‐9‐CM. Healthcare Cost and Utilization Project. 2009–2011. Agency for Healthcare Research and Quality, Rockville, MD. Available at: www.hcup‐us.ahrq.gov/toolssoftware/ccs/ccs.jsp. Accessed December 15, 2013.
- Joinpoint Regression Program, Version 4.0.4, December, 2014. Statistical Methodology and Applications Branch, Surveillance Research Program, National Cancer Institute. Available at: https://surveillance.cancer.gov/joinpoint/download. Accessed December 25, 2013.
- , , , , . Estimating average annual per cent change in trend analysis. Stat Med. 2009;28(29):3670–3682.
- , , , . Permutation tests for joinpoint regression with applications to cancer rates. Stat Med. 2000;19(3):335–351.
- , , , et al. Choosing wisely in adult hospital medicine: five opportunities for improved healthcare value. J Hosp Med. 2013;8(9):486–492.
- , , , . Patient‐centered blood management. J Hosp Med. 2014;9(1):60–65.
Although potentially life saving, blood‐product transfusion is costly and associated with transfusion‐related adverse events, including death on rare occasions. Studies in varied patient populations have demonstrated that a restrictive red blood cell transfusion strategy reduces the number of transfusion‐related adverse effects and can result in improved short‐term survival.[1, 2, 3] In 2011, more than 20 million blood products were transfused in the United States, which resulted in more than 50,000 transfusion‐related adverse reactions (0.24%).[4] With a mean cost of greater than $50 per unit of plasma and $500 per unit of apheresis platelets,[4] the cost of blood transfusion is well in excess of $1 billion per year. Blood‐product transfusion is the most frequent inpatient procedure,[5] and inpatient blood‐product transfusion contributes to the bulk of transfusions nationwide. To study the utilization of blood‐product transfusion in the inpatient population, we studied the temporal trend of inpatient blood‐product transfusions in the United States from 2002 to 2011 using data from the Nationwide Inpatient Sample (NIS), Healthcare Cost and Utilization Project, Agency for Healthcare Research and Quality.[4] The NIS, the largest inpatient care database in the United States, includes approximately a 20% stratified sample of US community hospital admissions and is weighted at discharge level to permit population‐level estimates.[6] We utilized this database to identify the total number of blood‐product transfusions and discharges between 2002 and 2011. We calculated the rate of all blood‐product transfusions, which include packed red blood cell, platelets, and other blood components, using the International Classification of DiseasesNinth Revision, Clinical Modification Procedural Clinical Classification Software code 222.[7] Trend analysis and calculation of average annual percent change were done using the Joinpoint Regression Program version 4.0.4 (National Cancer Institute, Bethesda, MD).[8] This software uses trend data and calculates the best fit lines to create the simplest joinpoint model that the data allow. The model can be expressed as a figure where several different multisegmented trend lines are connected together at the joinpoints. Trend over a fixed prespecified interval was computed as average annual percent change, and the Monte Carlo permutation method was used to test for apparent change in the trends.[9, 10] The study was exempted by the institutional review board of the University of Nebraska Medical Center.
Between 2002 and 2011, there were a total of 24,641,581 blood‐product transfusions among 389,761,571 hospitalizations. The rate of transfusion per 100 hospitalizations increased by 2.9% from 2002 to 2011 (4.6% in 2002 [n=1,767,111] to 7.5% in 2011 [n=2,929,312]) (Figure 1). The average annual percent change from 2002 to 2011 was 5.6% (95% confidence interval [CI]: 3.7‐7.6), which was statistically significant at P0.05. A statistically significant change in trend (joinpoint) was observed in 2004. The annual percent change was 11.2% (95% CI: 0.323.4) from 2002 to 2004 and 4.1% (95% CI: 3.05.1) from 2004 to 2011, both of which were statistically significant at P0.05 (Figure 2).
Our study demonstrates an overall increasing trend in the inpatient blood‐product transfusions over the past decade. However, the rate of increase seems to have slowed down since 2004. The National Blood Collection and Utilization Survey[4] demonstrated a decrease of 11.6% in the total number of all components transfused in the United States between 2008 and 2011. Our data are different from the survey, which also included blood transfusions in outpatient settings, emergency departments, and pediatric patients. The rising proportion of aging population with multiple comorbidities and cancers, increases in hematopoietic stem cell/solid organ transplants and chemotherapy, as well as widespread availability of blood products presumably contributed to the continued increase observed in our inpatient data after 2004. Nevertheless, the declining trend in the rate of the increased blood‐product transfusion usage seen after 2004 is encouraging. Increased awareness of restrictive transfusion strategy, coupled with efforts by professional bodies to improve the adoption of restrictive strategies, is most likely responsible for this.[3, 11, 12] As the clinical classification software procedure code 222 lumps together all the different types of blood products, we were unable to study the transfusion trend among each different type of blood products. In conclusion, further efforts need to be directed at increasing the awareness of clinicians, especially hospitalists, about the benefits of a restrictive transfusion policy and decreasing the rate of blood product use in the inpatient service. Furthermore, studies elaborating the patient population who are being transfused and the factors influencing the transfusion trends can provide useful insights to optimize blood‐product utilization and control resource consumption.
Disclosure
Nothing to report.
- , , . Outcomes using lower vs higher hemoglobin thresholds for red blood cell transfusion. JAMA. 2013;309(1):83–84.
- , , , et al. Transfusion strategies for acute upper gastrointestinal bleeding. N Engl J Med. 2013;368(1):11–21.
- , , , . Evidence review: periprocedural use of blood products. J Hosp Med. 2013;8(11):647–652.
- The 2011 National Blood Collection and Utilization Survey Report. Washington, DC: U.S. Department of Health and Human Services, Office of the Assistant Secretary for Health; 2013.
- , , , et al. HCUP facts and figures: statistics on hospital‐based care in the United States. 2009. Agency for Healthcare Research and Quality, Rockville, MD. Available at: http://www.hcup‐us.ahrq.gov/reports.jsp. Accessed January 2, 2014.
- HCUP Nationwide Inpatient Sample (NIS). Healthcare Cost and Utilization Project. 2009–2011. Agency for Healthcare Research and Quality, Rockville, MD. Available at: www.hcup‐us.ahrq.gov/nisoverview.jsp. Accessed December 15, 2013.
- HCUP Clinical Classifications Software (CCS) for ICD‐9‐CM. Healthcare Cost and Utilization Project. 2009–2011. Agency for Healthcare Research and Quality, Rockville, MD. Available at: www.hcup‐us.ahrq.gov/toolssoftware/ccs/ccs.jsp. Accessed December 15, 2013.
- Joinpoint Regression Program, Version 4.0.4, December, 2014. Statistical Methodology and Applications Branch, Surveillance Research Program, National Cancer Institute. Available at: https://surveillance.cancer.gov/joinpoint/download. Accessed December 25, 2013.
- , , , , . Estimating average annual per cent change in trend analysis. Stat Med. 2009;28(29):3670–3682.
- , , , . Permutation tests for joinpoint regression with applications to cancer rates. Stat Med. 2000;19(3):335–351.
- , , , et al. Choosing wisely in adult hospital medicine: five opportunities for improved healthcare value. J Hosp Med. 2013;8(9):486–492.
- , , , . Patient‐centered blood management. J Hosp Med. 2014;9(1):60–65.

Bedside Interprofessional Rounds
Interprofessional collaborative care (IPCC) involves members from different professions working together to enhance communication, coordination, and healthcare quality.[1, 2, 3] Because several current healthcare policy initiatives include financial incentives for increased quality of care, there has been resultant interest in the implementation of IPCC in healthcare systems.[4, 5] Unfortunately, many hospitals have found IPCC difficult to achieve. Hospital‐based medicine units are complex, time‐constrained environments requiring a high degree of collaboration and mutual decision‐making between nurses, physicians, therapists, pharmacists, care coordinators, and patients. In addition, despite recommendations for interprofessional collaborative care, the implementation and assessment of IPCC within this environment has not been well studied.[6, 7]
On academic internal medicine services, the majority of care decisions occur during rounds. Although rounds provide a common structure, the participants, length, location, and agenda of rounds tend to vary by institution and individual physician preference.[8, 9, 10, 11] Traditionally, ward rounds occur mostly in hallways and conference rooms rather than the patient's bedside.[12] Additionally, during rounds, nurse‐physician collaboration occurs infrequently, estimated at <10% of rounding time.[13] Recently, an increased focus on quality, safety, and collaboration has inspired the investigation and implementation of new methods to increase interprofessional collaboration during rounds, but many of these interventions occurred away from the patient's bedside.[14, 15] One trial of bedside interprofessional rounds (BIRs) by Curley et al. suggested improvements in patient‐level outcomes (cost and length of stay) versus traditional physician‐based rounds.[16] Although interprofessional nurse‐physician rounds at patients' bedsides may represent an ideal process, limited work has investigated this activity.[17]
A prerequisite for successful and sustained integration of BIRs is a shared conceptualization among physicians and nurses regarding the process. Such a shared conceptualization would include perceptions of benefits and barriers to implementation.[18] Currently, such perceptions have not been measured. In this study, we sought to evaluate perceptions of front‐line care providers on inpatient units, specifically nursing staff, attending physicians, and housestaff physicians, regarding the benefits and barriers to BIRs.
METHODS
Study Design and Participants
In June 2013, we performed a cross‐sectional assessment of front‐line providers caring for patients on the internal medicine services in our academic hospital. Participants included medicine nursing staff in acute care and intermediate care units, medicine and combined medicine‐pediatrics housestaff physicians, and general internal medicine faculty physicians who supervised the housestaff physicians.
Study Setting
The study was conducted at a 378‐bed, university‐based, acute care teaching hospital in central Pennsylvania. There are a total of 64 internal medicine beds located in2 units, a general medicine unit (44 beds, staffed by 60 nurses, nurse‐to‐patient ratio 1:4) and an intermediate care unit (20 beds, staffed by 41 nurses, nurse‐to‐patient ratio 1:3). Both units are staffed by the general internal medicine physician teams. The academic medicine residency program consists of 69 internal medicine housestaff and 14 combined internal medicine‐pediatrics housestaff. Five teams, organized into 3 academic teaching teams and 2 nonteaching teams, provide care for all patients admitted to the medicine units. Teaching teams consist of 1 junior (postgraduate year [PGY]2) or senior (PGY34) housestaff member, 2 interns (PGY1), 2 medical students, and 1 attending physician.
There are several main features of BIRs in our medicine units. The rounding team of physicians alerts the assigned nurse about the start of rounds. In our main medicine unit, each doorway is equipped with a light that allows the physician team to indicate the start of the BIRs encounter. Case presentations by trainees occur either in the hallway or bedside, at the discretion of the attending physician. During bedside encounters, nurses typically contribute to the discussion about clinical status, decision making, patient concerns, and disposition. Patients are encouraged to contribute to the discussion and are provided the opportunity to ask questions.
For the purposes of this study, we specifically defined BIRs as: encounters that include the team of providers, at least 2 physicians plus a nurse or other care provider, discussing the case at the patient's bedside. In our prior work performed during the same time period as this study, we used the same definition to examine the incidence of and time spent in BIRs in both of our medicine units.[19] We found that 63% to 81% of patients in both units received BIRs. As a result, we assumed all nursing staff, attending physicians, and housestaff physicians had experienced this process, and their responses to this survey were contextualized in these experiences.
Survey Instrument
We developed a survey instrument specifically for this study. We derived items primarily from our prior qualitative work on physician‐based team bedside rounds and a literature review.[20, 21, 22, 23, 24, 25] For the benefits to BIRs, we developed items related to 5 domains, including factors related to the patient, education, communication/coordination/teamwork, efficiency and process, and outcomes.[20, 26] For the barriers to BIRs, we developed items related to 4 domains, including factors related to the patient, time, systems issues, and providers (nurses, attending physicians, and housestaff physicians).[22, 24, 25] We included our definition of BIRs into the survey instructions. We pilot tested the survey with 3 medicine faculty and 3 nursing staff and, based on our pilot, modified several questions to improve clarity. Primary demographic items in the survey included identification of provider role (nurses, attending physicians, or housestaff physicians) and years in the current role. Respondent preference for the benefits and barriers were investigated on a 7‐point scale (1=lowest response and 7=high response possible). Descriptive text was provided at the extremes (choice 1 and 7), but intermediary values (26) did not have descriptive cues.[27] As an incentive, the end of the survey provided respondents with an option for submitting their name to be entered into a raffle to win 1 of 50, $5 gift certificates to a coffee shop.
Prior to the end of the academic year in June 2013, we sent a survey link via e‐mail to all medicine nursing staff, housestaff physicians, and attending physicians. The email described the study and explained the voluntary nature of the work, and that informed consent would be implied by survey completion. Following the initial e‐mail, 3 additional weekly e‐mail reminders were sent by the lead investigator. The study was approved by the institutional review board at the Pennsylvania State College of Medicine.
Data Analysis
Descriptive statistics were used to examine the characteristics of the 3 respondent groups and combined totals for each survey item. The nonparametric Wilcoxon rank sum test was used to compare the average values between groups (nursing staff vs all physicians, attending physicians vs housestaff physicians) for both sets of survey variables (benefits and barriers). The nonparametric correlation statistical test Spearman rank was used to assess the degree of correlation between respondent groups for both survey variables. The data were analyzed using SAS 9.3 (SAS Institute, Cary, NC) and Stata/IC‐8 (StataCorp, College Station, Texas).
RESULTS
Of the 171 surveys sent, 149 participants completed surveys (response rate 87%). Responses were received from 53/58 nursing staff (91% response), 21/28 attending physicians (75% response), and 75/85 housestaff physicians (88% response). Table 1 describes the participant response demographics.
| Variable | Value |
|---|---|
| |
| Nursing staff, n=58, n (%) | 53 (36) |
| Intermediate care unit, n (%) | 14 (26) |
| General medicine ward, n (%) | 39 (74) |
| All day shifts, n (%) | 25 (47) |
| Mix of day and night shifts, n (%) | 32 (60) |
| Years of experience, mean (SD) | 7.4 (9) |
| Attending physicians, n=28, n (%) | 21 (14) |
| Years since residency graduation, mean (SD) | 10.5 (8) |
| No. of weeks in past year serving as teaching attending, mean (SD) | 9.1(8) |
| Housestaff physicians (n=85), n (%) | 75 (50) |
| Intern, n (%) | 28 (37) |
| Junior resident, n (%) | 25 (33) |
| Senior resident, n (%)a | 22 (29) |
Benefits of BIRs
Respondents' perceptions of the benefits of BIRs are shown by mean value (between 1 and 7) for the total respondent pool and by each participant group (Table 2). Six of the 7 highest‐ranked benefits were related to communication, coordination, and teamwork, including improves communication between nurses and physicians, improves awareness of clinical issues that need to be addressed, and improves team‐building between nurses and physicians. Lowest‐ranked benefits were related to efficiency, process, and outcomes, including decreases patients' hospital length‐of‐stay, improves timeliness of consultations, and reduces ordering of unnecessary tests and treatments. Comparing mean values among the 3 groups, all 18 items showed statistical differences in response rates (all P values <0.05). Nursing staff reported more favorable ratings than both attending physicians and housestaff physicians for each of the 18 items, whereas attending physicians reported more favorable ratings than housestaff physicians in 16/18 items. The rank order among provider groups showed a high degree of correlation (r=0.92, P<0.001).
| Survey Itema | Item Domain | Total, N=149, Mean (SD) | Nurses, N=53, Mean (SD) | Attending Physicians, N=21, Mean (SD) | House staff Physicians, N=75, Mean (SD)b |
|---|---|---|---|---|---|
| |||||
| Improves communication between nurses and physicians. | CCT | 6.26 (1.11) | 6.74 (0.59)c | 6.52 (1.03)d | 5.85 (1.26) |
| Improves awareness of clinical issues needing to be addressed. | CCT | 6.05 (1.12) | 6.57 (0.64)c | 5.95 (1.07) | 5.71 (1.26) |
| Improves team‐building between nurses and physicians. | CCT | 6.03 (1.32) | 6.72 (0.60)c | 6.14 (1.11) | 5.52 (1.51) |
| Improves coordination of the patient's care. | CCT | 5.98 (1.34) | 6.60 (0.72)c | 6.00 (1.18) | 5.53 (1.55) |
| Improves nursing contributions to a patient's care plan. | CCT | 5.91 (1.25) | 6.47 (0.77)c | 6.14 (0.85) | 5.44 (1.43) |
| Improves quality of care delivered in our unit. | O | 5.72 (1.42) | 6.34 (0.83)c | 5.81 (1.33) | 5.25 (1.61) |
| Improves appreciation of the roles/contributions of other providers. | CCT | 5.69 (1.49) | 6.36 (0.86)c | 5.90 (1.04) | 5.16 (1.73) |
| Promotes shared decision making between patients and providers. | P | 5.62 (1.51) | 6.43 (0.77)c | 5.57 (1.40) | 5.05 (1.68) |
| Improves patients' satisfaction with their hospitalization. | P, O | 5.53 (1.40) | 6.15 (0.95)c | 5.38 (1.12) | 5.13 (1.58) |
| Provides more respect/dignity to patients. | P | 5.31 (1.55) | 6.23 (0.89)c | 5.10 (1.18) | 4.72 (1.71) |
| Decreases number of pages/phone calls between nurses and physicians. | EP | 5.28 (1.82) | 6.28 (0.93)c | 5.24 (1.30) | 4.57 (2.09) |
| Improves educational opportunities for housestaff/students. | E | 5.07 (1.77) | 6.08 (0.98)c | 4.81 (1.60) | 4.43 (1.93) |
| Improves the efficiency of your work. | EP | 5.01 (1.77) | 6.04 (1.13)c | 4.90 (1.30) | 4.31 (1.92) |
| Improves adherence to evidence‐based guidelines or interventions. | EP | 4.89 (1.79) | 6.06 (0.91)c | 4.00 (1.18) | 4.31 (1.97) |
| Improves the accuracy of your sign‐outs (or reports) to the next shift. | EP | 4.80 (1.99) | 6.30 (0.93)c | 4.05 (1.66) | 3.95 (2.01) |
| Reduces ordering of unnecessary tests and treatments. | O | 4.51 (1.86) | 5.77 (1.15)c | 3.86 (1.11) | 3.8 (1.97) |
| Improves the timeliness of consultations. | EP | 4.28 (1.99) | 5.66 (1.22)c | 3.24 (1.48) | 3.59 (2.02) |
| Decreases patients' hospital length of stay. | O | 4.15 (1.68) | 5.04 (1.24)c | 3.95 (1.16) | 3.57 (1.81) |
Barriers to BIRs
Respondents' perceptions of barriers to BIRs are shown by mean value (between 1 and 7) for the total respondent pool and by each participant group (Table 3). The 6 highest‐ranked barriers were related to time, including nursing staff have limited time, the time required for bedside nurse‐physician encounters, and coordinating the start time of encounters with arrival of both physicians and nursing. The lowest‐ranked barriers were related to provider‐ and patient‐related factors, including patient lack of comfort with bedside nurse‐physician encounters, attending physicians/housestaff lack bedside skills, and attending physicians lack comfort with bedside nurse‐physician encounters. Comparing mean values between groups, 10 of 21 items showed statistical differences (P<0.05). The rank order among groups showed moderate correlation (nurses‐attending physicians r=0.62, nurses‐housestaff physicians r=0.76, attending physicians‐housestaff physicians r=0.82). A qualitative inspection of disparities among respondent groups highlighted that nursing staff were more likely to rank bedside rounds are not part of the unit's culture lower than physician groups.
| Survey Itema | Item Domain | Total, N=149, Mean (SD) | Nurses, n=53, Mean (SD) | Attending Physicians, n=21, Mean (SD) | Housestaff Physicians, n=75,b Mean (SD) |
|---|---|---|---|---|---|
| |||||
| Nursing staff have limited time. | T | 4.89 (1.34) | 4.96 (1.27) | 4.86 (1.65) | 4.85 (1.30) |
| Coordinating start time of encounters with arrival of physicians and nursing. | T | 4.80 (1.50) | 4.58 (1.43) | 5.24 (1.45) | 4.84 (1.55) |
| Housestaff have limited time. | T | 4.68 (1.47) | 4.56 (1.26) | 4.24 (1.81) | 4.89 (1.48) |
| Attending physicians have limited time. | T | 4.50 (1.49) | 4.81 (1.34) | 4.33 (1.65) | 4.34 (1.53) |
| Other acutely sick patients in unit. | T | 4.39 (1.42) | 4.79 (1.30)c | 4.52 (1.21) | 4.08 (1.49) |
| Time required for bedside nurse‐physician encounters. | T | 4.32 (1.55) | 4.85 (1.38)c | 3.62 (1.80) | 4.15 (1.49) |
| Lack of use of the pink‐rounding light to alert nursing staff. | S | 3.77 (1.75) | 4.71 (1.70)c | 3.48 (1.86) | 3.19 (1.46) |
| Patient not available (eg, off to test, getting bathed) | S | 3.74 (1.40) | 3.98 (1.28) | 4.52 (1.36)d | 3.35 (1.37) |
| Large team size. | S | 3.64 (1.74) | 3.12 (1.58)c | 3.95 (1.83) | 3.92 (1.77) |
| Patients in dispersed locations (eg, other units or in different hallways). | S | 3.64 (1.77) | 2.77 (1.55)c | 4.52 (1.83) | 4.00 (1.66) |
| Bedside nurse‐physician rounds are not part of the unit's culture. | S | 3.35 (1.94) | 2.25 (1.47)c | 4.76 (1.92) | 3.72 (1.85) |
| Limitations in physical facilities (eg, rooms too small, limited chairs). | S | 3.25 (1.71) | 2.71 (1.72) | 3.33 (1.71) | 3.59 (1.62) |
| Insufficient nurse engagement during bedside nurse‐physician encounters. | PR | 3.24 (1.63) | 2.71 (1.47)c | 3.67 (1.68) | 3.49 (1.65) |
| Patient on contact or respiratory isolation. | S | 3.20 (1.82) | 2.42 (1.67)c | 3.43 (1.63) | 3.69 (1.80) |
| Language barrier between providers and patients. | P | 2.69 (1.37) | 2.77 (1.39) | 2.57 (1.08) | 2.68 (1.43) |
| Privacy/sensitive patient issues. | P | 2.65 (1.45) | 2.27 (1.24) | 2.57 (1.33) | 2.93 (1.56) |
| Housestaff lack comfort with bedside nurse‐physician encounters. | PR | 2.55 (1.49) | 2.48 (1.15) | 2.67 (1.68) | 2.57 (1.65) |
| Nurses lack comfort with bedside nurse‐physician encounters. | PR | 2.45 (1.45) | 2.35 (1.27) | 2.48 (1.66) | 2.51 (1.53) |
| Attending physicians lack comfort with bedside nurse‐physician encounters. | PR | 2.35 (1.38) | 2.33 (1.25) | 2.33 (1.62) | 2.36 (1.41) |
| Attending physician/housestaff lack bedside skills (eg, history, exam). | PR | 2.34 (1.34) | 2.19 (1.19) | 2.85 (1.69) | 2.30 (1.32) |
| Patient lack of comfort with bedside nurse‐physician encounters. | P | 2.33 (1.48) | 2.23 (1.37) | 1.95 (1.32) | 2.5 (1.59) |
DISCUSSION
In this study, we sought to compare perceptions of nurses and physicians on the benefits and barriers to BIRs. Nursing staff ranked each benefit higher than physicians, though rank orders of specific benefits were highly correlated. Highest‐ranked benefits related to coordination and communication more than quality or process benefits. Across groups, the highest‐ranked barriers to BIRs were related to time, whereas the lowest‐ranked factors were related to provider and patient discomfort. These results highlight important similarities and differences in perceptions between front‐line providers.
The highest‐ranked benefits were related to improved interprofessional communication and coordination. Combining interprofessional team members during care delivery allows for integrated understanding of daily care plans and clinical issues, and fosters collaboration and a team‐based atmosphere.[1, 20, 26] The lowest‐ranked benefits were related to more tangible measures, including length of stay, timely consultations, and judicious laboratory ordering. This finding contrasts with the limited literature demonstrating increased efficiency in general medicine units practicing IPCC.[16] These rankings may reflect a poor understanding or self‐assessment of outcome measures by healthcare providers, representing a potential focus for educational initiatives. Future investigations using objective assessment methods of outcomes and collaboration will provide a more accurate understanding of these findings.
The highest‐ranked barriers were related to time and systems issues. Several studies of physician‐based bedside rounds have identified systems‐ and time‐related issues as primary limiting barriers.[22, 24] In units without colocalization of patients and providers, finding receptive times for BIRs can be difficult. Although time‐related issues could be addressed by decreasing patient‐provider ratios, these changes require substantial investment in resources. A reasonable degree of improvement in efficiency and coordination is expected following acclimation to BIRs or by addressing modifiable systems factors to increase this activity. Less costly interventions, such as tailoring provider schedules, prescheduling patient rounding times, and geographic colocalization of patients and providers may be more feasible. However, the clinical microsystems within which medicine patients are cared for are often chaotic and disorganized at the infrastructural and cultural levels, which may be less influenced by surface‐level interventions. Such interventions may be ward specific and require customization to individual team needs.
The lowest‐ranked barriers to BIRs were related to provider‐ and patient‐related factors, including comfort level of patients and providers. Prior work on bedside rounds has identified physicians who are apprehensive about performing bedside rounds, but those who experience this activity are more likely to be comfortable with it.[12, 28] Our results from a culture where BIRs occur on nearly two‐thirds of patients suggest provider discomfort is not a predominant barrier.[22, 29] Additionally, educators have raised concerns about patient discomfort with bedside rounds, but nearly all studies evaluating patients' perspectives reveal patient preference for bedside case presentations over activities occurring in alternative locations.[30, 31, 32] Little work has investigated patient preference for BIRs as per our definition; our participants do not believe patients are discomforted by BIRs, building upon evidence in the literature for patient preferences regarding bedside activities.
Nursing staff perceptions of the benefits and culture related to BIRs were more positive than physicians. We hypothesize several reasons for this disparity. First, nursing staff may have more experience with observing and understanding the positive impact of BIRs and therefore are more likely to understand the positive ramifications. Alternatively, nursing staff may be satisfied with active integration into traditional physician‐centric decisions. Additionally, the professional culture and educational foundation of the nursing culture is based upon a patient‐centered approach and therefore may be more aligned with the goals of BIRs. Last, physicians may have competing priorities, favoring productivity and didactic learning rather than interprofessional collaboration. Further investigation is required to understand differences between nurses and physicians, in addition to other providers integral to BIRs (eg, care coordinators, pharmacists). Regardless, during the implementation of interprofessional collaborative care models, our findings suggest initial challenges, and the focus of educational initiatives may necessitate acclimating physician groups to benefits identified by front‐line nursing staff.
There are several limitations to our study. We investigated the perceptions of medicine nurses and physicians in 1 teaching hospital, limiting generalizability to other specialties, other vital professional groups, and nonteaching hospitals. Additionally, BIRs has been a focus of our hospital for several years. Therefore, perceived barriers may differ in BIRs‐nave hospitals. Second, although pilot‐tested for content, the construct validity of the instrument was not rigorously assessed, and the instrument was not designed to measure benefits and barriers not explicitly identified during pilot testing. Last, although surveys were anonymous, the possibility of social desirability bias exists, thereby limiting accuracy.
For over a century, physician‐led rounds have been the preferred modality for point‐of‐care decision making.[10, 15, 32, 33] BIRs address our growing understanding of patient‐centered care. Future efforts should address the quality of collaboration and current hospital and unit structures hindering patient‐centered IPCC and patient outcomes.
Acknowledgements
The authors thank the medicine nursing staff and physicians for their dedication to patient‐centered care and willingness to participate in this study.
Disclosures: The Department of Medicine at the Penn State Hershey Medical Center provided funding for this project. There are no conflicts of interest to report.
- , , . Interprofessional collaboration: effects of practice‐based interventions on professional practice and healthcare outcomes. Cochrane Database Syst Rev. 2009(3):CD000072.
- . Teamswork! Hosp Health Netw. 2012;86(3):24–27, 21.
- , , , . The coming of age for interprofessional education and practice. Am J Med. 2013;126(4):284–288.
- , . Payment incentives and integrated care delivery: levers for health system reform and cost containment. Inquiry. 2011;48(4):277–287.
- . Payment reform and the mission of academic medical centers. N Engl J Med. 2010;363(19):1784–1786.
- Josiah Macy Jr. Foundation. Transforming patient care: aligning interprofessional education and clinical practice redesign. In: Proceedings of the Josiah Macy Jr. Foundation Conference; January 17–20, 2013; Atlanta, GA.
- , , , . Bridging the quality chasm: interprofessional teams to the rescue? Am J Med. 2013;126(4):276–277.
- . Attending rounds: guidelines for teaching on the wards. J Gen Intern Med. 1992;7(1):68–75.
- , . Teaching at the bedside: a new model. Med Teach. 2003;25(2):127–130.
- . On bedside teaching. Ann Intern Med. 1997;126(3):217–220.
- , , , . Relationships of the location and content of rounds to specialty, institution, patient‐census, and team size. PloS One. 2010;5(6):e11246.
- , , , . Attending rounds and bedside case presentations: medical student and medicine resident experiences and attitudes. Teach Learn Med. 2009;21(2):105–110.
- , , , et al. Attending rounds in the current era: what is and is not happening. JAMA Intern Med. 2013;173(12):1084–1089.
- , , , et al. Structured interdisciplinary rounds in a medical teaching unit: improving patient safety. Arch Intern Med. 2011;171(7):678–684.
- , , , , . Use of multidisciplinary rounds to simultaneously improve quality outcomes, enhance resident education, and shorten length of stay. J Gen Intern Med. 2007;22(8):1073–1079.
- , , . A firm trial of interdisciplinary rounds on the inpatient medical wards: an intervention designed using continuous quality improvement. Med Care. 1998;36(8 suppl):AS4–AS12.
- , , , . A randomized, controlled trial of bedside versus conference‐room case presentation in a pediatric intensive care unit. Pediatrics. 2007;120(2):275–280.
- , . The challenge of innovation implementation. Acad Manage Rev. 1996;21(4):1055–1080.
- , , , . Ocular dipping in creutzfeldt‐jakob disease. J Clin Neurol. 2014;10(2):162–165.
- , , , et al. The value of bedside rounds: a multicenter qualitative study. Teach Learn Med. 2013;25(4):326–333.
- , , , et al. The art of bedside rounds: a multi‐center qualitative study of strategies used by experienced bedside teachers. J Gen Intern Med. 2013;28(3):412–420.
- , , , et al. Identifying and overcoming the barriers to bedside rounds: a multicenter qualitative study. Acad Med. 2014;89(2):326–334.
- , . Bedside teaching in medical education: a literature review. Perspec Med Educ. 2014;3(2):76–88.
- , , . Impediments to bed‐side teaching. Med Educ. 1998;32(2):159–162.
- , , , . Whither bedside teaching? A focus‐group study of clinical teachers. Acad Med. 2003;78(4):384–390.
- , . Staff preference for multidisciplinary rounding practices in the critical care setting. 2011. Paper presented at: Design July 6–10, 2011. Boston, MA. Available at: http://www.designandhealth.com/uploaded/documents/Awards‐and‐events/WCDH2011/Presentations/Friday/Session‐8/DianaAnderson.pdf. Accessed July 6, 2014.
- , . Health Measurement Scales: A Practical Guide to Their Development and Use. 2nd ed. New York, NY: Oxford University Press; 1995.
- , , . Student and patient perspectives on bedside teaching. Med Educ. 1997;31(5):341–346.
- , , , , , . The positive impact of portfolios on health care assistants' clinical practice. J Eval Clin Pract. 2008;14(1):172–174.
- , , , . The physiologic and psychological effects of the bedside presentation. N Engl J Med. 1989;321(18):1273–1275.
- , , , , . The effect of bedside case presentations on patients' perceptions of their medical care. N Engl J Med. 1997;336(16):1150–1155.
- , , , . The return of bedside rounds: an educational intervention. J Gen Intern Med. 2010;25(8):792–798.
- . Bedside rounds revisited. N Engl J Med. 1997;336(16):1174–1175.
Interprofessional collaborative care (IPCC) involves members from different professions working together to enhance communication, coordination, and healthcare quality.[1, 2, 3] Because several current healthcare policy initiatives include financial incentives for increased quality of care, there has been resultant interest in the implementation of IPCC in healthcare systems.[4, 5] Unfortunately, many hospitals have found IPCC difficult to achieve. Hospital‐based medicine units are complex, time‐constrained environments requiring a high degree of collaboration and mutual decision‐making between nurses, physicians, therapists, pharmacists, care coordinators, and patients. In addition, despite recommendations for interprofessional collaborative care, the implementation and assessment of IPCC within this environment has not been well studied.[6, 7]
On academic internal medicine services, the majority of care decisions occur during rounds. Although rounds provide a common structure, the participants, length, location, and agenda of rounds tend to vary by institution and individual physician preference.[8, 9, 10, 11] Traditionally, ward rounds occur mostly in hallways and conference rooms rather than the patient's bedside.[12] Additionally, during rounds, nurse‐physician collaboration occurs infrequently, estimated at <10% of rounding time.[13] Recently, an increased focus on quality, safety, and collaboration has inspired the investigation and implementation of new methods to increase interprofessional collaboration during rounds, but many of these interventions occurred away from the patient's bedside.[14, 15] One trial of bedside interprofessional rounds (BIRs) by Curley et al. suggested improvements in patient‐level outcomes (cost and length of stay) versus traditional physician‐based rounds.[16] Although interprofessional nurse‐physician rounds at patients' bedsides may represent an ideal process, limited work has investigated this activity.[17]
A prerequisite for successful and sustained integration of BIRs is a shared conceptualization among physicians and nurses regarding the process. Such a shared conceptualization would include perceptions of benefits and barriers to implementation.[18] Currently, such perceptions have not been measured. In this study, we sought to evaluate perceptions of front‐line care providers on inpatient units, specifically nursing staff, attending physicians, and housestaff physicians, regarding the benefits and barriers to BIRs.
METHODS
Study Design and Participants
In June 2013, we performed a cross‐sectional assessment of front‐line providers caring for patients on the internal medicine services in our academic hospital. Participants included medicine nursing staff in acute care and intermediate care units, medicine and combined medicine‐pediatrics housestaff physicians, and general internal medicine faculty physicians who supervised the housestaff physicians.
Study Setting
The study was conducted at a 378‐bed, university‐based, acute care teaching hospital in central Pennsylvania. There are a total of 64 internal medicine beds located in2 units, a general medicine unit (44 beds, staffed by 60 nurses, nurse‐to‐patient ratio 1:4) and an intermediate care unit (20 beds, staffed by 41 nurses, nurse‐to‐patient ratio 1:3). Both units are staffed by the general internal medicine physician teams. The academic medicine residency program consists of 69 internal medicine housestaff and 14 combined internal medicine‐pediatrics housestaff. Five teams, organized into 3 academic teaching teams and 2 nonteaching teams, provide care for all patients admitted to the medicine units. Teaching teams consist of 1 junior (postgraduate year [PGY]2) or senior (PGY34) housestaff member, 2 interns (PGY1), 2 medical students, and 1 attending physician.
There are several main features of BIRs in our medicine units. The rounding team of physicians alerts the assigned nurse about the start of rounds. In our main medicine unit, each doorway is equipped with a light that allows the physician team to indicate the start of the BIRs encounter. Case presentations by trainees occur either in the hallway or bedside, at the discretion of the attending physician. During bedside encounters, nurses typically contribute to the discussion about clinical status, decision making, patient concerns, and disposition. Patients are encouraged to contribute to the discussion and are provided the opportunity to ask questions.
For the purposes of this study, we specifically defined BIRs as: encounters that include the team of providers, at least 2 physicians plus a nurse or other care provider, discussing the case at the patient's bedside. In our prior work performed during the same time period as this study, we used the same definition to examine the incidence of and time spent in BIRs in both of our medicine units.[19] We found that 63% to 81% of patients in both units received BIRs. As a result, we assumed all nursing staff, attending physicians, and housestaff physicians had experienced this process, and their responses to this survey were contextualized in these experiences.
Survey Instrument
We developed a survey instrument specifically for this study. We derived items primarily from our prior qualitative work on physician‐based team bedside rounds and a literature review.[20, 21, 22, 23, 24, 25] For the benefits to BIRs, we developed items related to 5 domains, including factors related to the patient, education, communication/coordination/teamwork, efficiency and process, and outcomes.[20, 26] For the barriers to BIRs, we developed items related to 4 domains, including factors related to the patient, time, systems issues, and providers (nurses, attending physicians, and housestaff physicians).[22, 24, 25] We included our definition of BIRs into the survey instructions. We pilot tested the survey with 3 medicine faculty and 3 nursing staff and, based on our pilot, modified several questions to improve clarity. Primary demographic items in the survey included identification of provider role (nurses, attending physicians, or housestaff physicians) and years in the current role. Respondent preference for the benefits and barriers were investigated on a 7‐point scale (1=lowest response and 7=high response possible). Descriptive text was provided at the extremes (choice 1 and 7), but intermediary values (26) did not have descriptive cues.[27] As an incentive, the end of the survey provided respondents with an option for submitting their name to be entered into a raffle to win 1 of 50, $5 gift certificates to a coffee shop.
Prior to the end of the academic year in June 2013, we sent a survey link via e‐mail to all medicine nursing staff, housestaff physicians, and attending physicians. The email described the study and explained the voluntary nature of the work, and that informed consent would be implied by survey completion. Following the initial e‐mail, 3 additional weekly e‐mail reminders were sent by the lead investigator. The study was approved by the institutional review board at the Pennsylvania State College of Medicine.
Data Analysis
Descriptive statistics were used to examine the characteristics of the 3 respondent groups and combined totals for each survey item. The nonparametric Wilcoxon rank sum test was used to compare the average values between groups (nursing staff vs all physicians, attending physicians vs housestaff physicians) for both sets of survey variables (benefits and barriers). The nonparametric correlation statistical test Spearman rank was used to assess the degree of correlation between respondent groups for both survey variables. The data were analyzed using SAS 9.3 (SAS Institute, Cary, NC) and Stata/IC‐8 (StataCorp, College Station, Texas).
RESULTS
Of the 171 surveys sent, 149 participants completed surveys (response rate 87%). Responses were received from 53/58 nursing staff (91% response), 21/28 attending physicians (75% response), and 75/85 housestaff physicians (88% response). Table 1 describes the participant response demographics.
| Variable | Value |
|---|---|
| |
| Nursing staff, n=58, n (%) | 53 (36) |
| Intermediate care unit, n (%) | 14 (26) |
| General medicine ward, n (%) | 39 (74) |
| All day shifts, n (%) | 25 (47) |
| Mix of day and night shifts, n (%) | 32 (60) |
| Years of experience, mean (SD) | 7.4 (9) |
| Attending physicians, n=28, n (%) | 21 (14) |
| Years since residency graduation, mean (SD) | 10.5 (8) |
| No. of weeks in past year serving as teaching attending, mean (SD) | 9.1(8) |
| Housestaff physicians (n=85), n (%) | 75 (50) |
| Intern, n (%) | 28 (37) |
| Junior resident, n (%) | 25 (33) |
| Senior resident, n (%)a | 22 (29) |
Benefits of BIRs
Respondents' perceptions of the benefits of BIRs are shown by mean value (between 1 and 7) for the total respondent pool and by each participant group (Table 2). Six of the 7 highest‐ranked benefits were related to communication, coordination, and teamwork, including improves communication between nurses and physicians, improves awareness of clinical issues that need to be addressed, and improves team‐building between nurses and physicians. Lowest‐ranked benefits were related to efficiency, process, and outcomes, including decreases patients' hospital length‐of‐stay, improves timeliness of consultations, and reduces ordering of unnecessary tests and treatments. Comparing mean values among the 3 groups, all 18 items showed statistical differences in response rates (all P values <0.05). Nursing staff reported more favorable ratings than both attending physicians and housestaff physicians for each of the 18 items, whereas attending physicians reported more favorable ratings than housestaff physicians in 16/18 items. The rank order among provider groups showed a high degree of correlation (r=0.92, P<0.001).
| Survey Itema | Item Domain | Total, N=149, Mean (SD) | Nurses, N=53, Mean (SD) | Attending Physicians, N=21, Mean (SD) | House staff Physicians, N=75, Mean (SD)b |
|---|---|---|---|---|---|
| |||||
| Improves communication between nurses and physicians. | CCT | 6.26 (1.11) | 6.74 (0.59)c | 6.52 (1.03)d | 5.85 (1.26) |
| Improves awareness of clinical issues needing to be addressed. | CCT | 6.05 (1.12) | 6.57 (0.64)c | 5.95 (1.07) | 5.71 (1.26) |
| Improves team‐building between nurses and physicians. | CCT | 6.03 (1.32) | 6.72 (0.60)c | 6.14 (1.11) | 5.52 (1.51) |
| Improves coordination of the patient's care. | CCT | 5.98 (1.34) | 6.60 (0.72)c | 6.00 (1.18) | 5.53 (1.55) |
| Improves nursing contributions to a patient's care plan. | CCT | 5.91 (1.25) | 6.47 (0.77)c | 6.14 (0.85) | 5.44 (1.43) |
| Improves quality of care delivered in our unit. | O | 5.72 (1.42) | 6.34 (0.83)c | 5.81 (1.33) | 5.25 (1.61) |
| Improves appreciation of the roles/contributions of other providers. | CCT | 5.69 (1.49) | 6.36 (0.86)c | 5.90 (1.04) | 5.16 (1.73) |
| Promotes shared decision making between patients and providers. | P | 5.62 (1.51) | 6.43 (0.77)c | 5.57 (1.40) | 5.05 (1.68) |
| Improves patients' satisfaction with their hospitalization. | P, O | 5.53 (1.40) | 6.15 (0.95)c | 5.38 (1.12) | 5.13 (1.58) |
| Provides more respect/dignity to patients. | P | 5.31 (1.55) | 6.23 (0.89)c | 5.10 (1.18) | 4.72 (1.71) |
| Decreases number of pages/phone calls between nurses and physicians. | EP | 5.28 (1.82) | 6.28 (0.93)c | 5.24 (1.30) | 4.57 (2.09) |
| Improves educational opportunities for housestaff/students. | E | 5.07 (1.77) | 6.08 (0.98)c | 4.81 (1.60) | 4.43 (1.93) |
| Improves the efficiency of your work. | EP | 5.01 (1.77) | 6.04 (1.13)c | 4.90 (1.30) | 4.31 (1.92) |
| Improves adherence to evidence‐based guidelines or interventions. | EP | 4.89 (1.79) | 6.06 (0.91)c | 4.00 (1.18) | 4.31 (1.97) |
| Improves the accuracy of your sign‐outs (or reports) to the next shift. | EP | 4.80 (1.99) | 6.30 (0.93)c | 4.05 (1.66) | 3.95 (2.01) |
| Reduces ordering of unnecessary tests and treatments. | O | 4.51 (1.86) | 5.77 (1.15)c | 3.86 (1.11) | 3.8 (1.97) |
| Improves the timeliness of consultations. | EP | 4.28 (1.99) | 5.66 (1.22)c | 3.24 (1.48) | 3.59 (2.02) |
| Decreases patients' hospital length of stay. | O | 4.15 (1.68) | 5.04 (1.24)c | 3.95 (1.16) | 3.57 (1.81) |
Barriers to BIRs
Respondents' perceptions of barriers to BIRs are shown by mean value (between 1 and 7) for the total respondent pool and by each participant group (Table 3). The 6 highest‐ranked barriers were related to time, including nursing staff have limited time, the time required for bedside nurse‐physician encounters, and coordinating the start time of encounters with arrival of both physicians and nursing. The lowest‐ranked barriers were related to provider‐ and patient‐related factors, including patient lack of comfort with bedside nurse‐physician encounters, attending physicians/housestaff lack bedside skills, and attending physicians lack comfort with bedside nurse‐physician encounters. Comparing mean values between groups, 10 of 21 items showed statistical differences (P<0.05). The rank order among groups showed moderate correlation (nurses‐attending physicians r=0.62, nurses‐housestaff physicians r=0.76, attending physicians‐housestaff physicians r=0.82). A qualitative inspection of disparities among respondent groups highlighted that nursing staff were more likely to rank bedside rounds are not part of the unit's culture lower than physician groups.
| Survey Itema | Item Domain | Total, N=149, Mean (SD) | Nurses, n=53, Mean (SD) | Attending Physicians, n=21, Mean (SD) | Housestaff Physicians, n=75,b Mean (SD) |
|---|---|---|---|---|---|
| |||||
| Nursing staff have limited time. | T | 4.89 (1.34) | 4.96 (1.27) | 4.86 (1.65) | 4.85 (1.30) |
| Coordinating start time of encounters with arrival of physicians and nursing. | T | 4.80 (1.50) | 4.58 (1.43) | 5.24 (1.45) | 4.84 (1.55) |
| Housestaff have limited time. | T | 4.68 (1.47) | 4.56 (1.26) | 4.24 (1.81) | 4.89 (1.48) |
| Attending physicians have limited time. | T | 4.50 (1.49) | 4.81 (1.34) | 4.33 (1.65) | 4.34 (1.53) |
| Other acutely sick patients in unit. | T | 4.39 (1.42) | 4.79 (1.30)c | 4.52 (1.21) | 4.08 (1.49) |
| Time required for bedside nurse‐physician encounters. | T | 4.32 (1.55) | 4.85 (1.38)c | 3.62 (1.80) | 4.15 (1.49) |
| Lack of use of the pink‐rounding light to alert nursing staff. | S | 3.77 (1.75) | 4.71 (1.70)c | 3.48 (1.86) | 3.19 (1.46) |
| Patient not available (eg, off to test, getting bathed) | S | 3.74 (1.40) | 3.98 (1.28) | 4.52 (1.36)d | 3.35 (1.37) |
| Large team size. | S | 3.64 (1.74) | 3.12 (1.58)c | 3.95 (1.83) | 3.92 (1.77) |
| Patients in dispersed locations (eg, other units or in different hallways). | S | 3.64 (1.77) | 2.77 (1.55)c | 4.52 (1.83) | 4.00 (1.66) |
| Bedside nurse‐physician rounds are not part of the unit's culture. | S | 3.35 (1.94) | 2.25 (1.47)c | 4.76 (1.92) | 3.72 (1.85) |
| Limitations in physical facilities (eg, rooms too small, limited chairs). | S | 3.25 (1.71) | 2.71 (1.72) | 3.33 (1.71) | 3.59 (1.62) |
| Insufficient nurse engagement during bedside nurse‐physician encounters. | PR | 3.24 (1.63) | 2.71 (1.47)c | 3.67 (1.68) | 3.49 (1.65) |
| Patient on contact or respiratory isolation. | S | 3.20 (1.82) | 2.42 (1.67)c | 3.43 (1.63) | 3.69 (1.80) |
| Language barrier between providers and patients. | P | 2.69 (1.37) | 2.77 (1.39) | 2.57 (1.08) | 2.68 (1.43) |
| Privacy/sensitive patient issues. | P | 2.65 (1.45) | 2.27 (1.24) | 2.57 (1.33) | 2.93 (1.56) |
| Housestaff lack comfort with bedside nurse‐physician encounters. | PR | 2.55 (1.49) | 2.48 (1.15) | 2.67 (1.68) | 2.57 (1.65) |
| Nurses lack comfort with bedside nurse‐physician encounters. | PR | 2.45 (1.45) | 2.35 (1.27) | 2.48 (1.66) | 2.51 (1.53) |
| Attending physicians lack comfort with bedside nurse‐physician encounters. | PR | 2.35 (1.38) | 2.33 (1.25) | 2.33 (1.62) | 2.36 (1.41) |
| Attending physician/housestaff lack bedside skills (eg, history, exam). | PR | 2.34 (1.34) | 2.19 (1.19) | 2.85 (1.69) | 2.30 (1.32) |
| Patient lack of comfort with bedside nurse‐physician encounters. | P | 2.33 (1.48) | 2.23 (1.37) | 1.95 (1.32) | 2.5 (1.59) |
DISCUSSION
In this study, we sought to compare perceptions of nurses and physicians on the benefits and barriers to BIRs. Nursing staff ranked each benefit higher than physicians, though rank orders of specific benefits were highly correlated. Highest‐ranked benefits related to coordination and communication more than quality or process benefits. Across groups, the highest‐ranked barriers to BIRs were related to time, whereas the lowest‐ranked factors were related to provider and patient discomfort. These results highlight important similarities and differences in perceptions between front‐line providers.
The highest‐ranked benefits were related to improved interprofessional communication and coordination. Combining interprofessional team members during care delivery allows for integrated understanding of daily care plans and clinical issues, and fosters collaboration and a team‐based atmosphere.[1, 20, 26] The lowest‐ranked benefits were related to more tangible measures, including length of stay, timely consultations, and judicious laboratory ordering. This finding contrasts with the limited literature demonstrating increased efficiency in general medicine units practicing IPCC.[16] These rankings may reflect a poor understanding or self‐assessment of outcome measures by healthcare providers, representing a potential focus for educational initiatives. Future investigations using objective assessment methods of outcomes and collaboration will provide a more accurate understanding of these findings.
The highest‐ranked barriers were related to time and systems issues. Several studies of physician‐based bedside rounds have identified systems‐ and time‐related issues as primary limiting barriers.[22, 24] In units without colocalization of patients and providers, finding receptive times for BIRs can be difficult. Although time‐related issues could be addressed by decreasing patient‐provider ratios, these changes require substantial investment in resources. A reasonable degree of improvement in efficiency and coordination is expected following acclimation to BIRs or by addressing modifiable systems factors to increase this activity. Less costly interventions, such as tailoring provider schedules, prescheduling patient rounding times, and geographic colocalization of patients and providers may be more feasible. However, the clinical microsystems within which medicine patients are cared for are often chaotic and disorganized at the infrastructural and cultural levels, which may be less influenced by surface‐level interventions. Such interventions may be ward specific and require customization to individual team needs.
The lowest‐ranked barriers to BIRs were related to provider‐ and patient‐related factors, including comfort level of patients and providers. Prior work on bedside rounds has identified physicians who are apprehensive about performing bedside rounds, but those who experience this activity are more likely to be comfortable with it.[12, 28] Our results from a culture where BIRs occur on nearly two‐thirds of patients suggest provider discomfort is not a predominant barrier.[22, 29] Additionally, educators have raised concerns about patient discomfort with bedside rounds, but nearly all studies evaluating patients' perspectives reveal patient preference for bedside case presentations over activities occurring in alternative locations.[30, 31, 32] Little work has investigated patient preference for BIRs as per our definition; our participants do not believe patients are discomforted by BIRs, building upon evidence in the literature for patient preferences regarding bedside activities.
Nursing staff perceptions of the benefits and culture related to BIRs were more positive than physicians. We hypothesize several reasons for this disparity. First, nursing staff may have more experience with observing and understanding the positive impact of BIRs and therefore are more likely to understand the positive ramifications. Alternatively, nursing staff may be satisfied with active integration into traditional physician‐centric decisions. Additionally, the professional culture and educational foundation of the nursing culture is based upon a patient‐centered approach and therefore may be more aligned with the goals of BIRs. Last, physicians may have competing priorities, favoring productivity and didactic learning rather than interprofessional collaboration. Further investigation is required to understand differences between nurses and physicians, in addition to other providers integral to BIRs (eg, care coordinators, pharmacists). Regardless, during the implementation of interprofessional collaborative care models, our findings suggest initial challenges, and the focus of educational initiatives may necessitate acclimating physician groups to benefits identified by front‐line nursing staff.
There are several limitations to our study. We investigated the perceptions of medicine nurses and physicians in 1 teaching hospital, limiting generalizability to other specialties, other vital professional groups, and nonteaching hospitals. Additionally, BIRs has been a focus of our hospital for several years. Therefore, perceived barriers may differ in BIRs‐nave hospitals. Second, although pilot‐tested for content, the construct validity of the instrument was not rigorously assessed, and the instrument was not designed to measure benefits and barriers not explicitly identified during pilot testing. Last, although surveys were anonymous, the possibility of social desirability bias exists, thereby limiting accuracy.
For over a century, physician‐led rounds have been the preferred modality for point‐of‐care decision making.[10, 15, 32, 33] BIRs address our growing understanding of patient‐centered care. Future efforts should address the quality of collaboration and current hospital and unit structures hindering patient‐centered IPCC and patient outcomes.
Acknowledgements
The authors thank the medicine nursing staff and physicians for their dedication to patient‐centered care and willingness to participate in this study.
Disclosures: The Department of Medicine at the Penn State Hershey Medical Center provided funding for this project. There are no conflicts of interest to report.
- , , . Interprofessional collaboration: effects of practice‐based interventions on professional practice and healthcare outcomes. Cochrane Database Syst Rev. 2009(3):CD000072.
- . Teamswork! Hosp Health Netw. 2012;86(3):24–27, 21.
- , , , . The coming of age for interprofessional education and practice. Am J Med. 2013;126(4):284–288.
- , . Payment incentives and integrated care delivery: levers for health system reform and cost containment. Inquiry. 2011;48(4):277–287.
- . Payment reform and the mission of academic medical centers. N Engl J Med. 2010;363(19):1784–1786.
- Josiah Macy Jr. Foundation. Transforming patient care: aligning interprofessional education and clinical practice redesign. In: Proceedings of the Josiah Macy Jr. Foundation Conference; January 17–20, 2013; Atlanta, GA.
- , , , . Bridging the quality chasm: interprofessional teams to the rescue? Am J Med. 2013;126(4):276–277.
- . Attending rounds: guidelines for teaching on the wards. J Gen Intern Med. 1992;7(1):68–75.
- , . Teaching at the bedside: a new model. Med Teach. 2003;25(2):127–130.
- . On bedside teaching. Ann Intern Med. 1997;126(3):217–220.
- , , , . Relationships of the location and content of rounds to specialty, institution, patient‐census, and team size. PloS One. 2010;5(6):e11246.
- , , , . Attending rounds and bedside case presentations: medical student and medicine resident experiences and attitudes. Teach Learn Med. 2009;21(2):105–110.
- , , , et al. Attending rounds in the current era: what is and is not happening. JAMA Intern Med. 2013;173(12):1084–1089.
- , , , et al. Structured interdisciplinary rounds in a medical teaching unit: improving patient safety. Arch Intern Med. 2011;171(7):678–684.
- , , , , . Use of multidisciplinary rounds to simultaneously improve quality outcomes, enhance resident education, and shorten length of stay. J Gen Intern Med. 2007;22(8):1073–1079.
- , , . A firm trial of interdisciplinary rounds on the inpatient medical wards: an intervention designed using continuous quality improvement. Med Care. 1998;36(8 suppl):AS4–AS12.
- , , , . A randomized, controlled trial of bedside versus conference‐room case presentation in a pediatric intensive care unit. Pediatrics. 2007;120(2):275–280.
- , . The challenge of innovation implementation. Acad Manage Rev. 1996;21(4):1055–1080.
- , , , . Ocular dipping in creutzfeldt‐jakob disease. J Clin Neurol. 2014;10(2):162–165.
- , , , et al. The value of bedside rounds: a multicenter qualitative study. Teach Learn Med. 2013;25(4):326–333.
- , , , et al. The art of bedside rounds: a multi‐center qualitative study of strategies used by experienced bedside teachers. J Gen Intern Med. 2013;28(3):412–420.
- , , , et al. Identifying and overcoming the barriers to bedside rounds: a multicenter qualitative study. Acad Med. 2014;89(2):326–334.
- , . Bedside teaching in medical education: a literature review. Perspec Med Educ. 2014;3(2):76–88.
- , , . Impediments to bed‐side teaching. Med Educ. 1998;32(2):159–162.
- , , , . Whither bedside teaching? A focus‐group study of clinical teachers. Acad Med. 2003;78(4):384–390.
- , . Staff preference for multidisciplinary rounding practices in the critical care setting. 2011. Paper presented at: Design July 6–10, 2011. Boston, MA. Available at: http://www.designandhealth.com/uploaded/documents/Awards‐and‐events/WCDH2011/Presentations/Friday/Session‐8/DianaAnderson.pdf. Accessed July 6, 2014.
- , . Health Measurement Scales: A Practical Guide to Their Development and Use. 2nd ed. New York, NY: Oxford University Press; 1995.
- , , . Student and patient perspectives on bedside teaching. Med Educ. 1997;31(5):341–346.
- , , , , , . The positive impact of portfolios on health care assistants' clinical practice. J Eval Clin Pract. 2008;14(1):172–174.
- , , , . The physiologic and psychological effects of the bedside presentation. N Engl J Med. 1989;321(18):1273–1275.
- , , , , . The effect of bedside case presentations on patients' perceptions of their medical care. N Engl J Med. 1997;336(16):1150–1155.
- , , , . The return of bedside rounds: an educational intervention. J Gen Intern Med. 2010;25(8):792–798.
- . Bedside rounds revisited. N Engl J Med. 1997;336(16):1174–1175.
© 2014 Society of Hospital Medicine
Inpatient Sleep Aid Utilization
Sleep is known to be poor among hospitalized patients for many reasons.[1] Patients may have pain, dyspnea, or other discomforts that prevent sleep. Diagnostic and therapeutic procedures, including medication administration and routine nursing care, may take place during normal sleep times. Environmental factors such as noise and light frequently remain at daytime levels during normal sleep times.[2] In response, patients frequently request pharmacological sleep aids. Unfortunately, the use of sleep medications has been linked to clinically relevant and detrimental outcomes such as delirium and falls, particularly in the elderly. For example, in the landmark study by Inouye et al., a multicomponent intervention was used to successfully reduce delirium in older (>70 years) hospitalized patients.[3] One of the successful components was nonpharmacological sleep promotion, which reduced the use of pharmacological sleep aids from 46% to 35% of patients. Most recently, Kolla and colleagues found zolpidem tartrate use to be a risk factor (odds ratio 4.37) for inpatient falls, a known risk factor for morbidity and increased healthcare costs.[4]
The scope of recent pharmacological sleep aid use in the inpatient setting is not well described. Frighetto and colleagues described the pattern of in‐hospital drug use more than 12 years ago, before the concerns above were described, with 29% of patients receiving a medication for sleep, mostly benzodiazepines.[5] In 2008, Bartick and colleagues also found a very high rate of sleep aid use (42% of patients), but additionally described in 2010 an intervention to minimize sleep disruption that successfully reduced sleep aid use by 38%.[6] Both concerns over side effects and sleep promotion efforts might have reduced the current rate of medication use. Therefore, we sought to evaluate the prescription and administration of pharmacological sleep aids in general medical and surgical inpatients at our institution. Using our electronic medical records, including preadmission and discharge medication records, we assessed new and continued usage of medications for sleep complaints following hospital admission.
METHODS
Patients and Design
Records were reviewed for all adult patient (18 years or older) admissions to 1 of 4 units (2 general medicine and 2 general surgical units) from January 1, 2013 to February 28, 2013. These units do not have specific policies to promote sleep, such as nocturnal noise and light reduction or clustering of care. Brigham and Women's Hospital (BWH) is a 793‐bed university‐affiliated teaching hospital. Approval for this retrospective chart review study was obtained from the Partners Healthcare Institutional Review Board.
BWH uses an in‐house electronic health record system, which gathers information from a wider healthcare system (Partners Healthcare). Medications, problem lists, and allergies are available from within‐system providers and prior encounters. Admitting physicians are also required to document a preadmission medication list. A computerized physician order entry (CPOE) system is used for all medication orders. Although standardized admission order sets are used, none of these sets contains a pharmacological sleep aid. There is decision support for geriatric patients (age >65 years) that may recommend reduced starting doses for some medications.[7]
Medications Monitored for Treatment of Sleep Complaints
Using our electronic medication ordering and administration system, each patient admission was reviewed for any medication that might be used for treatment of sleep complaints. The list of sleep medications was based on those commonly used for the outpatient treatment of insomnia, as well as others included based on the authors' experience as clinical inpatient pharmacists.[8, 9, 10] Admissions were reviewed for the following medications: first generation antihistamines (diphenhydramine, hydroxyzine), tricyclic antidepressants (amitriptyline, nortriptyline, desipramine), serotonin‐norepinephrine reuptake inhibitor antidepressants (mirtazapine, trazodone, nefazodone), melatonin agonists (ramelteon), nonbenzodiazepine hypnotics (zolpidem tartrate, eszopiclone), benzodiazepines (oxazepam, temazepam, lorazepam, triazolam, diazepam), typical antipsychotics (haloperidol, fluphenazine, thioridazine, chlorpromazine), and atypical antipsychotics (quetiapine fumarate, ziprasidone, olanzapine, risperidone, aripiprazole). Melatonin, which is not regulated by the US Food and Drug Administration (FDA), cannot be prescribed using our CPOE system.
Determination of Medication Administration for Treatment of Sleep Complaints
The charts of patients receiving 1 or more of these monitored medications were then reviewed by the authors to determine if the medication was indeed prescribed for insomnia/sleep. Chart documents reviewed were the patient's problem list from outpatient provider notes; admission note, including past medical history and home medications; the preadmission medication list; and the inpatient daily progress note. The medication was considered to be used for sleep complaints (as opposed to another indication) when any of the additional following inclusion criteria were met: the medication was part of the patient's home medication regimen for insomnia, the medication order indicated that the medication was for insomnia/difficulty sleeping, or the medication was administered without a specific indication between the hours of 6 pm and 6 am. The medication was not considered to be used primarily as a sleep aid if any of the following were present (exclusion criteria): utilization for an as needed reason including anxiety, agitation, itching, nausea, muscle spasm; utilization for a documented disorder including depression, anxiety, schizophrenia, bipolar disorder, alcohol withdrawal, or epilepsy; intramuscular administration of olanzapine or ziprasidone; or topical administration of diphenhydramine.
Medication Administration Characteristics
For each medication that was administered for difficulty sleeping, the following data were documented: dose in milligrams, route of administration, time of administration, administration timing directions (eg, times 1 [x1], as needed [PRN], or standing), an increase or decrease in dose during hospital stay, documentation of the medication in discharge notes or discharge medications, and documentation of development of an allergy or adverse reaction due to the medication. Changes in dose were recorded. If a patient received more than 1 study medication, each individual medication and dose was evaluated for inclusion in the study analysis. Other data collected included the total number of days of exposure to each sleep aid during admission, the date of initiation, the total number of days of exposure to more than 1 sleep aid during admission, and the location of initiation of each individual sleep aid (eg, intensive care unit, medical floor). Appropriate time of administration was defined as sleep aid administration between 9 pm and 12 am.
RESULTS
Patients
During the 59‐day study period, there were 642 patients admitted to the study units. Two hundred seventy‐six patients received 1 of the monitored medications; however, 106 patients received the medication for an indication other than insomnia/difficulty sleeping. In 2 patients, incomplete records prevented ascertainment of the motivation for using the monitored medication. Thus, 168 patients (26.2%) were determined to have received a medication for sleep complaints and were included in the study analysis (Figure 1). Table 1 lists the characteristics of the 168 patients, of whom 10 had a prior documented sleep disorder such as insomnia (6 patients), restless leg syndrome (1 patient), and obstructive sleep apnea (3 patients). The rate of sleep medication use was lower, though not drastically so, in patients 65 years of age compared to those <65 years of age.

| Patients | Value |
|---|---|
| |
| Age, y | 57.919.8a |
| Age 65 years | 70 (41.7) |
| Age 64 years | 98 (58.3) |
| Female, n (%) | 97 (57.7) |
| Ethnicity, n (%) | |
| Caucasian | 114 (67.9) |
| Black | 18 (10.7) |
| Hispanic | 13 (7.7) |
| Other | 23 (13.7) |
| Admitted to floor from: | |
| Emergency department | 95 (56.5) |
| Operating room | 30 (17.9) |
| Transferred from outside hospital | 35 (20.8) |
| Intensive care unit | 8 (4.8) |
| Admission service, n (%) | |
| Medical | 109 (64.9) |
| Surgical | 59 (35.1) |
| Hospital length of stay | 10.516.0a |
| Known sleep disorder | |
| Insomnia | 6 (3.6) |
| Restless leg syndrome | 1 (0.6) |
| Obstructive sleep apnea | 3(1.8) |
Medications Used for Treatment of Sleep Complaints
Of the 25 monitored medications, 13 were administered to patients for sleep during the study period. The most commonly administered medications (percent of patients, median dose, absolute dose range) were trazodone (30.4%, 50 mg, 12.5450 mg), lorazepam (24.4%, 0.5 mg, 0.25 mg2 mg), and zolpidem tartrate (17.9%, 10 mg, 2.5 mg10 mg) (Table 2). As only a few of these medications (diphenhydramine, ramelteon, temazepam, triazolam, zolpidem) have a formal FDA indication for insomnia, most patients (72%) were treated using an off‐label medication. Although the types of medication used did not vary substantially between young and old patients, the median doses and ranges were lower in the elderly. Admitting service did not substantially influence the medication or dose chosen for sleep complaints (data not shown).
| Medication | All Patients, N=168, n (%) | Patients <65 Years Old, n=98, n (%) | Patients >65 Years Old, n=70, n (%) |
|---|---|---|---|
| |||
| Trazodoneb | 51 (30.4) | 29 (29.6) | 22 (31.4) |
| Median dose | 50 | 50 | 25 |
| Dose range | 12.5450 | 25450 | 12.5200 |
| Lorazepamc | 41 (24.4) | 24 (24.5) | 17 (24.3) |
| Median dose | 0.5 | 1 | 0.25 |
| Dose range | 0.252 | 0.252 | 0.251 |
| Zolpidem tartratec | 30 (17.9) | 20 (20.4) | 10 (14.3) |
| Median dose | 10 | 10 | 5 |
| Dose range | 2.510 | 2.510 | 2.510 |
| Quetiapine fumarate | 21 (12.5) | 9 (9.2) | 12 (17.1) |
| Median dose | 50 | 50 | 25 |
| Dose range | 12.5300 | 12.5300 | 12.5100 |
| Haloperidol | 18 (10.7) | 7 (7.1) | 11 (15.7) |
| Median dose | 1 | 5 | 1 |
| Dose range | 0.2510 | 0.510 | 0.251 |
| Diphenhydraminec | 16 (9.5) | 12 (12.2) | 4 (5.7) |
| Median dose | 25 | 25 | 12.5 |
| Dose range | 12.550 | 12.550 | 12.525 |
| Mirtazapine | 7 (4.2) | 3 (3.1) | 4 (5.7) |
| Median dose | 15 | 30 | 7.5 |
| Dose range | 7.545 | 7.530 | 7.545 |
| Olanzapine | 5 (3.6) | 3 (3.1) | 2 (2.9) |
| Median dose | 5 | 5 | 2.5 |
| Dose range | 2.512.5 | 512.5 | 2.52.5 |
| Amitriptyline | 5 (3.0) | 4 (4.1) | 1 (1.4) |
| Median dose | 25 | 25 | 25 |
| Dose range | 25100 | 25100 | |
| Diazepam | 5 (3.0) | 3 (3.1) | 2 (2.9) |
| Median dose | 5 | 5 | 10 |
| Dose range | 510 | ||
| Oxazepam | 2 (1.2) | 0 | 2 (2.9) |
| Median dose | 10 | 10 | |
| Dose range | 1010 | 1010 | |
| Temazepamc | 1 (0.6) | 0 | 1 (1.4) |
| Median dose | 15 | 15 | |
| Dose range | |||
| Hydroxyzine | 1 (0.6) | 1 (1.0) | 0 |
| Median dose | 50 | 50 | |
| Dose range | |||
Initiation, Duration, and Changes to Medications for Treatment of Sleep Complaints
None of the medication orders were part of a standardized order set. The sleep medication for the majority of patients (n=108, 64.3%) was initiated during their time on the study units (general inpatient hospital wards). Most patients (n=90, 53.6%) were ordered for a sleep aid within 48 hours of admission to the hospital. The patients who received medication for sleep had a median length of stay of 6 (interquartile range [IQR], 311) days on the study units, and received medication for a median of 2 (IQR, 15) days (Table 3). One hundred twenty patients (71.4%) were continued on a sleep aid until discharge. Essentially the same percentage of patients experienced an increase (14.9%) or decrease (14.9%) in the dose of their sleep aid during admission. Although most patients received 1 medication for sleep throughout their admission, almost one‐quarter of the patients were given 2 or more medications for sleep during their admission to the floor, sometimes including multiple medications on the same night.
| Variable | Patients, N=168 |
|---|---|
| |
| Total sleep aids each patient received during hospital length of stay, n (%) | |
| 1 sleep aid | 132 (78.6) |
| 2 sleep aids | 28 (16.7) |
| 3 sleep aids | 6 (3.6) |
| 4 sleep aids | 2 (1.2) |
| Patients who received multiple sleep aids for 1 or more days during hospital length of stay, n (%) | 20 (11.9) |
| Length of stay on study units, d | 6 [310.75]a |
| Length of sleep aid therapy on study units, d | 2 [15]a |
Of patients not known to be previously on sleep aid therapy, 40 (34.4%) of them were discharged home on a sleep aid.
Medication Administration Characteristics
Sleep medications were prescribed most frequently as standing orders (63.7%), rather than x1 (17.7%) or PRN (18.6%). Although the majority of sleep medications were administered between the hours of 9 pm and 12 am, more than 35% of doses were given outside of this range (Figure 2).
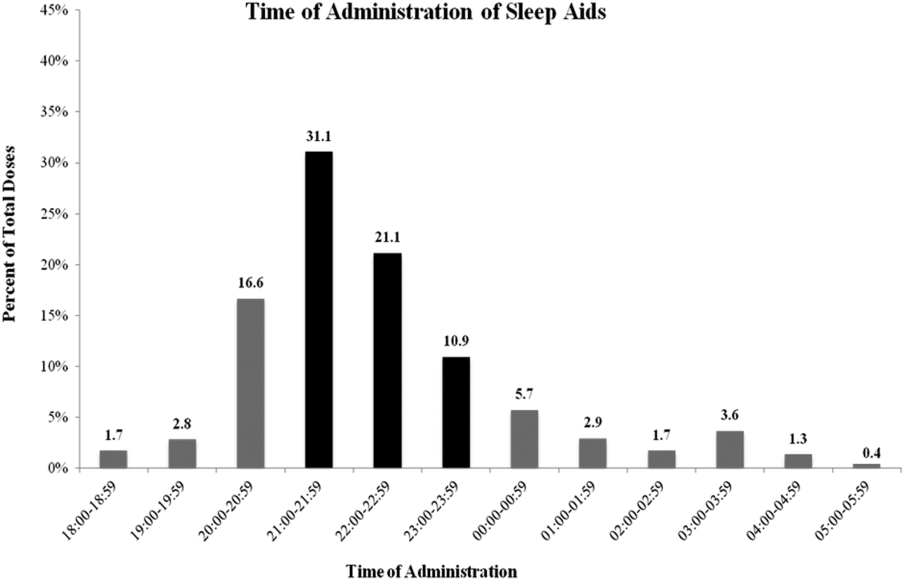
DISCUSSION
Our results confirm the continued frequent use of pharmacological sleep aids in the hospital setting, even in the elderly, despite recent concerns regarding the use of certain sleep medications. Additional, novel findings of our study are: (1) medications used for sleep complaints in the hospital are frequently those without a formal indication for sleep, (2) medications for sleep complaints are frequently administered too early or too late at night to be consistent with good sleep hygiene, and (3) many patients never previously on a medication for insomnia are discharged with a prescription for a sleep aid.
Despite recent warnings regarding side effects especially in the elderly, our rate of medication use has only slightly improved from prior reports from more than a decade ago.[3, 5] This high rate of use is likely due to a combination of patient, clinician, and environmental factors. In our sample, the sleep aid orders were not part of an order set; thus, the orders were either the result of patient request or in response to a patient report of poor sleep. Patients and clinicians may perceive medications for sleep as highly effective and safe, despite evidence to the contrary. Another factor is that both patients and clinicians may be unaware of nonpharmacological interventions that might improve sleep. Similarly, hospital environmental factors (noise, light) may be so disruptive as to preclude these interventions or opportunities for adequate sleep. Thus, the continued high use of medication for sleep is due in part to the lack of patient and clinician education and the difficulty in changing the hospital environment and culture, especially with only limited data on the value of sleep during recovery from illness.
Clinicians typically receive little training regarding sleep or its importance. In fact, most clinicians do not assess or communicate about the patient's quality of sleep.[11] Many may not know that there is little evidence of benefit of pharmacological sleep aids in the hospital. For example, a recent report found, in contrast to the authors' hypothesis, no changes in sleep architecture or duration using 10 mg of zolpidem tartrate in postoperative patients.[12] In our study, we found that some patients required an increase in the dose of their medications or were transitioned to a different sleep aid class (suggesting that sleep aids were ineffective). Alternatively, some patients' sleep aids were discontinued during hospital admission, again, likely due to perceived ineffectiveness or perhaps side effects. It is possible that the effectiveness of these medications might be influenced by timing of administration. This too was variable in our study. Proper clinician education around sleep hygiene might prevent early medication administration (which might lead to middle‐of‐the‐night awakenings) or delayed administration (which will delay the sleep phase), as was frequently seen in our cohort.
Despite emerging evidence of the importance of sleep in maintaining adequate immune, cardiovascular, and cognitive function, there are limited data regarding the benefits of sleep during acute illness.[13, 14, 15, 16] In the absence of compelling data, promoting sleep in the hospital has been difficult. The successful interventions used by Inouye and Bartick and their colleagues to minimize sedative hypnotic use included: a bedtime routine (eg, milk or herbal tea, relaxation tapes or music, back massage, toilet at bedtime), unit‐wide noise‐reduction strategies (eg, silent pill crushers, vibrating beepers, quiet hallways, and noise‐monitoring equipment that alerted staff above a certain decibel level), and schedule adjustments to allow sleep (eg, rescheduling of medications, intravenous fluids, and procedures), all of which require substantial clinician care or may not be possible in more acutely ill patients. Although such changes might be costly, sleep promotion and minimization of sleep aids continues to be part of a strategy that reduces delirium, hospital costs, and hospital length of stay.[16] From a patient perspective, many are interested in nondrug alternatives, especially those who have never used medications before, but few are told of them.[17]
Novel findings of our study include the types of medications used for sleep in the hospital. We found that a variety of medications and classes of medications were prescribed by clinicians for sleep complaints during hospitalization. This variability is due to a number of factors including the lack of rigorous data in this area, well‐established guidelines, or clinician education. We speculate that the high rates of use of nonbenzodiazepine and non‐ gamma‐aminobutyric acid (GABA)ergic agents, such as trazodone and quetiapine, reflect concerns about the use of medications such as zolpidem. Conversely, this means patients are increasingly treated with medications without formal FDA labeling for sleep. It does appear at least that the median doses of medication prescribed were lower in those over age 65 years compared to younger patients, although we cannot determine whether this reflects physician awareness or effective decision support used during computerized order entry. The geriatric decision support recommends a reduced dose for some (eg, trazodone, haloperidol) but not all (eg, quetiapine, lorazepam) of the monitored medications.
We found that many patients, even those who were never previously known to have insomnia, were discharged with a prescription for a sleep medication. Our study design is limited in assessing whether this prescription was needed or not, that is, whether or not the patient will have insomnia (sleep difficulty despite adequate opportunity for sleep) after hospital discharge. However, other studies have suggested that acute illness can be a precipitant for insomnia. Some of this literature has focused on patients in the intensive care unit, but it seems reasonable that patients on general medical and surgical wards (not having come through the intensive care units) might also be at risk for insomnia.[18] A study by Zisberg and colleagues in an elderly Israeli cohort found hospitalization (even without intensive care unit stay) to be both a starting point and a stopping point for chronic sleep medication use.[19] Alternatively, patients may not continue to suffer from insomnia after discharge, and thus the prescription for a sleep aid is inappropriate, as it is likely to have no benefit but may carry risk.[20] Regardless of whether hospital‐acquired insomnia persists past discharge, our findings suggest that some patients will start on chronic medication use for insomnia. Importantly, these patients may have limited understanding of the reason for their prescription, medication risks and benefits, and are unlikely to receive guidance on sleep hygiene or referral to a sleep specialist if needed. In our case, the high rate of prescriptions likely reflects the way in which inpatient medications can be added as a discharge medication automatically. This represents an area for improvement at our institution.
Limitations
This retrospective, single‐center study has several limitations. First, although our results are specific to our institution, our use of pharmacological sleep aids is similar to those previously reported in the literature. Our results are consistent in some ways with the changing trends in outpatient management of insomnia, in which trazodone and quetiapine are now frequently used. Second, we rely on the medical record for prior documentation of insomnia and/or use of medications for insomnia. However, our rate of prior diagnosis of insomnia or medication use of 8.3% is consistent with epidemiological studies.[21] Third, in this retrospective study we may have included some medications in our analysis that may have been given for indications other than sleep promotion, such as medications for anxiety or agitation. However, sleep promotion may have been an intended benefit of the medication choice. Fourth, we did not follow patients after discharge to know whether they continued with sleep medication use outside the hospital. Finally, in this retrospective chart review, we focused on utilization metrics, not on efficacy (which we can only infer) or adverse effects, such as altered mental status or falls. Moreover, we did not compare those patients who did and who did not receive any medication for sleep. However, such work will be crucial in future studies.
CONCLUSIONS
Despite increasing evidence of risks such as delirium or falls, pharmacological sleep aid use in hospitalized patients, even the elderly, remains common. A variety of medications are used, with variable administration times, which likely reflects the few rigorous studies or guidelines for the use of pharmacological sleep aids in hospitalized patients. Many patients not known to be on medications for sleep before admission leave the hospital with a sleep aid prescription. Our results suggest the need to better understand the factors that contribute to the high rate of sleep aid use in hospitalized patients. Clinician education regarding sleep, and nonpharmacological strategies to improve sleep in the hospital, are also needed.
Disclosure: Nothing to report.
- , , , . Sleep in hospitalized medical patients, part 1: factors affecting sleep. J Hosp Med. 2008;3(6):473–482.
- . Sleep and the sleep environment of older adults in acute care settings. J Gerontol Nurs. 2008;34(6):15–21.
- , , , et al. A multicomponent intervention to prevent delirium in hospitalized older patients. N Engl J Med. 1999;340(9):669–676.
- , , , . Zolpidem is independently associated with increased risk of inpatient falls. J Hosp Med. 2013;8(1):1–6.
- , , , , , . An assessment of quality of sleep and the use of drugs with sedating properties in hospitalized adult patients. Health Qual Life Outcomes. 2004;2:17.
- , , , , . Decrease in as‐needed sedative use by limiting nighttime sleep disruptions from hospital staff. J Hosp Med. 2010;5(3):E20–E24.
- , , , , , . Guided prescription of psychotropic medications for geriatric inpatients. Arch Intern Med. 2005;165(7):802–807.
- , , , . National use of prescription medications for insomnia: NHANES 1999–2010. Sleep. 2014;37(2):343–349.
- , . Safety of low doses of quetiapine when used for insomnia. Ann Pharmacother. 2012;46(5):718–722.
- , . Ten‐year trends in the pharmacological treatment of insomnia. Sleep. 1999;22(3):371–375.
- , , , . How do clinicians assess, communicate about, and manage patient sleep in the hospital? J Nurs Adm. 2013;43(6):342–347.
- , , . Postoperative sleep disturbances after zolpidem treatment in fast‐track hip and knee replacement. J Clin Sleep Med. 2014;10(3):321–326.
- , , . Sleep deprivation after septic insult increases mortality independent of age. J Trauma. 2009;66(1):50–54.
- , , , , , . Partial night sleep deprivation reduces natural killer and cellular immune responses in humans. Faseb J. 1996;10(5):643–653.
- , , , et al. Objective sleep duration and quality in hospitalized older adults: associations with blood pressure and mood. J Am Geriatr Soc. 2011;59(11):2185–2186.
- , , , et al. Quality improvement and cost savings with multicomponent delirium interventions: replication of the Hospital Elder Life Program in a community hospital. Psychosomatics. 2013;54(3):219–226.
- , , , , . Hospitalized patients' preference in the treatment of insomnia: pharmacological versus non‐pharmacological. Can J Clin Pharmacol. 2003;10(2):89–92.
- , , , et al. Post‐discharge insomnia symptoms are associated with quality of life impairment among survivors of acute lung injury. Sleep Med. 2012;13(8):1106–1109.
- , , , , , . Hospitalization as a turning point for sleep medication use in older adults: prospective cohort study. Drugs Aging. 2012;29(7):565–576.
- , , , et al. Inappropriate medication prescriptions in elderly adults surviving an intensive care unit hospitalization. J Am Geriatr Soc. 2013;61(7):1128–1134.
- , . Epidemiologic study of sleep disturbances and psychiatric disorders. An opportunity for prevention? JAMA. 1989;262(11):1479–1484.
Sleep is known to be poor among hospitalized patients for many reasons.[1] Patients may have pain, dyspnea, or other discomforts that prevent sleep. Diagnostic and therapeutic procedures, including medication administration and routine nursing care, may take place during normal sleep times. Environmental factors such as noise and light frequently remain at daytime levels during normal sleep times.[2] In response, patients frequently request pharmacological sleep aids. Unfortunately, the use of sleep medications has been linked to clinically relevant and detrimental outcomes such as delirium and falls, particularly in the elderly. For example, in the landmark study by Inouye et al., a multicomponent intervention was used to successfully reduce delirium in older (>70 years) hospitalized patients.[3] One of the successful components was nonpharmacological sleep promotion, which reduced the use of pharmacological sleep aids from 46% to 35% of patients. Most recently, Kolla and colleagues found zolpidem tartrate use to be a risk factor (odds ratio 4.37) for inpatient falls, a known risk factor for morbidity and increased healthcare costs.[4]
The scope of recent pharmacological sleep aid use in the inpatient setting is not well described. Frighetto and colleagues described the pattern of in‐hospital drug use more than 12 years ago, before the concerns above were described, with 29% of patients receiving a medication for sleep, mostly benzodiazepines.[5] In 2008, Bartick and colleagues also found a very high rate of sleep aid use (42% of patients), but additionally described in 2010 an intervention to minimize sleep disruption that successfully reduced sleep aid use by 38%.[6] Both concerns over side effects and sleep promotion efforts might have reduced the current rate of medication use. Therefore, we sought to evaluate the prescription and administration of pharmacological sleep aids in general medical and surgical inpatients at our institution. Using our electronic medical records, including preadmission and discharge medication records, we assessed new and continued usage of medications for sleep complaints following hospital admission.
METHODS
Patients and Design
Records were reviewed for all adult patient (18 years or older) admissions to 1 of 4 units (2 general medicine and 2 general surgical units) from January 1, 2013 to February 28, 2013. These units do not have specific policies to promote sleep, such as nocturnal noise and light reduction or clustering of care. Brigham and Women's Hospital (BWH) is a 793‐bed university‐affiliated teaching hospital. Approval for this retrospective chart review study was obtained from the Partners Healthcare Institutional Review Board.
BWH uses an in‐house electronic health record system, which gathers information from a wider healthcare system (Partners Healthcare). Medications, problem lists, and allergies are available from within‐system providers and prior encounters. Admitting physicians are also required to document a preadmission medication list. A computerized physician order entry (CPOE) system is used for all medication orders. Although standardized admission order sets are used, none of these sets contains a pharmacological sleep aid. There is decision support for geriatric patients (age >65 years) that may recommend reduced starting doses for some medications.[7]
Medications Monitored for Treatment of Sleep Complaints
Using our electronic medication ordering and administration system, each patient admission was reviewed for any medication that might be used for treatment of sleep complaints. The list of sleep medications was based on those commonly used for the outpatient treatment of insomnia, as well as others included based on the authors' experience as clinical inpatient pharmacists.[8, 9, 10] Admissions were reviewed for the following medications: first generation antihistamines (diphenhydramine, hydroxyzine), tricyclic antidepressants (amitriptyline, nortriptyline, desipramine), serotonin‐norepinephrine reuptake inhibitor antidepressants (mirtazapine, trazodone, nefazodone), melatonin agonists (ramelteon), nonbenzodiazepine hypnotics (zolpidem tartrate, eszopiclone), benzodiazepines (oxazepam, temazepam, lorazepam, triazolam, diazepam), typical antipsychotics (haloperidol, fluphenazine, thioridazine, chlorpromazine), and atypical antipsychotics (quetiapine fumarate, ziprasidone, olanzapine, risperidone, aripiprazole). Melatonin, which is not regulated by the US Food and Drug Administration (FDA), cannot be prescribed using our CPOE system.
Determination of Medication Administration for Treatment of Sleep Complaints
The charts of patients receiving 1 or more of these monitored medications were then reviewed by the authors to determine if the medication was indeed prescribed for insomnia/sleep. Chart documents reviewed were the patient's problem list from outpatient provider notes; admission note, including past medical history and home medications; the preadmission medication list; and the inpatient daily progress note. The medication was considered to be used for sleep complaints (as opposed to another indication) when any of the additional following inclusion criteria were met: the medication was part of the patient's home medication regimen for insomnia, the medication order indicated that the medication was for insomnia/difficulty sleeping, or the medication was administered without a specific indication between the hours of 6 pm and 6 am. The medication was not considered to be used primarily as a sleep aid if any of the following were present (exclusion criteria): utilization for an as needed reason including anxiety, agitation, itching, nausea, muscle spasm; utilization for a documented disorder including depression, anxiety, schizophrenia, bipolar disorder, alcohol withdrawal, or epilepsy; intramuscular administration of olanzapine or ziprasidone; or topical administration of diphenhydramine.
Medication Administration Characteristics
For each medication that was administered for difficulty sleeping, the following data were documented: dose in milligrams, route of administration, time of administration, administration timing directions (eg, times 1 [x1], as needed [PRN], or standing), an increase or decrease in dose during hospital stay, documentation of the medication in discharge notes or discharge medications, and documentation of development of an allergy or adverse reaction due to the medication. Changes in dose were recorded. If a patient received more than 1 study medication, each individual medication and dose was evaluated for inclusion in the study analysis. Other data collected included the total number of days of exposure to each sleep aid during admission, the date of initiation, the total number of days of exposure to more than 1 sleep aid during admission, and the location of initiation of each individual sleep aid (eg, intensive care unit, medical floor). Appropriate time of administration was defined as sleep aid administration between 9 pm and 12 am.
RESULTS
Patients
During the 59‐day study period, there were 642 patients admitted to the study units. Two hundred seventy‐six patients received 1 of the monitored medications; however, 106 patients received the medication for an indication other than insomnia/difficulty sleeping. In 2 patients, incomplete records prevented ascertainment of the motivation for using the monitored medication. Thus, 168 patients (26.2%) were determined to have received a medication for sleep complaints and were included in the study analysis (Figure 1). Table 1 lists the characteristics of the 168 patients, of whom 10 had a prior documented sleep disorder such as insomnia (6 patients), restless leg syndrome (1 patient), and obstructive sleep apnea (3 patients). The rate of sleep medication use was lower, though not drastically so, in patients 65 years of age compared to those <65 years of age.
| Patients | Value |
|---|---|
| |
| Age, y | 57.919.8a |
| Age 65 years | 70 (41.7) |
| Age 64 years | 98 (58.3) |
| Female, n (%) | 97 (57.7) |
| Ethnicity, n (%) | |
| Caucasian | 114 (67.9) |
| Black | 18 (10.7) |
| Hispanic | 13 (7.7) |
| Other | 23 (13.7) |
| Admitted to floor from: | |
| Emergency department | 95 (56.5) |
| Operating room | 30 (17.9) |
| Transferred from outside hospital | 35 (20.8) |
| Intensive care unit | 8 (4.8) |
| Admission service, n (%) | |
| Medical | 109 (64.9) |
| Surgical | 59 (35.1) |
| Hospital length of stay | 10.516.0a |
| Known sleep disorder | |
| Insomnia | 6 (3.6) |
| Restless leg syndrome | 1 (0.6) |
| Obstructive sleep apnea | 3(1.8) |
Medications Used for Treatment of Sleep Complaints
Of the 25 monitored medications, 13 were administered to patients for sleep during the study period. The most commonly administered medications (percent of patients, median dose, absolute dose range) were trazodone (30.4%, 50 mg, 12.5450 mg), lorazepam (24.4%, 0.5 mg, 0.25 mg2 mg), and zolpidem tartrate (17.9%, 10 mg, 2.5 mg10 mg) (Table 2). As only a few of these medications (diphenhydramine, ramelteon, temazepam, triazolam, zolpidem) have a formal FDA indication for insomnia, most patients (72%) were treated using an off‐label medication. Although the types of medication used did not vary substantially between young and old patients, the median doses and ranges were lower in the elderly. Admitting service did not substantially influence the medication or dose chosen for sleep complaints (data not shown).
| Medication | All Patients, N=168, n (%) | Patients <65 Years Old, n=98, n (%) | Patients >65 Years Old, n=70, n (%) |
|---|---|---|---|
| |||
| Trazodoneb | 51 (30.4) | 29 (29.6) | 22 (31.4) |
| Median dose | 50 | 50 | 25 |
| Dose range | 12.5450 | 25450 | 12.5200 |
| Lorazepamc | 41 (24.4) | 24 (24.5) | 17 (24.3) |
| Median dose | 0.5 | 1 | 0.25 |
| Dose range | 0.252 | 0.252 | 0.251 |
| Zolpidem tartratec | 30 (17.9) | 20 (20.4) | 10 (14.3) |
| Median dose | 10 | 10 | 5 |
| Dose range | 2.510 | 2.510 | 2.510 |
| Quetiapine fumarate | 21 (12.5) | 9 (9.2) | 12 (17.1) |
| Median dose | 50 | 50 | 25 |
| Dose range | 12.5300 | 12.5300 | 12.5100 |
| Haloperidol | 18 (10.7) | 7 (7.1) | 11 (15.7) |
| Median dose | 1 | 5 | 1 |
| Dose range | 0.2510 | 0.510 | 0.251 |
| Diphenhydraminec | 16 (9.5) | 12 (12.2) | 4 (5.7) |
| Median dose | 25 | 25 | 12.5 |
| Dose range | 12.550 | 12.550 | 12.525 |
| Mirtazapine | 7 (4.2) | 3 (3.1) | 4 (5.7) |
| Median dose | 15 | 30 | 7.5 |
| Dose range | 7.545 | 7.530 | 7.545 |
| Olanzapine | 5 (3.6) | 3 (3.1) | 2 (2.9) |
| Median dose | 5 | 5 | 2.5 |
| Dose range | 2.512.5 | 512.5 | 2.52.5 |
| Amitriptyline | 5 (3.0) | 4 (4.1) | 1 (1.4) |
| Median dose | 25 | 25 | 25 |
| Dose range | 25100 | 25100 | |
| Diazepam | 5 (3.0) | 3 (3.1) | 2 (2.9) |
| Median dose | 5 | 5 | 10 |
| Dose range | 510 | ||
| Oxazepam | 2 (1.2) | 0 | 2 (2.9) |
| Median dose | 10 | 10 | |
| Dose range | 1010 | 1010 | |
| Temazepamc | 1 (0.6) | 0 | 1 (1.4) |
| Median dose | 15 | 15 | |
| Dose range | |||
| Hydroxyzine | 1 (0.6) | 1 (1.0) | 0 |
| Median dose | 50 | 50 | |
| Dose range | |||
Initiation, Duration, and Changes to Medications for Treatment of Sleep Complaints
None of the medication orders were part of a standardized order set. The sleep medication for the majority of patients (n=108, 64.3%) was initiated during their time on the study units (general inpatient hospital wards). Most patients (n=90, 53.6%) were ordered for a sleep aid within 48 hours of admission to the hospital. The patients who received medication for sleep had a median length of stay of 6 (interquartile range [IQR], 311) days on the study units, and received medication for a median of 2 (IQR, 15) days (Table 3). One hundred twenty patients (71.4%) were continued on a sleep aid until discharge. Essentially the same percentage of patients experienced an increase (14.9%) or decrease (14.9%) in the dose of their sleep aid during admission. Although most patients received 1 medication for sleep throughout their admission, almost one‐quarter of the patients were given 2 or more medications for sleep during their admission to the floor, sometimes including multiple medications on the same night.
| Variable | Patients, N=168 |
|---|---|
| |
| Total sleep aids each patient received during hospital length of stay, n (%) | |
| 1 sleep aid | 132 (78.6) |
| 2 sleep aids | 28 (16.7) |
| 3 sleep aids | 6 (3.6) |
| 4 sleep aids | 2 (1.2) |
| Patients who received multiple sleep aids for 1 or more days during hospital length of stay, n (%) | 20 (11.9) |
| Length of stay on study units, d | 6 [310.75]a |
| Length of sleep aid therapy on study units, d | 2 [15]a |
Of patients not known to be previously on sleep aid therapy, 40 (34.4%) of them were discharged home on a sleep aid.
Medication Administration Characteristics
Sleep medications were prescribed most frequently as standing orders (63.7%), rather than x1 (17.7%) or PRN (18.6%). Although the majority of sleep medications were administered between the hours of 9 pm and 12 am, more than 35% of doses were given outside of this range (Figure 2).
DISCUSSION
Our results confirm the continued frequent use of pharmacological sleep aids in the hospital setting, even in the elderly, despite recent concerns regarding the use of certain sleep medications. Additional, novel findings of our study are: (1) medications used for sleep complaints in the hospital are frequently those without a formal indication for sleep, (2) medications for sleep complaints are frequently administered too early or too late at night to be consistent with good sleep hygiene, and (3) many patients never previously on a medication for insomnia are discharged with a prescription for a sleep aid.
Despite recent warnings regarding side effects especially in the elderly, our rate of medication use has only slightly improved from prior reports from more than a decade ago.[3, 5] This high rate of use is likely due to a combination of patient, clinician, and environmental factors. In our sample, the sleep aid orders were not part of an order set; thus, the orders were either the result of patient request or in response to a patient report of poor sleep. Patients and clinicians may perceive medications for sleep as highly effective and safe, despite evidence to the contrary. Another factor is that both patients and clinicians may be unaware of nonpharmacological interventions that might improve sleep. Similarly, hospital environmental factors (noise, light) may be so disruptive as to preclude these interventions or opportunities for adequate sleep. Thus, the continued high use of medication for sleep is due in part to the lack of patient and clinician education and the difficulty in changing the hospital environment and culture, especially with only limited data on the value of sleep during recovery from illness.
Clinicians typically receive little training regarding sleep or its importance. In fact, most clinicians do not assess or communicate about the patient's quality of sleep.[11] Many may not know that there is little evidence of benefit of pharmacological sleep aids in the hospital. For example, a recent report found, in contrast to the authors' hypothesis, no changes in sleep architecture or duration using 10 mg of zolpidem tartrate in postoperative patients.[12] In our study, we found that some patients required an increase in the dose of their medications or were transitioned to a different sleep aid class (suggesting that sleep aids were ineffective). Alternatively, some patients' sleep aids were discontinued during hospital admission, again, likely due to perceived ineffectiveness or perhaps side effects. It is possible that the effectiveness of these medications might be influenced by timing of administration. This too was variable in our study. Proper clinician education around sleep hygiene might prevent early medication administration (which might lead to middle‐of‐the‐night awakenings) or delayed administration (which will delay the sleep phase), as was frequently seen in our cohort.
Despite emerging evidence of the importance of sleep in maintaining adequate immune, cardiovascular, and cognitive function, there are limited data regarding the benefits of sleep during acute illness.[13, 14, 15, 16] In the absence of compelling data, promoting sleep in the hospital has been difficult. The successful interventions used by Inouye and Bartick and their colleagues to minimize sedative hypnotic use included: a bedtime routine (eg, milk or herbal tea, relaxation tapes or music, back massage, toilet at bedtime), unit‐wide noise‐reduction strategies (eg, silent pill crushers, vibrating beepers, quiet hallways, and noise‐monitoring equipment that alerted staff above a certain decibel level), and schedule adjustments to allow sleep (eg, rescheduling of medications, intravenous fluids, and procedures), all of which require substantial clinician care or may not be possible in more acutely ill patients. Although such changes might be costly, sleep promotion and minimization of sleep aids continues to be part of a strategy that reduces delirium, hospital costs, and hospital length of stay.[16] From a patient perspective, many are interested in nondrug alternatives, especially those who have never used medications before, but few are told of them.[17]
Novel findings of our study include the types of medications used for sleep in the hospital. We found that a variety of medications and classes of medications were prescribed by clinicians for sleep complaints during hospitalization. This variability is due to a number of factors including the lack of rigorous data in this area, well‐established guidelines, or clinician education. We speculate that the high rates of use of nonbenzodiazepine and non‐ gamma‐aminobutyric acid (GABA)ergic agents, such as trazodone and quetiapine, reflect concerns about the use of medications such as zolpidem. Conversely, this means patients are increasingly treated with medications without formal FDA labeling for sleep. It does appear at least that the median doses of medication prescribed were lower in those over age 65 years compared to younger patients, although we cannot determine whether this reflects physician awareness or effective decision support used during computerized order entry. The geriatric decision support recommends a reduced dose for some (eg, trazodone, haloperidol) but not all (eg, quetiapine, lorazepam) of the monitored medications.
We found that many patients, even those who were never previously known to have insomnia, were discharged with a prescription for a sleep medication. Our study design is limited in assessing whether this prescription was needed or not, that is, whether or not the patient will have insomnia (sleep difficulty despite adequate opportunity for sleep) after hospital discharge. However, other studies have suggested that acute illness can be a precipitant for insomnia. Some of this literature has focused on patients in the intensive care unit, but it seems reasonable that patients on general medical and surgical wards (not having come through the intensive care units) might also be at risk for insomnia.[18] A study by Zisberg and colleagues in an elderly Israeli cohort found hospitalization (even without intensive care unit stay) to be both a starting point and a stopping point for chronic sleep medication use.[19] Alternatively, patients may not continue to suffer from insomnia after discharge, and thus the prescription for a sleep aid is inappropriate, as it is likely to have no benefit but may carry risk.[20] Regardless of whether hospital‐acquired insomnia persists past discharge, our findings suggest that some patients will start on chronic medication use for insomnia. Importantly, these patients may have limited understanding of the reason for their prescription, medication risks and benefits, and are unlikely to receive guidance on sleep hygiene or referral to a sleep specialist if needed. In our case, the high rate of prescriptions likely reflects the way in which inpatient medications can be added as a discharge medication automatically. This represents an area for improvement at our institution.
Limitations
This retrospective, single‐center study has several limitations. First, although our results are specific to our institution, our use of pharmacological sleep aids is similar to those previously reported in the literature. Our results are consistent in some ways with the changing trends in outpatient management of insomnia, in which trazodone and quetiapine are now frequently used. Second, we rely on the medical record for prior documentation of insomnia and/or use of medications for insomnia. However, our rate of prior diagnosis of insomnia or medication use of 8.3% is consistent with epidemiological studies.[21] Third, in this retrospective study we may have included some medications in our analysis that may have been given for indications other than sleep promotion, such as medications for anxiety or agitation. However, sleep promotion may have been an intended benefit of the medication choice. Fourth, we did not follow patients after discharge to know whether they continued with sleep medication use outside the hospital. Finally, in this retrospective chart review, we focused on utilization metrics, not on efficacy (which we can only infer) or adverse effects, such as altered mental status or falls. Moreover, we did not compare those patients who did and who did not receive any medication for sleep. However, such work will be crucial in future studies.
CONCLUSIONS
Despite increasing evidence of risks such as delirium or falls, pharmacological sleep aid use in hospitalized patients, even the elderly, remains common. A variety of medications are used, with variable administration times, which likely reflects the few rigorous studies or guidelines for the use of pharmacological sleep aids in hospitalized patients. Many patients not known to be on medications for sleep before admission leave the hospital with a sleep aid prescription. Our results suggest the need to better understand the factors that contribute to the high rate of sleep aid use in hospitalized patients. Clinician education regarding sleep, and nonpharmacological strategies to improve sleep in the hospital, are also needed.
Disclosure: Nothing to report.
- , , , . Sleep in hospitalized medical patients, part 1: factors affecting sleep. J Hosp Med. 2008;3(6):473–482.
- . Sleep and the sleep environment of older adults in acute care settings. J Gerontol Nurs. 2008;34(6):15–21.
- , , , et al. A multicomponent intervention to prevent delirium in hospitalized older patients. N Engl J Med. 1999;340(9):669–676.
- , , , . Zolpidem is independently associated with increased risk of inpatient falls. J Hosp Med. 2013;8(1):1–6.
- , , , , , . An assessment of quality of sleep and the use of drugs with sedating properties in hospitalized adult patients. Health Qual Life Outcomes. 2004;2:17.
- , , , , . Decrease in as‐needed sedative use by limiting nighttime sleep disruptions from hospital staff. J Hosp Med. 2010;5(3):E20–E24.
- , , , , , . Guided prescription of psychotropic medications for geriatric inpatients. Arch Intern Med. 2005;165(7):802–807.
- , , , . National use of prescription medications for insomnia: NHANES 1999–2010. Sleep. 2014;37(2):343–349.
- , . Safety of low doses of quetiapine when used for insomnia. Ann Pharmacother. 2012;46(5):718–722.
- , . Ten‐year trends in the pharmacological treatment of insomnia. Sleep. 1999;22(3):371–375.
- , , , . How do clinicians assess, communicate about, and manage patient sleep in the hospital? J Nurs Adm. 2013;43(6):342–347.
- , , . Postoperative sleep disturbances after zolpidem treatment in fast‐track hip and knee replacement. J Clin Sleep Med. 2014;10(3):321–326.
- , , . Sleep deprivation after septic insult increases mortality independent of age. J Trauma. 2009;66(1):50–54.
- , , , , , . Partial night sleep deprivation reduces natural killer and cellular immune responses in humans. Faseb J. 1996;10(5):643–653.
- , , , et al. Objective sleep duration and quality in hospitalized older adults: associations with blood pressure and mood. J Am Geriatr Soc. 2011;59(11):2185–2186.
- , , , et al. Quality improvement and cost savings with multicomponent delirium interventions: replication of the Hospital Elder Life Program in a community hospital. Psychosomatics. 2013;54(3):219–226.
- , , , , . Hospitalized patients' preference in the treatment of insomnia: pharmacological versus non‐pharmacological. Can J Clin Pharmacol. 2003;10(2):89–92.
- , , , et al. Post‐discharge insomnia symptoms are associated with quality of life impairment among survivors of acute lung injury. Sleep Med. 2012;13(8):1106–1109.
- , , , , , . Hospitalization as a turning point for sleep medication use in older adults: prospective cohort study. Drugs Aging. 2012;29(7):565–576.
- , , , et al. Inappropriate medication prescriptions in elderly adults surviving an intensive care unit hospitalization. J Am Geriatr Soc. 2013;61(7):1128–1134.
- , . Epidemiologic study of sleep disturbances and psychiatric disorders. An opportunity for prevention? JAMA. 1989;262(11):1479–1484.
© 2014 Society of Hospital Medicine

Pediatric Hospital Medicine 2014: Clinical Competence for the Community Hospitalist
Presenters: Julia Aquino, Elisabeth Schainker, Michelle Hofmann
Summary: The panel began by laying the foundation for why competency assessment of community pediatric hospitalists is important, based on the Pediatric Hospital Medicine Core Competencies published in the Journal of Hospital Medicine. Throughout the presentation, the panel used their own personal experience of developing a neonatal competency assessment program to demonstrate how to build a successful, comprehensive program for community pediatric hospitalists.
The presenters outlined the key goals of a competency assessment program, including:
• Feedback about both strengths and weaknesses should be provided in order to reinforce learned knowledge and guide future learning;
• Programs should assess not just clinical, but also non-clinical skills, such as communication, patient safety, and continuous quality improvement; and
• Assessment should include formative assessment, or “low stakes” monitoring of learning, as well as summative assessment, in which there is a “high stakes” consequence for not demonstrating competency. An example of summative assessment would be the current NRP testing: if you do not pass the test, you do not receive NRP certification.
The panel then described the need to build a competency assessment program based on the concepts of Miller’s Triangle of assessment. The bottom two layers of the triangle include standardized evaluations of a user’s knowledge, while the top two layers are comprised of practice-based assessment.
The bottom layer of the triangle assesses a user’s knowledge through test questions. The next level up tests a user’s ability to apply knowledge, for example, the current PALS case-based learning. The third level evaluates a user’s ability to show or demonstrate knowledge, such as through simulation training. The final or top level assesses the user actually doing, or performing the task, such as through direct observation.
The presenters pointed out the relative strengths and weaknesses of each level, namely, as one moves up the pyramid, the levels of assessment demonstrate increasing levels of competency, but come at the expense of increasing work or cost.
Key Takeaways
A comprehensive competency assessment program should:
(1) Evaluate clinical and non-clinical skills, based on the Pediatric Hospital Medicine Core Competencies;
(2) Incorporate both “low stakes” formative and “high stakes” summative assessment; and
(3) Include standardized assessments as well as practice-based evaluations, based on the concepts of Miller’s Triangle. TH
Dr. O’Callaghan is a clinical assistant professor of pediatrics at the University of Washington and a member of Team Hospitalist.
Plan helped atrial fibrillation patients safely switch oral anticoagulants
A detailed transition plan protected most atrial fibrillation patients from strokes and major bleeding when they switched oral anticoagulants, researchers reported in the August issue of the Journal of the American College of Cardiology.
Following such a plan could help patients safely switch anticoagulants in clinical practice, said Dr. Christian Ruff at Harvard Medical School in Boston and his associates.
They reported an analysis from the ENGAGE AF-TIMI 48 (Effective Anticoagulation With Factor Xa Next Generation in Atrial Fibrillation–Thrombolysis in Myocardial Infarction 48) trial, which randomized more than 21,000 AF patients at high risk of stroke to either the investigational factor Xa inhibitor edoxaban or warfarin. Edoxaban was shown noninferior to warfarin in preventing stroke or systemic embolism (N. Engl. J. Med. 2013; 369:2093-104).
In the past, researchers from the ROCKET AF and ARISTOTLE trials reported excess strokes and bleeding events after patients were switched from blinded factor Xa inhibitors to open-label antithrombotics, the investigators said.
In response, ENGAGE AF-TIMI 48 patients and their physicians decided together whether to switch to an open-label vitamin K antagonist (VKA) or a newer oral anticoagulant at the end of the trial, the researchers said. Patients then received a transition kit with a 14-day supply of either a half-dose edoxaban for patients switching from blinded edoxaban to open warfarin, or a placebo for patients switching from blinded to open warfarin. Patients also underwent at least three international normalized ratio (INR) tests during the first 2 weeks of the transition period and were dosed based on a VKA titration algorithm designed to quickly reach therapeutic INR, they said.
Among 13,642 ENGAGE AF-TIMI patients alive at the end of the trial, 68.2% transitioned to a VKA and 31.2% to a new oral anticoagulant, said the researchers.
Thirty days later, rates of therapeutic INR, stroke, and bleeding events were similar regardless of whether patients had taken low-dose edoxaban, high-dose edoxaban, or warfarin during the trial, they reported. In all, 98.7% of patients switched from high-dose edoxaban had at least one INR of 2 or more, compared with 98.9% of patients switched from low-dose edoxaban and 99.4% of patients switched from warfarin, they said (J. Am. Coll. Cardiol. 2014;64:576-84).
Post-transition rates of strokes (1.85% to 1.90% per year) and major bleeding (2.69% to 4.76% per year) also were similar among the three trial groups, they added.
The excess ischemic events in earlier trials probably resulted from relative delays in achieving a therapeutic INR when patients were switched from a newer oral anticoagulant to an open-label VKA, the researchers noted, adding that "VKAs are effective as long as a therapeutic INR can be rapidly reached and maintained."
Daiichi Sankyo funded the ENGAGE AF-TIMI trial. Dr. Ruff reported having been a consultant and receiving honoraria from Daiichi Sankyo. Two coauthors reported financial relationships, six reported having received grant support, and two reported employment with Daiichi Sankyo.
These results appear to set a new standard for managing patients switching from a new oral anticoagulant to open-label warfarin at the end of blinded anticoagulation trials.
The data reveal ways to manage patients who need their anticoagulation interrupted. Bridging anticoagulation can prevent thromboembolic events when combined with rigorous INR monitoring and algorithm-based warfarin dosing.
Furthermore, the lack of excess bleeding with the half-dose edoxaban bridging regimen raises the possibility that lowering the dose of the anticoagulant can improve safety without compromising efficacy. In past observational studies, bridging with a fast-acting parenteral anticoagulant until INR reached 2.0 increased the risk of bleeding probably because of dose overlap between the bridging agent and warfarin. Also, annualized stroke rates during the transition phase slightly exceeded those during the rest of the trial, reminding clinicians that even when carefully managed, switching from one anticoagulant to another is not without risk.
Remaining questions include whether to apply bridging uniformly, whether a half-dose of edoxaban is sufficient, and whether results for lower edoxaban dosing can be extrapolated to other new oral anticoagulants, said the researchers. Finally, evaluation of the transition kit in the ENGAGE AF-TIMI 48 trial was not randomized, and our conclusions regarding the efficacy and safety of this approach compared with no bridging or a more limited bridging strategy are based on indirect comparisons across trials and cannot be considered definitive. In the meantime several large ongoing trials are evaluating bridging regimens for surgical patients who need their warfarin therapy interrupted.
Dr. John Eikelboom, Dr. Thomas. Vanassche, and Dr. Stuart Connolly, are cardiologists with Hamilton General Hospital and McMaster University in Ontario, Canada. Dr. Eikelboom has received financial support from companies that make and market non–vitamin K antagonist oral anticoagulants, including Bayer HealthCare, Boehringer Ingelheim, Bristol-Myers Squibb, Janssen, and Pfizer. Dr. Connolly has been an adviser, consultant, or speaker for Bayer HealthCare Pharmaceuticals, BI, BMS, Pfizer, and Portola Pharmaceuticals. Dr. Vanassche reported no financial conflicts of interest. These remarks were excerpted from their editorial accompanying Dr. Ruff’s report (J. Am. Coll. Cardiol. 2014;64:585-7).
A detailed transition plan protected most atrial fibrillation patients from strokes and major bleeding when they switched oral anticoagulants, researchers reported in the August issue of the Journal of the American College of Cardiology.
Following such a plan could help patients safely switch anticoagulants in clinical practice, said Dr. Christian Ruff at Harvard Medical School in Boston and his associates.
They reported an analysis from the ENGAGE AF-TIMI 48 (Effective Anticoagulation With Factor Xa Next Generation in Atrial Fibrillation–Thrombolysis in Myocardial Infarction 48) trial, which randomized more than 21,000 AF patients at high risk of stroke to either the investigational factor Xa inhibitor edoxaban or warfarin. Edoxaban was shown noninferior to warfarin in preventing stroke or systemic embolism (N. Engl. J. Med. 2013; 369:2093-104).
In the past, researchers from the ROCKET AF and ARISTOTLE trials reported excess strokes and bleeding events after patients were switched from blinded factor Xa inhibitors to open-label antithrombotics, the investigators said.
In response, ENGAGE AF-TIMI 48 patients and their physicians decided together whether to switch to an open-label vitamin K antagonist (VKA) or a newer oral anticoagulant at the end of the trial, the researchers said. Patients then received a transition kit with a 14-day supply of either a half-dose edoxaban for patients switching from blinded edoxaban to open warfarin, or a placebo for patients switching from blinded to open warfarin. Patients also underwent at least three international normalized ratio (INR) tests during the first 2 weeks of the transition period and were dosed based on a VKA titration algorithm designed to quickly reach therapeutic INR, they said.
Among 13,642 ENGAGE AF-TIMI patients alive at the end of the trial, 68.2% transitioned to a VKA and 31.2% to a new oral anticoagulant, said the researchers.
Thirty days later, rates of therapeutic INR, stroke, and bleeding events were similar regardless of whether patients had taken low-dose edoxaban, high-dose edoxaban, or warfarin during the trial, they reported. In all, 98.7% of patients switched from high-dose edoxaban had at least one INR of 2 or more, compared with 98.9% of patients switched from low-dose edoxaban and 99.4% of patients switched from warfarin, they said (J. Am. Coll. Cardiol. 2014;64:576-84).
Post-transition rates of strokes (1.85% to 1.90% per year) and major bleeding (2.69% to 4.76% per year) also were similar among the three trial groups, they added.
The excess ischemic events in earlier trials probably resulted from relative delays in achieving a therapeutic INR when patients were switched from a newer oral anticoagulant to an open-label VKA, the researchers noted, adding that "VKAs are effective as long as a therapeutic INR can be rapidly reached and maintained."
Daiichi Sankyo funded the ENGAGE AF-TIMI trial. Dr. Ruff reported having been a consultant and receiving honoraria from Daiichi Sankyo. Two coauthors reported financial relationships, six reported having received grant support, and two reported employment with Daiichi Sankyo.
FROM THE JOURNAL OF THE AMERICAN COLLEGE OF CARDIOLOGY
Key clinical point: Following a prescribed transition plan when switching oral anticoagulants protected most AF patients from strokes and major bleeding.
Major finding: Thirty days after transitioning to a new oral anticoagulant, 98.7% of patients who were switched from high-dose edoxaban had at least one therapeutic INR, compared with 98.9% of patients switched from low-dose edoxaban and 99.4% of patients switched from warfarin. Post-transition rates of stroke and major bleeding also were similar among all three groups.
Data source: Randomized, open-label study of 13,642 patients with AF from the ENGAGE AF-TIMI 48 trial. At the end of the trial, 68.2% of patients transitioned to an open-label vitamin K antagonist, and 31.2% were switched to new oral anticoagulant.
Disclosures: Daiichi Sankyo funded the ENGAGE AF-TIMI trial. Dr. Ruff reported having been a consultant and receiving honoraria from Daiichi Sankyo. Two coauthors reported financial relationships, six reported having received grant support, and two reported employment with Daiichi Sankyo.