User login
Caring for an expectant mother
"Mrs. Jones in ED room 12? Septic with severe multilobar pneumonia and hypoxemic respiratory failure? Got it. I’m on my way down to the ED now." The heart races in anticipation of caring for this critically ill patient near death’s door. But it’s okay. You know exactly what you have to do. You have done it many times before. No problem. Just as you are about to hang up the phone you learn more ...
"What’s that? She is 22 weeks pregnant? Uh, all right."

Suddenly, what initially seemed to be a routine case takes a complicated twist. You are no longer caring for one life, you are caring for two (or more), and one of those is extremely frail and vulnerable. The bugs, the drugs, maintaining adequate perfusion of vital organs – both hers and her baby’s – the questions of "What if ... ?" and "Should I ... ?" race through your mind. Should you get infectious disease and pulmonary consultations for an added layer of protection or should you treat her as you have treated so many others before her, the caveat, of course, being the need to check every single drug for its teratogenicity.
If you have ever felt at least a little queasiness in the pit of your stomach when called upon to care for an expectant mother, you are notalone. I think it is natural to feel a bit uneasy when we care for pregnant patients because most of us do it rather infrequently and there may not be room for a do-over even if you make the tiniest mistake. Each drug we order has the potential to do harm and any missed or delayed diagnosis may be tolerated well by mom, but maybe not much by the tiny baby growing inside her. Get it right and the family may live a storybook fantasy. Yet, a single miscalculation, an honest mistake, and that innocent child’s future may be compromised or destroyed.
Fortunately, these days, horror stories seem to be less frequent than in the past. But we must remain vigilant to not only optimally treat our patient (mommy), but also to protect our patients (mommy and baby) from future complications of treatment. If there is any doubt, go ahead and call an infectious disease and pulmonary consultation. Sometimes, everyone sleeps better when we do.
Dr. A. Maria Hester is a hospitalist with Baltimore-Washington Medical Center, Glen Burnie, Md., who has a passion for empowering patients to partner in their health care. She is the creator of the Patient Whiz, a patient-engagement app for iOS.
"Mrs. Jones in ED room 12? Septic with severe multilobar pneumonia and hypoxemic respiratory failure? Got it. I’m on my way down to the ED now." The heart races in anticipation of caring for this critically ill patient near death’s door. But it’s okay. You know exactly what you have to do. You have done it many times before. No problem. Just as you are about to hang up the phone you learn more ...
"What’s that? She is 22 weeks pregnant? Uh, all right."
Suddenly, what initially seemed to be a routine case takes a complicated twist. You are no longer caring for one life, you are caring for two (or more), and one of those is extremely frail and vulnerable. The bugs, the drugs, maintaining adequate perfusion of vital organs – both hers and her baby’s – the questions of "What if ... ?" and "Should I ... ?" race through your mind. Should you get infectious disease and pulmonary consultations for an added layer of protection or should you treat her as you have treated so many others before her, the caveat, of course, being the need to check every single drug for its teratogenicity.
If you have ever felt at least a little queasiness in the pit of your stomach when called upon to care for an expectant mother, you are notalone. I think it is natural to feel a bit uneasy when we care for pregnant patients because most of us do it rather infrequently and there may not be room for a do-over even if you make the tiniest mistake. Each drug we order has the potential to do harm and any missed or delayed diagnosis may be tolerated well by mom, but maybe not much by the tiny baby growing inside her. Get it right and the family may live a storybook fantasy. Yet, a single miscalculation, an honest mistake, and that innocent child’s future may be compromised or destroyed.
Fortunately, these days, horror stories seem to be less frequent than in the past. But we must remain vigilant to not only optimally treat our patient (mommy), but also to protect our patients (mommy and baby) from future complications of treatment. If there is any doubt, go ahead and call an infectious disease and pulmonary consultation. Sometimes, everyone sleeps better when we do.
Dr. A. Maria Hester is a hospitalist with Baltimore-Washington Medical Center, Glen Burnie, Md., who has a passion for empowering patients to partner in their health care. She is the creator of the Patient Whiz, a patient-engagement app for iOS.

Almonds
A tree species belonging to the Rosaceae family and native to the Middle East and South Asia, Prunus dulcis (also called Prunus amygdalus), popularly known as almond, is cultivated widely in warm, arid locations and used primarily for its edible seeds (J. Agric. Food Chem. 2007;55:8498-507; J. Agric. Food Chem. 2006;54:312-8). Almonds and almond skins are rich in polyphenols and are an important source of these phytonutrients, particularly flavan-3-ols and flavonols (J. Proteome Res. 2010;9:5859-67). Almonds also are known to contain an abundance of fiber (Anaerobe 2014;26:1-6). Almond extracts are used in cosmetic formulations because of their high concentration of polyphenols, particularly flavonoids and phenolic acids (Int. J. Curr. Pharm. Res. 2011;3:57-9).
Key components
In 2006, Milbury et al. determined that the main flavonoids and phenolic acids in Prunus dulcis skins and kernels are isorhamnetin-3-O-rutinoside and isorhamnetin-3-O-glucoside (in combination), catechin, kaempferol-3-O-rutinoside, epicatechin, quercetin-3-O-galactoside, and isorhamnetin-3-O-galactoside (J. Agric. Food Chem. 2006;54:5027-33).

In a separate study that year, Wijeratne et al. identified quercetin, isorhamnetin, quercitrin, kaempferol 3-O-rutinoside, isorhamnetin 3-O-glucoside, and morin as the primary flavonoids in various whole-seed, brown, skin, and green-shell-cover almond extracts (J. Agric. Food Chem. 2006;54:312-8). Almond seed skin also has been shown to contain highly polymerized polyphenols that exhibit potent alpha-amylase inhibitory activity, thus slowing the absorption of carbohydrate (J. Agric. Food Chem. 2013;61:4570-6).
In 2010, Bartolomé et al. identified A- and B-type procyanidin, propelargonidin, and prodelphinidin polymers in almond skins. In human plasma and urine samples taken after consumption of almond skin polyphenols, the investigators detected O-methyl glucuronide sulfate and O-methyl sulfate derivatives of (epi)catechin; the glucuronide conjugates of naringenin and isorhamnetin; and sulfate conjugates of isorhamnetin, together with conjugates of hydroxyphenylvalerolactones. They also identified various microbial-derived metabolites, including hydroxyphenylpropionic, hydroxyphenylacetic, hydroxycinnamic, hydroxybenzoic, and hydroxyhippuric acids (Arch. Biochem. Biophys. 2010;501:124-33).
A functional food: Antioxidant constituents and activity
In a study of two human subjects conducted in 2009, Urpi-Sarda et al. profiled microbial-derived phenolic metabolites in plasma and urine samples before and after the consumption of almond skins. They detected glucuronide, O-methyl glucuronide sulfate, and O-methyl sulfate derivatives of epicatechin, the glucuronide conjugates of naringenin and glucuronide, and sulfate conjugates of isorhamnetin. The researchers also detected, in their glucuronide and sulfate forms, microbial-derived metabolites of flavanols, including 5-(dihydroxyphenyl)-gamma-valerolactone and 5-(hydroxymethoxyphenyl)-gamma-valerolactone (J. Agric. Food Chem. 2009;57:10134-42).
A 2010 study with 24 volunteers conducted by Llorach et al. investigated urinary metabolome changes during the 24-hour period following ingestion of a single dose of almond skin extract. The participants, who were following a polyphenol-free diet for 48 hours, were divided into two groups: the almond skin group or a placebo group. Thirty-four metabolites were linked to the consumption of the almond extract (J. Proteome Res. 2010;9:5859-67).

Monagas et al. previously led a comprehensive investigation of the phenolic composition of almond skins to elucidate its potential as a functional food. They identified 33 compounds, including flavanols, flavonols, dihydroflavonols, and flavanones, as well as nonflavonoid substances. The most abundant phenols were flavanols (38%-57%) and flavonol glycosides (14%-35%). Further, the researchers measured the oxygen radical absorbance capacity of almond skins at 0.398-0.500 mmol Trolox/g, a range that suggests its antioxidant potency (J. Agric. Food Chem. 2007;55:8498-507).
In 2008, Garrido et al. investigated the phenolic composition and antioxidant activity of almond skins (Prunus dulcis) obtained from three almond varieties and through various industrial processes, including blanching, blanching and drying, as well as roasting. Identified were 31 phenolic compounds, including flavan-3-ols, flavonol glycosides, hydroxybenzoic acids and aldehydes, flavonol aglycones, flavanone glycosides, flavanone aglycones, hydroxycinnamic acids, and dihydroflavonol aglycones. Phenolic content as well as antioxidant activity were significantly higher in the roasted samples (J. Food Sci. 2008;73:C106-15).
In 2014, Liu et al. conducted a study in healthy humans of the potential prebiotic effects of consuming almonds and almond skins. For 6 weeks, 48 adult volunteers ingested a daily dose of roasted almonds, almond skins, or a positive control (commercial fructo-oligosaccharides). The investigators collected fecal samples and analyzed them for microbiota composition. They observed significant increases in populations of Bifidobacterium spp. and Lactobacillus spp. in fecal samples after almond or almond skin supplementation; substantial inhibition of the growth of the pathogen Clostridium perfringens; and favorable changes in bacterial enzyme activities. They concluded that almonds and almond skins appear to exhibit potential prebiotic qualities (Anaerobe 2014;26:1-6).
Topical antiaging potential
In 2011, Sachdeva and Katyal assessed the antioxidant and antiwrinkle effects of almond skin extracts in UV-induced photoaging in mice. Twenty-five mice were used as an unirradiated control, receiving neither UV exposure nor almond skin treatment. A second group of 24 mice received only UV exposure of 5 minutes twice a day, and served as an irradiated control. Further groups of 24 mice received both UV radiation and treatment with prepared formulation. The treatment groups received various topical almond skin extract doses 2 hours prior to the same level of UV exposure. Significant decreases in malondialdehyde and increases in glutathione levels, respectively, suggested to the investigators that the almond skin extracts effectively scavenged free radicals while also enhancing moisturization. They concluded that almond skin extracts display potential as antiaging ingredients in topical cosmetic formulations (Int. J. Curr. Pharm. Res. 2011;3:57-9).
Conclusion
Almonds are believed to be a healthy addition to the human diet, with their regular consumption thought to confer cardiovascular benefits. The healthful effects of dietary intake of almonds are often attributed to the presence of several polyphenolic constituents. While it is speculated that such ingredients also play a role in imparting cutaneous benefits, the body of evidence supporting such claims remains sparse to date. Nevertheless, P. dulcis is incorporated in various cosmetic formulations. More research is necessary to ascertain whether such inclusion is warranted.
Dr. Baumann is chief executive officer of the Baumann Cosmetic & Research Institute in Miami Beach. She founded the cosmetic dermatology center at the University of Miami in 1997. Dr. Baumann wrote the textbook "Cosmetic Dermatology: Principles and Practice" (McGraw-Hill, April 2002), and a book for consumers, "The Skin Type Solution" (Bantam, 2006). She has contributed to the Cosmeceutical Critique column in Skin & Allergy News since January 2001. Dr. Baumann has received funding for clinical grants from Allergan, Aveeno, Avon Products, Galderma, Mary Kay, Medicis Pharmaceuticals, Neutrogena, Philosophy, Stiefel, Topix Pharmaceuticals, and Unilever.
A tree species belonging to the Rosaceae family and native to the Middle East and South Asia, Prunus dulcis (also called Prunus amygdalus), popularly known as almond, is cultivated widely in warm, arid locations and used primarily for its edible seeds (J. Agric. Food Chem. 2007;55:8498-507; J. Agric. Food Chem. 2006;54:312-8). Almonds and almond skins are rich in polyphenols and are an important source of these phytonutrients, particularly flavan-3-ols and flavonols (J. Proteome Res. 2010;9:5859-67). Almonds also are known to contain an abundance of fiber (Anaerobe 2014;26:1-6). Almond extracts are used in cosmetic formulations because of their high concentration of polyphenols, particularly flavonoids and phenolic acids (Int. J. Curr. Pharm. Res. 2011;3:57-9).
Key components
In 2006, Milbury et al. determined that the main flavonoids and phenolic acids in Prunus dulcis skins and kernels are isorhamnetin-3-O-rutinoside and isorhamnetin-3-O-glucoside (in combination), catechin, kaempferol-3-O-rutinoside, epicatechin, quercetin-3-O-galactoside, and isorhamnetin-3-O-galactoside (J. Agric. Food Chem. 2006;54:5027-33).
In a separate study that year, Wijeratne et al. identified quercetin, isorhamnetin, quercitrin, kaempferol 3-O-rutinoside, isorhamnetin 3-O-glucoside, and morin as the primary flavonoids in various whole-seed, brown, skin, and green-shell-cover almond extracts (J. Agric. Food Chem. 2006;54:312-8). Almond seed skin also has been shown to contain highly polymerized polyphenols that exhibit potent alpha-amylase inhibitory activity, thus slowing the absorption of carbohydrate (J. Agric. Food Chem. 2013;61:4570-6).
In 2010, Bartolomé et al. identified A- and B-type procyanidin, propelargonidin, and prodelphinidin polymers in almond skins. In human plasma and urine samples taken after consumption of almond skin polyphenols, the investigators detected O-methyl glucuronide sulfate and O-methyl sulfate derivatives of (epi)catechin; the glucuronide conjugates of naringenin and isorhamnetin; and sulfate conjugates of isorhamnetin, together with conjugates of hydroxyphenylvalerolactones. They also identified various microbial-derived metabolites, including hydroxyphenylpropionic, hydroxyphenylacetic, hydroxycinnamic, hydroxybenzoic, and hydroxyhippuric acids (Arch. Biochem. Biophys. 2010;501:124-33).
A functional food: Antioxidant constituents and activity
In a study of two human subjects conducted in 2009, Urpi-Sarda et al. profiled microbial-derived phenolic metabolites in plasma and urine samples before and after the consumption of almond skins. They detected glucuronide, O-methyl glucuronide sulfate, and O-methyl sulfate derivatives of epicatechin, the glucuronide conjugates of naringenin and glucuronide, and sulfate conjugates of isorhamnetin. The researchers also detected, in their glucuronide and sulfate forms, microbial-derived metabolites of flavanols, including 5-(dihydroxyphenyl)-gamma-valerolactone and 5-(hydroxymethoxyphenyl)-gamma-valerolactone (J. Agric. Food Chem. 2009;57:10134-42).
A 2010 study with 24 volunteers conducted by Llorach et al. investigated urinary metabolome changes during the 24-hour period following ingestion of a single dose of almond skin extract. The participants, who were following a polyphenol-free diet for 48 hours, were divided into two groups: the almond skin group or a placebo group. Thirty-four metabolites were linked to the consumption of the almond extract (J. Proteome Res. 2010;9:5859-67).
Monagas et al. previously led a comprehensive investigation of the phenolic composition of almond skins to elucidate its potential as a functional food. They identified 33 compounds, including flavanols, flavonols, dihydroflavonols, and flavanones, as well as nonflavonoid substances. The most abundant phenols were flavanols (38%-57%) and flavonol glycosides (14%-35%). Further, the researchers measured the oxygen radical absorbance capacity of almond skins at 0.398-0.500 mmol Trolox/g, a range that suggests its antioxidant potency (J. Agric. Food Chem. 2007;55:8498-507).
In 2008, Garrido et al. investigated the phenolic composition and antioxidant activity of almond skins (Prunus dulcis) obtained from three almond varieties and through various industrial processes, including blanching, blanching and drying, as well as roasting. Identified were 31 phenolic compounds, including flavan-3-ols, flavonol glycosides, hydroxybenzoic acids and aldehydes, flavonol aglycones, flavanone glycosides, flavanone aglycones, hydroxycinnamic acids, and dihydroflavonol aglycones. Phenolic content as well as antioxidant activity were significantly higher in the roasted samples (J. Food Sci. 2008;73:C106-15).
In 2014, Liu et al. conducted a study in healthy humans of the potential prebiotic effects of consuming almonds and almond skins. For 6 weeks, 48 adult volunteers ingested a daily dose of roasted almonds, almond skins, or a positive control (commercial fructo-oligosaccharides). The investigators collected fecal samples and analyzed them for microbiota composition. They observed significant increases in populations of Bifidobacterium spp. and Lactobacillus spp. in fecal samples after almond or almond skin supplementation; substantial inhibition of the growth of the pathogen Clostridium perfringens; and favorable changes in bacterial enzyme activities. They concluded that almonds and almond skins appear to exhibit potential prebiotic qualities (Anaerobe 2014;26:1-6).
Topical antiaging potential
In 2011, Sachdeva and Katyal assessed the antioxidant and antiwrinkle effects of almond skin extracts in UV-induced photoaging in mice. Twenty-five mice were used as an unirradiated control, receiving neither UV exposure nor almond skin treatment. A second group of 24 mice received only UV exposure of 5 minutes twice a day, and served as an irradiated control. Further groups of 24 mice received both UV radiation and treatment with prepared formulation. The treatment groups received various topical almond skin extract doses 2 hours prior to the same level of UV exposure. Significant decreases in malondialdehyde and increases in glutathione levels, respectively, suggested to the investigators that the almond skin extracts effectively scavenged free radicals while also enhancing moisturization. They concluded that almond skin extracts display potential as antiaging ingredients in topical cosmetic formulations (Int. J. Curr. Pharm. Res. 2011;3:57-9).
Conclusion
Almonds are believed to be a healthy addition to the human diet, with their regular consumption thought to confer cardiovascular benefits. The healthful effects of dietary intake of almonds are often attributed to the presence of several polyphenolic constituents. While it is speculated that such ingredients also play a role in imparting cutaneous benefits, the body of evidence supporting such claims remains sparse to date. Nevertheless, P. dulcis is incorporated in various cosmetic formulations. More research is necessary to ascertain whether such inclusion is warranted.
Dr. Baumann is chief executive officer of the Baumann Cosmetic & Research Institute in Miami Beach. She founded the cosmetic dermatology center at the University of Miami in 1997. Dr. Baumann wrote the textbook "Cosmetic Dermatology: Principles and Practice" (McGraw-Hill, April 2002), and a book for consumers, "The Skin Type Solution" (Bantam, 2006). She has contributed to the Cosmeceutical Critique column in Skin & Allergy News since January 2001. Dr. Baumann has received funding for clinical grants from Allergan, Aveeno, Avon Products, Galderma, Mary Kay, Medicis Pharmaceuticals, Neutrogena, Philosophy, Stiefel, Topix Pharmaceuticals, and Unilever.

Why EHRs are not the face of digital health technology
Medical imaging was the first taste of digital health technology for physicians and most health care providers. The technology provides prompt high-quality information which improves efficiency and is mobile. Then came electronic health records (EHRs). EHRs were mandated as part of the Health Information Technology for Economic and Clinical Health (HITECH) Act of 2009. The goals of EHRs are to improve patient safety, decrease costs, and allow for the seamless exchange of information among providers and providing entities. As a proponent of digital health technologies, I submit that they are patient advocacy tools. The debate over the "effectiveness"of EHRs continues. It is too early to evaluate the true impact of EHRs on patient care at this juncture. Stage 1 of Meaningful Use (MU) of EHRs pertains solely to data capture. It is with Stages 2 and 3 that patient engagement and clinical decision support tools are incorporated in processes around the EHR. These stages have not been fully implemented and won’t be for a few years to come. Therefore those attributes of MU potentially having the most impact on patients are not in use today. What we do know is that: A) Physicians are spending more time looking at computer screens than into the faces of the people they are treating. B) That much of the data entered is to satisfy regulations of the HITECH Act and not directly related to patient care. C) That EHRs were designed for billing and regulatory purposes and do not in any way reflect clinical work flow. D) EHRs do not integrate well with medical devices or disparate digital health technology systems. However some excellent progress has been made in developing true interoperability among systems.
The EHR does not represent the face of digital technology in health care. Mobile health technologies, wearable sensor technologies, aging at home technologies, and ingestible medication sensor technology populate today’s digital health landscape. These are developments which will contribute directly to more efficient and improved patient care. They will address gaps in care. Having a mother who is ill and requiring significant help at home has taken me on a journey riddled with frustration and pain that is also experienced by my patients and their caregivers daily. It has made me a better physician, who realizes that the most important aspect of care is empathy. Most people view technology as a something that creates a divide between provider and patient. Effective technology can actually bring them closer. It can deliver trending data (which must be accurate, filtered, and actionable in order to be useful), drastically altering care recommendations and preventing hospitalizations and medical emergencies. While there remains much to be proven with regards to digital technologies, I expect them to become a backbone of the health care landscape.

Another digital health technology sector making its way into advanced health care enterprises is analytics. These tools take health care "big data" and make it relevant to treating individual patients as well as populations. Use cases for health care analytics demonstrate that EHRs, while being innately clumsy can be transformed into powerful sources of useful information.
Patients as consumers are demanding mobile tools long utilized in the retail and finance sectors . Examples can be seen in patient-physician video conferencing, mobile appointment schedulers, and even a smartphone ECG rhythm monitor. Digital health also involves social media. Patients are now finding themselves in online patient support groups. There are significant advantages of online versus real life support groups. On the provider side, digital tools such as Doximity and Epocratesare widely used.
In summary, the digital health landscape is much broader and friendlier than the EHR of today. I look forward to EHRs becoming more user friendly and clinically rewarding.
Dr. Scher is an electrophysiologist with the Heart Group of Lancaster (Pa.) General Health. He is also director of DLS Healthcare Consulting, Harrisburg, Pa., and clinical associate professor of medicine at the Pennsylvania State University, Hershey.
Medical imaging was the first taste of digital health technology for physicians and most health care providers. The technology provides prompt high-quality information which improves efficiency and is mobile. Then came electronic health records (EHRs). EHRs were mandated as part of the Health Information Technology for Economic and Clinical Health (HITECH) Act of 2009. The goals of EHRs are to improve patient safety, decrease costs, and allow for the seamless exchange of information among providers and providing entities. As a proponent of digital health technologies, I submit that they are patient advocacy tools. The debate over the "effectiveness"of EHRs continues. It is too early to evaluate the true impact of EHRs on patient care at this juncture. Stage 1 of Meaningful Use (MU) of EHRs pertains solely to data capture. It is with Stages 2 and 3 that patient engagement and clinical decision support tools are incorporated in processes around the EHR. These stages have not been fully implemented and won’t be for a few years to come. Therefore those attributes of MU potentially having the most impact on patients are not in use today. What we do know is that: A) Physicians are spending more time looking at computer screens than into the faces of the people they are treating. B) That much of the data entered is to satisfy regulations of the HITECH Act and not directly related to patient care. C) That EHRs were designed for billing and regulatory purposes and do not in any way reflect clinical work flow. D) EHRs do not integrate well with medical devices or disparate digital health technology systems. However some excellent progress has been made in developing true interoperability among systems.
The EHR does not represent the face of digital technology in health care. Mobile health technologies, wearable sensor technologies, aging at home technologies, and ingestible medication sensor technology populate today’s digital health landscape. These are developments which will contribute directly to more efficient and improved patient care. They will address gaps in care. Having a mother who is ill and requiring significant help at home has taken me on a journey riddled with frustration and pain that is also experienced by my patients and their caregivers daily. It has made me a better physician, who realizes that the most important aspect of care is empathy. Most people view technology as a something that creates a divide between provider and patient. Effective technology can actually bring them closer. It can deliver trending data (which must be accurate, filtered, and actionable in order to be useful), drastically altering care recommendations and preventing hospitalizations and medical emergencies. While there remains much to be proven with regards to digital technologies, I expect them to become a backbone of the health care landscape.
Another digital health technology sector making its way into advanced health care enterprises is analytics. These tools take health care "big data" and make it relevant to treating individual patients as well as populations. Use cases for health care analytics demonstrate that EHRs, while being innately clumsy can be transformed into powerful sources of useful information.
Patients as consumers are demanding mobile tools long utilized in the retail and finance sectors . Examples can be seen in patient-physician video conferencing, mobile appointment schedulers, and even a smartphone ECG rhythm monitor. Digital health also involves social media. Patients are now finding themselves in online patient support groups. There are significant advantages of online versus real life support groups. On the provider side, digital tools such as Doximity and Epocratesare widely used.
In summary, the digital health landscape is much broader and friendlier than the EHR of today. I look forward to EHRs becoming more user friendly and clinically rewarding.
Dr. Scher is an electrophysiologist with the Heart Group of Lancaster (Pa.) General Health. He is also director of DLS Healthcare Consulting, Harrisburg, Pa., and clinical associate professor of medicine at the Pennsylvania State University, Hershey.

Summary of evidence-based guideline: complementary and alternative medicine in multiple sclerosis. Report of the Guideline Development Subcommittee of the American Academy of Neurology
Cannabinoids
Cannabinoid Practice Recommendations
Clinicians might offer oral cannabis extract (OCE) to patients with multiple sclerosis (MS) to reduce patient-reported symptoms of spasticity and pain (excluding central neuropathic pain) (Level A) and might counsel patients that this symptomatic benefit is possibly maintained for 1 year (Level C), although OCE is probably ineffective for improving objective spasticity measures (short-term) or tremor (Level B).
Clinicians might offer tetrahydrocannabinol (THC) to patients with MS to reduce patient-reported symptoms of spasticity and pain (excluding central neuropathic pain) (Level B). Clinicians might counsel patients that this symptomatic benefit is possibly maintained for 1 year (Level C), although THC is probably ineffective for improving objective spasticity measures (short-term) or tremor (Level B).
Clinicians might offer Sativex oromucosal cannabinoid spray (nabiximols), where available, to reduce symptoms of spasticity, pain, or urinary frequency, although it is probably ineffective for improving objective spasticity measures or number of urinary incontinence episodes (Level B).
Clinicians might choose not to offer Sativex oromucosal cannabinoid spray to reduce MS-related tremor (Level C).
Data are inadequate to support or refute use of the following in MS (Level U):
- OCE/THC for bladder urge incontinence and overall symptoms
- Synthetic THC (Marinol) for central neuropathic pain
- Sativex oromucosal cannabinoid spray for overall bladder symptoms, anxiety symptoms/sleep problems, cognitive symptoms, quality of life (QOL), and fatigue
- Smoked cannabis for spasticity, pain, balance/posture, and cognition
Data are inadequate to determine the abuse potential or effect on psychopathologic symptoms of Sativex cannabinoid spray (Level U).
Clinical Context
The cannabinoid studies have limitations that physicians and patients must be aware of. Most studies were of short duration (6 to 15 weeks). Another limitation was the potential for central side effects to unmask patients to treatment assignment — a concern with regard to all masked trials involving treatments with prominent side effects. It is also important to recognize that the Ashworth scale used for objective measurement may be insensitive to spasticity changes. These factors may contribute to the discordant effects of cannabinoids on subjective and objective spasticity measures.
Ginkgo Biloba (GB)
GB Practice Recommendations
Clinicians might counsel patients with MS that GB is established as ineffective for improving cognitive function (Level A).
Clinicians might counsel patients with MS that GB is possibly effective for reducing fatigue (Level C).
Clinical Context
GB and other supplements are not U.S. Food and Drug Administration (FDA) regulated. Their quality control may play a role in their effectiveness and adverse effect (AE) risk. Moreover, interactions of supplements with other medications, especially disease-modifying therapies for MS, are a clinical concern.
Low-Fat Diet with Omega-3 Fatty Acid Supplementation (Omega-3)
Omega-3 Practice Recommendation
Clinicians might counsel patients that a low-fat diet with fish oil supplementation is probably ineffective for reducing relapses, disability, or magnetic resonance imaging (MRI) lesions, or for improving fatigue or QOL in MS (Level B).
Lofepramine
Lofepramine Practice Recommendation
Clinicians might counsel patients with MS that lofepramine plus L-phenylalanine with vitamin B12 (Cari Loder regimen) is possibly ineffective for treating disability, symptoms, depression, or fatigue (Level C).
Reflexology
Reflexology Practice Recommendation
Clinicians might counsel patients with MS that reflexology is possibly effective for reducing paresthesia (Level C).
Bee Venom
Bee Venom Practice Recommendation
Clinicians might counsel patients with MS that bee sting therapy is possibly ineffective for reducing relapses, disability, fatigue, total MRI lesion burden, new gadolinium-enhancing lesion volume, or health-related quality of life (HRQOL) (Level C).
Clinical Context
Bee stings can be associated with anaphylactic reaction and possible death.
Magnetic Therapy
Magnetic Therapy Practice Recommendation
Clinicians might counsel patients with MS that magnetic therapy is probably effective for reducing fatigue (Level B) and probably ineffective for reducing depression (Level B).
Other CAM Therapies Practice Recommendation
Clinicians should counsel patients with MS that the safety and efficacy of other reviewed CAM, or the interaction of CAM with disease-modifying therapies for MS, are unknown (Level U).
Definitions:
Classification of Evidence for Therapeutic Interventions
Class I: A randomized, controlled clinical trial of the intervention of interest with masked or objective outcome assessment, in a representative population. Relevant baseline characteristics are presented and substantially equivalent among treatment groups or there is appropriate statistical adjustment for differences.
The following are also required:
- Concealed allocation
- Primary outcome(s) clearly defined
- Exclusion/inclusion criteria clearly defined
- Adequate accounting for drop-outs (with at least 80% of enrolled subjects completing the study) and cross-overs with numbers sufficiently low to have minimal potential for bias.
- For noninferiority or equivalence trials claiming to prove efficacy for one or both drugs, the following are also required*:
- The authors explicitly state the clinically meaningful difference to be excluded by defining the threshold for equivalence or noninferiority.
- The standard treatment used in the study is substantially similar to that used in previous studies establishing efficacy of the standard treatment (e.g., for a drug, the mode of administration, dose and dosage adjustments are similar to those previously shown to be effective).
- The inclusion and exclusion criteria for patient selection and the outcomes of patients on the standard treatment are comparable to those of previous studies establishing efficacy of the standard treatment.
- The interpretation of the results of the study is based upon a per protocol analysis that takes into account dropouts or crossovers.
Class II: A randomized controlled clinical trial of the intervention of interest in a representative population with masked or objective outcome assessment that lacks one criteria a-e above or a prospective matched cohort study with masked or objective outcome assessment in a representative population that meets b-e above. Relevant baseline characteristics are presented and substantially equivalent among treatment groups or there is appropriate statistical adjustment for differences.
Class III: All other controlled trials (including well-defined natural history controls or patients serving as own controls) in a representative population, where outcome is independently assessed, or independently derived by objective outcome measurement.**
Class IV: Studies not meeting Class I, II or III criteria including consensus or expert opinion.
*Note that numbers 1-3 in Class Ie are required for Class II in equivalence trials. If any one of the three is missing, the class is automatically downgraded to Class III.
**Objective outcome measurement: an outcome measure that is unlikely to be affected by an observer's (patient, treating physician, investigator) expectation or bias (e.g., blood tests, administrative outcome data).
Classification of Recommendations
Level A = Established as effective, ineffective, or harmful (or established as useful/predictive or not useful/predictive) for the given condition in the specified population. (Level A rating requires at least two consistent Class I studies.)*
Level B = Probably effective, ineffective, or harmful (or probably useful/predictive or not useful/predictive) for the given condition in the specified population. (Level B rating requires at least one Class I study or at least two consistent Class II studies.)
Level C = Possibly effective, ineffective, or harmful (or possibly useful/predictive or not useful/predictive) for the given condition in the specified population. (Level C rating requires at least one Class II study or two consistent Class III studies.)
Level U = Data inadequate or conflicting; given current knowledge, treatment (test, predictor) is unproven.
*In exceptional cases, one convincing Class I study may suffice for an "A" recommendation if 1) all criteria are met, 2) the magnitude of effect is large (relative rate improved outcome >5 and the lower limit of the confidence interval is >2).
OBJECTIVE:
To develop evidence-based recommendations for complementary and alternative medicine (CAM) in multiple sclerosis (MS).
METHODS:
We searched the literature (1970-March 2011; March 2011-September 2013 MEDLINE search), classified articles, and linked recommendations to evidence.
Guidelines are copyright © 2014 American Academy of Neurology. All rights reserved. The summary is provided by the Agency for Healthcare Research and Quality.
Robin Williams’s suspected suicide could encourage others to get help
The news last night was tragic: Robin Williams has died of an apparent suicide at the early age of 63. I saw the news and felt overwhelmingly sad. Really? He was a tremendous actor, a creative genius by any account, a man who I imagined had everything – talent, wealth, fame, the wonderful ability to make people laugh and to brighten lives. Such people also get draped with love and admiration, though certainly at a price. For what it’s worth, Robin Williams has been open about the fact that he’s struggled with both depression and addiction, but the complete story is never the one that gets told by the media.

Twitter started with 140-character links to suicide hotlines and suicide awareness, to statements about how depression is a treatable illness – Is it always? – and I hit retweet on a comment stating:" We’re never going to get anywhere till we take seriously that depression is an illness, not a weakness" and several people retweeted my retweet. I’m not sure why I did this; I don’t think that most people still think of mood disorders as a "weakness," or that those who do might change their minds because of a tweet. And I don’t think that suicide does anything to reduce stigma.
One psychiatrist friend tweeted a comment about how one should never ask someone why they are depressed, I guess because the "why?" implies something other than because biology dictated it, but if you’ve ever spoken to a person suffering from depression, you know that it comes in all shades of severity and that people often write a story to explain it. Sometimes that story is right: I’m depressed because of a breakup, or because I don’t have a job now, or because of ongoing work stress – and indeed, the person suffering often feels better after talking about the situation, after getting a new boyfriend or a new job, or after their boss moves to Zimbabwe.
I’m convinced that treatment works best when psychotherapy is combined with medication (if indicated), and while medicines are a miracle for some, they aren’t for others. As psychiatrists, we certainly see a good deal of treatment-resistant depression. And yes, the antipsychiatry faction may postulate that it is the treatment – the medications, specifically – that cause people to kill themselves and others, but I will leave you with the idea that the science just doesn’t support that. Certainly, they aren’t for everyone, but clinically, I have seen medications do more good than harm in clinical practice overall.
I know nothing about Robin Williams beyond what I’ve read in the media, and I know that the media reports are often incomplete and distorted. I do imagine that Mr. Williams had the resources to get good care and that he may well have had treatment for depression since he was open about his struggle. His story will be used to say: "Get help," and if you’re feeling suicidal and aren’t getting help, please do so. If you’re feeling suicidal and "help" isn’t making you feel better, please consider getting a second opinion or a different kind of help.
The tragic thing about suicide is that it’s a permanent answer to what is often a temporary problem.

Sometimes, I imagine that there are people who have tried and tried to get help and that their pain remains so unbearable for so long that suicide offers them the only possible relief – if such a thing is even to be had given that we don’t what comes next and some religions will say that suicide leads to nowhere good. Even if it provides relief to the person involved, it comes with the cost of leaving those who remain in horrible pain. Sadly, depressed people sometimes imagine that the world will be better off without them, and often that idea is just not true.
I hope that Robin Williams is in a better place, for his sake. I hope that before he ended his life, he tried every possible treatment option, and that this wasn’t an impulsive decision, or one based on an episodic relapse of either depression or substance abuse – a relapse that may have resolved and let him live for decades more. I hope his wife and children and all the people who knew and loved him will eventually find some peace. His death, however, is not simply a personal one because he touched us all with his talent and his charisma. What a tragic loss.
Dr. Miller also posted a version http://bit.ly/1kyO1a7 of this piece on the Shrink Rap News website. She is a coauthor of "Shrink Rap: Three Psychiatrists Explain Their Work" (Baltimore: the Johns Hopkins University Press, 2011).
The news last night was tragic: Robin Williams has died of an apparent suicide at the early age of 63. I saw the news and felt overwhelmingly sad. Really? He was a tremendous actor, a creative genius by any account, a man who I imagined had everything – talent, wealth, fame, the wonderful ability to make people laugh and to brighten lives. Such people also get draped with love and admiration, though certainly at a price. For what it’s worth, Robin Williams has been open about the fact that he’s struggled with both depression and addiction, but the complete story is never the one that gets told by the media.
Twitter started with 140-character links to suicide hotlines and suicide awareness, to statements about how depression is a treatable illness – Is it always? – and I hit retweet on a comment stating:" We’re never going to get anywhere till we take seriously that depression is an illness, not a weakness" and several people retweeted my retweet. I’m not sure why I did this; I don’t think that most people still think of mood disorders as a "weakness," or that those who do might change their minds because of a tweet. And I don’t think that suicide does anything to reduce stigma.
One psychiatrist friend tweeted a comment about how one should never ask someone why they are depressed, I guess because the "why?" implies something other than because biology dictated it, but if you’ve ever spoken to a person suffering from depression, you know that it comes in all shades of severity and that people often write a story to explain it. Sometimes that story is right: I’m depressed because of a breakup, or because I don’t have a job now, or because of ongoing work stress – and indeed, the person suffering often feels better after talking about the situation, after getting a new boyfriend or a new job, or after their boss moves to Zimbabwe.
I’m convinced that treatment works best when psychotherapy is combined with medication (if indicated), and while medicines are a miracle for some, they aren’t for others. As psychiatrists, we certainly see a good deal of treatment-resistant depression. And yes, the antipsychiatry faction may postulate that it is the treatment – the medications, specifically – that cause people to kill themselves and others, but I will leave you with the idea that the science just doesn’t support that. Certainly, they aren’t for everyone, but clinically, I have seen medications do more good than harm in clinical practice overall.
I know nothing about Robin Williams beyond what I’ve read in the media, and I know that the media reports are often incomplete and distorted. I do imagine that Mr. Williams had the resources to get good care and that he may well have had treatment for depression since he was open about his struggle. His story will be used to say: "Get help," and if you’re feeling suicidal and aren’t getting help, please do so. If you’re feeling suicidal and "help" isn’t making you feel better, please consider getting a second opinion or a different kind of help.
The tragic thing about suicide is that it’s a permanent answer to what is often a temporary problem.
Sometimes, I imagine that there are people who have tried and tried to get help and that their pain remains so unbearable for so long that suicide offers them the only possible relief – if such a thing is even to be had given that we don’t what comes next and some religions will say that suicide leads to nowhere good. Even if it provides relief to the person involved, it comes with the cost of leaving those who remain in horrible pain. Sadly, depressed people sometimes imagine that the world will be better off without them, and often that idea is just not true.
I hope that Robin Williams is in a better place, for his sake. I hope that before he ended his life, he tried every possible treatment option, and that this wasn’t an impulsive decision, or one based on an episodic relapse of either depression or substance abuse – a relapse that may have resolved and let him live for decades more. I hope his wife and children and all the people who knew and loved him will eventually find some peace. His death, however, is not simply a personal one because he touched us all with his talent and his charisma. What a tragic loss.
Dr. Miller also posted a version http://bit.ly/1kyO1a7 of this piece on the Shrink Rap News website. She is a coauthor of "Shrink Rap: Three Psychiatrists Explain Their Work" (Baltimore: the Johns Hopkins University Press, 2011).

Guideline for overactive bladder adds new treatments
Updated recommendations for the diagnosis and treatment of non-neurogenic overactive bladder incorporate two new treatments approved since 2012 – oral mirabegron and intradetrusor injection of onabotulinumtoxinA.
The 2014 update from the American Urological Association and the Society of Urodynamics, Female Pelvic Medicine and Urogenital Reconstruction (AUA/SUFU) also recognizes the growing number of therapeutic options by stressing the need to take a methodical approach and give an adequate trial of individual treatments before combining them.

"As we have more and more options on the market, you don’t want to stack one on top of another," Dr. Emily Cole said in an interview.
"All of these methodologies have some side effects. What you don’t want to do is have added side effects if something is not working," said Dr. Cole, a urologist specializing in female pelvic medicine and reconstructive surgery in a group practice in San Diego.
Compared with the 2012 AUA/SUFU recommendations, the 2014 guideline on "Diagnosis and Treatment of Overactive Bladder (Non-Neurogenic) in Adults" adds the beta3-adrenoceptor agonist mirabegron (Myrbetriq, Astellas Pharma) as a first- or second-line treatment option for some patients. OnabotulinumtoxinA (Botox, Allergan) has been upgraded to a "Standard Option" among third-line treatments instead of a nonapproved, off-label therapy.
The Food and Drug Administration approved mirabegron for adults with overactive bladder in June 2012. The FDA approved onabotulinumtoxinA (Botox, Allergan) in January 2013 for adults with overactive bladder who can’t use or don’t respond adequately to anticholinergics.
Clinicians always should start with first- and second-line therapies to reduce symptoms of overactive bladder, Dr. Cole said. By the time patients come to her, they typically have failed those options, but she offers them hope with third-line treatments.
"In most cases, we can really help patients. We may not make you completely dry," she said, but "we have enough tools now that we can make marked improvements."
That’s a big change in recent years, she added. "When I started out, we had two medications that had horrible side effects," she said. Dr. Cole was not involved in creation of the AUA/SUFU guideline.
The AUA/SUFU based the 2012 guideline on 151 articles on the treatment of overactive bladder and reviewed 72 more articles on treatment for the 2014 update.
The recommendations on diagnosis have not changed since 2012 and are based on expert opinion and clinical principles due to insufficient evidence for stronger recommendations.
First-line treatments are behavioral therapies such as bladder training and bladder control strategies or pelvic floor muscle training, which may be combined with pharmacologic management, the guideline states.
Second-line treatments include oral antimuscarinic drugs or mirabegron, preferably in an extended-release formulation if available to reduce the likelihood of dry mouth from immediate-release formulations. A transdermal patch that delivers the antimuscarinic drug oxybutynin became available to adult women over the counter (without a prescription) in 2013.
If a first antimuscarinic medication doesn’t work or causes unacceptable side effects, modify the dose or offer a different antimuscarinic or beta3-adrenoceptor agonist, the guideline states. If an antimuscarinic is effective but causes constipation or dry mouth, don’t give up on that drug class without trying to manage side effects through bowel management, fluid management, modifying the dose, or trying another antimuscarinic.
Be extremely cautious in using antimuscarinics in patients with impaired gastric emptying or a history of urinary retention, and don’t use antimuscarinics in patients with narrow-angle glaucoma without approval from a treating ophthalmologist. If a patient is on other medications with anticholinergic properties, be cautious about prescribing antimuscarinics.
Patients who fail first- and second-line therapies should be evaluated by a specialist if they still desire treatment, according to the guideline.
Among third-line treatment options, sacral neuromodulation may be offered to patients with severe refractory overactive bladder or patients who are not candidates for second-line treatments and who are willing to undergo a surgical procedure. Peripheral tibial nerve stimulation is another option in carefully selected patients.
Intradetrusor injections of Botox may be appropriate for carefully selected and "thoroughly counseled" patients who failed first- and second-line treatments if they are able and willing to return for frequent postvoid residual evaluations and to perform self-catheterization if necessary.
The guideline does not recommend indwelling catheters for management of overactive bladder except as a last resort in some patients, and says that augmentation cystoplasty or urinary diversion may be considered in rare cases of severe, refractory, complicated overactive bladder.
Dr. Cole has been a speaker for Allergan, which markets Botox.
On Twitter @sherryboschert
Updated recommendations for the diagnosis and treatment of non-neurogenic overactive bladder incorporate two new treatments approved since 2012 – oral mirabegron and intradetrusor injection of onabotulinumtoxinA.
The 2014 update from the American Urological Association and the Society of Urodynamics, Female Pelvic Medicine and Urogenital Reconstruction (AUA/SUFU) also recognizes the growing number of therapeutic options by stressing the need to take a methodical approach and give an adequate trial of individual treatments before combining them.
"As we have more and more options on the market, you don’t want to stack one on top of another," Dr. Emily Cole said in an interview.
"All of these methodologies have some side effects. What you don’t want to do is have added side effects if something is not working," said Dr. Cole, a urologist specializing in female pelvic medicine and reconstructive surgery in a group practice in San Diego.
Compared with the 2012 AUA/SUFU recommendations, the 2014 guideline on "Diagnosis and Treatment of Overactive Bladder (Non-Neurogenic) in Adults" adds the beta3-adrenoceptor agonist mirabegron (Myrbetriq, Astellas Pharma) as a first- or second-line treatment option for some patients. OnabotulinumtoxinA (Botox, Allergan) has been upgraded to a "Standard Option" among third-line treatments instead of a nonapproved, off-label therapy.
The Food and Drug Administration approved mirabegron for adults with overactive bladder in June 2012. The FDA approved onabotulinumtoxinA (Botox, Allergan) in January 2013 for adults with overactive bladder who can’t use or don’t respond adequately to anticholinergics.
Clinicians always should start with first- and second-line therapies to reduce symptoms of overactive bladder, Dr. Cole said. By the time patients come to her, they typically have failed those options, but she offers them hope with third-line treatments.
"In most cases, we can really help patients. We may not make you completely dry," she said, but "we have enough tools now that we can make marked improvements."
That’s a big change in recent years, she added. "When I started out, we had two medications that had horrible side effects," she said. Dr. Cole was not involved in creation of the AUA/SUFU guideline.
The AUA/SUFU based the 2012 guideline on 151 articles on the treatment of overactive bladder and reviewed 72 more articles on treatment for the 2014 update.
The recommendations on diagnosis have not changed since 2012 and are based on expert opinion and clinical principles due to insufficient evidence for stronger recommendations.
First-line treatments are behavioral therapies such as bladder training and bladder control strategies or pelvic floor muscle training, which may be combined with pharmacologic management, the guideline states.
Second-line treatments include oral antimuscarinic drugs or mirabegron, preferably in an extended-release formulation if available to reduce the likelihood of dry mouth from immediate-release formulations. A transdermal patch that delivers the antimuscarinic drug oxybutynin became available to adult women over the counter (without a prescription) in 2013.
If a first antimuscarinic medication doesn’t work or causes unacceptable side effects, modify the dose or offer a different antimuscarinic or beta3-adrenoceptor agonist, the guideline states. If an antimuscarinic is effective but causes constipation or dry mouth, don’t give up on that drug class without trying to manage side effects through bowel management, fluid management, modifying the dose, or trying another antimuscarinic.
Be extremely cautious in using antimuscarinics in patients with impaired gastric emptying or a history of urinary retention, and don’t use antimuscarinics in patients with narrow-angle glaucoma without approval from a treating ophthalmologist. If a patient is on other medications with anticholinergic properties, be cautious about prescribing antimuscarinics.
Patients who fail first- and second-line therapies should be evaluated by a specialist if they still desire treatment, according to the guideline.
Among third-line treatment options, sacral neuromodulation may be offered to patients with severe refractory overactive bladder or patients who are not candidates for second-line treatments and who are willing to undergo a surgical procedure. Peripheral tibial nerve stimulation is another option in carefully selected patients.
Intradetrusor injections of Botox may be appropriate for carefully selected and "thoroughly counseled" patients who failed first- and second-line treatments if they are able and willing to return for frequent postvoid residual evaluations and to perform self-catheterization if necessary.
The guideline does not recommend indwelling catheters for management of overactive bladder except as a last resort in some patients, and says that augmentation cystoplasty or urinary diversion may be considered in rare cases of severe, refractory, complicated overactive bladder.
Dr. Cole has been a speaker for Allergan, which markets Botox.
On Twitter @sherryboschert

The Right Choice? Surgeons, patients, and ethical analysis
In July 2011, I first had the opportunity to write a column on ethics for ACS Surgery News. That article, "Responding to Family/Patient Requests," explored possible responses to the family members’ requests to "do everything" for a critically ill patient. The article was published under the tag line, "The Right Choice."
Since that first article, I have had the opportunity to write 12 additional columns on different ethical issues in the care of surgical patients. The issues have ranged from considerations of informed consent and disclosure of information to the challenges of innovative techniques and scarce resources. Each of these columns has continued to be under the heading "The Right Choice." As I considered what to write about this month, I reviewed my previous articles and I was struck by a worrisome possibility. In the challenging surgical cases presented, is the suggestion that I know "the right choice" actually wrong?
Medical ethics has increasingly become an important topic in medical schools and the clinical care of patients since the late 1970s. Although the medical and surgical care of patients has always had an ethical dimension, it has only been in the last several decades that the ethical issues have been separately identified and analyzed. As the acceptance of surgeons making decisions about what is "best" for their patients has shifted to increasing respect for the patient as an autonomous decision maker, we have seen the importance of understanding patient preferences increase.
At the same time, as medical and surgical care has improved, we now have more options to prolong patients’ lives even when the quality of those lives may be dramatically diminished. These factors have led to the increased consideration of ethical dimensions of decisions that we must help our patients make.
Although many authors have suggested ways to proceed with the ethical analysis of cases, few methods have been as widely adopted as that suggested by Albert Jonsen, Mark Siegler, and William Winslade in their influential book, "Clinical Ethics: A Practical Approach to Ethical Decisions in Clinical Medicine," 7th edition (New York: Lange Clinical Science/McGraw Hill, 2010). These authors suggest that the analysis of a case should include attention to four sets of issues: medical indications, patient preferences, quality of life, and contextual features. By analyzing these issues for a difficult case, we are often able to see where the underlying principles of beneficence, nonmaleficence, respect for patient autonomy, and justice may be at odds.
For example, in the case that I discussed in the July 2011 issue, about the 80-year-old woman with extensive gangrenous bowel, a central concern was whether the surgical decision making should be altered by the family member’s request to "do everything you can." In this case, I suggested that requests from surrogate decision makers must be tempered by the realities of the case and the importance of not harming a patient by providing burdensome care that has minimal chance of success.
As I reread that prior article, I am struck by the fact that I suggest a way of thinking about the case and a series of considerations that are important. However, I am not comfortable saying that I have identified the single correct course of action. I believe that although ethical analysis of cases has tremendous value for doctors and patients, there is rarely one right answer. There may be several wrong answers, and there may be several acceptable answers, but there is rarely a single right choice. My goal in these columns that I wrote in the past and hope to write in the future is to raise awareness of the ethical dimensions of the case, to suggest important considerations, and perhaps even to identify some of the ethical principles that may be relevant. But I do not believe that I can identify "the right choice
In the very first edition of "Clinical Ethics" published in 1982, Jonsen, Siegler, and Winslade wrote in the preface, "We do not merely discuss or analyze the ethical problems; we offer counsel about decisions. Lest this be thought presumptuous, we do not consider our counsel the single and final answer. We offer it in the tradition of medical consultation: The consultant may bring to the practitioner’s view of the case not only broader information but another perspective."
I have tried to provide this type of information and perspective in the ACS Surgery News ethics columns and in view of the difficulty of determining the single right answer to many challenging cases, future columns will be found under the new heading, "The Right Choice?" By adding the critical question mark, I hope that readers will be reminded of the need for ongoing discussion of the challenging ethical questions that arise in the care of surgical patients.
Dr. Angelos is the Linda Kohler Anderson Professor of Surgery and Surgical Ethics; chief, endocrine surgery; and associate director, MacLean Center for Clinical Medical Ethics, at the University of Chicago.

Surgery in an aging population, part 2
Because of the increased risks associated with surgery in an elderly population, a thorough preoperative assessment should include identification of medical problems and important risk factors for increased perioperative morbidity and mortality, a thorough evaluation of the patient’s activities of daily living, and a mini–mental status exam (Primary Care 1989;16:361-76).

The severity of a patient’s illness is a better predictor of perioperative morbidity than age, and therefore age alone should not determine whether gynecologists operate (Clin. Podiatr. Med. Surg. 2003;20:607-26). In elderly patients, we should consider preoperative consultation with the patient’s primary care physician, subspecialists, geriatricians, physical and occupational therapists, and anesthesiologist to evaluate comorbidities and optimize preoperative status. Posthospitalization discharge planning also should start preoperatively if there is a concern that a patient may not be able to be discharged home.
Gynecologists also should consider the indications for surgery and a patient’s life expectancy. Prior to surgery, surgeons should believe that each patient has an expected life span such that they will benefit from the surgery. We should perform the most appropriate and least aggressive surgery and take into consideration the duration of the procedure. Surgeons also should consider functional outcomes, including quality of life, and the goal should be a postoperative return to normal function (Mt. Sinai J. Med. 2012;79:95-106).
Other factors to consider once a gynecologist has decided to operate on an elderly patient include surgical approach, mode of anesthesia, and the need for operative staging. An abdominal surgery is a risk factor for perioperative morbidity. Therefore, a laparoscopic or vaginal approach should be considered in elderly patients. These surgeries may promote more rapid return to functional status, thereby decreasing the risk of postoperative respiratory complications, length of hospital stay, and risk of delirium and postoperative cognitive decline (Curr. Opin. Obstet. Gynecol. 1997;9:300-305).Unfortunately, changes in cardiovascular physiology during abdominal insufflation and desufflation may lead to decreased peripheral perfusion and increased cardiac output. Additionally, a laparoscopic approach can lead to increases in operating time. Therefore, a gynecologist must carefully consider surgical approach.

Another important aspect to consider prior to surgery is whether the procedure can be performed under neuraxial anesthesia. An epidural could be left in place for postoperative pain control and eliminate the need for general anesthesia and postoperative pain control with narcotics. Gynecologic oncologists specifically must consider whether extending the procedure to include surgical staging is necessary and appropriate for each individual patient. A specific example concerns lymph node dissection in endometrial cancer. A recent study has shown that 5-year survival does not differ in women older than 80 years with low-grade endometrial cancer if lymph node dissection is omitted (Gynecol. Oncol. 2012;126:12-15).This may be important in limiting total anesthetic time to under 3 hours in an attempt to decrease perioperative morbidity and mortality.
Specific operating room considerations include patient position, coverage, and orientation. Elderly patients have fragile skin with decreased elasticity and decreased muscle mass. Therefore, they are more sensitive than their younger counterparts to bruising, skin tears, pressure ulcers, and hypothermia. Extra care must be taken during patient positioning to pad joints, avoid tape on fragile skin, and keep her covered with blankets or a warming device. Elderly patients also are at increased risk for venous thromboembolism; therefore sequential compression devices and, potentially, chemoprophylaxis should be used intraoperatively. On emergence from anesthesia, elderly patients should be given their glasses, and operating room staff should speak clearly and loudly to orient the patient to their situation.
Postoperatively, providers and family should continue to orient and reorient elderly patients to person, place, and situation. Good pain control is important, especially with larger abdominal incisions, to decrease respiratory complications and promote early ambulation. NSAIDs or neuraxial anesthesia should be considered to decrease the use of potentially sedating opioids. But avoid NSAIDs in patients with dehydration, congestive heart failure, and preexisting renal disease. It also is important to get patients back to their activities of daily living as soon as possible; therefore inpatient physical and occupational therapy should be considered on the day following surgery. Prior to discharge, care to avoid too many additional medications and attention to potential medication interactions are critical.
Elderly women are at risk for increased postoperative morbidity and mortality; however, with appropriate perioperative planning, these risks can be minimized. Each patient and her situation should be carefully evaluated, and a multidisciplinary team assembled to assist with taking the steps necessary to promote a smooth transition to the outpatient setting and decrease complications.
Dr. Hacker is a rising fourth-year resident in the department of obstetrics and gynecology at the University of North Carolina at Chapel Hill. Dr. Clarke-Pearson is the chair and the Robert A. Ross Distinguished Professor of Obstetrics and Gynecology, and a professor in the division of gynecologic oncology at the university. E-mail them at [email protected].
Because of the increased risks associated with surgery in an elderly population, a thorough preoperative assessment should include identification of medical problems and important risk factors for increased perioperative morbidity and mortality, a thorough evaluation of the patient’s activities of daily living, and a mini–mental status exam (Primary Care 1989;16:361-76).
The severity of a patient’s illness is a better predictor of perioperative morbidity than age, and therefore age alone should not determine whether gynecologists operate (Clin. Podiatr. Med. Surg. 2003;20:607-26). In elderly patients, we should consider preoperative consultation with the patient’s primary care physician, subspecialists, geriatricians, physical and occupational therapists, and anesthesiologist to evaluate comorbidities and optimize preoperative status. Posthospitalization discharge planning also should start preoperatively if there is a concern that a patient may not be able to be discharged home.
Gynecologists also should consider the indications for surgery and a patient’s life expectancy. Prior to surgery, surgeons should believe that each patient has an expected life span such that they will benefit from the surgery. We should perform the most appropriate and least aggressive surgery and take into consideration the duration of the procedure. Surgeons also should consider functional outcomes, including quality of life, and the goal should be a postoperative return to normal function (Mt. Sinai J. Med. 2012;79:95-106).
Other factors to consider once a gynecologist has decided to operate on an elderly patient include surgical approach, mode of anesthesia, and the need for operative staging. An abdominal surgery is a risk factor for perioperative morbidity. Therefore, a laparoscopic or vaginal approach should be considered in elderly patients. These surgeries may promote more rapid return to functional status, thereby decreasing the risk of postoperative respiratory complications, length of hospital stay, and risk of delirium and postoperative cognitive decline (Curr. Opin. Obstet. Gynecol. 1997;9:300-305).Unfortunately, changes in cardiovascular physiology during abdominal insufflation and desufflation may lead to decreased peripheral perfusion and increased cardiac output. Additionally, a laparoscopic approach can lead to increases in operating time. Therefore, a gynecologist must carefully consider surgical approach.
Another important aspect to consider prior to surgery is whether the procedure can be performed under neuraxial anesthesia. An epidural could be left in place for postoperative pain control and eliminate the need for general anesthesia and postoperative pain control with narcotics. Gynecologic oncologists specifically must consider whether extending the procedure to include surgical staging is necessary and appropriate for each individual patient. A specific example concerns lymph node dissection in endometrial cancer. A recent study has shown that 5-year survival does not differ in women older than 80 years with low-grade endometrial cancer if lymph node dissection is omitted (Gynecol. Oncol. 2012;126:12-15).This may be important in limiting total anesthetic time to under 3 hours in an attempt to decrease perioperative morbidity and mortality.
Specific operating room considerations include patient position, coverage, and orientation. Elderly patients have fragile skin with decreased elasticity and decreased muscle mass. Therefore, they are more sensitive than their younger counterparts to bruising, skin tears, pressure ulcers, and hypothermia. Extra care must be taken during patient positioning to pad joints, avoid tape on fragile skin, and keep her covered with blankets or a warming device. Elderly patients also are at increased risk for venous thromboembolism; therefore sequential compression devices and, potentially, chemoprophylaxis should be used intraoperatively. On emergence from anesthesia, elderly patients should be given their glasses, and operating room staff should speak clearly and loudly to orient the patient to their situation.
Postoperatively, providers and family should continue to orient and reorient elderly patients to person, place, and situation. Good pain control is important, especially with larger abdominal incisions, to decrease respiratory complications and promote early ambulation. NSAIDs or neuraxial anesthesia should be considered to decrease the use of potentially sedating opioids. But avoid NSAIDs in patients with dehydration, congestive heart failure, and preexisting renal disease. It also is important to get patients back to their activities of daily living as soon as possible; therefore inpatient physical and occupational therapy should be considered on the day following surgery. Prior to discharge, care to avoid too many additional medications and attention to potential medication interactions are critical.
Elderly women are at risk for increased postoperative morbidity and mortality; however, with appropriate perioperative planning, these risks can be minimized. Each patient and her situation should be carefully evaluated, and a multidisciplinary team assembled to assist with taking the steps necessary to promote a smooth transition to the outpatient setting and decrease complications.
Dr. Hacker is a rising fourth-year resident in the department of obstetrics and gynecology at the University of North Carolina at Chapel Hill. Dr. Clarke-Pearson is the chair and the Robert A. Ross Distinguished Professor of Obstetrics and Gynecology, and a professor in the division of gynecologic oncology at the university. E-mail them at [email protected].

Signaling Pathways and Novel Inhibitors in Chronic Lymphocytic Leukemia
Chronic lymphocytic leukemia (CLL) is a common hematological malignancy in the U.S. with 15,000 new patients diagnosed each year.1 This leukemia is frequently diagnosed in veterans since it is more commonly seen in an elderly male population. The disease is characterized by a slow accumulation of mature B cells that are functionally incompetent and resist apoptosis. CLL has an indolent clinical course, but about 60% to 70% of patients require treatment. The disease also runs a variable course, and a number of genetic abnormalities and prognostic markers have been defined to subclassify CLL patients and prognosticate.2-4 This article reviews important CLL signaling pathways and novel therapeutic agents in this leukemia.
Signaling Pathways
B-Cell Receptor Signaling
The B-cell receptor (BCR) signaling is the major signaling pathway in CLL, because it defines clinical, biologic, and prognostic characteristics of the disease.5 The BCR is composed of a surface transmembrane immunoglobulin that binds the antigen with CD79 alpha and beta chains. The activation of BCR results in the formation of a signaling complex or signalosome, which includes Lyn, Syk, BTK, and ZAP-70, among other components that assemble with other adaptor proteins (Figure). This assembly of proteins occurs on the cytoplasmic tails of immunoglobulin chains on regions called immunoreceptor tyrosine-based motifs (ITAMs).
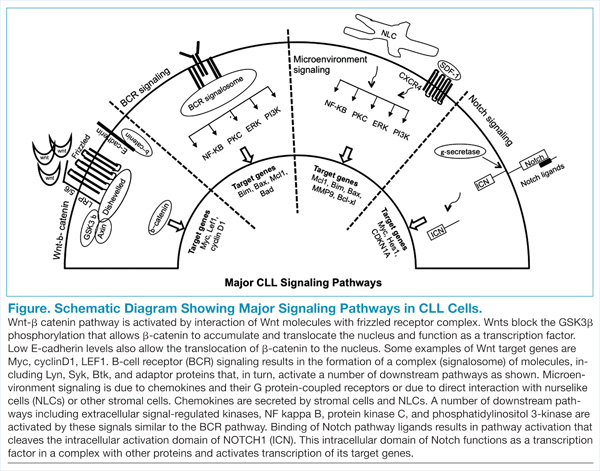
With the assembly of this signaling complex, BCR stimulates a number of downstream pathways, such as phosphatidylinositol 3-kinase (PI3K), protein kinase B (Akt), protein kinase C, nuclear factor-κB (NFκB), and extracellular signal-regulated kinases (ERKs) (Figure). Activation of these pathways results in cell proliferation, resistance to apoptosis, increased cell motility and migration. Recent studies have identified additional novel components of this signaling complex, including a guanine nucleotide exchange factor (GEF) RASGRF1. This GEF is activated by BCR signaling and, in turn, stimulates the ERK pathway by increasing the production of active GTP-bound Ras.6
The ability of BCR to activate a number of downstream signaling pathways makes it a highly relevant and investigated pathway in this leukemia. Inhibitors have been developed and/or identified against a number of signalosome components to block the BCR signaling.7 Syk and Lyn are Src kinases, and their phosphorylation is one of the initial events of BCR signaling. Syk is overexpressed in CLL specimens, and Syk inhibitors (R406 and P505-15, also known as PRT062607) have shown activity in CLL.8,9 Dasatinib is a Src inhibitor that also shows activity in CLL specimens and is being studied in combination with chemotherapy drugs in refractory CLL patients.10
BTK, a component of the BCR signalosome, is required for BCR function, and loss of its function is seen in X-linked agammaglobulinemia. PCI-32765 (ibrutinib) is an oral BTK inhibitor that irreversibly inactivates this kinase and has been approved for clinical use in CLL patients.11,12 Another signaling pathway activated by BCR is the PI3K, and a promising inhibitor (CAL-101) blocks its activity in CLL specimens.13 Investigative work has identified that the delta isoform of PI3K p110 is highly expressed in B cells and lymphocytes.14 This is a catalytic subunit of a class I PI3K with a role in BCR signaling. A selective inhibitor GS-1101 (CAL-101) is able to block PI3K signaling in CLL specimens and inhibits Akt phosphorylation and other downstream effectors along with induction of apoptosis.15 The clinical data with BTK and PI3K inhibitors will be discussed later in this review.
CLL and the Microenvironment
Interactions between CLL cells and the microenvironment allow CLL cells to thrive in certain niche environments.16,17 Interaction mainly occurs via bone marrow stromal cells and nurselike cells (NLCs), which evolve from monocytes (Figure). These interactions can be divided into 2 groups. First, CLL cell growth is supported by a number of chemokine receptor-ligand interactions. CXCR4 is the receptor for CXCL12 (SDF-1) that stimulates chemotaxis and tissue homing. Another chemokine is CXCL13, which acts via its receptor CXCR5 and is involved in chemotaxis and activation of other kinases. Second, NLCs also support CLL cells by expressing TNF family members BAFF and APRIL, which interact with their receptors and activate the NFκB pathway.
Leukemic cells also express VLA-4 integrins, which further their support adhesion to the stromal cells and predict for an aggressive phenotype. Specific inhibitors that block the stimulation by chemokines and cytokines are not yet available; however, one can envision that this class of inhibitors will decrease the chemoresistance of leukemic cells and will be used in conjunction with other chemotherapy agents. Interestingly, inhibitors that block BCR-mediated signaling (BTK and PI3K inhibitors) also inhibit signaling via the microenvironment and chemokines.
Wnt-β-catenin Pathway
Wnt signaling affects developmental pathways, and its aberrant activation has major oncogenic effects as well. This pathway is activated in CLL as these leukemic cells express high levels of Wnt and frizzled along with epigenetic downregulation of Wnt pathway antagonist genes, including secreted frizzled-related protein (SFRP) family members and WIF1 (Figure).18-20 The binding of Wnts to their cognate receptors results in inhibition of GSK3β phosphorylation and stabilization of β-catenin, which then translocates to the nucleus and interacts with lymphoid-enhancing (LEF) and T-cell transcription factors to activate transcription of Wnt-target genes. Lack of E-cadherin expression in CLL cells also results in an increase in translocation of β-catenin and upregulation of the Wnt pathway.20
Wnt-target genes include Myc, LEF, cyclinD1, COX-2, and MMP. Gene expression profiling from our laboratory and other groups have identified the overexpression of these wnt-target genes and support this pathway activation in CLL cells.20 This is a promising signalling pathway and an active area of research for developing inhibitors that will have a growth inhibitory effect on CLL leukemic cells. GSK3b inhibitors and other drugs that re-express epigenetically silenced Wnt antagonist genes have been shown to inhibit this pathway activity in CLL cells in vitro.
Notch Pathway Activation
High-throughput exome sequencing has identified recurring mutations in a number of genes, including NOTCH1.21 Analysis of additional CLL patients confirmed activating NOTCH1 mutations in 10% to 15% of CLL patients and were also associated with poor outcome.22 This pathway is activated by ligands such as Jagged and Delta-like, which interact with the Notch receptor, which is then cleaved by γ-secretases. The cleaved intracellular domain of the NOTCH1 receptor in combination with other factors activates transcription of target genes, including Myc and HES1 (Figure). Besides the mutations that generate a truncated protein or may stabilize the pathway, the Notch pathway is also constitutively active in CLL specimens.23 Notch stimulation increases activity of prosurvival pathways and genes such as NFκB that resist apoptotic signals. The pathway can be inhibited by γ-secretase inhibitors (GSIs), which reduce the levels of cleaved NOTCH1 protein and downregulated Notch target genes. This pathway is also able to modulate the microenvironment stimuli as the GSIs inhibit responses to chemokines such as CXCL12 and inhibit migration and invasion.24
Newer Theraputic Agents
Work on signaling mechanisms paid dividends in CLL with the recent development of 2 inhibitors. Ibrutinib (BTK inhibitor) and idelalisib (PI3K inhibitor) are being studied in clinical trials, and both drugs block the BCR and microenvironment signaling pathways, thereby inhibiting the growth of CLL cells.
BTK Inhibitor: Ibrutinib
The activity of BTK is critical for a number of CLL signaling pathways, and it is a component of the initial signaling complex or signalosome that is formed with BCR signaling. Studies have shown that inhibiting this kinase blocks a number of pathways, including ERK, NFκB, and others. The drug ibrutinib blocks this kinase by forming a covalent bond and inhibiting its enzyme activity. This orally bioavailable drug showed activity in phase 1 trials in different B-cell malignancies.25 In a phase 2 study, high-risk CLL patients were given 2 different doses of this inhibitor, and the overall response rate was 71% with an overall survival at 26 months of 83%.11 Responses were seen in all patients irrespective of clinical and genetic risk factors. Based on these findings, the drug was approved for clinical use in patients with relapsed or refractory disease. Recently, there are data on the use of this drug as frontline therapy in elderly patients, and the drug was well tolerated.26 There are additional ongoing trials to compare this drug with other agents, including chlorambucil (in chemotherapy-naïve patients) and ofatumumab (in relapsed or refractory patients).
PI3 Kinase p110 Delta Inhibitor: Idelalisib
The crucial finding for the development of this inhibitor was the over-expression of the delta isoform of PI3K p110 in B-cell malignancies.14 The drug CAL-101 selectively inhibits this constitutively active isoform and induces apoptosis in a number of B-cell malignancies.15,27 In the phase 1 trial, this inhibitor was evaluated in relapsed/refractory patients at multiple dose levels.28 There was inhibition of PI3K signaling with an overall response rate of 72%, and a partial response rate of 39% was observed in CLL patients. This was followed by a randomized, placebo-controlled phase 3 study in which patients with myelosuppression, decreased renal function, or other illnesses were treated with either rituximab alone or with rituximab and idelalisib.29
At the time of reporting, the median progression-free survival (PFS) was 5.5 months in the placebo arm and was not reached in the idelalisib arm. Overall response rates were higher in the idelalisib group (81% vs 13%) with similar toxicity profiles in the 2 groups. This drug is now being extensively studied in combination with bendamustine and other anti-CD20 antibodies in clinical trials.
A unique toxicity observed with both these inhibitors is the initial lymphocytosis. In the case of ibrutinib, this was seen in a majority of patients (77%) and at the same time there was a response in the nodal disease, implying a redistribution of leukemic cells from the tissues to the peripheral blood.30
A potential explanation is that these drugs inhibit signaling via chemokines and other components of the microenvironment and by inhibiting the homing signals, allows leukemic cells to move out of their niche areas. This was analyzed in a recent study that compared clinical and biochemical parameters of patients who had a complete or partial response with ibrutinib compared with a “partial response except for lymphocytosis.”30 Patients with “partial response except for lymphocytosis” were found to have favorable prognostic factors, and the persisting leukemic cells were not clonally different from the original cells. The progression free survival of patients with “partial response except for lymphocytosis” was also similar to the subgroup with no prolonged lymphocytosis.
Discussion
Several therapeutic agents with novel mechanisms of action are effective in killing the CLL leukemic cells, and a number of targeted agents are currently in the pipeline. The next challenge for treating CLL will be the proper integration of these novel targeted agents with the traditional chemotherapy and chemoimmunotherapy approaches. Let us consider CLL patients in different clinical settings. First, a patient aged 60 years who is otherwise healthy will be treated with possibly all the available chemotherapy and chemoimmunotherapy options, as well as the newer targeted agents. In this clinical setting sequencing of therapy is not a major concern. On the other hand, a patient aged 70 years who is already refractory to multiple lines of therapy is a good candidate for these newer drugs.
The more controversial use of these targeted agents will be in an older patient with some comorbidities and newly diagnosed CLL. In this clinical setting, should one go with traditional chemotherapy/chemoimmunotherapy approaches or consider newer targeted agents? These issues are now being addressed in clinical trials, and with acceptable toxicity profiles these newer drugs will move to the frontline setting.
Author disclosures
The author reports no actual or potential conflicts of interest with regard to this article.
Disclaimer
The opinions expressed herein are those of the author and do not necessarily reflect an endorsement by or opinion of Federal Practitioner, Frontline Medical Communications, the U.S. Air Force, the U.S. Government, or any of its agencies. This article may discuss unlabeled or investigational use of certain drugs. Please review complete prescribing information for specific drug combinations–including indications, contraindications, warnings, and adverse effects–before administering pharmacologic therapy to patients.
1. Siegel R, Ma J, Zou Z, Jemal A. Cancer statistics, 2014. CA Cancer J Clin. 2014;64(1):9-29.
2. Döhner H, Stilgenbauer S, Döhner K, Bentz M, Lichter P. Chromosome aberrations in B-cell chronic lymphocytic leukemia: reassessment based on molecular cytogenetic analysis. J Mol Med. 1999;77(2):266-281.
3. Hamblin TJ, Davis Z, Gardiner A, Oscier DG, Stevenson FK. Unmutated Ig V(H) genes are associated with a more aggressive form of chronic lymphocytic leukemia. Blood. 1999;94(6):1848-1854.
4. Chen L, Widhopf G, Huynh L, et al. Expression of ZAP-70 is associated with increased B-cell receptor signaling in chronic lymphocytic leukemia. Blood. 2002;100(13):4609-4614.
5. Wickremasinghe RG, Prentice AG, Steele AJ. Aberrantly activated anti-apoptotic signalling mechanisms in chronic lymphocytic leukaemia cells: Clues to the identification of novel therapeutic targets. Br J Haematol. 2011;153(5):545-556.
6. Liao W, Jordaan G, Coriaty N, Sharma S. Amplification of B cell receptor-Erk signaling by Rasgrf-1 overexpression in chronic lymphocytic leukemia [published online ahead of print April 2, 2014]. Leuk Lymphoma. doi: 10.3109/10428194.2014898759.
7. Burger JA. Inhibiting B-cell receptor signaling pathways in chronic lymphocytic leukemia. Curr Hematol Malig Rep. 2012;7(1):26-33.
8. Buchner M, Fuchs S, Prinz G, et al. Spleen tyrosine kinase is overexpressed and represents a potential therapeutic target in chronic lymphocytic leukemia. Cancer Res. 2009;69(13):5424-5432.
9. Spurgeon SE, Coffey G, Fletcher LB, et al. The selective SYK inhibitor P505-15 (PRT062607) inhibits B cell signaling and function in vitro and in vivo and augments the activity of fludarabine in chronic lymphocytic leukemia. J Pharmacol Exp Ther. 2013;344(2):378-387.
10. Veldurthy A, Patz M, Hagist S, et al. The kinase inhibitor dasatinib induces apoptosis in chronic lymphocytic leukemia cells in vitro with preference for a subgroup of patients with unmutated IgVH genes. Blood. 2008;112(4):1443-1452.
11. Byrd JC, Furman RR, Coutre SE, et al. Targeting BTK with ibrutinib in relapsed chronic lymphocytic leukemia [published correction appears in N Engl J Med. 2014;370(8):786]. N Engl J Med. 2013;369(1):32-42.
12. Cheng S, Ma J, Guo A, et al. BTK inhibition targets in vivo CLL proliferation through its effects on B-cell receptor signaling activity. Leukemia. 2014;28(3):649-657.
13. Lannutti BJ, Meadows SA, Herman SE, et al. CAL-101, a p110delta selective phosphatidylinositol-3-kinase inhibitor for the treatment of B-cell malignancies, inhibits PI3K signaling and cellular viability. Blood. 2011;117(2):591-594.
14. Chantry D, Vojtek A, Kashishian A, et al. p110delta, a novel phosphatidylinositol 3-kinase catalytic subunit that associates with p85 and is expressed predominantly in leukocytes. J Biol Chem. 1997;272(31):19236-19241.
15. Hoellenriegel J, Meadows SA, Sivina M, et al. The phosphoinositide 3’-kinase delta inhibitor, CAL-101, inhibits B-cell receptor signaling and chemokine networks in chronic lymphocytic leukemia. Blood. 2011;118(13):3603-3612.
16. Burger JA, Ghia P, Rosenwald A, Caligaris-Cappio F. The microenvironment in mature B-cell malignancies: A target for new treatment strategies. Blood. 2009;114(16):3367-3375.
17. ten Hacken E, Burger JA. Molecular pathways: targeting the microenvironment in chronic lymphocytic leukemia—focus on the B-cell receptor. Clin Cancer Res. 2014;20(3):548-556.
18. Gandhirajan RK, Poll-Wolbeck SJ, Gehrke I, Kreuzer KA. Wnt/b-catenin/LEF-1 signaling in chronic lymphocytic leukemia (CLL): a target for current and potential therapeutic options. Curr Cancer Drug Targets. 2010;10(7):716-727.
19. Gutierrez A, Jr, Tschumper RC, Wu X, et al. LEF-1 is a prosurvival factor in chronic lymphocytic leukemia and is expressed in the preleukemic state of monoclonal B-cell lymphocytosis. Blood. 2010;116(16):2975-2983.
20. Jordaan G, Liao W, Sharma S. E-cadherin gene re-expression in chronic lymphocytic leukemia cells by HDAC inhibitors. BMC Cancer. 2013;13:88.
21. Puente XS, Pinyol M, Quesada V, et al. Whole-genome sequencing identifies recurrent mutations in chronic lymphocytic leukaemia. Nature. 2011;475(7354):101-105.
22. Fabbri G, Rasi S, Rossi D, et al. Analysis of the chronic lymphocytic leukemia coding genome: role of NOTCH1 mutational activation. J Exp Med. 2011;208(7):1389-1401.
23. Rosati E, Sabatini R, Rampino G, et al. Constitutively activated Notch signaling is involved in survival and apoptosis resistance of B-CLL cells. Blood. 2009;113(4):856-865.
24. López-Guerra M, Xargay-Torrent S, Rosich L, et al. The g-secretase inhibitor PF-03084014 combined with fludarabine antagonizes migration, invasion and angiogenesis in NOTCH1-mutated CLL cells [published online ahead of print April 30, 2014]. Leukemia. doi: 10.1038/leu.2014.143.
25. Advani RH, Buggy JJ, Sharman JP, et al. Bruton tyrosine kinase inhibitor ibrutinib (PCI-32765) has significant activity in patients with relapsed/refractory B-cell malignancies. J Clin Oncol. 2013;31(1):88-94.
26. O’Brien S, Furman RR, Coutre SE, et al. Ibrutinib as initial therapy for elderly patients with chronic lymphocytic leukaemia or small lymphocytic lymphoma: An open-label, multicentre, phase 1b/2 trial. Lancet Oncol. 2014;15(1):48-58.
27. Brown JR, Byrd JC, Coutre SE, et al. Idelalisib, an inhibitor of phosphatidylinositol 3-kinase p110∂, for relapsed/refractory chronic lymphocytic leukemia. Blood. 2014;123(22):3390-3397.
28. Brown JR, Furman RR, Flinn I, et al. Final results of a phase I study of idelalisib (GS-1101) a selective inhibitor of PI3K∂, in patients with relapsed or refractory CLL. J Clin Oncol. 2013;31:Absract 7003.
29. Furman RR, Sharman JP, Coutre SE, et al. Idelalisib and rituximab in relapsed chronic lymphocytic leukemia. N Engl J Med. 2014;370(11):997-1007.
30. Woyach JA, Smucker K, Smith LL, et al. Prolonged lymphocytosis during ibrutinib therapy is associated with distinct molecular characteristics and does not indicate a suboptimal response to therapy. Blood. 2013;123(12):1810-1817.
Chronic lymphocytic leukemia (CLL) is a common hematological malignancy in the U.S. with 15,000 new patients diagnosed each year.1 This leukemia is frequently diagnosed in veterans since it is more commonly seen in an elderly male population. The disease is characterized by a slow accumulation of mature B cells that are functionally incompetent and resist apoptosis. CLL has an indolent clinical course, but about 60% to 70% of patients require treatment. The disease also runs a variable course, and a number of genetic abnormalities and prognostic markers have been defined to subclassify CLL patients and prognosticate.2-4 This article reviews important CLL signaling pathways and novel therapeutic agents in this leukemia.
Signaling Pathways
B-Cell Receptor Signaling
The B-cell receptor (BCR) signaling is the major signaling pathway in CLL, because it defines clinical, biologic, and prognostic characteristics of the disease.5 The BCR is composed of a surface transmembrane immunoglobulin that binds the antigen with CD79 alpha and beta chains. The activation of BCR results in the formation of a signaling complex or signalosome, which includes Lyn, Syk, BTK, and ZAP-70, among other components that assemble with other adaptor proteins (Figure). This assembly of proteins occurs on the cytoplasmic tails of immunoglobulin chains on regions called immunoreceptor tyrosine-based motifs (ITAMs).
With the assembly of this signaling complex, BCR stimulates a number of downstream pathways, such as phosphatidylinositol 3-kinase (PI3K), protein kinase B (Akt), protein kinase C, nuclear factor-κB (NFκB), and extracellular signal-regulated kinases (ERKs) (Figure). Activation of these pathways results in cell proliferation, resistance to apoptosis, increased cell motility and migration. Recent studies have identified additional novel components of this signaling complex, including a guanine nucleotide exchange factor (GEF) RASGRF1. This GEF is activated by BCR signaling and, in turn, stimulates the ERK pathway by increasing the production of active GTP-bound Ras.6
The ability of BCR to activate a number of downstream signaling pathways makes it a highly relevant and investigated pathway in this leukemia. Inhibitors have been developed and/or identified against a number of signalosome components to block the BCR signaling.7 Syk and Lyn are Src kinases, and their phosphorylation is one of the initial events of BCR signaling. Syk is overexpressed in CLL specimens, and Syk inhibitors (R406 and P505-15, also known as PRT062607) have shown activity in CLL.8,9 Dasatinib is a Src inhibitor that also shows activity in CLL specimens and is being studied in combination with chemotherapy drugs in refractory CLL patients.10
BTK, a component of the BCR signalosome, is required for BCR function, and loss of its function is seen in X-linked agammaglobulinemia. PCI-32765 (ibrutinib) is an oral BTK inhibitor that irreversibly inactivates this kinase and has been approved for clinical use in CLL patients.11,12 Another signaling pathway activated by BCR is the PI3K, and a promising inhibitor (CAL-101) blocks its activity in CLL specimens.13 Investigative work has identified that the delta isoform of PI3K p110 is highly expressed in B cells and lymphocytes.14 This is a catalytic subunit of a class I PI3K with a role in BCR signaling. A selective inhibitor GS-1101 (CAL-101) is able to block PI3K signaling in CLL specimens and inhibits Akt phosphorylation and other downstream effectors along with induction of apoptosis.15 The clinical data with BTK and PI3K inhibitors will be discussed later in this review.
CLL and the Microenvironment
Interactions between CLL cells and the microenvironment allow CLL cells to thrive in certain niche environments.16,17 Interaction mainly occurs via bone marrow stromal cells and nurselike cells (NLCs), which evolve from monocytes (Figure). These interactions can be divided into 2 groups. First, CLL cell growth is supported by a number of chemokine receptor-ligand interactions. CXCR4 is the receptor for CXCL12 (SDF-1) that stimulates chemotaxis and tissue homing. Another chemokine is CXCL13, which acts via its receptor CXCR5 and is involved in chemotaxis and activation of other kinases. Second, NLCs also support CLL cells by expressing TNF family members BAFF and APRIL, which interact with their receptors and activate the NFκB pathway.
Leukemic cells also express VLA-4 integrins, which further their support adhesion to the stromal cells and predict for an aggressive phenotype. Specific inhibitors that block the stimulation by chemokines and cytokines are not yet available; however, one can envision that this class of inhibitors will decrease the chemoresistance of leukemic cells and will be used in conjunction with other chemotherapy agents. Interestingly, inhibitors that block BCR-mediated signaling (BTK and PI3K inhibitors) also inhibit signaling via the microenvironment and chemokines.
Wnt-β-catenin Pathway
Wnt signaling affects developmental pathways, and its aberrant activation has major oncogenic effects as well. This pathway is activated in CLL as these leukemic cells express high levels of Wnt and frizzled along with epigenetic downregulation of Wnt pathway antagonist genes, including secreted frizzled-related protein (SFRP) family members and WIF1 (Figure).18-20 The binding of Wnts to their cognate receptors results in inhibition of GSK3β phosphorylation and stabilization of β-catenin, which then translocates to the nucleus and interacts with lymphoid-enhancing (LEF) and T-cell transcription factors to activate transcription of Wnt-target genes. Lack of E-cadherin expression in CLL cells also results in an increase in translocation of β-catenin and upregulation of the Wnt pathway.20
Wnt-target genes include Myc, LEF, cyclinD1, COX-2, and MMP. Gene expression profiling from our laboratory and other groups have identified the overexpression of these wnt-target genes and support this pathway activation in CLL cells.20 This is a promising signalling pathway and an active area of research for developing inhibitors that will have a growth inhibitory effect on CLL leukemic cells. GSK3b inhibitors and other drugs that re-express epigenetically silenced Wnt antagonist genes have been shown to inhibit this pathway activity in CLL cells in vitro.
Notch Pathway Activation
High-throughput exome sequencing has identified recurring mutations in a number of genes, including NOTCH1.21 Analysis of additional CLL patients confirmed activating NOTCH1 mutations in 10% to 15% of CLL patients and were also associated with poor outcome.22 This pathway is activated by ligands such as Jagged and Delta-like, which interact with the Notch receptor, which is then cleaved by γ-secretases. The cleaved intracellular domain of the NOTCH1 receptor in combination with other factors activates transcription of target genes, including Myc and HES1 (Figure). Besides the mutations that generate a truncated protein or may stabilize the pathway, the Notch pathway is also constitutively active in CLL specimens.23 Notch stimulation increases activity of prosurvival pathways and genes such as NFκB that resist apoptotic signals. The pathway can be inhibited by γ-secretase inhibitors (GSIs), which reduce the levels of cleaved NOTCH1 protein and downregulated Notch target genes. This pathway is also able to modulate the microenvironment stimuli as the GSIs inhibit responses to chemokines such as CXCL12 and inhibit migration and invasion.24
Newer Theraputic Agents
Work on signaling mechanisms paid dividends in CLL with the recent development of 2 inhibitors. Ibrutinib (BTK inhibitor) and idelalisib (PI3K inhibitor) are being studied in clinical trials, and both drugs block the BCR and microenvironment signaling pathways, thereby inhibiting the growth of CLL cells.
BTK Inhibitor: Ibrutinib
The activity of BTK is critical for a number of CLL signaling pathways, and it is a component of the initial signaling complex or signalosome that is formed with BCR signaling. Studies have shown that inhibiting this kinase blocks a number of pathways, including ERK, NFκB, and others. The drug ibrutinib blocks this kinase by forming a covalent bond and inhibiting its enzyme activity. This orally bioavailable drug showed activity in phase 1 trials in different B-cell malignancies.25 In a phase 2 study, high-risk CLL patients were given 2 different doses of this inhibitor, and the overall response rate was 71% with an overall survival at 26 months of 83%.11 Responses were seen in all patients irrespective of clinical and genetic risk factors. Based on these findings, the drug was approved for clinical use in patients with relapsed or refractory disease. Recently, there are data on the use of this drug as frontline therapy in elderly patients, and the drug was well tolerated.26 There are additional ongoing trials to compare this drug with other agents, including chlorambucil (in chemotherapy-naïve patients) and ofatumumab (in relapsed or refractory patients).
PI3 Kinase p110 Delta Inhibitor: Idelalisib
The crucial finding for the development of this inhibitor was the over-expression of the delta isoform of PI3K p110 in B-cell malignancies.14 The drug CAL-101 selectively inhibits this constitutively active isoform and induces apoptosis in a number of B-cell malignancies.15,27 In the phase 1 trial, this inhibitor was evaluated in relapsed/refractory patients at multiple dose levels.28 There was inhibition of PI3K signaling with an overall response rate of 72%, and a partial response rate of 39% was observed in CLL patients. This was followed by a randomized, placebo-controlled phase 3 study in which patients with myelosuppression, decreased renal function, or other illnesses were treated with either rituximab alone or with rituximab and idelalisib.29
At the time of reporting, the median progression-free survival (PFS) was 5.5 months in the placebo arm and was not reached in the idelalisib arm. Overall response rates were higher in the idelalisib group (81% vs 13%) with similar toxicity profiles in the 2 groups. This drug is now being extensively studied in combination with bendamustine and other anti-CD20 antibodies in clinical trials.
A unique toxicity observed with both these inhibitors is the initial lymphocytosis. In the case of ibrutinib, this was seen in a majority of patients (77%) and at the same time there was a response in the nodal disease, implying a redistribution of leukemic cells from the tissues to the peripheral blood.30
A potential explanation is that these drugs inhibit signaling via chemokines and other components of the microenvironment and by inhibiting the homing signals, allows leukemic cells to move out of their niche areas. This was analyzed in a recent study that compared clinical and biochemical parameters of patients who had a complete or partial response with ibrutinib compared with a “partial response except for lymphocytosis.”30 Patients with “partial response except for lymphocytosis” were found to have favorable prognostic factors, and the persisting leukemic cells were not clonally different from the original cells. The progression free survival of patients with “partial response except for lymphocytosis” was also similar to the subgroup with no prolonged lymphocytosis.
Discussion
Several therapeutic agents with novel mechanisms of action are effective in killing the CLL leukemic cells, and a number of targeted agents are currently in the pipeline. The next challenge for treating CLL will be the proper integration of these novel targeted agents with the traditional chemotherapy and chemoimmunotherapy approaches. Let us consider CLL patients in different clinical settings. First, a patient aged 60 years who is otherwise healthy will be treated with possibly all the available chemotherapy and chemoimmunotherapy options, as well as the newer targeted agents. In this clinical setting sequencing of therapy is not a major concern. On the other hand, a patient aged 70 years who is already refractory to multiple lines of therapy is a good candidate for these newer drugs.
The more controversial use of these targeted agents will be in an older patient with some comorbidities and newly diagnosed CLL. In this clinical setting, should one go with traditional chemotherapy/chemoimmunotherapy approaches or consider newer targeted agents? These issues are now being addressed in clinical trials, and with acceptable toxicity profiles these newer drugs will move to the frontline setting.
Author disclosures
The author reports no actual or potential conflicts of interest with regard to this article.
Disclaimer
The opinions expressed herein are those of the author and do not necessarily reflect an endorsement by or opinion of Federal Practitioner, Frontline Medical Communications, the U.S. Air Force, the U.S. Government, or any of its agencies. This article may discuss unlabeled or investigational use of certain drugs. Please review complete prescribing information for specific drug combinations–including indications, contraindications, warnings, and adverse effects–before administering pharmacologic therapy to patients.
1. Siegel R, Ma J, Zou Z, Jemal A. Cancer statistics, 2014. CA Cancer J Clin. 2014;64(1):9-29.
2. Döhner H, Stilgenbauer S, Döhner K, Bentz M, Lichter P. Chromosome aberrations in B-cell chronic lymphocytic leukemia: reassessment based on molecular cytogenetic analysis. J Mol Med. 1999;77(2):266-281.
3. Hamblin TJ, Davis Z, Gardiner A, Oscier DG, Stevenson FK. Unmutated Ig V(H) genes are associated with a more aggressive form of chronic lymphocytic leukemia. Blood. 1999;94(6):1848-1854.
4. Chen L, Widhopf G, Huynh L, et al. Expression of ZAP-70 is associated with increased B-cell receptor signaling in chronic lymphocytic leukemia. Blood. 2002;100(13):4609-4614.
5. Wickremasinghe RG, Prentice AG, Steele AJ. Aberrantly activated anti-apoptotic signalling mechanisms in chronic lymphocytic leukaemia cells: Clues to the identification of novel therapeutic targets. Br J Haematol. 2011;153(5):545-556.
6. Liao W, Jordaan G, Coriaty N, Sharma S. Amplification of B cell receptor-Erk signaling by Rasgrf-1 overexpression in chronic lymphocytic leukemia [published online ahead of print April 2, 2014]. Leuk Lymphoma. doi: 10.3109/10428194.2014898759.
7. Burger JA. Inhibiting B-cell receptor signaling pathways in chronic lymphocytic leukemia. Curr Hematol Malig Rep. 2012;7(1):26-33.
8. Buchner M, Fuchs S, Prinz G, et al. Spleen tyrosine kinase is overexpressed and represents a potential therapeutic target in chronic lymphocytic leukemia. Cancer Res. 2009;69(13):5424-5432.
9. Spurgeon SE, Coffey G, Fletcher LB, et al. The selective SYK inhibitor P505-15 (PRT062607) inhibits B cell signaling and function in vitro and in vivo and augments the activity of fludarabine in chronic lymphocytic leukemia. J Pharmacol Exp Ther. 2013;344(2):378-387.
10. Veldurthy A, Patz M, Hagist S, et al. The kinase inhibitor dasatinib induces apoptosis in chronic lymphocytic leukemia cells in vitro with preference for a subgroup of patients with unmutated IgVH genes. Blood. 2008;112(4):1443-1452.
11. Byrd JC, Furman RR, Coutre SE, et al. Targeting BTK with ibrutinib in relapsed chronic lymphocytic leukemia [published correction appears in N Engl J Med. 2014;370(8):786]. N Engl J Med. 2013;369(1):32-42.
12. Cheng S, Ma J, Guo A, et al. BTK inhibition targets in vivo CLL proliferation through its effects on B-cell receptor signaling activity. Leukemia. 2014;28(3):649-657.
13. Lannutti BJ, Meadows SA, Herman SE, et al. CAL-101, a p110delta selective phosphatidylinositol-3-kinase inhibitor for the treatment of B-cell malignancies, inhibits PI3K signaling and cellular viability. Blood. 2011;117(2):591-594.
14. Chantry D, Vojtek A, Kashishian A, et al. p110delta, a novel phosphatidylinositol 3-kinase catalytic subunit that associates with p85 and is expressed predominantly in leukocytes. J Biol Chem. 1997;272(31):19236-19241.
15. Hoellenriegel J, Meadows SA, Sivina M, et al. The phosphoinositide 3’-kinase delta inhibitor, CAL-101, inhibits B-cell receptor signaling and chemokine networks in chronic lymphocytic leukemia. Blood. 2011;118(13):3603-3612.
16. Burger JA, Ghia P, Rosenwald A, Caligaris-Cappio F. The microenvironment in mature B-cell malignancies: A target for new treatment strategies. Blood. 2009;114(16):3367-3375.
17. ten Hacken E, Burger JA. Molecular pathways: targeting the microenvironment in chronic lymphocytic leukemia—focus on the B-cell receptor. Clin Cancer Res. 2014;20(3):548-556.
18. Gandhirajan RK, Poll-Wolbeck SJ, Gehrke I, Kreuzer KA. Wnt/b-catenin/LEF-1 signaling in chronic lymphocytic leukemia (CLL): a target for current and potential therapeutic options. Curr Cancer Drug Targets. 2010;10(7):716-727.
19. Gutierrez A, Jr, Tschumper RC, Wu X, et al. LEF-1 is a prosurvival factor in chronic lymphocytic leukemia and is expressed in the preleukemic state of monoclonal B-cell lymphocytosis. Blood. 2010;116(16):2975-2983.
20. Jordaan G, Liao W, Sharma S. E-cadherin gene re-expression in chronic lymphocytic leukemia cells by HDAC inhibitors. BMC Cancer. 2013;13:88.
21. Puente XS, Pinyol M, Quesada V, et al. Whole-genome sequencing identifies recurrent mutations in chronic lymphocytic leukaemia. Nature. 2011;475(7354):101-105.
22. Fabbri G, Rasi S, Rossi D, et al. Analysis of the chronic lymphocytic leukemia coding genome: role of NOTCH1 mutational activation. J Exp Med. 2011;208(7):1389-1401.
23. Rosati E, Sabatini R, Rampino G, et al. Constitutively activated Notch signaling is involved in survival and apoptosis resistance of B-CLL cells. Blood. 2009;113(4):856-865.
24. López-Guerra M, Xargay-Torrent S, Rosich L, et al. The g-secretase inhibitor PF-03084014 combined with fludarabine antagonizes migration, invasion and angiogenesis in NOTCH1-mutated CLL cells [published online ahead of print April 30, 2014]. Leukemia. doi: 10.1038/leu.2014.143.
25. Advani RH, Buggy JJ, Sharman JP, et al. Bruton tyrosine kinase inhibitor ibrutinib (PCI-32765) has significant activity in patients with relapsed/refractory B-cell malignancies. J Clin Oncol. 2013;31(1):88-94.
26. O’Brien S, Furman RR, Coutre SE, et al. Ibrutinib as initial therapy for elderly patients with chronic lymphocytic leukaemia or small lymphocytic lymphoma: An open-label, multicentre, phase 1b/2 trial. Lancet Oncol. 2014;15(1):48-58.
27. Brown JR, Byrd JC, Coutre SE, et al. Idelalisib, an inhibitor of phosphatidylinositol 3-kinase p110∂, for relapsed/refractory chronic lymphocytic leukemia. Blood. 2014;123(22):3390-3397.
28. Brown JR, Furman RR, Flinn I, et al. Final results of a phase I study of idelalisib (GS-1101) a selective inhibitor of PI3K∂, in patients with relapsed or refractory CLL. J Clin Oncol. 2013;31:Absract 7003.
29. Furman RR, Sharman JP, Coutre SE, et al. Idelalisib and rituximab in relapsed chronic lymphocytic leukemia. N Engl J Med. 2014;370(11):997-1007.
30. Woyach JA, Smucker K, Smith LL, et al. Prolonged lymphocytosis during ibrutinib therapy is associated with distinct molecular characteristics and does not indicate a suboptimal response to therapy. Blood. 2013;123(12):1810-1817.
Enzyme plays key role in MM, group finds

Credit: Darren Baker
Researchers have identified an enzyme that appears key to prognosis and progression in multiple myeloma (MM).
The group found the enzyme, ST3GAL6, is overexpressed in MM cell lines and patients with disease.
This overexpression increases glycosylation, which escalates the interaction between MM cells and selectins.
And this encourages the circulation and spread of MM cells, as well as their retention in the bone marrow.
The researchers recounted this series of events in Blood.
“[W]e focused on alterations in [glycosylation] because of its role in cell-cell interactions and the spread of cancer cells in the blood,” said study author Michael O’Dwyer, MD, of National University of Ireland, Galway.
Using gene set enrichment analysis, he and his colleagues confirmed the overexpression of glycosylation-related signatures in MM. They also discovered the sialyltransferase ST3GAL6 was “one of the most significantly increased genes” in MM patients, when compared to healthy donors.
The team observed increased ST3GAL6 levels in both relapsed and newly diagnosed MM. And they found that higher ST3GAL6 levels were associated with decreased survival.
To expand upon these findings, the researchers went on to test 5 MM cell lines—MM1S, MM1R, U266, RPMI-8226, and H929. They found significantly higher levels of ST3GAL6 mRNA and protein in the cell lines compared to healthy CD138+ cells.
Knocking down ST3GAL6 in 2 of the cell lines—MM1S and RPMI-8226—significantly reduced the amount of alpha 2,3 sialic acid at the cell surface, which suggests that ST3GAL6 contributes to the synthesis of this glycan.
In addition, knocking down ST3GAL6 significantly reduced MM cells’ adhesion to bone marrow stem cells, human umbilical vein endothelial cells, and fibronectin. It also reduced MM cells’ transendothelial migration, attenuated Src activation in MM cells, and reduced the cells’ ability to roll on p-selectin.
Likewise, in mouse models, knockdown of ST3GAL6 reduced MM cell homing and engraftment. It also significantly decreased tumor burden and increased survival in the mice.
The researchers concluded that these findings highlight the importance of altered glycosylation, particularly sialylation, in MM cell adhesion and migration.
“Our research is crucial because it sheds new light on the biology of [MM], which could lead to new strategies to overcome resistance to treatment,” Dr O’Dwyer said. “Our aim now is to prevent these interactions that cause the spread [of MM cells] using specific enzyme and selectin inhibitors.” ![]()