User login
International Association Favors CT Screening of Heavy Smokers
AMSTERDAM – The International Association for the Study of Lung Cancer has issued a call for physicians to discuss lung cancer screening with patients who match the high-risk smoking history of the people enrolled in the landmark National Lung Screening Trial.
The National Lung Screening Trial (NLST) showed that an annual, low-dose CT chest scan can lead to significant reductions in lung cancer deaths and overall mortality in patients aged 55-74 years who smoked for at least 30 pack-years and, if former smokers, quit within the prior 15 years (New Engl. J. Med. 2011 [doi: 364:10.1056/NEJMoa1102873).
Based on these unprecedented findings, the International Association for the Study of Lung Cancer (IASLC)’s position-writing committee issued a call for physicians to discuss the data and its implications with such patients.
"It is appropriate for heavy smokers ages 55 to 74 to discuss relevant lung cancer screening information with their physicians to assist them in deciding whether to undergo spiral CT screening," said the statement, issued as IASLC started its world conference
Although some committee members, including the chairman, urged caution when routinely discussing screening with the target population before the cost effectiveness of this approach is proven, two of the Americans on the 10-member position-statement writing committee endorsed immediately offering screening to fully informed people who match the study’s screening profile.
"For patients with metastatic lung cancer the cure rate is essentially zero. Finding lung cancer early is the best way to deal with this disease, and that’s why this is such an extraordinary result," said Dr. Roy S. Herbst, a member of the task force and chief of medical oncology at Yale University in New Haven, Conn.
"Even with all the cautions, I think that in the United States at least you’ll see screening, especially since the NLST was largely sponsored by the National Cancer Institute. Assuming that the CMS [Centers for Medicare and Medicaid Services] and insurers will pick this up, I think [screening] is something we’re going to see. I think there will be great pressure in the United States for this to be covered, at a cost of about $300-$400 per scan.
"At Yale, we’ll start screening people who meet the enrollment criteria for the trial, as will several other U.S. centers. We’ll offer screening with all the caveats," including informing patients about the risks they will face from screening, their need to stop smoking, their need for ongoing screening, and the need to have a multidisciplinary team in place at the screening site to deal with all the possible consequences of screening, Dr. Herbst said.
"We know there is effectiveness from screening, but is there cost effectiveness? Is there value?" asked Dr. Richard Gralla, another member of the statement-writing committee and chief of hematology-oncology at North Shore University Medical Center and Long Island Jewish Medical Center in New Hyde Park, N.Y.
"My prediction is that screening will not only be shown to be cost effective, but it will be very cost effective. It will also be very expensive" to run annual screens on the millions of middle-aged smokers who meet the trial’s screening profile, he added. The NLST report estimated that 7 million Americans match the age and smoking history of the people enrolled in the trial.
By thrusting medicine into a new era of routine lung cancer screening, these developments will trigger creation of a new system of quality oversight for lung cancer screening that will likely follow the model of breast cancer screening.
"There is a laundry list of requirements that will need to be established by the institutions that want to do CT screening," said Dr. Denise R. Aberle, professor of radiology at the University of California, Los Angeles, and a collaborator on the NLST. "That will likely evolve into a form of accreditation to better guarantee quality assurance, as with breast cancer screening." Dr. Aberle also noted that the NLST researchers collected cost-effectiveness data, and that they will soon release a report on their analysis of those data.
Routine lung cancer screening will also place new responsibilities on the thoracic surgeons who follow up on suspicious lung lesions found though screening, most of which will not be cancers.
"For surgeons it will be a very large challenge to offer correct treatment to patients with very small cancers," said Dr. Jesper Pedersen, a thoracic surgeon at Copenhagen University Hospital. "We’re planning on writing guidelines for surgeons, because they will be at risk by operating on so many patients without lung cancer." The NLST results showed that 96% of suspicious lesions identified by CT screening were not cancers.
"There is potential for physical and psychiatric harm from cancer screening, but the results from many studies of breast cancer screening have shown that the benefits of screening outweigh its harms," said IASLC president David R. Gandara, professor of medicine and director of the thoracic oncology program at the University of California, Davis, in Sacramento.
"We’re in the early days of screening for lung cancer, and we must do everything to make sure that screening is done appropriately and that follow-up is appropriate. But our message to patients about screening is positive. We can’t overemphasize that," Dr. Gandara said.
Dr. Herbst said that he has been a consultant to Genentech, Agennix, Allos Therapeutics, Boehringer Ingelheim, and OSI Pharmaceuticals. He has been on the advisory boards of Amgen, Biothera, Genetics Squared (now Everist Genomics), MedTrust, N-of-One, SunDev, Targeted Molecular Diagnostics, and DiaTech. He has received research grants from Genentech, Amgen, Bristol-Myers Squibb, AstraZeneca, Novartis, OSI, Oncothyreon, Geron, Sanofi-Aventis, Pfizer, and ImClone.
Dr. Gralla and Dr. Aberle had no relevant disclosures. Dr. Pedersen said that he has been on the speakers bureau for Eli Lilly and Roche and received grant support from AstraZeneca. Dr. Gandara said that he has been a consultant to Amgen, AstraZeneca, Biodesix, Bristol-Myers Squibb/ImClone, GlaxoSmithKline, Genentech, Merck, Novartis, Sanofi-Aventis, and Response Genetics; he has received research support from Abbott, Bristol-Myers Squibb/ImClone, Genentech, Lilly, Merck, Novartis, and Pfizer.
FROM THE WORLD CONFERENCE ON LUNG CANCER
No Change in Statin Usage
A new study that links intensive-dose statin therapy to increased risk of developing diabetes mellitus is unlikely to convince HM or any other specialty to discontinue the treatment, a hospitalist focused on glycemic issues says.
A recent JAMA article reports that a meta-analysis of five clinical trials showed intensive statin regimen was associated with a 12% increased diabetes incidence over moderate-dose regimens (JAMA. 2011;305(24):2556-2564). The authors found that it would take 498 patients taking a statin to cause one extra case of diabetes. Conversely, only 155 people taking a statin would prevent one heart attack.
“The benefits of statins are just too well documented to ignore,” says Steven C. Smith, MD, FHM, medical director of hospitalist services at Healthcare Authority for Medical West in Bessemer, Ala. Quoting a cardiologist colleague, he adds, “statins are so beneficial, there is no way I wouldn’t use them because of a higher risk for diabetes.”
Dr. Smith, who leads the SHM-sponsored Glycemic Control Mentored Implementation program at his hospital, says the research is a formal link for what many hospitalists already realize: patients taking statins because of cardiovascular risk factors usually are at risk for diabetes. He adds that “modifiable risk factors”—including sedentary lifestyle, weight issues and diet—are prevalent in both patient groups. He refers to the JAMA research as “the last stone on the scale that tips the scale.”
“You have to weigh one versus the other,” Dr. Smith says. “The population of people on statins are already at risk for diabetes...you really have to address the risk factors that will solve both problems.”
First Responder
Every May, Mayo Clinic hospitalist Jason Persoff, MD, SFHM, sheds his doctor’s gear, grabs his camera and camcorder, and heads to the Midwest in search of ferocious weather for two weeks. This year, the Jacksonville, Fla.-based physician put his doctor’s gear back on sooner than he expected.
After 20 years of chasing storms, he found himself in what might have been considered a situation that was inevitable: helping people injured in a tornado. When a monstrous twister barreled through Joplin, Mo., last month, Dr. Persoff was less than a mile from its path. He and his “chase partner,” Robert Balogh, MD, an Oklahoma-based internist and former hospitalist, were able to rush in and assist in the aftermath.
One hospital serving the area, St. John’s Regional Medical Center, was destroyed, its roof ripped off by 200 mph winds.
Dr. Persoff checked in at the emergency room of the other one, Freeman Health System, and offered his help. He spent 10 hours there—first treating trauma patients.
“The initial trauma that came in was pretty fast and furious,” he says. “If somebody could be saved, and it wasn’t going to require an effort that would jeopardize resources, they did everything they could to save people.”
There were amputations, impalements, eviscerations. Some patients were covered in glass, he recalls. When the patients from St. John’s began to arrive at Freeman, Dr. Persoff treated them, doing admission orders on 24 patients.
Dr. Persoff plans to continue storm-chasing next year. But he says he’ll never forget the trauma nurse who was working as he arrived at Freeman and was still working as he left the hospital.
“That was one of the times where I was like, ‘Wow, this is really humbling,’ ” he says.
Check out photos and journal entries of Dr. Persoff’s storm-chasing adventures at http://stormdoctor.com/.
Gene Test Refines Prognosis For Lung Cancer
AMSTERDAM – A commercially available gene-expression test significantly improved discrimination between low- and high-risk stage I and IIa lung cancer patients in a pair of validation tests, leading investigators to propose routine use of the test to identify early-stage patients who should get adjuvant chemotherapy.
"The multigene assay can outperform conventional risk factors and staging, and may lead to personalized therapies for patients with early-stage nonsquamous non–small cell lung cancer," Dr. Johannes Kratz said at the World Conference on Lung Cancer.

Dr. Kratz conceded that no prospective, randomized study has yet tested whether identification of high-risk stage I patients singled out a subgroup that would definitely benefit from adjuvant chemotherapy. But the prognostic information that the genetic test already provides justifies its routine use in stage I and II patients, said Dr. Kratz, a surgeon who performed this study while at the University of California, San Francisco (UCSF), but who is now at Massachusetts General Hospital in Boston.
"I think [the test] is certainly ready for prognosis, to give patients information," he said in an interview. "We’ll start using it routinely for prognosis at UCSF. We believe the strength of the results show it’s ready for prime time. Whether it should also be used to guide treatment, especially for stage I patients, is up to each health care provider, but it opens an interesting possibility before anything is proven in a randomized, controlled trial. The hope is that by identifying high-risk patients, you’ll improve their survival by giving them adjuvant chemotherapy. And in some of the low-risk stage II patients, you can avoid some of the toxicities of adjuvant chemotherapy."
Although several different genetic tests for stage I lung cancer have been studied over the past decade, none have wound up as marketed tests. Dr. Kratz and his associates set out to develop a practical and commercially viable test. They worked in collaboration with Pinpoint Genomics, the company that has now begun marketing the test.
The test they developed uses polymerase chain reaction–based gene expression assays for 11 different genes, based on results from prior studies that identified genes critical to key causal pathways leading to lung cancer. "We took a truly blinded, one-shot approach" in putting together the genetic test panel, without any tinkering during the validation phase to boost the prognostic strength of the test, he explained at the conference sponsored by the International Association for the Study of Lung Cancer. They also focused on tests that use paraffin-embedded specimens.
"I don’t think a prospective validation study is needed" before routine prognostic use of the test begins, he said. The validation studies "were done retrospectively, but in a very controlled way that was equivalent to prospective validation. I think we have powerful evidence that these markers provide additional prognostic information. We’re not saying to abandon traditional staging, but this adds useful prognostic information."
The initial test development cohort consisted of 361 stage I, II, and III patients treated and followed at UCSF. Validation used two independent cohorts, 433 stage I patients treated by physicians from Kaiser Permanente of Northern California, and a second cohort of 1,006 patients with stage I, II, or II disease treated at hospitals affiliated with the China Clinical Trials Consortium. Median follow-up in the three cohorts ranged from just over 3 years to just short of 6 years. Five-year mortality was about 42% in each of the three cohorts. About 80% of the nonsquamous non–small cell lung cancer patients in the three cohorts had adenocarcinomas.
The genetic test used to discriminate among three risk levels in the UCSF cohort identified a low-risk group with a calculated 5-year survival of 78%, an intermediate group with a 5-year survival of 60%, and a high-risk group with a survival rate of 30%. Between-group differences were statistically significant (P = .00005). The U.S. and Chinese validation cohorts each led to identification of three very similar prognostic subgroups, "suggesting that the assay was based on principles of lung cancer biology that are fundamental to the disease and remain constant despite the diverse genetic backgrounds of the populations studied," Dr. Kratz said.
In a multivariate analysis that controlled for age, sex, tumor size, and smoking history, high-risk identification using the genetic test led to a near doubling of the mortality risk in the Kaiser cohort (hazard ratio = 1.93, P = .010) and a more than tripling of the mortality risk in the Chinese cohort, compared with the low-risk tertile (HR = 3.25, P less than .001).
On the basis of their findings, Dr. Kratz and his associates proposed a new variation on the conventional tumor size, lymph node status, metastases (TNM) staging system that they called TNMM; the second M stands for multigene assay.
Their revised system designates patients judged stage Ia or Ib by TNM who have a low-risk gene test result as a new class Ia. Patients who had been classified Ia or Ib by the old system who have intermediate- or high-risk gene test results form a new stage Ib, a stage that also includes old IIa patients by TNM who had a low-risk gene test outcome. Finally, the new stage IIa consists of patients scored as IIa by the TNM system who also score as intermediate or high risk on the genetic test.
To further assess the prognostic value of adding the gene test, the researchers ran receiver-operator curves for the standard and revised staging methods in each of the two validation cohorts, and found that adding the gene test led to statistically significant increases in the area under the curve for prognostic accuracy.
In commenting on the study, Dr. Giorgio V. Scagliotti, the designated discussant, said the prognostic factors in current use – tumor size, differentiation, vascular invasion, and surgical margins – are not enough. Additional prognostic factors are needed to identify the completely resected stage I patients who might benefit from adjuvant chemotherapy. "We also need to better identify the stage II patients who have a low risk of recurrence and will not benefit from adjuvant chemotherapy," he said.
Previously reported genetic tests for early-stage non–small cell lung cancer involved complicated microarray test methods and a need for fresh tissue. They lacked reproducibility and validation, and had other problems as well. "The new study avoided these pitfalls, but despite its advances, it remains a set of post hoc analyses that lack prospective, randomized testing. Additional study must prospectively establish the medical utility of the prognostic information before routine use begins. Do patients identified by the test as high risk get any benefit from systemic treatment? Is the genetic test significant in the context of tumor stage, patient age, and treatment with adjuvant chemotherapy? Adjuvant therapy has so far not been included in the analysis," said Dr. Scagliotti, professor of medicine at the University of Torino (Italy).
He said he has been a consultant to Eli Lilly, and has been on the speakers bureaus of AstraZeneca, Eli Lilly, and Roche. Dr. Kratz said that he has been a consultant to and has an equity interest in Pinpoint Genomics, the company that developed the genetic test used in the study.
AMSTERDAM – A commercially available gene-expression test significantly improved discrimination between low- and high-risk stage I and IIa lung cancer patients in a pair of validation tests, leading investigators to propose routine use of the test to identify early-stage patients who should get adjuvant chemotherapy.
"The multigene assay can outperform conventional risk factors and staging, and may lead to personalized therapies for patients with early-stage nonsquamous non–small cell lung cancer," Dr. Johannes Kratz said at the World Conference on Lung Cancer.
Dr. Kratz conceded that no prospective, randomized study has yet tested whether identification of high-risk stage I patients singled out a subgroup that would definitely benefit from adjuvant chemotherapy. But the prognostic information that the genetic test already provides justifies its routine use in stage I and II patients, said Dr. Kratz, a surgeon who performed this study while at the University of California, San Francisco (UCSF), but who is now at Massachusetts General Hospital in Boston.
"I think [the test] is certainly ready for prognosis, to give patients information," he said in an interview. "We’ll start using it routinely for prognosis at UCSF. We believe the strength of the results show it’s ready for prime time. Whether it should also be used to guide treatment, especially for stage I patients, is up to each health care provider, but it opens an interesting possibility before anything is proven in a randomized, controlled trial. The hope is that by identifying high-risk patients, you’ll improve their survival by giving them adjuvant chemotherapy. And in some of the low-risk stage II patients, you can avoid some of the toxicities of adjuvant chemotherapy."
Although several different genetic tests for stage I lung cancer have been studied over the past decade, none have wound up as marketed tests. Dr. Kratz and his associates set out to develop a practical and commercially viable test. They worked in collaboration with Pinpoint Genomics, the company that has now begun marketing the test.
The test they developed uses polymerase chain reaction–based gene expression assays for 11 different genes, based on results from prior studies that identified genes critical to key causal pathways leading to lung cancer. "We took a truly blinded, one-shot approach" in putting together the genetic test panel, without any tinkering during the validation phase to boost the prognostic strength of the test, he explained at the conference sponsored by the International Association for the Study of Lung Cancer. They also focused on tests that use paraffin-embedded specimens.
"I don’t think a prospective validation study is needed" before routine prognostic use of the test begins, he said. The validation studies "were done retrospectively, but in a very controlled way that was equivalent to prospective validation. I think we have powerful evidence that these markers provide additional prognostic information. We’re not saying to abandon traditional staging, but this adds useful prognostic information."
The initial test development cohort consisted of 361 stage I, II, and III patients treated and followed at UCSF. Validation used two independent cohorts, 433 stage I patients treated by physicians from Kaiser Permanente of Northern California, and a second cohort of 1,006 patients with stage I, II, or II disease treated at hospitals affiliated with the China Clinical Trials Consortium. Median follow-up in the three cohorts ranged from just over 3 years to just short of 6 years. Five-year mortality was about 42% in each of the three cohorts. About 80% of the nonsquamous non–small cell lung cancer patients in the three cohorts had adenocarcinomas.
The genetic test used to discriminate among three risk levels in the UCSF cohort identified a low-risk group with a calculated 5-year survival of 78%, an intermediate group with a 5-year survival of 60%, and a high-risk group with a survival rate of 30%. Between-group differences were statistically significant (P = .00005). The U.S. and Chinese validation cohorts each led to identification of three very similar prognostic subgroups, "suggesting that the assay was based on principles of lung cancer biology that are fundamental to the disease and remain constant despite the diverse genetic backgrounds of the populations studied," Dr. Kratz said.
In a multivariate analysis that controlled for age, sex, tumor size, and smoking history, high-risk identification using the genetic test led to a near doubling of the mortality risk in the Kaiser cohort (hazard ratio = 1.93, P = .010) and a more than tripling of the mortality risk in the Chinese cohort, compared with the low-risk tertile (HR = 3.25, P less than .001).
On the basis of their findings, Dr. Kratz and his associates proposed a new variation on the conventional tumor size, lymph node status, metastases (TNM) staging system that they called TNMM; the second M stands for multigene assay.
Their revised system designates patients judged stage Ia or Ib by TNM who have a low-risk gene test result as a new class Ia. Patients who had been classified Ia or Ib by the old system who have intermediate- or high-risk gene test results form a new stage Ib, a stage that also includes old IIa patients by TNM who had a low-risk gene test outcome. Finally, the new stage IIa consists of patients scored as IIa by the TNM system who also score as intermediate or high risk on the genetic test.
To further assess the prognostic value of adding the gene test, the researchers ran receiver-operator curves for the standard and revised staging methods in each of the two validation cohorts, and found that adding the gene test led to statistically significant increases in the area under the curve for prognostic accuracy.
In commenting on the study, Dr. Giorgio V. Scagliotti, the designated discussant, said the prognostic factors in current use – tumor size, differentiation, vascular invasion, and surgical margins – are not enough. Additional prognostic factors are needed to identify the completely resected stage I patients who might benefit from adjuvant chemotherapy. "We also need to better identify the stage II patients who have a low risk of recurrence and will not benefit from adjuvant chemotherapy," he said.
Previously reported genetic tests for early-stage non–small cell lung cancer involved complicated microarray test methods and a need for fresh tissue. They lacked reproducibility and validation, and had other problems as well. "The new study avoided these pitfalls, but despite its advances, it remains a set of post hoc analyses that lack prospective, randomized testing. Additional study must prospectively establish the medical utility of the prognostic information before routine use begins. Do patients identified by the test as high risk get any benefit from systemic treatment? Is the genetic test significant in the context of tumor stage, patient age, and treatment with adjuvant chemotherapy? Adjuvant therapy has so far not been included in the analysis," said Dr. Scagliotti, professor of medicine at the University of Torino (Italy).
He said he has been a consultant to Eli Lilly, and has been on the speakers bureaus of AstraZeneca, Eli Lilly, and Roche. Dr. Kratz said that he has been a consultant to and has an equity interest in Pinpoint Genomics, the company that developed the genetic test used in the study.
FROM THE WORLD CONFERENCE ON LUNG CANCER
Major Finding: Adding a commercially available genetic test to standard TNM staging significantly refined the prognosis of stage I and IIa patients. Patients identified as being at high risk for mortality by the genetic test had a statistically significant, 90% increased risk (P = .010) in a multivariate analysis in one validation cohort, and a threefold increased mortality risk (P less than .001) in the second validation cohort.
Data Source: Validation cohorts of 433 nonsquamous non–small cell lung cancer patients collected by Kaiser Permanente of Northern California and 1,006 similar lung cancer patients collected by the Chinese Clinical Trials Consortium, and a training cohort of 361 similar lung cancer patients collected at UCSF.
Disclosures: Dr. Kratz said that he has been a consultant to and has an equity interest in Pinpoint Genomics, the company that developed the genetic test used in the study.
Supporting Children's Grief within an Adult and Pediatric Palliative Care Program
Children are too often the forgotten mourners in the homes of dying patients. Children, even young children, and youth grieve and mourn the threatened and, then, actual loss of a dying parent, sibling, or other significant family member.1 At a time when the family resources and focus are pulled away and taxed, caregivers are tasked with the difficult job of sorting through their own emotions and a wealth of advice. Caregivers must decide how they will communicate with, include, and support the children/youth in their care.
Although evidence is incomplete and there is a clear need for further studies, links between unresolved childhood grief, or an inability to adequately process their grief, and subsequent psychiatric conditions such as depression and anxiety have been presented as far back as Freud.[2], [3], [4] and [5] In addition, prevalent feelings of responsibility and exclusion and poor communication are consistently identified by researchers interviewing bereaved children/youth about their own experience over the last couple of decades.[6], [7] and [8] Therefore, given the risk of negative psychological and social outcomes associated with children's grief and the struggles communicated by children themselves, it is critical to recognize the important and preventive role of supportive interventions, especially prior to the death of a significant family member.
Looking at caregivers' experiences, there is still a large divide between the advice given by many family and friends in this situation (see Table 1) and what has become accepted within the palliative and grief counseling fields as “best practice.”[6], [7] and [8] In addition, family members' access to professionals trained or knowledgeable in this area is growing but usually still limited.9 Many children/youth are left uninformed, unprepared, and cut off from their family's support.
Table 1. Myths and Realities about Speaking to Children about Grief and Dying. Adapted from MacPherson C.10
Professionals are not immune to subscribing to the myths listed in Table 1 and “are often inhibited by their anxieties about saying or doing the wrong thing and causing lasting emotional damage.”10 However, by communicating openly and honestly and including children/youth, informed care team members can offer many supportive interventions that a family can benefit from during the time leading up to and following the death. These interventions foster the best outcomes when they are offered early on in the palliative trajectory.[11] and [12]
Our Setting
The Temmy Latner Centre for Palliative Care (TLCPC) at Mount Sinai Hospital in Toronto is one of Canada's largest academic palliative care programs, incorporating a children's center, the Max and Beatrice Wolfe Children's Centre, which provides pediatric palliative care and children's grief programs (Dr. Jay Children's Grief Program). Our children's center supports children, youth, and their families when a family member is dying or has died. This support includes Canada's first Camp Erin, an overnight children's grief camp. Children are referred to these programs for grief counseling by our center's palliative care physicians, local palliative care units and hospices, and a wide variety of community agencies. Children's grief programs are very limited in our large urban setting, as is true in most communities across North America. We have four counselors devoted to child and youth grief support services.
What We Do
Action 1: Intake and Assessment
The center has an open referral policy, accepting referrals from any source, including self-referrals, regardless of the nature of the illness or cause of death.
An intake phone call, lasting between 15 and 60 minutes, is made to the family to assess their needs and to provide psychoeducation and relevant resources. Based on our belief that early intervention provides the most supportive opportunities, families in which the patient is dying are prioritized.
As a result of demand for services being greater than our resources, children and their families bereaved at the time of referral are provided with an initial psychoeducational visit and assessment and then placed on a waiting list if further counseling is deemed appropriate.
In either case, the initial assessment often reveals that what the family needs most is psychoeducation about child/youth grief, communication and development, and reassurance about the benefits of the things they are already doing. Caregivers are provided with educational materials, including a copy of the center's publication Living Dying: A Guide for Adults Supporting Grieving Children and Teenagers,11 a list of Web resources, books, and brochures written by us. All these resources are also available to professionals.
Action 2: Counseling
If further assessment and counseling are warranted, children are seen individually, with siblings and/or with their family depending on the needs and circumstances. The bulk of our counseling services are brief, typically lasting three or four sessions in total. However, more intensive counseling is available on a case-by-case basis, with progress and needs being assessed every four sessions. Counseling techniques including expressive arts, crafts, therapeutic play, and activities are used to support children/youth and families in the grieving process. Families are able to contact counselors when issues arise for them, which often occurs around anniversaries, holidays, other important events, and as children/youth develop and experience their grief in a new light.13
The center's model is resiliency-based, nonpathological, and family-centered. Caregivers are empowered as primary and ongoing sources of support and dominant role models for the grieving child and youth in their care. In addition to conversations with their counselor, families are offered monthly opportunities forcaregiver education and peer support and various therapeutic group activities for children/youth.
Action 3: Complex Cases
Referrals to secondary children's mental health services are facilitated for families with needs beyond the scope of our supportive grief services, including children with indicators of complicated grief who need more intensive counseling. For children with severe psychological distress, referrals are made to a pediatric psychiatrist with special interest in this area.
According to Rando,14 there are a number of forms of unresolved or complicated grief which can overlap, and each has components of denial or regression. These include feelings of grief and mourning being absent, an inhibition of some of the normal symptoms of grief, putting grief on hold for any reason, and when there is a dependent or ambivalent relationship with the deceased. Two common manifestations are extreme anger and extreme guilt.
Some types of death that place children/youth at risk for complicated grief include a sudden or unexpected death, a violent death, a death involving mutilation, the death of a child, and death as the result of a prolonged illness. Also included is complicated loss associated with social stigma such as imprisonment, suicide, AIDS, abortion, severe mental illness, serious family dysfunction, or addiction. However, the presence of these factors does not necessarily lead to complicated grief. Complicated loss is known to be mediated by personal, familial, and social factors that contribute to relative risk and resilience.
What We Say
Engaging a family early in the palliative journey allows greater opportunity to prepare children/youth and prevent possible negative outcomes.[6] and [15] Christ and Weisenfluh16 tell us that the greatest need for support is found during the weeks leading up to the death. A large component of the early intervention we offer is age-appropriate psychoeducation to help caregivers conceptualize how their child/youth may be experiencing and understanding what is happening. Caregivers who anticipate some of the thoughts, feelings, questions, and struggles that their child/youth might face are empowered and children benefit.
The 3 Cs
1. Can I catch it?
2. Did I cause it?
3. Who is going to take care of me?
Julie Stokes15 was able to summarize what children/youth think and worry about most when a family member is dying into three questions. We have coined these three questions the “Three Cs”: Catch, Cause, and Care.
Catch
The first “C” relates to the fear expressed by children/youth that they could catch the illness. Melanie, a 7-year-old, explained that she would have a brain tumor soon because her sister Sarah, who was dying of brain cancer at the time, “is my sister and we lived in the same room always.” If such concerns go unexplored and children are not given clear information, caregivers may see children/youth distance themselves from their ill family member, develop a fear that they and the rest of their family will get sick and die as well, and other implications.17
The weight of language in a child's understanding of illness, death, and dying cannot be emphasized enough.11 More often than not, indirect and generic language used by adults, such as referring to someone as being “sick” or “not doing well,” complicates a child's ability to differentiate between the common cold or flu and life-threatening diseases and illnesses. “My mom was sick and she died; therefore, all people that are sick die.” Many adults believe that their child is too young to understand what cancer means. While it is true that children may not be able to grasp the complex medical information about the illness, they are able to understand a great deal more than they are given credit for, and using the word “cancer” gives them a way to distinguish their dying family member's illness from others such as the common cold or flu.
Cause
The second “C” arises from the common thought in children/youth that they somehow caused or hastened the death and/or prevented the recovery of their family member. Cause is one of the five accepted subconcepts of the developmental understanding of death8 and among the last to be mastered due to its complexity and abstract components. As she sat under her pink bunk-bed, 5-year-old Tayah told her counselor that she had cancer when she was a little girl and then her mother got it after her. Eleven-year-old Joshua shared, “I just have to get to that cancer walk thing. If I can do that, then my mom will get her cure. That is what they said on TV you know, to walk for the cure!”
There are a number of ways that children/youth may try to own responsibility for the illness and death of their family member. They may believe that things they thought or did not think, did or did not do, felt or did not feel were directly related to the cause, progression, or death of the family member.18 These thoughts are especially strong for children in the magical thinking stage of development. In Piaget's theory of cognitive development, magical thinking dominates the preoperational stage (2–7 years old) and describes thinking disconnected from the laws of nature.19 Special attention should be given to assuring children in this age group that they are in no way responsible for the illness or death of their family member, as well as to avoid minimizing these fears and beliefs of responsibility.[6] and [17] This point will need to be readdressed often, with frequent reassurance that they are not responsible.
Care
The third “C” includes concerns about what will become of them and who will take care of them as well as the desire to help care for the dying person. While it is commonly thought that this fear is felt more significantly by children/youth who have a dying or deceased parent, siblings of dying or deceased children appear to be just as challenged. They will experience the same break in their belief that their family member will always be with them.20 Also, many children worry that their surviving parent will be incapacitated and unable to care for them after the death. Four-year-old Alex looked up at his mom one night and said, “You are dying in front of me. I'm scared. Who is going to turn out the light, I can't reach it, and who will cook for me, I can't turn on the stove?” This fear extends beyond who will take over the practical parental roles, to the worry that the child or youth will be orphaned.
Children will often connect their own experience to what they have seen or heard and fear the worst.[18] and [21] Orphans are ever present in children's literature and movies and are often depicted as abandoned to fend for themselves. For many, this fear is grounded in the reality that their current caregiver may not have been emotionally able to address issues of custody or guardianship or that they do not have anyone willing or able to care for the kids after their death. As Alice lay on her bedroom floor writing notes to her dying mother in the critical care unit, she shared, “My mommy and my daddy are dying … they is both going to die,” convinced that this was the truth. Alice's dad is healthy and has been for all of Alice's life.
“Three Cs” and Adolescents
Occasionally, adults have questioned the relativity of the “Three Cs” to our adolescent (ages 13–18) population. Our clinical work has led us to conclude that indeed the “Three Cs” are very real in the lives of the youth we work with. An example of this in relation to “Catch” is Sarah, who expressed distress over the familial traits of breast cancer and the likelihood that her fate will one day mirror that of her mother, aunt, and grandmother.
With regard to “Cause,” we hear youth talk about the relationship between the quality of their caregiving efforts and the death of their family member. Many youth express a feeling that if they had done a better job caregiving, their family member would not have died, especially for youth in primary caregiving roles and single-parent homes.14
When looking at “Care,” youth are impacted by their ability to think abstractly and to experience the loss of what is yet to come. Youth understand that they depend on their caregivers for much more than their practical needs. Joshua talked to his counselor about the loss he was feeling as he searched for employment without his father's help and network. He shared, “If my Dad was here, he would know someone; he would know what I should do.” Important to note is that age is not always the best predictor of cognitive capacity as we see school-aged children grapple with many of the thoughts more commonly expressed by our older population.
Whether or not a caregiver has already spoken with a child about a diagnosis and prognosis, it is helpful to get him or her to consider what the child may be thinking about. Using the foundation of the “Three Cs” will help caregivers understand the importance of open, honest, and concrete communication, as well as feel better equipped to provide their child/youth with support.
Teaching Parents How to Communicate with Their Children
It is difficult for a parent to witness the reaction of a child/youth to such difficult information. This challenge cannot be questioned. However, the benefit to children/youth of having their parents lead or participate in communications and psychoeducation about the cancer and terminal prognosis is clear.[6], [7], [8] and [12] Caregivers are able to clarify assumptions and misperceptions while modeling that it is permissible to talk about cancer and dying together.
Medical staff can facilitate opportunities for such family communications by including children in family meetings and discussions with medical staff and by explaining complex concepts to family members in a simple, concrete fashion. Caregivers often need professionals to welcome and encourage the children to be included. Staff can reassure parents that although they may fear that their children's inclusion will be harmful, on the contrary, inclusion is helpful.
Getting Started
1 Ask what the child/youth understands about the disease/illness.
2 Fill in any gaps in their understanding and explain the treatments that were given.
3 Explain cancer treatments such as chemotherapy, radiation, and surgery.
4 Ask the child/youth what he or she thinks is going to happen.
5 Explain in terms that can be understood that the family member will die.
In any conversation with children/youth about such complex and consequential material, follow their lead in regard to the amount of detail they want. Conceptualize it as an onion: You will want to provide the child/youth with clear and simple language describing basic information. Beyond that, peel off subsequent layers as the child/youth requests more information, always using clear and concrete language. The child/youth may be uncomfortable with the material and may attempt to change the topic. This is a healthy coping mechanism; the average child is quite good at knowing when he or she has reached the limit of their emotional attention span. Allow the child to take the conversation in a different direction, periodically checking to see if he or she is ready to come back to the topic at hand. The benefit of starting this course of conversation early is that it allows children/youth the chance to receive information in small, digestible pieces and the time to process and integrate the information to begin to make meaning of it.
Summary
“What about the kids?” is a dominant and consuming question for caregivers supporting children/youth around the dying and death of a family member. The concerns and fears encompassed in this question can overwhelm caregivers as they put vast amounts of energy into trying to protect children/youth from the suffering and pain that awaits them. Perhaps the hardest lesson these caregivers must learn is that they cannot protect their child/youth from the death any more than they can stop the death from happening. Instead, what is needed most from children/youth is to be included, prepared, and provided with a safe place for emotional expression. Children, as well as adults, will grieve in their own specific way, mediated by their developmental level, circumstances of the illness and death, and protective factors available to them. Providing comprehensive, whole-person care to palliative patients with children/youth in their care ought to include psychoeducation and support for all members of the family. Our communities' bereaved children/youth will be impacted by the death of their family members in countless ways throughout their lives. As professionals caring for people who are dying, we have a responsibility to mediate this impact to the best of our ability.
References1
1 J. Bowlby, Pathological mourning and childhood mourning, J Am Psychoanal Assoc 11 (1963), pp. 500–541. Full Text via CrossRef | View Record in Scopus | Cited By in Scopus (48)
2 L. Dowdney, Annotation: childhood bereavement following parental death, J Child Psychol Psychiat 41 (7) (2000), pp. 819–830. Full Text via CrossRef | View Record in Scopus | Cited By in Scopus (68)
3 K. Kirwin and V. Hamrin, Decreasing the risk of complicated bereavement and future psych disorders in children, J Child Adolesc Psychiat Nurs 18 (2) (2005), pp. 62–78. View Record in Scopus | Cited By in Scopus (10)
4 L. Saler and N. Skoinick, Childhood parental death and depression in adulthood: roles of surviving parent and family environment, Am J Orthopsychiatry 62 (4) (1992), pp. 504–516. Full Text via CrossRef | View Record in Scopus | Cited By in Scopus (35)
5 G. Mireault and L. Bond, Parental death in childhood: perceived vulnerability, and adult depression and anxiety, Am J Orthopsychiatry 62 (4) (1992), pp. 517–524. Full Text via CrossRef | View Record in Scopus | Cited By in Scopus (28)
6 G. Christ and A. Christ, Current approaches to helping children cope with a parent's terminal illness, CA Cancer J Clin 56 (2006), pp. 197–212. Full Text via CrossRef | View Record in Scopus | Cited By in Scopus (13)
7 P.R. Silverman, Never Too Young to Know: Death in Children's Lives, Oxford University Press, New York (2000).
8 J.W. Warden, Children and Grief: When a Parent Dies, Guilford Press, New York (1996).
9 L. Dowdney, R. Wilson, B. Maughan, M. Allerton, P. Schofield and D. Skuse, Psychological disturbance and service provision in parentally bereaved children: prospective case–control study, BMJ 319 (7206) (1999), pp. 354–357. View Record in Scopus | Cited By in Scopus (25)
10 C. MacPherson, Telling children their ill parent is dying: a study of the factors influencing the well parent, Mortality 10 (2) (2005), pp. 113–120.
11 C. Eaton-Russell, Living Dying: A Guide for Adults Supporting Grieving Children and Teenagers, Temmy Latner Centre for Palliative Care, Toronto (2007).
12 D. Black, Childhood bereavement: distress and long term sequelae can be lessened by early intervention, BMJ 312 (1996), p. 1496. View Record in Scopus | Cited By in Scopus (14)
13 S. Leighton, Bereavement therapy with adolescents—facilitating a process of spiritual growth, J Child Adolesc Psychiatr Nurs 21 (1) (2008), pp. 24–34. Full Text via CrossRef | View Record in Scopus | Cited By in Scopus (4)
14 T. Rando, Grief, Dying, and Death: Clinical Interventions for Caregivers, Research Press, Champaign, IL (1984).
15 J. Stokes, Anticipatory grief in families affected by HIV/AIDS, Prog Palliat Care 2 (1994), pp. 43–48.
16 C. Christ and S. Weisenfluh, Parent and child bereavement. In: D. Walsh, Editor, Palliative Medicine (1st ed.), Saunders, Philadelphia (2008).
17 L. Kroll, J. Barnes, A.L. Jones and A. Stein, Cancer in parents: telling children, BMJ 316 (1998), p. 880. View Record in Scopus | Cited By in Scopus (22)
18 J. Piaget, Piaget's theory. In: P. Mussen, Editor, Handbook of Child Psychology (4th ed.), John Wiley & Sons, New York (1970), pp. 703–732.
19 M. Van Riper, Death of a sibling: five sisters, five stories, Pediatr Nurs 23 (6) (1997), pp. 587–593.
20 F. Thompson and S. Payne, Bereaved children's questions to a doctor, Mortality 5 (1) (2000), pp. 74–96. Full Text via CrossRef
21 C.M. Burns, T.W. LeBlanc, A. Abernethy and D. Currow, Young caregivers in the end-of-life setting: a population-based profile of an emerging group, J Palliat Med 13 (10) (2010), pp. 1225–1235. Full Text via CrossRef | View Record in Scopus | Cited By in Scopus (0)
Providing Pain and Palliative Care Education Internationally
Volume 9, Issue 4, July-August 2011, Pages 129-133
How we do it
Judith A. Paice PhD, RN![]()
Available online 2 July 2011.
Article Outline
For many clinicians in oncology, educating other health-care professionals about cancer pain and palliative care is part of their professional life. The need for education exists across clinical settings around the world. Improved education is an urgent need as the prevalence of cancer is increasing. This burden is largely carried by the developing world, where resources are often limited.[1] Global educational efforts, including managing common symptoms, communication, care at the time of death, grief, and other topics, are imperative to reduce pain and suffering.[2] International training efforts require additional expertise and preparation beyond the standard teaching skills needed for all professional education.
The goal of international training efforts in pain and palliative care is to provide useful, culturally relevant programs while empowering participants to sustain these efforts in the long term. Global efforts in palliative care have demonstrated that sharing educational materials, resources, support and encouragement with our international colleagues can provide mentorship to go beyond simply attending a course to developing and expanding their own programs of palliative care in oncology.[3] and [4] To do this well, the following provides specific suggestions for before, during, and after international palliative care training experiences.
Do Your Homework
Before a course, it is essential to learn as much as possible about the region, the culture(s), and the health-care system. Several resources for this information are listed in Table 1. Additionally, speaking with colleagues who have traveled to the country or to those who have emigrated from the country can provide valuable insight. These individuals can provide a wealth of information to assist in developing an appropriate curriculum and specific presentations. As demographics vary, it is important to know the common cancers and other leading causes of death in the region. Issues that may be seen as “competing” issues HIV/AIDS, malaria, immunizations, lack of clean water, or maternal–infant mortality.[5] and [6] Literature, including fiction and nonfiction, as well as movies and other media, can enlighten the traveler regarding life in the region. Local consulates offer opportunities for learning, as do organizations such as the Council on Global Relations. There are rapid changes in global politics, health-care systems, and governments, so it is also vital to have current information.
| American Society for Clinical Oncology (ASCO) | Offers international cancer courses as well as fellowships and other awards. |
| Centers for Disease Control and Prevention (CDC), http://wwwnc.cdc.gov/travel/ | Provides information regarding common infectious illnesses, traveler's alerts. |
| Central Intelligence Agency (CIA), The World Factbook, https://www.cia.gov/library/publications/the-world-factbook/ | Excellent review of a country's political, demographic, geographic, and other attributes. |
| City of Hope Pain & Palliative Care Resource Center, http://prc.coh.org/ | Provides a clearinghouse that includes a wide array of resources and references to enhance pain and palliative care education and research. |
| End of Life Nursing Education Consortium (ELNEC), http://www.aacn.nche.edu/elnec/ | Includes relevant articles, resources, and a summary of current international ELNEC training programs. |
| International Association for Hospice and Palliative Care (IAHPC), http://www.hospicecare.com/ | Numerous global palliative care resources, including List of Essential Medicines, Global Directory of Educational Programs in Palliative Care, Global Directory of Palliative Care Providers/Services/Organizations, as well as Palliative Care in the Developing World: Principles and Practice. |
| International Association for the Study of Pain (IASP), http://www.iasp-pain.org/ | Strong emphasis on support of developing countries with research and educational grants; publishes a Guide to Pain Management in Low-Resource Settings offered without cost. |
| Open Society Institute–International Palliative Care Initiative, http://www.soros.org/initiatives/health/focus/ipci/about | Offers support for training, clinical care, and research in palliative care, alone and in collaboration with other organizations. |
| Pain & Policy Studies Group, http://www.painpolicy.wisc.edu/ | Excellent resource for information regarding opioid consumption by country as well as guidelines for policies that allow access to necessary medications. |
| U.S. Department of State, http://www.usembassy.gov/ Bureau of Consular Affairs, http://travel.state.gov/travel/travel_1744.html | Comprehensive lists of US embassies, consulates, and diplomatic missions; information to assist travelers from the United States to other countries, including visa requirements and safety alerts. |
| World Health Organization, http://www.who.int | Many useful resources, including Access to Analgesics and to other Controlled Medicines, as well as statistics regarding common illnesses by country. |
Health-Care Structure
Understand the existing health-care structure and what health care is available to all or for select populations. What is the extent of health-care services? Are there clinics for preventive care, or is most care obtained in the hospital? Is home care available with support from nurses and other professionals? Are emergency services available (eg, does the region have ambulances to transport and emergency departments to accept critically ill patients)? Where do patients obtain medications, and do they have to pay out of pocket for these? Do most people die in the hospital or at home? While websites and government sources are valuable, verify this information with clinicians since the clinical reality may be quite different.
Available Medications
To provide useful guidance in symptom management, it is necessary to have a list of available medications used to treat pain, nausea, dyspnea, constipation/diarrhea, wounds, and other symptoms commonly seen in oncology. Your presentation may need to be modified based upon these available drugs (Table 2). Where do patients obtain medications, and do they pay out of pocket for these? There are limitations on availability and access to opioids around the world.[7] Which opioids are available and actually used? What is the process for obtaining a supply of an opioid for a person with cancer? For example, in some countries, physicians can order only one week's worth of medication at a time. In other countries, patients must obtain opioids from the police station rather than a pharmacy. In several settings, only the patient, not family members, can pick up the medication from the dispensing site. And in a few countries, only parenteral opioids are available. It is also helpful to understand issues such as the prevalence of drug trafficking in the region and how this might affect local drug laws. Are traditional medicines, such as herbal therapies, or other techniques commonly used? It is helpful to be aware of these practices and incorporate them into teaching plans where appropriate.
Education of Health-Care Professionals
International education in palliative care should consider how physicians, nurses, pharmacists, and others are educated. Is the educational system very traditional and formal, with little interaction between students and teachers? Professionals trained in this manner may be less comfortable when faced with role-play, learning through discussion, or other Socratic educational methods. That does not mean that one should exclude these methods when planning the curriculum but, rather, be prepared for silence and possibly even discomfort when first introduced. Seek guidance from local educators as to what methods will be acceptable.
Who is included in the health-care team? Are psychologists available, and are chaplains considered part of health-care services? What is the relationship between physicians, nurses, and other team members? Is collegiality accepted, or is there a hierarchy that limits true teamwork? What is the status of physicians, nurses, and other professionals in the region? In some areas, physicians are highly regarded and financially compensated accordingly. In other parts of the world, physicians have very low social status, respect, and compensation. Within diverse cultures, compensation and acceptance of tips (or bribes) to see a patient or perform an intervention may be accepted practice. Attitudes toward work hours may differ from the Western perspective. In some cultures, socialization and development of personal relationships may be considered more important than other aspects of the workload.[8]
Planning in advance to know the targeted attendees is helpful. It is advisable to inquire if the hosts might consider inviting representatives from the ministry of health, the appropriate drug institutes, other key government officials, as well as medical, nursing, and pharmacy leaders who can become champions for access to pain relief and palliative care. Having multiple disciplines and leaders from health care and government at the same program can foster ongoing communication and understanding. Include chief educators as they can incorporate this content into their respective curricula.
Plan the Curriculum and the Program
The importance of cultural issues when developing content cannot be overstated.[9] Factors that might affect pain expression and language or cultural beliefs about death and dying will greatly impact content for teaching. Be aware of local religious and spiritual beliefs impacting pain and palliative care. Consider issues surrounding disclosure of diagnosis and prognosis. Autonomy may not be the prevailing perspective as seen in North America. Ensure that slides are culturally correct and that pictures and illustrations are appropriate. Having the host country leaders review the curriculum in advance is advisable. Avoid cartoons as these may not translate well. Use case examples, but ensure that they represent the types of patients and scenarios seen by the audience. It is also important to avoid being ethnocentric as Western medicine has much to learn from other approaches. It is very helpful to use case studies from the host country. In some settings, trainers will not have access to computers and projectors, limiting the role of PowerPoint slides. Paper presentations or the use of flip-charts may be more accessible.
Consider the need for translation and, if so, which type will be used. Simultaneous interpretation generally requires a sound booth and headphones for participants, and may be more expensive. Consecutive interpretation requires that the instructor present blocks of information, usually a sentence or two, followed by the interpreter providing the content in the appropriate language. This requires speakers to plan much shorter presentations with up to 50% less content being delivered. In either case, trained interpreters can benefit from seeing the slides in advance so they can prepare and clarify prior to the presentation.
When developing an agenda, inquire about the usual times for breaks and meals, as well as time for prayers or other activities. What is considered a “full day” varies around the world, as does the value of adhering rigidly to a schedule. International education generally means that the agenda is fluid; once you are actually in the country and providing the course, other needs may arise. A common mistake is trying to squeeze in too much content. Ask your host to meet prior to the program and, optimally, plan for time before the course to tour health-care facilities. Arrange for a time to meet with key medical, nursing, pharmacy, and governmental leaders who are not scheduled to attend the meeting but might somehow influence curricula and practice. In some settings, local media may be alerted to generate local interest in the topic. Communicate with your host about these opportunities so that arrangements can be made in advance.
For resource-poor countries, consider asking for donations from colleagues before leaving, including books, CDs, and medical supplies. Check local regulations first, particularly if bringing in medications or equipment. If sending books, some countries require high tariff fees to be paid by the receiver when accepting these packages, creating a financial burden for your hosts. Inquire ahead of time if they have to pay to accept these packages. Additionally, in some resource-poor countries, professionals do not have access to personal or work computers and internet café computers often do not have CD drives. Information on jump drives may be more easily accessible.
Finally, visiting educators may want to pack small gifts to give to hosts and others. These should be easily transported and may include items that represent your city or institution. We have also found bringing candy and small toys to be universally appreciated when visiting pediatric settings. A small portable color printer can be used to print photographs of pediatric patients as some of these children have never seen pictures of themselves. You can also print photographs of participants in the training courses.
Personal Considerations
Several months prior to departure, you should contact your traveler's health information resource to identify which vaccinations and what documents are needed to enter the country. To avoid lost time due to illness, ciprofloxacin and antidiarrheal medicines should be obtained before traveling. It is advisable to update your passport. Some countries require you to have sufficient blank pages in your passport to allow entry into their country. An entry fee paid in cash may be required upon arrival. Travelers should consider the political climate of the country and check the U.S. Department of State website (included in Table 1) for alerts or precautions.
Consider appropriate attire when packing. Clothing should reflect respect for the cultural and religious beliefs of the attendees.
During the Experience
It is very useful to meet with interpreters prior to the presentations to clarify any questions. Translation can be quite complicated. For example, a slide that used the term “caring” was interpreted as “romantic love,” and concepts about suffering and death can take on a cultural meaning. Check with interpreters regularly to determine if the speed of delivery is acceptable. Also, translators may have difficulty with this emotional content. In some instances, interpreters have become tearful and required debriefing after palliative care education events. Consider nonverbal communication and personal space. In some cultures, it may not be appropriate to shake hands or to use two hands. Gestures may have very different meanings in other cultures, so avoid these forms of communication. For example, the “OK” sign commonly used in North America, with the tip of the finger touching the tip of the thumb and the other three fingers extended, is considered an obscene gesture in Brazil.
When using teaching strategies other than lecture, respect that some students may not be comfortable at first with nontraditional approaches. Informal teaching strategies that are valued in North America may be viewed as of poor academic quality in other cultures. Debate and discussion, which may make it seem that the student is questioning a teacher's view, may be seen as disrespectful. At times, eliciting personal reflection and experience can engage the audience. For example, when introducing the topic of communication, health-care professionals in the audience can be asked the following questions:
- • If you had cancer, would you want to know?
• Would you want to know that you had a disease that you could die from?
Following these with “What do you tell your patients?” usually engenders excellent discussion.
We have also found that asking participants to do “homework” can be useful, particularly if the students have been quiet or reluctant to communicate during class. Suggested assignments might include listing the five top barriers to cancer pain management in your setting, describing a difficult death or a death that you made better, or related issues. Reticence to speak during class may be due to discomfort with language skills. Some students feel more comfortable sharing ideas in writing, and these assignments have yielded valuable stories that have helped us to understand their experiences and perspectives.
Since the goal of these educational efforts should be sustained, it is helpful to develop a plan for the future with students. Assist them in identifying goals, as well as action items to meet these goals. Allow time for individual meetings between faculty and students to fine-tune these efforts. This ensures that the educational experience will have a greater likelihood of translation into action. To provide practical assistance, if Internet access is available, spend time with small groups to demonstrate literature searches, useful websites, and other information that will foster continuity.
Faculty should meet after each day of training to modify the planned agenda as needed, to optimally meet the needs of the participants. This also provides needed time to debrief about the day's activities and provide support. Particularly when new to international education, the experience may be overwhelming as the status of health-care in developing countries can cause deep personal reflection.
Finally, celebrate. We have found that many students appreciate the opportunity to have some type of closing ceremony to receive certificates and pins, acknowledge their accomplishments, and encourage their future efforts.
Afterward
E-mail, voiceover Internet services, and videoconferencing software have significantly enhanced global communication. Faculty can make themselves available to the trainees after leaving the country using these technologies. Group conversations via e-mail can help solve problems, provide encouragement, and celebrate successes. Connect attendees with international professional organizations to support ongoing educational efforts. It is very useful to identify the leaders or champions and to plan ongoing support to help sustain their commitment. Many countries do not have professional organizations or support networks. These leaders can exist in isolation and suffer great personal sacrifice to lead palliative care efforts in their country.
Conclusion
When educating about pain and palliative care to a worldwide audience, never make assumptions, expect the unexpected, and be flexible. We have found many of these international teaching experiences to be some of the most exhilarating of our professional lives, providing insight to our own practices and creating lasting relationships with colleagues from around the globe. Ultimately, these efforts will improve care for people with cancer.
Acknowledgments
The authors acknowledge the American Association of Colleges of Nursing and the City of Hope for their ongoing support of the End-of-Life Nursing Education Consortium training activities, as well as the Oncology Nursing Society Foundation and the Open Society Institute for their support of international educational efforts. They also thank Marian Grant for her input.
References [Pub Med ID in Brackets]
1 A.L. Taylor, L.O. Gostin and K.A. Pagonis, Ensuring effective pain treatment: a national and global perspective, JAMA 299 (2008), pp. 89–91 [18167410].
2 K. Crane, Palliative care gains ground in developing countries, J Natl Cancer Inst 102 (21) (2010), pp. 1613–1615 [20966432].
3 J.A. Paice, B.R. Ferrell, N. Coyle, P. Coyne and M. Callaway, Global efforts to improve palliative care: the International End-of-Life Nursing Education Consortium training programme, J Adv Nurs 61 (2007), pp. 173–180 [18186909].
4 J.A. Paice, B. Ferrell, N. Coyle, P. Coyne and T. Smith, Living and dying in East Africa: implementing the End-of-Life Nursing Education Consortium curriculum in Tanzania, Clin J Oncol Nurs 14 (2010), pp. 161–166 [20350889].
5 C. Olweny, C. Sepulveda, A. Merriman, S. Fonn, M. Borok, T. Ngoma, A. Doh and J. Stjernsward, Desirable services and guidelines for the treatment and palliative care of HIV disease patients with cancer in Africa: a World Health Organization consultation, J Palliat Care 19 (2003), pp. 198–205 [14606333].
6 C. Sepulveda, V. Habiyatmbete, J. Amandua, M. Borok, E. Kikule, B. Mudanga and B. Solomon, Quality care at the end of life in Africa, BMJ 327 (2003), pp. 209–213 [12881267].
7 E.L. Krakauer, R. Wenk, R. Buitrago, P. Jenkins and W. Scholten, Opioid inaccessibility and its human consequences: reports from the field, J Pain Palliat Care Pharmacother 24 (2010), pp. 239–243 [20718644].
8 C.M. Bolin, Developing a postbasic gerontology program for international learners: considerations for the process, J Contin Educ Nurs 34 (2003), pp. 177–183 [12887229].
9 K.D. Meneses and C.H. Yarbro, Cultural perspectives of international breast health and breast cancer education, J Nurs Scholarsh 39 (2) (2007), pp. 105–112 [19058079].
Conflict of Interest Disclosures: All authors have completed and submitted the ICMJE Form for Disclosure of Potential Conflicts of Interest and none were reported.
![]()
Vitae
Dr. Paice is Director of the Cancer Pain Program, Division of Hematology-Oncology, Northwestern University, Feinberg School of Medicine, Chicago, Illinois.
Carma Erickson-Hurt is a faculty member at Grand Canyon University, Phoenix, Arizona.
Dr. Ferrell is a Professor and Research Scientist at the City of Hope National Medical Center, Duarte, California.
Nessa Coyle is on the Pain and Palliative Care Service, Department of Medicine, Memorial Sloan-Kettering Cancer Center, New York.
Dr. Coyne is Clinical Director of the Thomas Palliative Care Program, Virginia Commonwealth University/Massey Cancer Center, Richmond, Virginia.
Dr. Long is a geriatric nursing consultant and codirector of the Palliative Care for Advanced Dementia, Beatitudes Campus, Phoenix, Arizona.
Dr. Mazanec is a clinical nurse specialist at the University Hospitals Seidman Cancer Center, Cleveland, Ohio.
Pam Malloy is ELNEC Project Director, American Association of Colleges of Nursing, Washington, DC.
Dr. Smith is Professor of Medicine and Palliative Care Research, Virginia Commonwealth University/Massey Cancer Center, Richmond.
For many clinicians in oncology, educating other health-care professionals about cancer pain and palliative care is part of their professional life. The need for education exists across clinical settings around the world. Improved education is an urgent need as the prevalence of cancer is increasing.
How High Can Your Support Payments Go?
Last December, St. Peter’s Hospital, a 122-bed acute-care facility in Helena, Mont., crossed a symbolic line in the decade-long evolution of the financial payments that hospitals have provided to HM groups to make up the gap that exists between the expenses of running a hospitalist service and the professional fees that generate its revenue.
Hospital administrators asked the outpatient providers at the Helena Physicians’ Clinic to pay nearly $400,000 per year to support the in-house HM service at St. Peter’s, according to a series of stories in the local paper, the Helena Independent Record. The fee was never instituted and, in fact, some Helena patients and physicians have questioned whether the high-stakes payment was part of a broader campaign for the hospital to take over the clinic, a process that culminated in March with the hospital’s purchase of the clinic’s building.
Still, the Montana case focused a spotlight on the doughnut hole of HM ledger sheets: hospital subsidies. More than 80% of HM groups took financial support from their host institutions in fiscal year 2010, according to new data from SHM and the Medical Group Management Association (MGMA), which will be released in September. And the amount of that support has more than doubled, from $60,000 per full-time equivalent (FTE) in 2003-2004 to $136,400 per FTE in the latest data, according to a presentation at HM11 in May.
HM leaders agree the growth is unsustainable, particularly in the new world of healthcare reform, but they also concur that satisfaction with the benefits a hospitalist service offers make it unlikely other institutions will implement a fee-for-service system similar to that of St. Peter’s (see “Pay to Play?,” p. 38). As hospital administrators struggle to dole out pieces of their ever-shrinking financial pie, hospitalists also agree that they will find it more and more difficult to ask their C-suite for continually larger payments (see Figure 1, “Growth in Hospitalist Financial Support,” p. 37). Even when portrayed as “investments” in physicians that provide more than clinical care (e.g. hospitalists assuming leadership roles on hospital committees and pushing quality-improvement initiatives), a hospital’s bottom line can only afford so much.
“It’s not sustainable,” says Burke Kealey, MD, SFHM, medical director of hospital specialties at HealthPartners in Minneapolis and an SHM board member. “I think hospitals are pretty much tapped out by and large.
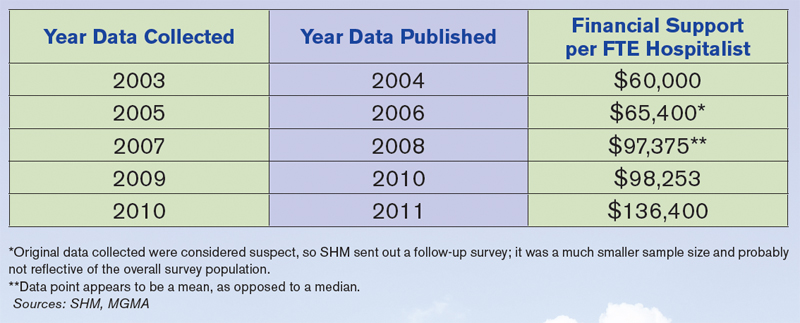
“What we’ve been seeing is practices have been able to ramp up their productivity, but people have also found other revenue streams, be it perioperative clinics, be it trying to find direct subsidies from specialty practices, be it educational funds for teaching. … We’re kind of entering a time when payment reform of some sort is going to have to come into play.”
History Lesson
Support payments have been around since HM’s earliest days, Dr. Kealey says. From the outset, it was difficult for most practices to cover their own salaries and expenses with reimbursement to the charges that make up the bulk of the field’s billing opportunities. “The economics of the situation are such that it is pretty difficult for a hospitalist to cover their own salary with the standard E/M codes,” he adds.
Hospitals, though, quickly realized that hospitalist practices were a valuable presence and created a payment stream to help offset the difference.
John Laverty, DHA, vice president of hospital-based physicians at HCA Physician Services in Nashville, Tenn., says four main factors drive the need for the hospitalist subsidy:
- Physician productivity. How many patients can a practice see on a daily or a monthly basis? Most averages teeter between 15 and 20 patients per day, often less in academic models. There is a mathematical point at which a group can generate enough revenue to cover costs, but many HM leaders say that comes at the cost of quality care delivery and physician satisfaction.
- Nonclinical/non-revenue-generating activities performed by hospitalists. HM groups usually are involved in QI and patient-safety initiatives, which, while important, are not necessarily captured by billing codes. Some HM contracts call for compensation tied to those activities, but many still do not, leaving groups with a gap to cover.
- Payor mix. A particularly difficult mix with high charity care and uninsured patients can lower the average net collected revenue per visit. There also is the choice between being a Medicaid participating provider or a nonparticipating provider with managed-care payors. So-called “non-par” providers typically have the ability to negotiate higher rates.
- Expenses. “How rich is your benefit package for your physicians?” Laverty asks. “Do you provide a retirement plan? Health, dental and vision? … Do you pay for CME?”
Dr. Kealey says it’s not “impossible” to cover all of a hospitalist’s costs through professional fees; however, “it usually requires a hospitalist be in an area with a very good payor mix or a hospital of very high efficiency, where they can see lots of patients. And often, there might be a setup where they aren’t covering unproductive times or tasks.”
Another Point of View
Not everyone thinks the subsidy is a fait accompli. Jeff Taylor, president and chief operating officer of IPC: The Hospitalist Co., a national physician group practice based in North Hollywood, Calif., says subsidies do not need to be a factor in a practice’s bottom line. Taylor says that IPC generates just 5% of its revenues from subsidies, with the remaining 95% financed by professional fees.
He attributes much of that to the work schedule, particularly the popular model of seven days on clinical duty followed by seven days off. He says that model has led to increased practice costs that then require financial support from their hospital. The schedule’s popularity is fueled by the balance it offers physicians between their work and personal lives, Taylor says, but it also means that practitioners working under it lose two weeks a month of billing opportunities.
He’s right about the popularity, as more than 70% of hospitalist groups use a shift-based staffing model, according to the State of Hospital Medicine: 2010 Report Based on 2009 Data. The number of HM groups employing call-based and hybrid coverage (some shift, some call) is 30%.

—Todd Nelson, MBA, technical director, Healthcare Financial Management Association, Chicago
“There is nothing else inherent in hospital medicine that makes this expensive, other than scheduling,” Taylor says. “Absent a very difficult payor mix, it’s the scheduling and the number of days worked that drives the cost. … We have been saying that for years, but we haven’t seen much of a waver yet. Once hospitals realize—some of them are starting to get it—that it’s the underlying work schedule that drives cost, they’re not going to continue to do it.”
Todd Nelson, MBA, a technical director at the Healthcare Financial Management Association in Chicago, agrees that the upward trajectory of hospital support payments will have to end, likely in concert with the expected payment reform of the next five years. But, he adds, the mere fact that hospital administrators have allowed the payments to double suggests that they view the support as an investment. In return for that money, though, C-suite members should contract for and then demand adherence to performance measures, he notes.
“Many specialties say, ‘We’re valuable; help us out,’ ” says Nelson, a former chief financial officer at Grinnell Regional Medical Center in Iowa. “In the hospital world, you can’t just ‘help out.’ They need to be providing a service you’re paying them for.”
SHM President Joseph Li, MD, SFHM, associate professor of medicine at Harvard Medical School and director of the hospital medicine division at Beth Israel Deaconess Medical Center in Boston, could not agree more. “The way I view monies that are sent to a group for nonclinical work is exactly that,” he says. “It’s compensation for nonclinical work. Subsidy, to me, seems to mean that despite whatever you’re doing, you need some more to pay because you can’t make your ends meet. That’s not true. What that figure is, for my group and for the vast majority of groups in this country, is really compensation for nonclinical efforts.”
HM groups should take it upon themselves to discuss their value contribution with their chief financial officer, as many in that position view hospitalist services as a “cost center” rather than as a means to the end of better financial performance for the institution as a whole, says Beth Hawley, senior vice president with Brentwood, Tenn.-based Cogent HMG.
“You need to look at it from the viewpoint of your CFO,” she says. “It is really important to educate your CFO on the myriad ways that your hospitalist program can create value for the hospital.”

—Jeff Taylor, president, COO, IPC: The Hospitalist Co., North Hollywood, Calif.
Hospitalist John Bulger, DO, FACP, FHM, of Geisinger Medical Center in Danville, Pa., says such education should highlight the intangible values of HM services, but it also needs to include firm, eye-opening data points. Put another way: “Have true ROI [return on investment], not soft ROI,” he says.
Dr. Bulger suggests pointing out that what some call a subsidy, he views as simply a payment, no different from the lump-sum check a hospital or healthcare system might cut for the group running its ED, or the check it writes for a cardiology specialty.
“There’s a subsidy for all those groups, but it’s never been looked at as a subsidy,” he adds. “But from a business perspective, it’s the same thing.”
The Future of Support
The relative value, justification, and existence of the support aside, the question remains: What is its future?
“Subsidies are not going to go away, because you can’t recruit and retain physicians in this environment for the most part without them,” says Troy Ahlstrom, MD, SFHM, CFO of Hospitalists of Northern Michigan, a hospitalist-owned and -managed group based in Traverse City. “Especially not when physicians coming out of residency have a desire to maintain a reasonable work and personal life, with fewer shifts where possible, fewer patients per shift. And they also have income goals that they have to maintain with that because they’re coming out of training with larger debt loads than ever before. That’s the tricky part for CMS and the federal government moving forward.”
Nelson, however, says that the future of support will be tied to payment reform, as bundled payments, value-based purchasing (VBP), and other initiatives to reduce overall healthcare spending are implemented. He said HM and other specialties should keep in mind that the point of reform is less overall spending, which translates to less support for everyone.
“When the pie shrinks, the table manners change,” he adds. “People are going to have to figure out how to slice that pie.”
Accountable-care organizations (ACOs) could be one answer. An ACO is a type of healthcare delivery model being piloted by the Centers for Medicare & Medicaid Services (CMS), in which a group of providers band together to coordinate the care of beneficiaries (see “Quality over Quantity,” December 2009, p. 23). Reimbursement is shared by the group and is tied to the quality of care provided. Nelson says the model could significantly cut the need for support, as HM groups are allowed to share in the upside created by the ACO.
The program is set to go live Jan. 1, 2012, but a leading hospitalist already has questioned whether the proposed rules provide enough capitated risk and, therefore, whether the incentive is enough to spur adoption of the model and the potential support reductions it would bring.
“You can certainly start by taking a lower amount of risk, just upside risk,” Cogent HMG chief medical officer Ron Greeno, MD, FCCP, SFHM, told The Hospitalist eWire in April, when the proposed rules were issued. “But your plan should be not to stay there. Your plan should be to take more and more risk as soon as you can, as soon as you’re capable.”
Nelson says that the support can continue in some form or fashion in the new models as long as the hospital and its practitioners are integrated and looking to achieve the same goal.
“The reality is, from the hospital perspective, you need to make sure you’re getting some value,” he says. “What are they buying in exchange for that [payment]?” TH
Richard Quinn is a freelance writer based in New Jersey.
Pay to Play?

When St. Peter’s Hospital in Helena, Mont., proposed charging an outpatient clinic nearly $400,000 a year to use its in-house HM group, it prompted a new question from the hospitalist field: Will hospitals begin charging a fee for HM services?
The near-universal answer from hospitalists is no.
“At the end of the day, what the hospital wants is to keep peace in the valley and drive volume,” says John Laverty, DHA, vice president of hospital-based physicians at HCA Physician Services in Nashville, Tenn. “Any way that they encourage volume by going out and adding subscribing physicians, or docs that want to turn their patients over to hospitalists, I can’t see a hospital charging a fee for that service. Obviously, they’re cutting their nose off because they’re going to limit [referrals].”
Hospitalists have heard about institutions attempting to institute a fee, but pushback from stakeholders usually makes the paradigm unworkable.
Hospitals usually value their relationships with primary-care physicians (PCPs) too much to alienate them, says hospitalist John Bulger, DO, FACP, FHM, of Geisinger Medical Center in Danville, Pa. This is particularly so, he says, when PCPs point out that should they object to paying such a fee to use HM services, many of their patients would end up in a hospital regardless of referrals.
In that context, the attempt by St. Peter’s to charge a fee is the perfect example of the failed premise: The idea was raised but never executed.
“PCPs love hospitalists,” Dr. Bulger says. “But part of the reason they love HM is it’s free.”—RQ
Last December, St. Peter’s Hospital, a 122-bed acute-care facility in Helena, Mont., crossed a symbolic line in the decade-long evolution of the financial payments that hospitals have provided to HM groups to make up the gap that exists between the expenses of running a hospitalist service and the professional fees that generate its revenue.
Hospital administrators asked the outpatient providers at the Helena Physicians’ Clinic to pay nearly $400,000 per year to support the in-house HM service at St. Peter’s, according to a series of stories in the local paper, the Helena Independent Record. The fee was never instituted and, in fact, some Helena patients and physicians have questioned whether the high-stakes payment was part of a broader campaign for the hospital to take over the clinic, a process that culminated in March with the hospital’s purchase of the clinic’s building.
Still, the Montana case focused a spotlight on the doughnut hole of HM ledger sheets: hospital subsidies. More than 80% of HM groups took financial support from their host institutions in fiscal year 2010, according to new data from SHM and the Medical Group Management Association (MGMA), which will be released in September. And the amount of that support has more than doubled, from $60,000 per full-time equivalent (FTE) in 2003-2004 to $136,400 per FTE in the latest data, according to a presentation at HM11 in May.
HM leaders agree the growth is unsustainable, particularly in the new world of healthcare reform, but they also concur that satisfaction with the benefits a hospitalist service offers make it unlikely other institutions will implement a fee-for-service system similar to that of St. Peter’s (see “Pay to Play?,” p. 38). As hospital administrators struggle to dole out pieces of their ever-shrinking financial pie, hospitalists also agree that they will find it more and more difficult to ask their C-suite for continually larger payments (see Figure 1, “Growth in Hospitalist Financial Support,” p. 37). Even when portrayed as “investments” in physicians that provide more than clinical care (e.g. hospitalists assuming leadership roles on hospital committees and pushing quality-improvement initiatives), a hospital’s bottom line can only afford so much.
“It’s not sustainable,” says Burke Kealey, MD, SFHM, medical director of hospital specialties at HealthPartners in Minneapolis and an SHM board member. “I think hospitals are pretty much tapped out by and large.
“What we’ve been seeing is practices have been able to ramp up their productivity, but people have also found other revenue streams, be it perioperative clinics, be it trying to find direct subsidies from specialty practices, be it educational funds for teaching. … We’re kind of entering a time when payment reform of some sort is going to have to come into play.”
History Lesson
Support payments have been around since HM’s earliest days, Dr. Kealey says. From the outset, it was difficult for most practices to cover their own salaries and expenses with reimbursement to the charges that make up the bulk of the field’s billing opportunities. “The economics of the situation are such that it is pretty difficult for a hospitalist to cover their own salary with the standard E/M codes,” he adds.
Hospitals, though, quickly realized that hospitalist practices were a valuable presence and created a payment stream to help offset the difference.
John Laverty, DHA, vice president of hospital-based physicians at HCA Physician Services in Nashville, Tenn., says four main factors drive the need for the hospitalist subsidy:
- Physician productivity. How many patients can a practice see on a daily or a monthly basis? Most averages teeter between 15 and 20 patients per day, often less in academic models. There is a mathematical point at which a group can generate enough revenue to cover costs, but many HM leaders say that comes at the cost of quality care delivery and physician satisfaction.
- Nonclinical/non-revenue-generating activities performed by hospitalists. HM groups usually are involved in QI and patient-safety initiatives, which, while important, are not necessarily captured by billing codes. Some HM contracts call for compensation tied to those activities, but many still do not, leaving groups with a gap to cover.
- Payor mix. A particularly difficult mix with high charity care and uninsured patients can lower the average net collected revenue per visit. There also is the choice between being a Medicaid participating provider or a nonparticipating provider with managed-care payors. So-called “non-par” providers typically have the ability to negotiate higher rates.
- Expenses. “How rich is your benefit package for your physicians?” Laverty asks. “Do you provide a retirement plan? Health, dental and vision? … Do you pay for CME?”
Dr. Kealey says it’s not “impossible” to cover all of a hospitalist’s costs through professional fees; however, “it usually requires a hospitalist be in an area with a very good payor mix or a hospital of very high efficiency, where they can see lots of patients. And often, there might be a setup where they aren’t covering unproductive times or tasks.”
Another Point of View
Not everyone thinks the subsidy is a fait accompli. Jeff Taylor, president and chief operating officer of IPC: The Hospitalist Co., a national physician group practice based in North Hollywood, Calif., says subsidies do not need to be a factor in a practice’s bottom line. Taylor says that IPC generates just 5% of its revenues from subsidies, with the remaining 95% financed by professional fees.
He attributes much of that to the work schedule, particularly the popular model of seven days on clinical duty followed by seven days off. He says that model has led to increased practice costs that then require financial support from their hospital. The schedule’s popularity is fueled by the balance it offers physicians between their work and personal lives, Taylor says, but it also means that practitioners working under it lose two weeks a month of billing opportunities.
He’s right about the popularity, as more than 70% of hospitalist groups use a shift-based staffing model, according to the State of Hospital Medicine: 2010 Report Based on 2009 Data. The number of HM groups employing call-based and hybrid coverage (some shift, some call) is 30%.
—Todd Nelson, MBA, technical director, Healthcare Financial Management Association, Chicago
“There is nothing else inherent in hospital medicine that makes this expensive, other than scheduling,” Taylor says. “Absent a very difficult payor mix, it’s the scheduling and the number of days worked that drives the cost. … We have been saying that for years, but we haven’t seen much of a waver yet. Once hospitals realize—some of them are starting to get it—that it’s the underlying work schedule that drives cost, they’re not going to continue to do it.”
Todd Nelson, MBA, a technical director at the Healthcare Financial Management Association in Chicago, agrees that the upward trajectory of hospital support payments will have to end, likely in concert with the expected payment reform of the next five years. But, he adds, the mere fact that hospital administrators have allowed the payments to double suggests that they view the support as an investment. In return for that money, though, C-suite members should contract for and then demand adherence to performance measures, he notes.
“Many specialties say, ‘We’re valuable; help us out,’ ” says Nelson, a former chief financial officer at Grinnell Regional Medical Center in Iowa. “In the hospital world, you can’t just ‘help out.’ They need to be providing a service you’re paying them for.”
SHM President Joseph Li, MD, SFHM, associate professor of medicine at Harvard Medical School and director of the hospital medicine division at Beth Israel Deaconess Medical Center in Boston, could not agree more. “The way I view monies that are sent to a group for nonclinical work is exactly that,” he says. “It’s compensation for nonclinical work. Subsidy, to me, seems to mean that despite whatever you’re doing, you need some more to pay because you can’t make your ends meet. That’s not true. What that figure is, for my group and for the vast majority of groups in this country, is really compensation for nonclinical efforts.”
HM groups should take it upon themselves to discuss their value contribution with their chief financial officer, as many in that position view hospitalist services as a “cost center” rather than as a means to the end of better financial performance for the institution as a whole, says Beth Hawley, senior vice president with Brentwood, Tenn.-based Cogent HMG.
“You need to look at it from the viewpoint of your CFO,” she says. “It is really important to educate your CFO on the myriad ways that your hospitalist program can create value for the hospital.”
—Jeff Taylor, president, COO, IPC: The Hospitalist Co., North Hollywood, Calif.
Hospitalist John Bulger, DO, FACP, FHM, of Geisinger Medical Center in Danville, Pa., says such education should highlight the intangible values of HM services, but it also needs to include firm, eye-opening data points. Put another way: “Have true ROI [return on investment], not soft ROI,” he says.
Dr. Bulger suggests pointing out that what some call a subsidy, he views as simply a payment, no different from the lump-sum check a hospital or healthcare system might cut for the group running its ED, or the check it writes for a cardiology specialty.
“There’s a subsidy for all those groups, but it’s never been looked at as a subsidy,” he adds. “But from a business perspective, it’s the same thing.”
The Future of Support
The relative value, justification, and existence of the support aside, the question remains: What is its future?
“Subsidies are not going to go away, because you can’t recruit and retain physicians in this environment for the most part without them,” says Troy Ahlstrom, MD, SFHM, CFO of Hospitalists of Northern Michigan, a hospitalist-owned and -managed group based in Traverse City. “Especially not when physicians coming out of residency have a desire to maintain a reasonable work and personal life, with fewer shifts where possible, fewer patients per shift. And they also have income goals that they have to maintain with that because they’re coming out of training with larger debt loads than ever before. That’s the tricky part for CMS and the federal government moving forward.”
Nelson, however, says that the future of support will be tied to payment reform, as bundled payments, value-based purchasing (VBP), and other initiatives to reduce overall healthcare spending are implemented. He said HM and other specialties should keep in mind that the point of reform is less overall spending, which translates to less support for everyone.
“When the pie shrinks, the table manners change,” he adds. “People are going to have to figure out how to slice that pie.”
Accountable-care organizations (ACOs) could be one answer. An ACO is a type of healthcare delivery model being piloted by the Centers for Medicare & Medicaid Services (CMS), in which a group of providers band together to coordinate the care of beneficiaries (see “Quality over Quantity,” December 2009, p. 23). Reimbursement is shared by the group and is tied to the quality of care provided. Nelson says the model could significantly cut the need for support, as HM groups are allowed to share in the upside created by the ACO.
The program is set to go live Jan. 1, 2012, but a leading hospitalist already has questioned whether the proposed rules provide enough capitated risk and, therefore, whether the incentive is enough to spur adoption of the model and the potential support reductions it would bring.
“You can certainly start by taking a lower amount of risk, just upside risk,” Cogent HMG chief medical officer Ron Greeno, MD, FCCP, SFHM, told The Hospitalist eWire in April, when the proposed rules were issued. “But your plan should be not to stay there. Your plan should be to take more and more risk as soon as you can, as soon as you’re capable.”
Nelson says that the support can continue in some form or fashion in the new models as long as the hospital and its practitioners are integrated and looking to achieve the same goal.
“The reality is, from the hospital perspective, you need to make sure you’re getting some value,” he says. “What are they buying in exchange for that [payment]?” TH
Richard Quinn is a freelance writer based in New Jersey.
Pay to Play?
When St. Peter’s Hospital in Helena, Mont., proposed charging an outpatient clinic nearly $400,000 a year to use its in-house HM group, it prompted a new question from the hospitalist field: Will hospitals begin charging a fee for HM services?
The near-universal answer from hospitalists is no.
“At the end of the day, what the hospital wants is to keep peace in the valley and drive volume,” says John Laverty, DHA, vice president of hospital-based physicians at HCA Physician Services in Nashville, Tenn. “Any way that they encourage volume by going out and adding subscribing physicians, or docs that want to turn their patients over to hospitalists, I can’t see a hospital charging a fee for that service. Obviously, they’re cutting their nose off because they’re going to limit [referrals].”
Hospitalists have heard about institutions attempting to institute a fee, but pushback from stakeholders usually makes the paradigm unworkable.
Hospitals usually value their relationships with primary-care physicians (PCPs) too much to alienate them, says hospitalist John Bulger, DO, FACP, FHM, of Geisinger Medical Center in Danville, Pa. This is particularly so, he says, when PCPs point out that should they object to paying such a fee to use HM services, many of their patients would end up in a hospital regardless of referrals.
In that context, the attempt by St. Peter’s to charge a fee is the perfect example of the failed premise: The idea was raised but never executed.
“PCPs love hospitalists,” Dr. Bulger says. “But part of the reason they love HM is it’s free.”—RQ
It Takes a Village
Gregory Misky, MD, has been a hospitalist for 12 years, first at a community hospital and for the past seven years at the University of Colorado Denver. In recent years, his frustration has grown over the challenges of discharge planning, care transitions, and preventing readmissions for vulnerable, disadvantaged patients, including the uninsured, underinsured, and medically indigent.
“There’s a big elephant in the room that we’re not talking about, and that elephant is having babies,” he says. “Access is such a big problem for these patients and, as a hospitalist, it’s just not OK to me anymore. I need to be proactive about finding solutions.”
Dr. Misky’s concerns led him to do research with mentor Eric Coleman, MD, the university’s creator of the Care Transitions Program (www.caretransitions.org), studying patients who lacked primary-care physicians (PCPs) or timely PCP follow-up, and their resulting higher rates of readmissions.1 Dr. Misky also helped develop care pathways, including post-discharge care, for VTE patients, a “common, costly, and dangerous” condition. He is working with a hospitalist colleague to explore how electronic health records (EHR) might be used to help trigger post-discharge follow-up for at-risk patients.
University of Colorado Hospital (UCH), a 425-bed urban academic tertiary-care center, is not the designated safety net hospital for metro Denver, yet 28% to 32% of patients discharged from its medical services are uninsured, Dr. Misky says. He finds that academic physicians at UCH are not always able to take on large numbers of uninsured patients in their clinics, given the productivity demands they face, while the hospital has not been able to participate in systemwide, comprehensive national models for improving care transitions, such as SHM’s Project BOOST (www.hospitalmedicine.org/boost) or Boston Medical Center’s Project RED (www.bu.edu/fammed/projectred/).
Dr. Misky is in discussions with local community services, such as the Metro Community Provider Network (MCPN) of clinics for underserved patients, and exploring the development of a collaborative model for integrating post-hospital care between UCH and MCPN. “A lot of our ideas are still very exploratory—trying to get the key providers to the table to talk about what these approaches might look like,” Dr. Misky explains. “I’ve been part of ongoing meetings, and I think similar kinds of conversations are happening at many levels at UCH, but there’s not a unified, consensus approach to care transitions—and that’s a problem. But I’m in the midst of it all, trying to highlight the issues and explore solutions.”
—Patricia Rutherford, RN, MS, vice president, Institute for Healthcare Improvement
Dr. Misky says every hospital-based provider—hospitalist, nurses, social workers—feels the same frustration and worry about the level of care when indigent patients are discharged to the community. Uninsured patients can run into problems post-hospitalization and return to the ED for their primary care because they lack other options, he says. “Without established liaisons to the community clinics,” he notes, “it can take three or four months for a new indigent patient to get seen at one.”
Disproportional Issues of the Uninsured
Hospitalists at San Francisco General Hospital, which is the safety-net provider for the Bay Area, are looking at similar issues, says Jeff Critchfield, MD, division chief of hospital medicine. “What we know about the uninsured is that they have a wealth of other challenges and barriers that they bring to the table,” he says. “First of all, un- and underinsured patients are more likely to have chronic illnesses, to be hospitalized for those illnesses, and then to be rehospitalized after discharge.”
Other issues disproportionally impacting uninsured or indigent patients include low literacy, low healthcare literacy, language barriers, cross-cultural barriers, substance abuse and mental health issues, homelessness or marginal housing, transportation barriers, and “social isolation, which also plagues our population and, I believe, places patients at risk, as does depression,” says Dr. Critchfield’s colleague Michelle Schneidermann, MD.
One-third of San Francisco General’s patients are uninsured and 40% have Medi-Cal (California’s version of Medicaid), which basically means they are underinsured.
“California has 19 safety-net hospitals, with 6% of the state’s inpatient beds but 50% of its uninsured population. So that’s what we do,” Dr. Critchfield says. But almost any hospital or hospitalist will see many of the same issues and problems, just not in the same proportions. “These are patients who can be most frustrating to hospitalists, requiring a disproportionate amount of our time,” he says, adding the greatest difficulty is helping these patients understand and follow post-discharge care plans. But if someone is ill enough to need acute hospitalization and is later discharged back to the street, readmission should not be a surprise. “We’ve done that experiment for many years, and we know how it turns out,” he says.
Dr. Schneidermann serves as medical director of San Francisco General’s medical respite program, a 45-bed emergency shelter that accepts homeless or marginally housed patients in need of follow-up care following discharge from any of the city’s acute-care hospitals. Research has shown that the programs can have a major effect on keeping discharged patients off the street, reducing their rates of rehospitalization by as much as 50%.2,3
“We know that homeless patients have longer lengths of hospital stay because their discharges are fraught with problems,” she says. A homeless patient hospitalized with a blood clot potentially could be kept in the hospital for a week while transitioning from heparin to Coumadin, while similar patients with community support might get discharged in a day.
“We are also fortunate to have a program called Healthy San Francisco,” which isn’t a health insurance program per se but since 2007 has provided access to outpatient, inpatient, and preventive care and medications for indigent patients, Dr. Schneidermann says. Sponsored by the city’s Department of Public Health, it is accessed through 32 medical homes located in both public and private clinics. The hospitalists’ goal is to have a follow-up appointment set with a receiving provider at the time of discharge. “It doesn’t always happen, but that’s the goal,” she explains. “Someone, by name, who has accepted the referral.”
Dr. Critchfield is running a randomized controlled trial of the hospital’s interventions to stem the tide of readmissions in patients 60 and older; many of these patients share the same indigent demographics of the rest of San Francisco General’s caseload, although most patients 65 and older qualify for Medicare. He describes the program as a hybrid of Project RED and Dr. Coleman’s Care Transitions Program, although it targets patients who speak English, Spanish, Cantonese, and Mandarin.
How many Americans are uninsured today is a moving target in the context of healthcare reform and its uncertain future, but the number increased to 53 million in 2007 from 42 million in 1998.4 The number of hospitalizations of uninsured patients also grew to 2.3 million from 1.8 million in the same time period, an increase of 31%, while total hospitalizations were increasing by 13%. A May 2011 research brief from the U.S. Department of Health and Human Services estimates that uncompensated costs of hospital care incurred for uninsured patients total $73 billion per year.5
The homeless in shelters or on the street number about 630,000 on any given evening, and 1.5 million Americans experienced homelessness last year, says Sabrina Edgington, MSSW, program and policy specialist at the National Health Care for the Homeless Council in Nashville, Tenn. That said, 30% of the U.S. homeless have health insurance. Uninsured patients are less likely to receive necessary diagnostic tests and labs while in the hospital, and they face limited access and longer wait times—even in the facilities that are willing to take them.7 Research published in the Journal of Hospital Medicine finds that uninsured or Medicaid patients with three common conditions are more likely to die in the hospital than insured patients.8 A 2008 national sample survey of physicians found that “most U.S. physicians limit their care of medically indigent patients.”9 Other recent research suggests that readmission rates are affected by race and by site of care—with hospitals serving a higher proportion of black patients also having higher readmission rates.10
“This is not a hospital problem—it’s a communitywide problem. So there’s not just a hospital solution; it will take the whole village,” says Patricia Rutherford, RN, MS, vice president of the Institute for Healthcare Improvement (IHI), which sponsors initiatives targeting care transitions.
The major national care-transitions programs that assist hospitals with addressing rehospitalizations all share similar objectives, Rutherford says, and all could be helpful in improving hospitals’ responses to indigent patients. The recognized programs include IHI’s STAAR (State Action on Avoidable Rehospitalizations: www.ihi.org/IHI/Programs), a multistate, multistakeholder quality improvement (QI) program; Project BOOST; Project RED; Dr. Coleman’s Care Transitions Project; the nursing-based Transitional Care Model (www.transitionalcare.info); and the American College of Cardiology’s Hospital to Home (www.cardiosource.org).

—Amy Boutwell, MD, MPP, hospitalist, Newton (Mass.) Wellesley Hospital, president, Collaborative Healthcare Strategies
Most of these “well-established, evidence-based interventions,” including BOOST, will be given preference in applications for grants from the federal Community-Based Care Transitions Program (CCTP). The program recently committed $500 million to support community-based coalitions that include hospitals that are working with community partners to create seamless care transitions. “It’s most important that hospitalists are integrally involved with these care-transition teams—if not leading them,” Rutherford says.
BOOST’s approach is built on a major change-management strategy to reconstruct hospitals’ care transitions and discharge processes from the ground up, says Tina Budnitz, MPH, the project’s director at SHM (see “Discharge Improvement,” p. 7.) “The first thing we do, we literally get out pens and paper and chart what happens before patients get into the hospital and what happens after they are discharged, all of the services that touch them—or should,” she says. “The planning process occurs on many levels, with all of the stakeholders in the community looking at the process map and seeing where people fall off and end up readmitted.”
—Jeff Critchfield, MD, division chief of hospital medicine, San Francisco General Hospital
SHM is planning to launch several new BOOST cohorts for participating hospitals this fall, along with a wider range of technical support, Budnitz says.
The Cross-Setting Team
Research on care transitions for uninsured or indigent patients “is not very robust,” observes Amy Boutwell, MD, MPP, a hospitalist at Newton Wellesley Hospital in Newton, Mass., former director of health policy at IHI and president of Collaborative Healthcare Strategies. “We don’t have the information we need, but there are great opportunities to improve our research base,” she explains.
Dr. Boutwell is a big fan of the “cross-setting team,” which brings together around a conference table professionals who work in different care settings, including the hospital, long-term care, and home-based care. She says it’s her job “to make sure patients are safe upon discharge, but if the community is under-resourced for primary-care physicians, if the patient is uninsured and we can’t find a PCP, the hospitalist and cross-setting team need to say, ‘We just can’t accept that.’ ”
What Do HM’s Community Partners Think About the Problem?

Lori J. Heim, MD, FAAFP, board chair of the American Academy of Family Physicians, a family physician in Vass, N.C., and hospitalist at Scotland Memorial Hospital in Laurinburg, N.C., says the unassigned patient who lacks a PCP might be the hardest issue to overcome in improving care transitions.
“We have a lot of members who volunteer at free clinics. Others are part of revolving lists of physicians willing to take unassigned call and accept referrals of indigent patients from the hospital,” Dr. Heim says. “If you look at the number of primary-care practices that are barely surviving, most hospitalists I know are very cognizant of how financially strapped family practice and general internist physicians are these days.”
It isn’t always clear who benefits financially from improved care transitions, particularly for indigent patients, Dr. Heim says. But the growth of patient-centered medical homes through the rollout of national healthcare reform, opportunities for community clinics to become those medical homes, and the wider dissemination of electronic medical records are all important components of the changes that need to take place.
“I would encourage hospitalists to be involved with their hospital leadership on these issues and have ongoing communication with community physicians. Both sides need to think more in terms of the systemic demands,” she says. “Often the ED doctor or the hospitalist knows about these issues and can help hospital leaders understand potential solutions for uninsured patients.–LB
A proper handoff should be done in a way that helps the patient and the physician providing the follow-up care. “But you won’t know what that is unless you ask the people you’re sending patients to how you’re doing,” she explains. “When we routinely review readmitted patients in cross-setting groups, it quickly breaks down the mindset that we in the hospital did everything we could have done to make the discharge successful.”
Dr. Boutwell recommends that hospitalists avoid thinking of these issues in a vacuum, as medical-clinical issues that only doctors can fix. “Because you can’t,” she says. “I would never ask an individual hospitalist to reduce readmissions. It requires a multidisciplinary, all-hands-on-deck approach by the hospital. This is different and more exciting than other quality-improvement efforts.” What’s more, she says, the day is coming—and soon—when failing to manage these readmissions will be a bad business proposition for the hospital (see “Value-Based Purchasing Raises the Stakes,” May 2011, p. 1).
IHI’s STAAR Initiative is working with coalitions of providers in Massachusetts, Michigan, Ohio, and Washington. One of those coalitions, Detroit CARR (Community Action to Reduce Rehospitalizations), convened by MPRO, a Michigan-based quality-improvement organization, is a great example of a cross-continuum team involving five inner-city hospitals, Dr. Boutwell says.
“CARR has really dug deeply into the needs of vulnerable patients in one of America’s most economically challenged communities, with a high proportion of Medicaid, uninsured, and disabled patients” and a shrinking population, she says. Many rehospitalizations are related to socio-economics. “The CARR coalition is meeting with the homeless shelters, the food pantries, and the faith-based agencies,” she says. “They’re really getting at the root of significant issues in their community.”
Nancy Vecchioni, RN, MSN, CPHQ, vice present of Medicare operations at MPRO, says CARR involves more than just healthcare providers; it also brings community agencies together with them to take ownership of the patient. Organizations that a year ago weren’t talking to each other are now meeting regularly to focus on the most vulnerable patients, reviewing cases of rehospitalized homeless patients, and sharing their experiences. Rehospitalized patients are being interviewed, using a prepared script (see Figure 1, p. 34), which allows the patient to tell their story. The information is shared within the coalition.
Each hospital has its own transition team, with post-acute providers, physicians, home health agencies, and community service providers, Vecchioni says. For patients who can’t get in to see a PCP within five days of discharge, some hospitals are opening continuity clinics. Others give patients three- to 30-day supplies of needed medications. “There’s no magic bullet—it’s just a different way of looking at how we do this work,” she adds. “Every day we see new barriers. But we’ve already seen a 5% overall reduction in readmissions. And I think hospitalists can be the champions and leaders of these efforts.”
Hospitalists have to raise the bar for themselves, Dr. Schneidermann says, “doing our best while recognizing we can only do so much. There is a lot we can learn from geriatrics, starting with truly embracing the multidisciplinary team.” If hospitalists feel like they are functioning in isolation, she says, they need to look around. “Are these kinds of interdisciplinary meetings happening? If so, join them. If not, light a fire. Convert your frustrating experiences with patients into action.” TH
Larry Beresford is a freelance medical writer based in California.
References
- Misky GJ, Wald HL, Coleman EA. Post-hospitalization transitions: Examining the effects of timing of primary care provider follow-up. J Hosp Med. 2010;5:392-397.
- Buchanan D, Doblin B, Sai T, Garcia P. The effects of respite care for homeless patients: a cohort study. Am J Public Health. 2006;96:1278-1281.
- Kertesz SG, Posner MA, O’Connell JJ, et al. Post-hospital medical respite care and hospital readmission of homeless persons. J Prev Inter Community. 2009;37:129-142.
- Nagamine M, Stocks C, Merrill C. Trends in uninsured hospital stays, 1998-2007. Health Care Cost & Utilization Project (HCUP) Statistical Brief #88. May 2010.
- U.S. Department of Health and Human Services. ASPE Research Brief. The value of health insurance: few of the uninsured have adequate resources to pay potential hospital bills. May 2011.
- U.S. Department of Housing and Urban Development. The Annual Housing Assessment Report to Congress, 2009.
- Kellerman A, Coleman M. Care without Coverage: Too Little, Too Late. Report by Institute of Medicine, May 2002.
- Hasan O, Orav EJ, Hicks LS. Insurance status and hospital care for myocardial infarction, stroke, and pneumonia. J Hosp Med. 2010;5(8):452-459.
- Chirayath HT, Wentworth AL. Constraints to caring: Service to medically indigent patients by allopathic and osteopathic physicians. J Health Care Poor Underserved. 2008;19:500-511.
- Joynt KE, Orav EJ, Jha AK. Thirty-day readmission rates for Medicare beneficiaries by race and site of care. JAMA. 2011;305:675-681.
- Buchanan D, Rohr L, Kehoe L, Glick SB, Jain S. Changing attitudes toward homeless people. J Gen Intern Med. 2004;19(5 Pt 2):566-568.
Liability and Compliance Issues

Hospitalists and other experts say medical/legal liability for indigent patients resulting from readmissions has not been a major focus of their care-transitions initiatives. Even as bundled care models will give hospitals greater financial responsibility for episodes of care across settings, getting sued by patients is not said to be a major concern.
“What we try to do is put together the most robust plan of care that we can for patients, whether insured or not,” says Jeff Critchfield, MD, chief of hospital medicine and medical director of risk management at San Francisco General Hospital. “The tone of the conversation for patients without insurance is different—because the options are fewer. We may have to keep these patients longer because of the absence of options. But rarely does risk management come into it. We don’t get sued by these patients, so that’s not a driving force.”
State and local regulations and Medicare conditions of participation also define expectations for hospitals regarding the care of indigent patients who present at the hospital with acute medical needs. In Los Angeles, a controversy emerged in 2005 when several hospitals were accused of dumping homeless patients on skid row. Local governments responded by approving a $100 million plan to provide homeless shelters across Los Angeles County; in 2008, the same public officials passed an ordinance making it illegal for hospitals to discharge homeless patients to the streets without their consent.
There can be liability issues for any patient who gets transferred out of the hospital and the transition is not a good one, Dr. Critchfield adds, “but I try to think about this population the same as any other.”—LB
Gregory Misky, MD, has been a hospitalist for 12 years, first at a community hospital and for the past seven years at the University of Colorado Denver. In recent years, his frustration has grown over the challenges of discharge planning, care transitions, and preventing readmissions for vulnerable, disadvantaged patients, including the uninsured, underinsured, and medically indigent.
“There’s a big elephant in the room that we’re not talking about, and that elephant is having babies,” he says. “Access is such a big problem for these patients and, as a hospitalist, it’s just not OK to me anymore. I need to be proactive about finding solutions.”
Dr. Misky’s concerns led him to do research with mentor Eric Coleman, MD, the university’s creator of the Care Transitions Program (www.caretransitions.org), studying patients who lacked primary-care physicians (PCPs) or timely PCP follow-up, and their resulting higher rates of readmissions.1 Dr. Misky also helped develop care pathways, including post-discharge care, for VTE patients, a “common, costly, and dangerous” condition. He is working with a hospitalist colleague to explore how electronic health records (EHR) might be used to help trigger post-discharge follow-up for at-risk patients.
University of Colorado Hospital (UCH), a 425-bed urban academic tertiary-care center, is not the designated safety net hospital for metro Denver, yet 28% to 32% of patients discharged from its medical services are uninsured, Dr. Misky says. He finds that academic physicians at UCH are not always able to take on large numbers of uninsured patients in their clinics, given the productivity demands they face, while the hospital has not been able to participate in systemwide, comprehensive national models for improving care transitions, such as SHM’s Project BOOST (www.hospitalmedicine.org/boost) or Boston Medical Center’s Project RED (www.bu.edu/fammed/projectred/).
Dr. Misky is in discussions with local community services, such as the Metro Community Provider Network (MCPN) of clinics for underserved patients, and exploring the development of a collaborative model for integrating post-hospital care between UCH and MCPN. “A lot of our ideas are still very exploratory—trying to get the key providers to the table to talk about what these approaches might look like,” Dr. Misky explains. “I’ve been part of ongoing meetings, and I think similar kinds of conversations are happening at many levels at UCH, but there’s not a unified, consensus approach to care transitions—and that’s a problem. But I’m in the midst of it all, trying to highlight the issues and explore solutions.”
—Patricia Rutherford, RN, MS, vice president, Institute for Healthcare Improvement
Dr. Misky says every hospital-based provider—hospitalist, nurses, social workers—feels the same frustration and worry about the level of care when indigent patients are discharged to the community. Uninsured patients can run into problems post-hospitalization and return to the ED for their primary care because they lack other options, he says. “Without established liaisons to the community clinics,” he notes, “it can take three or four months for a new indigent patient to get seen at one.”
Disproportional Issues of the Uninsured
Hospitalists at San Francisco General Hospital, which is the safety-net provider for the Bay Area, are looking at similar issues, says Jeff Critchfield, MD, division chief of hospital medicine. “What we know about the uninsured is that they have a wealth of other challenges and barriers that they bring to the table,” he says. “First of all, un- and underinsured patients are more likely to have chronic illnesses, to be hospitalized for those illnesses, and then to be rehospitalized after discharge.”
Other issues disproportionally impacting uninsured or indigent patients include low literacy, low healthcare literacy, language barriers, cross-cultural barriers, substance abuse and mental health issues, homelessness or marginal housing, transportation barriers, and “social isolation, which also plagues our population and, I believe, places patients at risk, as does depression,” says Dr. Critchfield’s colleague Michelle Schneidermann, MD.
One-third of San Francisco General’s patients are uninsured and 40% have Medi-Cal (California’s version of Medicaid), which basically means they are underinsured.
“California has 19 safety-net hospitals, with 6% of the state’s inpatient beds but 50% of its uninsured population. So that’s what we do,” Dr. Critchfield says. But almost any hospital or hospitalist will see many of the same issues and problems, just not in the same proportions. “These are patients who can be most frustrating to hospitalists, requiring a disproportionate amount of our time,” he says, adding the greatest difficulty is helping these patients understand and follow post-discharge care plans. But if someone is ill enough to need acute hospitalization and is later discharged back to the street, readmission should not be a surprise. “We’ve done that experiment for many years, and we know how it turns out,” he says.
Dr. Schneidermann serves as medical director of San Francisco General’s medical respite program, a 45-bed emergency shelter that accepts homeless or marginally housed patients in need of follow-up care following discharge from any of the city’s acute-care hospitals. Research has shown that the programs can have a major effect on keeping discharged patients off the street, reducing their rates of rehospitalization by as much as 50%.2,3
“We know that homeless patients have longer lengths of hospital stay because their discharges are fraught with problems,” she says. A homeless patient hospitalized with a blood clot potentially could be kept in the hospital for a week while transitioning from heparin to Coumadin, while similar patients with community support might get discharged in a day.
“We are also fortunate to have a program called Healthy San Francisco,” which isn’t a health insurance program per se but since 2007 has provided access to outpatient, inpatient, and preventive care and medications for indigent patients, Dr. Schneidermann says. Sponsored by the city’s Department of Public Health, it is accessed through 32 medical homes located in both public and private clinics. The hospitalists’ goal is to have a follow-up appointment set with a receiving provider at the time of discharge. “It doesn’t always happen, but that’s the goal,” she explains. “Someone, by name, who has accepted the referral.”
Dr. Critchfield is running a randomized controlled trial of the hospital’s interventions to stem the tide of readmissions in patients 60 and older; many of these patients share the same indigent demographics of the rest of San Francisco General’s caseload, although most patients 65 and older qualify for Medicare. He describes the program as a hybrid of Project RED and Dr. Coleman’s Care Transitions Program, although it targets patients who speak English, Spanish, Cantonese, and Mandarin.
How many Americans are uninsured today is a moving target in the context of healthcare reform and its uncertain future, but the number increased to 53 million in 2007 from 42 million in 1998.4 The number of hospitalizations of uninsured patients also grew to 2.3 million from 1.8 million in the same time period, an increase of 31%, while total hospitalizations were increasing by 13%. A May 2011 research brief from the U.S. Department of Health and Human Services estimates that uncompensated costs of hospital care incurred for uninsured patients total $73 billion per year.5
The homeless in shelters or on the street number about 630,000 on any given evening, and 1.5 million Americans experienced homelessness last year, says Sabrina Edgington, MSSW, program and policy specialist at the National Health Care for the Homeless Council in Nashville, Tenn. That said, 30% of the U.S. homeless have health insurance. Uninsured patients are less likely to receive necessary diagnostic tests and labs while in the hospital, and they face limited access and longer wait times—even in the facilities that are willing to take them.7 Research published in the Journal of Hospital Medicine finds that uninsured or Medicaid patients with three common conditions are more likely to die in the hospital than insured patients.8 A 2008 national sample survey of physicians found that “most U.S. physicians limit their care of medically indigent patients.”9 Other recent research suggests that readmission rates are affected by race and by site of care—with hospitals serving a higher proportion of black patients also having higher readmission rates.10
“This is not a hospital problem—it’s a communitywide problem. So there’s not just a hospital solution; it will take the whole village,” says Patricia Rutherford, RN, MS, vice president of the Institute for Healthcare Improvement (IHI), which sponsors initiatives targeting care transitions.
The major national care-transitions programs that assist hospitals with addressing rehospitalizations all share similar objectives, Rutherford says, and all could be helpful in improving hospitals’ responses to indigent patients. The recognized programs include IHI’s STAAR (State Action on Avoidable Rehospitalizations: www.ihi.org/IHI/Programs), a multistate, multistakeholder quality improvement (QI) program; Project BOOST; Project RED; Dr. Coleman’s Care Transitions Project; the nursing-based Transitional Care Model (www.transitionalcare.info); and the American College of Cardiology’s Hospital to Home (www.cardiosource.org).
—Amy Boutwell, MD, MPP, hospitalist, Newton (Mass.) Wellesley Hospital, president, Collaborative Healthcare Strategies
Most of these “well-established, evidence-based interventions,” including BOOST, will be given preference in applications for grants from the federal Community-Based Care Transitions Program (CCTP). The program recently committed $500 million to support community-based coalitions that include hospitals that are working with community partners to create seamless care transitions. “It’s most important that hospitalists are integrally involved with these care-transition teams—if not leading them,” Rutherford says.
BOOST’s approach is built on a major change-management strategy to reconstruct hospitals’ care transitions and discharge processes from the ground up, says Tina Budnitz, MPH, the project’s director at SHM (see “Discharge Improvement,” p. 7.) “The first thing we do, we literally get out pens and paper and chart what happens before patients get into the hospital and what happens after they are discharged, all of the services that touch them—or should,” she says. “The planning process occurs on many levels, with all of the stakeholders in the community looking at the process map and seeing where people fall off and end up readmitted.”
—Jeff Critchfield, MD, division chief of hospital medicine, San Francisco General Hospital
SHM is planning to launch several new BOOST cohorts for participating hospitals this fall, along with a wider range of technical support, Budnitz says.
The Cross-Setting Team
Research on care transitions for uninsured or indigent patients “is not very robust,” observes Amy Boutwell, MD, MPP, a hospitalist at Newton Wellesley Hospital in Newton, Mass., former director of health policy at IHI and president of Collaborative Healthcare Strategies. “We don’t have the information we need, but there are great opportunities to improve our research base,” she explains.
Dr. Boutwell is a big fan of the “cross-setting team,” which brings together around a conference table professionals who work in different care settings, including the hospital, long-term care, and home-based care. She says it’s her job “to make sure patients are safe upon discharge, but if the community is under-resourced for primary-care physicians, if the patient is uninsured and we can’t find a PCP, the hospitalist and cross-setting team need to say, ‘We just can’t accept that.’ ”
What Do HM’s Community Partners Think About the Problem?
Lori J. Heim, MD, FAAFP, board chair of the American Academy of Family Physicians, a family physician in Vass, N.C., and hospitalist at Scotland Memorial Hospital in Laurinburg, N.C., says the unassigned patient who lacks a PCP might be the hardest issue to overcome in improving care transitions.
“We have a lot of members who volunteer at free clinics. Others are part of revolving lists of physicians willing to take unassigned call and accept referrals of indigent patients from the hospital,” Dr. Heim says. “If you look at the number of primary-care practices that are barely surviving, most hospitalists I know are very cognizant of how financially strapped family practice and general internist physicians are these days.”
It isn’t always clear who benefits financially from improved care transitions, particularly for indigent patients, Dr. Heim says. But the growth of patient-centered medical homes through the rollout of national healthcare reform, opportunities for community clinics to become those medical homes, and the wider dissemination of electronic medical records are all important components of the changes that need to take place.
“I would encourage hospitalists to be involved with their hospital leadership on these issues and have ongoing communication with community physicians. Both sides need to think more in terms of the systemic demands,” she says. “Often the ED doctor or the hospitalist knows about these issues and can help hospital leaders understand potential solutions for uninsured patients.–LB
A proper handoff should be done in a way that helps the patient and the physician providing the follow-up care. “But you won’t know what that is unless you ask the people you’re sending patients to how you’re doing,” she explains. “When we routinely review readmitted patients in cross-setting groups, it quickly breaks down the mindset that we in the hospital did everything we could have done to make the discharge successful.”
Dr. Boutwell recommends that hospitalists avoid thinking of these issues in a vacuum, as medical-clinical issues that only doctors can fix. “Because you can’t,” she says. “I would never ask an individual hospitalist to reduce readmissions. It requires a multidisciplinary, all-hands-on-deck approach by the hospital. This is different and more exciting than other quality-improvement efforts.” What’s more, she says, the day is coming—and soon—when failing to manage these readmissions will be a bad business proposition for the hospital (see “Value-Based Purchasing Raises the Stakes,” May 2011, p. 1).
IHI’s STAAR Initiative is working with coalitions of providers in Massachusetts, Michigan, Ohio, and Washington. One of those coalitions, Detroit CARR (Community Action to Reduce Rehospitalizations), convened by MPRO, a Michigan-based quality-improvement organization, is a great example of a cross-continuum team involving five inner-city hospitals, Dr. Boutwell says.
“CARR has really dug deeply into the needs of vulnerable patients in one of America’s most economically challenged communities, with a high proportion of Medicaid, uninsured, and disabled patients” and a shrinking population, she says. Many rehospitalizations are related to socio-economics. “The CARR coalition is meeting with the homeless shelters, the food pantries, and the faith-based agencies,” she says. “They’re really getting at the root of significant issues in their community.”
Nancy Vecchioni, RN, MSN, CPHQ, vice present of Medicare operations at MPRO, says CARR involves more than just healthcare providers; it also brings community agencies together with them to take ownership of the patient. Organizations that a year ago weren’t talking to each other are now meeting regularly to focus on the most vulnerable patients, reviewing cases of rehospitalized homeless patients, and sharing their experiences. Rehospitalized patients are being interviewed, using a prepared script (see Figure 1, p. 34), which allows the patient to tell their story. The information is shared within the coalition.
Each hospital has its own transition team, with post-acute providers, physicians, home health agencies, and community service providers, Vecchioni says. For patients who can’t get in to see a PCP within five days of discharge, some hospitals are opening continuity clinics. Others give patients three- to 30-day supplies of needed medications. “There’s no magic bullet—it’s just a different way of looking at how we do this work,” she adds. “Every day we see new barriers. But we’ve already seen a 5% overall reduction in readmissions. And I think hospitalists can be the champions and leaders of these efforts.”
Hospitalists have to raise the bar for themselves, Dr. Schneidermann says, “doing our best while recognizing we can only do so much. There is a lot we can learn from geriatrics, starting with truly embracing the multidisciplinary team.” If hospitalists feel like they are functioning in isolation, she says, they need to look around. “Are these kinds of interdisciplinary meetings happening? If so, join them. If not, light a fire. Convert your frustrating experiences with patients into action.” TH
Larry Beresford is a freelance medical writer based in California.
References
- Misky GJ, Wald HL, Coleman EA. Post-hospitalization transitions: Examining the effects of timing of primary care provider follow-up. J Hosp Med. 2010;5:392-397.
- Buchanan D, Doblin B, Sai T, Garcia P. The effects of respite care for homeless patients: a cohort study. Am J Public Health. 2006;96:1278-1281.
- Kertesz SG, Posner MA, O’Connell JJ, et al. Post-hospital medical respite care and hospital readmission of homeless persons. J Prev Inter Community. 2009;37:129-142.
- Nagamine M, Stocks C, Merrill C. Trends in uninsured hospital stays, 1998-2007. Health Care Cost & Utilization Project (HCUP) Statistical Brief #88. May 2010.
- U.S. Department of Health and Human Services. ASPE Research Brief. The value of health insurance: few of the uninsured have adequate resources to pay potential hospital bills. May 2011.
- U.S. Department of Housing and Urban Development. The Annual Housing Assessment Report to Congress, 2009.
- Kellerman A, Coleman M. Care without Coverage: Too Little, Too Late. Report by Institute of Medicine, May 2002.
- Hasan O, Orav EJ, Hicks LS. Insurance status and hospital care for myocardial infarction, stroke, and pneumonia. J Hosp Med. 2010;5(8):452-459.
- Chirayath HT, Wentworth AL. Constraints to caring: Service to medically indigent patients by allopathic and osteopathic physicians. J Health Care Poor Underserved. 2008;19:500-511.
- Joynt KE, Orav EJ, Jha AK. Thirty-day readmission rates for Medicare beneficiaries by race and site of care. JAMA. 2011;305:675-681.
- Buchanan D, Rohr L, Kehoe L, Glick SB, Jain S. Changing attitudes toward homeless people. J Gen Intern Med. 2004;19(5 Pt 2):566-568.
Liability and Compliance Issues
Hospitalists and other experts say medical/legal liability for indigent patients resulting from readmissions has not been a major focus of their care-transitions initiatives. Even as bundled care models will give hospitals greater financial responsibility for episodes of care across settings, getting sued by patients is not said to be a major concern.
“What we try to do is put together the most robust plan of care that we can for patients, whether insured or not,” says Jeff Critchfield, MD, chief of hospital medicine and medical director of risk management at San Francisco General Hospital. “The tone of the conversation for patients without insurance is different—because the options are fewer. We may have to keep these patients longer because of the absence of options. But rarely does risk management come into it. We don’t get sued by these patients, so that’s not a driving force.”
State and local regulations and Medicare conditions of participation also define expectations for hospitals regarding the care of indigent patients who present at the hospital with acute medical needs. In Los Angeles, a controversy emerged in 2005 when several hospitals were accused of dumping homeless patients on skid row. Local governments responded by approving a $100 million plan to provide homeless shelters across Los Angeles County; in 2008, the same public officials passed an ordinance making it illegal for hospitals to discharge homeless patients to the streets without their consent.
There can be liability issues for any patient who gets transferred out of the hospital and the transition is not a good one, Dr. Critchfield adds, “but I try to think about this population the same as any other.”—LB
Red Flags within Documentation for Hospitalists
With the number of clinical hospitalists still growing, more patients are under HM care, which puts hospitalists at higher risk for lawsuits. The goal for a hospitalist should be to take care of their patients, but at the same point make a defensible medical record. Plaintiffs’ attorneys look for potential red flags in the medical record. Potential red flags could be illegibility, omissions of date and time, criticism of other healthcare providers, vague terminology, abbreviations, delayed entries, inconsistencies between healthcare providers, corrections, and opinions about the patient.
The medical record is a legal document that is required by law and regulatory bodies. It serves as a communication vehicle for healthcare providers; it tells the patient’s story as well as the care that has been received. It is used for implementing quality-improvement initiatives, determining appropriate level of care, and research and education. It also is the most credible evidence in a legal proceeding. Inaccurate or incomplete documentation can mean serious trouble.
The most common documentation error is illegible handwriting. It is well known throughout medicine that if it’s not documented, it has not been done. At the same time, what is not readable has not been done. Electronic health records (EHR) have minimized this problem; however, EHR is not universally available, and documentation could include both electronic and handwritten entries.
Common sense dictates that all records should be legible, but it is surprising the number of progress notes that are illegible. Physicians are encouraged to write in black ink, so that the notes are capable of being photocopied. Some colored inks can run when they become wet. Also, all entries should include the full date, time, and the name of the physician, as well as their title and designation, which should be printed alongside their signatures.
Correction fluid must not be used in any patient records. Corrections should be made with a single line drawn through them, initialed, dated, and timed, so the error can still be read. All entries should be in a chronological order, with no spaces between the entries. Extra words should not be squeezed onto a line; a line must be drawn through any empty space at the end of an entry. Ditto marks should never be used. Use of glue is not permitted in the medical record, unless some special pages have tabs to allow sheets to be attached to the notes.
No paper should be removed from the clinical file, other than for purposes of photocopying, and those should be returned immediately. Each page of the documentation should be sequentially numbered; if the pages are kept in separate sections, make sure that is clear. Each progress note should have three unique patient identifiers: patient name, date of birth, and a record number. Most hospitals use sticker systems or printable progress notes, which have taken care of this problem.
Notes from various specialties, including nursing records, should be documented in the patient chart. If any of these include discussions held outside of normal working hours, those entry notes should clearly state the time and location of the discussions and state that the entry is made retrospectively.
Leaving space to accommodate late documentation never is a good idea. If the space is too small and subsequent documentation is squeezed in, an attorney could allege that the squeeze documentation was added to cover something up. If the space is too large, the blank space remains unaccounted for. When a late entry is made several days later, it should include a rationale for the delay. Unexplained late entries, along with erased or obliterated entries, are serious red flags.
The clinical content of a progress note should state in full a legible and understandable history. This should include a full assessment, including the positive and negative findings, interventions, and outcomes, as well as initial and ongoing assessments by each provider. Legible instructions should be included for all treatment therapies and medications. These records should be factual, consistent, and accurate.
When physicians disagree among themselves, criticism of that should not be on the record. In fact, this variance should be documented in the chart and the provider making this decision should clearly document the processes that led to the decision.
It is unwise to include abbreviations. In cases where abbreviations are necessary, they should be spelled out fully the first time. Institutional policies should be followed for appropriate abbreviations. Jargon, meaningless phrases, irrelevant speculation, and offensive or subjective statements should not be written. Labels to describe a patient as obnoxious, belligerent, or rude can lead to serious allegations. In fact, direct quotes should be applied on the record. The patient’s refusal of treatment should be documented, including the patient’s stated reason for refusal, if provided, and any action taken by the provider, as well as patient education and notifying the patient and their family. Patients who refuse to accept treatment recommendations might bear partial responsibility for a subsequent injury, which is known as “contributory negligence.”
Vague terminology should be avoided (e.g. “Cl urine” could mean colored urine, clear urine, or cloudy urine) as it can be subject to interpretation. Institutional policies should be followed for reporting incident reports. Peer-review processes should be noted; however, do not indicate in the chart that an incident report has been filed or an event report has been completed. This can serve as a red flag and could give the plaintiff’s attorney the right to access the record.
Documentation red flags should be addressed on a daily basis. Progress notes should be catered not only to providing an accurate record of the physicians’ thought process, but as an assessment of the patient, keeping in mind that if this case is called into court three or four years later, the record will speak for itself.
Deepak Pahuja, MD, FACP,
hospitalist, director of CME,
Erie Physician Network Hospitalists,
St. Vincent Health Center, Erie, Pa.,
CEO, Aerolib Healthcare Solutions LLC;
Priyanka Chadha, MD,
cofounder, Aerolib Healthcare Solutions LLC
DRG Accuracy Increases Medicare Reimbursement, Reduces Risks
Clinical documentation integrity (CDI) programs started in the 1990s. Most of the programs were experimental pilots that assessed the impact on physician documentation and quality.
In 2007, the Centers for Medicare & Medicaid Services (CMS) implemented the Medicare Severity Diagnosis Related Group (DRG). The focus of the DRG system was severity of illness and mortality rates. Indicators such as present on admission (POA) and hospital-acquired condition (HCA) were added the next year to identify conditions noted when a patient was admitted into the hospital.
Currently, the purpose of the CDI program is to optimize the DRG by capturing conditions through clear, concise documentation and coding. Accuracy in reporting DRG assignments will increase Medicare reimbursement and reduce compliance risks. CDI program popularity has grown because of careful consideration of the benefits of implementation.
Are we ready for the change? Launching a CDI program is not an easy task. It takes courage, tenacity, patience, and a great plan. The success of a CDI program depends on one key element: buy-in by physicians at your facility. Yes, physicians. Physician resistance is high for two key reasons: time and education.
A physician’s focus primarily has been the care of the patient, with time allowed to clarify their working or discharge diagnosis and maintaining their patients in the hospital setting. That’s where a clinical documentation specialist (CDS) comes in. At Civista Medical Center in Maryland, color-coded worksheets are printed and attached to the patient’s medical record. The purpose of the worksheet is to trigger the physician to write specific documentation.
Education! Education! It cannot be stressed enough. Healthcare is a team effort. To achieve accurate and concise documentation, physicians must be educated about the importance of documentation. Nonspecific documentation leads to nonspecific coding of the medical record. Therefore, the true severity of illness, mortality rate, and intensity of service goes uncaptured. The lack of specificity in documentation affects the quality of patient care, compliance risk, data integrity, and reimbursement.
The implementation of a CDI program can be successful by enlisting internal support at your facility, including administration, physicians, and such ancillary staff members as case management. A clear, concise plan that includes physicians every step of the way will be imperative.
Consider the many avenues you might have to implement your query system, either by paper or electronically. If the coding department does not own the concurrent CDI query process, make sure they are involved in the process of establishing the program. In addition, provide feedback to various facility departments about the impact the CDI program is having on quality, integrity, and reimbursement. Include an ongoing program to educate the physicians on ICD 9-CM, as well as the forthcoming ICD 10, for a smoother transition.
Karen Stanley, RN, MBA,
White Plains, Md.
Team Hospitalist Seats New Members
Six hospitalists have joined Team Hospitalist, the only reader-involvement group of its kind in HM. Each of the new members has experience in the practice of HM; many offer specialized backgrounds in pediatrics, academics, and group administration. The new members will serve two-year terms on the 12-person board, and act as special editorial consultants to the magazine.

Femi Adewunmi, MD, MBA, CPE, SFHM
Senior hospitalist management consultant
Crosswalk Consulting Group
Raleigh, N.C.

Tracy E. Cardin, ACNP-BC
Section of Hospital Medicine
Department of General Medicine
University of Chicago Medical Center

Dan Hale, MD, FAAP
Pediatric hospitalist
Floating Hospital for Children
Tufts Medical Center
Boston

Larry W. Holder, MD, FACP
Medical director hospitalist services
Chief medical information officer
Decatur Memorial Hospital,
Illinois

Joshua D. Lenchus, DO, RPh, FACP, FHM
Assistant professor, division of hospital medicine Department of Medicine
University of Miami Miller School of Medicine
Associate program director
Jackson Memorial Hospital Internal Medicine Residency

Michelle Mourad, MD
Assistant professor and director of quality, division of hospital medicine
Department of Medicine
University of California at San Francisco Medical Center
Six hospitalists have joined Team Hospitalist, the only reader-involvement group of its kind in HM. Each of the new members has experience in the practice of HM; many offer specialized backgrounds in pediatrics, academics, and group administration. The new members will serve two-year terms on the 12-person board, and act as special editorial consultants to the magazine.
Femi Adewunmi, MD, MBA, CPE, SFHM
Senior hospitalist management consultant
Crosswalk Consulting Group
Raleigh, N.C.
Tracy E. Cardin, ACNP-BC
Section of Hospital Medicine
Department of General Medicine
University of Chicago Medical Center
Dan Hale, MD, FAAP
Pediatric hospitalist
Floating Hospital for Children
Tufts Medical Center
Boston
Larry W. Holder, MD, FACP
Medical director hospitalist services
Chief medical information officer
Decatur Memorial Hospital,
Illinois
Joshua D. Lenchus, DO, RPh, FACP, FHM
Assistant professor, division of hospital medicine Department of Medicine
University of Miami Miller School of Medicine
Associate program director
Jackson Memorial Hospital Internal Medicine Residency
Michelle Mourad, MD
Assistant professor and director of quality, division of hospital medicine
Department of Medicine
University of California at San Francisco Medical Center