User login
Dr. Arora talks about HM's role in patient safety
Vineet Arora, MD, MA, FHM, assistant professor in the Department of Medicine at the University of Chicago, believes HM has played a part in patient-safety reform, but she also believes HM can do more to preserve continuity of care for patients as they transition in and out of the hospital.
Click here to listen to the audio file.
Dr. Wachter talks about patient safety
Robert Wachter, MD, FHM, chief of the hospitalist division, professor and associate chair of the Department of Medicine at the University of California at San Francisco, former SHM president, and author of the blog "Wachter's World," is outspoken in his belief that hospital medicine should be one the solutions to medical mistakes in U.S. hospitals.
Click here to listen to the audio file.
Mentored Implementation
When Kendall Rogers, MD, signed up for his first mentored implementation project, he remembers being skeptical. After all, it seemed too good to be true. “I wanted to ask, ‘What’s the catch? Are you trying to get us to adopt a certain practice?’ ” says Dr. Rogers, a hospitalist at the University of New Mexico Health Science Center School of Medicine in Albuquerque.
Now, after participating in SHM’s Venous Thromboembolism (VTE) Prevention Collaborative and later mentoring other hospitalists in SHM’s Glycemic Control Mentored Implemen-tation (GCMI) program, he understands the motivation.
“Mentored implementation is unique in that it accomplishes two goals,” he says. “It improves the nuts and bolts of a project, and it also creates new hospitalist leaders and quality-improvement [QI] experts.”
Prior to his work in the VTE Prevention Collaborative, Dr. Rogers had little exposure to QI programs. He has since implemented a VTE prevention program at his hospital, and his mentorship of hospitalists in the GCMI program is helping to create custom programs to optimize glycemic control protocols. He also is a faculty member for SHM’s QI and patient-safety pre-course and is leading SHM training sessions on VTE prevention.
The mentored implementation model, he says, is an effective way to get over many of the daunting roadblocks that can stand in the way of a hospitalist-led QI program. “Many people need that spark,” Dr. Rogers says. “This is a highly effective way to be that spark. I’ve seen too many people get disillusioned and frustrated with quality-improvement programs and give up. In these programs, the mentor can help identify and address roadblocks.”
What is Mentored Implementation?
In theory, mentored implementation is a unique and simple approach to both education and QI in healthcare. At its core, mentored implementation is the pairing of a program participant with a subject-matter expert who already has been involved in similar programs and will help the participant implement a QI program of their own.
The concept is new to QI initiatives. Although SHM has embraced the idea, mentored implementation programs first started at the Center to Advance Palliative Care in New York City, says Kathleen Kerr, SHM’s program manager for mentored implementation programs and senior research analyst in the Department of Medicine at the University of California at San Francisco. The model is an alternative to more traditional educational approaches that rely exclusively on lectures or educational sessions.
“You could sit in a session and it’s very valuable, but also very different from actually doing it,” Kerr says. “It’s hard to process so much information in a session. You don’t understand the complexity of something like gathering data until you’re actually doing it. The mentor can tailor what they’re teaching to the exact stage of the project.”
In practice, the most effective mentored implementation projects create multiple layers of support for both the mentor and the participant. SHM’s mentored implementation programs include online resource rooms on the topic (e.g., glycemic control or hospital discharge) and collaboration between participants. Rather than being just repositories of information on the subject, SHM’s resource rooms are roadmaps for new programs.
“SHM’s resource rooms define an intervention that can be implemented,” says Geri Barnes, SHM’s senior director of education and meetings.
Those resources, plus ongoing guidance from mentors, help hospitalists implement QI programs at their hospitals. Many hospitalists are early in their careers and benefit from all of the resources available. The energy that early-career hospitalists bring to QI is one of the key components the program harnesses, Kerr says.
“Junior staff are really motivated to do things in their scope, but there aren’t really a lot of mid-career local mentors” who can provide the guidance they need, Kerr says.
Training Days
Given SHM’s focus on QI and the relative youth of both HM as a specialty and hospitalists in relation to their peers, the mentored implementation model seems particularly suited to hospitalists. Launched in 2007, the VTE Prevention Collaborative was SHM’s first mentored implementation program. It was designed to help hospitalists create custom programs to prevent VTE. The collaborative included mentors, an online resource room, and on-site consultations with experts.

—Kendall Rogers, MD, University of New Mexico Health Science Center School of Medicine, Albuquerque
SHM created Project BOOST (Better Outcomes for Older adults through Safe Transitions) in 2008. Project BOOST began with six pilot sites and has now expanded to 30 sites. Each hospital site can participate in daylong training sessions and yearlong mentorships. Sites also receive the Project BOOST implementation guide from SHM’s resource room. Since it was posted in July 2008, more than 250 hospitals have downloaded the guide.
In 2009, SHM and hospitalists are teaming up in 30 different sites across the country to improve early detection and treatment of hyperglycemia in hospitalized patients through the Glycemic Control Mentored Implementation program. Each participant in the two-year program receives a toolkit, access to Web-based resources, and is assigned a mentor to guide implementation.
MI 2.0
Despite early successes with SHM’s mentored implementation programs, those closest to them acknowledge there is room for improvement. Among a host of factors is the success of the next generation of programs, which will hinge on the idea’s scalability.
“We’re looking at testing models where we have a one-to-one mentoring program, compared to a one-to-five mentoring program,” says Jane Kelly-Cummings, RN, CPHQ, SHM’s senior director of quality initiatives.
Kerr also sees opportunities to expand the scope without sacrificing the customized approach. “We are looking for ways to expand the reach of each individual effort. Right now, customization means that mentored implementation is more like building a Ferrari than a Ford,” she says. “We need to do some ‘train the trainer’ models and explore ways to reach more hospitals simultaneously.”
For Dr. Rogers, his experience with mentored implementation and QI has strengthened his resolve to help hospitalists get it right.
“We have a lot to learn to do this effectively. We have 5,000 hospitals out there and hospitalists are naturally looked at as leaders within the institution,” he says. “The failure of one hospitalist quality-improvement program affects all of us, so success is key. This is one of the most effective tools for doing it.” TH
Brandon Shank is a freelance writer based in Philadelphia.
Letters
The Unique Potential of Hospitalists as Leaders in Healthcare Reform
The usual first response when a physician is asked, “Why do you practice medicine?” is “to help people.” This is especially true for younger practitioners. A frequent second response is “I like the independence.” As physicians, we enjoy being our own boss and calling the shots.
Chapter Updates
New Jersey

ISTOCKPHOTO.COM
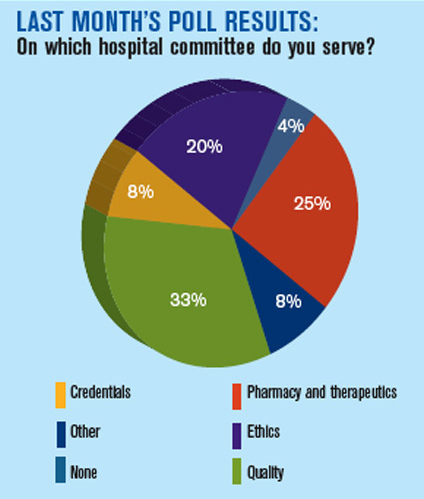
The New Jersey chapter met Sept. 10 at Fiorino’s Restaurant in Summit. The meeting consisted of two discussions: the safe use of anticoagulation to reduce the likelihood of harm, and the current state of healthcare and how it will impact the hospitalist. There were 27 attendees from five HM groups in attendance.
Western Massachusetts

/ISTOCKPHOTO.COM
The Western Massachusetts chapter met June 11 at Zen Restaurant in Northampton. The meeting included a dinner lecture by Richard Zuwallack, MD, FACCP, associate chief of pulmonary diseases at St. Francis Hospital in Hartford, Conn. His talk was titled “Optimizing the Management of COPD.” A discussion followed his presentation. Hospitalists from three local hospitals attended.
Therein rests the cultural healthcare quandary. Physicians need to accept the fact that standardization of medicine is going to happen, as it allows for improved efficiencies with a resultant decrease in healthcare expenditures. Yet the independent and entrepreneurial nature of physicians has caused them to resist the standardization of medicine for years. After all, while one fellow physician might treat a disease or perform a procedure differently than another, as long as it is efficacious, we all believe our peers should be able to practice the way they want.
Hospitalists are no different, as they are independent, too. They are simply working under the hospital umbrella. This relationship of working in hospitals positions HM practitioners, as a group, to be central players in the healthcare reform debate. This truly is a unique opportunity.
Looking demographically at the generational makeup of all physicians, we have four familiar groups represented: baby boomers, Gen X’ers, Gen Y’ers, and millennials. There are certain broad yet defining characteristics of these four generational groups. The baby boomers, being the offspring of the World War II generation, the generation that rebuilt the world and kept their “nose to the grindstone,” are defined by their work ethic. Simply put, boomers live to work. As children and students of the 1960s, they also value individuality.
Gen X’ers focus more on themselves, and often are referred to as the “me generation.” They expect to have a range of choices within their expression of individuality.
Gen Y’ers have a different work ethic, one their managers often find alarming. They are defined by the adage “work to live.” This dilemma, while difficult for their managers, allows Gen Y’ers to adapt to workplace practices, as their individuality is no longer of primary concern. After all, “it is only work.”
Millennials, having been brought up in the digital age, are bombarded with information and entertainment 24 hours a day. From birth on, they have heard that the future is uncertain. Demographically, they are more aligned with the work ethic of their great-grandparents, the World War II generation, and they are more willing to serve the common good. Thus, millennials, like Generation Y, are less individualistic and more willing to adapt to the work environment.
In considering hospitalists and their roles in the current healthcare debate and medical standards, this young specialty is uniquely poised to implement the upcoming standardizations required for three reasons. First, HM has an unusually large representation of Gen Y’ers and millennials—more than other medical specialties. These younger physicians, with their adaptability for the common good, are less resistant to the standardization of medicine.
Second, unlike most practitioners, hospitalists tend to practice in larger medical groups. Thus, they are familiar with standardization and the uniformity necessary for the group to practice effectively.
Third, with the Centers for Medicare and Medicaid Services (CMS) adopting the experimental payment mechanism known as value-based purchasing, hospitals will insist on standardization to maximize reimbursement.
The benefits to HM practitioners are twofold. The hospitalist will share in reimbursement of pay-for-performance, thereby gaining a financial incentive for the greater efficiencies that standardization yields. This is evidenced by the trend that hospitalist contracts are increasingly based on pay-for-performance, rather than payment based on relative value units.
The second benefit, and perhaps the most important, is that the influence and power of hospitalists will greatly increase, particularly in formulating the standards of medical treatment, procedures, and, more importantly, QI and patient safety.
As the practice of HM matures from infancy into adolescence, recognizing the opportunity at hand and deciding how to proceed is paramount to its future position and existence.
Michael G. Cassatly, DMD
Certified business coach,
American Board of Oral and Maxillofacial Surgery diplomate
When Kendall Rogers, MD, signed up for his first mentored implementation project, he remembers being skeptical. After all, it seemed too good to be true. “I wanted to ask, ‘What’s the catch? Are you trying to get us to adopt a certain practice?’ ” says Dr. Rogers, a hospitalist at the University of New Mexico Health Science Center School of Medicine in Albuquerque.
Now, after participating in SHM’s Venous Thromboembolism (VTE) Prevention Collaborative and later mentoring other hospitalists in SHM’s Glycemic Control Mentored Implemen-tation (GCMI) program, he understands the motivation.
“Mentored implementation is unique in that it accomplishes two goals,” he says. “It improves the nuts and bolts of a project, and it also creates new hospitalist leaders and quality-improvement [QI] experts.”
Prior to his work in the VTE Prevention Collaborative, Dr. Rogers had little exposure to QI programs. He has since implemented a VTE prevention program at his hospital, and his mentorship of hospitalists in the GCMI program is helping to create custom programs to optimize glycemic control protocols. He also is a faculty member for SHM’s QI and patient-safety pre-course and is leading SHM training sessions on VTE prevention.
The mentored implementation model, he says, is an effective way to get over many of the daunting roadblocks that can stand in the way of a hospitalist-led QI program. “Many people need that spark,” Dr. Rogers says. “This is a highly effective way to be that spark. I’ve seen too many people get disillusioned and frustrated with quality-improvement programs and give up. In these programs, the mentor can help identify and address roadblocks.”
What is Mentored Implementation?
In theory, mentored implementation is a unique and simple approach to both education and QI in healthcare. At its core, mentored implementation is the pairing of a program participant with a subject-matter expert who already has been involved in similar programs and will help the participant implement a QI program of their own.
The concept is new to QI initiatives. Although SHM has embraced the idea, mentored implementation programs first started at the Center to Advance Palliative Care in New York City, says Kathleen Kerr, SHM’s program manager for mentored implementation programs and senior research analyst in the Department of Medicine at the University of California at San Francisco. The model is an alternative to more traditional educational approaches that rely exclusively on lectures or educational sessions.
“You could sit in a session and it’s very valuable, but also very different from actually doing it,” Kerr says. “It’s hard to process so much information in a session. You don’t understand the complexity of something like gathering data until you’re actually doing it. The mentor can tailor what they’re teaching to the exact stage of the project.”
In practice, the most effective mentored implementation projects create multiple layers of support for both the mentor and the participant. SHM’s mentored implementation programs include online resource rooms on the topic (e.g., glycemic control or hospital discharge) and collaboration between participants. Rather than being just repositories of information on the subject, SHM’s resource rooms are roadmaps for new programs.
“SHM’s resource rooms define an intervention that can be implemented,” says Geri Barnes, SHM’s senior director of education and meetings.
Those resources, plus ongoing guidance from mentors, help hospitalists implement QI programs at their hospitals. Many hospitalists are early in their careers and benefit from all of the resources available. The energy that early-career hospitalists bring to QI is one of the key components the program harnesses, Kerr says.
“Junior staff are really motivated to do things in their scope, but there aren’t really a lot of mid-career local mentors” who can provide the guidance they need, Kerr says.
Training Days
Given SHM’s focus on QI and the relative youth of both HM as a specialty and hospitalists in relation to their peers, the mentored implementation model seems particularly suited to hospitalists. Launched in 2007, the VTE Prevention Collaborative was SHM’s first mentored implementation program. It was designed to help hospitalists create custom programs to prevent VTE. The collaborative included mentors, an online resource room, and on-site consultations with experts.
—Kendall Rogers, MD, University of New Mexico Health Science Center School of Medicine, Albuquerque
SHM created Project BOOST (Better Outcomes for Older adults through Safe Transitions) in 2008. Project BOOST began with six pilot sites and has now expanded to 30 sites. Each hospital site can participate in daylong training sessions and yearlong mentorships. Sites also receive the Project BOOST implementation guide from SHM’s resource room. Since it was posted in July 2008, more than 250 hospitals have downloaded the guide.
In 2009, SHM and hospitalists are teaming up in 30 different sites across the country to improve early detection and treatment of hyperglycemia in hospitalized patients through the Glycemic Control Mentored Implementation program. Each participant in the two-year program receives a toolkit, access to Web-based resources, and is assigned a mentor to guide implementation.
MI 2.0
Despite early successes with SHM’s mentored implementation programs, those closest to them acknowledge there is room for improvement. Among a host of factors is the success of the next generation of programs, which will hinge on the idea’s scalability.
“We’re looking at testing models where we have a one-to-one mentoring program, compared to a one-to-five mentoring program,” says Jane Kelly-Cummings, RN, CPHQ, SHM’s senior director of quality initiatives.
Kerr also sees opportunities to expand the scope without sacrificing the customized approach. “We are looking for ways to expand the reach of each individual effort. Right now, customization means that mentored implementation is more like building a Ferrari than a Ford,” she says. “We need to do some ‘train the trainer’ models and explore ways to reach more hospitals simultaneously.”
For Dr. Rogers, his experience with mentored implementation and QI has strengthened his resolve to help hospitalists get it right.
“We have a lot to learn to do this effectively. We have 5,000 hospitals out there and hospitalists are naturally looked at as leaders within the institution,” he says. “The failure of one hospitalist quality-improvement program affects all of us, so success is key. This is one of the most effective tools for doing it.” TH
Brandon Shank is a freelance writer based in Philadelphia.
Letters
The Unique Potential of Hospitalists as Leaders in Healthcare Reform
The usual first response when a physician is asked, “Why do you practice medicine?” is “to help people.” This is especially true for younger practitioners. A frequent second response is “I like the independence.” As physicians, we enjoy being our own boss and calling the shots.
Chapter Updates
New Jersey
ISTOCKPHOTO.COM
The New Jersey chapter met Sept. 10 at Fiorino’s Restaurant in Summit. The meeting consisted of two discussions: the safe use of anticoagulation to reduce the likelihood of harm, and the current state of healthcare and how it will impact the hospitalist. There were 27 attendees from five HM groups in attendance.
Western Massachusetts
/ISTOCKPHOTO.COM
The Western Massachusetts chapter met June 11 at Zen Restaurant in Northampton. The meeting included a dinner lecture by Richard Zuwallack, MD, FACCP, associate chief of pulmonary diseases at St. Francis Hospital in Hartford, Conn. His talk was titled “Optimizing the Management of COPD.” A discussion followed his presentation. Hospitalists from three local hospitals attended.
Therein rests the cultural healthcare quandary. Physicians need to accept the fact that standardization of medicine is going to happen, as it allows for improved efficiencies with a resultant decrease in healthcare expenditures. Yet the independent and entrepreneurial nature of physicians has caused them to resist the standardization of medicine for years. After all, while one fellow physician might treat a disease or perform a procedure differently than another, as long as it is efficacious, we all believe our peers should be able to practice the way they want.
Hospitalists are no different, as they are independent, too. They are simply working under the hospital umbrella. This relationship of working in hospitals positions HM practitioners, as a group, to be central players in the healthcare reform debate. This truly is a unique opportunity.
Looking demographically at the generational makeup of all physicians, we have four familiar groups represented: baby boomers, Gen X’ers, Gen Y’ers, and millennials. There are certain broad yet defining characteristics of these four generational groups. The baby boomers, being the offspring of the World War II generation, the generation that rebuilt the world and kept their “nose to the grindstone,” are defined by their work ethic. Simply put, boomers live to work. As children and students of the 1960s, they also value individuality.
Gen X’ers focus more on themselves, and often are referred to as the “me generation.” They expect to have a range of choices within their expression of individuality.
Gen Y’ers have a different work ethic, one their managers often find alarming. They are defined by the adage “work to live.” This dilemma, while difficult for their managers, allows Gen Y’ers to adapt to workplace practices, as their individuality is no longer of primary concern. After all, “it is only work.”
Millennials, having been brought up in the digital age, are bombarded with information and entertainment 24 hours a day. From birth on, they have heard that the future is uncertain. Demographically, they are more aligned with the work ethic of their great-grandparents, the World War II generation, and they are more willing to serve the common good. Thus, millennials, like Generation Y, are less individualistic and more willing to adapt to the work environment.
In considering hospitalists and their roles in the current healthcare debate and medical standards, this young specialty is uniquely poised to implement the upcoming standardizations required for three reasons. First, HM has an unusually large representation of Gen Y’ers and millennials—more than other medical specialties. These younger physicians, with their adaptability for the common good, are less resistant to the standardization of medicine.
Second, unlike most practitioners, hospitalists tend to practice in larger medical groups. Thus, they are familiar with standardization and the uniformity necessary for the group to practice effectively.
Third, with the Centers for Medicare and Medicaid Services (CMS) adopting the experimental payment mechanism known as value-based purchasing, hospitals will insist on standardization to maximize reimbursement.
The benefits to HM practitioners are twofold. The hospitalist will share in reimbursement of pay-for-performance, thereby gaining a financial incentive for the greater efficiencies that standardization yields. This is evidenced by the trend that hospitalist contracts are increasingly based on pay-for-performance, rather than payment based on relative value units.
The second benefit, and perhaps the most important, is that the influence and power of hospitalists will greatly increase, particularly in formulating the standards of medical treatment, procedures, and, more importantly, QI and patient safety.
As the practice of HM matures from infancy into adolescence, recognizing the opportunity at hand and deciding how to proceed is paramount to its future position and existence.
Michael G. Cassatly, DMD
Certified business coach,
American Board of Oral and Maxillofacial Surgery diplomate
A-Plus Achievement
Timing is everything. Christopher Columbus, Abraham Lincoln, Harry Truman … each benefited from perfect timing and, in turn, helped change the course of history.
HM has had great timing, too. With numbers now estimated at more than 30,000 hospitalists nationwide, HM is systematically changing the way patients are cared for in the hospital. The maturation process is equally evident. In less than two decades, HM has organized annual meetings, developed educational programs, established a peer-reviewed journal, and published core competencies.
The next step in the evolutionary process: the Recognition of Focused Practice (RFP) in Hospital Medicine through the American Board of Internal Medicine’s (ABIM) maintenance of certification (MOC) program. Registration for the RFP in HM should be available by May 2010, with the first MOC in fall 2010.
“The timing is perfect. It’s appropriate,” says Robert Wachter, MD, FHM, chief of the hospital medicine
division, professor, and associate chair of the Department of Medicine at the University of California at San Francisco, a former SHM president, and author of the blog Wachter’s World. “We knew we needed to ripen and mature. It’s like watching your child growing up: their first steps, first day of school, graduating high school. This has a lot of the same feeling. This is one more statement that the field is real, here to stay, and vitally important to medicine.”
The new pathway to board recertification is as meaningful to HM’s founding fathers as it will be to the next generation of hospitalists. It represents validation to physicians who have chosen a career in HM, and it offers early-career physicians a specialized path to recertification. Moreover, hospitalists agree the RFP in HM provides accountability to the profession and patients.
“Hospitalists must be able to exhibit clinical competence in the areas of patient safety, quality, and clinical care transitions,” says Jeff Wiese, MD, FACP, FHM, associate dean of Graduate Medical Education and professor of medicine at Tulane University in New Orleans, SHM president-elect, and chair of the ABIM Hospital Medicine Maintenance of Certification Question Writing Committee. “Everything is driving at those issues. Individuals who go through the four parts of this certification will be able to say to their patients, with confidence, that one, they are a competent internist knowledgeable in hospital-based care, and two, they are an expert in patient safety, quality, and transitions of care.”
ABIM, for its part, expects to learn from this “new paradigm,” says Eric Holmbloe, MD, ABIM’s senior vice president and chief medical officer.
“The major change is the ability to implement the concept of a focused practice. It’s the first time, and it does recognize that the world has changed,” Dr. Holmbloe says, noting his group is “working feverishly” to complete the examination and build the online infrastructure needed for testing. “For those individuals whose [certificates] expire in 2010 or 2011, this is a viable pathway for recertification.”
Satisfaction Guaranteed
Ask any long-in-the-tooth hospitalist what the RFP in HM means to them, and more often than not the answer centers on professional self-regulation and career validation. Few will argue the specialty has, at times, suffered from an identity crisis. Sans fellowships, specialized training, or a particular organ to hang their hat on, HM physicians have labored to carve their niche and gain a seat at the specialist’s table.
The RFP in HM, many hospitalists envision, solves a number of those acceptance-related issues (see “Certified Special,” p. 53). Most importantly, it identifies physicians who have chosen to make HM their career.
“Hospitalists have always struggled, especially in academic settings,” says Scott Flanders, MD, FHM, SHM president, associate professor and director of the hospitalist program at the University of Michigan Health System in Ann Arbor. “I think this is a major, major moment for the field. It validates the field, and the belief that HM is a positive [for medicine].”
The new designation likely has greater meaning to older HM physicians, those who remember the early days of society formation (i.e., the National Association of Inpatient Physicians) and annual meeting attendance in the hundreds, not thousands.
“With the older docs, validation is particularly meaningful,” says Dr. Wachter, who, along with Lee Goldman, MD, first coined the term “hospitalist” in a 1996 article in the New England Journal of Medicine.1 “Paradoxically, most of the older physicians don’t have to take this test.”
That might be true, but only a small percentage of the 30,000-plus hospitalists in the U.S. are grandfathered into time-unlimited IM certificates. ABIM began time-limited certificates in 1990. The average hospitalist is 40, according to SHM’s “2007-2008 Bi-Annual Survey on the State of the Hospital Medicine Movement.”
John Nelson, MD, doesn’t have to recertify, but the co-founder of SHM is planning to be among the first to take the test. “It’s the first way hospitalists will be able to show their competence,” says Dr. Nelson, FACP, FHM, past president of SHM, and a principal in the national practice management firm Nelson Flores Hospital Medicine Consultants. A regular contributor to The Hospitalist, Dr. Nelson says the RFP in HM “will help people take our field more seriously.”
Inclusive of IM
The RFP in HM pathway is not a way to distance hospitalists from their internal medicine (IM) training and certification. Nearly 85% of hospitalists are IM-trained, according to SHM’s 2007-2008 bi-annual survey, and clinical competence as an internist will be a requisite for recertification through the new ABIM test.
“HM is borne of internal medicine … and has evolved to something unique. Therefore, your credentials should reflect that uniqueness,” says Larry Wellikson, MD, FHM, CEO of SHM. “This [process] is going to make the whole maintenance of certification process more relevant to hospitalists. This is recognition that hospitalists should be accountable for learning new things after they complete their formal training—things not emphasized in training like patient safety, quality, and care transitions.”
The language used on ABIM’s Web site to announce the new testing program furthers the message: “ABIM is developing a program to assess, set standards for, and recognize the proficiency of general internists who focus their practice in the care of hospitalized patients. The board’s decision to advance this program is consistent with its primary role of certifying internal-medicine physicians who meet the profession’s standards for focused practice in internal medicine.”
In addition to quality, patient safety, and transitions, “accountability to the patient” is a popular catchphrase used by members of the committee dedicated to writing the new certification test. Licensure and certification provide public accountability to patients, colleagues, and stakeholders, says Dr. Wiese. What differentiates career hospitalists from those making a pit stop during an alternate career path is increased accessibility to patients, expertise in patient safety and quality initiatives, and knowledge of clinical care transitions, he explains.
“Everything is driving at those issues,” he says. “From the beginning, there has been no agenda to change residency training. Any information contrary is a complete myth. Principle No. 1 is that you have to be competent internist. This new [MOC process] is much closer to an MBA.”
How hospitalists who are recertifying through the RFP in HM will refer to themselves remains up for debate. Although some physicians might say they are “board-certified in hospital medicine,” Dr. Wachter hopes hospitalists will use the phrase “board-certified in internal medicine with a recognized focused practice in hospital medicine.” “I hope to think our physicians will still say ‘IM,’ ” he says. “The goal here is not to sever ties with IM. That is a concern.”
Dr. Wiese, who, along with Dr. Wachter and other members of the test-writing committee, was required to complete the IM maintenance of certification (MOC), envisions a four-part process (see “Board Certification, With a Healthy Dose of HM,” p. 31) that challenges hospitalists in the core competencies of hospital-based practice.
“The [IM] recertification was the one test in my career that made me a better physician. I think this HM examination is going to be the same way,” Dr. Wiese says. “I want hospitalists to say, ‘When I go back to take care of my patients, they’ll be better off for it.’ ”
Target Audience
Dr. Flanders has about 40 hospitalists in his HM group at the University of Michigan. Although he recertified in IM in 2006, he knows many of his hospitalists are itching to take ABIM’s new HM-focused test. “They will be thrilled. They have all said to me that we can’t get this done fast enough,” he says, noting three or four of his hospitalists probably will recertify through the new test in fall 2010. “Our field is young; I suspect there are a lot of hospitalists out there who are within the 10-year window for recertification. I plan to do it at my next MOC … and that date could be moved up the way things are going.”
Dr. Wachter agrees the RFP in HM is an “attractive” option to hospitalists, especially those whose recertification is looming in the next two or three years. This MOC, he explains, “offers a pathway that is more in sync with the medicine [they are practicing] day in and day out.”
ABIM plans to have comprehensive information about the process available on its Web site (www.abim.org) this month and online registration available in May 2010 (see “FAQs,” left). While the test-writing committee finishes its tasks, Dr. Holmbloe says, ABIM’s systems department is working to build the online infrastructure. The first RFP in HM tests should go live in fall 2010.
“For those individuals [whose certificates] expire in 2010 or 2011, this is a viable pathway for recertification. If HM is their passion, this is for them,” Dr. Holmbloe says. “The major change, from ABIM’s perspective, is the ability to implement the concept of a focused practice. It’s the first time, a new paradigm. This does recognize that the world has changed.”
Crash Course
Every physician, sometime in his or her career, has crammed for a test. ABIM, however, recommends physicians start this process two or three years before their certificate expires. That timetable might work for some hospitalists, not so much for others. In any event, Dr. Flanders says hospitalists can count on SHM to help them prepare for the HM-specific examination.
“SHM has to help develop the tools and resources hospitalists will need to successfully prepare for and pass this test,” he says. He expects educational resources and self-assessment modules will be available on SHM’s Web site (www.hospitalmedicine.org) and at HM10, April 8-11 in Washington, D.C.
Dr. Wellikson says MOC preparedness “should match [SHM’s] educational projects,” and his staff “will continue to develop” tools and resources to assist hospitalists. He also recognizes the moment: the notch on HM’s evolutionary timeline where a once-fledgling group of inpatient physicians helped chart a new course for American medicine.
“Obviously, 10 years ago was too early. Now there are 30,000 hospitalists. Many of them are making HM a career. It’s evolving as a discipline,” Dr. Wellikson says. “We’ve moved beyond the idea of HM to the reality of HM.” TH
Jason Carris is editor of The Hospitalist.
Reference
- Wachter RM, Goldman L. The emerging role of “hospitalists” in the American health care system. N Engl J Med. 1996;335(7):514-517.
Image Source: PORCOREX/ISTOCKPHOTO.COM
Medical Mistakes, 10 Years Post-Op
It’s November 1999, and the release of an advance copy of a breakthrough Institute of Medicine (IOM) report on patient safety provokes headlines around the world with its estimate that as many as 98,000 people per year die from medical errors in U.S. hospitals. The report and subsequent book, To Err is Human: Building a Safer Health System, already is labeled a landmark event for modern medicine.1 It launches a nationwide effort to systematically improve patient safety and reduce errors.
Believe it or not, the IOM report celebrates its 10th anniversary this month. Many healthcare leaders point out that the QI and patient-safety revolution birthed by the IOM report has paralleled the simultaneous—and seismic—growth of HM.
The IOM report drew upon data from Harvard Medical Practice Studies and other existing research for its shocking estimates of error-induced deaths. The report, to a large degree, focused on prescribing errors, with less emphasis on hospital-acquired infections and other safety and quality issues that have emerged since its publication. The report also proposed a comprehensive safety strategy for government, industry, consumers, and healthcare providers—a proposal that has been adopted only in pieces.
In commemorating the 10th anniversary of the IOM report, industry leaders agree that HM more than any other medical specialty will continue to play a leading role in pushing the quality and patient-safety agenda in hospitals throughout America.
IOM’s Committee on Quality of Healthcare in America, which was made up of physicians, researchers, and healthcare leaders, authored the breakthrough report on medical errors, and followed up two years later with Crossing the Quality Chasm: A New Health System for the 21st Century (www.iom.edu/?id=12736).2
The Hospitalist caught up with two of the original committee members, Donald Berwick, MD, MPP, FRCP, president and CEO of the Institute for Healthcare Improvement (IHI), and Christine Cassel, MD, president and CEO of the American Board of Internal Medicine (ABIM), to discuss how far medicine has come—and how far it has to go—in the areas of hospital quality and patient safety.

—Christine Cassel, MD, president, CEO, American Board of Internal Medicine, Philadelphia
Question: What is the legacy of the IOM report?
Dr. Berwick: It didn’t launch the patient-safety movement, but it was the most important single contributor to that movement. In one step, it took the focus on safety as a goal in medicine from a relatively fringe concern to a central issue, and a central task for health providers.
Its most important element was the focus on systems improvement, rather than exhortations to individual health professionals to do a better job with patient safety. It is a cultural norm to blame someone when something goes wrong. That hasn’t changed fundamentally. But the IOM report made the point that it’s not people who are to blame for problems in patient safety, and blame won’t get us where we need to go.
HM Jumps into Quality and Patient Safety with Both Feet

An incredible, happy coincidence: That is how Robert Wachter, MD, FHM, explains the paralleled growth of HM and patient-safety awareness in U.S. hospitals. HM had “just emerged in the mid-1990s and was still figuring out what it was about when the IOM report [To Err is Human] was published,” says Dr. Wachter, chief of the hospital medicine division, professor and associate chair of the Department of Medicine, the University of California at San Francisco, former SHM president and author of the blog “Wachter’s World,” noting concerns at the time that HM would be branded as a cost-saving measure for hospitals and health plans.
“I remember vividly when the IOM report came out. A light bulb went off for me—what a spectacular opportunity for our field,” the well-known HM pioneer recalls. “Here was this huge report saying patient safety stinks and needs to be fixed. I was pretty sure other medical specialties would not welcome the findings. I and other hospitalist leaders pushed very hard to say ‘we own this’—we believe the report is true and we believe it requires a new kind of physician who believes in systems thinking, teamwork, and collaboration. I still think it was a good call for hospital medicine to jump with both feet into the quality and safety field.”
The IOM report sparked a patient-safety renaissance, Dr. Wachter says. “We recognized that there is a science here—a core knowledge, a way of thinking and an understanding that we were not going to make much progress on patient safety until we understood that knowledge, learned its science, and did the research. We have since learned that fixing patient safety is tricky, and yet as you scan the landscape, you see all of the important actors are doing something to make patient care safer.”
One of the first steps to fixing the problem is “owning up” to the fact people die because of medical mistakes. Hospitals’ willingness to adopt transparency, from the first floor to the C-suite, has changed in the past decade, Dr. Wachter says.
“We have created an environment where we’re on the path to getting safer,” he says. “We’re much more open and honest about errors. We attack them with root-cause analysis and find better ways to fix the problem. For me, that’s all healthy. It leaves me with great confidence that things are safer in American hospitals than they were 10 years ago—although certainly not as safe as they need to be.”—LB
Q: How do you rate the impact of To Err is Human on the medical industry as a whole?
Dr. Cassel: The Agency for Healthcare Research and Quality, five years after the IOM report, said we hadn’t made enough progress. We have, most importantly, been able to talk about it and understand some of the approaches to safety and quality. But that’s not nearly enough, in my opinion.
Dr. Berwick: I’d give it a C-minus. There has been a change in awareness of medical safety. Before the IOM report, you just didn’t hear about it. A scientific basis for the statement of the problem was created, and we can never go back. Prototypes of what could be achieved have started to emerge, not just in this country but worldwide. The problem is that the success is just in pockets—not fundamental change in the nature of the American healthcare industry. That level of execution just is not there yet. Now it’s game time—time to take safety and quality mainstream.
Q: In retrospect, what was missed in the report?
Dr. Berwick: If we missed any boat in our analysis, the idea of “no blame” is not meant to relieve everyone of responsibility for medical errors, but to relocate responsibility for safety in the offices and work of leaders of healthcare institutions. The finger points to the executive suite. There’s more and more evidence that safety does not improve without the clear commitment of leaders.
Dr. Cassel: When we think about how we train doctors, which I spend a lot of time doing, they just aren’t trained to think of root-cause analysis or how to work in teams to reduce errors. That needs to change. ABIM’s new pathway for hospitalists, which will be rolled out in another year or so (see “A-Plus Achievement,” p. 1), treats questions of how … to identify patient-safety issues as core knowledge.
Q: What is the relationship of the patient-safety movement to the hospitalist movement?
Dr. Cassel: The development and growth of patient safety has paralleled the growth of hospital medicine, and I think that’s a good thing. Most of the literature on available errors focuses on the hospital because that’s the easiest place to find numbers of patients and shine a light on safety. Specialists in hospital medicine have a unique opportunity and responsibility to be leaders in continuing to advance the cause of patient safety.
Q: What should HM’s patient-safety agenda look like going forward?
Dr. Berwick: No. 1, aim for zero. There are types of injuries and infections that can be nearly eliminated in the hospital. When you look at safety-oriented efforts in other industries, they strive to get to the point where they’re no longer talking about ratios, only numerators (how many actual incidents).
Second is to broaden the focus from safety to all the other dimensions of quality. Think about reliability, processes and performance across the board.
Third is to be authentic about teamwork across professions. In the medical culture at large, there still is too much focus on turf issues between doctors and nurses. I believe in the long run new safety initiatives will be fostered by teams working at unprecedented levels of collaboration, reaching across traditional boundaries.
Dr. Cassel: The issue of diagnostic error is also emerging as another kind of medical error.
In order for patients to get the right treatment, they need to get the right diagnosis. That’s where all of your medical training, knowledge, and judgment come into play. For ABIM, that’s how we evaluate physicians’ judgment.
The next frontier in patient safety is the handoff, from ambulatory to hospital and back, but also with long-term care, which is a black box. An enlightened and energetic hospitalist movement could decide to take that issue on.
Where it would happen is at the community level, although some of the healthcare reform legislation includes ideas about innovation zones and how to create payment mechanisms to support continuity of care. TH
Larry Beresford is a freelance writer based in Oakland, Calif.
References
- Kohn LT, Corrigan JM, Donaldson MS, et al. To Err Is Human: Building a Safer Health System. Washington, D.C.: National Academies Press, 2000.
- Institute of Medicine Committee on Quality Health Care in America. Crossing the Quality Chasm: A New Health System for the 21st Century. Washington, D.C.: National Academies Press, 2001.
- Moser R. Diseases of Medical Progress: A Contemporary Analysis of Illnesses Produced by Drugs and Other Therapeutic Procedures. Springfield, Ill.: Charles C. Thomas, 1959.
- Reason, J. Human Error. Cambridge, England: Cambridge University Press, 1990.
- Leape LL. Error in medicine. JAMA. 1994;272(23):1851-1857.
- United Kingdom Department of Health. An Organisation with a Memory. 2000.
- Jerrard J. No fee for errors. The Hospitalist. 2008;(5):18.
- Pronovost PJ, Berenholtz SM, Goeschel C, et al. Improving patient safety in intensive care units in Michigan. J Crit Care. 2008;23(2):207-221.
The Evolution of Patient Safety
Key milestones in the patient-safety and medical QI movement:


1980s-1990s - Various medical errors result in high-profile patient deaths, including that of Libby Zion at New York Hospital in 1984 and Betsy Lehman at the Dana-Farber Cancer Institute in Boston in 1994. The deaths keep medical errors in the headlines.

1990 - James Reason’s Human Error describes his theory of error as systems failure.3 It is undiscovered by healthcare until …
1994 - … Lucien Leape’s article “Error in Medicine” is published in the Journal of the American Medical Association, drawing upon advances in error prevention from fields other than medicine.4
1999- The Institute of Medicine releases its landmark patient safety report, To Err Is Human.

2001 - Congress establishes the Agency for Healthcare Research and Quality (AHRQ) to begin an aggressive patient-safety research and improvement program.

2002 - The Joint Commission releases its first National Patient Safety Goals.
2004 - The federal government creates the Office of the National Coordinator for Healthcare Information Technology to promote systems improvements in the medical industry.
2005 - The Institute for Healthcare Improvement’s 100,000 Lives campaign begins; it encourages hospitals to adopt basic steps to reduce harm and deaths.
2006 - The National Quality Forum issues its list of “never events,” 28 medical errors that should never occur in hospitals.6

2009 - The American Recovery and Reinvestment Act passes Congress and is signed by President Obama. It contains $19 billion for advancing healthcare information technology.
Source: Adapted from Wachter, R. Understanding Patient Safety (Lang Clinical Medicine), McGraw-Hill: 2007, Appendix III, Selected Milestones in the Field of Patient Safety, p. 280-281, which was adapted from sources including Vincent C. Patient Safety. London; Elsevier, 2006; and Sharpe VA, Faden AI. Medical Harm: Historical, Conceptual, and Ethical Dimensions of Iatrogenic illness. New York: Cambridge University Press, 1998.
Image Sources: DNY59, ZEFFSS1, AYZEK, DON BAYLEY, BECKY REED/ISTOCKPHOTO.COM
HM Leaders Weigh In
Question 1: What was hospital medicine’s contribution and role in the patient-safety movement that ensued following the IOM report?

“I believe that hospitalists have been integral to improving patient safety and reducing medical errors in those hospitals. Patients are safer and better off if there is a physician in the house ready to respond should patients have a change in health status. Hospitalists see the hospital as their office, if you will, and they focus not only on treating the patient in the bed, but treating the hospital itself by becoming engaged with quality improvement and patient-safety initiatives that improve the system of care.”—Mark Williams, MD, FHM, chief, division of hospital medicine, Northwestern University Feinberg School of Medicine, Chicago; SHM past president; editor of the Journal of Hospital Medicine

“The role hospital medicine has filled has been as a major supplier of physicians to quality-improvement teams and other hospital teams at the front lines, prior to which physicians were conspicuously absent. If you look, for example, at nurses and other healthcare professionals, they came to the party much earlier than we did. Physicians have only recently on a broad scale become involved on these teams, and I think the major contributors have been hospitalists.”—Winthrop Whitcomb, MD, FHM, director of performance improvement, Mercy Medical Center, Springfield, Mass.; SHM co-founder

“There was a tremendous kind of synergy where hospital medicine was defining itself by its focus on systems of care, safety culture, error reporting, collaboration, interdisciplinary teams and so forth. The IOM report did a beautiful job of taking the knowledge and literature, not just from within medicine but more importantly from outside, and showing how a lot of those concepts that had been implemented successfully elsewhere were lacking in medicine in general. That really just teed it up for hospital medicine to take the impetus and framework IOM supplied and use it as a rubric for what hospital medicine could do for its part of the health system.”—Russ Cucina, MD, assistant professor of medicine and associate medical director for information technology, University of California at San Francisco
Question 2: What is the most important unfinished business for hospitalists regarding the patient-safety movement?
“I think we have made tremendous strides but there is much more to do. Although we have pockets of success, what we need to do is make those successes more uniform, so they happen in every hospital, not just some hospitals that have the right hospitalist leader or the right skill set or the right culture. We want to create the right culture and skill set and team in every hospital, and one of our challenges at SHM is to work on a mentoring program for hospitalists. That means using those who have been successful to mentor other sites and bring them on board to reproduce and replicate the good work.”—Janet Nagamine, MD, FHM, hospitalist, Kaiser Permanente Medical Center, Santa Clara, Calif.; SHM Hospital Quality/Patient Safety Committee chairwoman

“The patients who enter hospitals today are incredibly sick, with multiple organ failures and other complications. Taking care of these patients is incredibly challenging, and there are always going to be things that do not go well. Hospitalists have begun to uncover and tackle a lot of these problems, but even as they eliminate one problem, new treatments, devices, procedures and strategies for caring for patients—all designed to improve care—may have unintended consequences. It is hospitalists’ job to try to mitigate those consequences and redesign the strategies to continue to improve outcomes. But this is a long road—a marathon, not a sprint.”—Scott Flanders, MD, FHM, director of the hospitalist division, University of Michigan Health System, Ann Arbor; president of SHM

“The greatest area of unfinished business I see is preserving continuity of care for our patients as they transition in and out of the hospital. So much is happening, and there is a great need to get information quickly and communicate between the inpatient and community-based practitioner. I should say we’ve come a long way, but there’s a lot more to do in this area, and that’s why six medical societies, including SHM, came together to produce the recent Transitions of Care Consensus Statement, acknowledging that this is a crucial part of patient safety and describing what are effective transitions of care in and out of the hospital.”—Vineet Arora, MD, MA, FHM, assistant professor, Department of Medicine, University of Chicago
—LB
It’s November 1999, and the release of an advance copy of a breakthrough Institute of Medicine (IOM) report on patient safety provokes headlines around the world with its estimate that as many as 98,000 people per year die from medical errors in U.S. hospitals. The report and subsequent book, To Err is Human: Building a Safer Health System, already is labeled a landmark event for modern medicine.1 It launches a nationwide effort to systematically improve patient safety and reduce errors.
Believe it or not, the IOM report celebrates its 10th anniversary this month. Many healthcare leaders point out that the QI and patient-safety revolution birthed by the IOM report has paralleled the simultaneous—and seismic—growth of HM.
The IOM report drew upon data from Harvard Medical Practice Studies and other existing research for its shocking estimates of error-induced deaths. The report, to a large degree, focused on prescribing errors, with less emphasis on hospital-acquired infections and other safety and quality issues that have emerged since its publication. The report also proposed a comprehensive safety strategy for government, industry, consumers, and healthcare providers—a proposal that has been adopted only in pieces.
In commemorating the 10th anniversary of the IOM report, industry leaders agree that HM more than any other medical specialty will continue to play a leading role in pushing the quality and patient-safety agenda in hospitals throughout America.
IOM’s Committee on Quality of Healthcare in America, which was made up of physicians, researchers, and healthcare leaders, authored the breakthrough report on medical errors, and followed up two years later with Crossing the Quality Chasm: A New Health System for the 21st Century (www.iom.edu/?id=12736).2
The Hospitalist caught up with two of the original committee members, Donald Berwick, MD, MPP, FRCP, president and CEO of the Institute for Healthcare Improvement (IHI), and Christine Cassel, MD, president and CEO of the American Board of Internal Medicine (ABIM), to discuss how far medicine has come—and how far it has to go—in the areas of hospital quality and patient safety.
—Christine Cassel, MD, president, CEO, American Board of Internal Medicine, Philadelphia
Question: What is the legacy of the IOM report?
Dr. Berwick: It didn’t launch the patient-safety movement, but it was the most important single contributor to that movement. In one step, it took the focus on safety as a goal in medicine from a relatively fringe concern to a central issue, and a central task for health providers.
Its most important element was the focus on systems improvement, rather than exhortations to individual health professionals to do a better job with patient safety. It is a cultural norm to blame someone when something goes wrong. That hasn’t changed fundamentally. But the IOM report made the point that it’s not people who are to blame for problems in patient safety, and blame won’t get us where we need to go.
HM Jumps into Quality and Patient Safety with Both Feet
An incredible, happy coincidence: That is how Robert Wachter, MD, FHM, explains the paralleled growth of HM and patient-safety awareness in U.S. hospitals. HM had “just emerged in the mid-1990s and was still figuring out what it was about when the IOM report [To Err is Human] was published,” says Dr. Wachter, chief of the hospital medicine division, professor and associate chair of the Department of Medicine, the University of California at San Francisco, former SHM president and author of the blog “Wachter’s World,” noting concerns at the time that HM would be branded as a cost-saving measure for hospitals and health plans.
“I remember vividly when the IOM report came out. A light bulb went off for me—what a spectacular opportunity for our field,” the well-known HM pioneer recalls. “Here was this huge report saying patient safety stinks and needs to be fixed. I was pretty sure other medical specialties would not welcome the findings. I and other hospitalist leaders pushed very hard to say ‘we own this’—we believe the report is true and we believe it requires a new kind of physician who believes in systems thinking, teamwork, and collaboration. I still think it was a good call for hospital medicine to jump with both feet into the quality and safety field.”
The IOM report sparked a patient-safety renaissance, Dr. Wachter says. “We recognized that there is a science here—a core knowledge, a way of thinking and an understanding that we were not going to make much progress on patient safety until we understood that knowledge, learned its science, and did the research. We have since learned that fixing patient safety is tricky, and yet as you scan the landscape, you see all of the important actors are doing something to make patient care safer.”
One of the first steps to fixing the problem is “owning up” to the fact people die because of medical mistakes. Hospitals’ willingness to adopt transparency, from the first floor to the C-suite, has changed in the past decade, Dr. Wachter says.
“We have created an environment where we’re on the path to getting safer,” he says. “We’re much more open and honest about errors. We attack them with root-cause analysis and find better ways to fix the problem. For me, that’s all healthy. It leaves me with great confidence that things are safer in American hospitals than they were 10 years ago—although certainly not as safe as they need to be.”—LB
Q: How do you rate the impact of To Err is Human on the medical industry as a whole?
Dr. Cassel: The Agency for Healthcare Research and Quality, five years after the IOM report, said we hadn’t made enough progress. We have, most importantly, been able to talk about it and understand some of the approaches to safety and quality. But that’s not nearly enough, in my opinion.
Dr. Berwick: I’d give it a C-minus. There has been a change in awareness of medical safety. Before the IOM report, you just didn’t hear about it. A scientific basis for the statement of the problem was created, and we can never go back. Prototypes of what could be achieved have started to emerge, not just in this country but worldwide. The problem is that the success is just in pockets—not fundamental change in the nature of the American healthcare industry. That level of execution just is not there yet. Now it’s game time—time to take safety and quality mainstream.
Q: In retrospect, what was missed in the report?
Dr. Berwick: If we missed any boat in our analysis, the idea of “no blame” is not meant to relieve everyone of responsibility for medical errors, but to relocate responsibility for safety in the offices and work of leaders of healthcare institutions. The finger points to the executive suite. There’s more and more evidence that safety does not improve without the clear commitment of leaders.
Dr. Cassel: When we think about how we train doctors, which I spend a lot of time doing, they just aren’t trained to think of root-cause analysis or how to work in teams to reduce errors. That needs to change. ABIM’s new pathway for hospitalists, which will be rolled out in another year or so (see “A-Plus Achievement,” p. 1), treats questions of how … to identify patient-safety issues as core knowledge.
Q: What is the relationship of the patient-safety movement to the hospitalist movement?
Dr. Cassel: The development and growth of patient safety has paralleled the growth of hospital medicine, and I think that’s a good thing. Most of the literature on available errors focuses on the hospital because that’s the easiest place to find numbers of patients and shine a light on safety. Specialists in hospital medicine have a unique opportunity and responsibility to be leaders in continuing to advance the cause of patient safety.
Q: What should HM’s patient-safety agenda look like going forward?
Dr. Berwick: No. 1, aim for zero. There are types of injuries and infections that can be nearly eliminated in the hospital. When you look at safety-oriented efforts in other industries, they strive to get to the point where they’re no longer talking about ratios, only numerators (how many actual incidents).
Second is to broaden the focus from safety to all the other dimensions of quality. Think about reliability, processes and performance across the board.
Third is to be authentic about teamwork across professions. In the medical culture at large, there still is too much focus on turf issues between doctors and nurses. I believe in the long run new safety initiatives will be fostered by teams working at unprecedented levels of collaboration, reaching across traditional boundaries.
Dr. Cassel: The issue of diagnostic error is also emerging as another kind of medical error.
In order for patients to get the right treatment, they need to get the right diagnosis. That’s where all of your medical training, knowledge, and judgment come into play. For ABIM, that’s how we evaluate physicians’ judgment.
The next frontier in patient safety is the handoff, from ambulatory to hospital and back, but also with long-term care, which is a black box. An enlightened and energetic hospitalist movement could decide to take that issue on.
Where it would happen is at the community level, although some of the healthcare reform legislation includes ideas about innovation zones and how to create payment mechanisms to support continuity of care. TH
Larry Beresford is a freelance writer based in Oakland, Calif.
References
- Kohn LT, Corrigan JM, Donaldson MS, et al. To Err Is Human: Building a Safer Health System. Washington, D.C.: National Academies Press, 2000.
- Institute of Medicine Committee on Quality Health Care in America. Crossing the Quality Chasm: A New Health System for the 21st Century. Washington, D.C.: National Academies Press, 2001.
- Moser R. Diseases of Medical Progress: A Contemporary Analysis of Illnesses Produced by Drugs and Other Therapeutic Procedures. Springfield, Ill.: Charles C. Thomas, 1959.
- Reason, J. Human Error. Cambridge, England: Cambridge University Press, 1990.
- Leape LL. Error in medicine. JAMA. 1994;272(23):1851-1857.
- United Kingdom Department of Health. An Organisation with a Memory. 2000.
- Jerrard J. No fee for errors. The Hospitalist. 2008;(5):18.
- Pronovost PJ, Berenholtz SM, Goeschel C, et al. Improving patient safety in intensive care units in Michigan. J Crit Care. 2008;23(2):207-221.
The Evolution of Patient Safety
Key milestones in the patient-safety and medical QI movement:
1980s-1990s - Various medical errors result in high-profile patient deaths, including that of Libby Zion at New York Hospital in 1984 and Betsy Lehman at the Dana-Farber Cancer Institute in Boston in 1994. The deaths keep medical errors in the headlines.
1990 - James Reason’s Human Error describes his theory of error as systems failure.3 It is undiscovered by healthcare until …
1994 - … Lucien Leape’s article “Error in Medicine” is published in the Journal of the American Medical Association, drawing upon advances in error prevention from fields other than medicine.4
1999- The Institute of Medicine releases its landmark patient safety report, To Err Is Human.
2001 - Congress establishes the Agency for Healthcare Research and Quality (AHRQ) to begin an aggressive patient-safety research and improvement program.
2002 - The Joint Commission releases its first National Patient Safety Goals.
2004 - The federal government creates the Office of the National Coordinator for Healthcare Information Technology to promote systems improvements in the medical industry.
2005 - The Institute for Healthcare Improvement’s 100,000 Lives campaign begins; it encourages hospitals to adopt basic steps to reduce harm and deaths.
2006 - The National Quality Forum issues its list of “never events,” 28 medical errors that should never occur in hospitals.6
2009 - The American Recovery and Reinvestment Act passes Congress and is signed by President Obama. It contains $19 billion for advancing healthcare information technology.
Source: Adapted from Wachter, R. Understanding Patient Safety (Lang Clinical Medicine), McGraw-Hill: 2007, Appendix III, Selected Milestones in the Field of Patient Safety, p. 280-281, which was adapted from sources including Vincent C. Patient Safety. London; Elsevier, 2006; and Sharpe VA, Faden AI. Medical Harm: Historical, Conceptual, and Ethical Dimensions of Iatrogenic illness. New York: Cambridge University Press, 1998.
Image Sources: DNY59, ZEFFSS1, AYZEK, DON BAYLEY, BECKY REED/ISTOCKPHOTO.COM
HM Leaders Weigh In
Question 1: What was hospital medicine’s contribution and role in the patient-safety movement that ensued following the IOM report?
“I believe that hospitalists have been integral to improving patient safety and reducing medical errors in those hospitals. Patients are safer and better off if there is a physician in the house ready to respond should patients have a change in health status. Hospitalists see the hospital as their office, if you will, and they focus not only on treating the patient in the bed, but treating the hospital itself by becoming engaged with quality improvement and patient-safety initiatives that improve the system of care.”—Mark Williams, MD, FHM, chief, division of hospital medicine, Northwestern University Feinberg School of Medicine, Chicago; SHM past president; editor of the Journal of Hospital Medicine
“The role hospital medicine has filled has been as a major supplier of physicians to quality-improvement teams and other hospital teams at the front lines, prior to which physicians were conspicuously absent. If you look, for example, at nurses and other healthcare professionals, they came to the party much earlier than we did. Physicians have only recently on a broad scale become involved on these teams, and I think the major contributors have been hospitalists.”—Winthrop Whitcomb, MD, FHM, director of performance improvement, Mercy Medical Center, Springfield, Mass.; SHM co-founder
“There was a tremendous kind of synergy where hospital medicine was defining itself by its focus on systems of care, safety culture, error reporting, collaboration, interdisciplinary teams and so forth. The IOM report did a beautiful job of taking the knowledge and literature, not just from within medicine but more importantly from outside, and showing how a lot of those concepts that had been implemented successfully elsewhere were lacking in medicine in general. That really just teed it up for hospital medicine to take the impetus and framework IOM supplied and use it as a rubric for what hospital medicine could do for its part of the health system.”—Russ Cucina, MD, assistant professor of medicine and associate medical director for information technology, University of California at San Francisco
Question 2: What is the most important unfinished business for hospitalists regarding the patient-safety movement?
“I think we have made tremendous strides but there is much more to do. Although we have pockets of success, what we need to do is make those successes more uniform, so they happen in every hospital, not just some hospitals that have the right hospitalist leader or the right skill set or the right culture. We want to create the right culture and skill set and team in every hospital, and one of our challenges at SHM is to work on a mentoring program for hospitalists. That means using those who have been successful to mentor other sites and bring them on board to reproduce and replicate the good work.”—Janet Nagamine, MD, FHM, hospitalist, Kaiser Permanente Medical Center, Santa Clara, Calif.; SHM Hospital Quality/Patient Safety Committee chairwoman
“The patients who enter hospitals today are incredibly sick, with multiple organ failures and other complications. Taking care of these patients is incredibly challenging, and there are always going to be things that do not go well. Hospitalists have begun to uncover and tackle a lot of these problems, but even as they eliminate one problem, new treatments, devices, procedures and strategies for caring for patients—all designed to improve care—may have unintended consequences. It is hospitalists’ job to try to mitigate those consequences and redesign the strategies to continue to improve outcomes. But this is a long road—a marathon, not a sprint.”—Scott Flanders, MD, FHM, director of the hospitalist division, University of Michigan Health System, Ann Arbor; president of SHM
“The greatest area of unfinished business I see is preserving continuity of care for our patients as they transition in and out of the hospital. So much is happening, and there is a great need to get information quickly and communicate between the inpatient and community-based practitioner. I should say we’ve come a long way, but there’s a lot more to do in this area, and that’s why six medical societies, including SHM, came together to produce the recent Transitions of Care Consensus Statement, acknowledging that this is a crucial part of patient safety and describing what are effective transitions of care in and out of the hospital.”—Vineet Arora, MD, MA, FHM, assistant professor, Department of Medicine, University of Chicago
—LB
Public reporting and pay-for-performance programs in perioperative medicine
Hospital quality measures and rankings are now widely available to the public online, but is public reporting of this information an effective strategy for improving health care? Using a case study of a hospital that suffered negative publicity as a result of a quality report, this article explores the use of public reporting of performance data and pay-for-performance reimbursement strategies to foster quality improvement in the US health care system.
CASE STUDY: A SURGICAL PROGRAM GETS A BAD REPORT―IN THE HEADLINES
In September 2005, The Boston Globe ran a prominent story reporting that the UMass Memorial Medical Center in Worcester, Mass., was abruptly suspending its elective cardiac surgery program.1 The program’s suspension came after state public health officials presented UMass Memorial with a detailed analysis showing that the hospital’s mortality rate for coronary artery bypass graft surgery (CABG) patients was the highest in the state and almost double the average for Massachusetts hospitals.1
Key personnel from UMass Memorial described the events preceding and following the program’s suspension in a journal article published in 2008.2 In 2002, UMass Memorial hired a new chief of cardiothoracic surgery, who resigned in early 2005. A few months after that resignation, state public health officials alerted the hospital to the abovementioned CABG mortality data (from 2002 and 2003), which they said would soon be reported publicly. UMass Memorial then conducted an internal review of its data from the most recent years (2004 and 2005) and found that its risk-adjusted CABG mortality had actually worsened, at which point the hospital voluntarily suspended its cardiac surgery program.2
More news stories arose about UMass Memorial’s program and its problems. The hospital hired consultants and senior surgeons from around the state and New England to completely review its cardiac surgery program. They concluded that “many essential systems were not in place” and made 68 key recommendations, including a complete overhaul of the hospital’s quality-improvement structure. The prior cardiac surgeons departed.2
The cardiac surgery program resumed after a 6-week hiatus, with day-to-day supervision by two senior cardiac surgeons from a Boston teaching hospital. A nationally recognized cardiac surgeon was brought on as chief of cardiac surgery in January 2006. In the 18 months after the program resumed, risk-adjusted CABG mortality rates declined substantially, but patient volume failed to return to presuspension levels and the hospital reported $22 million in lost revenue in fiscal year 2006 as a result of the suspension.2
This case raises a number of questions that help to frame discussion of the benefits and risks of public reporting of hospital quality measures:
- To what extent does public reporting accelerate quality improvement?
- How typical was the subsequent mortality reduction reported by UMass Memorial—ie, can public reporting be expected to improve outcomes?
- Was the effect on patient volume expected—ie, how much does public reporting affect market share?
- Would a pay-for-performance reimbursement model have accelerated improvement?
- Why do public reporting and pay-for-performance programs remain controversial?
- Do patients have a right to know?
WHAT HAS FUELED THE MOVE TOWARD PUBLIC REPORTING?
Drivers of public reporting
Massachusetts is one of a number of states that publicly report outcomes from cardiac surgery and other procedures and processes of care. Three basic factors have helped drive the development of public reporting (and, in some cases, pay-for-performance) programs:
- National policy imperatives designed to improve quality and safety and to reduce costs
- Cultural factors in society, which include consumerism in health care and the desire for transparency
- The growth of information technology and use of the World Wide Web, which has been a huge enabler of public reporting. Public reporting could be done prior to the Web era but would not have reached such a wide audience had the results been released in a book that had to be ordered from a government printing office.
The rationale for public reporting
In theory, how might public reporting and pay-for-performance programs improve quality? Several different mechanisms or factors are likely to be involved:
- Feedback. The basic premise of the National Surgical Quality Improvement Program, to cite one example, is that peer comparison and performance feedback will stimulate quality improvement.
- Reputation. Hospital personnel fear being embarrassed if data show that they are performing poorly compared with other hospitals. Likewise, in recent years we have seen hospitals with the best quality rankings publicly advertise their performance.
- Market share. Here the premise is that patients will tend to select providers with higher quality rankings and shun those with lower rankings.
- Financial incentives. Pay-for-performance programs link payment or reimbursement directly to the desired outcomes and thereby stimulate quality improvement without working through the abovementioned mechanisms.
Approaches to quality measurement
Public reporting of hospital performance requires selection of an approach to measuring quality of care. Generally speaking, measures of health care quality reflect one of three domains of care:
Structural (or environmental) aspects, such as staffing in the intensive care unit (ICU), surgical volume, or availablity of emergency medical responders. An example of a structure-oriented reporting system is the Leapfrog Group’s online posting of hospital ratings based on surgical volumes for high-risk procedures, the degree of computerized order entry implementation, and the presence or absence of various patient safety practices.3
Processes of care, such as whether beta-blockers are prescribed for all patients after a myocardial infarction (MI), or whether thromboprophylaxis measures are ordered for surgical patients in keeping with guideline recommendations. Examples of process-oriented reporting systems include the US Department of Health and Human Services’ Hospital Compare Web site4 and the Commonwealth Fund’s WhyNotTheBest.org site.5
Outcomes of care, such as rates of mortality or complications, or patient satisfaction rates. An example of an outcomes-oriented reporting system is the annual report of institution-specific hospital-acquired infection rates put out by Pennsylvania6 and most other states.
IS THERE EVIDENCE OF BENEFIT?
A consistent effect in spurring quality-improvement efforts
Nearly a dozen published studies have evaluated whether public reporting stimulates quality-improvement activities, and the results have shown fairly consistently that it does. A 2003 study by Hibbard et al is representative of the results.7 This survey-based investigation measured the number of quality-improvement activities in cardiac and obstetric care undertaken by 24 Wisconsin hospitals that were included in an existing public reporting system compared with the number undertaken by 98 other Wisconsin hospitals that received either a private report on their own quality performance (without the information being made public) or no quality report at all. The study found that the hospitals that participated in public reporting were engaged in significantly more quality-improvement activities in both of the clinical areas assessed than were the hospitals receiving private reporting or no reporting.
A mixed effect on patient outcomes
In contrast, the data on whether public reporting improves patient outcomes have so far been mixed. A 2008 systematic review of the literature identified 11 studies that addressed this issue: five studies found that public reporting had a positive effect on patient outcomes, while six studies demonstrated a negative effect or no effect.8 Unfortunately, the methodological quality of most studies was poor: most were before-and-after comparisons without controls.
One of the positive studies in this review examined the effects of New York State’s pioneering institution of provider-specific CABG mortality reports (provider profiling) in 1989.9 The analysis found that between 1987 and 1992 (during which time provider profiling was instituted), unadjusted 30-day mortality rates following bypass surgery declined to a significantly larger degree among New York Medicare patients (33% reduction) than among Medicare patients nationwide (19% reduction) (P < .001).
In contrast, a time-series study from Cleveland Health Quality Choice (CHQC)—an early and innovative public reporting program—exemplifies a case in which public reporting of hospital performance had no discernible effect.10 The study examined trends in 30-day mortality across a range of conditions over a 6-year period for 30 hospitals in the Cleveland area participating in a public reporting system. It found that the hospitals that started out in the worst-performing groups (based on baseline mortality rates) showed no significant change in mortality over time.
DOES PUBLIC REPORTING AFFECT PATIENT CHOICES?
How a high-profile bypass patient chooses a hospital
When former President Bill Clinton developed chest pain and shortness of breath in 2004, he was seen at a small community hospital in Westchester County, N.Y., and then transferred to New York-Presbyterian Hospital/Columbia University Medical Center for bypass surgery.11 Although one would think President Clinton would have chosen the best hospital for CABG in New York, Presbyterian/Columbia’s risk-adjusted mortality rate for CABG was actually about twice the average for New York hospitals and one of the worst in the state, according to the most recent “report card” for New York hospitals available at the time.12
Why did President Clinton choose the hospital he did? Chances are that he, like most other patients, did not base his decision on publicly reported data. His choice probably was heavily influenced by the normal referral patterns of the community hospital where he was first seen.
Surveys show low patient use of data on quality...
The question raised by President Clinton’s case has been formally studied. In 1996, Schneider and Epstein surveyed patients who had recently undergone CABG in Pennsylvania (where surgeon- and hospital-specific mortality rates for cardiac surgery are publicly available) and found that fewer than 1% of patients said that provider ratings had a moderate or major impact on their choice of provider.13
The Kaiser Family Foundation regularly surveys the public about its knowledge and use of publicly available hospital comparison data. In the latest Kaiser survey, conducted in 2008,14 41% of respondents said they believe there are “big differences” in quality among their local hospitals, yet 59% said they would choose a hospital that is familiar to them rather than a higher-rated facility. These findings may be explained, in part, by a lack of awareness that data on hospital quality are available: only 7% of survey participants said they had seen and used information comparing the quality of hospitals to make health care decisions in the prior year, and only 6% said they had seen and used information comparing physicians.
...But a trend toward greater acceptance
Although consumers’ use of publicly reported quality data remains low, their recognition of the value of such data has grown over time. Kaiser has conducted similar public surveys dating back to 1996, and the period from 1996 to 2008 saw a substantial decrease (from 72% to 59%) in the percentage of Americans who would choose a hospital based on familiarity more than on quality ratings. Similarly, the percentage of Americans who would prefer a surgeon with high quality ratings over a surgeon who has treated friends or family more than doubled from 1996 (20%) to 2008 (47%).14
What effect on market share?
Studies on the effects that public reporting has on hospital market share have been limited.
Schneider and Epstein surveyed cardiologists in Pennsylvania in 1995 and found that 87% of them said the state’s public reporting of surgeon- and hospital-specific mortality rates for CABG had no influence or minimal influence on their referral recommendations.15
Similarly, a review of New York State’s public reporting system for CABG 15 years after its launch found that hospital performance was not associated with a subsequent change in market share, not even among those hospitals with the highest mortality rate in a given year.16 Interestingly, however, this review also showed that surgeons in the bottom performance quartile were four times as likely as other surgeons to leave practice in the year following their poor report, which is one of the most prominent outcomes associated with provider profiling reported to date.
PAY-FOR-PERFORMANCE PROGRAMS
Evidence on the impact of pay-for-performance programs in the hospital setting is even more limited than that for public reporting.
Some evidence has come from the CMS/Premier Hospital Quality Incentive Demonstration, a pay-for-performance collaboration between the Centers for Medicare and Medicaid Services (CMS) and Premier, Inc., a nationwide alliance of hospitals that promotes best practices.17 The demonstration calls for hospitals that rank in the top quintile or decile for performance to receive a 1% or 2% Medicare payment bonus for five clinical focus areas: cardiac surgery, hip and knee surgery, pneumonia, heart failure, and acute MI. Performance ratings are based primarily on process measures as well as a few clinical outcome measures. Results from the first 21 months of the demonstration showed a consistent improvement in the hospitals’ composite quality scores in each of the five clinical areas.17
It is important to recognize, however, that this improvement occurred against the backdrop of broad national adoption of public reporting of hospital quality data, which makes it difficult to tease out how much of the improvement was truly attributable to pay-for-performance, especially in the absence of a control group.
To address this question, my colleagues and I evaluated adherence to quality measures over a 2-year period at 613 hospitals participating in a national public reporting initiative,18 including 207 hospitals that simultaneously took part in the CMS/Premier Hospital Quality Incentive Demonstration’s pay-for-performance program described above. We found that the hospitals participating in both public reporting and the pay-for-performance initiative achieved only modestly greater improvements in quality than did the hospitals engaged solely in public reporting; the difference amounted to only about a 1% improvement in process measures per year.
In another controlled study, Glickman et al compared quality improvement in the management of acute MI between 54 hospitals in a CMS pay-for-performance pilot project and 446 control hospitals without pay-for-performance incentives.19 They found that the pay-for-performance hospitals achieved a statistically significantly greater degree of improvement compared with control hospitals on two of six process-of-care measures (use of aspirin at discharge and smoking-cessation counseling) but not on the composite process-of-care measure. There was no significant difference between the groups in improvements in in-hospital mortality.
Why have the effects of pay-for-performance initiatives so far been so limited? It may be that the bonuses are too small and that public reporting is already effective at stimulating quality improvement, so that the incremental benefit of adding financial incentives is small. In the case of my group’s study,18 another possible factor was that the hospitals’ baseline performance on the quality measures assessed was already high—approaching or exceeding 90% on 5 of the 10 measures—thereby limiting our power to detect differences between the groups.
CONTROVERSIES AND CHALLENGES
Many issues continue to surround public reporting and pay-for-performance programs:
- Are the measures used to evaluate health care systems suitable and evidence-based? Do they truly reflect the quality of care that providers are giving?
- Do the programs encourage “teaching to the test” rather than stimulating real and comprehensive improvement? Do they make the system prone to misuse or overuse of measured services?
- How much of the variation in hospital outcomes can be explained by the current process-of-care measures?
- Should quality be measured by outcomes or processes? Outcomes matter more to patients, but they require risk adjustment to ensure valid comparisons, and risk adjustment can be difficult and expensive to conduct.
- How much is chance a factor in apparent performance differences between hospitals?
- How much is patient selection a factor? Might public reporting lead to “cherry-picking” of low-risk patients and thereby reduce access to care for other patients?
Unidirectional measures can lead to misuse, overuse
In 2003, the Infectious Diseases Society of America updated its guidelines on community-acquired pneumonia to recommend that patients receive antibiotics within 4 hours of hospital admission. This recommendation was widely adopted as an incentive-linked performance measure by CMS and other third-party payers. Kanwar et al studied the impact of this guidelines-based incentive in a pre/post study at one large teaching hospital.20 They found that while significantly more patients received antibiotics in a timely fashion after publication of the guidelines (2005) versus before the guidelines (2003), almost one-third of patients receiving antibiotics in 2005 had normal chest radiographs and thus were not appropriate candidates for therapy. Moreover, significantly fewer patients in 2005 had a final diagnosis of pneumonia at discharge, and there was no difference between the two periods in rates of mortality or ICU transfer. The researchers concluded that linking the quality indicator of early antibiotic use to financial incentives may lead to misdiagnosis of pneumonia and inappropriate antibiotic use.
Of course, antibiotic timing is not the only quality measure subject to overuse or misuse; other measures pose similar risks, including prophylaxis for deep vein thrombosis, glycemic control measures, and target immunization rates.
More-nuanced measures needed
We must also consider how well reported quality measures actually reflect our objectives. For example, an evaluation of 962 hospitals’ performance in managing acute MI found that the publicly reported core process measures for acute MI (beta-blocker and aspirin at admission and discharge, ACE inhibitor at discharge, smoking-cessation counseling, timely reperfusion) together explained only 6% of the variance among the hospitals in risk-adjusted 30-day mortality.21 This underscores how complicated the factors affecting mortality are, and how existing process measures have only begun to scratch the surface.
How much of a role does chance play?
Another issue is the role of chance and our limited power to detect real differences in outcomes, as illustrated by an analysis by Dimick et al of all discharges from a nationally representative sample of nearly 1,000 hospitals.22 The objective was to determine whether the seven operations for which mortality is advocated as a quality indicator by the Agency for Healthcare Research and Quality are performed often enough to reliably identify hospitals with increased mortality rates. The researchers found that only for one of the seven procedures—CABG—is there sufficient caseload over a 3-year period at the majority of US hospitals to accurately detect a mortality rate twice the national average.
Although CMS is highly committed to public reporting, the comparative mortality data available on its Hospital Compare Web site are not very useful for driving consumer choice or motivating hospitals to improve. For example, of the nearly 4,500 US hospitals that reported data on 30-day mortality from MI, only 17 hospitals were considered to be better than the national average and only 7 were considered worse than the national average.4
CASE REVISITED: LESSONS FROM THE UMASS MEMORIAL EXPERIENCE
Returning to our case study, what can the UMass Memorial experience teach us, and how well does it reflect the literature about the usefulness of public reporting?
Did public reporting accelerate quality improvement efforts? Yes. Reporting led to the suspension of cardiac surgery and substantive reorganization, which is consistent with the literature.
Was the mortality reduction typical? No. An optimist’s view would be that the drastic actions spurred by the media coverage had strong effects. A skeptic might say that perhaps UMass Memorial did some “cherry-picking” of patients, or that they got better at coding procedures in a way that reflected more favorably on the hospital.
Were the declines in patient volumes predictable? No. So far, the data suggest that public reporting has its greatest effects on providers rather than on institutions. This may change, however, with the introduction of tiered copayments, whereby patients are asked to pay more if they get their care from lower rated institutions.
Would financial incentives have accelerated improvement? It is too early to tell. The evidence for pay-for-performance programs is limited, and the benefits demonstrated so far have been modest. But in many ways the alternative is worse: our current system of financing and paying for hospital care offers no financial incentives to hospitals for investing in the personnel or systems required to achieve better outcomes—and instead rewards (through supplemental payments) adverse outcomes.
Did prospective patients have a right to know? Despite the limitations of public reporting, one of the most compelling arguments in its favor is that patients at UMass Memorial had the right to know about the program’s outcomes. This alone may ultimately justify the expense and efforts involved. Transparency and accountability are core values of open democratic societies, and US society relies on public reporting in many other realms: the National Highway Traffic Safety Administration publicizes crash test ratings, the Securities and Exchange Commission enforces public reporting by financial institutions, and the Federal Aviation Administration reports on airline safety, timeliness of flights, and lost baggage rates.
FUTURE DIRECTIONS
In the future, we can expect more measurement and reporting of health care factors that patients care most about, such as clinical outcomes and the patient experience. It is likely that public reporting and pay-for-performance programs will address a broader range of conditions and comprise a larger number of measures. CMS has outlined plans to increase the number of publicly reported measures to more than 70 by 2010 and more than 100 by 2011. My hope is that this expansion of data, along with improved data synthesis and presentation, will foster greater use of publicly reported data. Further, the continued evolution of the Web and social networking sites is very likely to enhance public awareness of hospital performance and change the ways in which patients use these data.
DISCUSSION
Question from the audience: I’m concerned about what seems to be a unilateral effort to improve quality. There are many components of health care delivery beyond those you’ve described, including the efforts of patients, insurers, employers, and the government. The reality is that patients don’t plan for illness, insurance companies often deny care, more and more employers are providing less coverage or no coverage, and Medicare is on the road to insolvency. Is the battle for quality winnable when all these other components of delivery are failing?
Dr. Lindenauer: You make good points. But from the standpoint of professionalism, I think we have a compelling duty to constantly strive to improve the quality of care in our hospitals and practices. I have presented strategies for potentially accelerating improvements that providers are trying to make anyway. Public reporting and financial incentives are likely to be with us for a while, and their use is likely to grow. But as you said, they address only part of the problem confronting American health care.
Question from the audience: For the savvy health care consumer, is there one particular Web site for hospital or provider comparisons that you would especially recommend? Do you actually recommend using such Web sites to patients before they undergo certain procedures?
Dr. Lindenauer: I think the Hospital Compare site from the Department of Health and Human Services is the key Web site. The California Hospital Assessment and Reporting Taskforce (CHART) has a good site, and the Commonwealth Fund’s WhyNotTheBest.org is an interesting newcomer.
However, even the most ardent advocates for public reporting wouldn’t say the information available today is sufficient for making decisions. There’s still an important role for getting recommendations from other doctors who are familiar with local hospitals and providers.
I’m optimistic that the changes that are coming to these Web sites will provide a better user experience and make it harder to ignore the results of public reporting. Today we can say, “Hospital A is better at discharge instructions or smoking cessation counseling.” But we all can appreciate how weak those kinds of measures are because their implementation is subject to local interpretations. Once risk-adjusted outcomes and more-meaningful process measures are available, I’d be surprised if more patients weren’t willing to base their decisions on published comparisons.
- Kowalczyk L, Smith S. Hospital halts heart surgeries due to deaths: high rate cited at Worcester facility. The Boston Globe. September 22, 2005.
- Ettinger WH, Hylka SM, Phillips RA, Harrison LH Jr, Cyr JA, Sussman AJ. When things go wrong: the impact of being a statistical outlier in publicly reported coronary artery bypass graft surgery mortality data. Am J Med Qual 2008; 23:90–95.
- Leapfrog hospital quality ratings. The Leapfrog Group Web site. http://www.leapfroggroup.org/cp. Accessed June 10, 2009.
- Hospital Compare: a quality tool provided by Medicare. U.S. Department of Health & Human Services Web site. http://www.hospitalcompare.hhs.gov. Accessed June 10, 2009.
- Why Not the Best (Beta): A Health Care Quality Improvement Resource. The Commonwealth Fund. http://www.WhyNotTheBest.org. Accessed May 6, 2009.
- Hospital-acquired infections in Pennsylvania. Pennsylvania Health Care Cost Containment Council Web site. http://www.phc4.org. Accessed April 6, 2009.
- Hibbard JH, Stockard J, Tusler M. Does publicizing hospital performance stimulate quality improvement efforts? Health Aff (Millwood) 2003; 22:84–94.
- Fung CH, Lim YW, Mattke S, Damberg C, Shekelle PG. Systematic review: the evidence that publishing patient care performance data improves quality of care. Ann Intern Med 2008; 148:111–123.
- Peterson ED, DeLong ER, Jollis JG, et al. The effects of New York’s bypass surgery provider profiling on access to care and patient outcomes in the elderly. J Am Coll Cardiol 1998; 32:993–999.
- Baker DW, Einstadter D, Thomas C, et al. The effect of publicly reporting hospital performance on market share and risk-adjusted mortality at high-mortality hospitals. Med Care 2003; 41:729–740.
- Graylock J. After chest pains, Clinton set to undergo bypass surgery. USA Today. September 3, 2004.
- Adult Cardiac Surgery in New York State, 1999–2001. Albany, NY: New York State Department of Health; April 2004. http://www.health.state.ny.us/nysdoh/heart/pdf/1999-2001_cabg.pdf. Accessed June 10, 2009.
- Schneider EC, Epstein AM. Use of public performance reports: a survey of patients undergoing cardiac surgery. JAMA 1998; 279:1638–1642.
- The Henry J. Kaiser Family Foundation. 2008 Update on Consumers’ Views of Patient Safety and Quality Information: Summary & Chartpack; October 2008. http://www.kff.org/kaiserpolls/upload/7819.pdf. Accessed June 10, 2009.
- Schneider EC, Epstein AM. Influence of cardiac-surgery performance reports on referral practices and access to care: a survey of cardiovascular specialists. N Engl J Med 1996; 335:251–256.
- Jha AK, Epstein AM. The predictive accuracy of the New York State coronary artery bypass surgery report-card system. Health Aff (Millwood) 2006; 25:844–855.
- Remus D. Pay for performance: CMS/Premier Hospital Quality Incentive Demonstration Project—year 1 results, December 2005. PowerPoint presentation available at: http://www.premierinc.com/quality-safety/tools-services/p4p/hqi/results/index.jsp. Accessed June 10, 2009.
- Lindenauer PK, Remus D, Roman S, et al. Public reporting and pay for performance in hospital quality improvement. N Engl J Med 2007; 356:486–496.
- Glickman SW, Ou FS, DeLong ER, et al. Pay for performance, quality of care, and outcomes in acute myocardial infarction. JAMA 2007; 297:2373–2380.
- Kanwar M, Brar N, Khatib R, Fakih MG. Misdiagnosis of community-acquired pneumonia and inappropriate utilization of antibiotics: side effects of the 4-h antibiotic administration rule. Chest 2007; 131:1865–1869.
- Bradley EH, Herrin J, Elbel B, et al. Hospital quality for acute myocardial infarction: correlation among process measures and relationship with short-term mortality. JAMA 2006; 296:72–78.
- Dimick JB, Welch HG, Birkmeyer JD. Surgical mortality as an indicator of hospital quality: the problem with small sample size. JAMA 2004; 292:847–851.
Hospital quality measures and rankings are now widely available to the public online, but is public reporting of this information an effective strategy for improving health care? Using a case study of a hospital that suffered negative publicity as a result of a quality report, this article explores the use of public reporting of performance data and pay-for-performance reimbursement strategies to foster quality improvement in the US health care system.
CASE STUDY: A SURGICAL PROGRAM GETS A BAD REPORT―IN THE HEADLINES
In September 2005, The Boston Globe ran a prominent story reporting that the UMass Memorial Medical Center in Worcester, Mass., was abruptly suspending its elective cardiac surgery program.1 The program’s suspension came after state public health officials presented UMass Memorial with a detailed analysis showing that the hospital’s mortality rate for coronary artery bypass graft surgery (CABG) patients was the highest in the state and almost double the average for Massachusetts hospitals.1
Key personnel from UMass Memorial described the events preceding and following the program’s suspension in a journal article published in 2008.2 In 2002, UMass Memorial hired a new chief of cardiothoracic surgery, who resigned in early 2005. A few months after that resignation, state public health officials alerted the hospital to the abovementioned CABG mortality data (from 2002 and 2003), which they said would soon be reported publicly. UMass Memorial then conducted an internal review of its data from the most recent years (2004 and 2005) and found that its risk-adjusted CABG mortality had actually worsened, at which point the hospital voluntarily suspended its cardiac surgery program.2
More news stories arose about UMass Memorial’s program and its problems. The hospital hired consultants and senior surgeons from around the state and New England to completely review its cardiac surgery program. They concluded that “many essential systems were not in place” and made 68 key recommendations, including a complete overhaul of the hospital’s quality-improvement structure. The prior cardiac surgeons departed.2
The cardiac surgery program resumed after a 6-week hiatus, with day-to-day supervision by two senior cardiac surgeons from a Boston teaching hospital. A nationally recognized cardiac surgeon was brought on as chief of cardiac surgery in January 2006. In the 18 months after the program resumed, risk-adjusted CABG mortality rates declined substantially, but patient volume failed to return to presuspension levels and the hospital reported $22 million in lost revenue in fiscal year 2006 as a result of the suspension.2
This case raises a number of questions that help to frame discussion of the benefits and risks of public reporting of hospital quality measures:
- To what extent does public reporting accelerate quality improvement?
- How typical was the subsequent mortality reduction reported by UMass Memorial—ie, can public reporting be expected to improve outcomes?
- Was the effect on patient volume expected—ie, how much does public reporting affect market share?
- Would a pay-for-performance reimbursement model have accelerated improvement?
- Why do public reporting and pay-for-performance programs remain controversial?
- Do patients have a right to know?
WHAT HAS FUELED THE MOVE TOWARD PUBLIC REPORTING?
Drivers of public reporting
Massachusetts is one of a number of states that publicly report outcomes from cardiac surgery and other procedures and processes of care. Three basic factors have helped drive the development of public reporting (and, in some cases, pay-for-performance) programs:
- National policy imperatives designed to improve quality and safety and to reduce costs
- Cultural factors in society, which include consumerism in health care and the desire for transparency
- The growth of information technology and use of the World Wide Web, which has been a huge enabler of public reporting. Public reporting could be done prior to the Web era but would not have reached such a wide audience had the results been released in a book that had to be ordered from a government printing office.
The rationale for public reporting
In theory, how might public reporting and pay-for-performance programs improve quality? Several different mechanisms or factors are likely to be involved:
- Feedback. The basic premise of the National Surgical Quality Improvement Program, to cite one example, is that peer comparison and performance feedback will stimulate quality improvement.
- Reputation. Hospital personnel fear being embarrassed if data show that they are performing poorly compared with other hospitals. Likewise, in recent years we have seen hospitals with the best quality rankings publicly advertise their performance.
- Market share. Here the premise is that patients will tend to select providers with higher quality rankings and shun those with lower rankings.
- Financial incentives. Pay-for-performance programs link payment or reimbursement directly to the desired outcomes and thereby stimulate quality improvement without working through the abovementioned mechanisms.
Approaches to quality measurement
Public reporting of hospital performance requires selection of an approach to measuring quality of care. Generally speaking, measures of health care quality reflect one of three domains of care:
Structural (or environmental) aspects, such as staffing in the intensive care unit (ICU), surgical volume, or availablity of emergency medical responders. An example of a structure-oriented reporting system is the Leapfrog Group’s online posting of hospital ratings based on surgical volumes for high-risk procedures, the degree of computerized order entry implementation, and the presence or absence of various patient safety practices.3
Processes of care, such as whether beta-blockers are prescribed for all patients after a myocardial infarction (MI), or whether thromboprophylaxis measures are ordered for surgical patients in keeping with guideline recommendations. Examples of process-oriented reporting systems include the US Department of Health and Human Services’ Hospital Compare Web site4 and the Commonwealth Fund’s WhyNotTheBest.org site.5
Outcomes of care, such as rates of mortality or complications, or patient satisfaction rates. An example of an outcomes-oriented reporting system is the annual report of institution-specific hospital-acquired infection rates put out by Pennsylvania6 and most other states.
IS THERE EVIDENCE OF BENEFIT?
A consistent effect in spurring quality-improvement efforts
Nearly a dozen published studies have evaluated whether public reporting stimulates quality-improvement activities, and the results have shown fairly consistently that it does. A 2003 study by Hibbard et al is representative of the results.7 This survey-based investigation measured the number of quality-improvement activities in cardiac and obstetric care undertaken by 24 Wisconsin hospitals that were included in an existing public reporting system compared with the number undertaken by 98 other Wisconsin hospitals that received either a private report on their own quality performance (without the information being made public) or no quality report at all. The study found that the hospitals that participated in public reporting were engaged in significantly more quality-improvement activities in both of the clinical areas assessed than were the hospitals receiving private reporting or no reporting.
A mixed effect on patient outcomes
In contrast, the data on whether public reporting improves patient outcomes have so far been mixed. A 2008 systematic review of the literature identified 11 studies that addressed this issue: five studies found that public reporting had a positive effect on patient outcomes, while six studies demonstrated a negative effect or no effect.8 Unfortunately, the methodological quality of most studies was poor: most were before-and-after comparisons without controls.
One of the positive studies in this review examined the effects of New York State’s pioneering institution of provider-specific CABG mortality reports (provider profiling) in 1989.9 The analysis found that between 1987 and 1992 (during which time provider profiling was instituted), unadjusted 30-day mortality rates following bypass surgery declined to a significantly larger degree among New York Medicare patients (33% reduction) than among Medicare patients nationwide (19% reduction) (P < .001).
In contrast, a time-series study from Cleveland Health Quality Choice (CHQC)—an early and innovative public reporting program—exemplifies a case in which public reporting of hospital performance had no discernible effect.10 The study examined trends in 30-day mortality across a range of conditions over a 6-year period for 30 hospitals in the Cleveland area participating in a public reporting system. It found that the hospitals that started out in the worst-performing groups (based on baseline mortality rates) showed no significant change in mortality over time.
DOES PUBLIC REPORTING AFFECT PATIENT CHOICES?
How a high-profile bypass patient chooses a hospital
When former President Bill Clinton developed chest pain and shortness of breath in 2004, he was seen at a small community hospital in Westchester County, N.Y., and then transferred to New York-Presbyterian Hospital/Columbia University Medical Center for bypass surgery.11 Although one would think President Clinton would have chosen the best hospital for CABG in New York, Presbyterian/Columbia’s risk-adjusted mortality rate for CABG was actually about twice the average for New York hospitals and one of the worst in the state, according to the most recent “report card” for New York hospitals available at the time.12
Why did President Clinton choose the hospital he did? Chances are that he, like most other patients, did not base his decision on publicly reported data. His choice probably was heavily influenced by the normal referral patterns of the community hospital where he was first seen.
Surveys show low patient use of data on quality...
The question raised by President Clinton’s case has been formally studied. In 1996, Schneider and Epstein surveyed patients who had recently undergone CABG in Pennsylvania (where surgeon- and hospital-specific mortality rates for cardiac surgery are publicly available) and found that fewer than 1% of patients said that provider ratings had a moderate or major impact on their choice of provider.13
The Kaiser Family Foundation regularly surveys the public about its knowledge and use of publicly available hospital comparison data. In the latest Kaiser survey, conducted in 2008,14 41% of respondents said they believe there are “big differences” in quality among their local hospitals, yet 59% said they would choose a hospital that is familiar to them rather than a higher-rated facility. These findings may be explained, in part, by a lack of awareness that data on hospital quality are available: only 7% of survey participants said they had seen and used information comparing the quality of hospitals to make health care decisions in the prior year, and only 6% said they had seen and used information comparing physicians.
...But a trend toward greater acceptance
Although consumers’ use of publicly reported quality data remains low, their recognition of the value of such data has grown over time. Kaiser has conducted similar public surveys dating back to 1996, and the period from 1996 to 2008 saw a substantial decrease (from 72% to 59%) in the percentage of Americans who would choose a hospital based on familiarity more than on quality ratings. Similarly, the percentage of Americans who would prefer a surgeon with high quality ratings over a surgeon who has treated friends or family more than doubled from 1996 (20%) to 2008 (47%).14
What effect on market share?
Studies on the effects that public reporting has on hospital market share have been limited.
Schneider and Epstein surveyed cardiologists in Pennsylvania in 1995 and found that 87% of them said the state’s public reporting of surgeon- and hospital-specific mortality rates for CABG had no influence or minimal influence on their referral recommendations.15
Similarly, a review of New York State’s public reporting system for CABG 15 years after its launch found that hospital performance was not associated with a subsequent change in market share, not even among those hospitals with the highest mortality rate in a given year.16 Interestingly, however, this review also showed that surgeons in the bottom performance quartile were four times as likely as other surgeons to leave practice in the year following their poor report, which is one of the most prominent outcomes associated with provider profiling reported to date.
PAY-FOR-PERFORMANCE PROGRAMS
Evidence on the impact of pay-for-performance programs in the hospital setting is even more limited than that for public reporting.
Some evidence has come from the CMS/Premier Hospital Quality Incentive Demonstration, a pay-for-performance collaboration between the Centers for Medicare and Medicaid Services (CMS) and Premier, Inc., a nationwide alliance of hospitals that promotes best practices.17 The demonstration calls for hospitals that rank in the top quintile or decile for performance to receive a 1% or 2% Medicare payment bonus for five clinical focus areas: cardiac surgery, hip and knee surgery, pneumonia, heart failure, and acute MI. Performance ratings are based primarily on process measures as well as a few clinical outcome measures. Results from the first 21 months of the demonstration showed a consistent improvement in the hospitals’ composite quality scores in each of the five clinical areas.17
It is important to recognize, however, that this improvement occurred against the backdrop of broad national adoption of public reporting of hospital quality data, which makes it difficult to tease out how much of the improvement was truly attributable to pay-for-performance, especially in the absence of a control group.
To address this question, my colleagues and I evaluated adherence to quality measures over a 2-year period at 613 hospitals participating in a national public reporting initiative,18 including 207 hospitals that simultaneously took part in the CMS/Premier Hospital Quality Incentive Demonstration’s pay-for-performance program described above. We found that the hospitals participating in both public reporting and the pay-for-performance initiative achieved only modestly greater improvements in quality than did the hospitals engaged solely in public reporting; the difference amounted to only about a 1% improvement in process measures per year.
In another controlled study, Glickman et al compared quality improvement in the management of acute MI between 54 hospitals in a CMS pay-for-performance pilot project and 446 control hospitals without pay-for-performance incentives.19 They found that the pay-for-performance hospitals achieved a statistically significantly greater degree of improvement compared with control hospitals on two of six process-of-care measures (use of aspirin at discharge and smoking-cessation counseling) but not on the composite process-of-care measure. There was no significant difference between the groups in improvements in in-hospital mortality.
Why have the effects of pay-for-performance initiatives so far been so limited? It may be that the bonuses are too small and that public reporting is already effective at stimulating quality improvement, so that the incremental benefit of adding financial incentives is small. In the case of my group’s study,18 another possible factor was that the hospitals’ baseline performance on the quality measures assessed was already high—approaching or exceeding 90% on 5 of the 10 measures—thereby limiting our power to detect differences between the groups.
CONTROVERSIES AND CHALLENGES
Many issues continue to surround public reporting and pay-for-performance programs:
- Are the measures used to evaluate health care systems suitable and evidence-based? Do they truly reflect the quality of care that providers are giving?
- Do the programs encourage “teaching to the test” rather than stimulating real and comprehensive improvement? Do they make the system prone to misuse or overuse of measured services?
- How much of the variation in hospital outcomes can be explained by the current process-of-care measures?
- Should quality be measured by outcomes or processes? Outcomes matter more to patients, but they require risk adjustment to ensure valid comparisons, and risk adjustment can be difficult and expensive to conduct.
- How much is chance a factor in apparent performance differences between hospitals?
- How much is patient selection a factor? Might public reporting lead to “cherry-picking” of low-risk patients and thereby reduce access to care for other patients?
Unidirectional measures can lead to misuse, overuse
In 2003, the Infectious Diseases Society of America updated its guidelines on community-acquired pneumonia to recommend that patients receive antibiotics within 4 hours of hospital admission. This recommendation was widely adopted as an incentive-linked performance measure by CMS and other third-party payers. Kanwar et al studied the impact of this guidelines-based incentive in a pre/post study at one large teaching hospital.20 They found that while significantly more patients received antibiotics in a timely fashion after publication of the guidelines (2005) versus before the guidelines (2003), almost one-third of patients receiving antibiotics in 2005 had normal chest radiographs and thus were not appropriate candidates for therapy. Moreover, significantly fewer patients in 2005 had a final diagnosis of pneumonia at discharge, and there was no difference between the two periods in rates of mortality or ICU transfer. The researchers concluded that linking the quality indicator of early antibiotic use to financial incentives may lead to misdiagnosis of pneumonia and inappropriate antibiotic use.
Of course, antibiotic timing is not the only quality measure subject to overuse or misuse; other measures pose similar risks, including prophylaxis for deep vein thrombosis, glycemic control measures, and target immunization rates.
More-nuanced measures needed
We must also consider how well reported quality measures actually reflect our objectives. For example, an evaluation of 962 hospitals’ performance in managing acute MI found that the publicly reported core process measures for acute MI (beta-blocker and aspirin at admission and discharge, ACE inhibitor at discharge, smoking-cessation counseling, timely reperfusion) together explained only 6% of the variance among the hospitals in risk-adjusted 30-day mortality.21 This underscores how complicated the factors affecting mortality are, and how existing process measures have only begun to scratch the surface.
How much of a role does chance play?
Another issue is the role of chance and our limited power to detect real differences in outcomes, as illustrated by an analysis by Dimick et al of all discharges from a nationally representative sample of nearly 1,000 hospitals.22 The objective was to determine whether the seven operations for which mortality is advocated as a quality indicator by the Agency for Healthcare Research and Quality are performed often enough to reliably identify hospitals with increased mortality rates. The researchers found that only for one of the seven procedures—CABG—is there sufficient caseload over a 3-year period at the majority of US hospitals to accurately detect a mortality rate twice the national average.
Although CMS is highly committed to public reporting, the comparative mortality data available on its Hospital Compare Web site are not very useful for driving consumer choice or motivating hospitals to improve. For example, of the nearly 4,500 US hospitals that reported data on 30-day mortality from MI, only 17 hospitals were considered to be better than the national average and only 7 were considered worse than the national average.4
CASE REVISITED: LESSONS FROM THE UMASS MEMORIAL EXPERIENCE
Returning to our case study, what can the UMass Memorial experience teach us, and how well does it reflect the literature about the usefulness of public reporting?
Did public reporting accelerate quality improvement efforts? Yes. Reporting led to the suspension of cardiac surgery and substantive reorganization, which is consistent with the literature.
Was the mortality reduction typical? No. An optimist’s view would be that the drastic actions spurred by the media coverage had strong effects. A skeptic might say that perhaps UMass Memorial did some “cherry-picking” of patients, or that they got better at coding procedures in a way that reflected more favorably on the hospital.
Were the declines in patient volumes predictable? No. So far, the data suggest that public reporting has its greatest effects on providers rather than on institutions. This may change, however, with the introduction of tiered copayments, whereby patients are asked to pay more if they get their care from lower rated institutions.
Would financial incentives have accelerated improvement? It is too early to tell. The evidence for pay-for-performance programs is limited, and the benefits demonstrated so far have been modest. But in many ways the alternative is worse: our current system of financing and paying for hospital care offers no financial incentives to hospitals for investing in the personnel or systems required to achieve better outcomes—and instead rewards (through supplemental payments) adverse outcomes.
Did prospective patients have a right to know? Despite the limitations of public reporting, one of the most compelling arguments in its favor is that patients at UMass Memorial had the right to know about the program’s outcomes. This alone may ultimately justify the expense and efforts involved. Transparency and accountability are core values of open democratic societies, and US society relies on public reporting in many other realms: the National Highway Traffic Safety Administration publicizes crash test ratings, the Securities and Exchange Commission enforces public reporting by financial institutions, and the Federal Aviation Administration reports on airline safety, timeliness of flights, and lost baggage rates.
FUTURE DIRECTIONS
In the future, we can expect more measurement and reporting of health care factors that patients care most about, such as clinical outcomes and the patient experience. It is likely that public reporting and pay-for-performance programs will address a broader range of conditions and comprise a larger number of measures. CMS has outlined plans to increase the number of publicly reported measures to more than 70 by 2010 and more than 100 by 2011. My hope is that this expansion of data, along with improved data synthesis and presentation, will foster greater use of publicly reported data. Further, the continued evolution of the Web and social networking sites is very likely to enhance public awareness of hospital performance and change the ways in which patients use these data.
DISCUSSION
Question from the audience: I’m concerned about what seems to be a unilateral effort to improve quality. There are many components of health care delivery beyond those you’ve described, including the efforts of patients, insurers, employers, and the government. The reality is that patients don’t plan for illness, insurance companies often deny care, more and more employers are providing less coverage or no coverage, and Medicare is on the road to insolvency. Is the battle for quality winnable when all these other components of delivery are failing?
Dr. Lindenauer: You make good points. But from the standpoint of professionalism, I think we have a compelling duty to constantly strive to improve the quality of care in our hospitals and practices. I have presented strategies for potentially accelerating improvements that providers are trying to make anyway. Public reporting and financial incentives are likely to be with us for a while, and their use is likely to grow. But as you said, they address only part of the problem confronting American health care.
Question from the audience: For the savvy health care consumer, is there one particular Web site for hospital or provider comparisons that you would especially recommend? Do you actually recommend using such Web sites to patients before they undergo certain procedures?
Dr. Lindenauer: I think the Hospital Compare site from the Department of Health and Human Services is the key Web site. The California Hospital Assessment and Reporting Taskforce (CHART) has a good site, and the Commonwealth Fund’s WhyNotTheBest.org is an interesting newcomer.
However, even the most ardent advocates for public reporting wouldn’t say the information available today is sufficient for making decisions. There’s still an important role for getting recommendations from other doctors who are familiar with local hospitals and providers.
I’m optimistic that the changes that are coming to these Web sites will provide a better user experience and make it harder to ignore the results of public reporting. Today we can say, “Hospital A is better at discharge instructions or smoking cessation counseling.” But we all can appreciate how weak those kinds of measures are because their implementation is subject to local interpretations. Once risk-adjusted outcomes and more-meaningful process measures are available, I’d be surprised if more patients weren’t willing to base their decisions on published comparisons.
- Kowalczyk L, Smith S. Hospital halts heart surgeries due to deaths: high rate cited at Worcester facility. The Boston Globe. September 22, 2005.
- Ettinger WH, Hylka SM, Phillips RA, Harrison LH Jr, Cyr JA, Sussman AJ. When things go wrong: the impact of being a statistical outlier in publicly reported coronary artery bypass graft surgery mortality data. Am J Med Qual 2008; 23:90–95.
- Leapfrog hospital quality ratings. The Leapfrog Group Web site. http://www.leapfroggroup.org/cp. Accessed June 10, 2009.
- Hospital Compare: a quality tool provided by Medicare. U.S. Department of Health & Human Services Web site. http://www.hospitalcompare.hhs.gov. Accessed June 10, 2009.
- Why Not the Best (Beta): A Health Care Quality Improvement Resource. The Commonwealth Fund. http://www.WhyNotTheBest.org. Accessed May 6, 2009.
- Hospital-acquired infections in Pennsylvania. Pennsylvania Health Care Cost Containment Council Web site. http://www.phc4.org. Accessed April 6, 2009.
- Hibbard JH, Stockard J, Tusler M. Does publicizing hospital performance stimulate quality improvement efforts? Health Aff (Millwood) 2003; 22:84–94.
- Fung CH, Lim YW, Mattke S, Damberg C, Shekelle PG. Systematic review: the evidence that publishing patient care performance data improves quality of care. Ann Intern Med 2008; 148:111–123.
- Peterson ED, DeLong ER, Jollis JG, et al. The effects of New York’s bypass surgery provider profiling on access to care and patient outcomes in the elderly. J Am Coll Cardiol 1998; 32:993–999.
- Baker DW, Einstadter D, Thomas C, et al. The effect of publicly reporting hospital performance on market share and risk-adjusted mortality at high-mortality hospitals. Med Care 2003; 41:729–740.
- Graylock J. After chest pains, Clinton set to undergo bypass surgery. USA Today. September 3, 2004.
- Adult Cardiac Surgery in New York State, 1999–2001. Albany, NY: New York State Department of Health; April 2004. http://www.health.state.ny.us/nysdoh/heart/pdf/1999-2001_cabg.pdf. Accessed June 10, 2009.
- Schneider EC, Epstein AM. Use of public performance reports: a survey of patients undergoing cardiac surgery. JAMA 1998; 279:1638–1642.
- The Henry J. Kaiser Family Foundation. 2008 Update on Consumers’ Views of Patient Safety and Quality Information: Summary & Chartpack; October 2008. http://www.kff.org/kaiserpolls/upload/7819.pdf. Accessed June 10, 2009.
- Schneider EC, Epstein AM. Influence of cardiac-surgery performance reports on referral practices and access to care: a survey of cardiovascular specialists. N Engl J Med 1996; 335:251–256.
- Jha AK, Epstein AM. The predictive accuracy of the New York State coronary artery bypass surgery report-card system. Health Aff (Millwood) 2006; 25:844–855.
- Remus D. Pay for performance: CMS/Premier Hospital Quality Incentive Demonstration Project—year 1 results, December 2005. PowerPoint presentation available at: http://www.premierinc.com/quality-safety/tools-services/p4p/hqi/results/index.jsp. Accessed June 10, 2009.
- Lindenauer PK, Remus D, Roman S, et al. Public reporting and pay for performance in hospital quality improvement. N Engl J Med 2007; 356:486–496.
- Glickman SW, Ou FS, DeLong ER, et al. Pay for performance, quality of care, and outcomes in acute myocardial infarction. JAMA 2007; 297:2373–2380.
- Kanwar M, Brar N, Khatib R, Fakih MG. Misdiagnosis of community-acquired pneumonia and inappropriate utilization of antibiotics: side effects of the 4-h antibiotic administration rule. Chest 2007; 131:1865–1869.
- Bradley EH, Herrin J, Elbel B, et al. Hospital quality for acute myocardial infarction: correlation among process measures and relationship with short-term mortality. JAMA 2006; 296:72–78.
- Dimick JB, Welch HG, Birkmeyer JD. Surgical mortality as an indicator of hospital quality: the problem with small sample size. JAMA 2004; 292:847–851.
KEY POINTS
- Public reporting programs have expanded in recent years, driven by national policy imperatives to improve safety, increased demands for transparency, patient “consumerism,” and the growth of information technology.
- Hospital-based pay-for-performance programs have had only a minor impact on quality so far, possibly because financial incentives have been small and much of the programs’ potential benefit may be preempted by existing public reporting efforts.
- These programs have considerable potential to accelerate improvement in quality but are limited by a need for more-nuanced process measures and better risk-adjustment methods.
- These programs may lead to unintended consequences such as misuse or overuse of measured services, “cherry-picking” of low-risk patients, or misclassification of providers.
- Continued growth of the Internet and social-networking sites will likely enhance and change the way patients use and share information about the quality of health care.
Cardiac risk stratification for noncardiac surgery
In patients undergoing noncardiac surgery, preoperative intervention for a cardiac condition is rarely needed simply to reduce the risk of the surgery unless such intervention is indicated separate from the preoperative context.
This is the overriding message of the 2007 guidelines on perioperative cardiovascular evaluation and care for noncardiac surgery issued by the American College of Cardiology (ACC) and American Heart Association (AHA),1 for which I was privileged to chair the writing committee. This article outlines current best practices in cardiac risk stratification for noncardiac surgery, highlighting key recommendations from the ACC/AHA 2007 perioperative guidelines.
PURPOSE OF THE PREOPERATIVE CARDIAC EVALUATION
Provide clinical judgment, not clearance for surgery
A proper cardiac evaluation prior to noncardiac surgery involves a comprehensive patient assessment that draws on clinical findings, the clinical experience of the consulting physician (typically a cardiologist or internist), and an assessment of the literature. The purpose is not to give medical clearance for surgery but rather to provide informed clinical judgment to the anesthesiologist and the surgical team in terms of the following1:
- The patient’s current medical status
- Recommendations regarding the management and risk of cardiac problems during the perioperative period
- The patient’s clinical risk profile, to assist with treatment decisions that may affect short- or long-term cardiac outcomes.
Order tests only when results may change management
The consulting physician’s clinical judgment is critical in determining the need to order any specific tests. In general, a test to further define cardiac risk is valid only when its results could change the planned management and lead to a specific intervention. Potential interventions that may result from knowledge gained through testing include:
- Delaying the operation because of unstable symptoms
- Coronary revascularization
- Attempting medical optimization before surgery
- Involving additional specialists or providers in the patient’s perioperative care
- Modification of intraoperative monitoring
- Modification of postoperative monitoring
- Modification of the surgical location, particularly when the procedure is scheduled for an ambulatory surgical center.
The cardiac evaluation should result in an estimation of cardiac risk. If the consulting physician’s estimation of risk is not clearly above or below the threshold for a potential intervention, then further testing may be indicated to further define the need for interventions (ie, reaching the threshold for action).
WHAT TO WORRY ABOUT FIRST: HIGH-RISK CONDITIONS THAT REQUIRE EVALUATION AND TREATMENT
In a recommendation categorized as a Class I, Level B endorsement,* the ACC/AHA 2007 perioperative guidelines specify four active cardiac conditions for which an evaluation and treatment are required before noncardiac surgery1:
- Unstable coronary syndromes, including unstable or severe angina or recent myocardial infarction (MI). These syndromes should be the first and most important consideration. Unstable angina is a hypercoagulable state, as is recent MI. The hypercoagulability of these conditions is compounded by the hypercoagulability induced by the perioperative setting itself. As a result, the rate of perioperative MI or death in the setting of unstable angina is as high as 28%.2 In the case of unstable coronary syndromes, delaying surgery is appropriate if the risks of the surgery are deemed greater than its potential benefits.
- Decompensated heart failure, defined as New York Heart Association functional class IV disease or worsening or new-onset heart failure.
- Significant arrhythmias, defined as high-grade or Mobitz II atrioventricular block, third-degree atrioventricular heart block, symptomatic ventricular arrhythmias, supraventricular arrhythmias with uncontrolled ventricular rate, symptomatic bradycardia, and newly recognized ventricular tachycardia.
- Severe valvular disease, defined as severe aortic stenosis and symptomatic mitral stenosis.
(*The ACC/AHA 2007 perioperative guidelines make recommendations by classifying the magnitude of benefit versus risk [I = the intervention should be undertaken; IIa = the intervention is reasonable to undertake; IIb = the intervention may be considered; III = the intervention should not be undertaken] and assigning a level of supporting evidence [A = highest level of evidence; B = limited evidence; C = very limited evidence].)
CARDIAC RISK STRATIFICATION: INITIAL PATIENT ASSESSMENT
Clinical risk factors and functional capacity
The Revised Cardiac Risk Index of Lee et al3 remains the general paradigm for stratifying cardiac risk before noncardiac surgery. This validated index consists of six independent predictors of cardiac complications:
- High-risk surgery (intraperitoneal, intrathoracic, or suprainguinal vascular procedures)
- Ischemic heart disease
- History of congestive heart failure
- History of cerebrovascular disease
- Insulin therapy for diabetes mellitus
- Preoperative creatinine level greater than 2.0 mg/dL.
The more predictors a patient has, the greater the risk of perioperative complications. Thus, the Revised Cardiac Risk Index is a good tool for establishing a baseline risk level for use in determining whether a preoperative or perioperative intervention is likely to make a difference in the patient’s surgical outcome. For the purpose of the algorithmic approach to testing, the surgical procedure is not considered a risk factor. Additionally, type 2 diabetes mellitus is also considered a risk factor.
Another important determinant of risk is the patient’s functional capacity. A study of 600 patients undergoing major noncardiac procedures found that poor self-reported exercise capacity, defined as an inability to walk four blocks or climb two flights of stairs, was associated with significantly more perioperative complications than was good exercise capacity.4 Simple instruments such as the Duke Activity Status Index5 can be used to estimate the patient’s functional capacity.
Procedure-specific risk
In addition to patient-specific factors, surgery-specific cardiac risk can be important, especially in patients with more than two clinical risk factors. The ACC/AHA 2007 perioperative guidelines identify three categories of surgery-specific risk1:
- Vascular surgery (the highest-risk category and also the most extensively studied), which has been associated with cardiac morbidity rates of greater than 5% in many reports. Examples include aortic and other major vascular surgery, as well as peripheral vascular surgery.
- Intermediate-risk surgery, for which reported cardiac morbidity rates range from 1% to 5%. Examples include intraperitoneal and intrathoracic procedures, carotid endarterectomy, head and neck surgery, orthopedic surgery, and prostate surgery.
- Low-risk surgery, for which reported cardiac morbidity rates are generally below 1%. Examples include endoscopic and superficial procedures, cataract surgery, breast surgery, and ambulatory surgery. Patients undergoing these procedures do not generally require further preoperative cardiac testing.1
Of course, some variability exists within each risk level as a result of institutional differences in surgical volume and expertise as well as in preoperative evaluation and other processes of care. Endovascular surgery is considered intermediate risk from a perioperative perspective but is in the same risk category as vascular surgery from a 1-year perspective.
Risk stratification promotes good perioperative outcomes
Appropriate risk stratification can make the day of surgery among the safest times for patients undergoing outpatient procedures. A retrospective analysis of Medicare claims from the late 1990s for more than 500,000 elderly patients undergoing low-risk procedures in various outpatient settings found that the mortality rate was only 1 in 50,000 on the day of surgery but increased substantially over the following 7 days and 30 days.6 This was likely a reflection of the diligence applied to managing patient-specific risk factors before proceeding to outpatient surgery.
HEART RATE CONTROL
Chronic beta-blockade can obviate need for cardiac testing
The DECREASE (Dutch Echocardiographic Cardiac Risk Evaluation Applying Strees Echo) II trial assessed the value of cardiac testing before major vascular surgery in intermediate-risk patients (ie, with one or two cardiac risk factors) receiving chronic beta-blocker therapy begun 7 to 30 days prior to surgery.7 Among the study’s 770 intermediate-risk patients, the primary outcome—cardiac death or MI at 30 days—was no different between those randomized to receive stress testing or no stress testing. The investigators concluded that cardiac testing can safely be omitted in intermediate-risk patients if beta-blockers are used with the aim of tight heart rate control.
Continue ongoing beta-blocker therapy, start in select high-risk patients
The ACC/AHA 2007 perioperative guidelines recommend continuing beta-blocker therapy in patients who are already receiving these agents (Class I, Level C). For patients not already taking beta-blockers, their initiation is recommended in those undergoing vascular surgery who have ischemia on preoperative testing (Class I, Level B). The guidelines designate beta-blockers as “probably” recommended (Class IIa, Level B) for several other patient subgroups with high cardiac risk, mainly in the setting of vascular surgery.1
Notably, the guidelines were written before publication of the Perioperative Ischemic Evaluation (POISE),8 which questioned the risk/benefit profile of perioperative beta-blockade in patients with or at high risk of atherosclerotic disease (see the Poldermans–Devereaux debate on page S84 of this supplement), and therefore may require revision (an update is scheduled for release in November 2009).
LIMITED ROLE FOR CORONARY REVASCULARIZATION
Until recently, no randomized trials had assessed the benefit of prophylactic coronary revascularization to reduce the perioperative risk of noncardiac surgery. The first large such trial was the Coronary Artery Revascularization Prophylaxis (CARP) study, which randomized 510 patients scheduled for major elective vascular surgery to undergo or not undergo coronary artery revascularization before the procedure.9 The study found that revascularization failed to affect any outcome measure, including mortality or the development of MI, out to 6 years of follow-up. Notably, the CARP population consisted mostly of patients with single-, double-, or mild triple-vessel coronary artery disease, so the study was limited in that it did not include patients with strong indications for coronary artery bypass graft surgery (CABG).7
A reanalysis of the CARP results by the type of revascularization procedure—CABG or percutaneous coronary intervention (PCI)—revealed that patients undergoing CABG had lower rates of death, MI, and additional revascularization procedures compared with those undergoing PCI, despite the presumably more extensive disease of the CABG recipients.10
Benefit apparently limited to left main disease
Further analysis of patients in the CARP trial who underwent coronary angiography found that one subgroup—patients with left main disease—did experience an improvement in survival with preoperative coronary revascularization.11
In a subsequent randomized pilot study, Poldermans et al found no advantage to preoperative coronary revascularization among patients with extensive ischemia who underwent major vascular surgery.12 While this study was not adequately sized to definitively address the value of preoperative revascularization in these high-risk patients, its results are consistent with those of the CARP trial.
In a retrospective cohort study of patients who underwent noncardiac surgery, Posner and colleagues found that rates of adverse cardiac outcomes among patients who had recent PCI (≤ 90 days before surgery) were similar to rates among matched controls with nonrevascularized coronary disease.13 Patients who had had remote PCI (> 90 days before surgery) had a lower risk of poor outcomes than did matched controls with nonrevascularized disease, but had a higher risk than did controls without coronary disease.13
PATIENTS WITH CORONARY STENTS: STENT TYPE AND TIME SINCE PLACEMENT ARE KEY
The lack of benefit from prophylactic PCI prior to noncardiac surgery also applies to PCI procedures that involve coronary stent placement. For instance, a propensity-score analysis found no benefit from prophylactic PCI (using stents in the vast majority of cases) in patients with coronary artery disease in terms of adverse coronary events or death following aortic surgery.14
In patients who have undergone prior PCI, noncardiac surgery poses special challenges, especially in relation to stents. Restenosis is a particular concern with the use of bare-metal stents, and development of stent thrombosis is a particular risk with the use of drug-eluting stents.15 The use of drug-eluting stents requires intensive antiplatelet therapy for at least 1 year following stent implantation to prevent stent thrombosis.16
Time interval to surgery after bare-metal stent placement
The effect of prior PCI with bare-metal stents on outcomes following noncardiac surgery was examined in a recent large retrospective study by Nuttall et al.17 The incidence of major cardiac events was found to be lowest when noncardiac surgery was performed more than 90 days after PCI with bare-metal stents. Using patients who had a greater than 90-day interval before surgery as the reference group, propensity analysis showed that performing surgery within 30 days of PCI was associated with an odds ratio of 3.6 for major cardiac events. The odds ratio was reduced to 1.6 when surgery was performed 31 to 90 days after PCI. These findings suggest that 30 days may be an ideal minimum time interval, from a risk/benefit standpoint, between PCI with bare-metal stents and noncardiac surgery.
Time interval to surgery after drug-eluting stent placement
A recent retrospective study by Rabbitts et al examined patients who had noncardiac surgery after prior PCI with drug-eluting stents, focusing on the relationship between the timing of the procedures and major cardiac events during hospitalization for the surgery.18 Although the frequency of major cardiac events was not statistically significantly associated with the time between stent placement and surgery, the frequency was lowest—3.3%—when surgery followed drug-eluting stent placement by more than 365 days (versus rates of 5.7% to 6.4% for various intervals of less than 365 days).
ACC/AHA recommendations
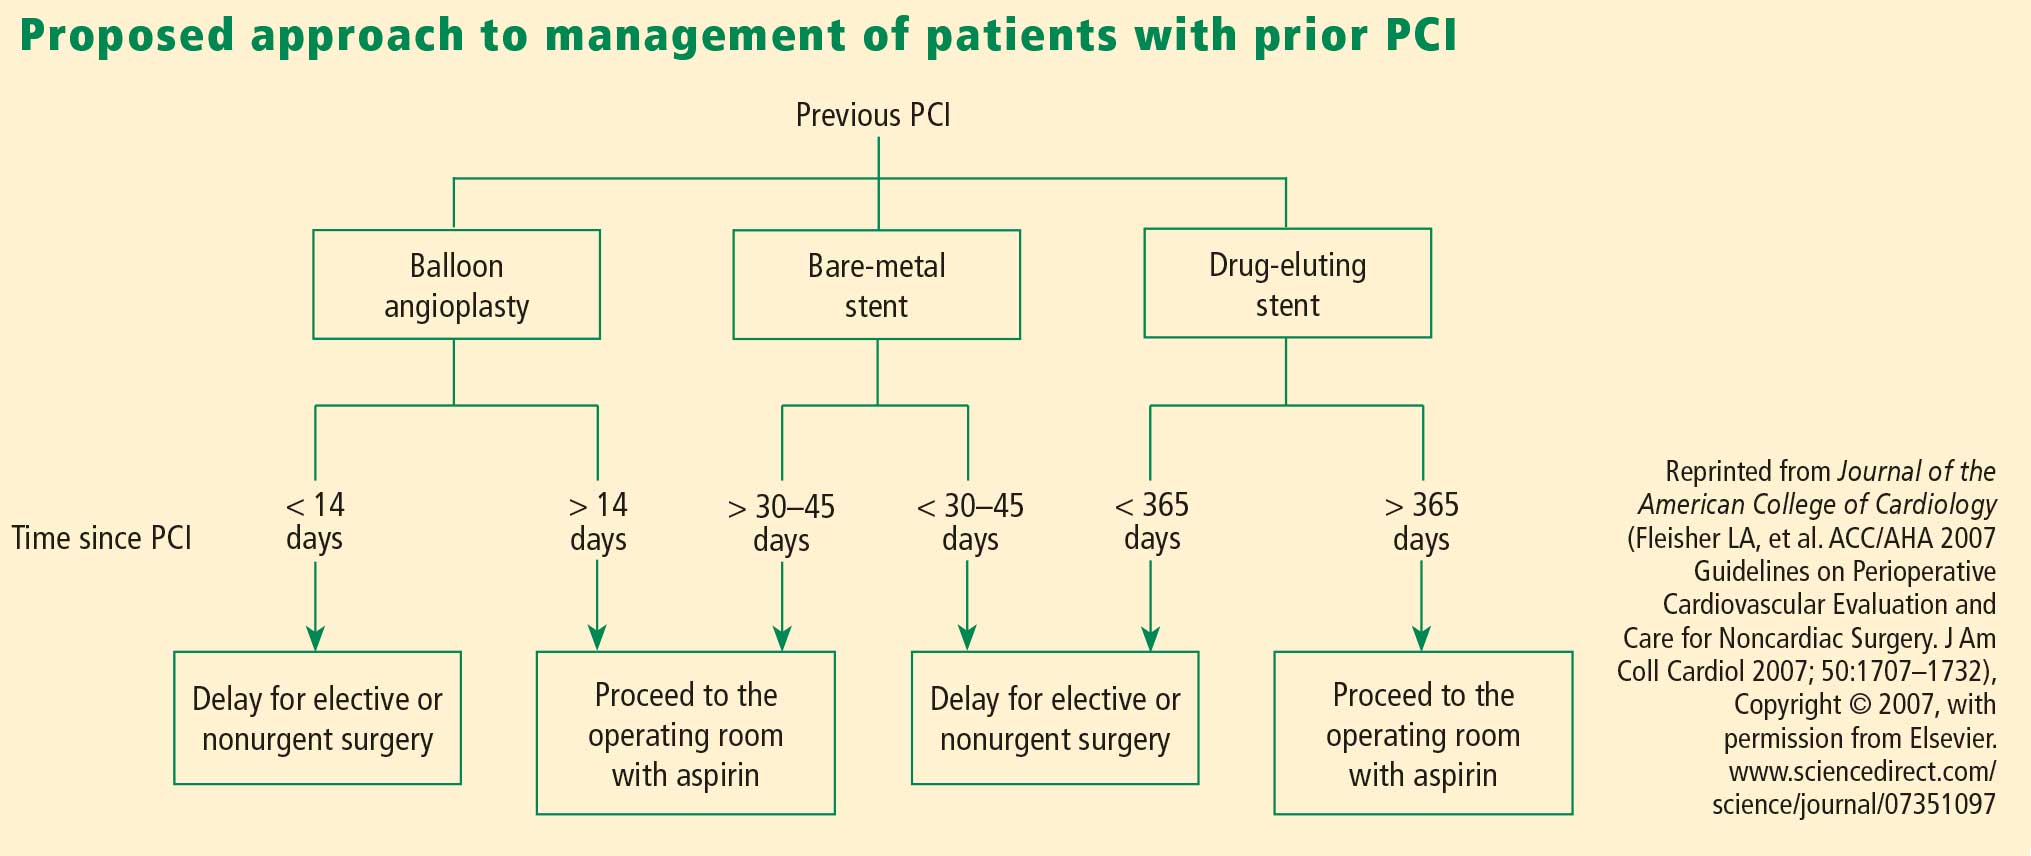
Timing of antiplatelet interruption
Results from a prospectively maintained Dutch registry19 are consistent with the findings reviewed above: patients who underwent noncardiac surgery less than 30 days after bare-metal stent implantation or less than 6 months after drug-eluting stent implantation (early surgery group) had a significantly elevated rate of major cardiac events compared with patients in whom the interval between stenting and noncardiac surgery was longer (late surgery group). Notably, this report also found that the rate of major cardiac events within the early surgery group was significantly higher in patients whose antiplatelet therapy was discontinued during the preoperative period than in those whose antiplatelet therapy was not stopped.19
A hypercoagulable state develops within 7 to 10 days after interruption of antiplatelet therapy, at which time the patient is vulnerable to thrombosis. In general, surgery should not proceed during this time without antiplatelet coverage.
From my perspective, giving ketorolac or aspirin the morning of surgery may be beneficial for patients whose antiplatelet therapy has been stopped 7 to 10 days previously, although no data from randomized trials exist to support this practice. Theoretically, it is reasonable to stop antiplatelet therapy 4 to 5 days before surgery in patients with an increased risk of bleeding without exposing them to the hypercoagulability that would set in if therapy were stopped earlier.
A FRAMEWORK FOR CARDIAC EVALUATION
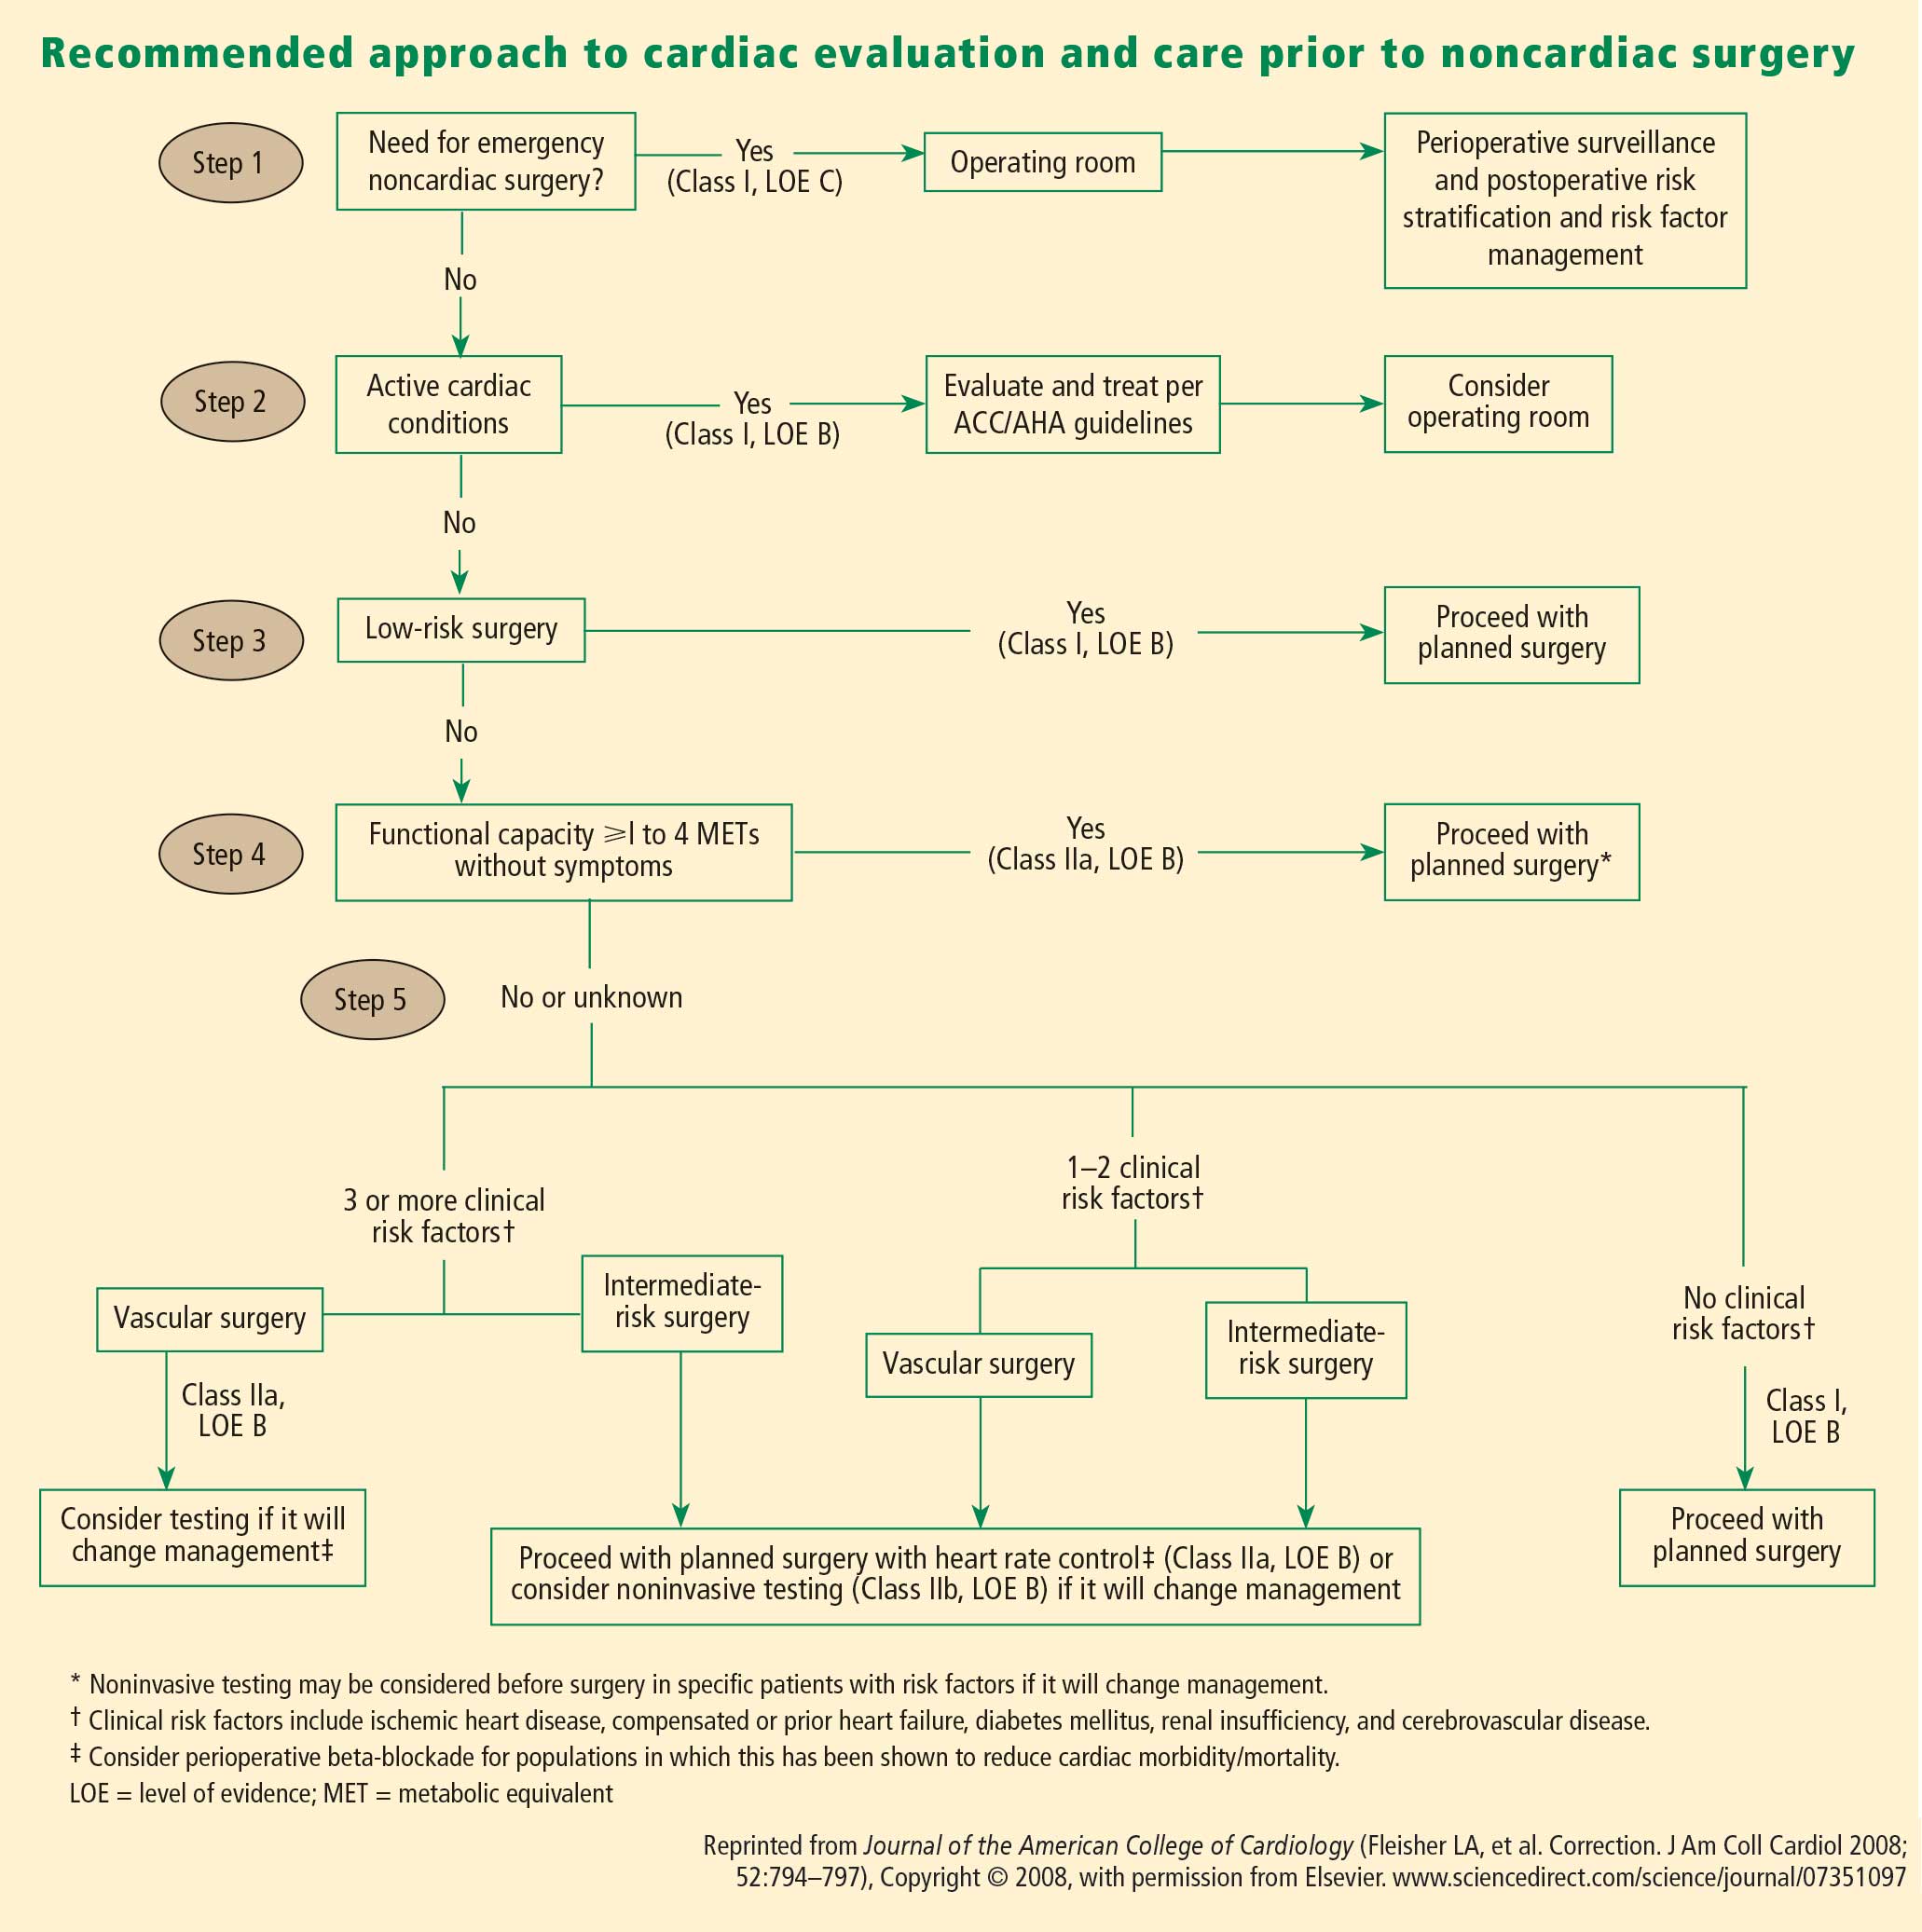
The following are among the algorithm’s key recommendations:
- Patients requiring urgent noncardiac surgery should proceed to the operating room with perioperative surveillance (Class I, Level C).
- Patients with active cardiac conditions who are undergoing nonurgent surgery should be evaluated and treated per ACC/AHA guidelines before proceeding to the operating room is considered (Class I, Level B).
- Patients scheduled for a low-risk procedure can proceed to surgery without testing (Class I, Level B).
- Patients scheduled for intermediate-risk surgery or vascular surgery are to be assessed by functional capacity and clinical risk factors. Proceeding with planned surgery is appropriate in patients with good functional capacity (Class IIa, Level B). In patients with poor or unknown functional capacity undergoing vascular surgery who have three or more clinical risk factors, testing should be considered if the results would change management (Class IIa, Level B).
- Patients with one or more clinical risk factors undergoing intermediate-risk surgery and those with fewer than three clinical risk factors undergoing vascular surgery may proceed to planned surgery with control of heart rate to diminish the stress response perioperatively (Class IIa, Level B), or they may undergo noninvasive testing, but only if the results would change management (Class IIb, Level B).
- Patients undergoing intermediate-risk or vascular surgery who have poor or unknown functional capacity but no clinical risk factors may proceed to surgery without testing (Class I, Level B).
DISCUSSION
Question from the audience: The POISE study showed a 30% reduction in nonfatal MI with routine perioperative beta-blockade but an overall increase in mortality. Since most MIs occur immediately postoperatively and sepsis occurs a bit later, would you consider continuing beta-blocker therapy for a few days to prevent an MI but then stopping it before sepsis develops?
Dr. Fleisher: I’ve had discussions with sepsis experts about the link between beta-blocker therapy and sepsis and death in POISE, and the belief is that beta-blockers do not cause sepsis. I think that a septic patient on acute high-dose beta-blocker therapy can’t respond appropriately because of an inability to increase cardiac output. I believe we should titrate beta-blockers more closely. Information on preoperative dose titration in POISE is not available because of the way the trial was designed. Sepsis developed in only 53 of the 8,351 patients randomized in the study.
I would not start an acute beta-blocker protocol just to get a patient through surgery. I would start a perioperative hemodynamic protocol with the goal of maintaining the patient’s heart rate at lower than 80 beats per minute. Because I don’t believe that beta-blockers cause sepsis, if I initiated a beta-blocker preoperatively, I would not stop it at 2 days.
Question from the audience: Is there a time period during which a patient with a bare-metal stent could have back surgery or knee replacement surgery while not on aspirin?
Dr. Fleisher: The guidelines say that if a patient is on aspirin, it should be continued indefinitely. The issue is one of risk versus benefit. For back surgery, if bleeding is a concern, stopping aspirin for 6 or 7 days after the 30-day period following PCI is not unreasonable, but I would not stop it during the first 30 days following PCI.
Question from the audience: I don’t assess for vascular surgery but rather for the Whipple procedure [radical pancreatoduodenectomy], and I use the Revised Cardiac Risk Index to assess the number of risk factors. I believe the Whipple procedure is a high-risk operation, but it appears to be considered an intermediate-risk operation by the ACC/AHA guidelines. Is my approach to risk assessment appropriate?
Dr. Fleisher: If the rates of morbidity and mortality with the Whipple procedure are low at your institution, you might risk worsening your outcomes by applying someone else’s paradigms to your institution. There’s a big difference in risk between a surgeon who does a Whipple in 5 hours with 0.5 to 1.0 U of blood loss and a surgeon who does a 12-hour Whipple with 20 U of blood loss, necessitating a stay in the intensive care unit for multiple days. You need to consider the risk associated with your institution and specifically with the surgeon.
Question from the audience: Peripheral vascular disease is considered a coronary heart disease risk equivalent, so why is it not one of the criteria in the Revised Cardiac Risk Index?
Dr. Fleisher: The criteria are not hard and fast. The index was devised at one institution, Brigham and Women’s Hospital, in about 4,000 patients, and it has been used differently. It assigns 1 point to ischemic heart disease. It would not be inappropriate to assume that any atherosclerotic class of disease is equivalent to ischemic heart disease for risk purposes.
Question from the audience: You mentioned a 4-day window for withholding clopidogrel. Do you factor into the decision the duration of therapy? Some cardiologists go beyond the 1-year recommendation to continue clopidogrel after stenting because they believe there is still benefit.
Dr. Fleisher: The key is to confer with the cardiologist who implanted the stent, who knows the stenosis for which the stent was implanted. A problem we’ve had for years is that a practitioner will stop the antiplatelet agent without having spoken to the surgeon or the anesthesiologist. As an anesthesiologist, I need to know that someone has done a risk/benefit assessment of whether to continue antiplatelet agents in a given patient.
Question from the audience: The Revised Cardiac Risk Index of Lee et al3 includes the type of surgery in its total point system while the ACC/AHA guidelines do not. Can you explain the discrepancy?
Dr. Fleisher: We on the writing committee for the ACC/AHA 2007 perioperative guidelines made a decision to pull out the type of surgery and use the other five risk factors of Lee et al. It was a consensus of the committee because we believed that the complexity of the surgery itself is a separate consideration for risk. That’s why we included the medical risk factors and considered the surgical factors separately.
- Fleisher LA, Beckman JA, Brown KA, et al. ACC/AHA 2007 guidelines on perioperative cardiovascular evaluation and care for noncardiac surgery: a report of the American College of Cardiology/American Heart Association Task Force on Practice Guidelines [published correction appears in J Am Coll Cardiol 2008; 52:794–797]. J Am Coll Cardiol 2007; 50:1707–1732.
- Shah KB, Kleinman BS, Rao TLK, Jacobs HK, Mestan K, Schaafsma M. Angina and other risk factors in patients with cardiac diseases undergoing noncardiac operations. Anesth Analg 1990; 70:240–247.
- Lee TH, Marcantonio ER, Mangione CM, et al. Derivation and prospective validation of a simple index for prediction of cardiac risk of major noncardiac surgery. Circulation 1999; 100:1043–1049.
- Reilly DF, McNeely MJ, Doerner D, et al. Self-reported exercise tolerance and the risk of serious perioperative complications. Arch Intern Med 1999; 159:2185–2192.
- Nelson CL, Herndon JE, Mark DB, et al. Relation of clinical and angiographic factors to functional capacity as measured by the Duke Activity Status Index. Am J Cardiol 1991; 68:973–975.
- Fleisher LA, Pasternak LR, Herbert R, Anderson GF. Inpatient hospital admission and death after outpatient surgery in elderly patients: importance of patient and system characteristics and location of care. Arch Surg 2004; 139:67–72.
- Poldermans D, Bax JJ, Schouten O, et al. Should major vascular surgery be delayed because of preoperative cardiac testing in intermediate-risk patients receiving beta-blocker therapy with tight heart rate control? J Am Coll Cardiol 2006; 48:964–969.
- POISE Study Group, Devereaux PJ, Yang H, Yusuf S, et al. Effects of extended-release metoprolol succinate in patients undergoing non-cardiac surgery (POISE trial): a randomized controlled trial. Lancet 2008; 371:1839–1847.
- McFalls EO, Ward HB, Moritz TE, et al. Coronary-artery revascularization before elective major vascular surgery. N Engl J Med 2004; 351:2795–2804.
- Ward HB, Kelly RF, Thottapurathu L, et al. Coronary artery bypass grafting is superior to percutaneous coronary intervention in prevention of perioperative myocardial infarctions during subsequent vascular surgery. Ann Thorac Surg 2006; 82:795–801.
- Garcia S, Moritz TE, Ward HB, et al. Usefulness of revascularization of patients with multivessel coronary artery disease before elective vascular surgery for abdominal aortic and peripheral occlusive disease. Am J Cardiol 2008; 102:809–813.
- Poldermans D, Schouten O, Vidakovic R, et al. A clinical randomized trial to evaluate the safety of a noninvasive approach in high-risk patients undergoing major vascular surgery: the DECREASE-V Pilot Study. J Am Coll Cardiol 2007; 49:1763–1769.
- Posner KL, Van Norman GA, Chan V. Adverse cardiac outcomes after noncardiac surgery in patients with prior percutaneous transluminal coronary angioplasty. Anesth Analg 1999; 89:553–560.
- Godet G, Riou B, Bertrand M, et al. Does preoperative coronary angioplasty improve perioperative cardiac outcome? Anesthesiology 2005; 102:739–746.
- Shuchman M. Debating the risks of drug-eluting stents. N Engl J Med 2007; 356:325–328.
- King SB III, Smith SC Jr, Hirshfeld JW Jr, et al. ACC/AHA/SCAI. 2007 focused update of the ACC/AHA/SCAI 2005 guideline update for percutaneous coronary intervention: a report of the American College of Cardiology/American Heart Association Task Force on Practice guidelines. J Am Coll Cardiol 2008; 51:172–209.
- Nuttall GA, Brown MJ, Stombaugh JW, et al. Time and cardiac risk of surgery after bare-metal stent percutaneous coronary intervention. Anesthesiology 2008; 109:588–595.
- Rabbitts JA, Nuttall GA, Brown MJ, et al. Cardiac risk of noncardiac surgery after percutaneous coronary intervention with drug-eluting stents. Anesthesiology 2008; 109:596–604.
- Schouten O, van Domburg RT, Bax JJ, et al. Noncardiac surgery after coronary stenting: early surgery and interruption of antiplatelet therapy are associated with an increase in major adverse cardiac events. J Am Coll Cardiol 2007; 49:122–124.
- Correction to Fleisher et al, J Am Coll Cardiol 2007; 50:1707–1732. J Am Coll Cardiol 2008; 52:794–797.
In patients undergoing noncardiac surgery, preoperative intervention for a cardiac condition is rarely needed simply to reduce the risk of the surgery unless such intervention is indicated separate from the preoperative context.
This is the overriding message of the 2007 guidelines on perioperative cardiovascular evaluation and care for noncardiac surgery issued by the American College of Cardiology (ACC) and American Heart Association (AHA),1 for which I was privileged to chair the writing committee. This article outlines current best practices in cardiac risk stratification for noncardiac surgery, highlighting key recommendations from the ACC/AHA 2007 perioperative guidelines.
PURPOSE OF THE PREOPERATIVE CARDIAC EVALUATION
Provide clinical judgment, not clearance for surgery
A proper cardiac evaluation prior to noncardiac surgery involves a comprehensive patient assessment that draws on clinical findings, the clinical experience of the consulting physician (typically a cardiologist or internist), and an assessment of the literature. The purpose is not to give medical clearance for surgery but rather to provide informed clinical judgment to the anesthesiologist and the surgical team in terms of the following1:
- The patient’s current medical status
- Recommendations regarding the management and risk of cardiac problems during the perioperative period
- The patient’s clinical risk profile, to assist with treatment decisions that may affect short- or long-term cardiac outcomes.
Order tests only when results may change management
The consulting physician’s clinical judgment is critical in determining the need to order any specific tests. In general, a test to further define cardiac risk is valid only when its results could change the planned management and lead to a specific intervention. Potential interventions that may result from knowledge gained through testing include:
- Delaying the operation because of unstable symptoms
- Coronary revascularization
- Attempting medical optimization before surgery
- Involving additional specialists or providers in the patient’s perioperative care
- Modification of intraoperative monitoring
- Modification of postoperative monitoring
- Modification of the surgical location, particularly when the procedure is scheduled for an ambulatory surgical center.
The cardiac evaluation should result in an estimation of cardiac risk. If the consulting physician’s estimation of risk is not clearly above or below the threshold for a potential intervention, then further testing may be indicated to further define the need for interventions (ie, reaching the threshold for action).
WHAT TO WORRY ABOUT FIRST: HIGH-RISK CONDITIONS THAT REQUIRE EVALUATION AND TREATMENT
In a recommendation categorized as a Class I, Level B endorsement,* the ACC/AHA 2007 perioperative guidelines specify four active cardiac conditions for which an evaluation and treatment are required before noncardiac surgery1:
- Unstable coronary syndromes, including unstable or severe angina or recent myocardial infarction (MI). These syndromes should be the first and most important consideration. Unstable angina is a hypercoagulable state, as is recent MI. The hypercoagulability of these conditions is compounded by the hypercoagulability induced by the perioperative setting itself. As a result, the rate of perioperative MI or death in the setting of unstable angina is as high as 28%.2 In the case of unstable coronary syndromes, delaying surgery is appropriate if the risks of the surgery are deemed greater than its potential benefits.
- Decompensated heart failure, defined as New York Heart Association functional class IV disease or worsening or new-onset heart failure.
- Significant arrhythmias, defined as high-grade or Mobitz II atrioventricular block, third-degree atrioventricular heart block, symptomatic ventricular arrhythmias, supraventricular arrhythmias with uncontrolled ventricular rate, symptomatic bradycardia, and newly recognized ventricular tachycardia.
- Severe valvular disease, defined as severe aortic stenosis and symptomatic mitral stenosis.
(*The ACC/AHA 2007 perioperative guidelines make recommendations by classifying the magnitude of benefit versus risk [I = the intervention should be undertaken; IIa = the intervention is reasonable to undertake; IIb = the intervention may be considered; III = the intervention should not be undertaken] and assigning a level of supporting evidence [A = highest level of evidence; B = limited evidence; C = very limited evidence].)
CARDIAC RISK STRATIFICATION: INITIAL PATIENT ASSESSMENT
Clinical risk factors and functional capacity
The Revised Cardiac Risk Index of Lee et al3 remains the general paradigm for stratifying cardiac risk before noncardiac surgery. This validated index consists of six independent predictors of cardiac complications:
- High-risk surgery (intraperitoneal, intrathoracic, or suprainguinal vascular procedures)
- Ischemic heart disease
- History of congestive heart failure
- History of cerebrovascular disease
- Insulin therapy for diabetes mellitus
- Preoperative creatinine level greater than 2.0 mg/dL.
The more predictors a patient has, the greater the risk of perioperative complications. Thus, the Revised Cardiac Risk Index is a good tool for establishing a baseline risk level for use in determining whether a preoperative or perioperative intervention is likely to make a difference in the patient’s surgical outcome. For the purpose of the algorithmic approach to testing, the surgical procedure is not considered a risk factor. Additionally, type 2 diabetes mellitus is also considered a risk factor.
Another important determinant of risk is the patient’s functional capacity. A study of 600 patients undergoing major noncardiac procedures found that poor self-reported exercise capacity, defined as an inability to walk four blocks or climb two flights of stairs, was associated with significantly more perioperative complications than was good exercise capacity.4 Simple instruments such as the Duke Activity Status Index5 can be used to estimate the patient’s functional capacity.
Procedure-specific risk
In addition to patient-specific factors, surgery-specific cardiac risk can be important, especially in patients with more than two clinical risk factors. The ACC/AHA 2007 perioperative guidelines identify three categories of surgery-specific risk1:
- Vascular surgery (the highest-risk category and also the most extensively studied), which has been associated with cardiac morbidity rates of greater than 5% in many reports. Examples include aortic and other major vascular surgery, as well as peripheral vascular surgery.
- Intermediate-risk surgery, for which reported cardiac morbidity rates range from 1% to 5%. Examples include intraperitoneal and intrathoracic procedures, carotid endarterectomy, head and neck surgery, orthopedic surgery, and prostate surgery.
- Low-risk surgery, for which reported cardiac morbidity rates are generally below 1%. Examples include endoscopic and superficial procedures, cataract surgery, breast surgery, and ambulatory surgery. Patients undergoing these procedures do not generally require further preoperative cardiac testing.1
Of course, some variability exists within each risk level as a result of institutional differences in surgical volume and expertise as well as in preoperative evaluation and other processes of care. Endovascular surgery is considered intermediate risk from a perioperative perspective but is in the same risk category as vascular surgery from a 1-year perspective.
Risk stratification promotes good perioperative outcomes
Appropriate risk stratification can make the day of surgery among the safest times for patients undergoing outpatient procedures. A retrospective analysis of Medicare claims from the late 1990s for more than 500,000 elderly patients undergoing low-risk procedures in various outpatient settings found that the mortality rate was only 1 in 50,000 on the day of surgery but increased substantially over the following 7 days and 30 days.6 This was likely a reflection of the diligence applied to managing patient-specific risk factors before proceeding to outpatient surgery.
HEART RATE CONTROL
Chronic beta-blockade can obviate need for cardiac testing
The DECREASE (Dutch Echocardiographic Cardiac Risk Evaluation Applying Strees Echo) II trial assessed the value of cardiac testing before major vascular surgery in intermediate-risk patients (ie, with one or two cardiac risk factors) receiving chronic beta-blocker therapy begun 7 to 30 days prior to surgery.7 Among the study’s 770 intermediate-risk patients, the primary outcome—cardiac death or MI at 30 days—was no different between those randomized to receive stress testing or no stress testing. The investigators concluded that cardiac testing can safely be omitted in intermediate-risk patients if beta-blockers are used with the aim of tight heart rate control.
Continue ongoing beta-blocker therapy, start in select high-risk patients
The ACC/AHA 2007 perioperative guidelines recommend continuing beta-blocker therapy in patients who are already receiving these agents (Class I, Level C). For patients not already taking beta-blockers, their initiation is recommended in those undergoing vascular surgery who have ischemia on preoperative testing (Class I, Level B). The guidelines designate beta-blockers as “probably” recommended (Class IIa, Level B) for several other patient subgroups with high cardiac risk, mainly in the setting of vascular surgery.1
Notably, the guidelines were written before publication of the Perioperative Ischemic Evaluation (POISE),8 which questioned the risk/benefit profile of perioperative beta-blockade in patients with or at high risk of atherosclerotic disease (see the Poldermans–Devereaux debate on page S84 of this supplement), and therefore may require revision (an update is scheduled for release in November 2009).
LIMITED ROLE FOR CORONARY REVASCULARIZATION
Until recently, no randomized trials had assessed the benefit of prophylactic coronary revascularization to reduce the perioperative risk of noncardiac surgery. The first large such trial was the Coronary Artery Revascularization Prophylaxis (CARP) study, which randomized 510 patients scheduled for major elective vascular surgery to undergo or not undergo coronary artery revascularization before the procedure.9 The study found that revascularization failed to affect any outcome measure, including mortality or the development of MI, out to 6 years of follow-up. Notably, the CARP population consisted mostly of patients with single-, double-, or mild triple-vessel coronary artery disease, so the study was limited in that it did not include patients with strong indications for coronary artery bypass graft surgery (CABG).7
A reanalysis of the CARP results by the type of revascularization procedure—CABG or percutaneous coronary intervention (PCI)—revealed that patients undergoing CABG had lower rates of death, MI, and additional revascularization procedures compared with those undergoing PCI, despite the presumably more extensive disease of the CABG recipients.10
Benefit apparently limited to left main disease
Further analysis of patients in the CARP trial who underwent coronary angiography found that one subgroup—patients with left main disease—did experience an improvement in survival with preoperative coronary revascularization.11
In a subsequent randomized pilot study, Poldermans et al found no advantage to preoperative coronary revascularization among patients with extensive ischemia who underwent major vascular surgery.12 While this study was not adequately sized to definitively address the value of preoperative revascularization in these high-risk patients, its results are consistent with those of the CARP trial.
In a retrospective cohort study of patients who underwent noncardiac surgery, Posner and colleagues found that rates of adverse cardiac outcomes among patients who had recent PCI (≤ 90 days before surgery) were similar to rates among matched controls with nonrevascularized coronary disease.13 Patients who had had remote PCI (> 90 days before surgery) had a lower risk of poor outcomes than did matched controls with nonrevascularized disease, but had a higher risk than did controls without coronary disease.13
PATIENTS WITH CORONARY STENTS: STENT TYPE AND TIME SINCE PLACEMENT ARE KEY
The lack of benefit from prophylactic PCI prior to noncardiac surgery also applies to PCI procedures that involve coronary stent placement. For instance, a propensity-score analysis found no benefit from prophylactic PCI (using stents in the vast majority of cases) in patients with coronary artery disease in terms of adverse coronary events or death following aortic surgery.14
In patients who have undergone prior PCI, noncardiac surgery poses special challenges, especially in relation to stents. Restenosis is a particular concern with the use of bare-metal stents, and development of stent thrombosis is a particular risk with the use of drug-eluting stents.15 The use of drug-eluting stents requires intensive antiplatelet therapy for at least 1 year following stent implantation to prevent stent thrombosis.16
Time interval to surgery after bare-metal stent placement
The effect of prior PCI with bare-metal stents on outcomes following noncardiac surgery was examined in a recent large retrospective study by Nuttall et al.17 The incidence of major cardiac events was found to be lowest when noncardiac surgery was performed more than 90 days after PCI with bare-metal stents. Using patients who had a greater than 90-day interval before surgery as the reference group, propensity analysis showed that performing surgery within 30 days of PCI was associated with an odds ratio of 3.6 for major cardiac events. The odds ratio was reduced to 1.6 when surgery was performed 31 to 90 days after PCI. These findings suggest that 30 days may be an ideal minimum time interval, from a risk/benefit standpoint, between PCI with bare-metal stents and noncardiac surgery.
Time interval to surgery after drug-eluting stent placement
A recent retrospective study by Rabbitts et al examined patients who had noncardiac surgery after prior PCI with drug-eluting stents, focusing on the relationship between the timing of the procedures and major cardiac events during hospitalization for the surgery.18 Although the frequency of major cardiac events was not statistically significantly associated with the time between stent placement and surgery, the frequency was lowest—3.3%—when surgery followed drug-eluting stent placement by more than 365 days (versus rates of 5.7% to 6.4% for various intervals of less than 365 days).
ACC/AHA recommendations
Timing of antiplatelet interruption
Results from a prospectively maintained Dutch registry19 are consistent with the findings reviewed above: patients who underwent noncardiac surgery less than 30 days after bare-metal stent implantation or less than 6 months after drug-eluting stent implantation (early surgery group) had a significantly elevated rate of major cardiac events compared with patients in whom the interval between stenting and noncardiac surgery was longer (late surgery group). Notably, this report also found that the rate of major cardiac events within the early surgery group was significantly higher in patients whose antiplatelet therapy was discontinued during the preoperative period than in those whose antiplatelet therapy was not stopped.19
A hypercoagulable state develops within 7 to 10 days after interruption of antiplatelet therapy, at which time the patient is vulnerable to thrombosis. In general, surgery should not proceed during this time without antiplatelet coverage.
From my perspective, giving ketorolac or aspirin the morning of surgery may be beneficial for patients whose antiplatelet therapy has been stopped 7 to 10 days previously, although no data from randomized trials exist to support this practice. Theoretically, it is reasonable to stop antiplatelet therapy 4 to 5 days before surgery in patients with an increased risk of bleeding without exposing them to the hypercoagulability that would set in if therapy were stopped earlier.
A FRAMEWORK FOR CARDIAC EVALUATION
The following are among the algorithm’s key recommendations:
- Patients requiring urgent noncardiac surgery should proceed to the operating room with perioperative surveillance (Class I, Level C).
- Patients with active cardiac conditions who are undergoing nonurgent surgery should be evaluated and treated per ACC/AHA guidelines before proceeding to the operating room is considered (Class I, Level B).
- Patients scheduled for a low-risk procedure can proceed to surgery without testing (Class I, Level B).
- Patients scheduled for intermediate-risk surgery or vascular surgery are to be assessed by functional capacity and clinical risk factors. Proceeding with planned surgery is appropriate in patients with good functional capacity (Class IIa, Level B). In patients with poor or unknown functional capacity undergoing vascular surgery who have three or more clinical risk factors, testing should be considered if the results would change management (Class IIa, Level B).
- Patients with one or more clinical risk factors undergoing intermediate-risk surgery and those with fewer than three clinical risk factors undergoing vascular surgery may proceed to planned surgery with control of heart rate to diminish the stress response perioperatively (Class IIa, Level B), or they may undergo noninvasive testing, but only if the results would change management (Class IIb, Level B).
- Patients undergoing intermediate-risk or vascular surgery who have poor or unknown functional capacity but no clinical risk factors may proceed to surgery without testing (Class I, Level B).
DISCUSSION
Question from the audience: The POISE study showed a 30% reduction in nonfatal MI with routine perioperative beta-blockade but an overall increase in mortality. Since most MIs occur immediately postoperatively and sepsis occurs a bit later, would you consider continuing beta-blocker therapy for a few days to prevent an MI but then stopping it before sepsis develops?
Dr. Fleisher: I’ve had discussions with sepsis experts about the link between beta-blocker therapy and sepsis and death in POISE, and the belief is that beta-blockers do not cause sepsis. I think that a septic patient on acute high-dose beta-blocker therapy can’t respond appropriately because of an inability to increase cardiac output. I believe we should titrate beta-blockers more closely. Information on preoperative dose titration in POISE is not available because of the way the trial was designed. Sepsis developed in only 53 of the 8,351 patients randomized in the study.
I would not start an acute beta-blocker protocol just to get a patient through surgery. I would start a perioperative hemodynamic protocol with the goal of maintaining the patient’s heart rate at lower than 80 beats per minute. Because I don’t believe that beta-blockers cause sepsis, if I initiated a beta-blocker preoperatively, I would not stop it at 2 days.
Question from the audience: Is there a time period during which a patient with a bare-metal stent could have back surgery or knee replacement surgery while not on aspirin?
Dr. Fleisher: The guidelines say that if a patient is on aspirin, it should be continued indefinitely. The issue is one of risk versus benefit. For back surgery, if bleeding is a concern, stopping aspirin for 6 or 7 days after the 30-day period following PCI is not unreasonable, but I would not stop it during the first 30 days following PCI.
Question from the audience: I don’t assess for vascular surgery but rather for the Whipple procedure [radical pancreatoduodenectomy], and I use the Revised Cardiac Risk Index to assess the number of risk factors. I believe the Whipple procedure is a high-risk operation, but it appears to be considered an intermediate-risk operation by the ACC/AHA guidelines. Is my approach to risk assessment appropriate?
Dr. Fleisher: If the rates of morbidity and mortality with the Whipple procedure are low at your institution, you might risk worsening your outcomes by applying someone else’s paradigms to your institution. There’s a big difference in risk between a surgeon who does a Whipple in 5 hours with 0.5 to 1.0 U of blood loss and a surgeon who does a 12-hour Whipple with 20 U of blood loss, necessitating a stay in the intensive care unit for multiple days. You need to consider the risk associated with your institution and specifically with the surgeon.
Question from the audience: Peripheral vascular disease is considered a coronary heart disease risk equivalent, so why is it not one of the criteria in the Revised Cardiac Risk Index?
Dr. Fleisher: The criteria are not hard and fast. The index was devised at one institution, Brigham and Women’s Hospital, in about 4,000 patients, and it has been used differently. It assigns 1 point to ischemic heart disease. It would not be inappropriate to assume that any atherosclerotic class of disease is equivalent to ischemic heart disease for risk purposes.
Question from the audience: You mentioned a 4-day window for withholding clopidogrel. Do you factor into the decision the duration of therapy? Some cardiologists go beyond the 1-year recommendation to continue clopidogrel after stenting because they believe there is still benefit.
Dr. Fleisher: The key is to confer with the cardiologist who implanted the stent, who knows the stenosis for which the stent was implanted. A problem we’ve had for years is that a practitioner will stop the antiplatelet agent without having spoken to the surgeon or the anesthesiologist. As an anesthesiologist, I need to know that someone has done a risk/benefit assessment of whether to continue antiplatelet agents in a given patient.
Question from the audience: The Revised Cardiac Risk Index of Lee et al3 includes the type of surgery in its total point system while the ACC/AHA guidelines do not. Can you explain the discrepancy?
Dr. Fleisher: We on the writing committee for the ACC/AHA 2007 perioperative guidelines made a decision to pull out the type of surgery and use the other five risk factors of Lee et al. It was a consensus of the committee because we believed that the complexity of the surgery itself is a separate consideration for risk. That’s why we included the medical risk factors and considered the surgical factors separately.
- Fleisher LA, Beckman JA, Brown KA, et al. ACC/AHA 2007 guidelines on perioperative cardiovascular evaluation and care for noncardiac surgery: a report of the American College of Cardiology/American Heart Association Task Force on Practice Guidelines [published correction appears in J Am Coll Cardiol 2008; 52:794–797]. J Am Coll Cardiol 2007; 50:1707–1732.
- Shah KB, Kleinman BS, Rao TLK, Jacobs HK, Mestan K, Schaafsma M. Angina and other risk factors in patients with cardiac diseases undergoing noncardiac operations. Anesth Analg 1990; 70:240–247.
- Lee TH, Marcantonio ER, Mangione CM, et al. Derivation and prospective validation of a simple index for prediction of cardiac risk of major noncardiac surgery. Circulation 1999; 100:1043–1049.
- Reilly DF, McNeely MJ, Doerner D, et al. Self-reported exercise tolerance and the risk of serious perioperative complications. Arch Intern Med 1999; 159:2185–2192.
- Nelson CL, Herndon JE, Mark DB, et al. Relation of clinical and angiographic factors to functional capacity as measured by the Duke Activity Status Index. Am J Cardiol 1991; 68:973–975.
- Fleisher LA, Pasternak LR, Herbert R, Anderson GF. Inpatient hospital admission and death after outpatient surgery in elderly patients: importance of patient and system characteristics and location of care. Arch Surg 2004; 139:67–72.
- Poldermans D, Bax JJ, Schouten O, et al. Should major vascular surgery be delayed because of preoperative cardiac testing in intermediate-risk patients receiving beta-blocker therapy with tight heart rate control? J Am Coll Cardiol 2006; 48:964–969.
- POISE Study Group, Devereaux PJ, Yang H, Yusuf S, et al. Effects of extended-release metoprolol succinate in patients undergoing non-cardiac surgery (POISE trial): a randomized controlled trial. Lancet 2008; 371:1839–1847.
- McFalls EO, Ward HB, Moritz TE, et al. Coronary-artery revascularization before elective major vascular surgery. N Engl J Med 2004; 351:2795–2804.
- Ward HB, Kelly RF, Thottapurathu L, et al. Coronary artery bypass grafting is superior to percutaneous coronary intervention in prevention of perioperative myocardial infarctions during subsequent vascular surgery. Ann Thorac Surg 2006; 82:795–801.
- Garcia S, Moritz TE, Ward HB, et al. Usefulness of revascularization of patients with multivessel coronary artery disease before elective vascular surgery for abdominal aortic and peripheral occlusive disease. Am J Cardiol 2008; 102:809–813.
- Poldermans D, Schouten O, Vidakovic R, et al. A clinical randomized trial to evaluate the safety of a noninvasive approach in high-risk patients undergoing major vascular surgery: the DECREASE-V Pilot Study. J Am Coll Cardiol 2007; 49:1763–1769.
- Posner KL, Van Norman GA, Chan V. Adverse cardiac outcomes after noncardiac surgery in patients with prior percutaneous transluminal coronary angioplasty. Anesth Analg 1999; 89:553–560.
- Godet G, Riou B, Bertrand M, et al. Does preoperative coronary angioplasty improve perioperative cardiac outcome? Anesthesiology 2005; 102:739–746.
- Shuchman M. Debating the risks of drug-eluting stents. N Engl J Med 2007; 356:325–328.
- King SB III, Smith SC Jr, Hirshfeld JW Jr, et al. ACC/AHA/SCAI. 2007 focused update of the ACC/AHA/SCAI 2005 guideline update for percutaneous coronary intervention: a report of the American College of Cardiology/American Heart Association Task Force on Practice guidelines. J Am Coll Cardiol 2008; 51:172–209.
- Nuttall GA, Brown MJ, Stombaugh JW, et al. Time and cardiac risk of surgery after bare-metal stent percutaneous coronary intervention. Anesthesiology 2008; 109:588–595.
- Rabbitts JA, Nuttall GA, Brown MJ, et al. Cardiac risk of noncardiac surgery after percutaneous coronary intervention with drug-eluting stents. Anesthesiology 2008; 109:596–604.
- Schouten O, van Domburg RT, Bax JJ, et al. Noncardiac surgery after coronary stenting: early surgery and interruption of antiplatelet therapy are associated with an increase in major adverse cardiac events. J Am Coll Cardiol 2007; 49:122–124.
- Correction to Fleisher et al, J Am Coll Cardiol 2007; 50:1707–1732. J Am Coll Cardiol 2008; 52:794–797.
KEY POINTS
- In addition to patient-specific factors, preoperative cardiac assessment should account for the risk of cardiac morbidity related to the procedure itself. Vascular surgery confers the highest risk, with reported rates of cardiac morbidity often greater than 5%.
- Continuation of chronic beta-blocker therapy is prudent during the perioperative period.
- Coronary revascularization prior to noncardiac surgery is generally indicated only in unstable patients and in patients with left main disease.
- Nonurgent noncardiac surgery should be delayed for at least 30 days after PCI using a bare-metal stent and for at least 365 days after PCI using a drug-eluting stent.
- Discontinuing antiplatelet therapy in patients with coronary stents may induce a hypercoagulable state within approximately 7 to 10 days.
Perioperative care of the elderly patient: An update*
Acute hospital care is fast becoming acute geriatric care: people aged 65 years or older are only 13% of the population but account for 44% of days of care in nonfederal hospitals and 38% of discharges.1 In general, the elderly have longer hospital stays, incur greater costs, and have a higher risk of adverse outcomes than do their younger counterparts.2
Among the most common surgical procedures for patients older than 65 are percutaneous coronary intervention with stenting, coronary artery bypass graft surgery, and open reduction internal fixation for hip fracture; the latter is the most common operation in patients aged 85 years or older.3
Elderly patients frequently pose many challenges perioperatively that are not often seen in younger patients. Dementia, frailty, impaired ability to care for oneself, and malnourishment may be present at baseline and are likely to worsen postoperatively. The elderly are at increased risk of acute delirium and cognitive impairment postoperatively, which often complicates recovery and discharge placement.
This article uses a case study to review perioperative problems commonly encountered in elderly surgical patients, particularly those undergoing hip surgery. As the case is presented, I will review strategies to assess risks and prevent and mitigate postoperative cognitive dysfunction and other barriers to recovery.
CASE: AN 82-YEAR-OLD WOMAN WITH HIP FRACTURE
An 82-year-old woman is admitted to undergo open reduction internal fixation for hip fracture. She has a history of osteoarthritis, systolic hypertension, and visual impairment (20/70). Her medications include a beta-blocker, a thiazide diuretic, analgesics as needed, and a multivitamin. She was independent in all activities of daily living before the fracture. She is a social drinker and does not smoke. She has no known cardiovascular, lung, or renal disease.
Her laboratory test results are as follows:
- Blood urea nitrogen (BUN), 24 mg/dL
- Creatinine, 1.0 mg/dL
- Hemoglobin, 12.8 g/dL
- Albumin, 3.8 gm/dL
- Normal levels of thyroid-stimulating hormone and vitamin B12.
Thus, her lab results are normal except for the BUN:creatinine ratio being a bit high, at 24:1 (normal is 10:1, with ratios greater than 18:1 being associated with an increased risk of delirium4).
ASSESSING COGNITIVE RISK: POSTOPERATIVE COGNITIVE DYSFUNCTION VS DELIRIUM
Question: Which of these statements about this patient is most correct?
A. She is at high risk (> 40%) of postoperative cognitive dysfunction
B. Her risk of postoperative delirium is 5% to 10%
C. Postoperative delirium cannot be prevented
D. Preoperative haloperidol (1.5 mg/day for 3 days) will reduce the risk of delirium by 25%
The best answer is A. Postoperative cognitive dysfunction is different from delirium, though it is part of a spectrum of cognitive impairment that may occur after surgery and even persist for a prolonged period. The patient’s risk of postoperative delirium is actually a bit higher than 10% (see “Estimating the risk of delirium” below). Some evidence shows that postoperative delirium can be prevented, at least in hip fracture patients. Kalisvaart et al found that preoperative treatment with low-dose haloperidol reduced the duration and severity of delirium in elderly patients following hip surgery but did not reduce its incidence.5
Cognitive dysfunction often follows surgery
Postoperative cognitive dysfunction has long been recognized and was first described in patients after cardiac surgery, especially following coronary artery bypass graft procedures. In the last several years, we have recognized that it also occurs in patients who undergo noncardiac surgery. Postoperative cognitive dysfunction, which may persist for weeks to months, may not be obvious but can be detected by standard neuropsychological testing.6
Postoperative cognitive dysfunction is different from the “emergence delirium” that may immediately follow surgery and that is often associated with the wearing off of anesthesia. It is also distinct from “incident delirium,” which sometimes occurs over the first few postoperative days (discussed below).
Postoperative dysfunction is especially persistent in the elderly
A recent study found cognitive dysfunction to be common at hospital discharge after major noncardiac surgery in adults of all ages: rates at discharge were 36.6% in patients aged 18 to 39 years, 30.4% in those aged 40 to 59, and 41.4% in those 60 or older.7 Notably, however, the oldest group was most likely to have persistent symptoms. Three months after surgery, 12.7% of patients aged 60 or older continued to have postoperative cognitive dysfunction, which was more than double the rates in the young and middle-aged patient groups (5.7% and 5.6%, respectively).7
Although the cause of postoperative cognitive dysfunction is not well understood, predisposing factors in addition to advanced age include metabolic problems, lower educational level, and previous cerebral vascular accident.7 When elective surgery is considered by elderly patients, the decision should take into account their risk of postoperative cognitive dysfunction and the impact it may have on their quality of life.
PREDICTING AND PREVENTING DELIRIUM
Delirium is easily recognized
Delirium is a common complication of surgery. Unlike postoperative cognitive dysfunction, delirium is easy to detect clinically. It is a disorder of attention and cognition and classically presents as an acute change in mental status accompanied by the following8:
- Fluctuation in awareness
- Memory impairment
- Inattention (inability to stay on task, distractibility)
- Disorganized or illogical thinking
- Altered level of consciousness—ie, hyperalertness (agitation, pulling out intravenous lines, etc) or hypoalertness (“quiet delirium”).
Estimating the risk of delirium
Marcantonio and colleagues developed a model to predict the likelihood that delirium will develop in patients undergoing elective surgery.9 The model assigns points to various risk factors as follows:
- Age ≥ 70 years (1 point)
- History of alcohol abuse (1 point)
- Baseline cognitive impairment (1 point)
- Severe physical impairment (reduced ability to walk or perform daily activities) (1 point)
- Abnormal preoperative blood levels of electrolytes or glucose (1 point)
- Noncardiac thoracic surgery (1 point)
- Abdominal aortic aneurysm surgery (2 points).
The study to validate this model found that a score of 0 points is associated with only a 2% risk of developing postoperative delirium. A score of 3 or more points is associated with a 50% risk of postoperative delirium. A score of 1 or 2 points (as for the patient in our case study) is associated with an 11% risk, according to this Marcantonio model.9
Additionally, well-designed cohort studies of medical patients10 have identified four major independent predictors of incident delirium:
- Severe illness (eg, high fever, complicated infections)
- Baseline dementia
- Dehydration (high BUN:creatinine ratio)
- Sensory impairments (particularly visual).
Kalisvaart et al conducted a prospective cohort study to determine whether these risk factors in medical patients are applicable to elderly patients undergoing hip surgery.11 They found that the incidence of delirium was low (4%) in hip surgery patients with none of these factors, increased to 11% in patients with one or two of these factors, and increased to 37% in patients with three or four factors. These findings suggest that hip surgery patients (like our case patient) may be at greater risk of postoperative delirium than is reflected in the Marcantonio model discussed above,9 which was validated in a study of patients undergoing elective (not emergent) surgery.
Several drug classes raise dementia risk
Anticholinergic medications and other drugs with anticholinergic properties, ie, benzodiazepines and the opioid agent meperidine, also raise the risk for delirium. In general, the older an elderly patient is, the less appropriate these agents are. Many drugs that are not typically recognized as anticholinergics may have potent anticholinergic activity, including tricyclic antidepressants, first-generation antihistamines (eg, diphenhydramine), and high-dose H2-receptor blockers (particularly cimetidine); these agents too should be avoided in elderly patients.12
Strategies to reduce postoperative delirium risk
How can we lower the risk of postoperative delirium in elderly hip fracture patients? Marcantonio et al13 randomized 126 patients undergoing hip fracture repair to receive usual care alone or supplemented with the following additional measures:
- Supplemental oxygen during surgery
- Optimization of electrolytes and blood glucose preoperatively
- Discontinuation of high-risk medications
- Adequate nutritional intake (by parenteral route if necessary)
- Encouragement to get out of bed on the first postoperative day
- Treatment of severe pain.
The incidence of delirium was reduced from 50% in the usual-care group to 32% in the intervention group, and the incidence of severe delirium was reduced even more, from 29% to 12%, respectively.13
OTHER BEST PRACTICES IN PERIOPERATIVE HIP FRACTURE MANAGEMENT
In a systematic literature review to identify best practices for perioperative management of elderly patients with hip fracture, Beaupre et al14 found the following measures to be among those with the strongest evidence of benefit:
- Use of spinal or local anesthesia rather than general anesthesia
- Use of pressure-relieving mattresses to prevent pressure ulcers
- Perioperative administration of antibiotics
- Deep vein thrombosis prophylaxis.
The review concluded that providing nutritional supplementation also is probably helpful although the evidence is not robust. Additionally, it was unclear whether minimizing the delay between hospital admission and surgery has any impact on mortality.14
Is early surgery better?
Early studies suggested that the sooner a hip fracture patient goes to surgery, the lower the mortality, but this has not been supported in well-controlled trials: no difference in mortality has been found whether the patient’s conditions are first optimized to reduce the risk of surgery or if the operation commences within 24 hours.
Although mortality does not appear to be affected, avoiding delay of hip fracture repair yields improvement in other outcomes. In a well-designed prospective cohort study, Orosz et al found that medically stable patients with hip fracture (mean age, 82 years) who underwent surgery within 24 hours had fewer days of pain and less intense pain postoperatively than those whose surgery was delayed beyond 24 hours.15 The early-surgery group also had a 1.94-day reduction in average length of stay compared with the late-surgery group.
A role for clinical pathways
To determine how the application of evidence-based perioperative practices affects actual outcomes in elderly hip fracture patients, Beaupre et al used a pre/post study design to evaluate the impact of an evidence-based clinical pathway at their institution.16 Though there were no differences in in-hospital mortality or the overall costs of inpatient care in elderly hip surgery patients before and after pathway implementation, the patients undergoing surgery after pathway implementation were significantly less likely to have postoperative delirium, heart failure, pressure ulcers, and urinary tract infections compared with those undergoing surgery before implementation. The outcomes benefits of this type of multimodal intervention are likely to extend to abdominal surgical procedures as well.
CASE CONTINUED: POSTOP DAY 2―PATIENT IS CONFUSED AND CRYING IN PAIN
On the second postoperative day, our patient appears weak and slightly confused. She is not eating and is crying in pain. Her neurological exam is normal.
Question: Which is the most appropriate next step?
A. Increase physical therapy
B. Begin an antidepressant
C. Insert a nasoenteric feeding tube
D. Increase doses of analgesics
The best answer is D. With no prior history of depression, an antidepressant would probably not be useful. It is premature to recommend nasoenteric feeding. Because pain hampers physical therapy, an increase in physical therapy would likewise be premature. Because we know the patient is in pain, the correct answer perhaps seems obvious. But keep in mind that relieving pain also has many other positive ramifications: intense pain can be a cause of delirium or at least worsen its symptoms, and pain relief is a prerequisite for the physical therapy that this patient needs.
Strategies for pain control
In general, the treatment of choice for postoperative pain is low-dose morphine sulfate (eg, 1–4 mg every 2 hours, titrated as needed). Acetaminophen can be given safely to virtually all patients. Patient-controlled analgesia is reasonable for select patients but not for older patients with cognitive impairment. Nonsteroidal anti-inflammatory drugs might be helpful in younger patients and even in robust elderly patients, but they must be used very cautiously in the older population because of the risk of gastric ulcers and bleeding, acute kidney injury, fluid retention, and exacerbation of congestive heart failure.
POSTOP DAY 3: PATIENT REPORTS LONG-STANDING FATIGUE
On postoperative day 3, the patient is weak and complains of fatigue. She says that before the fracture, she was experiencing mild weight loss, fatigue, and reduced activity.
Question: What is the most likely reason for her symptoms before the fracture?
A. Frailty
B. Occult heart failure
C. Adverse drug reaction to her beta-blocker
D. Clinical depression
The best answer is A. Occult heart failure is a reasonable second choice, as it is very common in older patients and the diagnosis is easy to miss unless florid pulmonary edema or associated symptoms (eg, chest pain) are present. But this patient had no history of heart disease and was only on medications for hypertension. An adverse drug reaction, such as to the beta-blocker, is unlikely and would probably not cause weight loss. The patient had no history of depression, so clinical depression is unlikely. That said, all the choices are reasonable to consider in elderly patients reporting fatigue and weakness.
Frailty is important to recognize
It is important to identify frailty and to aggressively manage frail patients postoperatively. Although frailty is not clearly defined, Fried et al17 identified five clinical features that correlate with its underlying pathophysiology:
- Minimal physical activity (ie, “doing less”)
- Generalized (not focal) muscle weakness
- Slowed performance (eg, walking short distances takes longer)
- Fatigue or poor endurance
- Unintentional weight loss.
The presence of three or more of these features meets the criteria for frailty and is associated with increased risk for mortality over the next 3 years with or without surgery,17 although surgery probably increases the risk.
Frailty is believed to be a failure over time of the homeostatic mechanisms that keep our organ systems functioning in the face of a stress. Decline in the ability of organ systems to maintain normal function is probably caused by inflammation, chronic disease, and normal aging, and has been termed homeostenosis. As a person ages and physiologic reserves are reduced, adding a stress such as surgery or severe infection can result in organ failure—usually multiple-system organ failure. In any intensive care unit, one is likely to see elderly patients who were admitted with one medical or surgical problem and soon end up having renal, liver, or brain dysfunction as well.
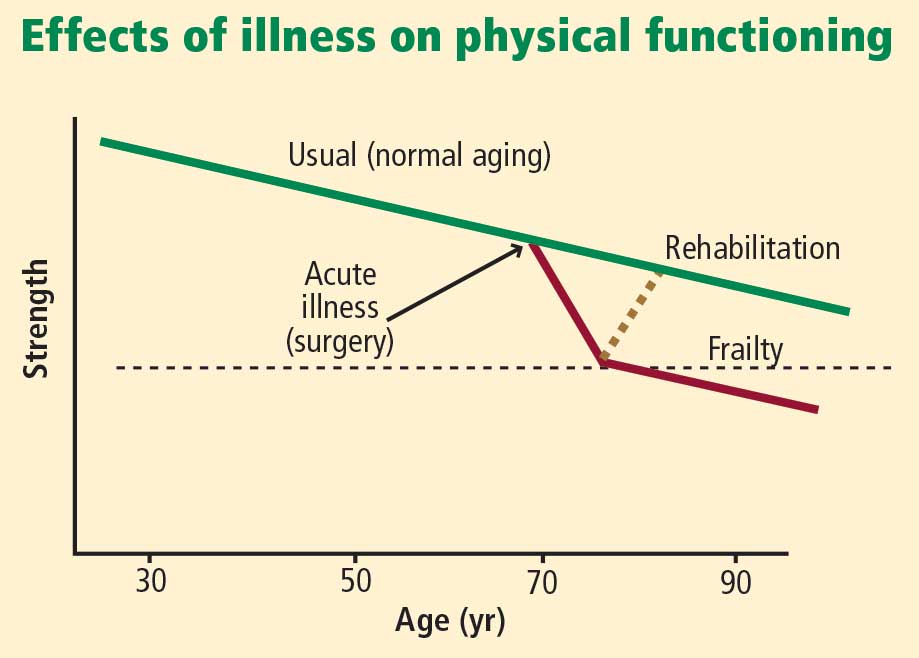
Physical therapy immediately after hip fracture surgery is associated with significantly better locomotion 2 months later.18 A number of exercises are effective: range-of-motion exercises, low-impact aerobic activities, and exercises starting with low-intensity resistance (using bands, tubes, and weights) and progressing as tolerated to high-intensity resistance (with machines and pulleys) for an extended period of time.
Nutrition supplementation
Malnourishment can contribute to frailty, yet evidence for the benefits of supplementing nutrition is not strong, as noted above. However, meta-analyses of studies of nutritional interventions with meal supplementation (usually canned supplements) show that meal supplementation can improve mortality risk and reduce morbidity such as pressure ulcers in hospitalized elderly patients.19,20 The patients most likely to benefit are those who are undernourished at baseline and aged 75 years or older.
CASE CONTINUED: WHAT HAPPENS POST-DISCHARGE?
Following surgery, our patient wonders, “Where will I go next? What will my lifestyle be like?”
These are important questions to consider when first evaluating whether an elderly patient should undergo surgery. In the case of hip fracture, standard thinking is that without surgery, the patient will never recover the ability to independently walk and perform activities of daily living. But we also must recognize the considerable risks of surgery in the elderly population, particularly those aged 75 years or older.
Comprehensive discharge planning
Early and intensive discharge management enhances quality of life and may help reduce hospital costs. A good model of care involves collaboration of orthopedic surgeons, hospitalists, general internists, geriatricians, and dietitians to address procedures, diet and nutrition, mobility and activities of daily living, and pain medications.21 A case manager such as a social worker should start addressing care transition the day after surgery—planning ahead is imperative.
Following hip surgery, patients are routinely sent to skilled nursing facilities as soon as possible so they can start intensive physical therapy. Patients with significant functional impairment or who had delirium are more likely to require a prolonged hospital stay.
Naylor et al examined the effectiveness of comprehensive discharge planning in a study that randomized hospitalized patients (including surgical patients) 65 years or older to either usual discharge planning or intensive discharge planning with advanced practice nurses beginning early in hospitalization.22 The intervention group was followed by home care nurses for up to 4 weeks and had continuous telephone access to the nurses. Patients who received the intervention had a significantly lower risk of hospital readmission, and those who were readmitted had significantly shorter hospital stays. The total cost of care was also significantly lower in the intervention group.
Family conferences aid decision making
Family conferences can be very useful for working through the many questions and challenges that surgery in an elderly person can pose, including whether the patient should undergo the operation, postoperative management, and postdischarge placement.23 For patients with an uncertain prognosis because of unclear or multiple concurrent diseases, a family conference can help clarify the goals of therapy, inform the family about likely outcomes, and help determine the patient’s wishes and values. Such issues should be revisited as the postoperative course proceeds.
Family conferences also provide a good opportunity to review advanced directives, the need for life support, and possible transfers to intensive care. Family conferences can also help resolve conflicts in care management, as family members may not agree with the need for surgery, how aggressive treatment should be, or where to send the patient for rehabilitation. Differences among family members on these questions are especially common with elderly patients. Working out such issues will improve patient care, especially when done early in the hospitalization.
DISCUSSION
Question from the audience: In our preoperative clinic, we are trying to intervene to reduce delirium and postoperative cognitive dysfunction. How can we quickly screen for the most important predictors and act to reduce the risk?
Dr. Palmer: The most important risk factor for delirium is age, which obviously can’t be changed. Ask patients about alcohol use and depression. Check on nutritional status and begin supplementation if indicated. Discontinue high-risk medications. Check on electrolytes and their state of hydration; ideally, an electrolyte imbalance can be corrected preoperatively. In addition, other than in patients with end-stage renal disease, try to keep the hemoglobin above 7.5 g/dL, which appears to be associated with better outcomes and less risk of delirium.
It’s also important to remind the family to bring in the patient’s visual aids, hearing devices, and cane or walker so that they’re available right after the operation.
Intraoperative factors that are important for preventing delirium include maintaining good blood pressure levels, giving supplemental oxygen, minimizing the time under general anesthesia, and using local anesthesia if possible.
Question from the audience: How strong is the evidence for using spinal anesthesia as opposed to general anesthesia in preventing postoperative cognitive dysfunction and delirium, especially in the setting of hip fracture repair?
Dr. Palmer: The evidence is fairly soft. For patients undergoing either hip or knee arthroplasty who were randomized to receive either spinal (or local) or general anesthesia, the risk of delirium was similar, but complications such as prolonged bed rest, pressure ulcers, and catheter-related urinary tract infections were somewhat reduced in the spinal/local group.14 The relative risk of developing postoperative cognitive dysfunction is unclear—no randomized controlled trials have been conducted to answer that question.
Question from the audience: How do you use antipsychotic drugs, especially with the concerns from epidemiologic studies about an increased risk of death?
Dr. Palmer: No antipsychotic agents, including haloperidol, have a specific Food and Drug Administration–approved indication for treating agitation, dementia, or delirium. In general, they should not be used without a clear indication. That said, the usual off-label use is for patients who are severely agitated and are at risk of harming themselves or others. In an ICU setting, where patients have multiple lines, the use of these agents can be considered for a very agitated patient. Alternatives exist, but antipsychotics like haloperidol have the advantage that they can be given in small increments very rapidly and achieve good control of severe agitation.
Antipsychotic agents should only be used with great caution and for the shortest duration needed. As delirium resolves, they should be tapered fairly rapidly over a few days and ideally should be discontinued by the time of hospital discharge.
None of the antipsychotic agents—including those in the first generation and the newer atypical agents—is free of this risk of increased mortality. The mechanism is not understood; it may be torsades de pointes or hypotension leading to stroke or sudden cardiac death.
Question from the audience: What is the most efficient way to assess cognitive and physical functioning preoperatively?
Dr. Palmer: There may be a documented history of dementia, or family members may tell you if there has been memory loss or some decline in the patient’s self-care abilities. For patients without dementia, you can ask them directly if they can perform basic activities of daily living, such as getting out of bed or dressing. To assess higher-level function, ask if they can manage their own medications, pay bills, or handle their finances. If not, they might have cognitive impairment and are at higher risk for postoperative delirium. These are rather sensitive measures. There are instruments to assess this more precisely, but few clinicians have time to use them.
Quick bedside tests can help assess for delirium postoperatively. We see if patients are “alert and oriented times three” (“Do you know who you are, where you are, and the date?”). We test for attention by asking them to repeat a random string of numbers spoken 1 second apart in monotone; people who are delirious and many patients with severe dementia can’t repeat more than three numbers. A patient who is alert and oriented, has a good attention span (more than three numbers in correct order), and has no history of dementia probably doesn’t have delirium or dementia.
For physical function, ask if they can walk, get out of bed to a chair, and ambulate. If they don’t give clear answers, observe them get out of bed or a chair, walk 10 feet, and return to bed. If they can do that with good balance, especially within 10 to 15 seconds, they probably have reasonably normal mobility and are at lower risk for postoperative complications such as falls with injury.
- DeFrances CJ, Cullen KA, Kozak LJ. National Hospital Discharge Survey: 2005 annual summary with detailed diagnosis and procedure data. Vital Health Stat (Series 13) 2007; Dec(165):1–209.
- Welcome to HCUPnet: a tool for identifying, tracking, and analyzing national hospital statistics. Agency for Healthcare Research and Quality Web site. http://hcupnet.ahrq.gov. Accessed February 23, 2009.
- Kozak LJ, Owings MF, Hall MJ. National Hospital Discharge Survey: 2002 annual summary with detailed diagnosis and procedure data. Vital Health Stat (Series 13) 2005; Mar(158):1–199.
- Inouye SK, Viscoli CM, Horwitz RI, Hurst LD, Tinetti ME. A predictive model for delirium in hospitalized elderly medical patients based on admission characteristics. Ann Intern Med 1993; 119:474–481.
- Kalisvaart KJ, de Jonghe JF, Bogaards MJ, et al. Haloperidol prophylaxis for elderly hip-surgery patients at risk for delirium: a randomized placebo-controlled study. J Am Geriatr Soc 2005; 53:1658–1666.
- Silverstein JH, Timberger M, Reich DL, Uysal S. Central nervous system dysfunction after noncardiac surgery and anesthesia in the elderly. Anesthesiology 2007; 106:622–628.
- Monk TG, Weldon BC, Garvan CW, et al. Predictors of cognitive dysfunction after major noncardiac surgery. Anesthesiology 2008; 108:18–30.
- Inouye SK. Delirium in older persons. N Engl J Med 2006; 354:1157–1165.
- Marcantonio ER, Goldman L, Mangione CM, et al. A clinical prediction rule for delirium after elective noncardiac surgery. JAMA 1994; 271:134–139.
- Inouye SK. Predisposing and precipitating factors for delirium in hospitalized older patients. Dement Geriatr Cogn Disord 1999; 10:393–400.
- Kalisvaart KJ, Vreeswijk R, de Jonghe JF, et al. Risk factors and prediction of postoperative delirium in elderly hip-surgery patients: implementation and validation of a medical risk factor model. J Am Geriatr Soc 2006; 54:817–822.
- Fick DM, Cooper JW, Wade WE, et al. Updating the Beers criteria for potentially inappropriate medication use in older adults: results of a US consensus panel of experts. Arch Intern Med 2003; 163:2716–2724.
- Marcantonio ER, Flacker JM, Wright RJ, et al. Reducing delirium after hip fracture: a randomized trial. J Am Geriatr Soc 2001; 49:516–522.
- Beaupre LA, Jones CA, Saunders LD, Johnston DW, Buckingham J, Majumdar SR. Best practices for elderly hip fracture patients: a systematic overview of the evidence. J Gen Intern Med 2005; 20:1019–1025.
- Orosz GM, Magaziner J, Hannan EL, et al. Association of timing of surgery for hip fracture and patient outcomes. JAMA 2004; 291:1738–1743.
- Beaupre LA, Cinats JG, Senthilselvan A, et al. Reduced morbidity for elderly patients with a hip fracture after implementation of a perioperative evidence-based clinical pathway. Qual Saf Health Care 2006; 15:375–379.
- Fried LP, Tangen CM, Walston J, et al. Frailty in older adults: evidence for a phenotype. J Gerontol A Biol Sci Med Sci 2001; 56:M146–M156.
- Penrod JD, Boockvar KS, Litke A, et al. Physical therapy and mobility 2 and 6 months after hip fracture. J Am Geriatr Soc 2004; 52:1114–1120.
- Milne AC, Avenell A, Potter J. Meta-analysis: protein and energy supplementation in older people. Ann Intern Med 2006; 144:37–48.
- Avenell A, Handoll HH. Nutritional supplementation for hip fracture aftercare in older people. Cochrane Database Syst Rev 2006; (4):CD001880.
- Miura LN, DiPiero AR, Homer LD. Effects of a geriatrician-led hip fracture program: improvements in clinical and economic outcomes. J Am Geriatr Soc 2009; 57:159–167.
- Naylor MD, Brooten D, Campbell R, et al. Comprehensive discharge planning and home follow-up of hospitalized elders: a randomized clinical trial. JAMA 1999; 281:613–620.
- Palmer RM. Acute hospital care of the elderly: making a difference. Hospitalist 2004; (suppl):4–7.
Acute hospital care is fast becoming acute geriatric care: people aged 65 years or older are only 13% of the population but account for 44% of days of care in nonfederal hospitals and 38% of discharges.1 In general, the elderly have longer hospital stays, incur greater costs, and have a higher risk of adverse outcomes than do their younger counterparts.2
Among the most common surgical procedures for patients older than 65 are percutaneous coronary intervention with stenting, coronary artery bypass graft surgery, and open reduction internal fixation for hip fracture; the latter is the most common operation in patients aged 85 years or older.3
Elderly patients frequently pose many challenges perioperatively that are not often seen in younger patients. Dementia, frailty, impaired ability to care for oneself, and malnourishment may be present at baseline and are likely to worsen postoperatively. The elderly are at increased risk of acute delirium and cognitive impairment postoperatively, which often complicates recovery and discharge placement.
This article uses a case study to review perioperative problems commonly encountered in elderly surgical patients, particularly those undergoing hip surgery. As the case is presented, I will review strategies to assess risks and prevent and mitigate postoperative cognitive dysfunction and other barriers to recovery.
CASE: AN 82-YEAR-OLD WOMAN WITH HIP FRACTURE
An 82-year-old woman is admitted to undergo open reduction internal fixation for hip fracture. She has a history of osteoarthritis, systolic hypertension, and visual impairment (20/70). Her medications include a beta-blocker, a thiazide diuretic, analgesics as needed, and a multivitamin. She was independent in all activities of daily living before the fracture. She is a social drinker and does not smoke. She has no known cardiovascular, lung, or renal disease.
Her laboratory test results are as follows:
- Blood urea nitrogen (BUN), 24 mg/dL
- Creatinine, 1.0 mg/dL
- Hemoglobin, 12.8 g/dL
- Albumin, 3.8 gm/dL
- Normal levels of thyroid-stimulating hormone and vitamin B12.
Thus, her lab results are normal except for the BUN:creatinine ratio being a bit high, at 24:1 (normal is 10:1, with ratios greater than 18:1 being associated with an increased risk of delirium4).
ASSESSING COGNITIVE RISK: POSTOPERATIVE COGNITIVE DYSFUNCTION VS DELIRIUM
Question: Which of these statements about this patient is most correct?
A. She is at high risk (> 40%) of postoperative cognitive dysfunction
B. Her risk of postoperative delirium is 5% to 10%
C. Postoperative delirium cannot be prevented
D. Preoperative haloperidol (1.5 mg/day for 3 days) will reduce the risk of delirium by 25%
The best answer is A. Postoperative cognitive dysfunction is different from delirium, though it is part of a spectrum of cognitive impairment that may occur after surgery and even persist for a prolonged period. The patient’s risk of postoperative delirium is actually a bit higher than 10% (see “Estimating the risk of delirium” below). Some evidence shows that postoperative delirium can be prevented, at least in hip fracture patients. Kalisvaart et al found that preoperative treatment with low-dose haloperidol reduced the duration and severity of delirium in elderly patients following hip surgery but did not reduce its incidence.5
Cognitive dysfunction often follows surgery
Postoperative cognitive dysfunction has long been recognized and was first described in patients after cardiac surgery, especially following coronary artery bypass graft procedures. In the last several years, we have recognized that it also occurs in patients who undergo noncardiac surgery. Postoperative cognitive dysfunction, which may persist for weeks to months, may not be obvious but can be detected by standard neuropsychological testing.6
Postoperative cognitive dysfunction is different from the “emergence delirium” that may immediately follow surgery and that is often associated with the wearing off of anesthesia. It is also distinct from “incident delirium,” which sometimes occurs over the first few postoperative days (discussed below).
Postoperative dysfunction is especially persistent in the elderly
A recent study found cognitive dysfunction to be common at hospital discharge after major noncardiac surgery in adults of all ages: rates at discharge were 36.6% in patients aged 18 to 39 years, 30.4% in those aged 40 to 59, and 41.4% in those 60 or older.7 Notably, however, the oldest group was most likely to have persistent symptoms. Three months after surgery, 12.7% of patients aged 60 or older continued to have postoperative cognitive dysfunction, which was more than double the rates in the young and middle-aged patient groups (5.7% and 5.6%, respectively).7
Although the cause of postoperative cognitive dysfunction is not well understood, predisposing factors in addition to advanced age include metabolic problems, lower educational level, and previous cerebral vascular accident.7 When elective surgery is considered by elderly patients, the decision should take into account their risk of postoperative cognitive dysfunction and the impact it may have on their quality of life.
PREDICTING AND PREVENTING DELIRIUM
Delirium is easily recognized
Delirium is a common complication of surgery. Unlike postoperative cognitive dysfunction, delirium is easy to detect clinically. It is a disorder of attention and cognition and classically presents as an acute change in mental status accompanied by the following8:
- Fluctuation in awareness
- Memory impairment
- Inattention (inability to stay on task, distractibility)
- Disorganized or illogical thinking
- Altered level of consciousness—ie, hyperalertness (agitation, pulling out intravenous lines, etc) or hypoalertness (“quiet delirium”).
Estimating the risk of delirium
Marcantonio and colleagues developed a model to predict the likelihood that delirium will develop in patients undergoing elective surgery.9 The model assigns points to various risk factors as follows:
- Age ≥ 70 years (1 point)
- History of alcohol abuse (1 point)
- Baseline cognitive impairment (1 point)
- Severe physical impairment (reduced ability to walk or perform daily activities) (1 point)
- Abnormal preoperative blood levels of electrolytes or glucose (1 point)
- Noncardiac thoracic surgery (1 point)
- Abdominal aortic aneurysm surgery (2 points).
The study to validate this model found that a score of 0 points is associated with only a 2% risk of developing postoperative delirium. A score of 3 or more points is associated with a 50% risk of postoperative delirium. A score of 1 or 2 points (as for the patient in our case study) is associated with an 11% risk, according to this Marcantonio model.9
Additionally, well-designed cohort studies of medical patients10 have identified four major independent predictors of incident delirium:
- Severe illness (eg, high fever, complicated infections)
- Baseline dementia
- Dehydration (high BUN:creatinine ratio)
- Sensory impairments (particularly visual).
Kalisvaart et al conducted a prospective cohort study to determine whether these risk factors in medical patients are applicable to elderly patients undergoing hip surgery.11 They found that the incidence of delirium was low (4%) in hip surgery patients with none of these factors, increased to 11% in patients with one or two of these factors, and increased to 37% in patients with three or four factors. These findings suggest that hip surgery patients (like our case patient) may be at greater risk of postoperative delirium than is reflected in the Marcantonio model discussed above,9 which was validated in a study of patients undergoing elective (not emergent) surgery.
Several drug classes raise dementia risk
Anticholinergic medications and other drugs with anticholinergic properties, ie, benzodiazepines and the opioid agent meperidine, also raise the risk for delirium. In general, the older an elderly patient is, the less appropriate these agents are. Many drugs that are not typically recognized as anticholinergics may have potent anticholinergic activity, including tricyclic antidepressants, first-generation antihistamines (eg, diphenhydramine), and high-dose H2-receptor blockers (particularly cimetidine); these agents too should be avoided in elderly patients.12
Strategies to reduce postoperative delirium risk
How can we lower the risk of postoperative delirium in elderly hip fracture patients? Marcantonio et al13 randomized 126 patients undergoing hip fracture repair to receive usual care alone or supplemented with the following additional measures:
- Supplemental oxygen during surgery
- Optimization of electrolytes and blood glucose preoperatively
- Discontinuation of high-risk medications
- Adequate nutritional intake (by parenteral route if necessary)
- Encouragement to get out of bed on the first postoperative day
- Treatment of severe pain.
The incidence of delirium was reduced from 50% in the usual-care group to 32% in the intervention group, and the incidence of severe delirium was reduced even more, from 29% to 12%, respectively.13
OTHER BEST PRACTICES IN PERIOPERATIVE HIP FRACTURE MANAGEMENT
In a systematic literature review to identify best practices for perioperative management of elderly patients with hip fracture, Beaupre et al14 found the following measures to be among those with the strongest evidence of benefit:
- Use of spinal or local anesthesia rather than general anesthesia
- Use of pressure-relieving mattresses to prevent pressure ulcers
- Perioperative administration of antibiotics
- Deep vein thrombosis prophylaxis.
The review concluded that providing nutritional supplementation also is probably helpful although the evidence is not robust. Additionally, it was unclear whether minimizing the delay between hospital admission and surgery has any impact on mortality.14
Is early surgery better?
Early studies suggested that the sooner a hip fracture patient goes to surgery, the lower the mortality, but this has not been supported in well-controlled trials: no difference in mortality has been found whether the patient’s conditions are first optimized to reduce the risk of surgery or if the operation commences within 24 hours.
Although mortality does not appear to be affected, avoiding delay of hip fracture repair yields improvement in other outcomes. In a well-designed prospective cohort study, Orosz et al found that medically stable patients with hip fracture (mean age, 82 years) who underwent surgery within 24 hours had fewer days of pain and less intense pain postoperatively than those whose surgery was delayed beyond 24 hours.15 The early-surgery group also had a 1.94-day reduction in average length of stay compared with the late-surgery group.
A role for clinical pathways
To determine how the application of evidence-based perioperative practices affects actual outcomes in elderly hip fracture patients, Beaupre et al used a pre/post study design to evaluate the impact of an evidence-based clinical pathway at their institution.16 Though there were no differences in in-hospital mortality or the overall costs of inpatient care in elderly hip surgery patients before and after pathway implementation, the patients undergoing surgery after pathway implementation were significantly less likely to have postoperative delirium, heart failure, pressure ulcers, and urinary tract infections compared with those undergoing surgery before implementation. The outcomes benefits of this type of multimodal intervention are likely to extend to abdominal surgical procedures as well.
CASE CONTINUED: POSTOP DAY 2―PATIENT IS CONFUSED AND CRYING IN PAIN
On the second postoperative day, our patient appears weak and slightly confused. She is not eating and is crying in pain. Her neurological exam is normal.
Question: Which is the most appropriate next step?
A. Increase physical therapy
B. Begin an antidepressant
C. Insert a nasoenteric feeding tube
D. Increase doses of analgesics
The best answer is D. With no prior history of depression, an antidepressant would probably not be useful. It is premature to recommend nasoenteric feeding. Because pain hampers physical therapy, an increase in physical therapy would likewise be premature. Because we know the patient is in pain, the correct answer perhaps seems obvious. But keep in mind that relieving pain also has many other positive ramifications: intense pain can be a cause of delirium or at least worsen its symptoms, and pain relief is a prerequisite for the physical therapy that this patient needs.
Strategies for pain control
In general, the treatment of choice for postoperative pain is low-dose morphine sulfate (eg, 1–4 mg every 2 hours, titrated as needed). Acetaminophen can be given safely to virtually all patients. Patient-controlled analgesia is reasonable for select patients but not for older patients with cognitive impairment. Nonsteroidal anti-inflammatory drugs might be helpful in younger patients and even in robust elderly patients, but they must be used very cautiously in the older population because of the risk of gastric ulcers and bleeding, acute kidney injury, fluid retention, and exacerbation of congestive heart failure.
POSTOP DAY 3: PATIENT REPORTS LONG-STANDING FATIGUE
On postoperative day 3, the patient is weak and complains of fatigue. She says that before the fracture, she was experiencing mild weight loss, fatigue, and reduced activity.
Question: What is the most likely reason for her symptoms before the fracture?
A. Frailty
B. Occult heart failure
C. Adverse drug reaction to her beta-blocker
D. Clinical depression
The best answer is A. Occult heart failure is a reasonable second choice, as it is very common in older patients and the diagnosis is easy to miss unless florid pulmonary edema or associated symptoms (eg, chest pain) are present. But this patient had no history of heart disease and was only on medications for hypertension. An adverse drug reaction, such as to the beta-blocker, is unlikely and would probably not cause weight loss. The patient had no history of depression, so clinical depression is unlikely. That said, all the choices are reasonable to consider in elderly patients reporting fatigue and weakness.
Frailty is important to recognize
It is important to identify frailty and to aggressively manage frail patients postoperatively. Although frailty is not clearly defined, Fried et al17 identified five clinical features that correlate with its underlying pathophysiology:
- Minimal physical activity (ie, “doing less”)
- Generalized (not focal) muscle weakness
- Slowed performance (eg, walking short distances takes longer)
- Fatigue or poor endurance
- Unintentional weight loss.
The presence of three or more of these features meets the criteria for frailty and is associated with increased risk for mortality over the next 3 years with or without surgery,17 although surgery probably increases the risk.
Frailty is believed to be a failure over time of the homeostatic mechanisms that keep our organ systems functioning in the face of a stress. Decline in the ability of organ systems to maintain normal function is probably caused by inflammation, chronic disease, and normal aging, and has been termed homeostenosis. As a person ages and physiologic reserves are reduced, adding a stress such as surgery or severe infection can result in organ failure—usually multiple-system organ failure. In any intensive care unit, one is likely to see elderly patients who were admitted with one medical or surgical problem and soon end up having renal, liver, or brain dysfunction as well.
Physical therapy immediately after hip fracture surgery is associated with significantly better locomotion 2 months later.18 A number of exercises are effective: range-of-motion exercises, low-impact aerobic activities, and exercises starting with low-intensity resistance (using bands, tubes, and weights) and progressing as tolerated to high-intensity resistance (with machines and pulleys) for an extended period of time.
Nutrition supplementation
Malnourishment can contribute to frailty, yet evidence for the benefits of supplementing nutrition is not strong, as noted above. However, meta-analyses of studies of nutritional interventions with meal supplementation (usually canned supplements) show that meal supplementation can improve mortality risk and reduce morbidity such as pressure ulcers in hospitalized elderly patients.19,20 The patients most likely to benefit are those who are undernourished at baseline and aged 75 years or older.
CASE CONTINUED: WHAT HAPPENS POST-DISCHARGE?
Following surgery, our patient wonders, “Where will I go next? What will my lifestyle be like?”
These are important questions to consider when first evaluating whether an elderly patient should undergo surgery. In the case of hip fracture, standard thinking is that without surgery, the patient will never recover the ability to independently walk and perform activities of daily living. But we also must recognize the considerable risks of surgery in the elderly population, particularly those aged 75 years or older.
Comprehensive discharge planning
Early and intensive discharge management enhances quality of life and may help reduce hospital costs. A good model of care involves collaboration of orthopedic surgeons, hospitalists, general internists, geriatricians, and dietitians to address procedures, diet and nutrition, mobility and activities of daily living, and pain medications.21 A case manager such as a social worker should start addressing care transition the day after surgery—planning ahead is imperative.
Following hip surgery, patients are routinely sent to skilled nursing facilities as soon as possible so they can start intensive physical therapy. Patients with significant functional impairment or who had delirium are more likely to require a prolonged hospital stay.
Naylor et al examined the effectiveness of comprehensive discharge planning in a study that randomized hospitalized patients (including surgical patients) 65 years or older to either usual discharge planning or intensive discharge planning with advanced practice nurses beginning early in hospitalization.22 The intervention group was followed by home care nurses for up to 4 weeks and had continuous telephone access to the nurses. Patients who received the intervention had a significantly lower risk of hospital readmission, and those who were readmitted had significantly shorter hospital stays. The total cost of care was also significantly lower in the intervention group.
Family conferences aid decision making
Family conferences can be very useful for working through the many questions and challenges that surgery in an elderly person can pose, including whether the patient should undergo the operation, postoperative management, and postdischarge placement.23 For patients with an uncertain prognosis because of unclear or multiple concurrent diseases, a family conference can help clarify the goals of therapy, inform the family about likely outcomes, and help determine the patient’s wishes and values. Such issues should be revisited as the postoperative course proceeds.
Family conferences also provide a good opportunity to review advanced directives, the need for life support, and possible transfers to intensive care. Family conferences can also help resolve conflicts in care management, as family members may not agree with the need for surgery, how aggressive treatment should be, or where to send the patient for rehabilitation. Differences among family members on these questions are especially common with elderly patients. Working out such issues will improve patient care, especially when done early in the hospitalization.
DISCUSSION
Question from the audience: In our preoperative clinic, we are trying to intervene to reduce delirium and postoperative cognitive dysfunction. How can we quickly screen for the most important predictors and act to reduce the risk?
Dr. Palmer: The most important risk factor for delirium is age, which obviously can’t be changed. Ask patients about alcohol use and depression. Check on nutritional status and begin supplementation if indicated. Discontinue high-risk medications. Check on electrolytes and their state of hydration; ideally, an electrolyte imbalance can be corrected preoperatively. In addition, other than in patients with end-stage renal disease, try to keep the hemoglobin above 7.5 g/dL, which appears to be associated with better outcomes and less risk of delirium.
It’s also important to remind the family to bring in the patient’s visual aids, hearing devices, and cane or walker so that they’re available right after the operation.
Intraoperative factors that are important for preventing delirium include maintaining good blood pressure levels, giving supplemental oxygen, minimizing the time under general anesthesia, and using local anesthesia if possible.
Question from the audience: How strong is the evidence for using spinal anesthesia as opposed to general anesthesia in preventing postoperative cognitive dysfunction and delirium, especially in the setting of hip fracture repair?
Dr. Palmer: The evidence is fairly soft. For patients undergoing either hip or knee arthroplasty who were randomized to receive either spinal (or local) or general anesthesia, the risk of delirium was similar, but complications such as prolonged bed rest, pressure ulcers, and catheter-related urinary tract infections were somewhat reduced in the spinal/local group.14 The relative risk of developing postoperative cognitive dysfunction is unclear—no randomized controlled trials have been conducted to answer that question.
Question from the audience: How do you use antipsychotic drugs, especially with the concerns from epidemiologic studies about an increased risk of death?
Dr. Palmer: No antipsychotic agents, including haloperidol, have a specific Food and Drug Administration–approved indication for treating agitation, dementia, or delirium. In general, they should not be used without a clear indication. That said, the usual off-label use is for patients who are severely agitated and are at risk of harming themselves or others. In an ICU setting, where patients have multiple lines, the use of these agents can be considered for a very agitated patient. Alternatives exist, but antipsychotics like haloperidol have the advantage that they can be given in small increments very rapidly and achieve good control of severe agitation.
Antipsychotic agents should only be used with great caution and for the shortest duration needed. As delirium resolves, they should be tapered fairly rapidly over a few days and ideally should be discontinued by the time of hospital discharge.
None of the antipsychotic agents—including those in the first generation and the newer atypical agents—is free of this risk of increased mortality. The mechanism is not understood; it may be torsades de pointes or hypotension leading to stroke or sudden cardiac death.
Question from the audience: What is the most efficient way to assess cognitive and physical functioning preoperatively?
Dr. Palmer: There may be a documented history of dementia, or family members may tell you if there has been memory loss or some decline in the patient’s self-care abilities. For patients without dementia, you can ask them directly if they can perform basic activities of daily living, such as getting out of bed or dressing. To assess higher-level function, ask if they can manage their own medications, pay bills, or handle their finances. If not, they might have cognitive impairment and are at higher risk for postoperative delirium. These are rather sensitive measures. There are instruments to assess this more precisely, but few clinicians have time to use them.
Quick bedside tests can help assess for delirium postoperatively. We see if patients are “alert and oriented times three” (“Do you know who you are, where you are, and the date?”). We test for attention by asking them to repeat a random string of numbers spoken 1 second apart in monotone; people who are delirious and many patients with severe dementia can’t repeat more than three numbers. A patient who is alert and oriented, has a good attention span (more than three numbers in correct order), and has no history of dementia probably doesn’t have delirium or dementia.
For physical function, ask if they can walk, get out of bed to a chair, and ambulate. If they don’t give clear answers, observe them get out of bed or a chair, walk 10 feet, and return to bed. If they can do that with good balance, especially within 10 to 15 seconds, they probably have reasonably normal mobility and are at lower risk for postoperative complications such as falls with injury.
- DeFrances CJ, Cullen KA, Kozak LJ. National Hospital Discharge Survey: 2005 annual summary with detailed diagnosis and procedure data. Vital Health Stat (Series 13) 2007; Dec(165):1–209.
- Welcome to HCUPnet: a tool for identifying, tracking, and analyzing national hospital statistics. Agency for Healthcare Research and Quality Web site. http://hcupnet.ahrq.gov. Accessed February 23, 2009.
- Kozak LJ, Owings MF, Hall MJ. National Hospital Discharge Survey: 2002 annual summary with detailed diagnosis and procedure data. Vital Health Stat (Series 13) 2005; Mar(158):1–199.
- Inouye SK, Viscoli CM, Horwitz RI, Hurst LD, Tinetti ME. A predictive model for delirium in hospitalized elderly medical patients based on admission characteristics. Ann Intern Med 1993; 119:474–481.
- Kalisvaart KJ, de Jonghe JF, Bogaards MJ, et al. Haloperidol prophylaxis for elderly hip-surgery patients at risk for delirium: a randomized placebo-controlled study. J Am Geriatr Soc 2005; 53:1658–1666.
- Silverstein JH, Timberger M, Reich DL, Uysal S. Central nervous system dysfunction after noncardiac surgery and anesthesia in the elderly. Anesthesiology 2007; 106:622–628.
- Monk TG, Weldon BC, Garvan CW, et al. Predictors of cognitive dysfunction after major noncardiac surgery. Anesthesiology 2008; 108:18–30.
- Inouye SK. Delirium in older persons. N Engl J Med 2006; 354:1157–1165.
- Marcantonio ER, Goldman L, Mangione CM, et al. A clinical prediction rule for delirium after elective noncardiac surgery. JAMA 1994; 271:134–139.
- Inouye SK. Predisposing and precipitating factors for delirium in hospitalized older patients. Dement Geriatr Cogn Disord 1999; 10:393–400.
- Kalisvaart KJ, Vreeswijk R, de Jonghe JF, et al. Risk factors and prediction of postoperative delirium in elderly hip-surgery patients: implementation and validation of a medical risk factor model. J Am Geriatr Soc 2006; 54:817–822.
- Fick DM, Cooper JW, Wade WE, et al. Updating the Beers criteria for potentially inappropriate medication use in older adults: results of a US consensus panel of experts. Arch Intern Med 2003; 163:2716–2724.
- Marcantonio ER, Flacker JM, Wright RJ, et al. Reducing delirium after hip fracture: a randomized trial. J Am Geriatr Soc 2001; 49:516–522.
- Beaupre LA, Jones CA, Saunders LD, Johnston DW, Buckingham J, Majumdar SR. Best practices for elderly hip fracture patients: a systematic overview of the evidence. J Gen Intern Med 2005; 20:1019–1025.
- Orosz GM, Magaziner J, Hannan EL, et al. Association of timing of surgery for hip fracture and patient outcomes. JAMA 2004; 291:1738–1743.
- Beaupre LA, Cinats JG, Senthilselvan A, et al. Reduced morbidity for elderly patients with a hip fracture after implementation of a perioperative evidence-based clinical pathway. Qual Saf Health Care 2006; 15:375–379.
- Fried LP, Tangen CM, Walston J, et al. Frailty in older adults: evidence for a phenotype. J Gerontol A Biol Sci Med Sci 2001; 56:M146–M156.
- Penrod JD, Boockvar KS, Litke A, et al. Physical therapy and mobility 2 and 6 months after hip fracture. J Am Geriatr Soc 2004; 52:1114–1120.
- Milne AC, Avenell A, Potter J. Meta-analysis: protein and energy supplementation in older people. Ann Intern Med 2006; 144:37–48.
- Avenell A, Handoll HH. Nutritional supplementation for hip fracture aftercare in older people. Cochrane Database Syst Rev 2006; (4):CD001880.
- Miura LN, DiPiero AR, Homer LD. Effects of a geriatrician-led hip fracture program: improvements in clinical and economic outcomes. J Am Geriatr Soc 2009; 57:159–167.
- Naylor MD, Brooten D, Campbell R, et al. Comprehensive discharge planning and home follow-up of hospitalized elders: a randomized clinical trial. JAMA 1999; 281:613–620.
- Palmer RM. Acute hospital care of the elderly: making a difference. Hospitalist 2004; (suppl):4–7.
KEY POINTS
- Postoperative cognitive dysfunction and delirium are distinct conditions, though both are common in the elderly. Postoperative cognitive dysfunction may persist for weeks to months and may not be obvious, whereas delirium, a disorder of attention and cognition, is easier to detect clinically.
- Major predictors of postoperative delirium are severe illness, baseline dementia, dehydration, and sensory impairment.
- Drugs that raise dementia risk include anticholinergics, benzodiazepines, meperidine, tricyclic antidepressants, first-generation antihistamines, and high-dose H2-receptor blockers.
- Early performance of hip fracture surgery in the elderly (ie, within 24 hours of admission) has not been shown to lower mortality but appears to improve other outcomes.
- Identifying and managing frail elderly patients is important. Signs of frailty are minimal activity, generalized muscle weakness, slowed performance, fatigue, and weight loss.
The role of testing in the preoperative evaluation
Routine presurgical assessment of patients with a standard battery of tests not only is wasteful but can lead to more unnecessary expense, delay, and even risk to the patient and physician. Any abnormal tests results, even if likely to be clinically unimportant to the upcoming surgery, will need to be followed up to rule out a significant abnormality that may have later implications. This review will outline strategies for making decisions about which tests are clinically useful for preoperative assessment of a given patient and also discuss the value of preoperative evaluation centers in promoting appropriate preoperative testing.
PREOPERATIVE EVALUATION SHOULD BE CLEARLY DIRECTED
Most patients scheduled for surgery at Brigham and Women’s Hospital are assessed by the staff at our preoperative evaluation center. We take a medical history and conduct a physical examination, review the medical records, order laboratory tests or other studies as indicated, and determine which patients need further work-up or consultations. The goals are to evaluate patient readiness for anesthesia and surgery, optimize patient health before surgery, enhance the quality of perioperative care, reduce the morbidity of surgery and length of stay, and return the patient to normal functioning.1,2
The above goals are generally achieved by directed laboratory testing, managing the patient’s medications, stabilizing disorders when possible, and creating plans for postoperative care and pain management. Communication among the surgeon, the anesthesiology team, and the preoperative medical consultant (if there is one) is critical.1,2
In contrast, “clearing the patient for surgery” is not a legitimate goal of consultation. The real issues to be taken up in a consult are:
- What is the patient’s risk of complications (cardiac and noncardiac)?
- Would further risk stratification alter patient management?
- Can anything be done to reduce the patient’s risk?
If indicated, a consult should cover the entire perioperative period, offering opinions on operative risk and suggesting treatments that affect long-term patient outcomes. Rarely is preoperative intervention necessary just to lower the risk of surgery. Most interventions that are needed should be done regardless of the surgery.
Everyone on the medical team should have the goal of efficient resource utilization, including avoidance of unnecessary visits, laboratory testing, and consultations.
PREOPERATIVE TESTING: WHAT IS NEEDED?
Preoperative testing is extremely expensive: even more than 20 years ago, preoperative medical testing for all types of surgery accounted for approximately $30 billion in US health care costs annually.3 The likelihood of abnormal test results increases with age, and the more tests performed, the more likely a false positive will occur, further driving up costs.
Preoperative testing should generally be directed by a targeted history and physical examination, and the relevance of any tests should be considered in light of the type of procedure that is planned, particularly the hemodynamic changes and blood loss involved. Before ordering a test, physicians should be sure that there is a good reason for the test, that it is consistent with established guidelines, and that the results will be useful (ie, have the potential to change management).
Case study: Inguinal surgery in a healthy elderly man
A 72-year-old man is being evaluated prior to a right inguinal herniorrhaphy. He has osteoarthritis but is otherwise healthy and jogs 3 to 5 miles several times a week. He takes no medications and has no known drug allergies.
Question: Which of the following tests is necessary prior to surgery?
A. Complete blood cell count (CBC)
B. Prothrombin time and partial thromboplastin time
C. Electrocardiogram (ECG)
D. All of the above
E. None of the above
The correct answer is E (none of the above), for the reasons laid out in the following section.
Unnecessary testing may cause more harm than good
Untargeted testing should be avoided. An unexpected result will probably not be clinically significant for the surgery and will only lead to more needless testing, unnecessary anxiety for the patient, and delays in proceeding to the operating room.4 The more tests that are ordered, the higher the likelihood of having an abnormal result by chance: for a test with 95% specificity, results for 1 out of 13 ordered tests will likely be abnormal without there being a true underlying physiologic abnormality.
Researchers at Johns Hopkins University assessed the value of routine preoperative medical testing in a randomized study of nearly 20,000 patients undergoing elective cataract surgery whose preoperative history and physical examination was either preceded or not preceded by a standard battery of tests, including ECG, CBC, electrolytes, urea nitrogen, creatinine, and glucose.5 This was an ideal study population, given the relatively noninvasive nature of the procedure (with minimal hemodynamic changes) and cataract patients’ relatively advanced age and resulting likelihood of comorbidities. Notably, there were no differences between the two groups in the overall rate of complications (approximately 3%), which led the researchers to conclude that routine preoperative medical testing does not increase the safety of cataract procedures. These results could be applied to other low-risk cases.
Unnecessary testing is also expensive. Researchers at Stanford University Hospital retrospectively compared preoperative test orders during 6-month periods before and 1 year after development of an anesthesia preoperative evaluation clinic.6 They found a 55% reduction in the number of preoperative tests ordered from the period before the clinic was established, when tests were ordered by surgeons and primary care physicians, to the period after the clinic was established, when test ordering was transferred to anesthesiologists at the clinic. This reduction in the number of tests ordered resulted in a 59% reduction in the hospital’s expenditures for preoperative tests, yielding $112 in cost savings per patient. No operating room cancellations, delays, or adverse patient events were reported as a result of the change.
Similar results were reported more recently by researchers at a Canadian hospital, who found that selective preoperative test ordering by staff anesthesiologists reduced the number and cost of preoperative studies compared with usual practice without a resulting increase in complications.7
What are the real legal risks?
Many surgeons express the fear that they will be sued if they do not routinely order preoperative tests. My view is that from a medicolegal standpoint, it is usually better not to order an unnecessary test if the next step to take in the event of an abnormal result would be unclear. The legal risk is greater for not following an abnormal test result than for not ordering a test that was not indicated. One may uncover an abnormal laboratory test finding that is not likely to be clinically significant but that could result in legal action if it were not evaluated further. A complication that may not be related to the abnormal result may develop at some point in the future and be blamed on the lack of follow-up. At our center, we insist that when a physician orders a test, he or she is responsible for the results and for following up on abnormalities.
Should testing be based on age?
Using age as a criterion for preoperative testing is controversial. There is no doubt that the older a patient is, the more likely he or she is to have abnormal test results: patients aged 70 years or older have about a 10% chance of having abnormal levels of serum creatinine, hemoglobin, or glucose8 and a 75% chance of having at least one abnormality on their ECG (and a 50% chance of having a major ECG abnormality).9 However, these factors were found not to be predictive of postoperative complications. In contrast, predictive factors for this age group are an American Society of Anesthesiologists (ASA) physical status classification of at least 3 (indicating severe systemic disease), the risk of the surgical procedure, and a history of congestive heart failure.8,9
Guidelines for testing—and for not testing
About 10 years ago, the ASA attempted to develop a practice guideline for routine preoperative testing. The available data were so inconsistent, however, that the ASA could not reach a consensus and instead issued a practice advisory.10
Even so, there are a number of general principles for avoiding unnecessary preoperative testing:
- Routine laboratory tests are not good screening devices and should not be used to screen for disease
- Repetition should be avoided: there is no need to repeat a recent test
- Healthy patients may not need testing
- Patients undergoing minimally invasive procedures may not need testing
- A test should be ordered only if its results will influence management.
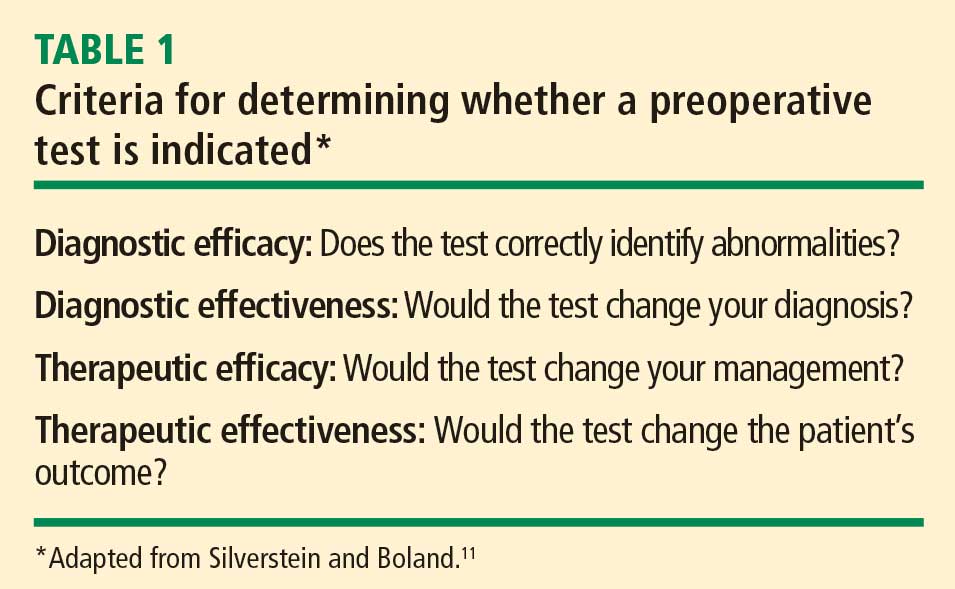
A CLOSER LOOK AT A FEW SPECIFIC TESTS
Question: Which of the following tests is most likely to provide useful information to aid clinical decision-making during a preoperative evaluation for laparoscopic cholecystectomy?
A. A chest radiograph in a 43-year-old woman with asthma
B. An ECG in a 71-year-old man with hypertension
C. A pregnancy test in an 18-year-old woman with amenorrhea
D. A prothrombin time in a 51-year-old man with anemia
E. A urinalysis in a 67-year-old woman with diabetes
The best answer is C (pregnancy test); an ECG in the 71-year-old man would be less useful (see below). The remaining choices—chest radiograph, prothrombin time, and urinalysis—are even less appropriate. A chest radiograph in an asthmatic patient is not likely to yield more information than what is obtained from the history and physical exam. Patients with anemia are not likely to have abnormal coagulation, and the role of urinalysis in detecting glucose and protein in asymptomatic diabetic patients is limited.
Routine pregnancy testing is justifiable
There are a number of reasons to justify a low threshold for preoperative pregnancy testing10:
- Patients, especially adolescents, are often unreliable in suspecting that they might be pregnant (in several studies of routine preoperative pregnancy screening, 0.3% to 2.2% of tests were positive)
- History and physical examination are often insufficient to determine early pregnancy
- Management usually changes if it is discovered that a patient is pregnant.
Using the four criteria from Table 1, pregnancy testing rates high as a useful test: it would identify “abnormality,” it would determine a diagnosis, and it would likely change management.
Routine ECG has limited utility
In contrast, routine preoperative ECG is not well supported. A recent study from the Netherlands assessed the added value of a preoperative ECG in predicting myocardial infarction and death following noncardiac surgery among 2,422 patients older than age 50 years.12 It showed that ECG findings were no more predictive of complications than findings from the history and physical examination and the patient’s activity level.
From our own data at Brigham and Women’s Hospital,13 we found that the presence of any of the following six risk factors predicted all but 0.44% of ECG abnormalities in patients aged 50 years or older presenting for preoperative evaluation:
- Age greater than 65 years
- Congestive heart failure
- High cholesterol
- Angina
- Myocardial infarction
- Severe valvular disease.
The 2007 guidelines on perioperative risk assessment from the American College of Cardiology and American Heart Association (ACC/AHA) do not consider ECG to be indicated in asymptomatic patients undergoing low-risk noncardiac procedures regardless of patient age,14 like the 71-year-old man with hypertension in the above case question. These guidelines also state that evidence for routine ECG orders is not well established in patients with at least one clinical risk factor undergoing intermediate-risk procedures.
The aforementioned ASA practice advisory acknowledges that the likelihood of ECG abnormalities rises with increasing patient age, but the ASA was unable to reach consensus on a minimum age for routinely ordering an ECG in surgical candidates.10 The advisory recommends taking into account other factors, such as cardiac risk factors, the presence of cardiocirculatory or respiratory disease, and the type and invasiveness of the surgical procedure.10
In recommendations not specific to the perioperative setting, the US Preventive Services Task Force advises against routine screening for coronary heart disease with ECG or exercise treadmill testing.15 It gives routine screening a “D” recommendation, indicating that risk is greater than benefit because of the potential for unnecessary invasive procedures, overtreatment, and mislabeling of patients.
Our group at Brigham and Women’s Hospital recently surveyed anesthesiology program directors at US teaching hospitals to determine their preoperative test-ordering practices.16 Among the 75 respondents (58% response rate), 95% said their institutions have no requirements for ordering ECGs unless indicated based on age, history, or surgery type; 71% said their institutions have age-based requirements for ordering ECGs (usually > 50 years). Most respondents reported that their institutions are ordering fewer ECGs since the publication of the 2007 ACC/AHA guidelines on perioperative evaluation.
Whether or not age should be used as a criterion for ECG testing is controversial, and editorials on this subject abound.17–19 They point out that clinicians must be careful before abandoning routine ECGs in elderly patients, for several reasons:
- An abnormal ECG (or abnormal lab test results) may modify a patient’s ASA classification (which is predictive of complications)
- At least one-quarter of myocardial infarctions in elderly persons are “silent” or clinically unrecognized
- A preoperative ECG provides a useful baseline if the patient should develop ECG changes, chest pain, or cardiac complications during the perioperative period.
Most institutions use age as a criterion for ordering tests, especially for ECGs. If such a policy is used, a threshold of 60 years or older is probably most appropriate. However, a patient with good functional capacity who is undergoing a low-risk procedure does not need cardiac testing.14,20
An additional consideration is cost. Although the cost of a single ECG is modest, the cumulative cost of preoperative ECGs for all older surgical patients is significant over the course of a year. Because the Centers for Medicare and Medicaid Services (CMS) no longer cover routine preoperative ECGs, routine testing can be very costly to an institution over time.
COST AND REGULATORY BENEFITS OF PREOPERATIVE CENTERS
Preoperative evaluation centers tend to be cost-effective, as they keep consultations and redundant provider interviews to a minimum, encourage more appropriate targeting of tests, and help to avoid last-minute operating room delays and cancellations.21,22 They also provide an efficient means of compiling the chart for the operating room.
The merits of standardization
Preoperative evaluation centers likewise encourage more standardized preoperative assessment, which can facilitate compliance with surgical quality measures such as those from the National Surgical Quality Improvement Program and the Leapfrog Group. Standardization also fosters more efficient and consistent regulatory documentation, making it easier to follow requirements from CMS (often linked to reimbursement) and the Joint Commission. It also tends to improve reimbursement by encouraging more appropriate coding under CMS’ diagnosis-related group (DRG) system to indicate that whatever testing is ordered is related to the surgical diagnosis or to relevant comorbidities.
No excessive dictates from Joint Commission or CMS
Contrary to what many believe, the Joint Commission does not require excessive preoperative testing. The Joint Commission has no mandate for routine diagnostic tests but requires only what is necessary for determining a patient’s health care needs.23
CMS provides no guidance as to what to do or not do in a preoperative assessment, but it does not reimburse for routine screening tests or for age-based testing.24 Reimbursement for a preoperative ECG, for example, requires documentation of the patient’s signs or symptoms; for an ECG that is indicated, reimbursement includes review and interpretation by the physician.25
A new partner for proper preoperative assessment
Appropriate preoperative evaluation and testing is one of the goals promoted by the recently formed Society for Perioperative Assessment and Quality Improvement (SPAQI). The mission of this international nonprofit organization is to optimize surgical outcomes by sharing best practices and promoting research and communication among health professionals across multiple disciplines. More information is available at www.spaqi.org.
DISCUSSION
Question from the audience: At my hospital, we teach residents about limiting the preoperative tests they order, but surgeons routinely expect many of these tests, including chest x-rays in patients with pulmonary conditions. Are any surgical societies involved in efforts to reduce preoperative testing? Or are surgical societies’ recommendations actually driving some of the unnecessary testing?
Dr. Hepner: I’m not aware of recommendations from surgical societies regarding preoperative testing. Many surgeons believe that the more testing that’s done, the likelier they are to uncover an occult disease. They also often want baseline information, which may actually be warranted in some cases.
Question from the audience: If you’re already ordering a “type and screen” or “type and hold” for a patient, isn’t it worthwhile to just add on a CBC? The patient is already getting the phlebotomy, so isn’t there a cost benefit to getting other routine tests done at the same time rather than calling the patient back for more tests if another indication arises?
Dr. Hepner: Charges are generally assessed for each individual test, not for drawing blood, so I would only get the tests that are indicated.
Question from the audience: In institutions without a preoperative clinic, sometimes the surgeons do the work-up without discussing the case with the primary doctor, and the surgeons want an ECG so that the case isn’t cancelled at the last minute. Can you give straightforward criteria in such cases, such as an age threshold, or would you not order an ECG for anyone?
Dr. Hepner: Based on our most recent data, 60 years seems to be a reasonable cutoff if you are going to use age as a criterion.
Question from the audience: What criteria do you use for preoperative screening with pregnancy tests?
Dr. Hepner: If you have an unreliable patient population, general screening should be done. We don’t have such a requirement, but we have a very low threshold. If a patient appears very reliable, knowing the exact date of her last menstrual period, we’ll go by that. If a patient is unsure, we’ll do a pregnancy test.
Question from the audience: My hospital doesn’t have a preoperative clinic, and until recently, the anesthesiology department has helped surgeons with ordering of preoperative tests. We followed a guideline protocol for about 20 years. Now the newer surgeons say they don’t want to be responsible for abnormal test results. Yet we anesthesiologists aren’t seeing the patients, so we can’t use clinical judgment; we can only go by the guidelines. The surgeons are the only physicians on the case who actually do the history and physical exam. So who should sign the test orders and be responsible for abnormal results?
Dr. Hepner: In our preoperative test center, we tell the surgical team that if they are uncertain about which tests to order, we will handle it. And if we order a test, we follow up on the results. You must ensure that orders are signed and not rubber-stamped; that way, the person who orders a test will get called with any abnormal results. If you order it, you own it.
Question from the audience: I agree that no testing is needed for the 72-year-old man you presented who was undergoing surgery for inguinal hernia, but it always worries me not to do an ECG since part of the standard of care for anesthesia is intraoperative ECG monitoring. If we see some sort of unusual arrhythmia when we take the patient in, we might cancel the case if we don’t know whether it was present at baseline. Surgeons will ask me, “Why didn’t you order a baseline if you’re going to monitor the ECG in the operating room? If you’re not going to order a baseline, then why monitor the ECG?” These are medicolegal issues that I haven’t seen addressed.
Dr. Hepner: A case like you describe will be addressed in the upcoming medicolegal session (see page S119). You make a good point that many times just having a baseline is helpful, but I would argue that it is more helpful for intermediate- or high-risk cases.
- Klafta JM, Roizen MF. Current understanding of patients’ attitudes toward and preparation for anesthesia: a review. Anesth Analg 1996; 83:1314–1321.
- Halaszynski TM, Juda R, Silverman DG. Optimizing postoperative outcomes with efficient preoperative assessment and management. Crit Care Med 2004; 32(suppl 4):S76–S86.
- Roizen MF, Kaplan EB, Schreider BD, Lichtor LJ, Orkin FK. The relative roles of the history and physical examination, and laboratory testing in preoperative evaluation for outpatient surgery: the “Starling” curve of preoperative laboratory testing. Anesthesiol Clin North Am 1987; 5:15–34.
- Roizen MF. More preoperative assessment by physicians and less by laboratory tests. N Engl J Med 2000; 342:204–205.
- Schein OD, Katz J, Bass EB, et al. The value of routine preoperative medical testing before cataract surgery. Study of Medical Testing for Cataract Surgery. N Engl J Med 2000; 342:168–175.
- Fischer SP. Development and effectiveness of an anesthesia preoperative evaluation clinic in a teaching hospital. Anesthesiology 1996; 85:196–206.
- Finegan BA, Rashiq S, McAlister FA, O’Connor P. Selective ordering of preoperative investigations by anesthesiologists reduces the number and cost of tests. Can J Anaesth 2005; 52:575–580.
- Dzankic S, Pastor D, Gonzalez C, Leung JM. The prevalence and predictive value of abnormal preoperative laboratory tests in elderly surgical patients. Anesth Analg 2001; 93:301–308.
- Liu LL, Dzankic S, Leung JM. Preoperative electrocardiogram abnormalities do not predict postoperative cardiac complications in geriatric surgical patients. J Am Geriatr Soc 2002; 50:1186–1191.
- American Society of Anesthesiologists Task Force on Preanesthesia Evaluation. Practice advisory for preanesthesia evaluation: a report by the American Society of Anesthesiologists Task Force on Preanesthesia Evaluation. Anesthesiology 2002; 96:485–496.
- Silverstein MD, Boland BJ. Conceptual framework for evaluating laboratory tests: case-finding in ambulatory patients. Clin Chem 1994; 40:1621–1627.
- van Klei WA, Bryson GL, Yang H, et al. The value of routine preoperative electrocardiography in predicting myocardial infarction after noncardiac surgery. Ann Surg 2007; 246:165–170.
- Correll DJ, Hepner DL, Chang C, Tsen L, Hevelone ND, Bader AM. Preoperative electrocardiograms: patient factors predictive of abnormalities. Anesthesiology 2009; 110:1217–1222.
- Fleisher LA, Beckman JA, Brown KA, et al. ACC/AHA 2007 guidelines on perioperative cardiovascular evaluation and care for noncardiac surgery: executive summary. J Am Coll Cardiol 2007; 50:1707–1732.
- U.S. Preventive Services Task Force. Screening for coronary heart disease: recommendation statement. Agency for Healthcare Research and Quality Web site. http://www.ahrq.gov/clinic/3rduspstf/chd/chdrs.htm. Accessed March 20, 2009.
- Hepner DL, Bader AR, Correll D, Tsen LC, Segal BS, Bader AM. An analysis of preoperative testing protocols in academic anesthesiology programs. Poster presented at: 4th Annual Perioperative Medicine Summit; February 5–7, 2009; Miami Beach, FL. http://www.ccjm.org/content/76/Electronic_Suppl_1/eS18.full.pdf+html. Accessed May 28, 2009.
- De Hert SG. Preoperative electrocardiograms: obsolete or still useful? Anesthesiology 2009; 110:1205–1206.
- Fleisher LA. The preoperative electrocardiogram: what is the role in 2007? Ann Surg 2007; 246:171–172.
- Rich MW. The preoperative electrocardiogram: have we reached the end of an era? J Am Geriatr Soc 2002; 50:1301–1303.
- Noordzij PG, Boersma E, Bax JJ, et al. Prognostic value of routine preoperative electrocardiography in patients undergoing noncardiac surgery. Am J Cardiol 2006; 97:1103–1106.
- Ferschl MB, Tung A, Sweitzer B, Huo D, Glick DB. Preoperative clinic visits reduce operating room cancellations and delays. Anesthesiology 2005; 103:855–859.
- Correll DJ, Bader AM, Hull MW, Tsen LC, Hepner DL. The value of preoperative clinic visits in identifying issues with potential impact on operating room efficiency. Anesthesiology 2006; 105:1254–1259.
- The Joint Commission. 2009 Comprehensive Accreditation Manual for Hospitals: The Official Handbook. Oak Brook, IL: Joint Commission Resources; 2008.
- Medicare coverage center. Centers for Medicare & Medicaid Services Web site. http://www.cms.hhs.gov/Center/coverage.asp. Accessed March 20, 2009.
- CMS Manual System: Pub. 100-03 Medicare National Coverage Determinations. Dept of Health & Human Services (DHHS), Centers for Medicare & Medicaid Services (CMS). Transmittal 26. December 10, 2004.
Routine presurgical assessment of patients with a standard battery of tests not only is wasteful but can lead to more unnecessary expense, delay, and even risk to the patient and physician. Any abnormal tests results, even if likely to be clinically unimportant to the upcoming surgery, will need to be followed up to rule out a significant abnormality that may have later implications. This review will outline strategies for making decisions about which tests are clinically useful for preoperative assessment of a given patient and also discuss the value of preoperative evaluation centers in promoting appropriate preoperative testing.
PREOPERATIVE EVALUATION SHOULD BE CLEARLY DIRECTED
Most patients scheduled for surgery at Brigham and Women’s Hospital are assessed by the staff at our preoperative evaluation center. We take a medical history and conduct a physical examination, review the medical records, order laboratory tests or other studies as indicated, and determine which patients need further work-up or consultations. The goals are to evaluate patient readiness for anesthesia and surgery, optimize patient health before surgery, enhance the quality of perioperative care, reduce the morbidity of surgery and length of stay, and return the patient to normal functioning.1,2
The above goals are generally achieved by directed laboratory testing, managing the patient’s medications, stabilizing disorders when possible, and creating plans for postoperative care and pain management. Communication among the surgeon, the anesthesiology team, and the preoperative medical consultant (if there is one) is critical.1,2
In contrast, “clearing the patient for surgery” is not a legitimate goal of consultation. The real issues to be taken up in a consult are:
- What is the patient’s risk of complications (cardiac and noncardiac)?
- Would further risk stratification alter patient management?
- Can anything be done to reduce the patient’s risk?
If indicated, a consult should cover the entire perioperative period, offering opinions on operative risk and suggesting treatments that affect long-term patient outcomes. Rarely is preoperative intervention necessary just to lower the risk of surgery. Most interventions that are needed should be done regardless of the surgery.
Everyone on the medical team should have the goal of efficient resource utilization, including avoidance of unnecessary visits, laboratory testing, and consultations.
PREOPERATIVE TESTING: WHAT IS NEEDED?
Preoperative testing is extremely expensive: even more than 20 years ago, preoperative medical testing for all types of surgery accounted for approximately $30 billion in US health care costs annually.3 The likelihood of abnormal test results increases with age, and the more tests performed, the more likely a false positive will occur, further driving up costs.
Preoperative testing should generally be directed by a targeted history and physical examination, and the relevance of any tests should be considered in light of the type of procedure that is planned, particularly the hemodynamic changes and blood loss involved. Before ordering a test, physicians should be sure that there is a good reason for the test, that it is consistent with established guidelines, and that the results will be useful (ie, have the potential to change management).
Case study: Inguinal surgery in a healthy elderly man
A 72-year-old man is being evaluated prior to a right inguinal herniorrhaphy. He has osteoarthritis but is otherwise healthy and jogs 3 to 5 miles several times a week. He takes no medications and has no known drug allergies.
Question: Which of the following tests is necessary prior to surgery?
A. Complete blood cell count (CBC)
B. Prothrombin time and partial thromboplastin time
C. Electrocardiogram (ECG)
D. All of the above
E. None of the above
The correct answer is E (none of the above), for the reasons laid out in the following section.
Unnecessary testing may cause more harm than good
Untargeted testing should be avoided. An unexpected result will probably not be clinically significant for the surgery and will only lead to more needless testing, unnecessary anxiety for the patient, and delays in proceeding to the operating room.4 The more tests that are ordered, the higher the likelihood of having an abnormal result by chance: for a test with 95% specificity, results for 1 out of 13 ordered tests will likely be abnormal without there being a true underlying physiologic abnormality.
Researchers at Johns Hopkins University assessed the value of routine preoperative medical testing in a randomized study of nearly 20,000 patients undergoing elective cataract surgery whose preoperative history and physical examination was either preceded or not preceded by a standard battery of tests, including ECG, CBC, electrolytes, urea nitrogen, creatinine, and glucose.5 This was an ideal study population, given the relatively noninvasive nature of the procedure (with minimal hemodynamic changes) and cataract patients’ relatively advanced age and resulting likelihood of comorbidities. Notably, there were no differences between the two groups in the overall rate of complications (approximately 3%), which led the researchers to conclude that routine preoperative medical testing does not increase the safety of cataract procedures. These results could be applied to other low-risk cases.
Unnecessary testing is also expensive. Researchers at Stanford University Hospital retrospectively compared preoperative test orders during 6-month periods before and 1 year after development of an anesthesia preoperative evaluation clinic.6 They found a 55% reduction in the number of preoperative tests ordered from the period before the clinic was established, when tests were ordered by surgeons and primary care physicians, to the period after the clinic was established, when test ordering was transferred to anesthesiologists at the clinic. This reduction in the number of tests ordered resulted in a 59% reduction in the hospital’s expenditures for preoperative tests, yielding $112 in cost savings per patient. No operating room cancellations, delays, or adverse patient events were reported as a result of the change.
Similar results were reported more recently by researchers at a Canadian hospital, who found that selective preoperative test ordering by staff anesthesiologists reduced the number and cost of preoperative studies compared with usual practice without a resulting increase in complications.7
What are the real legal risks?
Many surgeons express the fear that they will be sued if they do not routinely order preoperative tests. My view is that from a medicolegal standpoint, it is usually better not to order an unnecessary test if the next step to take in the event of an abnormal result would be unclear. The legal risk is greater for not following an abnormal test result than for not ordering a test that was not indicated. One may uncover an abnormal laboratory test finding that is not likely to be clinically significant but that could result in legal action if it were not evaluated further. A complication that may not be related to the abnormal result may develop at some point in the future and be blamed on the lack of follow-up. At our center, we insist that when a physician orders a test, he or she is responsible for the results and for following up on abnormalities.
Should testing be based on age?
Using age as a criterion for preoperative testing is controversial. There is no doubt that the older a patient is, the more likely he or she is to have abnormal test results: patients aged 70 years or older have about a 10% chance of having abnormal levels of serum creatinine, hemoglobin, or glucose8 and a 75% chance of having at least one abnormality on their ECG (and a 50% chance of having a major ECG abnormality).9 However, these factors were found not to be predictive of postoperative complications. In contrast, predictive factors for this age group are an American Society of Anesthesiologists (ASA) physical status classification of at least 3 (indicating severe systemic disease), the risk of the surgical procedure, and a history of congestive heart failure.8,9
Guidelines for testing—and for not testing
About 10 years ago, the ASA attempted to develop a practice guideline for routine preoperative testing. The available data were so inconsistent, however, that the ASA could not reach a consensus and instead issued a practice advisory.10
Even so, there are a number of general principles for avoiding unnecessary preoperative testing:
- Routine laboratory tests are not good screening devices and should not be used to screen for disease
- Repetition should be avoided: there is no need to repeat a recent test
- Healthy patients may not need testing
- Patients undergoing minimally invasive procedures may not need testing
- A test should be ordered only if its results will influence management.
A CLOSER LOOK AT A FEW SPECIFIC TESTS
Question: Which of the following tests is most likely to provide useful information to aid clinical decision-making during a preoperative evaluation for laparoscopic cholecystectomy?
A. A chest radiograph in a 43-year-old woman with asthma
B. An ECG in a 71-year-old man with hypertension
C. A pregnancy test in an 18-year-old woman with amenorrhea
D. A prothrombin time in a 51-year-old man with anemia
E. A urinalysis in a 67-year-old woman with diabetes
The best answer is C (pregnancy test); an ECG in the 71-year-old man would be less useful (see below). The remaining choices—chest radiograph, prothrombin time, and urinalysis—are even less appropriate. A chest radiograph in an asthmatic patient is not likely to yield more information than what is obtained from the history and physical exam. Patients with anemia are not likely to have abnormal coagulation, and the role of urinalysis in detecting glucose and protein in asymptomatic diabetic patients is limited.
Routine pregnancy testing is justifiable
There are a number of reasons to justify a low threshold for preoperative pregnancy testing10:
- Patients, especially adolescents, are often unreliable in suspecting that they might be pregnant (in several studies of routine preoperative pregnancy screening, 0.3% to 2.2% of tests were positive)
- History and physical examination are often insufficient to determine early pregnancy
- Management usually changes if it is discovered that a patient is pregnant.
Using the four criteria from Table 1, pregnancy testing rates high as a useful test: it would identify “abnormality,” it would determine a diagnosis, and it would likely change management.
Routine ECG has limited utility
In contrast, routine preoperative ECG is not well supported. A recent study from the Netherlands assessed the added value of a preoperative ECG in predicting myocardial infarction and death following noncardiac surgery among 2,422 patients older than age 50 years.12 It showed that ECG findings were no more predictive of complications than findings from the history and physical examination and the patient’s activity level.
From our own data at Brigham and Women’s Hospital,13 we found that the presence of any of the following six risk factors predicted all but 0.44% of ECG abnormalities in patients aged 50 years or older presenting for preoperative evaluation:
- Age greater than 65 years
- Congestive heart failure
- High cholesterol
- Angina
- Myocardial infarction
- Severe valvular disease.
The 2007 guidelines on perioperative risk assessment from the American College of Cardiology and American Heart Association (ACC/AHA) do not consider ECG to be indicated in asymptomatic patients undergoing low-risk noncardiac procedures regardless of patient age,14 like the 71-year-old man with hypertension in the above case question. These guidelines also state that evidence for routine ECG orders is not well established in patients with at least one clinical risk factor undergoing intermediate-risk procedures.
The aforementioned ASA practice advisory acknowledges that the likelihood of ECG abnormalities rises with increasing patient age, but the ASA was unable to reach consensus on a minimum age for routinely ordering an ECG in surgical candidates.10 The advisory recommends taking into account other factors, such as cardiac risk factors, the presence of cardiocirculatory or respiratory disease, and the type and invasiveness of the surgical procedure.10
In recommendations not specific to the perioperative setting, the US Preventive Services Task Force advises against routine screening for coronary heart disease with ECG or exercise treadmill testing.15 It gives routine screening a “D” recommendation, indicating that risk is greater than benefit because of the potential for unnecessary invasive procedures, overtreatment, and mislabeling of patients.
Our group at Brigham and Women’s Hospital recently surveyed anesthesiology program directors at US teaching hospitals to determine their preoperative test-ordering practices.16 Among the 75 respondents (58% response rate), 95% said their institutions have no requirements for ordering ECGs unless indicated based on age, history, or surgery type; 71% said their institutions have age-based requirements for ordering ECGs (usually > 50 years). Most respondents reported that their institutions are ordering fewer ECGs since the publication of the 2007 ACC/AHA guidelines on perioperative evaluation.
Whether or not age should be used as a criterion for ECG testing is controversial, and editorials on this subject abound.17–19 They point out that clinicians must be careful before abandoning routine ECGs in elderly patients, for several reasons:
- An abnormal ECG (or abnormal lab test results) may modify a patient’s ASA classification (which is predictive of complications)
- At least one-quarter of myocardial infarctions in elderly persons are “silent” or clinically unrecognized
- A preoperative ECG provides a useful baseline if the patient should develop ECG changes, chest pain, or cardiac complications during the perioperative period.
Most institutions use age as a criterion for ordering tests, especially for ECGs. If such a policy is used, a threshold of 60 years or older is probably most appropriate. However, a patient with good functional capacity who is undergoing a low-risk procedure does not need cardiac testing.14,20
An additional consideration is cost. Although the cost of a single ECG is modest, the cumulative cost of preoperative ECGs for all older surgical patients is significant over the course of a year. Because the Centers for Medicare and Medicaid Services (CMS) no longer cover routine preoperative ECGs, routine testing can be very costly to an institution over time.
COST AND REGULATORY BENEFITS OF PREOPERATIVE CENTERS
Preoperative evaluation centers tend to be cost-effective, as they keep consultations and redundant provider interviews to a minimum, encourage more appropriate targeting of tests, and help to avoid last-minute operating room delays and cancellations.21,22 They also provide an efficient means of compiling the chart for the operating room.
The merits of standardization
Preoperative evaluation centers likewise encourage more standardized preoperative assessment, which can facilitate compliance with surgical quality measures such as those from the National Surgical Quality Improvement Program and the Leapfrog Group. Standardization also fosters more efficient and consistent regulatory documentation, making it easier to follow requirements from CMS (often linked to reimbursement) and the Joint Commission. It also tends to improve reimbursement by encouraging more appropriate coding under CMS’ diagnosis-related group (DRG) system to indicate that whatever testing is ordered is related to the surgical diagnosis or to relevant comorbidities.
No excessive dictates from Joint Commission or CMS
Contrary to what many believe, the Joint Commission does not require excessive preoperative testing. The Joint Commission has no mandate for routine diagnostic tests but requires only what is necessary for determining a patient’s health care needs.23
CMS provides no guidance as to what to do or not do in a preoperative assessment, but it does not reimburse for routine screening tests or for age-based testing.24 Reimbursement for a preoperative ECG, for example, requires documentation of the patient’s signs or symptoms; for an ECG that is indicated, reimbursement includes review and interpretation by the physician.25
A new partner for proper preoperative assessment
Appropriate preoperative evaluation and testing is one of the goals promoted by the recently formed Society for Perioperative Assessment and Quality Improvement (SPAQI). The mission of this international nonprofit organization is to optimize surgical outcomes by sharing best practices and promoting research and communication among health professionals across multiple disciplines. More information is available at www.spaqi.org.
DISCUSSION
Question from the audience: At my hospital, we teach residents about limiting the preoperative tests they order, but surgeons routinely expect many of these tests, including chest x-rays in patients with pulmonary conditions. Are any surgical societies involved in efforts to reduce preoperative testing? Or are surgical societies’ recommendations actually driving some of the unnecessary testing?
Dr. Hepner: I’m not aware of recommendations from surgical societies regarding preoperative testing. Many surgeons believe that the more testing that’s done, the likelier they are to uncover an occult disease. They also often want baseline information, which may actually be warranted in some cases.
Question from the audience: If you’re already ordering a “type and screen” or “type and hold” for a patient, isn’t it worthwhile to just add on a CBC? The patient is already getting the phlebotomy, so isn’t there a cost benefit to getting other routine tests done at the same time rather than calling the patient back for more tests if another indication arises?
Dr. Hepner: Charges are generally assessed for each individual test, not for drawing blood, so I would only get the tests that are indicated.
Question from the audience: In institutions without a preoperative clinic, sometimes the surgeons do the work-up without discussing the case with the primary doctor, and the surgeons want an ECG so that the case isn’t cancelled at the last minute. Can you give straightforward criteria in such cases, such as an age threshold, or would you not order an ECG for anyone?
Dr. Hepner: Based on our most recent data, 60 years seems to be a reasonable cutoff if you are going to use age as a criterion.
Question from the audience: What criteria do you use for preoperative screening with pregnancy tests?
Dr. Hepner: If you have an unreliable patient population, general screening should be done. We don’t have such a requirement, but we have a very low threshold. If a patient appears very reliable, knowing the exact date of her last menstrual period, we’ll go by that. If a patient is unsure, we’ll do a pregnancy test.
Question from the audience: My hospital doesn’t have a preoperative clinic, and until recently, the anesthesiology department has helped surgeons with ordering of preoperative tests. We followed a guideline protocol for about 20 years. Now the newer surgeons say they don’t want to be responsible for abnormal test results. Yet we anesthesiologists aren’t seeing the patients, so we can’t use clinical judgment; we can only go by the guidelines. The surgeons are the only physicians on the case who actually do the history and physical exam. So who should sign the test orders and be responsible for abnormal results?
Dr. Hepner: In our preoperative test center, we tell the surgical team that if they are uncertain about which tests to order, we will handle it. And if we order a test, we follow up on the results. You must ensure that orders are signed and not rubber-stamped; that way, the person who orders a test will get called with any abnormal results. If you order it, you own it.
Question from the audience: I agree that no testing is needed for the 72-year-old man you presented who was undergoing surgery for inguinal hernia, but it always worries me not to do an ECG since part of the standard of care for anesthesia is intraoperative ECG monitoring. If we see some sort of unusual arrhythmia when we take the patient in, we might cancel the case if we don’t know whether it was present at baseline. Surgeons will ask me, “Why didn’t you order a baseline if you’re going to monitor the ECG in the operating room? If you’re not going to order a baseline, then why monitor the ECG?” These are medicolegal issues that I haven’t seen addressed.
Dr. Hepner: A case like you describe will be addressed in the upcoming medicolegal session (see page S119). You make a good point that many times just having a baseline is helpful, but I would argue that it is more helpful for intermediate- or high-risk cases.
- Klafta JM, Roizen MF. Current understanding of patients’ attitudes toward and preparation for anesthesia: a review. Anesth Analg 1996; 83:1314–1321.
- Halaszynski TM, Juda R, Silverman DG. Optimizing postoperative outcomes with efficient preoperative assessment and management. Crit Care Med 2004; 32(suppl 4):S76–S86.
- Roizen MF, Kaplan EB, Schreider BD, Lichtor LJ, Orkin FK. The relative roles of the history and physical examination, and laboratory testing in preoperative evaluation for outpatient surgery: the “Starling” curve of preoperative laboratory testing. Anesthesiol Clin North Am 1987; 5:15–34.
- Roizen MF. More preoperative assessment by physicians and less by laboratory tests. N Engl J Med 2000; 342:204–205.
- Schein OD, Katz J, Bass EB, et al. The value of routine preoperative medical testing before cataract surgery. Study of Medical Testing for Cataract Surgery. N Engl J Med 2000; 342:168–175.
- Fischer SP. Development and effectiveness of an anesthesia preoperative evaluation clinic in a teaching hospital. Anesthesiology 1996; 85:196–206.
- Finegan BA, Rashiq S, McAlister FA, O’Connor P. Selective ordering of preoperative investigations by anesthesiologists reduces the number and cost of tests. Can J Anaesth 2005; 52:575–580.
- Dzankic S, Pastor D, Gonzalez C, Leung JM. The prevalence and predictive value of abnormal preoperative laboratory tests in elderly surgical patients. Anesth Analg 2001; 93:301–308.
- Liu LL, Dzankic S, Leung JM. Preoperative electrocardiogram abnormalities do not predict postoperative cardiac complications in geriatric surgical patients. J Am Geriatr Soc 2002; 50:1186–1191.
- American Society of Anesthesiologists Task Force on Preanesthesia Evaluation. Practice advisory for preanesthesia evaluation: a report by the American Society of Anesthesiologists Task Force on Preanesthesia Evaluation. Anesthesiology 2002; 96:485–496.
- Silverstein MD, Boland BJ. Conceptual framework for evaluating laboratory tests: case-finding in ambulatory patients. Clin Chem 1994; 40:1621–1627.
- van Klei WA, Bryson GL, Yang H, et al. The value of routine preoperative electrocardiography in predicting myocardial infarction after noncardiac surgery. Ann Surg 2007; 246:165–170.
- Correll DJ, Hepner DL, Chang C, Tsen L, Hevelone ND, Bader AM. Preoperative electrocardiograms: patient factors predictive of abnormalities. Anesthesiology 2009; 110:1217–1222.
- Fleisher LA, Beckman JA, Brown KA, et al. ACC/AHA 2007 guidelines on perioperative cardiovascular evaluation and care for noncardiac surgery: executive summary. J Am Coll Cardiol 2007; 50:1707–1732.
- U.S. Preventive Services Task Force. Screening for coronary heart disease: recommendation statement. Agency for Healthcare Research and Quality Web site. http://www.ahrq.gov/clinic/3rduspstf/chd/chdrs.htm. Accessed March 20, 2009.
- Hepner DL, Bader AR, Correll D, Tsen LC, Segal BS, Bader AM. An analysis of preoperative testing protocols in academic anesthesiology programs. Poster presented at: 4th Annual Perioperative Medicine Summit; February 5–7, 2009; Miami Beach, FL. http://www.ccjm.org/content/76/Electronic_Suppl_1/eS18.full.pdf+html. Accessed May 28, 2009.
- De Hert SG. Preoperative electrocardiograms: obsolete or still useful? Anesthesiology 2009; 110:1205–1206.
- Fleisher LA. The preoperative electrocardiogram: what is the role in 2007? Ann Surg 2007; 246:171–172.
- Rich MW. The preoperative electrocardiogram: have we reached the end of an era? J Am Geriatr Soc 2002; 50:1301–1303.
- Noordzij PG, Boersma E, Bax JJ, et al. Prognostic value of routine preoperative electrocardiography in patients undergoing noncardiac surgery. Am J Cardiol 2006; 97:1103–1106.
- Ferschl MB, Tung A, Sweitzer B, Huo D, Glick DB. Preoperative clinic visits reduce operating room cancellations and delays. Anesthesiology 2005; 103:855–859.
- Correll DJ, Bader AM, Hull MW, Tsen LC, Hepner DL. The value of preoperative clinic visits in identifying issues with potential impact on operating room efficiency. Anesthesiology 2006; 105:1254–1259.
- The Joint Commission. 2009 Comprehensive Accreditation Manual for Hospitals: The Official Handbook. Oak Brook, IL: Joint Commission Resources; 2008.
- Medicare coverage center. Centers for Medicare & Medicaid Services Web site. http://www.cms.hhs.gov/Center/coverage.asp. Accessed March 20, 2009.
- CMS Manual System: Pub. 100-03 Medicare National Coverage Determinations. Dept of Health & Human Services (DHHS), Centers for Medicare & Medicaid Services (CMS). Transmittal 26. December 10, 2004.
KEY POINTS
- Age-based criteria for preoperative testing are controversial because test abnormalities are common in older people but are not as predictive of complications as information gained from the history and physical exam.
- Pregnancy testing is an example of an appropriate preoperative test because pregnancy is often not detectable by the history and physical exam and a positive result would affect case management.
- Routine ordering of preoperative electrocardiograms is not recommended because they are unlikely to offer predictive value beyond the history and physical exam and are costly to an institution over time.
- Routine and aged-based preoperative tests are no longer reimbursed by the Centers for Medicare and Medicaid Services.
Perioperative fluid management: Progress despite lingering controversies
Perioperative fluid management remains controversial. Until recently, fluid management was guided by targets such as urine output, static pressures, blood pressure, and other physiologic variables. Such physiologic signs, however, are inadequate for detecting subclinical hypovolemia. This has prompted the emergence of an approach to fluid administration based on stroke volume and cardiac output—a “flow-guided” approach—designed to overcome the inadequacies of conventional physiologic signs and improve outcomes. Recent technological advances are permitting noninvasive guidance of intravenous fluid therapy to optimize intravascular volume status.
This article reviews the rationale for perioperative fluid management, strategies for perioperative fluid therapy and their associated outcomes, the types of volume expanders used, and considerations for improving perioperative fluid administration.
WHY FLUID MANAGEMENT MATTERS
Postoperative complications predict survival
In 2005, Khuri et al published a study of survival after major surgery that starkly illustrated the prognostic importance of postoperative complications.1 In an effort to identify predictors of long-term survival, they analyzed a National Surgical Quality Improvement Program database of 105,951 patients who underwent eight common operations at Veterans Administration facilities. They found that the most important determinant of reduced postoperative survival over 8 years of follow-up was the occurrence of a complication within 30 days after surgery. The presence of a postoperative complication was a stronger predictor of death than any intraoperative or preoperative risk factor.
Fluid management is key to preventing complications
Optimizing perioperative fluid management is essential to reducing the risk of postoperative complications and mortality. Surgical patients are more likely to have serious complications and die if they have limited physiologic reserve. Adequate fluid administration may reduce the stress response to surgical trauma and support recovery.
Building on early work showing that survivors of major surgery have consistently higher postoperative cardiac output and oxygen delivery (DO2) than do nonsurvivors,2,3 a seminal study by Shoemaker et al showed that these types of blood flow–related parameters are predictive of both survival and complication-free survival.4 Specifically, Shoemaker and his team showed that a protocol designed to achieve DO2 of at least 600 mL/min/m2 was associated with reductions in both postoperative complications and death.4
PROBLEMS WITH PERIOPERATIVE FLUID THERAPY―AND EFFORTS TO OVERCOME THEM
Despite the utility of fluid management in reducing postoperative complications, perioperative fluid therapy is fraught with several fundamental problems:
- Blood volume cannot be evaluated accurately.
- Fluid overload cannot be identified accurately, apart from tissue edema as a result of gross fluid overload.
- Hypovolemia cannot be identified accurately. Commonly measured variables (heart rate, blood pressure, base excess, lactate) are late markers, and the patient’s status upon admission to the operating room is often unknown.
- Tissue perfusion cannot be evaluated accurately. Although lactate and venous oxygen saturation are surrogate markers, genuinely accurate markers for tissue perfusion are lacking.
For these reasons, fluids are commonly administered without the guidance of direct markers of fluid status.
Assessing flow-guided fluid therapy
These shortcomings prompted me and several other researchers to assess the evidence regarding a flow-guided approach to fluid administration, which aims to achieve maximal cardiac output and stroke volume while avoiding excess fluid administration. We conducted a systematic literature search for randomized controlled trials evaluating the postsurgical effects of perioperative fluid therapy to increase global blood flow to explicitly defined goals, after which we performed a meta-analysis of the 22 qualifying studies.5 The trials collectively included 4,546 patients undergoing relatively high-risk elective or emergency surgery, consisting of general, vascular, cardiac, orthopedic, and urologic procedures. Overall mortality in these trials was 10.6% (481 deaths). The primary outcome assessed was mortality; secondary outcomes included morbidity and length of stay in the hospital and in the intensive care unit. Outcomes were assessed according to the timing of the intervention, the fluid type, and explicit measured goals. Fluids were given to all patients, usually as a dynamic bolus, using a flow-guided approach above and beyond that of the control group.
Our analysis found that a flow-guided protocol was associated with a significant reduction in mortality compared with control protocols (odds ratio = 0.82 [95% CI, 0.67–0.99]; P = .04).5 However, sensitivity analysis showed that the largest and best-designed studies tended to yield no significant differences in mortality between the groups, which highlights the remaining need for larger studies to more definitively clarify the effect on mortality.
Timing of administration (ie, whether fluid was given pre-, intra-, or postoperatively) influenced the primary outcome: compared with control, flow-guided fluid therapy was associated with a significant reduction in mortality only when administered intraoperatively, but not when given preoperatively or postoperatively.5
Length of hospital stay was reduced by approximately 1.6 days with flow-guided therapy compared with control (P < .00001), but there was no significant difference between approaches in terms of intensive care unit stay.5
Postoperative complication rates are difficult to compare, given the lack of a uniform definition of a complication and the relative importance of different complications. Nevertheless, when grouped as a whole, the rate of complications was 48% lower (P < .00001) with flow-guided therapy compared with control. Of all outcomes assessed, the effect on complications was the most consistent among all the studies in the analysis. To provide an example using one easily defined complication, the incidence of renal failure was reduced by 35% with flow-guided therapy compared with control (P = .002).5
COLLOID OR CRYSTALLOID?
Two pharmacologically distinct classes
Intravenous fluids can be broadly classified into colloid and crystalloid solutions, and the relative merits of these two fluid classes are at the center of an enduring debate that predates the advent of flow-based fluid administration. Despite fundamental differences in their pharmacokinetics and other characteristics, colloids and crystalloids are often not sufficiently distinguished from one another in discussions of perioperative fluid therapy.
The effect of a colloid depends on its molecular weight. Ninety minutes following administration, a significant proportion of a colloid with a high molecular weight (eg, hydroxyethyl starch) will be retained in the circulation. In contrast, crystalloid solutions (eg, 0.9% saline) readily disappear from the circulation, owing to the ease with which they travel across the cell membrane.6
No evidence of outcome differences
A systematic literature review by Choi et al reflects the current state of knowledge on the relative effects of colloids and crystalloids for fluid resuscitation.7 It concluded that there are no apparent differences between these fluid classes in their effects on pulmonary edema, mortality, or length of stay. The authors noted that methodologic limitations of the available comparative studies prevent meaningful conclusions and that larger randomized controlled trials are needed to detect any differences in outcomes between the two classes.
Although using a crystalloid for fluid resuscitation probably results in a greater volume of fluid given, a study known as SAFE (Saline versus Albumin Fluid Evaluation),8 published after the Choi analysis, showed no differences in 28-day all-cause mortality or other significant outcomes between patients randomized to the colloid (4% albumin) and those assigned to the crystalloid (0.9% saline). Patients receiving the colloid had a higher central venous pressure at all time points, a lower heart rate at the end of the first day, and less overall volume on days 1 and 2 compared with patients receiving the crystalloid. While SAFE was conducted in critically ill patients, these physiologic advantages of the colloid may have implications for results in the perioperative arena, although this remains speculative.
INTRAOPERATIVE MONITORING TO OPTIMIZE FLUID THERAPY
Another important issue is the emergence of minimally invasive technologies for monitoring hemodynamic measures intraoperatively. The aim is to enable more precise tailoring of fluid therapy to meet patient needs on a case-by-case basis.
One of the simplest of these techniques is esophageal Doppler monitoring to measure descending aortic blood flow using Doppler ultrasonography. The technique is used to titrate repeated boluses of fluid based on continuous estimations of stroke volume and surrogate markers of preload indices. Typical protocols for esophageal Doppler monitoring call for administration of colloid to maintain a descending thoracic corrected flow time of no more than 0.35 seconds and stroke volume increments of 10%.
Phan et al recently published a meta-analysis to assess the effect of intraoperative esophageal Doppler monitoring in guiding fluid therapy to optimize intravascular volume status.9 The analysis, which included nine randomized controlled trials in a total of 920 patients, found statistically significant reductions in the rate of complications and in length of hospital stay with the use of esophageal Doppler monitoring; there was no difference in mortality. Use of Doppler monitoring was associated with an increase (+671 mL) in the volume of colloid administered and a decrease (–156 mL) in the volume of crystalloid.
Timing of fluid administration can be critical
One of the trials in the above meta-analysis illustrated that the timing of fluid administration might be more critical than the volume of fluid given. Noblett et al placed an esophageal Doppler probe in each of a series of 108 patients undergoing colorectal resection;10 the control group received perioperative fluid at the anesthesiologist’s discretion, whereas the intervention group received additional colloid boluses based on Doppler assessment. While the overall volume of colloid given was comparable between the two groups, the intervention group received nearly 100% of the total volume during the first quarter of surgery. The intervention group had significantly fewer postoperative complications than the control group as well as a 2-day reduction in average length of stay. Circulating levels of interleukin-6 and cytokines also were significantly lower in the intervention group, which suggests that the intervention blunted the inflammatory response to surgery.
Fluid management must be individualized
Intraoperative fluid needs are highly variable and patient-specific. Parker et al tested an approach in which they universally administered 500 mL of a gelatin colloid solution prior to hip fracture surgery and compared it with a conventional intravenous saline crystalloid solution; neither approach used invasive intraoperative monitoring.11 They found no significant difference in length of stay, 30-day mortality, or postoperative complications between the two study arms. They concluded that more invasive investigation of patients before or during surgery may have been able to identify a subgroup in whom the colloid therapy or more precise fluid control would have been beneficial.
THE ROAD AHEAD
Fluid management remains suboptimal
Despite being a fundamental component of surgical and perioperative care, fluid management remains suboptimal in clinical practice. I can speak most directly to the practice of fluid management in the United Kingdom (UK), but the same types of shortcomings apply broadly to the United States as well.
In 1999, the UK’s National Confidential Enquiry into Patient Outcome and Death examined perioperative death in the UK, concluding that patients were dying as a result of too much or too little perioperative fluid administration.12 Their report cited staff inexperience as an important contributor to the problem, as junior physicians order and deliver the majority of postoperative fluid regimens.
This cautionary report from 10 years ago appears not to have produced substantial improvements in practice, at least according to a recent study by Walsh et al.13 These researchers prospectively audited postoperative fluid management practices in 106 consecutive patients undergoing laparotomy in a UK general surgical unit over a 6-month period in 2003. They found no correlation between available fluid balance data and the quantities of fluids prescribed, suggesting that physicians routinely ignore such data when prescribing. Fifty-four percent of the patients developed at least one fluid-related complication. Patients routinely received significantly greater amounts of fluid and sodium than were physiologically needed, and multivariate analysis showed that mean daily fluid load predicted development of fluid-related complications.
Guidance from a new British consensus document
Where can clinicians turn for a good synthesis of current evidence to guide better perioperative fluid management? I would recommend the newly released British Consensus Guidelines on Intravenous Fluid Therapy for Adult Surgical Patients,14 which are available on the Evidence Based Peri-Operative Medicine Web site (http://www.ebpom.org). These guidelines were developed by a multidisciplinary team of clinicians to improve perioperative fluid prescribing. They cover principles of preoperative, intraoperative, and postoperative fluid management, as well as fluid therapy in acute kidney injury. They present 28 recommendations in all, at least 12 of which are based on high-level (grade 1a or 1b) evidence.
DISCUSSION
Question from the audience: What is the relationship between perioperative fluid management, gut edema from perioperative fluid use, and postoperative ileus?
Dr. Hamilton: There’s no easy answer. Excessive administration of sodium and fluid does predispose to gut and tissue fluid edema. Many of the enhanced surgery recovery programs require no preoperative fasting. There’s no bowel prep. The enteral route is used primarily as quickly as possible. In the UK, we no longer use nasogastric tubes for many of those programs. But there’s no doubt that tissue edema still occurs with excess fluid therapy.
The premise for individualizing fluid therapy is that less is not more but that more is not the right approach either. The stroke volume approaches or the corrected flow time approaches have been related to return of gastrointestinal function and return of flatus, which is a function of gastrointestinal recovery.
Question from the audience: Can you comment on the perioperative use of the Swan-Ganz catheter for fluid management?
Dr. Hamilton: I don’t use it intraoperatively, and not many hospitals in the UK use it apart from liver resection surgery. Having said that, Swan-Ganz catheters were the predominant monitor for 30% to 40% of the original studies of hemodynamic optimization. I cannot give you intraoperative data to support the use of Swan-Ganz catheters for monitoring, but if you lift evidence from the other methods of monitoring hemodynamics, if you’re optimizing flow in a bolus and dynamic fashion, then you should see the kinds of improvements in outcomes that are associated with the other modalities.
The drawback with the Swan-Ganz catheter, obviously, is the morbidity associated with its insertion and its interpretation. But if you’re confident in doing those things, I think it’s a perfectly good monitor.
- Khuri SF, Henderson WG, DePalma RG, et al; Participants in the VA National Surgical Quality Improvement Program. Determinants of long-term survival after major surgery and the adverse effect of postoperative complications. Ann Surg 2005; 242:326–343.
- Boyd AD, Tremblay RE, Spencer FC, Bahnson HT. Estimation of cardiac output soon after intracardiac surgery with cardiopulmonary bypass. Ann Surg 1959; 150:613–626.
- Clowes GH Jr, Del Guercio LR. Circulatory response to trauma of surgical operations. Metabolism 1960; 9:67–81.
- Shoemaker WC, Appel PL, Kram HB, Waxman K, Lee TS. Prospective trial of supranormal values of survivors as therapeutic goals in high-risk surgical patients. Chest 1988; 94:1176–1186.
- Grocott MPW, Hamilton MA, Bennett ED, Harrison D, Rowan K. Perioperative increase in global blood flow to explicit defined goals and outcomes following surgery (Protocol). Cochrane Database Syst Rev 2006; Issue 2. Art. No.: CD004082. doi:10.1002/14651858.CD004082.pub4.
- Lamke LO, Liljedahl SO. Plasma volume changes after infusion of various plasma expanders. Resuscitation 1976; 5:93–102.
- Choi PT, Yip G, Quinonez LG, Cook DJ. Crystalloids vs. colloids in fluid resuscitation: a systematic review. Crit Care Med 1999; 27:200–210.
- The SAFE Study Investigators. A comparison of albumin and saline for fluid resuscitation in the intensive care unit. N Engl J Med 2004; 350:2247–2256.
- Phan TD, Ismail H, Heriot AG, Ho KM. Improving perioperative outcomes: fluid optimization with the esophageal Doppler monitor, a metaanalysis and review. J Am Coll Surg 2008; 207:935–941.
- Noblett SE, Snowden CP, Shenton BK, Horgan AF. Randomized clinical trial assessing the effect of Doppler-optimized fluid management on outcome after elective colorectal resection. Br J Surg 2006; 93:1069–1076.
- Parker MJ, Griffiths R, Boyle A. Preoperative saline versus gelatin for hip fracture patients: a randomized trial of 396 patients. Br J Anaesth 2004; 92:67–70.
- National Confidential Enquiry into Patient Outcome and Death (NCEPOD) Web site. http://www.ncepod.org.uk. Accessed March 25, 2009.
- Walsh SR, Cook EJ, Bentley R, et al. Perioperative fluid management: prospective audit. Int J Clin Pract 2008; 62:492–497.
- Powell-Tuck J, Gosling P, Lobo DN, et al. British consensus guidelines on intravenous fluid therapy for adult surgical patients; 2009. Evidence Based Peri-Operative Medicine (EBPOM) Web site. http://www.ebpom.org. Accessed March 26, 2009.
Perioperative fluid management remains controversial. Until recently, fluid management was guided by targets such as urine output, static pressures, blood pressure, and other physiologic variables. Such physiologic signs, however, are inadequate for detecting subclinical hypovolemia. This has prompted the emergence of an approach to fluid administration based on stroke volume and cardiac output—a “flow-guided” approach—designed to overcome the inadequacies of conventional physiologic signs and improve outcomes. Recent technological advances are permitting noninvasive guidance of intravenous fluid therapy to optimize intravascular volume status.
This article reviews the rationale for perioperative fluid management, strategies for perioperative fluid therapy and their associated outcomes, the types of volume expanders used, and considerations for improving perioperative fluid administration.
WHY FLUID MANAGEMENT MATTERS
Postoperative complications predict survival
In 2005, Khuri et al published a study of survival after major surgery that starkly illustrated the prognostic importance of postoperative complications.1 In an effort to identify predictors of long-term survival, they analyzed a National Surgical Quality Improvement Program database of 105,951 patients who underwent eight common operations at Veterans Administration facilities. They found that the most important determinant of reduced postoperative survival over 8 years of follow-up was the occurrence of a complication within 30 days after surgery. The presence of a postoperative complication was a stronger predictor of death than any intraoperative or preoperative risk factor.
Fluid management is key to preventing complications
Optimizing perioperative fluid management is essential to reducing the risk of postoperative complications and mortality. Surgical patients are more likely to have serious complications and die if they have limited physiologic reserve. Adequate fluid administration may reduce the stress response to surgical trauma and support recovery.
Building on early work showing that survivors of major surgery have consistently higher postoperative cardiac output and oxygen delivery (DO2) than do nonsurvivors,2,3 a seminal study by Shoemaker et al showed that these types of blood flow–related parameters are predictive of both survival and complication-free survival.4 Specifically, Shoemaker and his team showed that a protocol designed to achieve DO2 of at least 600 mL/min/m2 was associated with reductions in both postoperative complications and death.4
PROBLEMS WITH PERIOPERATIVE FLUID THERAPY―AND EFFORTS TO OVERCOME THEM
Despite the utility of fluid management in reducing postoperative complications, perioperative fluid therapy is fraught with several fundamental problems:
- Blood volume cannot be evaluated accurately.
- Fluid overload cannot be identified accurately, apart from tissue edema as a result of gross fluid overload.
- Hypovolemia cannot be identified accurately. Commonly measured variables (heart rate, blood pressure, base excess, lactate) are late markers, and the patient’s status upon admission to the operating room is often unknown.
- Tissue perfusion cannot be evaluated accurately. Although lactate and venous oxygen saturation are surrogate markers, genuinely accurate markers for tissue perfusion are lacking.
For these reasons, fluids are commonly administered without the guidance of direct markers of fluid status.
Assessing flow-guided fluid therapy
These shortcomings prompted me and several other researchers to assess the evidence regarding a flow-guided approach to fluid administration, which aims to achieve maximal cardiac output and stroke volume while avoiding excess fluid administration. We conducted a systematic literature search for randomized controlled trials evaluating the postsurgical effects of perioperative fluid therapy to increase global blood flow to explicitly defined goals, after which we performed a meta-analysis of the 22 qualifying studies.5 The trials collectively included 4,546 patients undergoing relatively high-risk elective or emergency surgery, consisting of general, vascular, cardiac, orthopedic, and urologic procedures. Overall mortality in these trials was 10.6% (481 deaths). The primary outcome assessed was mortality; secondary outcomes included morbidity and length of stay in the hospital and in the intensive care unit. Outcomes were assessed according to the timing of the intervention, the fluid type, and explicit measured goals. Fluids were given to all patients, usually as a dynamic bolus, using a flow-guided approach above and beyond that of the control group.
Our analysis found that a flow-guided protocol was associated with a significant reduction in mortality compared with control protocols (odds ratio = 0.82 [95% CI, 0.67–0.99]; P = .04).5 However, sensitivity analysis showed that the largest and best-designed studies tended to yield no significant differences in mortality between the groups, which highlights the remaining need for larger studies to more definitively clarify the effect on mortality.
Timing of administration (ie, whether fluid was given pre-, intra-, or postoperatively) influenced the primary outcome: compared with control, flow-guided fluid therapy was associated with a significant reduction in mortality only when administered intraoperatively, but not when given preoperatively or postoperatively.5
Length of hospital stay was reduced by approximately 1.6 days with flow-guided therapy compared with control (P < .00001), but there was no significant difference between approaches in terms of intensive care unit stay.5
Postoperative complication rates are difficult to compare, given the lack of a uniform definition of a complication and the relative importance of different complications. Nevertheless, when grouped as a whole, the rate of complications was 48% lower (P < .00001) with flow-guided therapy compared with control. Of all outcomes assessed, the effect on complications was the most consistent among all the studies in the analysis. To provide an example using one easily defined complication, the incidence of renal failure was reduced by 35% with flow-guided therapy compared with control (P = .002).5
COLLOID OR CRYSTALLOID?
Two pharmacologically distinct classes
Intravenous fluids can be broadly classified into colloid and crystalloid solutions, and the relative merits of these two fluid classes are at the center of an enduring debate that predates the advent of flow-based fluid administration. Despite fundamental differences in their pharmacokinetics and other characteristics, colloids and crystalloids are often not sufficiently distinguished from one another in discussions of perioperative fluid therapy.
The effect of a colloid depends on its molecular weight. Ninety minutes following administration, a significant proportion of a colloid with a high molecular weight (eg, hydroxyethyl starch) will be retained in the circulation. In contrast, crystalloid solutions (eg, 0.9% saline) readily disappear from the circulation, owing to the ease with which they travel across the cell membrane.6
No evidence of outcome differences
A systematic literature review by Choi et al reflects the current state of knowledge on the relative effects of colloids and crystalloids for fluid resuscitation.7 It concluded that there are no apparent differences between these fluid classes in their effects on pulmonary edema, mortality, or length of stay. The authors noted that methodologic limitations of the available comparative studies prevent meaningful conclusions and that larger randomized controlled trials are needed to detect any differences in outcomes between the two classes.
Although using a crystalloid for fluid resuscitation probably results in a greater volume of fluid given, a study known as SAFE (Saline versus Albumin Fluid Evaluation),8 published after the Choi analysis, showed no differences in 28-day all-cause mortality or other significant outcomes between patients randomized to the colloid (4% albumin) and those assigned to the crystalloid (0.9% saline). Patients receiving the colloid had a higher central venous pressure at all time points, a lower heart rate at the end of the first day, and less overall volume on days 1 and 2 compared with patients receiving the crystalloid. While SAFE was conducted in critically ill patients, these physiologic advantages of the colloid may have implications for results in the perioperative arena, although this remains speculative.
INTRAOPERATIVE MONITORING TO OPTIMIZE FLUID THERAPY
Another important issue is the emergence of minimally invasive technologies for monitoring hemodynamic measures intraoperatively. The aim is to enable more precise tailoring of fluid therapy to meet patient needs on a case-by-case basis.
One of the simplest of these techniques is esophageal Doppler monitoring to measure descending aortic blood flow using Doppler ultrasonography. The technique is used to titrate repeated boluses of fluid based on continuous estimations of stroke volume and surrogate markers of preload indices. Typical protocols for esophageal Doppler monitoring call for administration of colloid to maintain a descending thoracic corrected flow time of no more than 0.35 seconds and stroke volume increments of 10%.
Phan et al recently published a meta-analysis to assess the effect of intraoperative esophageal Doppler monitoring in guiding fluid therapy to optimize intravascular volume status.9 The analysis, which included nine randomized controlled trials in a total of 920 patients, found statistically significant reductions in the rate of complications and in length of hospital stay with the use of esophageal Doppler monitoring; there was no difference in mortality. Use of Doppler monitoring was associated with an increase (+671 mL) in the volume of colloid administered and a decrease (–156 mL) in the volume of crystalloid.
Timing of fluid administration can be critical
One of the trials in the above meta-analysis illustrated that the timing of fluid administration might be more critical than the volume of fluid given. Noblett et al placed an esophageal Doppler probe in each of a series of 108 patients undergoing colorectal resection;10 the control group received perioperative fluid at the anesthesiologist’s discretion, whereas the intervention group received additional colloid boluses based on Doppler assessment. While the overall volume of colloid given was comparable between the two groups, the intervention group received nearly 100% of the total volume during the first quarter of surgery. The intervention group had significantly fewer postoperative complications than the control group as well as a 2-day reduction in average length of stay. Circulating levels of interleukin-6 and cytokines also were significantly lower in the intervention group, which suggests that the intervention blunted the inflammatory response to surgery.
Fluid management must be individualized
Intraoperative fluid needs are highly variable and patient-specific. Parker et al tested an approach in which they universally administered 500 mL of a gelatin colloid solution prior to hip fracture surgery and compared it with a conventional intravenous saline crystalloid solution; neither approach used invasive intraoperative monitoring.11 They found no significant difference in length of stay, 30-day mortality, or postoperative complications between the two study arms. They concluded that more invasive investigation of patients before or during surgery may have been able to identify a subgroup in whom the colloid therapy or more precise fluid control would have been beneficial.
THE ROAD AHEAD
Fluid management remains suboptimal
Despite being a fundamental component of surgical and perioperative care, fluid management remains suboptimal in clinical practice. I can speak most directly to the practice of fluid management in the United Kingdom (UK), but the same types of shortcomings apply broadly to the United States as well.
In 1999, the UK’s National Confidential Enquiry into Patient Outcome and Death examined perioperative death in the UK, concluding that patients were dying as a result of too much or too little perioperative fluid administration.12 Their report cited staff inexperience as an important contributor to the problem, as junior physicians order and deliver the majority of postoperative fluid regimens.
This cautionary report from 10 years ago appears not to have produced substantial improvements in practice, at least according to a recent study by Walsh et al.13 These researchers prospectively audited postoperative fluid management practices in 106 consecutive patients undergoing laparotomy in a UK general surgical unit over a 6-month period in 2003. They found no correlation between available fluid balance data and the quantities of fluids prescribed, suggesting that physicians routinely ignore such data when prescribing. Fifty-four percent of the patients developed at least one fluid-related complication. Patients routinely received significantly greater amounts of fluid and sodium than were physiologically needed, and multivariate analysis showed that mean daily fluid load predicted development of fluid-related complications.
Guidance from a new British consensus document
Where can clinicians turn for a good synthesis of current evidence to guide better perioperative fluid management? I would recommend the newly released British Consensus Guidelines on Intravenous Fluid Therapy for Adult Surgical Patients,14 which are available on the Evidence Based Peri-Operative Medicine Web site (http://www.ebpom.org). These guidelines were developed by a multidisciplinary team of clinicians to improve perioperative fluid prescribing. They cover principles of preoperative, intraoperative, and postoperative fluid management, as well as fluid therapy in acute kidney injury. They present 28 recommendations in all, at least 12 of which are based on high-level (grade 1a or 1b) evidence.
DISCUSSION
Question from the audience: What is the relationship between perioperative fluid management, gut edema from perioperative fluid use, and postoperative ileus?
Dr. Hamilton: There’s no easy answer. Excessive administration of sodium and fluid does predispose to gut and tissue fluid edema. Many of the enhanced surgery recovery programs require no preoperative fasting. There’s no bowel prep. The enteral route is used primarily as quickly as possible. In the UK, we no longer use nasogastric tubes for many of those programs. But there’s no doubt that tissue edema still occurs with excess fluid therapy.
The premise for individualizing fluid therapy is that less is not more but that more is not the right approach either. The stroke volume approaches or the corrected flow time approaches have been related to return of gastrointestinal function and return of flatus, which is a function of gastrointestinal recovery.
Question from the audience: Can you comment on the perioperative use of the Swan-Ganz catheter for fluid management?
Dr. Hamilton: I don’t use it intraoperatively, and not many hospitals in the UK use it apart from liver resection surgery. Having said that, Swan-Ganz catheters were the predominant monitor for 30% to 40% of the original studies of hemodynamic optimization. I cannot give you intraoperative data to support the use of Swan-Ganz catheters for monitoring, but if you lift evidence from the other methods of monitoring hemodynamics, if you’re optimizing flow in a bolus and dynamic fashion, then you should see the kinds of improvements in outcomes that are associated with the other modalities.
The drawback with the Swan-Ganz catheter, obviously, is the morbidity associated with its insertion and its interpretation. But if you’re confident in doing those things, I think it’s a perfectly good monitor.
- Khuri SF, Henderson WG, DePalma RG, et al; Participants in the VA National Surgical Quality Improvement Program. Determinants of long-term survival after major surgery and the adverse effect of postoperative complications. Ann Surg 2005; 242:326–343.
- Boyd AD, Tremblay RE, Spencer FC, Bahnson HT. Estimation of cardiac output soon after intracardiac surgery with cardiopulmonary bypass. Ann Surg 1959; 150:613–626.
- Clowes GH Jr, Del Guercio LR. Circulatory response to trauma of surgical operations. Metabolism 1960; 9:67–81.
- Shoemaker WC, Appel PL, Kram HB, Waxman K, Lee TS. Prospective trial of supranormal values of survivors as therapeutic goals in high-risk surgical patients. Chest 1988; 94:1176–1186.
- Grocott MPW, Hamilton MA, Bennett ED, Harrison D, Rowan K. Perioperative increase in global blood flow to explicit defined goals and outcomes following surgery (Protocol). Cochrane Database Syst Rev 2006; Issue 2. Art. No.: CD004082. doi:10.1002/14651858.CD004082.pub4.
- Lamke LO, Liljedahl SO. Plasma volume changes after infusion of various plasma expanders. Resuscitation 1976; 5:93–102.
- Choi PT, Yip G, Quinonez LG, Cook DJ. Crystalloids vs. colloids in fluid resuscitation: a systematic review. Crit Care Med 1999; 27:200–210.
- The SAFE Study Investigators. A comparison of albumin and saline for fluid resuscitation in the intensive care unit. N Engl J Med 2004; 350:2247–2256.
- Phan TD, Ismail H, Heriot AG, Ho KM. Improving perioperative outcomes: fluid optimization with the esophageal Doppler monitor, a metaanalysis and review. J Am Coll Surg 2008; 207:935–941.
- Noblett SE, Snowden CP, Shenton BK, Horgan AF. Randomized clinical trial assessing the effect of Doppler-optimized fluid management on outcome after elective colorectal resection. Br J Surg 2006; 93:1069–1076.
- Parker MJ, Griffiths R, Boyle A. Preoperative saline versus gelatin for hip fracture patients: a randomized trial of 396 patients. Br J Anaesth 2004; 92:67–70.
- National Confidential Enquiry into Patient Outcome and Death (NCEPOD) Web site. http://www.ncepod.org.uk. Accessed March 25, 2009.
- Walsh SR, Cook EJ, Bentley R, et al. Perioperative fluid management: prospective audit. Int J Clin Pract 2008; 62:492–497.
- Powell-Tuck J, Gosling P, Lobo DN, et al. British consensus guidelines on intravenous fluid therapy for adult surgical patients; 2009. Evidence Based Peri-Operative Medicine (EBPOM) Web site. http://www.ebpom.org. Accessed March 26, 2009.
KEY POINTS
- A flow-guided approach to fluid administration is associated with reductions in mortality, postoperative complications, and length of stay compared with fluid management guided by traditional physiologic targets.
- Studies to date have shown no consistent difference between colloids and crystalloids in their effects on clinical outcomes.
- Intraoperative esophageal Doppler monitoring is a simple technique for titrating boluses of fluid based on continuous estimations of stroke volume.
- Administration of sufficient fluids early in the course of surgery may be more important than the total volume of fluid administered in improving patient outcomes.
- Intraoperative fluid needs are highly variable, underscoring the need for individual monitoring and assessment.