User login
Another New Frontier

When HM was just a twinkle in Bob Wachter’s eye somewhere around 1998, the nascent board of the National Association of Inpatient Physicians (later to become SHM’s board of directors) tried to look forward to the scope and breadth of this new specialty they were hoping to help shape. With just 300 or so hospitalists in the country at that time, it is not surprising that the original board’s vision was that someday hospitalists might replace the inpatient work being done by 30% to 40% of internists and family practitioners. Now, a little more than a decade later, HM has a vista that in some ways can’t be contained inside a hospital’s four walls.
Today, with more than 30,000 hospitalists actively seeing patients in most U.S. hospitals, there has been a reinvention of primary care, with many of the inpatient duties now assumed by hospitalists. Although direct patient care likely will remain the primary role for hospitalists in the foreseeable future, it is not the whole story.
More and more, hospitalists have a leading role in improving the function of the hospital as a cohesive force in the healthcare community. Hospitalists are active in performance-improvement strategies, both in the implementation as well as the measurement and reporting of outcomes. Hospitalists are expected by other hospital health professionals to actively participate in the team approach to healthcare. As hospitals work to reinvent themselves to meet the challenges of the 21st century, whether driven by The Joint Commission, insurers, the business community, or government, the C-suite sees “their” hospitalists as part of the calculus for change.
And as surgical care and subspecialty care evolves, hospitalists are key partners. The fastest-growing aspect of HM today is the growth in the individual hospitalist’s role as the comanager of the surgical or specialty patient. This is much more than a consult. Comanagement involves a division of labor and accountability in which surgeons do what they do best and engage their partner hospitalists to prevent VTE, provide coverage to control perisurgical complications, and share the flow of information to the patients and their families.
So in some sense, the hospitalist provides the multiuse toolbox for all things “hospital,” sort of the Swiss Army knife of healthcare:
- Direct patient care;
- Systems fixer;
- Quality and safety officer;
- Teammate and team leader; and
- Partner to the surgeon and the cardiologist.
It’s quite a lot of value and versatility all wrapped up in one package.
But wait: That is just today. There is more out there on the horizon. (That, by the way, is hospitalist-speak for “some of this is already happening in real time; it’s just not being done by everyone.”)
HM: The Problem-Solver
Hospitalists are being engaged at the ebb and flow of healthcare. Most of us know that even when we do the A-1 job in the hospital that the voltage drops when patients are flung into the white space of the discharge process. Hospitalists know that a patient’s hospitalization doesn’t end at the hospital’s threshold. In many cases, the patient is not cured or returned to full function, but more often than not, the patient is just no longer sick enough to warrant the expense and the intensity of hospitalization.
SHM and our hospitalist leaders have been tackling the discharge process with our Project BOOST (Better Outcomes for Older Adults through Safe Transitions), with funding coming from the Hartford Foundation. Our goals are to give hospitalist-led teams of health professionals the tools and training to reduce unnecessary readmissions and ED visits, and to improve the satisfaction and confidence of our patients and their families. Not an easy task and not one that is over and done, but SHM and our hospitalists have a plan and a path to success.
But wait: There is more.
The patient flow within most hospitals is anything but smooth, error-free, or efficient. The issues develop as the patient travels from the ED to the ICU and out to the floor. The problems arise when multiple physicians manage a patient. There are potential cracks in the system (e.g., shift changes from nurse to nurse, or pharmacist to pharmacist). And, of course, the hospitalist-to-hospitalist handoff still could use some work.
But HM isn’t waiting for someone else to fix this problem. SHM is actively talking to funders about applying some lessons we have learned in our BOOST pilot sites and other performance-improvement efforts. We are beginning to provide the framework to ensure our patients a safe and error-free hospital stay.
It might seem like quite a leap for a specialty that was started to replace direct patient care for a small segment of primary-care physicians. But now, there may be even more for hospitalists to tackle. As policymakers talk of redefining accountabilities, it appears that hospitals will be held financially—and possibly even legally—responsible for patients’ outcomes, not just while they are an inpatient, but for 30 days or more after discharge, too. Tackling this would be daunting if every hospital were surrounded by an entire neighborhood of medical homes, but, of course, that is very much not the case today.
So when the hospital is charged with making sure that their recently discharged patients take the entire course of their prescribed treatment, get the follow-up testing at the right time, follow up on any abnormal results that came up during and after hospitalization, and basically do all the sub-acute care that patients should and often don’t receive, who do you think they will look to?
That’s right: Say hello to the “sub-acutist,” the next member of the hospitalist family tree, which already has nocturnists and SNFists. Most HM groups are busy enough just seeing their inpatients and making the hospital safer, improving quality, and co-managing the surgical and specialty patients. Now it looks as if hospitalist groups will be the fallback to see a patient for the first two or three post-discharge visits, especially when the hospital needs to be accountable for patient outcomes after a patient leaves the hospital. This is definitely not a jump into outpatient medicine, but more of an attempt to “complete” the hospitalization in a new world in which the expectation of the patient and the payor is that the acute illness doesn’t end at the hospital door.
Those of us who think strategically need to analyze what these varied roles for hospitalists mean for the selection of the right people to enter HM, and what education and support the next wave of hospitalists will need to be successful and deliver on the promises being made to our healthcare communities.
SHM and numerous hospitalist companies and organizations are on the leading edge, thinking through these possibilities, and building HM for the future—which, by the way, already is here.
They used to say in a commercial, “This is not your father’s Oldsmobile.” Well, tomorrow’s HM is looking very much like not your older brother’s HM. Love the change; live the change. TH
Dr. Wellikson is CEO of SHM.
This Just Isn’t Working Out
It happens every now and then: A physician is providing care to a patient and things aren’t going as smoothly as they should. In fact, the situation is deteriorating. The reasons vary, but the end result is almost always the same, and necessary—the physician-patient relationship must be terminated. When, why, and how the relationship ends can make the difference between an amicable separation and years of litigation. Terminating a relationship with a patient, however, presents special challenges for a hospitalist.
Relationship to Nowhere
Certainly, some days are better than others in all relationships, and physician-patient relationships are no exception.
Hospitalists regularly talk to patients about unpleasant realities. Each patient responds to the information differently. More often than not, these difficult conversations lead to a focused plan for dealing with a patient’s health needs. Sometimes, however, a patient refuses to acknowledge the information provided, responds in an abusive manner to the physician or hospital staff, or is simply noncompliant.
An isolated incident is one thing; an ongoing pattern is another. One key consideration is deterioration of trust—for example, when a physician suspects a patient is malingering or seeking drugs, or the patient lacks confidence in the physician.
Another example is when the hospitalist determines that hospitalization is no longer necessary but the patient or their family does not want the patient discharged. In such cases, a hospitalist cannot continue to order care that is not medically necessary. Nonetheless, if the patient experiences a future adverse outcome, the fact that the patient opposed discharge increases the potential for a lawsuit.
This is particularly true when a patient must be forcibly removed from the hospital. In such cases, it is always best to get another hospitalist and the patient’s primary-care physician involved. Having two or three concurring opinions from outside physicians can help temper the liability risk.
Perhaps most difficult is assessing the impact of external factors on a physician’s ability to provide care. A hospitalist might have a difficult time providing objective care to a patient who is covered by the insurance carrier that is investigating him, the friend of a patient who is suing him, or a close friend or family member. Most state medical boards provide physicians with guidance on “boundary issues,” which boil down to a simple principle: If personal feelings have the appearance of interfering with objective assessment or treatment of the patient, the patient’s care is better left to another hospitalist.
Transitioning Care and Abandonment
Deciding that a physician-patient relationship is no longer productive is only the beginning of a termination. Prohibitions on patient “abandonment” restrict a physician’s ability to immediately terminate a relationship. Particularly when a patient objects to discharge, it is extremely important to have a comprehensive post-discharge plan. Such a plan must include ensuring that outpatient care providers are available and willing to see the patient.
Even transitioning care to another provider must be handled carefully. As a hospitalist, you first must ensure that another provider is able to promptly take responsibility. It is not enough to just call the service to assign a new hospitalist. Rather, your responsibilities end only when the new provider sees the patient. Moreover, there should be a “handoff” so you can pinpoint when your obligations to the patient officially end.
Discrimination
Physicians may not refuse to treat a patient for a discriminatory reason. For example, federal and state laws prohibit discrimination based on race, religion, sex, national origin, disability, or age. Additionally, some states prohibit discrimination based on sexual orientation. So while a physician can decide not to treat lawyers (not a protected class), they are not allowed to refuse to treat someone because they are Hispanic, Muslim, or homosexual.
Conclusion
The simple answer to the question of when to terminate a physician-patient relationship is: whenever a conflict arises that is likely to impact the provision of care. Terminating the relationship in a manner that protects both the patient and the physician is the key to reducing potential liability. TH
Patrick O’Rourke works in the Office of University Counsel, Department of Litigation, University of Colorado, Denver.
Image Source: CIMMERIAN/ISTOCKPHOTO.COM
Independent Partnership
While spending a summer taking care of her mother-in-law, who was ill with colon cancer, Lynne Allen, MN, ARNP, heard her calling loud and clear. “I thought, ‘Wow, I can do this,’ ” she says. “A lot of people can’t do this.”
Allen had completed a year of nursing school right after high school but never finished. So she decided to go back to school and earn a nursing degree. She graduated from the University of Washington’s Adult Acute Care Nurse Practitioner Program in 2001 and later landed a job at Columbia Basin Hematology and Oncology, a private practice in Kennewick, Wash.
At the time, a then-burgeoning hospitalist group based in Brentwood, Tenn., was looking to recruit nurses. Cogent Healthcare made Allen an offer. The idea of working in a hospital where doctors would be available 24 hours a day, seven days a week, intrigued Allen. “I was a house supervisor in grad school and always remember thinking, ‘If only I had a physician in here, I could take care of this problem in two minutes,’ ” she says.
Allen accepted the offer and went to work in Cogent’s nonphysician clinical development program. Last year, she returned to Columbia Basin, where she makes hospitalist rounds four times a week at Kadlec Regional Medical Center in Richland, Wash. Allen, the newest member of Team Hospitalist, recently spoke with The Hospitalist about the unique perspective nurse practitioners (NPs) offer HM.
Question: What do you like about working with hospitalists?
Answer: I like the teamwork involved. I really like going in the morning and seeing that the nurses cared for the patients all night and know what is going on. I like knowing that they can feel comfortable calling me about what they need and making a difference. In terms of hospital medicine, just because [a patient] stays a long time doesn’t mean they are getting the quality of care they need. There are other issues involved with that, especially in cancer patients. They are afraid to go home, afraid of dying. If you have a patient with cancer or COPD [chronic obstructive pulmonary disease] and they are probably not going to live as long as they would normally, you begin to talk to them about their goals for themselves, in terms of quality of life.
Q: How do you initiate that conversation?
A: Medicare has made it very easy, because every patient that comes in should be asked if they have a living will, so you bring that subject up. Most people, when they are dying, they know it. The rest of the family is surprised, but the patient knows it. Sometimes you just bring it up point-blank.

Q: Why does HM present an opportunity for NPs?
A: I think workforce is one of the issues. I think there are a lot of nurses out there who have worked in a hospital and love that acute-care environment. It is very different than working in a clinic. I do both right now, and there is such a difference in what you need to know about your patients and how you treat them.
Q: How is it different?
A: When you are in an outpatient center, [patients] are there and you are probably giving them meds if they are getting chemotherapy and need some support. In an inpatient setting, they are there all the time. It’s a 24/7 need for support. I see this as another special area NPs can take. It’s in the stage of infancy, and it will grow.
Q: Do you think your background in nursing has helped you interact better with patients?
A: Yes. It is part of “who” nurses are. I really enjoy being able to take care of the patients that need the open communication, because it does help them.
Q: What unique perspective do NPs bring to HM?
A: I think nurses are taught to look at the whole patient. We are not taught to specifically say, “This patient has these symptoms, this disease process, this treatment.” … They have family. They have social issues. They have spiritual issues. [It all plays] into their disease process and their treatment process.
Q: What’s the one thing about NPs that most hospitalists don’t get?
A: We are trained to practice independently. In my state, Washington, I can be a completely independent practitioner. We are also taught to know when to consult or collaborate with a physician. I think sometimes physicians don’t recognize that or understand that. They think that we just want to be more independent. HM is a team effort, and we are willing to be part of the team with an equal partnership.
Q: What are some of the issues that come up between NPs and hospitalists?
A: Physicians are not trained to delegate. They are trained that you are in control, you are the one in charge of this patient’s care, you will dictate what goes on with this patient. Medicare and Medicaid require an attending physician, so for a physician to put [his or her] name on there and trust someone else to assess and develop a care plan is hard for them. And I can’t blame them.
Give it a chance, work together, and develop that relationship. Don’t expect it to be there right at day one. And it might not even be six months, but you need to be open-minded and willing to work with someone who is willing to work with you, and not just think it is about giving orders.
Q: What qualities should hospitalists look for in hiring NPs?
A: They should look for someone who has actually worked in a hospital, who is interested in working on a team, who is interested in developing their own capacity or intellectual ability to take care of patients—and recognize that there is going to be a learning curve there. They should also look for someone who is pleasant and who seems to fit in with the team. TH
Stephanie Cajigal is associate editor of The Hospitalist.
While spending a summer taking care of her mother-in-law, who was ill with colon cancer, Lynne Allen, MN, ARNP, heard her calling loud and clear. “I thought, ‘Wow, I can do this,’ ” she says. “A lot of people can’t do this.”
Allen had completed a year of nursing school right after high school but never finished. So she decided to go back to school and earn a nursing degree. She graduated from the University of Washington’s Adult Acute Care Nurse Practitioner Program in 2001 and later landed a job at Columbia Basin Hematology and Oncology, a private practice in Kennewick, Wash.
At the time, a then-burgeoning hospitalist group based in Brentwood, Tenn., was looking to recruit nurses. Cogent Healthcare made Allen an offer. The idea of working in a hospital where doctors would be available 24 hours a day, seven days a week, intrigued Allen. “I was a house supervisor in grad school and always remember thinking, ‘If only I had a physician in here, I could take care of this problem in two minutes,’ ” she says.
Allen accepted the offer and went to work in Cogent’s nonphysician clinical development program. Last year, she returned to Columbia Basin, where she makes hospitalist rounds four times a week at Kadlec Regional Medical Center in Richland, Wash. Allen, the newest member of Team Hospitalist, recently spoke with The Hospitalist about the unique perspective nurse practitioners (NPs) offer HM.
Question: What do you like about working with hospitalists?
Answer: I like the teamwork involved. I really like going in the morning and seeing that the nurses cared for the patients all night and know what is going on. I like knowing that they can feel comfortable calling me about what they need and making a difference. In terms of hospital medicine, just because [a patient] stays a long time doesn’t mean they are getting the quality of care they need. There are other issues involved with that, especially in cancer patients. They are afraid to go home, afraid of dying. If you have a patient with cancer or COPD [chronic obstructive pulmonary disease] and they are probably not going to live as long as they would normally, you begin to talk to them about their goals for themselves, in terms of quality of life.
Q: How do you initiate that conversation?
A: Medicare has made it very easy, because every patient that comes in should be asked if they have a living will, so you bring that subject up. Most people, when they are dying, they know it. The rest of the family is surprised, but the patient knows it. Sometimes you just bring it up point-blank.
Q: Why does HM present an opportunity for NPs?
A: I think workforce is one of the issues. I think there are a lot of nurses out there who have worked in a hospital and love that acute-care environment. It is very different than working in a clinic. I do both right now, and there is such a difference in what you need to know about your patients and how you treat them.
Q: How is it different?
A: When you are in an outpatient center, [patients] are there and you are probably giving them meds if they are getting chemotherapy and need some support. In an inpatient setting, they are there all the time. It’s a 24/7 need for support. I see this as another special area NPs can take. It’s in the stage of infancy, and it will grow.
Q: Do you think your background in nursing has helped you interact better with patients?
A: Yes. It is part of “who” nurses are. I really enjoy being able to take care of the patients that need the open communication, because it does help them.
Q: What unique perspective do NPs bring to HM?
A: I think nurses are taught to look at the whole patient. We are not taught to specifically say, “This patient has these symptoms, this disease process, this treatment.” … They have family. They have social issues. They have spiritual issues. [It all plays] into their disease process and their treatment process.
Q: What’s the one thing about NPs that most hospitalists don’t get?
A: We are trained to practice independently. In my state, Washington, I can be a completely independent practitioner. We are also taught to know when to consult or collaborate with a physician. I think sometimes physicians don’t recognize that or understand that. They think that we just want to be more independent. HM is a team effort, and we are willing to be part of the team with an equal partnership.
Q: What are some of the issues that come up between NPs and hospitalists?
A: Physicians are not trained to delegate. They are trained that you are in control, you are the one in charge of this patient’s care, you will dictate what goes on with this patient. Medicare and Medicaid require an attending physician, so for a physician to put [his or her] name on there and trust someone else to assess and develop a care plan is hard for them. And I can’t blame them.
Give it a chance, work together, and develop that relationship. Don’t expect it to be there right at day one. And it might not even be six months, but you need to be open-minded and willing to work with someone who is willing to work with you, and not just think it is about giving orders.
Q: What qualities should hospitalists look for in hiring NPs?
A: They should look for someone who has actually worked in a hospital, who is interested in working on a team, who is interested in developing their own capacity or intellectual ability to take care of patients—and recognize that there is going to be a learning curve there. They should also look for someone who is pleasant and who seems to fit in with the team. TH
Stephanie Cajigal is associate editor of The Hospitalist.
Document Inspection
One constant in all the modifications to billing and reimbursement guidelines for evaluation and management (E/M) services provided by hospitalists is that a face-to-face patient encounter by the billing provider is required. Exceptions do occur (e.g., telehealth services, care plan oversight, home health certification) but are infrequently reported by hospitalist teams. Do not get caught misreporting the following services due to the absence of a physician presence.
Discharge Day Management
Hospital discharge day management (CPT 99238-99239) is a face-to-face E/M service between the attending physician and the patient. Document the date of the actual physician visit even if the patient is discharged from the facility on a different date.1 Documentation must substantiate this personal patient encounter.
A hospitalist can choose to record the face-to-face encounter in a handwritten progress note or make note of it in the formal discharge summary. When relying solely upon the dictated summary, physicians often fail to identify personal contact with the patient. Although an examination need only be performed “as appropriate” on the day of discharge, it is the best indicator of a face-to-face encounter. Such statements as “Upon discharge, the patient appeared well, vital signs stable, lungs clear” or “Patient seen and examined by me on discharge day” clearly illustrate this service.
It is important to note that only the attending physician of record reports the discharge day management service. Physicians or qualified non-physician practitioners (NPPs), other than the attending physician, who have been managing concurrent healthcare problems not primarily managed by the attending physician and who are not acting on behalf of the attending physician should use subsequent hospital care codes (99231-99233) for a final visit.2
Death pronouncement can be reported with discharge day management codes (99238-99239), but only when this service involves a physician-patient encounter. Physicians should report the most appropriate discharge code on the actual day of pronouncement.
Shared/Split Services
Shared/split Medicare services occur when two providers from the same specialty and group practice perform a portion of a facility-based (outpatient hospital, inpatient hospital, or ED) patient encounter on the same day. One provider must be a physician; the other must be a qualified and certified NPP (e.g., nurse practitioner, physician assistant, clinical nurse specialist, certified nurse midwife).
The culmination of the two portions of service must fulfill the requirements of a single E/M service (consultations, critical care, and other time-based services excluded). The physician has the option to report the shared/split service to Medicare under their name for 100% of the allowable reimbursement rate, or under the NPP’s name for 85% of the allowable reimbursement rate.
In order to utilize this billing model, the physician and the NPP must provide a face-to-face encounter on the same day. If there is no face-to-face encounter between the patient and the physician, then the service can only be billed under the NPP’s name at 85% of the allowable reimbursement rate.3
Documentation must clearly identify each provider involved in the shared/split service, along with the presence and the portion of each individual’s service. The NPP and the physician should each indicate the extent of their involvement (e.g., “Patient seen and examined by me … ”) in the patient’s care and sign their portion of the note. If the NPP and physician each write a separate note, each note should refer to the other provider. That way, the supporting documentation for the service rendered encompasses the summation of both notes.4
Teaching Physician Services
A different type of shared service can occur under the teaching physician rules, whereby an attending physician and a “resident” are involved in the same patient encounter. The term “resident” also includes interns and fellows in recognized graduate medical education (GME) programs, as approved for purposes of direct GME payments made by the fiscal intermediary.5 As with services shared with NPPs, the attending physician must provide a face-to-face encounter and participate in a key portion of the service.
The attending physician can perform their portion of the service concurrently or independent of the resident but is allowed to discuss the case (teaching service) with the resident, as appropriate. If the attending physician does not physically see the patient, the service cannot be reported. Payment is made only for the teaching physician’s involvement in the patient’s care.
Instead of detailing the entire encounter, the teaching physician should write a short, legible linking or tethering statement specifically referencing the resident’s note. Physicians must demonstrate their physical presence (e.g., “Patient seen and examined by me. Agree with note by Dr. Jones”) and comment on the patient’s evaluation and their active involvement in the care plan.6 TH
Carol Pohlig is a billing and coding expert with the University of Pennsylvania Medical Center, Philadelphia. She is faculty for SHM’s inpatient coding course.
References
- Medicare Claims Processing Manual: Chapter 12, Section 30.6.15.1C. Centers for Medicare and Medicaid Services (CMS) Web site. Available at: www.cms.hhs.gov/manuals/downloads/clm104c12. pdf. Accessed July 5, 2009.
- Medicare Claims Processing Manual: Chapter 12, Section 30.6.9.2B. CMS Web site. Available at: www.cms.hhs.gov/manuals/downloads/clm104c12. pdf. Accessed July 5, 2009.
- Medicare Claims Processing Manual: Chapter 12, Section 30.6.1B. CMS Web site. Available at: www.cms.hhs.gov/manuals/downloads/clm104c12. pdf. Accessed July 5, 2009.
- Pohlig, C. Nonphysician Providers in Your Practice. In: Coding for Chest Medicine 2009. Northbrook, IL: American College of Chest Physicians, 2008;265-271.
- Medicare Claims Processing Manual: Chapter 12, Section 100. CMS Web site. Available at: www.cms.hhs.gov/manuals/downloads/clm104c12. pdf. Accessed July 5, 2009.
- Manaker, S. Teaching Physician Regulations. In: Coding for Chest Medicine 2009. Northbrook, IL: American College of Chest Physicians, 2008;299-305.
- Medicare Claims Processing Manual: Chapter 12, Section 30.6.9.1D. CMS Web site. Available at: www.cms.hhs.gov/manuals/downloads/clm104c12. pdf. Accessed July 5, 2009.
- Beebe M, Dalton J, Espronceda M, Evans D, Glenn R. Current Procedural Terminology Professional Edition. Chicago: American Medical Association Press; 2008.
Healthcare Reform
The struggle over U.S. healthcare reform has consumed Congress for most of the year. It has dominated media coverage and fueled informal debates in all parts of the country. A resolution to the heated back-and-forth should arrive by Thanksgiving in the form of meaningful healthcare legislation, according to Vice President Joe Biden. Then again, Sen. Jim DeMint (R-S.C.) has pledged to cancel the Democrats’ planned festivities, preventing what he and other opponents have described as a “government takeover” of the healthcare system.
Amid the emotional tug-of-war and evolving bills, the nonpartisan Congressional Budget Office (CBO) has laid out the stakes. In a June letter to the Senate Budget Committee, CBO Director Douglas W. Elmendorf begins: “In the absence of significant changes in policy, rising costs for healthcare will cause federal spending to grow much faster than the economy, putting the federal budget on an unsustainable path.”
Most experts, analysts, and politicians agree that something must be done. It’s all a matter of what and how much it will cost. In the spirit of Thanksgiving, let’s talk turkey about the healthcare reform proposals that may or may not survive the holiday, and the key players who will determine whether this year’s reform effort stays alive—or gets stuffed.
Main Points of Disagreement

Beyond the sticky matter of how to pay for everything, businesses instinctively have opposed any requirement that employers offer health insurance to their employees. Then again, that opposition seems to be softening as more details of the plan are released.
In principle, widespread agreement exists on the notion that individuals should have guaranteed issue and renewability of their healthcare insurance, regardless of pre-existing conditions. Far less clear, however, is the matter of how much those individuals will have to pay for their policies.
Main Points of Agreement
Not everyone is on board, but any healthcare reform bill that emerges from Congress is likely to contain three main elements, according to Leighton Ku, director of the Center for Health Policy Research at George Washington University in Washington, D.C.
1. Expansion of Medicaid

2. Health Insurance Exchanges
Think of exchanges as the Travelocity or Orbitz for health-insurance plans, complete with coupons for the needy. Sliding-scale tax credits or vouchers could be used by low- to moderate-income people to buy insurance in publicly available, government-regulated marketplaces where such parameters as premiums and coverage could be compared. “The concept is that by setting up standards and having a place where it’s all together, it would create a competition,” Ku says.
In essence, more competition could lead to cost reductions.
3. An Individual Mandate
Hardship exemptions are likely, but people who can afford it will be expected to buy insurance or pay a penalty. Republican rumblings suggest that agreement on this point may not be as widespread as initially thought.
Main Players
President Obama has made healthcare reform the centerpiece of his first-year agenda. If he is to succeed, organizations like AARP will be key in winning over skeptical seniors. But the real power lies with a handful of Congressional leaders who have the ability to make or break any legislation. A brief rundown:
Senate

The overhaul is less expensive and more moderate than the America’s Affordable Health Choices Act, introduced in the House of Representatives, and a partial bill passed earlier by Sen. Kennedy’s Health, Education, Labor and Pensions (HELP) Committee. Nevertheless, progressives and conservatives criticized the Baucus plan. Even so, Sen. Olympia Snowe (R-Maine) has become a major focus of Democrats’ efforts to find 60 votes and avoid a Republican filibuster, though the seating of a replacement for Sen. Kennedy would help Democrats regain a filibuster-proof majority. One key point: Analysts say bringing Sen. Snowe on board might not win other Republican votes, but she might offer cover for such conservative Democratic senators as Mary Landrieu (D-La.) and Ben Nelson (D-Neb.).
As a last resort, Democrats have raised the possibility of using reconciliation, an arcane process originally intended for budgetary items. Reconciliation requires only a 51-vote majority, but complicated rules and a promised Republican challenge could lead to chaos.
House

Paying For It All
Meaningful reform without breaking the bank is a common refrain in healthcare discussions. Despite heated disputes over taxes, fees, fines, and service cuts to help defray costs, two main mechanisms for savings have emerged, according to the Center for Health Policy Research’s Ku:
1. Curbing Medicare Advantage

One cost-cutting idea would be to restore a level playing field, Ku says, and pay managed care on par with Medicare and Medicaid. “This is one of the largest components of savings that people are anticipating,” he adds. A backlash by seniors, however, has led to a “grandfathering” clause that would protect the extra benefits in certain parts of the country, potentially reducing the overall savings.
2. Disproportionate Share Hospital (DSH) Cuts
Both Medicare and Medicaid pay extra to hospitals that serve a high proportion of needy patients. The savings mechanism here is less clear, but the expectation is that because the number of uninsured patients will drop dramatically with legislation, the DSH payments could be scaled back as well. The cuts, phased in over a decade, could amount to tens of billions of dollars in overall savings, though the House and Senate Finance bills differ in how deep the trims should be.
For More Information

- Kaiser Family Foundation
http://healthreform.kff.org
The foundation’s comprehensive “Health Reform” page offers a side-by-side comparison of 12 healthcare proposals, including both Democratic and Republican bills.
- Congressional Budget Office
The nonpartisan office has already weighed in on the economic effects of preliminary versions of the competing healthcare reform bills, and will likely do so again.
- FactCheck.org
A project of The University of Pennsylvania’s Annenberg Public Policy Center, the site has debunked dozens of healthcare reform myths.
- PolitiFact.com
The Truth-O-Meter, a project of the St. Petersburg Times, has put recent healthcare assertions into categories ranging from “True” (substantiated assertions) to “Pants on Fire” (for absurd untruths).
- HospitalMedicine.org/advocacy
SHM updates health reform progress and offers a monthly “Washington Update” outlining the society’s policy positions and activities.
Other Proposals to Keep an Eye On
- Addition of a hospital value-based purchasing (VBP) program to Medicare, which would tie incentive payments to performance on various quality measures;
- Expansion of the Physician’s Quality Reporting Initiative (PQRI), with a 1% payment penalty by 2012 for nonparticipants;
- Creation of a CMS payment innovation center to try out new payment structures, with the goal of improving quality and reducing Medicare costs; and
- Establishment of a Medicare pilot initiative called the Community Care Transitions Program, which would spend $500 million over 10 years on efforts to reduce preventable rehospitalizations; SHM’s Project BOOST (Better Outcomes for Older Adults through Safe Transitions) likely would qualify.
Four Proposals Hospitalists Should Know About
1. Fixes to Medicare’s Physician Fee Schedule

The House bill would provide $228.5 billion to repeal the sustainable growth rate (SGR) used to determine the annual physician fee schedule and eliminate accumulated SGR debt, preventing a potential 21.5% cut in 2010 reimbursement fees. The more cost-conscious Senate Finance bill, by contrast, provides a one-year patch, providing a 0.5% update instead of any cut, but it leaves the SGR in place. “We understand the budgetary constraints that Senator Baucus is working with, but we’re disappointed that the SGR is getting another patch,” says Eric Siegal, MD, FHM, chair of SHM’s Public Policy Committee. “If we’re going to talk about restructuring healthcare, then we also need a payment system that is stable and that is not subject to the yearly whims of Congress.”
2. Medical Liability Reform
The Senate Finance plan’s nonbinding “Sense of the Senate,” which encourages states to pursue alternatives to the current civil litigation system, is a “missed opportunity,” according to Dr. Siegal. “We think that the Senate Finance Committee should have gone further with this,” he says, noting that medical liability is a significant driver of unnecessary healthcare expenses. The House bill is more robust in pushing medical malpractice reform by offering states federal assistance, Dr. Siegal says, but still leaves room for improvement.
3. Primary-Care Bonus Payments
Conceptually, the Senate and the House bills offer similar proposals to improve reimbursements for primary care, something Dr. Siegal says SHM has consistently and strongly supported “as a way of preventing further erosion of the primary-care infrastructure.” Depending on how the Senate Finance plan defines “primary care,” hospitalists might benefit directly. “Even if you get past the issue of whether it hits our pocketbook favorably,” Dr. Siegal says, “it is in the strategic interest of our specialty to have a strong primary-care base.”
4. Bundled Payments
Proposals in both the Senate and House bills for a pilot program aimed at bundling payments around an episode of care have been greeted cautiously by hospitalists, as have other new payment proposals. Robust and meaningful demonstration projects, Dr. Siegal says, are necessary to get a better sense of what the consequences could be, intended or otherwise. “Any time you’re talking about changes to the fundamental architecture of how we pay people for what they do, you’d better spend some time looking into what the implications of that are,” he says. TH
Bryn Nelson is a freelance writer based in Seattle.
Image Sources: KASH76, DIADEMIMAGES, DAVID GUNN, TOMENG, ALEXEY KASHIN, JONATHAN LARSEN, JON HELGASON, STEFAN KLEIN, SX70, SDOMINICK/ISTOCKPHOTO.COM
The struggle over U.S. healthcare reform has consumed Congress for most of the year. It has dominated media coverage and fueled informal debates in all parts of the country. A resolution to the heated back-and-forth should arrive by Thanksgiving in the form of meaningful healthcare legislation, according to Vice President Joe Biden. Then again, Sen. Jim DeMint (R-S.C.) has pledged to cancel the Democrats’ planned festivities, preventing what he and other opponents have described as a “government takeover” of the healthcare system.
Amid the emotional tug-of-war and evolving bills, the nonpartisan Congressional Budget Office (CBO) has laid out the stakes. In a June letter to the Senate Budget Committee, CBO Director Douglas W. Elmendorf begins: “In the absence of significant changes in policy, rising costs for healthcare will cause federal spending to grow much faster than the economy, putting the federal budget on an unsustainable path.”
Most experts, analysts, and politicians agree that something must be done. It’s all a matter of what and how much it will cost. In the spirit of Thanksgiving, let’s talk turkey about the healthcare reform proposals that may or may not survive the holiday, and the key players who will determine whether this year’s reform effort stays alive—or gets stuffed.
Main Points of Disagreement
Beyond the sticky matter of how to pay for everything, businesses instinctively have opposed any requirement that employers offer health insurance to their employees. Then again, that opposition seems to be softening as more details of the plan are released.
In principle, widespread agreement exists on the notion that individuals should have guaranteed issue and renewability of their healthcare insurance, regardless of pre-existing conditions. Far less clear, however, is the matter of how much those individuals will have to pay for their policies.
Main Points of Agreement
Not everyone is on board, but any healthcare reform bill that emerges from Congress is likely to contain three main elements, according to Leighton Ku, director of the Center for Health Policy Research at George Washington University in Washington, D.C.
1. Expansion of Medicaid
2. Health Insurance Exchanges
Think of exchanges as the Travelocity or Orbitz for health-insurance plans, complete with coupons for the needy. Sliding-scale tax credits or vouchers could be used by low- to moderate-income people to buy insurance in publicly available, government-regulated marketplaces where such parameters as premiums and coverage could be compared. “The concept is that by setting up standards and having a place where it’s all together, it would create a competition,” Ku says.
In essence, more competition could lead to cost reductions.
3. An Individual Mandate
Hardship exemptions are likely, but people who can afford it will be expected to buy insurance or pay a penalty. Republican rumblings suggest that agreement on this point may not be as widespread as initially thought.
Main Players
President Obama has made healthcare reform the centerpiece of his first-year agenda. If he is to succeed, organizations like AARP will be key in winning over skeptical seniors. But the real power lies with a handful of Congressional leaders who have the ability to make or break any legislation. A brief rundown:
Senate
The overhaul is less expensive and more moderate than the America’s Affordable Health Choices Act, introduced in the House of Representatives, and a partial bill passed earlier by Sen. Kennedy’s Health, Education, Labor and Pensions (HELP) Committee. Nevertheless, progressives and conservatives criticized the Baucus plan. Even so, Sen. Olympia Snowe (R-Maine) has become a major focus of Democrats’ efforts to find 60 votes and avoid a Republican filibuster, though the seating of a replacement for Sen. Kennedy would help Democrats regain a filibuster-proof majority. One key point: Analysts say bringing Sen. Snowe on board might not win other Republican votes, but she might offer cover for such conservative Democratic senators as Mary Landrieu (D-La.) and Ben Nelson (D-Neb.).
As a last resort, Democrats have raised the possibility of using reconciliation, an arcane process originally intended for budgetary items. Reconciliation requires only a 51-vote majority, but complicated rules and a promised Republican challenge could lead to chaos.
House
Paying For It All
Meaningful reform without breaking the bank is a common refrain in healthcare discussions. Despite heated disputes over taxes, fees, fines, and service cuts to help defray costs, two main mechanisms for savings have emerged, according to the Center for Health Policy Research’s Ku:
1. Curbing Medicare Advantage
One cost-cutting idea would be to restore a level playing field, Ku says, and pay managed care on par with Medicare and Medicaid. “This is one of the largest components of savings that people are anticipating,” he adds. A backlash by seniors, however, has led to a “grandfathering” clause that would protect the extra benefits in certain parts of the country, potentially reducing the overall savings.
2. Disproportionate Share Hospital (DSH) Cuts
Both Medicare and Medicaid pay extra to hospitals that serve a high proportion of needy patients. The savings mechanism here is less clear, but the expectation is that because the number of uninsured patients will drop dramatically with legislation, the DSH payments could be scaled back as well. The cuts, phased in over a decade, could amount to tens of billions of dollars in overall savings, though the House and Senate Finance bills differ in how deep the trims should be.
For More Information
- Kaiser Family Foundation
http://healthreform.kff.org
The foundation’s comprehensive “Health Reform” page offers a side-by-side comparison of 12 healthcare proposals, including both Democratic and Republican bills.
- Congressional Budget Office
The nonpartisan office has already weighed in on the economic effects of preliminary versions of the competing healthcare reform bills, and will likely do so again.
- FactCheck.org
A project of The University of Pennsylvania’s Annenberg Public Policy Center, the site has debunked dozens of healthcare reform myths.
- PolitiFact.com
The Truth-O-Meter, a project of the St. Petersburg Times, has put recent healthcare assertions into categories ranging from “True” (substantiated assertions) to “Pants on Fire” (for absurd untruths).
- HospitalMedicine.org/advocacy
SHM updates health reform progress and offers a monthly “Washington Update” outlining the society’s policy positions and activities.
Other Proposals to Keep an Eye On
- Addition of a hospital value-based purchasing (VBP) program to Medicare, which would tie incentive payments to performance on various quality measures;
- Expansion of the Physician’s Quality Reporting Initiative (PQRI), with a 1% payment penalty by 2012 for nonparticipants;
- Creation of a CMS payment innovation center to try out new payment structures, with the goal of improving quality and reducing Medicare costs; and
- Establishment of a Medicare pilot initiative called the Community Care Transitions Program, which would spend $500 million over 10 years on efforts to reduce preventable rehospitalizations; SHM’s Project BOOST (Better Outcomes for Older Adults through Safe Transitions) likely would qualify.
Four Proposals Hospitalists Should Know About
1. Fixes to Medicare’s Physician Fee Schedule
The House bill would provide $228.5 billion to repeal the sustainable growth rate (SGR) used to determine the annual physician fee schedule and eliminate accumulated SGR debt, preventing a potential 21.5% cut in 2010 reimbursement fees. The more cost-conscious Senate Finance bill, by contrast, provides a one-year patch, providing a 0.5% update instead of any cut, but it leaves the SGR in place. “We understand the budgetary constraints that Senator Baucus is working with, but we’re disappointed that the SGR is getting another patch,” says Eric Siegal, MD, FHM, chair of SHM’s Public Policy Committee. “If we’re going to talk about restructuring healthcare, then we also need a payment system that is stable and that is not subject to the yearly whims of Congress.”
2. Medical Liability Reform
The Senate Finance plan’s nonbinding “Sense of the Senate,” which encourages states to pursue alternatives to the current civil litigation system, is a “missed opportunity,” according to Dr. Siegal. “We think that the Senate Finance Committee should have gone further with this,” he says, noting that medical liability is a significant driver of unnecessary healthcare expenses. The House bill is more robust in pushing medical malpractice reform by offering states federal assistance, Dr. Siegal says, but still leaves room for improvement.
3. Primary-Care Bonus Payments
Conceptually, the Senate and the House bills offer similar proposals to improve reimbursements for primary care, something Dr. Siegal says SHM has consistently and strongly supported “as a way of preventing further erosion of the primary-care infrastructure.” Depending on how the Senate Finance plan defines “primary care,” hospitalists might benefit directly. “Even if you get past the issue of whether it hits our pocketbook favorably,” Dr. Siegal says, “it is in the strategic interest of our specialty to have a strong primary-care base.”
4. Bundled Payments
Proposals in both the Senate and House bills for a pilot program aimed at bundling payments around an episode of care have been greeted cautiously by hospitalists, as have other new payment proposals. Robust and meaningful demonstration projects, Dr. Siegal says, are necessary to get a better sense of what the consequences could be, intended or otherwise. “Any time you’re talking about changes to the fundamental architecture of how we pay people for what they do, you’d better spend some time looking into what the implications of that are,” he says. TH
Bryn Nelson is a freelance writer based in Seattle.
Image Sources: KASH76, DIADEMIMAGES, DAVID GUNN, TOMENG, ALEXEY KASHIN, JONATHAN LARSEN, JON HELGASON, STEFAN KLEIN, SX70, SDOMINICK/ISTOCKPHOTO.COM
Curriculum Vitae 101
By now, if you’re a final-year resident, you should be thinking about your plans for when you finish your residency. Before you begin the job search in earnest, it’s a good idea to create or update your curriculum vitae, or CV. You might be thinking, “That’s easy. I haven’t done anything yet!” That might be the case, but in reality, you probably have done more than you realize.
Whether you are just starting out or need to freshen a rough draft, here are some recommendations for creating a CV.
Brainstorm
The first step is to capture all the things you have done. Start by taking a sheet of paper and making columns with the following headings: licensure/documents, honors and awards, presentations/publications, research activities, committees, teaching, community service, and special skills. List each of the things you’ve done in each category.
Don’t be modest. You have to sell yourself. No item is too small for consideration for your CV at this stage. Get together with other people in your residency class and brainstorm together. They might help you think of certain activities that you have not already thought about. Here are some key points to keep in mind as you brainstorm each section:
- Licensure/documents: If you haven’t obtained a license in the state where you want to practice, now is the time to do it. Make sure advanced cardiac life support (ACLS) and BLS are current. If you haven’t taken your board exam, mention that you are board-eligible and include the date you plan to take the exam.
- Honors and awards: You don’t have to receive a trophy at a fancy awards ceremony to fill out this section. Did you ever receive a letter from the department chair, program director, or clerkship director giving you a special commendation? Such recognition might be worth a mention.
- Presentations and publications: If you have been published, include the citation here. Many residents present posters at regional meetings; this information should go in your CV. Have you given a presentation for “Morning Report” or a “Morbidity and Mortality Conference”? If so, these count as presentations, too. Many residents have written Web-based materials. Cite these as well.
- Teaching: Consider all the activities you perform for medical students. Have you given the students any prepared lectures? Have you been a preceptor for their physical exam labs? Have you provided mentorship for a student? Significant time spent mentoring also should be reflected on a resident’s CV.
- Research: QI projects generally count as HM research projects.
- Committees: Think about all the meetings you’ve attended and determine if any of them count as providing services to the residency or hospital.
- Special skills: Proficiency in thoracocentesis or lumbar puncture procedures qualifies for this section. If you speak a second (or third, fourth, etc.) language, include it here.
Rough Draft = First Attempt
Now that you have gathered your information, it’s time to organize it. Web-based resources and templates are plentiful, and many can help you write the CV. If you are applying for an academic position, you will need to keep a detailed CV. If you are not applying for an academic position, it is best to keep your CV at no more than two pages in length; however, you might want to keep a comprehensive (and lengthier) version on file.
Maintain a Career Folder
Once you’ve created your first CV, you will need to develop a system to update and maintain the document. The easiest way to do this is to keep a “career folder” on your desktop or in a filing cabinet. This will help you catalog all the extra things you’ve done throughout your career.
Write notes to yourself, with the date and time spent on certain activities. Then, at regular intervals, document them on your CV. It’s best to update your CV every six months.
The career file also can be used to keep evaluations, letters from patients, or anything else that exemplifies your accomplishments at work. Having a system for organizing your achievements will help you negotiate a raise and assist with future promotions or tenure.
Cover Letter
A cover letter should be no more than three to four paragraphs in length. Keep it simple and to the point. Briefly state how you heard about the job opening and why you are interested in the job.
Take a paragraph to identify the skills and experience you have to offer the HM group. The final paragraph should be used to explain how you intend to follow up and the best way you can be reached (phone, e-mail, etc.) to arrange an interview.
Interview Tips
A well-written CV can lead to several interview offers. Here are some important tips to help you obtain that all-important job offer:
- Have a clear vision. It’s important to know what you are looking for. Having clear goals will help you know exactly the kind of job you want and avoid wasting time and energy.
- Set aside time for a phone interview. You can learn a lot about an HM program during this time; give the interviewer a chance to learn about you, too. Use this step to screen out those places you really want to visit in person.
- Show up on time. Give yourself enough time to reach your destination, park, and find the meeting location. If possible, take a test drive a day or two before.
- Remember, your appearance matters. Dress professionally in conservative business attire. Furthermore, always act professional. Avoid negative talk about past attendings or employers. If you are going out for lunch, avoid ordering alcohol.
- Write down questions to ask. This will give you more clarity and ensure that all of your questions regarding the prospective job are answered.
- Show interest in the program. Ask appropriate questions, even if you have all the information you need. Don’t leave without asking about the next steps in the hiring process.
- Talk about money last. Contrary to popular belief, it’s OK to bring up the topic of money during an interview. Just don’t make it your first—and only—question.
- Check out the town. Bring your spouse or partner to explore a prospective relocation site. Look into housing, schools, your potential commute, and recreational activities. TH
Dr. Garcia is assistant professor in the division of hospital medicine at the University of Texas Health Sciences Center at San Antonio. Dr. Patel is a hospitalist at HPMG Regions Hospital and assistant professor of medicine at the University of Minnesota in St. Paul.
Image Source: CHAGIN/ISTOCKPHOTO.COM
Market Watch
Discontinued Products
- Amoxicillin powder for oral suspension and pediatric drops for oral suspension1
- Amoxicillin powder for oral suspension (Amoxil brand usually for adults), 250mg/5mL (100mL and 150mL sizes)2
- Insulin isophane suspension (Humulin 50/50), due to limited use.3 Current patient demand and existing inventory note product availability through April 2010. There are about 3,000 patients in the U.S. who will be affected by this action.
- Phenytoin 30 mg (Dilantin Kapseals brand) are being reformulated in a new, extended-release formulation, but Kapseals will be discontinued.4
New Generics
- Tacrolimus (generic Prograf) capsules5
New Drugs, Indications, and Dosage Forms
- Asenapine tablets (Saphris) have been approved by the Food and Drug Administration (FDA) to treat adults with schizophrenia and bipolar I disorder. The most common adverse effects in trials were akathisia, oral hypoesthesia, and somnolence. The most common adverse effects that were reported in the bipolar disorder trials were somnolence, dizziness, movement disorders other than akathisia, and weight gain.6
- Colchicine 0.6 mg tablets (Colcrys) have been approved by the FDA to treat gout flares and familial Mediterranean fever.7 Colchicine has been used for many years but has not received FDA approval until recently. The FDA is re-evaluating some older drugs and drug classes. For example, the pancrelipase products fall under a similar ruling. Now that colchicine is approved, the manufacturer has shown that it meets modern standards for safety, effectiveness, quality, and labeling. Historically, physicians have administered colchicine hourly to treat acute gout flares until symptoms subsided or the patient developed adverse gastrointestinal symptoms. A dosing study determined that one 1.2-mg dose of this formulation followed by 0.6 mg one hour later was as effective as hourly dosing in patients without renal or hepatic dysfunction. This two-dose regimen was less toxic than prior dosing regimens and, therefore, it received the FDA’s approval.8
- Fentanyl buccal soluble film (Onsolis) has been approved by the FDA as an opioid for managing breakthrough cancer pain in patients 18 years and older who already are receiving and are tolerant to opioid therapy.9 It is available in 200-, 400-, 600-, 800- and 1,200-mcg strengths. A Risk Evaluation and Mitigation Strategies (REMS) will be available with dispensing.
- Insulin aspart injection (NovoLog) has undergone a label change. NovoLog can now be used in an insulin pump for up to six days. The infusion set should be changed at least every three days. The updated label includes information about discarding the drug if temperatures exceed 37oC (98.6oF).10
- Interferon beta-1b injection (Extavia): A new brand of interferon has been approved by the FDA for treating relapsing forms of multiple sclerosis (MS), as well as for patients who have experienced a first clinical episode of MS with magnetic resonance imaging (MRI) features consistent of the disease.11
- Morphine/naltrexone capsules (Embeda), a long-acting opioid designed to reduce drug euphoria, have been approved by the FDA to treat moderate to severe chronic pain. It was developed with the abuse-deterrent drug naltrexone, which reduces euphoria when crushed or chewed.12
- Pitavastatin 4 mg (Livalo) has been approved by the FDA to treat hypercholesterolemia and combined dyslipidemia.13 It’s a potent statin with a new base structure. Additionally, it is only minimally metabolized by the cytochrome P450 (CYP) pathway. It will be available in early 2010 in 1-, 2- and 4-mg strengths. Only time will tell whether this is truly a benefit for this new agent.
- Saxagliptin (Onglyza), a new oral dipeptidyl peptidase-4 (DPP-4) inhibitor, has been approved by the FDA to treat Type 2 diabetes mellitus as an adjunct to diet and exercise.14 It is administered once daily at a starting dose of 2.5 mg or 5 mg, without regard to meal.15 The lower dose is recommended in patients with moderate to severe renal impairment or end-stage renal disease (CrCL < 50 mL/min). The lower dose (2.5 mg) also is recommended for patients taking strong CYP3A4/5 inhibitors (e.g., ketoconazole, atazanavir, clarithromycin, indinavir, itraconazole, nefazodone, nelfinavir, ritonavir, saquinavir, or telithromycin). The most common adverse effects in clinical trials were respiratory tract infection, urinary tract infection, and headache.
Pipeline
- Roflumilast (Daxas), a phosphodiesterase 4 enzyme inhibitor, has been submitted to the FDA. It is a once-daily oral treatment for patients with symptomatic chronic obstructive pulmonary disease (COPD).16
- Tocilizumab (Actemra), an interleukin-6 receptor-inhibiting monoclonal antibody to treat rheumatoid arthritis (RA), has been approved for use in Europe. Its manufacturer has announced that the FDA has accepted its reapplication for treating moderate to severe RA. It is available in Japan for treating RA, juvenile idiopathic arthritis, and Castleman’s disease.17
- TZP-102, an investigational oral prokinetic agent for treating diabetic gastroparesis, has received FDA fast-track status. A multinational study is under way for this ghrelin receptor agonist.18 TH
Michele B. Kaufman, PharmD, BSc, RPh, is a freelance medical writer based in New York City and a clinical pharmacist at New York Downtown Hospital.
What is the appropriate use of chronic medications in the perioperative setting?
Case
A 72-year-old female with multiple medical problems is admitted with a hip fracture. Surgery is scheduled in 48 hours. The patient’s home medications include aspirin, carbidopa/levodopa, celecoxib, clonidine, estradiol, ginkgo, lisinopril, NPH insulin, sulfasalazine, and prednisone 10 mg a day, which she has been taking for years. How should these and other medications be managed in the perioperative period?

Background
Perioperative management of chronic medications is a complex issue, as physicians are required to balance the beneficial and harmful effects of the individual drugs prescribed to their patients. On one hand, cessation of medications can result in decompensation of disease or withdrawal. On the other hand, continuation of drugs can alter metabolism of anesthetic agents, cause perioperative hemodynamic instability, or result in such post-operative complications as acute renal failure, bleeding, infection, and impaired wound healing.
Certain traits make it reasonable to continue medications during the perioperative period. A long elimination half-life or duration of action makes stopping some medications impractical as it takes four to five half-lives to completely clear the drug from the body; holding the drug for a few days around surgery will not appreciably affect its concentration. Stopping drugs that carry severe withdrawal symptoms can be impractical because of the need for lengthy tapers, which can delay surgery and result in decompensation of underlying disease.
Drugs with no significant interactions with anesthesia or risk of perioperative complications should be continued in order to avoid deterioration of the underlying disease. Conversely, drugs that interact with anesthesia or increase risk for complications should be stopped if this can be accomplished safely. Patient-specific factors should receive consideration, as the risk of complications has to be balanced against the danger of exacerbating the underlying disease.
Overview of the Data
The challenge in providing recommendations on perioperative medication management lies in a dearth of high-quality clinical trials. Thus, much of the information comes from case reports, expert opinion, and sound application of pharmacology.
Antiplatelet therapy: Nuances of perioperative antiplatelet therapy are beyond the scope of this review, but some general principles can be elucidated from the American College of Cardiology/American Heart Association (ACC/AHA) 2007 perioperative guidelines.1 Management of antiplatelet therapy should be done in conjunction with the surgical team, as cardiovascular risk has to be weighed against bleeding risk.
Aspirin therapy should be continued in all patients with a history of coronary artery disease (CAD), balloon angioplasty, or percutaneous coronary intervention (PCI), unless the risk of bleeding complications is felt to exceed the cardioprotective benefits—for example, in some neurosurgical patients.1
Clopidogrel therapy is crucial for prevention of in-stent thrombosis (IST) following PCI because patients who experience IST suffer catastrophic myocardial infarctions with high mortality. Ideally, surgery should be delayed to permit completion of clopidogrel therapy—30 to 45 days after implantation of a bare-metal stent and 365 days after a drug-eluting stent. If surgery has to be performed sooner, guidelines recommend operating on dual antiplatelet therapy with aspirin and clopidogrel.1 Again, this course of treatment has to be balanced against the risk of hemorrhagic complications from surgery.
Both aspirin and clopidogrel irreversibly inhibit platelet aggregation. The recovery of normal coagulation involves formation of new platelets, which necessitates cessation of therapy for seven to 10 days before surgery. Platelet inhibition begins within minutes of restarting aspirin and within hours of taking clopidogrel, although attaining peak clopidogrel effect takes three to seven days, unless a loading dose is used.
Cardiovascular Drugs
Beta-blockers in the perioperative setting are a focus of an ongoing debate beyond the scope of this review (see “What Pre-Operative Cardiac Evaluation of Patients Undergoing Intermediate-Risk Surgery Is Most Effective?,” February 2008, p. 26). Given the current evidence and the latest ACC/AHA guidelines, it is still reasonable to continue therapy in patients who are already taking them to avoid precipitating cardiovascular events by withdrawal. Patients with increased cardiac risk, demonstrated by a Revised Cardiac Risk Index (RCRI) score of ≥2 (see Table 1, p. 12), should be considered for beta-blocker therapy before surgery.1 In either case, the dose should be titrated to a heart rate <65 for optimal cardiac protection.1
Statins should be continued if the patient is taking them, especially because preoperative withdrawal has been associated with a 4.6-fold increase in troponin release and a 7.5-fold increased risk of myocardial infarction (MI) and cardiovascular death following major vascular surgery.2 Patients with increased cardiac risk— RCRI ≥1—can be considered for initiation of statin therapy before surgery, although the benefit of this intervention has not been examined in prospective studies.1
Amiodarone has an exceptionally long half-life of up to 142 days. It should be continued in the perioperative period.
Calcium channel blockers (CCBs) can be continued with no unpleasant perioperative hemodynamic effects.1 CCBs have potential cardioprotective benefits.
Clonidine withdrawal can result in severe rebound hypertension with reports of encephalopathy, stroke, and death. These effects are exacerbated by concomitant beta-blocker therapy. For this reason, if a patient is expected to be NPO for more than 12 hours, they should be converted to a clonidine patch 48-72 hours before surgery with concurrent tapering of the oral dose.3
Digoxin has a long half-life (up to 48 hours) and should be continued with monitoring of levels if there is a change in renal function.
Angiotensin converting enzyme inhibitors (ACEI) and angiotensin receptor blockers (ARBs) have been associated with a 50% increased risk of hypotension requiring vasopressors during induction of anesthesia.4 However, it is worth mentioning that this finding has not been corroborated in other studies. A large retrospective cohort of cardiothoracic surgical patients found a 28% increased risk of post-operative acute renal failure (ARF) with both drug classes, although another cardiothoracic report published the same year demonstrated a 50% reduction in risk with ACEIs.5,6 Although the evidence of harm is not unequivocal, perioperative blood-pressure control can be achieved with other drugs without hemodynamic or renal risk, such as CCBs, and in most cases ACEIs/ARBs should be stopped one day before surgery.
Diuretics carry a risk of volume depletion and electrolyte derangements, and should be stopped once a patient becomes NPO. Excess volume is managed with as-needed intravenous formulations.
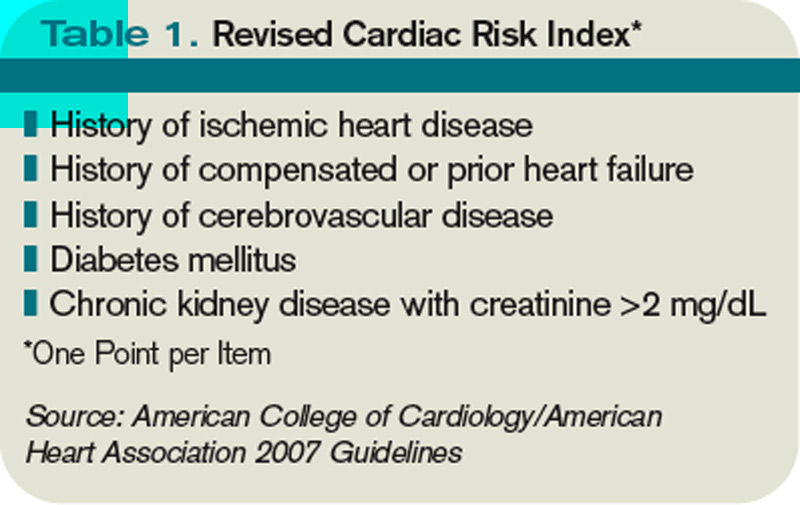
Drugs Acting on the Central Nervous System
The majority of central nervous system (CNS)-active drugs, including antiepileptics, antipsychotics, benzodiazepines, bupropion, gabapentin, lithium, mirtazapine, selective serotonin and norepinephrine reuptake inhibitors (SSRIs and SNRIs), tricyclic antidepressants (TCAs), and valproic acid, balance a low risk of perioperative complications against a significant potential for withdrawal and disease decompensation. Therefore, these medications should be continued.
Carbidopa/Levodopa should be continued because abrupt cessation can precipitate systemic withdrawal resembling serotonin syndrome and rapid deterioration of Parkinson’s symptoms.
Monoamine oxidase inhibitor (MAOI) therapy usually indicates refractory psychiatric illness, so these drugs should be continued to avoid decompensation. Importantly, MAOI-safe anesthesia without dextromethorphan, meperidine, epinephrine, or norepinephrine has to be used due to the risk of cardiovascular instability.7
Diabetic Drugs
Insulin therapy should be continued with adjustments. Glargine basal insulin has no peak and can be continued without changing the dose. Likewise, patients with insulin pumps can continue the usual basal rate. Short-acting insulin or such insulin mixes as 70/30 should be stopped four hours before surgery to avoid hypoglycemia. Intermediate-acting insulin (e.g., NPH) can be administered at half the usual dose the day of surgery with a perioperative 5% dextrose infusion. NPH should not be given the day of surgery if the dextrose infusion cannot be used.8
Incretins (exenatide, sitagliptin) rarely cause hypoglycemia in the absence of insulin and may be beneficial in controlling intraoperative hyperglycemia. Therefore, these medications can be continued.8
Thiazolidinediones (TZDs; pioglitazone, rosiglitazone) alter gene transcription with biological duration of action on the order of weeks and low risk of hypoglycemia, and should be continued.
Metformin carries an FDA black-box warning to discontinue therapy before any intravascular radiocontrast studies or surgical procedures due to the risk of severe lactic acidosis if renal failure develops. It should be stopped 24 hours before surgery and restarted at least 48-72 hours after. Normal renal function should be confirmed before restarting therapy.8
Sulfonylureas (glimepiride, glipizide, glyburide) carry a significant risk of hypoglycemia in a patient who is NPO; they should be stopped the night before surgery or before commencement of NPO status.
Hormones
Antithyroid drugs (methimazole, propylthiouracil) and levothyroxine should be continued, as they have no perioperative contraindications.
Oral contraceptives (OCPs), hormone replacement therapy (HRT), and raloxifene can increase the risk of DVT. The largest study on the topic was the HERS trial of postmenopausal women on estrogen/progesterone HRT. The authors reported a 4.9-fold increased risk of DVT for 90 days after surgery.9 Unfortunately, no information was provided on the types of surgery, or whether appropriate and consistent DVT prophylaxis was utilized. HERS authors also reported a 2.5-fold increased risk of DVT for at least 30 days after cessation of HRT.9
Given the data, it is reasonable to stop hormone therapy four weeks before surgery when prolonged immobilization is anticipated and patients are able to tolerate hormone withdrawal, especially if other DVT risk factors are present. If hormone therapy cannot be stopped, strong consideration should be given to higher-intensity DVT prophylaxis (e.g., chemoprophylaxis as opposed to mechanical measures) of longer duration—up to 28 days following general surgery and up to 35 days after orthopedic procedures.10
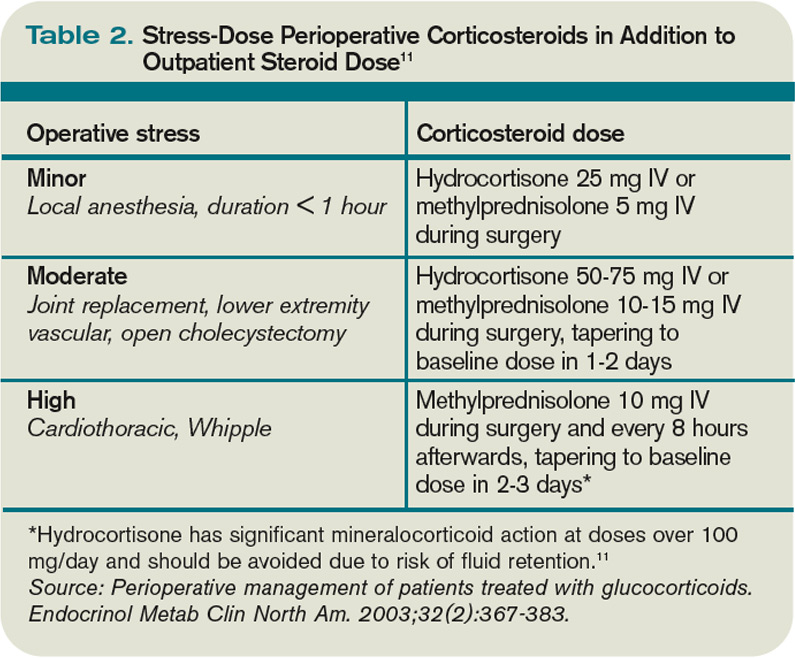
Perioperative Corticosteroids
Corticosteroid therapy in excess of prednisone 5 mg/day or equivalent for more than five days in the 30 days preceding surgery might predispose patients to acute adrenal insufficiency in the perioperative period. Surgical procedures typically result in cortisol release of 50-150 mg/day, which returns to baseline within 48 hours.11 Therefore, the recommendation is to continue a patient’s baseline steroid dose and supplement it with stress-dose steroids tailored to the severity of operative stress (see Table 2, above).
Mineralocorticoid supplementation is not necessary, because endogenous production is not suppressed by corticosteroid therapy.11 Although a recent systematic review suggests that routine stress-dose steroids might not be indicated, high-quality prospective data are needed before abandoning this strategy due to complications of acute adrenal insufficiency compared to the risk of a brief corticosteroid burst.
Non-Steroidal Anti-Inflammatory Drugs (NSAIDs)
Nonselective cyclooxygenase (COX) inhibitors reversibly decrease platelet aggregation only while the drug is present in the circulation and should be stopped one to three days before surgery due to risk of bleeding.
Selective COX-2 inhibitors do not significantly alter platelet aggregation and can be continued for opioid-sparing perioperative pain control.
Both COX-2-selective and nonselective inhibitors should be held if there are concerns for impaired renal function.
Disease-Modifying Antirheumatic Drugs (DMARDs) and Biological Response Modifiers (BRMs)
Methotrexate increases the risk of wound infections and dehiscence. However, this is offset by a decreased risk of post-operative disease flares with continued use. It can be continued unless the patient has medical comorbidities, advanced age, or chronic therapy with more than 10 mg/day of prednisone, in which case the drug should be stopped two weeks before surgery.12
Azathioprine, leflunomide, and sulfasalazine are renally cleared with a risk of myelosuppression; all of these medications should be stopped. Long half-life of leflunomide necessitates stopping it two weeks before surgery; azathioprine and sulfasalazine can be stopped one day in advance. The drugs can be restarted three days after surgery, assuming stable renal function.13
Anti-TNF-α (adalimumab, etanercept, infliximab), IL1 antagonist (anakinra), and anti-CD20 (rituximab) agents should be stopped one week before surgery and resumed 1-2 weeks afterward, unless risk of complications from disease flareup outweighs the concern for wound infections and dehiscence.14
Herbal Medicines
It is estimated that as much as a third of the U.S. population uses herbal medicines. These substances can result in perioperative hemodynamic instability (ephedra, ginseng, ma huang), hypoglycemia (ginseng), immunosuppression (echinacea, when taken for more than eight weeks), abnormal bleeding (garlic, ginkgo, ginseng), and prolongation of anesthesia (kava, St. John’s wort, valerian). All of these herbal medicine should be stopped one to two weeks before surgery.15,16
Back to the Case
The patient’s Carbidopa/Levodopa should be continued. Celecoxib can be continued if her renal function in stable. If aspirin is taken for a history of coronary artery disease or percutaneous coronary intervention, it should be continued, if possible. Clonidine should be continued or changed to a patch if an extended NPO period is anticipated. Ginkgo, lisinopril, and sulfasalazine should be stopped.
Hospitalization does not provide the luxury of stopping estradiol in advance, so it might be continued with chemical DVT prophylaxis for up to 35 days after surgery. The patient should receive 50-75 mg of IV hydrocortisone during surgery and an additional 25 mg the following day, in addition to her usual prednisone 10 mg/day. She can either receive half her usual NPH dose the morning of surgery with a 5% dextrose infusion in the operating room, or the NPH should be held altogether.
Bottom Line
Perioperative medication use should be tailored to each patient, balancing the risks and benefits of individual drugs. High-quality trials are needed to provide more robust clinical guidelines. TH
Dr. Levin is a hospitalist at the University of Colorado Denver.
References
- Fleisher LA, Beckman JA, Brown KA, et al. ACC/AHA 2007 Guidelines on Perioperative Cardiovascular Evaluation and Care for Noncardiac Surgery: Executive Summary: A Report of the American College of Cardiology/American Heart Association Task Force on Practice Guidelines (Writing Committee to Revise the 2002 Guidelines on Perioperative Cardiovascular Evaluation for Noncardiac Surgery): Developed in Collaboration With the American Society of Echocardiography, American Society of Nuclear Cardiology, Heart Rhythm Society, Society of Cardiovascular Anesthesiologists, Society for Cardiovascular Angiography and Interventions, Society for Vascular Medicine and Biology, and Society for Vascular Surgery. Circulation. 2007;116(17):1971-1996.
- Schouten O, Hoeks SE, Welten GM, et al. Effect of statin withdrawal on frequency of cardiac events after vascular surgery. Am J Cardiol. 2007;100(2):316-320.
- Spell NO III. Stopping and restarting medications in the perioperative period. Med Clin North Am. 2001;85(5):1117-1128.
- Rosenman DJ, McDonald FS, Ebbert JO, Erwin PJ, LaBella M, Montori VM. Clinical consequences of withholding versus administering renin-angiotensin-aldosterone system antagonists in the preoperative period. J Hosp Med. 2008;3(4):319-325.
- Arora P, Rajagopalam S, Ranjan R, et al. Preoperative use of angiotensin-converting enzyme inhibitors/ angiotensin receptor blockers is associated with increased risk for acute kidney injury after cardiovascular surgery. Clin J Am Soc Nephrol. 2008;3(5):1266-1273.
- Benedetto U, Sciarretta S, Roscitano A, et al. Preoperative Angiotensin-converting enzyme inhibitors and acute kidney injury after coronary artery bypass grafting. Ann Thorac Surg. 2008;86(4):1160-1165.
- Pass SE, Simpson RW. Discontinuation and reinstitution of medications during the perioperative period. Am J Health Syst Pharm. 2004;61(9):899-914.
- Kohl BA, Schwartz S. Surgery in the patient with endocrine dysfunction. Med Clin North Am. 2009;93(5):1031-1047.
- Grady D, Wenger NK, Herrington D, et al. Postmenopausal hormone therapy increases risk for venous thromboembolic disease: The Heart and Estrogen/progestin Replacement Study. Ann Intern Med. 2000;132(9):689-696.
- Hirsh J, Guyatt G, Albers GW, Harrington R, Schünemann HJ; American College of Chest Physicians. Executive summary: American College of Chest Physicians evidence-based clinical practice guidelines (8th edition). Chest. 2008;133(6 Suppl):71S-109S.
- Axelrod L. Perioperative management of patients treated with glucocorticoids. Endocrinol Metab Clin North Am. 2003;32(2):367-383.
- Marik PE, Varon J. Requirement of perioperative stress doses of corticosteroids: a systematic review of the literature. Arch Surg. 2008;143(12):1222-1226.
- Rosandich PA, Kelley JT III, Conn DL. Perioperative management of patients with rheumatoid arthritis in the era of biologic response modifiers. Curr Opin Rheumatol. 2004;16(3):192-198.
- Saag KG, Teng GG, Patkar NM, et al. American College of Rheumatology 2008 recommendations for the use of nonbiologic and biologic disease-modifying antirheumatic drugs in rheumatoid arthritis. Arthritis Rheum. 2008;59(6):762-784.
- Ang-Lee MK, Moss J, Yuan CS. Herbal medicines and perioperative care. JAMA. 2001;286(2):208-216.
- Hodges PJ, Kam PC. The peri-operative implications of herbal medicines. Anaesthesia. 2002;57(9):889-899.
Case
A 72-year-old female with multiple medical problems is admitted with a hip fracture. Surgery is scheduled in 48 hours. The patient’s home medications include aspirin, carbidopa/levodopa, celecoxib, clonidine, estradiol, ginkgo, lisinopril, NPH insulin, sulfasalazine, and prednisone 10 mg a day, which she has been taking for years. How should these and other medications be managed in the perioperative period?
Background
Perioperative management of chronic medications is a complex issue, as physicians are required to balance the beneficial and harmful effects of the individual drugs prescribed to their patients. On one hand, cessation of medications can result in decompensation of disease or withdrawal. On the other hand, continuation of drugs can alter metabolism of anesthetic agents, cause perioperative hemodynamic instability, or result in such post-operative complications as acute renal failure, bleeding, infection, and impaired wound healing.
Certain traits make it reasonable to continue medications during the perioperative period. A long elimination half-life or duration of action makes stopping some medications impractical as it takes four to five half-lives to completely clear the drug from the body; holding the drug for a few days around surgery will not appreciably affect its concentration. Stopping drugs that carry severe withdrawal symptoms can be impractical because of the need for lengthy tapers, which can delay surgery and result in decompensation of underlying disease.
Drugs with no significant interactions with anesthesia or risk of perioperative complications should be continued in order to avoid deterioration of the underlying disease. Conversely, drugs that interact with anesthesia or increase risk for complications should be stopped if this can be accomplished safely. Patient-specific factors should receive consideration, as the risk of complications has to be balanced against the danger of exacerbating the underlying disease.
Overview of the Data
The challenge in providing recommendations on perioperative medication management lies in a dearth of high-quality clinical trials. Thus, much of the information comes from case reports, expert opinion, and sound application of pharmacology.
Antiplatelet therapy: Nuances of perioperative antiplatelet therapy are beyond the scope of this review, but some general principles can be elucidated from the American College of Cardiology/American Heart Association (ACC/AHA) 2007 perioperative guidelines.1 Management of antiplatelet therapy should be done in conjunction with the surgical team, as cardiovascular risk has to be weighed against bleeding risk.
Aspirin therapy should be continued in all patients with a history of coronary artery disease (CAD), balloon angioplasty, or percutaneous coronary intervention (PCI), unless the risk of bleeding complications is felt to exceed the cardioprotective benefits—for example, in some neurosurgical patients.1
Clopidogrel therapy is crucial for prevention of in-stent thrombosis (IST) following PCI because patients who experience IST suffer catastrophic myocardial infarctions with high mortality. Ideally, surgery should be delayed to permit completion of clopidogrel therapy—30 to 45 days after implantation of a bare-metal stent and 365 days after a drug-eluting stent. If surgery has to be performed sooner, guidelines recommend operating on dual antiplatelet therapy with aspirin and clopidogrel.1 Again, this course of treatment has to be balanced against the risk of hemorrhagic complications from surgery.
Both aspirin and clopidogrel irreversibly inhibit platelet aggregation. The recovery of normal coagulation involves formation of new platelets, which necessitates cessation of therapy for seven to 10 days before surgery. Platelet inhibition begins within minutes of restarting aspirin and within hours of taking clopidogrel, although attaining peak clopidogrel effect takes three to seven days, unless a loading dose is used.
Cardiovascular Drugs
Beta-blockers in the perioperative setting are a focus of an ongoing debate beyond the scope of this review (see “What Pre-Operative Cardiac Evaluation of Patients Undergoing Intermediate-Risk Surgery Is Most Effective?,” February 2008, p. 26). Given the current evidence and the latest ACC/AHA guidelines, it is still reasonable to continue therapy in patients who are already taking them to avoid precipitating cardiovascular events by withdrawal. Patients with increased cardiac risk, demonstrated by a Revised Cardiac Risk Index (RCRI) score of ≥2 (see Table 1, p. 12), should be considered for beta-blocker therapy before surgery.1 In either case, the dose should be titrated to a heart rate <65 for optimal cardiac protection.1
Statins should be continued if the patient is taking them, especially because preoperative withdrawal has been associated with a 4.6-fold increase in troponin release and a 7.5-fold increased risk of myocardial infarction (MI) and cardiovascular death following major vascular surgery.2 Patients with increased cardiac risk— RCRI ≥1—can be considered for initiation of statin therapy before surgery, although the benefit of this intervention has not been examined in prospective studies.1
Amiodarone has an exceptionally long half-life of up to 142 days. It should be continued in the perioperative period.
Calcium channel blockers (CCBs) can be continued with no unpleasant perioperative hemodynamic effects.1 CCBs have potential cardioprotective benefits.
Clonidine withdrawal can result in severe rebound hypertension with reports of encephalopathy, stroke, and death. These effects are exacerbated by concomitant beta-blocker therapy. For this reason, if a patient is expected to be NPO for more than 12 hours, they should be converted to a clonidine patch 48-72 hours before surgery with concurrent tapering of the oral dose.3
Digoxin has a long half-life (up to 48 hours) and should be continued with monitoring of levels if there is a change in renal function.
Angiotensin converting enzyme inhibitors (ACEI) and angiotensin receptor blockers (ARBs) have been associated with a 50% increased risk of hypotension requiring vasopressors during induction of anesthesia.4 However, it is worth mentioning that this finding has not been corroborated in other studies. A large retrospective cohort of cardiothoracic surgical patients found a 28% increased risk of post-operative acute renal failure (ARF) with both drug classes, although another cardiothoracic report published the same year demonstrated a 50% reduction in risk with ACEIs.5,6 Although the evidence of harm is not unequivocal, perioperative blood-pressure control can be achieved with other drugs without hemodynamic or renal risk, such as CCBs, and in most cases ACEIs/ARBs should be stopped one day before surgery.
Diuretics carry a risk of volume depletion and electrolyte derangements, and should be stopped once a patient becomes NPO. Excess volume is managed with as-needed intravenous formulations.
Drugs Acting on the Central Nervous System
The majority of central nervous system (CNS)-active drugs, including antiepileptics, antipsychotics, benzodiazepines, bupropion, gabapentin, lithium, mirtazapine, selective serotonin and norepinephrine reuptake inhibitors (SSRIs and SNRIs), tricyclic antidepressants (TCAs), and valproic acid, balance a low risk of perioperative complications against a significant potential for withdrawal and disease decompensation. Therefore, these medications should be continued.
Carbidopa/Levodopa should be continued because abrupt cessation can precipitate systemic withdrawal resembling serotonin syndrome and rapid deterioration of Parkinson’s symptoms.
Monoamine oxidase inhibitor (MAOI) therapy usually indicates refractory psychiatric illness, so these drugs should be continued to avoid decompensation. Importantly, MAOI-safe anesthesia without dextromethorphan, meperidine, epinephrine, or norepinephrine has to be used due to the risk of cardiovascular instability.7
Diabetic Drugs
Insulin therapy should be continued with adjustments. Glargine basal insulin has no peak and can be continued without changing the dose. Likewise, patients with insulin pumps can continue the usual basal rate. Short-acting insulin or such insulin mixes as 70/30 should be stopped four hours before surgery to avoid hypoglycemia. Intermediate-acting insulin (e.g., NPH) can be administered at half the usual dose the day of surgery with a perioperative 5% dextrose infusion. NPH should not be given the day of surgery if the dextrose infusion cannot be used.8
Incretins (exenatide, sitagliptin) rarely cause hypoglycemia in the absence of insulin and may be beneficial in controlling intraoperative hyperglycemia. Therefore, these medications can be continued.8
Thiazolidinediones (TZDs; pioglitazone, rosiglitazone) alter gene transcription with biological duration of action on the order of weeks and low risk of hypoglycemia, and should be continued.
Metformin carries an FDA black-box warning to discontinue therapy before any intravascular radiocontrast studies or surgical procedures due to the risk of severe lactic acidosis if renal failure develops. It should be stopped 24 hours before surgery and restarted at least 48-72 hours after. Normal renal function should be confirmed before restarting therapy.8
Sulfonylureas (glimepiride, glipizide, glyburide) carry a significant risk of hypoglycemia in a patient who is NPO; they should be stopped the night before surgery or before commencement of NPO status.
Hormones
Antithyroid drugs (methimazole, propylthiouracil) and levothyroxine should be continued, as they have no perioperative contraindications.
Oral contraceptives (OCPs), hormone replacement therapy (HRT), and raloxifene can increase the risk of DVT. The largest study on the topic was the HERS trial of postmenopausal women on estrogen/progesterone HRT. The authors reported a 4.9-fold increased risk of DVT for 90 days after surgery.9 Unfortunately, no information was provided on the types of surgery, or whether appropriate and consistent DVT prophylaxis was utilized. HERS authors also reported a 2.5-fold increased risk of DVT for at least 30 days after cessation of HRT.9
Given the data, it is reasonable to stop hormone therapy four weeks before surgery when prolonged immobilization is anticipated and patients are able to tolerate hormone withdrawal, especially if other DVT risk factors are present. If hormone therapy cannot be stopped, strong consideration should be given to higher-intensity DVT prophylaxis (e.g., chemoprophylaxis as opposed to mechanical measures) of longer duration—up to 28 days following general surgery and up to 35 days after orthopedic procedures.10
Perioperative Corticosteroids
Corticosteroid therapy in excess of prednisone 5 mg/day or equivalent for more than five days in the 30 days preceding surgery might predispose patients to acute adrenal insufficiency in the perioperative period. Surgical procedures typically result in cortisol release of 50-150 mg/day, which returns to baseline within 48 hours.11 Therefore, the recommendation is to continue a patient’s baseline steroid dose and supplement it with stress-dose steroids tailored to the severity of operative stress (see Table 2, above).
Mineralocorticoid supplementation is not necessary, because endogenous production is not suppressed by corticosteroid therapy.11 Although a recent systematic review suggests that routine stress-dose steroids might not be indicated, high-quality prospective data are needed before abandoning this strategy due to complications of acute adrenal insufficiency compared to the risk of a brief corticosteroid burst.
Non-Steroidal Anti-Inflammatory Drugs (NSAIDs)
Nonselective cyclooxygenase (COX) inhibitors reversibly decrease platelet aggregation only while the drug is present in the circulation and should be stopped one to three days before surgery due to risk of bleeding.
Selective COX-2 inhibitors do not significantly alter platelet aggregation and can be continued for opioid-sparing perioperative pain control.
Both COX-2-selective and nonselective inhibitors should be held if there are concerns for impaired renal function.
Disease-Modifying Antirheumatic Drugs (DMARDs) and Biological Response Modifiers (BRMs)
Methotrexate increases the risk of wound infections and dehiscence. However, this is offset by a decreased risk of post-operative disease flares with continued use. It can be continued unless the patient has medical comorbidities, advanced age, or chronic therapy with more than 10 mg/day of prednisone, in which case the drug should be stopped two weeks before surgery.12
Azathioprine, leflunomide, and sulfasalazine are renally cleared with a risk of myelosuppression; all of these medications should be stopped. Long half-life of leflunomide necessitates stopping it two weeks before surgery; azathioprine and sulfasalazine can be stopped one day in advance. The drugs can be restarted three days after surgery, assuming stable renal function.13
Anti-TNF-α (adalimumab, etanercept, infliximab), IL1 antagonist (anakinra), and anti-CD20 (rituximab) agents should be stopped one week before surgery and resumed 1-2 weeks afterward, unless risk of complications from disease flareup outweighs the concern for wound infections and dehiscence.14
Herbal Medicines
It is estimated that as much as a third of the U.S. population uses herbal medicines. These substances can result in perioperative hemodynamic instability (ephedra, ginseng, ma huang), hypoglycemia (ginseng), immunosuppression (echinacea, when taken for more than eight weeks), abnormal bleeding (garlic, ginkgo, ginseng), and prolongation of anesthesia (kava, St. John’s wort, valerian). All of these herbal medicine should be stopped one to two weeks before surgery.15,16
Back to the Case
The patient’s Carbidopa/Levodopa should be continued. Celecoxib can be continued if her renal function in stable. If aspirin is taken for a history of coronary artery disease or percutaneous coronary intervention, it should be continued, if possible. Clonidine should be continued or changed to a patch if an extended NPO period is anticipated. Ginkgo, lisinopril, and sulfasalazine should be stopped.
Hospitalization does not provide the luxury of stopping estradiol in advance, so it might be continued with chemical DVT prophylaxis for up to 35 days after surgery. The patient should receive 50-75 mg of IV hydrocortisone during surgery and an additional 25 mg the following day, in addition to her usual prednisone 10 mg/day. She can either receive half her usual NPH dose the morning of surgery with a 5% dextrose infusion in the operating room, or the NPH should be held altogether.
Bottom Line
Perioperative medication use should be tailored to each patient, balancing the risks and benefits of individual drugs. High-quality trials are needed to provide more robust clinical guidelines. TH
Dr. Levin is a hospitalist at the University of Colorado Denver.
References
- Fleisher LA, Beckman JA, Brown KA, et al. ACC/AHA 2007 Guidelines on Perioperative Cardiovascular Evaluation and Care for Noncardiac Surgery: Executive Summary: A Report of the American College of Cardiology/American Heart Association Task Force on Practice Guidelines (Writing Committee to Revise the 2002 Guidelines on Perioperative Cardiovascular Evaluation for Noncardiac Surgery): Developed in Collaboration With the American Society of Echocardiography, American Society of Nuclear Cardiology, Heart Rhythm Society, Society of Cardiovascular Anesthesiologists, Society for Cardiovascular Angiography and Interventions, Society for Vascular Medicine and Biology, and Society for Vascular Surgery. Circulation. 2007;116(17):1971-1996.
- Schouten O, Hoeks SE, Welten GM, et al. Effect of statin withdrawal on frequency of cardiac events after vascular surgery. Am J Cardiol. 2007;100(2):316-320.
- Spell NO III. Stopping and restarting medications in the perioperative period. Med Clin North Am. 2001;85(5):1117-1128.
- Rosenman DJ, McDonald FS, Ebbert JO, Erwin PJ, LaBella M, Montori VM. Clinical consequences of withholding versus administering renin-angiotensin-aldosterone system antagonists in the preoperative period. J Hosp Med. 2008;3(4):319-325.
- Arora P, Rajagopalam S, Ranjan R, et al. Preoperative use of angiotensin-converting enzyme inhibitors/ angiotensin receptor blockers is associated with increased risk for acute kidney injury after cardiovascular surgery. Clin J Am Soc Nephrol. 2008;3(5):1266-1273.
- Benedetto U, Sciarretta S, Roscitano A, et al. Preoperative Angiotensin-converting enzyme inhibitors and acute kidney injury after coronary artery bypass grafting. Ann Thorac Surg. 2008;86(4):1160-1165.
- Pass SE, Simpson RW. Discontinuation and reinstitution of medications during the perioperative period. Am J Health Syst Pharm. 2004;61(9):899-914.
- Kohl BA, Schwartz S. Surgery in the patient with endocrine dysfunction. Med Clin North Am. 2009;93(5):1031-1047.
- Grady D, Wenger NK, Herrington D, et al. Postmenopausal hormone therapy increases risk for venous thromboembolic disease: The Heart and Estrogen/progestin Replacement Study. Ann Intern Med. 2000;132(9):689-696.
- Hirsh J, Guyatt G, Albers GW, Harrington R, Schünemann HJ; American College of Chest Physicians. Executive summary: American College of Chest Physicians evidence-based clinical practice guidelines (8th edition). Chest. 2008;133(6 Suppl):71S-109S.
- Axelrod L. Perioperative management of patients treated with glucocorticoids. Endocrinol Metab Clin North Am. 2003;32(2):367-383.
- Marik PE, Varon J. Requirement of perioperative stress doses of corticosteroids: a systematic review of the literature. Arch Surg. 2008;143(12):1222-1226.
- Rosandich PA, Kelley JT III, Conn DL. Perioperative management of patients with rheumatoid arthritis in the era of biologic response modifiers. Curr Opin Rheumatol. 2004;16(3):192-198.
- Saag KG, Teng GG, Patkar NM, et al. American College of Rheumatology 2008 recommendations for the use of nonbiologic and biologic disease-modifying antirheumatic drugs in rheumatoid arthritis. Arthritis Rheum. 2008;59(6):762-784.
- Ang-Lee MK, Moss J, Yuan CS. Herbal medicines and perioperative care. JAMA. 2001;286(2):208-216.
- Hodges PJ, Kam PC. The peri-operative implications of herbal medicines. Anaesthesia. 2002;57(9):889-899.
In the Literature
In This Edition
Literature at a Glance
A guide to this month’s studies
- CPOE and quality outcomes
- Outcomes of standardized management of endocarditis
- Effect of tPA three to 4.5 hours after stroke onset
- Failure to notify patients of significant test results
- PFO repair and stroke rate
- Predictors of delay in defibrillation for in-hospital arrest
- H. pylori eradication and risk of future gastric cancer
- Bleeding risk with fondaparinux vs. enoxaparin in ACS
- Perceptions of physician ability to predict medical futility
CPOE Is Associated with Improvement in Quality Measures
Clinical question: Is computerized physician order entry (CPOE) associated with improved outcomes across a large, nationally representative sample of hospitals?
Background: Several single-institution studies suggest CPOE leads to better outcomes in quality measures for heart failure, acute myocardial infarction, and pneumonia as defined by the Hospital Quality Alliance (HQA) initiative, led by the Centers for Medicare and Medicaid Services (CMS). Little systematic information is known about the effects of CPOE on quality of care.
Study design: Cross-sectional study.
Setting: The Health Information Management System Society (HIMSS) analytics database of 3,364 hospitals throughout the U.S.
Synopsis: Of the hospitals that reported CPOE utilization to HIMSS, 264 (7.8%) fully implement CPOE throughout their institutions. These CPOE hospitals outperformed their peers on five of 11 quality measures related to ordering medications, and in one of nine non-medication-related measures. No difference was noted in the other measures, except CPOE hospitals were less effective at providing antibiotics within four hours of pneumonia diagnosis. Hospitals that utilized CPOE were generally academic, larger, and nonprofit. After adjusting for these differences, benefits were still preserved.
The authors indicate that the lack of systematic outperformance by CPOE hospitals in all 20 of the quality categories inherently suggests that other factors (e.g., concomitant QI efforts) are not affecting these results. Given the observational nature of this study, no causal relationship can be established between CPOE and the observed benefits. CPOE might represent the commitment of certain hospitals to quality measures, but further study is needed.
Bottom line: Enhanced compliance in several CMS-established quality measures is seen in hospitals that utilize CPOE throughout their institutions.
Citation: Yu FB, Menachemi N, Berner ES, Allison JJ, Weissman NW, Houston TK. Full implementation of computerized physician order entry and medication-related quality outcomes: a study of 3,364 hospitals. Am J Med Qual. 2009;24(4):278-286.
Standardized Management of Endocarditis Leads to Significant Mortality Benefit
Clinical question: Does a standardized approach to the treatment of infective endocarditis reduce mortality and morbidity?
Background: Despite epidemiological changes to the inciting bacteria and improvements in available antibiotics, mortality and morbidity associated with endocarditis remain high. The contribution of inconsistent or inaccurate treatment of endocarditis is unclear.
Study design: Case series with historical controls from 1994 to 2001, compared with protocolized patients from 2002 to 2006.
Setting: Single teaching tertiary-care hospital in France.
Synopsis: The authors established a diagnostic protocol for infectious endocarditis from 1994 to 2001 (period 1) and established a treatment protocol from 2002 to 2006 (period 2). Despite a statistically significant sicker population (older, higher comorbidities, higher coagulase-negative staphylococcal infections, and fewer healthy valves), the period-2 patients had a dramatically lower mortality rate of 8.2% (P<0.001), compared with 18.5% in period-1 patients. Fewer episodes of renal failure, organ failure, and deaths associated with embolism were noted in period 2.
Whether these results are due to more frequent care, more aggressive care (patients were “summoned” if they did not show for appointments), standardized medication and surgical options, or the effects of long-term collaboration, these results appear durable, remarkable, and reproducible.
This study is limited by its lack of randomization and extensive time frame, with concomitant changes in medical treatment and observed infectious organisms.
Bottom line: Implementation of a standardized approach to endocarditis has significant benefit on mortality and morbidity.
Citation: Botelho-Nevers E, Thuny F, Casalta JP, et al. Dramatic reduction in infective endocarditis-related mortality with a management-based approach. Arch Intern Med. 2009;169(14):1290-1298.
Treatment with tPA in the Three- to 4.5-Hour Time Window after Stroke Is Beneficial
Clinical question: What is the effect of tissue plasminogen activator (tPA) on outcomes in patients treated in the three- to 4.5-hour window after stroke?
Background: The third European Cooperative Acute Stroke Study 3 (ECASS-3) demonstrated benefit of treatment of acute stroke with tPA in the three- to 4.5-hour time window. Prior studies, however, did not show superiority of tPA over placebo, and there is a lack of a confirmatory randomized, controlled trial of tPA in this time frame.
Study design: Meta-analysis of randomized, controlled trials.
Setting: Four studies involving 1,622 patients who were treated with intravenous tPA for acute ischemic stroke from three to 4.5 hours after stroke compared with placebo.
Synopsis: Of the randomized, controlled trials of intravenous tPA for treatment of acute ischemic stroke from three to 4.5 hours after stroke, four trials (ECASS-1, ECASS-2, ECASS-3, and ATLANTIS) were included in the analysis. Treatment with tPA in the three- to 4.5-hour time window is associated with increased favorable outcomes based on the global outcome measure (OR 1.31; 95% CI: 1.10-1.56, P=0.002) and the modified Rankin Scale (OR 1.31; 95% CI: 1.07-1.59, P=0.01), compared with placebo. The 90-day mortality rate was not significantly different between the treatment and placebo groups (OR 1.04; 95% CI 0.75-1.43, P=0.83).
Due to the relatively high dose of tPA (1.1 mg/kg) administered in the ECASS-1 trial, a separate meta-analysis looking at the other three trials (tPA dose of 0.9 mg/kg) was conducted, and the favorable outcome with tPA remained.
Bottom line: Treatment of acute ischemic stroke with tPA in the three- to 4.5-hour time window results in an increased rate of favorable functional outcomes without a significant difference in mortality.
Citation: Lansberg MG, Bluhmki E, Thijs VN. Efficacy and safety of tissue plasminogen activator 3 to 4.5 hours after acute ischemic stroke: a metaanalysis. Stroke. 2009;40(7):2438-2441.
Outpatients Often Are Not Notified of Clinically Significant Test Results
Clinical question: How frequently do primary-care physicians (PCPs) fail to inform patients of clinically significant outpatient test results?
Background: Diagnostic errors are the most common cause of malpractice claims in the U.S. It is unclear how often providers fail to either inform patients of abnormal test results or document that patients have been notified.
Study design: Retrospective chart review.
Setting: Twenty-three primary-care practices: 19 private, four academic.
Synopsis: More than 5,400 charts were reviewed, and 1,889 abnormal test results were identified in this study. Failure to inform or document notification was identified in 135 cases (7.1%). The failure rates in the practices ranged from 0.0% to 26.2%. Practices with the best processes for managing test results had the lowest failure rates; these processes included: all results being routed to the responsible physician; the physician signing off on all results; the practice informing patients of all results, both normal and abnormal; documenting when the patient is informed; and instructing patients to call if not notified of test results within a certain time interval.
Limitations of this study include the potential of over- or underreporting of failures to inform as a chart review was used, and only practices that agreed to participate were included.
Bottom line: Failure to notify outpatients of test results is common but can be minimized by creating a systematic management of test results that include best practices.
Citation: Casalino LP, Dunham D, Chin MH, et al. Frequency of failure to inform patients of clinically significant outpatient test results. Arch Intern Med. 2009;169(12):1123-1129.
Repair of Incidental PFO Discovered During Cardiothoracic Surgery Repair Increases Postoperative Stroke Risk
Clinical question: What is the impact of closing incidentally discovered patent foramen ovale (PFO) defects during cardiothoracic surgery?
Background: PFO’s role in cryptogenic stroke remains controversial. Incidental PFO is commonly detected by transesophageal echocardiography (TEE) during cardiothoracic surgery. Routine PFO closure has been recommended when almost no alteration of the surgical plan is required.
Study design: Retrospective chart review.
Setting: The Cleveland Clinic.
Synopsis: Between 1995 and 2006, 13,092 patients undergoing cardiothoracic surgery had TEE data with no previous diagnosis of PFO, but the review found that 2,277 (17%) had PFO discovered intraoperatively. Of these, 639 (28%) had the PFO repaired.
Patients with an intraoperative diagnosis of PFO had similar rates of in-hospital stroke and hospital death compared with those without PFO. Patients who had their PFO repaired had a greater in-hospital stroke risk (2.8% vs. 1.2%; P=0.04) compared with those with a non-repaired PFO, representing nearly 2.5 times greater odds of having an in-hospital stroke. No other difference was noted in perioperative outcomes for patients who underwent intraoperative repair compared with those who did not, including risk of in-hospital death, hospital length of stay, ICU length of stay, and time on cardiopulmonary bypass. Long-term analysis demonstrated that PFO repair was associated with no survival difference.
The study is limited by its retrospective nature.
Bottom line: Routine surgical closure of incidental PFO detected during intraoperative imaging should be discouraged.
Citation: Krasuski RA, Hart SA, Allen D, et al. Prevalence and repair of interoperatively diagnosed patent foramen ovale and association with perioperative outcomes and long-term survival. JAMA. 2009;302(3):290-297.
Hospital-Level Differences Are Strong Predictors of Time to Defibrillation Delay In Cardiac Arrest
Clinical question: What are the predictors of delay in the time to defibrillation after in-hospital cardiac arrest?
Background: Thirty percent of in-hospital cardiac arrests from ventricular arrhythmias are not treated within the American Heart Association’s recommendation of two minutes. This delay is associated with a 50% lower rate of in-hospital survival. Exploring the hospital-level variation in delays to defibrillation is a critical step toward sharing the best practices.
Study design: Retrospective review of registry data.
Setting: The National Registry of Cardiopulmonary Resuscitation (NRCPR) survey of 200 acute-care, nonpediatric hospitals.
Synopsis: The registry identified 7,479 patients who experienced cardiac arrest from ventricular tachycardia or pulseless ventricular fibrillation. The primary outcome was the hospital rate of delayed defibrillation (time to defibrillation > two minutes), which ranged from 2% to 51%.
Time to defibrillation was found to be a major predictor of survival after a cardiac arrest. Only bed volume and arrest location were associated with differences in rates of delayed defibrillation (lower rates in larger hospitals and in ICUs). The variability was not due to differences in patient characteristics, but was due to hospital-level effects. Academic status, geographical location, arrest volume, and daily admission volume did not affect the time to defibrillation.
The study was able to identify only a few facility characteristics that account for the variability between hospitals in the rate of delayed defibrillation. The study emphasizes the need for new approaches to identifying hospital innovations in process-of-care measures that are associated with improved performance in defibrillation times.
Bottom Line: Future research is needed to better understand the reason for the wide variation between hospitals in the rate of delayed defibrillation after in-hospital cardiac arrest.
Citation: Chan PS, Nichol G, Krumholz HM, Spertus JA, Nallamothu BK; American Heart Association National Registry of Cardiopulmonary Resuscitation (NRCPR) Investigators. Hospital variation in time to defibrillation after in-hospital cardiac arrest. Arch Intern Med. 2009;169(14):1265-1273.
Treating for H. Pylori Reduces the Risk for Developing Gastric Cancer in High-Risk Patients
Clinical question: In patients with high-baseline incidence of gastric cancer, does H. pylori eradication reduce the risk for developing gastric cancer?
Background: Gastric cancer remains a major health problem in Asia. The link of H. pylori and gastric cancer has been established, but it remains unclear whether treatment for H. pylori is effective primary prevention for the development of gastric cancer.
Study design: Meta-analysis of six studies.
Setting: All but one trial was performed in Asia.
Synopsis: Seven studies met inclusion criteria, one of which was excluded due to heterogeneity. The six remaining studies were pooled, with 37 of 3,388 (1.1%) treated patients developing a new gastric cancer, compared with 56 of 3,307 (1.7%) patients who received placebo or were in the control group (RR 0.65; 0.43-0.98). Most patients received gastric biopsy prior to enrollment, and most of those demonstrated gastric atrophy or intestinal metaplasia.
These patients, despite more advanced precancerous pathology findings, still benefited from eradication. The seventh study, which was excluded, enrolled patients with early gastric cancer; these patients still benefited from H. pylori eradication and, when included in the meta-analysis, the RR was even lower, 0.57 (0.49-0.81).
Only two trials were double-blinded, but all of the studies employed the same definition of gastric cancer and held to excellent data reporting standards. This study encourages screening and treatment in high-risk patients given the widespread incidence of H. pylori.
Bottom Line: Treatment of H. pylori reduces the risk of gastric cancer in high-risk patients.
Citation: Fuccio L, Zagari RM, Eusebi LH, et al. Meta-analysis: can Helicobacter pylori eradication treatment reduce the risk for gastric cancer? Ann Intern Med. 2009;151(2):121-128.
Patients on Anti-Platelet Agents with Acute Coronary Syndrome Have a Lower Bleeding Risk When Treated with Fondaparinux
Clinical question: Is there a difference in bleeding risk with fondaparinux and enoxaparin when used with GPIIb/IIIa inhibitors or thienopyridines in NSTEMI-ACS?
Background: The OASIS 5 study reported a 50% reduction in severe bleeding when comparing fondaparinux to enoxaparin in ACS while maintaining a similar efficacy. This subgroup analysis was performed to evaluate whether reduced bleeding risk with fondaparinux remains in patients treated with additional anti-platelet agents.
Study design: Subgroup analysis of a large, multicenter, randomized, double-blind trial.
Setting: Acute-care hospitals in North America, Eastern and Western Europe, Latin America, Australia, and Asia.
Synopsis: Patients with NSTE-ACS received either fondaparinux or enoxaparin and were treated with GPIIb/IIIa inhibitors or thienopyridines at the discretion of their physician. At 30 days, the fondaparinux group had similar efficacy and decreased bleeding risk in both the GPIIb/IIIa and the thienopyridine groups. Of the 3,630 patients in the GPIIb/IIIa group, the risk for major bleeding with fondaparinux was 5.2%, whereas the risk with enoxaparin was 8.3% (HR 0.61; P<0.001) compared with enoxaparin. Of the 1,352 patients treated with thienopyridines, the risk for major bleeding with fondaparinux was 3.4%, whereas the risk with enoxaparin was 5.4% (HR 0.62; P<0.001).
Bottom Line: This subgroup analysis suggests there are less-severe bleeding complications in patients treated with fondaparinux when compared with enoxaparin in the setting of cotreatment with GPIIb/IIIa inhibitors, thienopyridines, or both.
Citation: Jolly SS, Faxon DP, Fox KA, et al. Efficacy and safety of fondaparinux versus enoxaparin in patients with acute coronary syndromes treated with glycoprotein IIb/IIIa inhibitors of thienopyridines: results from the OASIS 5 (Fifth Organization to Assess Strategies in Ischemic Syndromes) trial. J Am Coll Cardiol. 2009;54(5):468-476.
Surrogate Decision-Makers Frequently Doubt Clinicians’ Ability to Predict Medical Futility
Clinical question: What attitudes do surrogate decision-makers hold toward clinicians’ predictions of medical futility in critically-ill patients?
Background: The clinical judgment of medical futility leading to the withdrawal of life-sustaining treatment—despite the objections of surrogate decision-makers—is controversial. Very little is known about how surrogate decision-makers view the futility rationale when physicians suggest limiting the use of life-sustaining treatment.
Study design: Multicenter, mixed, qualitative and quantitative study.
Setting: Three ICUs in three different California hospitals from 2006 to 2007.
Synopsis: Semi-structured interviews of surrogate decision-makers for 50 incapacitated, critically-ill patients were performed to ascertain their beliefs about medical futility in response to hypothetical situations. Of the surrogates surveyed, 64% expressed doubt about physicians’ futility predictions.
The interviewees gave four main reasons for their doubts. Two reasons not previously described were doubts about the accuracy of physicians’ predictions and the need for surrogates to see futility themselves. Previously described sources of conflict included a misunderstanding about prognosis and religious-based objections. Surrogates with religious objections were more likely to request continuation of life-sustaining treatments than those with secular or experiential objections (OR 4; 95% CI 1.2-14.0; P=0.03). Nearly a third (32%) of surrogates elected to continue life support with a <1% survival estimate; 18% elected to continue life support when physicians thought there was no chance of survival.
This study has several limitations: a small sample size, the use of hypothetical situations, and the inability to assess attitudes as they change over time.
Bottom line: The nature of surrogate decision-makers’ doubts about medical futility can help predict whether they accept predictions of medical futility from physicians.
Citation: Zier LS, Burack JH, Micco G, Chipman AK, Frank JA, White DB. Surrogate decision makers’ responses to physicians’ predictions of medical futility. Chest. 2009;136:110-117. TH
PEDIATRIC HM LITerature
House-Staff Signout Complexities Remain
By Mark Shen, MD

Clinical question: What are the characteristics of signout among house staff?
Background: Inadequate signout is a recognized contributor to medical errors. As care has become increasingly fragmented among house staff who must comply with work-hour restrictions, both the absolute number of signouts and the potential for incomplete transfer of information increase. Despite recent Joint Commission requirements to standardize handoffs, comprehensive analyses of the process remain scarce.
Study design: Quantitative and qualitative analysis of audiotaped oral internal-medicine signout.
Setting: Academic teaching hospital.
Synopsis: Audiotaped signout for eight internal-medicine house-staff teams during two time periods in 2006 were analyzed for content, clarity of language, and surrounding environment. Most signout (59.2%) did not include questions, and questioning of patient management was often indirect when it occurred. A spectrum of clarity existed from unclear anticipatory guidance to clear, concise instructions. Interruptions occurred less than 20% of the time. Familiarity with patients, sense of responsibility for patients, sequential signouts, experience, and comprehensiveness of the written form affected the content of the signout.
This study provides insight into the broad array of factors that affect signout. Despite the potential for interactive facilitation of understanding, the process is often one-sided and operator-dependent. Such systems-based factors as familiarity with patients and sequential signouts might affect quality, while cultural norms (such as sense of responsibility) also play a role.
Limitations of this study include the nonblinded observation method and the potential for institution-specific culture to limit applicability. Nonetheless, this study adds to literature painting a broader and complex picture of a routine hospital process often taken for granted.
Bottom line: Improving and standardizing handoffs requires attention to multifaceted domains that commonly affect complex human organizations.
Citation: Horwitz LI, Moin T, Krumholz HM, Wang L, Bradley EH. What are covering doctors told about their patients? Analysis of sign-out among internal medicine house staff. Qual Saf Health Care. 2009;18(4):248-255.
In This Edition
Literature at a Glance
A guide to this month’s studies
- CPOE and quality outcomes
- Outcomes of standardized management of endocarditis
- Effect of tPA three to 4.5 hours after stroke onset
- Failure to notify patients of significant test results
- PFO repair and stroke rate
- Predictors of delay in defibrillation for in-hospital arrest
- H. pylori eradication and risk of future gastric cancer
- Bleeding risk with fondaparinux vs. enoxaparin in ACS
- Perceptions of physician ability to predict medical futility
CPOE Is Associated with Improvement in Quality Measures
Clinical question: Is computerized physician order entry (CPOE) associated with improved outcomes across a large, nationally representative sample of hospitals?
Background: Several single-institution studies suggest CPOE leads to better outcomes in quality measures for heart failure, acute myocardial infarction, and pneumonia as defined by the Hospital Quality Alliance (HQA) initiative, led by the Centers for Medicare and Medicaid Services (CMS). Little systematic information is known about the effects of CPOE on quality of care.
Study design: Cross-sectional study.
Setting: The Health Information Management System Society (HIMSS) analytics database of 3,364 hospitals throughout the U.S.
Synopsis: Of the hospitals that reported CPOE utilization to HIMSS, 264 (7.8%) fully implement CPOE throughout their institutions. These CPOE hospitals outperformed their peers on five of 11 quality measures related to ordering medications, and in one of nine non-medication-related measures. No difference was noted in the other measures, except CPOE hospitals were less effective at providing antibiotics within four hours of pneumonia diagnosis. Hospitals that utilized CPOE were generally academic, larger, and nonprofit. After adjusting for these differences, benefits were still preserved.
The authors indicate that the lack of systematic outperformance by CPOE hospitals in all 20 of the quality categories inherently suggests that other factors (e.g., concomitant QI efforts) are not affecting these results. Given the observational nature of this study, no causal relationship can be established between CPOE and the observed benefits. CPOE might represent the commitment of certain hospitals to quality measures, but further study is needed.
Bottom line: Enhanced compliance in several CMS-established quality measures is seen in hospitals that utilize CPOE throughout their institutions.
Citation: Yu FB, Menachemi N, Berner ES, Allison JJ, Weissman NW, Houston TK. Full implementation of computerized physician order entry and medication-related quality outcomes: a study of 3,364 hospitals. Am J Med Qual. 2009;24(4):278-286.
Standardized Management of Endocarditis Leads to Significant Mortality Benefit
Clinical question: Does a standardized approach to the treatment of infective endocarditis reduce mortality and morbidity?
Background: Despite epidemiological changes to the inciting bacteria and improvements in available antibiotics, mortality and morbidity associated with endocarditis remain high. The contribution of inconsistent or inaccurate treatment of endocarditis is unclear.
Study design: Case series with historical controls from 1994 to 2001, compared with protocolized patients from 2002 to 2006.
Setting: Single teaching tertiary-care hospital in France.
Synopsis: The authors established a diagnostic protocol for infectious endocarditis from 1994 to 2001 (period 1) and established a treatment protocol from 2002 to 2006 (period 2). Despite a statistically significant sicker population (older, higher comorbidities, higher coagulase-negative staphylococcal infections, and fewer healthy valves), the period-2 patients had a dramatically lower mortality rate of 8.2% (P<0.001), compared with 18.5% in period-1 patients. Fewer episodes of renal failure, organ failure, and deaths associated with embolism were noted in period 2.
Whether these results are due to more frequent care, more aggressive care (patients were “summoned” if they did not show for appointments), standardized medication and surgical options, or the effects of long-term collaboration, these results appear durable, remarkable, and reproducible.
This study is limited by its lack of randomization and extensive time frame, with concomitant changes in medical treatment and observed infectious organisms.
Bottom line: Implementation of a standardized approach to endocarditis has significant benefit on mortality and morbidity.
Citation: Botelho-Nevers E, Thuny F, Casalta JP, et al. Dramatic reduction in infective endocarditis-related mortality with a management-based approach. Arch Intern Med. 2009;169(14):1290-1298.
Treatment with tPA in the Three- to 4.5-Hour Time Window after Stroke Is Beneficial
Clinical question: What is the effect of tissue plasminogen activator (tPA) on outcomes in patients treated in the three- to 4.5-hour window after stroke?
Background: The third European Cooperative Acute Stroke Study 3 (ECASS-3) demonstrated benefit of treatment of acute stroke with tPA in the three- to 4.5-hour time window. Prior studies, however, did not show superiority of tPA over placebo, and there is a lack of a confirmatory randomized, controlled trial of tPA in this time frame.
Study design: Meta-analysis of randomized, controlled trials.
Setting: Four studies involving 1,622 patients who were treated with intravenous tPA for acute ischemic stroke from three to 4.5 hours after stroke compared with placebo.
Synopsis: Of the randomized, controlled trials of intravenous tPA for treatment of acute ischemic stroke from three to 4.5 hours after stroke, four trials (ECASS-1, ECASS-2, ECASS-3, and ATLANTIS) were included in the analysis. Treatment with tPA in the three- to 4.5-hour time window is associated with increased favorable outcomes based on the global outcome measure (OR 1.31; 95% CI: 1.10-1.56, P=0.002) and the modified Rankin Scale (OR 1.31; 95% CI: 1.07-1.59, P=0.01), compared with placebo. The 90-day mortality rate was not significantly different between the treatment and placebo groups (OR 1.04; 95% CI 0.75-1.43, P=0.83).
Due to the relatively high dose of tPA (1.1 mg/kg) administered in the ECASS-1 trial, a separate meta-analysis looking at the other three trials (tPA dose of 0.9 mg/kg) was conducted, and the favorable outcome with tPA remained.
Bottom line: Treatment of acute ischemic stroke with tPA in the three- to 4.5-hour time window results in an increased rate of favorable functional outcomes without a significant difference in mortality.
Citation: Lansberg MG, Bluhmki E, Thijs VN. Efficacy and safety of tissue plasminogen activator 3 to 4.5 hours after acute ischemic stroke: a metaanalysis. Stroke. 2009;40(7):2438-2441.
Outpatients Often Are Not Notified of Clinically Significant Test Results
Clinical question: How frequently do primary-care physicians (PCPs) fail to inform patients of clinically significant outpatient test results?
Background: Diagnostic errors are the most common cause of malpractice claims in the U.S. It is unclear how often providers fail to either inform patients of abnormal test results or document that patients have been notified.
Study design: Retrospective chart review.
Setting: Twenty-three primary-care practices: 19 private, four academic.
Synopsis: More than 5,400 charts were reviewed, and 1,889 abnormal test results were identified in this study. Failure to inform or document notification was identified in 135 cases (7.1%). The failure rates in the practices ranged from 0.0% to 26.2%. Practices with the best processes for managing test results had the lowest failure rates; these processes included: all results being routed to the responsible physician; the physician signing off on all results; the practice informing patients of all results, both normal and abnormal; documenting when the patient is informed; and instructing patients to call if not notified of test results within a certain time interval.
Limitations of this study include the potential of over- or underreporting of failures to inform as a chart review was used, and only practices that agreed to participate were included.
Bottom line: Failure to notify outpatients of test results is common but can be minimized by creating a systematic management of test results that include best practices.
Citation: Casalino LP, Dunham D, Chin MH, et al. Frequency of failure to inform patients of clinically significant outpatient test results. Arch Intern Med. 2009;169(12):1123-1129.
Repair of Incidental PFO Discovered During Cardiothoracic Surgery Repair Increases Postoperative Stroke Risk
Clinical question: What is the impact of closing incidentally discovered patent foramen ovale (PFO) defects during cardiothoracic surgery?
Background: PFO’s role in cryptogenic stroke remains controversial. Incidental PFO is commonly detected by transesophageal echocardiography (TEE) during cardiothoracic surgery. Routine PFO closure has been recommended when almost no alteration of the surgical plan is required.
Study design: Retrospective chart review.
Setting: The Cleveland Clinic.
Synopsis: Between 1995 and 2006, 13,092 patients undergoing cardiothoracic surgery had TEE data with no previous diagnosis of PFO, but the review found that 2,277 (17%) had PFO discovered intraoperatively. Of these, 639 (28%) had the PFO repaired.
Patients with an intraoperative diagnosis of PFO had similar rates of in-hospital stroke and hospital death compared with those without PFO. Patients who had their PFO repaired had a greater in-hospital stroke risk (2.8% vs. 1.2%; P=0.04) compared with those with a non-repaired PFO, representing nearly 2.5 times greater odds of having an in-hospital stroke. No other difference was noted in perioperative outcomes for patients who underwent intraoperative repair compared with those who did not, including risk of in-hospital death, hospital length of stay, ICU length of stay, and time on cardiopulmonary bypass. Long-term analysis demonstrated that PFO repair was associated with no survival difference.
The study is limited by its retrospective nature.
Bottom line: Routine surgical closure of incidental PFO detected during intraoperative imaging should be discouraged.
Citation: Krasuski RA, Hart SA, Allen D, et al. Prevalence and repair of interoperatively diagnosed patent foramen ovale and association with perioperative outcomes and long-term survival. JAMA. 2009;302(3):290-297.
Hospital-Level Differences Are Strong Predictors of Time to Defibrillation Delay In Cardiac Arrest
Clinical question: What are the predictors of delay in the time to defibrillation after in-hospital cardiac arrest?
Background: Thirty percent of in-hospital cardiac arrests from ventricular arrhythmias are not treated within the American Heart Association’s recommendation of two minutes. This delay is associated with a 50% lower rate of in-hospital survival. Exploring the hospital-level variation in delays to defibrillation is a critical step toward sharing the best practices.
Study design: Retrospective review of registry data.
Setting: The National Registry of Cardiopulmonary Resuscitation (NRCPR) survey of 200 acute-care, nonpediatric hospitals.
Synopsis: The registry identified 7,479 patients who experienced cardiac arrest from ventricular tachycardia or pulseless ventricular fibrillation. The primary outcome was the hospital rate of delayed defibrillation (time to defibrillation > two minutes), which ranged from 2% to 51%.
Time to defibrillation was found to be a major predictor of survival after a cardiac arrest. Only bed volume and arrest location were associated with differences in rates of delayed defibrillation (lower rates in larger hospitals and in ICUs). The variability was not due to differences in patient characteristics, but was due to hospital-level effects. Academic status, geographical location, arrest volume, and daily admission volume did not affect the time to defibrillation.
The study was able to identify only a few facility characteristics that account for the variability between hospitals in the rate of delayed defibrillation. The study emphasizes the need for new approaches to identifying hospital innovations in process-of-care measures that are associated with improved performance in defibrillation times.
Bottom Line: Future research is needed to better understand the reason for the wide variation between hospitals in the rate of delayed defibrillation after in-hospital cardiac arrest.
Citation: Chan PS, Nichol G, Krumholz HM, Spertus JA, Nallamothu BK; American Heart Association National Registry of Cardiopulmonary Resuscitation (NRCPR) Investigators. Hospital variation in time to defibrillation after in-hospital cardiac arrest. Arch Intern Med. 2009;169(14):1265-1273.
Treating for H. Pylori Reduces the Risk for Developing Gastric Cancer in High-Risk Patients
Clinical question: In patients with high-baseline incidence of gastric cancer, does H. pylori eradication reduce the risk for developing gastric cancer?
Background: Gastric cancer remains a major health problem in Asia. The link of H. pylori and gastric cancer has been established, but it remains unclear whether treatment for H. pylori is effective primary prevention for the development of gastric cancer.
Study design: Meta-analysis of six studies.
Setting: All but one trial was performed in Asia.
Synopsis: Seven studies met inclusion criteria, one of which was excluded due to heterogeneity. The six remaining studies were pooled, with 37 of 3,388 (1.1%) treated patients developing a new gastric cancer, compared with 56 of 3,307 (1.7%) patients who received placebo or were in the control group (RR 0.65; 0.43-0.98). Most patients received gastric biopsy prior to enrollment, and most of those demonstrated gastric atrophy or intestinal metaplasia.
These patients, despite more advanced precancerous pathology findings, still benefited from eradication. The seventh study, which was excluded, enrolled patients with early gastric cancer; these patients still benefited from H. pylori eradication and, when included in the meta-analysis, the RR was even lower, 0.57 (0.49-0.81).
Only two trials were double-blinded, but all of the studies employed the same definition of gastric cancer and held to excellent data reporting standards. This study encourages screening and treatment in high-risk patients given the widespread incidence of H. pylori.
Bottom Line: Treatment of H. pylori reduces the risk of gastric cancer in high-risk patients.
Citation: Fuccio L, Zagari RM, Eusebi LH, et al. Meta-analysis: can Helicobacter pylori eradication treatment reduce the risk for gastric cancer? Ann Intern Med. 2009;151(2):121-128.
Patients on Anti-Platelet Agents with Acute Coronary Syndrome Have a Lower Bleeding Risk When Treated with Fondaparinux
Clinical question: Is there a difference in bleeding risk with fondaparinux and enoxaparin when used with GPIIb/IIIa inhibitors or thienopyridines in NSTEMI-ACS?
Background: The OASIS 5 study reported a 50% reduction in severe bleeding when comparing fondaparinux to enoxaparin in ACS while maintaining a similar efficacy. This subgroup analysis was performed to evaluate whether reduced bleeding risk with fondaparinux remains in patients treated with additional anti-platelet agents.
Study design: Subgroup analysis of a large, multicenter, randomized, double-blind trial.
Setting: Acute-care hospitals in North America, Eastern and Western Europe, Latin America, Australia, and Asia.
Synopsis: Patients with NSTE-ACS received either fondaparinux or enoxaparin and were treated with GPIIb/IIIa inhibitors or thienopyridines at the discretion of their physician. At 30 days, the fondaparinux group had similar efficacy and decreased bleeding risk in both the GPIIb/IIIa and the thienopyridine groups. Of the 3,630 patients in the GPIIb/IIIa group, the risk for major bleeding with fondaparinux was 5.2%, whereas the risk with enoxaparin was 8.3% (HR 0.61; P<0.001) compared with enoxaparin. Of the 1,352 patients treated with thienopyridines, the risk for major bleeding with fondaparinux was 3.4%, whereas the risk with enoxaparin was 5.4% (HR 0.62; P<0.001).
Bottom Line: This subgroup analysis suggests there are less-severe bleeding complications in patients treated with fondaparinux when compared with enoxaparin in the setting of cotreatment with GPIIb/IIIa inhibitors, thienopyridines, or both.
Citation: Jolly SS, Faxon DP, Fox KA, et al. Efficacy and safety of fondaparinux versus enoxaparin in patients with acute coronary syndromes treated with glycoprotein IIb/IIIa inhibitors of thienopyridines: results from the OASIS 5 (Fifth Organization to Assess Strategies in Ischemic Syndromes) trial. J Am Coll Cardiol. 2009;54(5):468-476.
Surrogate Decision-Makers Frequently Doubt Clinicians’ Ability to Predict Medical Futility
Clinical question: What attitudes do surrogate decision-makers hold toward clinicians’ predictions of medical futility in critically-ill patients?
Background: The clinical judgment of medical futility leading to the withdrawal of life-sustaining treatment—despite the objections of surrogate decision-makers—is controversial. Very little is known about how surrogate decision-makers view the futility rationale when physicians suggest limiting the use of life-sustaining treatment.
Study design: Multicenter, mixed, qualitative and quantitative study.
Setting: Three ICUs in three different California hospitals from 2006 to 2007.
Synopsis: Semi-structured interviews of surrogate decision-makers for 50 incapacitated, critically-ill patients were performed to ascertain their beliefs about medical futility in response to hypothetical situations. Of the surrogates surveyed, 64% expressed doubt about physicians’ futility predictions.
The interviewees gave four main reasons for their doubts. Two reasons not previously described were doubts about the accuracy of physicians’ predictions and the need for surrogates to see futility themselves. Previously described sources of conflict included a misunderstanding about prognosis and religious-based objections. Surrogates with religious objections were more likely to request continuation of life-sustaining treatments than those with secular or experiential objections (OR 4; 95% CI 1.2-14.0; P=0.03). Nearly a third (32%) of surrogates elected to continue life support with a <1% survival estimate; 18% elected to continue life support when physicians thought there was no chance of survival.
This study has several limitations: a small sample size, the use of hypothetical situations, and the inability to assess attitudes as they change over time.
Bottom line: The nature of surrogate decision-makers’ doubts about medical futility can help predict whether they accept predictions of medical futility from physicians.
Citation: Zier LS, Burack JH, Micco G, Chipman AK, Frank JA, White DB. Surrogate decision makers’ responses to physicians’ predictions of medical futility. Chest. 2009;136:110-117. TH
PEDIATRIC HM LITerature
House-Staff Signout Complexities Remain
By Mark Shen, MD
Clinical question: What are the characteristics of signout among house staff?
Background: Inadequate signout is a recognized contributor to medical errors. As care has become increasingly fragmented among house staff who must comply with work-hour restrictions, both the absolute number of signouts and the potential for incomplete transfer of information increase. Despite recent Joint Commission requirements to standardize handoffs, comprehensive analyses of the process remain scarce.
Study design: Quantitative and qualitative analysis of audiotaped oral internal-medicine signout.
Setting: Academic teaching hospital.
Synopsis: Audiotaped signout for eight internal-medicine house-staff teams during two time periods in 2006 were analyzed for content, clarity of language, and surrounding environment. Most signout (59.2%) did not include questions, and questioning of patient management was often indirect when it occurred. A spectrum of clarity existed from unclear anticipatory guidance to clear, concise instructions. Interruptions occurred less than 20% of the time. Familiarity with patients, sense of responsibility for patients, sequential signouts, experience, and comprehensiveness of the written form affected the content of the signout.
This study provides insight into the broad array of factors that affect signout. Despite the potential for interactive facilitation of understanding, the process is often one-sided and operator-dependent. Such systems-based factors as familiarity with patients and sequential signouts might affect quality, while cultural norms (such as sense of responsibility) also play a role.
Limitations of this study include the nonblinded observation method and the potential for institution-specific culture to limit applicability. Nonetheless, this study adds to literature painting a broader and complex picture of a routine hospital process often taken for granted.
Bottom line: Improving and standardizing handoffs requires attention to multifaceted domains that commonly affect complex human organizations.
Citation: Horwitz LI, Moin T, Krumholz HM, Wang L, Bradley EH. What are covering doctors told about their patients? Analysis of sign-out among internal medicine house staff. Qual Saf Health Care. 2009;18(4):248-255.
Dr. Flanders discusses the challenges of hospitalized patient care
Scott Flanders, MD, FHM, director of the hospitalist division, University of Michigan Health System, Ann Arbor; thinks HM has tackled many of the patient-safety issues noted in the 1999 IOM report. He also says HM should continue to redesign strategies to continue to improve outcomes; "This is a long road—a marathon, not a sprint."
Click here to listen to the audio file.
Scott Flanders, MD, FHM, director of the hospitalist division, University of Michigan Health System, Ann Arbor; thinks HM has tackled many of the patient-safety issues noted in the 1999 IOM report. He also says HM should continue to redesign strategies to continue to improve outcomes; "This is a long road—a marathon, not a sprint."