“Plane down, mass casualties possible; initiate disaster plan.”
The page interrupted my evening out with friends a few Saturday nights ago. Looking up from my dinner, I noticed the restaurant television had cut away to a news story at Denver International Airport. Continental Flight 1404, en route to Houston, had crashed during takeoff, belly-flopping to a fiery rest a few hundred yards off the runway. The airport is about 10 miles from the nearest hospital—mine.
The situation ended considerably better than originally expected. Thirty-eight people were treated at several Denver hospitals, 11 of them at my hospital, with most patients discharged from the emergency department. No one died. The case remains under review, and little is known about the cause of the crash.
Round Two
“Give me a call. I need to talk to you urgently.”
That page arrived the following Monday morning. It was from a co-worker. There had been an unexpected bad outcome in a young male patient. The hospital’s quality and risk management group had found out about the case and called for a peer review. My colleague was scared; would he be publicly criticized? Punished? Fired?
If we endeavor to fundamentally enhance the safety of hospital care, we must allow providers to openly discuss errors without fear of rebuke.
The patient had been admitted with a chronic disease flare-up. He was on the mend after receiving an increased dose of medication. The night before he was scheduled to be discharged, he developed a new symptom, was evaluated by the cross-cover team, and a plan was set in motion. However, a critical lab result, which became available overnight, mistakenly was not called to the provider and went unnoticed by the primary team that triaged the patient to the end of the team’s rounds. By then, he was in extremis.
Getty Images
Remains of the Boeing 737 that veered off a runway Dec. 20 in Denver. Miraculously, none of the 105 aboard were killed in the accident.
Planes and Patients
The proximity of these two events provoked comparisons.
By now, comparing healthcare to the aviation industry has become cliché. Both industries demand highly trained and skilled conductors; errors in both industries can result in death; both depend on technology; and both have turned to systems engineering to improve efficiencies and reduce mistakes. This is where the two industries diverge, and I think we get it wrong in medicine.
In aviation, there are very proscriptive algorithms that must be followed, and much of a pilot’s work is under constant scrutiny by air traffic controllers and data recorders. A deviation in protocol rarely goes unnoticed. Errors are systematically compiled, scrutinized, and compartmentalized, with the aim of further refining systems to reduce the likelihood of future errors. Although blame is often prescribed, it is in the context of improving the system. Thus, the aviation industry is awash with data to inform and fuel its systems engineering.
Meanwhile, in medicine our indelible sense of autonomy breeds variability, which is not only tolerated, but often goes unnoticed. Further, we employ a model of error analysis that focuses on affixing blame, as if somehow culpability will prevent future errors. Someone made an error, a bad outcome ensued, and the culprit must be identified and punished. This results in reprimand, remediation, or banishment from the medical staff. At times, this is an appropriate response, as some errors are so egregious or indicative of a chronic problem. More often, the punitive process misses the mark because it focuses on blame instead of prevention of the next error. Unlike the aviation industry, this leaves medicine bereft of data for improving our care systems.
“Blame and Punish” Doesn’t Work
There are two problems with the “blame and punish” approach. First, it is predicated on the belief that providers make errors because they are poorly trained, inept, or just plain careless. Sometimes this is the case.
However, the vast majority of peer reviews that I’ve participated in involved an error performed by extremely well trained, highly skilled clinicians with the highest level of integrity and vigilance. The real problem lies in the human condition.
Humans make mistakes. Always have, always will.
In college, I worked summers in a factory that applied coating to paper. This combined colossal machines spinning at breakneck speeds, huge rolls of paper, and hands—a recipe for handless employees. But accidents rarely happened. Over time, the mill engineers had designed systems so foolproof that the workers couldn’t chop their hands off, even if they wanted to. This level of safety was achieved, in principle, by learning how errors were made so that future errors could be prevented. It was not achieved by blaming handless employees. This paper-plant process recognizes the fallible nature of human beings; it’s the same recognition we need in medicine.
Whether we commit a systems error (e.g., the lab test results arrived after the patient was discharged), a cognitive error (e.g., I continue to believe this pulmonary embolism is pneumonia because my night-coverage partner signed it out as pneumonia), or simply a human error (e.g., the lab forgot to call a critical result to the ordering physician), we work in systems that often result in errors. And the only meaningful hope we have to reduce errors depends on our ability to identify them and build systems so safe that we couldn’t hurt a patient, even if we tried.
This leads to the second problem with the blame-and-punish mentality: It breeds concealment of errors, as providers become reticent to expose mistakes for fear of retribution. Thus, an important pipeline of information about system deficiencies dries up, and we are left to suffer the same cycle of errors.
Budging the quality and patient-safety needle will require a culture that freely and openly admits mistakes in order to analyze and prevent future mistakes. This is inherently difficult for most of us to do, and next to impossible when we fear reprimand. Then again, if we endeavor to fundamentally enhance the safety of hospital care, we must allow providers to openly discuss errors without fear of rebuke. Accomplishing this will require understanding, leadership and action—and it starts with each of us.
Anything short of this will just result in more bad pages. TH
Dr. Glasheen is associate professor of medicine at the University of Colorado Denver, where he serves as director of Hospital Medicine and the Hospitalist Training Program, and as associate program director of the Internal Medicine Residency Program.
Round One
“Plane down, mass casualties possible; initiate disaster plan.”
The page interrupted my evening out with friends a few Saturday nights ago. Looking up from my dinner, I noticed the restaurant television had cut away to a news story at Denver International Airport. Continental Flight 1404, en route to Houston, had crashed during takeoff, belly-flopping to a fiery rest a few hundred yards off the runway. The airport is about 10 miles from the nearest hospital—mine.
The situation ended considerably better than originally expected. Thirty-eight people were treated at several Denver hospitals, 11 of them at my hospital, with most patients discharged from the emergency department. No one died. The case remains under review, and little is known about the cause of the crash.
Round Two
“Give me a call. I need to talk to you urgently.”
That page arrived the following Monday morning. It was from a co-worker. There had been an unexpected bad outcome in a young male patient. The hospital’s quality and risk management group had found out about the case and called for a peer review. My colleague was scared; would he be publicly criticized? Punished? Fired?
If we endeavor to fundamentally enhance the safety of hospital care, we must allow providers to openly discuss errors without fear of rebuke.
The patient had been admitted with a chronic disease flare-up. He was on the mend after receiving an increased dose of medication. The night before he was scheduled to be discharged, he developed a new symptom, was evaluated by the cross-cover team, and a plan was set in motion. However, a critical lab result, which became available overnight, mistakenly was not called to the provider and went unnoticed by the primary team that triaged the patient to the end of the team’s rounds. By then, he was in extremis.
Getty Images
Remains of the Boeing 737 that veered off a runway Dec. 20 in Denver. Miraculously, none of the 105 aboard were killed in the accident.
Planes and Patients
The proximity of these two events provoked comparisons.
By now, comparing healthcare to the aviation industry has become cliché. Both industries demand highly trained and skilled conductors; errors in both industries can result in death; both depend on technology; and both have turned to systems engineering to improve efficiencies and reduce mistakes. This is where the two industries diverge, and I think we get it wrong in medicine.
In aviation, there are very proscriptive algorithms that must be followed, and much of a pilot’s work is under constant scrutiny by air traffic controllers and data recorders. A deviation in protocol rarely goes unnoticed. Errors are systematically compiled, scrutinized, and compartmentalized, with the aim of further refining systems to reduce the likelihood of future errors. Although blame is often prescribed, it is in the context of improving the system. Thus, the aviation industry is awash with data to inform and fuel its systems engineering.
Meanwhile, in medicine our indelible sense of autonomy breeds variability, which is not only tolerated, but often goes unnoticed. Further, we employ a model of error analysis that focuses on affixing blame, as if somehow culpability will prevent future errors. Someone made an error, a bad outcome ensued, and the culprit must be identified and punished. This results in reprimand, remediation, or banishment from the medical staff. At times, this is an appropriate response, as some errors are so egregious or indicative of a chronic problem. More often, the punitive process misses the mark because it focuses on blame instead of prevention of the next error. Unlike the aviation industry, this leaves medicine bereft of data for improving our care systems.
“Blame and Punish” Doesn’t Work
There are two problems with the “blame and punish” approach. First, it is predicated on the belief that providers make errors because they are poorly trained, inept, or just plain careless. Sometimes this is the case.
However, the vast majority of peer reviews that I’ve participated in involved an error performed by extremely well trained, highly skilled clinicians with the highest level of integrity and vigilance. The real problem lies in the human condition.
Humans make mistakes. Always have, always will.
In college, I worked summers in a factory that applied coating to paper. This combined colossal machines spinning at breakneck speeds, huge rolls of paper, and hands—a recipe for handless employees. But accidents rarely happened. Over time, the mill engineers had designed systems so foolproof that the workers couldn’t chop their hands off, even if they wanted to. This level of safety was achieved, in principle, by learning how errors were made so that future errors could be prevented. It was not achieved by blaming handless employees. This paper-plant process recognizes the fallible nature of human beings; it’s the same recognition we need in medicine.
Whether we commit a systems error (e.g., the lab test results arrived after the patient was discharged), a cognitive error (e.g., I continue to believe this pulmonary embolism is pneumonia because my night-coverage partner signed it out as pneumonia), or simply a human error (e.g., the lab forgot to call a critical result to the ordering physician), we work in systems that often result in errors. And the only meaningful hope we have to reduce errors depends on our ability to identify them and build systems so safe that we couldn’t hurt a patient, even if we tried.
This leads to the second problem with the blame-and-punish mentality: It breeds concealment of errors, as providers become reticent to expose mistakes for fear of retribution. Thus, an important pipeline of information about system deficiencies dries up, and we are left to suffer the same cycle of errors.
Budging the quality and patient-safety needle will require a culture that freely and openly admits mistakes in order to analyze and prevent future mistakes. This is inherently difficult for most of us to do, and next to impossible when we fear reprimand. Then again, if we endeavor to fundamentally enhance the safety of hospital care, we must allow providers to openly discuss errors without fear of rebuke. Accomplishing this will require understanding, leadership and action—and it starts with each of us.
Anything short of this will just result in more bad pages. TH
Dr. Glasheen is associate professor of medicine at the University of Colorado Denver, where he serves as director of Hospital Medicine and the Hospitalist Training Program, and as associate program director of the Internal Medicine Residency Program.
Hospitals as major employers and community resources can do nothing but reflect the realities of our country’s recession, now in its second year. For hospitalists who are integral to a hospital’s performance and are, at the same time, dependent on the institution’s financial success, there is the shared concern often seen by passengers in a two-person airplane buffeted by storms and fierce winds.
Hospitals are hit by a variety of forces during recessions, including tightening credit, increased borrowing costs, reduced returns from investments, decreased philanthropic donations, and the unkindest cut of all: more patients with less ability to pay.
American hospitals, which employ more than 5 million people, have witnessed all these forces magnify the long-standing issue of under-reimbursements from Medicare and Medicaid, which generally don’t even cover the rising costs of labor and technology. In New Jersey, 47% of hospitals were in the red in 2007, and five of the state’s 79 acute-care hospitals closed in 2008.
Hospitalists can deliver just what we need today—efficient and effective care with appropriate use of resources, better hospital throughput, attention to safety, and measurable efforts to improve performance.
According to recent data, more than 65% of surveyed hospitals saw decreases in elective procedures and an increase in nonpaying patients. The hit to hospitals’ investments has mirrored the 401(k) crisis. More than 550 hospitals watched their recent investment declines combine for a total loss of $832 million in the third quarter of 2008, compared with a $396 million aggregate gain in the same time period in 2007. All this bad news led Moody’s to change its 12- to 18-month outlook for both profit and nonprofit hospitals from stable to negative due to increasing bad debt, credit tightening, and loss of investments.
Hospitals are keenly affected by local employment, too. When local businesses have layoffs, former employees often lose their insurance coverage. When companies cut back on expenses to hold on to their workers, often that translates into no health insurance or very high deductibles. When patients lose their jobs or their insurance, they stop getting preventive care; they stop buying prescriptions. The end result is increased ED visits and admissions for decompensated heart failure, flu that turns into pneumonia, or out-of-control diabetes.
More admissions might mean more business for hospitals and hospitalists, but it certainly does not mean more money. It likely means more no-pays and increasing bad debt. It means turning a precarious, marginally balanced bottom line into losses and layoffs.
As if that weren’t bad enough, 44 of our 50 states are operating in the red and looking at trimming big-ticket items to stem the losses. For most states, the budget items under scrutiny include education, prisons, and healthcare. Medicaid payments—already inadequate—are shrinking further at a time when more people need a safety net.
Prove Thy Worth
These are tough times to be running a hospital, but aren’t hospitalists, so dependent on the viability of their hospitals, also on a slippery slope—and running downhill? Actually, these tough times might make hospitalists—and our value—all the more important to their hospitals, helping administrators weather the storm and be resources for their healthcare communities.
Hospitalists can deliver just what we need today—efficient and effective care with appropriate use of resources, better hospital throughput, attention to safety, and measurable efforts to improve performance.
In addition, as primary-care physicians (PCPs), surgeons, and subspecialists retrench to stay away from no-pays so they can find a better payor mix in order to survive, patients keep coming to hospitals, and hospitalists are positioned to pick up the slack and jump right in. Obviously, there is the chance PCPs and others in difficult times might actually come back to inpatient care as office and procedure revenues dwindle, but this is less likely to affect hospitalists when we seem to always have far more work than we have staff or time to manage.
Change Agents
Times of crisis create opportunities for real change. President Obama and many key legislators and thought leaders have signaled a genuine desire to change a system that rewards performance (value-based purchasing) and bundles hospital and physician payments, which will be tied to key outcomes and performance. SHM has been able to show Washington decision-makers that hospitalists can reduce preventable deep vein thrombosis (DVT) in hospitalized patients from 50 per year to three per year. We have shown that hospitalists, using SHM’s BOOST protocols, can improve the discharge process, identify high-risk patients, and reduce ED visits and readmissions. This is just the type of system improvement that leads to better care at a lower cost—the Holy Grail in hard times.
Couple all this with the Institute of Medicine’s call to further reduce residency hours, which only leads to a greater need for hospitalists in teaching institutions, and there is an increasing demand for hospitalists seemingly everywhere. And even in a recession, high demand with a small supply leads to the need to nurture and reward hospitalists, especially those who are experienced and can deliver efficient and effective inpatient care.
At a national level, we will see experimentation with demonstration projects to look at rewarding performance and bundling payments for inpatient care. Similarly, hospitalists should be emboldened to use the current crisis to experiment locally by using teams of hospitalists, nurses, pharmacists, and case managers to revise the way care is delivered. There are opportunities to responsibly involve nurse practitioners and physician assistants as integral parts of your hospitalist team.
While the rest of medicine might be forced to look out for themselves in tough times, hospitalists, by their very positioning, must focus on the survival and improvement of the system, of their hospital, and of the healthcare community. In hospital medicine, we recognize that the days of “Lone Ranger” physicians carving out their own destinies are long gone. In many ways, physicians are intricately intertwined. And that forces us to survive or fail together. That will be hospitalists’ salvation in these hard times: knowing there are better times ahead for us, our hospitals, and our patients. TH
Larry Wellikson is CEO of SHM.
Hospitals as major employers and community resources can do nothing but reflect the realities of our country’s recession, now in its second year. For hospitalists who are integral to a hospital’s performance and are, at the same time, dependent on the institution’s financial success, there is the shared concern often seen by passengers in a two-person airplane buffeted by storms and fierce winds.
Hospitals are hit by a variety of forces during recessions, including tightening credit, increased borrowing costs, reduced returns from investments, decreased philanthropic donations, and the unkindest cut of all: more patients with less ability to pay.
American hospitals, which employ more than 5 million people, have witnessed all these forces magnify the long-standing issue of under-reimbursements from Medicare and Medicaid, which generally don’t even cover the rising costs of labor and technology. In New Jersey, 47% of hospitals were in the red in 2007, and five of the state’s 79 acute-care hospitals closed in 2008.
Hospitalists can deliver just what we need today—efficient and effective care with appropriate use of resources, better hospital throughput, attention to safety, and measurable efforts to improve performance.
According to recent data, more than 65% of surveyed hospitals saw decreases in elective procedures and an increase in nonpaying patients. The hit to hospitals’ investments has mirrored the 401(k) crisis. More than 550 hospitals watched their recent investment declines combine for a total loss of $832 million in the third quarter of 2008, compared with a $396 million aggregate gain in the same time period in 2007. All this bad news led Moody’s to change its 12- to 18-month outlook for both profit and nonprofit hospitals from stable to negative due to increasing bad debt, credit tightening, and loss of investments.
Hospitals are keenly affected by local employment, too. When local businesses have layoffs, former employees often lose their insurance coverage. When companies cut back on expenses to hold on to their workers, often that translates into no health insurance or very high deductibles. When patients lose their jobs or their insurance, they stop getting preventive care; they stop buying prescriptions. The end result is increased ED visits and admissions for decompensated heart failure, flu that turns into pneumonia, or out-of-control diabetes.
More admissions might mean more business for hospitals and hospitalists, but it certainly does not mean more money. It likely means more no-pays and increasing bad debt. It means turning a precarious, marginally balanced bottom line into losses and layoffs.
As if that weren’t bad enough, 44 of our 50 states are operating in the red and looking at trimming big-ticket items to stem the losses. For most states, the budget items under scrutiny include education, prisons, and healthcare. Medicaid payments—already inadequate—are shrinking further at a time when more people need a safety net.
Prove Thy Worth
These are tough times to be running a hospital, but aren’t hospitalists, so dependent on the viability of their hospitals, also on a slippery slope—and running downhill? Actually, these tough times might make hospitalists—and our value—all the more important to their hospitals, helping administrators weather the storm and be resources for their healthcare communities.
Hospitalists can deliver just what we need today—efficient and effective care with appropriate use of resources, better hospital throughput, attention to safety, and measurable efforts to improve performance.
In addition, as primary-care physicians (PCPs), surgeons, and subspecialists retrench to stay away from no-pays so they can find a better payor mix in order to survive, patients keep coming to hospitals, and hospitalists are positioned to pick up the slack and jump right in. Obviously, there is the chance PCPs and others in difficult times might actually come back to inpatient care as office and procedure revenues dwindle, but this is less likely to affect hospitalists when we seem to always have far more work than we have staff or time to manage.
Change Agents
Times of crisis create opportunities for real change. President Obama and many key legislators and thought leaders have signaled a genuine desire to change a system that rewards performance (value-based purchasing) and bundles hospital and physician payments, which will be tied to key outcomes and performance. SHM has been able to show Washington decision-makers that hospitalists can reduce preventable deep vein thrombosis (DVT) in hospitalized patients from 50 per year to three per year. We have shown that hospitalists, using SHM’s BOOST protocols, can improve the discharge process, identify high-risk patients, and reduce ED visits and readmissions. This is just the type of system improvement that leads to better care at a lower cost—the Holy Grail in hard times.
Couple all this with the Institute of Medicine’s call to further reduce residency hours, which only leads to a greater need for hospitalists in teaching institutions, and there is an increasing demand for hospitalists seemingly everywhere. And even in a recession, high demand with a small supply leads to the need to nurture and reward hospitalists, especially those who are experienced and can deliver efficient and effective inpatient care.
At a national level, we will see experimentation with demonstration projects to look at rewarding performance and bundling payments for inpatient care. Similarly, hospitalists should be emboldened to use the current crisis to experiment locally by using teams of hospitalists, nurses, pharmacists, and case managers to revise the way care is delivered. There are opportunities to responsibly involve nurse practitioners and physician assistants as integral parts of your hospitalist team.
While the rest of medicine might be forced to look out for themselves in tough times, hospitalists, by their very positioning, must focus on the survival and improvement of the system, of their hospital, and of the healthcare community. In hospital medicine, we recognize that the days of “Lone Ranger” physicians carving out their own destinies are long gone. In many ways, physicians are intricately intertwined. And that forces us to survive or fail together. That will be hospitalists’ salvation in these hard times: knowing there are better times ahead for us, our hospitals, and our patients. TH
Dedication to hard work, a passion for improving health outcomes and medical curricula, a background in business administration, and a knack for team-building have catapulted Alpesh Amin, MD, MBA, FACP, to the forefront of change at the University of California at Irvine Health Affairs, comprised of the UC Irvine Medical Center and School of Medicine. Those skill sets and determination have landed Dr. Amin an HM first: appointment as interim chair of an academic Department of Medicine.
Dr. Amin’s new role—he supervises 11 divisions and more than 200 faculty—means he’s responsible for the department’s budget and administration. He also is charged with advancing the department’s clinical, teaching, and research missions, demonstrating that it’s possible for hospitalists to rise through the department ranks through an HM track. And that, says Scott Flanders, SHM’s president-elect and associate professor of medicine and director of the HM program at the University of Michigan Health System in Ann Arbor, “bodes well for the future of academic hospitalists at many institutions across the country.”
Traditionally, lofty hospital appointments have gone to academics with a background in biomedical and basic science research. But as academic and teaching hospitals focus more and more on quality issues and improved performance, hospitalists are positioned to advance into department leadership positions.
Alpesh does it all, from clinical research to leading a department to running an outstanding hospitalist service. He’s really a renaissance physician.—David N. Bailey, MD, dean, vice chancellor, UC Irvine Health Affairs
Dr. Amin’s appointment could signal the first of many opportunities for academic hospitalists, according to Joseph Ming-Wah Li, MD, assistant professor of medicine at Harvard Medical School and director of the HM program at Beth Israel Deaconess Medical Center in Boston. Dr. Li, who served with Dr. Amin on SHM’s Board of Directors, was not surprised when Alpesh was named the first hospitalist to chair a department of medicine. “He is a very gregarious person, he’s bright, and he’s logical in his thinking,” Dr. Li says.
Career Foundation
Dr. Amin credits his family with instilling in him strong values and dedication to his work. Born in Baroda, India, he emigrated to the U.S. before his first birthday; he graduated from Northgate High School in Walnut Creek, Calif., in 1985, and from UC San Diego with a degree in bioengineering in 1989. He obtained his MD in 1994 from Northwestern University’s Feinberg School of Medicine in Chicago.
During his internship and residency at UC Irvine, Dr. Amin pondered the possibilities of a subspecialty within internal medicine. He opted to follow his interests in medical education and healthcare outcomes and research. The HM field intrigued him, he says, “because there was an opportunity to improve on systems and patient-care delivery.” Numerous mentors along the way encouraged his interests in curriculum development and design, quality improvement, and developing delivery models for patient care.
Trendsetter
As a medical resident, Dr. Amin demonstrated a desire to become a leader and change agent. “He was truly an outstanding resident, and then he joined the faculty and did spectacularly in organizing the hospitalist program, which has become very successful,” recalls Nosratola D. Vaziri, MD, chief of the division of nephrology and hypertension at UC Irvine’s School of Medicine. Dr. Amin founded the UC Irvine hospitalist program in 1998. At the same time, he acquired his MBA in healthcare administration, thus rounding out an already impressive skill set. “The MBA has been a valuable tool,” says Dr. Amin, “because I learned—among other skills—leadership, strategic planning, developing business plans, and improving on operations.”
He has applied those techniques throughout his career, serving in various leadership roles at his institution, including medicine clerkship director, associate program director for the internal medicine residency program, vice chair for clinical affairs and quality assurance, and chief of the division of general internal medicine.
Are Hospitalists the Logical Choice to Chair Departments of Medicine?
Yes, says Joseph Ming-Wah Li, an SHM board member who heads the hospital medicine group at Beth Israel Deaconess in Boston. “The department chair of medicine of yesterday is very different from today—and that’s due to the changes in academic medical centers. It’s not enough anymore to just be a skilled teacher, or a bright clinician or be able to publish. You actually have to be a very skilled administrator and be able to see the bigger picture. That’s where people like [Dr. Amin] are so valuable. They understand what’s happening in terms of the hospital’s workflow, and he’s had to develop and hone those skills during his years as a hospitalist.”
Perhaps, says Matthew Brenner, MD, professor of medicine and chief of pulmonary and critical-care medicine at UC Irvine, but it’s not just hospitalist training that will project someone into a department chair post. What’s required is specific expertise in the business of healthcare. “It’s hard to be chair of medicine today without knowing how to run a business,” he says.
Yes, says SHM President-elect Scott Flanders, MD, associate professor of medicine and director of the hospital medicine program at the University of Michigan in Ann Arbor. “Many in the hospitalist community, including those at academic medical centers, are required to focus on business and leadership skills. We’re constantly having to juggle clinical tasks and administrative roles, both at a departmental level as well as the institutional level. Those skills are essential for department chairs. As a field, hospital medicine prepares people very well for future leadership roles beyond just the local hospitalist community.”
Yes, says Jeffrey Wiese, MD, FACP, professor of medicine and associate dean for graduate medical education at Tulane University Health Sciences Center in New Orleans and an SHM board member. “There is now an acceptance toward a mentality and culture that is empowered to fix the problems. And that’s our task, as hospitalists—to work as part of the patient-care team.” He also believes the research agenda may also benefit with a hospitalist-trained chair: “The more you can evoke collaboration between all subspecialties of medicine, the better off you will be in terms of fostering meaningful and fruitful research.”
Yes, says Eric Howell, MD, assistant professor of medicine at Johns Hopkins University School of Medicine, where he is also division director of collaborative inpatient medicine service; he is also chair of SHM’s Leadership Committee. “My belief is that hospitalists will be natural leaders of hospitals in the private sector, and also of departments and divisions in some academic environments. All hospitalists are trained to manage teams, so it’s not such a big leap for a hospitalist, as it might be for another specialist who may not be quite so used to managing teams.”
By developing and nurturing the UC Irvine hospitalist program, Dr. Amin has exhibited a deep commitment to the core missions of hospital medicine. “Our multidisciplinary program has nine different specialties managed under one program,” he notes. He has structured the program in such a way that members hold dual appointments in the HM program and their individual departments or divisions, thus creating a bridge between the HM program and other departments.
“We have an integrated group that is working together for the focus of advancement in the hospital setting, in terms of clinical care, teaching, team-building, quality and systems improvement. As a result, we’ve had great outcomes in terms of length of stay, quality, and core measures,” Dr. Amin says. “I’ve been fortunate to work with a team of hospitalist faculty who are spectacular and collectively deserve kudos for the success of our group.”
Dr. Amin has shared his passion for quality improvement and curriculum development with all of hospital medicine. As chair of SHM’s education committee, he pushed for the first education summit in 2001, securing support to form a core-curriculum task force. Four years later, Dr. Amin and a small group of industry leaders published “Core Competencies in Hospital Medicine” in the Journal of Hospital Medicine (www.hospitalmedicine.org/corecomp).
“Dr. Amin has really set the trend [for improved hospital performance], not only here for the hospitalist program, but nationwide,” says David N. Bailey, MD, dean and vice chancellor for UC Irvine Health Affairs.
Department Chairs Wear MULTIPLE Hats
The Department of Medicine is the largest department at the UC Irvine School of Medicine, with 11 divisions and 200 faculty members. Its residents rotate through three sites, including UC Irvine Medical Center, the Long Beach Veterans Administration, and Long Beach Memorial Hospital. In his new role, Dr. Amin must be an advocate for all the divisions in the Department of Medicine, not just the HM division.
Dr. Vaziri, who previously served as department chair, says Dr. Amin already has a track record in representing the broad interests of the faculty and the department. On more than one occasion, Dean Bailey has received a letter written by Dr. Amin and endorsed by the division heads: “He’s able to pull them together on initiatives,” the dean says.—GH
Bucking Tradition
Hospitalists have been advancing into leadership positions in the private sector for many years. It’s been a slower ascent in the academic medical center setting.
“Until recently, it would not have been possible to ascend to the level of chair at most academic centers unless your background was in biomedical and basic science research,” says Robert Wachter, MD, professor and chief of the division of HM at the University of California San Francisco, a former SHM president and author of the blog Wachter’s World (www.wachtersworld .com). “Quality, patient safety, and systems improvement were not considered to be legitimate enough academic work to garner the necessary credibility. I think that’s changing.”
Jeffrey Wiese, MD, FACP, professor of medicine and associate dean for graduate medical education at Tulane University Health Sciences Center in New Orleans and an SHM board member, believes Dr. Amin’s interim appointment “speaks in broad strokes to the new skill set—that is, financial and organizational abilities—that are increasingly becoming valued by academic medicine.” Agendas of patient safety, quality, and delivery of efficient, cost-effective, and safe healthcare are gaining parity, Dr. Wiese says, with academic research agendas. “For one to supercede the other is not a good thing, but for the two to be in balance, I think, is a very good thing,” he says.
“Renaissance Physician”
Dr. Bailey appointed Dr. Amin to what he describes as a “long-term” interim post last June. To make his decision, Dr. Bailey consulted with 11 division chiefs, and Dr. Amin emerged as the leading candidate. “Alpesh does it all, from clinical research to leading a department to running an outstanding hospitalist service,” Dr. Bailey says. “He’s really a renaissance physician.”
The promotion coincides with another of Dr. Amin’s recent accomplishments: He received the Laureate Award for the California Southern Region 2 of the American College of Physicians.
Ever energetic, Dr. Amin is not resting on his laurels. “I’m looking forward to helping the department continue to be a flagship within the UC Irvine School of Medicine,” he says. “This is a challenging and positive opportunity to balance systems-based practice, the business of medicine, and the science of medicine.”
Dr. Amin thinks his appointment signifies the new opportunities open to the growing number of U.S. hospitalists—now more than 28,000 strong and growing every day. “This [appointment] shows that hospitalists can move in the direction of being both academic leaders and healthcare administrative leaders.” TH
Gretchen Henkel is a freelance medical writer based in California.
An 84-year-old woman presents with watery diarrhea. She recently received a fluoroquinolone antibiotic during a hospitalization for pneumonia. Her temperature is 101 degrees, her heart rate is 110 beats per minute, and her respiratory rate is 22 breaths per minute. Her abdominal exam is significant for mild distention, hyperactive bowel sounds, and diffuse, mild tenderness without rebound or guarding. Her white blood cell count is 18,200 cells/mm3. You suspect C. difficile infection. Should you treat empirically with antibiotics and, if so, which antibiotic should you prescribe?
Overview
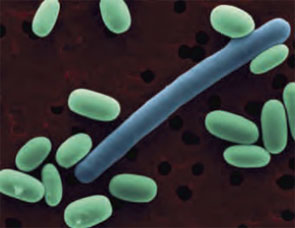
C. difficile is an anaerobic gram-positive bacillus that produces spores and toxins. In 1978, C. difficile was identified as the causative agent for antibiotic-associated diarrhea.1 The portal of entry is via the fecal-oral route.
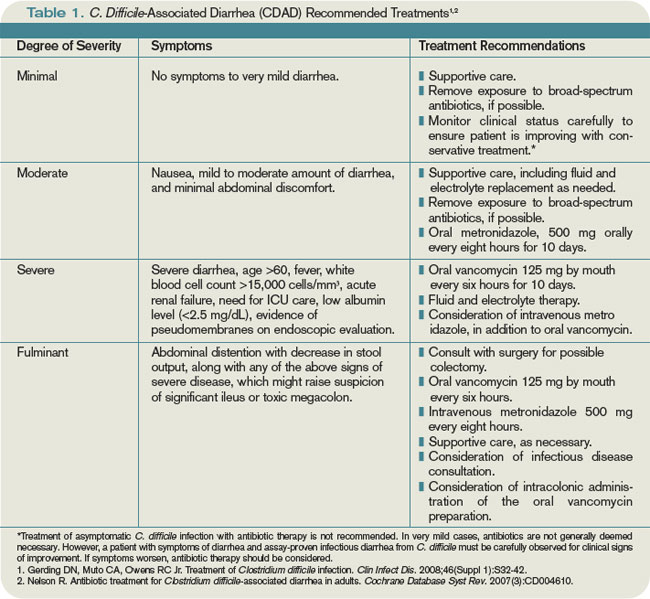
Some patients carry C. difficile in their intestinal flora and show no signs of infection. Patients who develop symptoms commonly present with profuse, watery diarrhea. Nausea, vomiting, and abdominal pain also can be seen. Severe cases of C. difficile-associated diarrhea (CDAD) can present with significant abdominal pain and multisystem organ failure, with toxic megacolon resulting from toxin production and ileus.2 In severe cases due to ileus, diarrhea may be absent. Risk of mortality in severe cases is high, with some reviews citing death rates of 57% in patients requiring total colectomy.3 Risk factors for developing CDAD include the prior or current use of antibiotics, advanced age, hospitalization, and prior gastrointestinal surgery or procedures.4
Risk factors for developing CDAD include: antibiotic use, advanced age, hospitalization, and prior gastrointestinal surgery or procedures. Metronidazole and oral doses of vancomycin are the most common treatments.
The initial CDAD treatment involves removal of the agent that incited the infection. In most cases, this means discontinuation of an antimicrobial agent. Removal of the inciting agent allows restoration of the normal bowel flora. In mild CDAD cases, this may be sufficient therapy. However, most CDAD cases require treatment. Although many antimicrobial and probiotic agents have been used in CDAD treatment, metronidazole and vancomycin are the most commonly prescribed agents. There is an ongoing debate as to which should be considered the first-line agent.
KEY Points
C. difficile is readily spread due to its hardy spore form.
The elderly, those with prior antibiotic exposure, anyone with recent hospitalization, and those with altered bowel flora are susceptible to C. difficile-associated diarrhea (CDAD).
Metronidazole remains the mainstay for treatment of mild CDAD, due to cost and concerns about proliferation of vancomycin-resistant pathogens.
Treat severe CDAD with oral vancomycin.
Severe CDAD can be defined as any patient with two or more points on the following scale: One point each for temperature > 38.3 degrees Celsius; age > 60 years; albumin level < 2.5 mg/dL; or white blood cell count > 15K cells/mm3. Any patient with endoscopic evidence for pseudomembrane formation or admission to the ICU for CDAD treatment can be considered to have severe disease.
Additional Reading
Bartlett JG. Narrative review: the new epidemic of Clostridium difficile-associated enteric disease. Ann Intern Med. 2006;145(10);758-764.
Kelly CP, LaMont JT. Clostridium difficile—more difficult than ever. N Engl J Med. 2008;359(18);1932-1940.
Gerding DN, Muto CA, Owens RC Jr. Treatment of Clostridium difficile infection. Clin Infect Dis. 2008;46(Suppl 1):S32-42.
Review of the Data
Metronidazole and vancomycin have the longest histories of use and are the most studied agents in CDAD. Metronidazole is prescribed 250 mg four times daily (or 500 mg twice daily) for 14 days. It is reasonably tolerated, although it can cause a metallic taste in the mouth. Vancomycin is given 125 mg four times daily (or 500 mg three times daily) for 10 to 14 days. Unlike metronidazole, which can be given by mouth or intravenously, only oral vancomycin is effective in CDAD.
Historically, metronidazole has been prescribed more frequently as the first-line agent in CDAD. Proponents of the drug tout its low cost and the importance of minimizing the development of vancomycin-resistant enteric pathogens. There are two small, prospective, randomized studies comparing the efficacy of the agents against one another in the treatment of C. difficile infection, with similar efficacy demonstrated in both studies. In the early 1980s, Teasley and colleagues randomized 94 patients with C. difficile infection to either metronidazole or vancomycin.5 All the patients receiving vancomycin resolved their disease; 95% of patients receiving metronidazole were cured. The differences were not statistically significant.
In the mid-1990s, Wenisch and colleagues randomized patients with C. difficile infection to receive vancomycin, metronidazole, fusidic acid, or teicoplanin therapy.6 Ninety-four percent of patients in both the vancomycin and metronidazole groups were cured.
However, since 2000, investigators have reported higher failure rates with metronidazole therapy in C. difficile infections. For example, in 2005, Pepin and colleagues reviewed cases of C. difficile infections at a hospital in Quebec.7 They determined the number of patients with C. difficile infection initially treated with metronidazole who required additional therapy had markedly increased. Between 1991 and 2002, 9.6% of patients who initially were treated with metronidazole required a switch to vancomycin (or the addition of vancomycin) because of a disappointing response. This figure doubled to 25.7% in 2003-2004. The 60-day probability of recurrence also increased in the 2003-2004 test group (47.2%), compared with the 1991-2002 group (20.8%). Both results were statistically significant. Such data contributed to the debate regarding whether metronidazole or vancomycin is the superior agent in the treatment of C. difficile infections.
In 2007, Zar and colleagues studied the efficacy of metronidazole and vancomycin in the treatment of CDAD patients, but the study stratified patients according to disease severity.8 This allowed the authors to investigate whether one agent was superior in treating mild or severe CDAD. They determined disease severity by assigning points to individual patient characteristics. Patients with two or more points were deemed to have “severe” CDAD.
The investigators assigned one point for each of the following patient characteristics: temperature >38.3 degrees Celsius, age >60 years, albumin level <2.5 mg/dL, and white blood cell count >15,000 cells/mm3 within 48 hours of enrolling in the study. Any patient with endoscopic evidence of pseudomembrane formation or admission to the intensive-care unit (ICU) for CDAD treatment was considered to have severe disease.
Medical-on-Line/Alamy
A scanning electron micrograph of C. difficile.
This was a prospective, randomized controlled trial of 150 patients. Patients were randomly prescribed 500 mg metronidazole by mouth three times daily or 125 mg of vancomycin by mouth four times daily. Patients with mild CDAD had similar cure rates: 90% metronidazole versus 98% vancomycin (P=0.36). However, patients with severe CDAD fared statistically better when treated with oral vancomycin. Ninety-seven percent of severe CDAD patients treated with oral vancomycin had a clinical cure, while only 76% of those treated with metronidazole were cured (P=0.02). Recurrence of the disease was similar in each treatment group.
Based on this study, metronidazole and vancomycin appear equally effective in the treatment of mild CDAD, but vancomycin is the superior agent in the treatment of patients with severe CDAD.
Back to the Case
Our patient had several risk factors predisposing her to developing CDAD. She was of advanced age and took a fluoroquinolone antibiotic during a recent hospitalization. She also presented with signs consistent with a severe case of CDAD. She had a fever, a white blood cell count >15,000 cells/mm3, and was older than 60. Thus, she should be treated with supportive care, placed on contact precautions, and administered oral vancomycin 125 mg by mouth every six hours for 10 days as empiric therapy for CDAD. Stool cultures should be sent to confirm the presence of the C. difficile toxin.
click for larger table
click for larger table
Bottom Line
The appropriate antibiotic choice to treat CDAD in any patient depends upon the clinical severity of the disease. Treat patients with mild CDAD with metronidazole; prescribe oral vancomycin for patients with severe CDAD. TH
Dr. Mattison, instructor of medicine at Harvard Medical School, is a hospitalist and co-director of the Inpatient Geriatrics Unit at Beth Israel Deaconess Medical Center (BIDMC) in Boston. Dr. Li, assistant professor of medicine at Harvard Medical School, is director of hospital medicine and associate chief of BIDMC’s Division of General Medicine and Primary Care.
References
1.Bartlett JG, Moon N, Chang TW, Taylor N, Onderdonk AB. Role of C. difficile in antibiotic-associated pseudomembranous colitis. Gastroenterology. 1978;75(5):778-782.
2.Poutanen SM, Simor AE. C. difficile-associated diarrhea in adults. CMAJ. 2004;171(1):51-58.
3.Dallal RM, Harbrecht BG, Boujoukas AJ, et al. Fulminant C. difficile: an underappreciated and increasing cause of death and complications. Ann Surg. 2002;235(3):363-372.
4.Bartlett JG. Narrative review: the new epidemic of C. difficile-associated enteric disease. Ann Intern Med. 2006;145(10):758-764.
5.Teasley DG, Gerding DN, Olson MM, et al. Prospective randomized trial of metronidazole versus vancomycin for C. difficile-associated diarrhea and colitis. Lancet. 1983;2:1043-1046.
6.Wenisch C, Parschalk B, Hasenhündl M, Hirschl AM, Graninger W. Comparison of vancomycin, teicoplanin, metronidazole, and fusidic acid for the treatment of C. difficile-associated diarrhea. Clin Infect Dis. 1996;22:813-818.
7.Pepin J, Alary M, Valiquette L, et al. Increasing risk of relapse after treatment of C. difficile colitis in Quebec, Canada. Clin Infect Dis. 2005;40:1591-1597.
8.Zar FA, Bakkanagari SR, Moorthi KM, Davis MB. A comparison of vancomycin and metronidazole for the treatment of C. difficile-associated diarrhea, stratified by disease severity. Clin Infect Dis. 2007;45(3):302-307.
An 84-year-old woman presents with watery diarrhea. She recently received a fluoroquinolone antibiotic during a hospitalization for pneumonia. Her temperature is 101 degrees, her heart rate is 110 beats per minute, and her respiratory rate is 22 breaths per minute. Her abdominal exam is significant for mild distention, hyperactive bowel sounds, and diffuse, mild tenderness without rebound or guarding. Her white blood cell count is 18,200 cells/mm3. You suspect C. difficile infection. Should you treat empirically with antibiotics and, if so, which antibiotic should you prescribe?
Overview
C. difficile is an anaerobic gram-positive bacillus that produces spores and toxins. In 1978, C. difficile was identified as the causative agent for antibiotic-associated diarrhea.1 The portal of entry is via the fecal-oral route.
Some patients carry C. difficile in their intestinal flora and show no signs of infection. Patients who develop symptoms commonly present with profuse, watery diarrhea. Nausea, vomiting, and abdominal pain also can be seen. Severe cases of C. difficile-associated diarrhea (CDAD) can present with significant abdominal pain and multisystem organ failure, with toxic megacolon resulting from toxin production and ileus.2 In severe cases due to ileus, diarrhea may be absent. Risk of mortality in severe cases is high, with some reviews citing death rates of 57% in patients requiring total colectomy.3 Risk factors for developing CDAD include the prior or current use of antibiotics, advanced age, hospitalization, and prior gastrointestinal surgery or procedures.4
Risk factors for developing CDAD include: antibiotic use, advanced age, hospitalization, and prior gastrointestinal surgery or procedures. Metronidazole and oral doses of vancomycin are the most common treatments.
The initial CDAD treatment involves removal of the agent that incited the infection. In most cases, this means discontinuation of an antimicrobial agent. Removal of the inciting agent allows restoration of the normal bowel flora. In mild CDAD cases, this may be sufficient therapy. However, most CDAD cases require treatment. Although many antimicrobial and probiotic agents have been used in CDAD treatment, metronidazole and vancomycin are the most commonly prescribed agents. There is an ongoing debate as to which should be considered the first-line agent.
KEY Points
C. difficile is readily spread due to its hardy spore form.
The elderly, those with prior antibiotic exposure, anyone with recent hospitalization, and those with altered bowel flora are susceptible to C. difficile-associated diarrhea (CDAD).
Metronidazole remains the mainstay for treatment of mild CDAD, due to cost and concerns about proliferation of vancomycin-resistant pathogens.
Treat severe CDAD with oral vancomycin.
Severe CDAD can be defined as any patient with two or more points on the following scale: One point each for temperature > 38.3 degrees Celsius; age > 60 years; albumin level < 2.5 mg/dL; or white blood cell count > 15K cells/mm3. Any patient with endoscopic evidence for pseudomembrane formation or admission to the ICU for CDAD treatment can be considered to have severe disease.
Additional Reading
Bartlett JG. Narrative review: the new epidemic of Clostridium difficile-associated enteric disease. Ann Intern Med. 2006;145(10);758-764.
Kelly CP, LaMont JT. Clostridium difficile—more difficult than ever. N Engl J Med. 2008;359(18);1932-1940.
Gerding DN, Muto CA, Owens RC Jr. Treatment of Clostridium difficile infection. Clin Infect Dis. 2008;46(Suppl 1):S32-42.
Review of the Data
Metronidazole and vancomycin have the longest histories of use and are the most studied agents in CDAD. Metronidazole is prescribed 250 mg four times daily (or 500 mg twice daily) for 14 days. It is reasonably tolerated, although it can cause a metallic taste in the mouth. Vancomycin is given 125 mg four times daily (or 500 mg three times daily) for 10 to 14 days. Unlike metronidazole, which can be given by mouth or intravenously, only oral vancomycin is effective in CDAD.
Historically, metronidazole has been prescribed more frequently as the first-line agent in CDAD. Proponents of the drug tout its low cost and the importance of minimizing the development of vancomycin-resistant enteric pathogens. There are two small, prospective, randomized studies comparing the efficacy of the agents against one another in the treatment of C. difficile infection, with similar efficacy demonstrated in both studies. In the early 1980s, Teasley and colleagues randomized 94 patients with C. difficile infection to either metronidazole or vancomycin.5 All the patients receiving vancomycin resolved their disease; 95% of patients receiving metronidazole were cured. The differences were not statistically significant.
In the mid-1990s, Wenisch and colleagues randomized patients with C. difficile infection to receive vancomycin, metronidazole, fusidic acid, or teicoplanin therapy.6 Ninety-four percent of patients in both the vancomycin and metronidazole groups were cured.
However, since 2000, investigators have reported higher failure rates with metronidazole therapy in C. difficile infections. For example, in 2005, Pepin and colleagues reviewed cases of C. difficile infections at a hospital in Quebec.7 They determined the number of patients with C. difficile infection initially treated with metronidazole who required additional therapy had markedly increased. Between 1991 and 2002, 9.6% of patients who initially were treated with metronidazole required a switch to vancomycin (or the addition of vancomycin) because of a disappointing response. This figure doubled to 25.7% in 2003-2004. The 60-day probability of recurrence also increased in the 2003-2004 test group (47.2%), compared with the 1991-2002 group (20.8%). Both results were statistically significant. Such data contributed to the debate regarding whether metronidazole or vancomycin is the superior agent in the treatment of C. difficile infections.
In 2007, Zar and colleagues studied the efficacy of metronidazole and vancomycin in the treatment of CDAD patients, but the study stratified patients according to disease severity.8 This allowed the authors to investigate whether one agent was superior in treating mild or severe CDAD. They determined disease severity by assigning points to individual patient characteristics. Patients with two or more points were deemed to have “severe” CDAD.
The investigators assigned one point for each of the following patient characteristics: temperature >38.3 degrees Celsius, age >60 years, albumin level <2.5 mg/dL, and white blood cell count >15,000 cells/mm3 within 48 hours of enrolling in the study. Any patient with endoscopic evidence of pseudomembrane formation or admission to the intensive-care unit (ICU) for CDAD treatment was considered to have severe disease.
Medical-on-Line/Alamy
A scanning electron micrograph of C. difficile.
This was a prospective, randomized controlled trial of 150 patients. Patients were randomly prescribed 500 mg metronidazole by mouth three times daily or 125 mg of vancomycin by mouth four times daily. Patients with mild CDAD had similar cure rates: 90% metronidazole versus 98% vancomycin (P=0.36). However, patients with severe CDAD fared statistically better when treated with oral vancomycin. Ninety-seven percent of severe CDAD patients treated with oral vancomycin had a clinical cure, while only 76% of those treated with metronidazole were cured (P=0.02). Recurrence of the disease was similar in each treatment group.
Based on this study, metronidazole and vancomycin appear equally effective in the treatment of mild CDAD, but vancomycin is the superior agent in the treatment of patients with severe CDAD.
Back to the Case
Our patient had several risk factors predisposing her to developing CDAD. She was of advanced age and took a fluoroquinolone antibiotic during a recent hospitalization. She also presented with signs consistent with a severe case of CDAD. She had a fever, a white blood cell count >15,000 cells/mm3, and was older than 60. Thus, she should be treated with supportive care, placed on contact precautions, and administered oral vancomycin 125 mg by mouth every six hours for 10 days as empiric therapy for CDAD. Stool cultures should be sent to confirm the presence of the C. difficile toxin.
click for larger table
click for larger table
Bottom Line
The appropriate antibiotic choice to treat CDAD in any patient depends upon the clinical severity of the disease. Treat patients with mild CDAD with metronidazole; prescribe oral vancomycin for patients with severe CDAD. TH
Dr. Mattison, instructor of medicine at Harvard Medical School, is a hospitalist and co-director of the Inpatient Geriatrics Unit at Beth Israel Deaconess Medical Center (BIDMC) in Boston. Dr. Li, assistant professor of medicine at Harvard Medical School, is director of hospital medicine and associate chief of BIDMC’s Division of General Medicine and Primary Care.
References
1.Bartlett JG, Moon N, Chang TW, Taylor N, Onderdonk AB. Role of C. difficile in antibiotic-associated pseudomembranous colitis. Gastroenterology. 1978;75(5):778-782.
2.Poutanen SM, Simor AE. C. difficile-associated diarrhea in adults. CMAJ. 2004;171(1):51-58.
3.Dallal RM, Harbrecht BG, Boujoukas AJ, et al. Fulminant C. difficile: an underappreciated and increasing cause of death and complications. Ann Surg. 2002;235(3):363-372.
4.Bartlett JG. Narrative review: the new epidemic of C. difficile-associated enteric disease. Ann Intern Med. 2006;145(10):758-764.
5.Teasley DG, Gerding DN, Olson MM, et al. Prospective randomized trial of metronidazole versus vancomycin for C. difficile-associated diarrhea and colitis. Lancet. 1983;2:1043-1046.
6.Wenisch C, Parschalk B, Hasenhündl M, Hirschl AM, Graninger W. Comparison of vancomycin, teicoplanin, metronidazole, and fusidic acid for the treatment of C. difficile-associated diarrhea. Clin Infect Dis. 1996;22:813-818.
7.Pepin J, Alary M, Valiquette L, et al. Increasing risk of relapse after treatment of C. difficile colitis in Quebec, Canada. Clin Infect Dis. 2005;40:1591-1597.
8.Zar FA, Bakkanagari SR, Moorthi KM, Davis MB. A comparison of vancomycin and metronidazole for the treatment of C. difficile-associated diarrhea, stratified by disease severity. Clin Infect Dis. 2007;45(3):302-307.
Case
An 84-year-old woman presents with watery diarrhea. She recently received a fluoroquinolone antibiotic during a hospitalization for pneumonia. Her temperature is 101 degrees, her heart rate is 110 beats per minute, and her respiratory rate is 22 breaths per minute. Her abdominal exam is significant for mild distention, hyperactive bowel sounds, and diffuse, mild tenderness without rebound or guarding. Her white blood cell count is 18,200 cells/mm3. You suspect C. difficile infection. Should you treat empirically with antibiotics and, if so, which antibiotic should you prescribe?
Overview
C. difficile is an anaerobic gram-positive bacillus that produces spores and toxins. In 1978, C. difficile was identified as the causative agent for antibiotic-associated diarrhea.1 The portal of entry is via the fecal-oral route.
Some patients carry C. difficile in their intestinal flora and show no signs of infection. Patients who develop symptoms commonly present with profuse, watery diarrhea. Nausea, vomiting, and abdominal pain also can be seen. Severe cases of C. difficile-associated diarrhea (CDAD) can present with significant abdominal pain and multisystem organ failure, with toxic megacolon resulting from toxin production and ileus.2 In severe cases due to ileus, diarrhea may be absent. Risk of mortality in severe cases is high, with some reviews citing death rates of 57% in patients requiring total colectomy.3 Risk factors for developing CDAD include the prior or current use of antibiotics, advanced age, hospitalization, and prior gastrointestinal surgery or procedures.4
Risk factors for developing CDAD include: antibiotic use, advanced age, hospitalization, and prior gastrointestinal surgery or procedures. Metronidazole and oral doses of vancomycin are the most common treatments.
The initial CDAD treatment involves removal of the agent that incited the infection. In most cases, this means discontinuation of an antimicrobial agent. Removal of the inciting agent allows restoration of the normal bowel flora. In mild CDAD cases, this may be sufficient therapy. However, most CDAD cases require treatment. Although many antimicrobial and probiotic agents have been used in CDAD treatment, metronidazole and vancomycin are the most commonly prescribed agents. There is an ongoing debate as to which should be considered the first-line agent.
KEY Points
C. difficile is readily spread due to its hardy spore form.
The elderly, those with prior antibiotic exposure, anyone with recent hospitalization, and those with altered bowel flora are susceptible to C. difficile-associated diarrhea (CDAD).
Metronidazole remains the mainstay for treatment of mild CDAD, due to cost and concerns about proliferation of vancomycin-resistant pathogens.
Treat severe CDAD with oral vancomycin.
Severe CDAD can be defined as any patient with two or more points on the following scale: One point each for temperature > 38.3 degrees Celsius; age > 60 years; albumin level < 2.5 mg/dL; or white blood cell count > 15K cells/mm3. Any patient with endoscopic evidence for pseudomembrane formation or admission to the ICU for CDAD treatment can be considered to have severe disease.
Additional Reading
Bartlett JG. Narrative review: the new epidemic of Clostridium difficile-associated enteric disease. Ann Intern Med. 2006;145(10);758-764.
Kelly CP, LaMont JT. Clostridium difficile—more difficult than ever. N Engl J Med. 2008;359(18);1932-1940.
Gerding DN, Muto CA, Owens RC Jr. Treatment of Clostridium difficile infection. Clin Infect Dis. 2008;46(Suppl 1):S32-42.
Review of the Data
Metronidazole and vancomycin have the longest histories of use and are the most studied agents in CDAD. Metronidazole is prescribed 250 mg four times daily (or 500 mg twice daily) for 14 days. It is reasonably tolerated, although it can cause a metallic taste in the mouth. Vancomycin is given 125 mg four times daily (or 500 mg three times daily) for 10 to 14 days. Unlike metronidazole, which can be given by mouth or intravenously, only oral vancomycin is effective in CDAD.
Historically, metronidazole has been prescribed more frequently as the first-line agent in CDAD. Proponents of the drug tout its low cost and the importance of minimizing the development of vancomycin-resistant enteric pathogens. There are two small, prospective, randomized studies comparing the efficacy of the agents against one another in the treatment of C. difficile infection, with similar efficacy demonstrated in both studies. In the early 1980s, Teasley and colleagues randomized 94 patients with C. difficile infection to either metronidazole or vancomycin.5 All the patients receiving vancomycin resolved their disease; 95% of patients receiving metronidazole were cured. The differences were not statistically significant.
In the mid-1990s, Wenisch and colleagues randomized patients with C. difficile infection to receive vancomycin, metronidazole, fusidic acid, or teicoplanin therapy.6 Ninety-four percent of patients in both the vancomycin and metronidazole groups were cured.
However, since 2000, investigators have reported higher failure rates with metronidazole therapy in C. difficile infections. For example, in 2005, Pepin and colleagues reviewed cases of C. difficile infections at a hospital in Quebec.7 They determined the number of patients with C. difficile infection initially treated with metronidazole who required additional therapy had markedly increased. Between 1991 and 2002, 9.6% of patients who initially were treated with metronidazole required a switch to vancomycin (or the addition of vancomycin) because of a disappointing response. This figure doubled to 25.7% in 2003-2004. The 60-day probability of recurrence also increased in the 2003-2004 test group (47.2%), compared with the 1991-2002 group (20.8%). Both results were statistically significant. Such data contributed to the debate regarding whether metronidazole or vancomycin is the superior agent in the treatment of C. difficile infections.
In 2007, Zar and colleagues studied the efficacy of metronidazole and vancomycin in the treatment of CDAD patients, but the study stratified patients according to disease severity.8 This allowed the authors to investigate whether one agent was superior in treating mild or severe CDAD. They determined disease severity by assigning points to individual patient characteristics. Patients with two or more points were deemed to have “severe” CDAD.
The investigators assigned one point for each of the following patient characteristics: temperature >38.3 degrees Celsius, age >60 years, albumin level <2.5 mg/dL, and white blood cell count >15,000 cells/mm3 within 48 hours of enrolling in the study. Any patient with endoscopic evidence of pseudomembrane formation or admission to the intensive-care unit (ICU) for CDAD treatment was considered to have severe disease.
Medical-on-Line/Alamy
A scanning electron micrograph of C. difficile.
This was a prospective, randomized controlled trial of 150 patients. Patients were randomly prescribed 500 mg metronidazole by mouth three times daily or 125 mg of vancomycin by mouth four times daily. Patients with mild CDAD had similar cure rates: 90% metronidazole versus 98% vancomycin (P=0.36). However, patients with severe CDAD fared statistically better when treated with oral vancomycin. Ninety-seven percent of severe CDAD patients treated with oral vancomycin had a clinical cure, while only 76% of those treated with metronidazole were cured (P=0.02). Recurrence of the disease was similar in each treatment group.
Based on this study, metronidazole and vancomycin appear equally effective in the treatment of mild CDAD, but vancomycin is the superior agent in the treatment of patients with severe CDAD.
Back to the Case
Our patient had several risk factors predisposing her to developing CDAD. She was of advanced age and took a fluoroquinolone antibiotic during a recent hospitalization. She also presented with signs consistent with a severe case of CDAD. She had a fever, a white blood cell count >15,000 cells/mm3, and was older than 60. Thus, she should be treated with supportive care, placed on contact precautions, and administered oral vancomycin 125 mg by mouth every six hours for 10 days as empiric therapy for CDAD. Stool cultures should be sent to confirm the presence of the C. difficile toxin.
click for larger table
click for larger table
Bottom Line
The appropriate antibiotic choice to treat CDAD in any patient depends upon the clinical severity of the disease. Treat patients with mild CDAD with metronidazole; prescribe oral vancomycin for patients with severe CDAD. TH
Dr. Mattison, instructor of medicine at Harvard Medical School, is a hospitalist and co-director of the Inpatient Geriatrics Unit at Beth Israel Deaconess Medical Center (BIDMC) in Boston. Dr. Li, assistant professor of medicine at Harvard Medical School, is director of hospital medicine and associate chief of BIDMC’s Division of General Medicine and Primary Care.
References
1.Bartlett JG, Moon N, Chang TW, Taylor N, Onderdonk AB. Role of C. difficile in antibiotic-associated pseudomembranous colitis. Gastroenterology. 1978;75(5):778-782.
2.Poutanen SM, Simor AE. C. difficile-associated diarrhea in adults. CMAJ. 2004;171(1):51-58.
3.Dallal RM, Harbrecht BG, Boujoukas AJ, et al. Fulminant C. difficile: an underappreciated and increasing cause of death and complications. Ann Surg. 2002;235(3):363-372.
4.Bartlett JG. Narrative review: the new epidemic of C. difficile-associated enteric disease. Ann Intern Med. 2006;145(10):758-764.
5.Teasley DG, Gerding DN, Olson MM, et al. Prospective randomized trial of metronidazole versus vancomycin for C. difficile-associated diarrhea and colitis. Lancet. 1983;2:1043-1046.
6.Wenisch C, Parschalk B, Hasenhündl M, Hirschl AM, Graninger W. Comparison of vancomycin, teicoplanin, metronidazole, and fusidic acid for the treatment of C. difficile-associated diarrhea. Clin Infect Dis. 1996;22:813-818.
7.Pepin J, Alary M, Valiquette L, et al. Increasing risk of relapse after treatment of C. difficile colitis in Quebec, Canada. Clin Infect Dis. 2005;40:1591-1597.
8.Zar FA, Bakkanagari SR, Moorthi KM, Davis MB. A comparison of vancomycin and metronidazole for the treatment of C. difficile-associated diarrhea, stratified by disease severity. Clin Infect Dis. 2007;45(3):302-307.
A 37-year-old African American man presents to the emergency department with chest pain and dyspnea, which began suddenly 30 minutes ago. The pain is severe, pressure-like, nonradiating, and pleuritic.
His heart rate is 88 beats per minute, blood pressure 135/72 mm Hg, respiratory rate 12 per minute, and oral temperature 38.5°C (101.3°F). His oxygen saturation by pulse oximetry is 99% while breathing room air. He is given sublingual nitroglycerin, but this does not alleviate his pain.
Figure 1. The patient’s electrocardiogram on admission. See text for interpretation.
On physical examination, he is a physically fit man in obvious distress. His jugular veins are not distended, and no lymph nodes are palpable in his neck. The heart sounds are muffled without murmurs, but a faint pericardial friction rub is heard that persists even when he holds his breath. His lungs are clear to auscultation, his abdomen is normal, and his lower extremities are warm, with normal pulses and no edema. Of note, neither a Kussmaul sign nor a paradoxical pulse is present. An electrocardiogram is ordered (Figure 1).
While blood samples are being drawn, we learn more about his history. He has hypertension, for which he takes amlodipine (Norvasc), and gastroesophageal reflux under control with esomeprazole (Nexium). He says he does not have hyperlipidemia, diabetes, or coronary artery disease and his surgical history is unremarkable. He says he does not smoke, rarely drinks, and does not use any drugs. No one in his family has had premature coronary artery disease.
He says he has had similar symptoms in the past few months, which resulted in two emergency room visits. Electrocardiograms at those times were unremarkable, and a stress test was negative for ischemia.
A computed tomographic (CT) scan of the chest was also obtained during one of those visits. The scan was negative for a pulmonary embolus but incidentally showed liver hemangiomas.
He goes on to add that his chest pain has recently increased in frequency, and it has occurred daily for the past 5 days. The pain is not related to exertion, occurs throughout the day, and is associated with significant shortness of breath. It worsens when he is taking a deep breath and improves when he leans forward. Although he is febrile, he says he has had no fevers or chills in the past. He gives no history of weight loss, cough, orthopnea, or paroxysmal nocturnal dyspnea, but has been experiencing malaise, weakness, and myalgia for the past month. His review of systems is otherwise negative.
The patient’s initial laboratory results are shown in Table 1.
WHAT IS THE CAUSE OF HIS CHEST PAIN?
1. Which is the most likely cause of this patient’s chest pain?
Acute myocardial infarction
Acute pericarditis
Myocarditis
Pulmonary embolism
Aortic dissection
Pneumonia
Acute myocardial infarction. This is a young man with chest pain, ST-segment elevation, and elevated cardiac enzymes. Acute myocardial infarction should always be included in the differential diagnosis of such a patient, as recognizing it early and making an effort to rapidly restore blood flow to the myocardium can greatly improve the clinical outcome. However, particular features in his electrocardiogram and the duration and nature of his chest pain suggest another diagnosis.
Acute pericarditis causes pleuritic chest pain with diffuse ST-segment elevation, and its electrocardiographic changes may be difficult to distinguish from those of ischemia. The features in our patient’s electrocardiogram that point to pericarditis are1:
ST-segment elevation that is concave upward, occurring in all leads except aVR
T waves concordant with ST-segment deviation
PR-segment depression, sparing V1 and aVR
PR-segment elevation and ST depression in aVR.
Pleuritic chest pain is the most common symptom in acute pericarditis. A prodrome of fever, myalgia, and malaise is also common, especially in younger patients.2 On physical examination, a pericardial friction rub is pathognomonic.
Our patient has most if not all of the classic features of acute pericarditis. Elevated cardiac enzymes, which this patient has, are not a classic feature of pericarditis and are generally considered a marker of cardiac ischemia. However, because the myocardium is adjacent to the pericardium, the acute inflammatory process of acute pericarditis may also result in myocardial injury, resulting in release of creatine kinase-MB.3
An increase in cardiac troponin is also frequently observed in acute pericarditis, reflecting biochemical evidence of inflammatory myocardial cell damage.4 Furthermore, cardiac troponin can be elevated in several other medical conditions,5 such as ischemic heart disease, congestive heart failure, myocarditis, pulmonary embolism, severe pulmonary hypertension, significant left ventricular hypertrophy, renal failure, sepsis, critical illness, and subarachnoid hemorrhage. Therefore, cardiac enzymes are not good markers to distinguish between acute myocardial infarction and acute pericarditis. However, echocardiography is an effective way to help differentiate pericarditis from myocardial ischemia in the setting of elevated troponins and electrocardiographic changes, by determining if wall-motion abnormalities are present or absent.
Hence, the diagnosis of acute pericarditis should take into account the combination of the clinical picture, electrocardiographic findings, and laboratory values. Overreliance on any of these in isolation can lead to misdiagnosis.
Pulmonary embolism is another common cause of acute-onset pleuritic chest pain and dyspnea. Electrocardiographic changes can include ST-segment elevation, and cardiac enzymes can be elevated, although this is uncommon.
Myocarditis is commonly due to infections, collagen vascular diseases, or medications. Hallmarks of this disease are elevated cardiac enzymes and myocardial damage that results in reduction in heart function.
Aortic dissection typically causes a sharp, tearing chest pain that radiates to the back. This diagnosis is unlikely in this patient.
Pneumonia. Although our patient did not have a cough and no crackles were heard on lung examination to suggest pneumonia, his fever, pleuritic chest pain, and leukocytosis with a left shift warrant a workup for it. A parapneumonic effusion could manifest with fevers and pleuritic chest pain. However, the acuity of the symptoms and the characteristic electrocardiographic changes and elevated cardiac enzymes are better explained by the other diagnoses, notably acute pericarditis.
ACUTE PERICARDITIS: WHAT IS THE CAUSE?
2. Which is the most common cause of acute pericarditis?
Idiopathic
Neoplasm
Autoimmune
Tuberculosis
Most (approximately 80%) of cases of acute pericarditis are idiopathic.6,7 In a study in 100 patients with acute pericarditis,6 a specific cause was identified in only 22. The most common identified cause was neoplasm, which was present in seven patients: four with lung cancer and one each with breast carcinoma, cystic duct adenocarcinoma, and cardiac angiosarcoma.
A more recent study in 453 patients revealed similar results: 377 (83.2%) of the cases were idiopathic, 23 (5.1%) were neoplastic, 17 (3.8%) were due to tuberculosis, 33 (7.3%) were autoimmune, and 3 (0.7%) were purulent. Of note, viral causes are categorized as idiopathic, since the diagnostic workup is usually unsuccessful and treatment is empiric6; therefore, most of the so-called idiopathic cases are likely viral. Table 2 summarizes the most common specific causes of acute pericarditis.
CASE CONTINUES: PERICARDIAL EFFUSION
The patient is admitted to the hospital for additional workup. His fever, myalgia, and chest pain persist, though the pain is less intense than before.
A chest roentgenogram and transthoracic echocardiogram are ordered and blood cultures are drawn.
The roentgenogram shows marked cardiomegaly, bilateral small pleural effusions, and minimal atelectatic changes in the lungs.
Echocardiography reveals a normal ejection fraction (60%) and a moderate-sized pericardial effusion without evidence of tamponade.
3. Which is the most common cause of pericardial effusion?
Idiopathic
Infection
Malignancy
Collagen vascular disease
Pericardial effusion is relatively common after acute pericarditis but also has many other possible causes. In a study of 204 patients with pericardial effusion,8 48% of cases were labeled as idiopathic. Of the remaining 52%, the most common specific diagnoses were infection (16%) and cancer (15%). Collagen vascular disease accounted for 8% of the cases and included systemic lupus erythematosus, rheumatoid arthritis, and scleroderma.
Although small pericardial effusions are common in pericarditis, larger pericardial effusions or failure to respond to therapy necessitates additional workup.2
In our patient, an extensive workup is initiated to look for bacterial, viral, fungal, and autoimmune causes of pericardial effusion, but the results of the workup are negative.
TREATING ACUTE PERICARDITIS
4. Which is the most appropriate treatment for acute pericarditis?
Steroids
A nonsteroidal anti-inflammatory drug (NSAID) or aspirin
Opioids
Colchicine
Colchicine plus an NSAID or aspirin
An NSAID or aspirin is the basis of treatment for acute pericarditis and is very effective in relieving symptoms. Aspirin 2–4 g daily, indomethacin (Indocin) 75–225 mg daily, or ibuprofen (Motrin) 1,600–3,200 mg daily are prescribed most often; ibuprofen is preferred because it has a lower incidence of adverse effects than the others.9
Colchicine is recommended in addition to aspirin or NSAIDs for the treatment of acute pericarditis. Although in the past colchicine was reserved for recurrent pericarditis, the Colchicine for Acute Pericarditis (COPE) trial10 found it to be beneficial for first episodes of pericarditis as well.10 In this study, patients were randomized to receive conventional treatment with aspirin 800 mg every 6 or 8 hours or aspirin at the same dose combined with colchicine 0.5 to 1.0 mg daily. Colchicine showed significant benefit over conventional therapy, resulting in reduced rates of recurrence.
CASE CONTINUES: HEPATIC LESIONS ON MRI
Although aspirin and colchicine were started at the time of admission, our patient’s symptoms fail to improve. A suspicion remains that a neoplastic disorder could be the underlying cause of the presentation and could explain his chronic malaise, pericardial disease, and fever. In view of the liver hemangiomas reported previously on CT, we decide to evaluate the liver further with magnetic resonance imaging (MRI).
Figure 2. Magnetic resonance imaging shows multiple lesions in the liver.
To our surprise, the MRI reveals innumerable hepatic lesions, some of which show radiographic features consistent with hemangiomas, while the remainder are atypical and appear to warrant a biopsy (Figure 2). An oncology consultation is obtained and the need for biopsy is confirmed.
Since our patient’s symptoms have improved significantly during the past few days and his fever has resolved, biopsy is scheduled on an outpatient basis. Biopsy with ultrasonographic guidance is performed a week later and yields a pathologic diagnosis of hemangioma. The improvement, however, is short-lived, and his pain and dyspnea recur after 2 months. A follow-up echocardiogram is ordered.
A remarkable echocardiographic finding
Figure 3. Echocardiogram, four-chamber view, showing the tumor (crosshairs) in the right atrium (RA). LA = left atrium, LV = left ventricle, RV = right ventricle.
To our astonishment, the echocardiogram reveals a mass in the right atrial free wall and right ventricle that appears to be invading the myocardial tissue (Figure 3).
The original echocardiogram that was performed a little over 2-1/2 months ago is re-reviewed. It very subtly suggests a complexity to the pericardial effusion in the area of the current mass, apparent only when the two studies are directly compared. Clearly, there has been interval development of a mass easily detectable by echocardiography. Although a small mass may have been obscured by the pericardial effusion in the original echocardiogram, the development of a mass of this size in such a short time suggests a rapidly growing tumor.
Figure 4. Cardiac MRI; arrow points to the tumor. RA = right atrium, RV = right ventricle, LA = left atrium, LV = left ventricle.
Cardiac MRI is performed, which confirms the finding and characterizes the mass as measuring 5.1 by 4.8 cm within the pericardial space adjacent to the right atrium and atrioventricular groove and adherent to the right atrium. There are small excrescences of soft tissue through the midportion of the right atrial wall, suggesting tissue invasion (Figure 4).
CARDIAC TUMORS
5. Which is the most common primary cardiac tumor?
Myxoma
Papillary fibroelastoma
Sarcoma
Lymphoma
Primary cardiac tumors are rare, with an incidence on autopsy series ranging between 0.0017% and 0.33%,11,12 making them far less common than metastases to the heart.
Myxomas are benign cardiac tumors and are the most common primary cardiac neoplasm. Approximately 80% of myxomas originate in the left atrium, typically presenting with one or more of the triad of intracardiac obstruction, systemic embolization, and constitutional symptoms.14
Cardiac papillary fibroelastomas, the second most common cardiac tumors, are benign and predominantly affect the cardiac valves.15
Only one-fourth of all cardiac tumors are malignant. Nearly all of these malignant tumors are sarcomas, with angiosarcoma being the most common morphologic type, accounting for 30% of primary cardiac sarcomas.13
Primary cardiac lymphomas are extremely rare and account for only 1.3% of all primary cardiac tumors.16
A DIAGNOSIS IS MADE
Figure 5. Liver biopsy shows cellular endothelial atypia with mitotic activity (black arrow), growth along the hepatic sinusoids, and papillary tufting (white arrow), all features of low-grade angiosarcoma.
Fluorodeoxyglucose (FDG) positron-emission tomography is done, and shows a hypermetabolic right-sided pericardial tumor in addition to several suspicious hepatic lesions with heterogeneously increased FDG uptake. Biopsy with ultrasonographic guidance is performed again and reveals tissue consistent with hemangioma in addition to other areas with features strongly suggestive of a low-grade angiosarcoma (Figure 5). Pathology findings are unable to differentiate primary cardiac angiosarcoma from a metastatic cardiac tumor; however, given the multiple liver lesions and the presence of a solitary cardiac mass, this is most likely a primary cardiac tumor with metastasis to the liver.
CARDIAC ANGIOSARCOMA
Cardiac angiosarcoma, the most common malignant primary cardiac tumor, has a predilection for the right atrium.13 These tumors tend to occur between the third and fifth decade of life and are three times more common in men than in women. Cardiac sarcomas proliferate rapidly and commonly extend into the pericardial space, causing pericardial effusion in up to one-fourth of patients.
Surgical resection is the treatment of choice, but due to the location and extent of involvement, complete resection is often difficult. Also, distant metastases are present at the time of diagnosis in 80% of cases, precluding a surgical cure.17 Adjuvant chemotherapy, radiotherapy, and even heart transplantation do not substantially improve the survival of these patients.18–20 Because no effective treatment is available, the prognosis is dismal, with a median survival of 6 to 12 months.
Our patient is discharged home to follow up with an oncologist and initiate chemotherapy.
Acknowledgment: We thank Lisa M. Yerian, MD, for interpreting the biopsy specimens described in this article.
References
Ariyarajah V, Spodick DH. Acute pericarditis: diagnostic cues and common electrocardiographic manifestations. Cardiol Rev2007; 15:24–30.
LeWinter MM, Kabbani S. Pericardial disease. In: Zipes DP, et al, editor. Braunwald's Heart Disease: A Textbook of Cardiovascular Medicine. 7th ed. Philadelphia: Elsevier/WB Saunders; 2005:1757–1781.
Karjalainen J, Heikkila J. “Acute pericarditis”: myocardial enzyme release as evidence for myocarditis”. Am Heart J1986; 111:546–552.
Brandt RR, Filzmaier K, Hanrath P. Circulating cardiac troponin I in acute pericarditis. Am J Cardiol2001; 87:1326–1328.
Jaffe AS, Babuin L, Apple FS. Biomarkers in acute cardiac disease: the present and the future. J Am Coll Cardiol2006; 48:1–11.
Zayas R, Anguita M, Torres F, et al. Incidence of specific etiology and role of methods for specific etiologic diagnosis of primary acute pericarditis. Am J Cardiol1995; 75:378–382.
Imazio M, Cecchi E, Demichelis B, et al. Indicators of poor prognosis of acute pericarditis. Circulation2007; 115:2739–2744.
Levy PY, Corey R, Berger P, et al. Etiologic diagnosis of 204 pericardial effusions. Medicine (Baltimore)2003; 82:385–391.
Lange RA, Hillis LD. Clinical practice. Acute pericarditis. N Engl J Med2004; 351:2195–2202.
Imazio M, Bobbio M, Cecchi E, et al. Colchicine in addition to conventional therapy for acute pericarditis: Results of the COlchicine for acute PEricarditis (COPE) trial. Circulation2005; 112:2012–2016.
Heath D. Pathology of cardiac tumors. Am J Cardiol1968; 21:315–327.
Wold LE, Lie JT. Cardiac myxomas: a clinicopathologic profile. Am J Pathol1980; 101:219–240.
Sabatine MS, Colucci WS, Schoen FS. Primary tumors of the heart. In: Zipes DP, et al, editor. Braunwald's Heart Disease: A Textbook of Cardiovascular Medicine. 7th ed. Philadelphia: Elsevier/WB Saunders; 2005:1741–1757.
Gowda RM, Khan IA, Nair CK, Mehta NJ, Vasavada BC, Sacchi TJ. Cardiac papillary fibroelastoma: a comprehensive analysis of 725 cases. Am Heart J2003; 146:404–410.
Glancy DL, Morales JB, Roberts WC. Angiosarcoma of the heart. Am J Cardiol1968; 21:413–419.
Ceresoli GL, Ferreri AJ, Bucci E, Ripa C, Ponzoni M, Villa E. Primary cardiac lymphoma in immunocompetent patients: diagnostic and therapeutic management. Cancer1997; 80:1497–1506.
Bear PA, Moodie DS. Malignant primary cardiac tumors. The Cleveland Clinic experience, 1956 to 1986. Chest1987; 92:860–862.
Llombart–Cussac A, Pivot X, Contesso G, et al. Adjuvant chemotherapy for primary cardiac sarcomas: the IGR experience. Br J Cancer1998; 78:1624–1628.
Putnam JB, Sweeney MS, Colon R, Lanza LA, Frazier OH, Cooley DA. Primary cardiac sarcomas. Ann Thorac Surg1991; 51:906–910.
Conklin LD, Reardon MJ. Autotransplantation of the heart for primary cardiac malignancy: development and surgical technique. Tex Heart Inst J2002; 29:105–108.
Arash Aghel, MD Department of Internal Medicine, Cleveland Clinic
Richard A. Krasuski, MD Department of Cardiovascular Medicine, Section of Clinical Cardiology, Cleveland Clinic
Address: Richard Krasuski, MD, Department of Cardiovascular Medicine, J2-4, Cleveland Clinic, 9500 Euclid Avenue, Cleveland, OH 44195; e-mail [email protected]
Dr. Krasuski has disclosed that he has received honoraria from Pfizer for teaching and speaking and honoraria and consulting fees from Actelion for teaching, speaking, and consultation.
Author and Disclosure Information
Arash Aghel, MD Department of Internal Medicine, Cleveland Clinic
Richard A. Krasuski, MD Department of Cardiovascular Medicine, Section of Clinical Cardiology, Cleveland Clinic
Address: Richard Krasuski, MD, Department of Cardiovascular Medicine, J2-4, Cleveland Clinic, 9500 Euclid Avenue, Cleveland, OH 44195; e-mail [email protected]
Dr. Krasuski has disclosed that he has received honoraria from Pfizer for teaching and speaking and honoraria and consulting fees from Actelion for teaching, speaking, and consultation.
A 37-year-old African American man presents to the emergency department with chest pain and dyspnea, which began suddenly 30 minutes ago. The pain is severe, pressure-like, nonradiating, and pleuritic.
His heart rate is 88 beats per minute, blood pressure 135/72 mm Hg, respiratory rate 12 per minute, and oral temperature 38.5°C (101.3°F). His oxygen saturation by pulse oximetry is 99% while breathing room air. He is given sublingual nitroglycerin, but this does not alleviate his pain.
Figure 1. The patient’s electrocardiogram on admission. See text for interpretation.
On physical examination, he is a physically fit man in obvious distress. His jugular veins are not distended, and no lymph nodes are palpable in his neck. The heart sounds are muffled without murmurs, but a faint pericardial friction rub is heard that persists even when he holds his breath. His lungs are clear to auscultation, his abdomen is normal, and his lower extremities are warm, with normal pulses and no edema. Of note, neither a Kussmaul sign nor a paradoxical pulse is present. An electrocardiogram is ordered (Figure 1).
While blood samples are being drawn, we learn more about his history. He has hypertension, for which he takes amlodipine (Norvasc), and gastroesophageal reflux under control with esomeprazole (Nexium). He says he does not have hyperlipidemia, diabetes, or coronary artery disease and his surgical history is unremarkable. He says he does not smoke, rarely drinks, and does not use any drugs. No one in his family has had premature coronary artery disease.
He says he has had similar symptoms in the past few months, which resulted in two emergency room visits. Electrocardiograms at those times were unremarkable, and a stress test was negative for ischemia.
A computed tomographic (CT) scan of the chest was also obtained during one of those visits. The scan was negative for a pulmonary embolus but incidentally showed liver hemangiomas.
He goes on to add that his chest pain has recently increased in frequency, and it has occurred daily for the past 5 days. The pain is not related to exertion, occurs throughout the day, and is associated with significant shortness of breath. It worsens when he is taking a deep breath and improves when he leans forward. Although he is febrile, he says he has had no fevers or chills in the past. He gives no history of weight loss, cough, orthopnea, or paroxysmal nocturnal dyspnea, but has been experiencing malaise, weakness, and myalgia for the past month. His review of systems is otherwise negative.
The patient’s initial laboratory results are shown in Table 1.
WHAT IS THE CAUSE OF HIS CHEST PAIN?
1. Which is the most likely cause of this patient’s chest pain?
Acute myocardial infarction
Acute pericarditis
Myocarditis
Pulmonary embolism
Aortic dissection
Pneumonia
Acute myocardial infarction. This is a young man with chest pain, ST-segment elevation, and elevated cardiac enzymes. Acute myocardial infarction should always be included in the differential diagnosis of such a patient, as recognizing it early and making an effort to rapidly restore blood flow to the myocardium can greatly improve the clinical outcome. However, particular features in his electrocardiogram and the duration and nature of his chest pain suggest another diagnosis.
Acute pericarditis causes pleuritic chest pain with diffuse ST-segment elevation, and its electrocardiographic changes may be difficult to distinguish from those of ischemia. The features in our patient’s electrocardiogram that point to pericarditis are1:
ST-segment elevation that is concave upward, occurring in all leads except aVR
T waves concordant with ST-segment deviation
PR-segment depression, sparing V1 and aVR
PR-segment elevation and ST depression in aVR.
Pleuritic chest pain is the most common symptom in acute pericarditis. A prodrome of fever, myalgia, and malaise is also common, especially in younger patients.2 On physical examination, a pericardial friction rub is pathognomonic.
Our patient has most if not all of the classic features of acute pericarditis. Elevated cardiac enzymes, which this patient has, are not a classic feature of pericarditis and are generally considered a marker of cardiac ischemia. However, because the myocardium is adjacent to the pericardium, the acute inflammatory process of acute pericarditis may also result in myocardial injury, resulting in release of creatine kinase-MB.3
An increase in cardiac troponin is also frequently observed in acute pericarditis, reflecting biochemical evidence of inflammatory myocardial cell damage.4 Furthermore, cardiac troponin can be elevated in several other medical conditions,5 such as ischemic heart disease, congestive heart failure, myocarditis, pulmonary embolism, severe pulmonary hypertension, significant left ventricular hypertrophy, renal failure, sepsis, critical illness, and subarachnoid hemorrhage. Therefore, cardiac enzymes are not good markers to distinguish between acute myocardial infarction and acute pericarditis. However, echocardiography is an effective way to help differentiate pericarditis from myocardial ischemia in the setting of elevated troponins and electrocardiographic changes, by determining if wall-motion abnormalities are present or absent.
Hence, the diagnosis of acute pericarditis should take into account the combination of the clinical picture, electrocardiographic findings, and laboratory values. Overreliance on any of these in isolation can lead to misdiagnosis.
Pulmonary embolism is another common cause of acute-onset pleuritic chest pain and dyspnea. Electrocardiographic changes can include ST-segment elevation, and cardiac enzymes can be elevated, although this is uncommon.
Myocarditis is commonly due to infections, collagen vascular diseases, or medications. Hallmarks of this disease are elevated cardiac enzymes and myocardial damage that results in reduction in heart function.
Aortic dissection typically causes a sharp, tearing chest pain that radiates to the back. This diagnosis is unlikely in this patient.
Pneumonia. Although our patient did not have a cough and no crackles were heard on lung examination to suggest pneumonia, his fever, pleuritic chest pain, and leukocytosis with a left shift warrant a workup for it. A parapneumonic effusion could manifest with fevers and pleuritic chest pain. However, the acuity of the symptoms and the characteristic electrocardiographic changes and elevated cardiac enzymes are better explained by the other diagnoses, notably acute pericarditis.
ACUTE PERICARDITIS: WHAT IS THE CAUSE?
2. Which is the most common cause of acute pericarditis?
Idiopathic
Neoplasm
Autoimmune
Tuberculosis
Most (approximately 80%) of cases of acute pericarditis are idiopathic.6,7 In a study in 100 patients with acute pericarditis,6 a specific cause was identified in only 22. The most common identified cause was neoplasm, which was present in seven patients: four with lung cancer and one each with breast carcinoma, cystic duct adenocarcinoma, and cardiac angiosarcoma.
A more recent study in 453 patients revealed similar results: 377 (83.2%) of the cases were idiopathic, 23 (5.1%) were neoplastic, 17 (3.8%) were due to tuberculosis, 33 (7.3%) were autoimmune, and 3 (0.7%) were purulent. Of note, viral causes are categorized as idiopathic, since the diagnostic workup is usually unsuccessful and treatment is empiric6; therefore, most of the so-called idiopathic cases are likely viral. Table 2 summarizes the most common specific causes of acute pericarditis.
CASE CONTINUES: PERICARDIAL EFFUSION
The patient is admitted to the hospital for additional workup. His fever, myalgia, and chest pain persist, though the pain is less intense than before.
A chest roentgenogram and transthoracic echocardiogram are ordered and blood cultures are drawn.
The roentgenogram shows marked cardiomegaly, bilateral small pleural effusions, and minimal atelectatic changes in the lungs.
Echocardiography reveals a normal ejection fraction (60%) and a moderate-sized pericardial effusion without evidence of tamponade.
3. Which is the most common cause of pericardial effusion?
Idiopathic
Infection
Malignancy
Collagen vascular disease
Pericardial effusion is relatively common after acute pericarditis but also has many other possible causes. In a study of 204 patients with pericardial effusion,8 48% of cases were labeled as idiopathic. Of the remaining 52%, the most common specific diagnoses were infection (16%) and cancer (15%). Collagen vascular disease accounted for 8% of the cases and included systemic lupus erythematosus, rheumatoid arthritis, and scleroderma.
Although small pericardial effusions are common in pericarditis, larger pericardial effusions or failure to respond to therapy necessitates additional workup.2
In our patient, an extensive workup is initiated to look for bacterial, viral, fungal, and autoimmune causes of pericardial effusion, but the results of the workup are negative.
TREATING ACUTE PERICARDITIS
4. Which is the most appropriate treatment for acute pericarditis?
Steroids
A nonsteroidal anti-inflammatory drug (NSAID) or aspirin
Opioids
Colchicine
Colchicine plus an NSAID or aspirin
An NSAID or aspirin is the basis of treatment for acute pericarditis and is very effective in relieving symptoms. Aspirin 2–4 g daily, indomethacin (Indocin) 75–225 mg daily, or ibuprofen (Motrin) 1,600–3,200 mg daily are prescribed most often; ibuprofen is preferred because it has a lower incidence of adverse effects than the others.9
Colchicine is recommended in addition to aspirin or NSAIDs for the treatment of acute pericarditis. Although in the past colchicine was reserved for recurrent pericarditis, the Colchicine for Acute Pericarditis (COPE) trial10 found it to be beneficial for first episodes of pericarditis as well.10 In this study, patients were randomized to receive conventional treatment with aspirin 800 mg every 6 or 8 hours or aspirin at the same dose combined with colchicine 0.5 to 1.0 mg daily. Colchicine showed significant benefit over conventional therapy, resulting in reduced rates of recurrence.
CASE CONTINUES: HEPATIC LESIONS ON MRI
Although aspirin and colchicine were started at the time of admission, our patient’s symptoms fail to improve. A suspicion remains that a neoplastic disorder could be the underlying cause of the presentation and could explain his chronic malaise, pericardial disease, and fever. In view of the liver hemangiomas reported previously on CT, we decide to evaluate the liver further with magnetic resonance imaging (MRI).
Figure 2. Magnetic resonance imaging shows multiple lesions in the liver.
To our surprise, the MRI reveals innumerable hepatic lesions, some of which show radiographic features consistent with hemangiomas, while the remainder are atypical and appear to warrant a biopsy (Figure 2). An oncology consultation is obtained and the need for biopsy is confirmed.
Since our patient’s symptoms have improved significantly during the past few days and his fever has resolved, biopsy is scheduled on an outpatient basis. Biopsy with ultrasonographic guidance is performed a week later and yields a pathologic diagnosis of hemangioma. The improvement, however, is short-lived, and his pain and dyspnea recur after 2 months. A follow-up echocardiogram is ordered.
A remarkable echocardiographic finding
Figure 3. Echocardiogram, four-chamber view, showing the tumor (crosshairs) in the right atrium (RA). LA = left atrium, LV = left ventricle, RV = right ventricle.
To our astonishment, the echocardiogram reveals a mass in the right atrial free wall and right ventricle that appears to be invading the myocardial tissue (Figure 3).
The original echocardiogram that was performed a little over 2-1/2 months ago is re-reviewed. It very subtly suggests a complexity to the pericardial effusion in the area of the current mass, apparent only when the two studies are directly compared. Clearly, there has been interval development of a mass easily detectable by echocardiography. Although a small mass may have been obscured by the pericardial effusion in the original echocardiogram, the development of a mass of this size in such a short time suggests a rapidly growing tumor.
Figure 4. Cardiac MRI; arrow points to the tumor. RA = right atrium, RV = right ventricle, LA = left atrium, LV = left ventricle.
Cardiac MRI is performed, which confirms the finding and characterizes the mass as measuring 5.1 by 4.8 cm within the pericardial space adjacent to the right atrium and atrioventricular groove and adherent to the right atrium. There are small excrescences of soft tissue through the midportion of the right atrial wall, suggesting tissue invasion (Figure 4).
CARDIAC TUMORS
5. Which is the most common primary cardiac tumor?
Myxoma
Papillary fibroelastoma
Sarcoma
Lymphoma
Primary cardiac tumors are rare, with an incidence on autopsy series ranging between 0.0017% and 0.33%,11,12 making them far less common than metastases to the heart.
Myxomas are benign cardiac tumors and are the most common primary cardiac neoplasm. Approximately 80% of myxomas originate in the left atrium, typically presenting with one or more of the triad of intracardiac obstruction, systemic embolization, and constitutional symptoms.14
Cardiac papillary fibroelastomas, the second most common cardiac tumors, are benign and predominantly affect the cardiac valves.15
Only one-fourth of all cardiac tumors are malignant. Nearly all of these malignant tumors are sarcomas, with angiosarcoma being the most common morphologic type, accounting for 30% of primary cardiac sarcomas.13
Primary cardiac lymphomas are extremely rare and account for only 1.3% of all primary cardiac tumors.16
A DIAGNOSIS IS MADE
Figure 5. Liver biopsy shows cellular endothelial atypia with mitotic activity (black arrow), growth along the hepatic sinusoids, and papillary tufting (white arrow), all features of low-grade angiosarcoma.
Fluorodeoxyglucose (FDG) positron-emission tomography is done, and shows a hypermetabolic right-sided pericardial tumor in addition to several suspicious hepatic lesions with heterogeneously increased FDG uptake. Biopsy with ultrasonographic guidance is performed again and reveals tissue consistent with hemangioma in addition to other areas with features strongly suggestive of a low-grade angiosarcoma (Figure 5). Pathology findings are unable to differentiate primary cardiac angiosarcoma from a metastatic cardiac tumor; however, given the multiple liver lesions and the presence of a solitary cardiac mass, this is most likely a primary cardiac tumor with metastasis to the liver.
CARDIAC ANGIOSARCOMA
Cardiac angiosarcoma, the most common malignant primary cardiac tumor, has a predilection for the right atrium.13 These tumors tend to occur between the third and fifth decade of life and are three times more common in men than in women. Cardiac sarcomas proliferate rapidly and commonly extend into the pericardial space, causing pericardial effusion in up to one-fourth of patients.
Surgical resection is the treatment of choice, but due to the location and extent of involvement, complete resection is often difficult. Also, distant metastases are present at the time of diagnosis in 80% of cases, precluding a surgical cure.17 Adjuvant chemotherapy, radiotherapy, and even heart transplantation do not substantially improve the survival of these patients.18–20 Because no effective treatment is available, the prognosis is dismal, with a median survival of 6 to 12 months.
Our patient is discharged home to follow up with an oncologist and initiate chemotherapy.
Acknowledgment: We thank Lisa M. Yerian, MD, for interpreting the biopsy specimens described in this article.
References
Ariyarajah V, Spodick DH. Acute pericarditis: diagnostic cues and common electrocardiographic manifestations. Cardiol Rev2007; 15:24–30.
LeWinter MM, Kabbani S. Pericardial disease. In: Zipes DP, et al, editor. Braunwald's Heart Disease: A Textbook of Cardiovascular Medicine. 7th ed. Philadelphia: Elsevier/WB Saunders; 2005:1757–1781.
Karjalainen J, Heikkila J. “Acute pericarditis”: myocardial enzyme release as evidence for myocarditis”. Am Heart J1986; 111:546–552.
Brandt RR, Filzmaier K, Hanrath P. Circulating cardiac troponin I in acute pericarditis. Am J Cardiol2001; 87:1326–1328.
Jaffe AS, Babuin L, Apple FS. Biomarkers in acute cardiac disease: the present and the future. J Am Coll Cardiol2006; 48:1–11.
Zayas R, Anguita M, Torres F, et al. Incidence of specific etiology and role of methods for specific etiologic diagnosis of primary acute pericarditis. Am J Cardiol1995; 75:378–382.
Imazio M, Cecchi E, Demichelis B, et al. Indicators of poor prognosis of acute pericarditis. Circulation2007; 115:2739–2744.
Levy PY, Corey R, Berger P, et al. Etiologic diagnosis of 204 pericardial effusions. Medicine (Baltimore)2003; 82:385–391.
Lange RA, Hillis LD. Clinical practice. Acute pericarditis. N Engl J Med2004; 351:2195–2202.
Imazio M, Bobbio M, Cecchi E, et al. Colchicine in addition to conventional therapy for acute pericarditis: Results of the COlchicine for acute PEricarditis (COPE) trial. Circulation2005; 112:2012–2016.
Heath D. Pathology of cardiac tumors. Am J Cardiol1968; 21:315–327.
Wold LE, Lie JT. Cardiac myxomas: a clinicopathologic profile. Am J Pathol1980; 101:219–240.
Sabatine MS, Colucci WS, Schoen FS. Primary tumors of the heart. In: Zipes DP, et al, editor. Braunwald's Heart Disease: A Textbook of Cardiovascular Medicine. 7th ed. Philadelphia: Elsevier/WB Saunders; 2005:1741–1757.
Gowda RM, Khan IA, Nair CK, Mehta NJ, Vasavada BC, Sacchi TJ. Cardiac papillary fibroelastoma: a comprehensive analysis of 725 cases. Am Heart J2003; 146:404–410.
Glancy DL, Morales JB, Roberts WC. Angiosarcoma of the heart. Am J Cardiol1968; 21:413–419.
Ceresoli GL, Ferreri AJ, Bucci E, Ripa C, Ponzoni M, Villa E. Primary cardiac lymphoma in immunocompetent patients: diagnostic and therapeutic management. Cancer1997; 80:1497–1506.
Bear PA, Moodie DS. Malignant primary cardiac tumors. The Cleveland Clinic experience, 1956 to 1986. Chest1987; 92:860–862.
Llombart–Cussac A, Pivot X, Contesso G, et al. Adjuvant chemotherapy for primary cardiac sarcomas: the IGR experience. Br J Cancer1998; 78:1624–1628.
Putnam JB, Sweeney MS, Colon R, Lanza LA, Frazier OH, Cooley DA. Primary cardiac sarcomas. Ann Thorac Surg1991; 51:906–910.
Conklin LD, Reardon MJ. Autotransplantation of the heart for primary cardiac malignancy: development and surgical technique. Tex Heart Inst J2002; 29:105–108.
A 43-year-old woman presents to the emergency department with substernal chest pressure of moderate intensity that started approximately 6 hours ago. The pressure radiates to both arms and is accompanied by nausea. She says she has had no emesis, diaphoresis, fevers, chills, shortness of breath, abdominal pain, melena, dysuria, weight loss, headaches, change in vision, seizures, joint pain, or skin rashes. She also says she has had no prior similar episodes and has no history of myocardial infarction (MI) or stroke.
The patient has a history of gastroesophageal reflux disease and uterine fibroids. She has had three pregnancies, one ending in spontaneous abortion at 12 weeks and two ending with healthy children delivered by cesarean section. She does not take any daily medications. She has smoked one pack per day over the last 25 years. She denies using alcohol or illicit drugs.
The patient’s mother had idiopathic deep vein thrombosis (DVT) at age 46, her father had an MI at age 65, and her sister had an MI at age 43.
On examination, she is in mild distress but is alert and oriented. Her temperature is 99.0°F (37.2°C), blood pressure 98/66 mm Hg, heart rate 65 beats per minute, respiratory rate 18 breaths per minute, and oxygen saturation 99% on room air. Her body mass index is 19.5 (normal range 18.5–24.9). Her skin appears normal. Her head and neck show no obvious abnormalities, lymphadenopathy, thyromegaly, or bruits. Her heart, lungs, and abdomen are normal, as are her strength, sensation, reflexes, and gait.
Laboratory values at the time of admission:
White blood cell count 12.58 × 10⁹/L (reference range 4.0–11.0)
Hemoglobin 15.4 g/dL (12.0–16.0)
Platelet count 122 × 109/L (150–400)
International normalized ratio (INR) 1.1 (0.9–1.1)
Activated partial thromboplastin time 29.1 seconds (24.6–34).
A heart attack, and then a stroke
An initial electrocardiogram shows normal sinus rhythm, left anterior hemiblock, and nonspecific T-wave abnormalities. Cardiac enzymes are measured at intervals: her troponin T level is less than 0.01 ng/mL at the time of admission but rises to 0.75 ng/mL 3 hours later (normal range 0.0–0.1 ng/mL). Similarly, her creatine kinase-MB level is 3.3 ng/mL at admission but rises to 71.9 ng/mL 3 hours later (normal range 0.0–8.0 ng/mL).
The patient is diagnosed with non-ST-elevation MI. An intravenous heparin drip is started, and she is sent for urgent cardiac catheterization, which shows a total occlusion in a lateral obtuse marginal branch of the left circumflex artery due to a thrombus in the vessel. Otherwise, her coronary arteries are angiographically free of disease. The heparin drip is continued, and treatment is started with abciximab (ReoPro) and tissue plasminogen activator (Alteplase). She is sent to the cardiac intensive care unit for recovery, where she is placed on continuous cardiac monitoring, with no evidence of arrhythmia.
One day later, the left side of her face is drooping, her left arm is weak, and her speech is slurred. Magnetic resonance imaging of the brain shows an acute ischemic infarct in the right temporoparietal area and multiple areas of subacute to chronic ischemia. Magnetic resonance angiography of the brain indicates patent vessels. Both transthoracic and transesophageal echocardiography are performed and indicate normal left ventricular size, ejection fraction of 55%, valves without thrombus or vegetations, aorta with mild atheroma, and no patent foramen ovale by Doppler flow or agitated saline contrast study. Carotid artery Doppler ultrasonography shows 40% to 59% stenosis bilaterally.
ARTERIAL THROMBOSIS
1. Which of the following is a risk factor for arterial thrombosis?
Atherosclerosis
Protein C deficiency
Use of oral contraceptive pills
The factor V Leiden mutation
Protein C deficiency, the use of oral contraceptives, and the factor V Leiden mutation are typically associated with venous thrombosis1; they have been documented as a cause of arterial thrombosis only in some case reports. In contrast, atherosclerosis is a well-established risk factor for arterial thrombosis.
Arterial occlusion can be due to thrombosis, embolism, or trauma
The causes of arterial occlusion can be categorized as thrombotic, embolic, or traumatic (Table 1).
Atherosclerosis is a risk factor for thrombosis and can be a source of emboli. Atherosclerotic plaque rupture may release inflammatory mediators, which also predispose to thrombosis.2 This patient’s coronary arteries are essentially free of atherosclerotic disease per angiography. However, studies of intravascular ultrasonography have shown that coronary angiography may not detect all atherosclerotic plaques, as angiography can show only the lumen of the artery and not the plaque itself.3 For that reason, atherosclerosis has not been ruled out completely, and further workup is needed to evaluate other possible causes of her thrombotic events.
Embolism is the most likely cause of her stroke, however. Cases of arterial embolism can be classified on the basis of the origin of the thrombus, ie, the heart, an artery, or the venous system via a patent foramen ovale (paradoxical embolism). This patient’s echocardiogram reveals mild aortic atheroma, which can be a source of emboli, especially soon after intervention.
Case continues: Acute and recurrent DVT
While recovering from her MI and stroke, the patient develops edema and pain in both legs. Doppler ultrasonography is performed, which reveals acute DVT in the right gastrocnemius and posterior tibial veins and left soleal vein, despite her continued heparin therapy.
Her platelet count is 189 × 109/L, so heparin-induced thrombocytopenia is not suspected; the new DVT is thought to be due to her hospitalization. Several days later, oral warfarin (Coumadin) is started and titrated to an INR of 2.0 to 3.0, the heparin is phased out, and the patient is sent home.
In the first few months after discharge, the patient presents to the emergency department three times with severe leg pain, and each time she is found to have extensive DVT in various leg veins even though she is complying with her warfarin therapy. At each visit, her INR is in the range of 2.5 to 3.1.
Comment. Her recurrent DVT warrants further evaluation for risk factors for venous thrombosis, which can be divided into hereditary and acquired factors.
Hereditary risk factors include the factor V Leiden mutation, the prothrombin gene mutation, hyperhomocysteinemia, dysfibrinogenemia, and deficiencies of protein C, protein S, and antithrombin.
Acquired risk factors include the antiphospholipid antibody syndrome, cancer, immobilization, surgery, congestive heart failure, pregnancy, use of hormonal contraceptives, hormone replacement therapy, nephrotic syndrome, trauma, and infection.1,4
TESTING FOR HYPERCOAGULABLE STATES
2. In view of our patient’s recurrent thrombotic episodes, should she be tested for hypercoagulable states?
Yes
No
Testing for hypercoagulable conditions is warranted if it will affect the patient’s management or outcome. Some authorities recommend testing patients who are clinically characterized as “strongly” thrombophilic,5 ie, those who present with DVT and are younger than age 50, have recurrent thrombotic episodes, have a first-degree relative with documented thromboembolism before age 50, or have thrombotic episodes despite warfarin therapy.
This patient should be tested for hypercoagulable conditions because her initial DVT occurred before age 50 (at age 43), she has had recurrent, apparently idiopathic thrombotic episodes, she has a family history of thromboembolism, and she had clots while on therapeutic warfarin therapy, all of which suggest a hypercoagulable state. Furthermore, the confirmation of her diagnosis may affect her medical management, as it may determine if further testing and therapies are needed.
Case continues: Tests are negative
Laboratory tests for hypercoagulable conditions are performed and are negative for the factor V Leiden mutation, the prothrombin gene mutation, antithrombin deficiency, and protein C and S deficiencies. A screen for antiphospholipid antibodies is indeterminate.
TREATMENT AFFECTS TEST RESULTS
3. If a patient is on warfarin therapy, which test results may be affected?
Antithrombin levels
Protein C and S levels
Factor V Leiden mutation
Warfarin decreases the levels of proteins C and S; therefore, the levels of these substances cannot be accurately interpreted in a patient taking warfarin.
All anticoagulants prolong the clotting time and may affect the results of assays based on the clotting time, such as the prothrombin time, the partial thromboplastin time, the dilute Russell’s viper venom time (DRVVT), the hexagonal phase phospholipid neutralization assay, the thrombin time, and clottable protein C and protein S. Heparin reduces the level of antithrombin; however, laboratories now have heparin-binding agents that reduce the effect of heparin in clotting studies.
Acute thrombotic states lower the levels of antithrombin and proteins C and S.
Assays not based on the clotting time (immunogenic or genetic tests such as those for anticardiolipin antibodies and the factor V Leiden and prothrombin gene mutations) are not affected by anticoagulant use.5
However, the presence or absence of a hypercoagulable state should not affect the treatment of acute DVT, and a full 6- to 12-month course of anticoagulation should be completed.6,7 If possible, lupus anticoagulant testing should be repeated 2 weeks after anticoagulation is stopped.8
This patient needs lifelong anticoagulation because of her repeated thrombotic episodes. Stopping the medication for 2 weeks for testing would increase the risk of rethrombosis in this patient, and most experts would not advise it.
In summary, testing for hypercoagulable conditions is not recommended during an acute thrombotic episode and is preferably performed while the patient is not on anticoagulation therapy. If the patient is already on anticoagulation, the results of tests for hypercoagulable conditions should be interpreted with caution.
Case continues: Another stroke
During the subsequent year, the patient’s primary care physician monitors her warfarin use and sends her for age-appropriate cancer screening, including a breast examination, Papanicolaou smear, and mammography. Also, given her history of smoking, a chest radiograph is ordered. All of these studies are normal. In addition, evaluations for hematologic disorders such as myelodysplastic syndrome, polycythemia vera, and Waldenström macroglobulinema reveal normal complete blood counts and normal results on serum and urine protein electrophoresis.
Later that year, she returns to the emergency department with complete aphasia and total right-sided paralysis. Magnetic resonance imaging shows an acute infarct in the left frontal operculum, a subacute infarct in the right cerebellum, and multiple chronic cortical and subcortical infarcts throughout the brain. Ultrasonography shows an extensive new DVT in her right leg. Her INR at this time is 3.1.
WHAT CONDITIONS CAUSE BOTH ARTERIAL AND VENOUS THROMBOSIS?
4. Given that the patient has evidence of both recurrent arterial and venous thromboses, which of the following conditions is likely?
Antiphospholipid antibody syndrome
Heparin-induced thrombocytopenia
Malignancy
All of the above
Conditions associated with both arterial and venous thrombosis include antiphospholipid antibody syndrome, heparin-induced thrombocytopenia, malignancy, paradoxical embolism, hyperhomocysteinemia, myeloproliferative disorders, myelodysplastic disorder, paraproteinemia, vasculitis, and paroxysmal nocturnal hemoglobinuria.1,4
The hypercoagulability associated with malignancy is also known as Trousseau syndrome. This term was originally used to describe migratory thrombophlebitis as a forewarning for occult visceral malignancy, and has grown over the years to describe malignancy-induced hypercoagulability.9
At present, the exact mechanism that causes Trousseau syndrome is unknown. Some hypotheses implicate mucin (produced by the cancer),10 tissue factor,11 tumor-associated cysteine proteinase,12 tumor hypoxia,13 and oncogene activation as plausible triggers for this syndrome.
As stated above, the patient has a normal platelet count and negative results on cancer screening tests. Tests for antiphospholipid antibodies and lupus anticoagulant are repeated. Tests for the specific antiphospholipid antibodies against beta-2 glycoprotein I and cardiolipin are negative (Table 2). However, the test for lupus anticoagulant is positive by the criteria of the International Society on Thrombosis and Haemostasis: the patient has a prolonged clotting time screening test (hexagonal phase screen, DRVVT screen), positive mixing study (DRVVT 1:1 mix and circulating anticoagulant), positive phospholipid dependence (hexagonal phase screen, confirm, and delta; DRVVT confirm ratio; and platelet neutralization procedure), and no evidence of other factor-specific inhibitors (Table 3).14
DOES SHE HAVE ANTIPHOSPHOLIPID ANTIBODY SYNDROME?
5. The patient is positive for lupus anticoagulant. Does she have antiphospholipid antibody syndrome?
Yes
No
Repeat testing is needed to meet the diagnostic criteria
The Sapporo criteria15 indicate that antiphospholipid antibody syndrome is present if at least one clinical criterion and one laboratory criterion are met. The clinical criteria are one or more episodes of arterial or venous thrombosis or pregnancy-related morbidity, ie:
Unexplained intrauterine fetal death at 10 weeks gestation or later with no apparent fetal abnormality
Premature births of a morphologically normal fetus at less than 34 weeks of gestation due to preeclampsia, eclampsia, or placental insufficiency
Three or more spontaneous abortions at 10 weeks of gestation or earlier, with no known paternal chromosomal abnormalities or maternal hormonal abnormalities and normal maternal anatomy.
The laboratory criteria are:
Lupus anticoagulant present
Anticardiolipin antibody (IgG or IgM) titer greater than 40 IgG antiphospholipid units (GPL) or IgM antiphospholipid units (MPL) or higher than the 99th percentile of the testing laboratory normal reference range
Anti-beta-2 glycoprotein-I antibody (IgG or IgM) titer greater than 20 GPL or MPL or higher than the 99th percentile of the testing laboratory normal reference range.
The patient likely has antiphospholipid antibody syndrome because her lupus anticoagulant screen is positive and she meets the clinical criteria of thrombosis, and she should continue to be treated accordingly. However, to officially meet the revised Sapporo criteria, she would need to have laboratory tests that are positive on two or more occasions at least 12 weeks apart.
Case continues: Lung cancer is found
The patient reports that she has lost 10 pounds in 4 months. Since age-appropriate cancer testing was previously performed, a more extensive evaluation for weight loss is undertaken, with computed tomography of the chest, abdomen, and pelvis. These tests reveal a nodule in the right upper lobe of the lung, scarring in the right middle and left lower lung lobes, and hilar lymphadenopathy. Bronchoscopy with transbronchial biopsy confirms that she has adenocarcinoma of the lung.
6. What is suggested as a sufficient workup for malignancy in patients with idiopathic venous thromboembolism?
Computed tomography of the chest, abdomen, and pelvis for every patient with idiopathic venous thromboembolism
Positron emission tomography and tumor marker levels
A comprehensive history and physical examination, routine laboratory tests, chest radiography, age- and sex-specific cancer screening, and patient-specific testing as indicated clinically
To date, there is no evidence to support a cancer evaluation beyond a comprehensive medical history and physical examination, routine laboratory testing, chest radiography, and age- and sex-specific cancer screening unless it is dictated by the patient’s clinical presentation. A study by Cornuz et al16 suggested that this approach is appropriate for detecting cancer in patients with idiopathic venous thromboembolism.
A 2004 study17 attempted to answer the question of what to do about patients who have idiopathic venous thromboembolism but no other signs or symptoms that raise any clinical suspicion of cancer. This study randomized patients with idiopathic venous thromboembolism to undergo either routine medical management or an extensive malignancy evaluation. The evaluation included ultrasonography of the abdomen and pelvis, computed tomography of the abdomen and pelvis, gastroscopy or a double-contrast barium swallow study, colonoscopy or sigmoidoscopy followed by a barium enema, stool occult blood testing, and sputum cytology. Women were also tested for the tumor markers carcinoembryonic antigen, alpha-fetoprotein, and CA-125, and they underwent mammography and Papanicolaou testing; men were tested for prostate-specific antigen and underwent ultrasonography of the prostate. The results of the study did not reveal a statistically significant survival benefit in the group that underwent extensive cancer evaluation.
These studies indicate that the decision to test for cancer should be guided by clinical suspicion. Our patient lost 10 pounds in 4 months, smokes, and has had recurrent venous thromboembolism, so testing was appropriate.
After her diagnosis with adenocarcinoma of the lung, the patient has yet another DVT despite an INR of 3.1 and treatment with warfarin and aspirin.
LOW-MOLECULAR-WEIGHT HEPARIN FOR PATIENTS WITH CANCER?
7. True or false? Low-molecular-weight heparin is more effective than warfarin in preventing DVT in cancer patients without increasing the bleeding risk.
True
False
This statement is true. The American College of Chest Physicians (ACCP) recommends immediate treatment of DVT with low-molecular-weight heparin for 6 to 12 months after a thrombotic event in a patient with malignancy.6,18
Two major studies provide evidence for these recommendations: the Comparison of Low-Molecular-Weight Heparin Versus Oral Anticoagulant Therapy for the Prevention of Recurrent Venous Thromboembolism in Patients With Cancer (CLOT)19 and the Trial of the Effect of Low-Molecular-Weight Heparin Versus Warfarin on Mortality in the Long-Term Treatment of Proximal Deep Vein Thrombosis (LITE)20 studies.
The CLOT19 study showed that dalteparin (Fragmin) 200 IU/kg subcutaneously once daily for l month and then 150 IU/kg once daily was more effective than oral warfarin titrated to an INR of 2.5 and did not increase the risk of bleeding.
The LITE trial20 showed the efficacy of tinzaparin (Innohep) 175 IU/kg subcutaneously daily, which can be used as an alternative.
Enoxaparin sodium (Lovenox) 1.5 mg/kg once daily has also been used. However, if low-molecular-weight heparin is not available, warfarin titrated to an INR of 2 to 3 is also acceptable.18
The ACCP consensus panel recommends giving anticoagulation for an initial 6 to 12 months and continuing it as long as there is evidence of active malignancy.6 The American Society for Clinical Oncology also recommends placement of an inferior vena cava filter for patients who have contraindications to anticoagulation or for whom low-molecular-weight heparin fails.18
Case continues: Summing up
In conclusion, our patient had an underlying malignancy, causing Trousseau syndrome. Before her cancer was diagnosed, she also had test results that suggested antiphospholipid antibody syndrome. Both of these conditions likely contributed to her hypercoagulable state, increasing her propensity for clotting and causing her recurrent thrombosis. The patient is currently on low-molecular-weight heparin and is undergoing palliative chemotherapy for metastatic adenocarcinoma of the lung. To this date, she has not had any new thrombotic events.
TAKE-HOME POINTS
Risk factors for arterial occlusion can be divided into thrombotic, embolic, and traumatic categories.
Risk factors for venous thrombosis can be divided into hereditary and acquired categories.
Evaluation for hypercoagulable conditions is recommended if it will affect patient management or outcome. Patients to be considered for testing include those with idiopathic DVT and who are under age 50, those with a history of recurrent thrombosis, and those with a first-degree relative with documented venous thromboembolism before age 50.
Evaluation for hypercoagulable conditions should ideally be performed either before starting anticoagulation therapy or 2 weeks after completing it.
Potential causes of both arterial and venous thrombosis include antiphospholipid antibody syndrome, cancer, hyperhomocysteinemia, heparin-induced thrombocytopenia, paradoxical emboli, myeloproliferative disorders, myelodysplastic syndrome, paraproteinemia, vasculitis, and paroxysmal nocturnal hemoglobinuria.
Current evidence does not support an extensive cancer evaluation in patients with idiopathic venous thromboembolism, unless dictated by the patient’s clinical condition.
In patients with venous thromboembolism and active malignancy, anticoagulation is recommended for at least 6 to 12 months and as long as there is evidence of active malignancy.
References
Levine JS, Branch DW, Rauch J. The antiphospholipid syndrome. N Engl J Med2002; 346:752–763.
Yamashita T, Colombo A, Tobis JM. Limitations of coronary angiography compared with intravascular ultrasound: implications for coronary interventions. Prog Cardiovasc Dis1999; 42:91–138.
Bauer KA. The thrombophilias: well-defined risk factors with uncertain therapeutic implications. Ann Intern Med2001; 135:367–373.
Buller HR, Agnelli G, Hull RD, Hyers TM, Prins MH, Raskob GE. Antithrombotic therapy for venous thromboembolic disease: the seventh ACCP conference on antithrombotic and thrombolytic therapy. Chest2004; 126suppl 3:401S–428S.
Locke CF, Evans NC. Evaluating idiopathic venous thromboembolism: what is necessary, what is not. J Fam Pract2003; 52:770–777.
Haemostasis and Thrombosis Task Force, British Committee for Standards in Haematology. Investigation and management of heritable thrombophilia. Br J Haematol2001; 114:512–528.
Varki A. Trousseau’s syndrome: multiple definitions and multiple mechanisms. Blood2007; 110:1723–1729.
Pineo GF, Brain MC, Gallus AS, Hirsh J, Hatton MW, Regoeczi E. Tumors, mucus production, and hypercoagulability. Ann N Y Acad Sci1974; 230:262–270.
Zacharski LR, Schned AR, Sorenson GD. Occurrence of fibrin and tissue factor antigen in human small cell carcinoma of the lung. Cancer Res1983; 43:3963–3968.
Falanga A, Gordon SG. Isolation and characterization of cancer pro-coagulant: a cysteine proteinase from malignant tissue. Biochemistry1985; 24:5558–5567.
Denko NC, Giaccia AJ. Tumor hypoxia, the physiological link between Trousseau’s syndrome (carcinoma-induced coagulopathy) and metastasis. Cancer Res2001; 61:795–798.
Brandt JT, Barna LK, Triplett DA. Laboratory identification of lupus anticoagulants: results of the Second International Workshop for Identification of Lupus Anticoagulants. On behalf of the Subcommittee on Lupus Anticoagulants/Antiphospholipid Antibodies of the ISTH. Thromb Haemost1995; 74:1597–1603.
Miyakis S, Lockshin MD, Atsumi T, et al. International consensus statement on an update of the classification criteria for definite antiphospholipid syndrome (APS). J Thromb Haemost2006; 4:295–306.
Cornuz J, Pearson SD, Creager MA, Cook EF, Goldman L. Importance of findings on the initial evaluation for cancer in patients with symptomatic idiopathic deep venous thrombosis. Ann Intern Med1996; 125:785–793.
Piccioli A, Lensing AW, Prins MH, et al. Extensive screening for occult malignant disease in idiopathic venous thromboembolism: a prospective randomized clinical trial. J Thromb Haemost2004; 2:884–889.
Lyman GH, Khorana AA, Falanga A, et al. American Society of Clinical Oncology guideline: recommendations for venous thromboembolism prophylaxis and treatment in patients with cancer. J Clin Oncol2007; 25:5490–5505.
Lee AY, Levine MN, Baker RI, et al. Low-molecular-weight heparin versus a coumarin for the prevention of recurrent venous thromboembolism in patients with cancer. N Engl J Med2003; 349:146–153.
Hull RD, Pineo GF, Brant RF, et al. Long-term low-molecular-weight heparin versus usual care in proximal-vein thrombosis patients with cancer. Am J Med2006; 119:1062–1072.
A 43-year-old woman presents to the emergency department with substernal chest pressure of moderate intensity that started approximately 6 hours ago. The pressure radiates to both arms and is accompanied by nausea. She says she has had no emesis, diaphoresis, fevers, chills, shortness of breath, abdominal pain, melena, dysuria, weight loss, headaches, change in vision, seizures, joint pain, or skin rashes. She also says she has had no prior similar episodes and has no history of myocardial infarction (MI) or stroke.
The patient has a history of gastroesophageal reflux disease and uterine fibroids. She has had three pregnancies, one ending in spontaneous abortion at 12 weeks and two ending with healthy children delivered by cesarean section. She does not take any daily medications. She has smoked one pack per day over the last 25 years. She denies using alcohol or illicit drugs.
The patient’s mother had idiopathic deep vein thrombosis (DVT) at age 46, her father had an MI at age 65, and her sister had an MI at age 43.
On examination, she is in mild distress but is alert and oriented. Her temperature is 99.0°F (37.2°C), blood pressure 98/66 mm Hg, heart rate 65 beats per minute, respiratory rate 18 breaths per minute, and oxygen saturation 99% on room air. Her body mass index is 19.5 (normal range 18.5–24.9). Her skin appears normal. Her head and neck show no obvious abnormalities, lymphadenopathy, thyromegaly, or bruits. Her heart, lungs, and abdomen are normal, as are her strength, sensation, reflexes, and gait.
Laboratory values at the time of admission:
White blood cell count 12.58 × 10⁹/L (reference range 4.0–11.0)
Hemoglobin 15.4 g/dL (12.0–16.0)
Platelet count 122 × 109/L (150–400)
International normalized ratio (INR) 1.1 (0.9–1.1)
Activated partial thromboplastin time 29.1 seconds (24.6–34).
A heart attack, and then a stroke
An initial electrocardiogram shows normal sinus rhythm, left anterior hemiblock, and nonspecific T-wave abnormalities. Cardiac enzymes are measured at intervals: her troponin T level is less than 0.01 ng/mL at the time of admission but rises to 0.75 ng/mL 3 hours later (normal range 0.0–0.1 ng/mL). Similarly, her creatine kinase-MB level is 3.3 ng/mL at admission but rises to 71.9 ng/mL 3 hours later (normal range 0.0–8.0 ng/mL).
The patient is diagnosed with non-ST-elevation MI. An intravenous heparin drip is started, and she is sent for urgent cardiac catheterization, which shows a total occlusion in a lateral obtuse marginal branch of the left circumflex artery due to a thrombus in the vessel. Otherwise, her coronary arteries are angiographically free of disease. The heparin drip is continued, and treatment is started with abciximab (ReoPro) and tissue plasminogen activator (Alteplase). She is sent to the cardiac intensive care unit for recovery, where she is placed on continuous cardiac monitoring, with no evidence of arrhythmia.
One day later, the left side of her face is drooping, her left arm is weak, and her speech is slurred. Magnetic resonance imaging of the brain shows an acute ischemic infarct in the right temporoparietal area and multiple areas of subacute to chronic ischemia. Magnetic resonance angiography of the brain indicates patent vessels. Both transthoracic and transesophageal echocardiography are performed and indicate normal left ventricular size, ejection fraction of 55%, valves without thrombus or vegetations, aorta with mild atheroma, and no patent foramen ovale by Doppler flow or agitated saline contrast study. Carotid artery Doppler ultrasonography shows 40% to 59% stenosis bilaterally.
ARTERIAL THROMBOSIS
1. Which of the following is a risk factor for arterial thrombosis?
Atherosclerosis
Protein C deficiency
Use of oral contraceptive pills
The factor V Leiden mutation
Protein C deficiency, the use of oral contraceptives, and the factor V Leiden mutation are typically associated with venous thrombosis1; they have been documented as a cause of arterial thrombosis only in some case reports. In contrast, atherosclerosis is a well-established risk factor for arterial thrombosis.
Arterial occlusion can be due to thrombosis, embolism, or trauma
The causes of arterial occlusion can be categorized as thrombotic, embolic, or traumatic (Table 1).
Atherosclerosis is a risk factor for thrombosis and can be a source of emboli. Atherosclerotic plaque rupture may release inflammatory mediators, which also predispose to thrombosis.2 This patient’s coronary arteries are essentially free of atherosclerotic disease per angiography. However, studies of intravascular ultrasonography have shown that coronary angiography may not detect all atherosclerotic plaques, as angiography can show only the lumen of the artery and not the plaque itself.3 For that reason, atherosclerosis has not been ruled out completely, and further workup is needed to evaluate other possible causes of her thrombotic events.
Embolism is the most likely cause of her stroke, however. Cases of arterial embolism can be classified on the basis of the origin of the thrombus, ie, the heart, an artery, or the venous system via a patent foramen ovale (paradoxical embolism). This patient’s echocardiogram reveals mild aortic atheroma, which can be a source of emboli, especially soon after intervention.
Case continues: Acute and recurrent DVT
While recovering from her MI and stroke, the patient develops edema and pain in both legs. Doppler ultrasonography is performed, which reveals acute DVT in the right gastrocnemius and posterior tibial veins and left soleal vein, despite her continued heparin therapy.
Her platelet count is 189 × 109/L, so heparin-induced thrombocytopenia is not suspected; the new DVT is thought to be due to her hospitalization. Several days later, oral warfarin (Coumadin) is started and titrated to an INR of 2.0 to 3.0, the heparin is phased out, and the patient is sent home.
In the first few months after discharge, the patient presents to the emergency department three times with severe leg pain, and each time she is found to have extensive DVT in various leg veins even though she is complying with her warfarin therapy. At each visit, her INR is in the range of 2.5 to 3.1.
Comment. Her recurrent DVT warrants further evaluation for risk factors for venous thrombosis, which can be divided into hereditary and acquired factors.
Hereditary risk factors include the factor V Leiden mutation, the prothrombin gene mutation, hyperhomocysteinemia, dysfibrinogenemia, and deficiencies of protein C, protein S, and antithrombin.
Acquired risk factors include the antiphospholipid antibody syndrome, cancer, immobilization, surgery, congestive heart failure, pregnancy, use of hormonal contraceptives, hormone replacement therapy, nephrotic syndrome, trauma, and infection.1,4
TESTING FOR HYPERCOAGULABLE STATES
2. In view of our patient’s recurrent thrombotic episodes, should she be tested for hypercoagulable states?
Yes
No
Testing for hypercoagulable conditions is warranted if it will affect the patient’s management or outcome. Some authorities recommend testing patients who are clinically characterized as “strongly” thrombophilic,5 ie, those who present with DVT and are younger than age 50, have recurrent thrombotic episodes, have a first-degree relative with documented thromboembolism before age 50, or have thrombotic episodes despite warfarin therapy.
This patient should be tested for hypercoagulable conditions because her initial DVT occurred before age 50 (at age 43), she has had recurrent, apparently idiopathic thrombotic episodes, she has a family history of thromboembolism, and she had clots while on therapeutic warfarin therapy, all of which suggest a hypercoagulable state. Furthermore, the confirmation of her diagnosis may affect her medical management, as it may determine if further testing and therapies are needed.
Case continues: Tests are negative
Laboratory tests for hypercoagulable conditions are performed and are negative for the factor V Leiden mutation, the prothrombin gene mutation, antithrombin deficiency, and protein C and S deficiencies. A screen for antiphospholipid antibodies is indeterminate.
TREATMENT AFFECTS TEST RESULTS
3. If a patient is on warfarin therapy, which test results may be affected?
Antithrombin levels
Protein C and S levels
Factor V Leiden mutation
Warfarin decreases the levels of proteins C and S; therefore, the levels of these substances cannot be accurately interpreted in a patient taking warfarin.
All anticoagulants prolong the clotting time and may affect the results of assays based on the clotting time, such as the prothrombin time, the partial thromboplastin time, the dilute Russell’s viper venom time (DRVVT), the hexagonal phase phospholipid neutralization assay, the thrombin time, and clottable protein C and protein S. Heparin reduces the level of antithrombin; however, laboratories now have heparin-binding agents that reduce the effect of heparin in clotting studies.
Acute thrombotic states lower the levels of antithrombin and proteins C and S.
Assays not based on the clotting time (immunogenic or genetic tests such as those for anticardiolipin antibodies and the factor V Leiden and prothrombin gene mutations) are not affected by anticoagulant use.5
However, the presence or absence of a hypercoagulable state should not affect the treatment of acute DVT, and a full 6- to 12-month course of anticoagulation should be completed.6,7 If possible, lupus anticoagulant testing should be repeated 2 weeks after anticoagulation is stopped.8
This patient needs lifelong anticoagulation because of her repeated thrombotic episodes. Stopping the medication for 2 weeks for testing would increase the risk of rethrombosis in this patient, and most experts would not advise it.
In summary, testing for hypercoagulable conditions is not recommended during an acute thrombotic episode and is preferably performed while the patient is not on anticoagulation therapy. If the patient is already on anticoagulation, the results of tests for hypercoagulable conditions should be interpreted with caution.
Case continues: Another stroke
During the subsequent year, the patient’s primary care physician monitors her warfarin use and sends her for age-appropriate cancer screening, including a breast examination, Papanicolaou smear, and mammography. Also, given her history of smoking, a chest radiograph is ordered. All of these studies are normal. In addition, evaluations for hematologic disorders such as myelodysplastic syndrome, polycythemia vera, and Waldenström macroglobulinema reveal normal complete blood counts and normal results on serum and urine protein electrophoresis.
Later that year, she returns to the emergency department with complete aphasia and total right-sided paralysis. Magnetic resonance imaging shows an acute infarct in the left frontal operculum, a subacute infarct in the right cerebellum, and multiple chronic cortical and subcortical infarcts throughout the brain. Ultrasonography shows an extensive new DVT in her right leg. Her INR at this time is 3.1.
WHAT CONDITIONS CAUSE BOTH ARTERIAL AND VENOUS THROMBOSIS?
4. Given that the patient has evidence of both recurrent arterial and venous thromboses, which of the following conditions is likely?
Antiphospholipid antibody syndrome
Heparin-induced thrombocytopenia
Malignancy
All of the above
Conditions associated with both arterial and venous thrombosis include antiphospholipid antibody syndrome, heparin-induced thrombocytopenia, malignancy, paradoxical embolism, hyperhomocysteinemia, myeloproliferative disorders, myelodysplastic disorder, paraproteinemia, vasculitis, and paroxysmal nocturnal hemoglobinuria.1,4
The hypercoagulability associated with malignancy is also known as Trousseau syndrome. This term was originally used to describe migratory thrombophlebitis as a forewarning for occult visceral malignancy, and has grown over the years to describe malignancy-induced hypercoagulability.9
At present, the exact mechanism that causes Trousseau syndrome is unknown. Some hypotheses implicate mucin (produced by the cancer),10 tissue factor,11 tumor-associated cysteine proteinase,12 tumor hypoxia,13 and oncogene activation as plausible triggers for this syndrome.
As stated above, the patient has a normal platelet count and negative results on cancer screening tests. Tests for antiphospholipid antibodies and lupus anticoagulant are repeated. Tests for the specific antiphospholipid antibodies against beta-2 glycoprotein I and cardiolipin are negative (Table 2). However, the test for lupus anticoagulant is positive by the criteria of the International Society on Thrombosis and Haemostasis: the patient has a prolonged clotting time screening test (hexagonal phase screen, DRVVT screen), positive mixing study (DRVVT 1:1 mix and circulating anticoagulant), positive phospholipid dependence (hexagonal phase screen, confirm, and delta; DRVVT confirm ratio; and platelet neutralization procedure), and no evidence of other factor-specific inhibitors (Table 3).14
DOES SHE HAVE ANTIPHOSPHOLIPID ANTIBODY SYNDROME?
5. The patient is positive for lupus anticoagulant. Does she have antiphospholipid antibody syndrome?
Yes
No
Repeat testing is needed to meet the diagnostic criteria
The Sapporo criteria15 indicate that antiphospholipid antibody syndrome is present if at least one clinical criterion and one laboratory criterion are met. The clinical criteria are one or more episodes of arterial or venous thrombosis or pregnancy-related morbidity, ie:
Unexplained intrauterine fetal death at 10 weeks gestation or later with no apparent fetal abnormality
Premature births of a morphologically normal fetus at less than 34 weeks of gestation due to preeclampsia, eclampsia, or placental insufficiency
Three or more spontaneous abortions at 10 weeks of gestation or earlier, with no known paternal chromosomal abnormalities or maternal hormonal abnormalities and normal maternal anatomy.
The laboratory criteria are:
Lupus anticoagulant present
Anticardiolipin antibody (IgG or IgM) titer greater than 40 IgG antiphospholipid units (GPL) or IgM antiphospholipid units (MPL) or higher than the 99th percentile of the testing laboratory normal reference range
Anti-beta-2 glycoprotein-I antibody (IgG or IgM) titer greater than 20 GPL or MPL or higher than the 99th percentile of the testing laboratory normal reference range.
The patient likely has antiphospholipid antibody syndrome because her lupus anticoagulant screen is positive and she meets the clinical criteria of thrombosis, and she should continue to be treated accordingly. However, to officially meet the revised Sapporo criteria, she would need to have laboratory tests that are positive on two or more occasions at least 12 weeks apart.
Case continues: Lung cancer is found
The patient reports that she has lost 10 pounds in 4 months. Since age-appropriate cancer testing was previously performed, a more extensive evaluation for weight loss is undertaken, with computed tomography of the chest, abdomen, and pelvis. These tests reveal a nodule in the right upper lobe of the lung, scarring in the right middle and left lower lung lobes, and hilar lymphadenopathy. Bronchoscopy with transbronchial biopsy confirms that she has adenocarcinoma of the lung.
6. What is suggested as a sufficient workup for malignancy in patients with idiopathic venous thromboembolism?
Computed tomography of the chest, abdomen, and pelvis for every patient with idiopathic venous thromboembolism
Positron emission tomography and tumor marker levels
A comprehensive history and physical examination, routine laboratory tests, chest radiography, age- and sex-specific cancer screening, and patient-specific testing as indicated clinically
To date, there is no evidence to support a cancer evaluation beyond a comprehensive medical history and physical examination, routine laboratory testing, chest radiography, and age- and sex-specific cancer screening unless it is dictated by the patient’s clinical presentation. A study by Cornuz et al16 suggested that this approach is appropriate for detecting cancer in patients with idiopathic venous thromboembolism.
A 2004 study17 attempted to answer the question of what to do about patients who have idiopathic venous thromboembolism but no other signs or symptoms that raise any clinical suspicion of cancer. This study randomized patients with idiopathic venous thromboembolism to undergo either routine medical management or an extensive malignancy evaluation. The evaluation included ultrasonography of the abdomen and pelvis, computed tomography of the abdomen and pelvis, gastroscopy or a double-contrast barium swallow study, colonoscopy or sigmoidoscopy followed by a barium enema, stool occult blood testing, and sputum cytology. Women were also tested for the tumor markers carcinoembryonic antigen, alpha-fetoprotein, and CA-125, and they underwent mammography and Papanicolaou testing; men were tested for prostate-specific antigen and underwent ultrasonography of the prostate. The results of the study did not reveal a statistically significant survival benefit in the group that underwent extensive cancer evaluation.
These studies indicate that the decision to test for cancer should be guided by clinical suspicion. Our patient lost 10 pounds in 4 months, smokes, and has had recurrent venous thromboembolism, so testing was appropriate.
After her diagnosis with adenocarcinoma of the lung, the patient has yet another DVT despite an INR of 3.1 and treatment with warfarin and aspirin.
LOW-MOLECULAR-WEIGHT HEPARIN FOR PATIENTS WITH CANCER?
7. True or false? Low-molecular-weight heparin is more effective than warfarin in preventing DVT in cancer patients without increasing the bleeding risk.
True
False
This statement is true. The American College of Chest Physicians (ACCP) recommends immediate treatment of DVT with low-molecular-weight heparin for 6 to 12 months after a thrombotic event in a patient with malignancy.6,18
Two major studies provide evidence for these recommendations: the Comparison of Low-Molecular-Weight Heparin Versus Oral Anticoagulant Therapy for the Prevention of Recurrent Venous Thromboembolism in Patients With Cancer (CLOT)19 and the Trial of the Effect of Low-Molecular-Weight Heparin Versus Warfarin on Mortality in the Long-Term Treatment of Proximal Deep Vein Thrombosis (LITE)20 studies.
The CLOT19 study showed that dalteparin (Fragmin) 200 IU/kg subcutaneously once daily for l month and then 150 IU/kg once daily was more effective than oral warfarin titrated to an INR of 2.5 and did not increase the risk of bleeding.
The LITE trial20 showed the efficacy of tinzaparin (Innohep) 175 IU/kg subcutaneously daily, which can be used as an alternative.
Enoxaparin sodium (Lovenox) 1.5 mg/kg once daily has also been used. However, if low-molecular-weight heparin is not available, warfarin titrated to an INR of 2 to 3 is also acceptable.18
The ACCP consensus panel recommends giving anticoagulation for an initial 6 to 12 months and continuing it as long as there is evidence of active malignancy.6 The American Society for Clinical Oncology also recommends placement of an inferior vena cava filter for patients who have contraindications to anticoagulation or for whom low-molecular-weight heparin fails.18
Case continues: Summing up
In conclusion, our patient had an underlying malignancy, causing Trousseau syndrome. Before her cancer was diagnosed, she also had test results that suggested antiphospholipid antibody syndrome. Both of these conditions likely contributed to her hypercoagulable state, increasing her propensity for clotting and causing her recurrent thrombosis. The patient is currently on low-molecular-weight heparin and is undergoing palliative chemotherapy for metastatic adenocarcinoma of the lung. To this date, she has not had any new thrombotic events.
TAKE-HOME POINTS
Risk factors for arterial occlusion can be divided into thrombotic, embolic, and traumatic categories.
Risk factors for venous thrombosis can be divided into hereditary and acquired categories.
Evaluation for hypercoagulable conditions is recommended if it will affect patient management or outcome. Patients to be considered for testing include those with idiopathic DVT and who are under age 50, those with a history of recurrent thrombosis, and those with a first-degree relative with documented venous thromboembolism before age 50.
Evaluation for hypercoagulable conditions should ideally be performed either before starting anticoagulation therapy or 2 weeks after completing it.
Potential causes of both arterial and venous thrombosis include antiphospholipid antibody syndrome, cancer, hyperhomocysteinemia, heparin-induced thrombocytopenia, paradoxical emboli, myeloproliferative disorders, myelodysplastic syndrome, paraproteinemia, vasculitis, and paroxysmal nocturnal hemoglobinuria.
Current evidence does not support an extensive cancer evaluation in patients with idiopathic venous thromboembolism, unless dictated by the patient’s clinical condition.
In patients with venous thromboembolism and active malignancy, anticoagulation is recommended for at least 6 to 12 months and as long as there is evidence of active malignancy.
References
Levine JS, Branch DW, Rauch J. The antiphospholipid syndrome. N Engl J Med2002; 346:752–763.
Yamashita T, Colombo A, Tobis JM. Limitations of coronary angiography compared with intravascular ultrasound: implications for coronary interventions. Prog Cardiovasc Dis1999; 42:91–138.
Bauer KA. The thrombophilias: well-defined risk factors with uncertain therapeutic implications. Ann Intern Med2001; 135:367–373.
Buller HR, Agnelli G, Hull RD, Hyers TM, Prins MH, Raskob GE. Antithrombotic therapy for venous thromboembolic disease: the seventh ACCP conference on antithrombotic and thrombolytic therapy. Chest2004; 126suppl 3:401S–428S.
Locke CF, Evans NC. Evaluating idiopathic venous thromboembolism: what is necessary, what is not. J Fam Pract2003; 52:770–777.
Haemostasis and Thrombosis Task Force, British Committee for Standards in Haematology. Investigation and management of heritable thrombophilia. Br J Haematol2001; 114:512–528.
Varki A. Trousseau’s syndrome: multiple definitions and multiple mechanisms. Blood2007; 110:1723–1729.
Pineo GF, Brain MC, Gallus AS, Hirsh J, Hatton MW, Regoeczi E. Tumors, mucus production, and hypercoagulability. Ann N Y Acad Sci1974; 230:262–270.
Zacharski LR, Schned AR, Sorenson GD. Occurrence of fibrin and tissue factor antigen in human small cell carcinoma of the lung. Cancer Res1983; 43:3963–3968.
Falanga A, Gordon SG. Isolation and characterization of cancer pro-coagulant: a cysteine proteinase from malignant tissue. Biochemistry1985; 24:5558–5567.
Denko NC, Giaccia AJ. Tumor hypoxia, the physiological link between Trousseau’s syndrome (carcinoma-induced coagulopathy) and metastasis. Cancer Res2001; 61:795–798.
Brandt JT, Barna LK, Triplett DA. Laboratory identification of lupus anticoagulants: results of the Second International Workshop for Identification of Lupus Anticoagulants. On behalf of the Subcommittee on Lupus Anticoagulants/Antiphospholipid Antibodies of the ISTH. Thromb Haemost1995; 74:1597–1603.
Miyakis S, Lockshin MD, Atsumi T, et al. International consensus statement on an update of the classification criteria for definite antiphospholipid syndrome (APS). J Thromb Haemost2006; 4:295–306.
Cornuz J, Pearson SD, Creager MA, Cook EF, Goldman L. Importance of findings on the initial evaluation for cancer in patients with symptomatic idiopathic deep venous thrombosis. Ann Intern Med1996; 125:785–793.
Piccioli A, Lensing AW, Prins MH, et al. Extensive screening for occult malignant disease in idiopathic venous thromboembolism: a prospective randomized clinical trial. J Thromb Haemost2004; 2:884–889.
Lyman GH, Khorana AA, Falanga A, et al. American Society of Clinical Oncology guideline: recommendations for venous thromboembolism prophylaxis and treatment in patients with cancer. J Clin Oncol2007; 25:5490–5505.
Lee AY, Levine MN, Baker RI, et al. Low-molecular-weight heparin versus a coumarin for the prevention of recurrent venous thromboembolism in patients with cancer. N Engl J Med2003; 349:146–153.
Hull RD, Pineo GF, Brant RF, et al. Long-term low-molecular-weight heparin versus usual care in proximal-vein thrombosis patients with cancer. Am J Med2006; 119:1062–1072.
A 28-year-old woman comes in for her annual checkup. Her physician notices a palpable, painless, 1-cm, well-demarcated mass in the left breast at the 3 o’clock position 2 cm from the nipple, with no associated skin changes, nipple retraction, or discharge. The patient has no personal or family history of breast cancer.
Given the patient’s age, physical findings, and medical history, the clinician believes it unlikely that the patient has cancer. How should she proceed with the workup of this patient?
PHYSICAL FINDINGS OF A BREAST MASS ARE NOT EXCLUSIVE
Figure 1. A simple cyst in the left breast. All three mammographic views—craniocaudal (A), mediolateral oblique (B), and spot-compression (C)—show a round, well-circumscribed mass in the mid-breast. Ultrasonography (D) shows a round, well-circumscribed anechoic lesion with a sharply defined posterior wall and posterior acoustic enhancement.
Breast cancer is the most common female malignancy and the second-leading cause of cancer deaths in the United States.1 The incidence is low in young women and increases with advancing age. Benign breast disease is common in young women and less common in postmenopausal women.2,3 However, the discovery of a breast mass, whether by the woman herself or by a clinician, is a common occurrence and distressing for any woman.
Benign lesions tend to have discrete, well-defined margins and are typically mobile. Malignant lesions may be firm, may have indistinct borders, and are often immobile.2 Although most breast masses found by palpation are benign, imaging is the critical next step in the workup to help determine if the mass is benign or malignant.
Benign palpable masses include:
Figure 2. Fibroadenoma. On mammography, the craniocaudal (A) and mediolateral oblique (B) views with a bright metallic marker (arrows) show a round, well-circumscribed mass in the upper outer quadrant of the left breast. Ultrasonography (C) shows an oval, well-circumscribed, mildly heterogeneous, hypoechoic mass that is wider than tall, indicating a benign mass.
Cysts (Figure 1)
Fibroadenomas (Figure 2)
Prominent fat lobules
Lymph nodes
Oil cysts
Lipomas
Hamartomas (Figure 3)
Hematomas
Fat necrosis
Galactoceles.
Malignant palpable masses include:
Figure 3. Hamartoma. Craniocaudal (A) and mediolateral oblique (B) mammographic views of the left breast show an apparently encapsulated, heterogeneous mass that contains fat mixed with fibroglandular tissue.
Invasive ductal and lobular carcinoma (Figure 4)
Ductal carcinoma in situ (which rarely presents as a palpable mass.)
HISTORY AND PHYSICAL EXAMINATION
To ensure that imaging provides the most useful information about a palpable breast lump, it is important to first do a careful history and physical examination. Important aspects of the history include family history, personal history of breast cancer, and any previous breast biopsies. The onset and duration of the palpable mass, changes in its size, the relationship of these changes to the menstrual cycle, and the presence or lack of tenderness are additional important elements of the history.
Figure 4. Infiltrating ductal carcinoma. Craniocaudal (A) and mediolateral oblique (B) mammographic views of the right breast show an irregular, mildly spiculated, high-density lesion in the posterior, medial breast. Ultrasonography (C) shows an irregularly shaped hypoechoic mass which is taller than wide (a profile tending to indicate malignancy) and has mild posterior acoustic shadowing.
On examination, it is important to note the clock-face location, size, texture, tenderness, and mobility of the lump. Accompanying nipple discharge and skin erythema or retraction are also important to report. In addition to conveying the location of the mass to the radiologist, it is equally important that the patient know what features the physician feels. This way, if the clinical information from the ordering physician is not available at the time of the radiologic evaluation, the patient will be able to guide the radiologist to the region of concern.
IMAGING TECHNIQUES
Mammography and ultrasonography are the primary imaging studies for evaluating palpable breast masses. Typically, in women under age 30, ultrasonography is the first or the only test ordered to evaluate the abnormality.4 In women age 30 or older, diagnostic mammography is typically the first test ordered. If mammography indicates that the palpable mass is not benign, then ultrasonography is the next study to be done.3 Although a powerful tool, magnetic resonance imaging of the breast does not currently have a role in the workup of a palpable abnormality and should not be used as a decision-delaying tactic or in place of biopsy.
Screening or diagnostic mammography?
Mammography is used in both screening and diagnosis. Screening mammography consists of two standard views of each breast—craniocaudal and mediolateral oblique—and is appropriate for asymptomatic women.
Women age 30 or older who present with a palpable breast mass require diagnostic mammography, in which standard mammographic views are obtained, as well as additional views (eg, tangential or spot-compression views) to better define the area of clinical concern. In a tangential view, a metallic skin marker is placed on the skin overlying the site of the palpable abnormality.
On mammography, a suspicious palpable mass has an irregular shape with spiculated margins. A benign mass typically has a round shape with well-circumscribed margins. If the palpable abnormality is not mammographically benign (eg, if it does not look like a lymph node, lipoma, or degenerating fibroadenoma), then ultrasonography is performed.
Mammography is less sensitive in younger women (ie, under age 30) because their breast tissue tends to be dense and glandular, whereas the tissue becomes more “fat-replaced” with age.3
Ultrasonography plays a complementary role
Ultrasonography complements diagnostic mammography and can be used as a first imaging study to evaluate a palpable breast mass in a young woman (ie, under age 30) with dense breast tissue. Ultrasonography is helpful in distinguishing cystic lesions from solid masses. It helps the radiologist delineate the shape, borders, and acoustic properties of the mass. It is also performed when a palpable mass is mammographically occult. When a mass appears suspicious on either mammography or ultrasonography, ultrasonography can be used to guide biopsy.
A suspicious mass on ultrasonography classically appears “taller than wide” and has posterior acoustic shadowing. Microlobulations and a spiculated margin also raise concern for malignancy. A benign sonographic appearance of a palpable mass includes a “wider than tall” (ellipsoid) shape, with homogeneous echogenicity, and four or fewer gentle lobulations. A thin, echogenic capsule also suggests the mass is benign.
Core-needle biopsy with ultrasonographic guidance
Core-needle biopsy is performed with a large-diameter (14-gauge to 18-gauge) needle to obtain tissue cores for histologic analysis. It has gained popularity over fine-needle aspiration because it includes surrounding tissue architecture, thus providing a more definitive histologic diagnosis.
Pathologic information obtained from core-needle biopsy allows the radiologist and surgeon to counsel the patient and determine the best surgical management or follow-up imaging study. If a clinician performs fine-needle biopsy in the office, it should be preceded by an imaging workup of the palpable finding.
WHAT IS APPROPRIATE FOR OUR 28-YEAR-OLD PATIENT?
Because she is under age 30, ultrasonography is the initial study of choice to evaluate the mass. If a simple cyst is detected, she can be reassured that the lesion is benign, and no subsequent follow-up is required. If the lesion is a solid mass with benign features, mammography may be considered, the patient may be followed with short-interval imaging (every 6 months) depending on patient-specific factors such as family history, or the mass can be biopsied. If the lesion is a solid mass with suspicious or malignant features, mammography with spot-compression views should be performed, and the patient should undergo core-needle biopsy with ultrasonographic guidance.
In a patient age 30 or older, diagnostic mammography is the imaging study of first choice.3 If the mass is clearly benign on mammography, no additional imaging would be necessary. If mammography fails to image the mass or shows it to have benign features such as fat, then the patient can undergo ultrasonography for further evaluation and confirmation of the clinical and mammographic findings. If the mass appears suspicious or malignant on mammography, ultrasonography is the next step, as it can help characterize the lesion and be used to guide core-needle biopsy.
IF A PREGNANT WOMAN HAS A PALPABLE BREAST MASS
Most publications on breast cancer in pregnancy report a prevalence of 3 per 10,000 pregnancies, accounting for 3% of all breast cancers diagnosed.5 Therefore, imaging evaluation of a palpable mass should not be postponed.
Hormonal changes throughout pregnancy may increase the nodularity of breast tissue, raising the concern of palpable masses. Additionally, there is a higher prevalence of galactoceles and lactating adenomas in these patients. Because contrasting fatty breast tissue is lost during pregnancy and because of the need to minimize radiation exposure, ultrasonography is often the imaging test of first choice. If mammography is required, the radiation dose is very low and the patient’s abdomen and pelvis can be shielded.6 In this situation, the patient can be reassured that the imaging test is not jeopardizing her fetus.
WHAT WORKUP IS REQUIRED IN MEN?
Breast cancer in men is rare, accounting for less than 0.5% of all cases.7 Most often, a palpable breast mass in a man presents as unilateral gynecomastia. Gynecomastia occurs in a bimodal age distribution (in the 2nd and 7th decades) and has a variety of hormonal and drug-related causes. Despite the low prevalence of breast cancer in men, the combination of mammography and ultrasonography is recommended for evaluation at all ages.
References
Klein S. Evaluation of palpable breast masses. Am Fam Physician2005; 71:1731–1738.
Pruthi S. Detection and evaluation of a palpable breast mass. Mayo Clin Proc2001; 76:641–648.
Harvey JA. Sonography of palpable breast masses. Semin Ultrasound CT MR2006; 27:284–297.
Mehta TS. Current uses of ultrasound in the evaluation of the breast. Radiol Clin North Am2003; 41:841–856.
Gallenberg MM, Lopines CL. Breast cancer and pregnancy. Semin Oncol1989; 16:369–376.
Barnavon Y, Wallack MK. Management of the pregnant patient with carcinoma of the breast. Surg Gynecol Obstet1990; 171:347–352.
Cardenosa G. The Core Curriculum: Breast Imaging. Philadelphia: Lippincott Williams and Wilkins, 2003;304.
Lauren Stein, MD Imaging Institute, Cleveland Clinic
Melanie Chellman-Jeffers, MD Center for Specialized Women’s Health and Section of Breast Imaging, Department of Diagnostic Radiology, Imaging Institute, Cleveland Clinic
Address: Melanie Chellman-Jeffers, MD, Imaging Institute, Section of Breast Imaging, A10, Cleveland Clinic, 9500 Euclid Avenue, Cleveland, OH 44195; e-mail [email protected]
Author and Disclosure Information
Lauren Stein, MD Imaging Institute, Cleveland Clinic
Melanie Chellman-Jeffers, MD Center for Specialized Women’s Health and Section of Breast Imaging, Department of Diagnostic Radiology, Imaging Institute, Cleveland Clinic
Address: Melanie Chellman-Jeffers, MD, Imaging Institute, Section of Breast Imaging, A10, Cleveland Clinic, 9500 Euclid Avenue, Cleveland, OH 44195; e-mail [email protected]
A 28-year-old woman comes in for her annual checkup. Her physician notices a palpable, painless, 1-cm, well-demarcated mass in the left breast at the 3 o’clock position 2 cm from the nipple, with no associated skin changes, nipple retraction, or discharge. The patient has no personal or family history of breast cancer.
Given the patient’s age, physical findings, and medical history, the clinician believes it unlikely that the patient has cancer. How should she proceed with the workup of this patient?
PHYSICAL FINDINGS OF A BREAST MASS ARE NOT EXCLUSIVE
Figure 1. A simple cyst in the left breast. All three mammographic views—craniocaudal (A), mediolateral oblique (B), and spot-compression (C)—show a round, well-circumscribed mass in the mid-breast. Ultrasonography (D) shows a round, well-circumscribed anechoic lesion with a sharply defined posterior wall and posterior acoustic enhancement.
Breast cancer is the most common female malignancy and the second-leading cause of cancer deaths in the United States.1 The incidence is low in young women and increases with advancing age. Benign breast disease is common in young women and less common in postmenopausal women.2,3 However, the discovery of a breast mass, whether by the woman herself or by a clinician, is a common occurrence and distressing for any woman.
Benign lesions tend to have discrete, well-defined margins and are typically mobile. Malignant lesions may be firm, may have indistinct borders, and are often immobile.2 Although most breast masses found by palpation are benign, imaging is the critical next step in the workup to help determine if the mass is benign or malignant.
Benign palpable masses include:
Figure 2. Fibroadenoma. On mammography, the craniocaudal (A) and mediolateral oblique (B) views with a bright metallic marker (arrows) show a round, well-circumscribed mass in the upper outer quadrant of the left breast. Ultrasonography (C) shows an oval, well-circumscribed, mildly heterogeneous, hypoechoic mass that is wider than tall, indicating a benign mass.
Cysts (Figure 1)
Fibroadenomas (Figure 2)
Prominent fat lobules
Lymph nodes
Oil cysts
Lipomas
Hamartomas (Figure 3)
Hematomas
Fat necrosis
Galactoceles.
Malignant palpable masses include:
Figure 3. Hamartoma. Craniocaudal (A) and mediolateral oblique (B) mammographic views of the left breast show an apparently encapsulated, heterogeneous mass that contains fat mixed with fibroglandular tissue.
Invasive ductal and lobular carcinoma (Figure 4)
Ductal carcinoma in situ (which rarely presents as a palpable mass.)
HISTORY AND PHYSICAL EXAMINATION
To ensure that imaging provides the most useful information about a palpable breast lump, it is important to first do a careful history and physical examination. Important aspects of the history include family history, personal history of breast cancer, and any previous breast biopsies. The onset and duration of the palpable mass, changes in its size, the relationship of these changes to the menstrual cycle, and the presence or lack of tenderness are additional important elements of the history.
Figure 4. Infiltrating ductal carcinoma. Craniocaudal (A) and mediolateral oblique (B) mammographic views of the right breast show an irregular, mildly spiculated, high-density lesion in the posterior, medial breast. Ultrasonography (C) shows an irregularly shaped hypoechoic mass which is taller than wide (a profile tending to indicate malignancy) and has mild posterior acoustic shadowing.
On examination, it is important to note the clock-face location, size, texture, tenderness, and mobility of the lump. Accompanying nipple discharge and skin erythema or retraction are also important to report. In addition to conveying the location of the mass to the radiologist, it is equally important that the patient know what features the physician feels. This way, if the clinical information from the ordering physician is not available at the time of the radiologic evaluation, the patient will be able to guide the radiologist to the region of concern.
IMAGING TECHNIQUES
Mammography and ultrasonography are the primary imaging studies for evaluating palpable breast masses. Typically, in women under age 30, ultrasonography is the first or the only test ordered to evaluate the abnormality.4 In women age 30 or older, diagnostic mammography is typically the first test ordered. If mammography indicates that the palpable mass is not benign, then ultrasonography is the next study to be done.3 Although a powerful tool, magnetic resonance imaging of the breast does not currently have a role in the workup of a palpable abnormality and should not be used as a decision-delaying tactic or in place of biopsy.
Screening or diagnostic mammography?
Mammography is used in both screening and diagnosis. Screening mammography consists of two standard views of each breast—craniocaudal and mediolateral oblique—and is appropriate for asymptomatic women.
Women age 30 or older who present with a palpable breast mass require diagnostic mammography, in which standard mammographic views are obtained, as well as additional views (eg, tangential or spot-compression views) to better define the area of clinical concern. In a tangential view, a metallic skin marker is placed on the skin overlying the site of the palpable abnormality.
On mammography, a suspicious palpable mass has an irregular shape with spiculated margins. A benign mass typically has a round shape with well-circumscribed margins. If the palpable abnormality is not mammographically benign (eg, if it does not look like a lymph node, lipoma, or degenerating fibroadenoma), then ultrasonography is performed.
Mammography is less sensitive in younger women (ie, under age 30) because their breast tissue tends to be dense and glandular, whereas the tissue becomes more “fat-replaced” with age.3
Ultrasonography plays a complementary role
Ultrasonography complements diagnostic mammography and can be used as a first imaging study to evaluate a palpable breast mass in a young woman (ie, under age 30) with dense breast tissue. Ultrasonography is helpful in distinguishing cystic lesions from solid masses. It helps the radiologist delineate the shape, borders, and acoustic properties of the mass. It is also performed when a palpable mass is mammographically occult. When a mass appears suspicious on either mammography or ultrasonography, ultrasonography can be used to guide biopsy.
A suspicious mass on ultrasonography classically appears “taller than wide” and has posterior acoustic shadowing. Microlobulations and a spiculated margin also raise concern for malignancy. A benign sonographic appearance of a palpable mass includes a “wider than tall” (ellipsoid) shape, with homogeneous echogenicity, and four or fewer gentle lobulations. A thin, echogenic capsule also suggests the mass is benign.
Core-needle biopsy with ultrasonographic guidance
Core-needle biopsy is performed with a large-diameter (14-gauge to 18-gauge) needle to obtain tissue cores for histologic analysis. It has gained popularity over fine-needle aspiration because it includes surrounding tissue architecture, thus providing a more definitive histologic diagnosis.
Pathologic information obtained from core-needle biopsy allows the radiologist and surgeon to counsel the patient and determine the best surgical management or follow-up imaging study. If a clinician performs fine-needle biopsy in the office, it should be preceded by an imaging workup of the palpable finding.
WHAT IS APPROPRIATE FOR OUR 28-YEAR-OLD PATIENT?
Because she is under age 30, ultrasonography is the initial study of choice to evaluate the mass. If a simple cyst is detected, she can be reassured that the lesion is benign, and no subsequent follow-up is required. If the lesion is a solid mass with benign features, mammography may be considered, the patient may be followed with short-interval imaging (every 6 months) depending on patient-specific factors such as family history, or the mass can be biopsied. If the lesion is a solid mass with suspicious or malignant features, mammography with spot-compression views should be performed, and the patient should undergo core-needle biopsy with ultrasonographic guidance.
In a patient age 30 or older, diagnostic mammography is the imaging study of first choice.3 If the mass is clearly benign on mammography, no additional imaging would be necessary. If mammography fails to image the mass or shows it to have benign features such as fat, then the patient can undergo ultrasonography for further evaluation and confirmation of the clinical and mammographic findings. If the mass appears suspicious or malignant on mammography, ultrasonography is the next step, as it can help characterize the lesion and be used to guide core-needle biopsy.
IF A PREGNANT WOMAN HAS A PALPABLE BREAST MASS
Most publications on breast cancer in pregnancy report a prevalence of 3 per 10,000 pregnancies, accounting for 3% of all breast cancers diagnosed.5 Therefore, imaging evaluation of a palpable mass should not be postponed.
Hormonal changes throughout pregnancy may increase the nodularity of breast tissue, raising the concern of palpable masses. Additionally, there is a higher prevalence of galactoceles and lactating adenomas in these patients. Because contrasting fatty breast tissue is lost during pregnancy and because of the need to minimize radiation exposure, ultrasonography is often the imaging test of first choice. If mammography is required, the radiation dose is very low and the patient’s abdomen and pelvis can be shielded.6 In this situation, the patient can be reassured that the imaging test is not jeopardizing her fetus.
WHAT WORKUP IS REQUIRED IN MEN?
Breast cancer in men is rare, accounting for less than 0.5% of all cases.7 Most often, a palpable breast mass in a man presents as unilateral gynecomastia. Gynecomastia occurs in a bimodal age distribution (in the 2nd and 7th decades) and has a variety of hormonal and drug-related causes. Despite the low prevalence of breast cancer in men, the combination of mammography and ultrasonography is recommended for evaluation at all ages.
References
Klein S. Evaluation of palpable breast masses. Am Fam Physician2005; 71:1731–1738.
Pruthi S. Detection and evaluation of a palpable breast mass. Mayo Clin Proc2001; 76:641–648.
Harvey JA. Sonography of palpable breast masses. Semin Ultrasound CT MR2006; 27:284–297.
Mehta TS. Current uses of ultrasound in the evaluation of the breast. Radiol Clin North Am2003; 41:841–856.
Gallenberg MM, Lopines CL. Breast cancer and pregnancy. Semin Oncol1989; 16:369–376.
Barnavon Y, Wallack MK. Management of the pregnant patient with carcinoma of the breast. Surg Gynecol Obstet1990; 171:347–352.
Cardenosa G. The Core Curriculum: Breast Imaging. Philadelphia: Lippincott Williams and Wilkins, 2003;304.
Typically, in women under age 30, ultrasonography is the first or the only test ordered to evaluate the abnormality. In women age 30 or older, diagnostic mammography is typically the first test ordered.
On mammography, a suspicious palpable mass has an irregular shape with spiculated margins. A benign mass typically has a round shape with well-circumscribed margins.
When mammography is required during pregnancy, the patient can be reassured that it will not jeopardize her fetus because the radiation dose is very low and the abdomen and pelvis can be shielded.
A 54-year-old man presents with sudden visual loss in the left eye. The left eye and left periorbital area have been painful for the past 5 days.
Figure 1. Multiple cotton wool spots in the peripapillary area in the left eye.
Funduscopic examination of the left eye reveals multiple cotton wool spots in the peripapillary area (Figure 1). The visual acuity is 20/200. The right eye appears normal, with normal vision.
Duplex ultrasonography of the carotid arteries shows total occlusion of the left internal carotid artery. Fluorescein angiography of the fundus reveals focal hyperfluorescence with delayed arteriovenous transit time in the left eye.
Q: Which of the following diagnoses is the most likely at this point in the evaluation?
Hypertensive retinopathy
Diabetic retinopathy
Human immunodeficiency virus (HIV) retinopathy
Retinal involvement of systemic autoimmune disease
Ocular ischemic syndrome
A: The ocular symptoms of hypertension, diabetes mellitus, HIV infection, and other autoimmune diseases usually present bilaterally, and funduscopic examination often reveals other signs such as vessel tortuosity, venous dilation, microaneurysms, retinal hemorrhages, hard exudates, and new vessel formation, in addition to cotton wool spots. In this patient, the lack of these signs and the unilateral cotton wool spots combined with the delay in arteriovenous transit time on fluorescein angiography point to ocular ischemic syndrome.
Ocular ischemic syndrome is the result of hypoperfusion of the globe caused by obstruction of the carotid or the ophthalmic artery,1 most commonly from atherosclerosis. Retinal hypoperfusion is also caused by arteritis, external compression, dissection of the artery,2 and, rarely, cardiac failure.
USUAL SIGNS AND SYMPTOMS
Usually, the patient presents with visual loss that has progressed gradually over a period of weeks or months and is associated with dull aching in the eye or orbit (“ocular angina”).3 Cotton wool spots on funduscopic examination represent retinal nerve fiber layer infarcts, a sign of retinal hypoperfusion. Delays in the choroidal filling time and the arteriole-to-venule transit time on fluorescein angiography confirm the diagnosis.
Strong clue to underlying disease
Ocular ischemic syndrome is an important clue to underlying macrovascular atherosclerotic disease: 50% of patients with ocular ischemic syndrome have ischemic heart disease, 25% have a history of stroke, and 20% have severe peripheral vascular disease. Ocular complications of the syndrome are rubeosis iridis, neovascular glaucoma, and neovascularization of the optic disc and retina. Prompt diagnosis is very important because the death rate at 5 years is 40%.4
Recommended workup
The recommended workup is a thorough history and physical examination to identify underlying systemic disease such as diabetes, hypertension, or collagen vascular disease. When carotid artery disease is suspected, a noninvasive vascular workup with carotid duplex ultrasonography is mandatory to confirm carotid arterial disease, to establish its cause, and to assess the severity of the lesion.
CURRENT TREATMENT OPTIONS
Treatment focuses on the control of systemic risk factors and follow-up to monitor for systemic and ocular complications. The combination of aspirin and extended-release dipyridamole (Aggrenox) is currently considered the most effective antiplatelet strategy, as it reduces the risk of stroke by 37% compared with 25% with aspirin alone.5
Carotid endarterectomy has been shown to benefit symptomatic patients with nondisabling stroke, amaurosis fugax, and a hemispheric transient ischemic attack and who have carotid stenosis of 70% to 99%. The North American Symptomatic Carotid Endarterectomy Trial found a 2-year stroke rate of 9% in such patients who underwent endarterectomy vs 26% in those treated with antiplatelet therapy alone.6,7 Some improvement in visual outcomes was also noted, but the data so far are not conclusive.6
Bypass procedures such as anastomosis of the superficial temporal artery to the middle cerebral artery have been tried in patients with 100% obstruction of the carotid artery in whom a thrombus has propagated distally, thus precluding endarterectomy.
We continue to monitor our patient for the development of ocular complications. The development of retinal neovascularization may warrant panretinal photocoagulation with or without anterior retinal cryoablation. Panretinal photocoagulation decreases the retinal demand for oxygen and decreases the release of angiogenic factors, thereby arresting the growth of neovascularization and preventing complications such as vitreous hemorrhage and tractional retinal detachment. Although no studies have analyzed the benefit of panretinal photocoagulation in patients with ocular ischemia, its long-term benefit has been well documented in diabetic patients.8
References
Chen CS, Miller NR. Ocular ischemic syndrome: review of clinical presentations, etiology, investigation, and management. Compr Ophthalmol Update2007; 8:17–28.
Hussain N, Falali S, Kaul S. Carotid artery disease and ocular vascular disorders. Indian J Ophthalmol2001; 49:5–14.
Brown GC, Magargal LE. The ocular ischemic syndrome. Clinical, fluorescein angiographic and carotid angiographic features. Int Ophthalmol1988; 11:239–251.
Sivalingham A, Brown GC, Magaragal LE, Menduke H. The ocular ischemic syndrome, II; mortality and systemic morbidity. Int Ophthalmol1989; 13:187–191.
Diener HC, Cundha L, Forbes C, Sivenius J, Smets P, Lowenthal A. European Stroke Prevention Study 2: dipyridamole and acetylsalicylic acid in the secondary prevention of stroke. J Neurol Sci1996; 143:1–13.
Barnett HJ, Taylor DW, Eliasziw M, et al. Benefit of carotid endarterectomy in patients with symptomatic moderate or severe stenosis. N Engl J Med1998; 339:1415–1425.
Wolintz RJ. Carotid endarterectomy for ophthalmic manifestations: is it ever indicated?J Neuroophthalmol2005; 25:299–302.
Chew EY, Ferris FL, Csaky KG, et al. The long-term effects of laser photocoagulation treatment in patients with diabetic retinopathy: the Early Treatment Diabetic Retinopathy Follow-up Study. Ophthalmology2003; 110:1683–1689.
A 54-year-old man presents with sudden visual loss in the left eye. The left eye and left periorbital area have been painful for the past 5 days.
Figure 1. Multiple cotton wool spots in the peripapillary area in the left eye.
Funduscopic examination of the left eye reveals multiple cotton wool spots in the peripapillary area (Figure 1). The visual acuity is 20/200. The right eye appears normal, with normal vision.
Duplex ultrasonography of the carotid arteries shows total occlusion of the left internal carotid artery. Fluorescein angiography of the fundus reveals focal hyperfluorescence with delayed arteriovenous transit time in the left eye.
Q: Which of the following diagnoses is the most likely at this point in the evaluation?
Hypertensive retinopathy
Diabetic retinopathy
Human immunodeficiency virus (HIV) retinopathy
Retinal involvement of systemic autoimmune disease
Ocular ischemic syndrome
A: The ocular symptoms of hypertension, diabetes mellitus, HIV infection, and other autoimmune diseases usually present bilaterally, and funduscopic examination often reveals other signs such as vessel tortuosity, venous dilation, microaneurysms, retinal hemorrhages, hard exudates, and new vessel formation, in addition to cotton wool spots. In this patient, the lack of these signs and the unilateral cotton wool spots combined with the delay in arteriovenous transit time on fluorescein angiography point to ocular ischemic syndrome.
Ocular ischemic syndrome is the result of hypoperfusion of the globe caused by obstruction of the carotid or the ophthalmic artery,1 most commonly from atherosclerosis. Retinal hypoperfusion is also caused by arteritis, external compression, dissection of the artery,2 and, rarely, cardiac failure.
USUAL SIGNS AND SYMPTOMS
Usually, the patient presents with visual loss that has progressed gradually over a period of weeks or months and is associated with dull aching in the eye or orbit (“ocular angina”).3 Cotton wool spots on funduscopic examination represent retinal nerve fiber layer infarcts, a sign of retinal hypoperfusion. Delays in the choroidal filling time and the arteriole-to-venule transit time on fluorescein angiography confirm the diagnosis.
Strong clue to underlying disease
Ocular ischemic syndrome is an important clue to underlying macrovascular atherosclerotic disease: 50% of patients with ocular ischemic syndrome have ischemic heart disease, 25% have a history of stroke, and 20% have severe peripheral vascular disease. Ocular complications of the syndrome are rubeosis iridis, neovascular glaucoma, and neovascularization of the optic disc and retina. Prompt diagnosis is very important because the death rate at 5 years is 40%.4
Recommended workup
The recommended workup is a thorough history and physical examination to identify underlying systemic disease such as diabetes, hypertension, or collagen vascular disease. When carotid artery disease is suspected, a noninvasive vascular workup with carotid duplex ultrasonography is mandatory to confirm carotid arterial disease, to establish its cause, and to assess the severity of the lesion.
CURRENT TREATMENT OPTIONS
Treatment focuses on the control of systemic risk factors and follow-up to monitor for systemic and ocular complications. The combination of aspirin and extended-release dipyridamole (Aggrenox) is currently considered the most effective antiplatelet strategy, as it reduces the risk of stroke by 37% compared with 25% with aspirin alone.5
Carotid endarterectomy has been shown to benefit symptomatic patients with nondisabling stroke, amaurosis fugax, and a hemispheric transient ischemic attack and who have carotid stenosis of 70% to 99%. The North American Symptomatic Carotid Endarterectomy Trial found a 2-year stroke rate of 9% in such patients who underwent endarterectomy vs 26% in those treated with antiplatelet therapy alone.6,7 Some improvement in visual outcomes was also noted, but the data so far are not conclusive.6
Bypass procedures such as anastomosis of the superficial temporal artery to the middle cerebral artery have been tried in patients with 100% obstruction of the carotid artery in whom a thrombus has propagated distally, thus precluding endarterectomy.
We continue to monitor our patient for the development of ocular complications. The development of retinal neovascularization may warrant panretinal photocoagulation with or without anterior retinal cryoablation. Panretinal photocoagulation decreases the retinal demand for oxygen and decreases the release of angiogenic factors, thereby arresting the growth of neovascularization and preventing complications such as vitreous hemorrhage and tractional retinal detachment. Although no studies have analyzed the benefit of panretinal photocoagulation in patients with ocular ischemia, its long-term benefit has been well documented in diabetic patients.8
References
Chen CS, Miller NR. Ocular ischemic syndrome: review of clinical presentations, etiology, investigation, and management. Compr Ophthalmol Update2007; 8:17–28.
Hussain N, Falali S, Kaul S. Carotid artery disease and ocular vascular disorders. Indian J Ophthalmol2001; 49:5–14.
Brown GC, Magargal LE. The ocular ischemic syndrome. Clinical, fluorescein angiographic and carotid angiographic features. Int Ophthalmol1988; 11:239–251.
Sivalingham A, Brown GC, Magaragal LE, Menduke H. The ocular ischemic syndrome, II; mortality and systemic morbidity. Int Ophthalmol1989; 13:187–191.
Diener HC, Cundha L, Forbes C, Sivenius J, Smets P, Lowenthal A. European Stroke Prevention Study 2: dipyridamole and acetylsalicylic acid in the secondary prevention of stroke. J Neurol Sci1996; 143:1–13.
Barnett HJ, Taylor DW, Eliasziw M, et al. Benefit of carotid endarterectomy in patients with symptomatic moderate or severe stenosis. N Engl J Med1998; 339:1415–1425.
Wolintz RJ. Carotid endarterectomy for ophthalmic manifestations: is it ever indicated?J Neuroophthalmol2005; 25:299–302.
Chew EY, Ferris FL, Csaky KG, et al. The long-term effects of laser photocoagulation treatment in patients with diabetic retinopathy: the Early Treatment Diabetic Retinopathy Follow-up Study. Ophthalmology2003; 110:1683–1689.
Dr. Lim is a medical officer at the Department of Epidemic Alert and Response, part of the Health Security and Environment Cluster at the World Health Organization, Geneva, Switzerland. Dr. Novotny is a professor of global health at the Graduate School of Public Health at San Diego State University, San Diego, CA.
global, diplomacy, emerging infectious diseases, EIDs, international, public health, foreign assistance, HIV, AIDS, avian influenza, bird flu, foreign assistance, aid, World Health Organization, WHO, Global Outbreak Alert and Response Network, GOARN, U.S. President's Emergency Plan for AIDS, PEPFAR
global, diplomacy, emerging infectious diseases, EIDs, international, public health, foreign assistance, HIV, AIDS, avian influenza, bird flu, foreign assistance, aid, World Health Organization, WHO, Global Outbreak Alert and Response Network, GOARN, U.S. President's Emergency Plan for AIDS, PEPFAR
Dr. Lim is a medical officer at the Department of Epidemic Alert and Response, part of the Health Security and Environment Cluster at the World Health Organization, Geneva, Switzerland. Dr. Novotny is a professor of global health at the Graduate School of Public Health at San Diego State University, San Diego, CA.
Author and Disclosure Information
Matthew Lim, MD and Thomas E. Novotny, MD, MPH
Dr. Lim is a medical officer at the Department of Epidemic Alert and Response, part of the Health Security and Environment Cluster at the World Health Organization, Geneva, Switzerland. Dr. Novotny is a professor of global health at the Graduate School of Public Health at San Diego State University, San Diego, CA.
global, diplomacy, emerging infectious diseases, EIDs, international, public health, foreign assistance, HIV, AIDS, avian influenza, bird flu, foreign assistance, aid, World Health Organization, WHO, Global Outbreak Alert and Response Network, GOARN, U.S. President's Emergency Plan for AIDS, PEPFAR
global, diplomacy, emerging infectious diseases, EIDs, international, public health, foreign assistance, HIV, AIDS, avian influenza, bird flu, foreign assistance, aid, World Health Organization, WHO, Global Outbreak Alert and Response Network, GOARN, U.S. President's Emergency Plan for AIDS, PEPFAR
Legacy Keywords
global, diplomacy, emerging infectious diseases, EIDs, international, public health, foreign assistance, HIV, AIDS, avian influenza, bird flu, foreign assistance, aid, World Health Organization, WHO, Global Outbreak Alert and Response Network, GOARN, U.S. President's Emergency Plan for AIDS, PEPFAR
global, diplomacy, emerging infectious diseases, EIDs, international, public health, foreign assistance, HIV, AIDS, avian influenza, bird flu, foreign assistance, aid, World Health Organization, WHO, Global Outbreak Alert and Response Network, GOARN, U.S. President's Emergency Plan for AIDS, PEPFAR
This article has been peer reviewed and approved by Michael Fisher, MD, Professor of Medicine, Albert Einstein College of Medicine. Review date: February 2009.
Drs. Eaton and Knable report no conflict of interest. Dr. Callen is a consultant for Abbott Laboratories; Amgen Inc; Electrical Optical Sciences; Genentech, Inc; and Medicis Pharmaceutical Corporation, and a speaker for Steifel Laboratories, Inc. These relationships are not relevant to this article. The authors report no discussion of off-label use. Dr. Fisher reports no conflict of interest. The staff of CCME of Albert Einstein College of Medicine and Cutis® have no conflicts of interest with commercial interest related directly or indirectly to this educational activity. From the Division of Dermatology, Department of Medicine, University of Louisville, Kentucky. Dr. Eaton was a resident, Dr. Knable is Associate Clinical Professor, and Dr. Callen is Professor of Medicine. Dr. Eaton currently is a dermatologist, Hawaii Permenente Medical Group, Honolulu. This case report was presented in part at the Summer Meeting of the American Academy of Dermatology; August 1-5, 2007; New York, New York.
Philip A. Eaton, MD; Alfred L. Knable, MD; Jeffrey P. Callen, MD
Author and Disclosure Information
This article has been peer reviewed and approved by Michael Fisher, MD, Professor of Medicine, Albert Einstein College of Medicine. Review date: February 2009.
Drs. Eaton and Knable report no conflict of interest. Dr. Callen is a consultant for Abbott Laboratories; Amgen Inc; Electrical Optical Sciences; Genentech, Inc; and Medicis Pharmaceutical Corporation, and a speaker for Steifel Laboratories, Inc. These relationships are not relevant to this article. The authors report no discussion of off-label use. Dr. Fisher reports no conflict of interest. The staff of CCME of Albert Einstein College of Medicine and Cutis® have no conflicts of interest with commercial interest related directly or indirectly to this educational activity. From the Division of Dermatology, Department of Medicine, University of Louisville, Kentucky. Dr. Eaton was a resident, Dr. Knable is Associate Clinical Professor, and Dr. Callen is Professor of Medicine. Dr. Eaton currently is a dermatologist, Hawaii Permenente Medical Group, Honolulu. This case report was presented in part at the Summer Meeting of the American Academy of Dermatology; August 1-5, 2007; New York, New York.
Philip A. Eaton, MD; Alfred L. Knable, MD; Jeffrey P. Callen, MD