User login
Glycemic Control eQUIPS yields success at Dignity Health Sequoia Hospital
Glucometrics database aids tracking, trending
In honor of Diabetes Awareness Month, The Hospitalist spoke recently with Stephanie Dizon, PharmD, BCPS, director of pharmacy at Dignity Health Sequoia Hospital in Redwood City, Calif. Dr. Dizon was the project lead for Dignity Health Sequoia’s participation in the Society of Hospital Medicine’s Glycemic Control eQUIPS program. The Northern California hospital was recognized as a top performer in the program.

SHM’s eQUIPS offers a virtual library of resources, including a step-by-step implementation guide, that addresses various issues that range from subcutaneous insulin protocols to care coordination and good hypoglycemia management. In addition, the program offers access to a data center for performance tracking and benchmarking.
Dr. Dizon shared her experience as a participant in the program, and explained its impact on glycemic control at Dignity Health Sequoia Hospital.
Could you tell us about your personal involvement with SHM?
I started as the quality lead for glycemic control for Sequoia Hospital in 2017 while serving in the role as the clinical pharmacy manager. Currently, I am the director of pharmacy.
What inspired your institution to enroll in the GC eQUIPS program? What were the challenges it helped you address?
Sequoia Hospital started in this journey to improve overall glycemic control in a collaborative with eight other Dignity Health hospitals in 2011. At Sequoia Hospital, this effort was led by Karen Harrison, RN, MSN, CCRN. At the time, Dignity Health saw variations in insulin management and adverse events, and it inspired this group to review their practices and try to find a better way to standardize them. The hope was that sharing information and making efforts to standardize practices would lead to better glycemic control.
Enrollment in the GC eQUIPS program helped Sequoia Hospital efficiently analyze data that would otherwise be too large to manage. In addition, by tracking and trending these large data sets, it helped us not only to see where the hospital’s greatest challenges are in glycemic control but also observe what the impact is when making changes. We were part of a nine-site study that proved the effectiveness of GC eQUIPS and highlighted the collective success across the health system.
What did you find most useful in the suite of resources included in eQUIPS?
The benchmarking webinars and informational webinars that have been provided by Greg Maynard, MD, over the years have been especially helpful. They have broadened my understanding of glycemic control. The glucometrics database is especially helpful for tracking and trending – we share these reports on a monthly basis with nursing and provider leadership. In addition, being able to benchmark ourselves with other hospitals pushes us to improve and keep an eye on glycemic control.
Are there any other highlights from your participation– and your institution’s – in the program that you feel would be beneficial to others who may be considering enrollment?
Having access to the tools available in the GC eQUIPS program is very powerful for data analysis and benchmarking. As a result, it allows the people at an institution to focus on the day-to-day tasks, clinical initiatives, and building a culture that can make a program successful instead of focusing on data collection.
For more information on SHM’s Glycemic Control resources or to enroll in eQUIPS, visit hospitalmedicine.org/gc.
Glucometrics database aids tracking, trending
Glucometrics database aids tracking, trending
In honor of Diabetes Awareness Month, The Hospitalist spoke recently with Stephanie Dizon, PharmD, BCPS, director of pharmacy at Dignity Health Sequoia Hospital in Redwood City, Calif. Dr. Dizon was the project lead for Dignity Health Sequoia’s participation in the Society of Hospital Medicine’s Glycemic Control eQUIPS program. The Northern California hospital was recognized as a top performer in the program.
SHM’s eQUIPS offers a virtual library of resources, including a step-by-step implementation guide, that addresses various issues that range from subcutaneous insulin protocols to care coordination and good hypoglycemia management. In addition, the program offers access to a data center for performance tracking and benchmarking.
Dr. Dizon shared her experience as a participant in the program, and explained its impact on glycemic control at Dignity Health Sequoia Hospital.
Could you tell us about your personal involvement with SHM?
I started as the quality lead for glycemic control for Sequoia Hospital in 2017 while serving in the role as the clinical pharmacy manager. Currently, I am the director of pharmacy.
What inspired your institution to enroll in the GC eQUIPS program? What were the challenges it helped you address?
Sequoia Hospital started in this journey to improve overall glycemic control in a collaborative with eight other Dignity Health hospitals in 2011. At Sequoia Hospital, this effort was led by Karen Harrison, RN, MSN, CCRN. At the time, Dignity Health saw variations in insulin management and adverse events, and it inspired this group to review their practices and try to find a better way to standardize them. The hope was that sharing information and making efforts to standardize practices would lead to better glycemic control.
Enrollment in the GC eQUIPS program helped Sequoia Hospital efficiently analyze data that would otherwise be too large to manage. In addition, by tracking and trending these large data sets, it helped us not only to see where the hospital’s greatest challenges are in glycemic control but also observe what the impact is when making changes. We were part of a nine-site study that proved the effectiveness of GC eQUIPS and highlighted the collective success across the health system.
What did you find most useful in the suite of resources included in eQUIPS?
The benchmarking webinars and informational webinars that have been provided by Greg Maynard, MD, over the years have been especially helpful. They have broadened my understanding of glycemic control. The glucometrics database is especially helpful for tracking and trending – we share these reports on a monthly basis with nursing and provider leadership. In addition, being able to benchmark ourselves with other hospitals pushes us to improve and keep an eye on glycemic control.
Are there any other highlights from your participation– and your institution’s – in the program that you feel would be beneficial to others who may be considering enrollment?
Having access to the tools available in the GC eQUIPS program is very powerful for data analysis and benchmarking. As a result, it allows the people at an institution to focus on the day-to-day tasks, clinical initiatives, and building a culture that can make a program successful instead of focusing on data collection.
For more information on SHM’s Glycemic Control resources or to enroll in eQUIPS, visit hospitalmedicine.org/gc.
Better time data from in-hospital resuscitations
Benefits of an undocumented defibrillator feature
Research and quality improvement (QI) related to in-hospital cardiopulmonary resuscitation attempts (“codes” from here forward) are hampered significantly by the poor quality of data on time intervals from arrest onset to clinical interventions.1

In 2000, the American Heart Association’s (AHA) Emergency Cardiac Care Guidelines said that current data were inaccurate and that greater accuracy was “the key to future high-quality research”2 – but since then, the general situation has not improved: Time intervals reported by the national AHA-supported registry Get With the Guidelines–Resuscitation (GWTG-R, 200+ hospitals enrolled) include a figure from all hospitals for times to first defibrillation of 1 minute median and 0 minutes first interquartile.3 Such numbers are typical – when they are tracked at all – but they strain credulity, and prima facie evidence is available at most clinical simulation centers simply by timing simulated defibrillation attempts under realistic conditions, as in “mock codes.”4,5
Taking artificially short time-interval data from GWTG-R or other sources at face value can hide serious delays in response to in-hospital arrests. It can also lead to flawed studies and highly questionable conclusions.6
The key to accuracy of critical time intervals – the intervals from arrest to key interventions – is an accurate time of arrest.7 Codes are typically recorded in handwritten form, though they may later be transcribed or scanned into electronic records. The “start” of the code for unmonitored arrests and most monitored arrests is typically taken to be the time that a human bedside recorder, arriving at an unknown interval after the arrest, writes down the first intervention. Researchers acknowledged the problem of artificially short time intervals in 2005, but they did not propose a remedy.1 Since then, the problem of in-hospital resuscitation delays has received little to no attention in the professional literature.
Description of feature
To get better time data from unmonitored resuscitation attempts, it is necessary to use a “surrogate marker” – a stand-in or substitute event – for the time of arrest. This event should occur reliably for each code, and as near as possible to the actual time of arrest. The main early events in a code are starting basic CPR, paging the code, and moving the defibrillator (usually on a code cart) to the scene. Ideally these events occur almost simultaneously, but that is not consistently achieved.
There are significant problems with use of the first two events as surrogate markers: the time of starting CPR cannot be determined accurately, and paging the code is dependent on several intermediate steps that lead to inaccuracy. Furthermore, the times of both markers are recorded using clocks that are typically not synchronized with the clock used for recording the code (defibrillator clock or the human recorder’s timepiece). Reconciliation of these times with the code record, while not particularly difficult,8 is rarely if ever done.
Defibrillator Power On is recorded on the defibrillator timeline and thus does not need to be reconciled with the defibrillator clock, but it is not suitable as a surrogate marker because this time is highly variable: It often does not occur until the time that monitoring pads are placed. Moving the code cart to the scene, which must occur early in the code, is a much more valid surrogate marker, with the added benefit that it can be marked on the defibrillator timeline.
The undocumented feature described here provides that marker. This feature has been a part of the LIFEPAK 20/20e’s design since it was launched in 2002, but it has not been publicized until now and is not documented in the user manual.
Hospital defibrillators are connected to alternating-current (AC) power when not in use. When the defibrillator is moved to the scene of the code, it is obviously necessary to disconnect the defibrillator from the wall outlet, at which time “AC Power Loss” is recorded on the event record generated by the LIFEPAK 20/20e defibrillators. The defibrillator may be powered on up to 10 minutes later while retaining the AC Power Loss marker in the event record. This surrogate marker for the start time will be on the same timeline as other events recorded by the defibrillator, including times of first monitoring and shocks.
Once the event record is acquired, determining time intervals is accomplished by subtracting clock times (see example, Figure 1).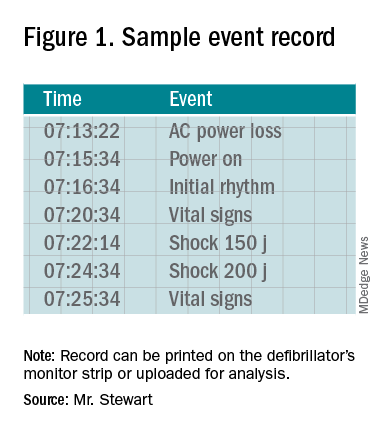
In the example, using AC Power Loss as the start time, time intervals from arrest to first monitoring (Initial Rhythm on the Event Record) and first shock were 3:12 (07:16:34 minus 07:13:22) and 8:42 (07:22:14 minus 07:13:22). Note that if Power On were used as the surrogate time of arrest in the example, the calculated intervals would be artificially shorter, by 2 min 12 sec.
Using this undocumented feature, any facility using LIFEPAK 20/20e defibrillators can easily measure critical time intervals during resuscitation attempts with much greater accuracy, including times to first monitoring and first defibrillation. Each defibrillator stores code summaries sufficient for dozens of events and accessing past data is simple. Analysis of the data can provide a much-improved measure of the facility’s speed of response as a baseline for QI.
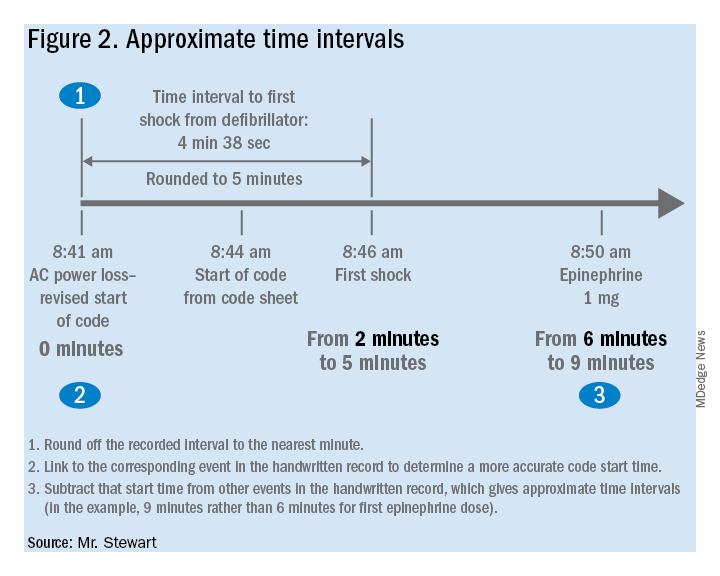
If desired, the time-interval data thus obtained can also be integrated with the handwritten record. The usual handwritten code sheet records times only in whole minutes, but with one of the more accurate intervals from the defibrillator – to first monitoring or first defibrillation – an adjusted time of arrest can be added to any code record to get other intervals that better approximate real-world response times.9
Research prospects
The feature opens multiple avenues for future research. Acquiring data by this method should be simple for any facility using LIFEPAK 20/20e defibrillators as its standard devices. Matching the existing handwritten code records with the time intervals obtained using this surrogate time marker will show how inaccurate the commonly reported data are. This can be done with a retrospective study comparing the time intervals from the archived event records with those from the handwritten records, to provide an example of the inaccuracy of data reported in the medical literature. The more accurate picture of time intervals can provide a much-needed yardstick for future research aimed at shortening response times.
The feature can facilitate aggregation of data across multiple facilities that use the LIFEPAK 20/20e as their standard defibrillator. Also, it is possible that other defibrillator manufacturers will duplicate this feature with their devices – it should produce valid data with any defibrillator – although there may be legal and technical obstacles to adopting it.
Combining data from multiple sites might lead to an important contribution to resuscitation research: a reasonably accurate overall survival curve for in-hospital tachyarrhythmic arrests. A commonly cited but crude guideline is that survival from tachyarrhythmic arrests decreases by 10%-15% per minute as defibrillation is delayed,10 but it seems unlikely that the relationship would be linear: Experience and the literature suggest that survival drops very quickly in the first few minutes, flattening out as elapsed time after arrest increases. Aggregating the much more accurate time-interval data from multiple facilities should produce a survival curve for in-hospital tachyarrhythmic arrests that comes much closer to reality.
Conclusion
It is unknown whether this feature will be used to improve the accuracy of reported code response times. It greatly facilitates acquiring more accurate times, but the task has never been especially difficult – particularly when balanced with the importance of better time data for QI and research.8 One possible impediment may be institutional obstacles to publishing studies with accurate response times due to concerns about public relations or legal exposure: The more accurate times will almost certainly be longer than those generally reported.
As was stated almost 2 decades ago and remains true today, acquiring accurate time-interval data is “the key to future high-quality research.”2 It is also key to improving any hospital’s quality of code response. As described in this article, better time data can easily be acquired. It is time for this important problem to be recognized and remedied.
Mr. Stewart has worked as a hospital nurse in Seattle for many years, and has numerous publications to his credit related to resuscitation issues. You can contact him at [email protected].
References
1. Kaye W et al. When minutes count – the fallacy of accurate time documentation during in-hospital resuscitation. Resuscitation. 2005;65(3):285-90.
2. The American Heart Association in collaboration with the International Liaison Committee on Resuscitation. Guidelines 2000 for Cardiopulmonary Resuscitation and Emergency Cardiovascular Care, Part 4: the automated external defibrillator: key link in the chain of survival. Circulation. 2000;102(8 Suppl):I-60-76.
3. Chan PS et al. American Heart Association National Registry of Cardiopulmonary Resuscitation Investigators. Delayed time to defibrillation after in-hospital cardiac arrest. N Engl J Med. 2008 Jan 3;358(1):9-17. doi: 10.1056/NEJMoa0706467.
4. Hunt EA et al. Simulation of in-hospital pediatric medical emergencies and cardiopulmonary arrests: Highlighting the importance of the first 5 minutes. Pediatrics. 2008;121(1):e34-e43. doi: 10.1542/peds.2007-0029.
5. Reeson M et al. Defibrillator design and usability may be impeding timely defibrillation. Comm J Qual Patient Saf. 2018 Sep;44(9):536-544. doi: 10.1016/j.jcjq.2018.01.005.
6. Hunt EA et al. American Heart Association’s Get With The Guidelines – Resuscitation Investigators. Association between time to defibrillation and survival in pediatric in-hospital cardiac arrest with a first documented shockable rhythm JAMA Netw Open. 2018;1(5):e182643. doi: 10.1001/jamanetworkopen.2018.2643.
7. Cummins RO et al. Recommended guidelines for reviewing, reporting, and conducting research on in-hospital resuscitation: the in-hospital “Utstein” style. Circulation. 1997;95:2213-39.
8. Stewart JA. Determining accurate call-to-shock times is easy. Resuscitation. 2005 Oct;67(1):150-1.
9. In infrequent cases, the code cart and defibrillator may be moved to a deteriorating patient before a full arrest. Such occurrences should be analyzed separately or excluded from analysis.
10. Valenzuela TD et al. Estimating effectiveness of cardiac arrest interventions: a logistic regression survival model. Circulation. 1997;96(10):3308-13. doi: 10.1161/01.cir.96.10.3308.
Benefits of an undocumented defibrillator feature
Benefits of an undocumented defibrillator feature
Research and quality improvement (QI) related to in-hospital cardiopulmonary resuscitation attempts (“codes” from here forward) are hampered significantly by the poor quality of data on time intervals from arrest onset to clinical interventions.1
In 2000, the American Heart Association’s (AHA) Emergency Cardiac Care Guidelines said that current data were inaccurate and that greater accuracy was “the key to future high-quality research”2 – but since then, the general situation has not improved: Time intervals reported by the national AHA-supported registry Get With the Guidelines–Resuscitation (GWTG-R, 200+ hospitals enrolled) include a figure from all hospitals for times to first defibrillation of 1 minute median and 0 minutes first interquartile.3 Such numbers are typical – when they are tracked at all – but they strain credulity, and prima facie evidence is available at most clinical simulation centers simply by timing simulated defibrillation attempts under realistic conditions, as in “mock codes.”4,5
Taking artificially short time-interval data from GWTG-R or other sources at face value can hide serious delays in response to in-hospital arrests. It can also lead to flawed studies and highly questionable conclusions.6
The key to accuracy of critical time intervals – the intervals from arrest to key interventions – is an accurate time of arrest.7 Codes are typically recorded in handwritten form, though they may later be transcribed or scanned into electronic records. The “start” of the code for unmonitored arrests and most monitored arrests is typically taken to be the time that a human bedside recorder, arriving at an unknown interval after the arrest, writes down the first intervention. Researchers acknowledged the problem of artificially short time intervals in 2005, but they did not propose a remedy.1 Since then, the problem of in-hospital resuscitation delays has received little to no attention in the professional literature.
Description of feature
To get better time data from unmonitored resuscitation attempts, it is necessary to use a “surrogate marker” – a stand-in or substitute event – for the time of arrest. This event should occur reliably for each code, and as near as possible to the actual time of arrest. The main early events in a code are starting basic CPR, paging the code, and moving the defibrillator (usually on a code cart) to the scene. Ideally these events occur almost simultaneously, but that is not consistently achieved.
There are significant problems with use of the first two events as surrogate markers: the time of starting CPR cannot be determined accurately, and paging the code is dependent on several intermediate steps that lead to inaccuracy. Furthermore, the times of both markers are recorded using clocks that are typically not synchronized with the clock used for recording the code (defibrillator clock or the human recorder’s timepiece). Reconciliation of these times with the code record, while not particularly difficult,8 is rarely if ever done.
Defibrillator Power On is recorded on the defibrillator timeline and thus does not need to be reconciled with the defibrillator clock, but it is not suitable as a surrogate marker because this time is highly variable: It often does not occur until the time that monitoring pads are placed. Moving the code cart to the scene, which must occur early in the code, is a much more valid surrogate marker, with the added benefit that it can be marked on the defibrillator timeline.
The undocumented feature described here provides that marker. This feature has been a part of the LIFEPAK 20/20e’s design since it was launched in 2002, but it has not been publicized until now and is not documented in the user manual.
Hospital defibrillators are connected to alternating-current (AC) power when not in use. When the defibrillator is moved to the scene of the code, it is obviously necessary to disconnect the defibrillator from the wall outlet, at which time “AC Power Loss” is recorded on the event record generated by the LIFEPAK 20/20e defibrillators. The defibrillator may be powered on up to 10 minutes later while retaining the AC Power Loss marker in the event record. This surrogate marker for the start time will be on the same timeline as other events recorded by the defibrillator, including times of first monitoring and shocks.
Once the event record is acquired, determining time intervals is accomplished by subtracting clock times (see example, Figure 1).
In the example, using AC Power Loss as the start time, time intervals from arrest to first monitoring (Initial Rhythm on the Event Record) and first shock were 3:12 (07:16:34 minus 07:13:22) and 8:42 (07:22:14 minus 07:13:22). Note that if Power On were used as the surrogate time of arrest in the example, the calculated intervals would be artificially shorter, by 2 min 12 sec.
Using this undocumented feature, any facility using LIFEPAK 20/20e defibrillators can easily measure critical time intervals during resuscitation attempts with much greater accuracy, including times to first monitoring and first defibrillation. Each defibrillator stores code summaries sufficient for dozens of events and accessing past data is simple. Analysis of the data can provide a much-improved measure of the facility’s speed of response as a baseline for QI.
If desired, the time-interval data thus obtained can also be integrated with the handwritten record. The usual handwritten code sheet records times only in whole minutes, but with one of the more accurate intervals from the defibrillator – to first monitoring or first defibrillation – an adjusted time of arrest can be added to any code record to get other intervals that better approximate real-world response times.9
Research prospects
The feature opens multiple avenues for future research. Acquiring data by this method should be simple for any facility using LIFEPAK 20/20e defibrillators as its standard devices. Matching the existing handwritten code records with the time intervals obtained using this surrogate time marker will show how inaccurate the commonly reported data are. This can be done with a retrospective study comparing the time intervals from the archived event records with those from the handwritten records, to provide an example of the inaccuracy of data reported in the medical literature. The more accurate picture of time intervals can provide a much-needed yardstick for future research aimed at shortening response times.
The feature can facilitate aggregation of data across multiple facilities that use the LIFEPAK 20/20e as their standard defibrillator. Also, it is possible that other defibrillator manufacturers will duplicate this feature with their devices – it should produce valid data with any defibrillator – although there may be legal and technical obstacles to adopting it.
Combining data from multiple sites might lead to an important contribution to resuscitation research: a reasonably accurate overall survival curve for in-hospital tachyarrhythmic arrests. A commonly cited but crude guideline is that survival from tachyarrhythmic arrests decreases by 10%-15% per minute as defibrillation is delayed,10 but it seems unlikely that the relationship would be linear: Experience and the literature suggest that survival drops very quickly in the first few minutes, flattening out as elapsed time after arrest increases. Aggregating the much more accurate time-interval data from multiple facilities should produce a survival curve for in-hospital tachyarrhythmic arrests that comes much closer to reality.
Conclusion
It is unknown whether this feature will be used to improve the accuracy of reported code response times. It greatly facilitates acquiring more accurate times, but the task has never been especially difficult – particularly when balanced with the importance of better time data for QI and research.8 One possible impediment may be institutional obstacles to publishing studies with accurate response times due to concerns about public relations or legal exposure: The more accurate times will almost certainly be longer than those generally reported.
As was stated almost 2 decades ago and remains true today, acquiring accurate time-interval data is “the key to future high-quality research.”2 It is also key to improving any hospital’s quality of code response. As described in this article, better time data can easily be acquired. It is time for this important problem to be recognized and remedied.
Mr. Stewart has worked as a hospital nurse in Seattle for many years, and has numerous publications to his credit related to resuscitation issues. You can contact him at [email protected].
References
1. Kaye W et al. When minutes count – the fallacy of accurate time documentation during in-hospital resuscitation. Resuscitation. 2005;65(3):285-90.
2. The American Heart Association in collaboration with the International Liaison Committee on Resuscitation. Guidelines 2000 for Cardiopulmonary Resuscitation and Emergency Cardiovascular Care, Part 4: the automated external defibrillator: key link in the chain of survival. Circulation. 2000;102(8 Suppl):I-60-76.
3. Chan PS et al. American Heart Association National Registry of Cardiopulmonary Resuscitation Investigators. Delayed time to defibrillation after in-hospital cardiac arrest. N Engl J Med. 2008 Jan 3;358(1):9-17. doi: 10.1056/NEJMoa0706467.
4. Hunt EA et al. Simulation of in-hospital pediatric medical emergencies and cardiopulmonary arrests: Highlighting the importance of the first 5 minutes. Pediatrics. 2008;121(1):e34-e43. doi: 10.1542/peds.2007-0029.
5. Reeson M et al. Defibrillator design and usability may be impeding timely defibrillation. Comm J Qual Patient Saf. 2018 Sep;44(9):536-544. doi: 10.1016/j.jcjq.2018.01.005.
6. Hunt EA et al. American Heart Association’s Get With The Guidelines – Resuscitation Investigators. Association between time to defibrillation and survival in pediatric in-hospital cardiac arrest with a first documented shockable rhythm JAMA Netw Open. 2018;1(5):e182643. doi: 10.1001/jamanetworkopen.2018.2643.
7. Cummins RO et al. Recommended guidelines for reviewing, reporting, and conducting research on in-hospital resuscitation: the in-hospital “Utstein” style. Circulation. 1997;95:2213-39.
8. Stewart JA. Determining accurate call-to-shock times is easy. Resuscitation. 2005 Oct;67(1):150-1.
9. In infrequent cases, the code cart and defibrillator may be moved to a deteriorating patient before a full arrest. Such occurrences should be analyzed separately or excluded from analysis.
10. Valenzuela TD et al. Estimating effectiveness of cardiac arrest interventions: a logistic regression survival model. Circulation. 1997;96(10):3308-13. doi: 10.1161/01.cir.96.10.3308.
Was the success of hospital medicine inevitable?
Early on, SHM defined the specialty
When I started at the Society of Hospital Medicine – known then as the National Association of Inpatient Physicians (NAIP) – in January 2000, Bill Clinton was still president. There were probably 500 hospitalists in the United States, and SHM had about 200-250 members.

It was so long ago that the iPhone hadn’t been invented, Twitter wasn’t even an idea, and Amazon was an online book store. SHM’s national offices were a cubicle at the American College of Physicians headquarters in Philadelphia, and our entire staff was me and a part-time assistant.
We have certainly come a long way in my 20 years as CEO of SHM.
When I first became involved with NAIP, it was to help the board with their strategic planning in 1998. At that time, the national thought leaders for the hospitalist movement (the term hospital medicine had not been invented yet) predicted that hospitalists would eventually do the inpatient work for about 25% of family doctors and for 15% of internists. Hospitalists were considered to be a form of “general medicine” without an office-based practice.
One of the first things we set about doing was to define the new specialty of hospital medicine before anyone else (e.g., American Medical Association, ACP, American Academy of Family Physicians, American Academy of Pediatrics, the government) defined us.
Most specialties were defined by a body organ (e.g., cardiology, renal), a population (e.g., pediatrics, geriatrics), or a disease (e.g., oncology), and there were a few other site-specific specialties (e.g., ED medicine, critical care). We felt that, to be a specialty, we needed certain key elements:
- Separate group consciousness
- Professional society
- Distinct residency and fellowship programs
- Separate CME
- Distinct educational materials (e.g., textbooks)
- Definable and distinct competencies
- Separate credentials – certification and/or hospital insurance driven
Early on, SHM defined the Core Competencies for Hospital Medicine for adults in patient care and, eventually, for pediatric patients. We rebranded our specialty as hospital medicine to be more than just inpatient physicians, and to broadly encompass the growing “big tent” of SHM that included those trained in internal medicine, family medicine, pediatrics, med-peds, as well as nurse practitioners, physician assistants, pharmacists, and others.
We were the first and only specialty society to set the standard for hospitalist compensation (how much you are paid) and productivity (what you are expected to do) with our unique State of Hospital Medicine (SOHM) Report. Other specialties left this work to the Medical Group Management Association, the AMA, or commercial companies.
Our specialty was soon being asked to do things that no other group of clinicians was ever asked to do.
Hospitalists were expected to Save Money by reducing length of stay and the use of resources on the sickest patients. Hospitalists were asked to Improve Measurable Quality at a time when most other physicians or even hospitals weren’t even being measured.
We were expected to form and Lead Teams of other clinicians when health care was still seen as a solo enterprise. Hospitalists were expected to Improve Efficiency and to create a Seamless Continuity, both during the hospital stay and in the transitions out of the hospital.
Hospitalists were asked to do things no one else wanted to do, such as taking on the uncompensated patients and extra hospital committee work and just about any new project their hospital wanted to be involved in. Along the way, we were expected to Make Other Physicians’ Lives Better by taking on their inpatients, inpatient calls, comanagement with specialists, and unloading the ED.
And both at medical schools and in the community, hospitalists became the Major Educators of medical students, residents, nurses, and other hospital staff.
At the same time, SHM was focusing on becoming a very unique medical professional society.
SHM built on the energy of our young and innovative hospitalists to forge a different path. We had no reputation to protect. We were not bound like most other specialty societies to over 100 years of “the way it’s always been done.”
While other professional societies thought their role in quality improvement was to pontificate and publish clinical guidelines that often were little used, SHM embarked on an aggressive, hands-on, frontline approach by starting SHM’s Center for Quality Improvement. Over the last 15 years, the center has raised millions of dollars to deliver real change and improvement at hundreds of hospitals nationwide, many times bringing work plans and mentors to support and train local clinicians in quality improvement skills and data collection. This approach was recognized by the National Quality Forum and the Joint Commission with their prestigious John Eisenberg Award for Quality Improvement.
When we went to Washington to help shape the future of health care, we did not ask for more money for hospitalists. We did not ask for more power or to use regulations to protect our new specialty. Instead, we went with ideas of how to make acute medical care more effective and efficient. We could show the politicians and the regulators how we could reduce incidence of deep vein thrombosis and pulmonary emboli, how we could make the hospital discharge process work better, how we could help chart a smoother medication reconciliation process, and so many other ways the system could be improved.
And even the way SHM generated our new ideas was uniquely different than other specialties. Way back in 2000 – long before Twitter and other social media were able to crowdsource and use the Internet to percolate new ideas – SHM relied on our members’ conversations on the SHM electronic mail discussion list to see what hospitalists were worried about, and what everyone was being asked to do, and SHM provided the resources and initiatives to support our nation’s hospitalists.
From these early conversations, SHM heard that hospitalists were being asked to Lead Change without much of an idea of the skills they would need. And so, the SHM leadership academies were born, which have now educated more than 2,700 hospitalist leaders.
Early on, we learned that hospitalists and even their bosses had no idea of how to start or run a successful hospital medicine group. SHM started our practice management courses and webinars and we developed the groundbreaking document, Key Characteristics of Effective Hospital Medicine Groups. In a typical SHM manner, we challenged most of our members to improve and get better rather trying to defend the status quo. At SHM, we have constantly felt that hospital medicine was a “work in progress.” We may not be perfect today, but we will be better in 90 days and even better in a year.
I have more to say about how we got this far and even more to say about where we might go. So, stay tuned and keep contributing to the future and success of SHM and hospital medicine.
Dr. Wellikson is the CEO of SHM. He has announced his plan to retire from SHM in late 2020. This article is the first in a series celebrating Dr. Wellikson’s tenure as CEO.
Early on, SHM defined the specialty
Early on, SHM defined the specialty
When I started at the Society of Hospital Medicine – known then as the National Association of Inpatient Physicians (NAIP) – in January 2000, Bill Clinton was still president. There were probably 500 hospitalists in the United States, and SHM had about 200-250 members.
It was so long ago that the iPhone hadn’t been invented, Twitter wasn’t even an idea, and Amazon was an online book store. SHM’s national offices were a cubicle at the American College of Physicians headquarters in Philadelphia, and our entire staff was me and a part-time assistant.
We have certainly come a long way in my 20 years as CEO of SHM.
When I first became involved with NAIP, it was to help the board with their strategic planning in 1998. At that time, the national thought leaders for the hospitalist movement (the term hospital medicine had not been invented yet) predicted that hospitalists would eventually do the inpatient work for about 25% of family doctors and for 15% of internists. Hospitalists were considered to be a form of “general medicine” without an office-based practice.
One of the first things we set about doing was to define the new specialty of hospital medicine before anyone else (e.g., American Medical Association, ACP, American Academy of Family Physicians, American Academy of Pediatrics, the government) defined us.
Most specialties were defined by a body organ (e.g., cardiology, renal), a population (e.g., pediatrics, geriatrics), or a disease (e.g., oncology), and there were a few other site-specific specialties (e.g., ED medicine, critical care). We felt that, to be a specialty, we needed certain key elements:
- Separate group consciousness
- Professional society
- Distinct residency and fellowship programs
- Separate CME
- Distinct educational materials (e.g., textbooks)
- Definable and distinct competencies
- Separate credentials – certification and/or hospital insurance driven
Early on, SHM defined the Core Competencies for Hospital Medicine for adults in patient care and, eventually, for pediatric patients. We rebranded our specialty as hospital medicine to be more than just inpatient physicians, and to broadly encompass the growing “big tent” of SHM that included those trained in internal medicine, family medicine, pediatrics, med-peds, as well as nurse practitioners, physician assistants, pharmacists, and others.
We were the first and only specialty society to set the standard for hospitalist compensation (how much you are paid) and productivity (what you are expected to do) with our unique State of Hospital Medicine (SOHM) Report. Other specialties left this work to the Medical Group Management Association, the AMA, or commercial companies.
Our specialty was soon being asked to do things that no other group of clinicians was ever asked to do.
Hospitalists were expected to Save Money by reducing length of stay and the use of resources on the sickest patients. Hospitalists were asked to Improve Measurable Quality at a time when most other physicians or even hospitals weren’t even being measured.
We were expected to form and Lead Teams of other clinicians when health care was still seen as a solo enterprise. Hospitalists were expected to Improve Efficiency and to create a Seamless Continuity, both during the hospital stay and in the transitions out of the hospital.
Hospitalists were asked to do things no one else wanted to do, such as taking on the uncompensated patients and extra hospital committee work and just about any new project their hospital wanted to be involved in. Along the way, we were expected to Make Other Physicians’ Lives Better by taking on their inpatients, inpatient calls, comanagement with specialists, and unloading the ED.
And both at medical schools and in the community, hospitalists became the Major Educators of medical students, residents, nurses, and other hospital staff.
At the same time, SHM was focusing on becoming a very unique medical professional society.
SHM built on the energy of our young and innovative hospitalists to forge a different path. We had no reputation to protect. We were not bound like most other specialty societies to over 100 years of “the way it’s always been done.”
While other professional societies thought their role in quality improvement was to pontificate and publish clinical guidelines that often were little used, SHM embarked on an aggressive, hands-on, frontline approach by starting SHM’s Center for Quality Improvement. Over the last 15 years, the center has raised millions of dollars to deliver real change and improvement at hundreds of hospitals nationwide, many times bringing work plans and mentors to support and train local clinicians in quality improvement skills and data collection. This approach was recognized by the National Quality Forum and the Joint Commission with their prestigious John Eisenberg Award for Quality Improvement.
When we went to Washington to help shape the future of health care, we did not ask for more money for hospitalists. We did not ask for more power or to use regulations to protect our new specialty. Instead, we went with ideas of how to make acute medical care more effective and efficient. We could show the politicians and the regulators how we could reduce incidence of deep vein thrombosis and pulmonary emboli, how we could make the hospital discharge process work better, how we could help chart a smoother medication reconciliation process, and so many other ways the system could be improved.
And even the way SHM generated our new ideas was uniquely different than other specialties. Way back in 2000 – long before Twitter and other social media were able to crowdsource and use the Internet to percolate new ideas – SHM relied on our members’ conversations on the SHM electronic mail discussion list to see what hospitalists were worried about, and what everyone was being asked to do, and SHM provided the resources and initiatives to support our nation’s hospitalists.
From these early conversations, SHM heard that hospitalists were being asked to Lead Change without much of an idea of the skills they would need. And so, the SHM leadership academies were born, which have now educated more than 2,700 hospitalist leaders.
Early on, we learned that hospitalists and even their bosses had no idea of how to start or run a successful hospital medicine group. SHM started our practice management courses and webinars and we developed the groundbreaking document, Key Characteristics of Effective Hospital Medicine Groups. In a typical SHM manner, we challenged most of our members to improve and get better rather trying to defend the status quo. At SHM, we have constantly felt that hospital medicine was a “work in progress.” We may not be perfect today, but we will be better in 90 days and even better in a year.
I have more to say about how we got this far and even more to say about where we might go. So, stay tuned and keep contributing to the future and success of SHM and hospital medicine.
Dr. Wellikson is the CEO of SHM. He has announced his plan to retire from SHM in late 2020. This article is the first in a series celebrating Dr. Wellikson’s tenure as CEO.

Aspirin for primary prevention reduces risk of CV events, increases bleeding
Background: Aspirin is beneficial in secondary prevention of stroke and MI. There is no consensus on its role in primary prevention of the same.

Study design: Systematic review and meta-analysis.
Setting: PubMed and Embase search on Cochrane from the earliest publication available through Nov. 1, 2018.
Synopsis: This meta-analysis included randomized, controlled trials that compared aspirin use versus no aspirin use in more than 1,000 participants without known cardiovascular (CV) disease. The primary CV outcome was a composite of CV mortality, nonfatal MI, and nonfatal stroke. The primary bleeding outcome was major bleeding (defined by individual studies). Thirteen studies enrolling 164,225 participants and including 1,050,511 participant-years were included. Compared with no aspirin use, aspirin use showed a reduction in composite CV outcomes (hazard ratio, 0.89; 95% confidence interval, 0.84-0.95; number needed to treat, 265) and an increased risk of major bleeding (HR, 1.43; 95% CI, 1.30-1.56; number needed to harm, 210). Limitations of the study include variations in data quality, outcome definitions, and aspirin doses among trials. The study authors advocate for including the lower risk of CV events and increased risk of major bleeding as part of discussions with patients about the use of aspirin for primary prevention.
Bottom line: Aspirin for primary prevention lowers risk of CV events and increases risk of major bleeding. Health care providers should include this as part of informed decision-making discussions with patients about the use of aspirin for primary prevention.
Citation: Zheng S et al. Association of aspirin use for primary prevention with cardiovascular events and bleeding events: A systematic review and meta-analysis. JAMA. 2019 Jan 22;321(3):277-87.
Dr. Radhakrishnan is a hospitalist at Beth Israel Deaconess Medical Center.
Background: Aspirin is beneficial in secondary prevention of stroke and MI. There is no consensus on its role in primary prevention of the same.
Study design: Systematic review and meta-analysis.
Setting: PubMed and Embase search on Cochrane from the earliest publication available through Nov. 1, 2018.
Synopsis: This meta-analysis included randomized, controlled trials that compared aspirin use versus no aspirin use in more than 1,000 participants without known cardiovascular (CV) disease. The primary CV outcome was a composite of CV mortality, nonfatal MI, and nonfatal stroke. The primary bleeding outcome was major bleeding (defined by individual studies). Thirteen studies enrolling 164,225 participants and including 1,050,511 participant-years were included. Compared with no aspirin use, aspirin use showed a reduction in composite CV outcomes (hazard ratio, 0.89; 95% confidence interval, 0.84-0.95; number needed to treat, 265) and an increased risk of major bleeding (HR, 1.43; 95% CI, 1.30-1.56; number needed to harm, 210). Limitations of the study include variations in data quality, outcome definitions, and aspirin doses among trials. The study authors advocate for including the lower risk of CV events and increased risk of major bleeding as part of discussions with patients about the use of aspirin for primary prevention.
Bottom line: Aspirin for primary prevention lowers risk of CV events and increases risk of major bleeding. Health care providers should include this as part of informed decision-making discussions with patients about the use of aspirin for primary prevention.
Citation: Zheng S et al. Association of aspirin use for primary prevention with cardiovascular events and bleeding events: A systematic review and meta-analysis. JAMA. 2019 Jan 22;321(3):277-87.
Dr. Radhakrishnan is a hospitalist at Beth Israel Deaconess Medical Center.
Spanish risk score predicts 30-day mortality in acute HF in ED patients
Background: The MEESSI-AHF (Multiple Estimation of Risk based on the Emergency Department Spanish Score In patients with Acute Heart Failure) score is a risk-stratification tool that includes systolic blood pressure, age, NT-proBNP, potassium, cardiac troponin T, New York Heart Association class 4 disease, respiratory rate, low-output symptoms, oxygen saturation, episode associated with acute coronary syndrome, signs of left ventricular hypertrophy on EKG, creatinine, and Barthel Index Score. Prior research has shown that it accurately risk-stratified ED patients with AHF in Spain. It has not been studied in other populations.

Study design: Prospective multicenter cohort study.
Setting: Adult ED patients with acute dyspnea in four hospitals in Switzerland.
Synopsis: The study included 1,247 nonhemodialysis patients who presented to the ED with acute dyspnea, were found to have all the necessary variables to calculate the MEESSI-AHF score, and were adjudicated to have acute heart failure. The authors calculated a modified MEESSI-AHF score, excluding the Barthel Index for all patients. The authors found that a six-group modified MEESSI-AHF risk-stratification model could predict 30-day mortality with excellent discrimination (C-Statistic, 0.80). Limitations of the study include the exclusion of all hemodynamically unstable patients and those on hemodialysis.
Bottom line: The MEESSI-AHF score effectively predicts 30-day mortality in AHF in Swiss and Spanish ED patients.
Citation: Wussler D et al. External validation of the MEESSI acute heart failure risk score: A cohort study. Ann Intern Med. 2019;170:248-56.
Dr. Radhakrishnan is a hospitalist at Beth Israel Deaconess Medical Center.
Background: The MEESSI-AHF (Multiple Estimation of Risk based on the Emergency Department Spanish Score In patients with Acute Heart Failure) score is a risk-stratification tool that includes systolic blood pressure, age, NT-proBNP, potassium, cardiac troponin T, New York Heart Association class 4 disease, respiratory rate, low-output symptoms, oxygen saturation, episode associated with acute coronary syndrome, signs of left ventricular hypertrophy on EKG, creatinine, and Barthel Index Score. Prior research has shown that it accurately risk-stratified ED patients with AHF in Spain. It has not been studied in other populations.
Study design: Prospective multicenter cohort study.
Setting: Adult ED patients with acute dyspnea in four hospitals in Switzerland.
Synopsis: The study included 1,247 nonhemodialysis patients who presented to the ED with acute dyspnea, were found to have all the necessary variables to calculate the MEESSI-AHF score, and were adjudicated to have acute heart failure. The authors calculated a modified MEESSI-AHF score, excluding the Barthel Index for all patients. The authors found that a six-group modified MEESSI-AHF risk-stratification model could predict 30-day mortality with excellent discrimination (C-Statistic, 0.80). Limitations of the study include the exclusion of all hemodynamically unstable patients and those on hemodialysis.
Bottom line: The MEESSI-AHF score effectively predicts 30-day mortality in AHF in Swiss and Spanish ED patients.
Citation: Wussler D et al. External validation of the MEESSI acute heart failure risk score: A cohort study. Ann Intern Med. 2019;170:248-56.
Dr. Radhakrishnan is a hospitalist at Beth Israel Deaconess Medical Center.
Oral antibiotics as effective as IV for stable endocarditis patients
Background: Patients with left-sided infective endocarditis often are treated with prolonged courses of intravenous (IV) antibiotics. The safety of switching from IV to oral antibiotics is unknown.
Study design: Randomized, multicenter, noninferiority study.
Setting: Cardiac centers in Denmark during July 2011–August 2017.
Synopsis: The study enrolled 400 patients with left-sided infective endocarditis and positive blood cultures from Streptococcus, Enterococcus, Staphylococcus aureus, or coagulase-negative staph (non–methicillin-resistant Staphylococcus aureus), without evidence of valvular abscess. Following at least 7 days (for those who required surgical intervention) or 10 days (for those who did not require surgical intervention) of IV antibiotics, patients with ongoing fever, leukocytosis, elevated C-reactive protein, or concurrent infections were excluded from the study. Patients were randomized to receive continued IV antibiotic treatment or switch to oral antibiotic treatment. The IV treatment group received a median of 19 additional days of therapy, compared with 17 days in the oral group. The primary composite outcome of death, unplanned cardiac surgery, embolic event, and relapse of bacteremia occurred in 12.1% in the IV therapy group and 9% in the oral therapy group (difference of 3.1%; 95% confidence interval, –3.4 to 9.6; P = .40), meeting the studies prespecified noninferiority criteria. Poor representation of women, obese patients, and patients who use IV drugs may limit the study’s generalizability. An accompanying editorial advocated for additional research before widespread change to current treatment recommendations are made.
Bottom line: For patients with left-sided infective endocarditis who have been stabilized on IV antibiotic treatment, transitioning to an oral antibiotic regimen may be a noninferior approach.
Citation: Iverson K et al. Partial oral versus intravenous antibiotic treatment of endocarditis. N Eng J Med. 2019 Jan 31;380(5):415-24.
Dr. Phillips is a hospitalist at Beth Israel Deaconess Medical Center and instructor in medicine at Harvard Medical School.
Previously healthy patients hospitalized for sepsis show increased mortality
WASHINGTON – Although severe, community-acquired sepsis in previously healthy U.S. adults is relatively uncommon, it occurs often enough to strike about 40,000 people annually, and when previously healthy people are hospitalized for severe sepsis, their rate of in-hospital mortality was double the rate in people with one or more comorbidities who have severe, community-acquired sepsis, based on a review of almost 7 million Americans hospitalized for sepsis.
The findings “underscore the importance of improving public awareness of sepsis and emphasizing early sepsis recognition and treatment in all patients,” including those without comorbidities, Chanu Rhee, MD, said at an annual scientific meeting on infectious diseases. He hypothesized that the increased sepsis mortality among previously healthy patients may have stemmed from factors such as delayed sepsis recognition resulting in hospitalization at a more advanced stage and less aggressive management.
In addition, “the findings provide context for high-profile reports about sepsis death in previously healthy people,” said Dr. Rhee, an infectious diseases and critical care physician at Brigham and Women’s Hospital in Boston. Dr. Rhee and associates found that, among patients hospitalized with what the researchers defined as “community-acquired” sepsis, 3% were judged previously healthy by having no identified major or minor comorbidity or pregnancy at the time of hospitalization, a percentage that – while small – still translates into roughly 40,000 such cases annually in the United States. That helps explain why every so often a headline appears about a famous person who died suddenly and unexpectedly from sepsis, he noted.
The study used data collected on hospitalized U.S. patients in the Cerner Health Facts, HCA Healthcare, and Institute for Health Metrics and Evaluation databases, which included about 6.7 million people total including 337,983 identified as having community-acquired sepsis, defined as patients who met the criteria for adult sepsis advanced by the Centers for Disease Control and Prevention within 2 days of their hospital admission. The researchers looked further into the hospital records of these patients and divided them into patients with one or more major comorbidities (96% of the cohort), patients who were pregnant or had a “minor” comorbidity such as a lipid disorder, benign neoplasm, or obesity (1% of the study group), or those with no chronic comorbidity (3%; the subgroup the researchers deemed previously healthy).
In a multivariate analysis that adjusted for patients’ age, sex, race, infection site, and illness severity at the time of hospital admission the researchers found that the rate of in-hospital death among the previously healthy patients was exactly twice the rate of those who had at least one major chronic comorbidity, Dr. Rhee reported. Differences in the treatment received by the previously-healthy patients or in their medical status compared with patients with a major comorbidity suggested that the previously health patients were sicker. They had a higher rate of mechanical ventilation, 30%, compared with about 18% for those with a comorbidity; a higher rate of acute kidney injury, about 43% in those previously healthy and 28% in those with a comorbidity; and a higher percentage had an elevated lactate level, about 41% among the previously healthy patients and about 22% among those with a comorbidity.
SOURCE: Alrawashdeh M et al. Open Forum Infect Dis. 2019 Oct 23;6. Abstract 891.
REPORTING FROM ID WEEK 2019

New score predicts benefits of prolonged cardiac monitoring for TIA, stroke patients
Background: Identifying paroxysmal atrial fibrillation (AFib) as the etiology of a transient ischemic attack (TIA) or stroke has implications for treatment as well as secondary prevention. Currently, there is not a universal, practical way to help determine which patients would benefit from prolonged cardiac monitoring to establish the diagnosis of AFib.

Study design: Logistic regression analysis of three prospective multicenter trials examining TIA and stroke patients who received Holter-ECG monitoring.
Setting: Patients who presented with TIA or stroke in Central Europe.
Synopsis: Using data from 1,556 patients, the authors identified age and NIH stroke scale score as being predictive of which patients were at highest risk for AFib detection within 72 hours of Holter-ECG monitor initiation. The authors developed a formula, titled AS5F; this formula scores each year of age as 0.76 points and then an NIH stroke scale score of 5 or less as 9 points or greater than 5 as 21 points. The authors found that the high-risk group (defined as those with AS5F scores of 67.5 or higher) had a predicted risk of 5.2%-40.8%, with a number needed to screen of 3. Given that a majority of the European patients included in the study were white, generalizability to other populations is unclear.
Bottom line: AS5F score may be able to predict those TIA and stroke patients who are most likely to be diagnosed with AFib with 72-hour cardiac monitoring.
Citation: Uphaus T et al. Development and validation of a score to detect paroxysmal atrial fibrillation after stroke. Neurology. 2019 Jan 8. doi. 10.1212/WNL.0000000000006727.
Dr. Phillips is a hospitalist at Beth Israel Deaconess Medical Center and instructor in medicine at Harvard Medical School.
Background: Identifying paroxysmal atrial fibrillation (AFib) as the etiology of a transient ischemic attack (TIA) or stroke has implications for treatment as well as secondary prevention. Currently, there is not a universal, practical way to help determine which patients would benefit from prolonged cardiac monitoring to establish the diagnosis of AFib.
Study design: Logistic regression analysis of three prospective multicenter trials examining TIA and stroke patients who received Holter-ECG monitoring.
Setting: Patients who presented with TIA or stroke in Central Europe.
Synopsis: Using data from 1,556 patients, the authors identified age and NIH stroke scale score as being predictive of which patients were at highest risk for AFib detection within 72 hours of Holter-ECG monitor initiation. The authors developed a formula, titled AS5F; this formula scores each year of age as 0.76 points and then an NIH stroke scale score of 5 or less as 9 points or greater than 5 as 21 points. The authors found that the high-risk group (defined as those with AS5F scores of 67.5 or higher) had a predicted risk of 5.2%-40.8%, with a number needed to screen of 3. Given that a majority of the European patients included in the study were white, generalizability to other populations is unclear.
Bottom line: AS5F score may be able to predict those TIA and stroke patients who are most likely to be diagnosed with AFib with 72-hour cardiac monitoring.
Citation: Uphaus T et al. Development and validation of a score to detect paroxysmal atrial fibrillation after stroke. Neurology. 2019 Jan 8. doi. 10.1212/WNL.0000000000006727.
Dr. Phillips is a hospitalist at Beth Israel Deaconess Medical Center and instructor in medicine at Harvard Medical School.
Patient-reported complications regarding PICC lines after inpatient discharge
Background: Despite the rise in utilization of PICC lines, few studies have addressed complications experienced by patients following PICC placement, especially subsequent to discharge from the inpatient setting.
Study design: Prospective longitudinal study.
Setting: Medical inpatient wards at four U.S. hospitals in Michigan and Texas.
Synopsis: Standardized questionnaires were completed by 438 patients who underwent PICC line placement during inpatient hospitalization within 3 days of placement and at 14, 30, and 70 days. The authors found that 61.4% of patients reported at least one possible PICC-related complication or complaint. A total of 17.6% reported signs and symptoms associated with a possible bloodstream infection; however, a central line–associated bloodstream infection was documented in only 1.6% of patients in the medical record. Furthermore, 30.6% of patients reported possible symptoms associated with deep venous thrombosis (DVT), which was documented in the medical record in 7.1% of patients. These data highlight that the frequency of PICC-related complications may be underestimated when relying solely on the medical record, especially when patients receive follow-up care at different facilities. Functionally, 26% of patients reported restrictions in activities of daily living and 19.2% reported difficulty with flushing and operating the PICC.
Bottom line: More than 60% of patients with PICC lines report signs or symptoms of a PICC-related complication or an adverse impact on physical or social function.
Citation: Krein SL et al. Patient-reported complications related to peripherally inserted central catheters: A multicenter prospective cohort study. BMJ Qual Saf. 2019 Jan 25. doi: 10.1136/bmjqs-2018-008726.
Dr. Cooke is a hospitalist at Beth Israel Deaconess Medical Center.
Hospitalists finding their role in hospital quality ratings
CMS considers how to assess socioeconomic factors
Since 2005 the government website Hospital Compare has publicly reported quality data on hospitals, with periodic updates of their performance, including specific measures of quality. But how accurately do the ratings reflect a hospital’s actual quality of care, and what do the ratings mean for hospitalists?

Hospital Compare provides searchable, comparable information to consumers on reported quality of care data submitted by more than 4,000 Medicare-certified hospitals, along with Veterans Administration and military health system hospitals. It is designed to allow consumers to select hospitals and directly compare their mortality, complication, infection, and other performance measures on conditions such as heart attacks, heart failure, pneumonia, and surgical outcomes.
The Overall Hospital Quality Star Ratings, which began in 2016, combine data from more than 50 quality measures publicly reported on Hospital Compare into an overall rating of one to five stars for each hospital. These ratings are designed to enhance and supplement existing quality measures with a more “customer-centric” measure that makes it easier for consumers to act on the information. Obviously, this would be helpful to consumers who feel overwhelmed by the volume of data on the Hospital Compare website, and by the complexity of some of the measures.
A posted call in spring 2019 by CMS for public comment on possible methodological changes to the Overall Hospital Quality Star Ratings received more than 800 comments from 150 different organizations. And this past summer, the Centers for Medicare & Medicaid Services decided to delay posting the refreshed Star Ratings in its Hospital Compare data preview reports for July 2019. The agency says it intends to release the updated information in early 2020. Meanwhile, the reported data – particularly the overall star ratings – continue to generate controversy for the hospital field.
Hospitalists’ critical role
Hospitalists are not rated individually on Hospital Compare, but they play important roles in the quality of care their hospital provides – and thus ultimately the hospital’s publicly reported rankings. Hospitalists typically are not specifically incentivized or penalized for their hospital’s performance, but this does happen in some cases.
“Hospital administrators absolutely take note of their hospital’s star ratings. These are the people hospitalists work for, and this is definitely top of their minds,” said Kate Goodrich, MD, MHS, director of the Center for Clinical Standards and Quality at CMS. “I recently spoke at an SHM annual conference and every question I was asked was about hospital ratings and the star system,” noted Dr. Goodrich, herself a practicing hospitalist at George Washington University Medical Center in Washington.
The government’s aim for Hospital Compare is to give consumers easy-to-understand indicators of the quality of care provided by hospitals, especially where they might have a choice of hospitals, such as for an elective surgery. Making that information public is also viewed as a motivator to help drive improvements in hospital performance, Dr. Goodrich said.
“In terms of what we measure, we try to make sure it’s important to patients and to clinicians. We have frontline practicing physicians, patients, and families advising us, along with methodologists and PhD researchers. These stakeholders tell us what is important to measure and why,” she said. “Hospitals and all health providers need more actionable and timely data to improve their quality of care, especially if they want to participate in accountable care organizations. And we need to make the information easy to understand.”
Dr. Goodrich sees two main themes in the public response to its request for comment. “People say the methodology we use to calculate star ratings is frustrating for hospitals, which have found it difficult to model their performance, predict their star ratings, or explain the discrepancies.” Hospitals taking care of sicker patients with lower socioeconomic status also say the ratings unfairly penalize them. “I work in a large urban hospital, and I understand this. They say we don’t take that sufficiently into account in the ratings,” she said.
“While our modeling shows that current ratings highly correlate with performance on individual measures, we have asked for comment on if and how we could adjust for socioeconomic factors. We are actively considering how to make changes to address these concerns,” Dr. Goodrich said.
In August 2019, CMS acknowledged that it plans to change the methodology used to calculate hospital star ratings in early 2021, but has not yet revealed specific details about the nature of the changes. The agency intends to propose the changes through the public rule-making process sometime in 2020.
Continuing controversy
The American Hospital Association – which has had strong concerns about the methodology and the usefulness of hospital star ratings – is pushing back on some of the changes to the system being considered by CMS. In its submitted comments, AHA supported only three of the 14 potential star ratings methodology changes being considered. AHA and the American Association of Medical Colleges, among others, have urged taking down the star ratings until major changes can be made.
“When the star ratings were first implemented, a lot of challenges became apparent right away,” said Akin Demehin, MPH, AHA’s director of quality policy. “We began to see that those hospitals that treat more complicated patients and poorer patients tended to perform more poorly on the ratings. So there was something wrong with the methodology. Then, starting in 2018, hospitals began seeing real shifts in their performance ratings when the underlying data hadn’t really changed.”
CMS uses a statistical approach called latent variable modeling. Its underlying assumption is that you can say something about a hospital’s underlying quality based on the data you already have, Mr. Demehin said, but noted “that can be a questionable assumption.” He also emphasized the need for ratings that compare hospitals that are similar in size and model to each other.

Suparna Dutta, MD, division chief, hospital medicine, Rush University, Chicago, said analyses done at Rush showed that the statistical model CMS used in calculating the star ratings was dynamically changing the weighting of certain measures in every release. “That meant one specific performance measure could play an outsized role in determining a final rating,” she said. In particular the methodology inadvertently penalized large hospitals, academic medical centers, and institutions that provide heroic care.
“We fundamentally believe that consumers should have meaningful information about hospital quality,” said Nancy Foster, AHA’s vice president for quality and patient safety policy at AHA. “We understand the complexities of Hospital Compare and the challenges of getting simple information for consumers. To its credit, CMS is thinking about how to do that, and we support them in that effort.”
Getting a handle on quality
Hospitalists are responsible for ensuring that their hospitals excel in the care of patients, said Julius Yang, MD, hospitalist and director of quality at Beth Israel Deaconess Medical Center in Boston. That also requires keeping up on the primary public ways these issues are addressed through reporting of quality data and through reimbursement policy. “That should be part of our core competencies as hospitalists.”
Some of the measures on Hospital Compare don’t overlap much with the work of hospitalists, he noted. But for others, such as for pneumonia, COPD, and care of patients with stroke, or for mortality and 30-day readmissions rates, “we are involved, even if not directly, and certainly responsible for contributing to the outcomes and the opportunity to add value,” he said.
“When it comes to 30-day readmission rates, do we really understand the risk factors for readmissions and the barriers to patients remaining in the community after their hospital stay? Are our patients stable enough to be discharged, and have we worked with the care coordination team to make sure they have the resources they need? And have we communicated adequately with the outpatient doctor? All of these things are within the wheelhouse of the hospitalist,” Dr. Yang said. “Let’s accept that the readmissions rate, for example, is not a perfect measure of quality. But as an imperfect measure, it can point us in the right direction.”

Jose Figueroa, MD, MPH, hospitalist and assistant professor at Harvard Medical School, has been studying for his health system the impact of hospital penalties such as the Hospital Readmissions Reduction Program on health equity. In general, hospitalists play an important role in dictating processes of care and serving on quality-oriented committees across multiple realms of the hospital, he said.
“What’s hard from the hospitalist’s perspective is that there don’t seem to be simple solutions to move the dial on many of these measures,” Dr. Figueroa said. “If the hospital is at three stars, can we say, okay, if we do X, Y, and Z, then our hospital will move from three to five stars? Some of these measures are so broad and not in our purview. Which ones apply to me as a hospitalist and my care processes?”
Dr. Dutta sits on the SHM Policy Committee, which has been working to bring these issues to the attention of frontline hospitalists. “Hospitalists are always going to be aligned with their hospital’s priorities. We’re in it to provide high-quality care, but there’s no magic way to do that,” she said.
Hospital Compare measures sometimes end up in hospitalist incentives plans – for example, the readmission penalty rates – even though that is a fairly arbitrary measure and hard to pin to one doctor, Dr. Dutta explained. “If you look at the evidence regarding these metrics, there are not a lot of data to show that the metrics lead to what we really want, which is better care for patients.”
A recent study in the British Medical Journal, for example, examined the association between the penalties on hospitals in the Hospital Acquired Condition Reduction Program and clinical outcome.1 The researchers concluded that the penalties were not associated with significant change or found to drive meaningful clinical improvement.
How can hospitalists engage with Compare?
Dr. Goodrich refers hospitalists seeking quality resources to their local quality improvement organizations (QIO) and to Hospital Improvement Innovation Networks at the regional, state, national, or hospital system level.
One helpful thing that any group of hospitalists could do, added Dr. Figueroa, is to examine the measures closely and determine which ones they think they can influence. “Then look for the hospitals that resemble ours and care for similar patients, based on the demographics. We can then say: ‘Okay, that’s a fair comparison. This can be a benchmark with our peers,’” he said. Then it’s important to ask how your hospital is doing over time on these measures, and use that to prioritize.
“You also have to appreciate that these are broad quality measures, and to impact them you have to do broad quality improvement efforts. Another piece of this is getting good at collecting and analyzing data internally in a timely fashion. You don’t want to wait 2-3 years to find out in Hospital Compare that you’re not performing well. You care about the care you provided today, not 2 or 3 years ago. Without this internal check, it’s impossible to know what to invest in – and to see if things you do are having an impact,” Dr. Figueroa said.
“As physician leaders, this is a real opportunity for us to trigger a conversation with our hospital’s administration around what we went into medicine for in the first place – to improve our patients’ care,” said Dr. Goodrich. She said Hospital Compare is one tool for sparking systemic quality improvement across the hospital – which is an important part of the hospitalist’s job. “If you want to be a bigger star within your hospital, show that level of commitment. It likely would be welcomed by your hospital.”
Reference
1. Sankaran R et al. Changes in hospital safety following penalties in the US Hospital Acquired Condition Reduction Program: retrospective cohort study. BMJ. 2019 Jul 3 doi: 10.1136/bmj.l4109.
CMS considers how to assess socioeconomic factors
CMS considers how to assess socioeconomic factors
Since 2005 the government website Hospital Compare has publicly reported quality data on hospitals, with periodic updates of their performance, including specific measures of quality. But how accurately do the ratings reflect a hospital’s actual quality of care, and what do the ratings mean for hospitalists?
Hospital Compare provides searchable, comparable information to consumers on reported quality of care data submitted by more than 4,000 Medicare-certified hospitals, along with Veterans Administration and military health system hospitals. It is designed to allow consumers to select hospitals and directly compare their mortality, complication, infection, and other performance measures on conditions such as heart attacks, heart failure, pneumonia, and surgical outcomes.
The Overall Hospital Quality Star Ratings, which began in 2016, combine data from more than 50 quality measures publicly reported on Hospital Compare into an overall rating of one to five stars for each hospital. These ratings are designed to enhance and supplement existing quality measures with a more “customer-centric” measure that makes it easier for consumers to act on the information. Obviously, this would be helpful to consumers who feel overwhelmed by the volume of data on the Hospital Compare website, and by the complexity of some of the measures.
A posted call in spring 2019 by CMS for public comment on possible methodological changes to the Overall Hospital Quality Star Ratings received more than 800 comments from 150 different organizations. And this past summer, the Centers for Medicare & Medicaid Services decided to delay posting the refreshed Star Ratings in its Hospital Compare data preview reports for July 2019. The agency says it intends to release the updated information in early 2020. Meanwhile, the reported data – particularly the overall star ratings – continue to generate controversy for the hospital field.
Hospitalists’ critical role
Hospitalists are not rated individually on Hospital Compare, but they play important roles in the quality of care their hospital provides – and thus ultimately the hospital’s publicly reported rankings. Hospitalists typically are not specifically incentivized or penalized for their hospital’s performance, but this does happen in some cases.
“Hospital administrators absolutely take note of their hospital’s star ratings. These are the people hospitalists work for, and this is definitely top of their minds,” said Kate Goodrich, MD, MHS, director of the Center for Clinical Standards and Quality at CMS. “I recently spoke at an SHM annual conference and every question I was asked was about hospital ratings and the star system,” noted Dr. Goodrich, herself a practicing hospitalist at George Washington University Medical Center in Washington.
The government’s aim for Hospital Compare is to give consumers easy-to-understand indicators of the quality of care provided by hospitals, especially where they might have a choice of hospitals, such as for an elective surgery. Making that information public is also viewed as a motivator to help drive improvements in hospital performance, Dr. Goodrich said.
“In terms of what we measure, we try to make sure it’s important to patients and to clinicians. We have frontline practicing physicians, patients, and families advising us, along with methodologists and PhD researchers. These stakeholders tell us what is important to measure and why,” she said. “Hospitals and all health providers need more actionable and timely data to improve their quality of care, especially if they want to participate in accountable care organizations. And we need to make the information easy to understand.”
Dr. Goodrich sees two main themes in the public response to its request for comment. “People say the methodology we use to calculate star ratings is frustrating for hospitals, which have found it difficult to model their performance, predict their star ratings, or explain the discrepancies.” Hospitals taking care of sicker patients with lower socioeconomic status also say the ratings unfairly penalize them. “I work in a large urban hospital, and I understand this. They say we don’t take that sufficiently into account in the ratings,” she said.
“While our modeling shows that current ratings highly correlate with performance on individual measures, we have asked for comment on if and how we could adjust for socioeconomic factors. We are actively considering how to make changes to address these concerns,” Dr. Goodrich said.
In August 2019, CMS acknowledged that it plans to change the methodology used to calculate hospital star ratings in early 2021, but has not yet revealed specific details about the nature of the changes. The agency intends to propose the changes through the public rule-making process sometime in 2020.
Continuing controversy
The American Hospital Association – which has had strong concerns about the methodology and the usefulness of hospital star ratings – is pushing back on some of the changes to the system being considered by CMS. In its submitted comments, AHA supported only three of the 14 potential star ratings methodology changes being considered. AHA and the American Association of Medical Colleges, among others, have urged taking down the star ratings until major changes can be made.
“When the star ratings were first implemented, a lot of challenges became apparent right away,” said Akin Demehin, MPH, AHA’s director of quality policy. “We began to see that those hospitals that treat more complicated patients and poorer patients tended to perform more poorly on the ratings. So there was something wrong with the methodology. Then, starting in 2018, hospitals began seeing real shifts in their performance ratings when the underlying data hadn’t really changed.”
CMS uses a statistical approach called latent variable modeling. Its underlying assumption is that you can say something about a hospital’s underlying quality based on the data you already have, Mr. Demehin said, but noted “that can be a questionable assumption.” He also emphasized the need for ratings that compare hospitals that are similar in size and model to each other.
Suparna Dutta, MD, division chief, hospital medicine, Rush University, Chicago, said analyses done at Rush showed that the statistical model CMS used in calculating the star ratings was dynamically changing the weighting of certain measures in every release. “That meant one specific performance measure could play an outsized role in determining a final rating,” she said. In particular the methodology inadvertently penalized large hospitals, academic medical centers, and institutions that provide heroic care.
“We fundamentally believe that consumers should have meaningful information about hospital quality,” said Nancy Foster, AHA’s vice president for quality and patient safety policy at AHA. “We understand the complexities of Hospital Compare and the challenges of getting simple information for consumers. To its credit, CMS is thinking about how to do that, and we support them in that effort.”
Getting a handle on quality
Hospitalists are responsible for ensuring that their hospitals excel in the care of patients, said Julius Yang, MD, hospitalist and director of quality at Beth Israel Deaconess Medical Center in Boston. That also requires keeping up on the primary public ways these issues are addressed through reporting of quality data and through reimbursement policy. “That should be part of our core competencies as hospitalists.”
Some of the measures on Hospital Compare don’t overlap much with the work of hospitalists, he noted. But for others, such as for pneumonia, COPD, and care of patients with stroke, or for mortality and 30-day readmissions rates, “we are involved, even if not directly, and certainly responsible for contributing to the outcomes and the opportunity to add value,” he said.
“When it comes to 30-day readmission rates, do we really understand the risk factors for readmissions and the barriers to patients remaining in the community after their hospital stay? Are our patients stable enough to be discharged, and have we worked with the care coordination team to make sure they have the resources they need? And have we communicated adequately with the outpatient doctor? All of these things are within the wheelhouse of the hospitalist,” Dr. Yang said. “Let’s accept that the readmissions rate, for example, is not a perfect measure of quality. But as an imperfect measure, it can point us in the right direction.”
Jose Figueroa, MD, MPH, hospitalist and assistant professor at Harvard Medical School, has been studying for his health system the impact of hospital penalties such as the Hospital Readmissions Reduction Program on health equity. In general, hospitalists play an important role in dictating processes of care and serving on quality-oriented committees across multiple realms of the hospital, he said.
“What’s hard from the hospitalist’s perspective is that there don’t seem to be simple solutions to move the dial on many of these measures,” Dr. Figueroa said. “If the hospital is at three stars, can we say, okay, if we do X, Y, and Z, then our hospital will move from three to five stars? Some of these measures are so broad and not in our purview. Which ones apply to me as a hospitalist and my care processes?”
Dr. Dutta sits on the SHM Policy Committee, which has been working to bring these issues to the attention of frontline hospitalists. “Hospitalists are always going to be aligned with their hospital’s priorities. We’re in it to provide high-quality care, but there’s no magic way to do that,” she said.
Hospital Compare measures sometimes end up in hospitalist incentives plans – for example, the readmission penalty rates – even though that is a fairly arbitrary measure and hard to pin to one doctor, Dr. Dutta explained. “If you look at the evidence regarding these metrics, there are not a lot of data to show that the metrics lead to what we really want, which is better care for patients.”
A recent study in the British Medical Journal, for example, examined the association between the penalties on hospitals in the Hospital Acquired Condition Reduction Program and clinical outcome.1 The researchers concluded that the penalties were not associated with significant change or found to drive meaningful clinical improvement.
How can hospitalists engage with Compare?
Dr. Goodrich refers hospitalists seeking quality resources to their local quality improvement organizations (QIO) and to Hospital Improvement Innovation Networks at the regional, state, national, or hospital system level.
One helpful thing that any group of hospitalists could do, added Dr. Figueroa, is to examine the measures closely and determine which ones they think they can influence. “Then look for the hospitals that resemble ours and care for similar patients, based on the demographics. We can then say: ‘Okay, that’s a fair comparison. This can be a benchmark with our peers,’” he said. Then it’s important to ask how your hospital is doing over time on these measures, and use that to prioritize.
“You also have to appreciate that these are broad quality measures, and to impact them you have to do broad quality improvement efforts. Another piece of this is getting good at collecting and analyzing data internally in a timely fashion. You don’t want to wait 2-3 years to find out in Hospital Compare that you’re not performing well. You care about the care you provided today, not 2 or 3 years ago. Without this internal check, it’s impossible to know what to invest in – and to see if things you do are having an impact,” Dr. Figueroa said.
“As physician leaders, this is a real opportunity for us to trigger a conversation with our hospital’s administration around what we went into medicine for in the first place – to improve our patients’ care,” said Dr. Goodrich. She said Hospital Compare is one tool for sparking systemic quality improvement across the hospital – which is an important part of the hospitalist’s job. “If you want to be a bigger star within your hospital, show that level of commitment. It likely would be welcomed by your hospital.”
Reference
1. Sankaran R et al. Changes in hospital safety following penalties in the US Hospital Acquired Condition Reduction Program: retrospective cohort study. BMJ. 2019 Jul 3 doi: 10.1136/bmj.l4109.