User login
How P-wave indices can improve AFib-related ischemic stroke prediction
Background: Current AFib management guidelines recommend ischemic stroke risk stratification with CHA2DS2-VASc score; however, emerging studies have highlighted limitations of this score.

Study design: Retrospective review of previously obtained prospective cohort study data.
Setting: Fourteen U.S. communities.
Synopsis: For the 2,929 individuals with new incident AFib without anticoagulant use in the prior year, study authors computed P-wave indices (including P-wave axis, P-wave duration, advanced interatrial block, and P-wave terminal force in lead V1) from the most recent sinus rhythm EKG prior to the diagnosis of AFib. Cox proportional hazard models estimated the hazard ratio between PWIs and ischemic stroke. Of the PWIs tested above, abnormal P-wave axis (hazard ratio, 1.88; 95% confidence interval, 1.36-2.61) and advanced interatrial block (HR, 2.93; 95% CI 1.78-4.81) were associated with increased risk of stroke after adjustment for individual CHA2DS2-VASc variables. A P2-CHA2DS2-VASc score that incorporated abnormal P-wave axis measurements demonstrated superior discrimination, compared with the CHA2DS2-VASc score alone, and resulted in improvement in ischemic stroke risk classification.
Bottom line: Abnormal P-wave axis and advanced interatrial block measured during periods of sinus rhythm may be associated with increased risk of ischemic stroke in patients with atrial fibrillation; the P2-CHA2DS2-VASc score incorporating abnormal P-wave axis may be superior to CHA2DS2-VASc in ischemic stroke risk classification.
Citation: Maheshwari A et al. Refining prediction of atrial fibrillation–related stroke using the P2-CHA2DS2-VASc score. Circulation. 2019 Jan 8;139:180-91.
Dr. Cooke is a hospitalist at Beth Israel Deaconess Medical Center.
Background: Current AFib management guidelines recommend ischemic stroke risk stratification with CHA2DS2-VASc score; however, emerging studies have highlighted limitations of this score.
Study design: Retrospective review of previously obtained prospective cohort study data.
Setting: Fourteen U.S. communities.
Synopsis: For the 2,929 individuals with new incident AFib without anticoagulant use in the prior year, study authors computed P-wave indices (including P-wave axis, P-wave duration, advanced interatrial block, and P-wave terminal force in lead V1) from the most recent sinus rhythm EKG prior to the diagnosis of AFib. Cox proportional hazard models estimated the hazard ratio between PWIs and ischemic stroke. Of the PWIs tested above, abnormal P-wave axis (hazard ratio, 1.88; 95% confidence interval, 1.36-2.61) and advanced interatrial block (HR, 2.93; 95% CI 1.78-4.81) were associated with increased risk of stroke after adjustment for individual CHA2DS2-VASc variables. A P2-CHA2DS2-VASc score that incorporated abnormal P-wave axis measurements demonstrated superior discrimination, compared with the CHA2DS2-VASc score alone, and resulted in improvement in ischemic stroke risk classification.
Bottom line: Abnormal P-wave axis and advanced interatrial block measured during periods of sinus rhythm may be associated with increased risk of ischemic stroke in patients with atrial fibrillation; the P2-CHA2DS2-VASc score incorporating abnormal P-wave axis may be superior to CHA2DS2-VASc in ischemic stroke risk classification.
Citation: Maheshwari A et al. Refining prediction of atrial fibrillation–related stroke using the P2-CHA2DS2-VASc score. Circulation. 2019 Jan 8;139:180-91.
Dr. Cooke is a hospitalist at Beth Israel Deaconess Medical Center.
Dose-reduced NOACs may be safer than warfarin in some AFib patients
Background: Prior studies have suggested that NOACs have a favorable risk-benefit profile when compared with warfarin, but it is unclear if this advantage also is present for those high-risk patients for whom NOAC dose reduction is recommended.

Study design: A meta-analysis.
Setting: Three phase 3 randomized, control trials.
Synopsis: From the three randomized, control trials, the authors identified 7,351 of the 46,426 patients as being eligible for dose-reduced NOACs. Of these patients, 3,702 were randomized to take a NOAC and 3,649 were randomized to take warfarin. For the primary outcomes of stroke or systemic embolism, there was no significant difference between patients randomized to receive dose-reduced NOAC versus warfarin. For outcomes of major bleeding, hemorrhagic stroke, intracranial hemorrhage, and fatal bleeding, dose-reduced NOACs had a significantly lower risk, compared with warfarin.
Bottom line: In patients eligible for dose-reduced NOACs, the use of dose-reduced NOACs may have a better safety profile without significant difference in the rate of ischemic stroke or systemic embolism.
Citation: Wang KL et al. Efficacy and safety of reduced-dose non–vitamin K antagonist oral anticoagulants in patients with atrial fibrillation: A meta-analysis of randomized controlled trials. Eur Heart J. 2018 Dec 22. doi: 10.1093/eurheartj/ehy802.
Dr. Biddick is a hospitalist at Beth Israel Deaconess Medical Center and instructor in medicine Harvard Medical School.
Background: Prior studies have suggested that NOACs have a favorable risk-benefit profile when compared with warfarin, but it is unclear if this advantage also is present for those high-risk patients for whom NOAC dose reduction is recommended.
Study design: A meta-analysis.
Setting: Three phase 3 randomized, control trials.
Synopsis: From the three randomized, control trials, the authors identified 7,351 of the 46,426 patients as being eligible for dose-reduced NOACs. Of these patients, 3,702 were randomized to take a NOAC and 3,649 were randomized to take warfarin. For the primary outcomes of stroke or systemic embolism, there was no significant difference between patients randomized to receive dose-reduced NOAC versus warfarin. For outcomes of major bleeding, hemorrhagic stroke, intracranial hemorrhage, and fatal bleeding, dose-reduced NOACs had a significantly lower risk, compared with warfarin.
Bottom line: In patients eligible for dose-reduced NOACs, the use of dose-reduced NOACs may have a better safety profile without significant difference in the rate of ischemic stroke or systemic embolism.
Citation: Wang KL et al. Efficacy and safety of reduced-dose non–vitamin K antagonist oral anticoagulants in patients with atrial fibrillation: A meta-analysis of randomized controlled trials. Eur Heart J. 2018 Dec 22. doi: 10.1093/eurheartj/ehy802.
Dr. Biddick is a hospitalist at Beth Israel Deaconess Medical Center and instructor in medicine Harvard Medical School.
EHR prompt significantly reduced telemetry monitoring during inpatient stays
Background: Prior studies have shown multifaceted interventions that include EHR prompts can reduce the utilization of telemetry monitoring, but it is unclear if EHR prompts alone can reduce utilization.

Study design: Cluster-randomized, control trial.
Setting: November 2016 and May 2017 at a tertiary care medical center on the general medicine service.
Synopsis: The authors designed an EHR prompt for patients ordered for telemetry. The prompt would request the team to either discontinue or continue telemetry. Half of the general medicine teams (representing 499 hospitalizations) were randomized to receive the intervention, and the other half of the general medicine teams (representing 567 hospitalizations) did not receive the intervention. In the intervention group, 62% of prompts were followed by a discontinuation of telemetry. This led to a 17% reduction in the mean hours of telemetry monitoring (50 hours in the control group and 41.3 hours in the intervention group; P = .001). There was no significant difference in the rate of rapid responses or medical emergencies between the two groups.
Bottom line: A targeted EHR prompt alone may lead to a reduction in the utilization of telemetry monitoring.
Citation: Najafi N et al. Assessment of a targeted electronic health record intervention to reduce telemetry duration: A cluster-randomized clinical trial. JAMA Intern Med. 2019 Dec 10;179(1):11-5.
Dr. Biddick is a hospitalist at Beth Israel Deaconess Medical Center and instructor in medicine Harvard Medical School.
Background: Prior studies have shown multifaceted interventions that include EHR prompts can reduce the utilization of telemetry monitoring, but it is unclear if EHR prompts alone can reduce utilization.
Study design: Cluster-randomized, control trial.
Setting: November 2016 and May 2017 at a tertiary care medical center on the general medicine service.
Synopsis: The authors designed an EHR prompt for patients ordered for telemetry. The prompt would request the team to either discontinue or continue telemetry. Half of the general medicine teams (representing 499 hospitalizations) were randomized to receive the intervention, and the other half of the general medicine teams (representing 567 hospitalizations) did not receive the intervention. In the intervention group, 62% of prompts were followed by a discontinuation of telemetry. This led to a 17% reduction in the mean hours of telemetry monitoring (50 hours in the control group and 41.3 hours in the intervention group; P = .001). There was no significant difference in the rate of rapid responses or medical emergencies between the two groups.
Bottom line: A targeted EHR prompt alone may lead to a reduction in the utilization of telemetry monitoring.
Citation: Najafi N et al. Assessment of a targeted electronic health record intervention to reduce telemetry duration: A cluster-randomized clinical trial. JAMA Intern Med. 2019 Dec 10;179(1):11-5.
Dr. Biddick is a hospitalist at Beth Israel Deaconess Medical Center and instructor in medicine Harvard Medical School.
Quick Byte: DeepMind emerges
The science of prediction
Hundreds of scientists around the world enter a competition every 2 years called the Critical Assessment of Structure Prediction.

“Tackling a biological puzzle they call ‘the protein folding problem,’ they try to predict the three-dimensional shape of proteins in the human body. No one knows how to solve the problem. Even the winners only chip away at it. But a solution could streamline the way scientists create new medicines and fight disease,” according to a report in the New York Times.
In 2019, those scientists did not win the contest. “It was won by DeepMind, the artificial intelligence lab owned by Google’s parent company. DeepMind specializes in ‘deep learning,’ a type of artificial intelligence that is rapidly changing drug discovery science.”
Reference
1. Metz C. “Making New Drugs With a Dose of Artificial Intelligence,” New York Times. Feb. 5, 2019. https://www.nytimes.com/2019/02/05/technology/artificial-intelligence-drug-research-deepmind.html. Accessed Feb 7, 2019.
The science of prediction
The science of prediction
Hundreds of scientists around the world enter a competition every 2 years called the Critical Assessment of Structure Prediction.
“Tackling a biological puzzle they call ‘the protein folding problem,’ they try to predict the three-dimensional shape of proteins in the human body. No one knows how to solve the problem. Even the winners only chip away at it. But a solution could streamline the way scientists create new medicines and fight disease,” according to a report in the New York Times.
In 2019, those scientists did not win the contest. “It was won by DeepMind, the artificial intelligence lab owned by Google’s parent company. DeepMind specializes in ‘deep learning,’ a type of artificial intelligence that is rapidly changing drug discovery science.”
Reference
1. Metz C. “Making New Drugs With a Dose of Artificial Intelligence,” New York Times. Feb. 5, 2019. https://www.nytimes.com/2019/02/05/technology/artificial-intelligence-drug-research-deepmind.html. Accessed Feb 7, 2019.
Demeaning patient behavior takes emotional toll on physicians
Despite an increasingly diverse workforce, a new study has found that many patients remain biased toward certain physicians, which can produce substantial negative – and occasionally positive – effects.

“Addressing demeaning behavior from patients will require a concerted effort from medical schools and hospital leadership to create an environment that respects the diversity of patients and physicians alike,” wrote Margaret Wheeler, MD, of the University of California, San Francisco (UCSF) and her coauthors. The study was published in JAMA Internal Medicine.
To determine the perspectives of physicians and trainees in regard to patient bias, along with potential barriers to responding effectively, the researchers led 13 focus groups attended by internal 11 medicine hospitalist physicians, 26 internal medicine residents, and 13 medical students affiliated with the UCSF School of Medicine. In terms of gender, 26 participants identified as women, 22 as men, and 2 as gender nonconforming. In terms of racial and ethnic diversity, 26 were white, 8 were Latinx, 7 were Asian, 3 were South Asian, 1 was Middle Eastern, and 5 were black.
In describing biased and demeaning patient behavior, the participants recalled remarks that ranged from refusal of care and questioning the clinician’s role to ethnic jokes, questions as to their ethnic backgrounds, inappropriate flirtations or compliments. The effects of these behaviors on the participants included negative responses like carrying an emotional burden and withdrawing from work, along with positive responses like an increased desire for self-growth and to pursue leadership opportunities.
Barriers to addressing these behaviors included a lack of support, uncertainty as to the appropriate response, and a fear of being perceived as unprofessional. Deciding how to respond – or to respond at all – was often dictated by the level of support from colleagues, a professional responsibility to peers, and the presence of a positive role model who would’ve done the same.
The authors acknowledged their study’s limitations, including only knowing the views of those who were interviewed. In addition, all participants came from a medical school located in a diverse city that embraces different cultures, meaning their findings “may not reflect the experiences of physicians in other geographic regions.”
The study was supported by the Greenwall Foundation. The authors reported no conflicts of interest.
SOURCE: Wheeler M et al. JAMA Intern Med. 2019 Oct 28. doi: 10.1001/jamainternmed.2019.4122.
The results of the patient bias study from Wheeler et al are troubling, but not surprising.
As the physician workforce becomes more diverse in regard to race, ethnicity, sex, gender identity, and sexual orientation, considering and addressing the negative impacts of demeaning patient interactions becomes increasingly important. And though a recent analysis stated a decline in biases between 2007 and 2016, discriminatory and disrespectful treatment remains the norm for members of many minority groups.
Strategies to address these behaviors include codes of professional ethics offering guidance on responding to disrespectful behavior, antidiscrimination training for all health professionals, and health care leaders themselves practicing and preaching respectfulness and civility within their institutions.
Patients can only be expected to behave respectfully towards physicians if the culture of health care is also respectful.
When anyone, including a patient, exhibits biased and disrespectful behavior, silence is not golden. It is tacit approval. We all have the responsibility to speak and act.
Lisa A. Cooper, MD, and Mary Catherine Beach, MD, of Johns Hopkins University in Baltimore; and David R. Williams, PhD, of Harvard University, Boston, made these comments in an accompanying editorial (JAMA Intern Med. 2019 Oct 28. doi: 10.1001/jamainternmed.2019.4100). They reported no conflicts of interest.
Despite an increasingly diverse workforce, a new study has found that many patients remain biased toward certain physicians, which can produce substantial negative – and occasionally positive – effects.
“Addressing demeaning behavior from patients will require a concerted effort from medical schools and hospital leadership to create an environment that respects the diversity of patients and physicians alike,” wrote Margaret Wheeler, MD, of the University of California, San Francisco (UCSF) and her coauthors. The study was published in JAMA Internal Medicine.
To determine the perspectives of physicians and trainees in regard to patient bias, along with potential barriers to responding effectively, the researchers led 13 focus groups attended by internal 11 medicine hospitalist physicians, 26 internal medicine residents, and 13 medical students affiliated with the UCSF School of Medicine. In terms of gender, 26 participants identified as women, 22 as men, and 2 as gender nonconforming. In terms of racial and ethnic diversity, 26 were white, 8 were Latinx, 7 were Asian, 3 were South Asian, 1 was Middle Eastern, and 5 were black.
In describing biased and demeaning patient behavior, the participants recalled remarks that ranged from refusal of care and questioning the clinician’s role to ethnic jokes, questions as to their ethnic backgrounds, inappropriate flirtations or compliments. The effects of these behaviors on the participants included negative responses like carrying an emotional burden and withdrawing from work, along with positive responses like an increased desire for self-growth and to pursue leadership opportunities.
Barriers to addressing these behaviors included a lack of support, uncertainty as to the appropriate response, and a fear of being perceived as unprofessional. Deciding how to respond – or to respond at all – was often dictated by the level of support from colleagues, a professional responsibility to peers, and the presence of a positive role model who would’ve done the same.
The authors acknowledged their study’s limitations, including only knowing the views of those who were interviewed. In addition, all participants came from a medical school located in a diverse city that embraces different cultures, meaning their findings “may not reflect the experiences of physicians in other geographic regions.”
The study was supported by the Greenwall Foundation. The authors reported no conflicts of interest.
SOURCE: Wheeler M et al. JAMA Intern Med. 2019 Oct 28. doi: 10.1001/jamainternmed.2019.4122.
FROM JAMA INTERNAL MEDICINE
PHM 19: PREP yourself for the PHM boards
Get ready for the first-ever ABP PHM exam
Presenters
Jared Austin, MD, FAAP
Ryan Bode, MD, FAAP
Jeremy Kern, MD, FAAP
Mary Ottolini, MD, MPH, MEd, FAAP
Stacy Pierson, MD, FAAP
Mary Rocha, MD, MPH, FAAP
Susan Walley, MD, CTTS, FAAP
Session summary
Professional development sessions at the Pediatric Hospital Medicine 2019 conference intended to further educate pediatric hospitalists and advance their careers. In November 2019, many pediatric hospitalists will be taking subspecialty PHM boards for the very first time. This PHM19 session had clear objectives: to describe the American Board of Pediatrics (ABP) PHM board content areas, to analyze common knowledge gaps in PREP PHM, and to examine different approaches to clinical management of PHM patients.

The session opened with a brief history of a vision of PHM and the story of its realization. In 2016, a group of eight stalwart writers, four new writers, and three editors created PREP 2018 and 2019 questions that were released in full prior to November 2019. The ABP will offer the board exam in 2019, 2021, and 2023
The exam content domains include the following:
- Medical conditions.
- Behavioral and mental health conditions.
- Newborn care.
- Children with medical complexity.
- Medical procedures.
- Patient and family centered care.
- Transitions of care.
- Quality improvement, patient safety and system based improvement.
- Evidence-based, high-value care.
- Advocacy and leadership.
- Ethics, legal issues, and human rights.
- Teaching and education.
- Core knowledge in scholarly activities.
Each question consists of a case vignette, question, response choices, critiques, PREP PEARLs, and references. There are also additional PREP Ponder Points that intend to prompt reflection on practice change.
For the remainder of the session presenters reviewed the PHM PREP questions that were most frequently answered incorrectly. Some of the topics included: asthma vs. anaphylaxis, venous thromboembolism prophylaxis in surgical patients, postoperative feeding regimens, transmission-based precautions, febrile neonates, Ebola, medical child abuse, absolute indications for intubation, toxic megacolon, palivizumab prophylaxis guidelines, key driver diagrams, and infantile hemangiomas.
Key takeaway
Pediatric hospitalists all over the United States will for the first time ever take PHM boards in November 2019. The exam content domains were demonstrated in detail, and several often incorrectly answered PREP questions were presented and discussed.
Dr. Giordano is assistant professor in pediatrics at Columbia University Medical Center, New York.
Get ready for the first-ever ABP PHM exam
Get ready for the first-ever ABP PHM exam
Presenters
Jared Austin, MD, FAAP
Ryan Bode, MD, FAAP
Jeremy Kern, MD, FAAP
Mary Ottolini, MD, MPH, MEd, FAAP
Stacy Pierson, MD, FAAP
Mary Rocha, MD, MPH, FAAP
Susan Walley, MD, CTTS, FAAP
Session summary
Professional development sessions at the Pediatric Hospital Medicine 2019 conference intended to further educate pediatric hospitalists and advance their careers. In November 2019, many pediatric hospitalists will be taking subspecialty PHM boards for the very first time. This PHM19 session had clear objectives: to describe the American Board of Pediatrics (ABP) PHM board content areas, to analyze common knowledge gaps in PREP PHM, and to examine different approaches to clinical management of PHM patients.
The session opened with a brief history of a vision of PHM and the story of its realization. In 2016, a group of eight stalwart writers, four new writers, and three editors created PREP 2018 and 2019 questions that were released in full prior to November 2019. The ABP will offer the board exam in 2019, 2021, and 2023
The exam content domains include the following:
- Medical conditions.
- Behavioral and mental health conditions.
- Newborn care.
- Children with medical complexity.
- Medical procedures.
- Patient and family centered care.
- Transitions of care.
- Quality improvement, patient safety and system based improvement.
- Evidence-based, high-value care.
- Advocacy and leadership.
- Ethics, legal issues, and human rights.
- Teaching and education.
- Core knowledge in scholarly activities.
Each question consists of a case vignette, question, response choices, critiques, PREP PEARLs, and references. There are also additional PREP Ponder Points that intend to prompt reflection on practice change.
For the remainder of the session presenters reviewed the PHM PREP questions that were most frequently answered incorrectly. Some of the topics included: asthma vs. anaphylaxis, venous thromboembolism prophylaxis in surgical patients, postoperative feeding regimens, transmission-based precautions, febrile neonates, Ebola, medical child abuse, absolute indications for intubation, toxic megacolon, palivizumab prophylaxis guidelines, key driver diagrams, and infantile hemangiomas.
Key takeaway
Pediatric hospitalists all over the United States will for the first time ever take PHM boards in November 2019. The exam content domains were demonstrated in detail, and several often incorrectly answered PREP questions were presented and discussed.
Dr. Giordano is assistant professor in pediatrics at Columbia University Medical Center, New York.
Climate change, health systems, and hospital medicine
Working toward carbon neutrality
I have always enjoyed talking with my patients from coastal Louisiana. They enjoy life, embrace their environment, and give me a perspective which is both similar and different than that of residents of New Orleans where I practice hospital medicine.

Their hospitalization is often a reflective moment in their lives. Lately I have been asking them about their advice to their children concerning the future of southern Louisiana in reference to sea rise, global warming, and increasing climatic events. More often than not, they have been telling their children it is time to move away.
These are a people who have strong devotion to family, but they are also practical. More than anything they would like their children to stay and preserve their heritage, but concern for their children’s future outweighs that. They have not come to this conclusion by scientific reports, but rather by what is happening before them. This group of people doesn’t alarm easily, but they see the unrelenting evidence of land loss and sea rise before them with little reason to believe it will change.
I am normally not one to speak out about climate change. Like most I have listened to the continuous alarms sounded by experts but have always assumed someone more qualified than myself should lead the efforts. But when I see the tangible effects of climate change both in my own life and the lives of my patients, I feel a sense of urgency.
12 years
Twelve years. That is the time we have to significantly reduce carbon emissions before catastrophic and potentially irreversible events will occur. This evidence is according to the authors of the landmark report by the UN Intergovernmental Panel on Climate Change released in October 2018. The report states urgent and unprecedented changes are needed to limit temperature elevations of 1.5°C and 2°C, as compared with the preindustrial era. Exceeding a 2°C elevation will likely lead to global adverse events at an unprecedented level.1
The events forecast by the U.N. report are not abstract, particularly as they relate to public health. With high confidence, the report outlines with high specificity: increases in extreme heat, floods, crop failures, and a multitude of economic and social stressors which will affect the care of our most vulnerable patients.1
This statement by Dr. Dana Hanson, president of the World Medical Association, summarizes the effects of climate change on the delivery of health care: “Climate change represents an inevitable massive threat to global health that will likely eclipse the major pandemics as a leading cause of death in the 21st century.”
So, what does the health care system have to do with climate change and its primary driver, carbon emissions? More than I realized, as the U.S. health care industry produces 10% of the nation’s carbon emissions.2 If the U.S. health care system was a country it would be ranked seventh, ahead of the United Kingdom; 10% of all smog and 9% of all particulate-related respiratory disease can be attributed to the carbon emissions of the health care industry. This breaks down to possibly 20,000 premature deaths per year.2 Our current health care industry is a significant driver of environmentally related disease and will continue to be so, unless major change occurs.
Although much of it is behind the scenes, providing health care 24/7 is a highly energy-intensive and waste-producing endeavor. Many of the innovations to reduce carbon emissions that have been seen in other industries have lagged behind in health care, as we have focused on other issues.
But the health care system is transitioning. It strives to address the whole person, including where they live, work, and play. A key component of this will be addressing our impact on the environments we serve. How can we make that argument if we don’t first address our own impact on the climate?
Carbon-neutral health care
Health care is one of the few industries that has the economic clout, the scientific basis, the community engagement, and perhaps most importantly the motivations to “first, do no harm” that could lead a national (if not a global) transformation in environmental stewardship among all industries.
Many agree that action is needed, but is essential that we set specific meaningful goals that take into account the urgency of the situation. One possible solution is to encourage every health care system to begin the process of becoming carbon neutral. Simply defined, carbon neutrality is balancing the activities that result in carbon emissions with activities that reduce carbon emissions. Carbon neutrality has become the standard by which an industry’s commitment to reducing carbon emissions is measured. The measurement is standardized and achievable, and the basic concept is understood by most. It results not only in long-term benefits to climate change, but immediate improvement of air quality in the local community. In addition, achieving carbon neutrality serves as a catalyst of new desired industries, improves employee morale, and aids in recruitment.3
So, what would a carbon-neutral health care system look like? In short, sustainability should be considered in all of its actions. Risks and benefits would be contemplated, as we do with all treatments, except now environmental risks would be brought into the equation. This includes the obvious, such as purchasing and supporting the development of renewable energy, but also transportation of patients and employees, food supply chains, and even the use of virtual visits to reduce the environmental impact of patient transportation.
I am optimistic that carbon neutrality is achievable in the health care sector. It can drive economic development and engage the community in environmental stewardship efforts. But time is of the essence and leaders for these efforts are needed now. As hospitalists, we are on the front lines of the health care system. We see the direct impact of social, economic, and environmental issues on our patients. We have credibility with both our patients and hospital administration. Among all industries, there need to be champions of environmental sustainability efforts. Hospitalists are uniquely positioned to fill that role.
My concern is that 12 years is right around the corner. We are at an inflection point on our efforts to reduce carbon emissions and that is good, but time has become our enemy. The difference between terrible and unlivable will be our, and the world’s, response to reducing carbon emissions.
It is time for bold action from us, the health care community. It is our moment and our place to lead those efforts, so let’s take advantage of both this challenge and this opportunity. Consider leading those efforts in your health care system.
Dr. Conrad is medical director of community affairs and health policy at Ochsner Health Systems in New Orleans.
References
1. Special Report on Global Warming of 1.5°C. Incheon [Republic of Korea]: Intergovernmental Panel on Climate Change. 7 Oct 2018.
2. Eckelman MJ, Sherman J. Environmental Impacts of the U.S. Health Care System and Effects on Public Health. PLoS ONE. 11(6):e0157014.
3. McCunn LJ, Gifford R. Do green offices affect employee engagement and environmental attitudes? Archit Sci Rev. 55:2;128-34. doi: 10.1080/00038628.2012.667939.
Working toward carbon neutrality
Working toward carbon neutrality
I have always enjoyed talking with my patients from coastal Louisiana. They enjoy life, embrace their environment, and give me a perspective which is both similar and different than that of residents of New Orleans where I practice hospital medicine.
Their hospitalization is often a reflective moment in their lives. Lately I have been asking them about their advice to their children concerning the future of southern Louisiana in reference to sea rise, global warming, and increasing climatic events. More often than not, they have been telling their children it is time to move away.
These are a people who have strong devotion to family, but they are also practical. More than anything they would like their children to stay and preserve their heritage, but concern for their children’s future outweighs that. They have not come to this conclusion by scientific reports, but rather by what is happening before them. This group of people doesn’t alarm easily, but they see the unrelenting evidence of land loss and sea rise before them with little reason to believe it will change.
I am normally not one to speak out about climate change. Like most I have listened to the continuous alarms sounded by experts but have always assumed someone more qualified than myself should lead the efforts. But when I see the tangible effects of climate change both in my own life and the lives of my patients, I feel a sense of urgency.
12 years
Twelve years. That is the time we have to significantly reduce carbon emissions before catastrophic and potentially irreversible events will occur. This evidence is according to the authors of the landmark report by the UN Intergovernmental Panel on Climate Change released in October 2018. The report states urgent and unprecedented changes are needed to limit temperature elevations of 1.5°C and 2°C, as compared with the preindustrial era. Exceeding a 2°C elevation will likely lead to global adverse events at an unprecedented level.1
The events forecast by the U.N. report are not abstract, particularly as they relate to public health. With high confidence, the report outlines with high specificity: increases in extreme heat, floods, crop failures, and a multitude of economic and social stressors which will affect the care of our most vulnerable patients.1
This statement by Dr. Dana Hanson, president of the World Medical Association, summarizes the effects of climate change on the delivery of health care: “Climate change represents an inevitable massive threat to global health that will likely eclipse the major pandemics as a leading cause of death in the 21st century.”
So, what does the health care system have to do with climate change and its primary driver, carbon emissions? More than I realized, as the U.S. health care industry produces 10% of the nation’s carbon emissions.2 If the U.S. health care system was a country it would be ranked seventh, ahead of the United Kingdom; 10% of all smog and 9% of all particulate-related respiratory disease can be attributed to the carbon emissions of the health care industry. This breaks down to possibly 20,000 premature deaths per year.2 Our current health care industry is a significant driver of environmentally related disease and will continue to be so, unless major change occurs.
Although much of it is behind the scenes, providing health care 24/7 is a highly energy-intensive and waste-producing endeavor. Many of the innovations to reduce carbon emissions that have been seen in other industries have lagged behind in health care, as we have focused on other issues.
But the health care system is transitioning. It strives to address the whole person, including where they live, work, and play. A key component of this will be addressing our impact on the environments we serve. How can we make that argument if we don’t first address our own impact on the climate?
Carbon-neutral health care
Health care is one of the few industries that has the economic clout, the scientific basis, the community engagement, and perhaps most importantly the motivations to “first, do no harm” that could lead a national (if not a global) transformation in environmental stewardship among all industries.
Many agree that action is needed, but is essential that we set specific meaningful goals that take into account the urgency of the situation. One possible solution is to encourage every health care system to begin the process of becoming carbon neutral. Simply defined, carbon neutrality is balancing the activities that result in carbon emissions with activities that reduce carbon emissions. Carbon neutrality has become the standard by which an industry’s commitment to reducing carbon emissions is measured. The measurement is standardized and achievable, and the basic concept is understood by most. It results not only in long-term benefits to climate change, but immediate improvement of air quality in the local community. In addition, achieving carbon neutrality serves as a catalyst of new desired industries, improves employee morale, and aids in recruitment.3
So, what would a carbon-neutral health care system look like? In short, sustainability should be considered in all of its actions. Risks and benefits would be contemplated, as we do with all treatments, except now environmental risks would be brought into the equation. This includes the obvious, such as purchasing and supporting the development of renewable energy, but also transportation of patients and employees, food supply chains, and even the use of virtual visits to reduce the environmental impact of patient transportation.
I am optimistic that carbon neutrality is achievable in the health care sector. It can drive economic development and engage the community in environmental stewardship efforts. But time is of the essence and leaders for these efforts are needed now. As hospitalists, we are on the front lines of the health care system. We see the direct impact of social, economic, and environmental issues on our patients. We have credibility with both our patients and hospital administration. Among all industries, there need to be champions of environmental sustainability efforts. Hospitalists are uniquely positioned to fill that role.
My concern is that 12 years is right around the corner. We are at an inflection point on our efforts to reduce carbon emissions and that is good, but time has become our enemy. The difference between terrible and unlivable will be our, and the world’s, response to reducing carbon emissions.
It is time for bold action from us, the health care community. It is our moment and our place to lead those efforts, so let’s take advantage of both this challenge and this opportunity. Consider leading those efforts in your health care system.
Dr. Conrad is medical director of community affairs and health policy at Ochsner Health Systems in New Orleans.
References
1. Special Report on Global Warming of 1.5°C. Incheon [Republic of Korea]: Intergovernmental Panel on Climate Change. 7 Oct 2018.
2. Eckelman MJ, Sherman J. Environmental Impacts of the U.S. Health Care System and Effects on Public Health. PLoS ONE. 11(6):e0157014.
3. McCunn LJ, Gifford R. Do green offices affect employee engagement and environmental attitudes? Archit Sci Rev. 55:2;128-34. doi: 10.1080/00038628.2012.667939.
The growing NP and PA workforce in hospital medicine
High rate of turnover among NPs, PAs
If you were a physician hospitalist in a group serving adults in 2017 you probably worked with nurse practitioners (NPs) and/or physician assistants (PAs). Seventy-seven percent of hospital medicine groups (HMGs) employed NPs and PAs that year.

In addition, the larger the group, the more likely the group was to have NPs and PAs as part of their practice model – 89% of hospital medicine groups with more than 30 physician had NPs and/or PAs as partners. In addition, the mean number of physicians for adult hospital medicine groups was 17.9. The same practices employed an average of 3.5 NPs, and 2.6 PAs.
Based on these numbers, there are just under three physicians per NP and PA in the typical HMG serving adults. This is all according to data from the 2018 State of Hospital Medicine (SoHM) report that was published in 2019 by the Society of Hospital Medicine.
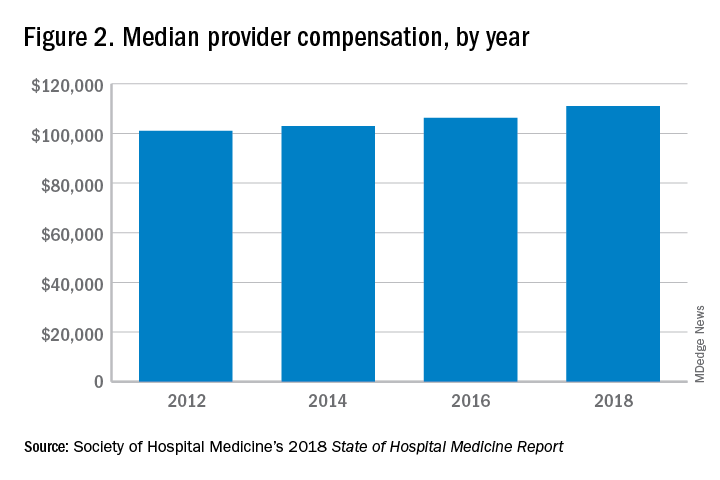
These observations lead to a number of questions. One thing that is not clear from the SoHM is why NPs and PAs are becoming a larger part of the hospital medicine workforce, but there are some insights and conjecture that can be drawn from the data. The first is economics. Over 6 years, the median incomes of NPs and PAs have risen a relatively modest 10%; over the same period physician hospitalists have seen a whopping 23.6% median pay increase.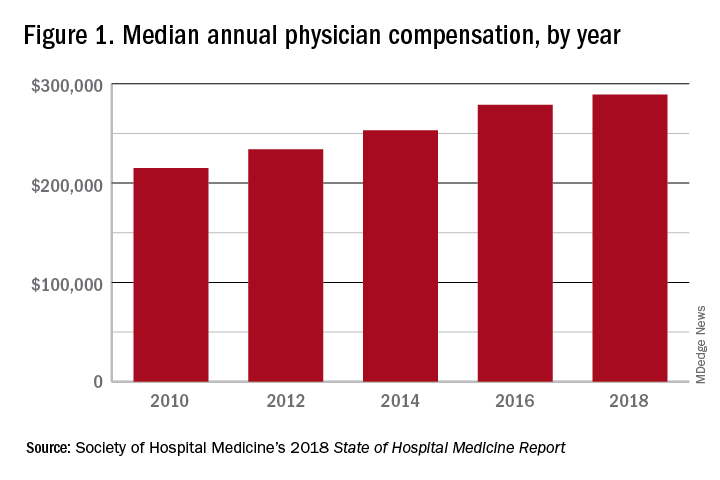
One argument against economics as a driving force behind greater use of NPs and PAs in the hospital medicine workforce is the billing patterns of HMGs that use NPs and PAs. Ten percent of HMGs do not have their NPs and PAs bill at all. The distribution of HMGs that predominantly bill NP and PA services as shared visits, versus having NPs and PAs bill independently, has also not changed much over the years, with 22% of HMGs having NPs and PAs bill independently as a predominant model. This would seem to suggest that some HMGs may not have learned how to deploy NPs and PAs effectively.
While inefficiency can be due to hospital bylaws, the culture of the hospital medicine group, or the skill set of the NPs and PAs working in HMGs – it would seem that if the driving force for the increase in the utilization of NPs and PAs in HMGs was financial, then that would also result in more of these providers billing independently, or alternatively, an increase in hospitalist physician productivity, which the data do not show. However, multistate HMGs may have this figured out better than some of the rest of us – 78% of these HMGs have NPs and PAs billing independently! All other categories of HMGs together are around 13%, with the next highest being hospital or health system integrated delivery systems, where NPs/PAs bill independently about 15% of the time.
In the last 2 years of the survey, there have been marked increases in the number of NPs and PAs at HMGs performing “nontraditional” services. For example, outpatient work has increased from 11% to 17%, and work in the postacute space has increased from 13% to 25%. Work in behavioral health and alcohol and drug rehab facilities has also increased, from 17% to 26%. As HMGs seek to rationalize their workforce while expanding, it is possible that decision makers have felt that it was either more economical to place NPs and PAs in positions where they are seeing these patients, or it was more aligned with the NP/PA skill set, or both. In any event, as the scope of hospital medicine broadens, the use of PAs and NPs has also increased – which is probably not coincidental.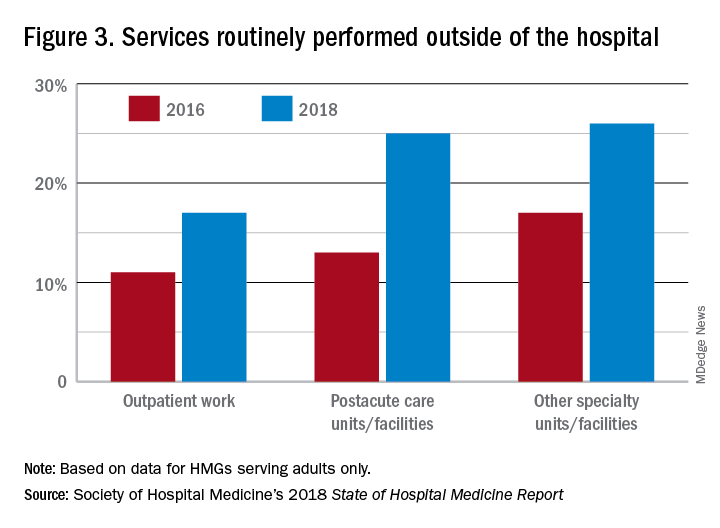
The average hospital medicine group continues to have staff openings. Workforce shortages may be leading to what in the past may have been considered physician openings being filled by NPs and PAs. Only 33% of HMGs reported having all their physician openings filled. Median physician shortage was 12% of total approved staffing. Given concerns in hospital medicine about provider burnout, the number of hospital medicine openings is no doubt a concern to HMG leaders and hospitalists. And necessity being the mother of invention, HMG leadership must be thinking differently than in the past about open positions and the skill mix needed to fill them. I believe this is leading to NPs and PAs being considered more often for a role that would have been open only to a physician in the past.
Just as open positions are a concern, so is turnover. One striking finding in the SoHM is the very high rate of turnover among NPs and PAs – a whopping 19.1% per year. For physicians, the same rate was 7.4% and has been declining every survey for many years. While NPs and PAs may be intended to stabilize the workforce, because of how this is being done in some groups, NPs and PAs may instead be a destabilizing factor. Rapid growth can lead to haphazard onboarding and less than clearly defined roles. NPs and PAs may often be placed into roles for which they are not yet prepared. In addition, the pay disparity between NPs and PAs and physicians has increased. As a new field, and with many HMGs still rapidly growing, increased thoughtfulness and maturity about how NPs and PAs are integrated into hospital medicine practices should lead to less turnover and better HMG stability in the future.
These observations could mark a future that includes higher pay for hospital medicine PAs and NPs (and potentially a slowdown in salary growth for physicians); HMGs taking steps to make the financial model more attractive by having NPs and PAs bill independently more often; and HMGs and their leaders engaging NPs and PAs by more clearly defining roles, shoring up onboarding and mentoring programs, and other measures that decrease turnover. This would help to make hospital medicine a career destination, rather than a stopping off point for NPs and PAs, much as it has become for internists over the past 20 years.
Dr. Frederickson is medical director, hospital medicine and palliative care, at CHI Health, Omaha, Neb., and assistant professor at Creighton University, Omaha.
High rate of turnover among NPs, PAs
High rate of turnover among NPs, PAs
If you were a physician hospitalist in a group serving adults in 2017 you probably worked with nurse practitioners (NPs) and/or physician assistants (PAs). Seventy-seven percent of hospital medicine groups (HMGs) employed NPs and PAs that year.
In addition, the larger the group, the more likely the group was to have NPs and PAs as part of their practice model – 89% of hospital medicine groups with more than 30 physician had NPs and/or PAs as partners. In addition, the mean number of physicians for adult hospital medicine groups was 17.9. The same practices employed an average of 3.5 NPs, and 2.6 PAs.
Based on these numbers, there are just under three physicians per NP and PA in the typical HMG serving adults. This is all according to data from the 2018 State of Hospital Medicine (SoHM) report that was published in 2019 by the Society of Hospital Medicine.
These observations lead to a number of questions. One thing that is not clear from the SoHM is why NPs and PAs are becoming a larger part of the hospital medicine workforce, but there are some insights and conjecture that can be drawn from the data. The first is economics. Over 6 years, the median incomes of NPs and PAs have risen a relatively modest 10%; over the same period physician hospitalists have seen a whopping 23.6% median pay increase.
One argument against economics as a driving force behind greater use of NPs and PAs in the hospital medicine workforce is the billing patterns of HMGs that use NPs and PAs. Ten percent of HMGs do not have their NPs and PAs bill at all. The distribution of HMGs that predominantly bill NP and PA services as shared visits, versus having NPs and PAs bill independently, has also not changed much over the years, with 22% of HMGs having NPs and PAs bill independently as a predominant model. This would seem to suggest that some HMGs may not have learned how to deploy NPs and PAs effectively.
While inefficiency can be due to hospital bylaws, the culture of the hospital medicine group, or the skill set of the NPs and PAs working in HMGs – it would seem that if the driving force for the increase in the utilization of NPs and PAs in HMGs was financial, then that would also result in more of these providers billing independently, or alternatively, an increase in hospitalist physician productivity, which the data do not show. However, multistate HMGs may have this figured out better than some of the rest of us – 78% of these HMGs have NPs and PAs billing independently! All other categories of HMGs together are around 13%, with the next highest being hospital or health system integrated delivery systems, where NPs/PAs bill independently about 15% of the time.
In the last 2 years of the survey, there have been marked increases in the number of NPs and PAs at HMGs performing “nontraditional” services. For example, outpatient work has increased from 11% to 17%, and work in the postacute space has increased from 13% to 25%. Work in behavioral health and alcohol and drug rehab facilities has also increased, from 17% to 26%. As HMGs seek to rationalize their workforce while expanding, it is possible that decision makers have felt that it was either more economical to place NPs and PAs in positions where they are seeing these patients, or it was more aligned with the NP/PA skill set, or both. In any event, as the scope of hospital medicine broadens, the use of PAs and NPs has also increased – which is probably not coincidental.
The average hospital medicine group continues to have staff openings. Workforce shortages may be leading to what in the past may have been considered physician openings being filled by NPs and PAs. Only 33% of HMGs reported having all their physician openings filled. Median physician shortage was 12% of total approved staffing. Given concerns in hospital medicine about provider burnout, the number of hospital medicine openings is no doubt a concern to HMG leaders and hospitalists. And necessity being the mother of invention, HMG leadership must be thinking differently than in the past about open positions and the skill mix needed to fill them. I believe this is leading to NPs and PAs being considered more often for a role that would have been open only to a physician in the past.
Just as open positions are a concern, so is turnover. One striking finding in the SoHM is the very high rate of turnover among NPs and PAs – a whopping 19.1% per year. For physicians, the same rate was 7.4% and has been declining every survey for many years. While NPs and PAs may be intended to stabilize the workforce, because of how this is being done in some groups, NPs and PAs may instead be a destabilizing factor. Rapid growth can lead to haphazard onboarding and less than clearly defined roles. NPs and PAs may often be placed into roles for which they are not yet prepared. In addition, the pay disparity between NPs and PAs and physicians has increased. As a new field, and with many HMGs still rapidly growing, increased thoughtfulness and maturity about how NPs and PAs are integrated into hospital medicine practices should lead to less turnover and better HMG stability in the future.
These observations could mark a future that includes higher pay for hospital medicine PAs and NPs (and potentially a slowdown in salary growth for physicians); HMGs taking steps to make the financial model more attractive by having NPs and PAs bill independently more often; and HMGs and their leaders engaging NPs and PAs by more clearly defining roles, shoring up onboarding and mentoring programs, and other measures that decrease turnover. This would help to make hospital medicine a career destination, rather than a stopping off point for NPs and PAs, much as it has become for internists over the past 20 years.
Dr. Frederickson is medical director, hospital medicine and palliative care, at CHI Health, Omaha, Neb., and assistant professor at Creighton University, Omaha.
In-hospital flu shot reduced readmissions in pneumonia patients
NEW ORLEANS – In-hospital flu shots were rare, yet linked to a lower readmission rate for patients hospitalized with community-acquired pneumonia in a recent retrospective study, suggesting a “missed opportunity” to improve outcomes for these patients, an investigator said.

Less than 2% of patients admitted for community-acquired pneumonia (CAP) received in-hospital influenza vaccination, yet receiving it was linked to a 20% reduction in readmissions, according to investigator Kam Sing Ho, MD, a resident at Mount Sinai St. Luke’s, New York.
Those patients who were readmitted had a significantly higher death rate vs. index admissions, Dr. Ho said in a poster discussion session at the annual meeting of the American College of Chest Physicians.
“I know (vaccines) are pretty much pushed out to the outpatient setting, but given what we showed here in this abstract, I think there’s a role for influenza vaccines to be a discussion in the hospital,” Dr. Ho said in his presentation.
The retrospective analysis was based on 825,906 adult hospital admissions with a primary diagnosis of CAP in data from the Agency for Healthcare Research and Quality Healthcare Cost and Utilization Project (HCUP). Of that large cohort, just 14,047 (1.91%) received in-hospital influenza vaccination, according to Dr. Ho.
In-hospital influenza vaccination independently predicted a lower risk of readmission (hazard ratio, 0.821; 95% confidence interval, 0.69-0.98; P less than .02) in a propensity score matching analysis that included 9,777 CAP patients who received the vaccination and 9,777 with similar demographic and clinical characteristics.
Private insurance and high-income status also predicted lower risk of readmission in the analysis, while by contrast, factors associated with higher risk of readmission included advanced age, Medicare insurance, and respiratory failure, among other factors, Dr. Ho reported.
The overall 30-day rate of readmission in the study was 11.9%, and of those readmissions, the great majority (about 80%) were due to pneumonia, he said.
The rate of death in the hospital was 2.96% for CAP patients who were readmitted, versus 1.11% for the index admissions (P less than .001), Dr. Ho reported. Moreover, readmissions were associated with nearly half a million hospital days and $1 billion in costs and $3.67 billion in charges.
Based on these findings, Dr. Ho and colleagues hope to incorporate routine influenza vaccination for all adults hospitalized with CAP.
“We’re always under pressure to do so much for patients that we can’t comprehensively do everything. But the 20% reduction in the risk of coming back, I think that’s significant,” Dr. Ho said in an interview.
The authors reported having no disclosures related to this research.
This article was updated 10/23/2019.
SOURCE: Ho KS, et al. CHEST 2019. doi: 10.1016/j.chest.2019.08.450.
NEW ORLEANS – In-hospital flu shots were rare, yet linked to a lower readmission rate for patients hospitalized with community-acquired pneumonia in a recent retrospective study, suggesting a “missed opportunity” to improve outcomes for these patients, an investigator said.
Less than 2% of patients admitted for community-acquired pneumonia (CAP) received in-hospital influenza vaccination, yet receiving it was linked to a 20% reduction in readmissions, according to investigator Kam Sing Ho, MD, a resident at Mount Sinai St. Luke’s, New York.
Those patients who were readmitted had a significantly higher death rate vs. index admissions, Dr. Ho said in a poster discussion session at the annual meeting of the American College of Chest Physicians.
“I know (vaccines) are pretty much pushed out to the outpatient setting, but given what we showed here in this abstract, I think there’s a role for influenza vaccines to be a discussion in the hospital,” Dr. Ho said in his presentation.
The retrospective analysis was based on 825,906 adult hospital admissions with a primary diagnosis of CAP in data from the Agency for Healthcare Research and Quality Healthcare Cost and Utilization Project (HCUP). Of that large cohort, just 14,047 (1.91%) received in-hospital influenza vaccination, according to Dr. Ho.
In-hospital influenza vaccination independently predicted a lower risk of readmission (hazard ratio, 0.821; 95% confidence interval, 0.69-0.98; P less than .02) in a propensity score matching analysis that included 9,777 CAP patients who received the vaccination and 9,777 with similar demographic and clinical characteristics.
Private insurance and high-income status also predicted lower risk of readmission in the analysis, while by contrast, factors associated with higher risk of readmission included advanced age, Medicare insurance, and respiratory failure, among other factors, Dr. Ho reported.
The overall 30-day rate of readmission in the study was 11.9%, and of those readmissions, the great majority (about 80%) were due to pneumonia, he said.
The rate of death in the hospital was 2.96% for CAP patients who were readmitted, versus 1.11% for the index admissions (P less than .001), Dr. Ho reported. Moreover, readmissions were associated with nearly half a million hospital days and $1 billion in costs and $3.67 billion in charges.
Based on these findings, Dr. Ho and colleagues hope to incorporate routine influenza vaccination for all adults hospitalized with CAP.
“We’re always under pressure to do so much for patients that we can’t comprehensively do everything. But the 20% reduction in the risk of coming back, I think that’s significant,” Dr. Ho said in an interview.
The authors reported having no disclosures related to this research.
This article was updated 10/23/2019.
SOURCE: Ho KS, et al. CHEST 2019. doi: 10.1016/j.chest.2019.08.450.
REPORTING FROM CHEST 2019
How should anticoagulation be managed in a patient with cirrhosis?
DOACs may be a practical option for some CLD patients
Case
A 60-year-old man with cirrhosis is admitted to the hospital with concern for spontaneous bacterial peritonitis. His body mass index is 35 kg/m2. He is severely deconditioned and largely bed bound. His admission labs show thrombocytopenia (platelets 65,000/mcL) and an elevated international normalized ratio (INR) of 1.6. Should this patient be placed on venous thromboembolism (VTE) prophylaxis on admission?
Brief overview

Patients with chronic liver disease (CLD) have previously been considered “auto-anticoagulated” because of markers of increased bleeding risk, including a decreased platelet count and elevated INR, prothrombin time, and activated partial thromboplastin time. It is being increasingly recognized, however, that CLD often represents a hypercoagulable state despite these abnormalities.1
While cirrhotic patients produce less of several procoagulant substances (such as factors II, V, VII, X, XI, XII, XIII, and fibrinogen), they are also deficient in multiple anticoagulant factors (such as proteins C and S and antithrombin) and fibrinolytics (plasminogen). While the prothrombin time and activated partial thromboplastin time are sensitive to levels of procoagulant proteins in plasma, they do not measure response to the natural anticoagulants and therefore do not reflect an accurate picture of a cirrhotic patient’s risk of developing thrombosis. In addition, cirrhotic patients have many other risk factors for thrombosis, including poor functional status, frequent hospitalization, and elevated estrogen levels.
Overview of the data

VTE incidence among patients with CLD has varied across studies, ranging from 0.5% to 6.3%.2 A systemic review of VTE risk in cirrhotic patients concluded that they “have a significant risk of VTE, if not higher than noncirrhotic patients and this risk cannot be trivialized or ignored.”2
In a nationwide Danish case-control study, patients with cirrhosis had a 1.7 times increased risk of VTE, compared with the general population.3 Hypoalbuminemia appears to be one of the strongest associated risk factors for VTE in these patients, likely as a reflection of the degree of liver synthetic dysfunction (and therefore decreased synthesis of anticoagulant factors). One study showed that patients with an albumin of less than 1.9 g/dL had a VTE risk five times higher than patients with an albumin of 2.8 g/dL or higher.4
Prophylaxis
Given the increased risks of bleeding and thrombosis in patients with cirrhosis, how should VTE prophylaxis be managed in hospitalized patients? While current guidelines do not specifically address the use of pharmacologic prophylaxis in cirrhotic patients, the Padua Predictor Score, which is used to assess VTE risk in the general hospital population, has also been shown to be helpful in the subpopulation of patients with CLD (Table 1).
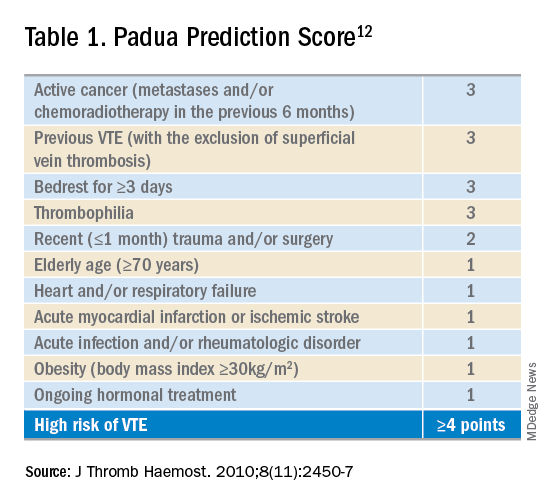
In one study, cirrhotic patients who were “high risk” by Padua Predictor score were over 12 times more likely to develop VTE than those who were “low risk.”5 Bleeding risk appears to be fairly low, and similar to those patients not receiving prophylactic anticoagulation. One retrospective case series of hospitalized cirrhotic patients receiving thromboprophylaxis showed a rate of GI bleeding of 2.5% (9 of 355 patients); the rate of major bleeding was less than 1%.6
Selection of anticoagulant for VTE prophylaxis should be similar to non-CLD patients. The choice of agent (low-molecular-weight heparin (LMWH) or unfractionated heparin) and dosing depends on factors including renal function and bodyweight. If anticoagulation is contraindicated (because of thrombocytopenia, for example), then mechanical prophylaxis should be considered.7
Treatment
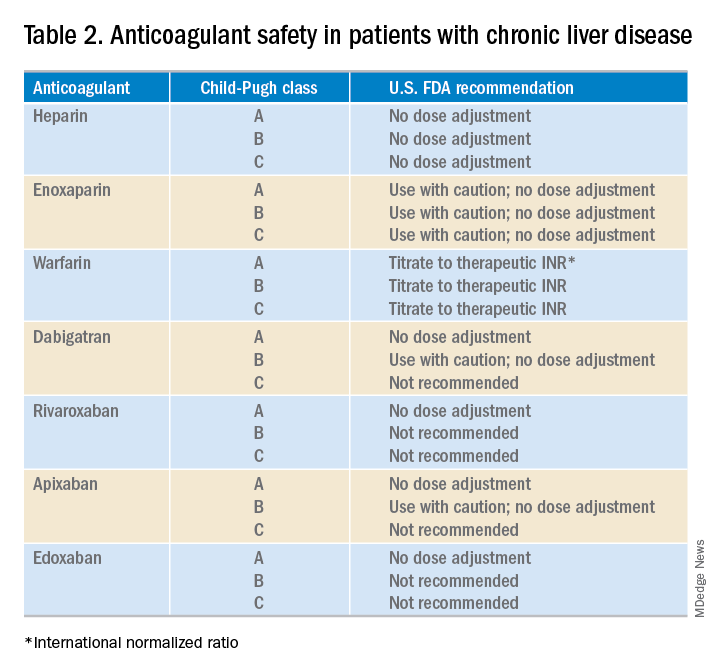
What about anticoagulation in patients with a known VTE? Food and Drug Administration safety recommendations are based on Child-Pugh class, although the current data on the safety and efficacy of full dose anticoagulation therapy for VTE in patients with cirrhosis are limited (Table 2). At this point, LMWH is often the preferred choice for anticoagulation in CLD patients. However, some limitations exist including the need for frequent subcutaneous injections and limited reliability of anti–factor Xa levels.
Cirrhotic patients often fail to achieve target anti–factor Xa levels on standard prophylactic and therapeutic doses of enoxaparin. This, however, is likely a lab anomaly as in vitro studies have shown that cirrhotic patients may show an increased response to LMWH despite reduced anti–factor Xa levels.8 Thus, LMWH remains the standard of care for many CLD patients.
The use of vitamin K antagonists (VKAs) such as warfarin for VTE treatment can be difficult to manage. Traditionally CLD patients have been started on lower doses of warfarin but given their already elevated INR, this may lead to a subtherapeutic dose of VKAs. A recent study of 23 patients with cirrhosis demonstrated that a target INR of 2-3 can be reached with VKA doses similar to those in noncirrhotic patients.9 These data support the practice of using the same VKA dosing strategies for CLD patients, and selecting a starting dose based on patient parameters such as age and weight.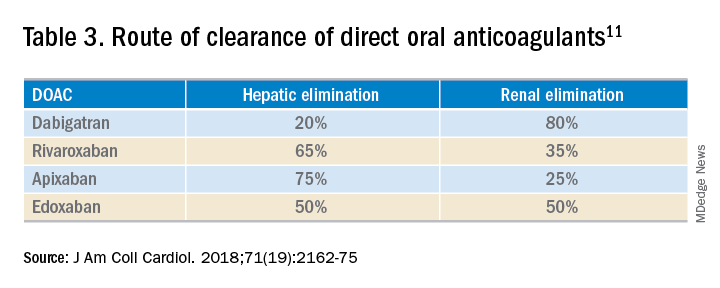
While the use of direct oral anticoagulants (DOACs) for this patient population is still not a common practice, they may be a practical option for some CLD patients. A meta-analysis found that the currently used DOACs have no significant risk of drug-induced hepatic injury.10 Currently, only observational data are available to assess the benefits and risks of bleeding with DOACs in this patient population, as patients with significant liver disease were excluded from the major randomized trials.11 DOACs may also represent a complicated choice for some patients given the effect of liver injury on their metabolism (Table 3).
Application of data to the original case
This patient should be assessed for both risk of VTE and risk of bleeding during the hospital admission. CLD patients likely have a risk of VTE similar to (or even greater than) that of general medical patients. The Padua score for this patient is 4 (bed rest, body mass index) indicating that he is at high risk of VTE. While he is thrombocytopenic, he is not below the threshold for receiving anticoagulation. His INR is elevated but this does not confer any reduced risk of VTE.
Bottom line
This patient should receive VTE prophylaxis with either subcutaneous heparin or LMWH during his hospital admission.
References
1. Khoury T et al. The complex role of anticoagulation in cirrhosis: An updated review of where we are and where we are going. Digestion. 2016 Mar;93(2):149-59.
2. Aggarwal A. Deep vein thrombosis and pulmonary embolism in cirrhotic patients: Systematic review. World J Gastroenterol. 2014 May 21;20(19):5737-45.
3. Søgaard KK et al. Risk of venous thromboembolism in patients with liver disease: A nationwide population-based case-control study. Am J Gastroenterol. 2009 Jan;104(1):96-101.
4. Walsh KA et al. Risk factors for venous thromboembolism in patients with chronic liver disease. Ann Pharmacother. 2013;47(3):333-9.
5. Bogari H et al. Risk-assessment and pharmacological prophylaxis of venous thromboembolism in hospitalized patients with chronic liver disease. Thromb Res. 2014 Dec;134(6):1220-3.
6. Intagliata NM et al. Prophylactic anticoagulation for venous thromboembolism in hospitalized cirrhosis patients is not associated with high rates of gastrointestinal bleeding. Liver Int. 2014 Jan;34(1):26-32.
7. Pincus KJ et al. Risk of venous thromboembolism in patients with chronic liver disease and the utility of venous thromboembolism prophylaxis. Ann Pharmacother. 2012 Jun;46(6):873-8.
8. Lishman T et al. Established and new-generation antithrombotic drugs in patients with cirrhosis – possibilities and caveats. J Hepatol. 2013 Aug;59(2):358-66.
9. Tripodi A et al. Coagulation parameters in patients with cirrhosis and portal vein thrombosis treated sequentially with low molecular weight heparin and vitamin K antagonists. Dig Liver Dis. 2016 Oct;48(10):1208-13.
10. Caldeira D et al. Risk of drug-induced liver injury with the new oral anticoagulants: Systematic review and meta-analysis. Heart. 2014 Apr;100(7):550-6.
11. Qamar A et al. Oral anticoagulation in patients with liver disease. J Am Coll Cardiol. 2018 May 15;71(19):2162-75.
12. Barbar S et al. A risk assessment model for the identification of hospitalized medical patients at risk for venous thromboembolism: The Padua prediction score. J Thromb Haemost. 2010 Nov;8(11):2450-7.
DOACs may be a practical option for some CLD patients
DOACs may be a practical option for some CLD patients
Case
A 60-year-old man with cirrhosis is admitted to the hospital with concern for spontaneous bacterial peritonitis. His body mass index is 35 kg/m2. He is severely deconditioned and largely bed bound. His admission labs show thrombocytopenia (platelets 65,000/mcL) and an elevated international normalized ratio (INR) of 1.6. Should this patient be placed on venous thromboembolism (VTE) prophylaxis on admission?
Brief overview
Patients with chronic liver disease (CLD) have previously been considered “auto-anticoagulated” because of markers of increased bleeding risk, including a decreased platelet count and elevated INR, prothrombin time, and activated partial thromboplastin time. It is being increasingly recognized, however, that CLD often represents a hypercoagulable state despite these abnormalities.1
While cirrhotic patients produce less of several procoagulant substances (such as factors II, V, VII, X, XI, XII, XIII, and fibrinogen), they are also deficient in multiple anticoagulant factors (such as proteins C and S and antithrombin) and fibrinolytics (plasminogen). While the prothrombin time and activated partial thromboplastin time are sensitive to levels of procoagulant proteins in plasma, they do not measure response to the natural anticoagulants and therefore do not reflect an accurate picture of a cirrhotic patient’s risk of developing thrombosis. In addition, cirrhotic patients have many other risk factors for thrombosis, including poor functional status, frequent hospitalization, and elevated estrogen levels.
Overview of the data
VTE incidence among patients with CLD has varied across studies, ranging from 0.5% to 6.3%.2 A systemic review of VTE risk in cirrhotic patients concluded that they “have a significant risk of VTE, if not higher than noncirrhotic patients and this risk cannot be trivialized or ignored.”2
In a nationwide Danish case-control study, patients with cirrhosis had a 1.7 times increased risk of VTE, compared with the general population.3 Hypoalbuminemia appears to be one of the strongest associated risk factors for VTE in these patients, likely as a reflection of the degree of liver synthetic dysfunction (and therefore decreased synthesis of anticoagulant factors). One study showed that patients with an albumin of less than 1.9 g/dL had a VTE risk five times higher than patients with an albumin of 2.8 g/dL or higher.4
Prophylaxis
Given the increased risks of bleeding and thrombosis in patients with cirrhosis, how should VTE prophylaxis be managed in hospitalized patients? While current guidelines do not specifically address the use of pharmacologic prophylaxis in cirrhotic patients, the Padua Predictor Score, which is used to assess VTE risk in the general hospital population, has also been shown to be helpful in the subpopulation of patients with CLD (Table 1).
In one study, cirrhotic patients who were “high risk” by Padua Predictor score were over 12 times more likely to develop VTE than those who were “low risk.”5 Bleeding risk appears to be fairly low, and similar to those patients not receiving prophylactic anticoagulation. One retrospective case series of hospitalized cirrhotic patients receiving thromboprophylaxis showed a rate of GI bleeding of 2.5% (9 of 355 patients); the rate of major bleeding was less than 1%.6
Selection of anticoagulant for VTE prophylaxis should be similar to non-CLD patients. The choice of agent (low-molecular-weight heparin (LMWH) or unfractionated heparin) and dosing depends on factors including renal function and bodyweight. If anticoagulation is contraindicated (because of thrombocytopenia, for example), then mechanical prophylaxis should be considered.7
Treatment
What about anticoagulation in patients with a known VTE? Food and Drug Administration safety recommendations are based on Child-Pugh class, although the current data on the safety and efficacy of full dose anticoagulation therapy for VTE in patients with cirrhosis are limited (Table 2). At this point, LMWH is often the preferred choice for anticoagulation in CLD patients. However, some limitations exist including the need for frequent subcutaneous injections and limited reliability of anti–factor Xa levels.
Cirrhotic patients often fail to achieve target anti–factor Xa levels on standard prophylactic and therapeutic doses of enoxaparin. This, however, is likely a lab anomaly as in vitro studies have shown that cirrhotic patients may show an increased response to LMWH despite reduced anti–factor Xa levels.8 Thus, LMWH remains the standard of care for many CLD patients.
The use of vitamin K antagonists (VKAs) such as warfarin for VTE treatment can be difficult to manage. Traditionally CLD patients have been started on lower doses of warfarin but given their already elevated INR, this may lead to a subtherapeutic dose of VKAs. A recent study of 23 patients with cirrhosis demonstrated that a target INR of 2-3 can be reached with VKA doses similar to those in noncirrhotic patients.9 These data support the practice of using the same VKA dosing strategies for CLD patients, and selecting a starting dose based on patient parameters such as age and weight.
While the use of direct oral anticoagulants (DOACs) for this patient population is still not a common practice, they may be a practical option for some CLD patients. A meta-analysis found that the currently used DOACs have no significant risk of drug-induced hepatic injury.10 Currently, only observational data are available to assess the benefits and risks of bleeding with DOACs in this patient population, as patients with significant liver disease were excluded from the major randomized trials.11 DOACs may also represent a complicated choice for some patients given the effect of liver injury on their metabolism (Table 3).
Application of data to the original case
This patient should be assessed for both risk of VTE and risk of bleeding during the hospital admission. CLD patients likely have a risk of VTE similar to (or even greater than) that of general medical patients. The Padua score for this patient is 4 (bed rest, body mass index) indicating that he is at high risk of VTE. While he is thrombocytopenic, he is not below the threshold for receiving anticoagulation. His INR is elevated but this does not confer any reduced risk of VTE.
Bottom line
This patient should receive VTE prophylaxis with either subcutaneous heparin or LMWH during his hospital admission.
References
1. Khoury T et al. The complex role of anticoagulation in cirrhosis: An updated review of where we are and where we are going. Digestion. 2016 Mar;93(2):149-59.
2. Aggarwal A. Deep vein thrombosis and pulmonary embolism in cirrhotic patients: Systematic review. World J Gastroenterol. 2014 May 21;20(19):5737-45.
3. Søgaard KK et al. Risk of venous thromboembolism in patients with liver disease: A nationwide population-based case-control study. Am J Gastroenterol. 2009 Jan;104(1):96-101.
4. Walsh KA et al. Risk factors for venous thromboembolism in patients with chronic liver disease. Ann Pharmacother. 2013;47(3):333-9.
5. Bogari H et al. Risk-assessment and pharmacological prophylaxis of venous thromboembolism in hospitalized patients with chronic liver disease. Thromb Res. 2014 Dec;134(6):1220-3.
6. Intagliata NM et al. Prophylactic anticoagulation for venous thromboembolism in hospitalized cirrhosis patients is not associated with high rates of gastrointestinal bleeding. Liver Int. 2014 Jan;34(1):26-32.
7. Pincus KJ et al. Risk of venous thromboembolism in patients with chronic liver disease and the utility of venous thromboembolism prophylaxis. Ann Pharmacother. 2012 Jun;46(6):873-8.
8. Lishman T et al. Established and new-generation antithrombotic drugs in patients with cirrhosis – possibilities and caveats. J Hepatol. 2013 Aug;59(2):358-66.
9. Tripodi A et al. Coagulation parameters in patients with cirrhosis and portal vein thrombosis treated sequentially with low molecular weight heparin and vitamin K antagonists. Dig Liver Dis. 2016 Oct;48(10):1208-13.
10. Caldeira D et al. Risk of drug-induced liver injury with the new oral anticoagulants: Systematic review and meta-analysis. Heart. 2014 Apr;100(7):550-6.
11. Qamar A et al. Oral anticoagulation in patients with liver disease. J Am Coll Cardiol. 2018 May 15;71(19):2162-75.
12. Barbar S et al. A risk assessment model for the identification of hospitalized medical patients at risk for venous thromboembolism: The Padua prediction score. J Thromb Haemost. 2010 Nov;8(11):2450-7.