User login
Total Knee Arthroplasty Performed With Long-Acting Liposomal Bupivacaine Versus Femoral Nerve Catheter
Take-Home Points
- At our institution, LALB has shortened our hospital stay.
- There is a trend towards decreased opioid consumption with LALB.
- With the opioid epidemic we face today, LALB can be one of many options in our toolbox towards a solution.
- As stated in prior publications, the effectiveness of LALB is definitely technique dependent.
- Additional clinical studies are warranted to better determine the efficacy and cost-effectiveness of LALB.
Almost 1 million total knee arthroplasties (TKAs) are performed in the United States each year, and the number continues to grow.1.2 For patients about to undergo TKA, a significant concern is postoperative pain.3 Fear of postoperative pain is often cited as a reason for delaying surgery.3 Recent literature suggests that patients with poor pain management during the first 48 hours after surgery have a 50% chance of gaining satisfactory long-term pain relief.4 In addition, inadequate postoperative pain management can interfere with participation in and progression of physical rehabilitation, prolong hospital stay, and increase patient dissatisfaction.5 Poorly controlled pain results in decreased range of motion (ROM), strength, stability, and ambulation thereby prolongs hospital stays, and increases costs and overall dissatisfaction with the procedure.
Post-TKA pain management has received much attention in recent years. A multimodal pain management protocol is now a key component of clinical pathways in TKA. Appropriate postoperative pain control lowers postoperative complications and accelerates recovery.6 Pain-caused loss of function makes surgical patients more susceptible to edema, deep vein thrombosis, and pulmonary embolism.4 Various oral and intravenous medications are used to lessen the pain response during the perioperative period. In addition, regional or neuraxial anesthesia is often added to blunt the immediate surgical pain response.7,8 At our institution, TKA traditionally has been performed with femoral nerve catheters (FNCs) for postoperative pain control. Although effective, this method often results in decreased quadriceps musculature function, which delays rehabilitation and increases the fall risk. Recently, there has been a shift toward using local anesthetic infusions about the knee to provide adequate pain relief and restore motor function, which is often sacrificed with use of regional nerve blocks and continuous catheter infusions.9
Many institutions have started using a new long-acting local anesthetic in their multimodal pain management pathways: Exparel (Pacira Pharmaceuticals), a liposomal membrane-bound bupivacaine with sustained release of approximately 72 hours. Several studies have verified the safety of this medication.10 A systemic review of prospective studies revealed that, compared with bupivacaine, long-acting liposomal bupivacaine (LALB) in therapeutic doses had a higher safety margin and a favorable safety profile.10 However, no study has compared the effectiveness of LALB and FNC in a matched TKA cohort with each patient serving as his or her own control.
We recently reviewed our multimodal pain management protocol for any areas in need of improvement and decided to compare the effects of the indwelling FNC protocol that was in use with the effects of injecting the local anesthetic LALB. We conducted a study to compare the 2 methods with respect to pain control, ROM, ability to ambulate, and hospital length of stay (LOS). We hypothesized that the longer acting local anesthetic would provide comparable post-TKA pain control and post-TKA opioid use but would accelerate post-TKA rehabilitation.
Materials and Methods
This retrospective, longitudinal, repeated- measures study was approved by the Greenville Hospital System Institutional Review Board and conducted at the Steadman Hawkins Clinic of the Carolinas, Greenville Health System.
Interventions
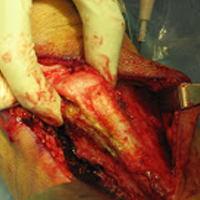
Twenty-three patients underwent separately staged bilateral TKAs between 2010 and 2013. For each TKA, a Genesis II implant (Smith & Nephew) was used, and the surgery was performed with the patient under spinal anesthesia. In each case, FNC was used for pain control after the first TKA, and periarticular injection (PAI) of LALB for pain control after the second TKA.
In the first TKAs, FNC-administered ropivacaine 0.2% (2 mg/mL) was maintained at a standard basal rate of 8 mL/h for 48 hours. In the second TKAs, LALB was administered along with bupivacaine/epinephrine. Twenty milliliters of LALB from a single-use vial was diluted in 40 mL of normal (0.9%) saline to obtain a 60-mL solution, and a 25-gauge needle was used to inject this solution into the periarticular soft tissues; another needle was used for PAI of 30 mL of bupivacaine 0.25% with epinephrine.
Continuous passive motion devices were not used. Most patients began therapy on day of surgery. Knee immobilizers were not used in the FNC group.
The same standardized multimodal pain management protocol was used for all TKAs. Non- narcotic medications, including acetaminophen, ketorolac, and celecoxib, were given on a scheduled basis. Tramadol and opioid medications were administered as needed for pain. The attending physician based patient discharge timing on pain control, ability to safely ambulate, and absence of complications.
Outcome Measures
Outcome measures were LOS; extension and flexion at discharge and 3-week follow-up; total ROM (extension plus flexion) at discharge and 3-week follow-up; per-day and total hospital stay morphine -equivalent doses (MEDs); and per-attempt walking distance during gait training.
ROM was measured with a standard goniometer. Flexion was tested with the patient supine and the hip and knee in neutral rotation. The goniometer axis was along the lateral epicondyle of the femur with the proximal arm of the goniometer parallel to the long axis of the femur and pointing at the greater trochanter and with the distal arm parallel to the long axis of the fibula and pointing at the lateral malleolus. The patient was instructed to flex the hip and knee by moving the heel toward the buttock. Expected normal ROM is 135°. The same landmarks were used for extension. The patient was instructed to push the back of the knee toward the plinth/bed, for maximal active extension. The same ROM assessment strategy was used during the hospitalization and at the 3-week follow-up.
Several opioid medications (eg, hydrocodone, oxycodone, tramadol, hydromorphone, morphine) with different dosages were used during hospitalization. Opioid doses were converted to MEDs to permit FNC–LALB comparisons. For each patient, total MEDs were divided by LOS to determine MEDs per day.
Mean per-attempt walking distance was calculated by dividing the total distance walked during hospitalization—the sum of the number of feet walked during each and every attempt, as measured by the treating physical therapist—by the total number of walking attempts.
Data Analysis
A paired-samples t test was used to calculate differences between all outcome measures: LOS; extension and flexion at discharge and 3-month follow-up; per-day and total MEDs; and mean per-attempt walking distance. P < .05 was considered significant. We elected not to adjust our α for a potential familywise error.
Results
Of the 23 patients, 14 were female and 9 were male, and 19 were white and 4 were black. Mean (SD) age was 64.4 (6.4) years for the FNC group and 66.0 (6.0) years for the LALB group. The age difference was not statistically significant.
Discussion
Poor pain control during the post-TKA period may have a significant impact on recovery rate, standard of living, psychological health, and postoperative complications.10 Inadequate postoperative pain control increases postoperative morbidity, hinders physiotherapy, increases anxiety, disrupts sleep patterns, and decreases patient satisfaction.9 There has been increased interest in PAIs. Local anesthetics are additional sources of pain control at surgical sites. However, the half-life of most local anesthetics is short. Soft-tissue infiltration of LALB into a surgical site extends the duration of active analgesia. Our study found that, compared with patients who received FNC, patients who received LALB had comparable pain control, improved knee ROM, and shorter hospital stays. In addition, the LALB group had no reports of quadriceps weakness or falls, both of which are associated with femoral nerve blocks. The FNC group had no reported falls, either. PAIs have the benefit of avoiding the invasiveness of femoral nerve blocks and possible neuritis.
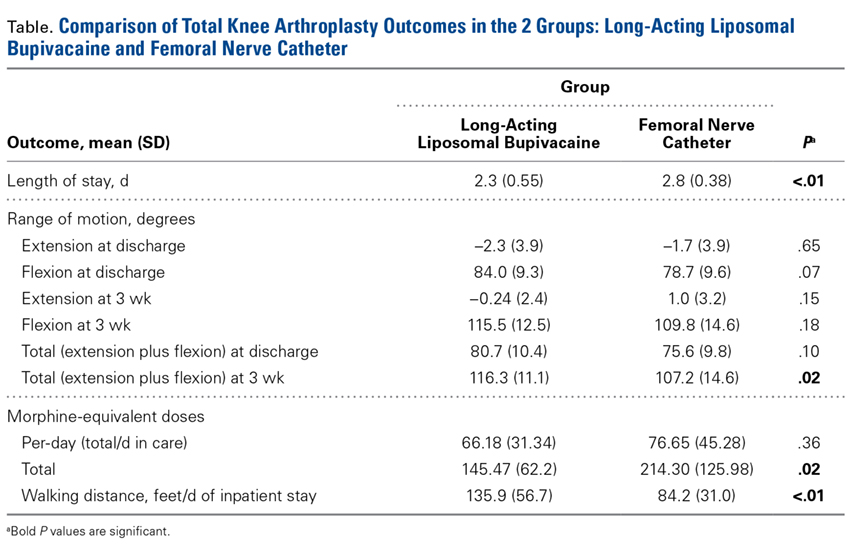
Many complications are associated with or indirectly related to delayed rehabilitation and immobility during the acute post-TKA period. From prolonged hospitalization to need for manipulation, the consequences of inadequate pain control and decreased function can be numerous and costly for patients and the healthcare system. In the present study, LALB use led to a statistically significant overall decrease in mean LOS (LALB group, 2.3 days; FNC, 2.8 days). With LALB, there was a higher likelihood of discharge the day after surgery; 20% of patients in the LALB group and no patients in the FNC group went home that day.
The implication is that inadequate pain control led to decreased motion and decreased progression during postoperative rehabilitation. Local infiltration resulted in increased total ROM (extension plus flexion) at 3-week follow-up (LALB, 116.3°; FNC, 107.2°). In addition, there was an increase in walking distance per day of hospital stay (LALB, 135.9 feet; FNC, 84.2 feet). Furthermore, patients indicated LALB when asked which anesthetic they preferred. To our knowledge, this is the first study to compare LALB and FNC data in a matched TKA cohort with each patient serving as his or her own control.
Our study had several limitations. First was the retrospective design. Second was the small sample size, which made definitive conclusions difficult. However, the statistically significant differences we noted validated our conclusions. A statistically significant difference favoring LALB over FNC was found for total MEDs during hospitalization, but there was no significant difference in per-day MEDs. A possible reason for this difference is that LALB patients had shorter hospital stays, and therefore received fewer doses overall. Another possible reason is the small sample size; whereas a larger study using our protocol may find a statistically significant difference between LALB and FNC, we found only a trend. In the FNC group, anesthetic infiltration occurred with use of a computerized pump, which was removed on postoperative day 2; most of these patients were discharged home that day or the morning of postoperative day 3. As it is possible that some of these patients could have gone home sooner, our LOS data may have been affected. We do not consider this limitation significant, as one of our discharge criteria was 150 feet of ambulation, and most patients who received FNCs could not ambulate that far until after FNC removal. Furthermore, this study compared LALB only with FNC. It is possible that our improved outcomes could have resulted from the PAIs themselves, irrespective of LALB. In a recent TKA study by Bagsby and colleagues,11 pain was controlled better with the less expensive traditional PAI of ropivacaine, epinephrine, and morphine than with the PAI of liposomal bupivacaine. Last, in our study, the experience of undergoing the first TKA may have increased patients’ confidence going into the second TKA and then helped them make faster progress in rehabilitation. Regardless, the promising results of our study and the firsthand use of LALB at our institution led us to modify our intraoperative pain management protocol for surgeons who perform TKA.
As we continue to use LALB, our study numbers will increase, and we may discover other factors that, though now underpowered, will prove to be statistically significant. Additional clinical studies are needed to better determine the efficacy and cost-effectiveness of LALB and other long-acting local anesthetic formulations.
1. Kurtz S, Ong K, Lau E, Mowat F, Halpern M. Projections of primary and revision hip and knee arthroplasty in the United States from 2005 to 2030. J Bone Joint Surg Am. 2007;89(4):780-785.
2. Ruiz D Jr, Koenig L, Dall TM, et al. The direct and indirect costs to society of treatment for end-stage knee osteoarthritis. J Bone Joint Surg Am. 2013;95(16):1473-1480.
3. Trousdale RT, McGrory BJ, Berry DJ, Becker MW, Harmsen WS. Patients’ concerns prior to undergoing total hip and total knee arthroplasty. Mayo Clin Proc. 1999;74(10):978-982.
4. Wells N, Pasero C, McCaffery M. Improving the quality of care through pain assessment and management. In: Hughes RG, ed. Patient Safety and Quality: An Evidence-Based Handbook for Nurses, Vol 1. Rockville, MD: Agency for Healthcare Research and Quality; 2008:469-497.
5. Breivik H, Collett B, Ventafridda V, Cohen R, Gallacher D. Survey of chronic pain in Europe: prevalence, impact on daily life, and treatment. Eur J Pain. 2006;10(4):287-333.
6. Parvizi J, Miller AG, Gandhi K. Multimodal pain management after total joint arthroplasty. J Bone Joint Surg Am. 2011;93(11):1075-1084.
7. Stein BE, Srikumaran U, Tan EW, Freehill MT, Wilckens JH. Lower-extremity peripheral nerve blocks in the perioperative pain management of orthopaedic patients: AAOS exhibit selection. J Bone Joint Surg Am. 2012;94(22):e167.
8. Pugely AJ, Martin CT, Gao Y, Mendoza-Lattes S, Callaghan JJ. Differences in short-term complications between spinal and general anesthesia for primary total knee arthroplasty. J Bone Joint Surg Am. 2013;95(3):193-199.
9. Dalury DF, Lieberman JR, MacDonald SJ. Current and innovative pain management techniques in total knee arthroplasty. J Bone Joint Surg Am. 2011;93(20):1938-1943.
10. Portillo J, Kamar N, Melibary S, Quevedo E, Bergese S. Safety of liposome extended-release bupivacaine for postoperative pain control. Front Pharmacol. 2014;5:90.
11. Bagsby DT, Ireland PH, Meneghini RM. Liposomal bupivacaine versus traditional periarticular injection for pain control after total knee arthroplasty. J Arthroplasty. 2014;29(8):1687-1690.
Take-Home Points
- At our institution, LALB has shortened our hospital stay.
- There is a trend towards decreased opioid consumption with LALB.
- With the opioid epidemic we face today, LALB can be one of many options in our toolbox towards a solution.
- As stated in prior publications, the effectiveness of LALB is definitely technique dependent.
- Additional clinical studies are warranted to better determine the efficacy and cost-effectiveness of LALB.
Almost 1 million total knee arthroplasties (TKAs) are performed in the United States each year, and the number continues to grow.1.2 For patients about to undergo TKA, a significant concern is postoperative pain.3 Fear of postoperative pain is often cited as a reason for delaying surgery.3 Recent literature suggests that patients with poor pain management during the first 48 hours after surgery have a 50% chance of gaining satisfactory long-term pain relief.4 In addition, inadequate postoperative pain management can interfere with participation in and progression of physical rehabilitation, prolong hospital stay, and increase patient dissatisfaction.5 Poorly controlled pain results in decreased range of motion (ROM), strength, stability, and ambulation thereby prolongs hospital stays, and increases costs and overall dissatisfaction with the procedure.
Post-TKA pain management has received much attention in recent years. A multimodal pain management protocol is now a key component of clinical pathways in TKA. Appropriate postoperative pain control lowers postoperative complications and accelerates recovery.6 Pain-caused loss of function makes surgical patients more susceptible to edema, deep vein thrombosis, and pulmonary embolism.4 Various oral and intravenous medications are used to lessen the pain response during the perioperative period. In addition, regional or neuraxial anesthesia is often added to blunt the immediate surgical pain response.7,8 At our institution, TKA traditionally has been performed with femoral nerve catheters (FNCs) for postoperative pain control. Although effective, this method often results in decreased quadriceps musculature function, which delays rehabilitation and increases the fall risk. Recently, there has been a shift toward using local anesthetic infusions about the knee to provide adequate pain relief and restore motor function, which is often sacrificed with use of regional nerve blocks and continuous catheter infusions.9
Many institutions have started using a new long-acting local anesthetic in their multimodal pain management pathways: Exparel (Pacira Pharmaceuticals), a liposomal membrane-bound bupivacaine with sustained release of approximately 72 hours. Several studies have verified the safety of this medication.10 A systemic review of prospective studies revealed that, compared with bupivacaine, long-acting liposomal bupivacaine (LALB) in therapeutic doses had a higher safety margin and a favorable safety profile.10 However, no study has compared the effectiveness of LALB and FNC in a matched TKA cohort with each patient serving as his or her own control.
We recently reviewed our multimodal pain management protocol for any areas in need of improvement and decided to compare the effects of the indwelling FNC protocol that was in use with the effects of injecting the local anesthetic LALB. We conducted a study to compare the 2 methods with respect to pain control, ROM, ability to ambulate, and hospital length of stay (LOS). We hypothesized that the longer acting local anesthetic would provide comparable post-TKA pain control and post-TKA opioid use but would accelerate post-TKA rehabilitation.
Materials and Methods
This retrospective, longitudinal, repeated- measures study was approved by the Greenville Hospital System Institutional Review Board and conducted at the Steadman Hawkins Clinic of the Carolinas, Greenville Health System.
Interventions
Twenty-three patients underwent separately staged bilateral TKAs between 2010 and 2013. For each TKA, a Genesis II implant (Smith & Nephew) was used, and the surgery was performed with the patient under spinal anesthesia. In each case, FNC was used for pain control after the first TKA, and periarticular injection (PAI) of LALB for pain control after the second TKA.
In the first TKAs, FNC-administered ropivacaine 0.2% (2 mg/mL) was maintained at a standard basal rate of 8 mL/h for 48 hours. In the second TKAs, LALB was administered along with bupivacaine/epinephrine. Twenty milliliters of LALB from a single-use vial was diluted in 40 mL of normal (0.9%) saline to obtain a 60-mL solution, and a 25-gauge needle was used to inject this solution into the periarticular soft tissues; another needle was used for PAI of 30 mL of bupivacaine 0.25% with epinephrine.
Continuous passive motion devices were not used. Most patients began therapy on day of surgery. Knee immobilizers were not used in the FNC group.
The same standardized multimodal pain management protocol was used for all TKAs. Non- narcotic medications, including acetaminophen, ketorolac, and celecoxib, were given on a scheduled basis. Tramadol and opioid medications were administered as needed for pain. The attending physician based patient discharge timing on pain control, ability to safely ambulate, and absence of complications.
Outcome Measures
Outcome measures were LOS; extension and flexion at discharge and 3-week follow-up; total ROM (extension plus flexion) at discharge and 3-week follow-up; per-day and total hospital stay morphine -equivalent doses (MEDs); and per-attempt walking distance during gait training.
ROM was measured with a standard goniometer. Flexion was tested with the patient supine and the hip and knee in neutral rotation. The goniometer axis was along the lateral epicondyle of the femur with the proximal arm of the goniometer parallel to the long axis of the femur and pointing at the greater trochanter and with the distal arm parallel to the long axis of the fibula and pointing at the lateral malleolus. The patient was instructed to flex the hip and knee by moving the heel toward the buttock. Expected normal ROM is 135°. The same landmarks were used for extension. The patient was instructed to push the back of the knee toward the plinth/bed, for maximal active extension. The same ROM assessment strategy was used during the hospitalization and at the 3-week follow-up.
Several opioid medications (eg, hydrocodone, oxycodone, tramadol, hydromorphone, morphine) with different dosages were used during hospitalization. Opioid doses were converted to MEDs to permit FNC–LALB comparisons. For each patient, total MEDs were divided by LOS to determine MEDs per day.
Mean per-attempt walking distance was calculated by dividing the total distance walked during hospitalization—the sum of the number of feet walked during each and every attempt, as measured by the treating physical therapist—by the total number of walking attempts.
Data Analysis
A paired-samples t test was used to calculate differences between all outcome measures: LOS; extension and flexion at discharge and 3-month follow-up; per-day and total MEDs; and mean per-attempt walking distance. P < .05 was considered significant. We elected not to adjust our α for a potential familywise error.
Results
Of the 23 patients, 14 were female and 9 were male, and 19 were white and 4 were black. Mean (SD) age was 64.4 (6.4) years for the FNC group and 66.0 (6.0) years for the LALB group. The age difference was not statistically significant.
Discussion
Poor pain control during the post-TKA period may have a significant impact on recovery rate, standard of living, psychological health, and postoperative complications.10 Inadequate postoperative pain control increases postoperative morbidity, hinders physiotherapy, increases anxiety, disrupts sleep patterns, and decreases patient satisfaction.9 There has been increased interest in PAIs. Local anesthetics are additional sources of pain control at surgical sites. However, the half-life of most local anesthetics is short. Soft-tissue infiltration of LALB into a surgical site extends the duration of active analgesia. Our study found that, compared with patients who received FNC, patients who received LALB had comparable pain control, improved knee ROM, and shorter hospital stays. In addition, the LALB group had no reports of quadriceps weakness or falls, both of which are associated with femoral nerve blocks. The FNC group had no reported falls, either. PAIs have the benefit of avoiding the invasiveness of femoral nerve blocks and possible neuritis.
Many complications are associated with or indirectly related to delayed rehabilitation and immobility during the acute post-TKA period. From prolonged hospitalization to need for manipulation, the consequences of inadequate pain control and decreased function can be numerous and costly for patients and the healthcare system. In the present study, LALB use led to a statistically significant overall decrease in mean LOS (LALB group, 2.3 days; FNC, 2.8 days). With LALB, there was a higher likelihood of discharge the day after surgery; 20% of patients in the LALB group and no patients in the FNC group went home that day.
The implication is that inadequate pain control led to decreased motion and decreased progression during postoperative rehabilitation. Local infiltration resulted in increased total ROM (extension plus flexion) at 3-week follow-up (LALB, 116.3°; FNC, 107.2°). In addition, there was an increase in walking distance per day of hospital stay (LALB, 135.9 feet; FNC, 84.2 feet). Furthermore, patients indicated LALB when asked which anesthetic they preferred. To our knowledge, this is the first study to compare LALB and FNC data in a matched TKA cohort with each patient serving as his or her own control.
Our study had several limitations. First was the retrospective design. Second was the small sample size, which made definitive conclusions difficult. However, the statistically significant differences we noted validated our conclusions. A statistically significant difference favoring LALB over FNC was found for total MEDs during hospitalization, but there was no significant difference in per-day MEDs. A possible reason for this difference is that LALB patients had shorter hospital stays, and therefore received fewer doses overall. Another possible reason is the small sample size; whereas a larger study using our protocol may find a statistically significant difference between LALB and FNC, we found only a trend. In the FNC group, anesthetic infiltration occurred with use of a computerized pump, which was removed on postoperative day 2; most of these patients were discharged home that day or the morning of postoperative day 3. As it is possible that some of these patients could have gone home sooner, our LOS data may have been affected. We do not consider this limitation significant, as one of our discharge criteria was 150 feet of ambulation, and most patients who received FNCs could not ambulate that far until after FNC removal. Furthermore, this study compared LALB only with FNC. It is possible that our improved outcomes could have resulted from the PAIs themselves, irrespective of LALB. In a recent TKA study by Bagsby and colleagues,11 pain was controlled better with the less expensive traditional PAI of ropivacaine, epinephrine, and morphine than with the PAI of liposomal bupivacaine. Last, in our study, the experience of undergoing the first TKA may have increased patients’ confidence going into the second TKA and then helped them make faster progress in rehabilitation. Regardless, the promising results of our study and the firsthand use of LALB at our institution led us to modify our intraoperative pain management protocol for surgeons who perform TKA.
As we continue to use LALB, our study numbers will increase, and we may discover other factors that, though now underpowered, will prove to be statistically significant. Additional clinical studies are needed to better determine the efficacy and cost-effectiveness of LALB and other long-acting local anesthetic formulations.
1. Kurtz S, Ong K, Lau E, Mowat F, Halpern M. Projections of primary and revision hip and knee arthroplasty in the United States from 2005 to 2030. J Bone Joint Surg Am. 2007;89(4):780-785.
2. Ruiz D Jr, Koenig L, Dall TM, et al. The direct and indirect costs to society of treatment for end-stage knee osteoarthritis. J Bone Joint Surg Am. 2013;95(16):1473-1480.
3. Trousdale RT, McGrory BJ, Berry DJ, Becker MW, Harmsen WS. Patients’ concerns prior to undergoing total hip and total knee arthroplasty. Mayo Clin Proc. 1999;74(10):978-982.
4. Wells N, Pasero C, McCaffery M. Improving the quality of care through pain assessment and management. In: Hughes RG, ed. Patient Safety and Quality: An Evidence-Based Handbook for Nurses, Vol 1. Rockville, MD: Agency for Healthcare Research and Quality; 2008:469-497.
5. Breivik H, Collett B, Ventafridda V, Cohen R, Gallacher D. Survey of chronic pain in Europe: prevalence, impact on daily life, and treatment. Eur J Pain. 2006;10(4):287-333.
6. Parvizi J, Miller AG, Gandhi K. Multimodal pain management after total joint arthroplasty. J Bone Joint Surg Am. 2011;93(11):1075-1084.
7. Stein BE, Srikumaran U, Tan EW, Freehill MT, Wilckens JH. Lower-extremity peripheral nerve blocks in the perioperative pain management of orthopaedic patients: AAOS exhibit selection. J Bone Joint Surg Am. 2012;94(22):e167.
8. Pugely AJ, Martin CT, Gao Y, Mendoza-Lattes S, Callaghan JJ. Differences in short-term complications between spinal and general anesthesia for primary total knee arthroplasty. J Bone Joint Surg Am. 2013;95(3):193-199.
9. Dalury DF, Lieberman JR, MacDonald SJ. Current and innovative pain management techniques in total knee arthroplasty. J Bone Joint Surg Am. 2011;93(20):1938-1943.
10. Portillo J, Kamar N, Melibary S, Quevedo E, Bergese S. Safety of liposome extended-release bupivacaine for postoperative pain control. Front Pharmacol. 2014;5:90.
11. Bagsby DT, Ireland PH, Meneghini RM. Liposomal bupivacaine versus traditional periarticular injection for pain control after total knee arthroplasty. J Arthroplasty. 2014;29(8):1687-1690.
A Method for Attributing Patient-Level Metrics to Rotating Providers in an Inpatient Setting
Hospitalists’ performance is routinely evaluated by third-party payers, employers, and patients. As hospitalist programs mature, there is a need to develop processes to identify, internally measure, and report on individual and group performance. We know from Society of Hospital Medicine (SHM) data that a significant amount of hospitalists’ total compensation is at least partially based on performance. Often this is based at least in part on quality data. In 2006, SHM issued a white paper detailing the key elements of a successful performance monitoring and reporting process.1,2 Recommendations included the identification of meaningful operational and clinical performance metrics, and the ability to monitor and report both group and individual metrics was highlighted as an essential component. There is evidence that comparison of individual provider performance with that of their peers is a necessary element of successful provider dashboards.3 Additionally, regular feedback and a clear, visual presentation of the data are important components of successful provider feedback dashboards.3-6
Much of the literature regarding provider feedback dashboards has been based in the outpatient setting. The majority of these dashboards focus on the management of chronic illnesses (eg, diabetes and hypertension), rates of preventative care services (eg, colonoscopy or mammogram), or avoidance of unnecessary care (eg, antibiotics for sinusitis).4,5 Unlike in the outpatient setting, in which 1 provider often provides a majority of the care for a given episode of care, hospitalized patients are often cared for by multiple providers, challenging the appropriate attribution of patient-level metrics to specific providers. Under the standard approach, an entire hospitalization is attributed to 1 physician, generally the attending of record for the hospitalization, which may be the admitting provider or the discharging provider, depending on the approach used by the hospital. However, assigning responsibility for an entire hospitalization to a provider who may have only seen the patient for a small percentage of a hospitalization may jeopardize the validity of metrics. As provider metrics are increasingly being used for compensation, it is important to ensure that the method for attribution correctly identifies the providers caring for patients. To our knowledge there is no gold standard approach for attributing metrics to providers when patients are cared for by multiple providers, and the standard attending of record–based approach may lack face validity in many cases.
We aimed to develop and operationalize a system to more fairly attribute patient-level data to individual providers across a single hospitalization even when multiple providers cared for the patient. We then compared our methodology to the standard approach, in which the attending of record receives full attribution for each metric, to determine the difference on a provider level between the 2 models.
METHODS
Clinical Setting
The Johns Hopkins Hospital is a 1145-bed, tertiary-care hospital. Over the years of this project, the Johns Hopkins Hospitalist Program was an approximately 20-physician group providing care in a variety of settings, including a dedicated hospitalist floor, where this metrics program was initiated. Hospitalists in this setting work Monday through Friday, with 1 hospitalist and a moonlighter covering on the weekends. Admissions are performed by an admitter, and overnight care is provided by a nocturnist. Initially 17 beds, this unit expanded to 24 beds in June 2012. For the purposes of this article, we included all general medicine patients admitted to this floor between July 1, 2010, and June 30, 2014, who were cared for by hospitalists. During this period, all patients were inpatients; no patients were admitted under observation status. All of these patients were cared for by hospitalists without housestaff or advanced practitioners. Since 2014, the metrics program has been expanded to other hospitalist-run services in the hospital, but for simplicity, we have not presented these more recent data.
Individual Provider Metrics
Metrics were chosen to reflect institutional quality and efficiency priorities. Our choice of metrics was restricted to those that (1) plausibly reflect provider performance, at least in part, and (2) could be accessed in electronic form (without any manual chart review). Whenever possible, we chose metrics with objective data. Additionally, because funding for this effort was provided by the hospital, we sought to ensure that enough of the metrics were related to cost to justify ongoing hospital support of the project. SAS 9.2 (SAS Institute Inc, Cary, NC) was used to calculate metric weights. Specific metrics included American College of Chest Physicians (ACCP)–compliant venous thromboembolism (VTE) prophylaxis,7 observed-to-expected length of stay (LOS) ratio, percentage of discharges per day, discharges before 3 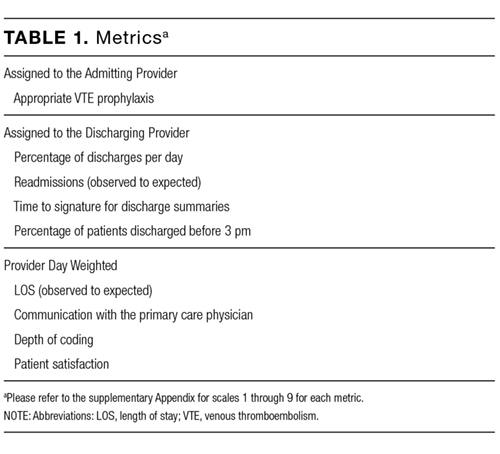
Appropriate prophylaxis for VTE was calculated by using an algorithm embedded within the computerized provider order entry system, which assessed the prescription of ACCP-compliant VTE prophylaxis within 24 hours following admission. This included a risk assessment, and credit was given for no prophylaxis and/or mechanical and/or pharmacologic prophylaxis per the ACCP guidelines.7
Observed-to-expected LOS was defined by using the University HealthSystem Consortium (UHC; now Vizient Inc) expected LOS for the given calendar year. This approach incorporates patient diagnoses, demographics, and other administrative variables to define an expected LOS for each patient.
The percent of patients discharged per day was defined from billing data as the percentage of a provider’s evaluation and management charges that were the final charge of a patient’s stay (regardless of whether a discharge day service was coded).
Discharge prior to 3
Depth of coding was defined as the number of coded diagnoses submitted to the Maryland Health Services Cost Review Commission for determining payment and was viewed as an indicator of the thoroughness of provider documentation.
Patient satisfaction was defined at the patient level (for those patients who turned in patient satisfaction surveys) as the pooled value of the 5 provider questions on the hospital’s patient satisfaction survey administered by Press Ganey: “time the physician spent with you,” “did the physician show concern for your questions/worries,” “did the physician keep you informed,” “friendliness/courtesy of the physician,” and “skill of the physician.”8
Readmission rates were defined as same-hospital readmissions divided by the total number of patients discharged by a given provider, with exclusions based on the Centers for Medicare and Medicaid Services hospital-wide, all-cause readmission measure.1 The expected same-hospital readmission rate was defined for each patient as the observed readmission rate in the entire UHC (Vizient) data set for all patients with the same All Patient Refined Diagnosis Related Group and severity of illness, as we have described previously.9
Communication with the primary care provider was the only self-reported metric used. It was based on a mandatory prompt on the discharge worksheet in the electronic medical record (EMR). Successful communication with the outpatient provider was defined as verbal or electronic communication by the hospitalist with the outpatient provider. Partial (50%) credit was given for providers who attempted but were unsuccessful in communicating with the outpatient provider, for patients for whom the provider had access to the Johns Hopkins EMR system, and for planned admissions without new or important information to convey. No credit was given for providers who indicated that communication was not indicated, who indicated that a patient and/or family would update the provider, or who indicated that the discharge summary would be sufficient.9 Because the discharge worksheet could be initiated at any time during the hospitalization, providers could document communication with the outpatient provider at any point during hospitalization.
Discharge summary turnaround was defined as the average number of days elapsed between the day of discharge and the signing of the discharge summary in the EMR.
Assigning Ownership of Patients to Individual Providers
Using billing data, we assigned ownership of patient care based on the type, timing, and number of charges that occurred during each hospitalization (Figure 1). Eligible charges included all history and physical (codes 99221, 99222, and 99223), subsequent care (codes 99231, 99232, and 99233), and discharge charges (codes 99238 and 99239).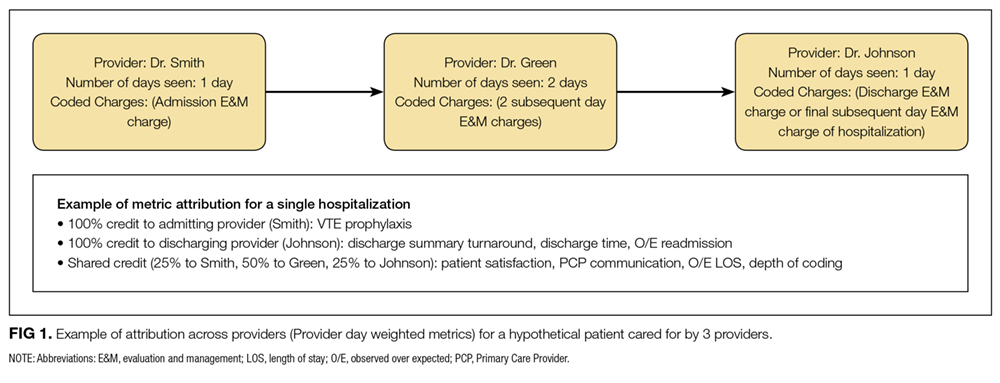
By using a unique identifier assigned for each hospitalization, professional fees submitted by providers were used to identify which provider saw the patient on the admission day, discharge day, as well as subsequent care days. Providers’ productivity, bonus supplements, and policy compliance were determined by using billing data, which encouraged the prompt submittal of charges.
The provider who billed the admission history and physical (codes 99221, 99222, and 99223) within 1 calendar date of the patient’s initial admission was defined as the admitting provider. Patients transferred to the hospitalist service from other services were not assigned an admitting hospitalist. The sole metric assigned to the admitting hospitalist was ACCP-compliant VTE prophylaxis.
The provider who billed the final subsequent care or discharge code (codes 99231, 99232, 99233, 99238, and 99239) within 1 calendar date of discharge was defined as the discharging provider. For hospitalizations characterized by a single provider charge (eg, for patients admitted and discharged on the same day), the provider billing this charge was assigned as both the admitting and discharging physician. Patients upgraded to the intensive care unit (ICU) were not counted as a discharge unless the patient was downgraded and discharged from the hospitalist service. The discharging provider was assigned responsibility for the time of discharge, the percent of patients discharged per day, the discharge summary turnaround time, and hospital readmissions.
Metrics that were assigned to multiple providers for a single hospitalization were termed “provider day–weighted” metrics. The formula for calculating the weight for each provider day–weighted metric was as follows: weight for provider A = [number of daily charges billed by provider A] divided by [LOS +1]. The initial hospital day was counted as day 0. LOS plus 1 was used to recognize that a typical hospitalization will have a charge on the day of admission (day 0) and a charge on the day of discharge such that an LOS of 2 days (eg, a patient admitted on Monday and discharged on Wednesday) will have 3 daily charges. Provider day–weighted metrics included patient satisfaction, communication with the outpatient provider, depth of coding, and observed-to-expected LOS.
Our billing software prevented providers from the same group from billing multiple daily charges, thus ensuring that there were no duplicated charges submitted for a given day.
Presenting Results
Providers were only shown data from the day-weighted approach. For ease of visual interpretation, scores for each metric were scaled ordinally from 1 (worst performance) to 9 (best performance; Table 1). Data were displayed in a dashboard format on a password-protected website for each provider to view his or her own data relative to that of the hospitalist peer group. The dashboard was implemented in this format on July 1, 2011. Data were updated quarterly (Figure 2).
Results were displayed in a polyhedral or spider-web graph (Figure 2). Provider and group metrics were scaled according to predefined benchmarks established for each metric and standardized to a scale ranging from 1 to 9. The scale for each metric was set based on examining historical data and group median performance on the metrics to ensure that there was a range of performance (ie, to avoid having most hospitalists scoring a 1 or 9). Scaling thresholds were periodically adjusted as appropriate to maintain good visual discrimination. Higher scores (creating a larger-volume polygon) are desirable even for metrics such as LOS, for which a low value is desirable. Both a spider-web graph and trends over time were available to the provider (Figure 2). These graphs display a comparison of the individual provider scores for each metric to the hospitalist group average for that metric.
Comparison with the Standard (Attending of Record) Method of Attribution
For the purposes of this report, we sought to determine whether there were meaningful differences between our day-weighted approach versus the standard method of attribution, in which the attending of record is assigned responsibility for each metric that would not have been attributed to the discharging attending under both methods. Our goal was to determine where and whether there was a meaningful difference between the 2 methodologies, recognizing that the degree of difference between these 2 methodologies might vary in other institutions and settings. In our hospital, the attending of record is generally the discharging attending. In order to compare the 2 methodologies, we arbitrarily picked 2015 to retrospectively evaluate the differences between these 2 methods of attribution. We did not display or provide data using the standard methodology to providers at any point; this approach was used only for the purposes of this report. Because these metrics are intended to evaluate relative provider performance, we assigned a percentile to each provider for his or her performance on the given metric using our attribution methodology and then, similarly, assigned a percentile to each provider using the standard methodology. This yielded 2 percentile scores for each provider and each metric. We then compared these percentile ranks for providers in 2 ways: (1) we determined how often providers who scored in the top half of the group for a given metric (above the 50th percentile) also scored in the top half of the group for that metric by using the other calculation method, and (2) we calculated the absolute value of the difference in percentiles between the 2 methods to characterize the impact on a provider’s ranking for that metric that might result from switching to the other method. For instance, if a provider scored at the 20th percentile for the group in patient satisfaction with 1 attribution method and scored at the 40th percentile for the group in patient satisfaction using the other method, the absolute change in percentile would be 20 percentile points. But, this provider would still be below the 50th percentile by both methods (concordant bottom half performance). We did not perform this comparison for metrics assigned to the discharging provider (such as discharge summary turnaround time or readmissions) because the attending of record designation is assigned to the discharging provider at our hospital.
RESULTS
The dashboard was successfully operationalized on July 1, 2011, with displays visible to providers as shown in Figure 2. Consistent with the principles of providing effective performance feedback to providers, the display simultaneously showed providers their individual performance as well as the performance of their peers. Providers were able to view their spider-web plot for prior quarters. Not shown are additional views that allowed providers to see quarterly trends in their data versus their peers across several fiscal years. Also available to providers was their ranking relative to their peers for each metric; specific peers were deidentified in the display.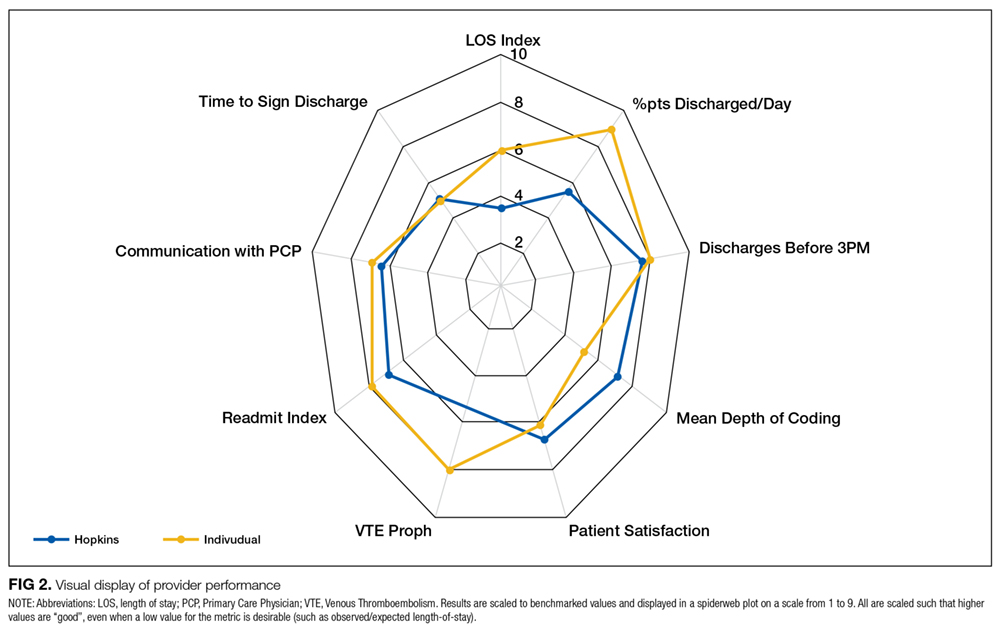
There was notable discordance between provider rankings between the 2 methodologies, as shown in Table 2. Provider performance above or below the median was concordant 56% to 75% of the time (depending on the particular metric), indicating substantial discordance because top-half or bottom-half concordance would be expected to occur by chance 50% of the time. Although the provider percentile differences between the 2 methods tended to be modest for most providers (the median difference between the methods was 13 to 22 percentile points for the various metrics), there were some providers for whom the method of calculation dramatically impacted their rankings. For 5 of the 6 metrics we examined, at least 1 provider had a 50-percentile or greater change in his or her ranking based on the method used. This indicates that at least some providers would have had markedly different scores relative to their peers had we used the alternative methodology (Table 2). In VTE prophylaxis, for example, at least 1 provider had a 94-percentile change in his or her ranking; similarly, a provider had an 88-perentile change in his or her LOS ranking between the 2 methodologies.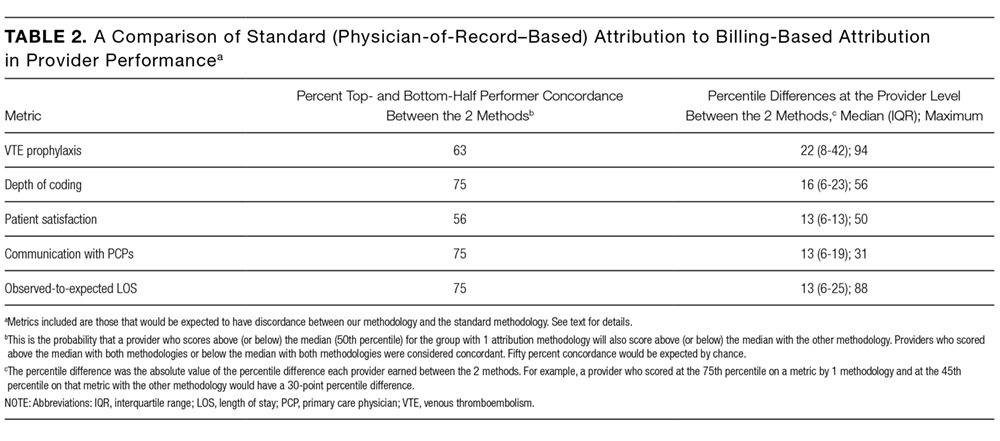
DISCUSSION
We found that it is possible to assign metrics across 1 hospital stay to multiple providers by using billing data. We also found a meaningful discrepancy in how well providers scored (relative to their peers) based on the method used for attribution. These results imply that hospitals should consider attributing performance metrics based on ascribed ownership from billing data and not just from attending of record status.
As hospitalist programs and providers in general are increasingly being asked to develop dashboards to monitor individual and group performance, correctly attributing care to providers is likely to become increasingly important. Experts agree that principles of effective provider performance dashboards include ranking individual provider performance relative to peers, clearly displaying data in an easily accessible format, and ensuring that data can be credibly attributed to the individual provider.3,4,6 However, there appears to be no gold standard method for attribution, especially in the inpatient setting. Our results imply that hospitals should consider attributing performance metrics based on ascribed ownership from billing data and not just from attending of record status.
Several limitations of our findings are important to consider. First, our program is a relatively small, academic group with handoffs that typically occur every 1 to 2 weeks and sometimes with additional handoffs on weekends. Different care patterns and settings might impact the utility of our attribution methodology relative to the standard methodology. Additionally, it is important to note that the relative merits of the different methodologies cannot be ascertained from our comparison. We can demonstrate discordance between the attribution methodologies, but we cannot say that 1 method is correct and the other is flawed. Although we believe that our day-weighted approach feels fairer to providers based on group input and feedback, we did not conduct a formal survey to examine providers’ preferences for the standard versus day-weighted approaches. The appropriateness of a particular attribution method needs to be assessed locally and may vary based on the clinical setting. For instance, on a service in which patients are admitted for procedures, it may make more sense to attribute the outcome of the case to the proceduralist even if that provider did not bill for the patient’s care on a daily basis. Finally, the computational requirements of our methodology are not trivial and require linking billing data with administrative patient-level data, which may be challenging to operationalize in some institutions.
These limitations aside, we believe that our attribution methodology has face validity. For example, a provider might be justifiably frustrated if, using the standard methodology, he or she is charged with the LOS of a patient who had been hospitalized for months, particularly if that patient is discharged shortly after the provider assumes care. Our method addresses this type of misattribution. Particularly when individual provider compensation is based on performance on metrics (as is the case at our institution), optimizing provider attribution to particular patients may be important, and face validity may be required for group buy-in.
In summary, we have demonstrated that it is possible to use billing data to assign ownership of patients to multiple providers over 1 hospital stay. This could be applied to other hospitalist programs as well as other healthcare settings in which multiple providers care for patients during 1 healthcare encounter (eg, ICUs).
Disclosure
The authors declare they have no relevant conflicts of interest.
1. Horwitz L, Partovian C, Lin Z, et al. Hospital-Wide (All-Condition) 30‐Day Risk-Standardized Readmission Measure. https://www.cms.gov/Medicare/Quality-Initiatives-Patient-Assessment-Instruments/MMS/downloads/MMSHospital-WideAll-ConditionReadmissionRate.pdf. Accessed March 6, 2015.
2. Medicine SoH. Measuring Hospitalist Performance: Metrics, Reports, and Dashboards. 2007; https://www.hospitalmedicine.org/Web/Practice_Management/Products_and_Programs/measure_hosp_perf_metrics_reports_dashboards.aspx. Accessed May 12, 2013.
3. Teleki SS, Shaw R, Damberg CL, McGlynn EA. Providing performance feedback to individual physicians: current practice and emerging lessons. Santa Monica, CA: RAND Corporation; 2006. 1-47. https://www.rand.org/content/dam/rand/pubs/working_papers/2006/RAND_WR381.pdf. Accessed August, 2017.
4. Brehaut JC, Colquhoun HL, Eva KW, et al. Practice Feedback Interventions: 15 Suggestions for Optimizing Effectiveness Practice Feedback Interventions. Ann Intern Med. 2016;164(6):435-441. PubMed
5. Dowding D, Randell R, Gardner P, et al. Dashboards for improving patient care: review of the literature. Int J Med Inform. 2015;84(2):87-100. PubMed
6. Landon BE, Normand S-LT, Blumenthal D, Daley J. Physician clinical performance assessment: prospects and barriers. JAMA. 2003;290(9):1183-1189. PubMed
7. Guyatt GH, Akl EA, Crowther M, Gutterman DD, Schuünemann HJ. Executive summary: Antit hrombotic therapy and prevention of thrombosis, 9th ed: American College of Chest Physicians evidence-based clinical practice guidelines. Ann Intern Med. 2012;141(2 suppl):7S-47S. PubMed
8. Siddiqui Z, Qayyum R, Bertram A, et al. Does Provider Self-reporting of Etiquette Behaviors Improve Patient Experience? A Randomized Controlled Trial. J Hosp Med. 2017;12(6):402-406. PubMed
9. Oduyebo I, Lehmann CU, Pollack CE, et al. Association of self-reported hospital discharge handoffs with 30-day readmissions. JAMA Intern Med. 2013;173(8):624-629. PubMed
Hospitalists’ performance is routinely evaluated by third-party payers, employers, and patients. As hospitalist programs mature, there is a need to develop processes to identify, internally measure, and report on individual and group performance. We know from Society of Hospital Medicine (SHM) data that a significant amount of hospitalists’ total compensation is at least partially based on performance. Often this is based at least in part on quality data. In 2006, SHM issued a white paper detailing the key elements of a successful performance monitoring and reporting process.1,2 Recommendations included the identification of meaningful operational and clinical performance metrics, and the ability to monitor and report both group and individual metrics was highlighted as an essential component. There is evidence that comparison of individual provider performance with that of their peers is a necessary element of successful provider dashboards.3 Additionally, regular feedback and a clear, visual presentation of the data are important components of successful provider feedback dashboards.3-6
Much of the literature regarding provider feedback dashboards has been based in the outpatient setting. The majority of these dashboards focus on the management of chronic illnesses (eg, diabetes and hypertension), rates of preventative care services (eg, colonoscopy or mammogram), or avoidance of unnecessary care (eg, antibiotics for sinusitis).4,5 Unlike in the outpatient setting, in which 1 provider often provides a majority of the care for a given episode of care, hospitalized patients are often cared for by multiple providers, challenging the appropriate attribution of patient-level metrics to specific providers. Under the standard approach, an entire hospitalization is attributed to 1 physician, generally the attending of record for the hospitalization, which may be the admitting provider or the discharging provider, depending on the approach used by the hospital. However, assigning responsibility for an entire hospitalization to a provider who may have only seen the patient for a small percentage of a hospitalization may jeopardize the validity of metrics. As provider metrics are increasingly being used for compensation, it is important to ensure that the method for attribution correctly identifies the providers caring for patients. To our knowledge there is no gold standard approach for attributing metrics to providers when patients are cared for by multiple providers, and the standard attending of record–based approach may lack face validity in many cases.
We aimed to develop and operationalize a system to more fairly attribute patient-level data to individual providers across a single hospitalization even when multiple providers cared for the patient. We then compared our methodology to the standard approach, in which the attending of record receives full attribution for each metric, to determine the difference on a provider level between the 2 models.
METHODS
Clinical Setting
The Johns Hopkins Hospital is a 1145-bed, tertiary-care hospital. Over the years of this project, the Johns Hopkins Hospitalist Program was an approximately 20-physician group providing care in a variety of settings, including a dedicated hospitalist floor, where this metrics program was initiated. Hospitalists in this setting work Monday through Friday, with 1 hospitalist and a moonlighter covering on the weekends. Admissions are performed by an admitter, and overnight care is provided by a nocturnist. Initially 17 beds, this unit expanded to 24 beds in June 2012. For the purposes of this article, we included all general medicine patients admitted to this floor between July 1, 2010, and June 30, 2014, who were cared for by hospitalists. During this period, all patients were inpatients; no patients were admitted under observation status. All of these patients were cared for by hospitalists without housestaff or advanced practitioners. Since 2014, the metrics program has been expanded to other hospitalist-run services in the hospital, but for simplicity, we have not presented these more recent data.
Individual Provider Metrics
Metrics were chosen to reflect institutional quality and efficiency priorities. Our choice of metrics was restricted to those that (1) plausibly reflect provider performance, at least in part, and (2) could be accessed in electronic form (without any manual chart review). Whenever possible, we chose metrics with objective data. Additionally, because funding for this effort was provided by the hospital, we sought to ensure that enough of the metrics were related to cost to justify ongoing hospital support of the project. SAS 9.2 (SAS Institute Inc, Cary, NC) was used to calculate metric weights. Specific metrics included American College of Chest Physicians (ACCP)–compliant venous thromboembolism (VTE) prophylaxis,7 observed-to-expected length of stay (LOS) ratio, percentage of discharges per day, discharges before 3
Appropriate prophylaxis for VTE was calculated by using an algorithm embedded within the computerized provider order entry system, which assessed the prescription of ACCP-compliant VTE prophylaxis within 24 hours following admission. This included a risk assessment, and credit was given for no prophylaxis and/or mechanical and/or pharmacologic prophylaxis per the ACCP guidelines.7
Observed-to-expected LOS was defined by using the University HealthSystem Consortium (UHC; now Vizient Inc) expected LOS for the given calendar year. This approach incorporates patient diagnoses, demographics, and other administrative variables to define an expected LOS for each patient.
The percent of patients discharged per day was defined from billing data as the percentage of a provider’s evaluation and management charges that were the final charge of a patient’s stay (regardless of whether a discharge day service was coded).
Discharge prior to 3
Depth of coding was defined as the number of coded diagnoses submitted to the Maryland Health Services Cost Review Commission for determining payment and was viewed as an indicator of the thoroughness of provider documentation.
Patient satisfaction was defined at the patient level (for those patients who turned in patient satisfaction surveys) as the pooled value of the 5 provider questions on the hospital’s patient satisfaction survey administered by Press Ganey: “time the physician spent with you,” “did the physician show concern for your questions/worries,” “did the physician keep you informed,” “friendliness/courtesy of the physician,” and “skill of the physician.”8
Readmission rates were defined as same-hospital readmissions divided by the total number of patients discharged by a given provider, with exclusions based on the Centers for Medicare and Medicaid Services hospital-wide, all-cause readmission measure.1 The expected same-hospital readmission rate was defined for each patient as the observed readmission rate in the entire UHC (Vizient) data set for all patients with the same All Patient Refined Diagnosis Related Group and severity of illness, as we have described previously.9
Communication with the primary care provider was the only self-reported metric used. It was based on a mandatory prompt on the discharge worksheet in the electronic medical record (EMR). Successful communication with the outpatient provider was defined as verbal or electronic communication by the hospitalist with the outpatient provider. Partial (50%) credit was given for providers who attempted but were unsuccessful in communicating with the outpatient provider, for patients for whom the provider had access to the Johns Hopkins EMR system, and for planned admissions without new or important information to convey. No credit was given for providers who indicated that communication was not indicated, who indicated that a patient and/or family would update the provider, or who indicated that the discharge summary would be sufficient.9 Because the discharge worksheet could be initiated at any time during the hospitalization, providers could document communication with the outpatient provider at any point during hospitalization.
Discharge summary turnaround was defined as the average number of days elapsed between the day of discharge and the signing of the discharge summary in the EMR.
Assigning Ownership of Patients to Individual Providers
Using billing data, we assigned ownership of patient care based on the type, timing, and number of charges that occurred during each hospitalization (Figure 1). Eligible charges included all history and physical (codes 99221, 99222, and 99223), subsequent care (codes 99231, 99232, and 99233), and discharge charges (codes 99238 and 99239).
By using a unique identifier assigned for each hospitalization, professional fees submitted by providers were used to identify which provider saw the patient on the admission day, discharge day, as well as subsequent care days. Providers’ productivity, bonus supplements, and policy compliance were determined by using billing data, which encouraged the prompt submittal of charges.
The provider who billed the admission history and physical (codes 99221, 99222, and 99223) within 1 calendar date of the patient’s initial admission was defined as the admitting provider. Patients transferred to the hospitalist service from other services were not assigned an admitting hospitalist. The sole metric assigned to the admitting hospitalist was ACCP-compliant VTE prophylaxis.
The provider who billed the final subsequent care or discharge code (codes 99231, 99232, 99233, 99238, and 99239) within 1 calendar date of discharge was defined as the discharging provider. For hospitalizations characterized by a single provider charge (eg, for patients admitted and discharged on the same day), the provider billing this charge was assigned as both the admitting and discharging physician. Patients upgraded to the intensive care unit (ICU) were not counted as a discharge unless the patient was downgraded and discharged from the hospitalist service. The discharging provider was assigned responsibility for the time of discharge, the percent of patients discharged per day, the discharge summary turnaround time, and hospital readmissions.
Metrics that were assigned to multiple providers for a single hospitalization were termed “provider day–weighted” metrics. The formula for calculating the weight for each provider day–weighted metric was as follows: weight for provider A = [number of daily charges billed by provider A] divided by [LOS +1]. The initial hospital day was counted as day 0. LOS plus 1 was used to recognize that a typical hospitalization will have a charge on the day of admission (day 0) and a charge on the day of discharge such that an LOS of 2 days (eg, a patient admitted on Monday and discharged on Wednesday) will have 3 daily charges. Provider day–weighted metrics included patient satisfaction, communication with the outpatient provider, depth of coding, and observed-to-expected LOS.
Our billing software prevented providers from the same group from billing multiple daily charges, thus ensuring that there were no duplicated charges submitted for a given day.
Presenting Results
Providers were only shown data from the day-weighted approach. For ease of visual interpretation, scores for each metric were scaled ordinally from 1 (worst performance) to 9 (best performance; Table 1). Data were displayed in a dashboard format on a password-protected website for each provider to view his or her own data relative to that of the hospitalist peer group. The dashboard was implemented in this format on July 1, 2011. Data were updated quarterly (Figure 2).
Results were displayed in a polyhedral or spider-web graph (Figure 2). Provider and group metrics were scaled according to predefined benchmarks established for each metric and standardized to a scale ranging from 1 to 9. The scale for each metric was set based on examining historical data and group median performance on the metrics to ensure that there was a range of performance (ie, to avoid having most hospitalists scoring a 1 or 9). Scaling thresholds were periodically adjusted as appropriate to maintain good visual discrimination. Higher scores (creating a larger-volume polygon) are desirable even for metrics such as LOS, for which a low value is desirable. Both a spider-web graph and trends over time were available to the provider (Figure 2). These graphs display a comparison of the individual provider scores for each metric to the hospitalist group average for that metric.
Comparison with the Standard (Attending of Record) Method of Attribution
For the purposes of this report, we sought to determine whether there were meaningful differences between our day-weighted approach versus the standard method of attribution, in which the attending of record is assigned responsibility for each metric that would not have been attributed to the discharging attending under both methods. Our goal was to determine where and whether there was a meaningful difference between the 2 methodologies, recognizing that the degree of difference between these 2 methodologies might vary in other institutions and settings. In our hospital, the attending of record is generally the discharging attending. In order to compare the 2 methodologies, we arbitrarily picked 2015 to retrospectively evaluate the differences between these 2 methods of attribution. We did not display or provide data using the standard methodology to providers at any point; this approach was used only for the purposes of this report. Because these metrics are intended to evaluate relative provider performance, we assigned a percentile to each provider for his or her performance on the given metric using our attribution methodology and then, similarly, assigned a percentile to each provider using the standard methodology. This yielded 2 percentile scores for each provider and each metric. We then compared these percentile ranks for providers in 2 ways: (1) we determined how often providers who scored in the top half of the group for a given metric (above the 50th percentile) also scored in the top half of the group for that metric by using the other calculation method, and (2) we calculated the absolute value of the difference in percentiles between the 2 methods to characterize the impact on a provider’s ranking for that metric that might result from switching to the other method. For instance, if a provider scored at the 20th percentile for the group in patient satisfaction with 1 attribution method and scored at the 40th percentile for the group in patient satisfaction using the other method, the absolute change in percentile would be 20 percentile points. But, this provider would still be below the 50th percentile by both methods (concordant bottom half performance). We did not perform this comparison for metrics assigned to the discharging provider (such as discharge summary turnaround time or readmissions) because the attending of record designation is assigned to the discharging provider at our hospital.
RESULTS
The dashboard was successfully operationalized on July 1, 2011, with displays visible to providers as shown in Figure 2. Consistent with the principles of providing effective performance feedback to providers, the display simultaneously showed providers their individual performance as well as the performance of their peers. Providers were able to view their spider-web plot for prior quarters. Not shown are additional views that allowed providers to see quarterly trends in their data versus their peers across several fiscal years. Also available to providers was their ranking relative to their peers for each metric; specific peers were deidentified in the display.
There was notable discordance between provider rankings between the 2 methodologies, as shown in Table 2. Provider performance above or below the median was concordant 56% to 75% of the time (depending on the particular metric), indicating substantial discordance because top-half or bottom-half concordance would be expected to occur by chance 50% of the time. Although the provider percentile differences between the 2 methods tended to be modest for most providers (the median difference between the methods was 13 to 22 percentile points for the various metrics), there were some providers for whom the method of calculation dramatically impacted their rankings. For 5 of the 6 metrics we examined, at least 1 provider had a 50-percentile or greater change in his or her ranking based on the method used. This indicates that at least some providers would have had markedly different scores relative to their peers had we used the alternative methodology (Table 2). In VTE prophylaxis, for example, at least 1 provider had a 94-percentile change in his or her ranking; similarly, a provider had an 88-perentile change in his or her LOS ranking between the 2 methodologies.
DISCUSSION
We found that it is possible to assign metrics across 1 hospital stay to multiple providers by using billing data. We also found a meaningful discrepancy in how well providers scored (relative to their peers) based on the method used for attribution. These results imply that hospitals should consider attributing performance metrics based on ascribed ownership from billing data and not just from attending of record status.
As hospitalist programs and providers in general are increasingly being asked to develop dashboards to monitor individual and group performance, correctly attributing care to providers is likely to become increasingly important. Experts agree that principles of effective provider performance dashboards include ranking individual provider performance relative to peers, clearly displaying data in an easily accessible format, and ensuring that data can be credibly attributed to the individual provider.3,4,6 However, there appears to be no gold standard method for attribution, especially in the inpatient setting. Our results imply that hospitals should consider attributing performance metrics based on ascribed ownership from billing data and not just from attending of record status.
Several limitations of our findings are important to consider. First, our program is a relatively small, academic group with handoffs that typically occur every 1 to 2 weeks and sometimes with additional handoffs on weekends. Different care patterns and settings might impact the utility of our attribution methodology relative to the standard methodology. Additionally, it is important to note that the relative merits of the different methodologies cannot be ascertained from our comparison. We can demonstrate discordance between the attribution methodologies, but we cannot say that 1 method is correct and the other is flawed. Although we believe that our day-weighted approach feels fairer to providers based on group input and feedback, we did not conduct a formal survey to examine providers’ preferences for the standard versus day-weighted approaches. The appropriateness of a particular attribution method needs to be assessed locally and may vary based on the clinical setting. For instance, on a service in which patients are admitted for procedures, it may make more sense to attribute the outcome of the case to the proceduralist even if that provider did not bill for the patient’s care on a daily basis. Finally, the computational requirements of our methodology are not trivial and require linking billing data with administrative patient-level data, which may be challenging to operationalize in some institutions.
These limitations aside, we believe that our attribution methodology has face validity. For example, a provider might be justifiably frustrated if, using the standard methodology, he or she is charged with the LOS of a patient who had been hospitalized for months, particularly if that patient is discharged shortly after the provider assumes care. Our method addresses this type of misattribution. Particularly when individual provider compensation is based on performance on metrics (as is the case at our institution), optimizing provider attribution to particular patients may be important, and face validity may be required for group buy-in.
In summary, we have demonstrated that it is possible to use billing data to assign ownership of patients to multiple providers over 1 hospital stay. This could be applied to other hospitalist programs as well as other healthcare settings in which multiple providers care for patients during 1 healthcare encounter (eg, ICUs).
Disclosure
The authors declare they have no relevant conflicts of interest.
1. Horwitz L, Partovian C, Lin Z, et al. Hospital-Wide (All-Condition) 30‐Day Risk-Standardized Readmission Measure. https://www.cms.gov/Medicare/Quality-Initiatives-Patient-Assessment-Instruments/MMS/downloads/MMSHospital-WideAll-ConditionReadmissionRate.pdf. Accessed March 6, 2015.
2. Medicine SoH. Measuring Hospitalist Performance: Metrics, Reports, and Dashboards. 2007; https://www.hospitalmedicine.org/Web/Practice_Management/Products_and_Programs/measure_hosp_perf_metrics_reports_dashboards.aspx. Accessed May 12, 2013.
3. Teleki SS, Shaw R, Damberg CL, McGlynn EA. Providing performance feedback to individual physicians: current practice and emerging lessons. Santa Monica, CA: RAND Corporation; 2006. 1-47. https://www.rand.org/content/dam/rand/pubs/working_papers/2006/RAND_WR381.pdf. Accessed August, 2017.
4. Brehaut JC, Colquhoun HL, Eva KW, et al. Practice Feedback Interventions: 15 Suggestions for Optimizing Effectiveness Practice Feedback Interventions. Ann Intern Med. 2016;164(6):435-441. PubMed
5. Dowding D, Randell R, Gardner P, et al. Dashboards for improving patient care: review of the literature. Int J Med Inform. 2015;84(2):87-100. PubMed
6. Landon BE, Normand S-LT, Blumenthal D, Daley J. Physician clinical performance assessment: prospects and barriers. JAMA. 2003;290(9):1183-1189. PubMed
7. Guyatt GH, Akl EA, Crowther M, Gutterman DD, Schuünemann HJ. Executive summary: Antit hrombotic therapy and prevention of thrombosis, 9th ed: American College of Chest Physicians evidence-based clinical practice guidelines. Ann Intern Med. 2012;141(2 suppl):7S-47S. PubMed
8. Siddiqui Z, Qayyum R, Bertram A, et al. Does Provider Self-reporting of Etiquette Behaviors Improve Patient Experience? A Randomized Controlled Trial. J Hosp Med. 2017;12(6):402-406. PubMed
9. Oduyebo I, Lehmann CU, Pollack CE, et al. Association of self-reported hospital discharge handoffs with 30-day readmissions. JAMA Intern Med. 2013;173(8):624-629. PubMed
© 2017 Society of Hospital Medicine
Characterization and Surgical Management of Metastatic Disease of the Tibia
Take-Home Points
- Metastatic disease of the tibia is a rare but significant event in a subset of patients.
- Cancer histologies with historically “acral” spread may not apply to tibial disease.
- Patients with leg pain and any cancer diagnosis should be worked up for tibial metastases.
- Tibial disease is probably a late manifestation, and early detection may indicate late diagnosis of malignancy.
- The ultimate surgical plan for these patients should be a patient-centered multidisciplinary decision making process.
Metastatic dissemination to bones is common in advanced cancer stages and affects the axial and appendicular skeleton.1-4 The appendicular skeleton bones most often involved are the proximal femur and the proximal humerus.5,6 The tibia is involved third most often but is comparatively rarely affected.4-6 Metastatic involvement distal to the knee or elbow is more typical of advanced disease.1,3 Distal appendicular lesions are called acral metastases, but the term is inconsistently used and may refer to lesions either distal to the knee and elbow or distal to the ankle and wrist. Regardless of terminology, tibia lesions are uncommon and not well described.1,4,7,8
The tibia is the primary weight-bearing leg bone. Metastatic tibia lesions may cause pain and instability and impair mobility. Although distal skeletal dissemination often presents late in advanced disease in patients with relatively poor prognoses, in some cases early surgical intervention is indicated for pain relief, increased mobility, and improved quality of life.4,8-10
Materials and Methods
Our Institutional Review Board approved this single-institution retrospective study. We used proprietary research software (Clinical Looking Glass) to identify eligible patients treated between 2000 and 2013. The software was used to search all radiology and pathology reports for the term tibia or any variation (eg, tibial) and metastasis or any variation (eg, metastatic). The software was then used to search by Current Procedural Terminology code for any patients treated with intramedullary nail (IMN) or another tibial fixation method. This list was cross-referenced with the list of patients originally identified to help ensure that all eligible patients were identified.
Inclusion criteria were known malignancy and imaging or biopsy evidence of a metastatic tibia lesion. Treatment strategies for patients with metastatic disease and patients with multiple myeloma are sometimes considered together because of similar goals and methodologies. We specifically excluded patients with multiple myeloma in order to more accurately characterize the natural history of metastatic disease and the timing of metastatic development and to report on a more homogeneous population. Patients were excluded if their electronic medical records were inadequate in establishing a diagnosis.
Demographic and pathology data were collected directly from the institutional electronic medical records system. Dr. Geller and Dr. Greenbaum used Centricity software (General Electric Healthcare) to review all imaging on medical diagnostic display monitors. If their interpretation differed from that in the radiology report, or if clarification was needed, the study was sent to Dr. Thornhill, the institution’s director of musculoskeletal radiology, for review and interpretation. Investigated radiographic characteristics included location, cortical breakthrough, presence of fracture, and size (if advanced imaging was available). Surgical interventions were recorded from reviews of operative reports and postoperative imaging studies.
Time to metastasis was defined as number of days from diagnosis of malignancy to diagnosis of tibial osseous spread. Date of diagnosis of malignancy was the date that a biopsy or other confirmatory test was performed. In cases in which that date was unavailable, an imaging study consistent with disease or a clinical note documenting the known diagnosis date was used instead. When only month and year (ie, not an exact date) of diagnosis were available, the 15th of the month was used as an estimate. Of the 36 patients, 4 had records insufficient for establishing date of diagnosis. The first date of any imaging study confirming (or suggestive of) a metastatic lesion of the tibia was used as the date of tibial metastasis.
Many patients had osseous lesions at sites other than the tibiae. These lesions were noted on review of imaging studies, screening examinations, and physicians’ clinical notes. Widespread disease was defined as including both axial and appendicular lesions, and lesions of the tibiae.
Tibia lesion presentation was recorded as either symptomatic or incidental. If the tibiae were imaged for pain, including posttraumatic pain, the presentation was symptomatic. If a lesion was identified on staging examination (eg, bone or positron emission tomography scan), or if the tibiae were imaged for another reason, the presentation was incidental.
Results
Demographics
Thirty-six patients had 43 affected tibiae. Sixteen male patients (44.4% of the total) had 19 (44.2%) of the affected tibiae, and 20 female patients (55.6%) had the other 24 affected tibiae (55.8%). Mean age was 63.5 years for all patients (range, 6-95 years), 68.1 years for males, and 59.8 years for females. Of the 36 patients, 32 (88.9%) were over age 40 years (Table). All patients had radiographic evidence of ≥1 tibia lesion, and 6 (16.7%) also had biopsy-proven metastatic disease of the tibia.
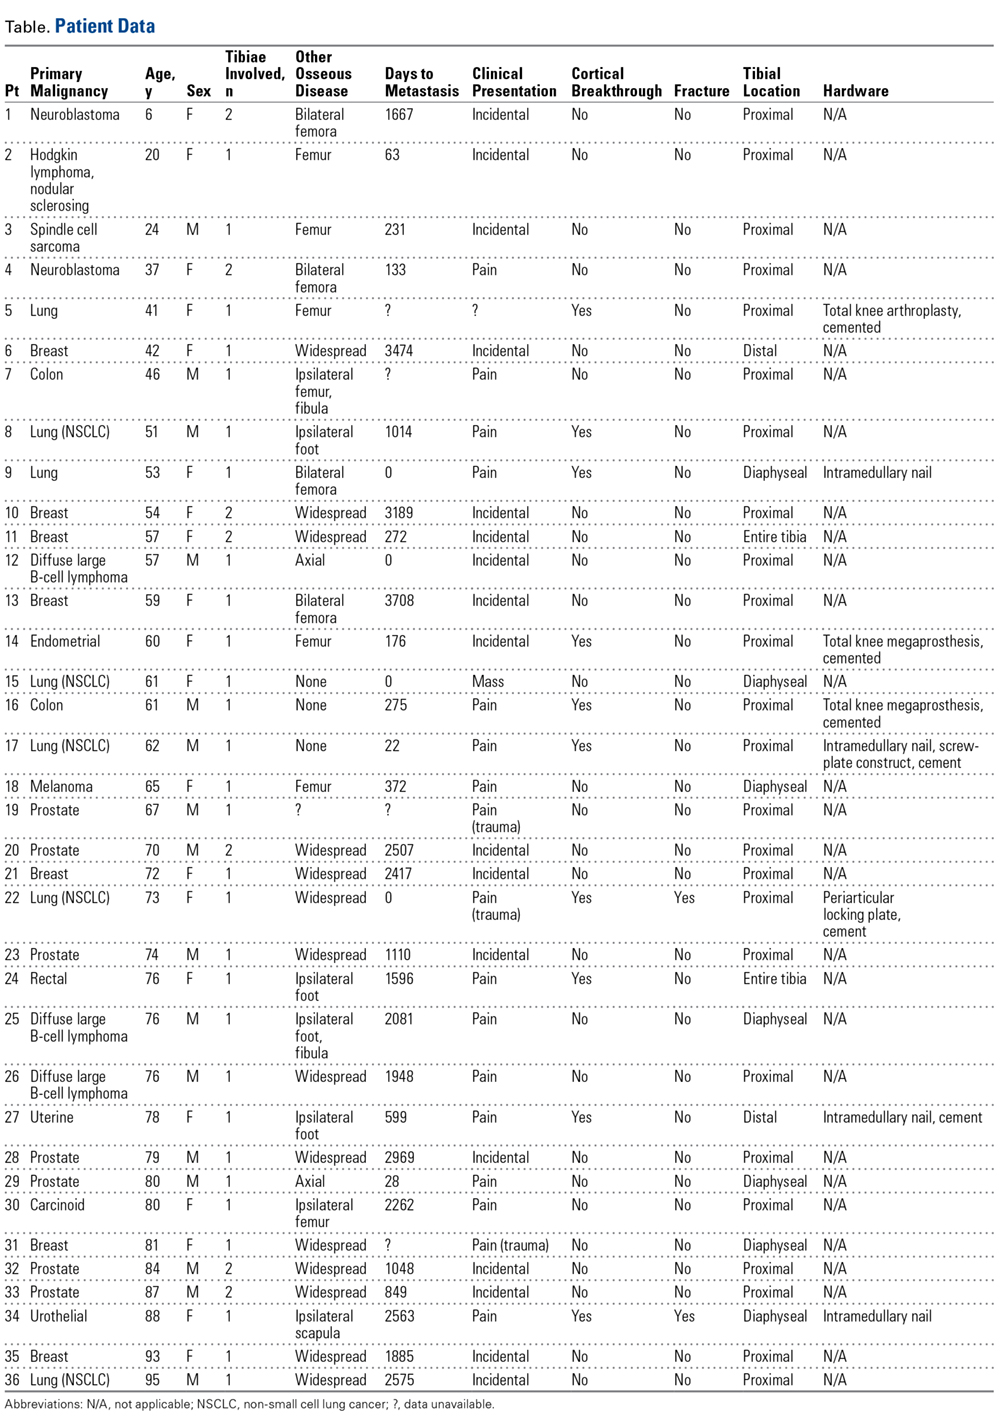
Tumor Characteristics
There were 12 different primary neoplasms (Table). The most common were prostate cancer (7 patients, 19.4%; 10 tibiae, 23.3%), breast cancer (7 patients, 19.4%; 9 tibiae, 20.9%), and lung cancer (7 patients, 19.4%; 7 tibiae, 16.3%). For males, the most common diagnoses were prostate cancer (7 cases, 43.8% of males) and diffuse large B-cell lymphoma and lung cancer (3 cases and 18.8% of males each). For females, the most common diagnoses were breast cancer (7 cases, 35.0% of females) and lung cancer (4 cases, 20.0% of females).
Most of the lesions were proximal (31 tibiae, 72.1%), followed by diaphyseal (7, 16.3%) and distal (2, 4.7%) (Table). Three tibiae (7.0%) were entirely involved, but 1 of these was more affected at the distal end. One tibia had 2 lesions, 1 proximal and 1 distal.
Time to Metastasis, Other Osseous Disease
Mean time from diagnosis of malignancy to diagnosis of osseous disease of the tibia was 1282 days (range, 0-3708 days) (Table). Of the 36 patients, 32 (88.9%) had other metastatic lesions, 3 (8.3%) had isolated tibia lesions, and 1 (2.8%) had a medical record insufficient for establishing lesion status (isolated or not). Of the 32 patients with known other osseous metastases, 14 (43.8%) had widespread (axial and additional appendicular) disease, and 3 (9.4%) had additional lesions only distal to the identified tibial metastases.
Clinical Presentation
Of the 36 lesions, 18 (50%) were asymptomatic and were found on screening examinations, 17 (47.2%) presented with pain, and 1 (2.8%) had a presentation that could not be determined from the medical record (Table). Of the 17 painful lesions, 3 (17.6%) were found after a trauma brought attention to the site, and the other 14 (82.4%) were atraumatic in origin.
Of the 10 patients with cortical breakthrough, 8 (80%) had painful lesions, 1 (10%) had a lesion that was found on screening examination, and 1 (10%) had a medical record insufficient for establishing clinical presentation. Of the 8 patients who underwent surgical stabilization, 6 (75%) had painful lesions. Only 1 patient with an asymptomatic tibia lesion underwent surgical intervention (total knee arthroplasty).
Surgical Intervention
Two patients (5.6%) with affected tibiae (4.8%) had pathologic fractures. One fracture (non-small cell lung cancer) was treated with open reduction and internal fixation (periarticular locking plate with cement augmentation), and the other (urothelial cancer) was treated with IMN fixation.
Ten patients (27.8%) with affected tibiae (23.8%) had radiographs that showed cortical breakthrough (Table). Two of the 10 cases were managed nonoperatively, and the patients died before surgical stabilization could be attempted. Of the 8 surgically managed cases, 3 were prophylactically stabilized with IMN (2 of these were augmented with cement, and the third with a screw-plate construct), 2 were treated with periarticular resection and reconstruction (total knee megaprosthesis), 1 was treated with an approach undertaken to address a concomitant distal femoral pathologic fracture, and 1 was treated with total knee arthroplasty undertaken to address lesions at the proximal end of the tibia and the distal end of the femur.
Discussion
We have described a retrospective descriptive study conducted to characterize tibial metastases, their histologies, and the circumstances surrounding diagnosis and surgical management. In all cases, general findings confirmed advanced metastatic disease. In only 3 cases, the tibia lesion was an isolated metastatic lesion.
Sex predilection of tibial metastases remains controversial. One study found males had up to twice as many hand and foot metastases as women,11 but this contrasts with the relatively equal sex ratio found in other studies8,10 and in the present study. We found metastatic disease of the tibia was unsurprisingly concentrated in patients over age 40 years, in whom the vast majority of all cancers develop.12,13 Our study agrees with those that have found most tibia lesions develop in patients in the 6th decade of life on average.8,10 Mean age was 8.3 years higher in our male patients than in our female patients.
Tumor Characteristics
The most common primary neoplasms in our cohort were prostate, breast, and lung cancers, which are among the most common cancers in the United States12,13 and which have a predilection for osseous spread.2,6,9,14 Renal cell carcinoma has been reported to spread to distal (or “acral”) skeletal sites,2-4,9,11,14 but the present study did not identify any patients with this diagnosis. Of our patients with a primary lung cancer for whom a histologic description was available (5/7), all had non-small cell lung cancer. Three patients had a primary malignancy of colorectal cancer, which occasionally metastasizes to the distal skeleton.3,8,11 We identified 3 patients with diffuse large B-cell lymphoma, a histology not widely reported to metastasize to distal skeletal sites.
Metastatic disease of the tibia is most common at the proximal end of the bone.1,10,11,14 Other studies8,10 have found the proximal tibia is affected much more commonly than the tibial diaphysis, and even fewer cases develop at the distal end. Our findings agree with theirs: Proximal lesions outnumber all other lesions combined (Table).
Time to Metastasis
Distal metastases are typical of late-stage metastatic disease,1,3 but quantification of the time from diagnosis of malignancy to presentation of a tibia lesion is not well defined. In our study, time to metastasis was <100 days for some patients (Table). As osseous involvement, especially acral disease, was considered a late-stage manifestation of malignancy, this result was unexpected and most likely represents undiagnosed and untreated malignancy. Six patients in this group were diagnosed with tibial metastases within 30 days, essentially at the same time the primary neoplasm was diagnosed. These findings suggest that a tibia lesion found at time of patient presentation should raise concern for late-stage undiagnosed metastatic cancer.
Other Osseous Disease
The patients identified in this study had advanced malignancy, and most had widespread bony dissemination. Those with the lowest disease burden had isolated tibia lesions or additional metastases only distal to the tibia lesion in the ipsilateral lower extremity. Most of these patients had undergone surgery or were scheduled for it (Table). Most of the patients with appendicular metastases proximal to the tibia lesion had disease of the femora, the most common long bones affected by osseous metastatic disease.5,6 In accordance with orthopedic oncology principles, all other osseous disease should be thoroughly identified and staged before any surgical planning for identified tibia lesions. Ipsilateral distal femoral lesions are of particular importance for patients with proximal tibia lesions, as reconstruction with total knee endoprosthesis can potentially provide a functional reconstructive option after resection of both lesions.
Clinical Presentation
Most of the patients who had cortical breakthrough or required surgical stabilization had painful lesions. Although tibial metastasis is rare, its potential occurrence should raise concerns and be investigated in the patient with tibial pain.
Surgical Intervention
General surgical management of metastatic disease of other long bones has been extensively studied,6,7,9,14 but there are fewer published recommendations regarding specific treatments for metastatic lesions of the tibia. In 2003, Kelly and colleagues8 described an algorithm based on the anatomical location of the lesion, with either internal fixation or IMN fixation representing the preferred management for lesions in the metaphyseal or diaphyseal regions. For epiphyseal or extensive proximal metaphyseal lesions, modular oncology endoprostheses are described as the procedure of choice. Piccioli and colleagues10 in 2013 and Beauchamp and Sim1 in 1988 described a similar operative approach.
It is unknown if the algorithm of Kelly and colleagues8 was referenced during clinical decision-making, but it appears operative management mirrored these principles. Deviations from this general approach in the operative management of the patients in the present study included modifications such as the addition of a screw-plate construct to an IMN for better stability.
Surgical management depends largely on the anatomical location within the bone and on remaining bone stock. Generally, extensive proximal disease is managed with total knee endoprosthesis reconstruction, diaphyseal disease with IMN, and distal disease with internal fixation. Construct augmentation, such as the addition of cement or use of additional hardware, is decided case by case on the basis of desired stability and surrounding bone stock.
Study Limitations
Despite being a larger series, this single-institution study had a relatively small sample size, and its patient demographics and primary malignancies may reflect institutional recruitment bias. In addition, the study was limited by its retrospective design and some incomplete medical records. Eleven patients had only a bone or positron emission tomography scan depicting metastatic disease, limiting characterization of these lesions. One patient lacked radiologic images, and characterizations were based on written reports. As multiple physicians were involved in diagnosis and treatment, there were many inconsistencies in clinical decision-making across the group.
Conclusion
Metastasis to the tibia is a rare but significant event in a subset of patients over the course of their treatment and surveillance. Patients may present with pain secondary to either pathologic or impending pathologic fractures, and in such instances surgical intervention is often needed. Despite the historical reports of “acral” histologies, tibia lesions are not indicative of histology, and biopsy should be considered, especially if management will depend on histology. Patients with lower leg pain and known malignancy should be evaluated to rule out tibial metastasis, but screening examinations may be prudent for asymptomatic patients as well. Increased vigilance may be indicated for those with prostate, breast, or lung cancer. These lesions should be surgically managed case by case using fundamental tenets of both orthopedic fracture care and orthopedic oncology. Ideally, patients should be treated by a multidisciplinary team using a patient-centered approach.
1. Beauchamp CP, Sim FH. Lesions of the tibia. In: Sim FH, ed. Diagnosis and Management of Metastatic Bone Disease: A Multidisciplinary Approach. New York, NY: Raven; 1988:201-212.
2. Coleman RE. Clinical features of metastatic bone disease and risk of skeletal morbidity. Clin Cancer Res. 2006;12(20 pt 2):6243s-6249s.
3. Healy JH, Turnbull AD, Miedema B, Lane JM. Acrometastases. A study of twenty-nine patients with osseous involvement of the hands and feet. J Bone Joint Surg Am. 1986;68(5):743-746.
4. Leeson MC, Makley JT, Carter JR. Metastatic skeletal disease distal to the elbow and knee. Clin Orthop Relat Res. 1986;(206):94-99.
5. De Geeter K, Reynders P, Samson I, Broos PL. Metastatic fractures of the tibia. Acta Orthop Belg. 2001;67(1):54-59.
6. Kelly M, Lee M, Clarkson P, O’Brien PJ. Metastatic disease of the long bones: a review of the health care burden in a major trauma centre. Can J Surg. 2012;55(2):95-98.
7. Jasmin C. Textbook of Bone Metastases. Chichester, England: Wiley; 2005.
8. Kelly CM, Wilkins RM, Eckardt JJ, Ward WG. Treatment of metastatic disease of the tibia. Clin Orthop Relat Res. 2003;(415 suppl):S219-S229.
9. Nielsen OS, Munro AJ, Tannock IF. Bone metastases: pathophysiology and management policy. J Clin Oncol. 1991;9(3):509-524.
10. Piccioli A, Maccauro G, Scaramuzzo L, Graci C, Spinelli MS. Surgical treatment of impending and pathological fractures of tibia. Injury. 2013;44(8):1092-1096.
11. Flynn CJ, Danjoux C, Wong J, et al. Two cases of acrometastasis to the hands and review of the literature. Curr Oncol. 2008;15(5):51-58.
12. American Cancer Society. Cancer Facts and Figures 2013. Atlanta, GA: American Cancer Society; 2013.
13. Siegel R, Naishadham D, Jemal A. Cancer statistics, 2013. CA Cancer J Clin. 2013;63(1):11-30.
14. Capanna R, Campanacci DA. The treatment of metastases in the appendicular skeleton. J Bone Joint Surg Br. 2001;83(4):471-481.
Take-Home Points
- Metastatic disease of the tibia is a rare but significant event in a subset of patients.
- Cancer histologies with historically “acral” spread may not apply to tibial disease.
- Patients with leg pain and any cancer diagnosis should be worked up for tibial metastases.
- Tibial disease is probably a late manifestation, and early detection may indicate late diagnosis of malignancy.
- The ultimate surgical plan for these patients should be a patient-centered multidisciplinary decision making process.
Metastatic dissemination to bones is common in advanced cancer stages and affects the axial and appendicular skeleton.1-4 The appendicular skeleton bones most often involved are the proximal femur and the proximal humerus.5,6 The tibia is involved third most often but is comparatively rarely affected.4-6 Metastatic involvement distal to the knee or elbow is more typical of advanced disease.1,3 Distal appendicular lesions are called acral metastases, but the term is inconsistently used and may refer to lesions either distal to the knee and elbow or distal to the ankle and wrist. Regardless of terminology, tibia lesions are uncommon and not well described.1,4,7,8
The tibia is the primary weight-bearing leg bone. Metastatic tibia lesions may cause pain and instability and impair mobility. Although distal skeletal dissemination often presents late in advanced disease in patients with relatively poor prognoses, in some cases early surgical intervention is indicated for pain relief, increased mobility, and improved quality of life.4,8-10
Materials and Methods
Our Institutional Review Board approved this single-institution retrospective study. We used proprietary research software (Clinical Looking Glass) to identify eligible patients treated between 2000 and 2013. The software was used to search all radiology and pathology reports for the term tibia or any variation (eg, tibial) and metastasis or any variation (eg, metastatic). The software was then used to search by Current Procedural Terminology code for any patients treated with intramedullary nail (IMN) or another tibial fixation method. This list was cross-referenced with the list of patients originally identified to help ensure that all eligible patients were identified.
Inclusion criteria were known malignancy and imaging or biopsy evidence of a metastatic tibia lesion. Treatment strategies for patients with metastatic disease and patients with multiple myeloma are sometimes considered together because of similar goals and methodologies. We specifically excluded patients with multiple myeloma in order to more accurately characterize the natural history of metastatic disease and the timing of metastatic development and to report on a more homogeneous population. Patients were excluded if their electronic medical records were inadequate in establishing a diagnosis.
Demographic and pathology data were collected directly from the institutional electronic medical records system. Dr. Geller and Dr. Greenbaum used Centricity software (General Electric Healthcare) to review all imaging on medical diagnostic display monitors. If their interpretation differed from that in the radiology report, or if clarification was needed, the study was sent to Dr. Thornhill, the institution’s director of musculoskeletal radiology, for review and interpretation. Investigated radiographic characteristics included location, cortical breakthrough, presence of fracture, and size (if advanced imaging was available). Surgical interventions were recorded from reviews of operative reports and postoperative imaging studies.
Time to metastasis was defined as number of days from diagnosis of malignancy to diagnosis of tibial osseous spread. Date of diagnosis of malignancy was the date that a biopsy or other confirmatory test was performed. In cases in which that date was unavailable, an imaging study consistent with disease or a clinical note documenting the known diagnosis date was used instead. When only month and year (ie, not an exact date) of diagnosis were available, the 15th of the month was used as an estimate. Of the 36 patients, 4 had records insufficient for establishing date of diagnosis. The first date of any imaging study confirming (or suggestive of) a metastatic lesion of the tibia was used as the date of tibial metastasis.
Many patients had osseous lesions at sites other than the tibiae. These lesions were noted on review of imaging studies, screening examinations, and physicians’ clinical notes. Widespread disease was defined as including both axial and appendicular lesions, and lesions of the tibiae.
Tibia lesion presentation was recorded as either symptomatic or incidental. If the tibiae were imaged for pain, including posttraumatic pain, the presentation was symptomatic. If a lesion was identified on staging examination (eg, bone or positron emission tomography scan), or if the tibiae were imaged for another reason, the presentation was incidental.
Results
Demographics
Thirty-six patients had 43 affected tibiae. Sixteen male patients (44.4% of the total) had 19 (44.2%) of the affected tibiae, and 20 female patients (55.6%) had the other 24 affected tibiae (55.8%). Mean age was 63.5 years for all patients (range, 6-95 years), 68.1 years for males, and 59.8 years for females. Of the 36 patients, 32 (88.9%) were over age 40 years (Table). All patients had radiographic evidence of ≥1 tibia lesion, and 6 (16.7%) also had biopsy-proven metastatic disease of the tibia.
Tumor Characteristics
There were 12 different primary neoplasms (Table). The most common were prostate cancer (7 patients, 19.4%; 10 tibiae, 23.3%), breast cancer (7 patients, 19.4%; 9 tibiae, 20.9%), and lung cancer (7 patients, 19.4%; 7 tibiae, 16.3%). For males, the most common diagnoses were prostate cancer (7 cases, 43.8% of males) and diffuse large B-cell lymphoma and lung cancer (3 cases and 18.8% of males each). For females, the most common diagnoses were breast cancer (7 cases, 35.0% of females) and lung cancer (4 cases, 20.0% of females).
Most of the lesions were proximal (31 tibiae, 72.1%), followed by diaphyseal (7, 16.3%) and distal (2, 4.7%) (Table). Three tibiae (7.0%) were entirely involved, but 1 of these was more affected at the distal end. One tibia had 2 lesions, 1 proximal and 1 distal.
Time to Metastasis, Other Osseous Disease
Mean time from diagnosis of malignancy to diagnosis of osseous disease of the tibia was 1282 days (range, 0-3708 days) (Table). Of the 36 patients, 32 (88.9%) had other metastatic lesions, 3 (8.3%) had isolated tibia lesions, and 1 (2.8%) had a medical record insufficient for establishing lesion status (isolated or not). Of the 32 patients with known other osseous metastases, 14 (43.8%) had widespread (axial and additional appendicular) disease, and 3 (9.4%) had additional lesions only distal to the identified tibial metastases.
Clinical Presentation
Of the 36 lesions, 18 (50%) were asymptomatic and were found on screening examinations, 17 (47.2%) presented with pain, and 1 (2.8%) had a presentation that could not be determined from the medical record (Table). Of the 17 painful lesions, 3 (17.6%) were found after a trauma brought attention to the site, and the other 14 (82.4%) were atraumatic in origin.
Of the 10 patients with cortical breakthrough, 8 (80%) had painful lesions, 1 (10%) had a lesion that was found on screening examination, and 1 (10%) had a medical record insufficient for establishing clinical presentation. Of the 8 patients who underwent surgical stabilization, 6 (75%) had painful lesions. Only 1 patient with an asymptomatic tibia lesion underwent surgical intervention (total knee arthroplasty).
Surgical Intervention
Two patients (5.6%) with affected tibiae (4.8%) had pathologic fractures. One fracture (non-small cell lung cancer) was treated with open reduction and internal fixation (periarticular locking plate with cement augmentation), and the other (urothelial cancer) was treated with IMN fixation.
Ten patients (27.8%) with affected tibiae (23.8%) had radiographs that showed cortical breakthrough (Table). Two of the 10 cases were managed nonoperatively, and the patients died before surgical stabilization could be attempted. Of the 8 surgically managed cases, 3 were prophylactically stabilized with IMN (2 of these were augmented with cement, and the third with a screw-plate construct), 2 were treated with periarticular resection and reconstruction (total knee megaprosthesis), 1 was treated with an approach undertaken to address a concomitant distal femoral pathologic fracture, and 1 was treated with total knee arthroplasty undertaken to address lesions at the proximal end of the tibia and the distal end of the femur.
Discussion
We have described a retrospective descriptive study conducted to characterize tibial metastases, their histologies, and the circumstances surrounding diagnosis and surgical management. In all cases, general findings confirmed advanced metastatic disease. In only 3 cases, the tibia lesion was an isolated metastatic lesion.
Sex predilection of tibial metastases remains controversial. One study found males had up to twice as many hand and foot metastases as women,11 but this contrasts with the relatively equal sex ratio found in other studies8,10 and in the present study. We found metastatic disease of the tibia was unsurprisingly concentrated in patients over age 40 years, in whom the vast majority of all cancers develop.12,13 Our study agrees with those that have found most tibia lesions develop in patients in the 6th decade of life on average.8,10 Mean age was 8.3 years higher in our male patients than in our female patients.
Tumor Characteristics
The most common primary neoplasms in our cohort were prostate, breast, and lung cancers, which are among the most common cancers in the United States12,13 and which have a predilection for osseous spread.2,6,9,14 Renal cell carcinoma has been reported to spread to distal (or “acral”) skeletal sites,2-4,9,11,14 but the present study did not identify any patients with this diagnosis. Of our patients with a primary lung cancer for whom a histologic description was available (5/7), all had non-small cell lung cancer. Three patients had a primary malignancy of colorectal cancer, which occasionally metastasizes to the distal skeleton.3,8,11 We identified 3 patients with diffuse large B-cell lymphoma, a histology not widely reported to metastasize to distal skeletal sites.
Metastatic disease of the tibia is most common at the proximal end of the bone.1,10,11,14 Other studies8,10 have found the proximal tibia is affected much more commonly than the tibial diaphysis, and even fewer cases develop at the distal end. Our findings agree with theirs: Proximal lesions outnumber all other lesions combined (Table).
Time to Metastasis
Distal metastases are typical of late-stage metastatic disease,1,3 but quantification of the time from diagnosis of malignancy to presentation of a tibia lesion is not well defined. In our study, time to metastasis was <100 days for some patients (Table). As osseous involvement, especially acral disease, was considered a late-stage manifestation of malignancy, this result was unexpected and most likely represents undiagnosed and untreated malignancy. Six patients in this group were diagnosed with tibial metastases within 30 days, essentially at the same time the primary neoplasm was diagnosed. These findings suggest that a tibia lesion found at time of patient presentation should raise concern for late-stage undiagnosed metastatic cancer.
Other Osseous Disease
The patients identified in this study had advanced malignancy, and most had widespread bony dissemination. Those with the lowest disease burden had isolated tibia lesions or additional metastases only distal to the tibia lesion in the ipsilateral lower extremity. Most of these patients had undergone surgery or were scheduled for it (Table). Most of the patients with appendicular metastases proximal to the tibia lesion had disease of the femora, the most common long bones affected by osseous metastatic disease.5,6 In accordance with orthopedic oncology principles, all other osseous disease should be thoroughly identified and staged before any surgical planning for identified tibia lesions. Ipsilateral distal femoral lesions are of particular importance for patients with proximal tibia lesions, as reconstruction with total knee endoprosthesis can potentially provide a functional reconstructive option after resection of both lesions.
Clinical Presentation
Most of the patients who had cortical breakthrough or required surgical stabilization had painful lesions. Although tibial metastasis is rare, its potential occurrence should raise concerns and be investigated in the patient with tibial pain.
Surgical Intervention
General surgical management of metastatic disease of other long bones has been extensively studied,6,7,9,14 but there are fewer published recommendations regarding specific treatments for metastatic lesions of the tibia. In 2003, Kelly and colleagues8 described an algorithm based on the anatomical location of the lesion, with either internal fixation or IMN fixation representing the preferred management for lesions in the metaphyseal or diaphyseal regions. For epiphyseal or extensive proximal metaphyseal lesions, modular oncology endoprostheses are described as the procedure of choice. Piccioli and colleagues10 in 2013 and Beauchamp and Sim1 in 1988 described a similar operative approach.
It is unknown if the algorithm of Kelly and colleagues8 was referenced during clinical decision-making, but it appears operative management mirrored these principles. Deviations from this general approach in the operative management of the patients in the present study included modifications such as the addition of a screw-plate construct to an IMN for better stability.
Surgical management depends largely on the anatomical location within the bone and on remaining bone stock. Generally, extensive proximal disease is managed with total knee endoprosthesis reconstruction, diaphyseal disease with IMN, and distal disease with internal fixation. Construct augmentation, such as the addition of cement or use of additional hardware, is decided case by case on the basis of desired stability and surrounding bone stock.
Study Limitations
Despite being a larger series, this single-institution study had a relatively small sample size, and its patient demographics and primary malignancies may reflect institutional recruitment bias. In addition, the study was limited by its retrospective design and some incomplete medical records. Eleven patients had only a bone or positron emission tomography scan depicting metastatic disease, limiting characterization of these lesions. One patient lacked radiologic images, and characterizations were based on written reports. As multiple physicians were involved in diagnosis and treatment, there were many inconsistencies in clinical decision-making across the group.
Conclusion
Metastasis to the tibia is a rare but significant event in a subset of patients over the course of their treatment and surveillance. Patients may present with pain secondary to either pathologic or impending pathologic fractures, and in such instances surgical intervention is often needed. Despite the historical reports of “acral” histologies, tibia lesions are not indicative of histology, and biopsy should be considered, especially if management will depend on histology. Patients with lower leg pain and known malignancy should be evaluated to rule out tibial metastasis, but screening examinations may be prudent for asymptomatic patients as well. Increased vigilance may be indicated for those with prostate, breast, or lung cancer. These lesions should be surgically managed case by case using fundamental tenets of both orthopedic fracture care and orthopedic oncology. Ideally, patients should be treated by a multidisciplinary team using a patient-centered approach.
1. Beauchamp CP, Sim FH. Lesions of the tibia. In: Sim FH, ed. Diagnosis and Management of Metastatic Bone Disease: A Multidisciplinary Approach. New York, NY: Raven; 1988:201-212.
2. Coleman RE. Clinical features of metastatic bone disease and risk of skeletal morbidity. Clin Cancer Res. 2006;12(20 pt 2):6243s-6249s.
3. Healy JH, Turnbull AD, Miedema B, Lane JM. Acrometastases. A study of twenty-nine patients with osseous involvement of the hands and feet. J Bone Joint Surg Am. 1986;68(5):743-746.
4. Leeson MC, Makley JT, Carter JR. Metastatic skeletal disease distal to the elbow and knee. Clin Orthop Relat Res. 1986;(206):94-99.
5. De Geeter K, Reynders P, Samson I, Broos PL. Metastatic fractures of the tibia. Acta Orthop Belg. 2001;67(1):54-59.
6. Kelly M, Lee M, Clarkson P, O’Brien PJ. Metastatic disease of the long bones: a review of the health care burden in a major trauma centre. Can J Surg. 2012;55(2):95-98.
7. Jasmin C. Textbook of Bone Metastases. Chichester, England: Wiley; 2005.
8. Kelly CM, Wilkins RM, Eckardt JJ, Ward WG. Treatment of metastatic disease of the tibia. Clin Orthop Relat Res. 2003;(415 suppl):S219-S229.
9. Nielsen OS, Munro AJ, Tannock IF. Bone metastases: pathophysiology and management policy. J Clin Oncol. 1991;9(3):509-524.
10. Piccioli A, Maccauro G, Scaramuzzo L, Graci C, Spinelli MS. Surgical treatment of impending and pathological fractures of tibia. Injury. 2013;44(8):1092-1096.
11. Flynn CJ, Danjoux C, Wong J, et al. Two cases of acrometastasis to the hands and review of the literature. Curr Oncol. 2008;15(5):51-58.
12. American Cancer Society. Cancer Facts and Figures 2013. Atlanta, GA: American Cancer Society; 2013.
13. Siegel R, Naishadham D, Jemal A. Cancer statistics, 2013. CA Cancer J Clin. 2013;63(1):11-30.
14. Capanna R, Campanacci DA. The treatment of metastases in the appendicular skeleton. J Bone Joint Surg Br. 2001;83(4):471-481.
Lumbar Microlaminectomy vs Traditional Laminectomy
Lumbar spinal stenosis (LSS) is a common debilitating issue in older patients. Open laminectomies traditionally are the standard treatment for LSS; however, minimally invasive surgery (MIS) has recently become a popular option to facilitate recovery and improve efficiency of care regarding spine procedures.
Guiot and colleagues described the technique for an MIS decompressive lumbar laminectomy procedure.1 The surgery may represent an important strategy to improve the efficiency of care for patients with severe LSS. Several authors have reported clinical benefits with the MIS lumbar laminectomy, leading to a significant improvement in the Oswetry Disability Index (ODI) 25 in the degenerative stenosis group in cases of LSS.2-5 In a recent reviewof 13 studies Wong and colleagues concluded that the MIS laminectomy was efficacious in terms of symptomatic relief and patient satisfaction for patients with LSS.6 Further, Rosen and colleaguesfound a significant improvement in the ODI scores and in the Short Form-36 body pain and physical functions scores in patients aged ≥ 75 years.7
Perioperative measures, including blood loss and narcotic consumption, have been shown to significantly decrease with MIS surgery compared with open decompression.8,9 Decreased narcotic use is of particular interest for the geriatric population because it is expected to allow those patients to remain more physically active and mentally agile.10
Also, long-term success is important when assessing the efficacy of new MIS procedures. Oertel and colleagues found that 85% of patients reported long-term success after unilateral laminotomy of bilateral decompression (ULBD).11 These results indicate that a MIS laminectomy is effective in older patients with LSS and neurogenic claudication.
Although there are numerous MIS approaches to alleviating LSS, more research is needed to determine whether it is superior to the open laminectomy.9,12,13 Skovrliand and colleagues reviewed publications comparing ULBD and open laminectomies and determined that currently insufficient evidence exists to define which technique leads to more positive outcomes.14 Thus, the purpose of this study is 2-fold. First, this study adds to the current research by comparing estimated blood loss and length of stay (LOS) for microscopic MIS laminectomy vs traditional laminectomy. Second, this study aims to address the difference in health care costs between the 2 types of surgery in the VHA.
The U.S. health care system is facing several challenges and in particular pressure for cost reduction.15 VA hospitals are not exempt from those challenges, and their operating budgets are influenced by political and economic factors.16 Because of those challenges, cost-effectiveness is gaining importance.7 Future decisions for procedure coverage and reimbursement rates are likely to consider ratios like the cost to quality-adjusted life-years (QALY). Improving this ratio requires a reduction of cost and/or an improvement in outcome.
Minimally invasive spine surgery (MISS) may lower the cost of spine procedures. Wang and colleagues reported that minimally invasive posterior lumbar interbody fusion (PLIF) led to shorter stay and lower blood loss compared with traditional PLIF.17 These improvements led to about $8,000 in savings for a single-level PLIF.17
Lumbar degenerative disease is a frequently encountered condition, and lumbar laminectomy is one of the most frequently performed spine procedures at VA hospitals. Consequently, MISS may be an important strategy for the VA to face systematic challenges. At the Southern Arizona VA Health Care System (SAVAHCS) in Tucson, the authors converted lumbar laminectomies from traditional open surgery to a MIS procedure using a tubular retractor system and a paramedian approach. To the authors’ knowledge, no studies have evaluated outcomes and cost efficiency of MIS surgery at the VA. The results of such a study may be instrumental in choosing which surgery is appropriate in a patient-centered health care model.
Material and Methods
Fifty veterans with severe lumbar stenosis and neurogenic claudication underwent a 1- or 2-level laminectomy at SAVAHCS (Table). A traditional laminectomy was performed for all patients until conversion to the MIS procedure, then all subsequent patients underwent the microlaminectomy. There was 1 female patient in each group. The preoperative magnetic resonance imaging (MRI) of the patients showed severe spinal canal stenosis defined radiographically by the absence of cerebrospinal fluid signal at the affected level on MRI (Figures 1A and 2A) and clinically by the presence of neurogenic claudication. 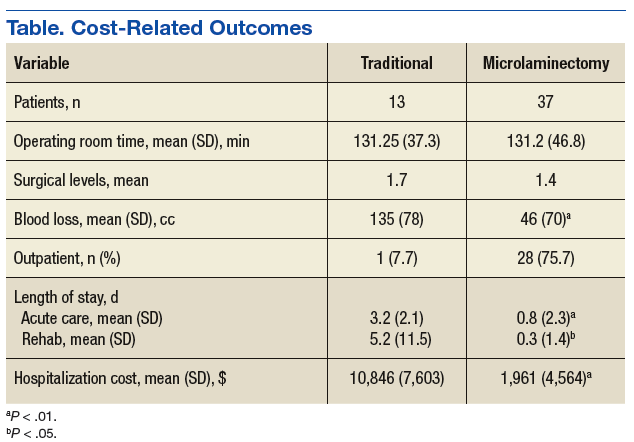
Procedure
The open laminectomies were performed in a traditional midline approach with removal of the spinous process along with the lamina bilaterally to provide spinal canal decompression (Figure 2). 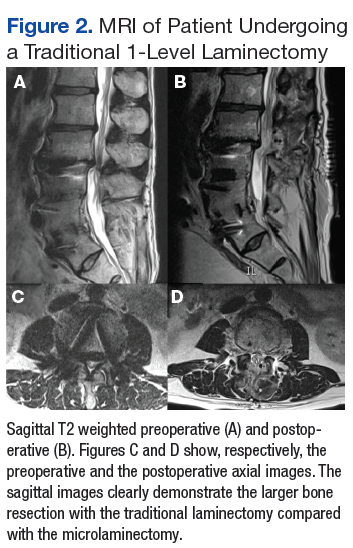
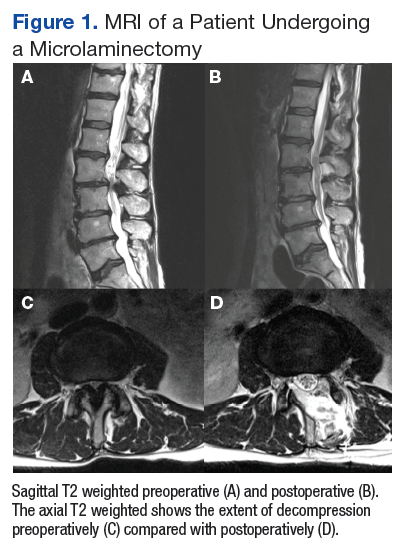
The patients were given the choice of going home or being admitted. Overall admission costs were determined by the VA hospital following described models.18 The LOS in rehabilitation were determined from the records of the SAVAHCS rehabilitation center.
Results
There was not a significant difference in age between the 2 groups; mean age was 69.7 ± 9.8 years for the traditional laminectomy group and 64.4 ± 8.3 years for the MIS group. Operating room time was just over 2 hours on average in both groups. Blood loss was estimated and reported by the surgeon and the anesthesiologist, based on values from the surgical suction system. Patients in the MIS group lost on average 46 cc ± 70 cc compared with 135 cc ± 78 cc in the traditional group. The average number of operated levels was higher in the traditional group (1.7 ± 0.5) compared with the MIS group (1.4 ± 0.5), but this difference did not reach significance (P > .05).
Length of Stay and Cost
The LOS was lower for the MIS group, and 76% chose to be discharged from the recovery room. After a traditional laminectomy, the average patient’s stay was 3 days in the hospital and 5 days in the rehabilitation center. The average MIS group patient stayed < 1 day in the hospital. There were no readmissions within 30 days and no severe morbidity (including no new neurologic deficits or death) in the MIS cohort.
Only 1 MIS patient needed transfer to the rehabilitation center. The estimated cost of care (hospital and rehabilitation) for the traditional group was $10,846 compared with $1,961 for the MIS group.
Discussion
In the authors’ experience, the use of MISS microlaminectomy for the treatment of LSS seems to have led to shorter hospital stays and faster recoveries. Some of the possible reasons for faster patient mobilization included a reduction in postoperative pain and the absence of a wound drain. Larger dissections with a traditional laminectomy often lead to the placement of a wound drain, which requires an inpatient stay until the wound output reaches a certain threshold. The absence of a drain and the reduction in pain with the MISS approach allowed the providers to focus on early ambulation and discharge planning. The microlaminectomy technique allowed for a proper surgical decompression with less tissue dissection than is required for a traditional laminectomy. Previous studies have shown that the microlaminectomy technique provides significant symptomatic relief.5-7,17
In most cases, the microlaminectomy can be performed on an outpatient basis. The improvement in bed availability is particularly important as surgical procedures may be delayed when hospitals operate at full capacity. Redesigning a procedure typically requiring hospital admission into an outpatient procedure improves availability, allowing for better patient access to health care.19
Other authors have studied opportunities to transform inpatient neurosurgical care into outpatient procedures. For instance, Purzner and colleagues presented a large series of successful outpatient neurosurgical cases, including craniotomies, cervical fusions, and lumbar microdiscectomies.20 The MISS techniques offer a critical option to facilitate postoperative recovery and improve efficiency of care in regards to spine procedures.5,17
Cost-Effectiveness Within the VHA
The VA has been described as one of the best health care systems in the U.S.9 The arguments in favor of the VA system include its integrated computerized system and its resistance to health care cost inflation over the years.21 The $186.5 billion 2018 fiscal year VA budget is surpassed only by the total DoD budget, and it is expected to rise substantially in the near future.22
Redesigning a procedure typically requiring hospital admission into an outpatient procedure improves bed availability and reduces cost.19 The authors have demonstrated that a minimally invasive unilateral paramedian approach for the treatment of lumbar stenosis leads to shorter hospital stay, improved bed availability, and lower cost while allowing for a proper surgical decompression. These clinical results are in accord with previous MIS surgery studies.5,17 The improvement in bed availability is particularly important within the VA system. Elective surgeries occasionally are delayed or cancelled because hospitals operate at full capacity. However, the authors’ outpatient microlaminectomy patients avoid delays or cancellations.
Given that both laminectomy procedures use similar operating room resources (time and material), the lower LOS associated with the microlaminectomy translates in cost saving. At SAVAHCS, acute care hospitalization is estimated at $3,000 per day when accounting for various costs, including nursing, pharmacy, ancillary services, and maintenance. The MIS procedure costs about $9,000 less than the open surgery. Over a 2-year period with 37 MIS patients, SAVAHCS saved about $300,000.
Patient Satisfaction
Patient satisfaction was assessed 1 day after the lumbar microdecompression outpatient surgery. Patients were asked to rate their overall surgical experience on a scale of 1 (worst) to 10 (best). All 24 patients who were contacted following outpatient lumbar microdecompression surgery rated the experience 10. These results indicate that patients do not expect or desire an admission following lumbar surgery, and they may recover comfortably at home. Studies are needed to compare outpatient and inpatient satisfaction ratings.
Conclusion
In this small sample, lumbar microlaminectomy significantly reduced LOS, successfully decompressed the spinal canal, and achieved symptomatic relief. Also, the procedure is associated with a lower blood loss than a traditional laminectomy and may reduce the rate of perioperative morbidity over time. In addition to faster recovery, the reduction in LOS can improve access to care by increasing the availability to inpatient admission.
1. Guiot BH, Khoo LT, Fessler RG. A minimally invasive technique for decompression of the lumbar spine. Spine (Phila PA 1976). 2002;27(4):432-438.
2. Rahman M, Summers LE, Richter B, Mimran RI, Jacob RP. Comparison of techniques for decompressive lumbar laminectomy: the minimally invasive versus the “classic” open approach. Minim Invasive Neurosurg. 2008;51(2)100-105.
3. Sasai K, Umeda M, Maruyama T, Wakabayashi E, Iida H. Microsurgical bilateral decompression via a unilateral approach for lumbar spinal canal stenosis including degenerative spondylolisthesis. J Neurosurg Spine. 2008;9(6):554-559.
4. Pao JL, Chen WC, Chen PQ. Clinical outcomes of microendoscopic decompressive laminotomy for degenerative lumbar spinal stenosis. Eur Spine J. 2009;18(5):672-678.
5. Yagi M, Okada, E, Ninomiya K, Kihara M. Postoperative outcome after modified unilateral-approach microendoscopic midline decompression for degenerative spinal stenosis. J Neurosurg Spine. 2009;10(4):293-299.
6. Wong AP, Smith ZA, Lall RR, Bresnahan LE, Fessler RG. The microendoscopic decompression of lumbar stenosis: a review of the current literature and clinical results. Minim Invasive Surg. 2012;2012:325095.
7. Rosen DS, O’Toole JE, Eichholz KM, et al. Minimally invasive lumbar spinal decompression in the elderly: outcomes of 50 patients aged 75 years and older. Neurosurgery. 2007;60(3):503-509.
8. Khoo LT, Fessler RG. Microendoscopic decompressive laminotomy for the treatment of lumbar stenosis. Neurosurgery. 2002;51(suppl 5):S146-S154.
9. Mobbs RJ, Li J, Sivabalan P, Raley D, Rao PJ. Outcomes after decompressive laminectomy for lumbar spinal stenosis: comparison between minimally invasive unilateral laminectomy for bilateral decompression and open laminectomy: clinical article. J Neurosurg Spine. 2014;21(2):179-186.
10. Avila MJ, Walter CM, Baaj AA. Outcomes and complications of minimally invasive surgery of the lumbar spine in the elderly. Cureus. 2016;8(3):e519.
11. Oertel MF, Ryang YM, Korinth MC, Gilsbach JM, Rohde V. Long-term results of microsurgical treatment of lumbar spinal stenosis by unilateral laminotomy for bilateral decompression. Neurosurgery. 2006;59(6):1264-1269.
12. Haddadi K, Ganjeh Qazvini HR. Outcome after surgery of lumbar spinal stenosis: a randomized comparison of bilateral laminotomy, trumpet laminectomy, and conventional laminectomy. Front Surg. 2016;3:199.
13. Watanabe K, Matsumoto M, Ikegami T, et al. Reduced postoperative wound pain after lumbar spinous process-splitting laminectomy for lumbar canal stenosis: a randomized controlled study. J Neurosurg Spine. 2011;14(1):51-58.
14. Skovrlj B, Belton P, Zarzour H, Qureshi SA. Perioperative outcomes in minimally invasive lumbar spine surgery: a systematic review. World J. Orthop. 2015;6(11):996-1005.
15. Hellander I. The deepening crisis in U.S. health care: a review of data. Int J Health Serv. 2011;41(3):575-586.
16. Chokshi DA. Improving health care for veterans—a watershed moment for the VA. N Engl J Med. 2014;371(4):297-299.
17. Wang MY, Cummock MD, Yu Y, Trivedi RA. An analysis of the differences in the acute hospitalization charges following minimally invasive versus open posterior lumbar interbody fusion. J Neurosurg Spine. 2010;12(6):694-699.
18. Barnett PG. Determination of VA health care costs. Med Care Res Rev. 2003;60(suppl 3):S124-S141.
19. Congressional Budget Office. The health care system for veterans: interim report. https://www.cbo.gov/sites/default/files/110th-congress-2007-2008/reports/12-21-va_healthcare.pdf. Published December 2007. Accessed October 13, 2017.
20. Purzner T, Purzner J, Massicotte EM, Bernstein M. Outpatient brain tumor surgery and spinal decompression: a prospective study of 1003 patients. Neurosurgery. 2011;69(1):119-126.
21. Waller D. How veterans’ hospitals became the best in health care. Time Magazine. http://content.time.com/time/magazine/article/0,9171,1376238,00.html. Published August 27, 2006. Accessed October 13, 2017.
22. U.S. Department of Veterans Affairs, Office of Budget. Annual budget submission—office of budget. https://www.va.gov/budget/products.asp. Updated July 12, 2017. Published October 13, 2017. Accessed October 27, 2017.
Lumbar spinal stenosis (LSS) is a common debilitating issue in older patients. Open laminectomies traditionally are the standard treatment for LSS; however, minimally invasive surgery (MIS) has recently become a popular option to facilitate recovery and improve efficiency of care regarding spine procedures.
Guiot and colleagues described the technique for an MIS decompressive lumbar laminectomy procedure.1 The surgery may represent an important strategy to improve the efficiency of care for patients with severe LSS. Several authors have reported clinical benefits with the MIS lumbar laminectomy, leading to a significant improvement in the Oswetry Disability Index (ODI) 25 in the degenerative stenosis group in cases of LSS.2-5 In a recent reviewof 13 studies Wong and colleagues concluded that the MIS laminectomy was efficacious in terms of symptomatic relief and patient satisfaction for patients with LSS.6 Further, Rosen and colleaguesfound a significant improvement in the ODI scores and in the Short Form-36 body pain and physical functions scores in patients aged ≥ 75 years.7
Perioperative measures, including blood loss and narcotic consumption, have been shown to significantly decrease with MIS surgery compared with open decompression.8,9 Decreased narcotic use is of particular interest for the geriatric population because it is expected to allow those patients to remain more physically active and mentally agile.10
Also, long-term success is important when assessing the efficacy of new MIS procedures. Oertel and colleagues found that 85% of patients reported long-term success after unilateral laminotomy of bilateral decompression (ULBD).11 These results indicate that a MIS laminectomy is effective in older patients with LSS and neurogenic claudication.
Although there are numerous MIS approaches to alleviating LSS, more research is needed to determine whether it is superior to the open laminectomy.9,12,13 Skovrliand and colleagues reviewed publications comparing ULBD and open laminectomies and determined that currently insufficient evidence exists to define which technique leads to more positive outcomes.14 Thus, the purpose of this study is 2-fold. First, this study adds to the current research by comparing estimated blood loss and length of stay (LOS) for microscopic MIS laminectomy vs traditional laminectomy. Second, this study aims to address the difference in health care costs between the 2 types of surgery in the VHA.
The U.S. health care system is facing several challenges and in particular pressure for cost reduction.15 VA hospitals are not exempt from those challenges, and their operating budgets are influenced by political and economic factors.16 Because of those challenges, cost-effectiveness is gaining importance.7 Future decisions for procedure coverage and reimbursement rates are likely to consider ratios like the cost to quality-adjusted life-years (QALY). Improving this ratio requires a reduction of cost and/or an improvement in outcome.
Minimally invasive spine surgery (MISS) may lower the cost of spine procedures. Wang and colleagues reported that minimally invasive posterior lumbar interbody fusion (PLIF) led to shorter stay and lower blood loss compared with traditional PLIF.17 These improvements led to about $8,000 in savings for a single-level PLIF.17
Lumbar degenerative disease is a frequently encountered condition, and lumbar laminectomy is one of the most frequently performed spine procedures at VA hospitals. Consequently, MISS may be an important strategy for the VA to face systematic challenges. At the Southern Arizona VA Health Care System (SAVAHCS) in Tucson, the authors converted lumbar laminectomies from traditional open surgery to a MIS procedure using a tubular retractor system and a paramedian approach. To the authors’ knowledge, no studies have evaluated outcomes and cost efficiency of MIS surgery at the VA. The results of such a study may be instrumental in choosing which surgery is appropriate in a patient-centered health care model.
Material and Methods
Fifty veterans with severe lumbar stenosis and neurogenic claudication underwent a 1- or 2-level laminectomy at SAVAHCS (Table). A traditional laminectomy was performed for all patients until conversion to the MIS procedure, then all subsequent patients underwent the microlaminectomy. There was 1 female patient in each group. The preoperative magnetic resonance imaging (MRI) of the patients showed severe spinal canal stenosis defined radiographically by the absence of cerebrospinal fluid signal at the affected level on MRI (Figures 1A and 2A) and clinically by the presence of neurogenic claudication.
Procedure
The open laminectomies were performed in a traditional midline approach with removal of the spinous process along with the lamina bilaterally to provide spinal canal decompression (Figure 2).
The patients were given the choice of going home or being admitted. Overall admission costs were determined by the VA hospital following described models.18 The LOS in rehabilitation were determined from the records of the SAVAHCS rehabilitation center.
Results
There was not a significant difference in age between the 2 groups; mean age was 69.7 ± 9.8 years for the traditional laminectomy group and 64.4 ± 8.3 years for the MIS group. Operating room time was just over 2 hours on average in both groups. Blood loss was estimated and reported by the surgeon and the anesthesiologist, based on values from the surgical suction system. Patients in the MIS group lost on average 46 cc ± 70 cc compared with 135 cc ± 78 cc in the traditional group. The average number of operated levels was higher in the traditional group (1.7 ± 0.5) compared with the MIS group (1.4 ± 0.5), but this difference did not reach significance (P > .05).
Length of Stay and Cost
The LOS was lower for the MIS group, and 76% chose to be discharged from the recovery room. After a traditional laminectomy, the average patient’s stay was 3 days in the hospital and 5 days in the rehabilitation center. The average MIS group patient stayed < 1 day in the hospital. There were no readmissions within 30 days and no severe morbidity (including no new neurologic deficits or death) in the MIS cohort.
Only 1 MIS patient needed transfer to the rehabilitation center. The estimated cost of care (hospital and rehabilitation) for the traditional group was $10,846 compared with $1,961 for the MIS group.
Discussion
In the authors’ experience, the use of MISS microlaminectomy for the treatment of LSS seems to have led to shorter hospital stays and faster recoveries. Some of the possible reasons for faster patient mobilization included a reduction in postoperative pain and the absence of a wound drain. Larger dissections with a traditional laminectomy often lead to the placement of a wound drain, which requires an inpatient stay until the wound output reaches a certain threshold. The absence of a drain and the reduction in pain with the MISS approach allowed the providers to focus on early ambulation and discharge planning. The microlaminectomy technique allowed for a proper surgical decompression with less tissue dissection than is required for a traditional laminectomy. Previous studies have shown that the microlaminectomy technique provides significant symptomatic relief.5-7,17
In most cases, the microlaminectomy can be performed on an outpatient basis. The improvement in bed availability is particularly important as surgical procedures may be delayed when hospitals operate at full capacity. Redesigning a procedure typically requiring hospital admission into an outpatient procedure improves availability, allowing for better patient access to health care.19
Other authors have studied opportunities to transform inpatient neurosurgical care into outpatient procedures. For instance, Purzner and colleagues presented a large series of successful outpatient neurosurgical cases, including craniotomies, cervical fusions, and lumbar microdiscectomies.20 The MISS techniques offer a critical option to facilitate postoperative recovery and improve efficiency of care in regards to spine procedures.5,17
Cost-Effectiveness Within the VHA
The VA has been described as one of the best health care systems in the U.S.9 The arguments in favor of the VA system include its integrated computerized system and its resistance to health care cost inflation over the years.21 The $186.5 billion 2018 fiscal year VA budget is surpassed only by the total DoD budget, and it is expected to rise substantially in the near future.22
Redesigning a procedure typically requiring hospital admission into an outpatient procedure improves bed availability and reduces cost.19 The authors have demonstrated that a minimally invasive unilateral paramedian approach for the treatment of lumbar stenosis leads to shorter hospital stay, improved bed availability, and lower cost while allowing for a proper surgical decompression. These clinical results are in accord with previous MIS surgery studies.5,17 The improvement in bed availability is particularly important within the VA system. Elective surgeries occasionally are delayed or cancelled because hospitals operate at full capacity. However, the authors’ outpatient microlaminectomy patients avoid delays or cancellations.
Given that both laminectomy procedures use similar operating room resources (time and material), the lower LOS associated with the microlaminectomy translates in cost saving. At SAVAHCS, acute care hospitalization is estimated at $3,000 per day when accounting for various costs, including nursing, pharmacy, ancillary services, and maintenance. The MIS procedure costs about $9,000 less than the open surgery. Over a 2-year period with 37 MIS patients, SAVAHCS saved about $300,000.
Patient Satisfaction
Patient satisfaction was assessed 1 day after the lumbar microdecompression outpatient surgery. Patients were asked to rate their overall surgical experience on a scale of 1 (worst) to 10 (best). All 24 patients who were contacted following outpatient lumbar microdecompression surgery rated the experience 10. These results indicate that patients do not expect or desire an admission following lumbar surgery, and they may recover comfortably at home. Studies are needed to compare outpatient and inpatient satisfaction ratings.
Conclusion
In this small sample, lumbar microlaminectomy significantly reduced LOS, successfully decompressed the spinal canal, and achieved symptomatic relief. Also, the procedure is associated with a lower blood loss than a traditional laminectomy and may reduce the rate of perioperative morbidity over time. In addition to faster recovery, the reduction in LOS can improve access to care by increasing the availability to inpatient admission.
1. Guiot BH, Khoo LT, Fessler RG. A minimally invasive technique for decompression of the lumbar spine. Spine (Phila PA 1976). 2002;27(4):432-438.
2. Rahman M, Summers LE, Richter B, Mimran RI, Jacob RP. Comparison of techniques for decompressive lumbar laminectomy: the minimally invasive versus the “classic” open approach. Minim Invasive Neurosurg. 2008;51(2)100-105.
3. Sasai K, Umeda M, Maruyama T, Wakabayashi E, Iida H. Microsurgical bilateral decompression via a unilateral approach for lumbar spinal canal stenosis including degenerative spondylolisthesis. J Neurosurg Spine. 2008;9(6):554-559.
4. Pao JL, Chen WC, Chen PQ. Clinical outcomes of microendoscopic decompressive laminotomy for degenerative lumbar spinal stenosis. Eur Spine J. 2009;18(5):672-678.
5. Yagi M, Okada, E, Ninomiya K, Kihara M. Postoperative outcome after modified unilateral-approach microendoscopic midline decompression for degenerative spinal stenosis. J Neurosurg Spine. 2009;10(4):293-299.
6. Wong AP, Smith ZA, Lall RR, Bresnahan LE, Fessler RG. The microendoscopic decompression of lumbar stenosis: a review of the current literature and clinical results. Minim Invasive Surg. 2012;2012:325095.
7. Rosen DS, O’Toole JE, Eichholz KM, et al. Minimally invasive lumbar spinal decompression in the elderly: outcomes of 50 patients aged 75 years and older. Neurosurgery. 2007;60(3):503-509.
8. Khoo LT, Fessler RG. Microendoscopic decompressive laminotomy for the treatment of lumbar stenosis. Neurosurgery. 2002;51(suppl 5):S146-S154.
9. Mobbs RJ, Li J, Sivabalan P, Raley D, Rao PJ. Outcomes after decompressive laminectomy for lumbar spinal stenosis: comparison between minimally invasive unilateral laminectomy for bilateral decompression and open laminectomy: clinical article. J Neurosurg Spine. 2014;21(2):179-186.
10. Avila MJ, Walter CM, Baaj AA. Outcomes and complications of minimally invasive surgery of the lumbar spine in the elderly. Cureus. 2016;8(3):e519.
11. Oertel MF, Ryang YM, Korinth MC, Gilsbach JM, Rohde V. Long-term results of microsurgical treatment of lumbar spinal stenosis by unilateral laminotomy for bilateral decompression. Neurosurgery. 2006;59(6):1264-1269.
12. Haddadi K, Ganjeh Qazvini HR. Outcome after surgery of lumbar spinal stenosis: a randomized comparison of bilateral laminotomy, trumpet laminectomy, and conventional laminectomy. Front Surg. 2016;3:199.
13. Watanabe K, Matsumoto M, Ikegami T, et al. Reduced postoperative wound pain after lumbar spinous process-splitting laminectomy for lumbar canal stenosis: a randomized controlled study. J Neurosurg Spine. 2011;14(1):51-58.
14. Skovrlj B, Belton P, Zarzour H, Qureshi SA. Perioperative outcomes in minimally invasive lumbar spine surgery: a systematic review. World J. Orthop. 2015;6(11):996-1005.
15. Hellander I. The deepening crisis in U.S. health care: a review of data. Int J Health Serv. 2011;41(3):575-586.
16. Chokshi DA. Improving health care for veterans—a watershed moment for the VA. N Engl J Med. 2014;371(4):297-299.
17. Wang MY, Cummock MD, Yu Y, Trivedi RA. An analysis of the differences in the acute hospitalization charges following minimally invasive versus open posterior lumbar interbody fusion. J Neurosurg Spine. 2010;12(6):694-699.
18. Barnett PG. Determination of VA health care costs. Med Care Res Rev. 2003;60(suppl 3):S124-S141.
19. Congressional Budget Office. The health care system for veterans: interim report. https://www.cbo.gov/sites/default/files/110th-congress-2007-2008/reports/12-21-va_healthcare.pdf. Published December 2007. Accessed October 13, 2017.
20. Purzner T, Purzner J, Massicotte EM, Bernstein M. Outpatient brain tumor surgery and spinal decompression: a prospective study of 1003 patients. Neurosurgery. 2011;69(1):119-126.
21. Waller D. How veterans’ hospitals became the best in health care. Time Magazine. http://content.time.com/time/magazine/article/0,9171,1376238,00.html. Published August 27, 2006. Accessed October 13, 2017.
22. U.S. Department of Veterans Affairs, Office of Budget. Annual budget submission—office of budget. https://www.va.gov/budget/products.asp. Updated July 12, 2017. Published October 13, 2017. Accessed October 27, 2017.
Does Knowledge of Implant Cost Affect Fixation Method Choice in the Management of Stable Intertrochanteric Hip Fractures?
Take-Home Points
- The incidence of geriatric hip fractures is rising nationally.
- Costs associated with hip fracture care have risen significantly.
- CMN and SHS are effective for stable, intertrochanteric hip fractures.
- Current trends show increased utilization of CMN compared to SHS for stable introchanteric hip fractures.
- Surgeon awareness of implant cost is a critical factor in delivering cost-effective, evidence-based surgical care.
The continuing increase in the population of patients older than 65 years in the United States is well known. For orthopedic surgeons, this trend highlights the importance of effective geriatric fracture care, particularly hip fracture care. Hip fractures in the elderly are expected to increase 50% by 2025 and to number 500,000 by 2040.1 The growing burden of hip fracture cases is accompanied by increasing costs of care. In 2012, 88% of the healthcare dollars spent on these patients were for direct fracture care, a significant increase from 60% in 2009.2 Although fewer than 1 in 5 fractures in the elderly are hip fractures, these injuries account for 72% of the total cost of geriatric fracture care, more than the total cost of all other osteoporosis-related injuries combined.1 Currently, the direct cost of hip fracture care ranges from $8358 to $32,195 and is expected, in total, to reach $25 billion by 2025.2,3
About 50% of geriatric hip fractures are extracapsular intertrochanteric or pertrochanteric.4 Several studies have compared sliding hip screws (SHSs) with cephalomedullary nails (CMNs) in the effective management of stable intertrochanteric fractures.5-11 Although these implants have shown an increased risk for peri-implant fracture and subsequent reoperation, markers such as mortality, medical complications, and restoration of prefracture function have all been equivocal relative to SHSs.12 Ultimately, one implant cannot be definitively recommended over the other for management of stable intertrochanteric hip fractures.13,14 Nevertheless, the current trend increasingly favors CMNs over SHSs.4,15 Most orthopedic surgeons are unaware of or underestimate the cost difference between these implants—a fact even more pronounced for newer implants.4,16 Considering the ever growing cost burden of hip fractures in the United States, orthopedists must consider not only the efficacy of care but the cost of delivery.
We conducted a study to determine the effect that surgeon knowledge of implant cost had on rates of use of SHSs and CMNs in the management of stable intertrochanteric hip fractures.
Patients and Methods
On May 1, 2012, all 9 attending orthopedic surgeons in a private practice group serving a suburban level II trauma center met to discuss implant prices and implant-related costs for the $850 Versafix SHS, the $1950 short Gamma3 nail (SGN), and the $2900 long Gamma3 nail (LGN), all manufactured by Stryker. All surgeons denied previous knowledge of the costs of these implants. During the discussion, no particular implant was recommended for management of any specific type of fracture. Surgeons were not directly instructed to consider implant cost in subsequent hip fracture surgeries and were not informed of our upcoming study of implant utilization.
After obtaining Institutional Review Board approval, we performed a retrospective chart and radiologic review of all hip fractures (Current Procedural Terminology [CPT] code 27244 or 27245) managed with fixation at our institution between May 1, 2011 and April 30, 2013. Two hundred six patients were identified (Figure 1).
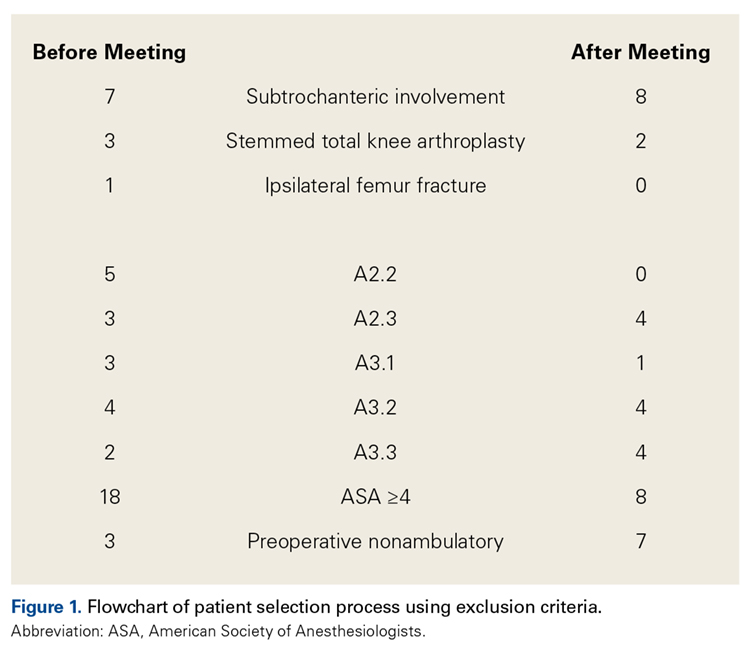
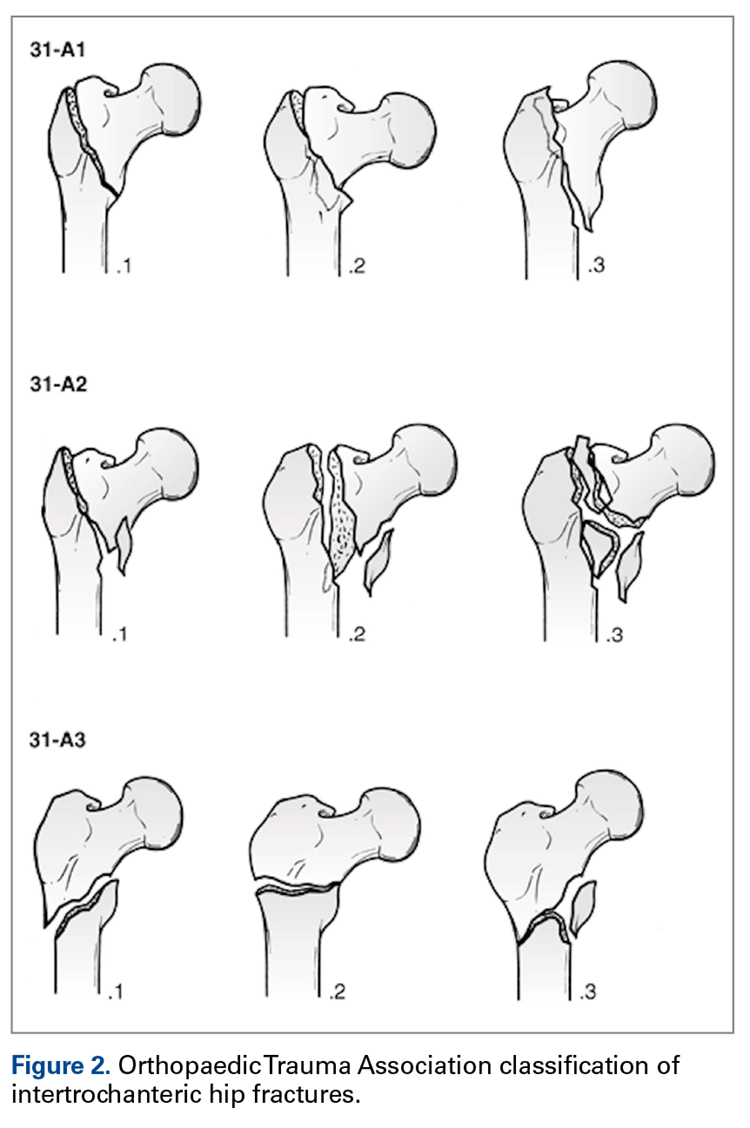
One year later, surgeons were again shown their respective hip fracture radiographs, with patient identifying data removed. They were asked to reclassify their respective cases using the OTA system and then indicate the implant they would use for operative fixation in each of their cases.
Patient age, sex, injury side, fracture types, and utilization rates of the SHS, SGN, and LGN implants were compared between the groups. For each eligible patient, implant cost and other financial data were obtained from the hospital’s finance department. Statistical analyses were performed with SPSS (Statistical Package for the Social Sciences) Version 20 for Macintosh. Independent 2-sample t test was used for parametric comparisons, and Fisher exact test was used for nonparametric comparisons.
Results
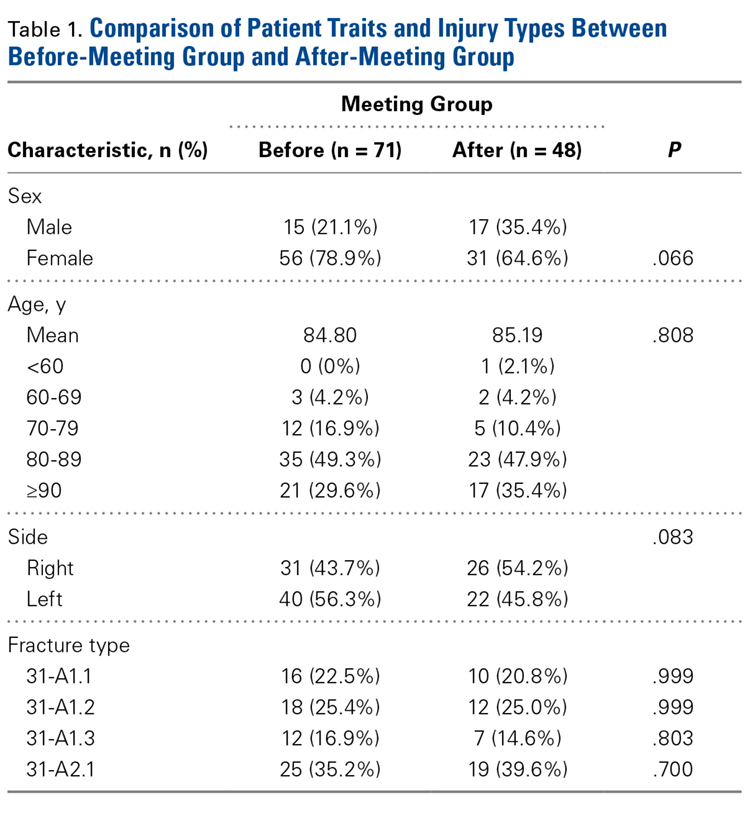
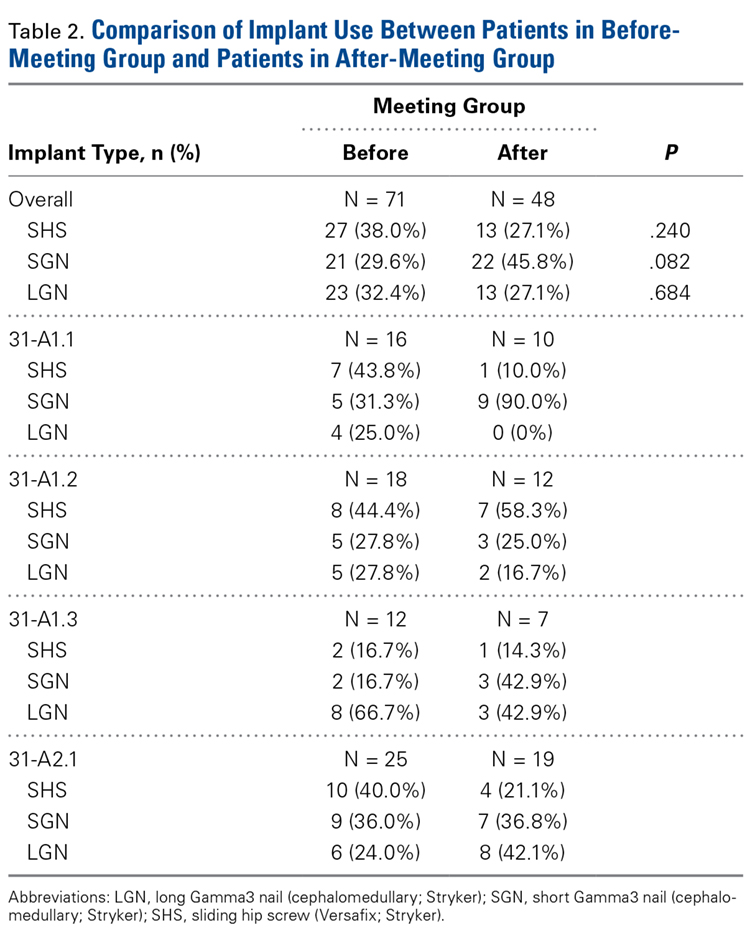
Examination of implant use per fracture classification revealed an interesting change. In the before group, SHS was the implant most commonly used for 31-A1.1 fractures (7/16, 43.8%), 31-A1.2 fractures (8/18, 44.4%), and 31-A2.1 fractures (10/25, 40.0%), and LGN was used in 66.7% (8/12) of 31-A1.3 fractures. By contrast, in the after group, SHS was most commonly used only for 31-A1.2 fractures (7/12, 58.3%), SGN was used in 90% (9/10) of 31-A1.1 fractures, and LGN was used in 42.1% (8/19) of 31-A2.1 fractures. In addition, 85.7% (6/7) of 31-A1.3 fractures were managed with a version of the Gamma nail.
Reclassification resulted in more A2.1 fractures (42.0% vs 37.0%) and fewer A1.3 fractures (10.1% vs 16.0%). About the same numbers of fractures were classified A1.1 (21.0% vs 21.8%) and A1.2 (26.9% vs 25.2%). SHS was favored for A1.1 fractures (92.0%) and A1.2 fractures (65.6%). SGN was favored for A1.3 fractures (75.0%). Gamma nails of both sizes were favored for A2.1 fractures (88.0%).
Discussion
Comparisons of SHS/plate and CMN constructs in the management of stable intertrochanteric hip fractures have long been discussed in the orthopedic literature. The major concern with CMNs (vs SHSs) is a statistically significantly higher rate of revision surgery, most often for peri-implant fracture. Rates of previous revision surgery for peri- implant fracture have ranged from 2.4% to 6% for CMNs and from 0.6% to 4% for SHSs.5-7,9 In a Cochrane review of 22 studies (3749 patients), Parker and Handoll12 compared CMN and SHS outcomes in 23 categories and found a statistically significant difference only in postoperative fracture rate. However, in a meta-analysis of studies conducted between 2000 and 2005, Bhandari and colleagues8 found no statistically significant difference in risk of femoral shaft fracture between CMNs (0.6%) and SHSs (0.1%). In addition, Utrilla and colleagues10 reported no postoperative fractures with use of Gamma3 CMNs. These recent studies may indicate that newer CMN designs can reduce the incidence of postoperative peri-implant fracture.8,10 Other outcome measures, such as 1-year mortality, functional outcome, and medical complication rate, have shown no statistically significant differences between the 2 implants.10-12 Ultimately, the current recommendation for fixation of stable intertrochanteric hip fractures is either SHS or CMN.13,14
Of our study patients, 78.9% (before group) and 64.6% (after group) were female, and 49.3% (before group) and 47.9% (after group) were between 80 and 89 years of age. Similarly, a review of hip fracture Medicare claims made between 1999 and 2002 revealed that >75% of the patients were females and 48% to 49% were octogenarians.4,18 However, our rates of different fracture types differed from those of Adams and colleagues.5 In a 1-year single-institution study, they found that, for both CMNs and SHSs, the most common stable intertrochanteric fractures were 31-A1.1 fractures; in our study’s before and after groups, more than one-third of injuries were 31-A2.1 fractures. Least common were 31-A1.3 fractures, both in the study by Adams and colleagues5 and in our before (16.9%) and after (14.6%) groups. Although our fracture rates differ from those of previous studies, all 4 classification categories fall under the umbrella of stable intertrochanteric hip fracture, which is the sole focus of this study.14
We hypothesized that cost would be a significant driver of implant choice in the management of these injuries. Given that SHS costs $1186.91 less than SGN and $1625.88 less than LGN at our institution, we expected that the before- discussion group’s overall SHS use rate of 38.0% would increase after discussion. Instead, SGN became the favored implant, with use in almost half of all fractures in the after group. Although the change in overall implant use rate was notable, these findings were not statistically significant. Examination of individual fracture patterns revealed 2 areas of interest. First, SHS was assumed to be the implant of choice in the management of the relatively simple 31-A1.1 fractures. Although this assumption was verified in the before group (SHS use in 43.8% of fractures), SGN was used in almost every case (90%) in the after group. However, when surgeons were asked 1 year later to recommend an implant for A1.1 fractures, 92% suggested SHS. The more cost-effective SHS construct may be the most amenable for use in these injury types given all intertrochanteric hip fracture patterns, though this has not been studied.
On the other hand, for 31-A2.1 fractures, perhaps the most complicated of the stable patterns, LGN became the implant of choice (42.1%). Despite surgeons’ awareness of the cost differences, management of these fractures shifted in the after group to the most expensive implant, indicative of surgeon concern about eventual loss of reduction with SHS and surgeon comfort with a particular procedure. This trend held when surgeons were asked to reclassify fractures 1 year later, as CMNs were recommended for 88% of 31-A2.1 fractures. Although both SHS and CMN were acceptable in 97% of the fractures included in this study, SGNs or LGNs were preferred for almost every fracture pattern involving the lesser trochanter. All 9 attending surgeons described involvement of the lesser trochanter as an indicator of posteromedial calcar injury. Surgeons became particularly concerned when this fracture pattern occurred in patients with significant osteopenia; SHS fixation, in their opinion, would be poor in the setting of a combination of greater posteromedial instability and poor bone quality. In a level I prospective, randomized trial, Barton and colleagues7 found no difference in outcomes between LGN and SHS fixation for 31-A2 proximal femur fractures and recommended SHS implants for the cost savings. In the clinical experience of this group, however, A1.3 and A2.1 fractures were at especially high risk for failure with SHS use, which necessitated greater implant stability through CMN fixation. On the other hand, for simpler fracture patterns, most surgeons suggested SHS implants. In their opinion, SGN and LGN implants offered no additional benefit of stability without evidence of posteromedial injury, even in the setting of osteopenia. For A1.2 fractures, posteromedial involvement was judged on the basis of size of the inferomedial spike or the extent of the inferomedial fracture line. Two surgeons preferred CMN for simple fractures, one because of the increased comfort with the implants and the other because of the minimally invasive surgical technique. Overall, our results indicate that knowledge of implant cost is not a strong enough factor to change surgeon behavior in selecting fixation for uncomplicated stable intertrochanteric hip fractures in previously ambulatory elderly patients.
The lack of effect could be a consequence of surgeons’ training and comfort with various implants, especially among younger attending surgeons. Most of the attendings in the practice are under age 50 years, which correlates with a preference for CMN fixation.19 Case loads of >80 intertrochanteric hip fractures per calendar year, as in the after group, also correlates with more CMN use.19 However, the before group had more intertrochanteric hip fractures, and yet SHS was the implant of choice. Resident physician experience and comfort with various implants may play a role too, as teaching hospitals with resident assistance also correlate with CMN use.19 However, no major change in resident physician involvement was undertaken during this period. The institution studied is near a major metropolis in the Northeast, a region that has disfavored SHS in recent years.18 The change from before to after fits an overall trend in changing implant use. Anglen and colleagues15 found a significant decrease in SHS use, from 97% in 1999 to 33% in 2006, for intertrochanteric fracture fixation. Simultaneously, CMN use increased from 3% to 67%.
This study had several limitations. First, its overall sample size was small, and therefore any data fluctuations may be exaggerated. Furthermore, changes in utilization rates were compared over 2 years, which may not be long enough to show a changing trend in implant selection. Post hoc analysis of the sample size determined a power of 0.76 for an α of 0.05 and an effect size of 0.50. Second, radiologic classification was performed in a retrospective review, not officially by the operative surgeon. Fractures that we considered stable may have been considered unstable by the operative surgeon, influencing implant selection. Third, patients were selected from only one hospital, and orthopedic surgeons from other institutions may be more sensitive to cost considerations, changing implant selection more quickly. Fourth, initial selection of patients by CPT code might not have captured all those who satisfied the inclusion criteria. Fifth, only a single intervention was used, and follow-up meetings certainly could have increased the effectiveness of the intervention. Last, this and other retrospective studies are inherently weaker because of possible bias.
Conclusion
Our study results showed that implant cost is not a significant factor in implant selection for uncomplicated stable intertrochanteric hip fractures in previously ambulatory elderly patients. By itself, knowledge of implant cost may not be a strong enough force to change surgeon behavior or preference secondary to consequences of failure or comfort with particular implants. In an economic climate in which healthcare is scrutinized for both its medical effectiveness and cost-effectiveness, further study of forces that could influence orthopedic surgeons to select a more cost-effective implant is warranted.
1. Burge R, Dawson-Hughes B, Solomon DH, Wong JB, King A, Tosteson A. Incidence and economic burden of osteoporosis-related fractures in the United States, 2005-2025. J Bone Miner Res. 2007;22(3):465-475.
2. Kilgore ML, Curtis JR, Delzell E, et al. A close examination of healthcare expenditures related to fractures. J Bone Miner Res. 2013;28(4):816-820.
3. Budhia S, Mikyas Y, Tang M, Badamgarav E. Osteoporotic fractures: a systematic review of U.S. healthcare costs and resource utilization. Pharmacoeconomics. 2012;30(2):147-170.
4. Aros B, Tosteson AN, Gottlieb DJ, Koval KJ. Is a sliding hip screw or IM nail the preferred implant for intertrochanteric fracture fixation? Clin Orthop Relat Res. 2008;466(11):2827-2832.
5. Adams CI, Robinson CM, Court-Brown CM, McQueen MM. Prospective randomized controlled trial of an intramedullary nail versus dynamic screw and plate for intertrochanteric fractures of the femur. J Orthop Trauma. 2001;15(6):394-400.
6. Ahrengart L, Törnkvist H, Fornander P, et al. A randomized study of the compression hip screw and Gamma nail in 426 fractures. Clin Orthop Relat Res. 2002;(401):209-222.
7. Barton TM, Gleeson R, Topliss C, Greenwood R, Harries WJ, Chesser TJ. A comparison of the long Gamma nail with the sliding hip screw for the treatment of AO/OTA 31-A2 fractures of the proximal part of the femur: a prospective randomized trial. J Bone Joint Surg Am. 2010;92(4):792-798.
8. Bhandari M, Schemitsch E, Jönsson A, Zlowodzki M, Haidukewych GJ. Gamma nails revisited: Gamma nails versus compression hip screws in the management of intertrochanteric fractures of the hip: a meta-analysis. J Orthop Trauma. 2009;23(6):460-464.
9. Osnes EK, Lofthus CM, Falch JA, et al. More postoperative femoral fractures with the Gamma nail than the sliding screw plate in the treatment of trochanteric fractures. Acta Orthop Scand. 2001;72(3):252-256.
10. Utrilla AL, Reig JS, Muñoz FM, Tufanisco CB. Trochanteric Gamma nail and compression hip screw for trochanteric fractures. J Orthop Trauma. 2005;19(4):229-233.
11. Verettas DA, Ifantidis P, Chatzipapas CN, et al. Systematic effects of surgical treatment of hip fractures: gliding screw-plating vs intramedullary nailing. Injury. 2010;41(3):279-284.
12. Parker MJ, Handoll HH. Gamma and other cephalocondylic intramedullary nails versus extramedullary implants for extracapsular hip fractures in adults. Cochrane Database Syst Rev. 2010;(9):CD000093.
13. Kaplan K, Miyamoto R, Levine BR, Egol KA, Zuckerman JD. Surgical management of hip fractures: an evidence-based review of the literature. II: intertrochanteric fractures. J Am Acad Orthop Surg. 2008;16(11):665-673.
14. Lindskog DM, Baumgaertner MR. Unstable intertrochanteric hip fractures in the elderly. J Am Acad Orthop Surg. 2004;12(3):179-190.
15. Anglen JO, Weinstein JN; American Board of Orthopaedic Surgery Research Committee. Nail or plate fixation of intertrochanteric hip fractures: changing pattern of practice. A review of the American Board of Orthopaedic Surgery Database. J Bone Joint Surg Am. 2008;90(4):700-707.
16. Streit JJ, Youssef A, Coale RM, Carpenter JE, Marcus RE. Orthopaedic surgeons frequently underestimate the cost of orthopaedic implants. Clin Orthop Relat Res. 2013;471(6):1744-1749.
17. Marsh JL, Slongo TF, Agel J, et al. Fracture and dislocation classification compendium—2007: Orthopaedic Trauma Association classification, database and outcomes committee. J Orthop Trauma. 2007;21(10 suppl):S1-S133.
18. Forte ML, Virnig BA, Kane RL, et al. Geographic variation in device use for intertrochanteric hip fractures. J Bone Joint Surg Am. 2008;90(4):691-699.
19. Forte ML, Virnig BA, Eberly LE, et al. Provider factors associated with intramedullary nail use for intertrochanteric hip fractures. J Bone Joint Surg Am. 2010;92(5):1105-1114.
Take-Home Points
- The incidence of geriatric hip fractures is rising nationally.
- Costs associated with hip fracture care have risen significantly.
- CMN and SHS are effective for stable, intertrochanteric hip fractures.
- Current trends show increased utilization of CMN compared to SHS for stable introchanteric hip fractures.
- Surgeon awareness of implant cost is a critical factor in delivering cost-effective, evidence-based surgical care.
The continuing increase in the population of patients older than 65 years in the United States is well known. For orthopedic surgeons, this trend highlights the importance of effective geriatric fracture care, particularly hip fracture care. Hip fractures in the elderly are expected to increase 50% by 2025 and to number 500,000 by 2040.1 The growing burden of hip fracture cases is accompanied by increasing costs of care. In 2012, 88% of the healthcare dollars spent on these patients were for direct fracture care, a significant increase from 60% in 2009.2 Although fewer than 1 in 5 fractures in the elderly are hip fractures, these injuries account for 72% of the total cost of geriatric fracture care, more than the total cost of all other osteoporosis-related injuries combined.1 Currently, the direct cost of hip fracture care ranges from $8358 to $32,195 and is expected, in total, to reach $25 billion by 2025.2,3
About 50% of geriatric hip fractures are extracapsular intertrochanteric or pertrochanteric.4 Several studies have compared sliding hip screws (SHSs) with cephalomedullary nails (CMNs) in the effective management of stable intertrochanteric fractures.5-11 Although these implants have shown an increased risk for peri-implant fracture and subsequent reoperation, markers such as mortality, medical complications, and restoration of prefracture function have all been equivocal relative to SHSs.12 Ultimately, one implant cannot be definitively recommended over the other for management of stable intertrochanteric hip fractures.13,14 Nevertheless, the current trend increasingly favors CMNs over SHSs.4,15 Most orthopedic surgeons are unaware of or underestimate the cost difference between these implants—a fact even more pronounced for newer implants.4,16 Considering the ever growing cost burden of hip fractures in the United States, orthopedists must consider not only the efficacy of care but the cost of delivery.
We conducted a study to determine the effect that surgeon knowledge of implant cost had on rates of use of SHSs and CMNs in the management of stable intertrochanteric hip fractures.
Patients and Methods
On May 1, 2012, all 9 attending orthopedic surgeons in a private practice group serving a suburban level II trauma center met to discuss implant prices and implant-related costs for the $850 Versafix SHS, the $1950 short Gamma3 nail (SGN), and the $2900 long Gamma3 nail (LGN), all manufactured by Stryker. All surgeons denied previous knowledge of the costs of these implants. During the discussion, no particular implant was recommended for management of any specific type of fracture. Surgeons were not directly instructed to consider implant cost in subsequent hip fracture surgeries and were not informed of our upcoming study of implant utilization.
After obtaining Institutional Review Board approval, we performed a retrospective chart and radiologic review of all hip fractures (Current Procedural Terminology [CPT] code 27244 or 27245) managed with fixation at our institution between May 1, 2011 and April 30, 2013. Two hundred six patients were identified (Figure 1).
One year later, surgeons were again shown their respective hip fracture radiographs, with patient identifying data removed. They were asked to reclassify their respective cases using the OTA system and then indicate the implant they would use for operative fixation in each of their cases.
Patient age, sex, injury side, fracture types, and utilization rates of the SHS, SGN, and LGN implants were compared between the groups. For each eligible patient, implant cost and other financial data were obtained from the hospital’s finance department. Statistical analyses were performed with SPSS (Statistical Package for the Social Sciences) Version 20 for Macintosh. Independent 2-sample t test was used for parametric comparisons, and Fisher exact test was used for nonparametric comparisons.
Results
Examination of implant use per fracture classification revealed an interesting change. In the before group, SHS was the implant most commonly used for 31-A1.1 fractures (7/16, 43.8%), 31-A1.2 fractures (8/18, 44.4%), and 31-A2.1 fractures (10/25, 40.0%), and LGN was used in 66.7% (8/12) of 31-A1.3 fractures. By contrast, in the after group, SHS was most commonly used only for 31-A1.2 fractures (7/12, 58.3%), SGN was used in 90% (9/10) of 31-A1.1 fractures, and LGN was used in 42.1% (8/19) of 31-A2.1 fractures. In addition, 85.7% (6/7) of 31-A1.3 fractures were managed with a version of the Gamma nail.
Reclassification resulted in more A2.1 fractures (42.0% vs 37.0%) and fewer A1.3 fractures (10.1% vs 16.0%). About the same numbers of fractures were classified A1.1 (21.0% vs 21.8%) and A1.2 (26.9% vs 25.2%). SHS was favored for A1.1 fractures (92.0%) and A1.2 fractures (65.6%). SGN was favored for A1.3 fractures (75.0%). Gamma nails of both sizes were favored for A2.1 fractures (88.0%).
Discussion
Comparisons of SHS/plate and CMN constructs in the management of stable intertrochanteric hip fractures have long been discussed in the orthopedic literature. The major concern with CMNs (vs SHSs) is a statistically significantly higher rate of revision surgery, most often for peri-implant fracture. Rates of previous revision surgery for peri- implant fracture have ranged from 2.4% to 6% for CMNs and from 0.6% to 4% for SHSs.5-7,9 In a Cochrane review of 22 studies (3749 patients), Parker and Handoll12 compared CMN and SHS outcomes in 23 categories and found a statistically significant difference only in postoperative fracture rate. However, in a meta-analysis of studies conducted between 2000 and 2005, Bhandari and colleagues8 found no statistically significant difference in risk of femoral shaft fracture between CMNs (0.6%) and SHSs (0.1%). In addition, Utrilla and colleagues10 reported no postoperative fractures with use of Gamma3 CMNs. These recent studies may indicate that newer CMN designs can reduce the incidence of postoperative peri-implant fracture.8,10 Other outcome measures, such as 1-year mortality, functional outcome, and medical complication rate, have shown no statistically significant differences between the 2 implants.10-12 Ultimately, the current recommendation for fixation of stable intertrochanteric hip fractures is either SHS or CMN.13,14
Of our study patients, 78.9% (before group) and 64.6% (after group) were female, and 49.3% (before group) and 47.9% (after group) were between 80 and 89 years of age. Similarly, a review of hip fracture Medicare claims made between 1999 and 2002 revealed that >75% of the patients were females and 48% to 49% were octogenarians.4,18 However, our rates of different fracture types differed from those of Adams and colleagues.5 In a 1-year single-institution study, they found that, for both CMNs and SHSs, the most common stable intertrochanteric fractures were 31-A1.1 fractures; in our study’s before and after groups, more than one-third of injuries were 31-A2.1 fractures. Least common were 31-A1.3 fractures, both in the study by Adams and colleagues5 and in our before (16.9%) and after (14.6%) groups. Although our fracture rates differ from those of previous studies, all 4 classification categories fall under the umbrella of stable intertrochanteric hip fracture, which is the sole focus of this study.14
We hypothesized that cost would be a significant driver of implant choice in the management of these injuries. Given that SHS costs $1186.91 less than SGN and $1625.88 less than LGN at our institution, we expected that the before- discussion group’s overall SHS use rate of 38.0% would increase after discussion. Instead, SGN became the favored implant, with use in almost half of all fractures in the after group. Although the change in overall implant use rate was notable, these findings were not statistically significant. Examination of individual fracture patterns revealed 2 areas of interest. First, SHS was assumed to be the implant of choice in the management of the relatively simple 31-A1.1 fractures. Although this assumption was verified in the before group (SHS use in 43.8% of fractures), SGN was used in almost every case (90%) in the after group. However, when surgeons were asked 1 year later to recommend an implant for A1.1 fractures, 92% suggested SHS. The more cost-effective SHS construct may be the most amenable for use in these injury types given all intertrochanteric hip fracture patterns, though this has not been studied.
On the other hand, for 31-A2.1 fractures, perhaps the most complicated of the stable patterns, LGN became the implant of choice (42.1%). Despite surgeons’ awareness of the cost differences, management of these fractures shifted in the after group to the most expensive implant, indicative of surgeon concern about eventual loss of reduction with SHS and surgeon comfort with a particular procedure. This trend held when surgeons were asked to reclassify fractures 1 year later, as CMNs were recommended for 88% of 31-A2.1 fractures. Although both SHS and CMN were acceptable in 97% of the fractures included in this study, SGNs or LGNs were preferred for almost every fracture pattern involving the lesser trochanter. All 9 attending surgeons described involvement of the lesser trochanter as an indicator of posteromedial calcar injury. Surgeons became particularly concerned when this fracture pattern occurred in patients with significant osteopenia; SHS fixation, in their opinion, would be poor in the setting of a combination of greater posteromedial instability and poor bone quality. In a level I prospective, randomized trial, Barton and colleagues7 found no difference in outcomes between LGN and SHS fixation for 31-A2 proximal femur fractures and recommended SHS implants for the cost savings. In the clinical experience of this group, however, A1.3 and A2.1 fractures were at especially high risk for failure with SHS use, which necessitated greater implant stability through CMN fixation. On the other hand, for simpler fracture patterns, most surgeons suggested SHS implants. In their opinion, SGN and LGN implants offered no additional benefit of stability without evidence of posteromedial injury, even in the setting of osteopenia. For A1.2 fractures, posteromedial involvement was judged on the basis of size of the inferomedial spike or the extent of the inferomedial fracture line. Two surgeons preferred CMN for simple fractures, one because of the increased comfort with the implants and the other because of the minimally invasive surgical technique. Overall, our results indicate that knowledge of implant cost is not a strong enough factor to change surgeon behavior in selecting fixation for uncomplicated stable intertrochanteric hip fractures in previously ambulatory elderly patients.
The lack of effect could be a consequence of surgeons’ training and comfort with various implants, especially among younger attending surgeons. Most of the attendings in the practice are under age 50 years, which correlates with a preference for CMN fixation.19 Case loads of >80 intertrochanteric hip fractures per calendar year, as in the after group, also correlates with more CMN use.19 However, the before group had more intertrochanteric hip fractures, and yet SHS was the implant of choice. Resident physician experience and comfort with various implants may play a role too, as teaching hospitals with resident assistance also correlate with CMN use.19 However, no major change in resident physician involvement was undertaken during this period. The institution studied is near a major metropolis in the Northeast, a region that has disfavored SHS in recent years.18 The change from before to after fits an overall trend in changing implant use. Anglen and colleagues15 found a significant decrease in SHS use, from 97% in 1999 to 33% in 2006, for intertrochanteric fracture fixation. Simultaneously, CMN use increased from 3% to 67%.
This study had several limitations. First, its overall sample size was small, and therefore any data fluctuations may be exaggerated. Furthermore, changes in utilization rates were compared over 2 years, which may not be long enough to show a changing trend in implant selection. Post hoc analysis of the sample size determined a power of 0.76 for an α of 0.05 and an effect size of 0.50. Second, radiologic classification was performed in a retrospective review, not officially by the operative surgeon. Fractures that we considered stable may have been considered unstable by the operative surgeon, influencing implant selection. Third, patients were selected from only one hospital, and orthopedic surgeons from other institutions may be more sensitive to cost considerations, changing implant selection more quickly. Fourth, initial selection of patients by CPT code might not have captured all those who satisfied the inclusion criteria. Fifth, only a single intervention was used, and follow-up meetings certainly could have increased the effectiveness of the intervention. Last, this and other retrospective studies are inherently weaker because of possible bias.
Conclusion
Our study results showed that implant cost is not a significant factor in implant selection for uncomplicated stable intertrochanteric hip fractures in previously ambulatory elderly patients. By itself, knowledge of implant cost may not be a strong enough force to change surgeon behavior or preference secondary to consequences of failure or comfort with particular implants. In an economic climate in which healthcare is scrutinized for both its medical effectiveness and cost-effectiveness, further study of forces that could influence orthopedic surgeons to select a more cost-effective implant is warranted.
1. Burge R, Dawson-Hughes B, Solomon DH, Wong JB, King A, Tosteson A. Incidence and economic burden of osteoporosis-related fractures in the United States, 2005-2025. J Bone Miner Res. 2007;22(3):465-475.
2. Kilgore ML, Curtis JR, Delzell E, et al. A close examination of healthcare expenditures related to fractures. J Bone Miner Res. 2013;28(4):816-820.
3. Budhia S, Mikyas Y, Tang M, Badamgarav E. Osteoporotic fractures: a systematic review of U.S. healthcare costs and resource utilization. Pharmacoeconomics. 2012;30(2):147-170.
4. Aros B, Tosteson AN, Gottlieb DJ, Koval KJ. Is a sliding hip screw or IM nail the preferred implant for intertrochanteric fracture fixation? Clin Orthop Relat Res. 2008;466(11):2827-2832.
5. Adams CI, Robinson CM, Court-Brown CM, McQueen MM. Prospective randomized controlled trial of an intramedullary nail versus dynamic screw and plate for intertrochanteric fractures of the femur. J Orthop Trauma. 2001;15(6):394-400.
6. Ahrengart L, Törnkvist H, Fornander P, et al. A randomized study of the compression hip screw and Gamma nail in 426 fractures. Clin Orthop Relat Res. 2002;(401):209-222.
7. Barton TM, Gleeson R, Topliss C, Greenwood R, Harries WJ, Chesser TJ. A comparison of the long Gamma nail with the sliding hip screw for the treatment of AO/OTA 31-A2 fractures of the proximal part of the femur: a prospective randomized trial. J Bone Joint Surg Am. 2010;92(4):792-798.
8. Bhandari M, Schemitsch E, Jönsson A, Zlowodzki M, Haidukewych GJ. Gamma nails revisited: Gamma nails versus compression hip screws in the management of intertrochanteric fractures of the hip: a meta-analysis. J Orthop Trauma. 2009;23(6):460-464.
9. Osnes EK, Lofthus CM, Falch JA, et al. More postoperative femoral fractures with the Gamma nail than the sliding screw plate in the treatment of trochanteric fractures. Acta Orthop Scand. 2001;72(3):252-256.
10. Utrilla AL, Reig JS, Muñoz FM, Tufanisco CB. Trochanteric Gamma nail and compression hip screw for trochanteric fractures. J Orthop Trauma. 2005;19(4):229-233.
11. Verettas DA, Ifantidis P, Chatzipapas CN, et al. Systematic effects of surgical treatment of hip fractures: gliding screw-plating vs intramedullary nailing. Injury. 2010;41(3):279-284.
12. Parker MJ, Handoll HH. Gamma and other cephalocondylic intramedullary nails versus extramedullary implants for extracapsular hip fractures in adults. Cochrane Database Syst Rev. 2010;(9):CD000093.
13. Kaplan K, Miyamoto R, Levine BR, Egol KA, Zuckerman JD. Surgical management of hip fractures: an evidence-based review of the literature. II: intertrochanteric fractures. J Am Acad Orthop Surg. 2008;16(11):665-673.
14. Lindskog DM, Baumgaertner MR. Unstable intertrochanteric hip fractures in the elderly. J Am Acad Orthop Surg. 2004;12(3):179-190.
15. Anglen JO, Weinstein JN; American Board of Orthopaedic Surgery Research Committee. Nail or plate fixation of intertrochanteric hip fractures: changing pattern of practice. A review of the American Board of Orthopaedic Surgery Database. J Bone Joint Surg Am. 2008;90(4):700-707.
16. Streit JJ, Youssef A, Coale RM, Carpenter JE, Marcus RE. Orthopaedic surgeons frequently underestimate the cost of orthopaedic implants. Clin Orthop Relat Res. 2013;471(6):1744-1749.
17. Marsh JL, Slongo TF, Agel J, et al. Fracture and dislocation classification compendium—2007: Orthopaedic Trauma Association classification, database and outcomes committee. J Orthop Trauma. 2007;21(10 suppl):S1-S133.
18. Forte ML, Virnig BA, Kane RL, et al. Geographic variation in device use for intertrochanteric hip fractures. J Bone Joint Surg Am. 2008;90(4):691-699.
19. Forte ML, Virnig BA, Eberly LE, et al. Provider factors associated with intramedullary nail use for intertrochanteric hip fractures. J Bone Joint Surg Am. 2010;92(5):1105-1114.
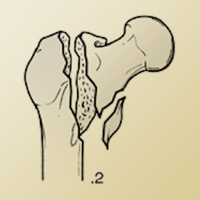
Lichen Planus and Lichenoid Drug Eruption After Vaccination
Lichen planus (LP) is a chronic inflammatory dermatosis of unknown origin that involves the skin and mucous membranes, and lichenoid drug eruption (LDE) is an uncommon cutaneous adverse reaction to a medication.1 The manifestations resemble each other clinically, and sometimes it is difficult to differentiate between them on histology. The pathogenesis still is not well characterized, especially the key initiating event that leads to the development of LP or LDE postimmunization. There have been reports of LP or LDEs after certain vaccines, especially the hepatitis B and influenza vaccines.2-4 Both vaccines are routinely administered in the United States; more than 100 million individuals have received the hepatitis B vaccine in the United States since it became available in 1982,5 and the Advisory Committee on Immunization Practices of the Centers for Disease Control and Prevention (CDC) recommends that all individuals 6 months or older receive an influenza vaccine every year.6 Currently, influenza vaccine coverage among adults 18 years or older reaches approximately 40% annually in the United States.6
Although certain viral infections (eg, hepatitis C virus) seem to play a role in the development of LP,7,8 the link between LP and hepatitis B vaccination is less well recognized. Reports of LP and LDE after vaccination have been largely limited to case reports and case series.2-4,9,10 Therefore, we aimed to characterize and review cases of LP and LDE following vaccination by analyzing the Vaccine Adverse Event Reporting System (VAERS) database.
Methods
The VAERS is a national vaccine safety surveillance database maintained jointly by the CDC and the US Food and Drug Administration to analyze adverse events (AEs) following immunizations. Serious AEs and deaths recorded in the VAERS were followed up periodically by VAERS staff. Information on vaccine-associated LP or LDE was retrieved from the VAERS database using the CDC WONDER online interface (http://wonder.cdc.gov/vaers.html). To examine if LP or LDE after vaccination occurred more frequently in patients with certain demographic risk factors, all reported cases of LP and LDE associated with vaccines administered from July 1990 to November 2014 were identified in the symptoms section of the VAERS system using the search terms lichen planus, oral lichen planus, and lichenoid drug eruption. Characteristics such as age, gender, time to onset, type of vaccine, method of diagnosis, and clinical outcome were collected.
The statistical package for social sciences (SPSS version 22) was utilized for the descriptive analysis. Fisher exact and χ2 tests were used to evaluate statistical significance. A 2-sided P value of <.05 was considered statistically significant.
Results
There were 434,943 reported AEs following vaccination in the VAERS database from July 1990 to November 2014; among them, 33 cases involved LP or LDE. Of these vaccine-associated AEs, LP was diagnosed in 23 (69.7%) cases, while LDE and oral LP were diagnosed in 6 (18.2%) and 4 (12.1%) cases, respectively. Females represented slightly more than half (57.6% [19/33]) of the total cases. The median age of onset was 47 years. Approximately two-thirds of the identified cases were confirmed on skin biopsy and histology, while the rest were diagnosed either by a dermatologist or a primary care physician. The time to onset of symptoms ranged from 1 to 297 days after vaccination, with a median time of 14 days.
Patients with LP or LDE were significantly older compared to the reported AEs overall (P<.001); the median age of onset was 47 years for LP or LDE compared to 24 years for all reported AEs. Table 1 shows the various vaccines associated with LP or LDE. The hepatitis B, influenza, and herpes zoster vaccines were the 3 most common types of vaccines associated with these conditions. The hepatitis B vaccine accounted for 24.2% (8/33) of the reported events, followed by influenza (18.2% [6/33]) and herpes zoster (15.2% [5/33]) vaccines. In addition, there were 3 cases of cutaneous reaction after receiving the combination hepatitis A and hepatitis B vaccine. Table 2 presents details of the reported events associated with hepatitis B, influenza, herpes zoster, combination hepatitis A and hepatitis B, and hepatitis A vaccination.
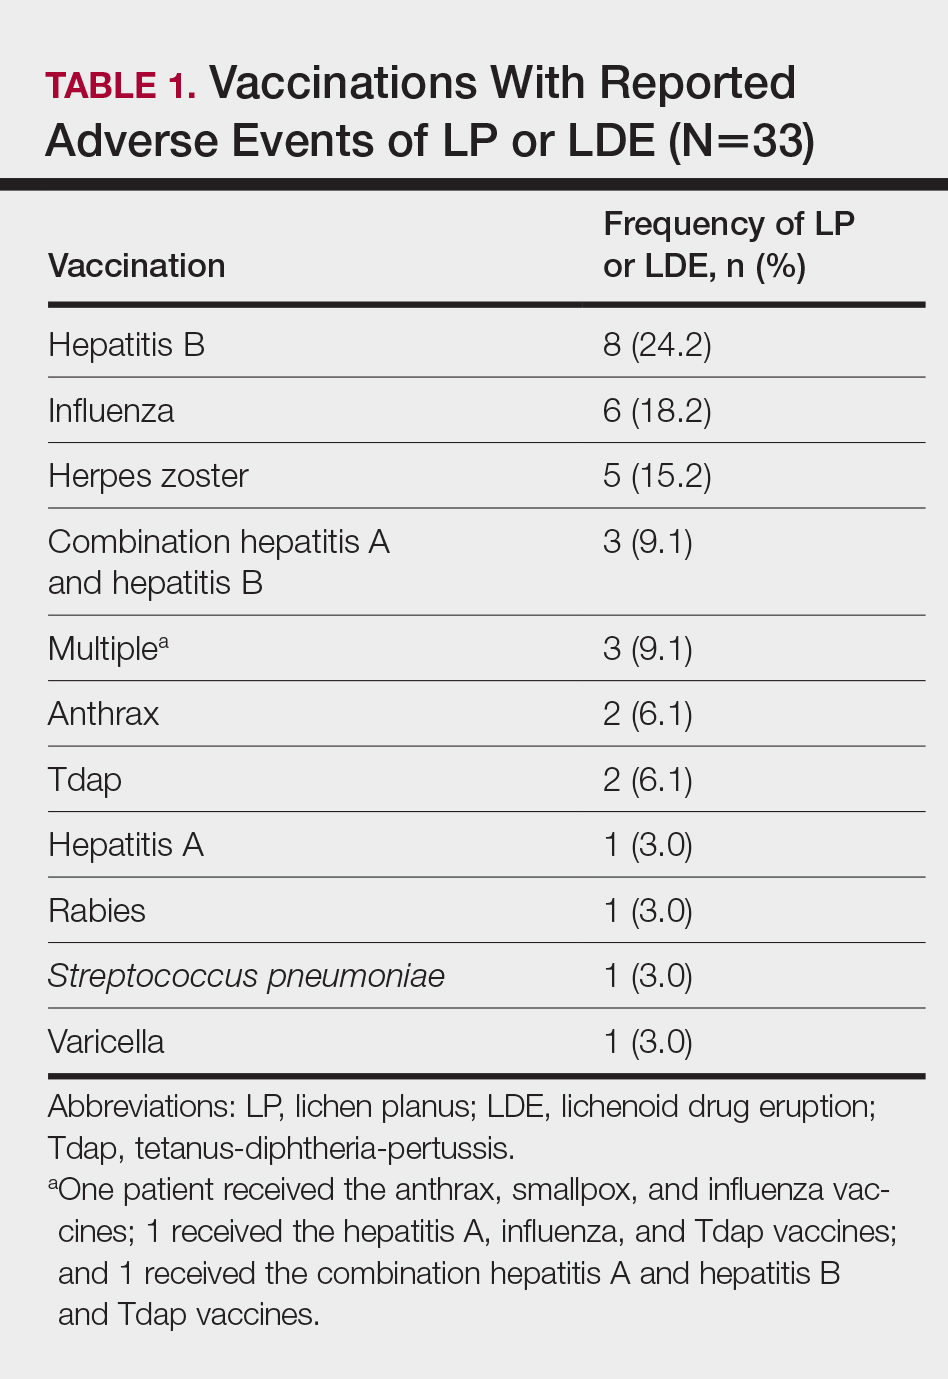
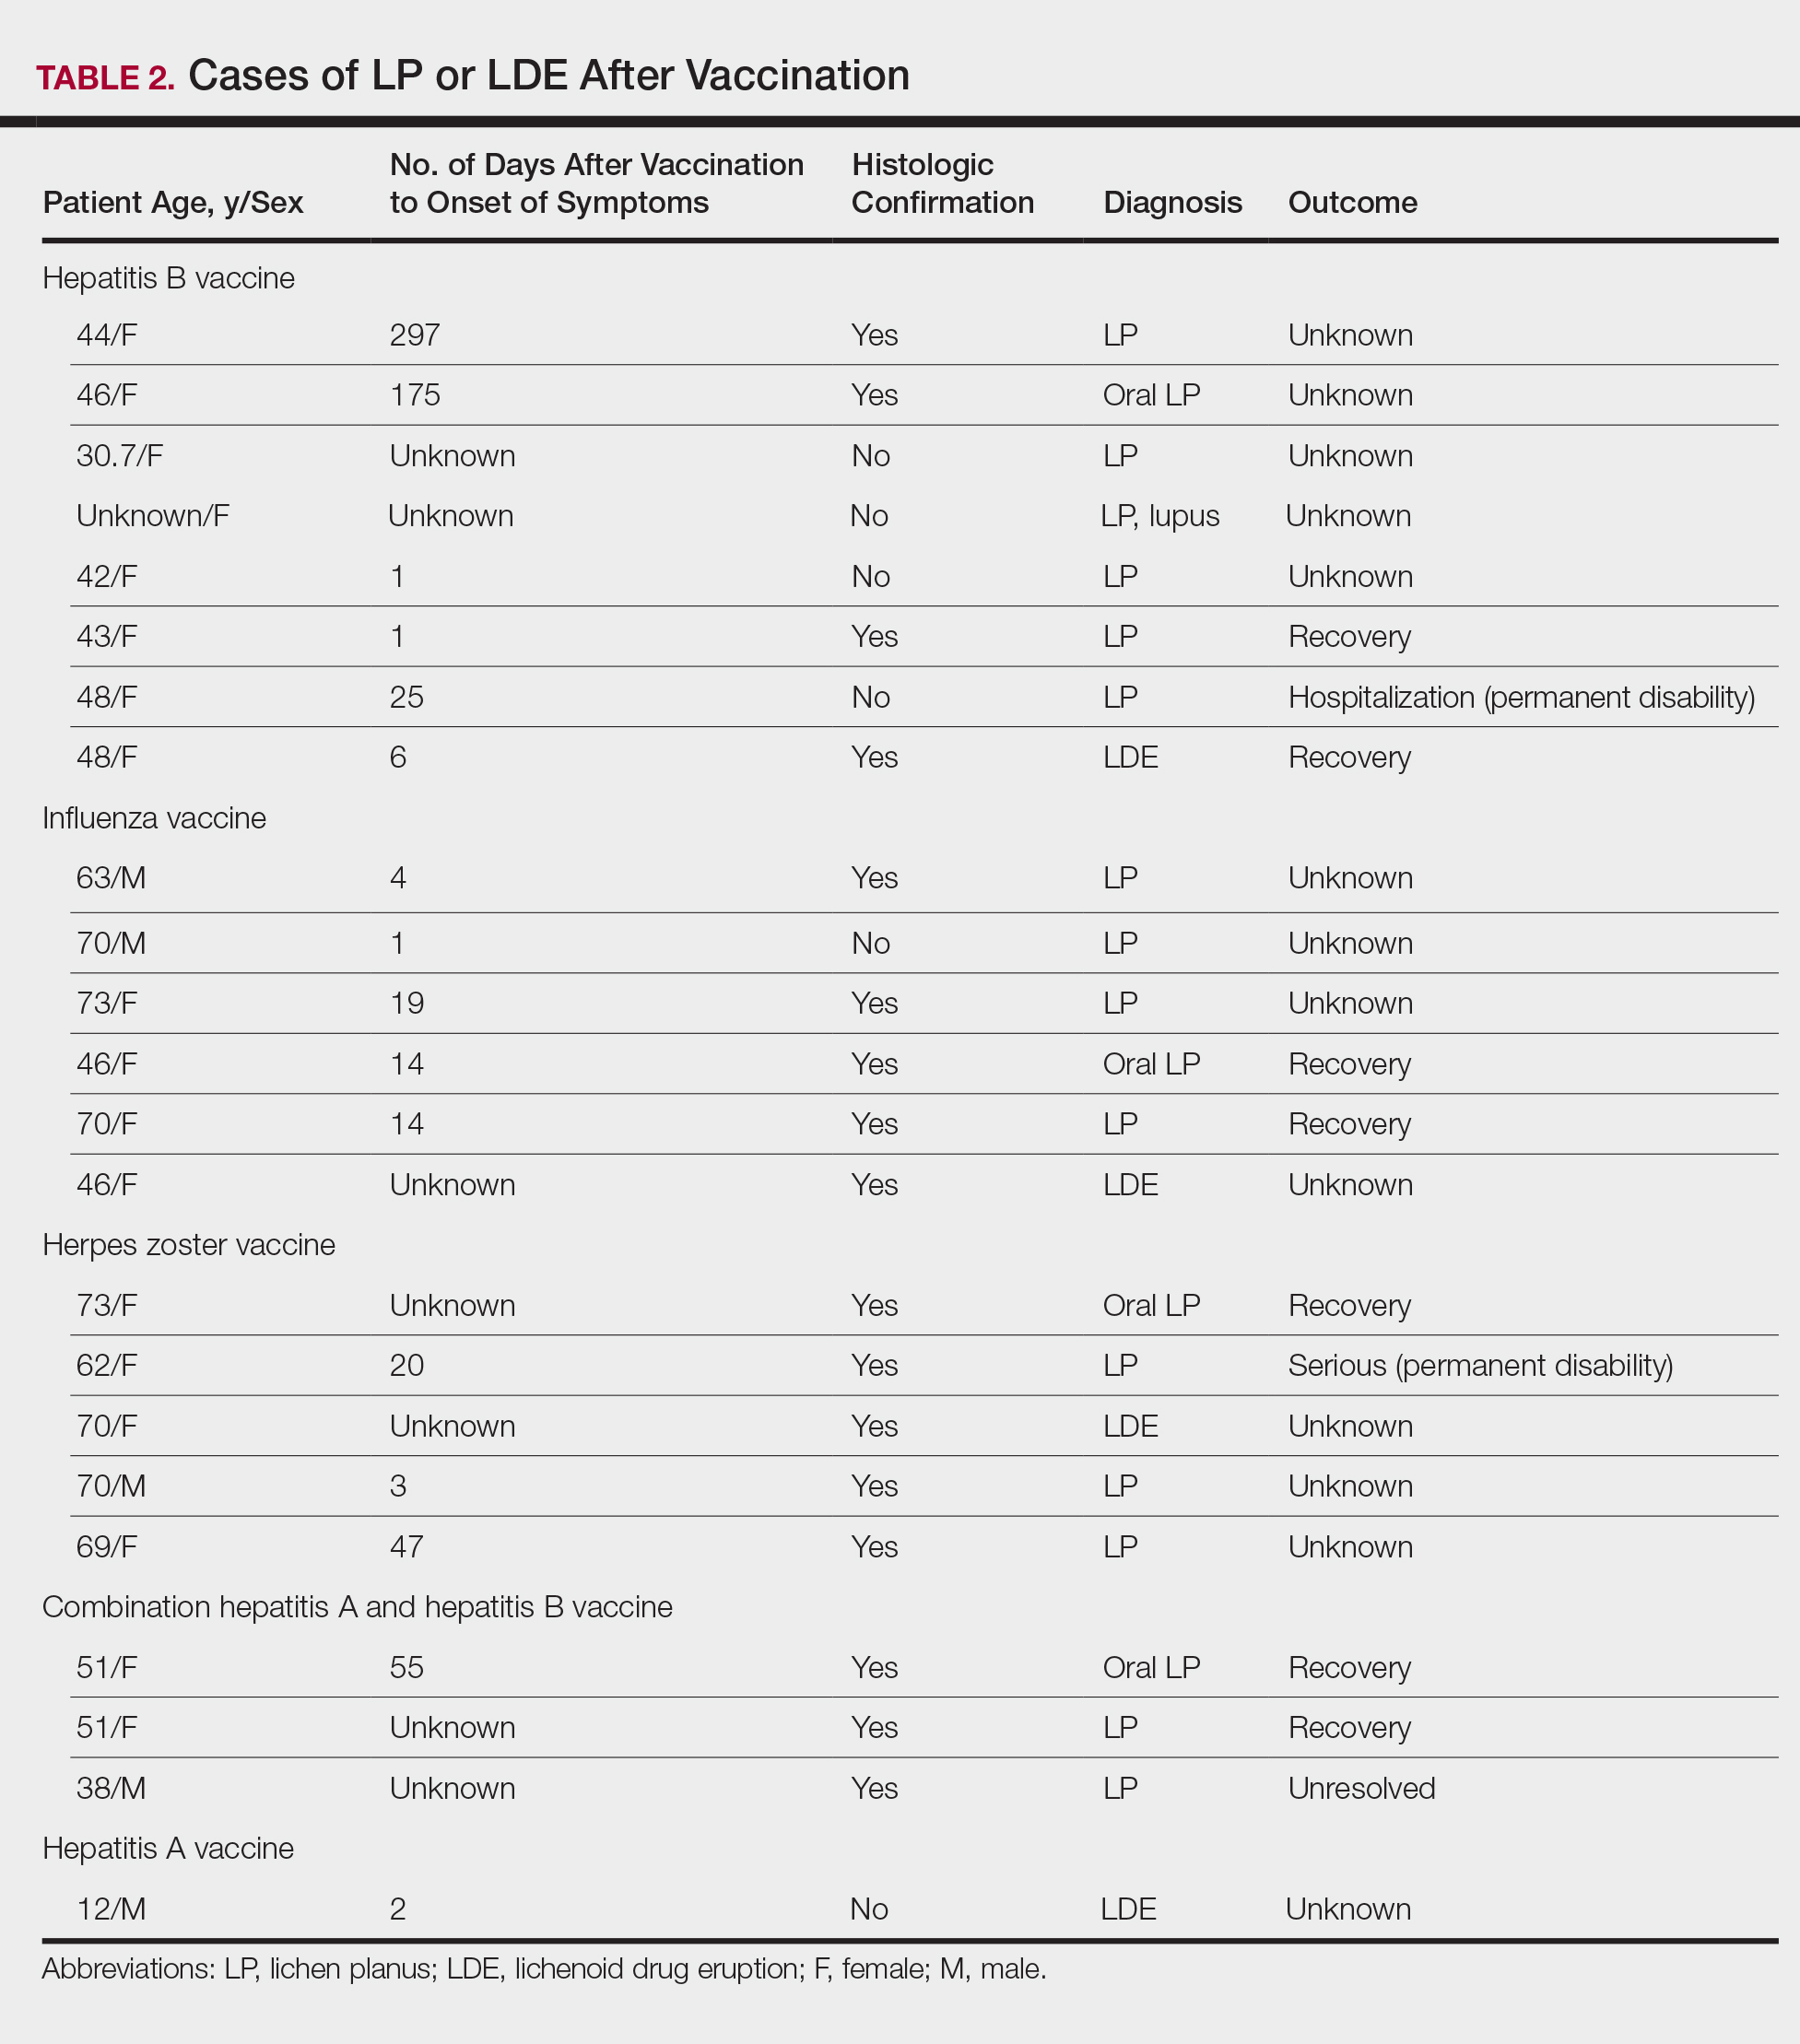
Of 8 AEs associated with hepatitis B vaccination, 1 AE resulted in permanent disability and required hospitalization. O
Comment
The estimated prevalence of LP ranges from 0.22% to 5% worldwide,11-15 with an incidence of 0.032% to 0.037%.16 Although rare, LP and LDE can occur from certain medications or vaccines. Cases of LP have been reported after hepatitis B and influenza vaccinations. The first case of LP following hepatitis B vaccination was described by Ciaccio and Rebora17 in 1990. Since then, a total of 50 similar cases have been reported worldwide.2 There also have been reports of LP following influenza, tetanus-diphtheria-pertussis, measles-mumps-rubella, and inactivated polio vaccines.3,4,9,10 Table 3 summarizes cases of LP following various vaccinations.
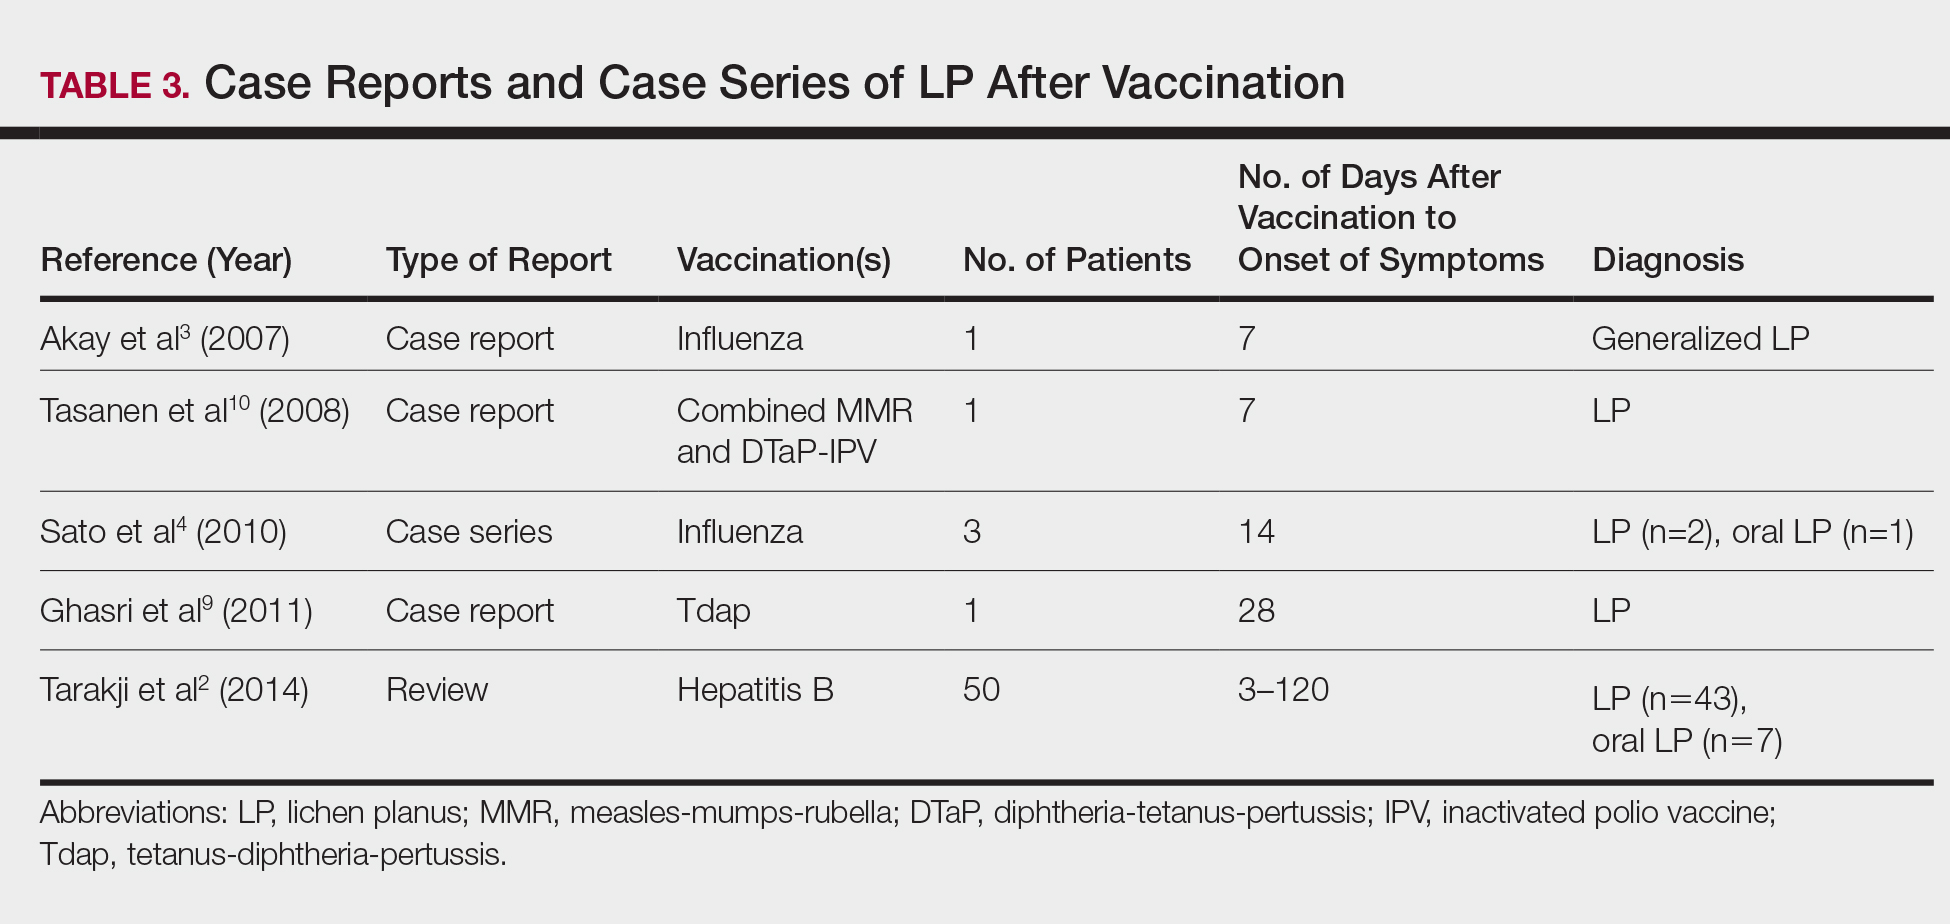
The key initiating event of the pathogenesis for both LP and LDE is not completely understood. Both conditions share similar immunologic mechanisms of persistently activated CD8 autocytotoxic T lymphocytes against epidermal cells.18 These cells can induce apoptosis of basal epidermal keratinocytes and generate various cytokines (eg, IFN-γ, IL-5) to enhance expression of class II MHC molecules and antigen presentation to CD4 T cells.19-22 It is conceivable that one of the initiating factors may be related to components in vaccines.
Hepatitis B, influenza, and herpes zoster vaccines were the 3 most common vaccines implicated in postimmunization LP or LDEs in our study. The excipients of these vaccines were compared based on the product inserts to identify any common components. It was found that all 3 vaccines contain either yeast protein or egg protein with various forms of phosphate buffers, while the hepatitis A and herpes zoster vaccines share Medical Research Council cell strain 5 (human diploid) cells as well as other cellular components.23 Sato et al4 suggested that specific vaccine components, such as the vaccine itself or egg proteins, could have contributed to the development of LP following vaccination. It has been postulated that the protein S fraction of hepatitis B surface antigen plays a crucial role in the pathogenesis of both LP and LDE after hepatitis B vaccination.2,24 It is likely that protein S shares common epitopes on keratinocytes that are recognized by the immune system, thus activating cytotoxic T lymphocytes and inducing apoptosis.2,24
In this study, the median time to onset of vaccine-related LP was 14 days, which is consistent with a case series by Sato et al,4 suggesting that adverse reactions mainly occurred within 2 weeks after influenza vaccination. Onset of symptoms within 2 weeks of vaccination would therefore be a crucial clue for diagnosing possible vaccine-related LP or LDE. On the other hand, at least 4 patients in our study had onset of LP and LDE more than 1 month after vaccination; 2 of 4 cases even reported symptom onset at 175 and 297 days after hepatitis B vaccination, which were much longer than the 120 days reported by Tarakji et al.2 It is not known if these cases constitute true vaccine-associated LP or LDE or if unmeasured confounding factors such as concurrent medications or comorbidities may have contributed to the development of these AEs.
It also is interesting to note that LP and LDE affected mainly middle-aged women. An increased risk of autoimmunity in female adults partly explains this observation.25 Some vaccines, such as herpes zoster and influenza vaccines, generally are recommended for older adults who also are more likely to have multiple comorbidities or take multiple medications/supplements, which can potentially skew the prevalence of AEs toward an older age group. It should be noted, however, that LP and LDE were relatively uncommon AEs following vaccination in the current study. In this study, LP and LDE consisted of only 0.01% (N=42,230) of all AEs after hepatitis B vaccination, while the more common AEs such as pyrexia, nonspecific rashes, nonspecific gastrointestinal symptoms, and headache contributed to approximately 66.5% of all reported events.
One of the strengths of our study is that up to two-thirds of cases were confirmed histologically and all patients were seen and followed up by dermatologists or physicians. The VAERS is an easily accessible, up-to-date, and live reporting system that collects all AEs associated with vaccines in the United States. Important clinical and laboratory information usually is available in the database; however, the main limitation is that this study can only demonstrate a possible association but not a causal relationship between vaccination and LP or LDE. There can be various sources of biases such as underreporting, overreporting, or inaccurate reporting.26,27 Pertinent clinical information (eg, new medications, new dental fillings/implants) that could potentially misrepresent the actual relationship between vaccination and development of AEs also was not available in the VAERS database. A cohort study with long-term follow-up or a large-scale case-control study would be useful in evaluating such associations.
Conclusion
Lichen planus and LDE can occur, albeit rarely, after vaccination, especially following hepatitis B vaccination. When middle-aged adults present to the clinic with LP or LDE, it is important to inquire about recent vaccination history in addition to a detailed medication history.
- Asarch A, Gottlieb AB, Lee J, et al. Lichen planus-like eruptions: an emerging side effect of tumor necrosis factor-alpha antagonists. J Am Acad Dermatol. 2009;61:104-111.
- Tarakji B, Ashok N, Alakeel R, et al. Hepatitis B vaccination and associated oral manifestations: a non-systemic review of literature and case reports. Ann Med Health Sci Res. 2014;4:829-836.
- Akay BN, Arslan A, Cekirge S, et al. The first reported case of lichen planus following inactivated influenza vaccination. J Drugs Dermatol. 2007;6:536-538.
- Sato NA, Kano Y, Shiohara T. Lichen planus occurring after influenza vaccination: report of three cases and review of the literature. Dermatology. 2010;221:296-299.
- Centers for Disease Control and Prevention. Hepatitis B FAQs for the public. https://www.cdc.gov/hepatitis/hbv/bfaq.htm. Updated May 23, 2016. Accessed April 4, 2017.
- Centers for Disease Control and Prevention. Prevention and control of seasonal influenza with vaccines: recommendations of the Advisory Committee on Immunization Practices (ACIP)—United States, 2013-2014. MMWR Recomm Rep. 2013;62:1-43.
- Rebora A. Hepatitis viruses and lichen planus. Arch Dermatol. 1994;130:1328-1329.
- Black MM. Lichen planus and lichenoid disorders. In: Rook A, Wilkinson DS, Ebling FJG, eds. Textbook of Dermatology. 6th ed. London, England: Blackwell Science Inc; 1998:1899-1890.
- Ghasri P, Roehmholdt BF, Young LC. A case of lichen planus following Tdap vaccination. J Drugs Dermatol. 2011;10:1067-1069.
- Tasanen K, Renko M, Kandelberg P, et al. Childhood lichen planus after simultaneous measles-mumps-rubella and diphtheria-tetanus-pertussis-polio vaccinations. Br J Dermatol. 2008;58:646-648.
- Shiohara T, Kano Y. Lichen planus and lichenoid dermatoses. In: Bolognia JL, Jorizzo J, Rapini RP, eds. Dermatology. 2nd ed. New York, NY: Mosby Elsevier; 2008:159-180.
- Miller CS, Epstein JB, Hall EH, et al. Changing oral care needs in the United States: the continuing need for oral medicine. Oral Surg Oral Med Oral Pathol Oral Radiol Endod. 2001;91:34-44.
- Bouquot JE, Gorlin RJ. Leukoplakia, lichen planus, and other oral keratoses in 23,616 white Americans over the age of 35 years. Oral Surg Oral Med Oral Pathol. 1986;61:373-381.
- Axéll T, Rundquist L. Oral lichen planus—a demographic study. Community Dent Oral Epidemiol. 1987;15:52-56.
- Alabi GO, Akinsanya JB. Lichen planus in tropical Africa. Trop Geogr Med. 1981;33:143-147.
- Pannell RS, Fleming DM, Cross KW. The incidence of molluscum contagiosum, scabies and lichen planus. Epidemiol Infect. 2005;133:985-991.
- Ciaccio M, Rebora A. Lichen planus following HBV vaccination: a coincidence? Br J Dermatol. 1990;122:424.
- Sugerman PB, Satterwhite K, Bigby M. Autocytotoxic T-cell clones in lichen planus. Br J Dermatol. 2000;142:449-456.
- Yawalkar N, Pichler WJ. Mechanisms of cutaneous drug reactions [in German]. J Dtsch Dermatol Ges. 2004;2:1013-1023; quiz 1024-1026.
- Yawalkar N, Pichler WJ. Immunohistology of drug-induced exanthema: clues to pathogenesis. Curr Opin Allergy Clin Immunol. 2001;1:299-303.
- Yawalkar N, Egli F, Hari Y, et al. Infiltration of cytotoxic T cells in drug-induced cutaneous eruptions. Clin Exp Allergy. 2000;30:847-855.
- Yawalkar N, Shrikhande M, Hari Y, et al. Evidence for a role for IL-5 and eotaxin in activating and recruiting eosinophils in drug-induced cutaneous eruptions. J Allergy Clin Immunol. 2000;106:1171-1176.
- Grabenstein JD. Immu
noFacts 2013: Vaccines and Immunologic Drugs. St Louis, MO: Wolters Kluwer Health; 2012. - Drago F, Rebora A. Cutaneous immunologic reactions to hepatitis B virus vaccine. Ann Intern Med. 2002;136:780.
- Quintero OL, Amador-Patarroyo MJ, Montoya-Ortiz G, et al. Autoimmune disease and gender: plausible mechanisms for the female predominance of autoimmunity [published online November 12, 2011]. J Autoimmun. 2012;38:J109-J119.
- Geier DA, Geier MR. A case-control study of serious autoimmune adverse events following hepatitis B immunization. Autoimmunity. 2005;38:295-301.
- Geier DA, Geier MR. A case-control study of quadrivalent human papillomavirus vaccine-associated autoimmune adverse events. Clin Rheumatol. 2015;34:1225-1231.
Lichen planus (LP) is a chronic inflammatory dermatosis of unknown origin that involves the skin and mucous membranes, and lichenoid drug eruption (LDE) is an uncommon cutaneous adverse reaction to a medication.1 The manifestations resemble each other clinically, and sometimes it is difficult to differentiate between them on histology. The pathogenesis still is not well characterized, especially the key initiating event that leads to the development of LP or LDE postimmunization. There have been reports of LP or LDEs after certain vaccines, especially the hepatitis B and influenza vaccines.2-4 Both vaccines are routinely administered in the United States; more than 100 million individuals have received the hepatitis B vaccine in the United States since it became available in 1982,5 and the Advisory Committee on Immunization Practices of the Centers for Disease Control and Prevention (CDC) recommends that all individuals 6 months or older receive an influenza vaccine every year.6 Currently, influenza vaccine coverage among adults 18 years or older reaches approximately 40% annually in the United States.6
Although certain viral infections (eg, hepatitis C virus) seem to play a role in the development of LP,7,8 the link between LP and hepatitis B vaccination is less well recognized. Reports of LP and LDE after vaccination have been largely limited to case reports and case series.2-4,9,10 Therefore, we aimed to characterize and review cases of LP and LDE following vaccination by analyzing the Vaccine Adverse Event Reporting System (VAERS) database.
Methods
The VAERS is a national vaccine safety surveillance database maintained jointly by the CDC and the US Food and Drug Administration to analyze adverse events (AEs) following immunizations. Serious AEs and deaths recorded in the VAERS were followed up periodically by VAERS staff. Information on vaccine-associated LP or LDE was retrieved from the VAERS database using the CDC WONDER online interface (http://wonder.cdc.gov/vaers.html). To examine if LP or LDE after vaccination occurred more frequently in patients with certain demographic risk factors, all reported cases of LP and LDE associated with vaccines administered from July 1990 to November 2014 were identified in the symptoms section of the VAERS system using the search terms lichen planus, oral lichen planus, and lichenoid drug eruption. Characteristics such as age, gender, time to onset, type of vaccine, method of diagnosis, and clinical outcome were collected.
The statistical package for social sciences (SPSS version 22) was utilized for the descriptive analysis. Fisher exact and χ2 tests were used to evaluate statistical significance. A 2-sided P value of <.05 was considered statistically significant.
Results
There were 434,943 reported AEs following vaccination in the VAERS database from July 1990 to November 2014; among them, 33 cases involved LP or LDE. Of these vaccine-associated AEs, LP was diagnosed in 23 (69.7%) cases, while LDE and oral LP were diagnosed in 6 (18.2%) and 4 (12.1%) cases, respectively. Females represented slightly more than half (57.6% [19/33]) of the total cases. The median age of onset was 47 years. Approximately two-thirds of the identified cases were confirmed on skin biopsy and histology, while the rest were diagnosed either by a dermatologist or a primary care physician. The time to onset of symptoms ranged from 1 to 297 days after vaccination, with a median time of 14 days.
Patients with LP or LDE were significantly older compared to the reported AEs overall (P<.001); the median age of onset was 47 years for LP or LDE compared to 24 years for all reported AEs. Table 1 shows the various vaccines associated with LP or LDE. The hepatitis B, influenza, and herpes zoster vaccines were the 3 most common types of vaccines associated with these conditions. The hepatitis B vaccine accounted for 24.2% (8/33) of the reported events, followed by influenza (18.2% [6/33]) and herpes zoster (15.2% [5/33]) vaccines. In addition, there were 3 cases of cutaneous reaction after receiving the combination hepatitis A and hepatitis B vaccine. Table 2 presents details of the reported events associated with hepatitis B, influenza, herpes zoster, combination hepatitis A and hepatitis B, and hepatitis A vaccination.
Of 8 AEs associated with hepatitis B vaccination, 1 AE resulted in permanent disability and required hospitalization. O
Comment
The estimated prevalence of LP ranges from 0.22% to 5% worldwide,11-15 with an incidence of 0.032% to 0.037%.16 Although rare, LP and LDE can occur from certain medications or vaccines. Cases of LP have been reported after hepatitis B and influenza vaccinations. The first case of LP following hepatitis B vaccination was described by Ciaccio and Rebora17 in 1990. Since then, a total of 50 similar cases have been reported worldwide.2 There also have been reports of LP following influenza, tetanus-diphtheria-pertussis, measles-mumps-rubella, and inactivated polio vaccines.3,4,9,10 Table 3 summarizes cases of LP following various vaccinations.
The key initiating event of the pathogenesis for both LP and LDE is not completely understood. Both conditions share similar immunologic mechanisms of persistently activated CD8 autocytotoxic T lymphocytes against epidermal cells.18 These cells can induce apoptosis of basal epidermal keratinocytes and generate various cytokines (eg, IFN-γ, IL-5) to enhance expression of class II MHC molecules and antigen presentation to CD4 T cells.19-22 It is conceivable that one of the initiating factors may be related to components in vaccines.
Hepatitis B, influenza, and herpes zoster vaccines were the 3 most common vaccines implicated in postimmunization LP or LDEs in our study. The excipients of these vaccines were compared based on the product inserts to identify any common components. It was found that all 3 vaccines contain either yeast protein or egg protein with various forms of phosphate buffers, while the hepatitis A and herpes zoster vaccines share Medical Research Council cell strain 5 (human diploid) cells as well as other cellular components.23 Sato et al4 suggested that specific vaccine components, such as the vaccine itself or egg proteins, could have contributed to the development of LP following vaccination. It has been postulated that the protein S fraction of hepatitis B surface antigen plays a crucial role in the pathogenesis of both LP and LDE after hepatitis B vaccination.2,24 It is likely that protein S shares common epitopes on keratinocytes that are recognized by the immune system, thus activating cytotoxic T lymphocytes and inducing apoptosis.2,24
In this study, the median time to onset of vaccine-related LP was 14 days, which is consistent with a case series by Sato et al,4 suggesting that adverse reactions mainly occurred within 2 weeks after influenza vaccination. Onset of symptoms within 2 weeks of vaccination would therefore be a crucial clue for diagnosing possible vaccine-related LP or LDE. On the other hand, at least 4 patients in our study had onset of LP and LDE more than 1 month after vaccination; 2 of 4 cases even reported symptom onset at 175 and 297 days after hepatitis B vaccination, which were much longer than the 120 days reported by Tarakji et al.2 It is not known if these cases constitute true vaccine-associated LP or LDE or if unmeasured confounding factors such as concurrent medications or comorbidities may have contributed to the development of these AEs.
It also is interesting to note that LP and LDE affected mainly middle-aged women. An increased risk of autoimmunity in female adults partly explains this observation.25 Some vaccines, such as herpes zoster and influenza vaccines, generally are recommended for older adults who also are more likely to have multiple comorbidities or take multiple medications/supplements, which can potentially skew the prevalence of AEs toward an older age group. It should be noted, however, that LP and LDE were relatively uncommon AEs following vaccination in the current study. In this study, LP and LDE consisted of only 0.01% (N=42,230) of all AEs after hepatitis B vaccination, while the more common AEs such as pyrexia, nonspecific rashes, nonspecific gastrointestinal symptoms, and headache contributed to approximately 66.5% of all reported events.
One of the strengths of our study is that up to two-thirds of cases were confirmed histologically and all patients were seen and followed up by dermatologists or physicians. The VAERS is an easily accessible, up-to-date, and live reporting system that collects all AEs associated with vaccines in the United States. Important clinical and laboratory information usually is available in the database; however, the main limitation is that this study can only demonstrate a possible association but not a causal relationship between vaccination and LP or LDE. There can be various sources of biases such as underreporting, overreporting, or inaccurate reporting.26,27 Pertinent clinical information (eg, new medications, new dental fillings/implants) that could potentially misrepresent the actual relationship between vaccination and development of AEs also was not available in the VAERS database. A cohort study with long-term follow-up or a large-scale case-control study would be useful in evaluating such associations.
Conclusion
Lichen planus and LDE can occur, albeit rarely, after vaccination, especially following hepatitis B vaccination. When middle-aged adults present to the clinic with LP or LDE, it is important to inquire about recent vaccination history in addition to a detailed medication history.
- Asarch A, Gottlieb AB, Lee J, et al. Lichen planus-like eruptions: an emerging side effect of tumor necrosis factor-alpha antagonists. J Am Acad Dermatol. 2009;61:104-111.
- Tarakji B, Ashok N, Alakeel R, et al. Hepatitis B vaccination and associated oral manifestations: a non-systemic review of literature and case reports. Ann Med Health Sci Res. 2014;4:829-836.
- Akay BN, Arslan A, Cekirge S, et al. The first reported case of lichen planus following inactivated influenza vaccination. J Drugs Dermatol. 2007;6:536-538.
- Sato NA, Kano Y, Shiohara T. Lichen planus occurring after influenza vaccination: report of three cases and review of the literature. Dermatology. 2010;221:296-299.
- Centers for Disease Control and Prevention. Hepatitis B FAQs for the public. https://www.cdc.gov/hepatitis/hbv/bfaq.htm. Updated May 23, 2016. Accessed April 4, 2017.
- Centers for Disease Control and Prevention. Prevention and control of seasonal influenza with vaccines: recommendations of the Advisory Committee on Immunization Practices (ACIP)—United States, 2013-2014. MMWR Recomm Rep. 2013;62:1-43.
- Rebora A. Hepatitis viruses and lichen planus. Arch Dermatol. 1994;130:1328-1329.
- Black MM. Lichen planus and lichenoid disorders. In: Rook A, Wilkinson DS, Ebling FJG, eds. Textbook of Dermatology. 6th ed. London, England: Blackwell Science Inc; 1998:1899-1890.
- Ghasri P, Roehmholdt BF, Young LC. A case of lichen planus following Tdap vaccination. J Drugs Dermatol. 2011;10:1067-1069.
- Tasanen K, Renko M, Kandelberg P, et al. Childhood lichen planus after simultaneous measles-mumps-rubella and diphtheria-tetanus-pertussis-polio vaccinations. Br J Dermatol. 2008;58:646-648.
- Shiohara T, Kano Y. Lichen planus and lichenoid dermatoses. In: Bolognia JL, Jorizzo J, Rapini RP, eds. Dermatology. 2nd ed. New York, NY: Mosby Elsevier; 2008:159-180.
- Miller CS, Epstein JB, Hall EH, et al. Changing oral care needs in the United States: the continuing need for oral medicine. Oral Surg Oral Med Oral Pathol Oral Radiol Endod. 2001;91:34-44.
- Bouquot JE, Gorlin RJ. Leukoplakia, lichen planus, and other oral keratoses in 23,616 white Americans over the age of 35 years. Oral Surg Oral Med Oral Pathol. 1986;61:373-381.
- Axéll T, Rundquist L. Oral lichen planus—a demographic study. Community Dent Oral Epidemiol. 1987;15:52-56.
- Alabi GO, Akinsanya JB. Lichen planus in tropical Africa. Trop Geogr Med. 1981;33:143-147.
- Pannell RS, Fleming DM, Cross KW. The incidence of molluscum contagiosum, scabies and lichen planus. Epidemiol Infect. 2005;133:985-991.
- Ciaccio M, Rebora A. Lichen planus following HBV vaccination: a coincidence? Br J Dermatol. 1990;122:424.
- Sugerman PB, Satterwhite K, Bigby M. Autocytotoxic T-cell clones in lichen planus. Br J Dermatol. 2000;142:449-456.
- Yawalkar N, Pichler WJ. Mechanisms of cutaneous drug reactions [in German]. J Dtsch Dermatol Ges. 2004;2:1013-1023; quiz 1024-1026.
- Yawalkar N, Pichler WJ. Immunohistology of drug-induced exanthema: clues to pathogenesis. Curr Opin Allergy Clin Immunol. 2001;1:299-303.
- Yawalkar N, Egli F, Hari Y, et al. Infiltration of cytotoxic T cells in drug-induced cutaneous eruptions. Clin Exp Allergy. 2000;30:847-855.
- Yawalkar N, Shrikhande M, Hari Y, et al. Evidence for a role for IL-5 and eotaxin in activating and recruiting eosinophils in drug-induced cutaneous eruptions. J Allergy Clin Immunol. 2000;106:1171-1176.
- Grabenstein JD. Immu
noFacts 2013: Vaccines and Immunologic Drugs. St Louis, MO: Wolters Kluwer Health; 2012. - Drago F, Rebora A. Cutaneous immunologic reactions to hepatitis B virus vaccine. Ann Intern Med. 2002;136:780.
- Quintero OL, Amador-Patarroyo MJ, Montoya-Ortiz G, et al. Autoimmune disease and gender: plausible mechanisms for the female predominance of autoimmunity [published online November 12, 2011]. J Autoimmun. 2012;38:J109-J119.
- Geier DA, Geier MR. A case-control study of serious autoimmune adverse events following hepatitis B immunization. Autoimmunity. 2005;38:295-301.
- Geier DA, Geier MR. A case-control study of quadrivalent human papillomavirus vaccine-associated autoimmune adverse events. Clin Rheumatol. 2015;34:1225-1231.
Practice Points
- Lichen planus (LP) and lichenoid drug eruptions (LDEs) can uncommonly occur after vaccination.
- Common vaccines associated with LP and LDEs include hepatitis B and influenza vaccinations.
- It is important to be cognizant of such reactions, especially in patients who have recently received these common vaccines.
Minimally Invasive Anatomical Reconstruction of Posteromedial Corner of Knee: A Cadaveric Study
Take-Home Points
- Injuries to the medial knee are the most common knee ligament injuries, and often occur in the athletic population.
- Complete posteromedial corner injuries require surgical treatment to restore joint stability and biomechanics.
- Biomechanical evidence has demonstrated an important load-sharing distribution between the sMCL and the POL.
- Valgus instability caused by a medial side injury, can lead to both ACL/posterior cruciate ligament reconstruction graft failure if the medial sided injury is not concurrently repaired or reconstructed.
- Anatomic posteromedial corner reconstruction yields excellent biomechanical and patient-reported outcomes.
Most injuries of the medial structures of the knee are treated conservatively.1-3 In severe acute injuries and chronic symptomatic instabilities, however, surgical treatment is needed to restore knee stability and to prevent degenerative changes secondary to instability.4 Three structures involved in medial stability are the superficial medial collateral ligament (sMCL), which is the primary valgus restraint; the posterior oblique ligament (POL), which is the primary restraint to internal rotation and the secondary valgus restraint; and the semimembranosus.5,6
Surgical techniques for posteromedial knee reconstruction include direct repair,7 repair with augmentation,8,9 advancement of the tibial insertion of the sMCL,10 and transfer of the pes anserine tendons.11 In anatomical reconstruction of the posteromedial corner, which has been described before, the sMCL and the POL are reconstructed to reproduce the native motion and stability of the knee.12 Clinically, repair and reconstruction have similar patient-reported outcomes and medial opening evaluations over the short term.
These approaches require large incisions and extensive dissection of soft tissue on the medial aspect of the knee.5 Given these drawbacks, it is reasonable to consider less invasive options. Minimally invasive surgery has the advantages of reduced scarring and blood loss, less disruption of surrounding tissue, faster recovery, and improved aesthetics.4
We conducted a study of a minimally invasive technique for reconstructing the posteromedial structures of the knee. We compared medial compartment stability measured on valgus stress radiographs in intact, sectioned, and reconstructed states in cadaveric knees. We hypothesized that a minimally invasive technique using autogenous hamstring graft in the appropriate anatomical location would return valgus stability to its nearly native state.
Materials and Methods
This study was conducted at the Buenos Aires British Hospital in Buenos Aires, Argentina, and at the University of Colorado Hospital in Aurora. Ten fresh-frozen cadaveric knees with no evidence of ligamentous injuries, osteoarthritis, or previous surgery were used. Mean donor age was 69.4 years (range, 45-87 years). Each specimen was maintained at room temperature for 24 hours before use. The femur was sectioned 20 cm proximal to the knee joint. The tibia was sectioned 12.5 cm distal to the knee joint.
Identification and Sectioning of Posteromedial Structures
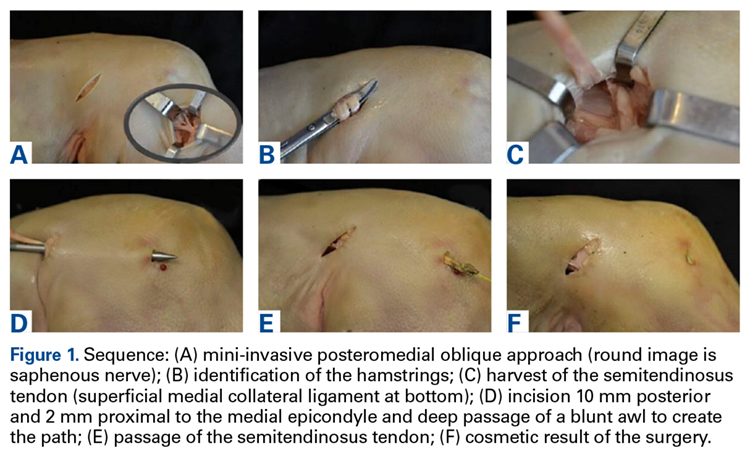
After intact-state evaluation, each knee’s sMCL, dMCL, and POL were sectioned at their tibial insertion. Valgus stress radiograph was repeated and medial compartment gap was remeasured for comparison of the sectioned state with the intact and reconstructed states.
Anatomical Reconstruction With Mini-Invasive Technique
After sectioning of medial stabilizing structures, minimally invasive reconstruction was performed through 2 small incisions on the medial aspect of each of the 10 knees, as follows. First, the semitendinosus tendon was identified through the oblique incision that had been used for sectioning. Then, an open-ended tendon stripper was placed around the circumference of the semitendinosus and was passed proximomedially, transecting the tendon at its musculotendinous junction. While the tendon stripper was being passed, care was taken to maintain the nearby tibial insertion of the sartorius fascia (Figures 1D-1F).
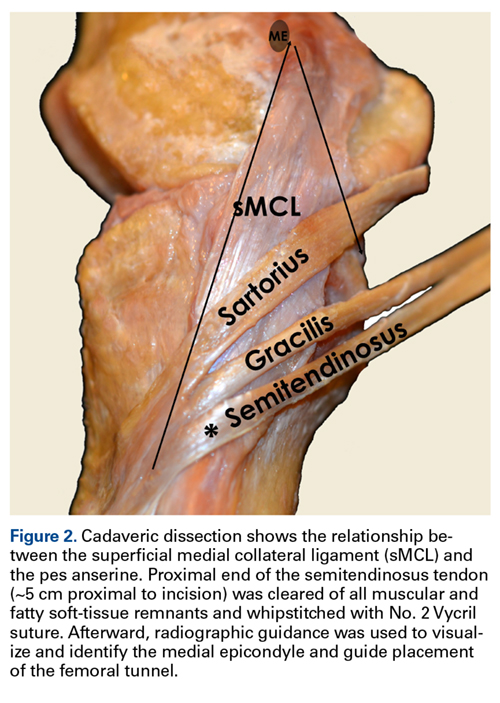
With the semitendinosus tendon looped around the wire, isometricity was tested by pulling the suture within the tendon and moving the knee through a full range of motion. The isometric point was confirmed by tendon migration of <2 mm.13 Migration was measured by marking the graft 2 mm from its insertion; the graft was then pulled to ensure correct isometric point position. An 18-mm cannulated spiked screw and washer (Arthrex) were then passed over the wire and partially secured to the femur—the attachment point for the proximal sMCL portion of the semitendinosus graft. The semitendinosus tendon was then secured beneath the spiked washer with the knee in 20° of flexion with neutral rotation, recreating the sMCL.
Posteriorly, the distal insertion site of the POL was identified at the posteromedial aspect of the tibia through the oblique incision previously described. A 7-mm tunnel was drilled starting posteromedial (10 mm under tibial articular surface) and exiting just distal and medial to the Gerdy tubercle.
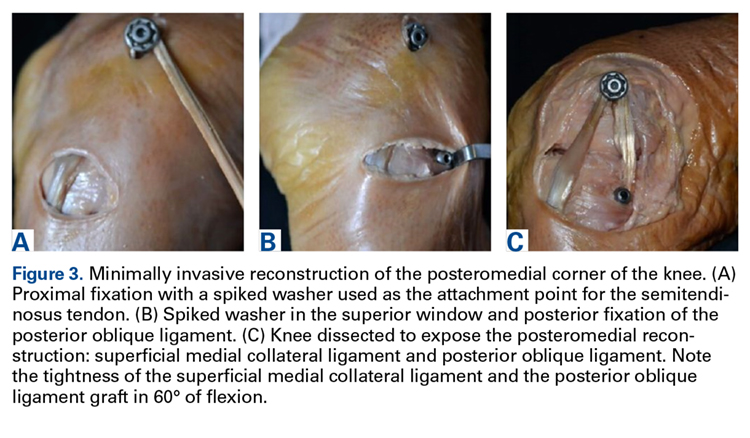
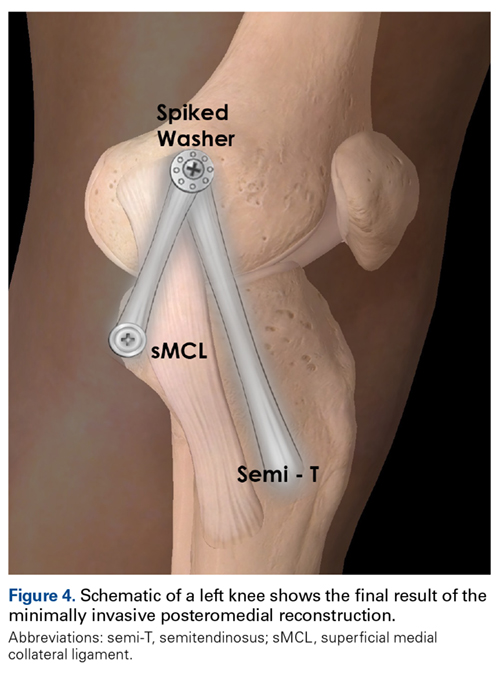
After final fixation, the medial knee was openly dissected to assess the inverted-V ligament reconstruction for anatomical placement and avoidance of crucial structures.
Stability Testing
Per International Knee Documentation Committee guidelines for stressing the medial compartment,14 valgus stress radiographs were obtained for all specimens at 0° and 20° of flexion in intact, sectioned, and reconstructed states.
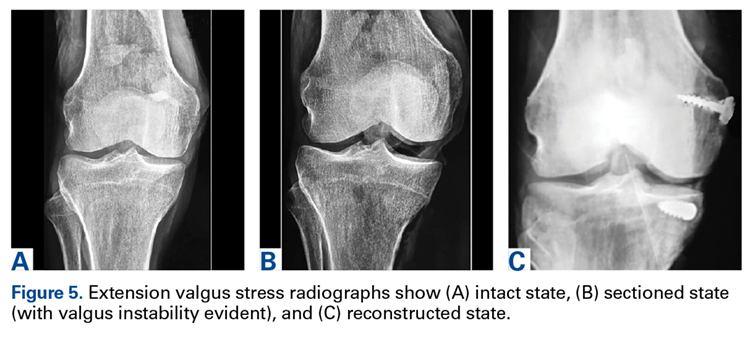
The medial gap formed by the femoral condyle and its corresponding tibial plateau (at site of maximal separation) was tested in all 3 state conditions (intact, sectioned, reconstructed). Distances were digitally measured with a picture archiving and communication system viewer (Imagecast; IDX Systems Corporation). Medial gap was measured by taking the shortest distance between the subchondral bone surface of the most distal aspect of the medial femoral condyle and the corresponding medial tibial plateau. Three independent examiners took all the measurements; each examiner was blinded to the others’ measurements.
Statistics
Paired Student t tests were used to compare the 3 conditions, and the Shapiro-Wilk test was used to check for a normally distributed population. Statistical significance was set at P < .05. Statistical analyses were performed with GraphPad software.
Results
In all 10 specimens, the sMCL, the dMCL, and the POL were successfully identified and sectioned through a medial oblique incision over the distal insertion of the structures.
During all valgus testing states, there was no loss of graft fixation, and there was no gross graft slippage. In addition, all grafts remained in continuity with no evidence of failure, and there were no failures or breakages of the proximal or distal screw.
After posteromedial sectioning, mean medial gap was statistically significantly larger (P = .0002) at full extension (11 mm vs 3.3 mm) and at 20° of flexion (12.6 mm vs 3.8 mm). There was no statistically significant difference between the value of the intact state and the value after minimally invasive reconstruction at 0° (P = .56) or 20° (P = .102) of flexion.
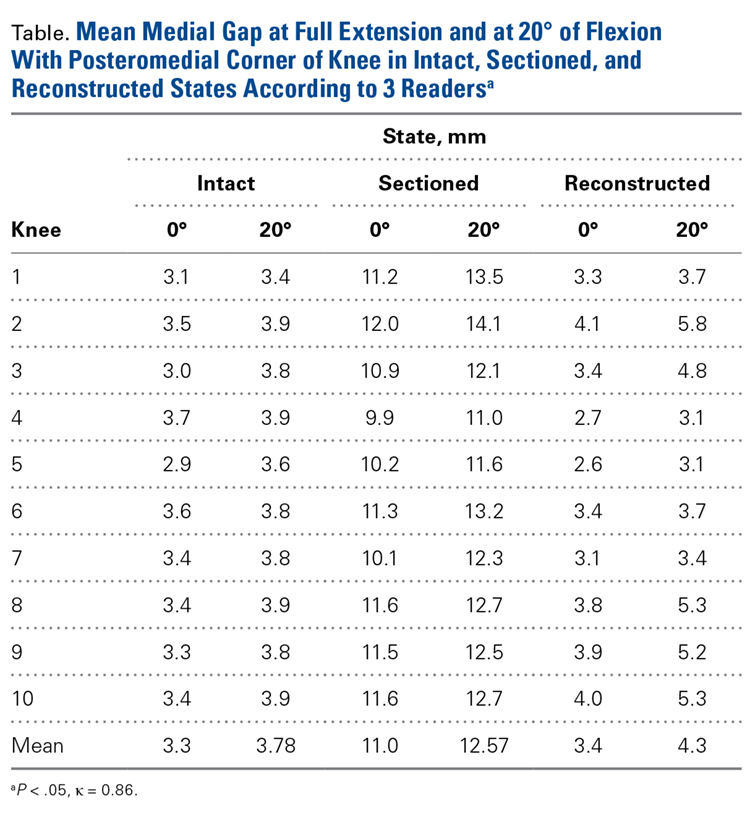
Discussion
In this article, we describe a minimally invasive technique for anatomical posteromedial reconstruction of the knee in a cadaveric model. This technique restores the knee’s native valgus stability without causing extensive damage to the surrounding soft tissues and thereby potentially prevents scar formation and reduces blood loss.
Superficial MCL injury, one of the most common knee ligament injuries, is often associated with POL injury.7 Although most sMCL injuries are treated nonoperatively, with good results,3 surgical treatment is needed for severe (grade III) instabilities, symptomatic chronic instabilities, and knee dislocations.12,17 Most posteromedial reconstruction techniques require an extensive approach that causes damage to surrounding soft tissue,6,7,9,10 which in turn may compromise healing and positive patient outcomes. Surgical techniques include direct repair with sutures or anchors,18 capsular procedures,19 augmentations,9 internal bracing,6 and complete reconstruction of the posteromedial corner.20
LaPrade and Wijdicks12 have previously described anatomical reconstruction of the posteromedial corner. In their technique, a split semitendinosus autograft is used to reconstruct the sMCL and the POL separately, using 4 implants and reproducing each ligament’s anatomical attachment site. In this proposed technique, the distal attachment of the semitendinosus insertion is left intact, and uses 1 attachment point on the distal femur and 1 on the proximal tibia, allowing use of only 2 implants. In addition, it is performed with a minimally invasive approach, reduces cost, limits surgical exposure, and with experience may shorten operative time. To reduce the graft failure rate, the technique of LaPrade and Wijdicks12 positions the sMCL tibial attachment as posterior as possible, which can be performed with this minimally invasive approach as well.
To reduce the graft failure rate, the technique of LaPrade and Wijdicks12 positions the sMCL as posterior as possible. Despite the potential for increased graft stress with an anterior position, as in our modified technique, our group of 10 knees had no graft fixation failures in isolated valgus stress testing in either extension or flexion. Our minimally invasive posteromedial knee reconstruction significantly improved knee stability over the sectioned state as well as medial compartment gapping with valgus stress. There was no significant difference in medial compartment gapping between the intact and reconstructed states.
Our technique was built on open procedures (described by Kim and colleagues13) that carefully identify the isometric point of the graft. In addition, it adopted the modification (proposed by Lind and colleagues21) in which a fixation point is added at the distal insertion of the POL instead of being sutured to the direct arm of the semitendinosus tendon.
Furthermore, our technique, despite being similar to those described by Dong and colleagues22 and Borden and colleagues,23 has the advantages of minimally invasive surgery and reduced disruption of soft tissues. Dong and colleagues22 reported on 64 patients with a mean follow-up of 34 months; patients’ medial opening measurements were significantly decreased at follow-up and fell within the normal range.
The present study had several limitations. First, the age of our specimens was higher than the mean age of patients with knee ligament injury, potentially leading to firmer or more fibrotic tendons less susceptible to elongation. Second, we did not evaluate the knees’ rotational stability, and anterior cruciate ligaments (ACLs) were intact. As most posteromedial injuries co-occur with ACL injuries, a more realistic situation would have been reproduced by assessing rotational stability while performing both ACL reconstruction and the proposed posteromedial reconstruction. Third, static specimen measurements do not reflect the dynamic function of the posteromedial corner. Prospective clinical studies are needed to assess the true effectiveness of the posteromedial corner in the clinical scenario.
Knowledge of the anatomy of the medial aspect of the knee is vital to reconstruction of the medial side of the knee. Our results suggest that a minimally invasive technique can restore valgus stability without the need for extensive dissection and disruption of surrounding soft tissues. More research is needed to determine the results of this technique in vivo.
1. Ellsasser JC, Reynolds FC, Omohundro JR. The non-operative treatment of collateral ligament injuries of the knee in professional football players. An analysis of seventy-four injuries treated non-operatively and twenty-four injuries treated surgically. J Bone Joint Surg Am. 1974;56(6):1185-1190.
2. Indelicato PA. Non-operative treatment of complete tears of the medial collateral ligament of the knee. J Bone Joint Surg Am. 1983;65(3):323-329.
3. Indelicato PA, Hermansdorfer J, Huegel M. Nonoperative management of complete tears of the medial collateral ligament of the knee in intercollegiate football players. Clin Orthop Rel Res. 1990;(256):174-177.
4. Jeng CL, Bluman EM, Myerson MS. Minimally invasive deltoid ligament reconstruction for stage IV flatfoot deformity. Foot Ankle Int. 2011;32(1):21-30.
5. Coobs BR, Wijdicks CA, Armitage BM, et al. An in vitro analysis of an anatomical medial knee reconstruction. Am J Sports Med. 2010;38(2):339-347.
6. Lubowitz JH, MacKay G, Gilmer B. Knee medial collateral ligament and posteromedial corner anatomic repair with internal bracing. Arthrosc Tech. 2014;3(4):e505-e508.
7. Hughston JC, Eilers AF. The role of the posterior oblique ligament in repairs of acute medial (collateral) ligament tears of the knee. J Bone Joint Surg Am. 1973;55(5):923-940.
8. Gorin S, Paul DD, Wilkinson EJ. An anterior cruciate ligament and medial collateral ligament tear in a skeletally immature patient: a new technique to augment primary repair of the medial collateral ligament and an allograft reconstruction of the anterior cruciate ligament. Arthroscopy. 2003;19(10):E21-E26.
Take-Home Points
- Injuries to the medial knee are the most common knee ligament injuries, and often occur in the athletic population.
- Complete posteromedial corner injuries require surgical treatment to restore joint stability and biomechanics.
- Biomechanical evidence has demonstrated an important load-sharing distribution between the sMCL and the POL.
- Valgus instability caused by a medial side injury, can lead to both ACL/posterior cruciate ligament reconstruction graft failure if the medial sided injury is not concurrently repaired or reconstructed.
- Anatomic posteromedial corner reconstruction yields excellent biomechanical and patient-reported outcomes.
Most injuries of the medial structures of the knee are treated conservatively.1-3 In severe acute injuries and chronic symptomatic instabilities, however, surgical treatment is needed to restore knee stability and to prevent degenerative changes secondary to instability.4 Three structures involved in medial stability are the superficial medial collateral ligament (sMCL), which is the primary valgus restraint; the posterior oblique ligament (POL), which is the primary restraint to internal rotation and the secondary valgus restraint; and the semimembranosus.5,6
Surgical techniques for posteromedial knee reconstruction include direct repair,7 repair with augmentation,8,9 advancement of the tibial insertion of the sMCL,10 and transfer of the pes anserine tendons.11 In anatomical reconstruction of the posteromedial corner, which has been described before, the sMCL and the POL are reconstructed to reproduce the native motion and stability of the knee.12 Clinically, repair and reconstruction have similar patient-reported outcomes and medial opening evaluations over the short term.
These approaches require large incisions and extensive dissection of soft tissue on the medial aspect of the knee.5 Given these drawbacks, it is reasonable to consider less invasive options. Minimally invasive surgery has the advantages of reduced scarring and blood loss, less disruption of surrounding tissue, faster recovery, and improved aesthetics.4
We conducted a study of a minimally invasive technique for reconstructing the posteromedial structures of the knee. We compared medial compartment stability measured on valgus stress radiographs in intact, sectioned, and reconstructed states in cadaveric knees. We hypothesized that a minimally invasive technique using autogenous hamstring graft in the appropriate anatomical location would return valgus stability to its nearly native state.
Materials and Methods
This study was conducted at the Buenos Aires British Hospital in Buenos Aires, Argentina, and at the University of Colorado Hospital in Aurora. Ten fresh-frozen cadaveric knees with no evidence of ligamentous injuries, osteoarthritis, or previous surgery were used. Mean donor age was 69.4 years (range, 45-87 years). Each specimen was maintained at room temperature for 24 hours before use. The femur was sectioned 20 cm proximal to the knee joint. The tibia was sectioned 12.5 cm distal to the knee joint.
Identification and Sectioning of Posteromedial Structures
After intact-state evaluation, each knee’s sMCL, dMCL, and POL were sectioned at their tibial insertion. Valgus stress radiograph was repeated and medial compartment gap was remeasured for comparison of the sectioned state with the intact and reconstructed states.
Anatomical Reconstruction With Mini-Invasive Technique
After sectioning of medial stabilizing structures, minimally invasive reconstruction was performed through 2 small incisions on the medial aspect of each of the 10 knees, as follows. First, the semitendinosus tendon was identified through the oblique incision that had been used for sectioning. Then, an open-ended tendon stripper was placed around the circumference of the semitendinosus and was passed proximomedially, transecting the tendon at its musculotendinous junction. While the tendon stripper was being passed, care was taken to maintain the nearby tibial insertion of the sartorius fascia (Figures 1D-1F).
With the semitendinosus tendon looped around the wire, isometricity was tested by pulling the suture within the tendon and moving the knee through a full range of motion. The isometric point was confirmed by tendon migration of <2 mm.13 Migration was measured by marking the graft 2 mm from its insertion; the graft was then pulled to ensure correct isometric point position. An 18-mm cannulated spiked screw and washer (Arthrex) were then passed over the wire and partially secured to the femur—the attachment point for the proximal sMCL portion of the semitendinosus graft. The semitendinosus tendon was then secured beneath the spiked washer with the knee in 20° of flexion with neutral rotation, recreating the sMCL.
Posteriorly, the distal insertion site of the POL was identified at the posteromedial aspect of the tibia through the oblique incision previously described. A 7-mm tunnel was drilled starting posteromedial (10 mm under tibial articular surface) and exiting just distal and medial to the Gerdy tubercle.
After final fixation, the medial knee was openly dissected to assess the inverted-V ligament reconstruction for anatomical placement and avoidance of crucial structures.
Stability Testing
Per International Knee Documentation Committee guidelines for stressing the medial compartment,14 valgus stress radiographs were obtained for all specimens at 0° and 20° of flexion in intact, sectioned, and reconstructed states.
The medial gap formed by the femoral condyle and its corresponding tibial plateau (at site of maximal separation) was tested in all 3 state conditions (intact, sectioned, reconstructed). Distances were digitally measured with a picture archiving and communication system viewer (Imagecast; IDX Systems Corporation). Medial gap was measured by taking the shortest distance between the subchondral bone surface of the most distal aspect of the medial femoral condyle and the corresponding medial tibial plateau. Three independent examiners took all the measurements; each examiner was blinded to the others’ measurements.
Statistics
Paired Student t tests were used to compare the 3 conditions, and the Shapiro-Wilk test was used to check for a normally distributed population. Statistical significance was set at P < .05. Statistical analyses were performed with GraphPad software.
Results
In all 10 specimens, the sMCL, the dMCL, and the POL were successfully identified and sectioned through a medial oblique incision over the distal insertion of the structures.
During all valgus testing states, there was no loss of graft fixation, and there was no gross graft slippage. In addition, all grafts remained in continuity with no evidence of failure, and there were no failures or breakages of the proximal or distal screw.
After posteromedial sectioning, mean medial gap was statistically significantly larger (P = .0002) at full extension (11 mm vs 3.3 mm) and at 20° of flexion (12.6 mm vs 3.8 mm). There was no statistically significant difference between the value of the intact state and the value after minimally invasive reconstruction at 0° (P = .56) or 20° (P = .102) of flexion.
Discussion
In this article, we describe a minimally invasive technique for anatomical posteromedial reconstruction of the knee in a cadaveric model. This technique restores the knee’s native valgus stability without causing extensive damage to the surrounding soft tissues and thereby potentially prevents scar formation and reduces blood loss.
Superficial MCL injury, one of the most common knee ligament injuries, is often associated with POL injury.7 Although most sMCL injuries are treated nonoperatively, with good results,3 surgical treatment is needed for severe (grade III) instabilities, symptomatic chronic instabilities, and knee dislocations.12,17 Most posteromedial reconstruction techniques require an extensive approach that causes damage to surrounding soft tissue,6,7,9,10 which in turn may compromise healing and positive patient outcomes. Surgical techniques include direct repair with sutures or anchors,18 capsular procedures,19 augmentations,9 internal bracing,6 and complete reconstruction of the posteromedial corner.20
LaPrade and Wijdicks12 have previously described anatomical reconstruction of the posteromedial corner. In their technique, a split semitendinosus autograft is used to reconstruct the sMCL and the POL separately, using 4 implants and reproducing each ligament’s anatomical attachment site. In this proposed technique, the distal attachment of the semitendinosus insertion is left intact, and uses 1 attachment point on the distal femur and 1 on the proximal tibia, allowing use of only 2 implants. In addition, it is performed with a minimally invasive approach, reduces cost, limits surgical exposure, and with experience may shorten operative time. To reduce the graft failure rate, the technique of LaPrade and Wijdicks12 positions the sMCL tibial attachment as posterior as possible, which can be performed with this minimally invasive approach as well.
To reduce the graft failure rate, the technique of LaPrade and Wijdicks12 positions the sMCL as posterior as possible. Despite the potential for increased graft stress with an anterior position, as in our modified technique, our group of 10 knees had no graft fixation failures in isolated valgus stress testing in either extension or flexion. Our minimally invasive posteromedial knee reconstruction significantly improved knee stability over the sectioned state as well as medial compartment gapping with valgus stress. There was no significant difference in medial compartment gapping between the intact and reconstructed states.
Our technique was built on open procedures (described by Kim and colleagues13) that carefully identify the isometric point of the graft. In addition, it adopted the modification (proposed by Lind and colleagues21) in which a fixation point is added at the distal insertion of the POL instead of being sutured to the direct arm of the semitendinosus tendon.
Furthermore, our technique, despite being similar to those described by Dong and colleagues22 and Borden and colleagues,23 has the advantages of minimally invasive surgery and reduced disruption of soft tissues. Dong and colleagues22 reported on 64 patients with a mean follow-up of 34 months; patients’ medial opening measurements were significantly decreased at follow-up and fell within the normal range.
The present study had several limitations. First, the age of our specimens was higher than the mean age of patients with knee ligament injury, potentially leading to firmer or more fibrotic tendons less susceptible to elongation. Second, we did not evaluate the knees’ rotational stability, and anterior cruciate ligaments (ACLs) were intact. As most posteromedial injuries co-occur with ACL injuries, a more realistic situation would have been reproduced by assessing rotational stability while performing both ACL reconstruction and the proposed posteromedial reconstruction. Third, static specimen measurements do not reflect the dynamic function of the posteromedial corner. Prospective clinical studies are needed to assess the true effectiveness of the posteromedial corner in the clinical scenario.
Knowledge of the anatomy of the medial aspect of the knee is vital to reconstruction of the medial side of the knee. Our results suggest that a minimally invasive technique can restore valgus stability without the need for extensive dissection and disruption of surrounding soft tissues. More research is needed to determine the results of this technique in vivo.
1. Ellsasser JC, Reynolds FC, Omohundro JR. The non-operative treatment of collateral ligament injuries of the knee in professional football players. An analysis of seventy-four injuries treated non-operatively and twenty-four injuries treated surgically. J Bone Joint Surg Am. 1974;56(6):1185-1190.
2. Indelicato PA. Non-operative treatment of complete tears of the medial collateral ligament of the knee. J Bone Joint Surg Am. 1983;65(3):323-329.
3. Indelicato PA, Hermansdorfer J, Huegel M. Nonoperative management of complete tears of the medial collateral ligament of the knee in intercollegiate football players. Clin Orthop Rel Res. 1990;(256):174-177.
4. Jeng CL, Bluman EM, Myerson MS. Minimally invasive deltoid ligament reconstruction for stage IV flatfoot deformity. Foot Ankle Int. 2011;32(1):21-30.
5. Coobs BR, Wijdicks CA, Armitage BM, et al. An in vitro analysis of an anatomical medial knee reconstruction. Am J Sports Med. 2010;38(2):339-347.
6. Lubowitz JH, MacKay G, Gilmer B. Knee medial collateral ligament and posteromedial corner anatomic repair with internal bracing. Arthrosc Tech. 2014;3(4):e505-e508.
7. Hughston JC, Eilers AF. The role of the posterior oblique ligament in repairs of acute medial (collateral) ligament tears of the knee. J Bone Joint Surg Am. 1973;55(5):923-940.
8. Gorin S, Paul DD, Wilkinson EJ. An anterior cruciate ligament and medial collateral ligament tear in a skeletally immature patient: a new technique to augment primary repair of the medial collateral ligament and an allograft reconstruction of the anterior cruciate ligament. Arthroscopy. 2003;19(10):E21-E26.
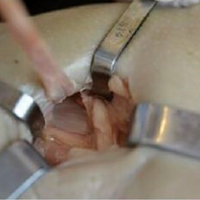
Timing of Surgical Reduction and Stabilization of Talus Fracture-Dislocations
Take-Home Points
- There is a 41% rate of AVN or PTOA after operatively managed talus fracture.
- Surgical timing does not affect development of AVN or PTOA.
- Open fractures are associated with development of AVN and PTOA.
- Quality of reduction is likely more important than timing of reduction.
- Urgent surgical treatment is necessary for threatened soft tissue or neurovascular compromise.
Talus fractures are rare injuries that present a significant treatment dilemma.1-12 These fractures represent <1% of all fractures4 and are second only to calcaneus fractures in fractures of the hindfoot. Talus fractures with associated dislocations are even rarer and may provide treating surgeons with a significant surgical quandary.6,13-16
Talus fractures historically have been characterized by their anatomical location: head, neck, or body. Two systems are commonly used to classify talus fractures: Hawkins and AO/OTA (Arbeitsgemeinschaft für Osteosynthesefragen/Orthopaedic Trauma Association). The first, developed by Hawkins7 and modified by Canale and Kelly2 and Vallier and colleagues,1 identifies 4 basic fracture types with associated dislocations. The other system, published in 199617 and republished in 2007,18 uses the combined methods of AO and OTA to systematically describe talus fractures. Although these classification systems accurately describe talus fractures with associated dislocation, both have difficulty predicting clinical outcomes.1,19,20
Talus fractures commonly result in avascular necrosis (AVN) of the talus and posttraumatic osteoarthritis (PTOA) of the tibiotalar and subtalar joints.3,8,9,12,14-16 Hawkins7 initially described subchondral lucency as indicating revascularization of the talus after injury. AVN and PTOA rates traditionally have been thought to be related to a blood supply disruption, given the prognostic value of the Hawkins sign.1,7,12,21 New methods, including a dual-incision approach and expedited transfer to foot and ankle surgeons or orthopedic traumatologists, have improved reduction quality21-24 but not patient outcomes.3,5,8,9,12,14
Recently, time from injury to surgical intervention has been a topic of much discussion, and there have been studies on the specific effects of timing with respect to outcome.1,15,16 Vallier and colleagues,1 who wanted to identify injury characteristics predictive of osteonecrosis, found that delaying reduction and surgical fixation did not increase the risk of AVN. Another study found that urgent reduction of fracture-dislocation with delayed open reduction and internal fixation (ORIF) using a dual approach may improve clinical outcomes.21
In this vein, we conducted a study to evaluate the effect of time to surgical reduction of talus fractures and talus fracture-dislocations on the development of AVN and PTOA. We hypothesized that time to surgical reduction of talus fracture-dislocation as classified with the AO/OTA system would have no effect of the development of AVN/PTOA.
Methods
After this study received Institutional Review Board approval, we retrospectively reviewed the records on talus fractures surgically managed at a level I trauma center during the 10-year period 2003 to 2013. Of the 119 potential cases identified using Current Procedural Terminology code 28445 (ORIF of talus), 13 were excluded (12 for inaccurate coding or missing documentation, 1 for being a pediatric case), leaving 106 for analysis. Using the Hawkins and AO/OTA systems, 3 independent reviewers classified the injuries on plain radiographs.
Injury dates and times were obtained from the medical records. Operating room start times were also obtained. Surgical timing was defined as time from injury to operating room start. For cases without an injury time, time of presentation to emergency department was used.
Open fracture-dislocations were managed with intravenous antibiotics, urgent surgical irrigation, débridement, and immediate fixation or temporizing external fixation after reduction. All fractures were definitively managed with standard ORIF with an anteromedial, anterolateral, or dual approach and mini-fragment implants. After fixation, weight-bearing typically was restricted for 6 to 12 weeks.
Follow-up radiographs were evaluated. Presence or absence of Hawkins sign7 was noted on radiographs at 6 or 8 weeks, and all follow-up radiographs were evaluated for AVN as defined by increased radiographic density within the talar dome or collapse of the articular surface. All radiographs were evaluated for PTOA as defined by loss of joint space within the tibiotalar, subtalar, or talonavicular joint on follow-up radiographs.
Clinical outcomes were analyzed for development of AVN, PTOA, or secondary corrective surgery or arthrodesis. Continuous variables were evaluated with the t test, and the χ2 test was used to compare distributions of categorical variables. The Wilcoxon rank sum test was used to compare non-normally distributed variables. Significance was set at P < .05.
Results
Classification Analysis (Table 1)
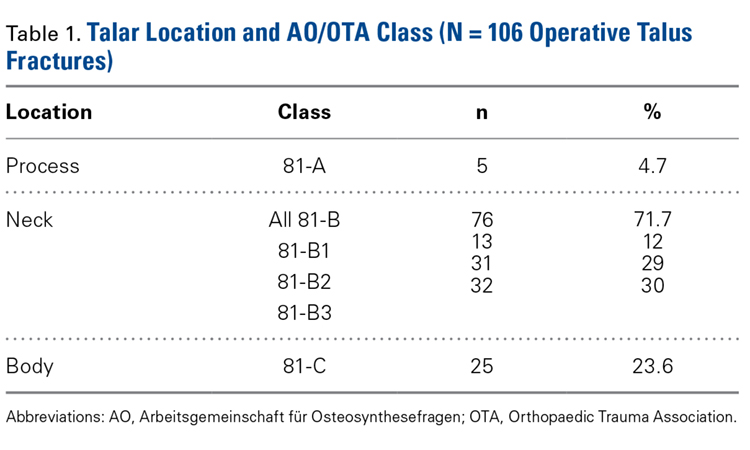
Subject Analysis (Table 2)
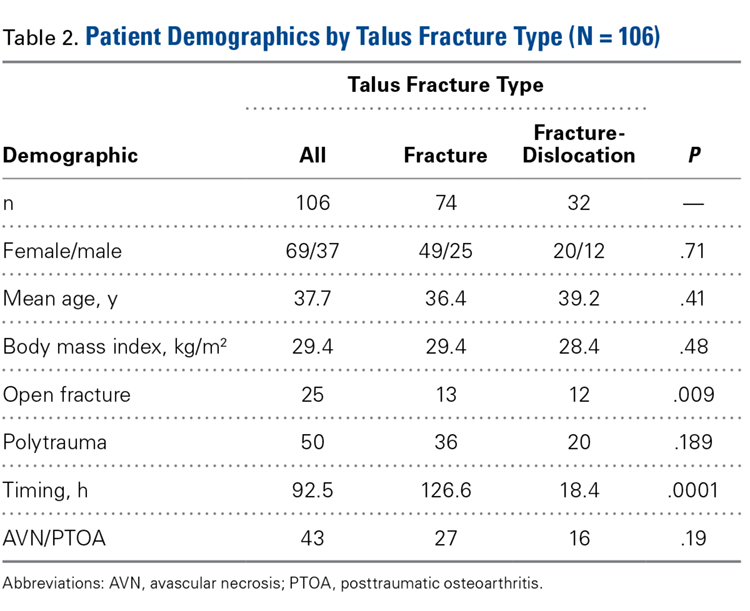
The mechanisms of injury were motor vehicle accident (70/106; 66%), fall from height (25; 24%), misstep (4), sports related (2), object falling on ankle (2), and not reported (3).
Of the 106 patients, 45 (42%) had isolated talus injuries, 35 had concomitant ipsilateral lower extremity injuries, 25 had concomitant contralateral lower extremity injuries, and 1 had a concomitant upper extremity injury.
Smoking status was everyday (14 patients), past (10), never (34), and unreported (48). Five patients reported a history of alcohol abuse, and 4 patients reported illicit drug use. Two had a history of atrial fibrillation, 9 had hypertension, 3 had hyperlipidemia, 3 had renal disease, 3 had heart disease, 4 had diabetes, 3 had lung disease, and 1 had a history of lung cancer.
Overall Analysis of AVN/PTOA (Table 3)
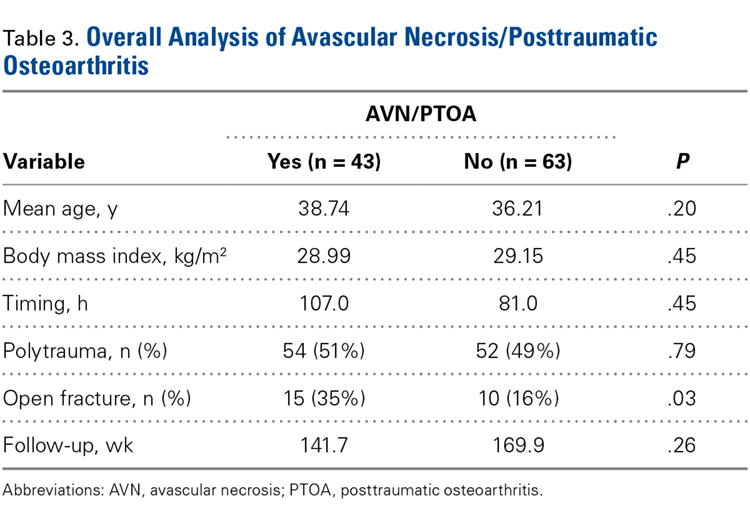
Analysis of AVN/PTOA in 81-B3 Fracture-Dislocations (Table 4)
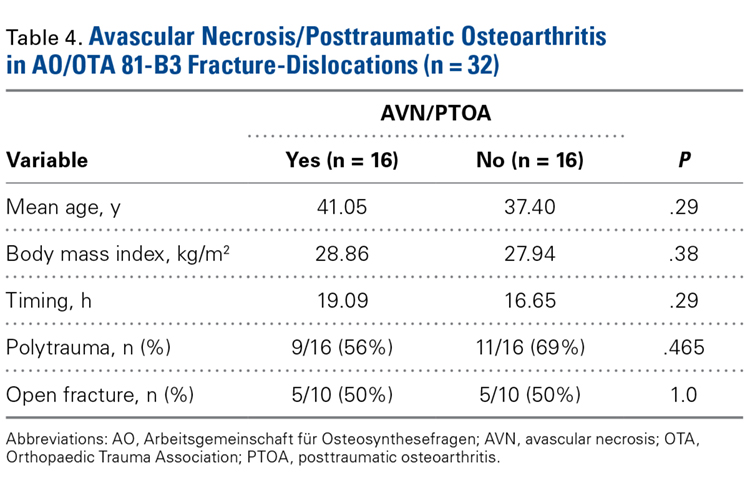
Analysis of AVN/PTOA in All Other Talus Fractures (Table 5)
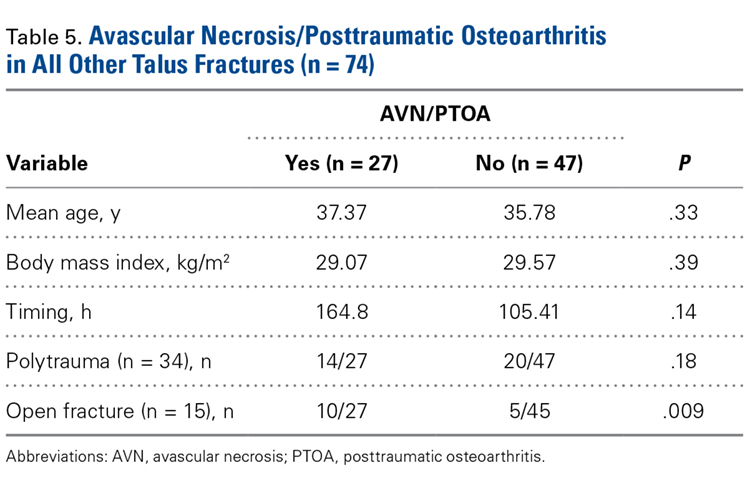
Discussion
Our results showed that time from talus fracture-dislocation to surgical reduction had no effect on development of AVN/PTOA. The findings in this largest series to date agree with earlier findings1,8,15,16,24 and add to the volume of literature suggesting that time to surgical reduction of talus fractures and talus fracture-dislocations does not markedly affect outcome.
Talus fractures continue to present a significant treatment dilemma. Despite recent improvements in surgical techniques and overall management of these injuries, rates of AVN and PTOA have not significantly decreased.1,16,23 At most treating facilities, talus fracture-dislocations are considered surgical emergencies/urgencies, and every effort is made to reduce and surgically address these injuries as soon as possible.1,13
In this study, rates of AVN/PTOA were 41% (all talus fractures) and 50% (displaced talar neck fractures), and the difference was not significant (Table 3). These rates are higher but consistent with previously reported rates (range, 14%-49%).1,2,7-9,12,14,24 There was no difference in surgical timing for development of AVN/PTOA. We analyzed the cases of all patients who had talus fractures and developed AVN/PTOA (43/106). Within this group, there were no significant differences in surgical timing, age, sex, polytrauma, or BMI between patients who developed AVN/PTOA and those who did not. Compared with patients who did not develop AVN/PTOA, those who developed AVN/PTOA were significantly more likely to have open injuries. This finding, consistent with those in other reports9,12,13 (Table 3), indicates outcome is more likely related to injury severity and not necessarily injury class.
We retrospectively analyzed talus fractures and talus fracture-dislocations to determine if urgent surgical management affects outcomes. Current practice at our institution is to routinely reduce and surgically address these fractures urgently, often during the middle of the night, when orthopedic resources are reduced. Our study found a significant difference in surgical timing for patients with talus fracture-dislocations and patients with talus fractures without dislocations (Table 2). Given our findings, urgent surgical reduction and fixation are not indicated to preserve the talus blood supply and prevent AVN/PTOA, though we still recommend urgent surgical management in the setting of an open wound, skin necrosis, or soft-tissue/neurovascular compromise.
This study had several limitations, primarily related to its retrospective nature. Surgical timing was defined as time from injury, as noted in the medical record, to operating room start. In some instances, time of injury was not noted in the medical record, and time of presentation to emergency room was used instead. Thus, surgical timing for these patients may have been longer than identified. In addition, given the rare injury pattern and the retrospective design, this study was susceptible to type II error and may have been underpowered to detect whether time to surgical reduction predicted complications. Also, the study did not address functional outcome as measured by validated outcome scores. Outcome measures were obtained in many but not all cases, making functional outcome measurement difficult. Similarly, the quality of the anatomical reductions was not assessed, potentially affecting complication rates. Postoperative reduction assessment, possibly performed with computed tomography, is an avenue of further study.
Strengths of this study include its large sample size (this was one of the largest studies of talus fractures), long follow-up (mean, 150 weeks), and novel use of AO/OTA classification.
We postulate that development of AVN/PTOA is not necessarily related to the urgency or timing of surgical reduction and fixation and is more likely related to injury severity. This idea is supported by the finding that development of AVN/PTOA was significantly correlated to open injuries in all talus fractures, including talus fracture-dislocations and isolated talus fractures.
Conclusion
Talus fracture-dislocations are devastating injuries with high rates of complications. In this study, open talus fractures, and fractures with associated tibiotalar or subtalar dislocations, had higher complication rates. Given the evidence presented, we recommend basing surgical timing on injury severity, not necessarily for AVN/PTOA prevention. Specifically, in the absence of an open wound, skin necrosis, or soft-tissue/neurovascular compromise, talus fracture-dislocations can be surgically reduced and stabilized when optimal resources are available.
1. Vallier HA, Reichard SG, Boyd AJ, Moore TA. A new look at the Hawkins classification for talar neck fractures: which features of injury and treatment are predictive of osteonecrosis? J Bone Joint Surg Am. 2014;96(3):192-197.
2. Canale ST, Kelly FB Jr. Fractures of the neck of the talus. Long-term evaluation of seventy-one cases. J Bone Joint Surg Am. 1978;60(2):143-156.
3. Ebraheim NA, Patil V, Owens C, Kandimalla Y. Clinical outcome of fractures of the talar body. Int Orthop. 2008;32(6):773-777.
4. Fortin PT, Balazsy JE. Talus fractures: evaluation and treatment. J Am Acad Orthop Surg. 2001;9(2):114-127.
5. Fournier A, Barba N, Steiger V, et al. Total talar fracture—long-term results of internal fixation of talar fractures. A multicentric study of 114 cases. Orthop Traumatol Surg Res. 2012;98(4 suppl):S48-S55.
6. Grob D, Simpson LA, Weber BG, Bray T. Operative treatment of displaced talus fractures. Clin Orthop Relat Res. 1985;(199):88-96.
7. Hawkins LG. Fractures of the neck of the talus. J Bone Joint Surg Am. 1970;52(5):991-1002.
8. Lindvall E, Haidukewych G, DiPasquale T, Herscovici D Jr, Sanders R. Open reduction and stable fixation of isolated, displaced talar neck and body fractures. J Bone Joint Surg Am. 2004;86(10):2229-2234.
9. Ohl X, Harisboure A, Hemery X, Dehoux E. Long-term follow-up after surgical treatment of talar fractures: twenty cases with an average follow-up of 7.5 years. Int Orthop. 2011;35(1):93-99.
10. Rammelt S, Zwipp H. Talar neck and body fractures. Injury. 2009;40(2):120-135.
11. Schulze W, Richter J, Russe O, Ingelfinger P, Muhr G. Surgical treatment of talus fractures: a retrospective study of 80 cases followed for 1-15 years. Acta Orthop Scand. 2002;73(3):344-351.
12. Vallier HA, Nork SE, Barei DP, Benirschke SK, Sangeorzan BJ. Talar neck fractures: results and outcomes. J Bone Joint Surg Am. 2004;86(8):1616-1624.
13. Patel R, Van Bergeyk A, Pinney S. Are displaced talar neck fractures surgical emergencies? A survey of orthopaedic trauma experts. Foot Ankle Int. 2005;26(5):378-381.
14. Sanders DW, Busam M, Hattwick E, Edwards JR, McAndrew MP, Johnson KD. Functional outcomes following displaced talar neck fractures. J Orthop Trauma. 2004;18(5):265-270.
15. Elgafy H, Ebraheim NA, Tile M, Stephen D, Kase J. Fractures of the talus: experience of two level 1 trauma centers. Foot Ankle Int. 2000;21(12):1023-1029.
16 Frawley PA, Hart JA, Young DA. Treatment outcome of major fractures of the talus. Foot Ankle Int. 1995;16(6):339-345.
17. Fracture and dislocation compendium. Orthopaedic Trauma Association committee for coding and classification. J Orthop Trauma. 1996;10(suppl 1):v-ix, 1-154.
18. Marsh JL, Slongo TF, Agel J, et al. Fracture and dislocation classification compendium—2007: Orthopaedic Trauma Association classification, database and outcomes committee. J Orthop Trauma. 2007;21(10 suppl):S1-S133.
19. Williams T, Barba N, Noailles T, et al. Total talar fracture—inter- and intra-observer reproducibility of two classification systems (Hawkins and AO) for central talar fractures. Orthop Traumatol Surg Res. 2012;98(4 suppl):S56-S65.
20. Zwipp H, Baumgart F, Cronier P, et al. Integral classification of injuries (ICI) to the bones, joints, and ligaments—application to injuries of the foot. Injury. 2004;35(suppl 2):SB3-SB9.
21. Xue Y, Zhang H, Pei F, et al. Treatment of displaced talar neck fractures using delayed procedures of plate fixation through dual approaches. Int Orthop. 2014;38(1):149-154.
22. Vallier HA, Nork SE, Benirschke SK, Sangeorzan BJ. Surgical treatment of talar body fractures. J Bone Joint Surg Am. 2003;85(9):1716-1724.
23. Fleuriau Chateau PB, Brokaw DS, Jelen BA, Scheid DK, Weber TG. Plate fixation of talar neck fractures: preliminary review of a new technique in twenty-three patients. J Orthop Trauma. 2002;16(4):213-219.
24. Vallier HA, Nork SE, Benirschke SK, Sangeorzan BJ. Surgical treatment of talar body fractures. J Bone Joint Surg Am. 2004;86(suppl 1, pt 2):180-192.
Take-Home Points
- There is a 41% rate of AVN or PTOA after operatively managed talus fracture.
- Surgical timing does not affect development of AVN or PTOA.
- Open fractures are associated with development of AVN and PTOA.
- Quality of reduction is likely more important than timing of reduction.
- Urgent surgical treatment is necessary for threatened soft tissue or neurovascular compromise.
Talus fractures are rare injuries that present a significant treatment dilemma.1-12 These fractures represent <1% of all fractures4 and are second only to calcaneus fractures in fractures of the hindfoot. Talus fractures with associated dislocations are even rarer and may provide treating surgeons with a significant surgical quandary.6,13-16
Talus fractures historically have been characterized by their anatomical location: head, neck, or body. Two systems are commonly used to classify talus fractures: Hawkins and AO/OTA (Arbeitsgemeinschaft für Osteosynthesefragen/Orthopaedic Trauma Association). The first, developed by Hawkins7 and modified by Canale and Kelly2 and Vallier and colleagues,1 identifies 4 basic fracture types with associated dislocations. The other system, published in 199617 and republished in 2007,18 uses the combined methods of AO and OTA to systematically describe talus fractures. Although these classification systems accurately describe talus fractures with associated dislocation, both have difficulty predicting clinical outcomes.1,19,20
Talus fractures commonly result in avascular necrosis (AVN) of the talus and posttraumatic osteoarthritis (PTOA) of the tibiotalar and subtalar joints.3,8,9,12,14-16 Hawkins7 initially described subchondral lucency as indicating revascularization of the talus after injury. AVN and PTOA rates traditionally have been thought to be related to a blood supply disruption, given the prognostic value of the Hawkins sign.1,7,12,21 New methods, including a dual-incision approach and expedited transfer to foot and ankle surgeons or orthopedic traumatologists, have improved reduction quality21-24 but not patient outcomes.3,5,8,9,12,14
Recently, time from injury to surgical intervention has been a topic of much discussion, and there have been studies on the specific effects of timing with respect to outcome.1,15,16 Vallier and colleagues,1 who wanted to identify injury characteristics predictive of osteonecrosis, found that delaying reduction and surgical fixation did not increase the risk of AVN. Another study found that urgent reduction of fracture-dislocation with delayed open reduction and internal fixation (ORIF) using a dual approach may improve clinical outcomes.21
In this vein, we conducted a study to evaluate the effect of time to surgical reduction of talus fractures and talus fracture-dislocations on the development of AVN and PTOA. We hypothesized that time to surgical reduction of talus fracture-dislocation as classified with the AO/OTA system would have no effect of the development of AVN/PTOA.
Methods
After this study received Institutional Review Board approval, we retrospectively reviewed the records on talus fractures surgically managed at a level I trauma center during the 10-year period 2003 to 2013. Of the 119 potential cases identified using Current Procedural Terminology code 28445 (ORIF of talus), 13 were excluded (12 for inaccurate coding or missing documentation, 1 for being a pediatric case), leaving 106 for analysis. Using the Hawkins and AO/OTA systems, 3 independent reviewers classified the injuries on plain radiographs.
Injury dates and times were obtained from the medical records. Operating room start times were also obtained. Surgical timing was defined as time from injury to operating room start. For cases without an injury time, time of presentation to emergency department was used.
Open fracture-dislocations were managed with intravenous antibiotics, urgent surgical irrigation, débridement, and immediate fixation or temporizing external fixation after reduction. All fractures were definitively managed with standard ORIF with an anteromedial, anterolateral, or dual approach and mini-fragment implants. After fixation, weight-bearing typically was restricted for 6 to 12 weeks.
Follow-up radiographs were evaluated. Presence or absence of Hawkins sign7 was noted on radiographs at 6 or 8 weeks, and all follow-up radiographs were evaluated for AVN as defined by increased radiographic density within the talar dome or collapse of the articular surface. All radiographs were evaluated for PTOA as defined by loss of joint space within the tibiotalar, subtalar, or talonavicular joint on follow-up radiographs.
Clinical outcomes were analyzed for development of AVN, PTOA, or secondary corrective surgery or arthrodesis. Continuous variables were evaluated with the t test, and the χ2 test was used to compare distributions of categorical variables. The Wilcoxon rank sum test was used to compare non-normally distributed variables. Significance was set at P < .05.
Results
Classification Analysis (Table 1)
Subject Analysis (Table 2)
The mechanisms of injury were motor vehicle accident (70/106; 66%), fall from height (25; 24%), misstep (4), sports related (2), object falling on ankle (2), and not reported (3).
Of the 106 patients, 45 (42%) had isolated talus injuries, 35 had concomitant ipsilateral lower extremity injuries, 25 had concomitant contralateral lower extremity injuries, and 1 had a concomitant upper extremity injury.
Smoking status was everyday (14 patients), past (10), never (34), and unreported (48). Five patients reported a history of alcohol abuse, and 4 patients reported illicit drug use. Two had a history of atrial fibrillation, 9 had hypertension, 3 had hyperlipidemia, 3 had renal disease, 3 had heart disease, 4 had diabetes, 3 had lung disease, and 1 had a history of lung cancer.
Overall Analysis of AVN/PTOA (Table 3)
Analysis of AVN/PTOA in 81-B3 Fracture-Dislocations (Table 4)
Analysis of AVN/PTOA in All Other Talus Fractures (Table 5)
Discussion
Our results showed that time from talus fracture-dislocation to surgical reduction had no effect on development of AVN/PTOA. The findings in this largest series to date agree with earlier findings1,8,15,16,24 and add to the volume of literature suggesting that time to surgical reduction of talus fractures and talus fracture-dislocations does not markedly affect outcome.
Talus fractures continue to present a significant treatment dilemma. Despite recent improvements in surgical techniques and overall management of these injuries, rates of AVN and PTOA have not significantly decreased.1,16,23 At most treating facilities, talus fracture-dislocations are considered surgical emergencies/urgencies, and every effort is made to reduce and surgically address these injuries as soon as possible.1,13
In this study, rates of AVN/PTOA were 41% (all talus fractures) and 50% (displaced talar neck fractures), and the difference was not significant (Table 3). These rates are higher but consistent with previously reported rates (range, 14%-49%).1,2,7-9,12,14,24 There was no difference in surgical timing for development of AVN/PTOA. We analyzed the cases of all patients who had talus fractures and developed AVN/PTOA (43/106). Within this group, there were no significant differences in surgical timing, age, sex, polytrauma, or BMI between patients who developed AVN/PTOA and those who did not. Compared with patients who did not develop AVN/PTOA, those who developed AVN/PTOA were significantly more likely to have open injuries. This finding, consistent with those in other reports9,12,13 (Table 3), indicates outcome is more likely related to injury severity and not necessarily injury class.
We retrospectively analyzed talus fractures and talus fracture-dislocations to determine if urgent surgical management affects outcomes. Current practice at our institution is to routinely reduce and surgically address these fractures urgently, often during the middle of the night, when orthopedic resources are reduced. Our study found a significant difference in surgical timing for patients with talus fracture-dislocations and patients with talus fractures without dislocations (Table 2). Given our findings, urgent surgical reduction and fixation are not indicated to preserve the talus blood supply and prevent AVN/PTOA, though we still recommend urgent surgical management in the setting of an open wound, skin necrosis, or soft-tissue/neurovascular compromise.
This study had several limitations, primarily related to its retrospective nature. Surgical timing was defined as time from injury, as noted in the medical record, to operating room start. In some instances, time of injury was not noted in the medical record, and time of presentation to emergency room was used instead. Thus, surgical timing for these patients may have been longer than identified. In addition, given the rare injury pattern and the retrospective design, this study was susceptible to type II error and may have been underpowered to detect whether time to surgical reduction predicted complications. Also, the study did not address functional outcome as measured by validated outcome scores. Outcome measures were obtained in many but not all cases, making functional outcome measurement difficult. Similarly, the quality of the anatomical reductions was not assessed, potentially affecting complication rates. Postoperative reduction assessment, possibly performed with computed tomography, is an avenue of further study.
Strengths of this study include its large sample size (this was one of the largest studies of talus fractures), long follow-up (mean, 150 weeks), and novel use of AO/OTA classification.
We postulate that development of AVN/PTOA is not necessarily related to the urgency or timing of surgical reduction and fixation and is more likely related to injury severity. This idea is supported by the finding that development of AVN/PTOA was significantly correlated to open injuries in all talus fractures, including talus fracture-dislocations and isolated talus fractures.
Conclusion
Talus fracture-dislocations are devastating injuries with high rates of complications. In this study, open talus fractures, and fractures with associated tibiotalar or subtalar dislocations, had higher complication rates. Given the evidence presented, we recommend basing surgical timing on injury severity, not necessarily for AVN/PTOA prevention. Specifically, in the absence of an open wound, skin necrosis, or soft-tissue/neurovascular compromise, talus fracture-dislocations can be surgically reduced and stabilized when optimal resources are available.
1. Vallier HA, Reichard SG, Boyd AJ, Moore TA. A new look at the Hawkins classification for talar neck fractures: which features of injury and treatment are predictive of osteonecrosis? J Bone Joint Surg Am. 2014;96(3):192-197.
2. Canale ST, Kelly FB Jr. Fractures of the neck of the talus. Long-term evaluation of seventy-one cases. J Bone Joint Surg Am. 1978;60(2):143-156.
3. Ebraheim NA, Patil V, Owens C, Kandimalla Y. Clinical outcome of fractures of the talar body. Int Orthop. 2008;32(6):773-777.
4. Fortin PT, Balazsy JE. Talus fractures: evaluation and treatment. J Am Acad Orthop Surg. 2001;9(2):114-127.
5. Fournier A, Barba N, Steiger V, et al. Total talar fracture—long-term results of internal fixation of talar fractures. A multicentric study of 114 cases. Orthop Traumatol Surg Res. 2012;98(4 suppl):S48-S55.
6. Grob D, Simpson LA, Weber BG, Bray T. Operative treatment of displaced talus fractures. Clin Orthop Relat Res. 1985;(199):88-96.
7. Hawkins LG. Fractures of the neck of the talus. J Bone Joint Surg Am. 1970;52(5):991-1002.
8. Lindvall E, Haidukewych G, DiPasquale T, Herscovici D Jr, Sanders R. Open reduction and stable fixation of isolated, displaced talar neck and body fractures. J Bone Joint Surg Am. 2004;86(10):2229-2234.
9. Ohl X, Harisboure A, Hemery X, Dehoux E. Long-term follow-up after surgical treatment of talar fractures: twenty cases with an average follow-up of 7.5 years. Int Orthop. 2011;35(1):93-99.
10. Rammelt S, Zwipp H. Talar neck and body fractures. Injury. 2009;40(2):120-135.
11. Schulze W, Richter J, Russe O, Ingelfinger P, Muhr G. Surgical treatment of talus fractures: a retrospective study of 80 cases followed for 1-15 years. Acta Orthop Scand. 2002;73(3):344-351.
12. Vallier HA, Nork SE, Barei DP, Benirschke SK, Sangeorzan BJ. Talar neck fractures: results and outcomes. J Bone Joint Surg Am. 2004;86(8):1616-1624.
13. Patel R, Van Bergeyk A, Pinney S. Are displaced talar neck fractures surgical emergencies? A survey of orthopaedic trauma experts. Foot Ankle Int. 2005;26(5):378-381.
14. Sanders DW, Busam M, Hattwick E, Edwards JR, McAndrew MP, Johnson KD. Functional outcomes following displaced talar neck fractures. J Orthop Trauma. 2004;18(5):265-270.
15. Elgafy H, Ebraheim NA, Tile M, Stephen D, Kase J. Fractures of the talus: experience of two level 1 trauma centers. Foot Ankle Int. 2000;21(12):1023-1029.
16 Frawley PA, Hart JA, Young DA. Treatment outcome of major fractures of the talus. Foot Ankle Int. 1995;16(6):339-345.
17. Fracture and dislocation compendium. Orthopaedic Trauma Association committee for coding and classification. J Orthop Trauma. 1996;10(suppl 1):v-ix, 1-154.
18. Marsh JL, Slongo TF, Agel J, et al. Fracture and dislocation classification compendium—2007: Orthopaedic Trauma Association classification, database and outcomes committee. J Orthop Trauma. 2007;21(10 suppl):S1-S133.
19. Williams T, Barba N, Noailles T, et al. Total talar fracture—inter- and intra-observer reproducibility of two classification systems (Hawkins and AO) for central talar fractures. Orthop Traumatol Surg Res. 2012;98(4 suppl):S56-S65.
20. Zwipp H, Baumgart F, Cronier P, et al. Integral classification of injuries (ICI) to the bones, joints, and ligaments—application to injuries of the foot. Injury. 2004;35(suppl 2):SB3-SB9.
21. Xue Y, Zhang H, Pei F, et al. Treatment of displaced talar neck fractures using delayed procedures of plate fixation through dual approaches. Int Orthop. 2014;38(1):149-154.
22. Vallier HA, Nork SE, Benirschke SK, Sangeorzan BJ. Surgical treatment of talar body fractures. J Bone Joint Surg Am. 2003;85(9):1716-1724.
23. Fleuriau Chateau PB, Brokaw DS, Jelen BA, Scheid DK, Weber TG. Plate fixation of talar neck fractures: preliminary review of a new technique in twenty-three patients. J Orthop Trauma. 2002;16(4):213-219.
24. Vallier HA, Nork SE, Benirschke SK, Sangeorzan BJ. Surgical treatment of talar body fractures. J Bone Joint Surg Am. 2004;86(suppl 1, pt 2):180-192.
Biceps Tenodesis: A Comparison of Tendon-to-Bone and Tendon-to-Tendon Healing in a Rat Model
Take-Home Points
- Cellular healing response differs between bony and soft tissue biceps tenodesis.
- Bony tenodesis incites an inflammatory healing response.
- Bony tenodesis healing occurs at the tendon-bone interface.
- Intrasseous bony fixation leads to tendon degeneration within the bone.
- Tendon-to-tendon tenodesis may result in regenerative tendon healing.
The long head of the biceps tendon (LHBT) is a well-established pain generator of the anterior shoulder1,2 and may be surgically addressed in refractory cases.3 According to a recent study of 44,932 cases, biceps tenodesis rates increased 80% over just 3 years (2008-2011).4 Nevertheless, optimal tenodesis location and technique remain controversial. Proximal and distal tenodesis, including numerous soft-tissue and bony techniques, have been described.5-7 Several studies have focused on the biomechanical strength of various fixation modalities.8-14 These data highlight the ongoing evolution of our understanding of biceps-labrum complex (BLC) disease.
Over the years, tenodesis location has proved to be an important factor in outcomes.3,15-20 Several recent studies have elucidated the role of the extra-articular LHBT and the limited capabilities of diagnostic arthroscopy.15-17,20,21 Taylor and colleagues17 defined the bicipital tunnel as the extra-articular segment of LHBT and its fibro-osseous enclosure. The tunnel extends from the articular margin through the subpectoral region and can be divided into 3 zones: Zone 1 goes from the articular margin to the inferior margin of the subscapularis, zone 2 goes from the inferior margin of the subscapularis to the proximal margin of the pectoralis major tendon, and zone 3 is the subpectoral region. Zone 2 is often referred to as “no man’s land” for its relative invisibility from arthroscopy above and open exposure below.17,21 Notably, a recent study reported a 47% prevalence of hidden tunnel lesions in patients with chronic BLC disease symptoms.18 Other studies have shown that standard proximal tenodesis methods often fail to address LHBT pathology in this area, leading to residual symptoms.9,22 It is evident that tenodesis location and technique play important roles in patient outcomes. Sanders and colleagues16 found that the revision rate was significantly higher among patients who underwent biceps tenodesis without release of the bicipital tunnel sheath than among patients who underwent tenodesis with the release. Dr. O’Brien developed an alternative option: soft-tissue tenodesis with transfer of the LHBT to the conjoint tendon within the subdeltoid space.23,24 This technique addresses intra-articular and extra-articular tunnel disease while mitigating the complications associated with bony tenodesis. Early and midterm studies have shown this to be an effective intervention for chronically symptomatic BLC disease.25,26
Despite the abundance of literature on tenodesis techniques, no one has histologically evaluated the location-dependent healing and inflammatory responses. We conducted a study to determine the impact of tenodesis location on healing and inflammation in a rat model. We hypothesized that, compared with tendon-to-bone techniques, soft-tissue tenodesis would minimize inflammatory response and optimize healing.
Methods
The study was approved by the Institutional Animal Care and Use Committee at the Hospital for Special Surgery.
Animals
Biceps tenodesis was performed at 1 of 3 locations in 36 thirteen-week-old Sprague-Dawley rats (Charles River Laboratories). All rats were prepared for surgery by an experienced veterinary technician. Sedation was induced with isoflurane gas through a nose cone.
Surgical Procedure
Animals were randomly assigned to 3 different tenodesis groups: tendon-to-bone in the bicipital groove (metaphyseal, M); tendon-to-bone in the subpectoral region (diaphyseal, D); and soft tissue-to-soft tissue transfer to the conjoint tendon (T). A standard deltopectoral approach was used to expose the biceps tendon. The tendon was tagged with a 5-0 polypropylene suture and tenotomized at the level of the bicipital groove (zone 1). All wounds were irrigated and closed with 4-0 nylon suture.
For animals undergoing tendon-to-bone metaphyseal tenodesis, a 0.045-mm Kirschner wire was used to drill bicortically into the intertubercular sulcus. Wire positioning distal to the physeal plate was confirmed with fluoroscopy. A locking stitch of 5-0 polypropylene suture was run along the free edge of the tendon. The tendon was then passed through the bone tunnel in an anterior-to-posterior direction, and the limbs of the suture were tied around the lateral cortex.
The process was repeated for animals undergoing diaphyseal tenodesis; only the tenodesis location was different. The inferior border of the pectoralis major was identified, and a bicortical tunnel was made in the center of the diaphyseal bone. The tendon was then prepared and tenodesed to bone using the method already described.
In soft-tissue tenodesis, the conjoint tendon was identified and carefully dissected from surrounding tissues. The LHBT was then tenodesed to the attached conjoint tendon with interrupted simple stitches of 5-0 polypropylene suture.
The animals were allowed to bear weight on the operative limb immediately after surgery and without immobilization.
Specimen Harvest and Preparation
Four animals from each group were sacrificed at 6, 12, and 24 weeks. Harvested specimens were fixed in 10% neutral-buffered formalin solution. Bony specimens consisted of the upper half of the humerus and the tenodesed biceps tendon, and soft-tissue specimens consisted of the tenodesed LHBT-conjoint tendon complex. Bony specimens were decalcified in 10% ethylenediaminetetraacetic acid. All specimens were paraffin-embedded and sectioned at 7 microns.
Analysis of Cellularity
Sections were stained with hematoxylin-eosin. Overall cellularity at the tenodesis interface was quantified by averaging the nuclei count within 3 separate standardized ×20 magnification high power fields. Only nucleated cells were included in the cell count. Immunohistochemical staining with tenomodulin (Santa Cruz Laboratories, sc-49324) was performed to characterize the cell population at the interface. Deparaffinized sections underwent antigen retrieval with pronase for 30 minutes at 37°C and were incubated overnight with the anti-tenomodulin goat monoclonal antibody diluted to 1:200 in 1% phosphate-buffered saline. The prepared slides were then counterstained with methyl green. Specimens treated with tenomodulin were evaluated for presence or absence of a positive reaction at the tenodesis interface.
Analysis of Inflammation
Inflammation at the interface was evaluated with the CD68 macrophage marker (ABcam, ab31630). Deparaffinized sections underwent antigen retrieval with pronase for 30 minutes at 37°C and were incubated overnight with anti-CD68 mouse monoclonal antibodies diluted to 1:200 in 1% phosphate-buffered saline. The prepared slides were then counterstained with neutral red. Inflammation was quantified by averaging the number of reactive cells within 3 separate standardized ×20 magnification high power fields.
Statistical Analysis
Descriptive statistics were calculated for cell and macrophage counts for each group at every time point. Two-way analysis of variance was used to compare the cell and macrophage counts between groups at each time point as well as the count differences within each group between time points. P values were Bonferroni-corrected to account for the multiple comparisons between groups. P < .05 was used to signify statistical significance.
Results
All 36 animals survived to their designated harvest time without complications. Twelve specimens were successfully harvested at 6 weeks and another 12 at 24 weeks. At 12 weeks, tenodesis failure occurred in 1 animal in group D, leaving 11 specimens for analysis.
Cellularity
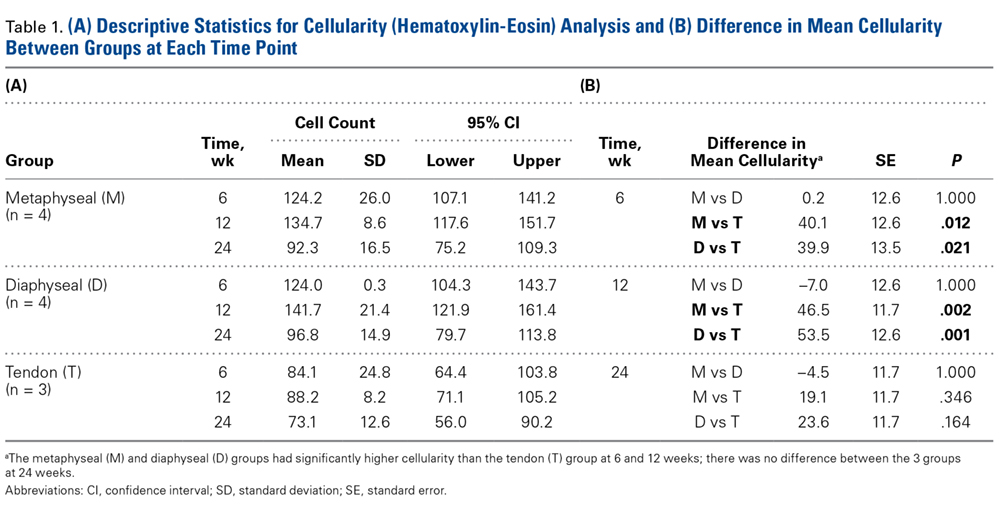
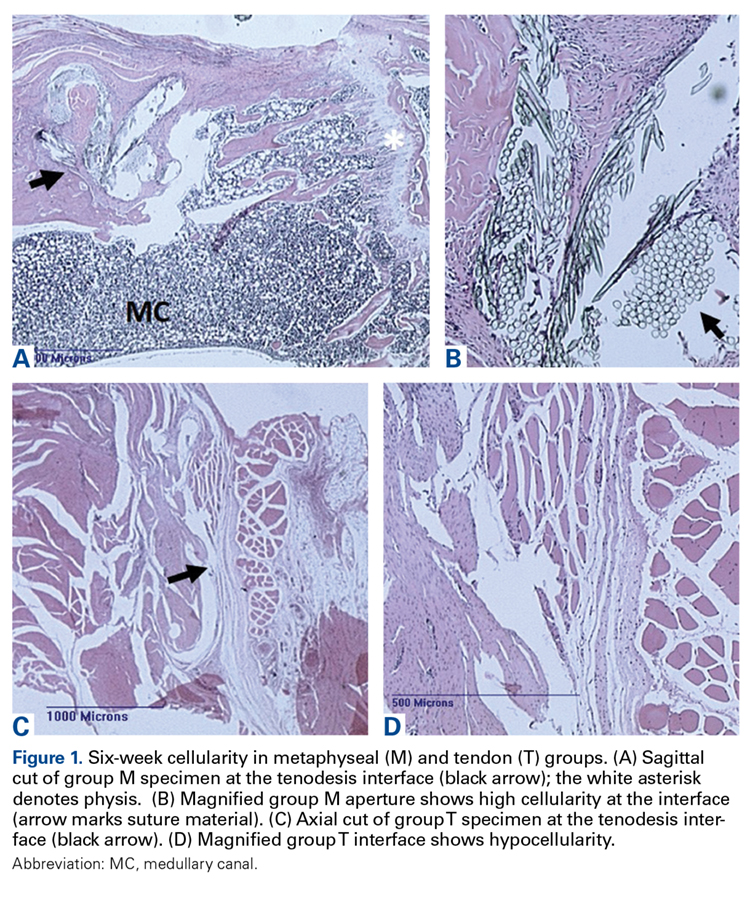
Within-group analysis revealed a trend of increasing cellularity at 12 weeks followed by a decrease at 24 weeks in all 3 groups (Table 2).
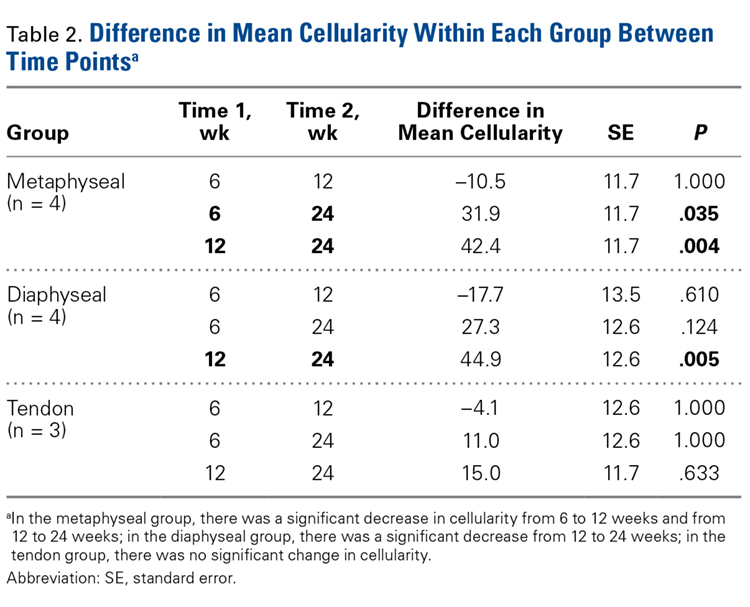
Inflammatory Response
During specimen processing, 1 group D specimen was severely degraded after pronase treatment, leaving 3 specimens for evaluation. Descriptive statistics for each group are listed in Table 3A.
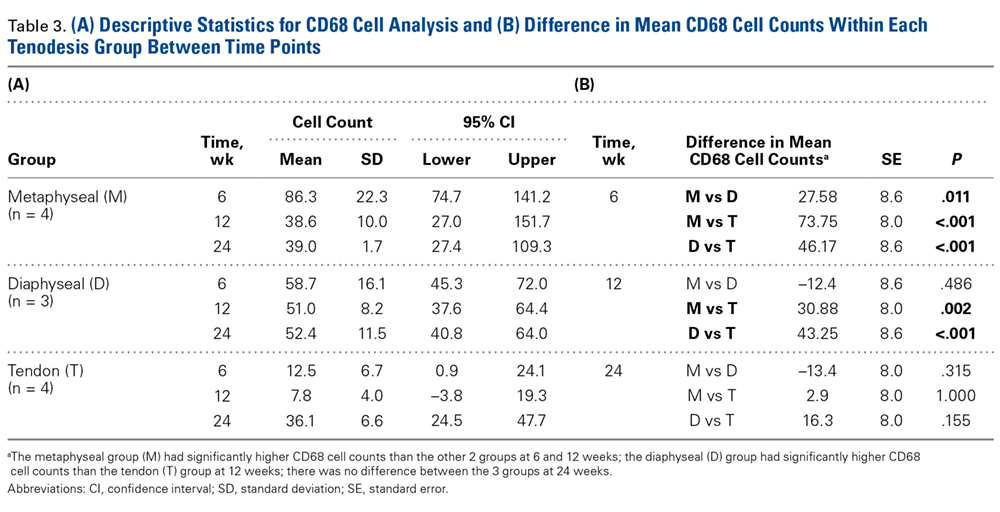
At 6 weeks, mean CD68 cell count was significantly higher in group M than in group D (P = .011) and group T (P < .001) (Table 3B). Likewise, CD68 count was significantly higher in group D than in group T (P < .001). There were no differences in CD68 counts between the 2 bony tenodesis groups at 12 weeks (P = .486) or 24 weeks (P = .315). Both bony tenodesis groups, however, had persistently higher CD68 counts at 12 weeks when compared with group T (group M, P = .002; group D, P < .001). In these specimens, an inflammatory milieu characterized by a large accumulation of lymphocytes and giant cells was noted at the bone-tendon interface.
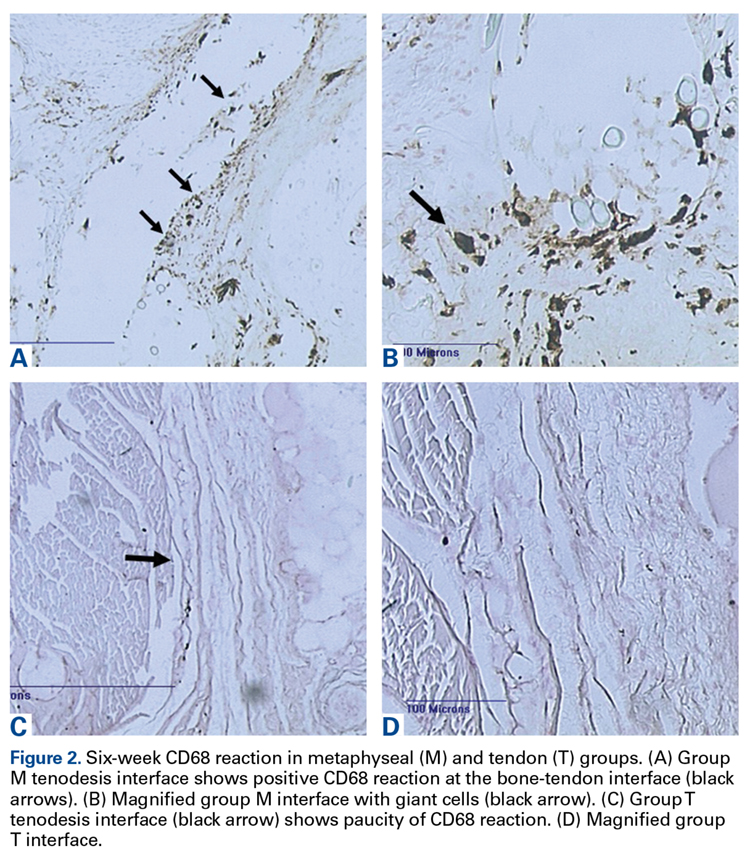
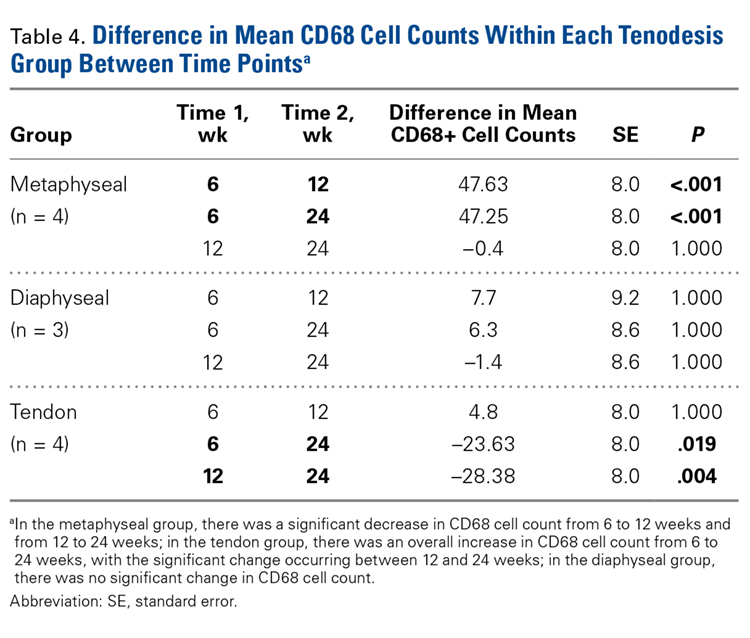
Tissue-Specific Staining
At 6 weeks, antigen retrieval resulted in severe degradation of 2 group M specimens, 2 group D specimens, and 1 group T specimen. The most notable tenomodulin reaction occurred in group T at the 6- and 12-week harvests, with the 6-week group having the most robust reaction. There was scant reaction in this group at 24 weeks.
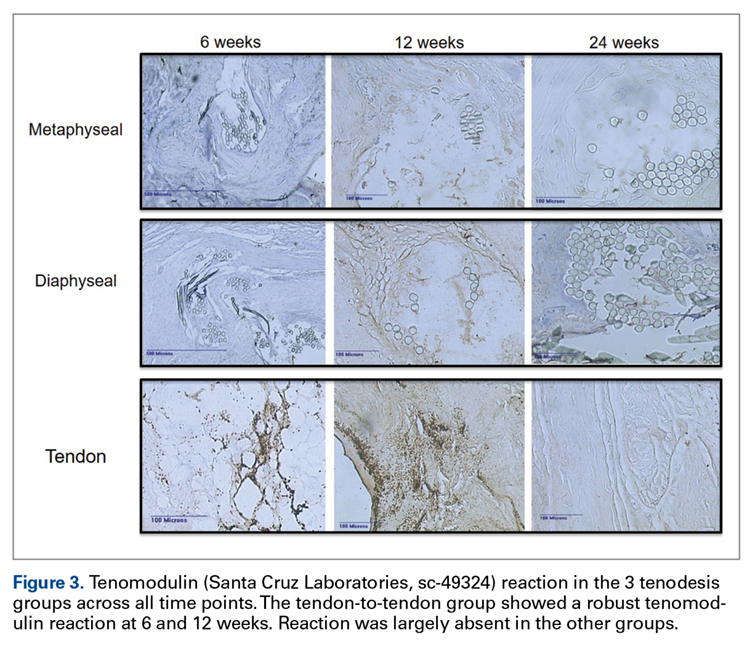
Discussion
In this study, the healing response differed between bony and soft-tissue tenodesis techniques in a rat model. Tendon-to-bone tenodesis, both diaphyseal and metaphyseal, appeared to incite an inflammatory degenerative response, whereas tendon-to-tendon healing occurred in a more quiescent and perhaps even regenerative manner.
The early inflammatory response that occurred in the bony tenodesis groups is not unlike what occurs in fracture healing.27 The reaction was even more robust at 12 weeks, signifying an ongoing inflammatory process. In this context, tendon degeneration may plausibly explain the consistent absence of mature tendon within the tunnels at all 3 time points. Some tendon degeneration may be explained by the vascular damage that occurred during surgery, but this damage was a constant factor in all 3 study groups. Interestingly, group M showed the highest early CD68 counts, consistent with this being the more biologically active region of bone.28
Group T had significantly lower cell and macrophage counts throughout the study period, possibly indicating improved healing—an observation supported by a study in which the impact of macrophage depletion on bone-tendon interface healing was evaluated.29 The authors found that, in suppressing macrophage activity, the morphologic and biomechanical properties at the healing interface were significantly improved.29 These findings are consistent with Dr. O’Brien’s anecdotal experience with patients who previously underwent the biceps transfer; on second-look arthroscopy, there was complete seamless integration of tendon and conjoint tendon (Figure 4).
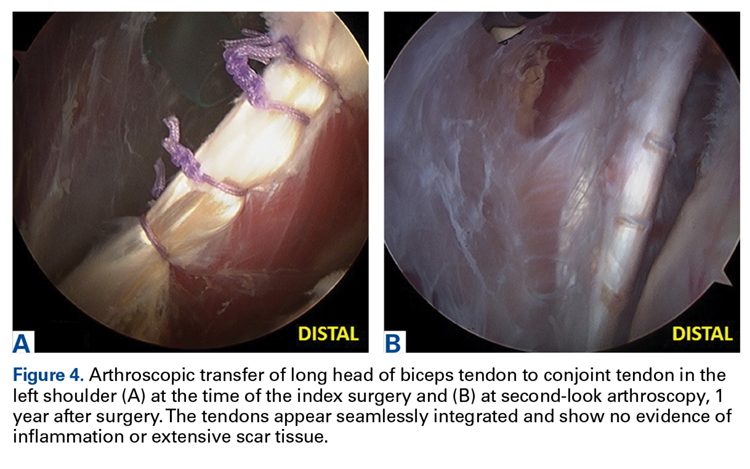
Studies have found that the inflammatory process is closely associated with pain, and pain syndromes such as fibromyalgia.30,31 Persistent inflammation, as seen in our bony tenodesis group, could explain the recalcitrant anterior shoulder pain that often occurs in patients after bony tenodesis of the LHBT.2,6,19,32
Studies have also suggested that osteoclasts at the bone-tendon interface—osteoclasts share a cell lineage with macrophages—may contribute to bone loss and tunnel widening.33,34 Osteoclasts are expected at the bone tunnel, as fracture healing occurs at the bone-tendon interface. These osteoclasts could have contributed to the strong CD68 reaction in our bony tenodesis groups. However, CD68 historically has been described as the classic macrophage marker.35 We specifically selected CD68 for this reason: Macrophages are the primary inflammatory cells involved in early healing and are key to the inflammatory process.36
Results of the tenomodulin analysis suggested 2 different healing processes are occurring in the bony and tendon groups. Tenomodulin is a known tenocyte marker for developing and mature tendon in both rats and humans.37,38 In our study, only group T had a positive tenomodulin reaction. Notably, the reaction occurred only at 6 and 12 weeks. This finding may indicate that a regenerative healing pattern becomes quiescent by 24 weeks. Indeed, it has been suggested that tenomodulin is a key regulator of tenocyte proliferation and tendon maturation.39
The complete absence of tenomodulin reaction in our bony tenodesis groups in the setting of significant inflammation further supports our theory of tendon degeneration within the tunnel. One potential explanation for this finding may be that as the tendon heals to the surface of the bone, the intra-osseous tendon is no longer load-bearing and is resorbed by the body through an inflammatory response. This finding differs from those in previous studies, which have described viable tendon within the bone tunnel at all time points up to 26 weeks.40 More recently, it has been suggested that callus formation at the external cortical tendon-bone interface is critical for healing and mechanical strength.41,42 In addition, recent studies have found a predominantly fibroblastic healing process at the midtunnel, potentially leading to the formation of loose fibrovascular tissue at the tendon-bone interface.43 These data, in concert with ours, call into question the rationale for performing intra-osseous tenodesis through bone tunnels.
Our study results, if confirmed in humans, will have significant clinical implications. If a similar effect can be confirmed in the human shoulder, one could argue that soft-tissue tenodesis may result in decreased postoperative shoulder pain. In addition, if tendon degeneration does occur within the intramedullary tunnel, surface fixation may be the better, safer alternative. Although older studies reported suboptimal strength with this type of fixation,8,44 more recent studies have found surface fixation strength equivalent to screw fixation strength.45,46 Such a shift in the treatment paradigm would obviate the need for violation of the humeral cortex, eliminating potential stress risers associated with screw fixation,47 and effectively eliminating the risk of iatrogenic fracture.48,49 It would be interesting to investigate what occurs histologically at the bone-tendon interface in surface fixation (ie, suture anchors). Would the inflammatory response at the surface be similar to the inflammatory intramedullary healing, or would it be similar to the quieter tendon-tendon healing? Answers to such questions have the potential to streamline the treatment algorithm for patients who require tenodesis.
Study Limitations
Our study had several limitations. First, as this was a basic science study using a rat model, its conclusions can only be extrapolated to humans. Second, given the nonspecific nature of the cellular analysis, we cannot draw any definitive conclusions about the cell population at the bone-tendon interface. For example, although tenomodulin is expressed by tenocytes, it is not an established specific marker for tenocytes and may be expressed by other fibroblastic cells. Still, our results provide insight into the local microenvironment and identify important differences between the tenodesis methods. Similarly, the complete absence of tendon within the bone tunnels suggests that an analysis of osteoclastic activity at the tenodesis interface may have been a valuable addition to the study. This finding, however, was unexpected, and we did not have the foresight to include it in our methods. A third limitation is that our fixation method essentially uses the suspension tenodesis method. This fixation method differs from the common fixation techniques used in the clinical setting. Testing of other fixation constructs would require a larger animal model. Furthermore, in suspension- type constructs, micromotion within the bone tunnel may independently elicit an inflammatory response. Inert suture was used in our fixation in order to reduce the risk of an iatrogenic inflammatory response. Last, it would have been valuable to perform a biomechanical analysis of the strength of each tenodesis construct. This was explored with our institution’s biomechanics team, but specimen size precluded successful analysis.
Conclusion
Our results indicated that, compared with tendon-to-tendon fixation, tendon-to-bone tenodesis produces a significantly greater inflammatory response at the tenodesis interface. An inflammatory milieu in the absence of tendon within the bony tunnel suggests intraosseous tendon degeneration. Tendon-to-tendon tenodesis, on the other hand, seems to limit the inflammatory response. In addition, a robust tenomodulin reaction in the early phases of tendon-to-tendon healing suggests regenerative healing. Our results showed a fundamental difference in the healing response between the 2 tenodesis methods. Further study is needed to evaluate the validity and applicability of our findings to the human patient population. Most important, our results underscore the need for more study to elucidate optimal tenodesis location and encourage orthopedic surgeons to reexamine current clinical practice patterns.
1. Alpantaki K, McLaughlin D, Karagogeos D, Hadjipavlou A, Kontakis G. Sympathetic and sensory neural elements in the tendon of the long head of the biceps. J Bone Joint Surg Am. 2005;87(7):1580-1583.
2. Nho SJ, Strauss EJ, Lenart BA, et al. Long head of the biceps tendinopathy: diagnosis and management. J Am Acad Orthop Surg. 2010;18(11):645-656.
3. Provencher MT, LeClere LE, Romeo AA. Subpectoral biceps tenodesis. Sports Med Arthrosc. 2008;16(3):170-176.
4. Werner BC, Brockmeier SF, Gwathmey FW. Trends in long head biceps tenodesis. Am J Sports Med. 2015;43(3):570-578.
5. Boileau P, Baque F, Valerio L, Ahrens P, Chuinard C, Trojani C. Isolated arthroscopic biceps tenotomy or tenodesis improves symptoms in patients with massive irreparable rotator cuff tears. J Bone Joint Surg Am. 2007;89(4):747-757.
6. Becker DA, Cofield RH. Tenodesis of the long head of the biceps brachii for chronic bicipital tendinitis. Long-term results. J Bone Joint Surg Am. 1989;71(3):376-381.
7. Richards DP, Burkhart SS. Arthroscopic-assisted biceps tenodesis for ruptures of the long head of biceps brachii: the cobra procedure. Arthroscopy. 2004;20(suppl 2):201-207.
8. Ozalay M, Akpinar S, Karaeminogullari O, et al. Mechanical strength of four different biceps tenodesis techniques. Arthroscopy. 2005;21(8):992-998.
9. Mazzocca AD, Bicos J, Santangelo S, Romeo AA, Arciero RA. The biomechanical evaluation of four fixation techniques for proximal biceps tenodesis. Arthroscopy. 2005;21(11):1296-1306.
10. Kilicoglu O, Koyuncu O, Demirhan M, et al. Time-dependent changes in failure loads of 3 biceps tenodesis techniques: in vivo study in a sheep model. Am J Sports Med. 2005;33(10):1536-1544.
11. Golish SR, Caldwell PE 3rd, Miller MD, et al. Interference screw versus suture anchor fixation for subpectoral tenodesis of the proximal biceps tendon: a cadaveric study. Arthroscopy. 2008;24(10):1103-1108.
12. Kusma M, Dienst M, Eckert J, Steimer O, Kohn D. Tenodesis of the long head of biceps brachii: cyclic testing of five methods of fixation in a porcine model. J Shoulder Elbow Surg. 2008;17(6):967-973.
13. Buchholz A, Martetschlager F, Siebenlist S, et al. Biomechanical comparison of intramedullary cortical button fixation and interference screw technique for subpectoral biceps tenodesis. Arthroscopy. 2013;29(5):845-853.
14. Werner BC, Lyons ML, Evans CL, et al. Arthroscopic suprapectoral and open subpectoral biceps tenodesis: a comparison of restoration of length-tension and mechanical strength between techniques. Arthroscopy. 2015;31(4):620-627.
15. Gilmer BB, DeMers AM, Guerrero D, Reid JB 3rd, Lubowitz JH, Guttmann D. Arthroscopic versus open comparison of long head of biceps tendon visualization and pathology in patients requiring tenodesis. Arthroscopy. 2015;31(1):29-34.
16. Sanders B, Lavery KP, Pennington S, Warner JJ. Clinical success of biceps tenodesis with and without release of the transverse humeral ligament. J Shoulder Elbow Surg. 2012;21(1):66-71.
17. Taylor SA, Fabricant PD, Bansal M, et al. The anatomy and histology of the bicipital tunnel of the shoulder. J Shoulder Elbow Surg. 2015;24(4):511-519.
18. Taylor SA, Khair MM, Gulotta LV, et al. Diagnostic glenohumeral arthroscopy fails to fully evaluate the biceps-labral complex. Arthroscopy. 2015;31(2):215-224.
19. Lutton DM, Gruson KI, Harrison AK, Gladstone JN, Flatow EL. Where to tenodese the biceps: proximal or distal? Clin Orthop Relat Res. 2011;469(4):1050-1055.
20. Moon SC, Cho NS, Rhee YG. Analysis of “hidden lesions” of the extra-articular biceps after subpectoral biceps tenodesis: the subpectoral portion as the optimal tenodesis site. Am J Sports Med. 2015;43(1):63-68.
21. Festa A, Allert J, Issa K, Tasto JP, Myer JJ. Visualization of the extra-articular portion of the long head of the biceps tendon during intra-articular shoulder arthroscopy. Arthroscopy. 2014;30(11):1413-1417.
22. Friedman DJ, Dunn JC, Higgins LD, Warner JJ. Proximal biceps tendon: injuries and management. Sports Med Arthrosc. 2008;16(3):162-169.
23. Verma NN, Drakos M, O’Brien SJ. Arthroscopic transfer of the long head biceps to the conjoint tendon. Arthroscopy. 2005;21(6):764.
24. O’Brien SJ, Taylor SA, DiPietro JR, Newman AM, Drakos MC, Voos JE. The arthroscopic “subdeltoid approach” to the anterior shoulder. J Shoulder Elbow Surg. 2013;22(4):e6-e10.
25. Drakos MC, Verma NN, Gulotta LV, et al. Arthroscopic transfer of the long head of the biceps tendon: functional outcome and clinical results. Arthroscopy. 2008;24(2):217-223.
26. Taylor SA, Fabricant PD, Baret NJ, et al. Midterm clinical outcomes for arthroscopic subdeltoid transfer of the long head of the biceps tendon to the conjoint tendon. Arthroscopy. 2014;30(12):1574-1581.
27. Marsell R, Einhorn TA. The biology of fracture healing. Injury. 2011;42(6):551-555.
28. Khan SN, Cammisa FP Jr, Sandhu HS, Diwan AD, Girardi FP, Lane JM. The biology of bone healing. J Am Acad Orthop Surg. 2005;13(1):77-86.
29. Hays PL, Kawamura S, Deng XH, et al. The role of macrophages in early healing of a tendon graft in a bone tunnel. J Bone Joint Surg Am. 2008;90(3):565-579.
30. Uhl RL, Roberts TT, Papaliodis DN, Mulligan MT, Dubin AH. Management of chronic musculoskeletal pain. J Am Acad Orthop Surg. 2014;22(2):101-110.
31. Kosek E, Altawil R, Kadetoff D, et al. Evidence of different mediators of central inflammation in dysfunctional and inflammatory pain—interleukin-8 in fibromyalgia and interleukin-1 β in rheumatoid arthritis. J Neuroimmunol. 2015;280:49-55.
32. Slenker NR, Lawson K, Ciccotti MG, Dodson CC, Cohen SB. Biceps tenotomy versus tenodesis: clinical outcomes. Arthroscopy. 2012;28(4):576-582.
33. Rodeo SA, Kawamura S, Kim HJ, Dynybil C, Ying L. Tendon healing in a bone tunnel differs at the tunnel entrance versus the tunnel exit: an effect of graft-tunnel motion? Am J Sports Med. 2006;34(11):1790-1800.
34. Hjorthaug GA, Madsen JE, Nordsletten L, Reinholt FP, Steen H, Dimmen S. Tendon to bone tunnel healing—a study on the time-dependent changes in biomechanics, bone remodeling, and histology in a rat model. J Orthop Res. 2015;33(2):216-223.
35. Pulford KA, Sipos A, Cordell JL, Stross WP, Mason DY. Distribution of the CD68 macrophage/myeloid associated antigen. Int Immunol. 1990;2(10):973-980.
36. Fujiwara N, Kobayashi K. Macrophages in inflammation. Curr Drug Targets Inflamm Allergy. 2005;4(3):281-286.
37. Qi J, Dmochowski JM, Banes AN, et al. Differential expression and cellular localization of novel isoforms of the tendon biomarker tenomodulin. J Appl Physiol (1985). 2012;113(6):861-871.
38. Jelinsky SA, Archambault J, Li L, Seeherman H. Tendon-selective genes identified from rat and human musculoskeletal tissues. J Orthop Res. 2010;28(3):289-297.
39. Docheva D, Hunziker EB, Fassler R, Brandau O. Tenomodulin is necessary for tenocyte proliferation and tendon maturation. Mol Cell Biol. 2005;25(2):699-705.
40. Rodeo SA, Arnoczky SP, Torzilli PA, Hidaka C, Warren RF. Tendon-healing in a bone tunnel. A biomechanical and histological study in the dog. J Bone Joint Surg Am. 1993;75(12):1795-1803.
41. Silva MJ, Thomopoulos S, Kusano N, et al. Early healing of flexor tendon insertion site injuries: tunnel repair is mechanically and histologically inferior to surface repair in a canine model. J Orthop Res. 2006;24(5):990-1000.
42. Hibino N, Hamada Y, Sairyo K, Yukata K, Sano T, Yasui N. Callus formation during healing of the repaired tendon–bone junction. A rat experimental model. J Bone Joint Surg Br. 2007;89(11):1539-1544.
43. Bedi A, Kawamura S, Ying L, Rodeo SA. Differences in tendon graft healing between the intra-articular and extra-articular ends of a bone tunnel. HSS J. 2009;5(1):51-57.
44. Richards DP, Burkhart SS. A biomechanical analysis of two biceps tenodesis fixation techniques. Arthroscopy. 2005;21(7):861-866.
45. Mazzocca AD, Cote MP, Arciero CL, Romeo AA, Arciero RA. Clinical outcomes after subpectoral biceps tenodesis with an interference screw. Am J Sports Med. 2008;36(10):1922-1929.
46. Baleani M, Francesconi D, Zani L, Giannini S, Snyder SJ. Suprapectoral biceps tenodesis: a biomechanical comparison of a new “soft anchor” tenodesis technique versus interference screw biceps tendon fixation. Clin Biomech. 2015;30(2):188-194.
47. Euler SA, Smith SD, Williams BT, Dornan GJ, Millett PJ, Wijdicks CA. Biomechanical analysis of subpectoral biceps tenodesis: effect of screw malpositioning on proximal humeral strength. Am J Sports Med. 2015;43(1):69-74.
48. Sears BW, Spencer EE, Getz CL. Humeral fracture following subpectoral biceps tenodesis in 2 active, healthy patients. J Shoulder Elbow Surg. 2011;20(6):e7-e11.
49. Dein EJ, Huri G, Gordon JC, McFarland EG. A humerus fracture in a baseball pitcher after biceps tenodesis. Am J Sports Med. 2014;42(4):877-879.
Take-Home Points
- Cellular healing response differs between bony and soft tissue biceps tenodesis.
- Bony tenodesis incites an inflammatory healing response.
- Bony tenodesis healing occurs at the tendon-bone interface.
- Intrasseous bony fixation leads to tendon degeneration within the bone.
- Tendon-to-tendon tenodesis may result in regenerative tendon healing.
The long head of the biceps tendon (LHBT) is a well-established pain generator of the anterior shoulder1,2 and may be surgically addressed in refractory cases.3 According to a recent study of 44,932 cases, biceps tenodesis rates increased 80% over just 3 years (2008-2011).4 Nevertheless, optimal tenodesis location and technique remain controversial. Proximal and distal tenodesis, including numerous soft-tissue and bony techniques, have been described.5-7 Several studies have focused on the biomechanical strength of various fixation modalities.8-14 These data highlight the ongoing evolution of our understanding of biceps-labrum complex (BLC) disease.
Over the years, tenodesis location has proved to be an important factor in outcomes.3,15-20 Several recent studies have elucidated the role of the extra-articular LHBT and the limited capabilities of diagnostic arthroscopy.15-17,20,21 Taylor and colleagues17 defined the bicipital tunnel as the extra-articular segment of LHBT and its fibro-osseous enclosure. The tunnel extends from the articular margin through the subpectoral region and can be divided into 3 zones: Zone 1 goes from the articular margin to the inferior margin of the subscapularis, zone 2 goes from the inferior margin of the subscapularis to the proximal margin of the pectoralis major tendon, and zone 3 is the subpectoral region. Zone 2 is often referred to as “no man’s land” for its relative invisibility from arthroscopy above and open exposure below.17,21 Notably, a recent study reported a 47% prevalence of hidden tunnel lesions in patients with chronic BLC disease symptoms.18 Other studies have shown that standard proximal tenodesis methods often fail to address LHBT pathology in this area, leading to residual symptoms.9,22 It is evident that tenodesis location and technique play important roles in patient outcomes. Sanders and colleagues16 found that the revision rate was significantly higher among patients who underwent biceps tenodesis without release of the bicipital tunnel sheath than among patients who underwent tenodesis with the release. Dr. O’Brien developed an alternative option: soft-tissue tenodesis with transfer of the LHBT to the conjoint tendon within the subdeltoid space.23,24 This technique addresses intra-articular and extra-articular tunnel disease while mitigating the complications associated with bony tenodesis. Early and midterm studies have shown this to be an effective intervention for chronically symptomatic BLC disease.25,26
Despite the abundance of literature on tenodesis techniques, no one has histologically evaluated the location-dependent healing and inflammatory responses. We conducted a study to determine the impact of tenodesis location on healing and inflammation in a rat model. We hypothesized that, compared with tendon-to-bone techniques, soft-tissue tenodesis would minimize inflammatory response and optimize healing.
Methods
The study was approved by the Institutional Animal Care and Use Committee at the Hospital for Special Surgery.
Animals
Biceps tenodesis was performed at 1 of 3 locations in 36 thirteen-week-old Sprague-Dawley rats (Charles River Laboratories). All rats were prepared for surgery by an experienced veterinary technician. Sedation was induced with isoflurane gas through a nose cone.
Surgical Procedure
Animals were randomly assigned to 3 different tenodesis groups: tendon-to-bone in the bicipital groove (metaphyseal, M); tendon-to-bone in the subpectoral region (diaphyseal, D); and soft tissue-to-soft tissue transfer to the conjoint tendon (T). A standard deltopectoral approach was used to expose the biceps tendon. The tendon was tagged with a 5-0 polypropylene suture and tenotomized at the level of the bicipital groove (zone 1). All wounds were irrigated and closed with 4-0 nylon suture.
For animals undergoing tendon-to-bone metaphyseal tenodesis, a 0.045-mm Kirschner wire was used to drill bicortically into the intertubercular sulcus. Wire positioning distal to the physeal plate was confirmed with fluoroscopy. A locking stitch of 5-0 polypropylene suture was run along the free edge of the tendon. The tendon was then passed through the bone tunnel in an anterior-to-posterior direction, and the limbs of the suture were tied around the lateral cortex.
The process was repeated for animals undergoing diaphyseal tenodesis; only the tenodesis location was different. The inferior border of the pectoralis major was identified, and a bicortical tunnel was made in the center of the diaphyseal bone. The tendon was then prepared and tenodesed to bone using the method already described.
In soft-tissue tenodesis, the conjoint tendon was identified and carefully dissected from surrounding tissues. The LHBT was then tenodesed to the attached conjoint tendon with interrupted simple stitches of 5-0 polypropylene suture.
The animals were allowed to bear weight on the operative limb immediately after surgery and without immobilization.
Specimen Harvest and Preparation
Four animals from each group were sacrificed at 6, 12, and 24 weeks. Harvested specimens were fixed in 10% neutral-buffered formalin solution. Bony specimens consisted of the upper half of the humerus and the tenodesed biceps tendon, and soft-tissue specimens consisted of the tenodesed LHBT-conjoint tendon complex. Bony specimens were decalcified in 10% ethylenediaminetetraacetic acid. All specimens were paraffin-embedded and sectioned at 7 microns.
Analysis of Cellularity
Sections were stained with hematoxylin-eosin. Overall cellularity at the tenodesis interface was quantified by averaging the nuclei count within 3 separate standardized ×20 magnification high power fields. Only nucleated cells were included in the cell count. Immunohistochemical staining with tenomodulin (Santa Cruz Laboratories, sc-49324) was performed to characterize the cell population at the interface. Deparaffinized sections underwent antigen retrieval with pronase for 30 minutes at 37°C and were incubated overnight with the anti-tenomodulin goat monoclonal antibody diluted to 1:200 in 1% phosphate-buffered saline. The prepared slides were then counterstained with methyl green. Specimens treated with tenomodulin were evaluated for presence or absence of a positive reaction at the tenodesis interface.
Analysis of Inflammation
Inflammation at the interface was evaluated with the CD68 macrophage marker (ABcam, ab31630). Deparaffinized sections underwent antigen retrieval with pronase for 30 minutes at 37°C and were incubated overnight with anti-CD68 mouse monoclonal antibodies diluted to 1:200 in 1% phosphate-buffered saline. The prepared slides were then counterstained with neutral red. Inflammation was quantified by averaging the number of reactive cells within 3 separate standardized ×20 magnification high power fields.
Statistical Analysis
Descriptive statistics were calculated for cell and macrophage counts for each group at every time point. Two-way analysis of variance was used to compare the cell and macrophage counts between groups at each time point as well as the count differences within each group between time points. P values were Bonferroni-corrected to account for the multiple comparisons between groups. P < .05 was used to signify statistical significance.
Results
All 36 animals survived to their designated harvest time without complications. Twelve specimens were successfully harvested at 6 weeks and another 12 at 24 weeks. At 12 weeks, tenodesis failure occurred in 1 animal in group D, leaving 11 specimens for analysis.
Cellularity
Within-group analysis revealed a trend of increasing cellularity at 12 weeks followed by a decrease at 24 weeks in all 3 groups (Table 2).
Inflammatory Response
During specimen processing, 1 group D specimen was severely degraded after pronase treatment, leaving 3 specimens for evaluation. Descriptive statistics for each group are listed in Table 3A.
At 6 weeks, mean CD68 cell count was significantly higher in group M than in group D (P = .011) and group T (P < .001) (Table 3B). Likewise, CD68 count was significantly higher in group D than in group T (P < .001). There were no differences in CD68 counts between the 2 bony tenodesis groups at 12 weeks (P = .486) or 24 weeks (P = .315). Both bony tenodesis groups, however, had persistently higher CD68 counts at 12 weeks when compared with group T (group M, P = .002; group D, P < .001). In these specimens, an inflammatory milieu characterized by a large accumulation of lymphocytes and giant cells was noted at the bone-tendon interface.
Tissue-Specific Staining
At 6 weeks, antigen retrieval resulted in severe degradation of 2 group M specimens, 2 group D specimens, and 1 group T specimen. The most notable tenomodulin reaction occurred in group T at the 6- and 12-week harvests, with the 6-week group having the most robust reaction. There was scant reaction in this group at 24 weeks.
Discussion
In this study, the healing response differed between bony and soft-tissue tenodesis techniques in a rat model. Tendon-to-bone tenodesis, both diaphyseal and metaphyseal, appeared to incite an inflammatory degenerative response, whereas tendon-to-tendon healing occurred in a more quiescent and perhaps even regenerative manner.
The early inflammatory response that occurred in the bony tenodesis groups is not unlike what occurs in fracture healing.27 The reaction was even more robust at 12 weeks, signifying an ongoing inflammatory process. In this context, tendon degeneration may plausibly explain the consistent absence of mature tendon within the tunnels at all 3 time points. Some tendon degeneration may be explained by the vascular damage that occurred during surgery, but this damage was a constant factor in all 3 study groups. Interestingly, group M showed the highest early CD68 counts, consistent with this being the more biologically active region of bone.28
Group T had significantly lower cell and macrophage counts throughout the study period, possibly indicating improved healing—an observation supported by a study in which the impact of macrophage depletion on bone-tendon interface healing was evaluated.29 The authors found that, in suppressing macrophage activity, the morphologic and biomechanical properties at the healing interface were significantly improved.29 These findings are consistent with Dr. O’Brien’s anecdotal experience with patients who previously underwent the biceps transfer; on second-look arthroscopy, there was complete seamless integration of tendon and conjoint tendon (Figure 4).
Studies have found that the inflammatory process is closely associated with pain, and pain syndromes such as fibromyalgia.30,31 Persistent inflammation, as seen in our bony tenodesis group, could explain the recalcitrant anterior shoulder pain that often occurs in patients after bony tenodesis of the LHBT.2,6,19,32
Studies have also suggested that osteoclasts at the bone-tendon interface—osteoclasts share a cell lineage with macrophages—may contribute to bone loss and tunnel widening.33,34 Osteoclasts are expected at the bone tunnel, as fracture healing occurs at the bone-tendon interface. These osteoclasts could have contributed to the strong CD68 reaction in our bony tenodesis groups. However, CD68 historically has been described as the classic macrophage marker.35 We specifically selected CD68 for this reason: Macrophages are the primary inflammatory cells involved in early healing and are key to the inflammatory process.36
Results of the tenomodulin analysis suggested 2 different healing processes are occurring in the bony and tendon groups. Tenomodulin is a known tenocyte marker for developing and mature tendon in both rats and humans.37,38 In our study, only group T had a positive tenomodulin reaction. Notably, the reaction occurred only at 6 and 12 weeks. This finding may indicate that a regenerative healing pattern becomes quiescent by 24 weeks. Indeed, it has been suggested that tenomodulin is a key regulator of tenocyte proliferation and tendon maturation.39
The complete absence of tenomodulin reaction in our bony tenodesis groups in the setting of significant inflammation further supports our theory of tendon degeneration within the tunnel. One potential explanation for this finding may be that as the tendon heals to the surface of the bone, the intra-osseous tendon is no longer load-bearing and is resorbed by the body through an inflammatory response. This finding differs from those in previous studies, which have described viable tendon within the bone tunnel at all time points up to 26 weeks.40 More recently, it has been suggested that callus formation at the external cortical tendon-bone interface is critical for healing and mechanical strength.41,42 In addition, recent studies have found a predominantly fibroblastic healing process at the midtunnel, potentially leading to the formation of loose fibrovascular tissue at the tendon-bone interface.43 These data, in concert with ours, call into question the rationale for performing intra-osseous tenodesis through bone tunnels.
Our study results, if confirmed in humans, will have significant clinical implications. If a similar effect can be confirmed in the human shoulder, one could argue that soft-tissue tenodesis may result in decreased postoperative shoulder pain. In addition, if tendon degeneration does occur within the intramedullary tunnel, surface fixation may be the better, safer alternative. Although older studies reported suboptimal strength with this type of fixation,8,44 more recent studies have found surface fixation strength equivalent to screw fixation strength.45,46 Such a shift in the treatment paradigm would obviate the need for violation of the humeral cortex, eliminating potential stress risers associated with screw fixation,47 and effectively eliminating the risk of iatrogenic fracture.48,49 It would be interesting to investigate what occurs histologically at the bone-tendon interface in surface fixation (ie, suture anchors). Would the inflammatory response at the surface be similar to the inflammatory intramedullary healing, or would it be similar to the quieter tendon-tendon healing? Answers to such questions have the potential to streamline the treatment algorithm for patients who require tenodesis.
Study Limitations
Our study had several limitations. First, as this was a basic science study using a rat model, its conclusions can only be extrapolated to humans. Second, given the nonspecific nature of the cellular analysis, we cannot draw any definitive conclusions about the cell population at the bone-tendon interface. For example, although tenomodulin is expressed by tenocytes, it is not an established specific marker for tenocytes and may be expressed by other fibroblastic cells. Still, our results provide insight into the local microenvironment and identify important differences between the tenodesis methods. Similarly, the complete absence of tendon within the bone tunnels suggests that an analysis of osteoclastic activity at the tenodesis interface may have been a valuable addition to the study. This finding, however, was unexpected, and we did not have the foresight to include it in our methods. A third limitation is that our fixation method essentially uses the suspension tenodesis method. This fixation method differs from the common fixation techniques used in the clinical setting. Testing of other fixation constructs would require a larger animal model. Furthermore, in suspension- type constructs, micromotion within the bone tunnel may independently elicit an inflammatory response. Inert suture was used in our fixation in order to reduce the risk of an iatrogenic inflammatory response. Last, it would have been valuable to perform a biomechanical analysis of the strength of each tenodesis construct. This was explored with our institution’s biomechanics team, but specimen size precluded successful analysis.
Conclusion
Our results indicated that, compared with tendon-to-tendon fixation, tendon-to-bone tenodesis produces a significantly greater inflammatory response at the tenodesis interface. An inflammatory milieu in the absence of tendon within the bony tunnel suggests intraosseous tendon degeneration. Tendon-to-tendon tenodesis, on the other hand, seems to limit the inflammatory response. In addition, a robust tenomodulin reaction in the early phases of tendon-to-tendon healing suggests regenerative healing. Our results showed a fundamental difference in the healing response between the 2 tenodesis methods. Further study is needed to evaluate the validity and applicability of our findings to the human patient population. Most important, our results underscore the need for more study to elucidate optimal tenodesis location and encourage orthopedic surgeons to reexamine current clinical practice patterns.
1. Alpantaki K, McLaughlin D, Karagogeos D, Hadjipavlou A, Kontakis G. Sympathetic and sensory neural elements in the tendon of the long head of the biceps. J Bone Joint Surg Am. 2005;87(7):1580-1583.
2. Nho SJ, Strauss EJ, Lenart BA, et al. Long head of the biceps tendinopathy: diagnosis and management. J Am Acad Orthop Surg. 2010;18(11):645-656.
3. Provencher MT, LeClere LE, Romeo AA. Subpectoral biceps tenodesis. Sports Med Arthrosc. 2008;16(3):170-176.
4. Werner BC, Brockmeier SF, Gwathmey FW. Trends in long head biceps tenodesis. Am J Sports Med. 2015;43(3):570-578.
5. Boileau P, Baque F, Valerio L, Ahrens P, Chuinard C, Trojani C. Isolated arthroscopic biceps tenotomy or tenodesis improves symptoms in patients with massive irreparable rotator cuff tears. J Bone Joint Surg Am. 2007;89(4):747-757.
6. Becker DA, Cofield RH. Tenodesis of the long head of the biceps brachii for chronic bicipital tendinitis. Long-term results. J Bone Joint Surg Am. 1989;71(3):376-381.
7. Richards DP, Burkhart SS. Arthroscopic-assisted biceps tenodesis for ruptures of the long head of biceps brachii: the cobra procedure. Arthroscopy. 2004;20(suppl 2):201-207.
8. Ozalay M, Akpinar S, Karaeminogullari O, et al. Mechanical strength of four different biceps tenodesis techniques. Arthroscopy. 2005;21(8):992-998.
9. Mazzocca AD, Bicos J, Santangelo S, Romeo AA, Arciero RA. The biomechanical evaluation of four fixation techniques for proximal biceps tenodesis. Arthroscopy. 2005;21(11):1296-1306.
10. Kilicoglu O, Koyuncu O, Demirhan M, et al. Time-dependent changes in failure loads of 3 biceps tenodesis techniques: in vivo study in a sheep model. Am J Sports Med. 2005;33(10):1536-1544.
11. Golish SR, Caldwell PE 3rd, Miller MD, et al. Interference screw versus suture anchor fixation for subpectoral tenodesis of the proximal biceps tendon: a cadaveric study. Arthroscopy. 2008;24(10):1103-1108.
12. Kusma M, Dienst M, Eckert J, Steimer O, Kohn D. Tenodesis of the long head of biceps brachii: cyclic testing of five methods of fixation in a porcine model. J Shoulder Elbow Surg. 2008;17(6):967-973.
13. Buchholz A, Martetschlager F, Siebenlist S, et al. Biomechanical comparison of intramedullary cortical button fixation and interference screw technique for subpectoral biceps tenodesis. Arthroscopy. 2013;29(5):845-853.
14. Werner BC, Lyons ML, Evans CL, et al. Arthroscopic suprapectoral and open subpectoral biceps tenodesis: a comparison of restoration of length-tension and mechanical strength between techniques. Arthroscopy. 2015;31(4):620-627.
15. Gilmer BB, DeMers AM, Guerrero D, Reid JB 3rd, Lubowitz JH, Guttmann D. Arthroscopic versus open comparison of long head of biceps tendon visualization and pathology in patients requiring tenodesis. Arthroscopy. 2015;31(1):29-34.
16. Sanders B, Lavery KP, Pennington S, Warner JJ. Clinical success of biceps tenodesis with and without release of the transverse humeral ligament. J Shoulder Elbow Surg. 2012;21(1):66-71.
17. Taylor SA, Fabricant PD, Bansal M, et al. The anatomy and histology of the bicipital tunnel of the shoulder. J Shoulder Elbow Surg. 2015;24(4):511-519.
18. Taylor SA, Khair MM, Gulotta LV, et al. Diagnostic glenohumeral arthroscopy fails to fully evaluate the biceps-labral complex. Arthroscopy. 2015;31(2):215-224.
19. Lutton DM, Gruson KI, Harrison AK, Gladstone JN, Flatow EL. Where to tenodese the biceps: proximal or distal? Clin Orthop Relat Res. 2011;469(4):1050-1055.
20. Moon SC, Cho NS, Rhee YG. Analysis of “hidden lesions” of the extra-articular biceps after subpectoral biceps tenodesis: the subpectoral portion as the optimal tenodesis site. Am J Sports Med. 2015;43(1):63-68.
21. Festa A, Allert J, Issa K, Tasto JP, Myer JJ. Visualization of the extra-articular portion of the long head of the biceps tendon during intra-articular shoulder arthroscopy. Arthroscopy. 2014;30(11):1413-1417.
22. Friedman DJ, Dunn JC, Higgins LD, Warner JJ. Proximal biceps tendon: injuries and management. Sports Med Arthrosc. 2008;16(3):162-169.
23. Verma NN, Drakos M, O’Brien SJ. Arthroscopic transfer of the long head biceps to the conjoint tendon. Arthroscopy. 2005;21(6):764.
24. O’Brien SJ, Taylor SA, DiPietro JR, Newman AM, Drakos MC, Voos JE. The arthroscopic “subdeltoid approach” to the anterior shoulder. J Shoulder Elbow Surg. 2013;22(4):e6-e10.
25. Drakos MC, Verma NN, Gulotta LV, et al. Arthroscopic transfer of the long head of the biceps tendon: functional outcome and clinical results. Arthroscopy. 2008;24(2):217-223.
26. Taylor SA, Fabricant PD, Baret NJ, et al. Midterm clinical outcomes for arthroscopic subdeltoid transfer of the long head of the biceps tendon to the conjoint tendon. Arthroscopy. 2014;30(12):1574-1581.
27. Marsell R, Einhorn TA. The biology of fracture healing. Injury. 2011;42(6):551-555.
28. Khan SN, Cammisa FP Jr, Sandhu HS, Diwan AD, Girardi FP, Lane JM. The biology of bone healing. J Am Acad Orthop Surg. 2005;13(1):77-86.
29. Hays PL, Kawamura S, Deng XH, et al. The role of macrophages in early healing of a tendon graft in a bone tunnel. J Bone Joint Surg Am. 2008;90(3):565-579.
30. Uhl RL, Roberts TT, Papaliodis DN, Mulligan MT, Dubin AH. Management of chronic musculoskeletal pain. J Am Acad Orthop Surg. 2014;22(2):101-110.
31. Kosek E, Altawil R, Kadetoff D, et al. Evidence of different mediators of central inflammation in dysfunctional and inflammatory pain—interleukin-8 in fibromyalgia and interleukin-1 β in rheumatoid arthritis. J Neuroimmunol. 2015;280:49-55.
32. Slenker NR, Lawson K, Ciccotti MG, Dodson CC, Cohen SB. Biceps tenotomy versus tenodesis: clinical outcomes. Arthroscopy. 2012;28(4):576-582.
33. Rodeo SA, Kawamura S, Kim HJ, Dynybil C, Ying L. Tendon healing in a bone tunnel differs at the tunnel entrance versus the tunnel exit: an effect of graft-tunnel motion? Am J Sports Med. 2006;34(11):1790-1800.
34. Hjorthaug GA, Madsen JE, Nordsletten L, Reinholt FP, Steen H, Dimmen S. Tendon to bone tunnel healing—a study on the time-dependent changes in biomechanics, bone remodeling, and histology in a rat model. J Orthop Res. 2015;33(2):216-223.
35. Pulford KA, Sipos A, Cordell JL, Stross WP, Mason DY. Distribution of the CD68 macrophage/myeloid associated antigen. Int Immunol. 1990;2(10):973-980.
36. Fujiwara N, Kobayashi K. Macrophages in inflammation. Curr Drug Targets Inflamm Allergy. 2005;4(3):281-286.
37. Qi J, Dmochowski JM, Banes AN, et al. Differential expression and cellular localization of novel isoforms of the tendon biomarker tenomodulin. J Appl Physiol (1985). 2012;113(6):861-871.
38. Jelinsky SA, Archambault J, Li L, Seeherman H. Tendon-selective genes identified from rat and human musculoskeletal tissues. J Orthop Res. 2010;28(3):289-297.
39. Docheva D, Hunziker EB, Fassler R, Brandau O. Tenomodulin is necessary for tenocyte proliferation and tendon maturation. Mol Cell Biol. 2005;25(2):699-705.
40. Rodeo SA, Arnoczky SP, Torzilli PA, Hidaka C, Warren RF. Tendon-healing in a bone tunnel. A biomechanical and histological study in the dog. J Bone Joint Surg Am. 1993;75(12):1795-1803.
41. Silva MJ, Thomopoulos S, Kusano N, et al. Early healing of flexor tendon insertion site injuries: tunnel repair is mechanically and histologically inferior to surface repair in a canine model. J Orthop Res. 2006;24(5):990-1000.
42. Hibino N, Hamada Y, Sairyo K, Yukata K, Sano T, Yasui N. Callus formation during healing of the repaired tendon–bone junction. A rat experimental model. J Bone Joint Surg Br. 2007;89(11):1539-1544.
43. Bedi A, Kawamura S, Ying L, Rodeo SA. Differences in tendon graft healing between the intra-articular and extra-articular ends of a bone tunnel. HSS J. 2009;5(1):51-57.
44. Richards DP, Burkhart SS. A biomechanical analysis of two biceps tenodesis fixation techniques. Arthroscopy. 2005;21(7):861-866.
45. Mazzocca AD, Cote MP, Arciero CL, Romeo AA, Arciero RA. Clinical outcomes after subpectoral biceps tenodesis with an interference screw. Am J Sports Med. 2008;36(10):1922-1929.
46. Baleani M, Francesconi D, Zani L, Giannini S, Snyder SJ. Suprapectoral biceps tenodesis: a biomechanical comparison of a new “soft anchor” tenodesis technique versus interference screw biceps tendon fixation. Clin Biomech. 2015;30(2):188-194.
47. Euler SA, Smith SD, Williams BT, Dornan GJ, Millett PJ, Wijdicks CA. Biomechanical analysis of subpectoral biceps tenodesis: effect of screw malpositioning on proximal humeral strength. Am J Sports Med. 2015;43(1):69-74.
48. Sears BW, Spencer EE, Getz CL. Humeral fracture following subpectoral biceps tenodesis in 2 active, healthy patients. J Shoulder Elbow Surg. 2011;20(6):e7-e11.
49. Dein EJ, Huri G, Gordon JC, McFarland EG. A humerus fracture in a baseball pitcher after biceps tenodesis. Am J Sports Med. 2014;42(4):877-879.
A Systematic Review of 21 Tibial Tubercle Osteotomy Studies and More Than 1000 Knees: Indications, Clinical Outcomes, Complications, and Reoperations
Take-Home Points
- TTO specifics depend on anatomy, radiographic alignment characteristics, and presence of chondral defects.
- Osteotomy and movement of the tibial tubercle can include anteriorization, anteromedialization, proximalization, medialization, or distalization.
- TTO was most commonly performed for isolated patellar instability in the presence of knee pain.
- Young women with prior surgery on the affected knee made up the primary patient population for this procedure.
- While TTO significantly improves knee pain and clinical outcome scores, >1 in 5 patients required reoperation for hardware removal.
Patellofemoral pain and patellofemoral instability are common orthopedic problems. Studies have found that 30% of patients 13 to 19 years old have patellofemoral pain and that 29 in 100,000 patients 10 to 17 years old have patellofemoral instability.1-3 The reported rate of recurrence after nonoperative management of patellofemoral instability is 33%.4 Tibial tubercle osteotomy (TTO), first described by Hauser5 in 1938, is an effective treatment option for many patellofemoral disorders.
TTO indications include patellofemoral maltracking or malalignment, patellar instability, patellofemoral arthritis, and focal patellofemoral chondral defects.6 With TTO, the goal is to move the tibial tubercle in a direction that will either improve patellar tracking or offload the medial or lateral patellar facet to improve pain and function.7,8 This action typically involves anterior, medial, lateral, or distal translation of the tibial tubercle, as posteriorization can lead to increased contact forces across the patellofemoral joint, resulting in accelerated patellofemoral wear and increased pain.9
We systematically reviewed the TTO literature to identify indications, clinical outcomes, complications, and reoperations. We hypothesized that the overall complication rate and the overall reoperation rate would both be <10%.
Clinical Evaluation of Patellofemoral Pathology
Patients with patellofemoral pain often report anterior knee pain, which typically begins gradually and is often activity related. Several symptoms may be present: pain with prolonged sitting with knees bent; pain on rising from a seated position; pain or crepitus with climbing stairs; and pain during repetitive activity such as running, squatting, or jumping. Location, duration, and onset of symptoms should be elicited. Patellofemoral instability can be described as dislocation events or subluxation events; number of events, mechanisms of injury, and resulting need for reduction should be documented. As age, sex, body mass index, and physical fitness are relevant to risk of recurrence, the physician should ask about general ligamentous laxity, other joint dislocations, and prior surgical intervention. Swelling or mechanical symptoms may indicate patellofemoral joint pathology.6,10
Physical examination of patients with patellofemoral pathology begins with assessment for overall limb alignment (including resting position of patella and corresponding quadriceps angle [Q-angle]), generalized ligamentous laxity (including hypermobile joints, evaluated with Brighton criteria), overall peri-knee muscle tone and strength, effusion, and gait pattern.

Common TTO Procedures
TTO specifics depend on anatomy, radiographic alignment characteristics, and presence of chondral defects. Essentially, the patella is translated to offload the affected areas. Osteotomy and movement of the tibial tubercle can include anteriorization, anteromedialization, proximalization, medialization, or distalization.
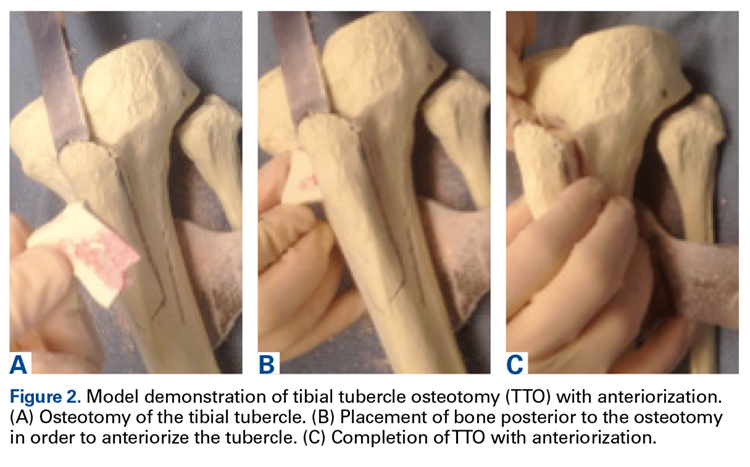

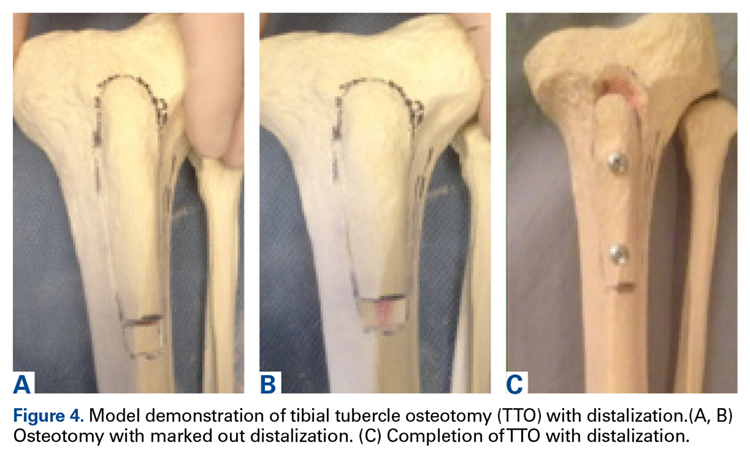
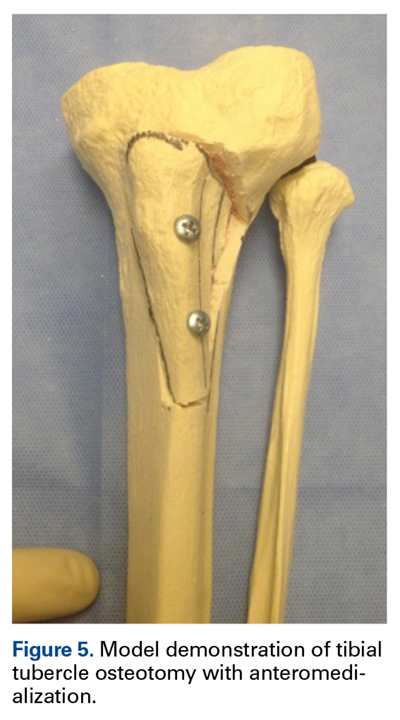


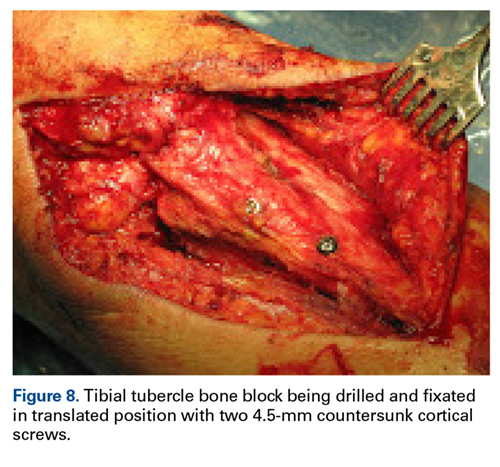
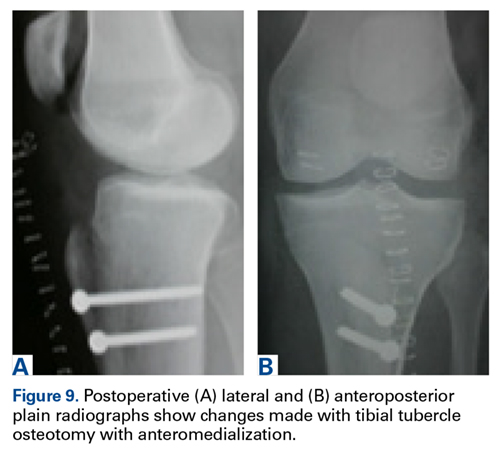
Methods
Search Strategy and Data Collection
We searched the PubMed (Medline) database for all English-language TTO studies published between database inception and April 9, 2015. After PROSPERO registration, and following PRISMA (Preferred Reporting Items for Systematic Reviews and Meta-Analyses) guidelines, we used the algorithm (“tibial” AND “tubercle” AND “osteotomy”) NOT (“total” AND “knee” AND “arthroplasty”) to search the literature. Inclusion criteria included level I-IV studies on TTO indications, operative findings, and outcomes. Exclusion criteria were non-English studies, unpublished studies, level V evidence, letters to the editor, editorials, review articles, basic science articles, technique articles, revision procedures, articles without clinical outcomes, and conference proceeding abstracts. Studies that reported on duplicate populations were included only with the most recent available clinical outcomes. All abstracts were reviewed in duplicate by Dr. Levy and Dr. Rao and assessed with respect to the criteria outlined. Then the same authors performed full-text reviews of eligible studies before including these studies in the systematic review.
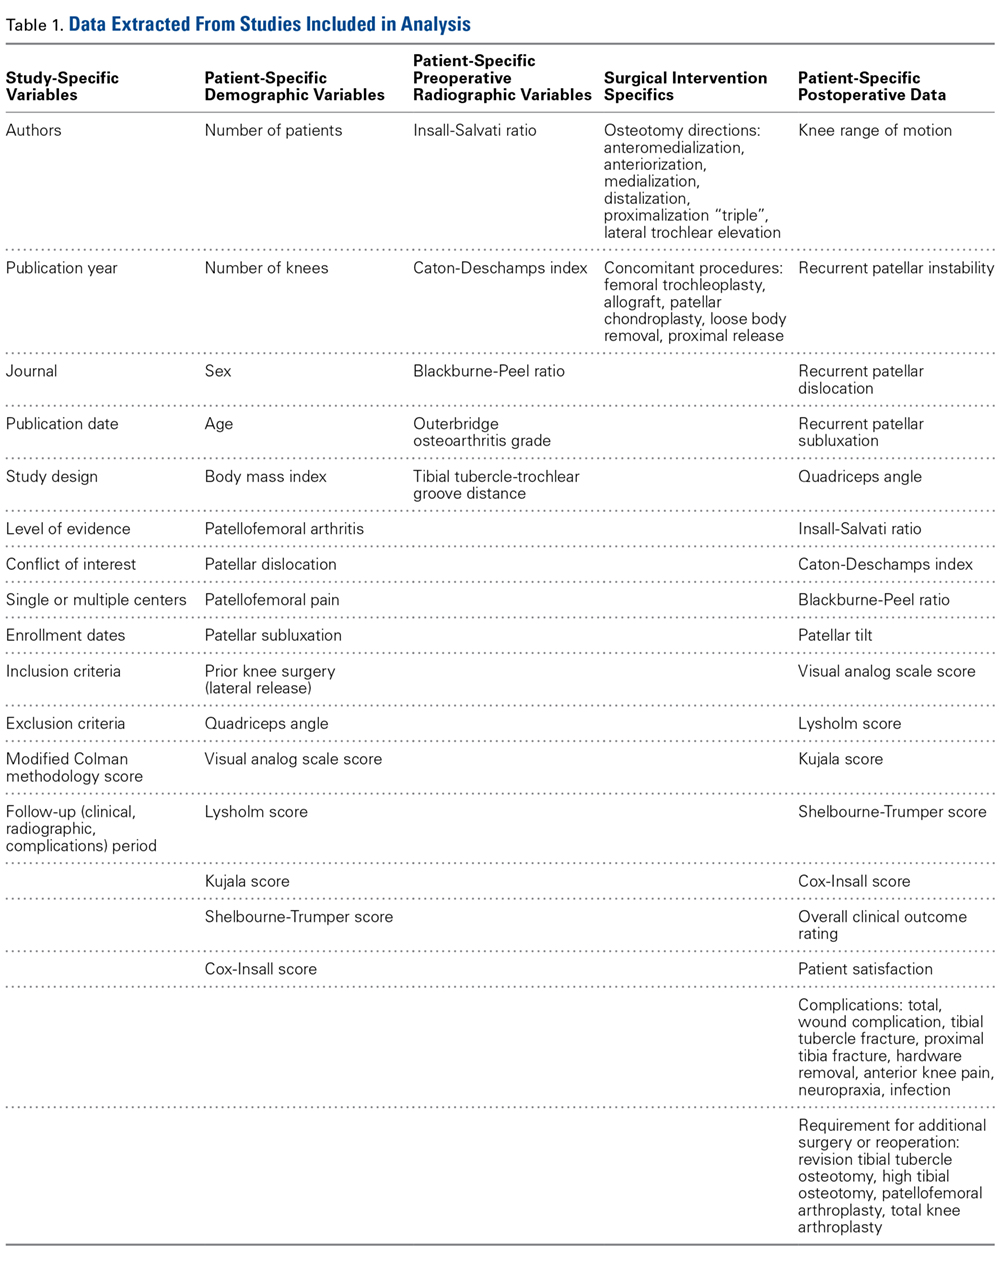
Assessment of Study Quality
The quality of each TTO study in the review was assessed with a modified Coleman methodology score (MCMS), which ranges from 0 to 100. A study with an MCMS of <55 points is considered a poor-quality study.11
Data Synthesis and Statistical Analysis
Given that most of the included studies were level IV, a formal meta-analysis was not indicated. In this article, we report categorical data as frequencies with percentages and preoperative and postoperative continuous data as means (SDs), with weighted means based on number of patients in each study, where applicable. We used 2-tailed t tests for comparisons made with the free Meta-Analysis Calculator and Grapher (http://www.healthstrategy.com/meta/meta.pl ). Statistical significance was set at P < .05.
Results
Search Results and Included Studies
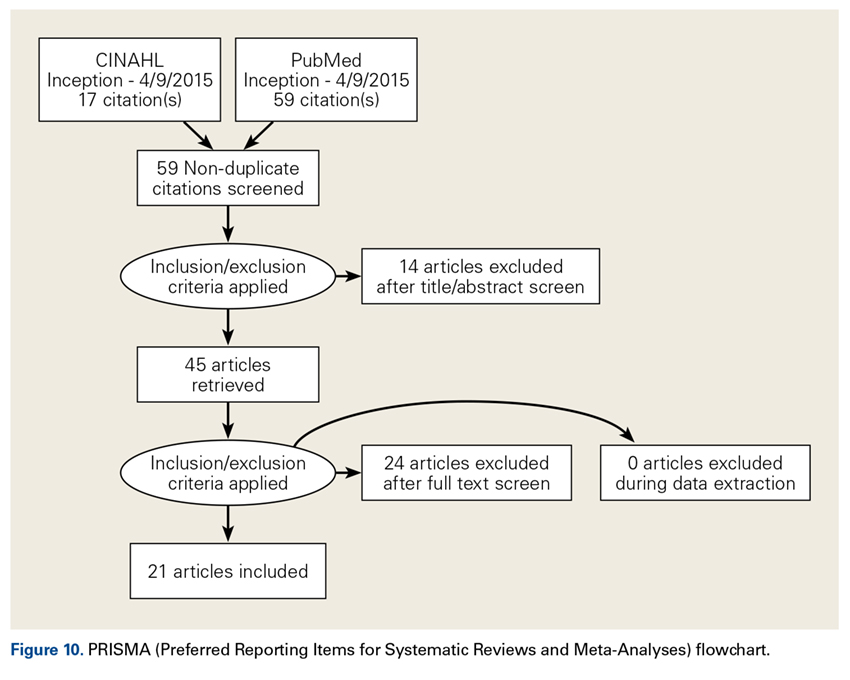
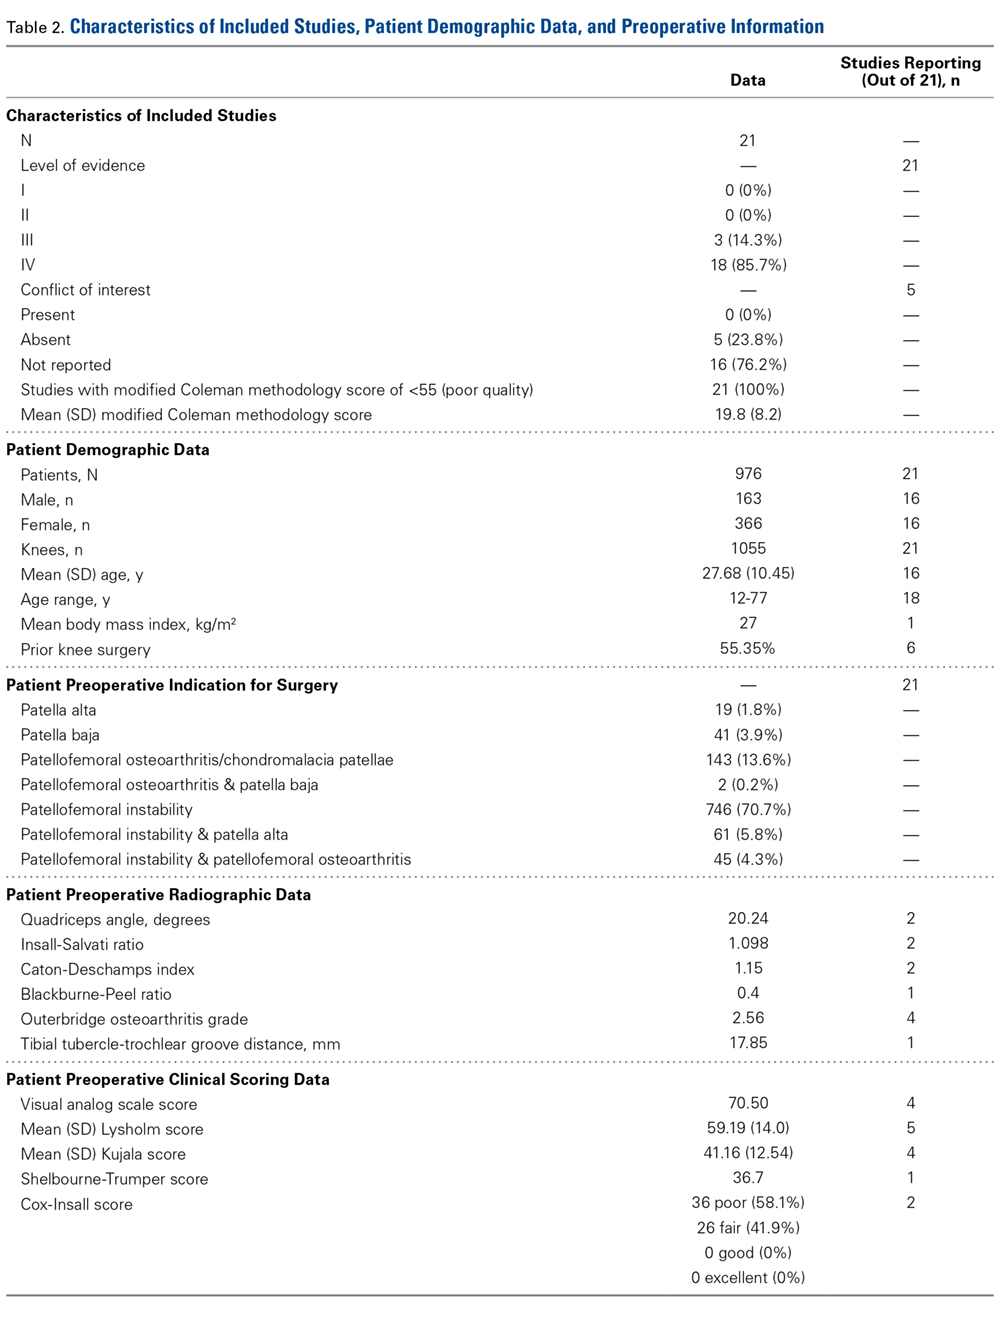
Only 1 study provided preoperative body mass index (27 kg/m2). There were 55.35% of patients who had prior surgery on the affected knee (6 studies reporting).
Preoperative Data
Preoperative pathologic, radiographic, and clinical scoring data were scarcely reported and nonuniform (Table 2). The most common pathology treated with TTO was isolated patellofemoral instability (746/1055 patients, 70.7%). The other pathologies addressed were isolated patellofemoral osteoarthritis/chondromalacia patellae (143, 13.6%), patellofemoral instability with patella alta (61, 5.8%), patellofemoral instability with patellofemoral osteoarthritis (45, 4.3%), isolated patella baja (41, 3.9%), isolated patella alta (19, 1.8%), and patellofemoral osteoarthritis with patella baja (2, 0.2%). Five hundred fifty-five patients (53%) had a preoperative complaint that included knee pain, and 809 (77%) reported preoperative patellar laxity or instability events. The imaging data reported were Q-angle, Insall-Salvati ratio, Caton-Deschamps index, Blackburne-Peel ratio, Outerbridge osteoarthritis grade, and TT-TG distance. Preoperative clinical scoring data most prominently included a visual analog scale (VAS) score of 70.50 (4 studies reporting), a Lysholm score of 59.19 (5 studies), and a Kujala score of 41.16 (4 studies). Shelbourne-Trumper and Cox-Insall scores were reported in 1 and 2 studies, respectively.
Operative Characteristics
Of the 21 studies, 12 reported only on patients who had TTO performed in isolation; in the other 9 studies, cohorts included patients who underwent concurrent procedures. In the 17 studies (856 patients) that listed numbers of patients who underwent specific concomitant procedures, 715 patients (83.5%) underwent an isolated TTO procedure, and the other 141 (16.5%) underwent either concomitant lateral femoral trochleoplasty, arthroscopic drilling of chondral lesions, patellar shaving chondroplasty, partial meniscectomy or concomitant meniscal repair, intra-articular loose body removal, and/or lateral release with or without medial plication.
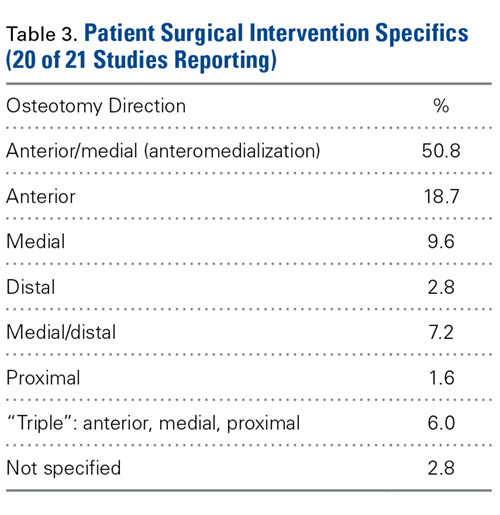
Postoperative Data
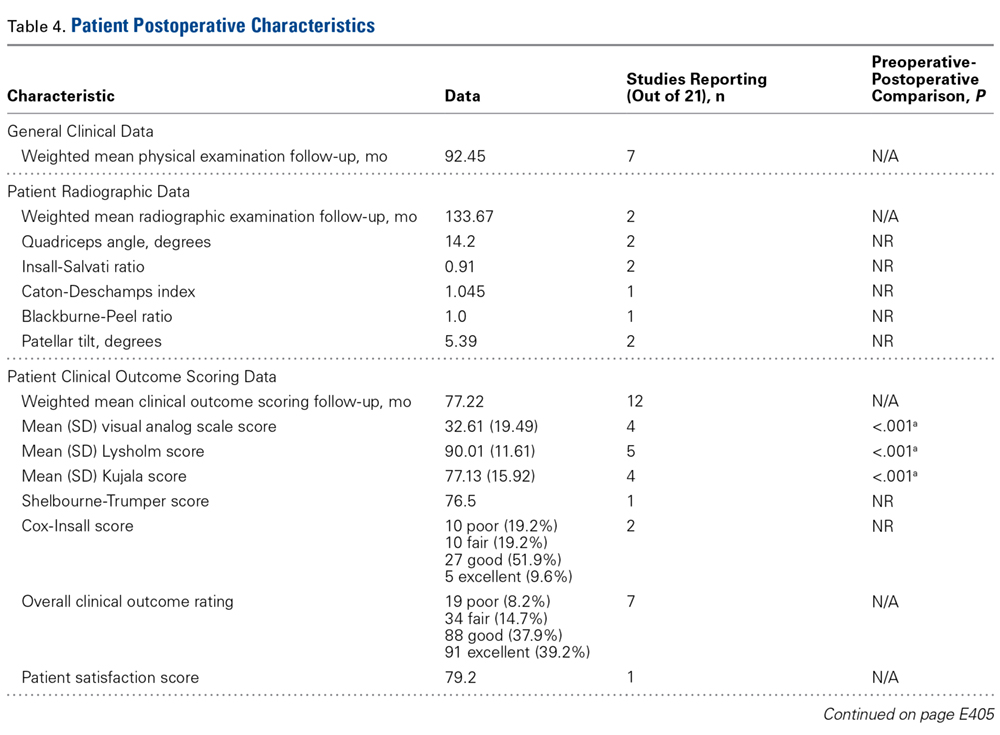
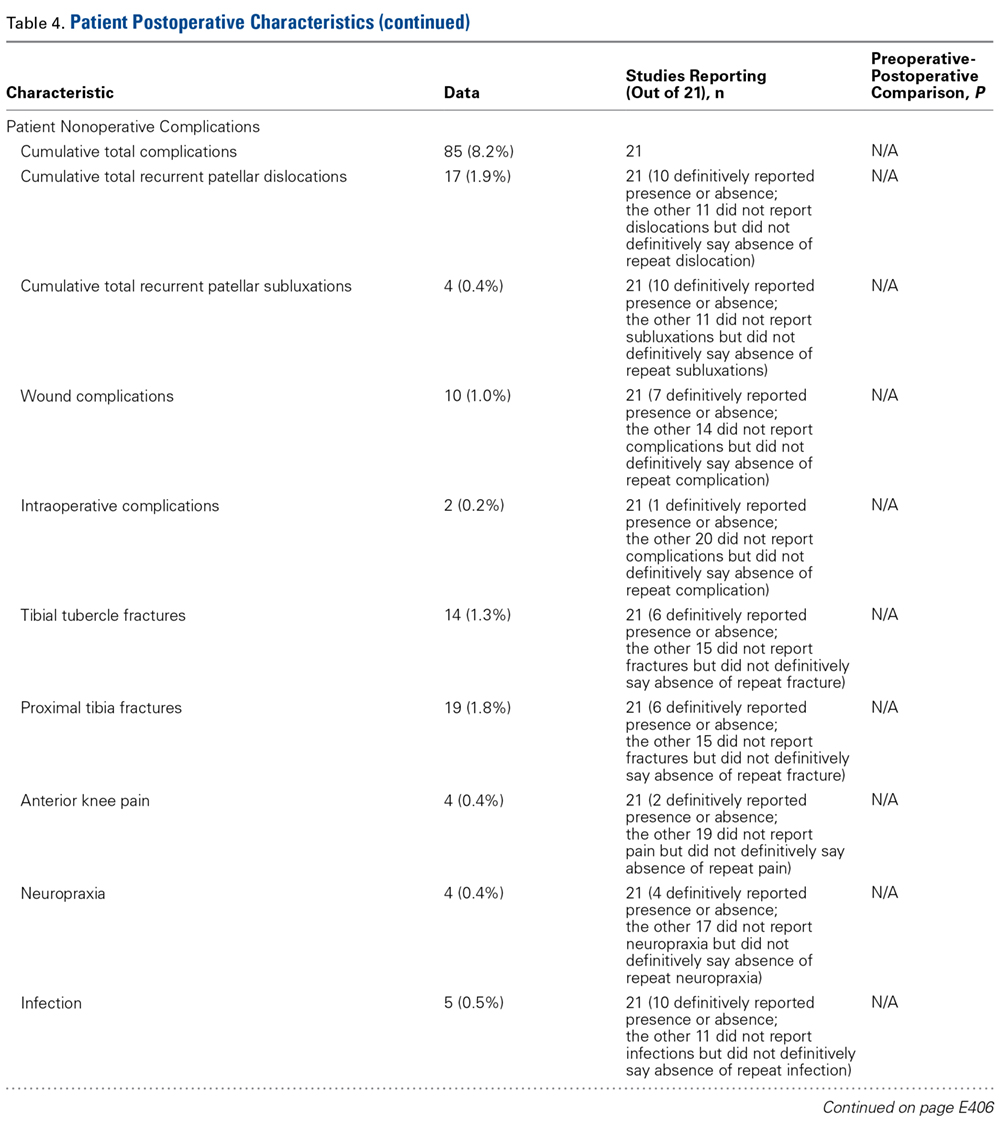
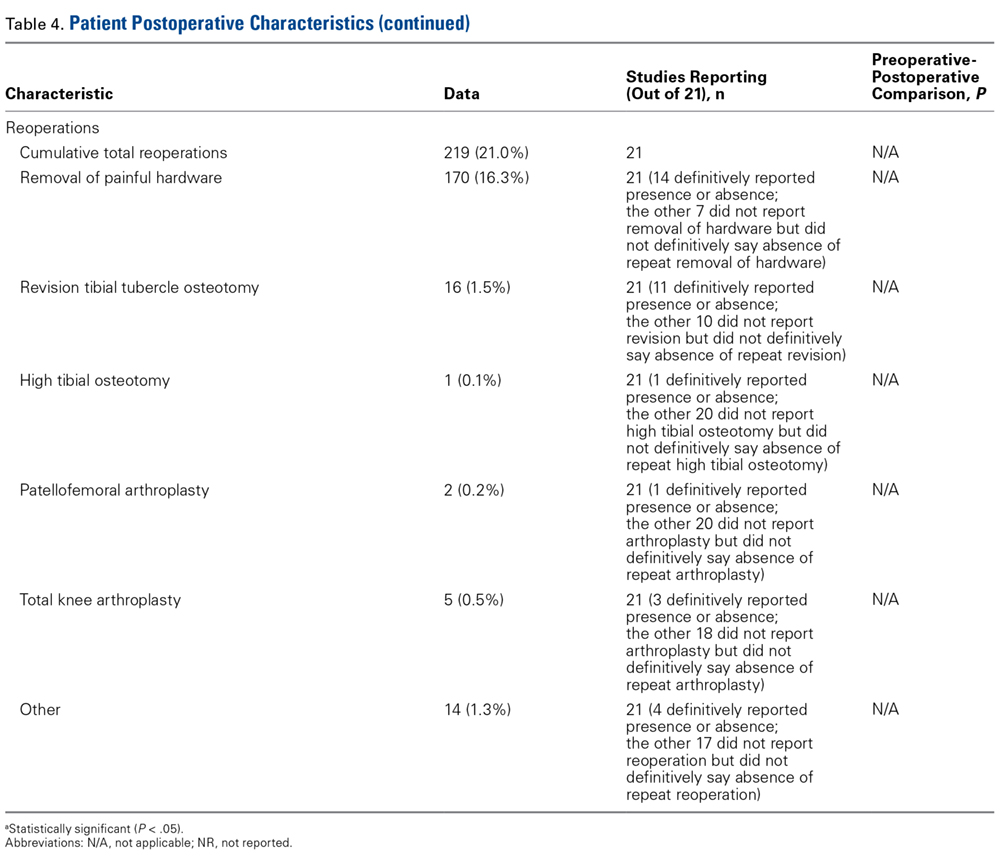
There was a cumulative total of 79 complications (8% of cohort): 17 recurrent patellar dislocations (1.9%), 4 recurrent patellar subluxations (0.4%), 10 wound complications (1.0%), 2 intraoperative complications (0.2%), 14 tibial tubercle fractures (1.3%), 19 proximal tibia fractures (1.8%), 4 cases of anterior knee pain (0.4%), 4 cases of neuropraxia (0.4%), and 5 infections (0.5%). Of note, 219 knees (21%) required reoperation, but 170 (16.3%) of these were for painful hardware removal. Sixteen knees (1.5%) required revision TTO, 1 (0.1%) required subsequent high tibial osteotomy, 2 (0.2%) underwent patellofemoral arthroplasty for advanced arthritic changes, and 5 (0.5%) underwent total knee arthroplasty for advanced arthritic changes.
Studies With TTO Performed in Isolation
Twelve studies reported outcomes of isolated TTO procedures. In the 638 patients who underwent isolated TTO, the pathologies addressed were instability/laxity (429 patients, 67%), patellofemoral osteoarthritis (74, 12%), patella alta with instability (61, 10%), patellofemoral osteoarthritis with instability (31, 5%), patella baja (24, 4%), and patella alta (19, 3%). Pain was a preoperative issue in 289 (45%) of these patients and instability in 472 (74%).
Only 2.8% of patients experienced postoperative patellar dislocation events. Of the 12 studies, 2 reported VAS scores (34-point weighted mean improvement, 65 points before surgery to 31 after surgery), 3 reported Lysholm scores (30-point improvement, from 60 to 90), and 2 reported Kujala scores (21-point improvement, from 46 to 67).
Complication rates for this isolated-TTO pooled cohort of patients were 1.2% for revision TTOs, 0.5% for wound complications, 0.8% for tibial tubercle fractures, and 1.9% for proximal tibia fractures. In total, 16% of patients required hardware removal after surgery.
Discussion
This study found that TTO improved patient pain and clinical outcome scores despite having a high (16%) rate of reoperation for painful hardware in patients with preoperative pain or instability, or with patellofemoral osteoarthritis or aberrant patellar anatomy. This reoperation rate and the overall complication rate both exceeded our hypothesized 10% cumulative rate. However, <1% of patients required conversion to a definitive end-stage surgery (patellofemoral arthroplasty or total knee arthroplasty) by final follow-up, and the rates of comorbidities (anterior knee pain, wound infection, recurrent patellar subluxation/dislocation, tibial fracture) were relatively low.
Patellofemoral disorders are common in the general population and a frequent primary complaint on presentation to orthopedic offices. Having a thorough understanding of knee joint biomechanics is imperative when trying to determine whether surgery is appropriate for these complaints and how to proceed. Extensor mechanism abnormalities, including high lateral force vectors (or larger TT-TG distances) and excessive patellar tilt, can affect alignment and increase the risk for patellofemoral dislocations, patellofemoral anterior- based knee pains, and chondral lesions. Patella alta, an elevated patella, risks increased contact stresses between the patella and the trochlear groove33 and decreases the osseous constraints that inhibit dislocation of the patella with physiologic flexion of the joint.34 With TTO, the change in tuberosity position can alter angles in the extensor mechanism and thereby decrease joint reaction forces and patellofemoral contact area forces.35,36
Although its use began as an option for combating patellar instability events in patients with predisposed patellofemoral kinematics,5 TTO has evolved in its therapeutic uses to include offloading patellar and trochlear focal chondral lesions and slowing progression of patellofemoral arthritis. Multiple iterations and modifications of the procedure have involved distal and medial transfer of the tibial tuberosity, medialization alone, concurrent anterior and medial elevation of the tuberosity, and proximal or distal transfers, depending on the pathology being corrected. Although TTO is highly versatile in treating multiple patellofemoral joint pathologies, this study found that its primary indication continues to be patellar instability, with anteromedialization as the most common direction of tubercle transfer in support of the medial structures providing the medial force vector that keeps the patella in place. These medial structures include the medial patellofemoral ligament, the vastus medialis obliquus, the medial patellotibial ligament, and the medial retinaculum.
Also notable was the relatively high rate of reoperation after TTO. However, >75% of reoperations were performed to remove painful hardware, and the need for reoperation seemed to have no effect on the statistically significant overall preoperative-to-postoperative improvement in VAS, Lysholm, and Kujala scores. Rates of definitive surgery for end-stage patellofemoral changes, including patellofemoral arthroplasty and total knee arthroplasty, were quite low at the weighted mean follow-up of several years after surgery, suggesting a role for TTO in avoiding arthroplasty. Although the infection rate was <1%, the rate of tibial tubercle or proximal tibia fractures was a cumulative 3.1%. Patients should be counseled on this complication risk, as treatment can require cast immobilization and weight-bearing limitations.24
The 69% proportion of women in the overall cohort and the mean (SD) age of 27.68 (10.45) years highlight the primary patient population that undergoes TTO. Compared with men, young women are more likely to have aberrant patellofemoral biomechanics, owing to their native anatomy, including their relatively larger Q-angle and TT-TG distance and thus increased lateral translational force vectors on the patella.37 In addition, more than half of patients who are having TTO underwent previous surgery on the affected knee—an indication that TTO is still not universally considered first-line in addressing patellofemoral pathology.
Limitations of the Analysis
The limitations of this analysis derive from the limitations of the included studies, which were mostly retrospective case series with relatively short follow-up. The low MCMS (<55) of all 21 studies highlights their low quality as well. These studies showed considerable heterogeneity in their reporting of specific preoperative, intraoperative, and postoperative radiographic, physical examination, and clinical outcome scores, which may be indicative of the relatively low rate of use of TTO, a procedure originally described decades ago. These studies also showed ample heterogeneity in the specific radiographic parameters or outcome scales they used to present their data. We were therefore limited in our ability to cohesively summarize and provide cumulative data points from the patients as a unified cohort. There was substantial variety in the procedures performed, surgical techniques used, concomitant pathologies addressed at time of surgery, and diagnoses treated—indicating a performance bias. This additionally precluded any significant meta-analysis within the patient cohort. A higher quality study, a randomized controlled trial, is needed to answer more definitively and completely the questions we left unanswered, including the effect on radiographic parameters, additional clinical outcomes, and patient satisfaction.
Conclusion
TTO is most commonly performed for isolated patellar instability in the presence of knee pain. Other pathologies addressed are patellofemoral osteoarthritis, and patella alta and patella baja with and without associated knee pain. TTO significantly improves knee pain and clinical outcome scores, though 21% of patients (>1 in 5) require reoperation for hardware removal. Young women with prior surgery on the affected knee are the primary patient population.
1. Blond L, Hansen L. Patellofemoral pain syndrome in athletes: a 5.7- year retrospective follow-up study of 250 athletes. Acta Orthop Belg. 1998;64(4):393-400.
2. Fairbank JC, Pynsent PB, van Poortvliet JA, Phillips H. Mechanical factors in the incidence of knee pain in adolescents and young adults. J Bone Joint Surg Br. 1984;66(5):685-693.
3. Mehta VM, Inoue M, Nomura E, Fithian DC. An algorithm guiding the evaluation and treatment of acute primary patellar dislocations. Sports Med Arthrosc. 2007;15(2):78-81.
4. Erickson BJ, Mascarenhas R, Sayegh ET, et al. Does operative treatment of first-time patellar dislocations lead to increased patellofemoral stability? A systematic review of overlapping meta-analyses. Arthroscopy. 2015;31(6):1207-1215.
5. Hauser E. Total tendon transplant for slipping patella. Surg Gynecol Obstet. 1938;66:199-214.
6. Sherman SL, Erickson BJ, Cvetanovich GL, et al. Tibial tuberosity osteotomy: indications, techniques, and outcomes. Am J Sports Med. 2014;42(8):2006-2017.
7. Hall MJ, Mandalia VI. Tibial tubercle osteotomy for patello-femoral joint disorders. Knee Surg Sports Traumatol Arthrosc. 2016;24(3):855-861.
8. Grawe B, Stein BS. Tibial tubercle osteotomy: indication and techniques. J Knee Surg. 2015;28(4):279-284.
9. Fulkerson JP. Disorders of the Patellofemoral Joint. 4th ed. Baltimore, MD: Williams & Wilkins; 1997.
10. Koh JL, Stewart C. Patellar instability. Clin Sports Med. 2014;33(3):461-476.
11. Coleman BD, Khan KM, Maffulli N, Cook JL, Wark JD. Studies of surgical outcome after patellar tendinopathy: clinical significance of methodological deficiencies and guidelines for future studies. Victorian Institute of Sport Tendon Study Group. Scand J Med Sci Sports. 2000;10(1):2-11.
12. Al-Sayyad MJ, Cameron JC. Functional outcome after tibial tubercle transfer for the painful patella alta. Clin Orthop Rel Res. 2002;(396):152-162.
13. Atkinson HD, Bailey CA, Anand S, Johal P, Oakeshott RD. Tibial tubercle advancement osteotomy with bone allograft for patellofemoral arthritis: a retrospective cohort study of 50 knees. Arch Orthop Trauma Surg. 2012;132(4):437-445.
14. Caton JH, Dejour D. Tibial tubercle osteotomy in patello-femoral instability and in patellar height abnormality. Int Orthop. 2010;34(2):305-309.
15. Dantas P, Nunes C, Moreira J, Amaral LB. Antero-medialisation of the tibial tubercle for patellar instability. Int Orthop. 2005;29(6):390-391.
16. Drexler M, Dwyer T, Marmor M, Sternheim A, Cameron HU, Cameron JC. The treatment of acquired patella baja with proximalize the tibial tuberosity. Knee Surg Sports Traumatol Arthrosc. 2013;21(11):2578-2583.
17. Eager MR, Bader DA, Kelly JD 4th, Moyer RA. Delayed fracture of the tibia following anteromedialization osteotomy of the tibial tubercle: a report of 5 cases. Am J Sports Med. 2004;32(4):1041-1048.
18. Ebinger TP, Boezaart A, Albright JP. Modifications of the Fulkerson osteotomy: a pilot study assessment of a novel technique of dynamic intraoperative determination of the adequacy of tubercle transfer. Iowa Orthop J. 2007;27:61-64.
19. Fulkerson JP, Becker GJ, Meaney JA, Miranda M, Folcik MA. Anteromedial tibial tubercle transfer without bone graft. Am J Sports Med. 1990;18(5):490-498.
20. Heatley FW, Allen PR, Patrick JH. Tibial tubercle advancement for anterior knee pain: a temporary or permanent solution. Clin Orthop Relat Res. 1986;(208):216-225.
21. Hirsh DM, Reddy DK. Experience with Maquet anterior tibial tubercle advancement for patellofemoral arthralgia. Clin Orthop Relat Res. 1980;(148):136-139.
22. Jack CM, Rajaratnam SS, Khan HO, Keast-Butler O, Butler-Manuel PA, Heatley FW. The modified tibial tubercle osteotomy for anterior knee pain due to chondromalacia patellae in adults: a five-year prospective study. Bone Joint Res. 2012;1(8):167-173.
23. Koëter S, Diks MJ, Anderson PG, Wymenga AB. A modified tibial tubercle osteotomy for patellar maltracking: results at two years. J Bone Joint Surg Br. 2007;89(2):180-185.
24. Luhmann SJ, Fuhrhop S, O’Donnell JC, Gordon JE. Tibial fractures after tibial tubercle osteotomies for patellar instability: a comparison of three osteotomy configurations. J Child Orthop. 2011;5(1):19-26.
25. Naranja RJ Jr, Reilly PJ, Kuhlman JR, Haut E, Torg JS. Long-term evaluation of the Elmslie-Trillat-Maquet procedure for patellofemoral dysfunction. Am J Sports Med. 1996;24(6):779-784.
26. Naveed MA, Ackroyd CE, Porteous AJ. Long-term (ten- to 15-year) outcome of arthroscopically assisted Elmslie-Trillat tibial tubercle osteotomy. Bone Joint J. 2013;95(4):478-485.
27. Paulos L, Swanson SC, Stoddard GJ, Barber-Westin S. Surgical correction of limb malalignment for instability of the patella: a comparison of 2 techniques. Am J Sports Med. 2009;37(7):1288-1300.
28. Pidoriano AJ, Weinstein RN, Buuck DA, Fulkerson JP. Correlation of patellar articular lesions with results from anteromedial tibial tubercle transfer. Am J Sports Med. 1997;25(4):533-537.
29. Shen HC, Chao KH, Huang GS, Pan RY, Lee CH. Combined proximal and distal realignment procedures to treat the habitual dislocation of the patella in adults. Am J Sports Med. 2007;35(12):2101-2108.
30. Stetson WB, Friedman MJ, Fulkerson JP, Cheng M, Buuck D. Fracture of the proximal tibia with immediate weightbearing after a Fulkerson osteotomy. Am J Sports Med. 1997;25(4):570-574.
31. Valenzuela L, Nemtala F, Orrego M, et al. Treatment of patellofemoral chondropathy with the Bandi tibial tubercle osteotomy: more than 10 years follow-up. Knee. 2011;18(2):94-97.
32. Wang CJ, Wong T, Ko JY, Siu KK. Triple positioning of tibial tubercle osteotomy for patellofemoral disorders. Knee. 2014;21(1):133-137.
33. Luyckx T, Didden K, Vandenneucker H, Labey L, Innocenti B, Bellemans J. Is there a biomechanical explanation for anterior knee pain in patients with patella alta? Influence of patellar height on patellofemoral contact force, contact area and contact pressure. J Bone Joint Surg Br. 2009;91(3):344-350.
34. Mayer C, Magnussen RA, Servien E, et al. Patellar tendon tenodesis in association with tibial tubercle distalization for the treatment of episodic patellar dislocation with patella alta. Am J Sports Med. 2012;40(2):346-351.
35. Maquet P. Advancement of the tibial tuberosity. Clin Orthop Relat Res. 1976;(115):225-230.
36. Lewallen DG, Riegger CL, Myers ER, Hayes WC. Effects of retinacular release and tibial tubercle elevation in patellofemoral degenerative joint disease. J Orthop Res. 1990;8(6):856-862.
37. Aglietti P, Insall JN, Cerulli G. Patellar pain and incongruence, I: measurements of incongruence. Clin Orthop Relat Res. 1983;(176):217-224.
Take-Home Points
- TTO specifics depend on anatomy, radiographic alignment characteristics, and presence of chondral defects.
- Osteotomy and movement of the tibial tubercle can include anteriorization, anteromedialization, proximalization, medialization, or distalization.
- TTO was most commonly performed for isolated patellar instability in the presence of knee pain.
- Young women with prior surgery on the affected knee made up the primary patient population for this procedure.
- While TTO significantly improves knee pain and clinical outcome scores, >1 in 5 patients required reoperation for hardware removal.
Patellofemoral pain and patellofemoral instability are common orthopedic problems. Studies have found that 30% of patients 13 to 19 years old have patellofemoral pain and that 29 in 100,000 patients 10 to 17 years old have patellofemoral instability.1-3 The reported rate of recurrence after nonoperative management of patellofemoral instability is 33%.4 Tibial tubercle osteotomy (TTO), first described by Hauser5 in 1938, is an effective treatment option for many patellofemoral disorders.
TTO indications include patellofemoral maltracking or malalignment, patellar instability, patellofemoral arthritis, and focal patellofemoral chondral defects.6 With TTO, the goal is to move the tibial tubercle in a direction that will either improve patellar tracking or offload the medial or lateral patellar facet to improve pain and function.7,8 This action typically involves anterior, medial, lateral, or distal translation of the tibial tubercle, as posteriorization can lead to increased contact forces across the patellofemoral joint, resulting in accelerated patellofemoral wear and increased pain.9
We systematically reviewed the TTO literature to identify indications, clinical outcomes, complications, and reoperations. We hypothesized that the overall complication rate and the overall reoperation rate would both be <10%.
Clinical Evaluation of Patellofemoral Pathology
Patients with patellofemoral pain often report anterior knee pain, which typically begins gradually and is often activity related. Several symptoms may be present: pain with prolonged sitting with knees bent; pain on rising from a seated position; pain or crepitus with climbing stairs; and pain during repetitive activity such as running, squatting, or jumping. Location, duration, and onset of symptoms should be elicited. Patellofemoral instability can be described as dislocation events or subluxation events; number of events, mechanisms of injury, and resulting need for reduction should be documented. As age, sex, body mass index, and physical fitness are relevant to risk of recurrence, the physician should ask about general ligamentous laxity, other joint dislocations, and prior surgical intervention. Swelling or mechanical symptoms may indicate patellofemoral joint pathology.6,10
Physical examination of patients with patellofemoral pathology begins with assessment for overall limb alignment (including resting position of patella and corresponding quadriceps angle [Q-angle]), generalized ligamentous laxity (including hypermobile joints, evaluated with Brighton criteria), overall peri-knee muscle tone and strength, effusion, and gait pattern.
Common TTO Procedures
TTO specifics depend on anatomy, radiographic alignment characteristics, and presence of chondral defects. Essentially, the patella is translated to offload the affected areas. Osteotomy and movement of the tibial tubercle can include anteriorization, anteromedialization, proximalization, medialization, or distalization.
Methods
Search Strategy and Data Collection
We searched the PubMed (Medline) database for all English-language TTO studies published between database inception and April 9, 2015. After PROSPERO registration, and following PRISMA (Preferred Reporting Items for Systematic Reviews and Meta-Analyses) guidelines, we used the algorithm (“tibial” AND “tubercle” AND “osteotomy”) NOT (“total” AND “knee” AND “arthroplasty”) to search the literature. Inclusion criteria included level I-IV studies on TTO indications, operative findings, and outcomes. Exclusion criteria were non-English studies, unpublished studies, level V evidence, letters to the editor, editorials, review articles, basic science articles, technique articles, revision procedures, articles without clinical outcomes, and conference proceeding abstracts. Studies that reported on duplicate populations were included only with the most recent available clinical outcomes. All abstracts were reviewed in duplicate by Dr. Levy and Dr. Rao and assessed with respect to the criteria outlined. Then the same authors performed full-text reviews of eligible studies before including these studies in the systematic review.
Assessment of Study Quality
The quality of each TTO study in the review was assessed with a modified Coleman methodology score (MCMS), which ranges from 0 to 100. A study with an MCMS of <55 points is considered a poor-quality study.11
Data Synthesis and Statistical Analysis
Given that most of the included studies were level IV, a formal meta-analysis was not indicated. In this article, we report categorical data as frequencies with percentages and preoperative and postoperative continuous data as means (SDs), with weighted means based on number of patients in each study, where applicable. We used 2-tailed t tests for comparisons made with the free Meta-Analysis Calculator and Grapher (http://www.healthstrategy.com/meta/meta.pl ). Statistical significance was set at P < .05.
Results
Search Results and Included Studies
Only 1 study provided preoperative body mass index (27 kg/m2). There were 55.35% of patients who had prior surgery on the affected knee (6 studies reporting).
Preoperative Data
Preoperative pathologic, radiographic, and clinical scoring data were scarcely reported and nonuniform (Table 2). The most common pathology treated with TTO was isolated patellofemoral instability (746/1055 patients, 70.7%). The other pathologies addressed were isolated patellofemoral osteoarthritis/chondromalacia patellae (143, 13.6%), patellofemoral instability with patella alta (61, 5.8%), patellofemoral instability with patellofemoral osteoarthritis (45, 4.3%), isolated patella baja (41, 3.9%), isolated patella alta (19, 1.8%), and patellofemoral osteoarthritis with patella baja (2, 0.2%). Five hundred fifty-five patients (53%) had a preoperative complaint that included knee pain, and 809 (77%) reported preoperative patellar laxity or instability events. The imaging data reported were Q-angle, Insall-Salvati ratio, Caton-Deschamps index, Blackburne-Peel ratio, Outerbridge osteoarthritis grade, and TT-TG distance. Preoperative clinical scoring data most prominently included a visual analog scale (VAS) score of 70.50 (4 studies reporting), a Lysholm score of 59.19 (5 studies), and a Kujala score of 41.16 (4 studies). Shelbourne-Trumper and Cox-Insall scores were reported in 1 and 2 studies, respectively.
Operative Characteristics
Of the 21 studies, 12 reported only on patients who had TTO performed in isolation; in the other 9 studies, cohorts included patients who underwent concurrent procedures. In the 17 studies (856 patients) that listed numbers of patients who underwent specific concomitant procedures, 715 patients (83.5%) underwent an isolated TTO procedure, and the other 141 (16.5%) underwent either concomitant lateral femoral trochleoplasty, arthroscopic drilling of chondral lesions, patellar shaving chondroplasty, partial meniscectomy or concomitant meniscal repair, intra-articular loose body removal, and/or lateral release with or without medial plication.
Postoperative Data
There was a cumulative total of 79 complications (8% of cohort): 17 recurrent patellar dislocations (1.9%), 4 recurrent patellar subluxations (0.4%), 10 wound complications (1.0%), 2 intraoperative complications (0.2%), 14 tibial tubercle fractures (1.3%), 19 proximal tibia fractures (1.8%), 4 cases of anterior knee pain (0.4%), 4 cases of neuropraxia (0.4%), and 5 infections (0.5%). Of note, 219 knees (21%) required reoperation, but 170 (16.3%) of these were for painful hardware removal. Sixteen knees (1.5%) required revision TTO, 1 (0.1%) required subsequent high tibial osteotomy, 2 (0.2%) underwent patellofemoral arthroplasty for advanced arthritic changes, and 5 (0.5%) underwent total knee arthroplasty for advanced arthritic changes.
Studies With TTO Performed in Isolation
Twelve studies reported outcomes of isolated TTO procedures. In the 638 patients who underwent isolated TTO, the pathologies addressed were instability/laxity (429 patients, 67%), patellofemoral osteoarthritis (74, 12%), patella alta with instability (61, 10%), patellofemoral osteoarthritis with instability (31, 5%), patella baja (24, 4%), and patella alta (19, 3%). Pain was a preoperative issue in 289 (45%) of these patients and instability in 472 (74%).
Only 2.8% of patients experienced postoperative patellar dislocation events. Of the 12 studies, 2 reported VAS scores (34-point weighted mean improvement, 65 points before surgery to 31 after surgery), 3 reported Lysholm scores (30-point improvement, from 60 to 90), and 2 reported Kujala scores (21-point improvement, from 46 to 67).
Complication rates for this isolated-TTO pooled cohort of patients were 1.2% for revision TTOs, 0.5% for wound complications, 0.8% for tibial tubercle fractures, and 1.9% for proximal tibia fractures. In total, 16% of patients required hardware removal after surgery.
Discussion
This study found that TTO improved patient pain and clinical outcome scores despite having a high (16%) rate of reoperation for painful hardware in patients with preoperative pain or instability, or with patellofemoral osteoarthritis or aberrant patellar anatomy. This reoperation rate and the overall complication rate both exceeded our hypothesized 10% cumulative rate. However, <1% of patients required conversion to a definitive end-stage surgery (patellofemoral arthroplasty or total knee arthroplasty) by final follow-up, and the rates of comorbidities (anterior knee pain, wound infection, recurrent patellar subluxation/dislocation, tibial fracture) were relatively low.
Patellofemoral disorders are common in the general population and a frequent primary complaint on presentation to orthopedic offices. Having a thorough understanding of knee joint biomechanics is imperative when trying to determine whether surgery is appropriate for these complaints and how to proceed. Extensor mechanism abnormalities, including high lateral force vectors (or larger TT-TG distances) and excessive patellar tilt, can affect alignment and increase the risk for patellofemoral dislocations, patellofemoral anterior- based knee pains, and chondral lesions. Patella alta, an elevated patella, risks increased contact stresses between the patella and the trochlear groove33 and decreases the osseous constraints that inhibit dislocation of the patella with physiologic flexion of the joint.34 With TTO, the change in tuberosity position can alter angles in the extensor mechanism and thereby decrease joint reaction forces and patellofemoral contact area forces.35,36
Although its use began as an option for combating patellar instability events in patients with predisposed patellofemoral kinematics,5 TTO has evolved in its therapeutic uses to include offloading patellar and trochlear focal chondral lesions and slowing progression of patellofemoral arthritis. Multiple iterations and modifications of the procedure have involved distal and medial transfer of the tibial tuberosity, medialization alone, concurrent anterior and medial elevation of the tuberosity, and proximal or distal transfers, depending on the pathology being corrected. Although TTO is highly versatile in treating multiple patellofemoral joint pathologies, this study found that its primary indication continues to be patellar instability, with anteromedialization as the most common direction of tubercle transfer in support of the medial structures providing the medial force vector that keeps the patella in place. These medial structures include the medial patellofemoral ligament, the vastus medialis obliquus, the medial patellotibial ligament, and the medial retinaculum.
Also notable was the relatively high rate of reoperation after TTO. However, >75% of reoperations were performed to remove painful hardware, and the need for reoperation seemed to have no effect on the statistically significant overall preoperative-to-postoperative improvement in VAS, Lysholm, and Kujala scores. Rates of definitive surgery for end-stage patellofemoral changes, including patellofemoral arthroplasty and total knee arthroplasty, were quite low at the weighted mean follow-up of several years after surgery, suggesting a role for TTO in avoiding arthroplasty. Although the infection rate was <1%, the rate of tibial tubercle or proximal tibia fractures was a cumulative 3.1%. Patients should be counseled on this complication risk, as treatment can require cast immobilization and weight-bearing limitations.24
The 69% proportion of women in the overall cohort and the mean (SD) age of 27.68 (10.45) years highlight the primary patient population that undergoes TTO. Compared with men, young women are more likely to have aberrant patellofemoral biomechanics, owing to their native anatomy, including their relatively larger Q-angle and TT-TG distance and thus increased lateral translational force vectors on the patella.37 In addition, more than half of patients who are having TTO underwent previous surgery on the affected knee—an indication that TTO is still not universally considered first-line in addressing patellofemoral pathology.
Limitations of the Analysis
The limitations of this analysis derive from the limitations of the included studies, which were mostly retrospective case series with relatively short follow-up. The low MCMS (<55) of all 21 studies highlights their low quality as well. These studies showed considerable heterogeneity in their reporting of specific preoperative, intraoperative, and postoperative radiographic, physical examination, and clinical outcome scores, which may be indicative of the relatively low rate of use of TTO, a procedure originally described decades ago. These studies also showed ample heterogeneity in the specific radiographic parameters or outcome scales they used to present their data. We were therefore limited in our ability to cohesively summarize and provide cumulative data points from the patients as a unified cohort. There was substantial variety in the procedures performed, surgical techniques used, concomitant pathologies addressed at time of surgery, and diagnoses treated—indicating a performance bias. This additionally precluded any significant meta-analysis within the patient cohort. A higher quality study, a randomized controlled trial, is needed to answer more definitively and completely the questions we left unanswered, including the effect on radiographic parameters, additional clinical outcomes, and patient satisfaction.
Conclusion
TTO is most commonly performed for isolated patellar instability in the presence of knee pain. Other pathologies addressed are patellofemoral osteoarthritis, and patella alta and patella baja with and without associated knee pain. TTO significantly improves knee pain and clinical outcome scores, though 21% of patients (>1 in 5) require reoperation for hardware removal. Young women with prior surgery on the affected knee are the primary patient population.
1. Blond L, Hansen L. Patellofemoral pain syndrome in athletes: a 5.7- year retrospective follow-up study of 250 athletes. Acta Orthop Belg. 1998;64(4):393-400.
2. Fairbank JC, Pynsent PB, van Poortvliet JA, Phillips H. Mechanical factors in the incidence of knee pain in adolescents and young adults. J Bone Joint Surg Br. 1984;66(5):685-693.
3. Mehta VM, Inoue M, Nomura E, Fithian DC. An algorithm guiding the evaluation and treatment of acute primary patellar dislocations. Sports Med Arthrosc. 2007;15(2):78-81.
4. Erickson BJ, Mascarenhas R, Sayegh ET, et al. Does operative treatment of first-time patellar dislocations lead to increased patellofemoral stability? A systematic review of overlapping meta-analyses. Arthroscopy. 2015;31(6):1207-1215.
5. Hauser E. Total tendon transplant for slipping patella. Surg Gynecol Obstet. 1938;66:199-214.
6. Sherman SL, Erickson BJ, Cvetanovich GL, et al. Tibial tuberosity osteotomy: indications, techniques, and outcomes. Am J Sports Med. 2014;42(8):2006-2017.
7. Hall MJ, Mandalia VI. Tibial tubercle osteotomy for patello-femoral joint disorders. Knee Surg Sports Traumatol Arthrosc. 2016;24(3):855-861.
8. Grawe B, Stein BS. Tibial tubercle osteotomy: indication and techniques. J Knee Surg. 2015;28(4):279-284.
9. Fulkerson JP. Disorders of the Patellofemoral Joint. 4th ed. Baltimore, MD: Williams & Wilkins; 1997.
10. Koh JL, Stewart C. Patellar instability. Clin Sports Med. 2014;33(3):461-476.
11. Coleman BD, Khan KM, Maffulli N, Cook JL, Wark JD. Studies of surgical outcome after patellar tendinopathy: clinical significance of methodological deficiencies and guidelines for future studies. Victorian Institute of Sport Tendon Study Group. Scand J Med Sci Sports. 2000;10(1):2-11.
12. Al-Sayyad MJ, Cameron JC. Functional outcome after tibial tubercle transfer for the painful patella alta. Clin Orthop Rel Res. 2002;(396):152-162.
13. Atkinson HD, Bailey CA, Anand S, Johal P, Oakeshott RD. Tibial tubercle advancement osteotomy with bone allograft for patellofemoral arthritis: a retrospective cohort study of 50 knees. Arch Orthop Trauma Surg. 2012;132(4):437-445.
14. Caton JH, Dejour D. Tibial tubercle osteotomy in patello-femoral instability and in patellar height abnormality. Int Orthop. 2010;34(2):305-309.
15. Dantas P, Nunes C, Moreira J, Amaral LB. Antero-medialisation of the tibial tubercle for patellar instability. Int Orthop. 2005;29(6):390-391.
16. Drexler M, Dwyer T, Marmor M, Sternheim A, Cameron HU, Cameron JC. The treatment of acquired patella baja with proximalize the tibial tuberosity. Knee Surg Sports Traumatol Arthrosc. 2013;21(11):2578-2583.
17. Eager MR, Bader DA, Kelly JD 4th, Moyer RA. Delayed fracture of the tibia following anteromedialization osteotomy of the tibial tubercle: a report of 5 cases. Am J Sports Med. 2004;32(4):1041-1048.
18. Ebinger TP, Boezaart A, Albright JP. Modifications of the Fulkerson osteotomy: a pilot study assessment of a novel technique of dynamic intraoperative determination of the adequacy of tubercle transfer. Iowa Orthop J. 2007;27:61-64.
19. Fulkerson JP, Becker GJ, Meaney JA, Miranda M, Folcik MA. Anteromedial tibial tubercle transfer without bone graft. Am J Sports Med. 1990;18(5):490-498.
20. Heatley FW, Allen PR, Patrick JH. Tibial tubercle advancement for anterior knee pain: a temporary or permanent solution. Clin Orthop Relat Res. 1986;(208):216-225.
21. Hirsh DM, Reddy DK. Experience with Maquet anterior tibial tubercle advancement for patellofemoral arthralgia. Clin Orthop Relat Res. 1980;(148):136-139.
22. Jack CM, Rajaratnam SS, Khan HO, Keast-Butler O, Butler-Manuel PA, Heatley FW. The modified tibial tubercle osteotomy for anterior knee pain due to chondromalacia patellae in adults: a five-year prospective study. Bone Joint Res. 2012;1(8):167-173.
23. Koëter S, Diks MJ, Anderson PG, Wymenga AB. A modified tibial tubercle osteotomy for patellar maltracking: results at two years. J Bone Joint Surg Br. 2007;89(2):180-185.
24. Luhmann SJ, Fuhrhop S, O’Donnell JC, Gordon JE. Tibial fractures after tibial tubercle osteotomies for patellar instability: a comparison of three osteotomy configurations. J Child Orthop. 2011;5(1):19-26.
25. Naranja RJ Jr, Reilly PJ, Kuhlman JR, Haut E, Torg JS. Long-term evaluation of the Elmslie-Trillat-Maquet procedure for patellofemoral dysfunction. Am J Sports Med. 1996;24(6):779-784.
26. Naveed MA, Ackroyd CE, Porteous AJ. Long-term (ten- to 15-year) outcome of arthroscopically assisted Elmslie-Trillat tibial tubercle osteotomy. Bone Joint J. 2013;95(4):478-485.
27. Paulos L, Swanson SC, Stoddard GJ, Barber-Westin S. Surgical correction of limb malalignment for instability of the patella: a comparison of 2 techniques. Am J Sports Med. 2009;37(7):1288-1300.
28. Pidoriano AJ, Weinstein RN, Buuck DA, Fulkerson JP. Correlation of patellar articular lesions with results from anteromedial tibial tubercle transfer. Am J Sports Med. 1997;25(4):533-537.
29. Shen HC, Chao KH, Huang GS, Pan RY, Lee CH. Combined proximal and distal realignment procedures to treat the habitual dislocation of the patella in adults. Am J Sports Med. 2007;35(12):2101-2108.
30. Stetson WB, Friedman MJ, Fulkerson JP, Cheng M, Buuck D. Fracture of the proximal tibia with immediate weightbearing after a Fulkerson osteotomy. Am J Sports Med. 1997;25(4):570-574.
31. Valenzuela L, Nemtala F, Orrego M, et al. Treatment of patellofemoral chondropathy with the Bandi tibial tubercle osteotomy: more than 10 years follow-up. Knee. 2011;18(2):94-97.
32. Wang CJ, Wong T, Ko JY, Siu KK. Triple positioning of tibial tubercle osteotomy for patellofemoral disorders. Knee. 2014;21(1):133-137.
33. Luyckx T, Didden K, Vandenneucker H, Labey L, Innocenti B, Bellemans J. Is there a biomechanical explanation for anterior knee pain in patients with patella alta? Influence of patellar height on patellofemoral contact force, contact area and contact pressure. J Bone Joint Surg Br. 2009;91(3):344-350.
34. Mayer C, Magnussen RA, Servien E, et al. Patellar tendon tenodesis in association with tibial tubercle distalization for the treatment of episodic patellar dislocation with patella alta. Am J Sports Med. 2012;40(2):346-351.
35. Maquet P. Advancement of the tibial tuberosity. Clin Orthop Relat Res. 1976;(115):225-230.
36. Lewallen DG, Riegger CL, Myers ER, Hayes WC. Effects of retinacular release and tibial tubercle elevation in patellofemoral degenerative joint disease. J Orthop Res. 1990;8(6):856-862.
37. Aglietti P, Insall JN, Cerulli G. Patellar pain and incongruence, I: measurements of incongruence. Clin Orthop Relat Res. 1983;(176):217-224.