User login
Driving-Related Coping Thoughts in Post-9/11 Combat Veterans With and Without Comorbid PTSD and TBI
Combat veterans who have served in Iraq and Afghanistan in the post-9/11 era face unique reintegration challenges, one being the transition from driving in combat zones to driving at home.1 Relative to previous conflicts, post-9/11 combat involves increased participation in road patrols and convoys along with more prevalent threats of improvised explosive devices (IEDs).1,2 Roadside ambushes designed to destroy or stop vehicles became a common warfare strategy, meaning that driving became an inherently dangerous combat maneuver.3
The modern combat driving framework includes cognitive tools (eg, targeted aggression and tactical awareness) combined with specific behaviors (eg, driving unpredictably fast, using rapid lane changes, and keeping other vehicles at a distance to avoid IEDs).4 This framework is adaptive and lifesaving in combat zones, but it can be maladaptive and dangerous in civilian environments. Service members face difficulty in updating this cognitive framework after leaving combat zones and may continue to experience specific cognitions (eg, “the world is dangerous”; “that car holds an IED”) while driving on civilian roads.3,5-8
The high prevalence of posttraumatic stress disorder (PTSD) and traumatic brain injury (TBI) in post-9/11 veterans may complicate reintegration. Both PTSD and TBI are considered signature wounds of these conflicts.8-11 Traumatic brain injury may be sustained as a result of blast injury or other mechanism, including a closed head injury or penetrating brain injury.10 Previous literature indicated that both PTSD and TBI across all severities are related to deficits in executive functioning, attention, and memory.12-16
In addition to cognitive deficits, veterans with PTSD also may experience cognitive misappraisal, in which they are more likely to perceive ambiguous stimuli as threatening because of an inability to suppress trauma-related schema and associations.5,17,18 Examples of roadside-specific trauma triggers include busy highways, traffic, loud or distracting noises, and vehicles of similar make and model as those commonly rigged with IEDs in Iraq or Afghanistan.2,7
Blast injury
Prior research suggests that veterans with PTSD and/or TBI experience significantly higher levels of anxiety in response to common roadside stimuli (ie, an overpass or stop sign) while driving than do veterans without either PTSD or TBI.3 Cognitive behavioral therapy (CBT) interventions have been developed and systematically evaluated for treating anxiety.21 The goal of CBT is to identify and change dysfunctional cognitions that result in biased information processing. Cognitive restructuring, the process by which problematic cognitions (negative automatic thoughts) are identified and examined for distortions, is one method of accomplishing this goal. Distortions then are disputed and rebutted with assistance from the clinician.22 A strategy for restructuring negative automatic thoughts is coping self-instruction, which centers on identifying when negative automatic thoughts are focused on others’ behavior, accepting that their behavior cannot be changed, and using positive coping behaviors to minimize negative automatic thoughts.23
The link between history of comorbid PTSD and TBI and combat driving, current driving anxiety, and coping strategies has not yet been extensively studied in veterans. Thus, the aim of the current study is to determine whether veterans with comorbid PTSD and TBI utilize coping self-instruction behind the wheel. Driving-specific coping self-instruction involves generating thoughts that are adaptive and accepting of others’ driving behaviors (eg, “Just turn up the radio and tune them out”). It was hypothesized that veterans with comorbid PTSD and TBI would endorse fewer coping self-instruction thoughts than would veterans without either PTSD or TBI.
Methods
The current project is part of a larger study that examines driving behaviors of post-9/11 combat veterans at the Michael J. Crescenz Veterans Affairs Medical Center in Philadelphia, Pennsylvania. Thirty-two male veterans aged between 22 and 48 years (M = 31.6, SD = 6.9) were included in the sample. Twenty-three were diagnosed with comorbid PTSD and TBI and 9 veterans with no major psychiatric or physical 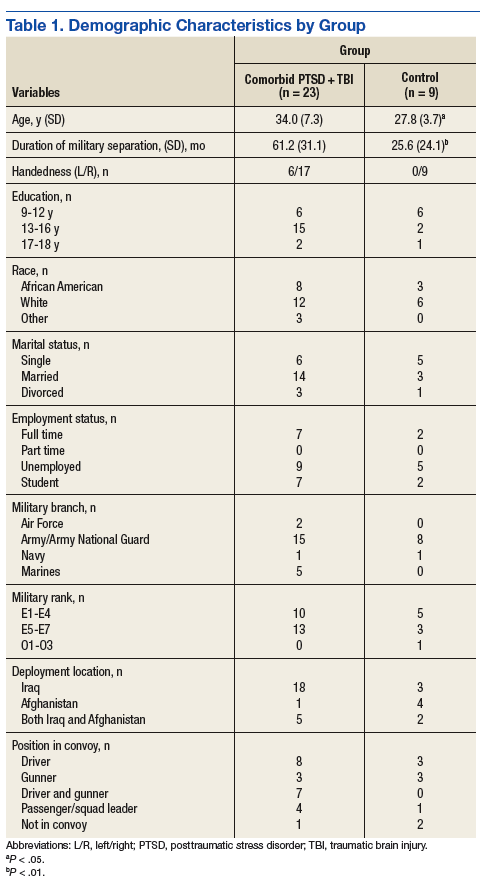
Assessment
All participants completed a battery of questionnaires, including the Driver’s Angry Thoughts Questionnaire (DATQ).23 The DATQ was used to investigate the specific thoughts that veterans experienced while driving.23 Participants indicated on a Likert scale from 1 (not at all) to 5 (all the time) how often they experienced any of 65 thoughts while driving. Each item was categorized into 1 of 5 distinct subscales (Table 2). A frequency score was generated for each of the 5 subscales. Each subscale had good internal consistency and convergent, divergent, and predictive validity. The Coping Self-Instruction subscale, which is defined as engaging in relaxing thoughts to accept others’ driving behaviors, was of primary interest. It is a 9-item scale (frequency score can range from 9 to 45) with good reliability (α = .83).23 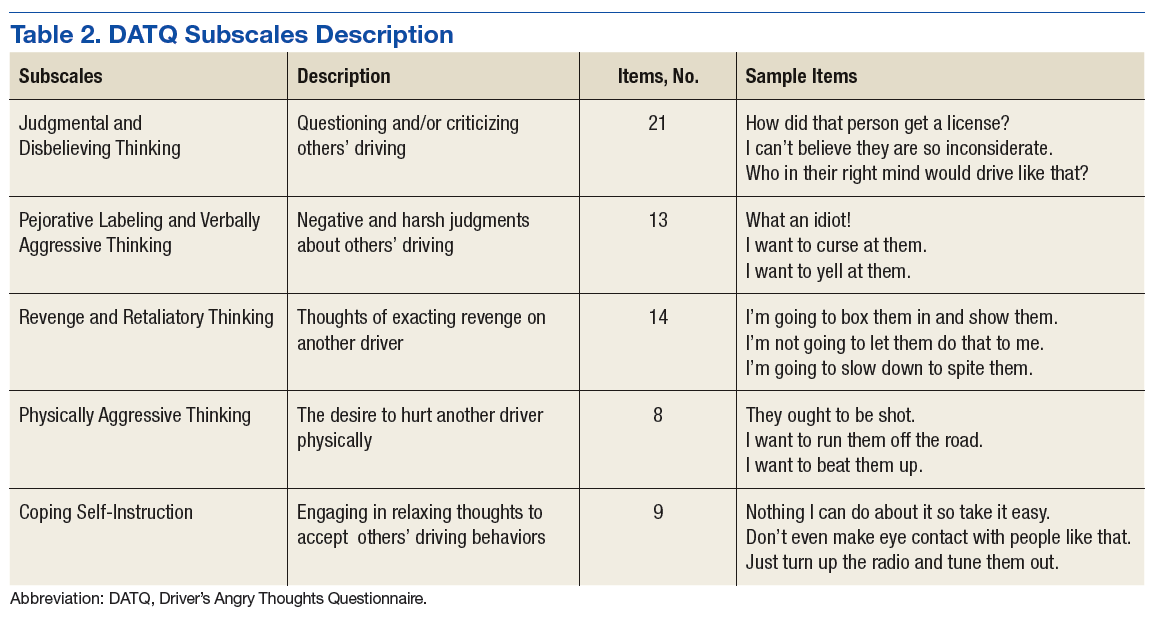
Given the small and unequal sample sizes, nonparametric independent samples Mann-Whitney U-tests were selected to compare frequency of driving-related thoughts across veterans with comorbid PTSD and TBI and those of veterans without either PTSD or TBI.
Results
Descriptive statistics and results for each DATQ subscale are reported in Table 3. Group comparisons revealed that veterans with comorbid PTSD and TBI endorsed statistically significantly fewer coping self-instruction thoughts while driving (M = 11.5, SD = 7.2) than did combat veterans without either PTSD or TBI (M = 18.1, SD = 6.9; U = 56.0, P = .05). Conversely, frequency of angry thoughts were statistically significant in their difference as a function of PTSD or TBI diagnostic status. 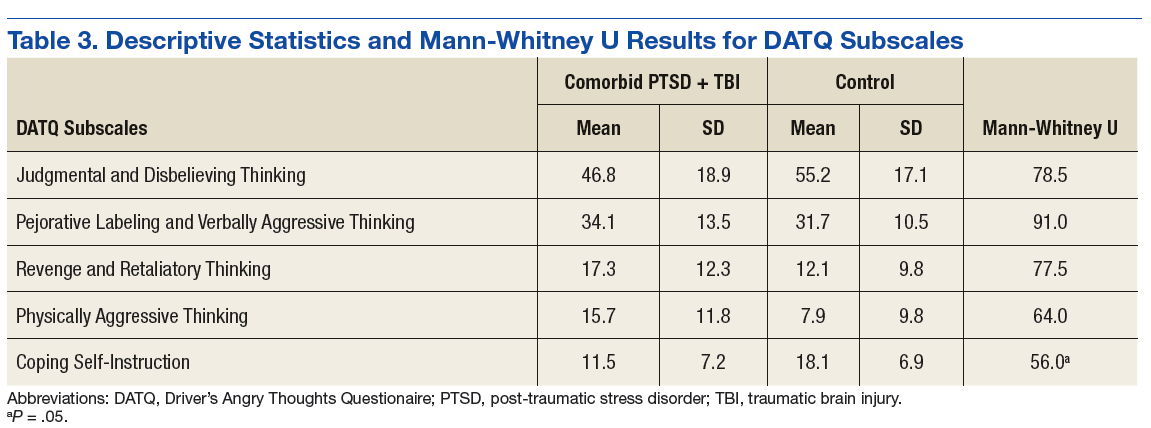
Discussion
While driving, veterans with PTSD or TBI endorsed statistically significantly fewer coping self-instruction thoughts than did veterans without either PTSD or TBI. Prior research suggests that veterans with PTSD or TBI experience greater anxiety than do veterans without either condition while driving.2,3 Taken together, this suggests that veterans with PTSD or TBI may lack efficient cognitive coping strategies related to the anxiety they experience while driving. Furthermore, the groups did not significantly differ in frequency of angry thoughts behind the wheel. This result was expected based on prior analyses that suggested that veterans with and without PTSD or TBI endorsed feelings of aggression, impatience, and frustration while driving at similar frequencies.3
Because all veterans in the current sample were exposed to combat, these results help to parse out the unique contribution of PTSD and TBI diagnoses on driving in civilian environments. Exposure to combat plus diagnoses of PTSD or TBI may be related to veterans’ ability to cope with typical driving situations at home. In the context of prior literature, results suggest that veterans with PTSD or TBI automatically may perceive neutral roadside stimuli as threatening, feel anxious in response to this perceived threat, and be ill-equipped to cope with this anxiety.3,5,17,18 According to CBT models, negative automatic thoughts play a critical role in maintaining anxiety.24 Particular cognitive distortions associated with PTSD symptomatology and combat driving experiences, such as misperceiving ambiguous stimuli as threatening because of an inability to suppress trauma-related schema and associations, may therefore maintain driving anxiety following military separation.
Research on CBT interventions suggests that cognitive restructuring, including coping self-instruction, are effective treatments to reduce anxiety.22,24 The current findings suggest that combat veterans with PTSD and TBI who experience driving anxiety endorse significantly fewer coping self-instruction thoughts than do controls in response to anxiety-provoking driving situations. In fact, prior research suggests that a majority of veterans experiencing driving-related anxiety do not seek help for their symptoms, and many of those who do prefer to reach out to friends rather than mental health professionals.2 However, due to their high levels of anxiety, these veterans likely would benefit from CBT interventions specifically targeted to coping strategies for civilian driving. These coping strategies should focus on recognizing that common roadside stimuli are not necessarily threatening in civilian environments. This type of cognitive restructuring may help veterans better manage anxiety while driving.
Limitations
The current study is limited by its small and unequal sample sizes and lack of a noncombat exposure comparison group. Additionally, while this study highlights a potential relationship between reduced cognitive coping strategies and behind-the-wheel anxiety in veterans with PTSD or TBI, causal inferences cannot be made. It is possible that individuals without coping strategies who are deployed to combat are more likely to develop PTSD or TBI. Being equipped with few coping strategies may then lead these veterans to experience greater anxiety while driving. Conversely, PTSD and TBI symptoms may prevent veterans from developing coping strategies over time.
Furthermore, the comorbid PTSD and TBI group was separated from the military for significantly longer than was the control group. Future studies using a longitudinal design could better examine the potential causal relationship between comorbid PTSD and TBI and coping and determine whether endorsement of coping self-instruction changes as a function of time since military separation.
Veterans in the current study report a variety of deployment experiences and locations. Methods of combat, type of vehicle, driving terrain, and prevalence of IEDs changed over the multiple post-9/11 military campaigns. Veterans who were deployed to Iraq in the mid-2000s were instructed to drive quickly and erratically to avoid IEDs and mortars, whereas veterans deployed in later years were taught to drive slowly and carefully to hunt for IEDs in heavily armored vehicles.3 Seventy-five percent of the veterans with PTSD or TBI in the current sample were deployed to Iraq in the early to mid-2000s, compared with 33% of the veterans without PTSD or TBI. Thus, the 2 groups in the current sample may have experienced different combat environments, which could impact how they perceived roadside stimuli. Future studies should recruit a larger and more balanced sample to better determine whether specific combat experiences impact coping strategies while driving.
Conclusion
To the best of the authors’ knowledge, the current study is the first to examine specific types of thoughts that veterans with and without PTSD or TBI experience while driving on civilian roads. Veterans with PTSD or TBI are not engaging in as many coping self-instruction thoughts behind the wheel, despite experiencing greater anxiety than that of veterans without either PTSD or TBI. Cognitive behavioral therapy interventions for anxiety include engaging in coping self-instruction during anxiety-provoking situations.22 Therefore, veterans with PTSD or TBI may benefit from learning targeted coping self-instruction thoughts that they can utilize when anxiety-provoking situations arise behind the wheel. Results suggest that clinicians should work with veterans with comorbid PTSD and TBI to develop specific coping self-instruction statements that they can utilize internally when faced with anxiety-provoking driving situations.
Acknowledgments
This study is the result of work supported by the Council on Brain Injury (grant #260472). The authors thank Dr. Rosette Biester for her guidance.
1. Belmont PJ, Schoenfeld AJ, Goodman G. Epidemiology of combat wounds in Operation Iraqi Freedom and Operation Enduring Freedom: orthopaedic burden of disease. J Surg Orthop Adv. 2010;19(1):2-7.
2. Zinzow HM, Brooks J, Stern EB. Driving-related anxiety in recently deployed service members: cues, mental health correlates, and help-seeking behavior. Mil Med. 2013;178(3):e357-e361.
3. Whipple EK, Schultheis MT, Robinson KM. Preliminary findings of a novel measure of driving behaviors in veterans with comorbid TBI and PTSD. J Rehabil Res Dev. 2016;53(6):827-838.
4. Adler AB, Bliese PD, McGurk D, Hoge CW, Castro CA. Battlemind debriefing and battlemind training as early interventions with soldiers returning from Iraq: randomization by platoon. J Consult Clin Psychol. 2009;77(5):928-940.
5. Amick MM, Kraft M, McGlinchey R. Driving simulator performance of veterans from the Iraq and Afghanistan wars. J Rehabil Res Dev. 2013;50(4):463-470.
6. Classen S, Cormack NL, Winter SM, et al. Efficacy of an occupational therapy driving intervention for returning combat veterans. OTJR (Thorofare NJ). 2014;34(4):177-182.
7. Hannold EM, Classen S, Winter S, Lanford DN, Levy CE. Exploratory pilot study of driving perceptions among OIF/OEF veterans with mTBI and PTSD. J Rehabil Res Dev. 2013;50(10):1315-1330.
8. Lew HL, Kraft M, Pogoda TK, Amick MM, Woods P, Cifu DX. Prevalence and characteristics of driving difficulties in Operation Iraqi Freedom/Operation Enduring Freedom combat returnees. J Rehabil Res Dev. 2011;48(8):913-925.
9. Arthur DC, MacDermid S, Kiley KC; Defense Health Board Task Force on Mental Health. An Achievable Vision: Report of the Department of Defense Task Force on Mental Health. Falls Church, VA: Defense Health Board; 2007.
10. Tanielian T, Jaycox LH, eds. Invisible Wounds of War: Psychological and Cognitive Injuries, Their Consequences, and Services to Assist Recovery. Santa Monica, CA: RAND Corporation; 2008.
11. Independent Review Group. Rebuilding the Trust: Independent Review Group Report on Rehabilitation Care and Administrative Processes at Walter Reed Army Medical Center and National Naval Medical Center. Arlington, VA: Independent Review Group; 2007
12. Bailie JM, Cole WR, Ivins B, et al. The experience, expression, and control of anger following traumatic brain injury in a military sample. J Head Trauma Rehabil. 2015;30(1):12-20.
13. Campbell TA, Nelson LA, Lumpkin R, Yoash-Gantz RE, Pickett TC, McCormick CL. Neuropsychological measures of processing speed and executive functioning in combat veterans with PTSD, TBI, and comorbid TBI/PTSD. Psychiatr Ann. 2009;39(8):796-803.
14. Classen S, Levy C, Meyer DL, Bewernitz M, Lanford DN, Mann WC. Simulated driving performance of combat veterans with mild tramatic brain injury and posttraumatic stress disorder: a pilot study. Am J Occup Ther. 2011;65(4):419-427.
15. Lew HL, Amick MM, Kraft M, Stein MB, Cifu DX. Potential driving issues in combat returnees. NeuroRehabilitation. 2010;26(3):271-278.
16. Vasterling JL, Brailey K, Allain AN, Duke LM, Constans JI, Sutker PB. Attention, learning, and memory performances and intellectual resources in Vietnam veterans: PTSD and no disorder comparisons. Neuropsychology. 2002;16(1):5-14.
17. Kimble MO, Kaufman ML, Leonard LL, et al. Sentence completion test in veterans with and without PTSD: preliminary findings. Psychiatry Res. 2002;113(3):303-307.
18. Kuhn E, Drescher K, Ruzek J, Rosen C. Aggressive and unsafe driving in male veterans receiving residential treatment for PTSD. J Trauma Stress. 2010;23(3):399-402.
19. Stein MB, McAllister TW. Exploring the convergence of posttraumatic stress disorder and mild traumatic brain injury. Am J Psychiatry. 2009;166(7):768-776.
20. Hill JJ III, Mobo BH Jr, Cullen MR. Separating deployment-related traumatic brain injury and posttraumatic stress disorder in veterans: preliminary findings from the Veterans Affairs traumatic brain injury screening program. Am J Phys Med Rehabil. 2009;88(8):605-614.
21. Hofmann SG, Smits JA. Cognitive-behavioral therapy for adult anxiety disorders: a meta-analysis of randomized placebo-controlled trials. J Clin Psychiatry. 2008;69(4):621-632.
22. Hope DA, Burns JA, Hayes SA, Herbert JD, Warner MD. Automatic thoughts and cognitive restructuring in cognitive behavioral group therapy for social anxiety disorder. Cognit Ther Res. 2010;34(1):1-12.
23. Deffenbacher JL, Petrilli RT, Lynch RS, Oetting ER, Swaim RC. The driver’s angry thoughts questionnaire: a measure of angry cognitions when driving. Cognit Ther Res. 2003;27(4):383-402.
24. Beck AT, Emery G, Greenberg RL. Anxiety Disorders and Phobias: A Cognitive Perspective. Rev. paperback ed. New York, NY: Basic Books; 2005.
Combat veterans who have served in Iraq and Afghanistan in the post-9/11 era face unique reintegration challenges, one being the transition from driving in combat zones to driving at home.1 Relative to previous conflicts, post-9/11 combat involves increased participation in road patrols and convoys along with more prevalent threats of improvised explosive devices (IEDs).1,2 Roadside ambushes designed to destroy or stop vehicles became a common warfare strategy, meaning that driving became an inherently dangerous combat maneuver.3
The modern combat driving framework includes cognitive tools (eg, targeted aggression and tactical awareness) combined with specific behaviors (eg, driving unpredictably fast, using rapid lane changes, and keeping other vehicles at a distance to avoid IEDs).4 This framework is adaptive and lifesaving in combat zones, but it can be maladaptive and dangerous in civilian environments. Service members face difficulty in updating this cognitive framework after leaving combat zones and may continue to experience specific cognitions (eg, “the world is dangerous”; “that car holds an IED”) while driving on civilian roads.3,5-8
The high prevalence of posttraumatic stress disorder (PTSD) and traumatic brain injury (TBI) in post-9/11 veterans may complicate reintegration. Both PTSD and TBI are considered signature wounds of these conflicts.8-11 Traumatic brain injury may be sustained as a result of blast injury or other mechanism, including a closed head injury or penetrating brain injury.10 Previous literature indicated that both PTSD and TBI across all severities are related to deficits in executive functioning, attention, and memory.12-16
In addition to cognitive deficits, veterans with PTSD also may experience cognitive misappraisal, in which they are more likely to perceive ambiguous stimuli as threatening because of an inability to suppress trauma-related schema and associations.5,17,18 Examples of roadside-specific trauma triggers include busy highways, traffic, loud or distracting noises, and vehicles of similar make and model as those commonly rigged with IEDs in Iraq or Afghanistan.2,7
Blast injury
Prior research suggests that veterans with PTSD and/or TBI experience significantly higher levels of anxiety in response to common roadside stimuli (ie, an overpass or stop sign) while driving than do veterans without either PTSD or TBI.3 Cognitive behavioral therapy (CBT) interventions have been developed and systematically evaluated for treating anxiety.21 The goal of CBT is to identify and change dysfunctional cognitions that result in biased information processing. Cognitive restructuring, the process by which problematic cognitions (negative automatic thoughts) are identified and examined for distortions, is one method of accomplishing this goal. Distortions then are disputed and rebutted with assistance from the clinician.22 A strategy for restructuring negative automatic thoughts is coping self-instruction, which centers on identifying when negative automatic thoughts are focused on others’ behavior, accepting that their behavior cannot be changed, and using positive coping behaviors to minimize negative automatic thoughts.23
The link between history of comorbid PTSD and TBI and combat driving, current driving anxiety, and coping strategies has not yet been extensively studied in veterans. Thus, the aim of the current study is to determine whether veterans with comorbid PTSD and TBI utilize coping self-instruction behind the wheel. Driving-specific coping self-instruction involves generating thoughts that are adaptive and accepting of others’ driving behaviors (eg, “Just turn up the radio and tune them out”). It was hypothesized that veterans with comorbid PTSD and TBI would endorse fewer coping self-instruction thoughts than would veterans without either PTSD or TBI.
Methods
The current project is part of a larger study that examines driving behaviors of post-9/11 combat veterans at the Michael J. Crescenz Veterans Affairs Medical Center in Philadelphia, Pennsylvania. Thirty-two male veterans aged between 22 and 48 years (M = 31.6, SD = 6.9) were included in the sample. Twenty-three were diagnosed with comorbid PTSD and TBI and 9 veterans with no major psychiatric or physical
Assessment
All participants completed a battery of questionnaires, including the Driver’s Angry Thoughts Questionnaire (DATQ).23 The DATQ was used to investigate the specific thoughts that veterans experienced while driving.23 Participants indicated on a Likert scale from 1 (not at all) to 5 (all the time) how often they experienced any of 65 thoughts while driving. Each item was categorized into 1 of 5 distinct subscales (Table 2). A frequency score was generated for each of the 5 subscales. Each subscale had good internal consistency and convergent, divergent, and predictive validity. The Coping Self-Instruction subscale, which is defined as engaging in relaxing thoughts to accept others’ driving behaviors, was of primary interest. It is a 9-item scale (frequency score can range from 9 to 45) with good reliability (α = .83).23
Given the small and unequal sample sizes, nonparametric independent samples Mann-Whitney U-tests were selected to compare frequency of driving-related thoughts across veterans with comorbid PTSD and TBI and those of veterans without either PTSD or TBI.
Results
Descriptive statistics and results for each DATQ subscale are reported in Table 3. Group comparisons revealed that veterans with comorbid PTSD and TBI endorsed statistically significantly fewer coping self-instruction thoughts while driving (M = 11.5, SD = 7.2) than did combat veterans without either PTSD or TBI (M = 18.1, SD = 6.9; U = 56.0, P = .05). Conversely, frequency of angry thoughts were statistically significant in their difference as a function of PTSD or TBI diagnostic status.
Discussion
While driving, veterans with PTSD or TBI endorsed statistically significantly fewer coping self-instruction thoughts than did veterans without either PTSD or TBI. Prior research suggests that veterans with PTSD or TBI experience greater anxiety than do veterans without either condition while driving.2,3 Taken together, this suggests that veterans with PTSD or TBI may lack efficient cognitive coping strategies related to the anxiety they experience while driving. Furthermore, the groups did not significantly differ in frequency of angry thoughts behind the wheel. This result was expected based on prior analyses that suggested that veterans with and without PTSD or TBI endorsed feelings of aggression, impatience, and frustration while driving at similar frequencies.3
Because all veterans in the current sample were exposed to combat, these results help to parse out the unique contribution of PTSD and TBI diagnoses on driving in civilian environments. Exposure to combat plus diagnoses of PTSD or TBI may be related to veterans’ ability to cope with typical driving situations at home. In the context of prior literature, results suggest that veterans with PTSD or TBI automatically may perceive neutral roadside stimuli as threatening, feel anxious in response to this perceived threat, and be ill-equipped to cope with this anxiety.3,5,17,18 According to CBT models, negative automatic thoughts play a critical role in maintaining anxiety.24 Particular cognitive distortions associated with PTSD symptomatology and combat driving experiences, such as misperceiving ambiguous stimuli as threatening because of an inability to suppress trauma-related schema and associations, may therefore maintain driving anxiety following military separation.
Research on CBT interventions suggests that cognitive restructuring, including coping self-instruction, are effective treatments to reduce anxiety.22,24 The current findings suggest that combat veterans with PTSD and TBI who experience driving anxiety endorse significantly fewer coping self-instruction thoughts than do controls in response to anxiety-provoking driving situations. In fact, prior research suggests that a majority of veterans experiencing driving-related anxiety do not seek help for their symptoms, and many of those who do prefer to reach out to friends rather than mental health professionals.2 However, due to their high levels of anxiety, these veterans likely would benefit from CBT interventions specifically targeted to coping strategies for civilian driving. These coping strategies should focus on recognizing that common roadside stimuli are not necessarily threatening in civilian environments. This type of cognitive restructuring may help veterans better manage anxiety while driving.
Limitations
The current study is limited by its small and unequal sample sizes and lack of a noncombat exposure comparison group. Additionally, while this study highlights a potential relationship between reduced cognitive coping strategies and behind-the-wheel anxiety in veterans with PTSD or TBI, causal inferences cannot be made. It is possible that individuals without coping strategies who are deployed to combat are more likely to develop PTSD or TBI. Being equipped with few coping strategies may then lead these veterans to experience greater anxiety while driving. Conversely, PTSD and TBI symptoms may prevent veterans from developing coping strategies over time.
Furthermore, the comorbid PTSD and TBI group was separated from the military for significantly longer than was the control group. Future studies using a longitudinal design could better examine the potential causal relationship between comorbid PTSD and TBI and coping and determine whether endorsement of coping self-instruction changes as a function of time since military separation.
Veterans in the current study report a variety of deployment experiences and locations. Methods of combat, type of vehicle, driving terrain, and prevalence of IEDs changed over the multiple post-9/11 military campaigns. Veterans who were deployed to Iraq in the mid-2000s were instructed to drive quickly and erratically to avoid IEDs and mortars, whereas veterans deployed in later years were taught to drive slowly and carefully to hunt for IEDs in heavily armored vehicles.3 Seventy-five percent of the veterans with PTSD or TBI in the current sample were deployed to Iraq in the early to mid-2000s, compared with 33% of the veterans without PTSD or TBI. Thus, the 2 groups in the current sample may have experienced different combat environments, which could impact how they perceived roadside stimuli. Future studies should recruit a larger and more balanced sample to better determine whether specific combat experiences impact coping strategies while driving.
Conclusion
To the best of the authors’ knowledge, the current study is the first to examine specific types of thoughts that veterans with and without PTSD or TBI experience while driving on civilian roads. Veterans with PTSD or TBI are not engaging in as many coping self-instruction thoughts behind the wheel, despite experiencing greater anxiety than that of veterans without either PTSD or TBI. Cognitive behavioral therapy interventions for anxiety include engaging in coping self-instruction during anxiety-provoking situations.22 Therefore, veterans with PTSD or TBI may benefit from learning targeted coping self-instruction thoughts that they can utilize when anxiety-provoking situations arise behind the wheel. Results suggest that clinicians should work with veterans with comorbid PTSD and TBI to develop specific coping self-instruction statements that they can utilize internally when faced with anxiety-provoking driving situations.
Acknowledgments
This study is the result of work supported by the Council on Brain Injury (grant #260472). The authors thank Dr. Rosette Biester for her guidance.
1. Belmont PJ, Schoenfeld AJ, Goodman G. Epidemiology of combat wounds in Operation Iraqi Freedom and Operation Enduring Freedom: orthopaedic burden of disease. J Surg Orthop Adv. 2010;19(1):2-7.
2. Zinzow HM, Brooks J, Stern EB. Driving-related anxiety in recently deployed service members: cues, mental health correlates, and help-seeking behavior. Mil Med. 2013;178(3):e357-e361.
3. Whipple EK, Schultheis MT, Robinson KM. Preliminary findings of a novel measure of driving behaviors in veterans with comorbid TBI and PTSD. J Rehabil Res Dev. 2016;53(6):827-838.
4. Adler AB, Bliese PD, McGurk D, Hoge CW, Castro CA. Battlemind debriefing and battlemind training as early interventions with soldiers returning from Iraq: randomization by platoon. J Consult Clin Psychol. 2009;77(5):928-940.
5. Amick MM, Kraft M, McGlinchey R. Driving simulator performance of veterans from the Iraq and Afghanistan wars. J Rehabil Res Dev. 2013;50(4):463-470.
6. Classen S, Cormack NL, Winter SM, et al. Efficacy of an occupational therapy driving intervention for returning combat veterans. OTJR (Thorofare NJ). 2014;34(4):177-182.
7. Hannold EM, Classen S, Winter S, Lanford DN, Levy CE. Exploratory pilot study of driving perceptions among OIF/OEF veterans with mTBI and PTSD. J Rehabil Res Dev. 2013;50(10):1315-1330.
8. Lew HL, Kraft M, Pogoda TK, Amick MM, Woods P, Cifu DX. Prevalence and characteristics of driving difficulties in Operation Iraqi Freedom/Operation Enduring Freedom combat returnees. J Rehabil Res Dev. 2011;48(8):913-925.
9. Arthur DC, MacDermid S, Kiley KC; Defense Health Board Task Force on Mental Health. An Achievable Vision: Report of the Department of Defense Task Force on Mental Health. Falls Church, VA: Defense Health Board; 2007.
10. Tanielian T, Jaycox LH, eds. Invisible Wounds of War: Psychological and Cognitive Injuries, Their Consequences, and Services to Assist Recovery. Santa Monica, CA: RAND Corporation; 2008.
11. Independent Review Group. Rebuilding the Trust: Independent Review Group Report on Rehabilitation Care and Administrative Processes at Walter Reed Army Medical Center and National Naval Medical Center. Arlington, VA: Independent Review Group; 2007
12. Bailie JM, Cole WR, Ivins B, et al. The experience, expression, and control of anger following traumatic brain injury in a military sample. J Head Trauma Rehabil. 2015;30(1):12-20.
13. Campbell TA, Nelson LA, Lumpkin R, Yoash-Gantz RE, Pickett TC, McCormick CL. Neuropsychological measures of processing speed and executive functioning in combat veterans with PTSD, TBI, and comorbid TBI/PTSD. Psychiatr Ann. 2009;39(8):796-803.
14. Classen S, Levy C, Meyer DL, Bewernitz M, Lanford DN, Mann WC. Simulated driving performance of combat veterans with mild tramatic brain injury and posttraumatic stress disorder: a pilot study. Am J Occup Ther. 2011;65(4):419-427.
15. Lew HL, Amick MM, Kraft M, Stein MB, Cifu DX. Potential driving issues in combat returnees. NeuroRehabilitation. 2010;26(3):271-278.
16. Vasterling JL, Brailey K, Allain AN, Duke LM, Constans JI, Sutker PB. Attention, learning, and memory performances and intellectual resources in Vietnam veterans: PTSD and no disorder comparisons. Neuropsychology. 2002;16(1):5-14.
17. Kimble MO, Kaufman ML, Leonard LL, et al. Sentence completion test in veterans with and without PTSD: preliminary findings. Psychiatry Res. 2002;113(3):303-307.
18. Kuhn E, Drescher K, Ruzek J, Rosen C. Aggressive and unsafe driving in male veterans receiving residential treatment for PTSD. J Trauma Stress. 2010;23(3):399-402.
19. Stein MB, McAllister TW. Exploring the convergence of posttraumatic stress disorder and mild traumatic brain injury. Am J Psychiatry. 2009;166(7):768-776.
20. Hill JJ III, Mobo BH Jr, Cullen MR. Separating deployment-related traumatic brain injury and posttraumatic stress disorder in veterans: preliminary findings from the Veterans Affairs traumatic brain injury screening program. Am J Phys Med Rehabil. 2009;88(8):605-614.
21. Hofmann SG, Smits JA. Cognitive-behavioral therapy for adult anxiety disorders: a meta-analysis of randomized placebo-controlled trials. J Clin Psychiatry. 2008;69(4):621-632.
22. Hope DA, Burns JA, Hayes SA, Herbert JD, Warner MD. Automatic thoughts and cognitive restructuring in cognitive behavioral group therapy for social anxiety disorder. Cognit Ther Res. 2010;34(1):1-12.
23. Deffenbacher JL, Petrilli RT, Lynch RS, Oetting ER, Swaim RC. The driver’s angry thoughts questionnaire: a measure of angry cognitions when driving. Cognit Ther Res. 2003;27(4):383-402.
24. Beck AT, Emery G, Greenberg RL. Anxiety Disorders and Phobias: A Cognitive Perspective. Rev. paperback ed. New York, NY: Basic Books; 2005.

Student Loan Burden and Its Impact on Career Decisions in Dermatology
Dermatology departments in the United States have been facing challenges in recruiting and retaining dermatologists for academic positions. Accordingly, a survey study reported that academic dermatologists were more likely than those in private practice to state that their institutions were recruiting new associates.1 Several factors could explain this phenomenon. Salary differences between jobs in academic and nonacademic settings may contribute to difficulty in recruiting dermatologists into academia, which is exacerbated by a theoretical shortage of dermatologists, leading to graduates who receive and accept private practice job offers.1,2 Furthermore, a large survey study reported that challenges unique to academic dermatologists include longer patient wait times in addition to responsibilities such as research, hospital consultations, medical writing, and teaching. These patterns raise concerns for the future of teaching institutions because academic dermatologists not only train future physicians but also conduct clinical and basic science research necessary to advance the field and improve patient care.2 Thus, it is important to evaluate the factors that affect career decisions in dermatology and to determine if these factors can be addressed. We hypothesized that student loan burden influences career plans in dermatology and that physicians are not fully educated on loan repayment options. The aims of this preliminary study were to explore the influence of student loan burden on career plans in dermatology and to determine if the Public Service Loan Forgiveness (PSLF) program could potentially encourage more dermatologists to consider academic careers.
Methods
The study aimed to investigate the factors that influence career decisions in dermatology and to assess attitudes toward the PSLF program as an option for student loan repayment. The target population included dermatology residents and attending physicians in the United States. Survey questions were adapted from a previously published study3 and were modified based on feedback from reviewers in the University of California (UC) Irvine department of dermatology. The survey was voluntary and did not collect identifying information. This study was granted exemption from oversight by the UC Irvine institutional review board.
Recruitment materials informed potential participants of the nature of the study and provided a hyperlink to the electronic survey. The UC Irvine department of dermatology emailed US dermatology residency program coordinators, requesting that they forward this study to residents and attending physicians in their programs.
Results
Demographics
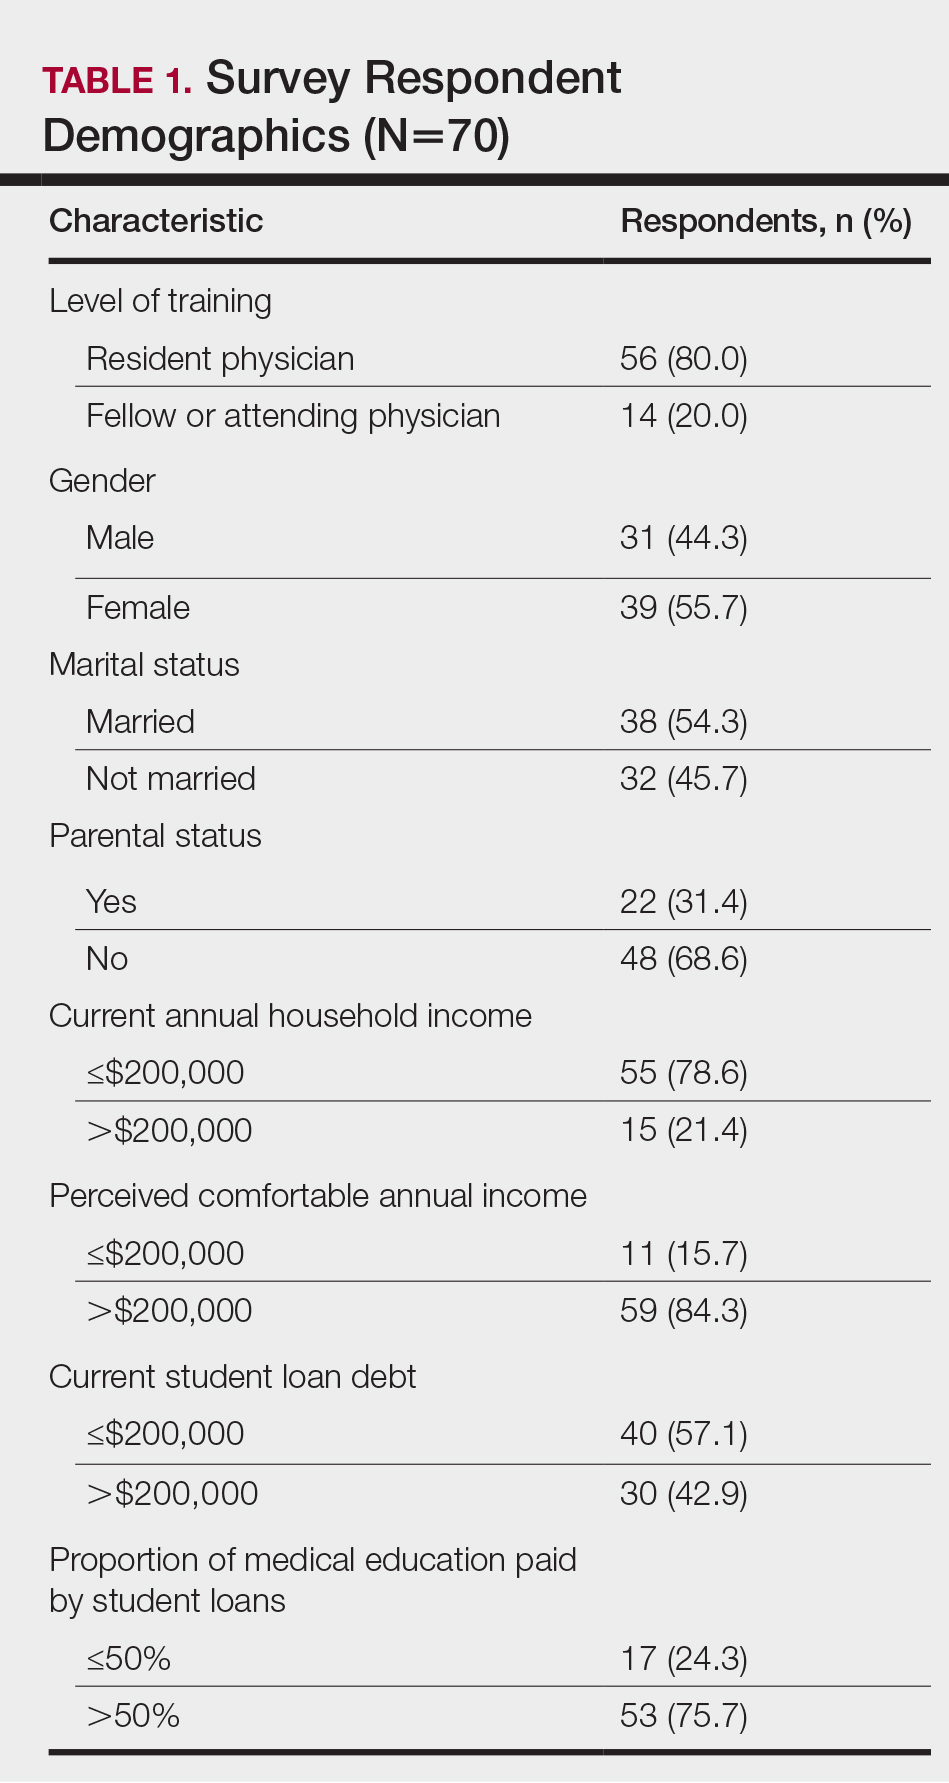
The survey had 70 respondents including residents (56 [80.0%]) and attending physicians (14 [20.0%]). The mean age (SD) of the respondents was 32.4 (6.1) years, with 31 (44.3%) men and 39 (55.7%) women. The majority were married (38 [54.3%]) and did not have children (48 [68.6%]). Most respondents reported an annual household income of $200,000 or less (55 [78.6%]) and perceived a comfortable annual household income as greater than $200,000 (59 [84.3%])(Table 1).
Financing Medical Education
Most respondents currently had $200,000 or less in student loan debt (40 [57.1%]) and financed more than half of their medical education with student loans (53 [75.7%]). A large majority (61 [87.1%]) indicated that some portion of their medical education was funded by student loans.
Career Goals in Dermatology and the Influence of Student Loans
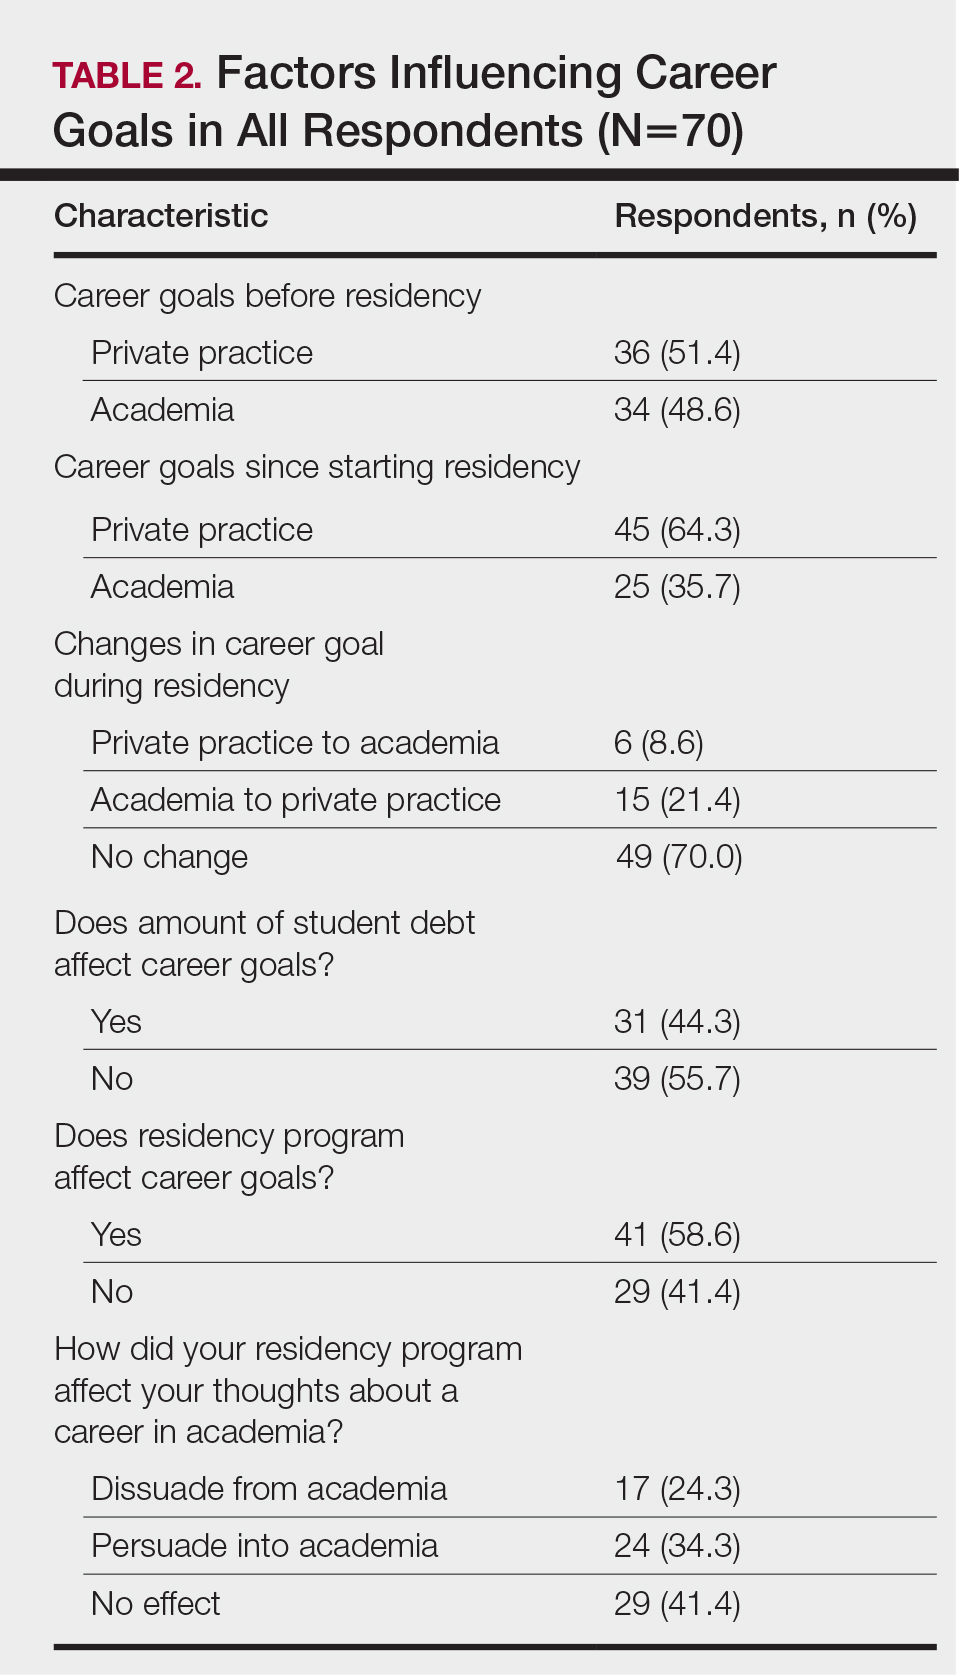
Respondents were asked to specify their career plans before versus after starting dermatology residency training (ie, current career plan). Prior to starting residency, 36 (51.4%) and 34 (48.6%) respondents indicated they were interested in private practice and academia, respectively. After starting residency, the number of respondents interested in private practice increased to 45 (64.3%), and the number of respondents interested in academia decreased to 25 (35.7%). Fifteen (21.4%) respondents changed career trajectories from academia to private practice, 6 (8.6%) changed from private practice to academia, and 49 (70.0%) did not change career goals.
The majority of respondents (39 [55.7%]) indicated that the amount of their student loan debt did not influence their career goals (Table 2); however, those with more than $200,000 in debt were more likely to state that student loans impacted their career goals compared to those with $200,000 or less in debt (70.0% [21/30] vs 25.0% [10/40]; P<.001).
Comparison of Respondents Interested in Careers in Academia vs Private Practice
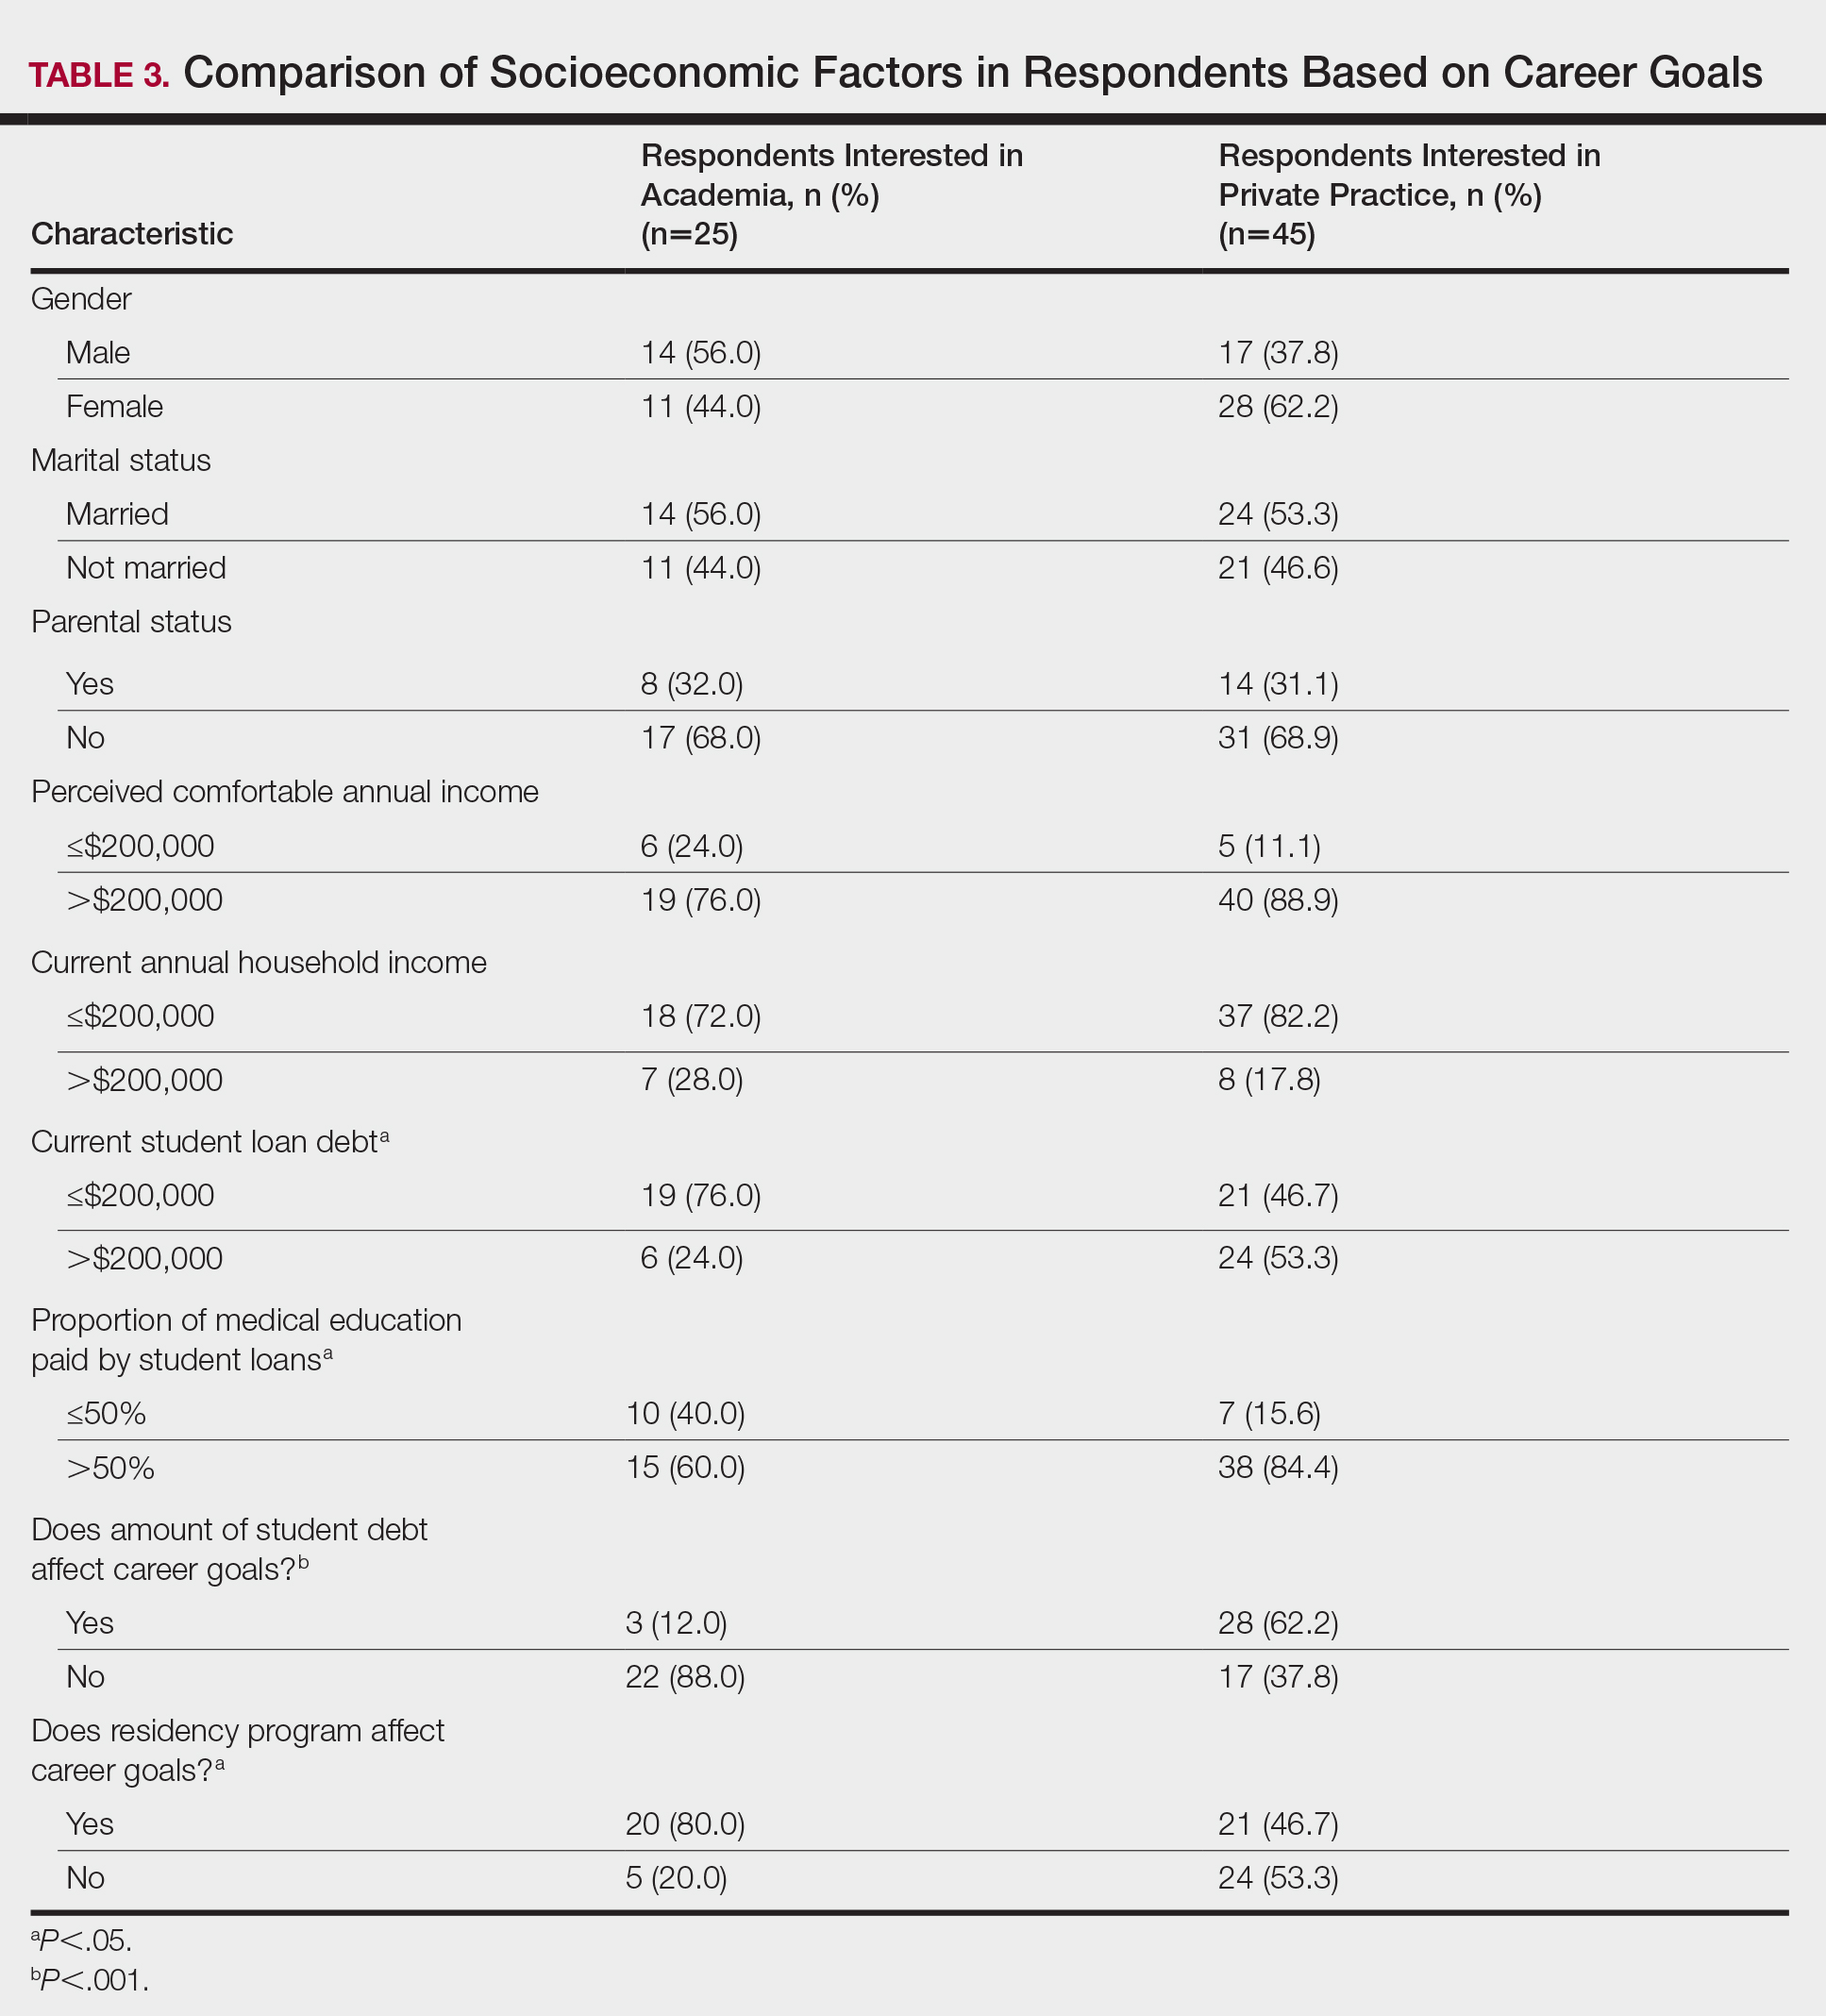
There were differences in financial circumstances between respondents interested in academia versus those interested in private practice. Compared to respondents interested in academia, those interested in private practice were more likely to have more than $200,000 in student loan debt (24 [53.3%] vs 6 [24.0%]; P<.05), have more than half of their education paid with student loans (38 [84.4%] vs 15 [60.0%]; P<.05), and state that student debt affected their career goals (28 [62.2%] vs 3 [12.0%]; P<.001)(Table 3). Demographic characteristics including gender, marital status, parental status, and current annual household income were not associated with a specific career goal.
Subgroup analysis was performed on respondents who were initially interested in academic careers but subsequently decided to pursue private practice (n=15).
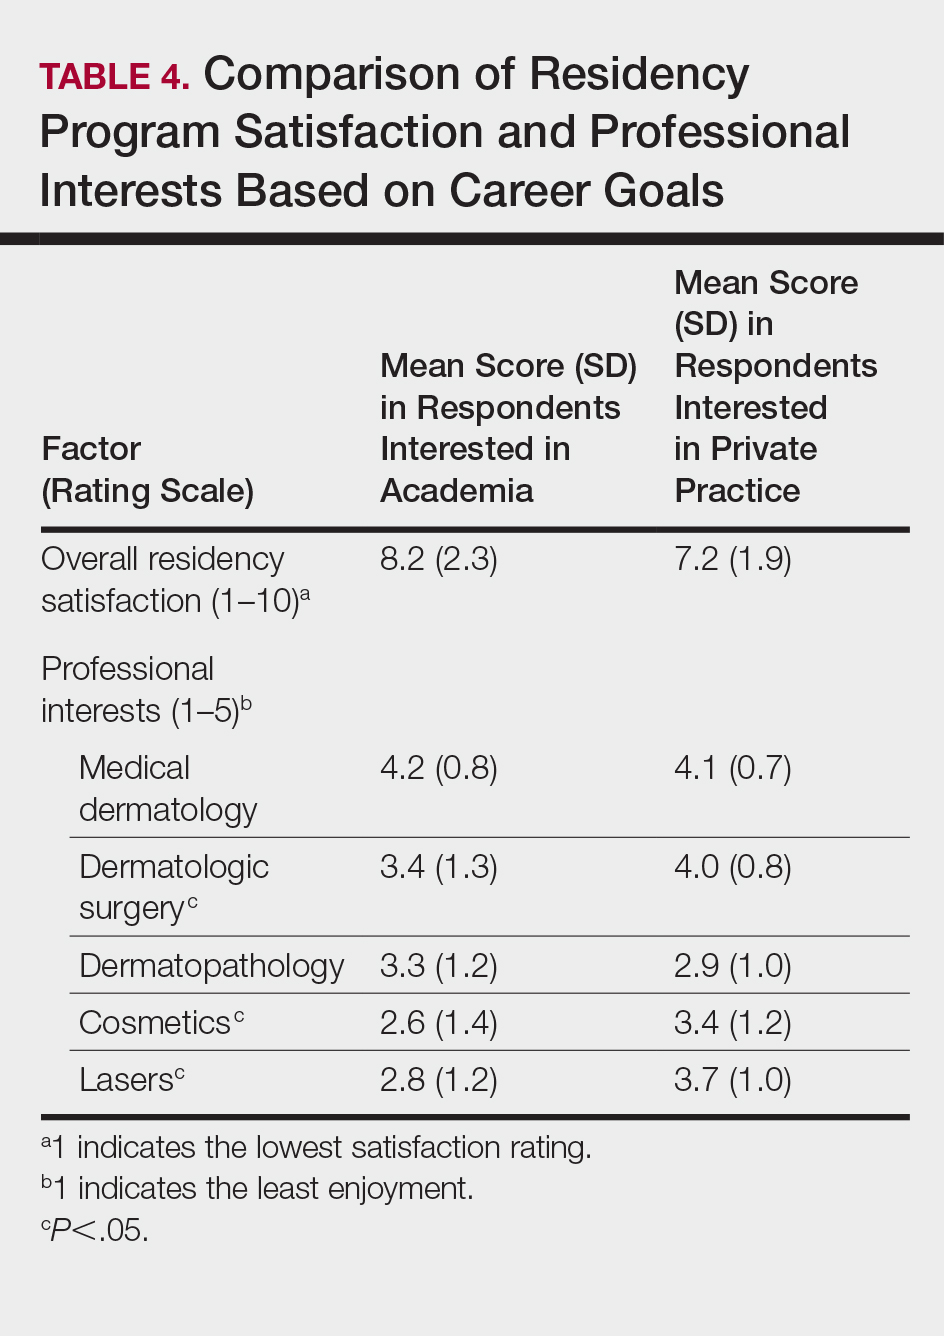
Residency program experience also may influence career trajectory. The majority (n=41 [58.6%]) of respondents indicated that their residency program experience affected their dermatology career goals. Of those, 41.7% and 58.5% stated that their residency program experiences dissuaded and persuaded them into academic positions, respectively. Those interested in academic dermatology were more likely to state that their residency program experience influenced their career goals (80.0% [20/25] vs 46.7% [21/45]; P<.05). Furthermore, those interested in academic positions responded with higher overall residency program satisfaction ratings on a scale of 1 to 10 (1 indicated the lowest satisfaction) than those interested in private practice, but the difference was not significant (mean [SD] score, 8.2 [2.3] vs 7.2 [1.9]; P=.07).
Respondents were asked to rate their interest in the following dermatology-related professional interests on a scale of 1 to 5 (1 indicated the least enjoyment): medical dermatology, dermatologic surgery, dermatopathology, cosmetics, and lasers. Those interested in private practice versus those interested in academic dermatology found more enjoyment in dermatologic surgery (mean [SD] score, 4.0 [0.8] vs 3.4 [1.3]; P<.05), cosmetics (3.4 [1.2] vs 2.6 [1.4]; P<.05), and lasers (3.7 [1.0] vs 2.8 [1.2]; P<.05)(Table 4).
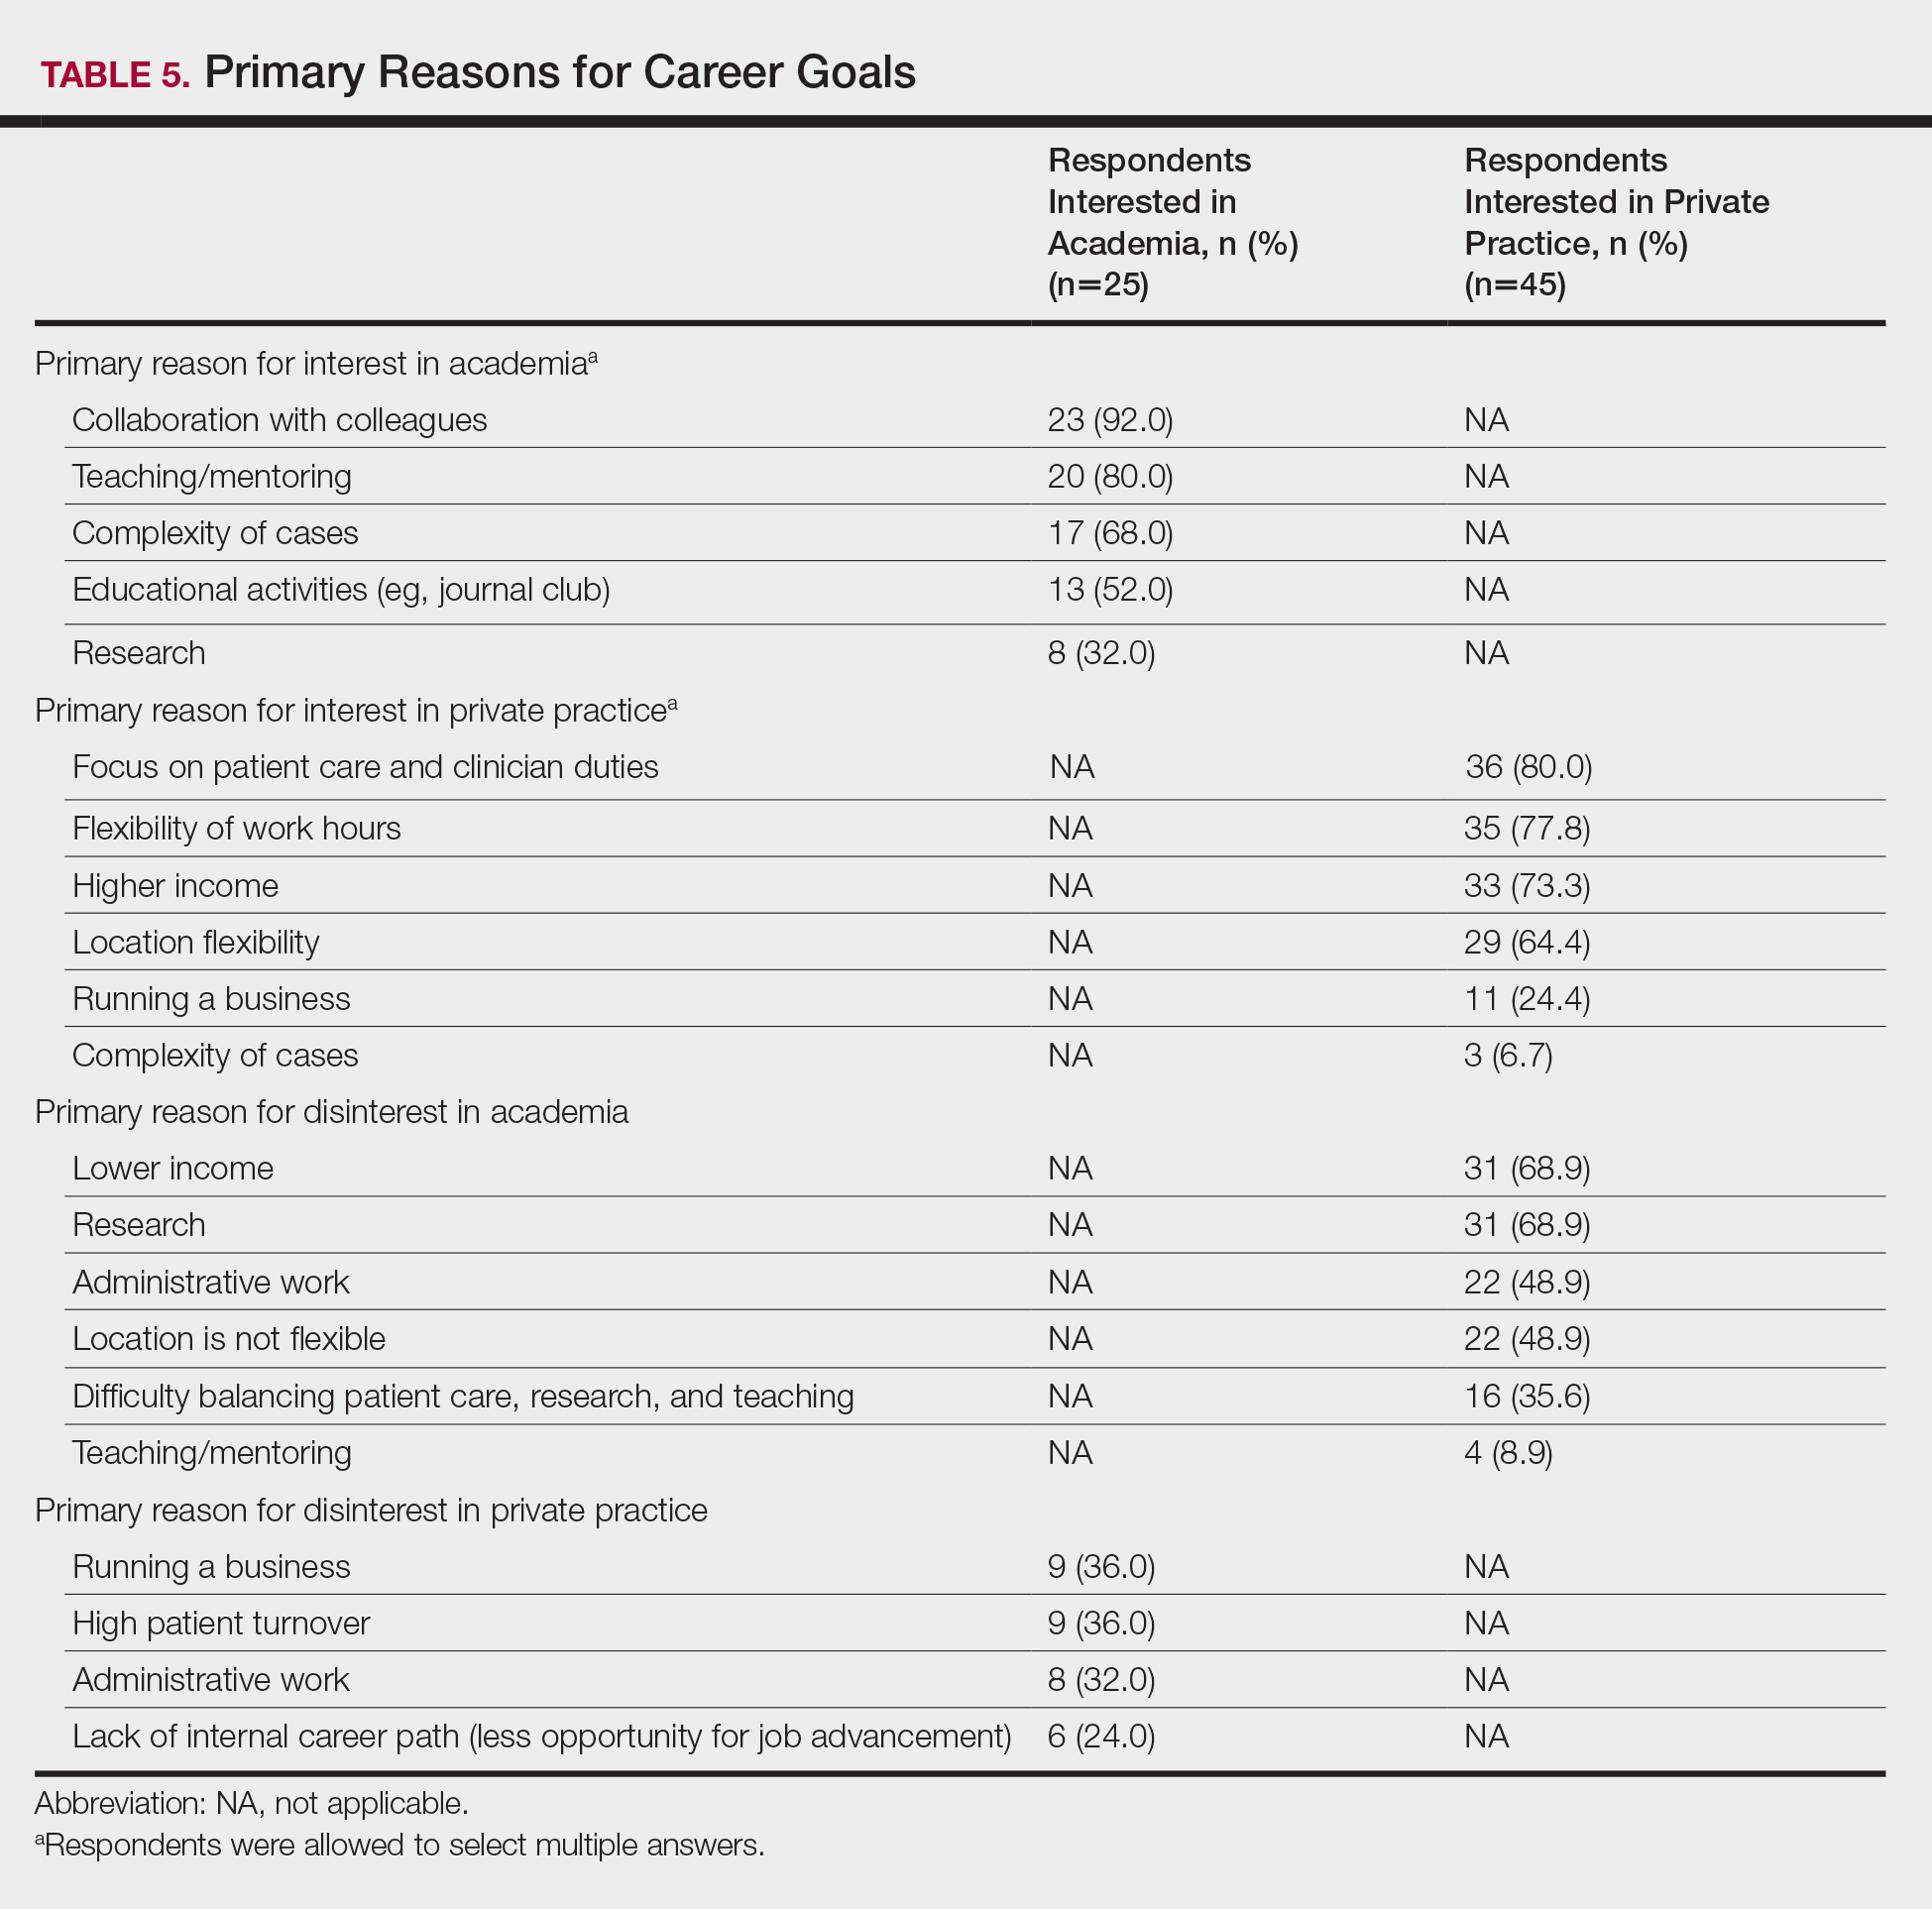
Respondents also were asked to select primary motivating factors for their career goals (ie, academia or private practice) and to indicate reasons for not choosing the alternative. The majority of those pursuing academia were motivated by opportunities to collaborate with colleagues (23 [92.0%]), teach and mentor (20 [80%]), and manage complex cases (17 [68.0%]). Most of the respondents who were pursing private practice were motivated by focus on patient care and clinician duties (36 [80.0%]), flexible work hours (35 [77.8%]), higher income (33 [73.3%]), and location flexibility (29 [64.4%]). Among those interested in academic dermatology, the top factors for disinterest in private practice were running a business (9 [36.0%]) and high patient turnover (9 [36.0%]). Most of those interested in private practice indicated that they were not interested in an academic position because of lower income (31 [68.9%]) and research duties (31 [68.9%])(Table 5).
Awareness of and Attitudes Toward the PSLF Program
The majority of respondents were aware of PSLF (53 [75.7%]); however, only 1 respondent endorsed current plans to use PSLF for loan repayment. Respondents were asked how likely they would be to pursue an academic position if given the option to have their student loans forgiven by the PSLF program. Overall, 44.6% (n=25) of respondents indicated that this option would have no effect or would unlikely convince them to pursue an academic position, and 55.4% (n=31) of respondents indicated that they were somewhat likely, likely, or very likely to pursue academia if PSLF was an option. Of those who stated that they would consider enrolling in PSLF, 64.5% (20/31) of individuals were pursuing careers in private practice. Neither current student loan burden nor career goal was associated with likelihood of enrolling in the PSLF.
Comment
In 2015, 76% of medical school graduates in the United States accrued educational debt, with an average of $189,165, a number that has continued to increase over the years.4 In addition to the increasing cost of medical education, higher interest rates on federal student loans contribute to debt burden. Over the last 2 decades, some research has posited that debt may influence medical specialty selection, with most studies focusing on primary care.5-9 However, there is limited information on the effect of student loan debt on career decisions within dermatology.
The results of our study suggest that financial factors including income and amount of educational debt may influence career decisions in dermatology. There is a known income gap between academic and nonacademic settings.
The PSLF can potentially address this issue and be used as a recruiting tool for dermatology positions in academia. Under PSLF, borrowers can have the remainder of their loan balances forgiven after making 120 monthly payments while employed full time by public service employers, including some academic medical institutions. In our study, a large majority of respondents indicated that they are aware of the PSLF, and more than half said they would consider pursuing positions in academia if their loans could be forgiven through the program; however, when asked about plans for loan repayment, only 1 respondent endorsed current plans to enroll in PSLF. Thus, despite high interest in PSLF among the survey respondents, few had actual plans to use the service, suggesting that perhaps dermatologists are not provided enough information about PSLF to motivate enrollment. In the same way, almost a quarter of respondents were not familiar with the PSLF as a repayment option, further signifying that distribution of information about financial planning may be inadequate. If student loan burden is a notable factor in career decisions in dermatology, it is important that academic institutions provide sufficient information about repayment to encourage informed decisions. As such, it is possible that educating physicians about options such as PSLF can potentially recruit more dermatologists to academic positions.
Aside from financial reasons, residency program experience and differences in practices in academic and nonacademic settings may impact career trajectories. The majority of respondents stated their residency program experience influenced their career decisions; however, the majority of respondents did not change their minds about career goals since starting residency, suggesting that residency program experience may reinforce but not necessarily alter these choices. Interests in specific focuses within dermatology also may influence career decisions. This study suggests that those pursuing private practice positions are more interested in dermatologic surgery, lasers, and cosmetics.
In this study, we did not find an association between gender and career plans in dermatology. In 2013, more than 60% of dermatology resident physicians were female.12 However, a recent study suggested that women face challenges in academic dermatology, including a downtrend in the number of female investigators with grants from the National Institutes of Health.13
This preliminary study has several limitations. First, the small sample size limited generalizability to all dermatologists. Second, responder bias was possible, as those who have stronger opinions about this topic may have been more inclined to participate in this voluntary survey. Future studies with larger sample sizes are needed to further explore the factors that influence career decisions within dermatology and to determine if there are additional means to increase recruitment into academia.
Conclusion
It is recognized that there are challenges in recruiting dermatologists into academic positions. This study suggests that student loan burden influences career decisions in dermatology. Dermatologists may not be fully educated on options for student loan repayment. With increased awareness, the PSLF can potentially be used as a recruitment tool for positions in academic dermatology.
- Resneck JS Jr, Kimball AB. The dermatology workforce shortage. J Am Acad Dermatol. 2004;50:50-54.
- Resneck JS Jr, Tierney EP, Kimball AB. Challenges facing academic dermatology: survey data on the faculty workforce. J Am Acad Dermatol. 2006;54:211-216.
- Lanzon J, Edwards SP, Inglehart MR. Choosing academia versus private practice: factors affecting oral maxillofacial surgery residents’ career choices. J Oral Maxillofac Surg. 2012;70:1751-1761.
- AAMC Medical Student Education: Debt, Costs, and Loan Repayment Fact Card. https://members.aamc.org/eweb/upload/2016_Debt_Fact_Card.pdf. Published October 2016. Accessed November 18, 2017.
- Rosenblatt RA, Andrilla CH. The impact of U.S. medical students’ debt on their choice of primary care careers: an analysis of data from the 2002 medical school graduation questionnaire. Acad Med. 2005;80:815-819.
- Woodworth PA, Chang FC, Helmer SD. Debt and other influences on career choices among surgical and primary care residents in a community-based hospital system. Am J Surg. 2000;180:570-575; discussion 575-576.
- Phillips RL Jr, Dodoo MS, Petterson S, et al. Specialty and geographic distribution of the physician workforce: what influences medical student and resident choices? Robert Graham Center website. http://www.graham-center.org/dam/rgc/documents/publications-reports/monographs-books/Specialty-geography-compressed.pdf. Published March 2, 2009. Accessed November 17, 2017.
- Rosenthal MP, Marquette PA, Diamond JJ. Trends along the debt-income axis: implications for medical students’ selections of family practice careers. Acad Med. 1996;71:675-677.
- McDonald FS, West CP, Popkave C, et al. Educational debt and reported career plans among internal medicine residents. Ann Intern Med. 2008;149:416-420.
- Careers in Medicine. Association of American Medical Colleges website. https://www.aamc.org/cim/specialty/exploreoptions/list/us/336836/dermatology.html. Accessed November 18, 2017.
- Youngclaus JA, Koehler PA, Kotlikoff LJ, et al. Can medical students afford to choose primary care? an economic analysis of physician education debt repayment. Acad Med. 2013;88:16-25.
- Physician specialty data book 2014. Association of American Medical Colleges website. https://members.aamc.org/eweb/upload/Physician Specialty Databook 2014.pdf. Published November 2014. Updated June 3, 2015. Accessed November 17, 2017.
- Cheng MY, Sukhov A, Sultani H, et al. Trends in National Institutes of Health funding of principal investigators in dermatology research by academic degree and sex. JAMA Dermatol. 2016;152:883-888.
Dermatology departments in the United States have been facing challenges in recruiting and retaining dermatologists for academic positions. Accordingly, a survey study reported that academic dermatologists were more likely than those in private practice to state that their institutions were recruiting new associates.1 Several factors could explain this phenomenon. Salary differences between jobs in academic and nonacademic settings may contribute to difficulty in recruiting dermatologists into academia, which is exacerbated by a theoretical shortage of dermatologists, leading to graduates who receive and accept private practice job offers.1,2 Furthermore, a large survey study reported that challenges unique to academic dermatologists include longer patient wait times in addition to responsibilities such as research, hospital consultations, medical writing, and teaching. These patterns raise concerns for the future of teaching institutions because academic dermatologists not only train future physicians but also conduct clinical and basic science research necessary to advance the field and improve patient care.2 Thus, it is important to evaluate the factors that affect career decisions in dermatology and to determine if these factors can be addressed. We hypothesized that student loan burden influences career plans in dermatology and that physicians are not fully educated on loan repayment options. The aims of this preliminary study were to explore the influence of student loan burden on career plans in dermatology and to determine if the Public Service Loan Forgiveness (PSLF) program could potentially encourage more dermatologists to consider academic careers.
Methods
The study aimed to investigate the factors that influence career decisions in dermatology and to assess attitudes toward the PSLF program as an option for student loan repayment. The target population included dermatology residents and attending physicians in the United States. Survey questions were adapted from a previously published study3 and were modified based on feedback from reviewers in the University of California (UC) Irvine department of dermatology. The survey was voluntary and did not collect identifying information. This study was granted exemption from oversight by the UC Irvine institutional review board.
Recruitment materials informed potential participants of the nature of the study and provided a hyperlink to the electronic survey. The UC Irvine department of dermatology emailed US dermatology residency program coordinators, requesting that they forward this study to residents and attending physicians in their programs.
Results
Demographics
The survey had 70 respondents including residents (56 [80.0%]) and attending physicians (14 [20.0%]). The mean age (SD) of the respondents was 32.4 (6.1) years, with 31 (44.3%) men and 39 (55.7%) women. The majority were married (38 [54.3%]) and did not have children (48 [68.6%]). Most respondents reported an annual household income of $200,000 or less (55 [78.6%]) and perceived a comfortable annual household income as greater than $200,000 (59 [84.3%])(Table 1).
Financing Medical Education
Most respondents currently had $200,000 or less in student loan debt (40 [57.1%]) and financed more than half of their medical education with student loans (53 [75.7%]). A large majority (61 [87.1%]) indicated that some portion of their medical education was funded by student loans.
Career Goals in Dermatology and the Influence of Student Loans
Respondents were asked to specify their career plans before versus after starting dermatology residency training (ie, current career plan). Prior to starting residency, 36 (51.4%) and 34 (48.6%) respondents indicated they were interested in private practice and academia, respectively. After starting residency, the number of respondents interested in private practice increased to 45 (64.3%), and the number of respondents interested in academia decreased to 25 (35.7%). Fifteen (21.4%) respondents changed career trajectories from academia to private practice, 6 (8.6%) changed from private practice to academia, and 49 (70.0%) did not change career goals.
The majority of respondents (39 [55.7%]) indicated that the amount of their student loan debt did not influence their career goals (Table 2); however, those with more than $200,000 in debt were more likely to state that student loans impacted their career goals compared to those with $200,000 or less in debt (70.0% [21/30] vs 25.0% [10/40]; P<.001).
Comparison of Respondents Interested in Careers in Academia vs Private Practice
There were differences in financial circumstances between respondents interested in academia versus those interested in private practice. Compared to respondents interested in academia, those interested in private practice were more likely to have more than $200,000 in student loan debt (24 [53.3%] vs 6 [24.0%]; P<.05), have more than half of their education paid with student loans (38 [84.4%] vs 15 [60.0%]; P<.05), and state that student debt affected their career goals (28 [62.2%] vs 3 [12.0%]; P<.001)(Table 3). Demographic characteristics including gender, marital status, parental status, and current annual household income were not associated with a specific career goal.
Subgroup analysis was performed on respondents who were initially interested in academic careers but subsequently decided to pursue private practice (n=15).
Residency program experience also may influence career trajectory. The majority (n=41 [58.6%]) of respondents indicated that their residency program experience affected their dermatology career goals. Of those, 41.7% and 58.5% stated that their residency program experiences dissuaded and persuaded them into academic positions, respectively. Those interested in academic dermatology were more likely to state that their residency program experience influenced their career goals (80.0% [20/25] vs 46.7% [21/45]; P<.05). Furthermore, those interested in academic positions responded with higher overall residency program satisfaction ratings on a scale of 1 to 10 (1 indicated the lowest satisfaction) than those interested in private practice, but the difference was not significant (mean [SD] score, 8.2 [2.3] vs 7.2 [1.9]; P=.07).
Respondents were asked to rate their interest in the following dermatology-related professional interests on a scale of 1 to 5 (1 indicated the least enjoyment): medical dermatology, dermatologic surgery, dermatopathology, cosmetics, and lasers. Those interested in private practice versus those interested in academic dermatology found more enjoyment in dermatologic surgery (mean [SD] score, 4.0 [0.8] vs 3.4 [1.3]; P<.05), cosmetics (3.4 [1.2] vs 2.6 [1.4]; P<.05), and lasers (3.7 [1.0] vs 2.8 [1.2]; P<.05)(Table 4).
Respondents also were asked to select primary motivating factors for their career goals (ie, academia or private practice) and to indicate reasons for not choosing the alternative. The majority of those pursuing academia were motivated by opportunities to collaborate with colleagues (23 [92.0%]), teach and mentor (20 [80%]), and manage complex cases (17 [68.0%]). Most of the respondents who were pursing private practice were motivated by focus on patient care and clinician duties (36 [80.0%]), flexible work hours (35 [77.8%]), higher income (33 [73.3%]), and location flexibility (29 [64.4%]). Among those interested in academic dermatology, the top factors for disinterest in private practice were running a business (9 [36.0%]) and high patient turnover (9 [36.0%]). Most of those interested in private practice indicated that they were not interested in an academic position because of lower income (31 [68.9%]) and research duties (31 [68.9%])(Table 5).
Awareness of and Attitudes Toward the PSLF Program
The majority of respondents were aware of PSLF (53 [75.7%]); however, only 1 respondent endorsed current plans to use PSLF for loan repayment. Respondents were asked how likely they would be to pursue an academic position if given the option to have their student loans forgiven by the PSLF program. Overall, 44.6% (n=25) of respondents indicated that this option would have no effect or would unlikely convince them to pursue an academic position, and 55.4% (n=31) of respondents indicated that they were somewhat likely, likely, or very likely to pursue academia if PSLF was an option. Of those who stated that they would consider enrolling in PSLF, 64.5% (20/31) of individuals were pursuing careers in private practice. Neither current student loan burden nor career goal was associated with likelihood of enrolling in the PSLF.
Comment
In 2015, 76% of medical school graduates in the United States accrued educational debt, with an average of $189,165, a number that has continued to increase over the years.4 In addition to the increasing cost of medical education, higher interest rates on federal student loans contribute to debt burden. Over the last 2 decades, some research has posited that debt may influence medical specialty selection, with most studies focusing on primary care.5-9 However, there is limited information on the effect of student loan debt on career decisions within dermatology.
The results of our study suggest that financial factors including income and amount of educational debt may influence career decisions in dermatology. There is a known income gap between academic and nonacademic settings.
The PSLF can potentially address this issue and be used as a recruiting tool for dermatology positions in academia. Under PSLF, borrowers can have the remainder of their loan balances forgiven after making 120 monthly payments while employed full time by public service employers, including some academic medical institutions. In our study, a large majority of respondents indicated that they are aware of the PSLF, and more than half said they would consider pursuing positions in academia if their loans could be forgiven through the program; however, when asked about plans for loan repayment, only 1 respondent endorsed current plans to enroll in PSLF. Thus, despite high interest in PSLF among the survey respondents, few had actual plans to use the service, suggesting that perhaps dermatologists are not provided enough information about PSLF to motivate enrollment. In the same way, almost a quarter of respondents were not familiar with the PSLF as a repayment option, further signifying that distribution of information about financial planning may be inadequate. If student loan burden is a notable factor in career decisions in dermatology, it is important that academic institutions provide sufficient information about repayment to encourage informed decisions. As such, it is possible that educating physicians about options such as PSLF can potentially recruit more dermatologists to academic positions.
Aside from financial reasons, residency program experience and differences in practices in academic and nonacademic settings may impact career trajectories. The majority of respondents stated their residency program experience influenced their career decisions; however, the majority of respondents did not change their minds about career goals since starting residency, suggesting that residency program experience may reinforce but not necessarily alter these choices. Interests in specific focuses within dermatology also may influence career decisions. This study suggests that those pursuing private practice positions are more interested in dermatologic surgery, lasers, and cosmetics.
In this study, we did not find an association between gender and career plans in dermatology. In 2013, more than 60% of dermatology resident physicians were female.12 However, a recent study suggested that women face challenges in academic dermatology, including a downtrend in the number of female investigators with grants from the National Institutes of Health.13
This preliminary study has several limitations. First, the small sample size limited generalizability to all dermatologists. Second, responder bias was possible, as those who have stronger opinions about this topic may have been more inclined to participate in this voluntary survey. Future studies with larger sample sizes are needed to further explore the factors that influence career decisions within dermatology and to determine if there are additional means to increase recruitment into academia.
Conclusion
It is recognized that there are challenges in recruiting dermatologists into academic positions. This study suggests that student loan burden influences career decisions in dermatology. Dermatologists may not be fully educated on options for student loan repayment. With increased awareness, the PSLF can potentially be used as a recruitment tool for positions in academic dermatology.
- Resneck JS Jr, Kimball AB. The dermatology workforce shortage. J Am Acad Dermatol. 2004;50:50-54.
- Resneck JS Jr, Tierney EP, Kimball AB. Challenges facing academic dermatology: survey data on the faculty workforce. J Am Acad Dermatol. 2006;54:211-216.
- Lanzon J, Edwards SP, Inglehart MR. Choosing academia versus private practice: factors affecting oral maxillofacial surgery residents’ career choices. J Oral Maxillofac Surg. 2012;70:1751-1761.
- AAMC Medical Student Education: Debt, Costs, and Loan Repayment Fact Card. https://members.aamc.org/eweb/upload/2016_Debt_Fact_Card.pdf. Published October 2016. Accessed November 18, 2017.
- Rosenblatt RA, Andrilla CH. The impact of U.S. medical students’ debt on their choice of primary care careers: an analysis of data from the 2002 medical school graduation questionnaire. Acad Med. 2005;80:815-819.
- Woodworth PA, Chang FC, Helmer SD. Debt and other influences on career choices among surgical and primary care residents in a community-based hospital system. Am J Surg. 2000;180:570-575; discussion 575-576.
- Phillips RL Jr, Dodoo MS, Petterson S, et al. Specialty and geographic distribution of the physician workforce: what influences medical student and resident choices? Robert Graham Center website. http://www.graham-center.org/dam/rgc/documents/publications-reports/monographs-books/Specialty-geography-compressed.pdf. Published March 2, 2009. Accessed November 17, 2017.
- Rosenthal MP, Marquette PA, Diamond JJ. Trends along the debt-income axis: implications for medical students’ selections of family practice careers. Acad Med. 1996;71:675-677.
- McDonald FS, West CP, Popkave C, et al. Educational debt and reported career plans among internal medicine residents. Ann Intern Med. 2008;149:416-420.
- Careers in Medicine. Association of American Medical Colleges website. https://www.aamc.org/cim/specialty/exploreoptions/list/us/336836/dermatology.html. Accessed November 18, 2017.
- Youngclaus JA, Koehler PA, Kotlikoff LJ, et al. Can medical students afford to choose primary care? an economic analysis of physician education debt repayment. Acad Med. 2013;88:16-25.
- Physician specialty data book 2014. Association of American Medical Colleges website. https://members.aamc.org/eweb/upload/Physician Specialty Databook 2014.pdf. Published November 2014. Updated June 3, 2015. Accessed November 17, 2017.
- Cheng MY, Sukhov A, Sultani H, et al. Trends in National Institutes of Health funding of principal investigators in dermatology research by academic degree and sex. JAMA Dermatol. 2016;152:883-888.
Practice Points
- Academic dermatology departments are facing challenges in recruiting physicians, raising concerns for the future of dermatology education and research.
- Large amounts of student loan burden may influence career plans in dermatology.
- Dermatologists may not be fully knowledgeable of loan repayment options; thus, education on this topic should be prioritized by dermatology training programs.

Direct and Indirect Patient Costs of Dermatology Clinic Visits and Their Impact on Access to Care and Provider Preference
Access to outpatient specialty care is notably limited due to time and out-of-pocket costs to patients, leading to patient dissatisfaction and worsened clinical outcomes. Lost time and earnings pose considerable opportunity costs for patients, with the total opportunity cost for all physician visits per year estimated at $52 billion in 2010 in the United States.1
The field of dermatology exemplifies the access issues patients may face when seeking specialty care given the ongoing national shortage of dermatologists and notably long wait times exceeding 60 days in major cities.2-4 With the high demand and limited number of providers, patients may have longer wait times to see dermatologists in their communities or have to travel further to see dermatologists in distant locations who have available appointments; therefore, patients may be subject to higher associated time, travel, and monetary costs. According to the 2013 Medical Expenditure Panel Survey, dermatology visits in the United States cost an average of $221 per visit compared to $166 for primary care. Dermatology visits had the highest median cost per office visit ($124) and were more often associated with out-of-pocket expenses (60.7%) compared to other specialties.5 Despite these high costs, the number of dermatology visits is increasing each year, with more than 38 million dermatology visits in 2012.6
In light of these factors that limit patient access to dermatologists compared to other specialists, we performed an evaluation of the direct and indirect costs to patients visiting an outpatient dermatology clinic in Boston, Massachusetts, to better understand obstacles to receiving dermatologic care. The impact that time and money have on how patients prefer to receive their care also was evaluated. Conducting this study in Boston may best reflect patient barriers to obtaining dermatologic treatment, as nationwide surveys have found that Boston has the highest cumulative average wait times for physician appointments compared to other US metropolitan cities, with an average wait time of 72 days to see a dermatologist.4 New studies of patient costs associated with dermatology clinic visits are lacking, and existing economic analyses rarely include time costs. Understanding time burden and opportunity costs from the patient perspective may motivate patients and physicians to alter how they receive and provide health care, respectively, to minimize these expenses. Advances in health care technology such as telecommunication may facilitate these changes.
Methods
Study Design
This survey study took place from October 1, 2015, to March 4, 2016, at the department of dermatology outpatient clinic of Tufts Medical Center, an academic university hospital located in downtown Boston, Massachusetts, with no satellite clinics. Five general dermatologists, 2 dermatologic surgeons, and 9 dermatology residents comprised the dermatology department. The study protocol and questionnaire received exemption status from the Tufts University Health Science’s institutional review board.
All adult patients (aged ≥18 years) attending a scheduled dermatology clinic visit within the designated time frame were invited to complete a questionnaire available in English, Spanish, or Chinese. Patients completed the questionnaire on paper or electronically using handheld tablets. Data were then compiled into the REDCap (Research Electronic Data Capture) online database. The questionnaire surveyed patient age; gender; ethnicity; language spoken; highest level of education; employment status; reason for visit (ie, skin condition); duration, cost, and mode of transportation; duration of visit including wait time; companion accompaniment; profession; hourly wage; and number of work hours requested off to attend the visit. Lastly, patients were surveyed on whether they prefer to receive dermatologic care at Tufts, to receive in-person care elsewhere, to use teledermatology, or none of the above.
Statistical Analysis
Total time attributed to the visit was the sum of time for round-trip travel to and from the clinic, wait time, and face-to-face time with care providers. Out-of-pocket patient expenses included round-trip travel expenses, child care expenses, and direct payments such as deductibles and co-pays. Opportunity cost for employed patients was calculated as the patient’s average hourly wage multiplied by either the number of hours taken off from work or the number of hours the patient attributed to the visit, whichever value was higher at the individual level. For the purpose of calculating opportunity costs, travel time, wait time, and face-to-face time were imputed using average values for these variables when not reported. Patients could provide exact hourly wage and annual income or select the closest approximation from 10 wage ranges. For patients who selected a wage range, the midpoint of the range was used as the hourly wage. Total costs were the sum of reported out-of-pocket expenses and calculated opportunity costs. For unemployed patients and those who did not report employment status, hourly wage was assumed to be $0, resulting in opportunity costs of $0. Costs are tabulated for individual patients and analyzed in aggregate.
Differences in patient characteristics between those who preferred their current care provider versus those who preferred to seek care elsewhere or via teledermatology were compared using the χ2 and Student t test. A multivariate logistic regression was then performed to identify predictors of patient preference for their current provider. Potential predictors for regression model were time and cost variables as well as factors selected based on results from bivariate analysis. Data analysis was performed using statistical software.
Results
Demographics
Demographic data for respondents are outlined in Table 1. Of 145 patients who completed the survey, the majority had already seen a dermatologist for their presenting condition (87.4%), and were English speaking (96.5%), white (76.6%), employed (59.4%), and male (50.3%), with a mean age (SD) of 52.3 (18.1) years and education level of 4-year university or higher (64.7%). The most common reasons for dermatology clinic attendance were general skin checks (30.8%) and psoriasis (26.6%). A smaller proportion of patients (16.1%) presented for surgical visits. Other less common conditions that brought patients into the clinic included acne (6.3%), eczema (4.9%), and skin rash (2.8%).
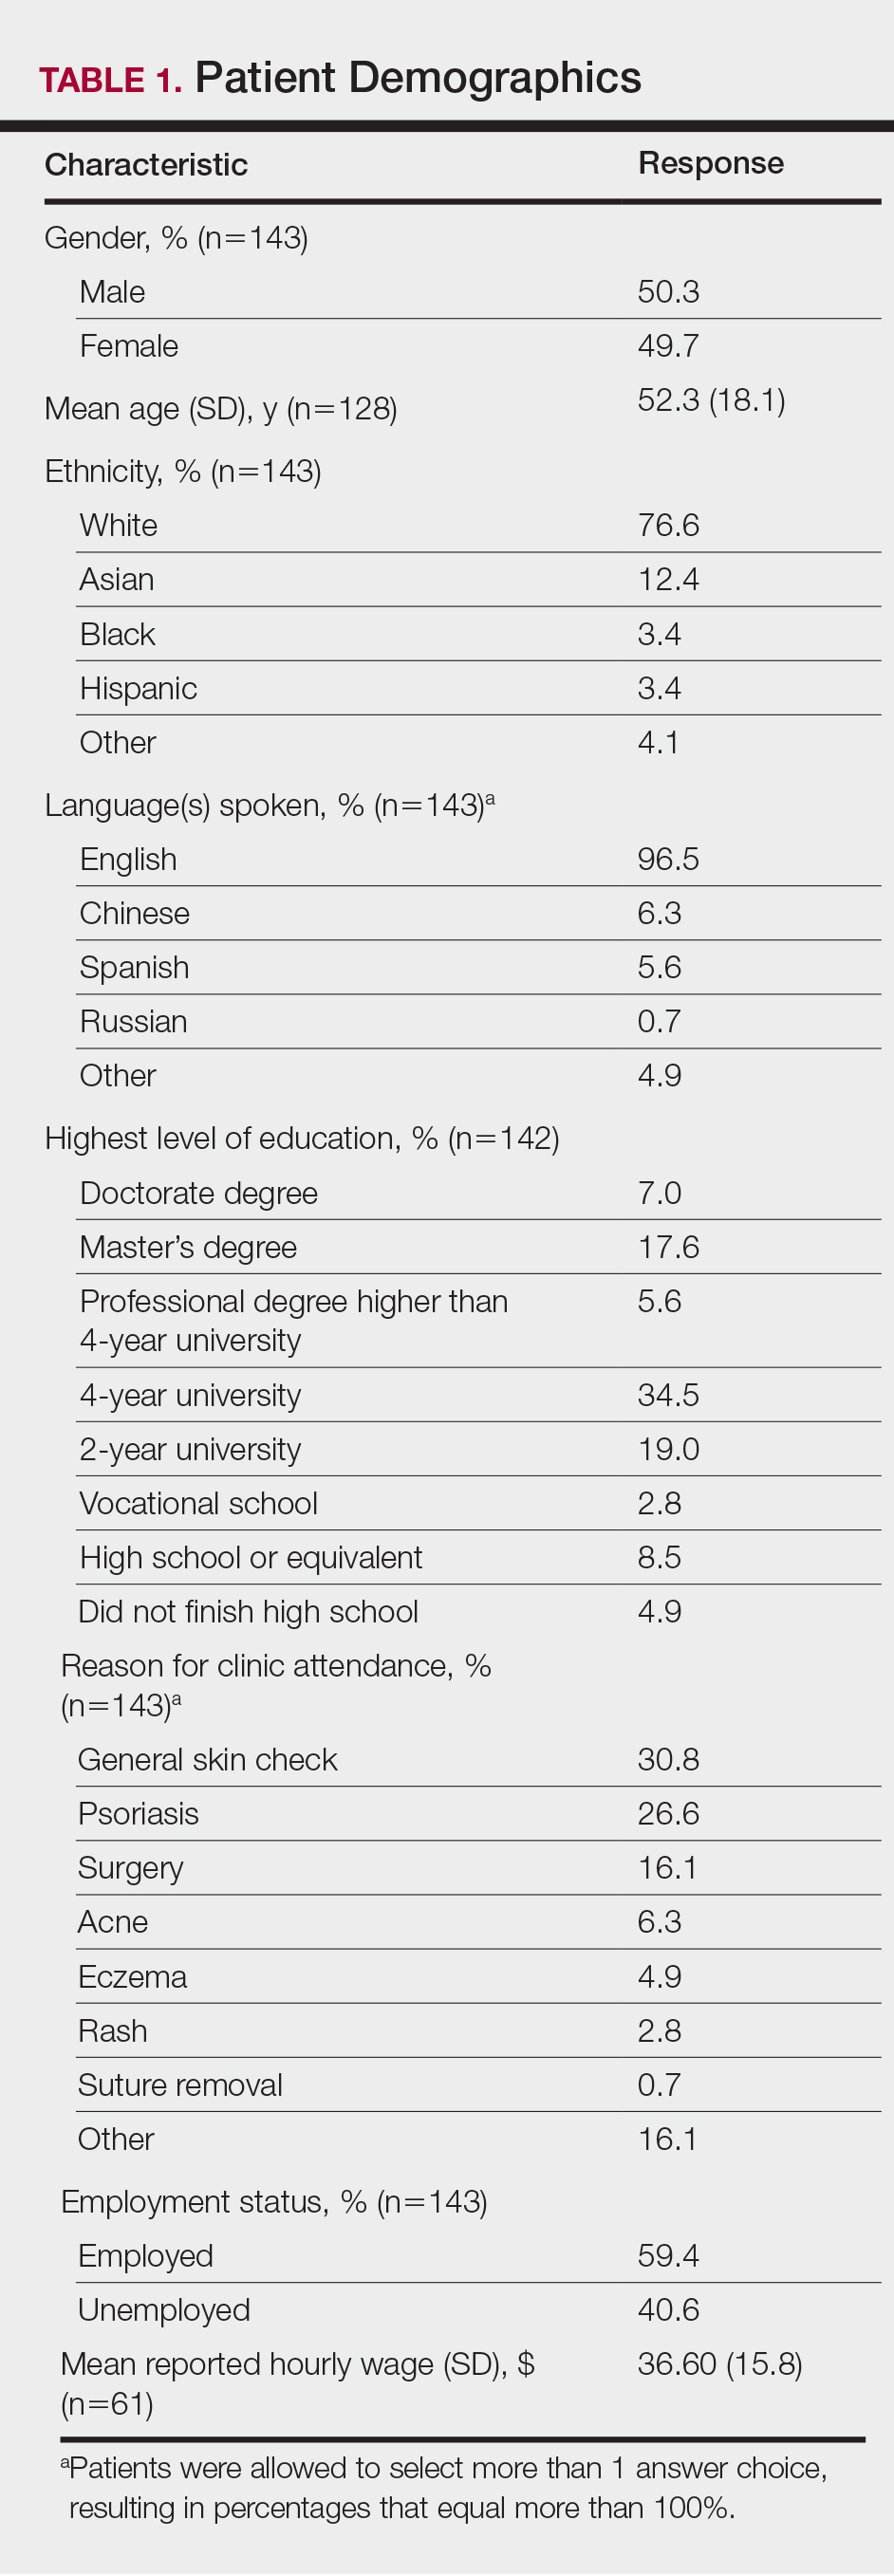
The mean (SD) reported hourly wage of employed patients was $36.60 (15.8). The most common reasons for unemployment were retirement (65.5% [38/58]), disability (10.3% [6/58]), and schooling (10.3% [6/58]).
Time Attributed to Attending Dermatology Clinic Visits
Time costs are reported in Table 2. Patients traveled to the clinic mainly by car (56.5% [78/138]) or train/subway (25.3% [35/138]). One in approximately 5 patients (21.3%) spent more than 1 hour traveling one-way to the clinic. Most patients waited less than 20 minutes to see their care providers. Face-to-face time with providers (ie, residents and attending physicians) ranged from less than 21 minutes to more than 1 hour, with a mean (SD) time of 36.8 (18.9) minutes.
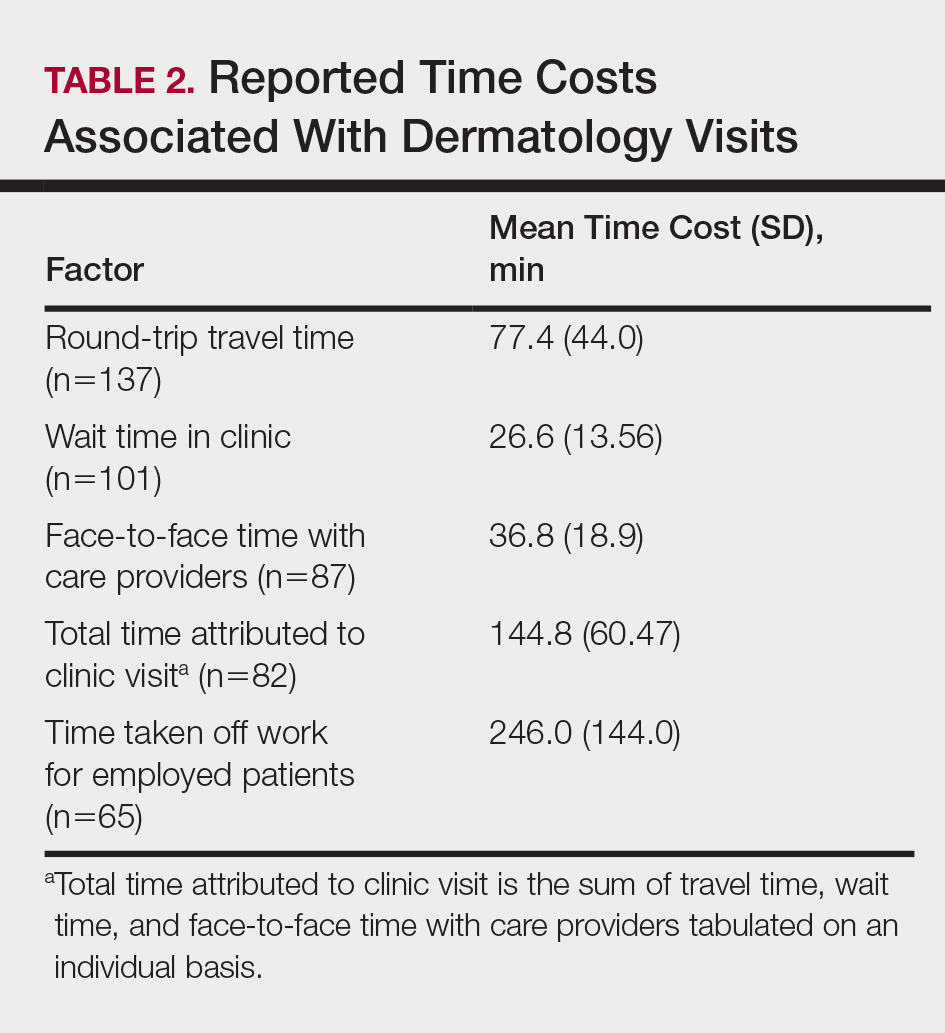
Of the employed respondents, 76.5% (65/85) took off time from work for the appointment. Patients took a mean (SD) of 4.1 (2.4) hours off from work, which was considered sick pay (35%), paid time off (36.6%), or unpaid time (28.3%). The total mean (SD) time dedicated to attending the clinic appointment averaged 144.8 (60.47) minutes. On average, the time spent traveling for the clinic visit was double the amount of time spent with the care provider (77.4 vs 36.8 minutes).
Monetary and Opportunity Costs
The mean (SD) monetary cost associated with clinic attendance for employed patients who reported their wages was $187.50 (103.2)(range, $37.50–$489), most of which was opportunity cost from loss of potential work income (mean [SD], $144.30 [93.6]; range, $27–$432)(Table 3). Similar total and opportunity costs were found for employed patients using the imputed average wage. The mean (SD) total cost per visit for unemployed patients or those who did not report employment status was $38.65 (103.6)(range, $0–$800), which was 4-times less than the cost per visit for employed patients. Mean (SD) and median one-way travel expenses were $16.60 (40.5) and $10, respectively. Mean (SD) and median reported costs for deductibles/co-pays were $44.20 (66.1) and $25, respectively. Only 2 patients reported child care costs, which were valued at $65 and $75.
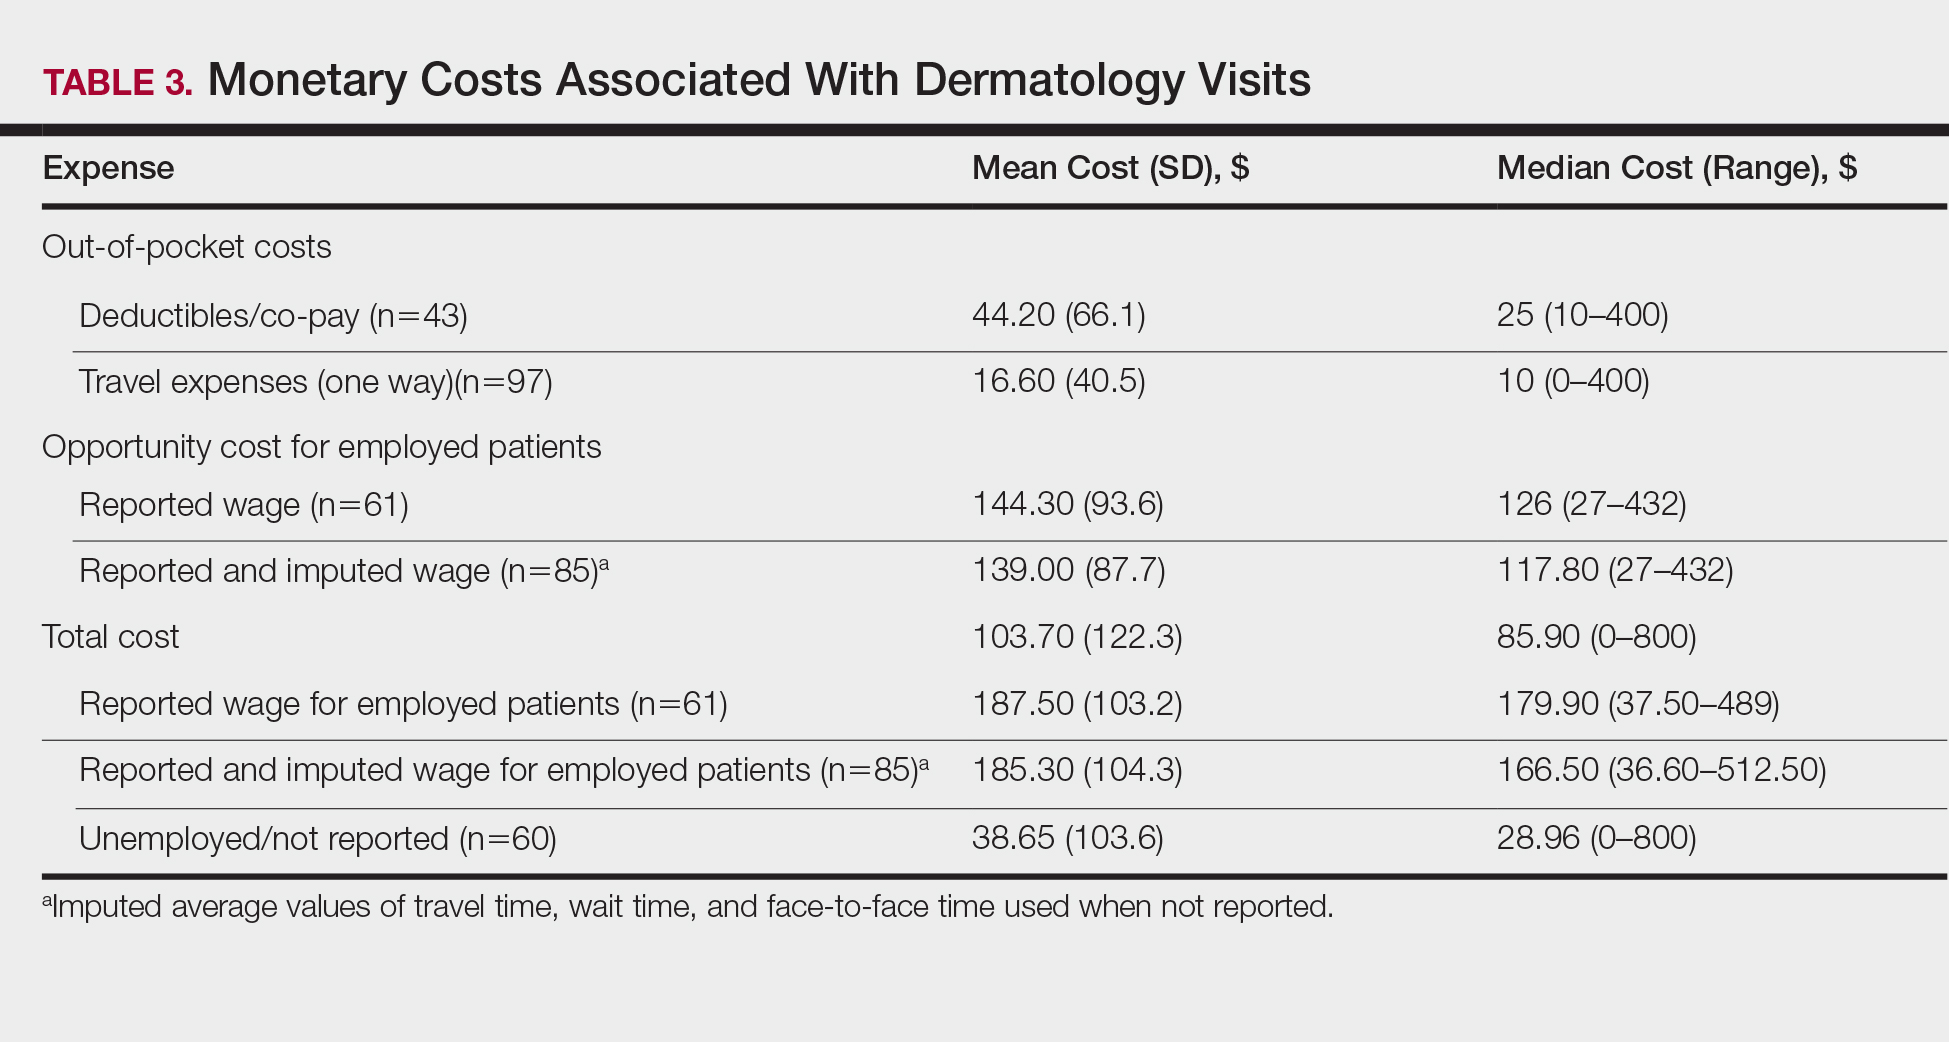
Patient Provider Preference
The majority (59.3% [67/113]) of patients preferred their current care providers, whereas 33.6% (38/113) preferred providers closer to work, home, or in a different unspecified setting. Only 7.0% (8/113) of patients who answered this survey question would choose teledermatology over their current providers.
On multivariate logistic regression (Table 4), patients who had additional out-of-pocket costs were significantly less likely to prefer their current care provider compared to patients with no out-of-pocket costs (odds ratio [OR], 0.27; 95% confidence interval [CI], 0.10-0.71; P<.05). Opportunity costs were not a significant predictor of provider preference. For every minute the travel time increased, the likelihood of preference for the current care provider decreased by 2% (OR, 0.98; 95% CI, 0.95–0.99), and patients who traveled 60 minutes or more round-trip were 71% less likely to choose current provider care than those who traveled less than 60 minutes (OR, 0.29; 95% CI, 0.09-0.96; P<.05). Patients with higher education (≥4 years of college) were 3.29-times more likely to stay with their current care provider than those with lower education (≤2 years of college). Those presenting for skin checks also preferred the current provider more than those with noninflammatory skin conditions such as alopecia and warts (OR, 9.01; 95% CI, 2.28-35.59). Age and gender were not statistically significant predictors of patient provider preference.
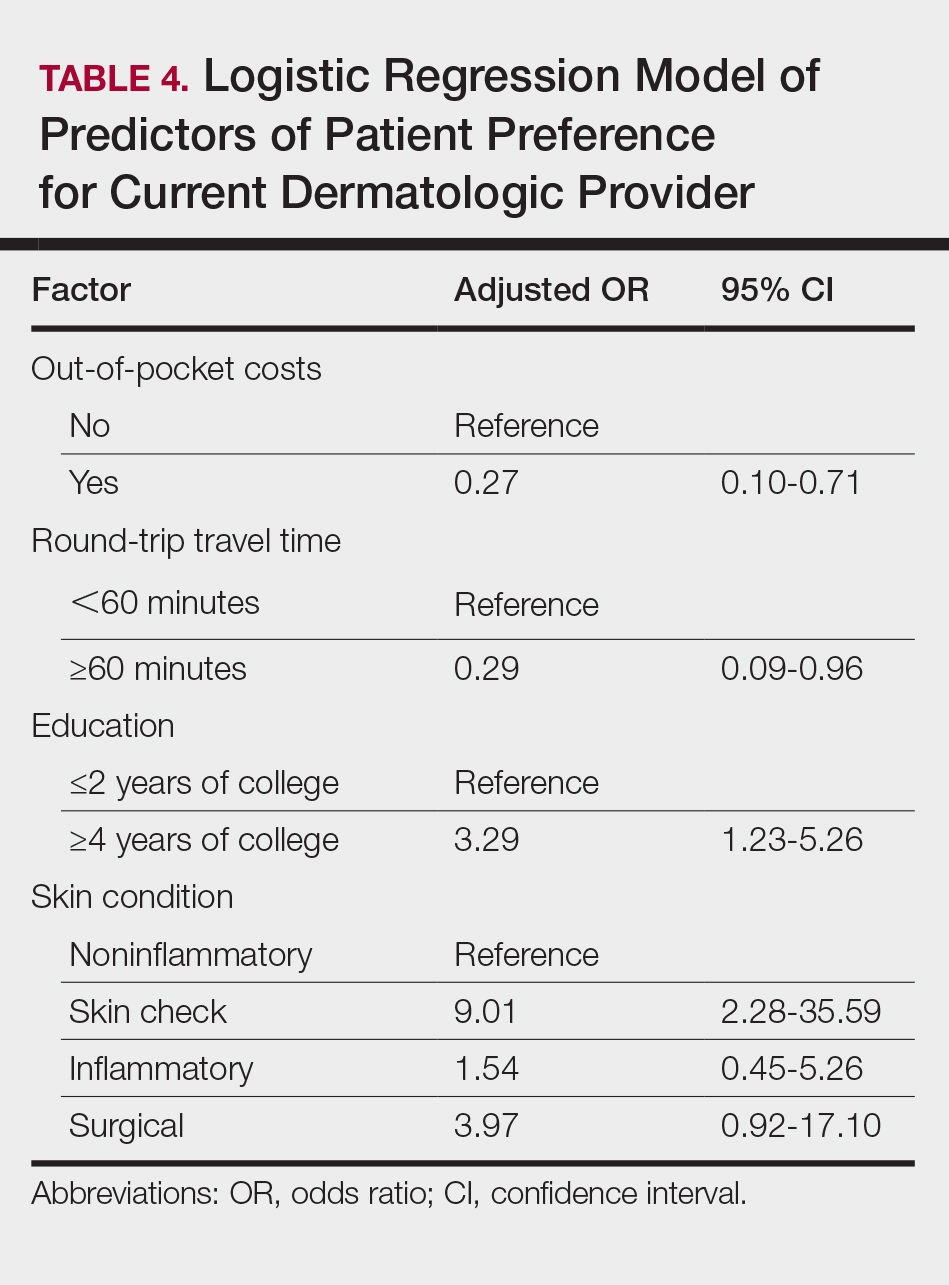
Comment
Our study revealed that patients spend a substantial amount of time and money attending dermatology clinic appointments. Round-trip travel time exceeded 2 hours for 20% of patients and accounted for the majority of the total time attributed to the visit. Patients who were employed typically requested an average of 4 hours off from work, resulting in a mean (SD) opportunity cost of $144.30 (93.6) due to lost wages. Direct costs such as co-pays, deductibles, travel expenses, and child care accounted for a smaller proportion of total costs. The study assumed a wage of $0 for unemployed patients, thus underestimating the true costs of the visit for these patients whose time may otherwise have been spent on leisure, education, volunteerism, or other activities that contribute to individual and societal productivity. The total costs for unemployed patients reflected only direct costs, and thus were notably lower than those for employed patients.
Direct out-of-pocket costs and travel time negatively impacted provider preference. Patients with out-of-pocket costs were much less likely to stay with their current care provider (OR, 0.27; 95% CI, 0.10-0.71), preferring to seek care closer to home/work or teledermatology services. Similarly, for each minute that travel time increased, preference for current care provider decreased by 2%. Those who traveled 60 minutes or more were 71% less likely than those who traveled less than 60 minutes to stay with their current provider when given other options for care. Opportunity costs did not affect provider preference, even though they far exceeded direct costs for employed patients. Perhaps opportunity costs are not as immediately apparent to patients as out-of-pocket costs and travel time, and thus they do not factor as heavily in provider preference.
Despite high time and monetary costs, the majority of patients (60%) still preferred their current care provider, especially those with 4-year university degrees or higher education level (OR, 3.29; 95% CI, 1.23-5.26) and those presenting for skin checks (OR, 9.01; 95% CI, 2.28-35.59). Patients with higher levels of education likely have higher incomes and thus may not be as adversely affected by direct and/or indirect visit costs. Patients presenting for skin checks may value continuity and prefer providers with whom they already have an established therapeutic relationship. Future studies are needed to analyze the impact of these nonmonetary factors on provider preference.
Seeking Alternative Care
Tufts Medical Center does not have satellite dermatology clinics, making it the only option for patients who wish to receive care within the Tufts hospital network. However, patients do have the option of visiting non–Tufts-affiliated dermatology clinics outside of the city. To our knowledge, no formal studies have been performed comparing wait times for dermatology appointments in suburban versus urban Boston areas; however, it has been reported that rural practitioners have longer wait times than urban dermatologists, possibly due to the fact that physicians tend to aggregate in metropolitan areas.2 Thus, the potential for shorter wait times in the Boston metropolitan area may make it a more desirable location to receive care compared to more suburban or even rural areas of Massachusetts, but additional data are needed to substantiate this hypothesis. Additionally, health insurance restrictions, refractory or complex dermatologic conditions, and referring providers’ preference may affect patients’ decisions to seek care at a particular clinic. However, these factors do not alter our finding that those who travel long distances to our dermatology clinic are less likely to stay with their current provider if given the choice to seek care closer to home/work or utilize teledermatology services.
Prior studies have demonstrated patient preference and willingness to accept alternative modes of care delivery to reduce time and monetary costs associated with in-person medical visits.7,8 Dermatology patients at a clinic in Ontario, Canada, considered the time they spent attending the clinic to be even more burdensome than the monetary cost.7 Patients with nondermatologic chronic diseases and high out-of-pocket costs would prefer email rather than a clinic visit as the first method of contact with care providers.8 The explosive growth of direct-to-consumer (DTC) teledermatology services in the last 10 years speaks to patient demand for alternative care delivery that saves time and money. Although telemedicine has been implemented in various specialties, including ophthalmology and neurology, one of the most common applications is teledermatology. With DTC teledermatology, patients can take photographs or videos using personal smartphones and communicate directly with care providers using mobile or online applications. More recent review articles have identified 22 to 29 DTC mobile and web-based teledermatology services, with costs varying from $0 to $250.9-11 The median consultation fee of $59 for DTC teledermatology services is substantially less than total visit costs for employed patients in our study.9 Teledermatology has become an accessible and affordable modality of care, though perhaps not yet fully optimized for quality of care.
With increasingly higher co-pays and high-deductible insurance plans, time and monetary factors play increasingly important roles in patient preference for specialty care providers,12 as demonstrated by our study. Dermatologists can work with patients to reduce the costs of medical visits. Perhaps monitoring of chronic but stable conditions can be accomplished through telecommunication to reduce the number of follow-up visits. For instance, psoriasis patients enrolled in telemonitoring perceived savings of time and expenses through reduction of clinic visits, resulting in high patient satisfaction levels.13 Telephone calls and secure email messaging are other feasible alternatives shown to aid in clinical management and decrease the need for in-person care.8,14 Fewer unnecessary follow-up visits also means more availability for new patients and those with acute needs.
Barriers to obtaining care are not limited to dermatology and are pervasive across most medical specialties. Issues of patient time burden and out-of-pocket expenses are reflected in recent reports focused on quantifying these costs throughout ambulatory care visits and services such as colorectal, cervical, and breast cancer screenings.1,15-18 Similar to our findings, many of these studies also show high time and opportunity costs from the patient perspective. Expansion of telemedicine to reduce patient costs is becoming a viable option for many specialists, though low reimbursement rates restrict its widespread application.9,19 However, this obstacle is not impossible to surmount. One study found that offering teledermatology to Medicaid patients through their primary care providers significantly improved access, allowing for a 63.8% increase in the number of patients visiting a dermatologist (P<.01).20 Currently, a total of 48 state Medicaid programs now cover telemedicine, and a growing number of states are requiring private insurers to cover telehealth services.21 As more dermatologists adopt telemedicine practices, it may allow for better access as well as expanded insurance coverage.
Limitations
The results of our study are limited by the single-institution survey design. Patients were asked to complete the survey while still at the clinic visit to minimize recall bias. Because these patients actually attended their appointments, they might perceive the time and monetary costs associated with the visit to be less problematic than those who canceled their appointments or transferred care elsewhere; however, we were still able to detect a significant impact of time and monetary costs on provider preference in this cohort (P<.05). Larger studies in different geographic settings and other specialty clinics are needed to confirm our findings and to determine if nonmonetary factors such as specific diagnoses, length of time with a certain care provider, or patient socioeconomic status can modulate the impact of time and monetary costs on provider preference.
Conclusion
This study showed that patients expend a substantial amount of time and monetary costs to attend dermatology clinic visits. Data from the current and prior studies suggest that these costs affect patient provider preference for dermatologic care and may pose barriers to necessary medical care. Recognizing direct and indirect patient costs may drive critical changes in health care delivery, such as increased telecommunication utilization, the more cost-saving alternative. Telemedicine, when integrated appropriately, can help minimize expenses for patients while continuing to maintain a high level of care.
- Ray KN, Chari AV, Engberg J, et al. Opportunity costs of ambulatory medical care in the United States. Am J Manag Care. 2015;21:567-574.
- Kimball AB, Resneck JS Jr. The US dermatology workforce: a specialty remains in shortage. J Am Acad Dermatol. 2008;59:741-745.
- Resneck JS Jr, Lipton S, Pletcher MJ. Short wait times for patients seeking cosmetic botulinum toxin appointments with dermatologists. J Am Acad Dermatol. 2007;57:985-989.
- Physician appointment wait times & Medicaid and Medicare acceptance rates. Merritt Hawkins website. https://www.merritthawkins.com/2014-survey/patientwaittime.aspx. Accessed February 15, 2017.
- Machlin SR, Adams SA. Expenses for office-based physician visits by specialty, 2013. Agency for Healthcare Research and Quality website. https://meps.ahrq.gov/data_files/publications/st484/stat484.pdf. Published November 2015. Accessed February 15, 2017.
- National ambulatory medical care survey: 2012 state and national summary tables. CDC website. www.cdc.gov/nchs/data/ahcd/namcs_summary/2012_namcs_web_tables.pdf. Accessed February 15, 2017.
- Vignjevic PM, Hux JE, Fisher BK, et al. Monetary and nonmonetary costs to patients attending an ambulatory dermatology clinic. J Cutan Med Surg. 1999;3:188-192.
- Reed M, Graetz I, Gordon N, Fung V. Patient-initiated e-mails to providers: associations with out-of-pocket visit costs, and impact on care-seeking and health. Am J Manag Care. 2015;21:E632-E639.
- Peart JM, Kovarik C. Direct-to-patient teledermatology practices. J Am Acad Dermatol. 2015;72:907-909.
- Fogel AL, Sarin KY. A survey of direct-to-consumer teledermatology services available to US patients: explosive growth, opportunities and controversy. J Telemed Telecare. 2017;23:19-25.
- Kochmann M, Locatis C. Direct to consumer mobile teledermatology apps: an exploratory study. Telemed J E Health. 2016;22:689-693.
- Helms AD. High-deductible health plans can ruin finances. Kaiser Health News website. https://khn.org/news/high-deductible-health-plans-can-ruin-finances/. Published April 6, 2015. Accessed February 15, 2017.
- Fruhauf J, Schwantzer G, Ambros-Rudolph CM, et al. Pilot study on the acceptance of mobile teledermatology for the home monitoring of high-need patients with psoriasis. Australas J Dermatol. 2012;53:41-46.
- Eisenberg D, Hwa K, Wren SM. Telephone follow-up by a midlevel provider after laparoscopic inguinal hernia repair instead of face-to-face clinic visit. JSLS. 2015;19:e2014.00205.
- Yabroff KR, Guy GP Jr, Ekwueme DU, et al. Annual patient time costs associated with medical care among cancer survivors in the United States. Med Care. 2014;52:594-601.
- Yabroff KR, Davis WW, Lamont EB, et al. Patient time costs associated with cancer care. J Natl Cancer Inst. 2007;99:14-23.
- Jonas DE, Russell LB, Sandler RS, et al. Value of patient time invested in the colonoscopy screening process: time requirements for colonoscopy study. Med Decis Making. 2008;28:56-65.
- Shireman TI, Tsevat J, Goldie SJ. Time costs associated with cervical cancer screening. Int J Technol Assess Health Care. 2001;17:146-152.
- Dorsey ER, Topol EJ. State of telehealth. N Engl J Med. 2016;375:154-161.
- Uscher-Pines L, Malsberger R, Burgette L, et al. Effect of teledermatology on access to dermatology care among Medicaid enrollees. JAMA Dermatol. 2016;152:905-912.
- Thomas L, Capistrant G. State telemedicine gaps analysis: coverage & reimbursement. Telehealth website. http://www.mtelehealth.com/state-telemedicine-gaps-analysis-coverage-reimbursement/. Published January 19, 2016. Accessed February 15, 2017.
Access to outpatient specialty care is notably limited due to time and out-of-pocket costs to patients, leading to patient dissatisfaction and worsened clinical outcomes. Lost time and earnings pose considerable opportunity costs for patients, with the total opportunity cost for all physician visits per year estimated at $52 billion in 2010 in the United States.1
The field of dermatology exemplifies the access issues patients may face when seeking specialty care given the ongoing national shortage of dermatologists and notably long wait times exceeding 60 days in major cities.2-4 With the high demand and limited number of providers, patients may have longer wait times to see dermatologists in their communities or have to travel further to see dermatologists in distant locations who have available appointments; therefore, patients may be subject to higher associated time, travel, and monetary costs. According to the 2013 Medical Expenditure Panel Survey, dermatology visits in the United States cost an average of $221 per visit compared to $166 for primary care. Dermatology visits had the highest median cost per office visit ($124) and were more often associated with out-of-pocket expenses (60.7%) compared to other specialties.5 Despite these high costs, the number of dermatology visits is increasing each year, with more than 38 million dermatology visits in 2012.6
In light of these factors that limit patient access to dermatologists compared to other specialists, we performed an evaluation of the direct and indirect costs to patients visiting an outpatient dermatology clinic in Boston, Massachusetts, to better understand obstacles to receiving dermatologic care. The impact that time and money have on how patients prefer to receive their care also was evaluated. Conducting this study in Boston may best reflect patient barriers to obtaining dermatologic treatment, as nationwide surveys have found that Boston has the highest cumulative average wait times for physician appointments compared to other US metropolitan cities, with an average wait time of 72 days to see a dermatologist.4 New studies of patient costs associated with dermatology clinic visits are lacking, and existing economic analyses rarely include time costs. Understanding time burden and opportunity costs from the patient perspective may motivate patients and physicians to alter how they receive and provide health care, respectively, to minimize these expenses. Advances in health care technology such as telecommunication may facilitate these changes.
Methods
Study Design
This survey study took place from October 1, 2015, to March 4, 2016, at the department of dermatology outpatient clinic of Tufts Medical Center, an academic university hospital located in downtown Boston, Massachusetts, with no satellite clinics. Five general dermatologists, 2 dermatologic surgeons, and 9 dermatology residents comprised the dermatology department. The study protocol and questionnaire received exemption status from the Tufts University Health Science’s institutional review board.
All adult patients (aged ≥18 years) attending a scheduled dermatology clinic visit within the designated time frame were invited to complete a questionnaire available in English, Spanish, or Chinese. Patients completed the questionnaire on paper or electronically using handheld tablets. Data were then compiled into the REDCap (Research Electronic Data Capture) online database. The questionnaire surveyed patient age; gender; ethnicity; language spoken; highest level of education; employment status; reason for visit (ie, skin condition); duration, cost, and mode of transportation; duration of visit including wait time; companion accompaniment; profession; hourly wage; and number of work hours requested off to attend the visit. Lastly, patients were surveyed on whether they prefer to receive dermatologic care at Tufts, to receive in-person care elsewhere, to use teledermatology, or none of the above.
Statistical Analysis
Total time attributed to the visit was the sum of time for round-trip travel to and from the clinic, wait time, and face-to-face time with care providers. Out-of-pocket patient expenses included round-trip travel expenses, child care expenses, and direct payments such as deductibles and co-pays. Opportunity cost for employed patients was calculated as the patient’s average hourly wage multiplied by either the number of hours taken off from work or the number of hours the patient attributed to the visit, whichever value was higher at the individual level. For the purpose of calculating opportunity costs, travel time, wait time, and face-to-face time were imputed using average values for these variables when not reported. Patients could provide exact hourly wage and annual income or select the closest approximation from 10 wage ranges. For patients who selected a wage range, the midpoint of the range was used as the hourly wage. Total costs were the sum of reported out-of-pocket expenses and calculated opportunity costs. For unemployed patients and those who did not report employment status, hourly wage was assumed to be $0, resulting in opportunity costs of $0. Costs are tabulated for individual patients and analyzed in aggregate.
Differences in patient characteristics between those who preferred their current care provider versus those who preferred to seek care elsewhere or via teledermatology were compared using the χ2 and Student t test. A multivariate logistic regression was then performed to identify predictors of patient preference for their current provider. Potential predictors for regression model were time and cost variables as well as factors selected based on results from bivariate analysis. Data analysis was performed using statistical software.
Results
Demographics
Demographic data for respondents are outlined in Table 1. Of 145 patients who completed the survey, the majority had already seen a dermatologist for their presenting condition (87.4%), and were English speaking (96.5%), white (76.6%), employed (59.4%), and male (50.3%), with a mean age (SD) of 52.3 (18.1) years and education level of 4-year university or higher (64.7%). The most common reasons for dermatology clinic attendance were general skin checks (30.8%) and psoriasis (26.6%). A smaller proportion of patients (16.1%) presented for surgical visits. Other less common conditions that brought patients into the clinic included acne (6.3%), eczema (4.9%), and skin rash (2.8%).
The mean (SD) reported hourly wage of employed patients was $36.60 (15.8). The most common reasons for unemployment were retirement (65.5% [38/58]), disability (10.3% [6/58]), and schooling (10.3% [6/58]).
Time Attributed to Attending Dermatology Clinic Visits
Time costs are reported in Table 2. Patients traveled to the clinic mainly by car (56.5% [78/138]) or train/subway (25.3% [35/138]). One in approximately 5 patients (21.3%) spent more than 1 hour traveling one-way to the clinic. Most patients waited less than 20 minutes to see their care providers. Face-to-face time with providers (ie, residents and attending physicians) ranged from less than 21 minutes to more than 1 hour, with a mean (SD) time of 36.8 (18.9) minutes.
Of the employed respondents, 76.5% (65/85) took off time from work for the appointment. Patients took a mean (SD) of 4.1 (2.4) hours off from work, which was considered sick pay (35%), paid time off (36.6%), or unpaid time (28.3%). The total mean (SD) time dedicated to attending the clinic appointment averaged 144.8 (60.47) minutes. On average, the time spent traveling for the clinic visit was double the amount of time spent with the care provider (77.4 vs 36.8 minutes).
Monetary and Opportunity Costs
The mean (SD) monetary cost associated with clinic attendance for employed patients who reported their wages was $187.50 (103.2)(range, $37.50–$489), most of which was opportunity cost from loss of potential work income (mean [SD], $144.30 [93.6]; range, $27–$432)(Table 3). Similar total and opportunity costs were found for employed patients using the imputed average wage. The mean (SD) total cost per visit for unemployed patients or those who did not report employment status was $38.65 (103.6)(range, $0–$800), which was 4-times less than the cost per visit for employed patients. Mean (SD) and median one-way travel expenses were $16.60 (40.5) and $10, respectively. Mean (SD) and median reported costs for deductibles/co-pays were $44.20 (66.1) and $25, respectively. Only 2 patients reported child care costs, which were valued at $65 and $75.
Patient Provider Preference
The majority (59.3% [67/113]) of patients preferred their current care providers, whereas 33.6% (38/113) preferred providers closer to work, home, or in a different unspecified setting. Only 7.0% (8/113) of patients who answered this survey question would choose teledermatology over their current providers.
On multivariate logistic regression (Table 4), patients who had additional out-of-pocket costs were significantly less likely to prefer their current care provider compared to patients with no out-of-pocket costs (odds ratio [OR], 0.27; 95% confidence interval [CI], 0.10-0.71; P<.05). Opportunity costs were not a significant predictor of provider preference. For every minute the travel time increased, the likelihood of preference for the current care provider decreased by 2% (OR, 0.98; 95% CI, 0.95–0.99), and patients who traveled 60 minutes or more round-trip were 71% less likely to choose current provider care than those who traveled less than 60 minutes (OR, 0.29; 95% CI, 0.09-0.96; P<.05). Patients with higher education (≥4 years of college) were 3.29-times more likely to stay with their current care provider than those with lower education (≤2 years of college). Those presenting for skin checks also preferred the current provider more than those with noninflammatory skin conditions such as alopecia and warts (OR, 9.01; 95% CI, 2.28-35.59). Age and gender were not statistically significant predictors of patient provider preference.
Comment
Our study revealed that patients spend a substantial amount of time and money attending dermatology clinic appointments. Round-trip travel time exceeded 2 hours for 20% of patients and accounted for the majority of the total time attributed to the visit. Patients who were employed typically requested an average of 4 hours off from work, resulting in a mean (SD) opportunity cost of $144.30 (93.6) due to lost wages. Direct costs such as co-pays, deductibles, travel expenses, and child care accounted for a smaller proportion of total costs. The study assumed a wage of $0 for unemployed patients, thus underestimating the true costs of the visit for these patients whose time may otherwise have been spent on leisure, education, volunteerism, or other activities that contribute to individual and societal productivity. The total costs for unemployed patients reflected only direct costs, and thus were notably lower than those for employed patients.
Direct out-of-pocket costs and travel time negatively impacted provider preference. Patients with out-of-pocket costs were much less likely to stay with their current care provider (OR, 0.27; 95% CI, 0.10-0.71), preferring to seek care closer to home/work or teledermatology services. Similarly, for each minute that travel time increased, preference for current care provider decreased by 2%. Those who traveled 60 minutes or more were 71% less likely than those who traveled less than 60 minutes to stay with their current provider when given other options for care. Opportunity costs did not affect provider preference, even though they far exceeded direct costs for employed patients. Perhaps opportunity costs are not as immediately apparent to patients as out-of-pocket costs and travel time, and thus they do not factor as heavily in provider preference.
Despite high time and monetary costs, the majority of patients (60%) still preferred their current care provider, especially those with 4-year university degrees or higher education level (OR, 3.29; 95% CI, 1.23-5.26) and those presenting for skin checks (OR, 9.01; 95% CI, 2.28-35.59). Patients with higher levels of education likely have higher incomes and thus may not be as adversely affected by direct and/or indirect visit costs. Patients presenting for skin checks may value continuity and prefer providers with whom they already have an established therapeutic relationship. Future studies are needed to analyze the impact of these nonmonetary factors on provider preference.
Seeking Alternative Care
Tufts Medical Center does not have satellite dermatology clinics, making it the only option for patients who wish to receive care within the Tufts hospital network. However, patients do have the option of visiting non–Tufts-affiliated dermatology clinics outside of the city. To our knowledge, no formal studies have been performed comparing wait times for dermatology appointments in suburban versus urban Boston areas; however, it has been reported that rural practitioners have longer wait times than urban dermatologists, possibly due to the fact that physicians tend to aggregate in metropolitan areas.2 Thus, the potential for shorter wait times in the Boston metropolitan area may make it a more desirable location to receive care compared to more suburban or even rural areas of Massachusetts, but additional data are needed to substantiate this hypothesis. Additionally, health insurance restrictions, refractory or complex dermatologic conditions, and referring providers’ preference may affect patients’ decisions to seek care at a particular clinic. However, these factors do not alter our finding that those who travel long distances to our dermatology clinic are less likely to stay with their current provider if given the choice to seek care closer to home/work or utilize teledermatology services.
Prior studies have demonstrated patient preference and willingness to accept alternative modes of care delivery to reduce time and monetary costs associated with in-person medical visits.7,8 Dermatology patients at a clinic in Ontario, Canada, considered the time they spent attending the clinic to be even more burdensome than the monetary cost.7 Patients with nondermatologic chronic diseases and high out-of-pocket costs would prefer email rather than a clinic visit as the first method of contact with care providers.8 The explosive growth of direct-to-consumer (DTC) teledermatology services in the last 10 years speaks to patient demand for alternative care delivery that saves time and money. Although telemedicine has been implemented in various specialties, including ophthalmology and neurology, one of the most common applications is teledermatology. With DTC teledermatology, patients can take photographs or videos using personal smartphones and communicate directly with care providers using mobile or online applications. More recent review articles have identified 22 to 29 DTC mobile and web-based teledermatology services, with costs varying from $0 to $250.9-11 The median consultation fee of $59 for DTC teledermatology services is substantially less than total visit costs for employed patients in our study.9 Teledermatology has become an accessible and affordable modality of care, though perhaps not yet fully optimized for quality of care.
With increasingly higher co-pays and high-deductible insurance plans, time and monetary factors play increasingly important roles in patient preference for specialty care providers,12 as demonstrated by our study. Dermatologists can work with patients to reduce the costs of medical visits. Perhaps monitoring of chronic but stable conditions can be accomplished through telecommunication to reduce the number of follow-up visits. For instance, psoriasis patients enrolled in telemonitoring perceived savings of time and expenses through reduction of clinic visits, resulting in high patient satisfaction levels.13 Telephone calls and secure email messaging are other feasible alternatives shown to aid in clinical management and decrease the need for in-person care.8,14 Fewer unnecessary follow-up visits also means more availability for new patients and those with acute needs.
Barriers to obtaining care are not limited to dermatology and are pervasive across most medical specialties. Issues of patient time burden and out-of-pocket expenses are reflected in recent reports focused on quantifying these costs throughout ambulatory care visits and services such as colorectal, cervical, and breast cancer screenings.1,15-18 Similar to our findings, many of these studies also show high time and opportunity costs from the patient perspective. Expansion of telemedicine to reduce patient costs is becoming a viable option for many specialists, though low reimbursement rates restrict its widespread application.9,19 However, this obstacle is not impossible to surmount. One study found that offering teledermatology to Medicaid patients through their primary care providers significantly improved access, allowing for a 63.8% increase in the number of patients visiting a dermatologist (P<.01).20 Currently, a total of 48 state Medicaid programs now cover telemedicine, and a growing number of states are requiring private insurers to cover telehealth services.21 As more dermatologists adopt telemedicine practices, it may allow for better access as well as expanded insurance coverage.
Limitations
The results of our study are limited by the single-institution survey design. Patients were asked to complete the survey while still at the clinic visit to minimize recall bias. Because these patients actually attended their appointments, they might perceive the time and monetary costs associated with the visit to be less problematic than those who canceled their appointments or transferred care elsewhere; however, we were still able to detect a significant impact of time and monetary costs on provider preference in this cohort (P<.05). Larger studies in different geographic settings and other specialty clinics are needed to confirm our findings and to determine if nonmonetary factors such as specific diagnoses, length of time with a certain care provider, or patient socioeconomic status can modulate the impact of time and monetary costs on provider preference.
Conclusion
This study showed that patients expend a substantial amount of time and monetary costs to attend dermatology clinic visits. Data from the current and prior studies suggest that these costs affect patient provider preference for dermatologic care and may pose barriers to necessary medical care. Recognizing direct and indirect patient costs may drive critical changes in health care delivery, such as increased telecommunication utilization, the more cost-saving alternative. Telemedicine, when integrated appropriately, can help minimize expenses for patients while continuing to maintain a high level of care.
- Ray KN, Chari AV, Engberg J, et al. Opportunity costs of ambulatory medical care in the United States. Am J Manag Care. 2015;21:567-574.
- Kimball AB, Resneck JS Jr. The US dermatology workforce: a specialty remains in shortage. J Am Acad Dermatol. 2008;59:741-745.
- Resneck JS Jr, Lipton S, Pletcher MJ. Short wait times for patients seeking cosmetic botulinum toxin appointments with dermatologists. J Am Acad Dermatol. 2007;57:985-989.
- Physician appointment wait times & Medicaid and Medicare acceptance rates. Merritt Hawkins website. https://www.merritthawkins.com/2014-survey/patientwaittime.aspx. Accessed February 15, 2017.
- Machlin SR, Adams SA. Expenses for office-based physician visits by specialty, 2013. Agency for Healthcare Research and Quality website. https://meps.ahrq.gov/data_files/publications/st484/stat484.pdf. Published November 2015. Accessed February 15, 2017.
- National ambulatory medical care survey: 2012 state and national summary tables. CDC website. www.cdc.gov/nchs/data/ahcd/namcs_summary/2012_namcs_web_tables.pdf. Accessed February 15, 2017.
- Vignjevic PM, Hux JE, Fisher BK, et al. Monetary and nonmonetary costs to patients attending an ambulatory dermatology clinic. J Cutan Med Surg. 1999;3:188-192.
- Reed M, Graetz I, Gordon N, Fung V. Patient-initiated e-mails to providers: associations with out-of-pocket visit costs, and impact on care-seeking and health. Am J Manag Care. 2015;21:E632-E639.
- Peart JM, Kovarik C. Direct-to-patient teledermatology practices. J Am Acad Dermatol. 2015;72:907-909.
- Fogel AL, Sarin KY. A survey of direct-to-consumer teledermatology services available to US patients: explosive growth, opportunities and controversy. J Telemed Telecare. 2017;23:19-25.
- Kochmann M, Locatis C. Direct to consumer mobile teledermatology apps: an exploratory study. Telemed J E Health. 2016;22:689-693.
- Helms AD. High-deductible health plans can ruin finances. Kaiser Health News website. https://khn.org/news/high-deductible-health-plans-can-ruin-finances/. Published April 6, 2015. Accessed February 15, 2017.
- Fruhauf J, Schwantzer G, Ambros-Rudolph CM, et al. Pilot study on the acceptance of mobile teledermatology for the home monitoring of high-need patients with psoriasis. Australas J Dermatol. 2012;53:41-46.
- Eisenberg D, Hwa K, Wren SM. Telephone follow-up by a midlevel provider after laparoscopic inguinal hernia repair instead of face-to-face clinic visit. JSLS. 2015;19:e2014.00205.
- Yabroff KR, Guy GP Jr, Ekwueme DU, et al. Annual patient time costs associated with medical care among cancer survivors in the United States. Med Care. 2014;52:594-601.
- Yabroff KR, Davis WW, Lamont EB, et al. Patient time costs associated with cancer care. J Natl Cancer Inst. 2007;99:14-23.
- Jonas DE, Russell LB, Sandler RS, et al. Value of patient time invested in the colonoscopy screening process: time requirements for colonoscopy study. Med Decis Making. 2008;28:56-65.
- Shireman TI, Tsevat J, Goldie SJ. Time costs associated with cervical cancer screening. Int J Technol Assess Health Care. 2001;17:146-152.
- Dorsey ER, Topol EJ. State of telehealth. N Engl J Med. 2016;375:154-161.
- Uscher-Pines L, Malsberger R, Burgette L, et al. Effect of teledermatology on access to dermatology care among Medicaid enrollees. JAMA Dermatol. 2016;152:905-912.
- Thomas L, Capistrant G. State telemedicine gaps analysis: coverage & reimbursement. Telehealth website. http://www.mtelehealth.com/state-telemedicine-gaps-analysis-coverage-reimbursement/. Published January 19, 2016. Accessed February 15, 2017.
Practice Points
- Physicians should be cognizant of the direct and indirect costs patients are subject to when attending dermatology clinic appointments and implement changes to reduce these costs.
- Telephone calls and secure email messaging are feasible alternatives shown to aid in clinical management and decrease the need for in-person care.
- Telecommunication may be used for the monitoring of chronic but stable conditions to reduce the number of follow-up visits.

The h-Index for Associate and Full Professors of Dermatology in the United States: An Epidemiologic Study of Scholastic Production
Academic promotion requires evidence of scholastic production. The number of publications by a scientist is the most frequently reported metric of scholastic production, but it does not account for the impact of publications. The h-index is a bibliometric measure that combines both volume and impact of scientific contributions. The physicist Jorge E. Hirsch introduced this metric in 2005.1 He defined it as the number of publications (h) by an author that have been cited at least h times. For example, a scientist with 30 publications including 12 that have been cited at least 12 times each has an h-index of 12. h-Index is a superior predictor of future scientific achievement in physics compared with total citation count, total publication count, and citations per publication. Hirsch2 proposed h-index thresholds of 12 and 18 for advancement to associate professor and full professor in physics, respectively.2
h-Index values are not comparable across academic disciplines because they are influenced by the number of journals and authors within the field. Scientists in disciplines with numerous scholars and publications will have higher h-indices. For example, the mean h-index for full professors of cardiothoracic anesthesiology is 12, but the mean h-index for full professors of urology is 22.3,4 Hence, h-index thresholds for professional advancement cannot be generalized but must be calculated on a granular, specialty-specific basis.
In a prior study on h-index among academic dermatologists in the United States, John et al5 reported that fellowship-trained dermatologists had a significantly higher mean h-index than those without fellowship training (13.2 vs 11.7; P<.001). They further found the mean h-index increased with academic rank.5
In our study, we measured mean and median h-indices among associate and full professors of dermatology in academic training programs in the United States with the goal of describing h-index distributions in these 2 academic ranks. We further sought to measure regional differences in h-index between northeastern, southern, central, and western states as defined by the National Resident Matching Program.
Methods
Institutional review board approval was deferred because the study did not require patient information or participation. Using the Association of American Medical Colleges Electronic Residency Application Service website (https://www.aamc.org/services/eras/) we identified dermatology residency training programs accredited by the Accreditation Council for Graduate Medical Education and participating in the Electronic Residency Application Service for the National Resident Matching Program in the United States. We visited the official website of each residency program and identified all associate and full professors of dermatology for further study. We included all faculty members listed as professor, clinical professor, associate professor, or clinical associate professor, and excluded assistant professor, volunteer faculty, research professor, and research associate professor. All faculty held an MD degree or an equivalent degree, such as MBBS or MDCM.
We used the Thomson Reuters (now Clarivate Analytics) Web of Science to calculate h-index and publication counts. The initial search was basic using the professor’s last name and first initial. We then augmented this list by searching for all variations of each professor’s name, with or without middle initial. Each publication in the search results was confirmed as belonging to the author of interest by verifying coauthors, institution information, and subject material. For authors with common names, we additionally consulted their online university profiles for specific names used in their “Selected Publications” lists. In a minority of cases, we also limited Research Domain to “dermatology.” Referring to the verified publication list for each dermatology professor, we used the Web of Science Citation Report function to determine number of publications and h-index for the individual. We tabulated results for associate and full professors and subgrouped those results into 4 geographic regions—northeastern, southern, central, and western states—according to the map used by the National Resident Matching Program. Descriptive statistics were performed with Microsoft Excel.
Results
We identified 300 associate professors and 352 full professors from 81 academic institutions. The number of associate professors per institution ranged from 1 to 25; the number of full professors per institution ranged from 1 to 16. The median and mean h-indices for associate and full professors, including interquartile values, are shown in the Table. There was a broad range of h-index scores among both academic ranks; median and mean h-indices varied more than 5-fold between the bottom and upper quartiles in both associate and full professor cohorts. Median interquartile h-index values for upper-quartile associate professors overlapped with those of lower-quartile full professors (Figure 1). h-Index for associate and full professors was similar across the 4 regions defined by the National Resident Matching Program. Median h-index was highest for full professors in western states and lowest for associate professors in southern states (Figure 2).
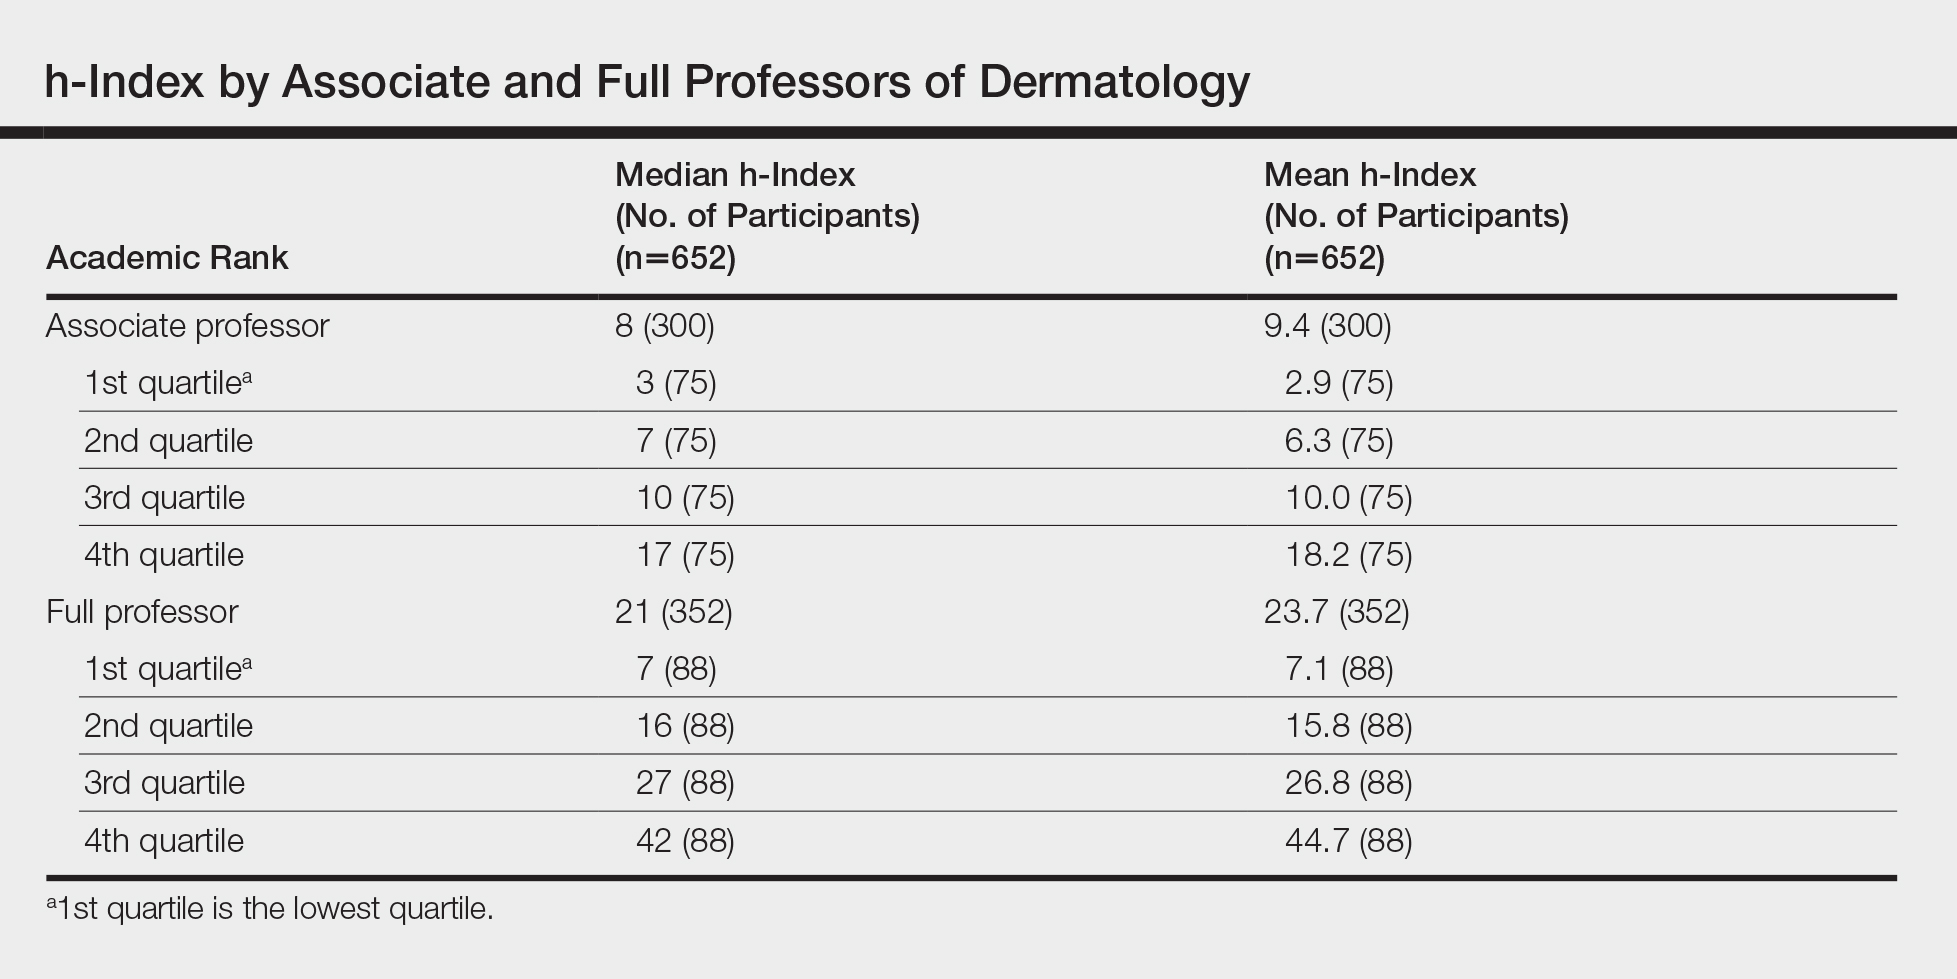
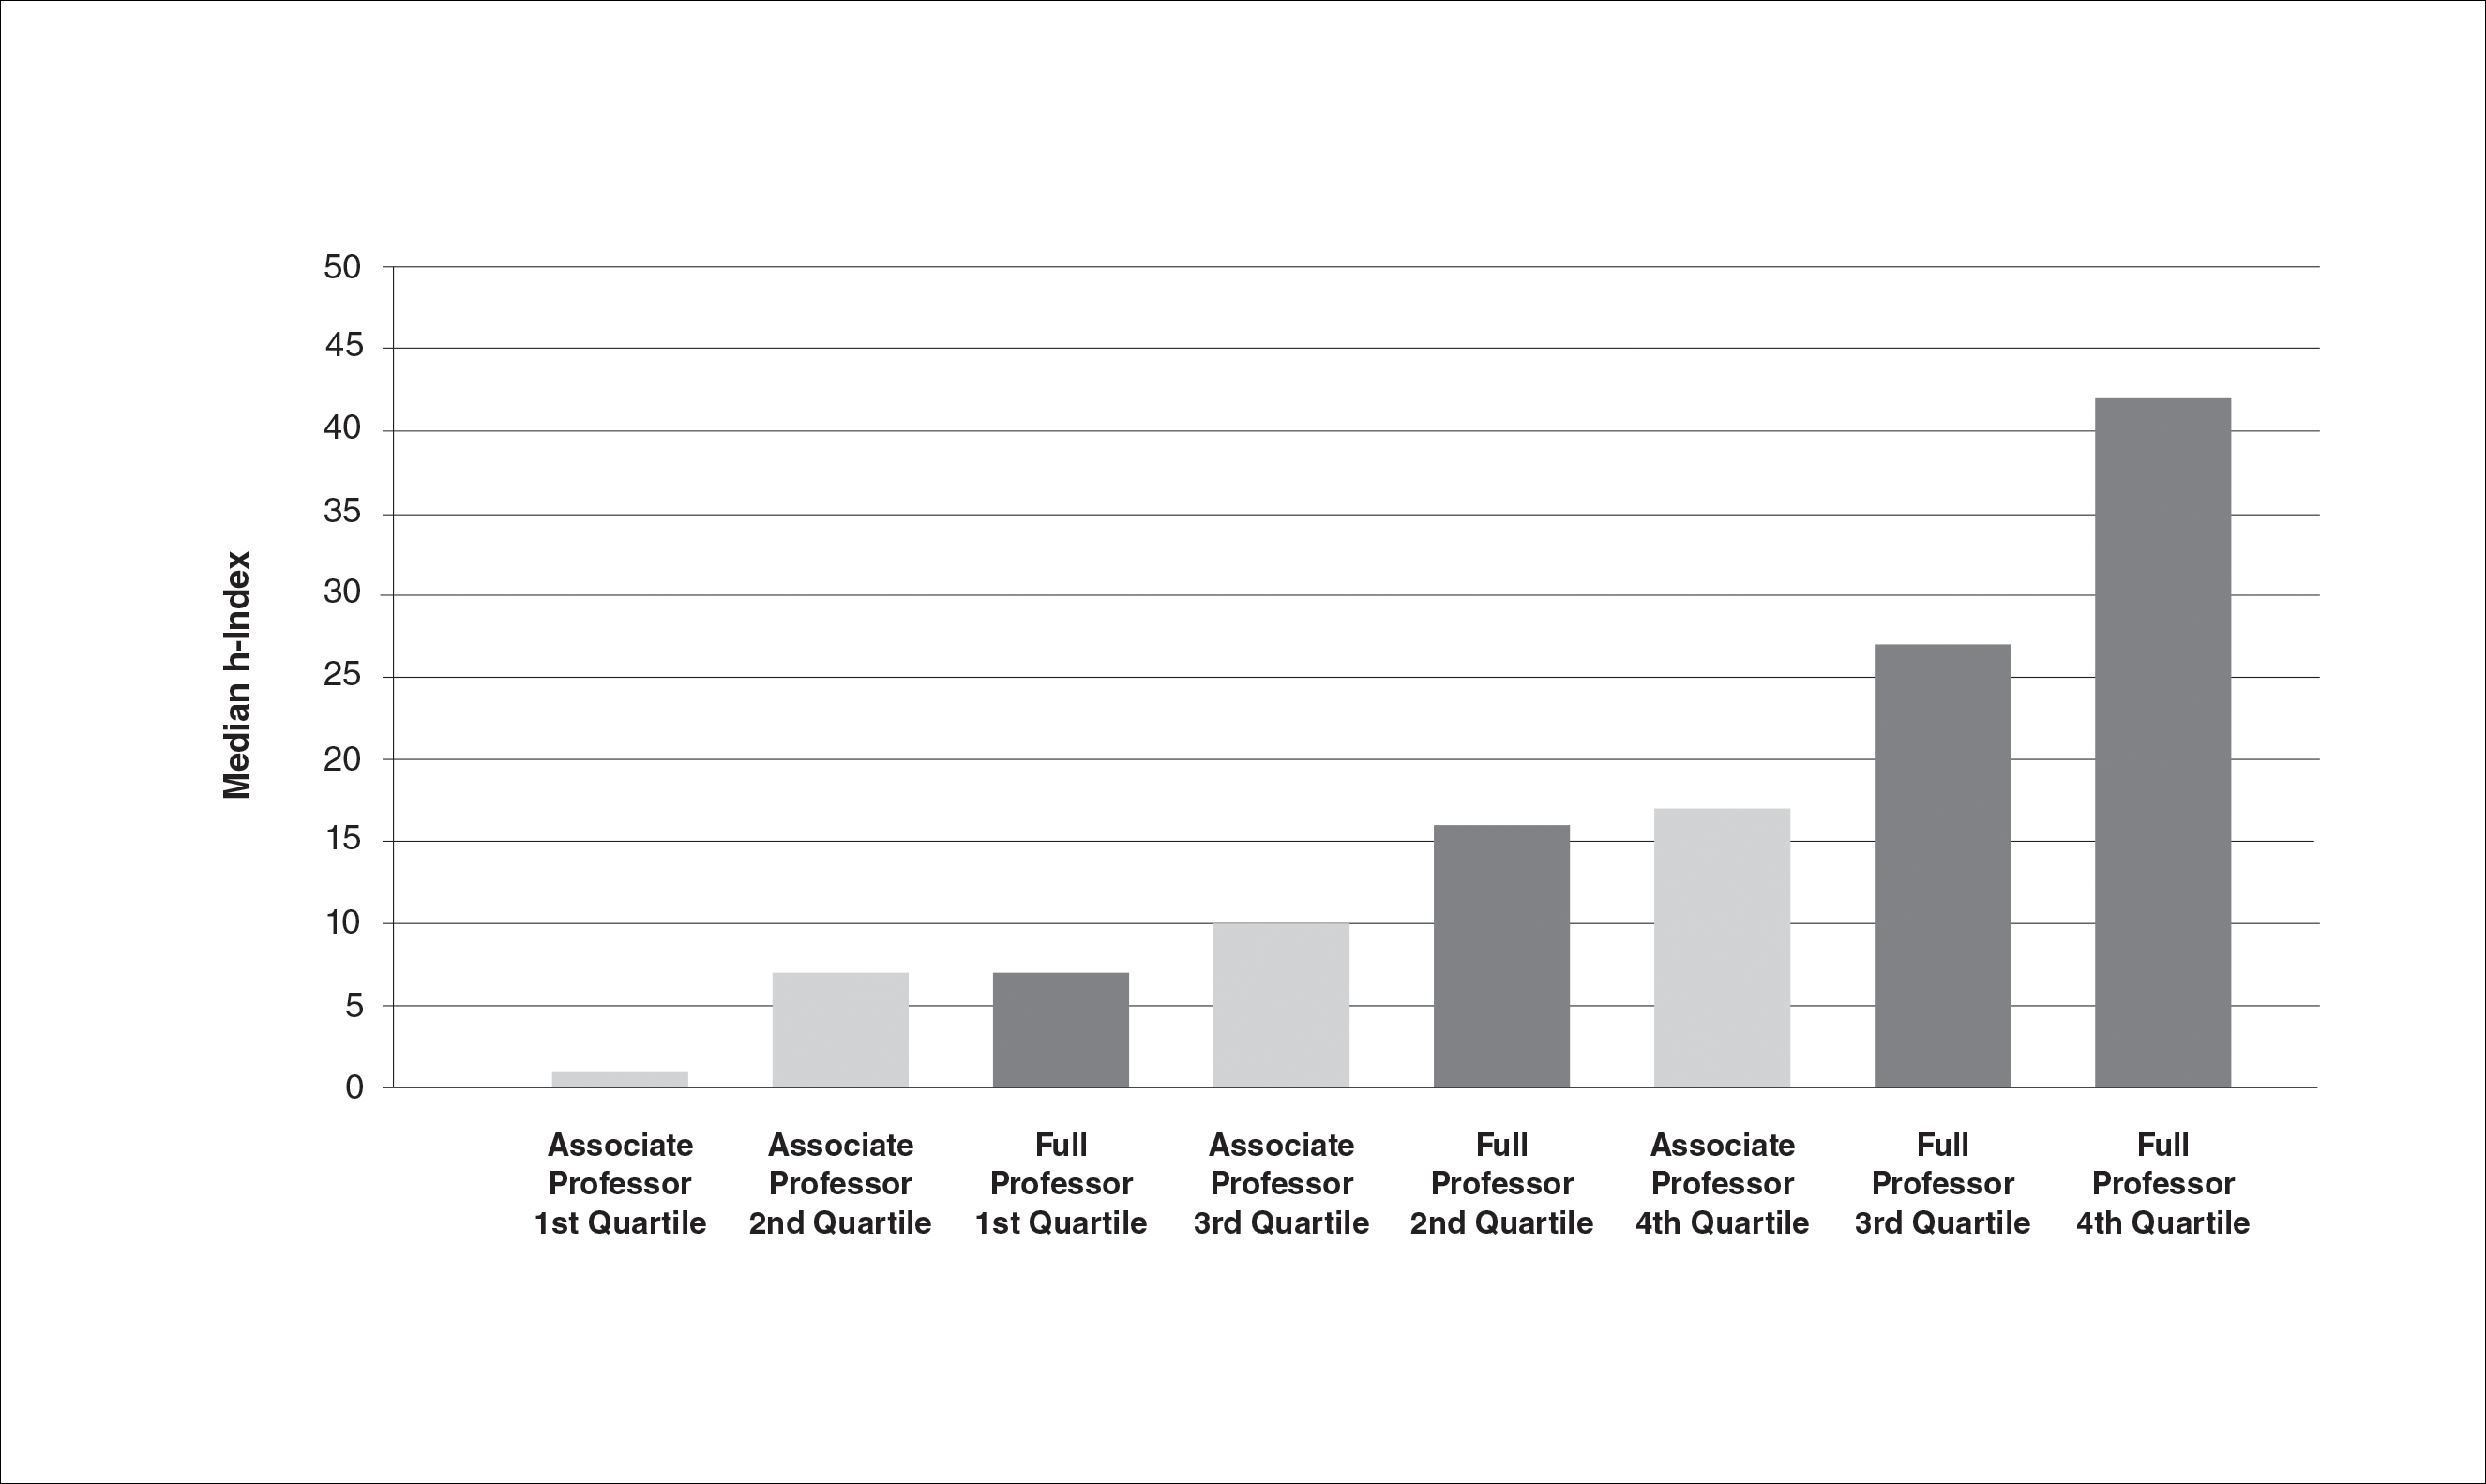

Comment
Professional advancement in academic medicine requires scholastic production. The h-index, defined as the number of publications (h) that have been cited at least h times, is a bibliometric measure that accounts for both volume and impact of an individual’s scientific productivity. The h-index would be a useful tool for determining professional advancement in academic dermatology departments. In this project, we calculated h-index values for 300 associate professors and 352 full professors of dermatology in the United States. We found the median h-index for associate professors was 8 and the median h-index for full professors was 21. There was more than a 5-fold variation in median and mean h-indices between lower and upper quartiles within both the associate and full professor cohorts. The highest median and mean h-indices were found among full professors of dermatology in western states. These results provide the opportunity for academic dermatologists and institutions to compare their research contributions with peers across the United States.
Our results support those of John et al5 who also found academic rank in dermatology was correlated with h-index. Scopus, Web of Science, and Google Scholar can be used to calculate h-index, but they may return different scores for the same individual.6 John et al5 used the Scopus database to calculate h-index. We used Web of Science because Scopus only includes citations since 1996 and Web of Science was used in the original h-index studies by Hirsch.1,2 Institutions that adopt h-index criteria for advancement and resource distribution decisions should be aware that database selection can affect h-index scores.
Caveats With the h-Index
Flaws in the h-index include inflationary effects of self-citation, time bias, and excessive coauthorship. Individuals can increase their h-index by routinely citing their own publications. However, Engqvist and Frommen7 found tripling self-citations increased the h-index by only 1.
Citations tend to increase with time, and authors who have been active for longer periods will have a higher h-index. It is more difficult for junior faculty to distinguish themselves with the h-index, as it takes time for even the most impactful publications to gain citations. Major scientific papers can take years from conception to publication, and an outstanding paper that is 1 year old would have fewer citations than an equally impactful paper that is 10 years old. To adjust for the effect of time bias, Hirsch2 proposed the m-index, in which the h-index is divided by the years between the author’s first and last publication. He proposed that an m-index of 1 would indicate a successful scientist, 2 an outstanding scientist, and 3 a unique individual.2
The literature is increasingly dominated by teams of coauthors, and the number of coauthors within each team has increased over the last 5 decades.8 h-Indices will increase if this trend continues, making it difficult to compare h-indices between different eras. Prosperi et al9 found national differences in kinship-based coauthorship, suggesting nepotism may influence decisions in assigning authorship status. h-Index valuations do not require evidence of meaningful contribution to the work but simply rely on contributors’ self-governance in assigning authorship status.
The h-index also has a bias against highly cited papers. A scientist with a small number of highly influential papers may have a smaller h-index than a scientist with more papers of modest impact. Finally, an author who has changed names (eg, due to marriage) may have an artificially low h-index, as a standard database search would miss publications under a maiden name.
Limitations
This study is limited by possible operator error when compiling each author’s publication list through Web of Science. Our search and refinement methodology took into account that authors may publish with slight variations in name, in various subject areas and fields, and with different institutions and coauthors. Each publication populated through Web of Science was carefully verified by the principal investigator; however, overestimation or underestimation of the number of publications and citations was possible, as the publication lists were not verified by the studied associate and full professors themselves. Our results are consistent with the h-index bar charts published by John et al5 using an alternate citation index, Scopus, which tends to corroborate our findings. This study also is limited by possible time bias because we did not correct the h-index for years of active publication (m-index).
Conclusion
In summary, we found the median h-index for associate professors was 8 and the median h-index for full professors was 21. We found a broad range of h-index values within each academic rank. h-Index for upper-quartile associate professors overlapped with those of lower-quartile full professors. Our results suggest professional advancement occurs over a broad range of scholastic production. Adopting requirements for minimum h-index thresholds for application for promotion might reduce disparities between rank and scientific contributions. We encourage use of the h-index for tracking academic progression and as a parameter to consider in academic promotion.
- Hirsch JE. An index to quantify an individual’s scientific research output. Proc Natl Acad Sci U S A. 2005;102:16569-16572.
- Hirsch JE. Does the H index have predictive power? Proc Natl Acad Sci U S A. 2007;104:19193-19198.
- Pagel PS, Hudetz JA. Scholarly productivity of United States academic cardiothoracic anesthesiologists: influence of fellowship accreditation and transesophageal echocardiographic credentials on h-index and other citation bibliometrics. J Cardiothorac Vasc Anesthesia. 2011;25:761-765.
- Benway BM, Kalidas P, Cabello JM, et al. Does citation analysis reveal association between h-index and academic rank in urology? Urology. 2009;74:30-33.
- John AM, Gupta AB, John ES, et al. The impact of fellowship training on scholarly productivity in academic dermatology. Cutis. 2016;97:353-358.
- Kulkarni AV, Aziz B, Shams I, et al. Comparisons of citations in Web of Science, Scopus, and Google Scholar for articles published in general medical journals. JAMA. 2009;302:1092-1096.
- Engqvist L, Frommen JG. The h-index and self-citations. Trends Ecol Evol. 2008;23:250-252.
- Wuchty S, Jones BF, Uzzi B. The increasing dominance of teams in production of knowledge. Science. 2007;316:1036-1039.
- Prosperi M, Buchan I, Fanti I, et al. Kin of coauthorship in five decades of health science literature. Proc Natl Acad Sci U S A. 2016;113:8957-8962.
Academic promotion requires evidence of scholastic production. The number of publications by a scientist is the most frequently reported metric of scholastic production, but it does not account for the impact of publications. The h-index is a bibliometric measure that combines both volume and impact of scientific contributions. The physicist Jorge E. Hirsch introduced this metric in 2005.1 He defined it as the number of publications (h) by an author that have been cited at least h times. For example, a scientist with 30 publications including 12 that have been cited at least 12 times each has an h-index of 12. h-Index is a superior predictor of future scientific achievement in physics compared with total citation count, total publication count, and citations per publication. Hirsch2 proposed h-index thresholds of 12 and 18 for advancement to associate professor and full professor in physics, respectively.2
h-Index values are not comparable across academic disciplines because they are influenced by the number of journals and authors within the field. Scientists in disciplines with numerous scholars and publications will have higher h-indices. For example, the mean h-index for full professors of cardiothoracic anesthesiology is 12, but the mean h-index for full professors of urology is 22.3,4 Hence, h-index thresholds for professional advancement cannot be generalized but must be calculated on a granular, specialty-specific basis.
In a prior study on h-index among academic dermatologists in the United States, John et al5 reported that fellowship-trained dermatologists had a significantly higher mean h-index than those without fellowship training (13.2 vs 11.7; P<.001). They further found the mean h-index increased with academic rank.5
In our study, we measured mean and median h-indices among associate and full professors of dermatology in academic training programs in the United States with the goal of describing h-index distributions in these 2 academic ranks. We further sought to measure regional differences in h-index between northeastern, southern, central, and western states as defined by the National Resident Matching Program.
Methods
Institutional review board approval was deferred because the study did not require patient information or participation. Using the Association of American Medical Colleges Electronic Residency Application Service website (https://www.aamc.org/services/eras/) we identified dermatology residency training programs accredited by the Accreditation Council for Graduate Medical Education and participating in the Electronic Residency Application Service for the National Resident Matching Program in the United States. We visited the official website of each residency program and identified all associate and full professors of dermatology for further study. We included all faculty members listed as professor, clinical professor, associate professor, or clinical associate professor, and excluded assistant professor, volunteer faculty, research professor, and research associate professor. All faculty held an MD degree or an equivalent degree, such as MBBS or MDCM.
We used the Thomson Reuters (now Clarivate Analytics) Web of Science to calculate h-index and publication counts. The initial search was basic using the professor’s last name and first initial. We then augmented this list by searching for all variations of each professor’s name, with or without middle initial. Each publication in the search results was confirmed as belonging to the author of interest by verifying coauthors, institution information, and subject material. For authors with common names, we additionally consulted their online university profiles for specific names used in their “Selected Publications” lists. In a minority of cases, we also limited Research Domain to “dermatology.” Referring to the verified publication list for each dermatology professor, we used the Web of Science Citation Report function to determine number of publications and h-index for the individual. We tabulated results for associate and full professors and subgrouped those results into 4 geographic regions—northeastern, southern, central, and western states—according to the map used by the National Resident Matching Program. Descriptive statistics were performed with Microsoft Excel.
Results
We identified 300 associate professors and 352 full professors from 81 academic institutions. The number of associate professors per institution ranged from 1 to 25; the number of full professors per institution ranged from 1 to 16. The median and mean h-indices for associate and full professors, including interquartile values, are shown in the Table. There was a broad range of h-index scores among both academic ranks; median and mean h-indices varied more than 5-fold between the bottom and upper quartiles in both associate and full professor cohorts. Median interquartile h-index values for upper-quartile associate professors overlapped with those of lower-quartile full professors (Figure 1). h-Index for associate and full professors was similar across the 4 regions defined by the National Resident Matching Program. Median h-index was highest for full professors in western states and lowest for associate professors in southern states (Figure 2).
Comment
Professional advancement in academic medicine requires scholastic production. The h-index, defined as the number of publications (h) that have been cited at least h times, is a bibliometric measure that accounts for both volume and impact of an individual’s scientific productivity. The h-index would be a useful tool for determining professional advancement in academic dermatology departments. In this project, we calculated h-index values for 300 associate professors and 352 full professors of dermatology in the United States. We found the median h-index for associate professors was 8 and the median h-index for full professors was 21. There was more than a 5-fold variation in median and mean h-indices between lower and upper quartiles within both the associate and full professor cohorts. The highest median and mean h-indices were found among full professors of dermatology in western states. These results provide the opportunity for academic dermatologists and institutions to compare their research contributions with peers across the United States.
Our results support those of John et al5 who also found academic rank in dermatology was correlated with h-index. Scopus, Web of Science, and Google Scholar can be used to calculate h-index, but they may return different scores for the same individual.6 John et al5 used the Scopus database to calculate h-index. We used Web of Science because Scopus only includes citations since 1996 and Web of Science was used in the original h-index studies by Hirsch.1,2 Institutions that adopt h-index criteria for advancement and resource distribution decisions should be aware that database selection can affect h-index scores.
Caveats With the h-Index
Flaws in the h-index include inflationary effects of self-citation, time bias, and excessive coauthorship. Individuals can increase their h-index by routinely citing their own publications. However, Engqvist and Frommen7 found tripling self-citations increased the h-index by only 1.
Citations tend to increase with time, and authors who have been active for longer periods will have a higher h-index. It is more difficult for junior faculty to distinguish themselves with the h-index, as it takes time for even the most impactful publications to gain citations. Major scientific papers can take years from conception to publication, and an outstanding paper that is 1 year old would have fewer citations than an equally impactful paper that is 10 years old. To adjust for the effect of time bias, Hirsch2 proposed the m-index, in which the h-index is divided by the years between the author’s first and last publication. He proposed that an m-index of 1 would indicate a successful scientist, 2 an outstanding scientist, and 3 a unique individual.2
The literature is increasingly dominated by teams of coauthors, and the number of coauthors within each team has increased over the last 5 decades.8 h-Indices will increase if this trend continues, making it difficult to compare h-indices between different eras. Prosperi et al9 found national differences in kinship-based coauthorship, suggesting nepotism may influence decisions in assigning authorship status. h-Index valuations do not require evidence of meaningful contribution to the work but simply rely on contributors’ self-governance in assigning authorship status.
The h-index also has a bias against highly cited papers. A scientist with a small number of highly influential papers may have a smaller h-index than a scientist with more papers of modest impact. Finally, an author who has changed names (eg, due to marriage) may have an artificially low h-index, as a standard database search would miss publications under a maiden name.
Limitations
This study is limited by possible operator error when compiling each author’s publication list through Web of Science. Our search and refinement methodology took into account that authors may publish with slight variations in name, in various subject areas and fields, and with different institutions and coauthors. Each publication populated through Web of Science was carefully verified by the principal investigator; however, overestimation or underestimation of the number of publications and citations was possible, as the publication lists were not verified by the studied associate and full professors themselves. Our results are consistent with the h-index bar charts published by John et al5 using an alternate citation index, Scopus, which tends to corroborate our findings. This study also is limited by possible time bias because we did not correct the h-index for years of active publication (m-index).
Conclusion
In summary, we found the median h-index for associate professors was 8 and the median h-index for full professors was 21. We found a broad range of h-index values within each academic rank. h-Index for upper-quartile associate professors overlapped with those of lower-quartile full professors. Our results suggest professional advancement occurs over a broad range of scholastic production. Adopting requirements for minimum h-index thresholds for application for promotion might reduce disparities between rank and scientific contributions. We encourage use of the h-index for tracking academic progression and as a parameter to consider in academic promotion.
- Hirsch JE. An index to quantify an individual’s scientific research output. Proc Natl Acad Sci U S A. 2005;102:16569-16572.
- Hirsch JE. Does the H index have predictive power? Proc Natl Acad Sci U S A. 2007;104:19193-19198.
- Pagel PS, Hudetz JA. Scholarly productivity of United States academic cardiothoracic anesthesiologists: influence of fellowship accreditation and transesophageal echocardiographic credentials on h-index and other citation bibliometrics. J Cardiothorac Vasc Anesthesia. 2011;25:761-765.
- Benway BM, Kalidas P, Cabello JM, et al. Does citation analysis reveal association between h-index and academic rank in urology? Urology. 2009;74:30-33.
- John AM, Gupta AB, John ES, et al. The impact of fellowship training on scholarly productivity in academic dermatology. Cutis. 2016;97:353-358.
- Kulkarni AV, Aziz B, Shams I, et al. Comparisons of citations in Web of Science, Scopus, and Google Scholar for articles published in general medical journals. JAMA. 2009;302:1092-1096.
- Engqvist L, Frommen JG. The h-index and self-citations. Trends Ecol Evol. 2008;23:250-252.
- Wuchty S, Jones BF, Uzzi B. The increasing dominance of teams in production of knowledge. Science. 2007;316:1036-1039.
- Prosperi M, Buchan I, Fanti I, et al. Kin of coauthorship in five decades of health science literature. Proc Natl Acad Sci U S A. 2016;113:8957-8962.
Practice Points
- Promotion in academic dermatology requires evidence of scholastic production. The h-index is a bibliometric measure that combines both volume and impact of scientific contributions.
- Our study’s findings provide data-driven parameters to consider in academic promotion.
- Institutions that adopt h-index criteria for advancement and resource distribution decisions should be aware that database selection can affect h-index scores.
How Exemplary Teaching Physicians Interact with Hospitalized Patients
Approximately a century ago, Francis Peabody taught that “the secret of the care of the patient is in caring for the patient.”1 His advice remains true today. Despite the advent of novel diagnostic tests, technologically sophisticated interventional procedures, and life-saving medications, perhaps the most important skill a bedside clinician can use is the ability to connect with patients.
The literature on patient-physician interaction is vast2-11 and generally indicates that exemplary bedside clinicians are able to interact well with patients by being competent, trustworthy, personable, empathetic, and effective communicators. “Etiquette-based medicine,” first proposed by Kahn,12 emphasizes the importance of certain behaviors from physicians, such as introducing yourself and
Yet, improving patient-physician interactions remains necessary. A recent systematic review reported that almost half of the reviewed studies on the patient-physician relationship published between 2000 and 2014 conveyed the idea that the patient-physician relationship is deteriorating.13
As part of a broader study to understand the behaviors and approaches of exemplary inpatient attending physicians,14-16 we examined how 12 carefully selected physicians interacted with their patients during inpatient teaching rounds.
METHODS
Overview
We conducted a multisite study using an exploratory, qualitative approach to inquiry, which has been described previously.14-16 Our primary purpose was to study the attributes and behaviors of outstanding general medicine attendings in the setting of inpatient rounds. The focus of this article is on the attendings’ interactions with patients.
We used a modified snowball sampling approach17 to identify 12 exemplary physicians. First, we contacted individuals throughout the United States who were known to the principal investigator (S.S.) and asked for suggestions of excellent clinician educators (also referred to as attendings) for potential inclusion in the study. In addition to these personal contacts, other individuals unknown to the investigative team were contacted and asked to provide suggestions for attendings to include in the study. Specifically, the US News & World Report 2015 Top Medical Schools: Research Rankings,18 which are widely used to represent the best U.S. hospitals, were reviewed in an effort to identify attendings from a broad range of medical schools. Using this list, we identified other medical schools that were in the top 25 and were not already represented. We contacted the division chiefs of general internal (or hospital) medicine, chairs and chiefs of departments of internal medicine, and internal medicine residency program directors from these medical schools and asked for recommendations of attendings from both within and outside their institutions whom they considered to be great inpatient teachers.
This sampling method resulted in 59 potential participants. An internet search was conducted on each potential participant to obtain further information about the individuals and their institutions. Both personal characteristics (medical education, training, and educational awards) and organizational characteristics (geographic location, hospital size and affiliation, and patient population) were considered so that a variety of organizations and backgrounds were represented. Through this process, the list was narrowed to 16 attendings who were contacted to participate in the study, of which 12 agreed. The number of attendings examined was appropriate because saturation of metathemes can occur in as little as 6 interviews, and data saturation occurs at 12 interviews.19 The participants were asked to provide a list of their current learners (ie, residents and medical students) and 6 to 10 former learners to contact for interviews and focus groups.
Data Collection
Observations
Two researchers conducted the one-day site visits. One was a physician (S.S.) and the other a medical anthropologist (M.H.), and both have extensive experience in qualitative methods. The only exception was the site visit at the principal investigator’s own institution, which was conducted by the medical anthropologist and a nonpracticing physician who was unknown to the participants. The team structure varied slightly among different institutions but in general was composed of 1 attending, 1 senior medical resident, 1 to 2 interns, and approximately 2 medical students. Each site visit began with observing the attendings (n = 12) and current learners (n = 57) on morning rounds, which included their interactions with patients. These observations lasted approximately 2 to 3 hours. The observers took handwritten field notes, paying particular attention to group interactions, teaching approaches, and patient interactions. The observers stood outside the medical team circle and remained silent during rounds so as to be unobtrusive to the teams’ discussions. The observers discussed and compared their notes after each site visit.
Interviews and Focus Groups
The research team also conducted individual, semistructured interviews with the attendings (n = 12), focus groups with their current teams (n = 46), and interviews or focus groups with their former learners (n = 26). Current learners were asked open-ended questions about their roles on the teams, their opinions of the attendings, and the care the attendings provide to their patients. Because they were observed during rounds, the researchers asked for clarification about specific interactions observed during the teaching rounds. Depending on availability and location, former learners either participated in in-person focus groups or interviews on the day of the site visit, or in a later telephone interview. All interviews and focus groups were audio recorded and transcribed.
This study was deemed to be exempt from regulation by the University of Michigan Institutional Review Board. All participants were informed that their participation was completely voluntary and that they could refuse to answer any question.
Data Analysis
Data were analyzed using a thematic analysis approach,20 which involves reading through the data to identify patterns (and create codes) that relate to behaviors, experiences, meanings, and activities. The patterns are then grouped into themes to help further explain the findings.21 The research team members (S.S. and M.H.) met after the first site visit and developed initial ideas about meanings and possible patterns. One team member (M.H.) read all the transcripts from the site visit and, based on the data, developed a codebook to be used for this study. This process was repeated after every site visit, and the coding definitions were refined as necessary. All transcripts were reviewed to apply any new codes when they developed. NVivo® 10 software (QSR International, Melbourne, Australia) was used to assist with the qualitative data analysis.
To ensure consistency and identify relationships between codes, code reports listing all the data linked to a specific code were generated after all the field notes and transcripts were coded. Once verified, codes were grouped based on similarities and relationships into prominent themes related to physician-patient interactions by 2 team members (S.S. and M.H.), though all members reviewed them and concurred.
RESULTS
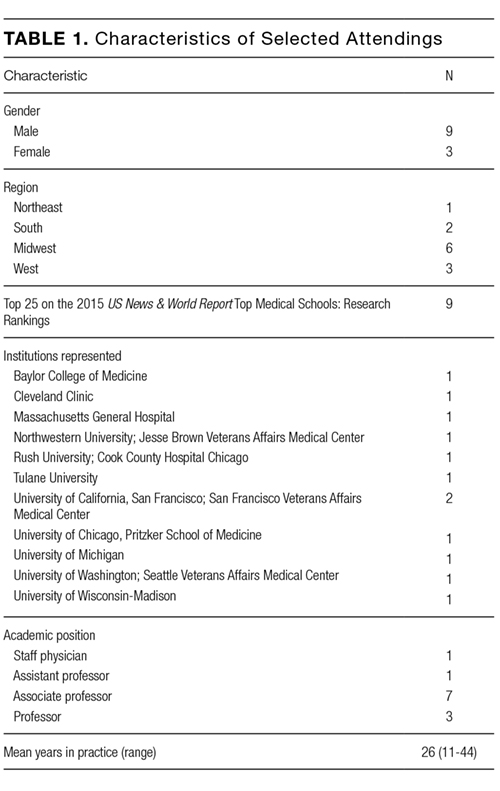
C are for the Patient’s Well-Being
The attendings we observed appeared to openly care for their patients’ well-being and were focused on the patients’ wants and needs. We noted that attendings were generally very attentive to the patients’ comfort. For example, we observed one attending sending the senior resident to find the patient’s nurse in order to obtain additional pain medications. The attending said to the patient several times, “I’m sorry you’re in so much pain.” When the team was leaving, she asked the intern to stay with the patient until the medications had been administered.
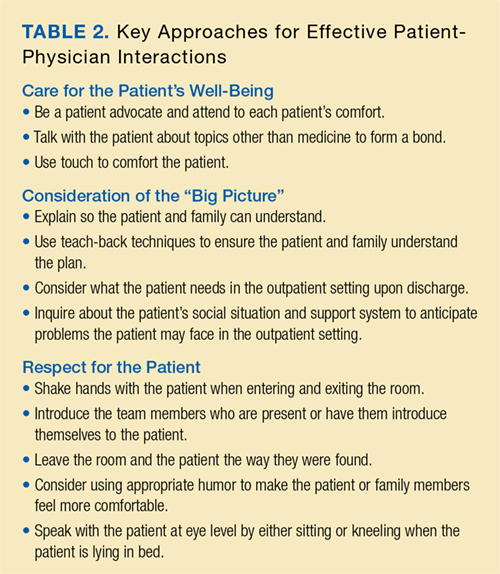
The attendings we observed could also be considered patient advocates, ensuring that patients received superb care. As one learner said about an attending who was attempting to have his patient listed for a liver transplant, “He is the biggest advocate for the patient that I have ever seen.” Regarding the balance between learning biomedical concepts and advocacy, another learner noted the following: “… there is always a teaching aspect, but he always makes sure that everything is taken care of for the patient…”
Building rapport creates and sustains bonds between people. Even though most of the attendings we observed primarily cared for hospitalized patients and had little long-term continuity with them, the attendings tended to take special care to talk with their patients about topics other than medicine to form a bond. This bonding between attending and patient was appreciated by learners. “Probably the most important thing I learned about patient care would be taking the time and really developing that relationship with patients,” said one of the former learners we interviewed. “There’s a question that he asks to a lot of our patients,” one learner told us, “especially our elderly patients, that [is], ‘What’s the most memorable moment in your life?’ So, he asks that question, and patient[s] open up and will share.”
The attendings often used touch to further solidify their relationships with their patients. We observed one attending who would touch her patients’ arms or knees when she was talking with them. Another attending would always shake the patient’s hand when leaving. Another attending would often lay his hand on the patient’s shoulder and help the patient sit up during the physical examination. Such humanistic behavior was noticed by learners. “She does a lot of comforting touch, particularly at the end of an exam,” said a current learner.
C onsideration of the “Big Picture”
Our exemplary attendings kept the “big picture” (that is, the patient’s overall medical and social needs) in clear focus. They behaved in a way to ensure that the patients understood the key points of their care and explained so the patients and families could understand. A current learner said, “[The attending] really makes sure that the patient understands what’s going on. And she always asks them, ‘What do you understand, what do you know, how can we fill in any blanks?’ And that makes the patient really involved in their own care, which I think is important.” This reflection was supported by direct observations. Attendings posed the following questions at the conclusion of patient interactions: “Tell me what you know.” “Tell me what our plan is.” “What did the lung doctors tell you yesterday?” These questions, which have been termed “teach-back” and are crucial for health literacy, were not meant to quiz the patient but rather to ensure the patient and family understood the plan.
We noticed that the attendings effectively explained clinical details and the plan of care to the patient while avoiding medical jargon. The following is an example of one interaction with a patient: “You threw up and created a tear in the food tube. Air got from that into the middle of the chest, not into the lungs. Air isn’t normally there. If it is just air, the body will reabsorb [it]... But we worry about bacteria getting in with the air. We need to figure out if it is an infection. We’re still trying to figure it out. Hang in there with us.” One learner commented, “… since we do bedside presentations, he has a great way of translating our gibberish, basically, to real language the patient understands.”
Finally, the attendings anticipated what patients would need in the outpatient setting. We observed that attendings stressed what the next steps would be during transitions of care. As one learner put it, “But he also thinks ahead; what do they need as an outpatient?” Another current learner commented on how another attending always asked about the social situations of his patients stating, “And then there is the social part of it. So, he is very much interested [in] where do they live? What is their support system? So, I think it has been a very holistic approach to patient care.”
R espect for the Patient
The attendings we observed were steadfastly respectful toward patients. As one attending told us, “The patient’s room is sacred space, and it’s a privilege for us to be there. And if we don’t earn that privilege, then we don’t get to go there.” We observed that the attendings generally referred to the patient as Mr. or Ms. (last name) rather than the patient’s first name unless the patient insisted. We also noticed that many of the attendings would introduce the team members to the patients or ask each member to introduce himself or herself. They also tended to leave the room and patient the way they were found, for example, by pushing the patient’s bedside table so that it was back within his or her reach or placing socks back onto the patient’s feet.
We noted that many of our attendings used appropriate humor with patients and families. As one learner explained, “I think Dr. [attending] makes most of our patients laugh during rounds. I don’t know if you noticed, but he really puts a smile on their face[s] whenever he walks in. … Maybe it would catch them off guard the first day, but after that, they are so happy to see him.”
Finally, we noticed that several of our attendings made sure to meet the patient at eye level during discussions by either kneeling or sitting on a chair. One of the attendings put it this way: “That’s a horrible power dynamic when you’re an inpatient and you’re sick and someone’s standing over you telling you things, and I like to be able to make eye contact with people, and often times that requires me to kneel down or to sit on a stool or to sit on the bed. … I feel like you’re able to connect with the people in a much better way…” Learners viewed this behavior favorably. As one told us, “[The attending] gets down to their level and makes sure that all of their questions are answered. So that is one thing that other attendings don’t necessarily do.”
DISCUSSION
In our national, qualitative study of 12 exemplary attending physicians, we found that these clinicians generally exhibited the following behaviors with patients. First, they were personable and caring and made significant attempts to connect with their patients. This occasionally took the form of using touch to comfort patients. Second, they tended to seek the “big picture” and tried to understand what patients would need upon hospital discharge. They communicated plans clearly to patients and families and inquired if those plans were understood. Finally, they showed respect toward their patients without fail. Such respect took many forms but included leaving the patient and room exactly as they were found and speaking with patients at eye level.
Our findings are largely consistent with other key studies in this field. Not surprisingly, the attendings we observed adhered to the major suggestions that Branch and colleagues2 put forth more than 15 years ago to improve the teaching of the humanistic dimension of the patient-physician relationship. Examples include greeting the patient, introducing team members and explaining each person’s role, asking open-ended questions, providing patient education, placing oneself at the same level as the patient, using appropriate touch, and being respectful. Weissmann et al.22 also found similar themes in their study of teaching physicians at 4 universities from 2003 to 2004. In that study, role-modeling was the primary method used by physician educators to teach the humanistic aspects of medical care, including nonverbal communication (eg, touch and eye contact), demonstration of respect, and building a personal connection with the patients.22In a focus group-based study performed at a teaching hospital in Boston, Ramani and Orlander23 concluded that both participating teachers and learners considered the patient’s bedside as a valuable venue to learn humanistic skills. Unfortunately, they also noted that there has been a decline in bedside teaching related to various factors, including documentation requirements and electronic medical records.23 Our attendings all demonstrated the value of teaching at a patient’s bedside. Not only could physical examination skills be demonstrated but role-modeling of interpersonal skills could be observed by learners.
Block and colleagues24 observed 29 interns in 732 patient encounters in 2 Baltimore training programs using Kahn’s “etiquette-based medicine” behaviors as a guide.12 They found that interns introduced themselves 40% of the time, explained their role 37% of the time, touched patients on 65% of visits (including as part of the physical examination), asked open-ended questions 75% of the time, and sat down with patients during only 9% of visits.24 Tackett et al.7 observed 24 hospitalists who collectively cared for 226 unique patients in 3 Baltimore-area hospitals. They found that each of the following behaviors was performed less than 30% of the time: explains role in care, shakes hand, and sits down.7 However, our attendings appeared to adhere to these behaviors to a much higher extent, though we did not quantify the interactions. This lends support to the notion that effective patient-physician interactions are the foundation of great teaching.
The attendings we observed (most of whom are inpatient based) tended to the contextual issues of the patients, such as their home environments and social support. Our exemplary physicians did what they could to ensure that patients received the appropriate follow-up care upon discharge.
Our study has important limitations. First, it was conducted in a limited number of US hospitals. The institutions represented were generally large, research-intensive, academic medical centers. Therefore, our findings may not apply to settings that are different from the hospitals studied. Second, our study included only 12 attendings and their learners, which may also limit the study’s generalizability. Third, we focused exclusively on teaching within general medicine rounds. Thus, our findings may not be generalizable to other subspecialties. Fourth, attendings were selected through a nonexhaustive method, increasing the potential for selection bias. However, the multisite design, the modified snowball sampling, and the inclusion of several types of institutions in the final participant pool introduced diversity to the final list. Former-learner responses were subject to recall bias. Finally, the study design is susceptible to observer bias. Attempts to reduce this included the diversity of the observers (ie, both a clinician and a nonclinician, the latter of whom was unfamiliar with medical education) and review of the data and coding by multiple research team members to ensure validity. Although we cannot discount the potential role of a Hawthorne effect on our data collection, the research team attempted to mitigate this by standing apart from the care teams and remaining unobtrusive during observations.
Limitations notwithstanding, we believe that our multisite study is important given the longstanding imperative to improve patient-physician interactions. We found empirical support for behaviors proposed by Branch and colleagues2 and Kahn12 in order to enhance these relationships. While others have studied attendings and their current learners,22 we add to the literature by also examining former learners’ perspectives on how the attendings’ teaching and role-modeling have created and sustained a lasting impact. The key findings of our national, qualitative study (care for the patient’s well-being, consideration of the “big picture,” and respect for the patient) can be readily adopted and honed by physicians to improve their interactions with hospitalized patients.
A cknowledgments
The findings and conclusions in this report are those of the authors and do not necessarily represent the official position of the US Department of Veterans Affairs.
F unding
Dr. Saint provided funding for this study using a University of Michigan endowment.
Disclosure
The authors declare no conflicts of interest.
1. Peabody FW. The care of the patient. JAMA. 1927;88(12):877-882. PubMed
2. Branch WT, Jr., Kern D, Haidet P, et al. The patient-physician relationship. Teaching the human dimensions of care in clinical settings. JAMA. 2001;286(9):1067-1074. PubMed
3. Frankel RM. Relationship-centered care and the patient-physician relationship. J Gen Intern Med. 2004;19(11):1163-1165. PubMed
4. Stewart MA. Effective physician-patient communication and health outcomes: a review. CMAJ. 1995;152(9):1423-1433. PubMed
5. Osmun WE, Brown JB, Stewart M, Graham S. Patients’ attitudes to comforting touch in family practice. Can Fam Physician. 2000;46:2411-2416. PubMed
6. Strasser F, Palmer JL, Willey J, et al. Impact of physician sitting versus standing during inpatient oncology consultations: patients’ preference and perception of compassion and duration. A randomized controlled trial. J Pain Symptom Manage. 2005;29(5):489-497. PubMed
7. Tackett S, Tad-y D, Rios R, Kisuule F, Wright S. Appraising the practice of etiquette-based medicine in the inpatient setting. J Gen Intern Med. 2013;28(7):908-913. PubMed
8. Gallagher TH, Levinson W. A prescription for protecting the doctor-patient relationship. Am J Manag Care. 2004;10(2, pt 1):61-68. PubMed
9. Braddock CH, 3rd, Snyder L. The doctor will see you shortly. The ethical significance of time for the patient-physician relationship. J Gen Intern Med. 2005;20(11):1057-1062. PubMed
10. Ong LM, de Haes JC, Hoos AM, Lammes FB. Doctor-patient communication: a review of the literature. Soc Sci Med. 1995;40(7):903-918. PubMed
11. Lee SJ, Back AL, Block SD, Stewart SK. Enhancing physician-patient communication. Hematology Am Soc Hematol Educ Program. 2002:464-483. PubMed
12. Kahn MW. Etiquette-based medicine. N Engl J Med. 2008;358(19):1988-1989. PubMed
13. Hoff T, Collinson GE. How Do We Talk About the Physician-Patient Relationship? What the Nonempirical Literature Tells Us. Med Care Res Rev. 2016. PubMed
14. Houchens N, Harrod M, Moody S, Fowler KE, Saint S. Techniques and behaviors associated with exemplary inpatient general medicine teaching: an exploratory qualitative study. J Hosp Med. 2017;12(7):503-509. PubMed
15. Houchens N, Harrod M, Fowler KE, Moody S., Saint S. Teaching “how” to think instead of “what” to think: how great inpatient physicians foster clinical reasoning. Am J Med. In Press.
16. Harrod M, Saint S, Stock RW. Teaching Inpatient Medicine: What Every Physician Needs to Know. New York, NY: Oxford University Press; 2017.
17. Richards L, Morse J. README FIRST for a User’s Guide to Qualitative Methods. 3rd ed. Los Angeles, CA: SAGE Publications Inc; 2013.
18. US News and World Report. Best Medical Schools: Research. 2014; http://grad-schools.usnews.rankingsandreviews.com/best-graduate-schools/top-medical-schools/research-rankings. Accessed on September 16, 2016.
19. Guest G, Bunce A, Johnson L. How many interviews are enough? An experiment with data saturation and variability. Field Methods. 2006;18(1):59-82.
20. Braun V, Clarke V. Using thematic analysis in psychology. Qual Res Psychol. 2006;3(2):77-101. PubMed
21. Aronson J. A pragmatic view of thematic analysis. Qual Rep. 1995;2(1):1-3.
22. Weissmann PF, Branch WT, Gracey CF, Haidet P, Frankel RM. Role modeling humanistic behavior: learning bedside manner from the experts. Acad Med. 2006;81(7):661-667. PubMed
23. Ramani S, Orlander JD. Human dimensions in bedside teaching: focus group discussions of teachers and learners. Teach Learn Med. 2013;25(4):312-318. PubMed
24. Block L, Hutzler L, Habicht R, et al. Do internal medicine interns practice etiquette-based communication? A critical look at the inpatient encounter. J Hosp Med. 2013;8(11):631-634. PubMed
Approximately a century ago, Francis Peabody taught that “the secret of the care of the patient is in caring for the patient.”1 His advice remains true today. Despite the advent of novel diagnostic tests, technologically sophisticated interventional procedures, and life-saving medications, perhaps the most important skill a bedside clinician can use is the ability to connect with patients.
The literature on patient-physician interaction is vast2-11 and generally indicates that exemplary bedside clinicians are able to interact well with patients by being competent, trustworthy, personable, empathetic, and effective communicators. “Etiquette-based medicine,” first proposed by Kahn,12 emphasizes the importance of certain behaviors from physicians, such as introducing yourself and
Yet, improving patient-physician interactions remains necessary. A recent systematic review reported that almost half of the reviewed studies on the patient-physician relationship published between 2000 and 2014 conveyed the idea that the patient-physician relationship is deteriorating.13
As part of a broader study to understand the behaviors and approaches of exemplary inpatient attending physicians,14-16 we examined how 12 carefully selected physicians interacted with their patients during inpatient teaching rounds.
METHODS
Overview
We conducted a multisite study using an exploratory, qualitative approach to inquiry, which has been described previously.14-16 Our primary purpose was to study the attributes and behaviors of outstanding general medicine attendings in the setting of inpatient rounds. The focus of this article is on the attendings’ interactions with patients.
We used a modified snowball sampling approach17 to identify 12 exemplary physicians. First, we contacted individuals throughout the United States who were known to the principal investigator (S.S.) and asked for suggestions of excellent clinician educators (also referred to as attendings) for potential inclusion in the study. In addition to these personal contacts, other individuals unknown to the investigative team were contacted and asked to provide suggestions for attendings to include in the study. Specifically, the US News & World Report 2015 Top Medical Schools: Research Rankings,18 which are widely used to represent the best U.S. hospitals, were reviewed in an effort to identify attendings from a broad range of medical schools. Using this list, we identified other medical schools that were in the top 25 and were not already represented. We contacted the division chiefs of general internal (or hospital) medicine, chairs and chiefs of departments of internal medicine, and internal medicine residency program directors from these medical schools and asked for recommendations of attendings from both within and outside their institutions whom they considered to be great inpatient teachers.
This sampling method resulted in 59 potential participants. An internet search was conducted on each potential participant to obtain further information about the individuals and their institutions. Both personal characteristics (medical education, training, and educational awards) and organizational characteristics (geographic location, hospital size and affiliation, and patient population) were considered so that a variety of organizations and backgrounds were represented. Through this process, the list was narrowed to 16 attendings who were contacted to participate in the study, of which 12 agreed. The number of attendings examined was appropriate because saturation of metathemes can occur in as little as 6 interviews, and data saturation occurs at 12 interviews.19 The participants were asked to provide a list of their current learners (ie, residents and medical students) and 6 to 10 former learners to contact for interviews and focus groups.
Data Collection
Observations
Two researchers conducted the one-day site visits. One was a physician (S.S.) and the other a medical anthropologist (M.H.), and both have extensive experience in qualitative methods. The only exception was the site visit at the principal investigator’s own institution, which was conducted by the medical anthropologist and a nonpracticing physician who was unknown to the participants. The team structure varied slightly among different institutions but in general was composed of 1 attending, 1 senior medical resident, 1 to 2 interns, and approximately 2 medical students. Each site visit began with observing the attendings (n = 12) and current learners (n = 57) on morning rounds, which included their interactions with patients. These observations lasted approximately 2 to 3 hours. The observers took handwritten field notes, paying particular attention to group interactions, teaching approaches, and patient interactions. The observers stood outside the medical team circle and remained silent during rounds so as to be unobtrusive to the teams’ discussions. The observers discussed and compared their notes after each site visit.
Interviews and Focus Groups
The research team also conducted individual, semistructured interviews with the attendings (n = 12), focus groups with their current teams (n = 46), and interviews or focus groups with their former learners (n = 26). Current learners were asked open-ended questions about their roles on the teams, their opinions of the attendings, and the care the attendings provide to their patients. Because they were observed during rounds, the researchers asked for clarification about specific interactions observed during the teaching rounds. Depending on availability and location, former learners either participated in in-person focus groups or interviews on the day of the site visit, or in a later telephone interview. All interviews and focus groups were audio recorded and transcribed.
This study was deemed to be exempt from regulation by the University of Michigan Institutional Review Board. All participants were informed that their participation was completely voluntary and that they could refuse to answer any question.
Data Analysis
Data were analyzed using a thematic analysis approach,20 which involves reading through the data to identify patterns (and create codes) that relate to behaviors, experiences, meanings, and activities. The patterns are then grouped into themes to help further explain the findings.21 The research team members (S.S. and M.H.) met after the first site visit and developed initial ideas about meanings and possible patterns. One team member (M.H.) read all the transcripts from the site visit and, based on the data, developed a codebook to be used for this study. This process was repeated after every site visit, and the coding definitions were refined as necessary. All transcripts were reviewed to apply any new codes when they developed. NVivo® 10 software (QSR International, Melbourne, Australia) was used to assist with the qualitative data analysis.
To ensure consistency and identify relationships between codes, code reports listing all the data linked to a specific code were generated after all the field notes and transcripts were coded. Once verified, codes were grouped based on similarities and relationships into prominent themes related to physician-patient interactions by 2 team members (S.S. and M.H.), though all members reviewed them and concurred.
RESULTS
C are for the Patient’s Well-Being
The attendings we observed appeared to openly care for their patients’ well-being and were focused on the patients’ wants and needs. We noted that attendings were generally very attentive to the patients’ comfort. For example, we observed one attending sending the senior resident to find the patient’s nurse in order to obtain additional pain medications. The attending said to the patient several times, “I’m sorry you’re in so much pain.” When the team was leaving, she asked the intern to stay with the patient until the medications had been administered.
The attendings we observed could also be considered patient advocates, ensuring that patients received superb care. As one learner said about an attending who was attempting to have his patient listed for a liver transplant, “He is the biggest advocate for the patient that I have ever seen.” Regarding the balance between learning biomedical concepts and advocacy, another learner noted the following: “… there is always a teaching aspect, but he always makes sure that everything is taken care of for the patient…”
Building rapport creates and sustains bonds between people. Even though most of the attendings we observed primarily cared for hospitalized patients and had little long-term continuity with them, the attendings tended to take special care to talk with their patients about topics other than medicine to form a bond. This bonding between attending and patient was appreciated by learners. “Probably the most important thing I learned about patient care would be taking the time and really developing that relationship with patients,” said one of the former learners we interviewed. “There’s a question that he asks to a lot of our patients,” one learner told us, “especially our elderly patients, that [is], ‘What’s the most memorable moment in your life?’ So, he asks that question, and patient[s] open up and will share.”
The attendings often used touch to further solidify their relationships with their patients. We observed one attending who would touch her patients’ arms or knees when she was talking with them. Another attending would always shake the patient’s hand when leaving. Another attending would often lay his hand on the patient’s shoulder and help the patient sit up during the physical examination. Such humanistic behavior was noticed by learners. “She does a lot of comforting touch, particularly at the end of an exam,” said a current learner.
C onsideration of the “Big Picture”
Our exemplary attendings kept the “big picture” (that is, the patient’s overall medical and social needs) in clear focus. They behaved in a way to ensure that the patients understood the key points of their care and explained so the patients and families could understand. A current learner said, “[The attending] really makes sure that the patient understands what’s going on. And she always asks them, ‘What do you understand, what do you know, how can we fill in any blanks?’ And that makes the patient really involved in their own care, which I think is important.” This reflection was supported by direct observations. Attendings posed the following questions at the conclusion of patient interactions: “Tell me what you know.” “Tell me what our plan is.” “What did the lung doctors tell you yesterday?” These questions, which have been termed “teach-back” and are crucial for health literacy, were not meant to quiz the patient but rather to ensure the patient and family understood the plan.
We noticed that the attendings effectively explained clinical details and the plan of care to the patient while avoiding medical jargon. The following is an example of one interaction with a patient: “You threw up and created a tear in the food tube. Air got from that into the middle of the chest, not into the lungs. Air isn’t normally there. If it is just air, the body will reabsorb [it]... But we worry about bacteria getting in with the air. We need to figure out if it is an infection. We’re still trying to figure it out. Hang in there with us.” One learner commented, “… since we do bedside presentations, he has a great way of translating our gibberish, basically, to real language the patient understands.”
Finally, the attendings anticipated what patients would need in the outpatient setting. We observed that attendings stressed what the next steps would be during transitions of care. As one learner put it, “But he also thinks ahead; what do they need as an outpatient?” Another current learner commented on how another attending always asked about the social situations of his patients stating, “And then there is the social part of it. So, he is very much interested [in] where do they live? What is their support system? So, I think it has been a very holistic approach to patient care.”
R espect for the Patient
The attendings we observed were steadfastly respectful toward patients. As one attending told us, “The patient’s room is sacred space, and it’s a privilege for us to be there. And if we don’t earn that privilege, then we don’t get to go there.” We observed that the attendings generally referred to the patient as Mr. or Ms. (last name) rather than the patient’s first name unless the patient insisted. We also noticed that many of the attendings would introduce the team members to the patients or ask each member to introduce himself or herself. They also tended to leave the room and patient the way they were found, for example, by pushing the patient’s bedside table so that it was back within his or her reach or placing socks back onto the patient’s feet.
We noted that many of our attendings used appropriate humor with patients and families. As one learner explained, “I think Dr. [attending] makes most of our patients laugh during rounds. I don’t know if you noticed, but he really puts a smile on their face[s] whenever he walks in. … Maybe it would catch them off guard the first day, but after that, they are so happy to see him.”
Finally, we noticed that several of our attendings made sure to meet the patient at eye level during discussions by either kneeling or sitting on a chair. One of the attendings put it this way: “That’s a horrible power dynamic when you’re an inpatient and you’re sick and someone’s standing over you telling you things, and I like to be able to make eye contact with people, and often times that requires me to kneel down or to sit on a stool or to sit on the bed. … I feel like you’re able to connect with the people in a much better way…” Learners viewed this behavior favorably. As one told us, “[The attending] gets down to their level and makes sure that all of their questions are answered. So that is one thing that other attendings don’t necessarily do.”
DISCUSSION
In our national, qualitative study of 12 exemplary attending physicians, we found that these clinicians generally exhibited the following behaviors with patients. First, they were personable and caring and made significant attempts to connect with their patients. This occasionally took the form of using touch to comfort patients. Second, they tended to seek the “big picture” and tried to understand what patients would need upon hospital discharge. They communicated plans clearly to patients and families and inquired if those plans were understood. Finally, they showed respect toward their patients without fail. Such respect took many forms but included leaving the patient and room exactly as they were found and speaking with patients at eye level.
Our findings are largely consistent with other key studies in this field. Not surprisingly, the attendings we observed adhered to the major suggestions that Branch and colleagues2 put forth more than 15 years ago to improve the teaching of the humanistic dimension of the patient-physician relationship. Examples include greeting the patient, introducing team members and explaining each person’s role, asking open-ended questions, providing patient education, placing oneself at the same level as the patient, using appropriate touch, and being respectful. Weissmann et al.22 also found similar themes in their study of teaching physicians at 4 universities from 2003 to 2004. In that study, role-modeling was the primary method used by physician educators to teach the humanistic aspects of medical care, including nonverbal communication (eg, touch and eye contact), demonstration of respect, and building a personal connection with the patients.22In a focus group-based study performed at a teaching hospital in Boston, Ramani and Orlander23 concluded that both participating teachers and learners considered the patient’s bedside as a valuable venue to learn humanistic skills. Unfortunately, they also noted that there has been a decline in bedside teaching related to various factors, including documentation requirements and electronic medical records.23 Our attendings all demonstrated the value of teaching at a patient’s bedside. Not only could physical examination skills be demonstrated but role-modeling of interpersonal skills could be observed by learners.
Block and colleagues24 observed 29 interns in 732 patient encounters in 2 Baltimore training programs using Kahn’s “etiquette-based medicine” behaviors as a guide.12 They found that interns introduced themselves 40% of the time, explained their role 37% of the time, touched patients on 65% of visits (including as part of the physical examination), asked open-ended questions 75% of the time, and sat down with patients during only 9% of visits.24 Tackett et al.7 observed 24 hospitalists who collectively cared for 226 unique patients in 3 Baltimore-area hospitals. They found that each of the following behaviors was performed less than 30% of the time: explains role in care, shakes hand, and sits down.7 However, our attendings appeared to adhere to these behaviors to a much higher extent, though we did not quantify the interactions. This lends support to the notion that effective patient-physician interactions are the foundation of great teaching.
The attendings we observed (most of whom are inpatient based) tended to the contextual issues of the patients, such as their home environments and social support. Our exemplary physicians did what they could to ensure that patients received the appropriate follow-up care upon discharge.
Our study has important limitations. First, it was conducted in a limited number of US hospitals. The institutions represented were generally large, research-intensive, academic medical centers. Therefore, our findings may not apply to settings that are different from the hospitals studied. Second, our study included only 12 attendings and their learners, which may also limit the study’s generalizability. Third, we focused exclusively on teaching within general medicine rounds. Thus, our findings may not be generalizable to other subspecialties. Fourth, attendings were selected through a nonexhaustive method, increasing the potential for selection bias. However, the multisite design, the modified snowball sampling, and the inclusion of several types of institutions in the final participant pool introduced diversity to the final list. Former-learner responses were subject to recall bias. Finally, the study design is susceptible to observer bias. Attempts to reduce this included the diversity of the observers (ie, both a clinician and a nonclinician, the latter of whom was unfamiliar with medical education) and review of the data and coding by multiple research team members to ensure validity. Although we cannot discount the potential role of a Hawthorne effect on our data collection, the research team attempted to mitigate this by standing apart from the care teams and remaining unobtrusive during observations.
Limitations notwithstanding, we believe that our multisite study is important given the longstanding imperative to improve patient-physician interactions. We found empirical support for behaviors proposed by Branch and colleagues2 and Kahn12 in order to enhance these relationships. While others have studied attendings and their current learners,22 we add to the literature by also examining former learners’ perspectives on how the attendings’ teaching and role-modeling have created and sustained a lasting impact. The key findings of our national, qualitative study (care for the patient’s well-being, consideration of the “big picture,” and respect for the patient) can be readily adopted and honed by physicians to improve their interactions with hospitalized patients.
A cknowledgments
The findings and conclusions in this report are those of the authors and do not necessarily represent the official position of the US Department of Veterans Affairs.
F unding
Dr. Saint provided funding for this study using a University of Michigan endowment.
Disclosure
The authors declare no conflicts of interest.
1. Peabody FW. The care of the patient. JAMA. 1927;88(12):877-882. PubMed
2. Branch WT, Jr., Kern D, Haidet P, et al. The patient-physician relationship. Teaching the human dimensions of care in clinical settings. JAMA. 2001;286(9):1067-1074. PubMed
3. Frankel RM. Relationship-centered care and the patient-physician relationship. J Gen Intern Med. 2004;19(11):1163-1165. PubMed
4. Stewart MA. Effective physician-patient communication and health outcomes: a review. CMAJ. 1995;152(9):1423-1433. PubMed
5. Osmun WE, Brown JB, Stewart M, Graham S. Patients’ attitudes to comforting touch in family practice. Can Fam Physician. 2000;46:2411-2416. PubMed
6. Strasser F, Palmer JL, Willey J, et al. Impact of physician sitting versus standing during inpatient oncology consultations: patients’ preference and perception of compassion and duration. A randomized controlled trial. J Pain Symptom Manage. 2005;29(5):489-497. PubMed
7. Tackett S, Tad-y D, Rios R, Kisuule F, Wright S. Appraising the practice of etiquette-based medicine in the inpatient setting. J Gen Intern Med. 2013;28(7):908-913. PubMed
8. Gallagher TH, Levinson W. A prescription for protecting the doctor-patient relationship. Am J Manag Care. 2004;10(2, pt 1):61-68. PubMed
9. Braddock CH, 3rd, Snyder L. The doctor will see you shortly. The ethical significance of time for the patient-physician relationship. J Gen Intern Med. 2005;20(11):1057-1062. PubMed
10. Ong LM, de Haes JC, Hoos AM, Lammes FB. Doctor-patient communication: a review of the literature. Soc Sci Med. 1995;40(7):903-918. PubMed
11. Lee SJ, Back AL, Block SD, Stewart SK. Enhancing physician-patient communication. Hematology Am Soc Hematol Educ Program. 2002:464-483. PubMed
12. Kahn MW. Etiquette-based medicine. N Engl J Med. 2008;358(19):1988-1989. PubMed
13. Hoff T, Collinson GE. How Do We Talk About the Physician-Patient Relationship? What the Nonempirical Literature Tells Us. Med Care Res Rev. 2016. PubMed
14. Houchens N, Harrod M, Moody S, Fowler KE, Saint S. Techniques and behaviors associated with exemplary inpatient general medicine teaching: an exploratory qualitative study. J Hosp Med. 2017;12(7):503-509. PubMed
15. Houchens N, Harrod M, Fowler KE, Moody S., Saint S. Teaching “how” to think instead of “what” to think: how great inpatient physicians foster clinical reasoning. Am J Med. In Press.
16. Harrod M, Saint S, Stock RW. Teaching Inpatient Medicine: What Every Physician Needs to Know. New York, NY: Oxford University Press; 2017.
17. Richards L, Morse J. README FIRST for a User’s Guide to Qualitative Methods. 3rd ed. Los Angeles, CA: SAGE Publications Inc; 2013.
18. US News and World Report. Best Medical Schools: Research. 2014; http://grad-schools.usnews.rankingsandreviews.com/best-graduate-schools/top-medical-schools/research-rankings. Accessed on September 16, 2016.
19. Guest G, Bunce A, Johnson L. How many interviews are enough? An experiment with data saturation and variability. Field Methods. 2006;18(1):59-82.
20. Braun V, Clarke V. Using thematic analysis in psychology. Qual Res Psychol. 2006;3(2):77-101. PubMed
21. Aronson J. A pragmatic view of thematic analysis. Qual Rep. 1995;2(1):1-3.
22. Weissmann PF, Branch WT, Gracey CF, Haidet P, Frankel RM. Role modeling humanistic behavior: learning bedside manner from the experts. Acad Med. 2006;81(7):661-667. PubMed
23. Ramani S, Orlander JD. Human dimensions in bedside teaching: focus group discussions of teachers and learners. Teach Learn Med. 2013;25(4):312-318. PubMed
24. Block L, Hutzler L, Habicht R, et al. Do internal medicine interns practice etiquette-based communication? A critical look at the inpatient encounter. J Hosp Med. 2013;8(11):631-634. PubMed
© 2017 Society of Hospital Medicine
Hospital Perceptions of Medicare’s Sepsis Quality Reporting Initiative
Sepsis affects over 1 million Americans annually, resulting in significant morbidity, mortality, and costs for hospitalized patients.1-4 There is an increasing interest in policy-oriented approaches to improving sepsis care at both the state and national levels.5,6 The most prominent policy is the Centers for Medicare and Medicaid Services (CMS) Sepsis CMS Core (SEP-1) program, which was formally implemented in October 2015; the program mandates that hospitals report their compliance with a variety of sepsis treatment processes (Table 1). Academic quality experts generally applaud the increased attention to sepsis but are concerned that the measure’s design and specifications advance beyond the existing evidence base.7,8 However, remarkably little is known about how front-line hospital quality officials perceive the program and how they are responding or not responding, to the new requirements. This knowledge gap is a critical barrier to evaluating the program’s practical impact on sepsis treatment and outcomes.
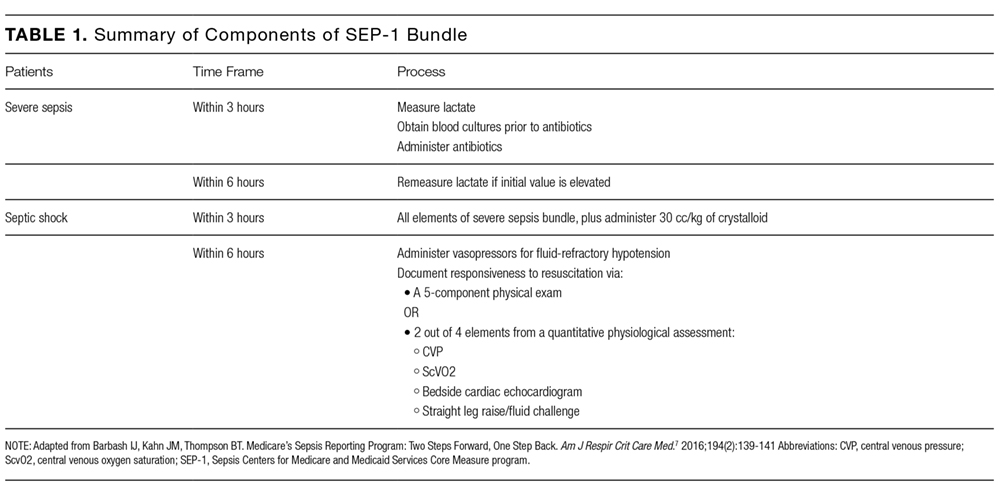
METHODS
Study Design, Setting, and Subjects
We conducted a qualitative study by using semistructured telephone interviews with hospital quality officers in the United States. We targeted hospital quality officers because they are in a position to provide overarching insights into hospitals’ perceptions of and responses to the SEP-1 program. We enrolled quality officers at general, short-stay, nonfederal acute care hospitals because those are the hospitals to which the SEP-1 program applies. We generated a stratified random sample of hospitals by using 2013 data from Medicare’s Healthcare Cost and Reporting Information System (HCRIS) database.10 We stratified by size (greater than or less than 200 total beds), teaching status (presence or absence of any resident physician trainees), and ownership (for-profit vs nonprofit), creating 8 mutually exclusive strata. This sampling frame was designed to ensure representativeness from a broad range of hospital types, not to enable comparisons across hospital types, which is outside the scope of qualitative research.
Within strata, we contacted hospitals in a random order by phone using the primary number listed in the HCRIS database. We asked the hospital operator to connect us to the chief quality officer or an appropriate alternative hospital administrator with knowledge of hospital quality-improvement activities. We limited participation to 1 respondent per hospital. We did not offer any specific incentives for participation.
The study was approved by the University of Pittsburgh Institutional Review Board with a waiver of signed informed consent.
Data Collection
Interviews were conducted by a trained research coordinator between February 2016 and October 2016. Interviews were conducted concurrently with data analysis by using a constant comparison approach.11 The constant comparison approach involves the iterative refinement of themes by comparing the existing themes to new data as they emerge during successive interviews. We chose a constant comparison approach because we wanted to systematically describe hospital responses to SEP-1 rather than specifically test individual hypotheses.11 As is typical in qualitative research, we did not set the sample size a priori but instead continued the interviews until we achieved thematic saturation.12,13
The interview script included a mix of directed and open-ended questions about respondents’ perspectives of and hospital responses to the SEP-1 program. The questions covered the following 4 domains: hospitals’ sepsis quality-improvement initiatives before and after the Medicare reporting program, reception of the hospital responses, the approach to data abstraction and reporting, and the overall impressions of the program and its impact.6-8,14 We allowed for updates and revisions of the interview guide as necessary to explore any new content and emergent themes. We piloted the interview guide on 2 hospital quality officers at our institution and then revised its structure again after interviews with the initial 6 hospitals. The complete final interview guide is available in the supplemental digital content.
Analysis
Interviews were audio recorded, transcribed, and loaded onto a secure server. We used NVivo 11 (QSR International, Cambridge, Massachusetts) for coding and analysis. We iteratively reviewed and thematically analyzed the transcripts for structural content and emergent themes, consistent with established qualitative methods.15 Three investigators reviewed the initial 20 transcripts and developed the codebook through iterative discussion and consensus. The codes were then organized into themes and subthemes. Subsequently, 1 investigator coded the remaining transcripts. The results are presented as a series of key themes supported by direct quotes from the interviews.
RESULTS
Sample Description
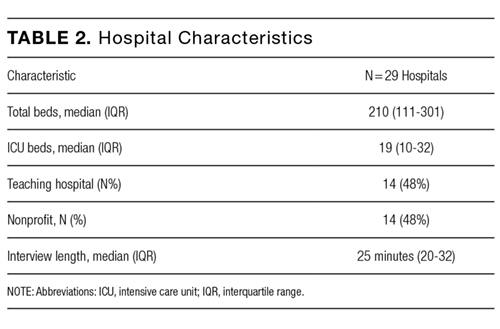
Perspectives on SEP-1

Responses to SEP-1

Efforts to Collect Data for SEP-1 Reporting
Respondents reported challenges in reliably and validly measuring and reporting data for the SEP-1 program. First, patient identification and the measurement of treatment processes depends largely on manual medical record review, which is subject to variation across coders. This presents a particular challenge because the clinical definition of sepsis itself is in evolution,1 creating the possibility that treating physicians could identify a given patient as having sepsis or septic shock based on the most up-to-date definitions but not based on the measure’s specifications or vice versa. Second, each case requires up to an hour of manual medical record review and patients who develop sepsis during prolonged hospitalizations can require several hours or more, which is an unprecedented length of time to spend abstracting data for a single measure.
In addressing these measurement challenges, investment in human resources is the rule. No respondent reported automating abstraction of all the SEP-1 data elements, underscoring concerns regarding the measurement burden of the SEP-1 program.7,8,14 Rather, hospitals with sufficient financial resources frequently employ full-time data abstractors and individuals responsible for ongoing performance feedback, which facilitates the iterative revision of sepsis quality-improvement initiatives. In contrast, hospitals with fewer resources often rely on contracts with third-party vendors, which delays reporting and complicates efforts to use the data for individualized performance improvement.
Efforts to Coordinate Hospital Responses Across Care Teams
Complying with the measure involves the longitudinal coordination of multiple care teams across different units, so planning and executing local hospital responses required interdepartmental and multidisciplinary stakeholder involvement. Respondents were uncertain about the ideal strategy to coordinate these quality-improvement efforts, yielding iterative changes to electronic health records (EHRs), education programs, and data collection methods. This “learning by doing” is necessary because no prior CMS quality measure is as complex as SEP-1 or as varied in the sources of data required to measure and report the results. By requiring hospitals to improve coordination of care throughout the hospital, SEP-1 presents a quality-improvement and measurement challenge that may ultimately drive innovation and better patient care.
Efforts to Improve Sepsis Diagnosis
Several hospitals are implementing sepsis screening and alerts to speed sepsis recognition and meet the measure’s time-sensitive treatment requirements. An example of a less-intensive alert is one hospital’s lowering of the threshold for lactate values that are viewed as “critical” (and thus requiring notification of the bedside clinician). Examples of more resource-intensive alerts included electronic screening for vital sign abnormalities that trigger bedside assessment for infection as well as nurse-driven manual sepsis screening tools.
Frequently, these more intensive efforts faced barriers to successful implementation related to the broader issues of performance measurement rather than the specifics of SEP-1. EHRs generally lacked built-in electronic screening capacity, and few hospitals had the resources required for customized EHR modification. Manual screening required nurses to spend time away from direct patient care. For both electronic and manual screening, respondents expressed concern about how these new alerts would fit into a care landscape already inundated with alerts, alarms, and care notifications.16,17
Efforts to Improve Sepsis Treatment
Many hospitals are implementing sepsis-specific treatment protocols and order sets designed to help meet SEP-1 treatment specifications. In hospitals and health systems with preexisting sepsis quality-improvement efforts, SEP-1 stimulated adaptation and acceleration of their efforts; in hospitals without preexisting sepsis-specific quality improvement, SEP-1 inspired de novo program development and implementation. These programs were wide ranging. Several hospitals implemented a process by which an initially elevated lactate value automates an order for a repeat lactate level, facilitating an assessment of the clinical response to treatment. Other examples include triggers for sepsis-specific treatment protocols and checklists that bedside nurses can begin without initial physician oversight. In 1 hospital, sepsis alerts triggered by emergency medical first responders initiate responses prior to hospital arrival in a manner analogous to prehospital alerts for myocardial infarction and stroke.18,19
Efforts to implement these protocols encountered several common challenges. Physicians were often resistant to adopting inflexible treatment rules that did not allow them to tailor therapies to individual patients. Furthermore, even protocols and order sets that worked in 1 setting did not necessarily generalize throughout the hospital or health system, reflecting the difficulty in implementing a highly specified measure across diverse treatment environments.
Efforts to Manage Clinician Attitudes Toward SEP-1 Implementation
In addition to addressing clinicians’ behaviors, hospitals sought to address stakeholders’ attitudes when those attitudes created barriers to SEP-1 implementation. First, hospitals frequently faced a lack of buy-in from clinicians who were resistant to the idea of protocolized care in general and who were specifically skeptical that initiatives designed to increase clinical documentation would drive improvements in patient-centered outcomes. Second, respondents had to confront a hierarchical hospital culture, which manifests not only in clinical care, but also in the quality-improvement infrastructure. Many respondents reported that physicians were more receptive to performance feedback from fellow physicians rather than nonphysician quality administrators.
Respondents described a range of approaches to counteract these attitudes. First, hospitals deployed department- and profession-specific “champions” to provide peer-to-peer performance feedback supported by data demonstrating a link between process improvements and patient outcomes. Second, many respondents noted that the addition of new clinical staff, who were often younger and more receptive to new initiatives, could alter a hospital’s quality culture; in smaller hospitals, just a few individuals could significantly alter the dynamic. Finally, when other efforts failed, some respondents indicated that top-down administrative support could persuade resistant individuals to change their approach. However, this solution worked best with employed physicians and was less effective with independent physician groups without direct financial ties to hospital performance. These efforts to overcome negative attitudes toward SEP-1 implementation required individuals’ time and energy, leading to frustration at times and adding to the resources required to comply with the program.
Planning for the Future of SEP-1
Respondents anticipate that performance of the SEP-1 measure will eventually become publicly reported and incorporated into value-based purchasing calculations. Hospitals are therefore seeking greater interaction with CMS as it makes iterative revisions to the measure because respondents expect that their hospitals’ level of performance, rather than just the act of participating, will affect hospital finances. Respondents expressed a desire for more live, interactive educational sessions with CMS moving forward, rather than limiting the opportunities for clarification to online comment forums or statements elsewhere in the public record. In addition, respondents hope that public reporting and pay-for-performance could be delayed to allow more time to work out the “kinks” in measurement and reporting.
DISCUSSION
We conducted semistructured telephone interviews with quality officers in U.S. hospitals in order to understand hospitals’ perceptions of and responses to Medicare’s SEP-1 sepsis quality-reporting program. Hospitals are struggling with the program’s complexity and investing considerable resources in order to iteratively revise their responses to the program. However, they generally believe that the program is bringing much-needed attention to sepsis diagnosis and treatment. These findings have several implications for the SEP-1 measure in particular and for hospital-based quality measurement and pay-for-performance policies in general.
First, we demonstrate that SEP-1 consistently requires a substantial investment of resources from hospitals already struggling under the weight of numerous local, state, and national quality-reporting and improvement programs.14,20,21 In aggregate, these programs can stretch hospitals’ resources to their limit. Respondents universally reported that the SEP-1 program is requiring dedicated staff to meet the data abstraction and reporting requirements as well as multicomponent quality-improvement initiatives. In the absence of well-established roadmaps for improving sepsis care, these sepsis quality-improvement efforts require experimentation and iterative revision, which can contribute to fatigue and frustration among quality officers and clinical staff. This process of innovation inherently involves successes, failures, and the risk of harm and opportunity costs that strain hospital resources.
Second, our study indicates how SEP-1 could exacerbate existing inequalities in our health system. Sepsis incidence and mortality are already higher in medically underserved regions.22 Given the resources required to respond to the SEP-1 program, optimal performance may be beyond the reach of smaller hospitals, or even larger hospitals, whose resources are already stretched to their limits. Public reporting and pay-for-performance can be adisadvantage to hospitals caring for underserved populations.23,24 To the extent that responding to sepsis-oriented public policy requires resources that certain hospitals cannot access, these policies could exacerbate existing health disparities.
Third, our findings highlight some specific ways that CMS could revise the SEP-1 program to better meet the needs of hospitals and improve outcomes for patients with sepsis. Primarily, although the program’s current specifications take an “all-or-none” approach to treatment success, a more flexible approach, such as a weighted score or composite measure that combines processes and outcomes,25,26 could allow hospitals to focus their efforts on those components of the bundle with the strongest evidence for improved patient outcomes.27 Second, policy makers need to reconcile the 2 existing clinical definitions for sepsis.1,28 CMS has already stated its plans to retain the preexisting sepsis definition,29 but this does not change the reality that frontline providers and quality officials face different, and at times conflicting, clinical definitions while caring for patients. Finally, current implementation challenges may support a delay in moving the measure toward public reporting and pay-for-performance. Hospitals are already responding to the measure in a substantial way, providing an opportunity for early quantitative evaluations of the program’s impact that could inform evidence-based revisions to the measure.
Our study has several limitations. First, by interviewing only individual quality officers within each hospital, it is possible that our findings were not representative of the perspectives of other individuals within their hospitals or the hospital as a whole; indeed, to the extent that quality officers “buy in” to quality measurement and reporting, their perspectives on SEP-1 may skew more positive than other hospital staff. Our respondents represented individuals from a range of positions within the quality infrastructure, whereas “hospital quality leaders” are often chief executive officers, chief medical officers, or vice presidents for quality.30 However, by virtue of our purposive sampling approach, we included respondents from a broad range of hospitals and found similar themes across these respondents, supporting the internal validity of our findings. Second, as is inherent in interview-based research, we cannot verify that respondents’ reports of hospital responses to SEP-1 match the actual changes implemented “on the ground.” We are reassured, however, by the fact that many of the perspectives and quality-improvement changes that respondents described align with the opinions and suggestions of academic quality experts, which are informed by clinical experience.6-8 Third, while respondents believe that hospital responses to SEP-1 are contributing to improvements in treatment and outcomes, we do not yet have robust objective data to support this opinion or to evaluate the association between quality officers’ perspectives and hospital performance. A quantitative evaluation of the clinical impact of SEP-1, as well as the relationship between hospital performance and quality officers’ perspectives on the measure, are important areas for future research.
CONCLUSIONS
In a qualitative study of hospital responses to Medicare’s SEP-1 program, we found that hospitals are implementing changes across a variety of domains and in ways that consistently require dedicated resources. Giving hospitals the flexibility to focus on treatment processes with the most direct impact on patient-centered outcomes might enhance the program’s effectiveness. Future work should quantify the program’s impact and develop novel approaches to data abstraction and quality improvement.
Disclosure
Aside from federal funding, the authors have no conflicts of interest to disclose. The authors received funding from the National Institutes of Health (IJB, F32HL132461) (JMK, K24HL133444). This work was submitted as an abstract to the 2017 American Thoracic Society International Conference, May 2017.
1. Singer M, Deutschman CS, Seymour CW, et al. The Third International Consensus Definitions for Sepsis and Septic Shock (Sepsis-3). JAMA. 2016;315(8):801-810. doi:10.1001/jama.2016.0287. PubMed
2. Angus DC, Linde-Zwirble WT, Lidicker J, Clermont G, Carcillo J, Pinsky MR. Epidemiology of severe sepsis in the United States: analysis of incidence, outcome, and associated costs of care. Crit Care Med. 2001;29(7):1303-1310. PubMed
3. Gaieski DF, Edwards JM, Kallan MJ, Carr BG. Benchmarking the incidence and mortality of severe sepsis in the United States. Crit Care Med. 2013;41(5):1167-1174. doi:10.1097/CCM.0b013e31827c09f8. PubMed
4. Liu V, Escobar GJ, Greene JD, et al. Hospital deaths in patients with sepsis from 2 independent cohorts. JAMA. 2014;312(1):90-92. doi:10.1001/jama.2014.5804. PubMed
5. Rhee C, Gohil S, Klompas M. Regulatory Mandates for Sepsis Care—Reasons for Caution. N Engl J Med. 2014;370(18):1673-1676. doi:10.1056/NEJMp1400276. PubMed
6. Cooke CR, Iwashyna TJ. Sepsis mandates: Improving inpatient care while advancing quality improvement. JAMA. 2014;312(14):1397-1398. doi:10.1001/jama.2014.11350. PubMed
7. Barbash IJ, Kahn JM, Thompson BT. Medicare’s Sepsis Reporting Program: Two Steps Forward, One Step Back. Am J Respir Crit Care Med. 2016;194(2):139-141. doi:10.1164/rccm.201604-0723ED. PubMed
8. Klompas M, Rhee C. The CMS Sepsis Mandate: Right Disease, Wrong Measure. Ann Intern Med. 2016;165(7):517-518. doi:10.7326/M16-0588. PubMed
9. Reade MC, Huang DT, Bell D, et al. Variability in management of early severe sepsis. Emerg Med J. 2010;27(2):110-115. doi:10.1136/emj.2008.070912. PubMed
10. Centers for Medicare & Medicaid Services. CMS Cost Reports. https://www.cms.gov/Research-Statistics-Data-and-Systems/Downloadable-Public-Use-Files/Cost-Reports/. Published 2017. Accessed on January 30, 2017.
11. Glaser BG. The Constant Comparative Method of Qualitative Analysis. Soc Probl. 1965;12(4):436-445. doi:10.2307/798843.
12. Morse JM. “Data Were Saturated...” Qual Health Res. 2015;25(5):587-588. doi:10.1177/1049732315576699. PubMed
13. Hennink MM, Kaiser BN, Marconi VC. Code Saturation Versus Meaning Saturation: How Many Interviews Are Enough? Qual Health Res. 2017;27(4):591-608. doi:10.1177/1049732316665344. PubMed
14. Wall MJ, Howell MD. Variation and Cost-effectiveness of Quality Measurement Programs. The Case of Sepsis Bundles. Ann Am Thorac Soc. 2015;12(11):1597-1599. doi:10.1513/AnnalsATS.201509-625ED. PubMed
15. Guest G, MacQueen KM. Handbook for Team-Based Qualitative Research. Plymouth: Altamira Press; 2008.
16. Kesselheim AS, Cresswell K, Phansalkar S, Bates DW, Sheikh A. Clinical decision support systems could be modified to reduce “alert fatigue” while still minimizing the risk of litigation. Health Aff (Millwood). 2011;30(12):2310-2317. doi:10.1377/hlthaff.2010.1111. PubMed
17. Sittig DF, Singh H. Electronic Health Records and National Patient-Safety Goals. N Engl J Med. 2012;367(19):1854-1860. doi:10.1056/NEJMsb1205420. PubMed
18. Kobayashi A, Misumida N, Aoi S, et al. STEMI notification by EMS predicts shorter door-to-balloon time and smaller infarct size. Am J Emerg Med. 2016;34(8):1610-1613. doi:10.1016/j.ajem.2016.06.022. PubMed
19. Lin CB, Peterson ED, Smith EE, et al. Emergency Medical Service Hospital Prenotification Is Associated With Improved Evaluation and Treatment of Acute Ischemic Stroke. Circ Cardiovasc Qual Outcomes. 2012;5(4):514-522. doi:10.1161/CIRCOUTCOMES.112.965210. PubMed
20. Meyer GS, Nelson EC, Pryor DB, et al. More quality measures versus measuring what matters: a call for balance and parsimony. BMJ Qual Saf. 2012;21(11):964-968. doi:10.1136/bmjqs-2012-001081. PubMed
21. Cassel CK, Conway PH, Delbanco SF, Jha AK, Saunders RS, Lee TH. Getting More Performance from Performance Measurement. N Engl J Med. 2014;371(23):2145-2147. doi:10.1056/NEJMp1408345. PubMed
22. Goodwin AJ, Nadig NR, McElligott JT, Simpson KN, Ford DW. Where You Live Matters: The Impact of Place of Residence on Severe Sepsis Incidence and Mortality. Chest. 2016;150(4):829-836. doi:10.1016/j.chest.2016.07.004. PubMed
23. Sjoding MW, Cooke CR. Readmission Penalties for Chronic Obstructive Pulmonary Disease Will Further Stress Hospitals Caring for Vulnerable Patient Populations. Am J Respir Crit Care Med. 2014;190(9):1072-1074. doi:10.1164/rccm.201407-1345LE. PubMed
24. Joynt KE, Jha AK. Characteristics of Hospitals Receiving Penalties Under the Hospital Readmissions Reduction Program. JAMA. 2013;309(4):342. doi:10.1001/jama.2012.94856. PubMed
25. Nolan T, Berwick DM. All-or-None Measurement Raises the Bar on Performance. JAMA. 2006;295(10):1168-1170. doi:10.1001/jama.295.10.1168. PubMed
26. Chen LM, Staiger DO, Birkmeyer JD, Ryan AM, Zhang W, Dimick JB. Composite quality measures for common inpatient medical conditions. Med Care. 2013;51(9):832-837. doi:10.1097/MLR.0b013e31829fa92a. PubMed
27. Rhodes A, Evans LE, Alhazzani W, et al. Surviving Sepsis Campaign: International Guidelines for Management of Sepsis and Septic Shock: 2016. Crit Care Med. 2017;45(3):486-552. doi:10.1097/CCM.0000000000002255. PubMed
28. Levy MM, Fink MP, Marshall JC, et al. 2001 SCCM/ESICM/ACCP/ATS/SIS International Sepsis Definitions Conference. Intensive Care Med. 2003;29(4):530-538. doi:10.1007/s00134-003-1662-x. PubMed
29. Townsend SR, Rivers E, Tefera L. Definitions for Sepsis and Septic Shock. JAMA. 2016;316(4):457-458. doi:10.1001/jama.2016.6374. PubMed
30. Lindenauer PK, Lagu T, Ross JS, et al. Attitudes of hospital leaders toward publicly reported measures of health care quality. JAMA Intern Med. 2014;174(12):1904-1911. doi:10.1001/jamainternmed.2014.5161. PubMed
Sepsis affects over 1 million Americans annually, resulting in significant morbidity, mortality, and costs for hospitalized patients.1-4 There is an increasing interest in policy-oriented approaches to improving sepsis care at both the state and national levels.5,6 The most prominent policy is the Centers for Medicare and Medicaid Services (CMS) Sepsis CMS Core (SEP-1) program, which was formally implemented in October 2015; the program mandates that hospitals report their compliance with a variety of sepsis treatment processes (Table 1). Academic quality experts generally applaud the increased attention to sepsis but are concerned that the measure’s design and specifications advance beyond the existing evidence base.7,8 However, remarkably little is known about how front-line hospital quality officials perceive the program and how they are responding or not responding, to the new requirements. This knowledge gap is a critical barrier to evaluating the program’s practical impact on sepsis treatment and outcomes.
METHODS
Study Design, Setting, and Subjects
We conducted a qualitative study by using semistructured telephone interviews with hospital quality officers in the United States. We targeted hospital quality officers because they are in a position to provide overarching insights into hospitals’ perceptions of and responses to the SEP-1 program. We enrolled quality officers at general, short-stay, nonfederal acute care hospitals because those are the hospitals to which the SEP-1 program applies. We generated a stratified random sample of hospitals by using 2013 data from Medicare’s Healthcare Cost and Reporting Information System (HCRIS) database.10 We stratified by size (greater than or less than 200 total beds), teaching status (presence or absence of any resident physician trainees), and ownership (for-profit vs nonprofit), creating 8 mutually exclusive strata. This sampling frame was designed to ensure representativeness from a broad range of hospital types, not to enable comparisons across hospital types, which is outside the scope of qualitative research.
Within strata, we contacted hospitals in a random order by phone using the primary number listed in the HCRIS database. We asked the hospital operator to connect us to the chief quality officer or an appropriate alternative hospital administrator with knowledge of hospital quality-improvement activities. We limited participation to 1 respondent per hospital. We did not offer any specific incentives for participation.
The study was approved by the University of Pittsburgh Institutional Review Board with a waiver of signed informed consent.
Data Collection
Interviews were conducted by a trained research coordinator between February 2016 and October 2016. Interviews were conducted concurrently with data analysis by using a constant comparison approach.11 The constant comparison approach involves the iterative refinement of themes by comparing the existing themes to new data as they emerge during successive interviews. We chose a constant comparison approach because we wanted to systematically describe hospital responses to SEP-1 rather than specifically test individual hypotheses.11 As is typical in qualitative research, we did not set the sample size a priori but instead continued the interviews until we achieved thematic saturation.12,13
The interview script included a mix of directed and open-ended questions about respondents’ perspectives of and hospital responses to the SEP-1 program. The questions covered the following 4 domains: hospitals’ sepsis quality-improvement initiatives before and after the Medicare reporting program, reception of the hospital responses, the approach to data abstraction and reporting, and the overall impressions of the program and its impact.6-8,14 We allowed for updates and revisions of the interview guide as necessary to explore any new content and emergent themes. We piloted the interview guide on 2 hospital quality officers at our institution and then revised its structure again after interviews with the initial 6 hospitals. The complete final interview guide is available in the supplemental digital content.
Analysis
Interviews were audio recorded, transcribed, and loaded onto a secure server. We used NVivo 11 (QSR International, Cambridge, Massachusetts) for coding and analysis. We iteratively reviewed and thematically analyzed the transcripts for structural content and emergent themes, consistent with established qualitative methods.15 Three investigators reviewed the initial 20 transcripts and developed the codebook through iterative discussion and consensus. The codes were then organized into themes and subthemes. Subsequently, 1 investigator coded the remaining transcripts. The results are presented as a series of key themes supported by direct quotes from the interviews.
RESULTS
Sample Description
Perspectives on SEP-1
Responses to SEP-1
Efforts to Collect Data for SEP-1 Reporting
Respondents reported challenges in reliably and validly measuring and reporting data for the SEP-1 program. First, patient identification and the measurement of treatment processes depends largely on manual medical record review, which is subject to variation across coders. This presents a particular challenge because the clinical definition of sepsis itself is in evolution,1 creating the possibility that treating physicians could identify a given patient as having sepsis or septic shock based on the most up-to-date definitions but not based on the measure’s specifications or vice versa. Second, each case requires up to an hour of manual medical record review and patients who develop sepsis during prolonged hospitalizations can require several hours or more, which is an unprecedented length of time to spend abstracting data for a single measure.
In addressing these measurement challenges, investment in human resources is the rule. No respondent reported automating abstraction of all the SEP-1 data elements, underscoring concerns regarding the measurement burden of the SEP-1 program.7,8,14 Rather, hospitals with sufficient financial resources frequently employ full-time data abstractors and individuals responsible for ongoing performance feedback, which facilitates the iterative revision of sepsis quality-improvement initiatives. In contrast, hospitals with fewer resources often rely on contracts with third-party vendors, which delays reporting and complicates efforts to use the data for individualized performance improvement.
Efforts to Coordinate Hospital Responses Across Care Teams
Complying with the measure involves the longitudinal coordination of multiple care teams across different units, so planning and executing local hospital responses required interdepartmental and multidisciplinary stakeholder involvement. Respondents were uncertain about the ideal strategy to coordinate these quality-improvement efforts, yielding iterative changes to electronic health records (EHRs), education programs, and data collection methods. This “learning by doing” is necessary because no prior CMS quality measure is as complex as SEP-1 or as varied in the sources of data required to measure and report the results. By requiring hospitals to improve coordination of care throughout the hospital, SEP-1 presents a quality-improvement and measurement challenge that may ultimately drive innovation and better patient care.
Efforts to Improve Sepsis Diagnosis
Several hospitals are implementing sepsis screening and alerts to speed sepsis recognition and meet the measure’s time-sensitive treatment requirements. An example of a less-intensive alert is one hospital’s lowering of the threshold for lactate values that are viewed as “critical” (and thus requiring notification of the bedside clinician). Examples of more resource-intensive alerts included electronic screening for vital sign abnormalities that trigger bedside assessment for infection as well as nurse-driven manual sepsis screening tools.
Frequently, these more intensive efforts faced barriers to successful implementation related to the broader issues of performance measurement rather than the specifics of SEP-1. EHRs generally lacked built-in electronic screening capacity, and few hospitals had the resources required for customized EHR modification. Manual screening required nurses to spend time away from direct patient care. For both electronic and manual screening, respondents expressed concern about how these new alerts would fit into a care landscape already inundated with alerts, alarms, and care notifications.16,17
Efforts to Improve Sepsis Treatment
Many hospitals are implementing sepsis-specific treatment protocols and order sets designed to help meet SEP-1 treatment specifications. In hospitals and health systems with preexisting sepsis quality-improvement efforts, SEP-1 stimulated adaptation and acceleration of their efforts; in hospitals without preexisting sepsis-specific quality improvement, SEP-1 inspired de novo program development and implementation. These programs were wide ranging. Several hospitals implemented a process by which an initially elevated lactate value automates an order for a repeat lactate level, facilitating an assessment of the clinical response to treatment. Other examples include triggers for sepsis-specific treatment protocols and checklists that bedside nurses can begin without initial physician oversight. In 1 hospital, sepsis alerts triggered by emergency medical first responders initiate responses prior to hospital arrival in a manner analogous to prehospital alerts for myocardial infarction and stroke.18,19
Efforts to implement these protocols encountered several common challenges. Physicians were often resistant to adopting inflexible treatment rules that did not allow them to tailor therapies to individual patients. Furthermore, even protocols and order sets that worked in 1 setting did not necessarily generalize throughout the hospital or health system, reflecting the difficulty in implementing a highly specified measure across diverse treatment environments.
Efforts to Manage Clinician Attitudes Toward SEP-1 Implementation
In addition to addressing clinicians’ behaviors, hospitals sought to address stakeholders’ attitudes when those attitudes created barriers to SEP-1 implementation. First, hospitals frequently faced a lack of buy-in from clinicians who were resistant to the idea of protocolized care in general and who were specifically skeptical that initiatives designed to increase clinical documentation would drive improvements in patient-centered outcomes. Second, respondents had to confront a hierarchical hospital culture, which manifests not only in clinical care, but also in the quality-improvement infrastructure. Many respondents reported that physicians were more receptive to performance feedback from fellow physicians rather than nonphysician quality administrators.
Respondents described a range of approaches to counteract these attitudes. First, hospitals deployed department- and profession-specific “champions” to provide peer-to-peer performance feedback supported by data demonstrating a link between process improvements and patient outcomes. Second, many respondents noted that the addition of new clinical staff, who were often younger and more receptive to new initiatives, could alter a hospital’s quality culture; in smaller hospitals, just a few individuals could significantly alter the dynamic. Finally, when other efforts failed, some respondents indicated that top-down administrative support could persuade resistant individuals to change their approach. However, this solution worked best with employed physicians and was less effective with independent physician groups without direct financial ties to hospital performance. These efforts to overcome negative attitudes toward SEP-1 implementation required individuals’ time and energy, leading to frustration at times and adding to the resources required to comply with the program.
Planning for the Future of SEP-1
Respondents anticipate that performance of the SEP-1 measure will eventually become publicly reported and incorporated into value-based purchasing calculations. Hospitals are therefore seeking greater interaction with CMS as it makes iterative revisions to the measure because respondents expect that their hospitals’ level of performance, rather than just the act of participating, will affect hospital finances. Respondents expressed a desire for more live, interactive educational sessions with CMS moving forward, rather than limiting the opportunities for clarification to online comment forums or statements elsewhere in the public record. In addition, respondents hope that public reporting and pay-for-performance could be delayed to allow more time to work out the “kinks” in measurement and reporting.
DISCUSSION
We conducted semistructured telephone interviews with quality officers in U.S. hospitals in order to understand hospitals’ perceptions of and responses to Medicare’s SEP-1 sepsis quality-reporting program. Hospitals are struggling with the program’s complexity and investing considerable resources in order to iteratively revise their responses to the program. However, they generally believe that the program is bringing much-needed attention to sepsis diagnosis and treatment. These findings have several implications for the SEP-1 measure in particular and for hospital-based quality measurement and pay-for-performance policies in general.
First, we demonstrate that SEP-1 consistently requires a substantial investment of resources from hospitals already struggling under the weight of numerous local, state, and national quality-reporting and improvement programs.14,20,21 In aggregate, these programs can stretch hospitals’ resources to their limit. Respondents universally reported that the SEP-1 program is requiring dedicated staff to meet the data abstraction and reporting requirements as well as multicomponent quality-improvement initiatives. In the absence of well-established roadmaps for improving sepsis care, these sepsis quality-improvement efforts require experimentation and iterative revision, which can contribute to fatigue and frustration among quality officers and clinical staff. This process of innovation inherently involves successes, failures, and the risk of harm and opportunity costs that strain hospital resources.
Second, our study indicates how SEP-1 could exacerbate existing inequalities in our health system. Sepsis incidence and mortality are already higher in medically underserved regions.22 Given the resources required to respond to the SEP-1 program, optimal performance may be beyond the reach of smaller hospitals, or even larger hospitals, whose resources are already stretched to their limits. Public reporting and pay-for-performance can be adisadvantage to hospitals caring for underserved populations.23,24 To the extent that responding to sepsis-oriented public policy requires resources that certain hospitals cannot access, these policies could exacerbate existing health disparities.
Third, our findings highlight some specific ways that CMS could revise the SEP-1 program to better meet the needs of hospitals and improve outcomes for patients with sepsis. Primarily, although the program’s current specifications take an “all-or-none” approach to treatment success, a more flexible approach, such as a weighted score or composite measure that combines processes and outcomes,25,26 could allow hospitals to focus their efforts on those components of the bundle with the strongest evidence for improved patient outcomes.27 Second, policy makers need to reconcile the 2 existing clinical definitions for sepsis.1,28 CMS has already stated its plans to retain the preexisting sepsis definition,29 but this does not change the reality that frontline providers and quality officials face different, and at times conflicting, clinical definitions while caring for patients. Finally, current implementation challenges may support a delay in moving the measure toward public reporting and pay-for-performance. Hospitals are already responding to the measure in a substantial way, providing an opportunity for early quantitative evaluations of the program’s impact that could inform evidence-based revisions to the measure.
Our study has several limitations. First, by interviewing only individual quality officers within each hospital, it is possible that our findings were not representative of the perspectives of other individuals within their hospitals or the hospital as a whole; indeed, to the extent that quality officers “buy in” to quality measurement and reporting, their perspectives on SEP-1 may skew more positive than other hospital staff. Our respondents represented individuals from a range of positions within the quality infrastructure, whereas “hospital quality leaders” are often chief executive officers, chief medical officers, or vice presidents for quality.30 However, by virtue of our purposive sampling approach, we included respondents from a broad range of hospitals and found similar themes across these respondents, supporting the internal validity of our findings. Second, as is inherent in interview-based research, we cannot verify that respondents’ reports of hospital responses to SEP-1 match the actual changes implemented “on the ground.” We are reassured, however, by the fact that many of the perspectives and quality-improvement changes that respondents described align with the opinions and suggestions of academic quality experts, which are informed by clinical experience.6-8 Third, while respondents believe that hospital responses to SEP-1 are contributing to improvements in treatment and outcomes, we do not yet have robust objective data to support this opinion or to evaluate the association between quality officers’ perspectives and hospital performance. A quantitative evaluation of the clinical impact of SEP-1, as well as the relationship between hospital performance and quality officers’ perspectives on the measure, are important areas for future research.
CONCLUSIONS
In a qualitative study of hospital responses to Medicare’s SEP-1 program, we found that hospitals are implementing changes across a variety of domains and in ways that consistently require dedicated resources. Giving hospitals the flexibility to focus on treatment processes with the most direct impact on patient-centered outcomes might enhance the program’s effectiveness. Future work should quantify the program’s impact and develop novel approaches to data abstraction and quality improvement.
Disclosure
Aside from federal funding, the authors have no conflicts of interest to disclose. The authors received funding from the National Institutes of Health (IJB, F32HL132461) (JMK, K24HL133444). This work was submitted as an abstract to the 2017 American Thoracic Society International Conference, May 2017.
1. Singer M, Deutschman CS, Seymour CW, et al. The Third International Consensus Definitions for Sepsis and Septic Shock (Sepsis-3). JAMA. 2016;315(8):801-810. doi:10.1001/jama.2016.0287. PubMed
2. Angus DC, Linde-Zwirble WT, Lidicker J, Clermont G, Carcillo J, Pinsky MR. Epidemiology of severe sepsis in the United States: analysis of incidence, outcome, and associated costs of care. Crit Care Med. 2001;29(7):1303-1310. PubMed
3. Gaieski DF, Edwards JM, Kallan MJ, Carr BG. Benchmarking the incidence and mortality of severe sepsis in the United States. Crit Care Med. 2013;41(5):1167-1174. doi:10.1097/CCM.0b013e31827c09f8. PubMed
4. Liu V, Escobar GJ, Greene JD, et al. Hospital deaths in patients with sepsis from 2 independent cohorts. JAMA. 2014;312(1):90-92. doi:10.1001/jama.2014.5804. PubMed
5. Rhee C, Gohil S, Klompas M. Regulatory Mandates for Sepsis Care—Reasons for Caution. N Engl J Med. 2014;370(18):1673-1676. doi:10.1056/NEJMp1400276. PubMed
6. Cooke CR, Iwashyna TJ. Sepsis mandates: Improving inpatient care while advancing quality improvement. JAMA. 2014;312(14):1397-1398. doi:10.1001/jama.2014.11350. PubMed
7. Barbash IJ, Kahn JM, Thompson BT. Medicare’s Sepsis Reporting Program: Two Steps Forward, One Step Back. Am J Respir Crit Care Med. 2016;194(2):139-141. doi:10.1164/rccm.201604-0723ED. PubMed
8. Klompas M, Rhee C. The CMS Sepsis Mandate: Right Disease, Wrong Measure. Ann Intern Med. 2016;165(7):517-518. doi:10.7326/M16-0588. PubMed
9. Reade MC, Huang DT, Bell D, et al. Variability in management of early severe sepsis. Emerg Med J. 2010;27(2):110-115. doi:10.1136/emj.2008.070912. PubMed
10. Centers for Medicare & Medicaid Services. CMS Cost Reports. https://www.cms.gov/Research-Statistics-Data-and-Systems/Downloadable-Public-Use-Files/Cost-Reports/. Published 2017. Accessed on January 30, 2017.
11. Glaser BG. The Constant Comparative Method of Qualitative Analysis. Soc Probl. 1965;12(4):436-445. doi:10.2307/798843.
12. Morse JM. “Data Were Saturated...” Qual Health Res. 2015;25(5):587-588. doi:10.1177/1049732315576699. PubMed
13. Hennink MM, Kaiser BN, Marconi VC. Code Saturation Versus Meaning Saturation: How Many Interviews Are Enough? Qual Health Res. 2017;27(4):591-608. doi:10.1177/1049732316665344. PubMed
14. Wall MJ, Howell MD. Variation and Cost-effectiveness of Quality Measurement Programs. The Case of Sepsis Bundles. Ann Am Thorac Soc. 2015;12(11):1597-1599. doi:10.1513/AnnalsATS.201509-625ED. PubMed
15. Guest G, MacQueen KM. Handbook for Team-Based Qualitative Research. Plymouth: Altamira Press; 2008.
16. Kesselheim AS, Cresswell K, Phansalkar S, Bates DW, Sheikh A. Clinical decision support systems could be modified to reduce “alert fatigue” while still minimizing the risk of litigation. Health Aff (Millwood). 2011;30(12):2310-2317. doi:10.1377/hlthaff.2010.1111. PubMed
17. Sittig DF, Singh H. Electronic Health Records and National Patient-Safety Goals. N Engl J Med. 2012;367(19):1854-1860. doi:10.1056/NEJMsb1205420. PubMed
18. Kobayashi A, Misumida N, Aoi S, et al. STEMI notification by EMS predicts shorter door-to-balloon time and smaller infarct size. Am J Emerg Med. 2016;34(8):1610-1613. doi:10.1016/j.ajem.2016.06.022. PubMed
19. Lin CB, Peterson ED, Smith EE, et al. Emergency Medical Service Hospital Prenotification Is Associated With Improved Evaluation and Treatment of Acute Ischemic Stroke. Circ Cardiovasc Qual Outcomes. 2012;5(4):514-522. doi:10.1161/CIRCOUTCOMES.112.965210. PubMed
20. Meyer GS, Nelson EC, Pryor DB, et al. More quality measures versus measuring what matters: a call for balance and parsimony. BMJ Qual Saf. 2012;21(11):964-968. doi:10.1136/bmjqs-2012-001081. PubMed
21. Cassel CK, Conway PH, Delbanco SF, Jha AK, Saunders RS, Lee TH. Getting More Performance from Performance Measurement. N Engl J Med. 2014;371(23):2145-2147. doi:10.1056/NEJMp1408345. PubMed
22. Goodwin AJ, Nadig NR, McElligott JT, Simpson KN, Ford DW. Where You Live Matters: The Impact of Place of Residence on Severe Sepsis Incidence and Mortality. Chest. 2016;150(4):829-836. doi:10.1016/j.chest.2016.07.004. PubMed
23. Sjoding MW, Cooke CR. Readmission Penalties for Chronic Obstructive Pulmonary Disease Will Further Stress Hospitals Caring for Vulnerable Patient Populations. Am J Respir Crit Care Med. 2014;190(9):1072-1074. doi:10.1164/rccm.201407-1345LE. PubMed
24. Joynt KE, Jha AK. Characteristics of Hospitals Receiving Penalties Under the Hospital Readmissions Reduction Program. JAMA. 2013;309(4):342. doi:10.1001/jama.2012.94856. PubMed
25. Nolan T, Berwick DM. All-or-None Measurement Raises the Bar on Performance. JAMA. 2006;295(10):1168-1170. doi:10.1001/jama.295.10.1168. PubMed
26. Chen LM, Staiger DO, Birkmeyer JD, Ryan AM, Zhang W, Dimick JB. Composite quality measures for common inpatient medical conditions. Med Care. 2013;51(9):832-837. doi:10.1097/MLR.0b013e31829fa92a. PubMed
27. Rhodes A, Evans LE, Alhazzani W, et al. Surviving Sepsis Campaign: International Guidelines for Management of Sepsis and Septic Shock: 2016. Crit Care Med. 2017;45(3):486-552. doi:10.1097/CCM.0000000000002255. PubMed
28. Levy MM, Fink MP, Marshall JC, et al. 2001 SCCM/ESICM/ACCP/ATS/SIS International Sepsis Definitions Conference. Intensive Care Med. 2003;29(4):530-538. doi:10.1007/s00134-003-1662-x. PubMed
29. Townsend SR, Rivers E, Tefera L. Definitions for Sepsis and Septic Shock. JAMA. 2016;316(4):457-458. doi:10.1001/jama.2016.6374. PubMed
30. Lindenauer PK, Lagu T, Ross JS, et al. Attitudes of hospital leaders toward publicly reported measures of health care quality. JAMA Intern Med. 2014;174(12):1904-1911. doi:10.1001/jamainternmed.2014.5161. PubMed
© 2017 Society of Hospital Medicine
Health Literacy and Hospital Length of Stay: An Inpatient Cohort Study
Health literacy (HL), defined as patients’ ability to understand health information and make health decisions,1 is a prevalent problem in the outpatient and inpatient settings.2,3 In both settings, low HL has adverse implications for self-care including interpreting health labels4 and taking medications correctly.5 Among outpatient cohorts, HL has been associated with worse outcomes and acute care utilization.6 Associations with low HL include increased hospitalizations,7 rehospitalizations,8,9 emergency department visits,10 and decreased preventative care use.11 Among the elderly, low HL is associated with increased mortality12 and decreased self-perception of health.13
A systematic review revealed that most high-quality HL outcome studies were conducted in the outpatient setting.6 There have been very few studies assessing effects of low HL in an acute-care setting.7,14 These studies have evaluated postdischarge outcomes, including admissions or readmissions,7-9 and medication knowledge.14 To the best of our knowledge, there are no studies evaluating associations between HL and hospital length of stay (LOS).
LOS has received much attention as providers and payers focus more on resource utilization and eliminating adverse effects of prolonged hospitalization.15 LOS is multifactorial, depending on clinical characteristics like disease severity, as well as on sociocultural, demographic, and geographic factors.16 Despite evidence that LOS reductions translate into improved resource allocation and potentially fewer complications, there remains a tension between the appropriate LOS and one that is too short for a given condition.17
Because low HL is associated with inefficient resource utilization, we hypothesized that low HL would be associated with increased LOS after controlling for illness severity. Our objectives were to evaluate the association between low HL and LOS and whether such an association was modified by illness severity and sociodemographics.
METHODS
Study Design, Setting, Participants
An in-hospital, cohort study design of patients who were admitted or transferred to the general medicine service at the University of Chicago between October 2012 and November 2015 and screened for inclusion as part of a large, ongoing study of inpatient care quality was conducted.18 Exclusion criteria included observation status, age under 18 years, non-English speaking, and repeat participants. Those who died during hospitalization or whose discharge status was missing were excluded because the primary goal was to examine the association of HL and time to discharge, which could not be evaluated among those who died. We excluded participants with LOS >30 days to limit overly influential effects of extreme outliers (1% of the population).
Variables
HL was screened using the Brief Health Literacy Screen (BHLS), a validated, 3-question verbal survey not requiring adequate visual acuity to assess HL.19,20 The 3 questions are as follows: (1) “How confident are you filling out medical forms by yourself?”, (2) “How often do you have someone help you read hospital materials?”, and (3) “How often do you have problems learning about your medical condition because of difficulty understanding written information?” Responses to the questions were scored on a 5-point Likert scale in which higher scores corresponded to higher HL.21,22 The scores for each of the 3 questions were summed to yield a range between 3 and 15. On the individual questions, prior work has demonstrated improved test performance with a cutoff of ≤3, which corresponds to a response of “some of the time” or “somewhat”; therefore, when the 3 questions were summed together, scores of ≤9 were considered indicative of low HL.21,23
For severity of illness adjustment, we used relative weights derived from the 3M (3M, Maplewood, MN) All Patient Refined Diagnosis Related Groups (APR-DRG) classification system, which uses administrative data to classify the severity. The APR-DRG system assigns each admission to a DRG based on principal diagnosis; for each DRG, patients are then subdivided into 4 severity classes based on age, comorbidity, and interactions between these variables and the admitting diagnosis.24 Using the base DRG and severity score, the system assigns relative weights that reflect differences in expected hospital resource utilization.
LOS was derived from hospital administrative data and counted from the date of admission to the hospital. Participants who were discharged on the day of admission were counted as having an LOS of 1. Insurance status (Medicare, Medicaid, no payer, private) also was obtained from administrative data. Age, sex (male or female), education (junior high or less, some high school, high school graduate, some college, college graduate, postgraduate), and race (black/African American, white, Asian or Pacific Islander [including Asian Indian, Chinese, Filipino, Japanese, Korean, Vietnamese, other Asian, Native Hawaiian, Guam/Chamorro, Samoan, other Pacific], American Indian or Alaskan Native, multiple race) were obtained from administrative data based on information provided by the patient. Participants with missing data on any of the sociodemographic variables or on the APR-DRG score were excluded from the analysis.
Statistical Analysis
χ2 and 2-tailed t tests were used to compare categorical and continuous variables, respectively. Multivariate linear regressions were employed to measure associations between the independent variables (HL, illness severity, race, gender, education, and insurance status) and the dependent variable, LOS. Independent variables were chosen for clinical significance and retained in the model regardless of statistical significance. The adjusted R2 values of models with and without the HL variable included were reported to provide information on the contribution of HL to the overall model.
Because LOS was observed to be right skewed and residuals of the untransformed regression were observed to be non-normally distributed, the decision was made to natural log transform LOS, which is consistent with previous hospital LOS studies.16 Regression coefficients and confidence intervals were then transformed into percentage estimates using the following equation: 100(eβ–1). Adjusted R2 was reported for the transformed regression.
The APR-DRG relative weight was treated as a continuous variable. Sociodemographic variables were dichotomized as follows: female vs male; high school graduates vs not; African American vs not; Medicaid/no payer vs Medicare/private payer. Age was not included in the multivariate model because it has been incorporated into the weighted APR-DRG illness severity scores.
Each of the sociodemographic variables and the APR-DRG score were examined for effect modification via the same multivariate linear equation described above, with the addition of an interaction term. A separate regression was performed with an interaction term between age (dichotomized at ≥65) and HL to investigate whether age modified the association between HL and LOS. Finally, we explored whether effects were isolated to long vs short LOS by dividing the sample based on the mean LOS (≥6 days) and performing separate multivariate comparisons.
Sensitivity analyses were performed to exclude those with LOS greater than the 90th percentile and those with APR-DRG score greater than the 90th percentile; age was added to the model as a continuous variable to evaluate whether the illness severity score fully adjusted for the effects of age on LOS. Furthermore, we compared the participants with missing data to those with complete data across both dependent and independent variables. Alpha was set at 0.05; analyses were performed using Stata Version 14 (Stata, College Station, TX).
RESULTS
A total of 5983 participants met inclusion criteria and completed the HL assessment; of these participants, 75 (1%) died during hospitalization, 9 (0.2%) had missing discharge status, and 79 (1%) had LOS >30 days. Two hundred eighty (5%) were missing data on sociodemographic variables or APR-DRG score. Of the remaining (n = 5540), the mean age was 57 years (standard deviation [SD] = 19 years), over half of participants were female (57%), and the majority were African American (73%) and had graduated from high school (81%). The sample was divided into those with private insurance (25%), those with Medicare (46%), and those with Medicaid (26%); 2% had no payer. The mean APR-DRG score was 1.3 (SD = 1.2), and the scores ranged from 0.3 to 15.8.
On the BHLS screen for HL, 20% (1104/5540) had inadequate HL. Participants with low HL had higher weighted illness severity scores (average 1.4 vs 1.3; P = 0.003). Participants with low HL were also more likely to be 65 or older (55% vs 33%; P < 0.001), non-high school graduates (35% vs 15%; P < 0.001), and African American (78% vs 72%; P < 0.001), and to have Medicare or private insurance (75% vs 71%; P = 0.02). There was no significant difference with respect to gender (54% male vs 57% female; P = 0.1)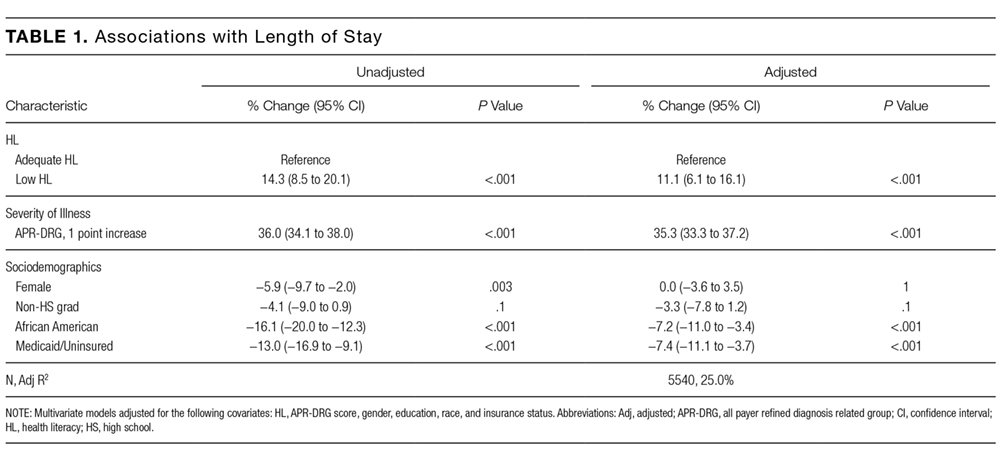
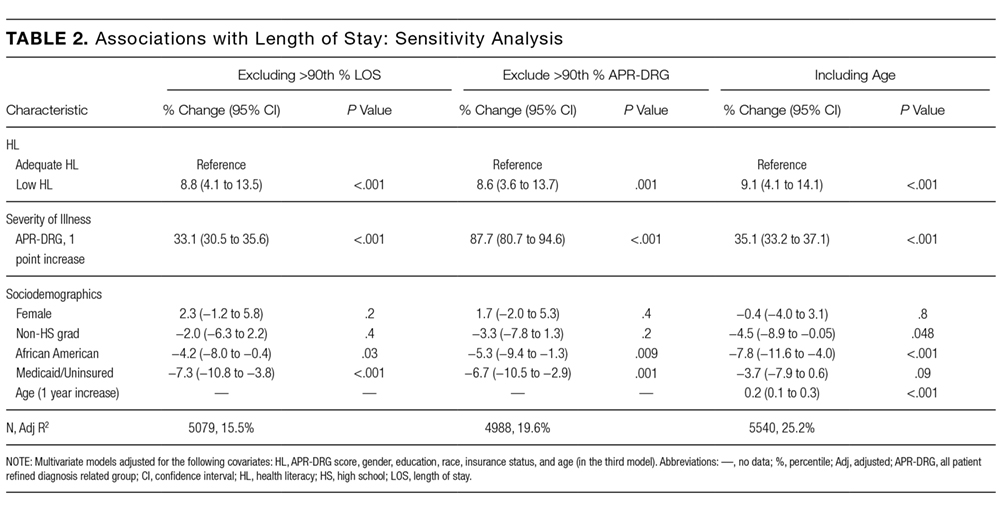
Finally, we compared the group with missing data (n = 280) to the group with complete data (n = 5540). The participants with missing data were more likely to have low HL (31% [86/280] vs 20%; P < 0.001) and to have Medicare or private insurance (82% [177/217] vs 72%; P = 0.002); however, they were not more likely to be 65 or older (40% [112/280] vs 37%; P = 0.3), high school graduates (88% [113/129] vs 81%; P = 0.06), African American (69% [177/256] vs 73%; P = 0.1), or female (57% [158/279] vs 57%; P = 1), nor were they more likely to have longer LOS (5.7 [n = 280] vs 5.5 days; P = 0.6) or higher illness severity scores (1.3 [n = 231] vs 1.3; P = 0.7).
DISCUSSION
To our knowledge, this study is the first to evaluate the association between low HL and an important in-hospital outcome measure, hospital LOS. We found that low HL was associated with a longer hospital LOS, a result which remained significant when controlling for severity of illness and sociodemographic variables and when testing the model for sensitivity to the highest values of LOS and illness severity. Additionally, the association of HL with LOS appeared concentrated among participants with shorter LOS. Relative to other predictors, the contribution of HL to the overall LOS model was small, as evidenced by the change in adjusted R2 values with HL excluded.
Among the covariates, only gender modified the association between HL and LOS; the findings suggested that men were more susceptible to the effect of low HL on increased LOS. Illness severity and other sociodemographics, including age ≥65, did not appear to modify the association. We also found that being African American and having Medicaid or no insurance were associated with a significantly shorter LOS in multivariate analysis.
Previous work suggested that the adverse health effects of low HL may be mediated through several pathways, including health knowledge, self-efficacy, health skills, and illness stigma.25-27 The finding of a small but significant relationship between HL and LOS was not surprising given these known associations; nevertheless, there may be an additional patient-dependent effect of low HL on LOS not discovered here. For instance, patients with poor health knowledge and self-efficacy might stay in the hospital longer if they or their providers do not feel comfortable with their self-care ability.
This finding may be useful in developing hospital-based interventions. HL-specific interventions, several of which have been tested in the inpatient setting,14,28,29 have shown promise toward improving health knowledge,30 disease severity,31 and health resource utilization.32
Those with low HL may lack the self-efficacy to participate in discharge planning; in fact, previous work has related low HL to posthospital readmissions.8,9 Conversely, patients with low HL might struggle to engage in the inpatient milieu, advocating for shorter LOS if they feel alienated by the inpatient experience.
These possibilities show that LOS is a complex measure shown to depend on patient-level characteristics and on provider-based, geographical, and sociocultural factors.16,33 With these forces at play, additional effects of lower levels of HL may be lost without phenotyping patients by both level of HL and related characteristics, such as self-efficacy, health skills, and stigma. By gathering these additional data, future work should explore whether subpopulations of patients with low HL may be at risk for too-short vs too-long hospital admissions.
For instance, in this study, both race and Medicaid insurance were associated with shorter LOS. Being African American was associated with shorter LOS in our study but has been found to be associated with longer LOS in another study specifically focused on diabetes.34 Prior findings found uninsured patients have shorter LOS.35 Therefore, these findings in our study are difficult to explain without further work to understand whether there are health disparities in the way patients are cared for during hospitalization that may shorten or lengthen their LOS because of factors outside of their clinical need.
The finding that gender modified the effect of low HL on LOS was unexpected. There were similar proportions of men and women with low HL. There is evidence to support that women make the majority of health decisions for themselves and their familes36; therefore, there may be unmeasured aspects of HL that provide an advantage for female vs male inpatients. Furthermore, omitted confounders, such as social support, may not fully capture potential gender-related differences. Future work is needed to understand the role of gender in relationship to HL and LOS.
Limitations of this study include its observational, single-centered design with information derived from administrative data; positive and negative confounding cannot be ruled out. For instance, we did not control for complex aspects affecting LOS, such as discharge disposition and goals of care (eg, aggressive care after discharge vs hospice). To address this limitation, multivariate analyses were performed, which were adjusted for illness severity scores and took into account both comorbidity and severity of the current illness. Additionally, although it is important to study such populations, our largely urban, minority sample is not representative of the U.S. population, and within our large sample, there were participants with missing data who had lower HL on average, although this group represented only 5% of the sample. Finally, different HL tools have noncomplete concordance, which has been seen when comparing the BHLS with more objective tools.20,37 Furthermore, certain in-hospital clinical scenarios (eg, recent stroke or prolonged intensive care unit stay) may present unique challenges in establishing a baseline HL level. However, the BHLS was used in this study because of its greater feasibility.
In conclusion, this study is the first to evaluate the relationship between low HL and LOS. The findings suggest that HL may play a role in shaping outcomes in the inpatient setting and that targeting interventions toward screened patients may be a pathway toward mitigating adverse effects. Our findings need to be replicated in larger, more representative samples, and further work understanding subpopulations within the low HL population is needed. Future work should measure this association in diverse inpatient settings (eg, psychiatric, surgical, and specialty), in addition to assessing associations between HL and other important in-hospital outcome measures, including mortality and discharge disposition.
Acknowledgments
The authors thank the Hospitalist Project team for their assistance with data collection. The authors especially thank Chuanhong Liao and Ashley Snyder for assistance with statistical analyses; Andrea Flores, Ainoa Coltri, and Tom Best for their assistance with data management. The authors would also like to thank Nicole Twu for her help with preparing and editing the manuscript.
Disclosures
Dr. Jaffee was supported by a Calvin Fentress Research Fellowship and NIH R25MH094612. Dr. Press was supported by a career development award (NHLBI K23HL118151). This work was also supported by a seed grant from the Center for Health Administration Studies. All other authors declare no conflicts of interest.
1. U.S. Department of Health and Human Services. Healthy People 2010: Understanding and Improving Health. Washington, DC: U.S. Government Printing Office; 2000.
2. “What Did the Doctor Say”? Improving Health Literacy to Protect Patient Safety. The Joint Commission; 2007.
3. Kutner M, Greenberg E, Jin Y, Paulsen C. The Health Literacy of America’s Adults: Results from the 2003 National Assessment of Adult Literacy. National Center for Education Statistics; 2006.
4. Davis TC, Wolf MS, Bass PF, et al. Literacy and misunderstanding prescription drug labels. Ann Intern Med. 2006;145(12):887-894. PubMed
5. Kripalani S, Henderson LE, Chiu EY, Robertson R, Kolm P, Jacobson TA. Predictors of medication self-management skill in a low-literacy population. J Gen Intern Med. 2006;21(8):852-856. PubMed
6. Berkman ND, Sheridan SL, Donahue KE, Halpern DJ, Crotty K. Low health literacy and health outcomes: an updated systematic review. Ann Intern Med. 2011;155(2):97-107. PubMed
7. Baker DW, Parker RM, Williams MV, Clark WS. Health literacy and the risk of hospital admission. J Gen Intern Med. 1998;13(12):791-798. PubMed
8. Mitchell SE, Sadikova E, Jack BW, Paasche-Orlow MK. Health literacy and 30-day postdischarge hospital utilization. J Health Commun. 2012;17(Suppl 3):325-338. PubMed
9. Jaffee EG, Arora VM, Matthiesen MI, Hariprasad SM, Meltzer DO, Press VG. Postdischarge Falls and Readmissions: Associations with Insufficient Vision and Low Health Literacy among Hospitalized Seniors. J Health Commun. 2016;21(sup2):135-140. PubMed
10. Hope CJ, Wu J, Tu W, Young J, Murray MD. Association of medication adherence, knowledge, and skills with emergency department visits by adults 50 years or older with congestive heart failure. Am J Health Syst Pharm. 2004;61(19):2043-2049. PubMed
11. Bennett IM, Chen J, Soroui JS, White S. The contribution of health literacy to disparities in self-rated health status and preventive health behaviors in older adults. Ann Fam Med. 2009;7(3):204-211. PubMed
12. Baker DW, Wolf MS, Feinglass J, Thompson JA. Health literacy, cognitive abilities, and mortality among elderly persons. J Gen Intern Med. 2008;23(6):723-726. PubMed
13. Cho YI, Lee SY, Arozullah AM, Crittenden KS. Effects of health literacy on health status and health service utilization amongst the elderly. Soc Sci Med. 2008;66(8):1809-1816. PubMed
14. Paasche-Orlow MK, Riekert KA, Bilderback A, et al. Tailored education may reduce health literacy disparities in asthma self-management. Am J Respir Crit Care Med. 2005;172(8):980-986. PubMed
15. Soria-Aledo V, Carrillo-Alcaraz A, Campillo-Soto Á, et al. Associated factors and cost of inappropriate hospital admissions and stays in a second-level hospital. Am J Med Qual. 2009;24(4):321-332. PubMed
16. Lu M, Sajobi T, Lucyk K, Lorenzetti D, Quan H. Systematic review of risk adjustment models of hospital length of stay (LOS). Med Care. 2015;53(4):355-365. PubMed
17. Clarke A, Rosen R. Length of stay. How short should hospital care be? Eur J Public Health. 2001;11(2):166-170. PubMed
18. Meltzer D, Manning WG, Morrison J, et al. Effects of physician experience on costs and outcomes on an academic general medicine service: results of a trial of hospitalists. Ann Intern Med. 2002;137(11):866-874. PubMed
19. Chew LD, Bradley KA, Boyko EJ. Brief questions to identify patients with inadequate health literacy. Fam Med. 2004;36(8):588-594. PubMed
20. Press VG, Shapiro MI, Mayo AM, Meltzer DO, Arora VM. More than meets the eye: relationship between low health literacy and poor vision in hospitalized patients. J Health Commun. 2013;18 Suppl 1:197-204. PubMed
21. Willens DE, Kripalani S, Schildcrout JS, et al. Association of brief health literacy screening and blood pressure in primary care. J Health Commun. 2013;18 Suppl 1:129-142. PubMed
22. Peterson PN, Shetterly SM, Clarke CL, et al. Health literacy and outcomes among patients with heart failure. JAMA. 2011;305(16):1695-1701. PubMed
23. Chew LD, Griffin JM, Partin MR, et al. Validation of screening questions for limited health literacy in a large VA outpatient population. J Gen Intern Med. 2008;23(5):561-566. PubMed
24. Averill RF, Goldfield N, Hughes JS, et al. All Patient Refined Diagnosis Related Groups (APR-DRGs): Methodology Overview. 3M Health Information Systems; 2003.
25. Waite KR, Paasche-Orlow M, Rintamaki LS, Davis TC, Wolf MS. Literacy, social stigma, and HIV medication adherence. J Gen Intern Med. 2008;23(9):1367-1372. PubMed
26. Paasche-Orlow MK, Wolf MS. The causal pathways linking health literacy to health outcomes. Am J Health Behav. 2007;31 Suppl 1:S19-26. PubMed
27. Berkman ND, Sheridan SL, Donahue KE, et al. Health literacy interventions and outcomes: an updated systematic review. Evid Rep Technol Assess (Full Rep). 2011;(199):1-941. PubMed
28. Kripalani S, Roumie CL, Dalal AK, et al. Effect of a pharmacist intervention on clinically important medication errors after hospital discharge: a randomized trial. Ann Intern Med. 2012;157(1):1-10. PubMed
29. Press VG, Arora VM, Shah LM, et al. Teaching the use of respiratory inhalers to hospitalized patients with asthma or COPD: a randomized trial. J Gen Intern Med. 2012;27(10):1317-1325. PubMed
30. Sobel RM, Paasche-Orlow MK, Waite KR, Rittner SS, Wilson EAH, Wolf MS. Asthma 1-2-3: a low literacy multimedia tool to educate African American adults about asthma. J Community Health. 2009;34(4):321-327. PubMed
31. Rothman RL, DeWalt DA, Malone R, et al. Influence of patient literacy on the effectiveness of a primary care-based diabetes disease management program. JAMA. 2004;292(14):1711-1716. PubMed
32. DeWalt DA, Malone RM, Bryant ME, et al. A heart failure self-management
program for patients of all literacy levels: a randomized, controlled trial [ISRCTN11535170].
BMC Health Serv Res. 2006;6:30. PubMed
33. Hasan O, Orav EJ, Hicks LS. Insurance status and hospital care for myocardial
infarction, stroke, and pneumonia. J Hosp Med. 2010;5(8):452-459. PubMed
34. Cook CB, Naylor DB, Hentz JG, et al. Disparities in diabetes-related hospitalizations:
relationship of age, sex, and race/ethnicity with hospital discharges, lengths
of stay, and direct inpatient charges. Ethn Dis. 2006;16(1):126-131. PubMed
35. Hadley J, Steinberg EP, Feder J. Comparison of uninsured and privately insured
hospital patients. Condition on admission, resource use, and outcome. JAMA.
1991;265(3):374-379. PubMed
36. Women’s Health Care Chartbook: Key Findings From the Kaiser Women’s
Health Survey. May 2011. https://kaiserfamilyfoundation.files.wordpress.
com/2013/01/8164.pdf. Accessed August 1, 2017.
37. Louis AJ, Arora VM, Matthiesen MI, Meltzer DO, Press VG. Screening Hospitalized Patients for Low Health Literacy: Beyond the REALM of Possibility? PubMed
Health literacy (HL), defined as patients’ ability to understand health information and make health decisions,1 is a prevalent problem in the outpatient and inpatient settings.2,3 In both settings, low HL has adverse implications for self-care including interpreting health labels4 and taking medications correctly.5 Among outpatient cohorts, HL has been associated with worse outcomes and acute care utilization.6 Associations with low HL include increased hospitalizations,7 rehospitalizations,8,9 emergency department visits,10 and decreased preventative care use.11 Among the elderly, low HL is associated with increased mortality12 and decreased self-perception of health.13
A systematic review revealed that most high-quality HL outcome studies were conducted in the outpatient setting.6 There have been very few studies assessing effects of low HL in an acute-care setting.7,14 These studies have evaluated postdischarge outcomes, including admissions or readmissions,7-9 and medication knowledge.14 To the best of our knowledge, there are no studies evaluating associations between HL and hospital length of stay (LOS).
LOS has received much attention as providers and payers focus more on resource utilization and eliminating adverse effects of prolonged hospitalization.15 LOS is multifactorial, depending on clinical characteristics like disease severity, as well as on sociocultural, demographic, and geographic factors.16 Despite evidence that LOS reductions translate into improved resource allocation and potentially fewer complications, there remains a tension between the appropriate LOS and one that is too short for a given condition.17
Because low HL is associated with inefficient resource utilization, we hypothesized that low HL would be associated with increased LOS after controlling for illness severity. Our objectives were to evaluate the association between low HL and LOS and whether such an association was modified by illness severity and sociodemographics.
METHODS
Study Design, Setting, Participants
An in-hospital, cohort study design of patients who were admitted or transferred to the general medicine service at the University of Chicago between October 2012 and November 2015 and screened for inclusion as part of a large, ongoing study of inpatient care quality was conducted.18 Exclusion criteria included observation status, age under 18 years, non-English speaking, and repeat participants. Those who died during hospitalization or whose discharge status was missing were excluded because the primary goal was to examine the association of HL and time to discharge, which could not be evaluated among those who died. We excluded participants with LOS >30 days to limit overly influential effects of extreme outliers (1% of the population).
Variables
HL was screened using the Brief Health Literacy Screen (BHLS), a validated, 3-question verbal survey not requiring adequate visual acuity to assess HL.19,20 The 3 questions are as follows: (1) “How confident are you filling out medical forms by yourself?”, (2) “How often do you have someone help you read hospital materials?”, and (3) “How often do you have problems learning about your medical condition because of difficulty understanding written information?” Responses to the questions were scored on a 5-point Likert scale in which higher scores corresponded to higher HL.21,22 The scores for each of the 3 questions were summed to yield a range between 3 and 15. On the individual questions, prior work has demonstrated improved test performance with a cutoff of ≤3, which corresponds to a response of “some of the time” or “somewhat”; therefore, when the 3 questions were summed together, scores of ≤9 were considered indicative of low HL.21,23
For severity of illness adjustment, we used relative weights derived from the 3M (3M, Maplewood, MN) All Patient Refined Diagnosis Related Groups (APR-DRG) classification system, which uses administrative data to classify the severity. The APR-DRG system assigns each admission to a DRG based on principal diagnosis; for each DRG, patients are then subdivided into 4 severity classes based on age, comorbidity, and interactions between these variables and the admitting diagnosis.24 Using the base DRG and severity score, the system assigns relative weights that reflect differences in expected hospital resource utilization.
LOS was derived from hospital administrative data and counted from the date of admission to the hospital. Participants who were discharged on the day of admission were counted as having an LOS of 1. Insurance status (Medicare, Medicaid, no payer, private) also was obtained from administrative data. Age, sex (male or female), education (junior high or less, some high school, high school graduate, some college, college graduate, postgraduate), and race (black/African American, white, Asian or Pacific Islander [including Asian Indian, Chinese, Filipino, Japanese, Korean, Vietnamese, other Asian, Native Hawaiian, Guam/Chamorro, Samoan, other Pacific], American Indian or Alaskan Native, multiple race) were obtained from administrative data based on information provided by the patient. Participants with missing data on any of the sociodemographic variables or on the APR-DRG score were excluded from the analysis.
Statistical Analysis
χ2 and 2-tailed t tests were used to compare categorical and continuous variables, respectively. Multivariate linear regressions were employed to measure associations between the independent variables (HL, illness severity, race, gender, education, and insurance status) and the dependent variable, LOS. Independent variables were chosen for clinical significance and retained in the model regardless of statistical significance. The adjusted R2 values of models with and without the HL variable included were reported to provide information on the contribution of HL to the overall model.
Because LOS was observed to be right skewed and residuals of the untransformed regression were observed to be non-normally distributed, the decision was made to natural log transform LOS, which is consistent with previous hospital LOS studies.16 Regression coefficients and confidence intervals were then transformed into percentage estimates using the following equation: 100(eβ–1). Adjusted R2 was reported for the transformed regression.
The APR-DRG relative weight was treated as a continuous variable. Sociodemographic variables were dichotomized as follows: female vs male; high school graduates vs not; African American vs not; Medicaid/no payer vs Medicare/private payer. Age was not included in the multivariate model because it has been incorporated into the weighted APR-DRG illness severity scores.
Each of the sociodemographic variables and the APR-DRG score were examined for effect modification via the same multivariate linear equation described above, with the addition of an interaction term. A separate regression was performed with an interaction term between age (dichotomized at ≥65) and HL to investigate whether age modified the association between HL and LOS. Finally, we explored whether effects were isolated to long vs short LOS by dividing the sample based on the mean LOS (≥6 days) and performing separate multivariate comparisons.
Sensitivity analyses were performed to exclude those with LOS greater than the 90th percentile and those with APR-DRG score greater than the 90th percentile; age was added to the model as a continuous variable to evaluate whether the illness severity score fully adjusted for the effects of age on LOS. Furthermore, we compared the participants with missing data to those with complete data across both dependent and independent variables. Alpha was set at 0.05; analyses were performed using Stata Version 14 (Stata, College Station, TX).
RESULTS
A total of 5983 participants met inclusion criteria and completed the HL assessment; of these participants, 75 (1%) died during hospitalization, 9 (0.2%) had missing discharge status, and 79 (1%) had LOS >30 days. Two hundred eighty (5%) were missing data on sociodemographic variables or APR-DRG score. Of the remaining (n = 5540), the mean age was 57 years (standard deviation [SD] = 19 years), over half of participants were female (57%), and the majority were African American (73%) and had graduated from high school (81%). The sample was divided into those with private insurance (25%), those with Medicare (46%), and those with Medicaid (26%); 2% had no payer. The mean APR-DRG score was 1.3 (SD = 1.2), and the scores ranged from 0.3 to 15.8.
On the BHLS screen for HL, 20% (1104/5540) had inadequate HL. Participants with low HL had higher weighted illness severity scores (average 1.4 vs 1.3; P = 0.003). Participants with low HL were also more likely to be 65 or older (55% vs 33%; P < 0.001), non-high school graduates (35% vs 15%; P < 0.001), and African American (78% vs 72%; P < 0.001), and to have Medicare or private insurance (75% vs 71%; P = 0.02). There was no significant difference with respect to gender (54% male vs 57% female; P = 0.1)
Finally, we compared the group with missing data (n = 280) to the group with complete data (n = 5540). The participants with missing data were more likely to have low HL (31% [86/280] vs 20%; P < 0.001) and to have Medicare or private insurance (82% [177/217] vs 72%; P = 0.002); however, they were not more likely to be 65 or older (40% [112/280] vs 37%; P = 0.3), high school graduates (88% [113/129] vs 81%; P = 0.06), African American (69% [177/256] vs 73%; P = 0.1), or female (57% [158/279] vs 57%; P = 1), nor were they more likely to have longer LOS (5.7 [n = 280] vs 5.5 days; P = 0.6) or higher illness severity scores (1.3 [n = 231] vs 1.3; P = 0.7).
DISCUSSION
To our knowledge, this study is the first to evaluate the association between low HL and an important in-hospital outcome measure, hospital LOS. We found that low HL was associated with a longer hospital LOS, a result which remained significant when controlling for severity of illness and sociodemographic variables and when testing the model for sensitivity to the highest values of LOS and illness severity. Additionally, the association of HL with LOS appeared concentrated among participants with shorter LOS. Relative to other predictors, the contribution of HL to the overall LOS model was small, as evidenced by the change in adjusted R2 values with HL excluded.
Among the covariates, only gender modified the association between HL and LOS; the findings suggested that men were more susceptible to the effect of low HL on increased LOS. Illness severity and other sociodemographics, including age ≥65, did not appear to modify the association. We also found that being African American and having Medicaid or no insurance were associated with a significantly shorter LOS in multivariate analysis.
Previous work suggested that the adverse health effects of low HL may be mediated through several pathways, including health knowledge, self-efficacy, health skills, and illness stigma.25-27 The finding of a small but significant relationship between HL and LOS was not surprising given these known associations; nevertheless, there may be an additional patient-dependent effect of low HL on LOS not discovered here. For instance, patients with poor health knowledge and self-efficacy might stay in the hospital longer if they or their providers do not feel comfortable with their self-care ability.
This finding may be useful in developing hospital-based interventions. HL-specific interventions, several of which have been tested in the inpatient setting,14,28,29 have shown promise toward improving health knowledge,30 disease severity,31 and health resource utilization.32
Those with low HL may lack the self-efficacy to participate in discharge planning; in fact, previous work has related low HL to posthospital readmissions.8,9 Conversely, patients with low HL might struggle to engage in the inpatient milieu, advocating for shorter LOS if they feel alienated by the inpatient experience.
These possibilities show that LOS is a complex measure shown to depend on patient-level characteristics and on provider-based, geographical, and sociocultural factors.16,33 With these forces at play, additional effects of lower levels of HL may be lost without phenotyping patients by both level of HL and related characteristics, such as self-efficacy, health skills, and stigma. By gathering these additional data, future work should explore whether subpopulations of patients with low HL may be at risk for too-short vs too-long hospital admissions.
For instance, in this study, both race and Medicaid insurance were associated with shorter LOS. Being African American was associated with shorter LOS in our study but has been found to be associated with longer LOS in another study specifically focused on diabetes.34 Prior findings found uninsured patients have shorter LOS.35 Therefore, these findings in our study are difficult to explain without further work to understand whether there are health disparities in the way patients are cared for during hospitalization that may shorten or lengthen their LOS because of factors outside of their clinical need.
The finding that gender modified the effect of low HL on LOS was unexpected. There were similar proportions of men and women with low HL. There is evidence to support that women make the majority of health decisions for themselves and their familes36; therefore, there may be unmeasured aspects of HL that provide an advantage for female vs male inpatients. Furthermore, omitted confounders, such as social support, may not fully capture potential gender-related differences. Future work is needed to understand the role of gender in relationship to HL and LOS.
Limitations of this study include its observational, single-centered design with information derived from administrative data; positive and negative confounding cannot be ruled out. For instance, we did not control for complex aspects affecting LOS, such as discharge disposition and goals of care (eg, aggressive care after discharge vs hospice). To address this limitation, multivariate analyses were performed, which were adjusted for illness severity scores and took into account both comorbidity and severity of the current illness. Additionally, although it is important to study such populations, our largely urban, minority sample is not representative of the U.S. population, and within our large sample, there were participants with missing data who had lower HL on average, although this group represented only 5% of the sample. Finally, different HL tools have noncomplete concordance, which has been seen when comparing the BHLS with more objective tools.20,37 Furthermore, certain in-hospital clinical scenarios (eg, recent stroke or prolonged intensive care unit stay) may present unique challenges in establishing a baseline HL level. However, the BHLS was used in this study because of its greater feasibility.
In conclusion, this study is the first to evaluate the relationship between low HL and LOS. The findings suggest that HL may play a role in shaping outcomes in the inpatient setting and that targeting interventions toward screened patients may be a pathway toward mitigating adverse effects. Our findings need to be replicated in larger, more representative samples, and further work understanding subpopulations within the low HL population is needed. Future work should measure this association in diverse inpatient settings (eg, psychiatric, surgical, and specialty), in addition to assessing associations between HL and other important in-hospital outcome measures, including mortality and discharge disposition.
Acknowledgments
The authors thank the Hospitalist Project team for their assistance with data collection. The authors especially thank Chuanhong Liao and Ashley Snyder for assistance with statistical analyses; Andrea Flores, Ainoa Coltri, and Tom Best for their assistance with data management. The authors would also like to thank Nicole Twu for her help with preparing and editing the manuscript.
Disclosures
Dr. Jaffee was supported by a Calvin Fentress Research Fellowship and NIH R25MH094612. Dr. Press was supported by a career development award (NHLBI K23HL118151). This work was also supported by a seed grant from the Center for Health Administration Studies. All other authors declare no conflicts of interest.
1. U.S. Department of Health and Human Services. Healthy People 2010: Understanding and Improving Health. Washington, DC: U.S. Government Printing Office; 2000.
2. “What Did the Doctor Say”? Improving Health Literacy to Protect Patient Safety. The Joint Commission; 2007.
3. Kutner M, Greenberg E, Jin Y, Paulsen C. The Health Literacy of America’s Adults: Results from the 2003 National Assessment of Adult Literacy. National Center for Education Statistics; 2006.
4. Davis TC, Wolf MS, Bass PF, et al. Literacy and misunderstanding prescription drug labels. Ann Intern Med. 2006;145(12):887-894. PubMed
5. Kripalani S, Henderson LE, Chiu EY, Robertson R, Kolm P, Jacobson TA. Predictors of medication self-management skill in a low-literacy population. J Gen Intern Med. 2006;21(8):852-856. PubMed
6. Berkman ND, Sheridan SL, Donahue KE, Halpern DJ, Crotty K. Low health literacy and health outcomes: an updated systematic review. Ann Intern Med. 2011;155(2):97-107. PubMed
7. Baker DW, Parker RM, Williams MV, Clark WS. Health literacy and the risk of hospital admission. J Gen Intern Med. 1998;13(12):791-798. PubMed
8. Mitchell SE, Sadikova E, Jack BW, Paasche-Orlow MK. Health literacy and 30-day postdischarge hospital utilization. J Health Commun. 2012;17(Suppl 3):325-338. PubMed
9. Jaffee EG, Arora VM, Matthiesen MI, Hariprasad SM, Meltzer DO, Press VG. Postdischarge Falls and Readmissions: Associations with Insufficient Vision and Low Health Literacy among Hospitalized Seniors. J Health Commun. 2016;21(sup2):135-140. PubMed
10. Hope CJ, Wu J, Tu W, Young J, Murray MD. Association of medication adherence, knowledge, and skills with emergency department visits by adults 50 years or older with congestive heart failure. Am J Health Syst Pharm. 2004;61(19):2043-2049. PubMed
11. Bennett IM, Chen J, Soroui JS, White S. The contribution of health literacy to disparities in self-rated health status and preventive health behaviors in older adults. Ann Fam Med. 2009;7(3):204-211. PubMed
12. Baker DW, Wolf MS, Feinglass J, Thompson JA. Health literacy, cognitive abilities, and mortality among elderly persons. J Gen Intern Med. 2008;23(6):723-726. PubMed
13. Cho YI, Lee SY, Arozullah AM, Crittenden KS. Effects of health literacy on health status and health service utilization amongst the elderly. Soc Sci Med. 2008;66(8):1809-1816. PubMed
14. Paasche-Orlow MK, Riekert KA, Bilderback A, et al. Tailored education may reduce health literacy disparities in asthma self-management. Am J Respir Crit Care Med. 2005;172(8):980-986. PubMed
15. Soria-Aledo V, Carrillo-Alcaraz A, Campillo-Soto Á, et al. Associated factors and cost of inappropriate hospital admissions and stays in a second-level hospital. Am J Med Qual. 2009;24(4):321-332. PubMed
16. Lu M, Sajobi T, Lucyk K, Lorenzetti D, Quan H. Systematic review of risk adjustment models of hospital length of stay (LOS). Med Care. 2015;53(4):355-365. PubMed
17. Clarke A, Rosen R. Length of stay. How short should hospital care be? Eur J Public Health. 2001;11(2):166-170. PubMed
18. Meltzer D, Manning WG, Morrison J, et al. Effects of physician experience on costs and outcomes on an academic general medicine service: results of a trial of hospitalists. Ann Intern Med. 2002;137(11):866-874. PubMed
19. Chew LD, Bradley KA, Boyko EJ. Brief questions to identify patients with inadequate health literacy. Fam Med. 2004;36(8):588-594. PubMed
20. Press VG, Shapiro MI, Mayo AM, Meltzer DO, Arora VM. More than meets the eye: relationship between low health literacy and poor vision in hospitalized patients. J Health Commun. 2013;18 Suppl 1:197-204. PubMed
21. Willens DE, Kripalani S, Schildcrout JS, et al. Association of brief health literacy screening and blood pressure in primary care. J Health Commun. 2013;18 Suppl 1:129-142. PubMed
22. Peterson PN, Shetterly SM, Clarke CL, et al. Health literacy and outcomes among patients with heart failure. JAMA. 2011;305(16):1695-1701. PubMed
23. Chew LD, Griffin JM, Partin MR, et al. Validation of screening questions for limited health literacy in a large VA outpatient population. J Gen Intern Med. 2008;23(5):561-566. PubMed
24. Averill RF, Goldfield N, Hughes JS, et al. All Patient Refined Diagnosis Related Groups (APR-DRGs): Methodology Overview. 3M Health Information Systems; 2003.
25. Waite KR, Paasche-Orlow M, Rintamaki LS, Davis TC, Wolf MS. Literacy, social stigma, and HIV medication adherence. J Gen Intern Med. 2008;23(9):1367-1372. PubMed
26. Paasche-Orlow MK, Wolf MS. The causal pathways linking health literacy to health outcomes. Am J Health Behav. 2007;31 Suppl 1:S19-26. PubMed
27. Berkman ND, Sheridan SL, Donahue KE, et al. Health literacy interventions and outcomes: an updated systematic review. Evid Rep Technol Assess (Full Rep). 2011;(199):1-941. PubMed
28. Kripalani S, Roumie CL, Dalal AK, et al. Effect of a pharmacist intervention on clinically important medication errors after hospital discharge: a randomized trial. Ann Intern Med. 2012;157(1):1-10. PubMed
29. Press VG, Arora VM, Shah LM, et al. Teaching the use of respiratory inhalers to hospitalized patients with asthma or COPD: a randomized trial. J Gen Intern Med. 2012;27(10):1317-1325. PubMed
30. Sobel RM, Paasche-Orlow MK, Waite KR, Rittner SS, Wilson EAH, Wolf MS. Asthma 1-2-3: a low literacy multimedia tool to educate African American adults about asthma. J Community Health. 2009;34(4):321-327. PubMed
31. Rothman RL, DeWalt DA, Malone R, et al. Influence of patient literacy on the effectiveness of a primary care-based diabetes disease management program. JAMA. 2004;292(14):1711-1716. PubMed
32. DeWalt DA, Malone RM, Bryant ME, et al. A heart failure self-management
program for patients of all literacy levels: a randomized, controlled trial [ISRCTN11535170].
BMC Health Serv Res. 2006;6:30. PubMed
33. Hasan O, Orav EJ, Hicks LS. Insurance status and hospital care for myocardial
infarction, stroke, and pneumonia. J Hosp Med. 2010;5(8):452-459. PubMed
34. Cook CB, Naylor DB, Hentz JG, et al. Disparities in diabetes-related hospitalizations:
relationship of age, sex, and race/ethnicity with hospital discharges, lengths
of stay, and direct inpatient charges. Ethn Dis. 2006;16(1):126-131. PubMed
35. Hadley J, Steinberg EP, Feder J. Comparison of uninsured and privately insured
hospital patients. Condition on admission, resource use, and outcome. JAMA.
1991;265(3):374-379. PubMed
36. Women’s Health Care Chartbook: Key Findings From the Kaiser Women’s
Health Survey. May 2011. https://kaiserfamilyfoundation.files.wordpress.
com/2013/01/8164.pdf. Accessed August 1, 2017.
37. Louis AJ, Arora VM, Matthiesen MI, Meltzer DO, Press VG. Screening Hospitalized Patients for Low Health Literacy: Beyond the REALM of Possibility? PubMed
© 2017 Society of Hospital Medicine
Trends in Troponin-Only Testing for AMI in Academic Teaching Hospitals and the Impact of Choosing Wisely®
Evidence suggests that troponin-only testing is the superior strategy to diagnose acute myocardial infarction (AMI).1 Because of this, in February 2015, the Choosing Wisely® campaign issued a recommendation to use troponin I or T to diagnose AMI, and not to test for myoglobin or creatine kinase-MB (CK-MB).2 This recommendation was in line with guidelines from the American Heart Association and the American College of Cardiology, which recommended that myoglobin and CK-MB are not useful and offer no benefit for the diagnosis of acute coronary syndrome.3 Some institutions have developed interventions to promote troponin-only testing, reporting substantial cost savings and no negative consequences.4,5
Despite these successes, it is likely that institutions vary with respect to the adoption of the Choosing Wisely® troponin-only testing recommendation.6 Implementing this recommendation requires both promoting clinician behavior change and a strong institutional culture of high-value care.7 Understanding the variation across institutions of troponin-only testing could inform how to promote high-value care recommendations nationwide. We aimed to describe patterns of troponin, myoglobin, and CK-MB testing in a sample of academic teaching hospitals before and after the Choosing Wisely® recommendation.
METHODS
Troponin, myoglobin, and CK-MB ordering data were extracted from Vizient’s (formerly University HealthSystem Consortium, Chicago, IL) Clinical Database/Resource Manager (CDB/RM®) for all patients with a principal discharge diagnosis of AMI at all hospitals reporting all 36 months from the fourth quarter of 2013 through the third quarter of 2016. This period includes time both before and after the Choosing Wisely® recommendation, which was released in the first quarter of 2015. Vizient’s CDB/RM contains ordering data for 300 academic medical centers and their affiliated hospitals and includes the discharge diagnoses for patients cared for by these institutions. Only patients with a principal discharge diagnosis of AMI were included because the Choosing Wisely® recommendation is specific with regard to troponin-only testing for the diagnosis of AMI. Patients with a principal diagnosis code for subcategories of myocardial ischemia (eg, stable angina, unstable angina) were not included because of the large number of diagnosis codes for these subcategories (more than 100 in the International Classification of Diseases, Ninth Revision and the International Classification of Diseases, Tenth Revision) and because the variation in their use across institutions within the dataset limited the utility of using these codes to consistently and accurately identify patients with myocardial ischemia. Moreover, the diagnosis of AMI encompasses the subcategories of myocardial ischemia.8
Hospital rates of ordering cardiac biomarkers (troponin-only or troponin and myoglobin/CK-MB) were determined overall for the entire study period and for each quarter of the study period based on the total patients with a discharge diagnosis of AMI. For each quarter of the 12 study quarters, all the hospitals were divided into tertiles based on their rate of troponin-only testing per discharge diagnosis of AMI. Hospitals were then classified into 3 groups based on their tertile ranking over the full 12 study quarters. The first group included hospitals whose rate of troponin-only testing placed them in the top tertile for each and all quarters throughout the study period. The second group included hospitals whose troponin-only testing rate placed them in the bottom tertile for each and all quarters throughout the study period. The third group included hospitals whose troponin-only testing rate each quarter led to either an increase or decrease in their tertile ranking throughout the study period. χ2 tests were used to test for bivariate associations among hospitals based on their rate of troponin-only testing and hospital size (number of beds), their regional geographic location, the volume of AMI patients seen at the hospital, whether the primary physician during the hospitalization was a cardiologist or other provider, and the hospitals’ quality ratings. Quality rating was based on an internal Vizient rating and the “Best Hospitals for Cardiology and Heart Surgery Rankings” as published in the US News & World Report.9 The Vizient quality rating is based on a composite score that combines scores from the domains of quality (hospital quality incentive scores), safety (patient safety indicators), patient-centeredness (Hospital Consumer Assessment of Healthcare Providers and Systems Hospital Survey), and equity (distribution of care by race/ethnicity, gender, and age). Simple slopes were calculated to determine the rate of change in troponin-only testing for each study quarter, and Student t tests were used to compare the rates of change of these simple slopes across study quarters.
RESULTS
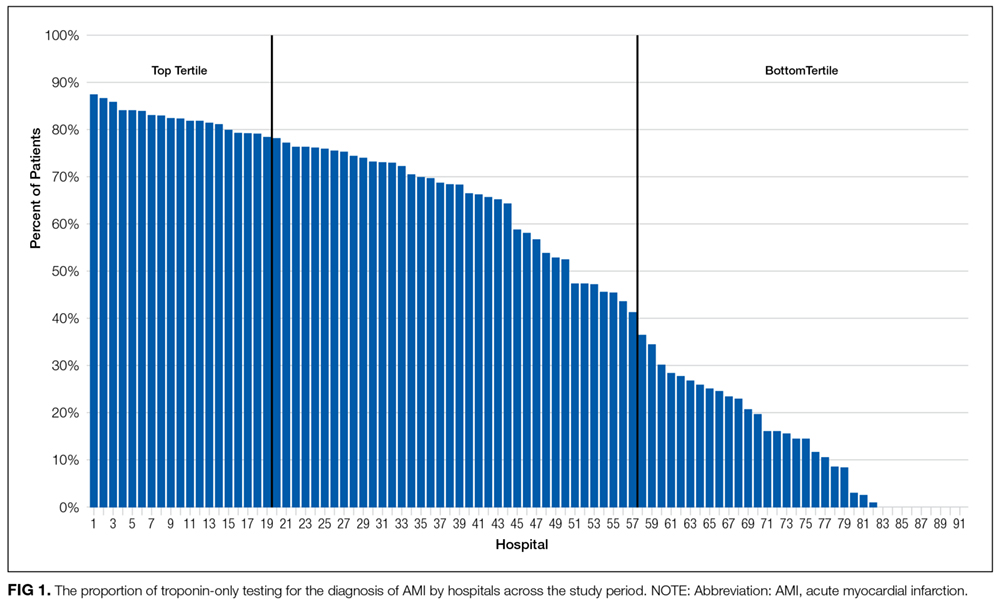
Pattern of Troponin-Only Testing by Hospital Size
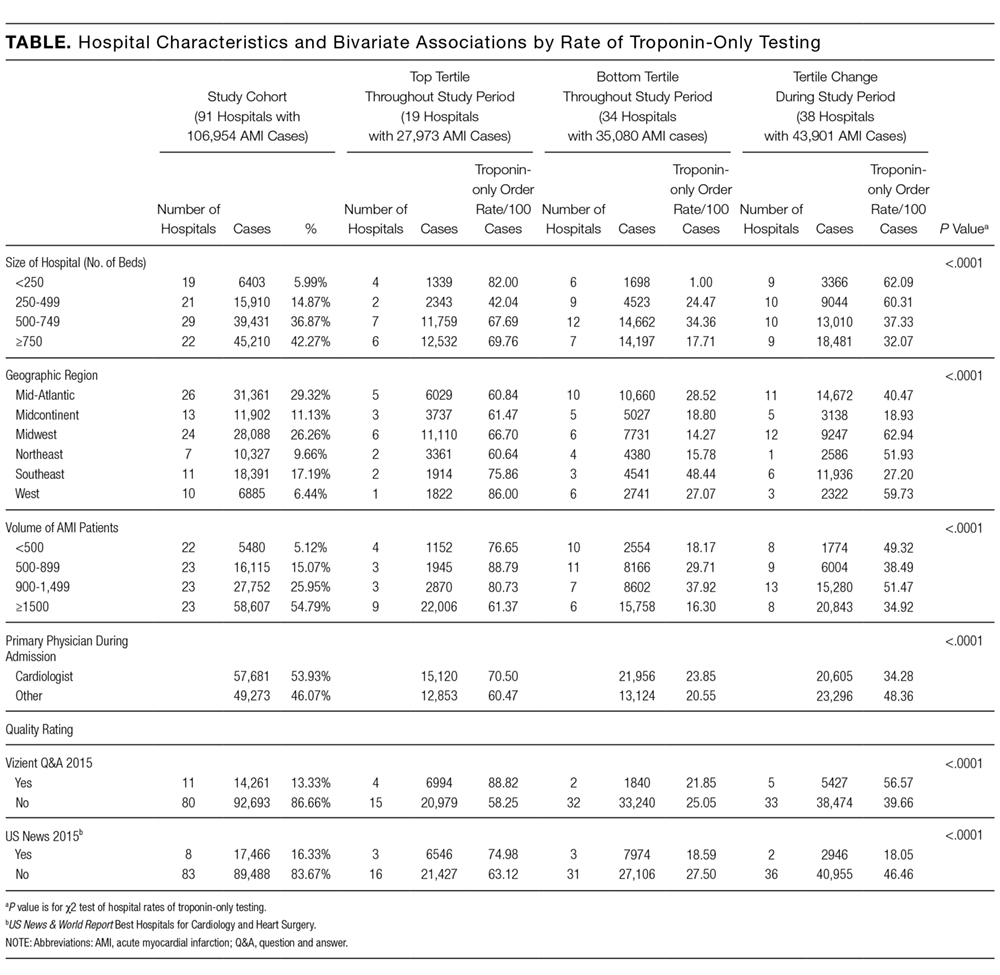
Pattern of Troponin-Only Testing by Geographic Region
The rate of troponin-only testing also varied and was statistically significantly different when comparing the 3 groups of hospitals across geographic regions of the country (P < 0.0001). Of the hospitals in the top tertile of troponin-only testing throughout the study period, the majority were in the Midwest (n = 6) and Mid-Atlantic (n = 5) regions. However, the rate of troponin-only testing for AMI in this group was highest in hospitals in the West (86/100 patients) and/or Southeast (75/100 patients) regions, although this rate was based on a small number of hospitals in these geographic areas (n = 1 in the West, n = 2 in the Southeast). Of hospitals in the bottom tertile of troponin-only testing throughout the study period, the majority were in the Mid-Atlantic region (n = 10). Hospitals that increased their troponin-only testing during the study period were predominantly in the Midwest (n = 12) and Mid-Atlantic regions (n = 11; Table), with the hospitals in the Midwest having the highest rate of troponin-only testing in this group.
Pattern of Troponin-Only Testing by Volume of AMI Patients
Of the hospitals in the top tertile of troponin-only testing during the study period, the majority cared for ≥1500 AMI patients (n = 9), but interestingly, among these hospitals, those caring for a smaller volume of AMI patients all had higher rates of troponin-only testing per 100 patients (P < 0.0001; Table). There was no other obvious pattern of troponin-only testing based on the volume of AMI patients cared for in hospitals in either the bottom tertile of troponin-only testing or hospitals that improved troponin-only testing during the study period.
Pattern of Troponin-Only Testing by Physician Type
Of the hospitals in the top tertile of troponin-only testing throughout the study period, those where a cardiologist cared for patients with AMI had higher rates of troponin-only testing (71/100 patients) than did hospitals where patients were cared for by a noncardiologist (60/100 patients). However, of the hospitals that improved their troponin-only testing during the study period, higher rates of troponin-only testing were seen in hospitals where patients were cared for by a noncardiologist (48/100 patients) compared with patients cared for by a cardiologist (34/100 patients; Table). These differences in hospital rates of troponin-only testing during the study period based on physician type were statistically significant (P < 0.0001; Table).
Pattern of Troponin-Only Testing by Quality Rating
Hospitals that were in the top tertile of troponin-only testing and were rated highly by Vizient’s quality rating or recognized as a top hospital by the US News & World Report had higher rates of troponin-only testing per 100 patients than did hospitals in the top tertile that were not ranked highly by Vizient’s quality rating or recognized as a top hospital by the US News & World Report. However, the majority of hospitals in the top tertile of troponin-only testing were not rated highly by Vizient (n = 15) or recognized as a top hospital by the US News & World Report (n = 16). The large majority of hospitals in the bottom tertile of troponin-only testing were not recognized as high-quality hospitals by Vizient (n = 32) or the US News & World Report (n = 31). Of the hospitals that improved their troponin-only testing during the study period, the majority were not recognized as high-quality hospitals by Vizient (n = 33) or the US News & World Report (n = 36), but among this group, those hospitals recognized by Vizient as high quality (n = 5) had the highest rate of troponin-only testing (57/100 patients). The differences in the rate of troponin-only testing across the different groups of hospitals and quality ratings were statistically significant (P < 0.0001; Table).
The Effect of Choosing Wisely® on Troponin-Only Testing
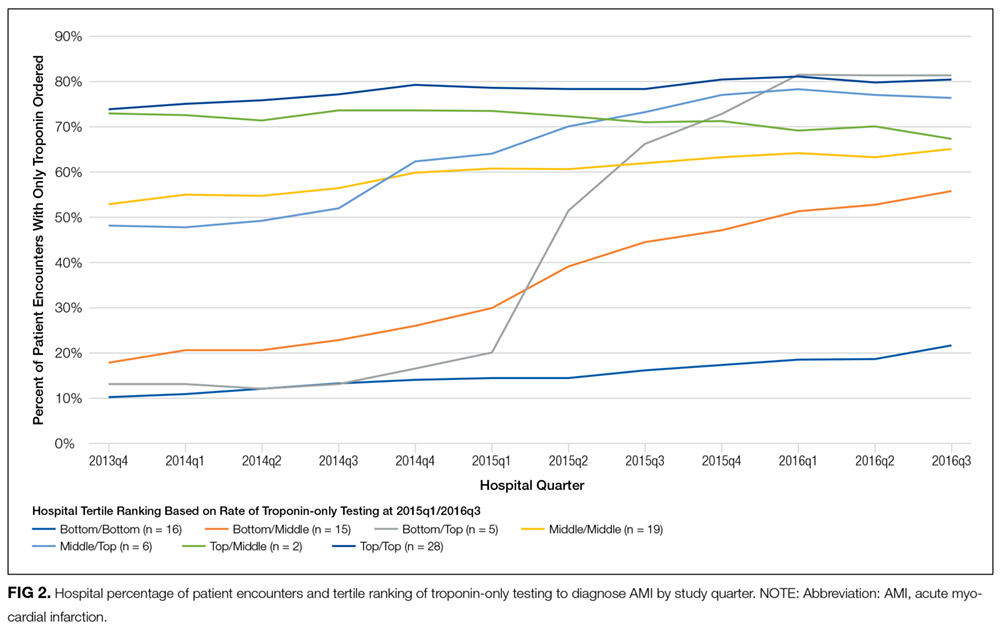
DISCUSSION
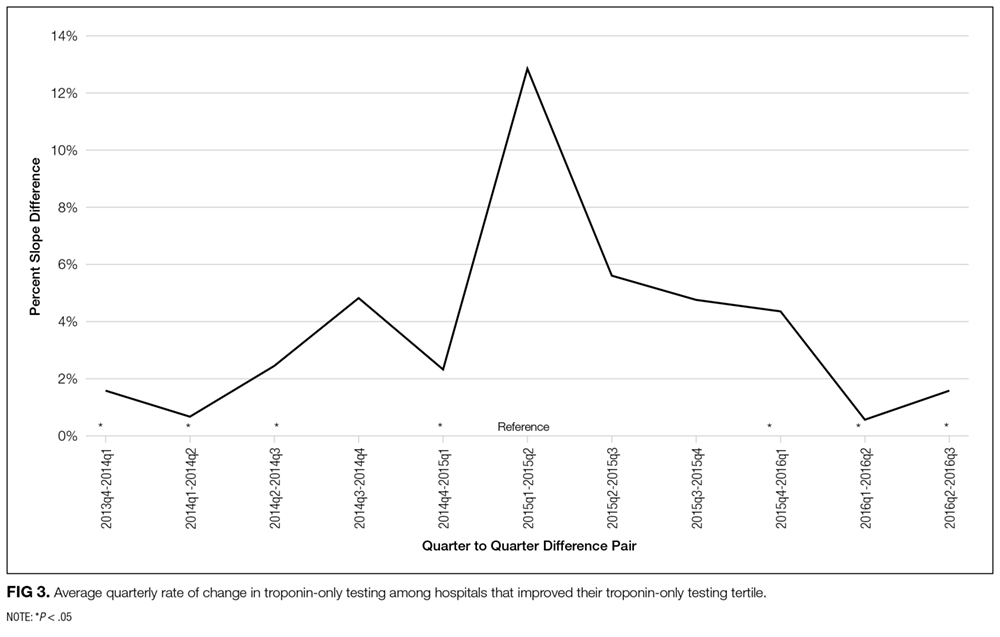
In the hospitals that demonstrated increasing adoption of troponin-only testing, there are several interesting patterns. First, among these hospitals, smaller hospitals tended to have higher overall rates of troponin-only testing per 100 patients than larger hospitals. Additionally, the hospitals with the highest rates were located in the Midwest region. These hospitals may be learning from and following the high-performing institutions observed in our data that are also located in the Midwest. Additionally, among the hospitals that significantly increased their rate of troponin-only testing, we see that the Choosing Wisely® recommendation appeared to facilitate accelerated adoption of troponin-only testing. In these institutions, it is likely that the impact of Choosing Wisely® was significant because there was attention to high-value care and already an existing movement underway to institute such high-value practices. For example, natural champions, leadership, infrastructure, and a supportive culture may all be prerequisites for Choosing Wisely® recommendations to become institutionally adopted.
Lastly, in the hospitals that have continued to order myoglobin and CK-MB, future work is needed to understand and overcome barriers to adopting high-value care practices.
There are several limitations to this study. First, because this was an observational study, we cannot prove a causal relationship between the Choosing Wisely® recommendation and the increased rates of troponin-only testing. Additionally, the Vizient CDB/RM contains reporting data for a limited number of academic medical centers only, and therefore, these results may not represent practices at nonacademic or even other academic medical centers. Our study only included patients with a principal discharge diagnosis of AMI because the Choosing Wisely® recommendation to order troponin-only is specific for diagnosing patients with AMI. However, it is possible that the Choosing Wisely® recommendation also has affected provider ordering in patients with diagnoses such as chest pain or angina, and these affects would not be captured in our study. Lastly, because instituting high-value care practices take time, our follow-up time may not have been long enough to capture improvement in troponin-only testing at institutions responding to and attempting to adhere to the Choosing Wisely® recommendation to order troponin-only testing for patients with AMI.
Disclosure
No other individuals besides the authors contributed to this work. This project was not funded or supported by any external grant or agency. Dr. Prochaska’s institute received funding from the Agency for Research Healthcare and Quality for a K12 Career Development Grant (AHRQ K12 HS023007) outside the submitted work. Dr. Hohmann and Dr Modes have nothing to disclose. Dr. Arora receives financial compensation as a member of the Board of Directors for the American Board of Internal Medicine and has received grant funding from the ABIM Foundation. She also receives royalties from McGraw Hill.
1. Pickering JW, Than MP, Cullen L, et al. Rapid rule-out of acute myocardial infarction with a single high-sensitivity cardiac troponin t measurement below the limit of detection: A collaborative meta-analysis. Ann Intern Med. 2017;166(10):715-724. PubMed
2. American Society for Clinical Pathology. Don’t test for myoglobin or CK-MB in the diagnosis of acute myocardial infarction (AMI). Instead, use troponin I or T. http://www.choosingwisely.org/clinician-lists/american-society-clinical-pathology-myoglobin-to-diagnose-acute-myocardial-infarction/. Accessed August 3, 2016.
3. Amsterdam EA, Wenger NK, Brindis RG, et al. 2014 AHA/ACC guideline for the management of patients with non–st-elevation acute coronary syndromes. Circulation. 2014;130(25):e344-e426. PubMed
4. Larochelle MR, Knight AM, Pantle H, Riedel S, Trost JC. Reducing excess cardiac biomarker testing at an academic medical center. J Gen Intern Med. 2014;29(11):1468-1474. PubMed
5. Le RD, Kosowsky JM, Landman AB, Bixho I, Melanson SEF, Tanasijevic MJ. Clinical and financial impact of removing creatine kinase-MB from the routine testing menu in the emergency setting. Am J Emerg Med. 2015;33(1):72-75. PubMed
6. Rosenberg A, Agiro A, Gottlieb M, et al. Early trends among seven recommendations from the choosing wisely campaign. JAMA Intern Med. 2015;175(12):1913. PubMed
7. Wolfson DB. Choosing Wisely recommendations using administrative claims data. JAMA Intern Med. 2016;176(4):565-565. PubMed
8. Thygesen K, Alpert JS, Jaffe AS, Simoons ML, Chaitman BR, White HD. Third universal definition of myocardial infarction. Circulation. 2012;126(16):2020-2035. PubMed
9. US News & World Report. Best hospitals for cardiology & heart surgery. http://health.usnews.com/best-hospitals/rankings/cardiology-and-heart-surgery. Accessed April 19, 2017.
10. Bradley EH, Curry LA, Ramanadhan S, Rowe L, Nembhard IM, Krumholz HM. Research in action: using positive deviance to improve quality of health care. Implement Sci IS. 2009;4:25. PubMed
Evidence suggests that troponin-only testing is the superior strategy to diagnose acute myocardial infarction (AMI).1 Because of this, in February 2015, the Choosing Wisely® campaign issued a recommendation to use troponin I or T to diagnose AMI, and not to test for myoglobin or creatine kinase-MB (CK-MB).2 This recommendation was in line with guidelines from the American Heart Association and the American College of Cardiology, which recommended that myoglobin and CK-MB are not useful and offer no benefit for the diagnosis of acute coronary syndrome.3 Some institutions have developed interventions to promote troponin-only testing, reporting substantial cost savings and no negative consequences.4,5
Despite these successes, it is likely that institutions vary with respect to the adoption of the Choosing Wisely® troponin-only testing recommendation.6 Implementing this recommendation requires both promoting clinician behavior change and a strong institutional culture of high-value care.7 Understanding the variation across institutions of troponin-only testing could inform how to promote high-value care recommendations nationwide. We aimed to describe patterns of troponin, myoglobin, and CK-MB testing in a sample of academic teaching hospitals before and after the Choosing Wisely® recommendation.
METHODS
Troponin, myoglobin, and CK-MB ordering data were extracted from Vizient’s (formerly University HealthSystem Consortium, Chicago, IL) Clinical Database/Resource Manager (CDB/RM®) for all patients with a principal discharge diagnosis of AMI at all hospitals reporting all 36 months from the fourth quarter of 2013 through the third quarter of 2016. This period includes time both before and after the Choosing Wisely® recommendation, which was released in the first quarter of 2015. Vizient’s CDB/RM contains ordering data for 300 academic medical centers and their affiliated hospitals and includes the discharge diagnoses for patients cared for by these institutions. Only patients with a principal discharge diagnosis of AMI were included because the Choosing Wisely® recommendation is specific with regard to troponin-only testing for the diagnosis of AMI. Patients with a principal diagnosis code for subcategories of myocardial ischemia (eg, stable angina, unstable angina) were not included because of the large number of diagnosis codes for these subcategories (more than 100 in the International Classification of Diseases, Ninth Revision and the International Classification of Diseases, Tenth Revision) and because the variation in their use across institutions within the dataset limited the utility of using these codes to consistently and accurately identify patients with myocardial ischemia. Moreover, the diagnosis of AMI encompasses the subcategories of myocardial ischemia.8
Hospital rates of ordering cardiac biomarkers (troponin-only or troponin and myoglobin/CK-MB) were determined overall for the entire study period and for each quarter of the study period based on the total patients with a discharge diagnosis of AMI. For each quarter of the 12 study quarters, all the hospitals were divided into tertiles based on their rate of troponin-only testing per discharge diagnosis of AMI. Hospitals were then classified into 3 groups based on their tertile ranking over the full 12 study quarters. The first group included hospitals whose rate of troponin-only testing placed them in the top tertile for each and all quarters throughout the study period. The second group included hospitals whose troponin-only testing rate placed them in the bottom tertile for each and all quarters throughout the study period. The third group included hospitals whose troponin-only testing rate each quarter led to either an increase or decrease in their tertile ranking throughout the study period. χ2 tests were used to test for bivariate associations among hospitals based on their rate of troponin-only testing and hospital size (number of beds), their regional geographic location, the volume of AMI patients seen at the hospital, whether the primary physician during the hospitalization was a cardiologist or other provider, and the hospitals’ quality ratings. Quality rating was based on an internal Vizient rating and the “Best Hospitals for Cardiology and Heart Surgery Rankings” as published in the US News & World Report.9 The Vizient quality rating is based on a composite score that combines scores from the domains of quality (hospital quality incentive scores), safety (patient safety indicators), patient-centeredness (Hospital Consumer Assessment of Healthcare Providers and Systems Hospital Survey), and equity (distribution of care by race/ethnicity, gender, and age). Simple slopes were calculated to determine the rate of change in troponin-only testing for each study quarter, and Student t tests were used to compare the rates of change of these simple slopes across study quarters.
RESULTS
Pattern of Troponin-Only Testing by Hospital Size
Pattern of Troponin-Only Testing by Geographic Region
The rate of troponin-only testing also varied and was statistically significantly different when comparing the 3 groups of hospitals across geographic regions of the country (P < 0.0001). Of the hospitals in the top tertile of troponin-only testing throughout the study period, the majority were in the Midwest (n = 6) and Mid-Atlantic (n = 5) regions. However, the rate of troponin-only testing for AMI in this group was highest in hospitals in the West (86/100 patients) and/or Southeast (75/100 patients) regions, although this rate was based on a small number of hospitals in these geographic areas (n = 1 in the West, n = 2 in the Southeast). Of hospitals in the bottom tertile of troponin-only testing throughout the study period, the majority were in the Mid-Atlantic region (n = 10). Hospitals that increased their troponin-only testing during the study period were predominantly in the Midwest (n = 12) and Mid-Atlantic regions (n = 11; Table), with the hospitals in the Midwest having the highest rate of troponin-only testing in this group.
Pattern of Troponin-Only Testing by Volume of AMI Patients
Of the hospitals in the top tertile of troponin-only testing during the study period, the majority cared for ≥1500 AMI patients (n = 9), but interestingly, among these hospitals, those caring for a smaller volume of AMI patients all had higher rates of troponin-only testing per 100 patients (P < 0.0001; Table). There was no other obvious pattern of troponin-only testing based on the volume of AMI patients cared for in hospitals in either the bottom tertile of troponin-only testing or hospitals that improved troponin-only testing during the study period.
Pattern of Troponin-Only Testing by Physician Type
Of the hospitals in the top tertile of troponin-only testing throughout the study period, those where a cardiologist cared for patients with AMI had higher rates of troponin-only testing (71/100 patients) than did hospitals where patients were cared for by a noncardiologist (60/100 patients). However, of the hospitals that improved their troponin-only testing during the study period, higher rates of troponin-only testing were seen in hospitals where patients were cared for by a noncardiologist (48/100 patients) compared with patients cared for by a cardiologist (34/100 patients; Table). These differences in hospital rates of troponin-only testing during the study period based on physician type were statistically significant (P < 0.0001; Table).
Pattern of Troponin-Only Testing by Quality Rating
Hospitals that were in the top tertile of troponin-only testing and were rated highly by Vizient’s quality rating or recognized as a top hospital by the US News & World Report had higher rates of troponin-only testing per 100 patients than did hospitals in the top tertile that were not ranked highly by Vizient’s quality rating or recognized as a top hospital by the US News & World Report. However, the majority of hospitals in the top tertile of troponin-only testing were not rated highly by Vizient (n = 15) or recognized as a top hospital by the US News & World Report (n = 16). The large majority of hospitals in the bottom tertile of troponin-only testing were not recognized as high-quality hospitals by Vizient (n = 32) or the US News & World Report (n = 31). Of the hospitals that improved their troponin-only testing during the study period, the majority were not recognized as high-quality hospitals by Vizient (n = 33) or the US News & World Report (n = 36), but among this group, those hospitals recognized by Vizient as high quality (n = 5) had the highest rate of troponin-only testing (57/100 patients). The differences in the rate of troponin-only testing across the different groups of hospitals and quality ratings were statistically significant (P < 0.0001; Table).
The Effect of Choosing Wisely® on Troponin-Only Testing
DISCUSSION
In the hospitals that demonstrated increasing adoption of troponin-only testing, there are several interesting patterns. First, among these hospitals, smaller hospitals tended to have higher overall rates of troponin-only testing per 100 patients than larger hospitals. Additionally, the hospitals with the highest rates were located in the Midwest region. These hospitals may be learning from and following the high-performing institutions observed in our data that are also located in the Midwest. Additionally, among the hospitals that significantly increased their rate of troponin-only testing, we see that the Choosing Wisely® recommendation appeared to facilitate accelerated adoption of troponin-only testing. In these institutions, it is likely that the impact of Choosing Wisely® was significant because there was attention to high-value care and already an existing movement underway to institute such high-value practices. For example, natural champions, leadership, infrastructure, and a supportive culture may all be prerequisites for Choosing Wisely® recommendations to become institutionally adopted.
Lastly, in the hospitals that have continued to order myoglobin and CK-MB, future work is needed to understand and overcome barriers to adopting high-value care practices.
There are several limitations to this study. First, because this was an observational study, we cannot prove a causal relationship between the Choosing Wisely® recommendation and the increased rates of troponin-only testing. Additionally, the Vizient CDB/RM contains reporting data for a limited number of academic medical centers only, and therefore, these results may not represent practices at nonacademic or even other academic medical centers. Our study only included patients with a principal discharge diagnosis of AMI because the Choosing Wisely® recommendation to order troponin-only is specific for diagnosing patients with AMI. However, it is possible that the Choosing Wisely® recommendation also has affected provider ordering in patients with diagnoses such as chest pain or angina, and these affects would not be captured in our study. Lastly, because instituting high-value care practices take time, our follow-up time may not have been long enough to capture improvement in troponin-only testing at institutions responding to and attempting to adhere to the Choosing Wisely® recommendation to order troponin-only testing for patients with AMI.
Disclosure
No other individuals besides the authors contributed to this work. This project was not funded or supported by any external grant or agency. Dr. Prochaska’s institute received funding from the Agency for Research Healthcare and Quality for a K12 Career Development Grant (AHRQ K12 HS023007) outside the submitted work. Dr. Hohmann and Dr Modes have nothing to disclose. Dr. Arora receives financial compensation as a member of the Board of Directors for the American Board of Internal Medicine and has received grant funding from the ABIM Foundation. She also receives royalties from McGraw Hill.
1. Pickering JW, Than MP, Cullen L, et al. Rapid rule-out of acute myocardial infarction with a single high-sensitivity cardiac troponin t measurement below the limit of detection: A collaborative meta-analysis. Ann Intern Med. 2017;166(10):715-724. PubMed
2. American Society for Clinical Pathology. Don’t test for myoglobin or CK-MB in the diagnosis of acute myocardial infarction (AMI). Instead, use troponin I or T. http://www.choosingwisely.org/clinician-lists/american-society-clinical-pathology-myoglobin-to-diagnose-acute-myocardial-infarction/. Accessed August 3, 2016.
3. Amsterdam EA, Wenger NK, Brindis RG, et al. 2014 AHA/ACC guideline for the management of patients with non–st-elevation acute coronary syndromes. Circulation. 2014;130(25):e344-e426. PubMed
4. Larochelle MR, Knight AM, Pantle H, Riedel S, Trost JC. Reducing excess cardiac biomarker testing at an academic medical center. J Gen Intern Med. 2014;29(11):1468-1474. PubMed
5. Le RD, Kosowsky JM, Landman AB, Bixho I, Melanson SEF, Tanasijevic MJ. Clinical and financial impact of removing creatine kinase-MB from the routine testing menu in the emergency setting. Am J Emerg Med. 2015;33(1):72-75. PubMed
6. Rosenberg A, Agiro A, Gottlieb M, et al. Early trends among seven recommendations from the choosing wisely campaign. JAMA Intern Med. 2015;175(12):1913. PubMed
7. Wolfson DB. Choosing Wisely recommendations using administrative claims data. JAMA Intern Med. 2016;176(4):565-565. PubMed
8. Thygesen K, Alpert JS, Jaffe AS, Simoons ML, Chaitman BR, White HD. Third universal definition of myocardial infarction. Circulation. 2012;126(16):2020-2035. PubMed
9. US News & World Report. Best hospitals for cardiology & heart surgery. http://health.usnews.com/best-hospitals/rankings/cardiology-and-heart-surgery. Accessed April 19, 2017.
10. Bradley EH, Curry LA, Ramanadhan S, Rowe L, Nembhard IM, Krumholz HM. Research in action: using positive deviance to improve quality of health care. Implement Sci IS. 2009;4:25. PubMed
© 2017 Society of Hospital Medicine
Returns to Emergency Department, Observation, or Inpatient Care Within 30 Days After Hospitalization in 4 States, 2009 and 2010 Versus 2013 and 2014
Given the frequency, potential preventability, and costs associated with hospital readmissions, reducing readmissions is a priority in efforts to improve the quality and value of healthcare.1,2 State and national bodies have created diverse initiatives to facilitate improvements in hospital discharge practices and reduce 30-day readmission rates across payers.3-5 For example, the Agency for Healthcare Research and Quality (AHRQ) and the Institute for Healthcare Improvement have published tools for improving discharge practices.6,7 Medicare instituted financial penalties for hospitals with higher-than-expected readmission rates for acute myocardial infarction (AMI), heart failure (HF), and pneumonia in 2012, while private payers and Medicaid programs have established their own policies.8-13 Furthermore, private payers and Medicaid programs shifted toward capitated and value-based reimbursement models in which readmissions lead to financial losses for hospitals.14,15 Accordingly, hospitals have implemented diverse interventions to reduce readmissions.16,17 From 2009 to 2013, 30-day readmissions declined among privately insured adults (from 12.4% to 11.7%), Medicare patients (from 22.0% to 20.0%), and uninsured individuals (11.5% to 11.0%) but climbed among patients with Medicaid (from 19.8% to 20.5%) after index admissions for AMI, HF, pneumonia, or chronic obstructive pulmonary disease.18
To date, research, policies, and quality improvement interventions have largely focused on improvements to one aspect of the system of care—that provided in the inpatient setting—among older adults with Medicare. Yet, inpatient readmissions may underestimate how often patients return to the hospital because patients can be placed under observation or stabilized and discharged from the emergency department (ED) instead of being readmitted. Observation and ED visits are less costly to payers than inpatient admissions.19 Thus, information about utilization of inpatient, observation, and ED visits within 30 days of hospital discharge may be more informative than inpatient readmissions alone. However, little is known about trends in returns to the hospital for observation and ED visits and whether such trends vary by payer.
Our objective was to assess whether changes have occurred in rates of total 30-day, all-cause, unplanned returns to the hospital among adults with index admissions for AMI, HF, and pneumonia in which returns to the hospital included inpatient readmissions, observation visits, and ED visits. We also assessed whether changes in the rate of hospital inpatient readmissions coincided with changes in rates of returns for ED or observation visits. To examine the effects of readmission policies implemented by diverse payers and broad changes to the health system following the Affordable Care Act, we compared data from 201 hospitals in 4 states in 2009 and 2010 with data from the same hospitals for 2013 and 2014.
METHODS
Data Sources, Populations, and Study Variables
We used Healthcare Cost and Utilization Project (HCUP) State Inpatient Databases, State Emergency Department Databases, and State Ambulatory Surgery and Services Databases from Georgia, Nebraska, South Carolina, and Tennessee. These states comprise 7% of the US population and were the only states with data that included all observation and ED visits as well as encrypted patient identification numbers that permitted linkage across facilities and hospitals.20
Index admissions for patients aged 18 years and older were eligible if they occurred at nonfederal general medical/surgical hospitals (excluding critical access hospitals) that had at least 1 index admission per target condition per year and at least 5 inpatient, observation, and ED visits for any condition per year.
We classified patients into the following 4 populations by age and insurance coverage: 18 to 64 years with private insurance, 65 years and older with Medicare (excluding younger adults with Medicare), 18 to 64 years with Medicaid, and 18 to 64 years without insurance. We identified patients aged 65 years and older with Medicare by using the primary or secondary expected payer for the index admission. This group included patients who were dually eligible for Medicare and Medicaid. If Medicare was not the primary or secondary payer, we used the primary payer to identify Medicaid, privately insured, and uninsured patients aged 18 to 64 years. None of the states expanded Medicaid coverage during the years studied.
The primary outcome of interest was the rate of having 1 or more all-cause, unplanned return(s) to an acute care hospital within 30 days of discharge after an index admission for AMI, HF, and pneumonia as defined by a modified version of Centers for Medicare & Medicaid Services’ readmission metrics.21,22 We examined total return rates as well as rates for inpatient, observation, and ED care. We also examined the leading diagnoses associated with returns to the hospital. For each index admission, we included only 1 return visit, giving priority to inpatient readmissions, then observation visits, and then ED visits.
The HCUP databases are consistent with the definition of limited data sets under the Health Insurance Portability and Accountability Act Privacy Rule and contain no direct patient identifiers. The AHRQ Institutional Review Board considers research using HCUP data to have exempt status.
Statistical Analysis
To compare rates at which patients returned to the hospital during 2 cohort periods (2009 and 2010 vs 2013 and 2014), we used coarsened exact matching, a well-established matching technique for balancing covariates between 2 populations of patients that may be related to the outcome.23 For observational datasets, coarsened exact matching is preferable to traditional matching because it enables the investigator to assess balance between the 2 populations, select the desired degree of balance, and eliminate observations for which comparable matches cannot be found.
We assembled sets of index admissions in each study period that were similar with respect to payer, primary diagnosis, and other factors. Matching variables included the patient’s age group, sex, and Elixhauser Comorbidity Index24 (in deciles), as well as the hospital’s ratio of observation visits relative to inpatient admissions in 2009 and 2010 combined (in quartiles; see supplementary Appendix). For Medicare beneficiaries, we also matched on dual enrollment in Medicaid.
We conducted the matching process separately for each target condition and payer population. First, we grouped index admissions in both periods into strata defined by all possible combinations of the matching variables and allowing one-to-many random matching within strata. We then dropped records in any strata for which there were no records in 1 of the time periods. Finally, we calculated weights based on the size of each stratum. We used these weights to account for the different numbers of index admissions in each stratum between the 2 study periods. For example, if a stratum contained 10 index admissions in 2009 and 2010 combined and 20 in 2013 and 2014 combined, an admission weighed double in the earlier period. After weighting, the index admissions in each period (2009 and 2010; 2013 and 2014) had similar characteristics (Table 1).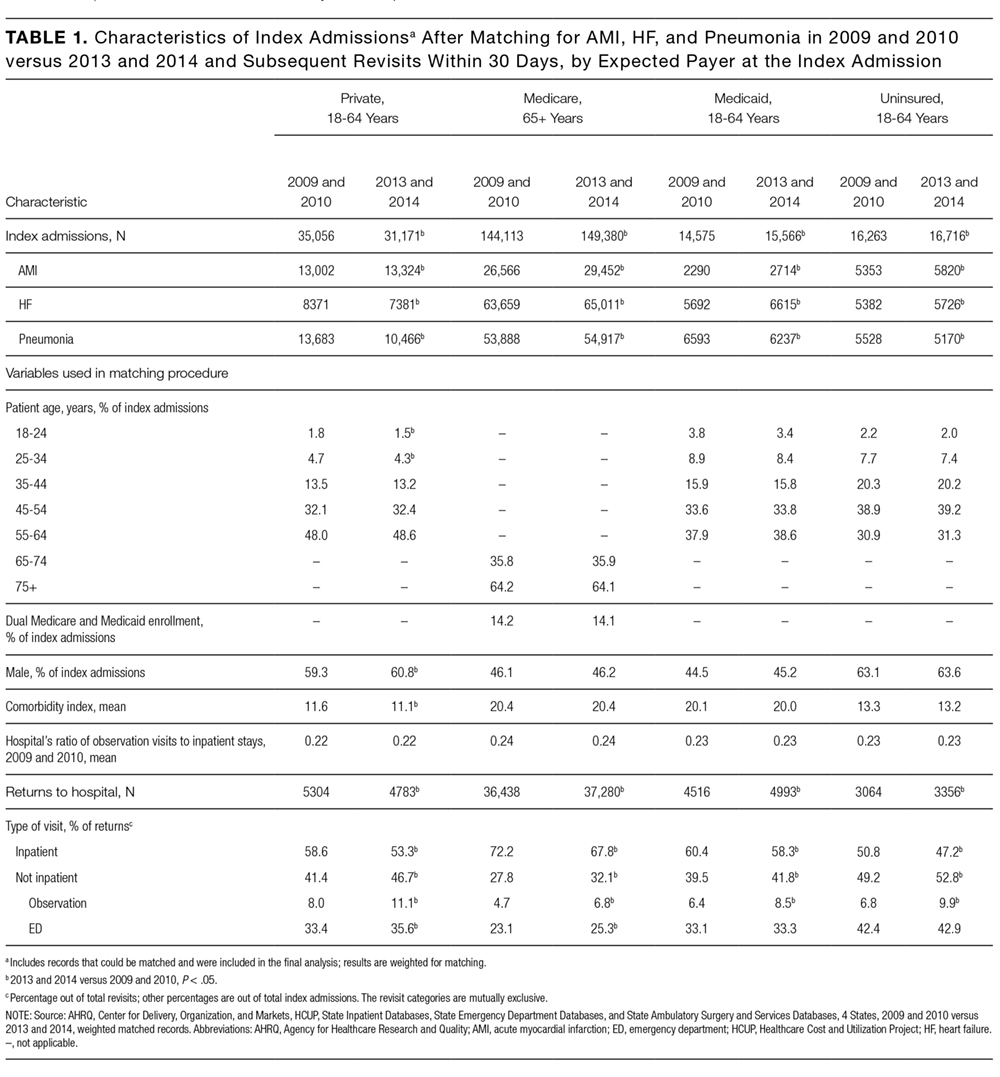
RESULTS
There were 423,503 eligible index admissions for AMI, HF, and pneumonia in the 2 periods combined; 422,840 (99.8%) were successfully matched and included in this analysis. After matching weights were applied, there were few statistically significant differences across the 2 time periods (see Table 1 and supplementary Appendix).
From 2009 and 2010 to 2013 and 2014, the percentage of patients hospitalized for AMI, HF, and pneumonia who had only observation or ED visits when they returned to the hospital increased from 41.4% to 46.7% among patients with private insurance (P < 0.001), from 27.8% to 32.1% among older patients with Medicare (P < 0.001), from 39.5% to 41.8% among patients with Medicaid (P = 0.03), and from 49.2% to 52.8% among patients without insurance (P = 0.004; Table 1). The percentage of returns to the hospital for observation increased across all payers (P < 0.001); in 2013 and 2014 combined, observation visits ranged from 6.8% of hospital returns among patients with Medicare to 11.1% among patients with private insurance. The percentage of returns to the hospital for an ED visit increased among patients with private insurance (P = 0.02) and Medicare (P < 0.001); in 2013 and 2014, ED visits ranged from 25.3% of returns to the hospital among patients with Medicare to 42.9% among uninsured patients.
The increases in 30-day observation and ED visits coincided with reductions in inpatient readmissions among patients with private insurance and Medicare and contributed to growth in total returns to the hospital among patients with Medicaid or no insurance (Figure 1).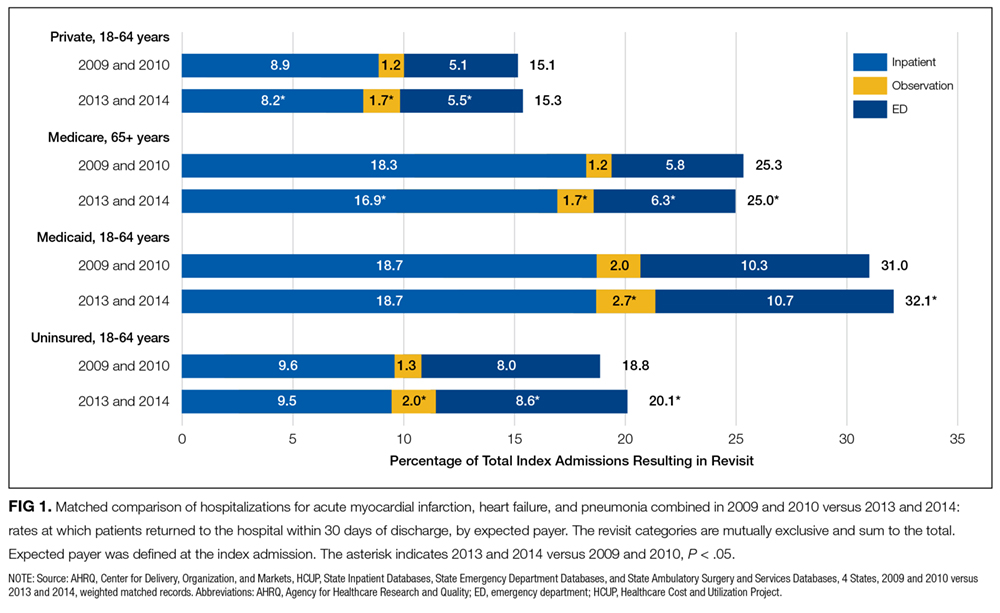
Figure 2 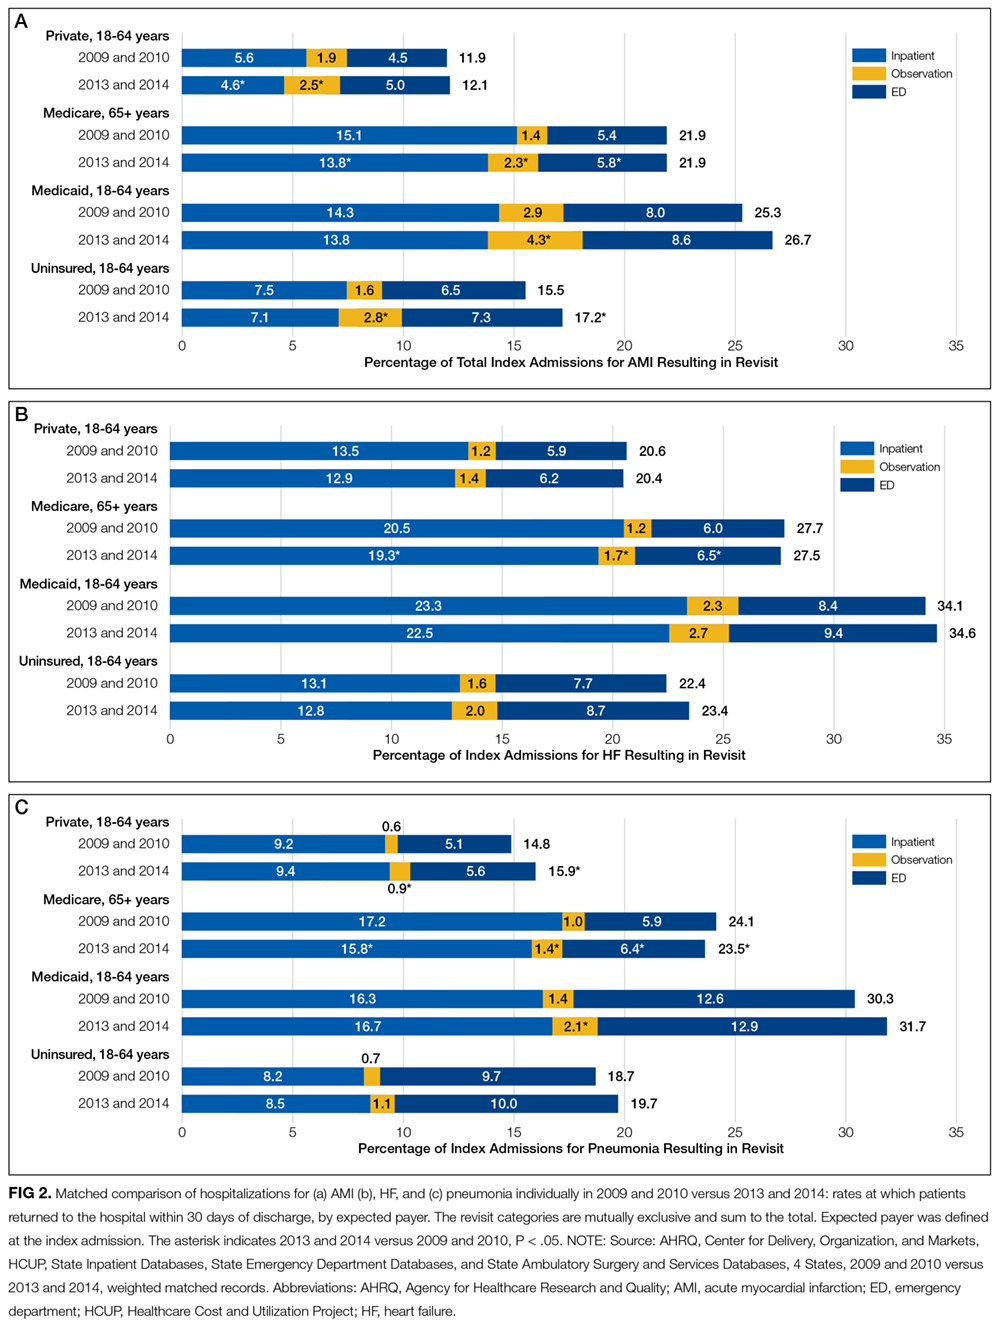
Patients initially hospitalized for HF and pneumonia who returned to the hospital within 30 days often returned for the same conditions (Table 2).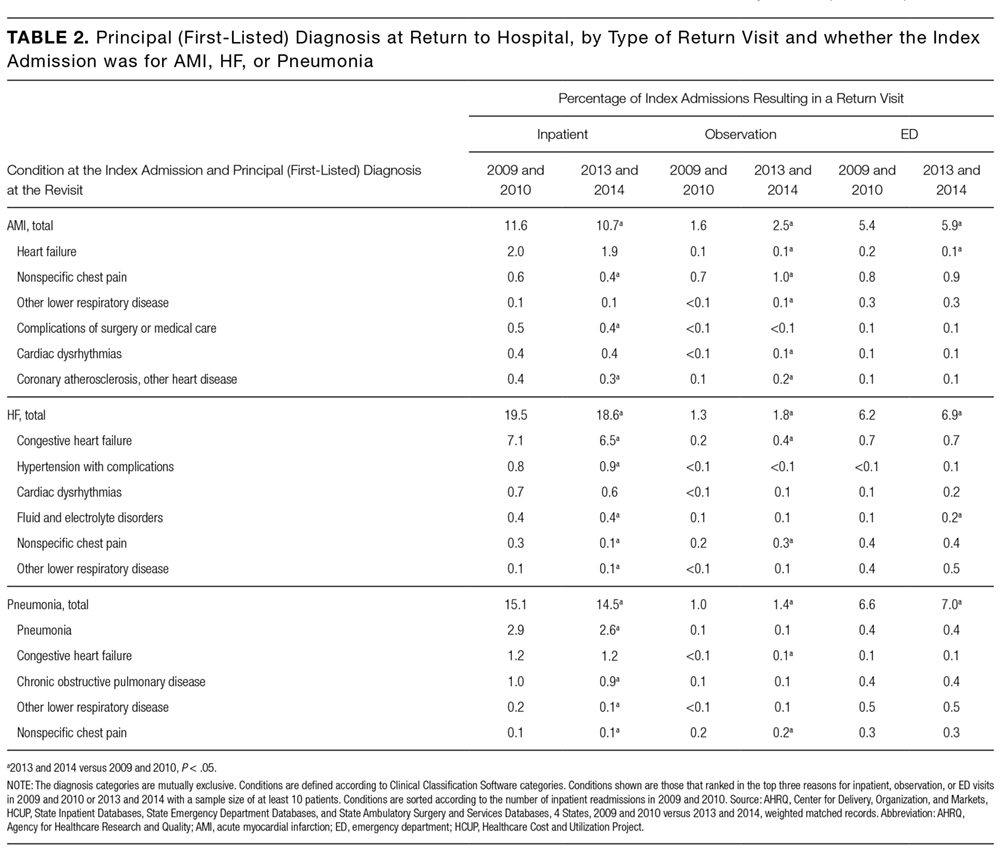
DISCUSSION
Matching index admissions for AMI, HF, or pneumonia in 201 hospitals in 2009 and 2010 with those in 2013 and 2014, we observed that increases in observation and ED visits coincided with reductions in inpatient readmissions among patients with private insurance and Medicare and contributed to growth in total returns to the hospital among patients with Medicaid or no insurance. Among patients with private insurance and Medicare, inpatient readmissions declined significantly for all 3 target conditions, but total returns to the hospital remained constant for AMI and HF, rose for privately insured patients with pneumonia, and declined modestly for Medicare patients with pneumonia. Inpatient readmissions were unchanged for adults aged 18 to 64 years with Medicaid or no insurance, but total returns to the hospital increased significantly, reaching 32% among those with Medicaid.
These findings add to recent literature, which has primarily emphasized inpatient readmissions among Medicare beneficiaries with several exceptions. A prior analysis indicates that readmissions have declined among diverse payer populations nationally.18 Gerhardt et al25 found that from 2011 to 2012, all-cause 30-day readmissions declined among fee-for-service (FFS) Medicare beneficiaries following any index admission, while ED revisits remained stable and observation revisits increased slightly. Evaluating the CMS Hospital Readmission Reductions Program (HRRP), Zuckerman et al17 reported that from 2007 to 2015, inpatient readmissions declined among FFS Medicare beneficiaries aged 65 years and older who were hospitalized with AMI, HF, or pneumonia, while returns to the hospital for observation rose approximately 2%; ED visits were not included. We found that Medicare (FFS and Medicare Advantage) patients with AMI and HF returned to the hospital with the same frequency in 2009 and 2010 as in 2013 and 2014, and those patients with pneumonia returned slightly less often. In aggregate, declines in inpatient readmissions in the 4 states we studied coincided with increases in observation and ED care. Moreover, these shifts occurred not only among Medicare beneficiaries but also among privately insured adults, Medicaid recipients, and the uninsured.
Three factors may have contributed to these apparent shifts from readmissions to observation and ED visits. First, some authors have suggested that hospitals may reduce readmissions by intentionally placing some of the patients who return to the hospital under observation instead of admitting them.17,26 If true, hospitals with greater declines in readmissions would have larger increases in observation revisits. Zuckerman et al17 found no correlation among Medicare beneficiaries between hospital-level trends in observation revisits and readmissions, but returns to observation rose more rapidly for AMI, HF, and pneumonia (compared with other conditions) during long term follow-up than during the HRRP implementation period. Other authors have documented that declines in readmissions have been greatest at hospitals with the highest baseline readmission rates,27,28 and hospitals with lower readmission rates have more observation return visits.29
Second, shifts from inpatient readmissions to return visits for observation may reflect unintentional rather than intentional changes in the services provided. Clinical practice patterns are evolving such that patients who present to the hospital for acute care increasingly are placed under observation or discharged from the ED instead of being admitted, regardless of whether they recently were hospitalized.30 Inpatient admissions, which are strongly correlated with readmission rates,28,31 are declining nationally,32 and both observation and ED visits are rising.33-35 Although little is known about effects on health outcomes and patient out-of-pocket costs,shifts from inpatient admissions to observation and ED visits reduce costs to payers.36,37
Third, instead of substitution, more patients may be returning for lower-acuity conditions that can be treated in the ED or under observation. Hospitals are implementing diverse and multifaceted interventions to reduce readmissions that can involve assessing patient needs and the risk for readmission, educating patients about self-care and risks after discharge, reconciling medication, scheduling follow-up visits, and monitoring patients through telephone calls and home nursing visits.26,38,39 Although the intent may be to reduce patients’ need to return to the hospital, interventions that educate patients about risks after discharge may lower the threshold at which they find symptoms worrisome enough to return. This could increase lower-acuity return visits. We found that reasons for returning were similar in 2009 and 2010 versus 2013 and 2014, but we did not examine acuity of illness at the time of return.
Other areas of concern are the high rates at which Medicaid patients are returning to the hospital and the increases in rates of returns among Medicaid patients and the uninsured. Individuals in these disadvantaged populations may be having difficulty accessing ambulatory care or may be turning to the ED more often for lower acuity problems that arise after discharge. In 3 of the 4 states we studied, 15% to 16% of adults live in poverty and 10% to 30% live in primary care health professional shortage areas.40,41 Given the implications for patient outcomes and costs, trends among these populations warrant further scrutiny.42,43
This analysis has several limitations. Data were from 4 states, but trends in readmissions are similar nationally. From 2010 through 2015, the all-condition readmission rate declined by 8% among Medicare beneficiaries nationally and by 6.1% in South Carolina, 7.4% in Georgia, 8.3% in Nebraska, and 8.7% in Tennessee.44 We report trends across hospitals and did not examine hospital-level revisits. Therefore, further research is needed to determine whether these findings are related to co-occurring trends, intentional substitution, or other factors.
In conclusion, measuring inpatient readmissions without accounting for return visits to the ED and observation underestimates the rate at which patients return to the hospital following an inpatient hospitalization. Because of growth in observation and ED visits, trends in the total rates at which patients return to the hospital can differ from trends in inpatient readmissions. In the 4 states we studied, total return rates were particularly high and rising among patients with Medicaid and lower, but also rising, among the uninsured. Policy analysts and researchers should investigate the factors contributing to growth in readmissions in these vulnerable populations and determine whether similar trends are occurring nationwide. Hospitalists play critical roles in admitting and discharging inpatients, caring for patients under observation, and implementing quality improvement programs. Irrespective of payer, hospitalists’ efforts to improve the quality and value of care should include observation and ED visits as well as inpatient readmissions.
Acknowledgments
The authors gratefully acknowledge Minya Sheng, M.S. (Truven Health Analytics) for assistance in programming and data management and Linda Lee, Ph.D. (Truven Health Analytics) for providing editorial review of the manuscript. We also wish to acknowledge the 4 HCUP Partner organizations that contributed to the HCUP State Databases used in this study: Georgia Hospital Association, Nebraska Hospital Association, South Carolina Revenue and Fiscal Affairs Office, and Tennessee Hospital Association.
Disclosure
Funding for this study was provided by the AHRQ Center for Delivery, Organization, and Markets, HCUP (Contract No. HHSA-290-2013-00002-C). The views expressed in this article are those of the authors and do not necessarily reflect those of the AHRQ or the U.S. Department of Health and Human Services. The authors have no conflicts of interest or financial disclosures to declare.
1. Jencks SF, Williams MV, Coleman EA. Rehospitalizations among patients in the Medicare fee-for-service program. N Engl J Med. 2009;360(14):1418-1428. PubMed
2. Lum HD, Studenski SA, Degenholtz HB, Hardy SE. Early hospital readmission is a predictor of one-year mortality in community-dwelling older Medicare beneficiaries. J Gen Intern Med. 2012;27(11):1467-1474. PubMed
3. Peach State Health Plan. New Peach State Health Plan 30-Day Readmission Payment Policy. https://www.pshpgeorgia.com/newsroom/30-day-readmission-payment-policy.html . Accessed September 26, 2017.
4. Axon RN, Cole L, Moonan A, et al. Evolution and Initial Experience of a Statewide Care Transitions Quality Improvement Collaborative: Preventing Avoidable Readmissions Together. Popul Health Manag. 2016 Feb;19(1):4-10. PubMed
5. Nebraska Hospital Association. Quality and Safety. http://www.nebraskahospitals.org/quality_and_safety/qs_home.html. Accessed July 25, 2017.
6. Agency for Healthcare Research and Quality. Re-Engineered Discharge (RED) Toolkit. http://www.ahrq.gov/professionals/systems/hospital/red/toolkit/index.html. Accessed July 25, 2017.
7. Institute for Healthcare Improvement. Readmissions. http://www.ihi.org/Topics/Readmissions/Pages/default.aspx. Accessed July 25, 2017.
8. Centers for Medicare & Medicaid Services (CMS). Readmissions Reduction Program (HRRP). https://www.cms.gov/medicare/medicare-fee-for-service-payment/acuteinpatientpps/readmissions-reduction-program.html. Accessed July 19, 2016.
9. Polinski JM, Moore JM, Kyrychenko P, et al. An insurer’s care transition program emphasizes medication reconciliation, reduces readmissions and costs. Health Aff (Millwood). 2016;35(7):1222-1229. PubMed
10. BlueCross BlueShield. Highmark’s Quality Blue Program helps hospitals reduce readmissions and infections for members. http://www.bcbs.com/healthcare-news/plans/highmark-quality-blue-program-helps-hospitals-reduce-readmissions-and-infections-for-members.html. Accessed November 7, 2016.
11. Agency for Healthcare Research and Quality (AHRQ). Designing and delivering whole-person transitional care: the hospital guide to reducing Medicaid readmissions. Rockville, MD: AHRQ; September 2016. AHRQ Pub. No. 16-0047-EF. http://www.ahrq.gov/sites/default/files/wysiwyg/professionals/systems/hospital/medicaidreadmitguide/medicaidreadmissions.pdf. Accessed March 15, 2017.
12. Aetna. Aetna, Genesis HealthCare take aim at preventing hospital readmissions. https://news.aetna.com/news-releases/aetna-genesis-healthcare-take-aim-at-preventing-hospital-readmissions/. Accessed November 7, 2016.
13. Molina Healthcare. Medical Management Program.http://www.molinahealthcare.com/providers/wi/medicaid/manual/PDF/manual_WI_19_Medical_Management.pdf. Accessed March 15, 2017.
14. Kaiser Family Foundation. Total Medicaid MCOs. State health facts, 2016. http://kff.org/other/state-indicator/total-medicaid-mcos/. Accessed July 19, 2016.
15. Muhlestein D, McClellan M. Accountable care organizations in 2016: private and public-sector growth and dispersion. Health Affairs blog. April 21, 2016. http://healthaffairs.org/blog/2016/04/21/accountable-care-organizations-in-2016-private-and-public-sector-growth-and-dispersion/. Accessed November 7, 2016.
16. Leppin AL, Gionfriddo MR, Kessler M, et al. Preventing 30-day hospital readmissions: a systematic review and meta-analysis of randomized trials. JAMA Intern Med. 2014;174(7):1095-1107. PubMed
17. Zuckerman RB, Sheingold SH, Orav EJ, Ruhter J, Epstein AM. Readmissions, observation, and the Hospital Readmissions Reduction Program. N Engl J Med. 2016;374(16):1543-1551. PubMed
18. Fingar KR, Washington R. Trends in hospital readmissions for four high-volume conditions, 2009–2013. Rockville, MD: Agency for Healthcare Research and Quality; November 2015. Statistical Brief No. 196. https://www.hcup-us.ahrq.gov/reports/statbriefs/sb196-Readmissions-Trends-High-Volume-Conditions.pdf. Accessed March 15, 2017.
19. Ross MA, Hockenberry JM, Mutter R, Barrett M, Wheatley M, Pitts SR. Protocol-driven emergency department observation units offer savings, shorter stays, and reduced admissions. Health Aff (Millwood). 2013;32(12):2149-2156. PubMed
20. Healthcare Cost and Utilization Project (HCUP). HCUP Databases. Rockville, MD: Agency for Healthcare Research and Quality; November 2016. www.hcup-us.ahrq.gov/databases.jsp. Accessed March 15, 2017.
21. QualityNet. Archived resources: readmission measures and measure methodology. https://www.qualitynet.org/dcs/ContentServer?cid=1228774371008&pagename=QnetPublic%2FPage%2FQnetTier4&c=Page. Accessed November 7, 2016.
22. Centers for Medicare & Medicaid Services. 2014 measures updates and specifications report: hospital-level 30-day risk-standardized readmission measures: acute myocardial infarction, heart failure, pneumonia, chronic obstructive pulmonary disease, stroke. March 2014. https://www.cms.gov/Medicare/Quality-Initiatives-Patient-Assessment-Instruments/HospitalQualityInits/Measure-Methodology.html. Accessed September 26, 2017.
23. Iacus SM, King G, Porro G. Causal inference without balance checking: coarsened exact matching. Political Analysis. 2012;20(1):1-24.
24. Moore BJ, White S, Washington R, Coenen N, Elixhauser A. Identifying increased risk of readmission and in-hospital mortality using hospital administrative data: The AHRQ Elixhauser Comorbidity Index. Med Care. 2017;55(7):698-705. PubMed
25. Gerhardt G, Yemane A, Apostle K, Oelschlaeger A, Rollins E, Brennan N. Evaluating whether changes in utilization of hospital outpatient services contributed to lower Medicare readmission rate. Medicare Medicaid Res Rev. 2014;4(1):mmrr2014.004.01.b03. PubMed
26. Kripalani S, Theobald CN, Anctil B, Vasilevskis EE. Reducing hospital readmission rates: current strategies and future directions. Annu Rev Med. 2014;65:471-485. PubMed
27. Desai NR, Ross JS, Kwon JY, et al. Association between hospital penalty status under the hospital readmission reduction program and readmission rates for target and nontarget conditions. JAMA. 2016;316(24):2647-2656. PubMed
28. Epstein AM, Jha AK, Orav EJ. The relationship between hospital admission rates and rehospitalizations. N Engl J Med. 2011;365(24):2287-2295. PubMed
29. Venkatesh AK, Wang C, Ross JS, et al. Hospital use of observation stays: cross sectional study of the impact on readmission rates. Med Care. 2016;54(12)1070-1077. PubMed
30. Nuckols TK, Fingar KR, Barrett M, Steiner CA, Stocks C, Owens PL. The shifting landscape in utilization of inpatient, observation, and emergency department Services Across Payers. J Hosp Med. 2017;12(6):443-446. PubMed
31. Dharmarajan K, Qin L, Lin Z, et al. Declining admission rates and thirty-day readmission rates positively associated even though patients grew sicker over time. Health Aff (Millwood). 2016;35(7):1294-1302. PubMed
32. Grube M, Kaufman K, York R. Decline in utilization rates signals a change in the inpatient business model. Health Affairs blog. March 8, 2013. http://healthaffairs.org/blog/2013/03/08/decline-in-utilization-rates-signals-a-change-in-the-inpatient-business-model/. Accessed November 7, 2016.
33. Feng Z, Wright B, Mor V. Sharp rise in Medicare enrollees being held in hospitals for observation raises concerns about causes and consequences. Health Aff (Millwood). 2012;31(6):1251-1259. PubMed
34. Venkatesh AK, Geisler BP, Gibson Chambers JJ, et al. Use of observation care in US emergency departments, 2001 to 2008. PLoS One. 2011;6(9):e24326. PubMed
35. Schuur JD, Venkatesh AK. The growing role of emergency departments in hospital admissions. N Engl J Med. 2012;367(5):391-393. PubMed
36. Kangovi S, Cafardi SG, Smith RA, Kulkarni R, Grande D. Patient financial responsibility for observation care. J Hosp Med. 2015;10(11):718-723. PubMed
37. Doyle BJ, Ettner SL, Nuckols TK. Supplemental insurance reduces out-of-pocket costs in Medicare observation services. J Hosp Med. 2016;11(7):502-504. doi:10.1002/jhm.2588. PubMed
38. Hansen LO, Young RS, Hinami K, Leung A, Williams MV. Interventions to reduce 30-day rehospitalization: a systematic review. Ann Intern Med. 2011;155(8):520-528. PubMed
39. Bradley EH, Curry L, Horwitz LI, et al. Hospital strategies associated with 30-day readmission rates for patients with heart failure. Circ Cardiovasc Qual Outcomes. 2013;6(4):444-450. PubMed
40. US Census Bureau. American Fact Finder: community facts. http://factfinder.census.gov/faces/nav/jsf/pages/index.xhtml. Accessed November 1, 2016.
41. Van Vleet A, Paradise J. Tapping nurse practitioners to meet rising demand for primary care. Kaiser Family Foundation Issue Brief. January 20, 2015. http://kff.org/medicaid/issue-brief/tapping-nurse-practitioners-to-meet-rising-demand-for-primary-care/. Accessed November 7, 2016.
42. Agency for Healthcare Research and Quality (AHRQ). Hospital guide to reducing Medicaid readmissions. Rockville, MD: AHRQ; August 2014. AHRQ Publication No. 14-0050-EF. http://www.ahrq.gov/sites/default/files/publications/files/medreadmissions.pdf. Accessed March 15, 2017.
43. Boccuti C, Casillas G. Aiming for fewer hospital U-turns: The Medicare Hospital Readmissions Reduction Program. Kaiser Family Foundation Issue Brief. March 10, 2017. http://kff.org/medicare/issue-brief/aiming-for-fewer-hospital-u-turns-the-medicare-hospital-readmission-reduction-program/. Accessed November 7, 2016.
44. Conway P, Gronniger T. New data: 49 states plus DC reduce avoidable hospital readmissions. Centers for Medicare & Medicaid Services blog. September 13, 2016. http://medtecheng.com/new-data-49-states-plus-dc-reduce-avoidable-hospital-readmissions/. Accessed September 26, 2017.
Given the frequency, potential preventability, and costs associated with hospital readmissions, reducing readmissions is a priority in efforts to improve the quality and value of healthcare.1,2 State and national bodies have created diverse initiatives to facilitate improvements in hospital discharge practices and reduce 30-day readmission rates across payers.3-5 For example, the Agency for Healthcare Research and Quality (AHRQ) and the Institute for Healthcare Improvement have published tools for improving discharge practices.6,7 Medicare instituted financial penalties for hospitals with higher-than-expected readmission rates for acute myocardial infarction (AMI), heart failure (HF), and pneumonia in 2012, while private payers and Medicaid programs have established their own policies.8-13 Furthermore, private payers and Medicaid programs shifted toward capitated and value-based reimbursement models in which readmissions lead to financial losses for hospitals.14,15 Accordingly, hospitals have implemented diverse interventions to reduce readmissions.16,17 From 2009 to 2013, 30-day readmissions declined among privately insured adults (from 12.4% to 11.7%), Medicare patients (from 22.0% to 20.0%), and uninsured individuals (11.5% to 11.0%) but climbed among patients with Medicaid (from 19.8% to 20.5%) after index admissions for AMI, HF, pneumonia, or chronic obstructive pulmonary disease.18
To date, research, policies, and quality improvement interventions have largely focused on improvements to one aspect of the system of care—that provided in the inpatient setting—among older adults with Medicare. Yet, inpatient readmissions may underestimate how often patients return to the hospital because patients can be placed under observation or stabilized and discharged from the emergency department (ED) instead of being readmitted. Observation and ED visits are less costly to payers than inpatient admissions.19 Thus, information about utilization of inpatient, observation, and ED visits within 30 days of hospital discharge may be more informative than inpatient readmissions alone. However, little is known about trends in returns to the hospital for observation and ED visits and whether such trends vary by payer.
Our objective was to assess whether changes have occurred in rates of total 30-day, all-cause, unplanned returns to the hospital among adults with index admissions for AMI, HF, and pneumonia in which returns to the hospital included inpatient readmissions, observation visits, and ED visits. We also assessed whether changes in the rate of hospital inpatient readmissions coincided with changes in rates of returns for ED or observation visits. To examine the effects of readmission policies implemented by diverse payers and broad changes to the health system following the Affordable Care Act, we compared data from 201 hospitals in 4 states in 2009 and 2010 with data from the same hospitals for 2013 and 2014.
METHODS
Data Sources, Populations, and Study Variables
We used Healthcare Cost and Utilization Project (HCUP) State Inpatient Databases, State Emergency Department Databases, and State Ambulatory Surgery and Services Databases from Georgia, Nebraska, South Carolina, and Tennessee. These states comprise 7% of the US population and were the only states with data that included all observation and ED visits as well as encrypted patient identification numbers that permitted linkage across facilities and hospitals.20
Index admissions for patients aged 18 years and older were eligible if they occurred at nonfederal general medical/surgical hospitals (excluding critical access hospitals) that had at least 1 index admission per target condition per year and at least 5 inpatient, observation, and ED visits for any condition per year.
We classified patients into the following 4 populations by age and insurance coverage: 18 to 64 years with private insurance, 65 years and older with Medicare (excluding younger adults with Medicare), 18 to 64 years with Medicaid, and 18 to 64 years without insurance. We identified patients aged 65 years and older with Medicare by using the primary or secondary expected payer for the index admission. This group included patients who were dually eligible for Medicare and Medicaid. If Medicare was not the primary or secondary payer, we used the primary payer to identify Medicaid, privately insured, and uninsured patients aged 18 to 64 years. None of the states expanded Medicaid coverage during the years studied.
The primary outcome of interest was the rate of having 1 or more all-cause, unplanned return(s) to an acute care hospital within 30 days of discharge after an index admission for AMI, HF, and pneumonia as defined by a modified version of Centers for Medicare & Medicaid Services’ readmission metrics.21,22 We examined total return rates as well as rates for inpatient, observation, and ED care. We also examined the leading diagnoses associated with returns to the hospital. For each index admission, we included only 1 return visit, giving priority to inpatient readmissions, then observation visits, and then ED visits.
The HCUP databases are consistent with the definition of limited data sets under the Health Insurance Portability and Accountability Act Privacy Rule and contain no direct patient identifiers. The AHRQ Institutional Review Board considers research using HCUP data to have exempt status.
Statistical Analysis
To compare rates at which patients returned to the hospital during 2 cohort periods (2009 and 2010 vs 2013 and 2014), we used coarsened exact matching, a well-established matching technique for balancing covariates between 2 populations of patients that may be related to the outcome.23 For observational datasets, coarsened exact matching is preferable to traditional matching because it enables the investigator to assess balance between the 2 populations, select the desired degree of balance, and eliminate observations for which comparable matches cannot be found.
We assembled sets of index admissions in each study period that were similar with respect to payer, primary diagnosis, and other factors. Matching variables included the patient’s age group, sex, and Elixhauser Comorbidity Index24 (in deciles), as well as the hospital’s ratio of observation visits relative to inpatient admissions in 2009 and 2010 combined (in quartiles; see supplementary Appendix). For Medicare beneficiaries, we also matched on dual enrollment in Medicaid.
We conducted the matching process separately for each target condition and payer population. First, we grouped index admissions in both periods into strata defined by all possible combinations of the matching variables and allowing one-to-many random matching within strata. We then dropped records in any strata for which there were no records in 1 of the time periods. Finally, we calculated weights based on the size of each stratum. We used these weights to account for the different numbers of index admissions in each stratum between the 2 study periods. For example, if a stratum contained 10 index admissions in 2009 and 2010 combined and 20 in 2013 and 2014 combined, an admission weighed double in the earlier period. After weighting, the index admissions in each period (2009 and 2010; 2013 and 2014) had similar characteristics (Table 1).
RESULTS
There were 423,503 eligible index admissions for AMI, HF, and pneumonia in the 2 periods combined; 422,840 (99.8%) were successfully matched and included in this analysis. After matching weights were applied, there were few statistically significant differences across the 2 time periods (see Table 1 and supplementary Appendix).
From 2009 and 2010 to 2013 and 2014, the percentage of patients hospitalized for AMI, HF, and pneumonia who had only observation or ED visits when they returned to the hospital increased from 41.4% to 46.7% among patients with private insurance (P < 0.001), from 27.8% to 32.1% among older patients with Medicare (P < 0.001), from 39.5% to 41.8% among patients with Medicaid (P = 0.03), and from 49.2% to 52.8% among patients without insurance (P = 0.004; Table 1). The percentage of returns to the hospital for observation increased across all payers (P < 0.001); in 2013 and 2014 combined, observation visits ranged from 6.8% of hospital returns among patients with Medicare to 11.1% among patients with private insurance. The percentage of returns to the hospital for an ED visit increased among patients with private insurance (P = 0.02) and Medicare (P < 0.001); in 2013 and 2014, ED visits ranged from 25.3% of returns to the hospital among patients with Medicare to 42.9% among uninsured patients.
The increases in 30-day observation and ED visits coincided with reductions in inpatient readmissions among patients with private insurance and Medicare and contributed to growth in total returns to the hospital among patients with Medicaid or no insurance (Figure 1).
Figure 2
Patients initially hospitalized for HF and pneumonia who returned to the hospital within 30 days often returned for the same conditions (Table 2).
DISCUSSION
Matching index admissions for AMI, HF, or pneumonia in 201 hospitals in 2009 and 2010 with those in 2013 and 2014, we observed that increases in observation and ED visits coincided with reductions in inpatient readmissions among patients with private insurance and Medicare and contributed to growth in total returns to the hospital among patients with Medicaid or no insurance. Among patients with private insurance and Medicare, inpatient readmissions declined significantly for all 3 target conditions, but total returns to the hospital remained constant for AMI and HF, rose for privately insured patients with pneumonia, and declined modestly for Medicare patients with pneumonia. Inpatient readmissions were unchanged for adults aged 18 to 64 years with Medicaid or no insurance, but total returns to the hospital increased significantly, reaching 32% among those with Medicaid.
These findings add to recent literature, which has primarily emphasized inpatient readmissions among Medicare beneficiaries with several exceptions. A prior analysis indicates that readmissions have declined among diverse payer populations nationally.18 Gerhardt et al25 found that from 2011 to 2012, all-cause 30-day readmissions declined among fee-for-service (FFS) Medicare beneficiaries following any index admission, while ED revisits remained stable and observation revisits increased slightly. Evaluating the CMS Hospital Readmission Reductions Program (HRRP), Zuckerman et al17 reported that from 2007 to 2015, inpatient readmissions declined among FFS Medicare beneficiaries aged 65 years and older who were hospitalized with AMI, HF, or pneumonia, while returns to the hospital for observation rose approximately 2%; ED visits were not included. We found that Medicare (FFS and Medicare Advantage) patients with AMI and HF returned to the hospital with the same frequency in 2009 and 2010 as in 2013 and 2014, and those patients with pneumonia returned slightly less often. In aggregate, declines in inpatient readmissions in the 4 states we studied coincided with increases in observation and ED care. Moreover, these shifts occurred not only among Medicare beneficiaries but also among privately insured adults, Medicaid recipients, and the uninsured.
Three factors may have contributed to these apparent shifts from readmissions to observation and ED visits. First, some authors have suggested that hospitals may reduce readmissions by intentionally placing some of the patients who return to the hospital under observation instead of admitting them.17,26 If true, hospitals with greater declines in readmissions would have larger increases in observation revisits. Zuckerman et al17 found no correlation among Medicare beneficiaries between hospital-level trends in observation revisits and readmissions, but returns to observation rose more rapidly for AMI, HF, and pneumonia (compared with other conditions) during long term follow-up than during the HRRP implementation period. Other authors have documented that declines in readmissions have been greatest at hospitals with the highest baseline readmission rates,27,28 and hospitals with lower readmission rates have more observation return visits.29
Second, shifts from inpatient readmissions to return visits for observation may reflect unintentional rather than intentional changes in the services provided. Clinical practice patterns are evolving such that patients who present to the hospital for acute care increasingly are placed under observation or discharged from the ED instead of being admitted, regardless of whether they recently were hospitalized.30 Inpatient admissions, which are strongly correlated with readmission rates,28,31 are declining nationally,32 and both observation and ED visits are rising.33-35 Although little is known about effects on health outcomes and patient out-of-pocket costs,shifts from inpatient admissions to observation and ED visits reduce costs to payers.36,37
Third, instead of substitution, more patients may be returning for lower-acuity conditions that can be treated in the ED or under observation. Hospitals are implementing diverse and multifaceted interventions to reduce readmissions that can involve assessing patient needs and the risk for readmission, educating patients about self-care and risks after discharge, reconciling medication, scheduling follow-up visits, and monitoring patients through telephone calls and home nursing visits.26,38,39 Although the intent may be to reduce patients’ need to return to the hospital, interventions that educate patients about risks after discharge may lower the threshold at which they find symptoms worrisome enough to return. This could increase lower-acuity return visits. We found that reasons for returning were similar in 2009 and 2010 versus 2013 and 2014, but we did not examine acuity of illness at the time of return.
Other areas of concern are the high rates at which Medicaid patients are returning to the hospital and the increases in rates of returns among Medicaid patients and the uninsured. Individuals in these disadvantaged populations may be having difficulty accessing ambulatory care or may be turning to the ED more often for lower acuity problems that arise after discharge. In 3 of the 4 states we studied, 15% to 16% of adults live in poverty and 10% to 30% live in primary care health professional shortage areas.40,41 Given the implications for patient outcomes and costs, trends among these populations warrant further scrutiny.42,43
This analysis has several limitations. Data were from 4 states, but trends in readmissions are similar nationally. From 2010 through 2015, the all-condition readmission rate declined by 8% among Medicare beneficiaries nationally and by 6.1% in South Carolina, 7.4% in Georgia, 8.3% in Nebraska, and 8.7% in Tennessee.44 We report trends across hospitals and did not examine hospital-level revisits. Therefore, further research is needed to determine whether these findings are related to co-occurring trends, intentional substitution, or other factors.
In conclusion, measuring inpatient readmissions without accounting for return visits to the ED and observation underestimates the rate at which patients return to the hospital following an inpatient hospitalization. Because of growth in observation and ED visits, trends in the total rates at which patients return to the hospital can differ from trends in inpatient readmissions. In the 4 states we studied, total return rates were particularly high and rising among patients with Medicaid and lower, but also rising, among the uninsured. Policy analysts and researchers should investigate the factors contributing to growth in readmissions in these vulnerable populations and determine whether similar trends are occurring nationwide. Hospitalists play critical roles in admitting and discharging inpatients, caring for patients under observation, and implementing quality improvement programs. Irrespective of payer, hospitalists’ efforts to improve the quality and value of care should include observation and ED visits as well as inpatient readmissions.
Acknowledgments
The authors gratefully acknowledge Minya Sheng, M.S. (Truven Health Analytics) for assistance in programming and data management and Linda Lee, Ph.D. (Truven Health Analytics) for providing editorial review of the manuscript. We also wish to acknowledge the 4 HCUP Partner organizations that contributed to the HCUP State Databases used in this study: Georgia Hospital Association, Nebraska Hospital Association, South Carolina Revenue and Fiscal Affairs Office, and Tennessee Hospital Association.
Disclosure
Funding for this study was provided by the AHRQ Center for Delivery, Organization, and Markets, HCUP (Contract No. HHSA-290-2013-00002-C). The views expressed in this article are those of the authors and do not necessarily reflect those of the AHRQ or the U.S. Department of Health and Human Services. The authors have no conflicts of interest or financial disclosures to declare.
1. Jencks SF, Williams MV, Coleman EA. Rehospitalizations among patients in the Medicare fee-for-service program. N Engl J Med. 2009;360(14):1418-1428. PubMed
2. Lum HD, Studenski SA, Degenholtz HB, Hardy SE. Early hospital readmission is a predictor of one-year mortality in community-dwelling older Medicare beneficiaries. J Gen Intern Med. 2012;27(11):1467-1474. PubMed
3. Peach State Health Plan. New Peach State Health Plan 30-Day Readmission Payment Policy. https://www.pshpgeorgia.com/newsroom/30-day-readmission-payment-policy.html . Accessed September 26, 2017.
4. Axon RN, Cole L, Moonan A, et al. Evolution and Initial Experience of a Statewide Care Transitions Quality Improvement Collaborative: Preventing Avoidable Readmissions Together. Popul Health Manag. 2016 Feb;19(1):4-10. PubMed
5. Nebraska Hospital Association. Quality and Safety. http://www.nebraskahospitals.org/quality_and_safety/qs_home.html. Accessed July 25, 2017.
6. Agency for Healthcare Research and Quality. Re-Engineered Discharge (RED) Toolkit. http://www.ahrq.gov/professionals/systems/hospital/red/toolkit/index.html. Accessed July 25, 2017.
7. Institute for Healthcare Improvement. Readmissions. http://www.ihi.org/Topics/Readmissions/Pages/default.aspx. Accessed July 25, 2017.
8. Centers for Medicare & Medicaid Services (CMS). Readmissions Reduction Program (HRRP). https://www.cms.gov/medicare/medicare-fee-for-service-payment/acuteinpatientpps/readmissions-reduction-program.html. Accessed July 19, 2016.
9. Polinski JM, Moore JM, Kyrychenko P, et al. An insurer’s care transition program emphasizes medication reconciliation, reduces readmissions and costs. Health Aff (Millwood). 2016;35(7):1222-1229. PubMed
10. BlueCross BlueShield. Highmark’s Quality Blue Program helps hospitals reduce readmissions and infections for members. http://www.bcbs.com/healthcare-news/plans/highmark-quality-blue-program-helps-hospitals-reduce-readmissions-and-infections-for-members.html. Accessed November 7, 2016.
11. Agency for Healthcare Research and Quality (AHRQ). Designing and delivering whole-person transitional care: the hospital guide to reducing Medicaid readmissions. Rockville, MD: AHRQ; September 2016. AHRQ Pub. No. 16-0047-EF. http://www.ahrq.gov/sites/default/files/wysiwyg/professionals/systems/hospital/medicaidreadmitguide/medicaidreadmissions.pdf. Accessed March 15, 2017.
12. Aetna. Aetna, Genesis HealthCare take aim at preventing hospital readmissions. https://news.aetna.com/news-releases/aetna-genesis-healthcare-take-aim-at-preventing-hospital-readmissions/. Accessed November 7, 2016.
13. Molina Healthcare. Medical Management Program.http://www.molinahealthcare.com/providers/wi/medicaid/manual/PDF/manual_WI_19_Medical_Management.pdf. Accessed March 15, 2017.
14. Kaiser Family Foundation. Total Medicaid MCOs. State health facts, 2016. http://kff.org/other/state-indicator/total-medicaid-mcos/. Accessed July 19, 2016.
15. Muhlestein D, McClellan M. Accountable care organizations in 2016: private and public-sector growth and dispersion. Health Affairs blog. April 21, 2016. http://healthaffairs.org/blog/2016/04/21/accountable-care-organizations-in-2016-private-and-public-sector-growth-and-dispersion/. Accessed November 7, 2016.
16. Leppin AL, Gionfriddo MR, Kessler M, et al. Preventing 30-day hospital readmissions: a systematic review and meta-analysis of randomized trials. JAMA Intern Med. 2014;174(7):1095-1107. PubMed
17. Zuckerman RB, Sheingold SH, Orav EJ, Ruhter J, Epstein AM. Readmissions, observation, and the Hospital Readmissions Reduction Program. N Engl J Med. 2016;374(16):1543-1551. PubMed
18. Fingar KR, Washington R. Trends in hospital readmissions for four high-volume conditions, 2009–2013. Rockville, MD: Agency for Healthcare Research and Quality; November 2015. Statistical Brief No. 196. https://www.hcup-us.ahrq.gov/reports/statbriefs/sb196-Readmissions-Trends-High-Volume-Conditions.pdf. Accessed March 15, 2017.
19. Ross MA, Hockenberry JM, Mutter R, Barrett M, Wheatley M, Pitts SR. Protocol-driven emergency department observation units offer savings, shorter stays, and reduced admissions. Health Aff (Millwood). 2013;32(12):2149-2156. PubMed
20. Healthcare Cost and Utilization Project (HCUP). HCUP Databases. Rockville, MD: Agency for Healthcare Research and Quality; November 2016. www.hcup-us.ahrq.gov/databases.jsp. Accessed March 15, 2017.
21. QualityNet. Archived resources: readmission measures and measure methodology. https://www.qualitynet.org/dcs/ContentServer?cid=1228774371008&pagename=QnetPublic%2FPage%2FQnetTier4&c=Page. Accessed November 7, 2016.
22. Centers for Medicare & Medicaid Services. 2014 measures updates and specifications report: hospital-level 30-day risk-standardized readmission measures: acute myocardial infarction, heart failure, pneumonia, chronic obstructive pulmonary disease, stroke. March 2014. https://www.cms.gov/Medicare/Quality-Initiatives-Patient-Assessment-Instruments/HospitalQualityInits/Measure-Methodology.html. Accessed September 26, 2017.
23. Iacus SM, King G, Porro G. Causal inference without balance checking: coarsened exact matching. Political Analysis. 2012;20(1):1-24.
24. Moore BJ, White S, Washington R, Coenen N, Elixhauser A. Identifying increased risk of readmission and in-hospital mortality using hospital administrative data: The AHRQ Elixhauser Comorbidity Index. Med Care. 2017;55(7):698-705. PubMed
25. Gerhardt G, Yemane A, Apostle K, Oelschlaeger A, Rollins E, Brennan N. Evaluating whether changes in utilization of hospital outpatient services contributed to lower Medicare readmission rate. Medicare Medicaid Res Rev. 2014;4(1):mmrr2014.004.01.b03. PubMed
26. Kripalani S, Theobald CN, Anctil B, Vasilevskis EE. Reducing hospital readmission rates: current strategies and future directions. Annu Rev Med. 2014;65:471-485. PubMed
27. Desai NR, Ross JS, Kwon JY, et al. Association between hospital penalty status under the hospital readmission reduction program and readmission rates for target and nontarget conditions. JAMA. 2016;316(24):2647-2656. PubMed
28. Epstein AM, Jha AK, Orav EJ. The relationship between hospital admission rates and rehospitalizations. N Engl J Med. 2011;365(24):2287-2295. PubMed
29. Venkatesh AK, Wang C, Ross JS, et al. Hospital use of observation stays: cross sectional study of the impact on readmission rates. Med Care. 2016;54(12)1070-1077. PubMed
30. Nuckols TK, Fingar KR, Barrett M, Steiner CA, Stocks C, Owens PL. The shifting landscape in utilization of inpatient, observation, and emergency department Services Across Payers. J Hosp Med. 2017;12(6):443-446. PubMed
31. Dharmarajan K, Qin L, Lin Z, et al. Declining admission rates and thirty-day readmission rates positively associated even though patients grew sicker over time. Health Aff (Millwood). 2016;35(7):1294-1302. PubMed
32. Grube M, Kaufman K, York R. Decline in utilization rates signals a change in the inpatient business model. Health Affairs blog. March 8, 2013. http://healthaffairs.org/blog/2013/03/08/decline-in-utilization-rates-signals-a-change-in-the-inpatient-business-model/. Accessed November 7, 2016.
33. Feng Z, Wright B, Mor V. Sharp rise in Medicare enrollees being held in hospitals for observation raises concerns about causes and consequences. Health Aff (Millwood). 2012;31(6):1251-1259. PubMed
34. Venkatesh AK, Geisler BP, Gibson Chambers JJ, et al. Use of observation care in US emergency departments, 2001 to 2008. PLoS One. 2011;6(9):e24326. PubMed
35. Schuur JD, Venkatesh AK. The growing role of emergency departments in hospital admissions. N Engl J Med. 2012;367(5):391-393. PubMed
36. Kangovi S, Cafardi SG, Smith RA, Kulkarni R, Grande D. Patient financial responsibility for observation care. J Hosp Med. 2015;10(11):718-723. PubMed
37. Doyle BJ, Ettner SL, Nuckols TK. Supplemental insurance reduces out-of-pocket costs in Medicare observation services. J Hosp Med. 2016;11(7):502-504. doi:10.1002/jhm.2588. PubMed
38. Hansen LO, Young RS, Hinami K, Leung A, Williams MV. Interventions to reduce 30-day rehospitalization: a systematic review. Ann Intern Med. 2011;155(8):520-528. PubMed
39. Bradley EH, Curry L, Horwitz LI, et al. Hospital strategies associated with 30-day readmission rates for patients with heart failure. Circ Cardiovasc Qual Outcomes. 2013;6(4):444-450. PubMed
40. US Census Bureau. American Fact Finder: community facts. http://factfinder.census.gov/faces/nav/jsf/pages/index.xhtml. Accessed November 1, 2016.
41. Van Vleet A, Paradise J. Tapping nurse practitioners to meet rising demand for primary care. Kaiser Family Foundation Issue Brief. January 20, 2015. http://kff.org/medicaid/issue-brief/tapping-nurse-practitioners-to-meet-rising-demand-for-primary-care/. Accessed November 7, 2016.
42. Agency for Healthcare Research and Quality (AHRQ). Hospital guide to reducing Medicaid readmissions. Rockville, MD: AHRQ; August 2014. AHRQ Publication No. 14-0050-EF. http://www.ahrq.gov/sites/default/files/publications/files/medreadmissions.pdf. Accessed March 15, 2017.
43. Boccuti C, Casillas G. Aiming for fewer hospital U-turns: The Medicare Hospital Readmissions Reduction Program. Kaiser Family Foundation Issue Brief. March 10, 2017. http://kff.org/medicare/issue-brief/aiming-for-fewer-hospital-u-turns-the-medicare-hospital-readmission-reduction-program/. Accessed November 7, 2016.
44. Conway P, Gronniger T. New data: 49 states plus DC reduce avoidable hospital readmissions. Centers for Medicare & Medicaid Services blog. September 13, 2016. http://medtecheng.com/new-data-49-states-plus-dc-reduce-avoidable-hospital-readmissions/. Accessed September 26, 2017.
© 2017 Society of Hospital Medicine
Hospitalist Perspective of Interactions with Medicine Subspecialty Consult Services
Hospitalist physicians care for an increasing proportion of general medicine inpatients and request a significant share of all subspecialty consultations.1 Subspecialty consultation in inpatient care is increasing,2,3 and effective hospitalist–consulting service interactions may affect team communication, patient care, and hospitalist learning. Therefore, enhancing hospitalist–consulting service interactions may have a broad-reaching, positive impact. Researchers in previous studies have explored resident–fellow consult interactions in the inpatient and emergency department settings as well as attending-to-attending consultation in the outpatient setting.4-7 However, to our knowledge, hospitalist–consulting team interactions have not been previously described. In academic medical centers, hospitalists are attending physicians who interact with both fellows (supervised by attending consultants) and directly with subspecialty attendings. Therefore, the exploration of the hospitalist–consultant interaction requires an evaluation of hospitalist–fellow and hospitalist–subspecialty attending interactions. The hospitalist–fellow interaction in particular is unique because it represents an unusual dynamic, in which an attending physician is primarily communicating with a trainee when requesting assistance with patient care.8 In order to explore hospitalist–consultant interactions (herein, the term “consultant” includes both fellow and attending consultants), we conducted a survey study in which we examine hospitalist practices and attitudes regarding consultation, with a specific focus on hospitalist consultation with internal medicine subspecialty consult services. In addition, we compared fellow–hospitalist and attending–hospitalist interactions and explored barriers to and facilitating factors of an effective hospitalist–consultant relationship.
METHODS
Survey Development
The survey instrument was developed by the authors based on findings of prior studies in which researchers examined consultation.2-6,9-16 The survey contained 31 questions (supplementary Appendix A) and evaluated 4 domains of the use of medical subspecialty consultation in direct patient care: (1) current consultation practices, (2) preferences regarding consultants, (3) barriers to and facilitating factors of effective consultation (both with respect to hospitalist learning and patient care), and (4) a comparison between hospitalist–fellow and hospitalist–subspecialty attending interactions. An evaluation of current consultation practices included a focus on communication methods (eg, in person, over the phone, through paging, or notes) because these have been found to be important during consultation.5,6,9,15,16 In order to explore hospitalist preferences regarding consult interactions and investigate perceptions of barriers to and facilitating factors of effective consultation, questions were developed based on previous literature, including our qualitative work examining resident–fellow interactions during consultation.4-6,9,12 We compared hospitalist consultation experiences among attending and fellow consultants because the interaction in which an attending hospitalist physician is primarily communicating with a trainee may differ from a consultation between a hospitalist attending and a subspecialty attending.8 Participants were asked to exclude their experiences when working on teaching services, during which students or housestaff often interact with consultants. The survey was cognitively tested with both hospitalist and non-hospitalist attending physicians not participating in the study and was revised by the authors using an iterative approach.
Study Participants
Hospitalist attending physicians at University of Texas Southwestern (UTSW) Medical Center, Emory University School of Medicine, Massachusetts General Hospital (MGH), and the Medical University of South Carolina (MUSC) were eligible to participate in the study. Consult team structures at each institution were composed of either a subspecialist-attending-only or a fellow-and-subspecialty-attending team. Fellows at all institutions are supervised by a subspecialty attending when performing consultations. Respondents who self-identified as nurse practitioners or physician assistants were excluded from the analysis. Hospitalists employed by the Veterans Affairs hospital system were also excluded. The study was approved by the institutional review boards of UTSW, Emory, MUSC, and MGH.
The survey was anonymous and administered to all hospitalists at participating institutions via a web-based survey tool (Qualtrics, Provo, UT). Participants were eligible to enter a raffle for a $500 gift card, and completion of the survey was not required for entry into the raffle.
Statistics
Results were summarized using the mean with standard deviation for continuous variables and the frequency with percentage for categorical variables after excluding missing values. All analyses were conducted using SAS version 9.4 (SAS Institute, Cary, NC). A 2-sided P value of ≤0.05 was considered statistically significant.
RESULTS
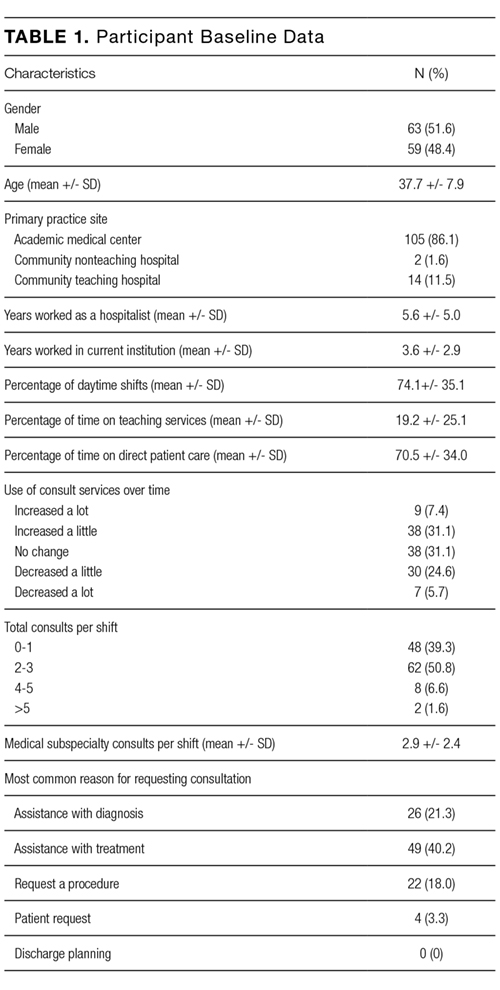
Current Consultation Practices
Current consultation practices and descriptions of hospitalist–consultant communication are shown in Table 2. Forty percent of respondents requested 0-1 consults per day, while 51.7% requested 2-3 per day. The most common reasons for requesting a consultation were assistance with treatment (48.5%), assistance with diagnosis (25.7%), and request for a procedure (21.8%). When asked whether the frequency of consultation is changing, slightly more hospitalists felt that their personal use of consultation was increasing as compared to those who felt that it was decreasing (38.5% vs 30.3%, respectively).
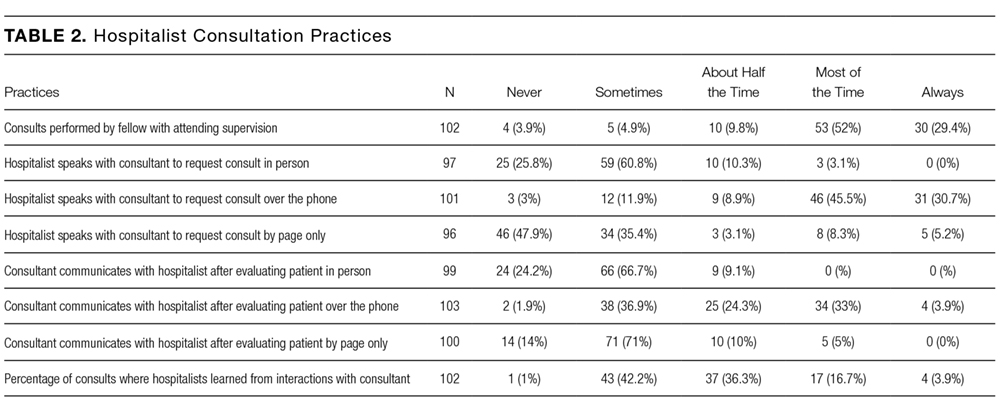
Hospitalist Preferences
Eighty-six percent of respondents agreed that consultants should be required to communicate their recommendations either in person or over the phone. Eighty-three percent of hospitalists agreed that they would like to receive more teaching from the consulting services, and 74.0% agreed that consultants should attempt to teach hospitalists during consult interactions regardless of whether the hospitalist initiates the teaching–learning interaction.
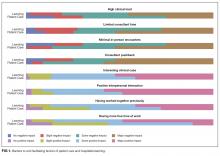
Barriers to and Facilitating Factors of Effective Consultation
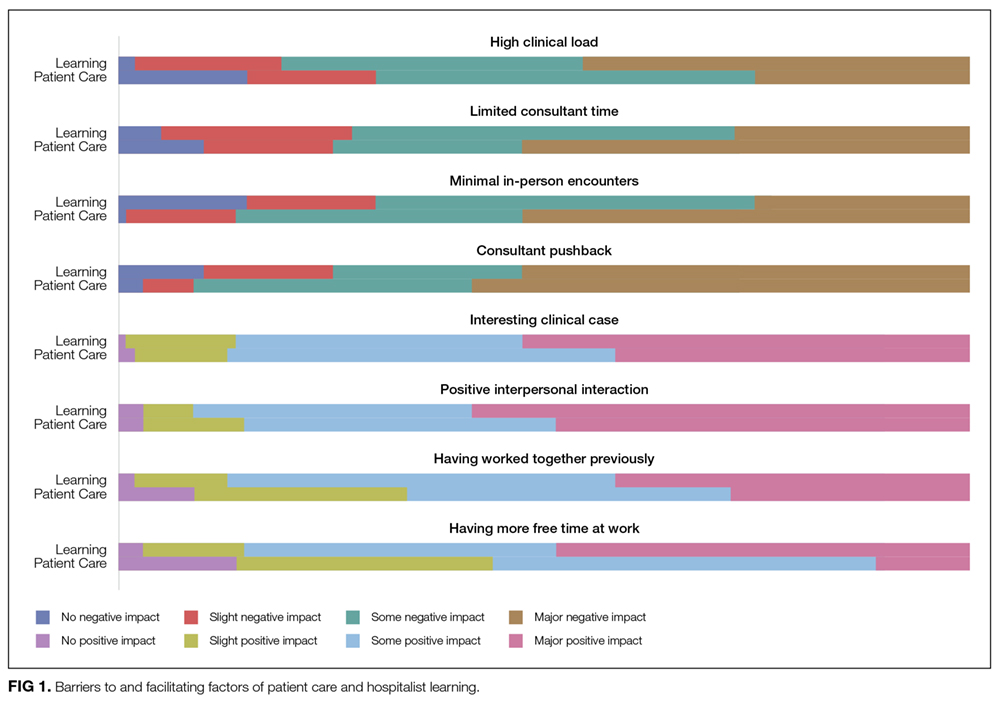
Participants reported that multiple factors affected patient care and their own learning during inpatient consultation (Figure 1). Consultant pushback, high hospitalist clinical workload, a perception that consultants had limited time, and minimal in-person interactions were all seen as factors that negatively affected the consult interaction. These generally affected both learning and patient care. Conversely, working on an interesting clinical case, more hospitalist free time, positive interaction with the consultant, and having previously worked with the consultant positively affected both learning and patient care (Figure 1).
Fellow Versus Attending Interactions
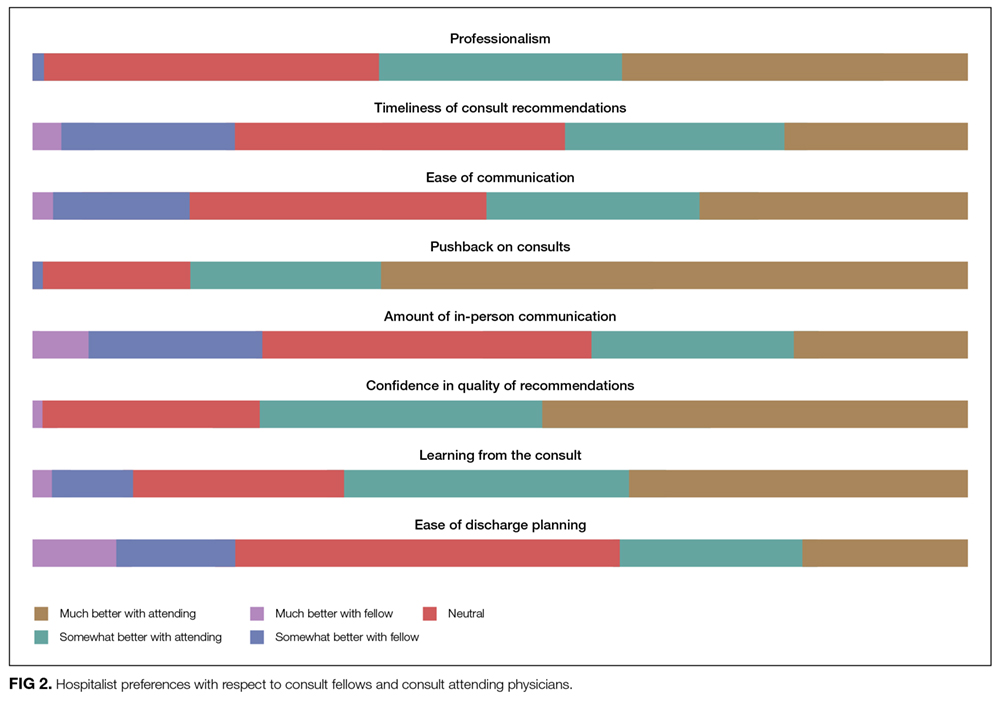
Respondents indicated that interacting directly with the consult attending was superior to hospitalist–fellow interactions in all aspects of care but particularly with respect to pushback, confidence in recommendations, professionalism, and hospitalist learning (Figure 2).
DISCUSSION
To our knowledge, this is the first study to describe hospitalist attending practices, attitudes, and perceptions of internal medicine subspecialty consultation. Our findings, which focus on the interaction between hospitalists and internal medicine subspecialty attendings and fellows, outline the hospitalist perspective on consultant interactions and identify a number of factors that are amenable to intervention. We found that hospitalists perceive the consult interaction to be important for patient care and a valuable opportunity for their own learning. In-person communication was seen as an important component of effective consultation but was reported to occur in a minority of consultations. We demonstrate that hospitalist–subspecialty attending consult interactions are perceived more positively than hospitalist–fellow interactions. Finally, we describe barriers and facilitating factors that may inform future interventions targeting this important interaction.
Effective communication between consultants and the primary team is critical for both patient care and teaching interactions.4-7 Pushback on consultation was reported to be the most significant barrier to hospitalist learning and had a major impact on patient care. Because hospitalists are attending physicians, we hypothesized that they may perceive pushback from fellows less frequently than residents.4 However, in our study, hospitalists reported pushback to be relatively frequent in their daily practice. Moreover, hospitalists reported a strong preference for in-person interactions with consultants, but our study demonstrated that such interactions are relatively infrequent. Researchers in studies of resident–fellow consult interactions have noted similar findings, suggesting that hospitalists and internal medicine residents face similar challenges during consultation.4-6 Hospitalists reported that positive interpersonal interactions and personal familiarity with the consultant positively affected the consult interaction. Most importantly, these effects were perceived to affect both hospitalist learning and patient care, suggesting the importance of interpersonal interactions in consultative medicine.
In an era of increasing clinical workload, the consult interaction represents an important workplace-based learning opportunity.4 Centered on a consult question, the hospitalist–consultant interaction embodies a teachable moment and can be an efficient opportunity to learn because both parties are familiar with the patient. Indeed, survey respondents reported that they frequently learned from consultation, and there was a strong preference for more teaching from consultants in this setting. However, the hospitalist–fellow consult interaction is unique because attending hospitalists are frequently communicating with fellow trainees, which could limit fellows’ confidence in their role as teachers and hospitalists’ perception of their role as learners. Our study identifies a number of barriers and facilitating factors (including communication, pushback, familiarity, and clinical workload) that affect the hospitalist–consultant teaching interaction and may be amenable to intervention.
Hospitalists expressed a consistent preference for interacting with attending subspecialists compared to clinical fellows during consultation. Preference for interaction with attendings was strongest in the areas of pushback, confidence in recommendations, professionalism, and learning from consultation. Some of the factors that relate to consult service structure and fellow experience, such as timeliness of consultation and confidence in recommendations, may not be amenable to intervention. For instance, fellows must first see and then staff the consult with their attending prior to leaving formal recommendations, which makes their communication less timely than that of attending physicians, when they are the primary consultant. However, aspects of the hospitalist–consultant interaction (such as professionalism, ease of communication, and pushback) should not be affected by the difference in experience between fellows and attending physicians. The reasons for such perceptions deserve further exploration; however, differences in incentive structures, workload, and communication skills between fellows and attending consultants may be potential explanations.
Our findings suggest that interventions aimed at enhancing hospitalist–consultant interactions focus on enhancing direct communication and teaching while limiting the perception of pushback. A number of interventions that are primarily focused on instituting a systematic approach to requesting consultation have shown an improvement in resident and medical student consult communication17,18 as well as resident–fellow teaching interactions.9 However, it is not clear whether these interventions would be effective given that hospitalists have more experience communicating with consultants than trainees. Given the unique nature of the hospitalist–consultant interaction, multiple barriers may need to be addressed in order to have a significant impact. Efforts to increase direct communication, such as a mechanism for hospitalists to make and request in-person or direct verbal communication about a particular consultation during the consult request, can help consultants prioritize direct communication with hospitalists for specific patients. Familiarizing fellows with hospitalist workflow and the locations of hospitalist workrooms also may promote in-person communication. Fellowship training can focus on enhancing fellow teaching and communication skills,19-22 particularly as they relate to hospitalists. Fellows in particular may benefit because the hospitalist–fellow teaching interaction may be bidirectional, with hospitalists having expertise in systems practice and quality efforts that can inform fellows’ practice. Furthermore, interacting with hospitalists is an opportunity for fellows to practice professional interactions, which will be critical to their careers. Increasing familiarity between fellows and hospitalists through joint events may also serve to enhance the interaction. Finally, enabling hospitalists to provide feedback to fellows stands to benefit both parties because multisource feedback is an important tool in assessing trainee competence and improving performance.23 However, we should note that because our study focused on hospitalist perceptions, an exploration of subspecialty fellows’ and attendings’ perceptions of the hospitalist–consultant interaction would provide additional, important data for shaping interventions.
Strengths of our study include the inclusion of multiple study sites, which may increase generalizability; however, our study has several limitations. The incomplete response rate reduces both generalizability and statistical power and may have created selection or nonresponder bias. However, low response rates occur commonly when surveying medical professionals, and our results are consistent with many prior hospitalist survey studies.24-26 Further, we conducted our study at a single time point; therefore, we could not evaluate the effect of fellow experience on hospitalist perceptions. However, we conducted our study in the second half of the academic year, when fellows had already gained considerable experience in the consultation setting. We did not capture participants’ institutional affiliations; therefore, a subgroup analysis by institution could not be performed. Additionally, our study reflects hospitalist perception rather than objectively measured communication practices between hospitalists and consultants, and it does not include the perspective of subspecialists. The specific needs of nurse practitioners and physicians’ assistants, who were excluded from this study, should also be evaluated in future research. Lastly, this is a hypothesis-generating study and should be replicated in a national cohort.
CONCLUSION
The hospitalists represented in our sample population perceived the consult interaction to be important for patient care and a valuable opportunity for their own learning. Participants expressed that they would like to increase direct communication with consultants and enhance consultant–hospitalist teaching interactions. Multiple barriers to effective hospitalist–consultant interactions (including communication, pushback, and hospitalist–consultant familiarity) are amenable to intervention.
Disclosure
The authors have no financial disclosures or conflicts of interest.
1. Kravolec PD, Miller JA, Wellikson L, Huddleston JM. The status of hospital medicine groups in the United States. J Hosp Med.2006;1(2):75-80. PubMed
2. Cai Q, Bruno CJ, Hagedorn CH, Desbiens NA. Temporal trends over ten years in formal inpatient gastroenterology consultations at an inner-city hospital. J Clin Gastroenterol. 2003;36(1):34-38. PubMed
3. Ta K, Gardner GC. Evaluation of the activity of an academic rheumatology consult service over 10 years: using data to shape curriculum. J Rheumatol. 2007;34(3):563-566. PubMed
4. Miloslavsky EM, McSparron JI, Richards JB, Puig A, Sullivan AM. Teaching during consultation: factors affecting the resident-fellow teaching interaction. Med Educ. 2015;49(7):717-730. PubMed
5. Chan T, Sabir K, Sanhan S, Sherbino J. Understanding the impact of residents’ interpersonal relationships during emergency department referrals and consultations. J Grad Med Educ. 2013;5(4):576-581. PubMed
6. Chan T, Bakewell F, Orlich D, Sherbino J. Conflict prevention, conflict mitigation, and manifestations of conflict during emergency department consultations. Acad Emerg Med. 2014;21(3):308-313. PubMed
7. Goldman L, Lee T, Rudd P. Ten commandments for effective consultations. Arch Intern Med. 1983;143(9):1753-1755. PubMed
8. Adams T. Barriers to hospitalist fellow interactions. Med Educ. 2016;50(3):370. PubMed
9. Gupta S, Alladina J, Heaton K, Miloslavsky E. A randomized trial of an intervention to improve resident-fellow teaching interaction on the wards. BMC Med Educ. 2016;16(1):276. PubMed
10. Day LW, Cello JP, Madden E, Segal M. Prospective assessment of inpatient gastrointestinal consultation requests in an academic teaching hospital. Am J Gastroenterol. 2010;105(3):484-489. PubMed
11. Kessler C, Kutka BM, Badillo C. Consultation in the emergency department: a qualitative analysis and review. J Emerg Med. 2012;42(6):704-711. PubMed
12. Salerno SM, Hurst FP, Halvorson S, Mercado DL. Principles of effective consultation: an update for the 21st-century consultant. Arch Intern Med. 2007;167(3):271-275. PubMed
13. Muzin LJ. Understanding the process of medical referral: part 1: critique of the literature. Can Fam Physician. 1991;37:2155-2161. PubMed
14. Muzin LJ. Understanding the process of medical referral: part 5: communication. Can Fam Physician. 1992;38:301-307. PubMed
15. Wadhwa A, Lingard L. A qualitative study examining tensions in interdoctor telephone consultations. Med Educ. 2006;40(8):759-767. PubMed
16. Grant IN, Dixon AS. “Thank you for seeing this patient”: studying the quality of communication between physicians. Can Fam Physician. 1987;33:605-611. PubMed
17. Kessler CS, Afshar Y, Sardar G, Yudkowsky R, Ankel F, Schwartz A. A prospective, randomized, controlled study demonstrating a novel, effective model of transfer of care between physicians: the 5 Cs of consultation. Acad Emerg Med. 2012;19(8):968-974. PubMed
18. Podolsky A, Stern DTP. The courteous consult: a CONSULT card and training to improve resident consults. J Grad Med Educ. 2015;7(1):113-117. PubMed
19. Tofil NM, Peterson DT, Harrington KF, et al. A novel iterative-learner simulation model: fellows as teachers. J. Grad. Med. Educ. 2014;6(1):127-132. PubMed
20. Kempainen RR, Hallstrand TS, Culver BH, Tonelli MR. Fellows as teachers: the teacher-assistant experience during pulmonary subspecialty training. Chest. 2005;128(1):401-406. PubMed
21. Backes CH, Reber KM, Trittmann JK, et al. Fellows as teachers: a model to enhance pediatric resident education. Med. Educ. Online. 2011;16:7205. PubMed
22. Miloslavsky EM, Degnan K, McNeill J, McSparron JI. Use of Fellow as Clinical Teacher (FACT) Curriculum for Teaching During Consultation: Effect on Subspecialty Fellow Teaching Skills. J Grad Med Educ. 2017;9(3):345-350 PubMed
23. Donnon T, Al Ansari A, Al Alawi S, Violato C. The reliability, validity, and feasibility of multisource feedback physician assessment: a systematic review. Acad. Med. 2014;89(3):511-516. PubMed
24. Monash B, Najafi N, Mourad M, et al. Standardized attending rounds to improve the patient experience: A pragmatic cluster randomized controlled trial. J Hosp Med. 2017;12(3):143-149. PubMed
25. Allen-Dicker J, Auerbach A, Herzig SJ. Perceived safety and value of inpatient “very important person” services. J Hosp Med. 2017;12(3):177-179. PubMed
26. Do D, Munchhof AM, Terry C, Emmett T, Kara A. Research and publication trends in hospital medicine. J Hosp Med. 2014;9(3):148-154. PubMed
Hospitalist physicians care for an increasing proportion of general medicine inpatients and request a significant share of all subspecialty consultations.1 Subspecialty consultation in inpatient care is increasing,2,3 and effective hospitalist–consulting service interactions may affect team communication, patient care, and hospitalist learning. Therefore, enhancing hospitalist–consulting service interactions may have a broad-reaching, positive impact. Researchers in previous studies have explored resident–fellow consult interactions in the inpatient and emergency department settings as well as attending-to-attending consultation in the outpatient setting.4-7 However, to our knowledge, hospitalist–consulting team interactions have not been previously described. In academic medical centers, hospitalists are attending physicians who interact with both fellows (supervised by attending consultants) and directly with subspecialty attendings. Therefore, the exploration of the hospitalist–consultant interaction requires an evaluation of hospitalist–fellow and hospitalist–subspecialty attending interactions. The hospitalist–fellow interaction in particular is unique because it represents an unusual dynamic, in which an attending physician is primarily communicating with a trainee when requesting assistance with patient care.8 In order to explore hospitalist–consultant interactions (herein, the term “consultant” includes both fellow and attending consultants), we conducted a survey study in which we examine hospitalist practices and attitudes regarding consultation, with a specific focus on hospitalist consultation with internal medicine subspecialty consult services. In addition, we compared fellow–hospitalist and attending–hospitalist interactions and explored barriers to and facilitating factors of an effective hospitalist–consultant relationship.
METHODS
Survey Development
The survey instrument was developed by the authors based on findings of prior studies in which researchers examined consultation.2-6,9-16 The survey contained 31 questions (supplementary Appendix A) and evaluated 4 domains of the use of medical subspecialty consultation in direct patient care: (1) current consultation practices, (2) preferences regarding consultants, (3) barriers to and facilitating factors of effective consultation (both with respect to hospitalist learning and patient care), and (4) a comparison between hospitalist–fellow and hospitalist–subspecialty attending interactions. An evaluation of current consultation practices included a focus on communication methods (eg, in person, over the phone, through paging, or notes) because these have been found to be important during consultation.5,6,9,15,16 In order to explore hospitalist preferences regarding consult interactions and investigate perceptions of barriers to and facilitating factors of effective consultation, questions were developed based on previous literature, including our qualitative work examining resident–fellow interactions during consultation.4-6,9,12 We compared hospitalist consultation experiences among attending and fellow consultants because the interaction in which an attending hospitalist physician is primarily communicating with a trainee may differ from a consultation between a hospitalist attending and a subspecialty attending.8 Participants were asked to exclude their experiences when working on teaching services, during which students or housestaff often interact with consultants. The survey was cognitively tested with both hospitalist and non-hospitalist attending physicians not participating in the study and was revised by the authors using an iterative approach.
Study Participants
Hospitalist attending physicians at University of Texas Southwestern (UTSW) Medical Center, Emory University School of Medicine, Massachusetts General Hospital (MGH), and the Medical University of South Carolina (MUSC) were eligible to participate in the study. Consult team structures at each institution were composed of either a subspecialist-attending-only or a fellow-and-subspecialty-attending team. Fellows at all institutions are supervised by a subspecialty attending when performing consultations. Respondents who self-identified as nurse practitioners or physician assistants were excluded from the analysis. Hospitalists employed by the Veterans Affairs hospital system were also excluded. The study was approved by the institutional review boards of UTSW, Emory, MUSC, and MGH.
The survey was anonymous and administered to all hospitalists at participating institutions via a web-based survey tool (Qualtrics, Provo, UT). Participants were eligible to enter a raffle for a $500 gift card, and completion of the survey was not required for entry into the raffle.
Statistics
Results were summarized using the mean with standard deviation for continuous variables and the frequency with percentage for categorical variables after excluding missing values. All analyses were conducted using SAS version 9.4 (SAS Institute, Cary, NC). A 2-sided P value of ≤0.05 was considered statistically significant.
RESULTS
Current Consultation Practices
Current consultation practices and descriptions of hospitalist–consultant communication are shown in Table 2. Forty percent of respondents requested 0-1 consults per day, while 51.7% requested 2-3 per day. The most common reasons for requesting a consultation were assistance with treatment (48.5%), assistance with diagnosis (25.7%), and request for a procedure (21.8%). When asked whether the frequency of consultation is changing, slightly more hospitalists felt that their personal use of consultation was increasing as compared to those who felt that it was decreasing (38.5% vs 30.3%, respectively).
Hospitalist Preferences
Eighty-six percent of respondents agreed that consultants should be required to communicate their recommendations either in person or over the phone. Eighty-three percent of hospitalists agreed that they would like to receive more teaching from the consulting services, and 74.0% agreed that consultants should attempt to teach hospitalists during consult interactions regardless of whether the hospitalist initiates the teaching–learning interaction.
Barriers to and Facilitating Factors of Effective Consultation
Participants reported that multiple factors affected patient care and their own learning during inpatient consultation (Figure 1). Consultant pushback, high hospitalist clinical workload, a perception that consultants had limited time, and minimal in-person interactions were all seen as factors that negatively affected the consult interaction. These generally affected both learning and patient care. Conversely, working on an interesting clinical case, more hospitalist free time, positive interaction with the consultant, and having previously worked with the consultant positively affected both learning and patient care (Figure 1).
Fellow Versus Attending Interactions
Respondents indicated that interacting directly with the consult attending was superior to hospitalist–fellow interactions in all aspects of care but particularly with respect to pushback, confidence in recommendations, professionalism, and hospitalist learning (Figure 2).
DISCUSSION
To our knowledge, this is the first study to describe hospitalist attending practices, attitudes, and perceptions of internal medicine subspecialty consultation. Our findings, which focus on the interaction between hospitalists and internal medicine subspecialty attendings and fellows, outline the hospitalist perspective on consultant interactions and identify a number of factors that are amenable to intervention. We found that hospitalists perceive the consult interaction to be important for patient care and a valuable opportunity for their own learning. In-person communication was seen as an important component of effective consultation but was reported to occur in a minority of consultations. We demonstrate that hospitalist–subspecialty attending consult interactions are perceived more positively than hospitalist–fellow interactions. Finally, we describe barriers and facilitating factors that may inform future interventions targeting this important interaction.
Effective communication between consultants and the primary team is critical for both patient care and teaching interactions.4-7 Pushback on consultation was reported to be the most significant barrier to hospitalist learning and had a major impact on patient care. Because hospitalists are attending physicians, we hypothesized that they may perceive pushback from fellows less frequently than residents.4 However, in our study, hospitalists reported pushback to be relatively frequent in their daily practice. Moreover, hospitalists reported a strong preference for in-person interactions with consultants, but our study demonstrated that such interactions are relatively infrequent. Researchers in studies of resident–fellow consult interactions have noted similar findings, suggesting that hospitalists and internal medicine residents face similar challenges during consultation.4-6 Hospitalists reported that positive interpersonal interactions and personal familiarity with the consultant positively affected the consult interaction. Most importantly, these effects were perceived to affect both hospitalist learning and patient care, suggesting the importance of interpersonal interactions in consultative medicine.
In an era of increasing clinical workload, the consult interaction represents an important workplace-based learning opportunity.4 Centered on a consult question, the hospitalist–consultant interaction embodies a teachable moment and can be an efficient opportunity to learn because both parties are familiar with the patient. Indeed, survey respondents reported that they frequently learned from consultation, and there was a strong preference for more teaching from consultants in this setting. However, the hospitalist–fellow consult interaction is unique because attending hospitalists are frequently communicating with fellow trainees, which could limit fellows’ confidence in their role as teachers and hospitalists’ perception of their role as learners. Our study identifies a number of barriers and facilitating factors (including communication, pushback, familiarity, and clinical workload) that affect the hospitalist–consultant teaching interaction and may be amenable to intervention.
Hospitalists expressed a consistent preference for interacting with attending subspecialists compared to clinical fellows during consultation. Preference for interaction with attendings was strongest in the areas of pushback, confidence in recommendations, professionalism, and learning from consultation. Some of the factors that relate to consult service structure and fellow experience, such as timeliness of consultation and confidence in recommendations, may not be amenable to intervention. For instance, fellows must first see and then staff the consult with their attending prior to leaving formal recommendations, which makes their communication less timely than that of attending physicians, when they are the primary consultant. However, aspects of the hospitalist–consultant interaction (such as professionalism, ease of communication, and pushback) should not be affected by the difference in experience between fellows and attending physicians. The reasons for such perceptions deserve further exploration; however, differences in incentive structures, workload, and communication skills between fellows and attending consultants may be potential explanations.
Our findings suggest that interventions aimed at enhancing hospitalist–consultant interactions focus on enhancing direct communication and teaching while limiting the perception of pushback. A number of interventions that are primarily focused on instituting a systematic approach to requesting consultation have shown an improvement in resident and medical student consult communication17,18 as well as resident–fellow teaching interactions.9 However, it is not clear whether these interventions would be effective given that hospitalists have more experience communicating with consultants than trainees. Given the unique nature of the hospitalist–consultant interaction, multiple barriers may need to be addressed in order to have a significant impact. Efforts to increase direct communication, such as a mechanism for hospitalists to make and request in-person or direct verbal communication about a particular consultation during the consult request, can help consultants prioritize direct communication with hospitalists for specific patients. Familiarizing fellows with hospitalist workflow and the locations of hospitalist workrooms also may promote in-person communication. Fellowship training can focus on enhancing fellow teaching and communication skills,19-22 particularly as they relate to hospitalists. Fellows in particular may benefit because the hospitalist–fellow teaching interaction may be bidirectional, with hospitalists having expertise in systems practice and quality efforts that can inform fellows’ practice. Furthermore, interacting with hospitalists is an opportunity for fellows to practice professional interactions, which will be critical to their careers. Increasing familiarity between fellows and hospitalists through joint events may also serve to enhance the interaction. Finally, enabling hospitalists to provide feedback to fellows stands to benefit both parties because multisource feedback is an important tool in assessing trainee competence and improving performance.23 However, we should note that because our study focused on hospitalist perceptions, an exploration of subspecialty fellows’ and attendings’ perceptions of the hospitalist–consultant interaction would provide additional, important data for shaping interventions.
Strengths of our study include the inclusion of multiple study sites, which may increase generalizability; however, our study has several limitations. The incomplete response rate reduces both generalizability and statistical power and may have created selection or nonresponder bias. However, low response rates occur commonly when surveying medical professionals, and our results are consistent with many prior hospitalist survey studies.24-26 Further, we conducted our study at a single time point; therefore, we could not evaluate the effect of fellow experience on hospitalist perceptions. However, we conducted our study in the second half of the academic year, when fellows had already gained considerable experience in the consultation setting. We did not capture participants’ institutional affiliations; therefore, a subgroup analysis by institution could not be performed. Additionally, our study reflects hospitalist perception rather than objectively measured communication practices between hospitalists and consultants, and it does not include the perspective of subspecialists. The specific needs of nurse practitioners and physicians’ assistants, who were excluded from this study, should also be evaluated in future research. Lastly, this is a hypothesis-generating study and should be replicated in a national cohort.
CONCLUSION
The hospitalists represented in our sample population perceived the consult interaction to be important for patient care and a valuable opportunity for their own learning. Participants expressed that they would like to increase direct communication with consultants and enhance consultant–hospitalist teaching interactions. Multiple barriers to effective hospitalist–consultant interactions (including communication, pushback, and hospitalist–consultant familiarity) are amenable to intervention.
Disclosure
The authors have no financial disclosures or conflicts of interest.
1. Kravolec PD, Miller JA, Wellikson L, Huddleston JM. The status of hospital medicine groups in the United States. J Hosp Med.2006;1(2):75-80. PubMed
2. Cai Q, Bruno CJ, Hagedorn CH, Desbiens NA. Temporal trends over ten years in formal inpatient gastroenterology consultations at an inner-city hospital. J Clin Gastroenterol. 2003;36(1):34-38. PubMed
3. Ta K, Gardner GC. Evaluation of the activity of an academic rheumatology consult service over 10 years: using data to shape curriculum. J Rheumatol. 2007;34(3):563-566. PubMed
4. Miloslavsky EM, McSparron JI, Richards JB, Puig A, Sullivan AM. Teaching during consultation: factors affecting the resident-fellow teaching interaction. Med Educ. 2015;49(7):717-730. PubMed
5. Chan T, Sabir K, Sanhan S, Sherbino J. Understanding the impact of residents’ interpersonal relationships during emergency department referrals and consultations. J Grad Med Educ. 2013;5(4):576-581. PubMed
6. Chan T, Bakewell F, Orlich D, Sherbino J. Conflict prevention, conflict mitigation, and manifestations of conflict during emergency department consultations. Acad Emerg Med. 2014;21(3):308-313. PubMed
7. Goldman L, Lee T, Rudd P. Ten commandments for effective consultations. Arch Intern Med. 1983;143(9):1753-1755. PubMed
8. Adams T. Barriers to hospitalist fellow interactions. Med Educ. 2016;50(3):370. PubMed
9. Gupta S, Alladina J, Heaton K, Miloslavsky E. A randomized trial of an intervention to improve resident-fellow teaching interaction on the wards. BMC Med Educ. 2016;16(1):276. PubMed
10. Day LW, Cello JP, Madden E, Segal M. Prospective assessment of inpatient gastrointestinal consultation requests in an academic teaching hospital. Am J Gastroenterol. 2010;105(3):484-489. PubMed
11. Kessler C, Kutka BM, Badillo C. Consultation in the emergency department: a qualitative analysis and review. J Emerg Med. 2012;42(6):704-711. PubMed
12. Salerno SM, Hurst FP, Halvorson S, Mercado DL. Principles of effective consultation: an update for the 21st-century consultant. Arch Intern Med. 2007;167(3):271-275. PubMed
13. Muzin LJ. Understanding the process of medical referral: part 1: critique of the literature. Can Fam Physician. 1991;37:2155-2161. PubMed
14. Muzin LJ. Understanding the process of medical referral: part 5: communication. Can Fam Physician. 1992;38:301-307. PubMed
15. Wadhwa A, Lingard L. A qualitative study examining tensions in interdoctor telephone consultations. Med Educ. 2006;40(8):759-767. PubMed
16. Grant IN, Dixon AS. “Thank you for seeing this patient”: studying the quality of communication between physicians. Can Fam Physician. 1987;33:605-611. PubMed
17. Kessler CS, Afshar Y, Sardar G, Yudkowsky R, Ankel F, Schwartz A. A prospective, randomized, controlled study demonstrating a novel, effective model of transfer of care between physicians: the 5 Cs of consultation. Acad Emerg Med. 2012;19(8):968-974. PubMed
18. Podolsky A, Stern DTP. The courteous consult: a CONSULT card and training to improve resident consults. J Grad Med Educ. 2015;7(1):113-117. PubMed
19. Tofil NM, Peterson DT, Harrington KF, et al. A novel iterative-learner simulation model: fellows as teachers. J. Grad. Med. Educ. 2014;6(1):127-132. PubMed
20. Kempainen RR, Hallstrand TS, Culver BH, Tonelli MR. Fellows as teachers: the teacher-assistant experience during pulmonary subspecialty training. Chest. 2005;128(1):401-406. PubMed
21. Backes CH, Reber KM, Trittmann JK, et al. Fellows as teachers: a model to enhance pediatric resident education. Med. Educ. Online. 2011;16:7205. PubMed
22. Miloslavsky EM, Degnan K, McNeill J, McSparron JI. Use of Fellow as Clinical Teacher (FACT) Curriculum for Teaching During Consultation: Effect on Subspecialty Fellow Teaching Skills. J Grad Med Educ. 2017;9(3):345-350 PubMed
23. Donnon T, Al Ansari A, Al Alawi S, Violato C. The reliability, validity, and feasibility of multisource feedback physician assessment: a systematic review. Acad. Med. 2014;89(3):511-516. PubMed
24. Monash B, Najafi N, Mourad M, et al. Standardized attending rounds to improve the patient experience: A pragmatic cluster randomized controlled trial. J Hosp Med. 2017;12(3):143-149. PubMed
25. Allen-Dicker J, Auerbach A, Herzig SJ. Perceived safety and value of inpatient “very important person” services. J Hosp Med. 2017;12(3):177-179. PubMed
26. Do D, Munchhof AM, Terry C, Emmett T, Kara A. Research and publication trends in hospital medicine. J Hosp Med. 2014;9(3):148-154. PubMed
©2017 Society of Hospital Medicine