User login
Don’t discontinue osteoporosis meds for COVID-19 vaccines, expert guidance says
COVID-19 vaccines are safe and effective for patients taking osteoporosis medications, according to joint guidance from six endocrine and osteoporosis societies and foundations.

They noted, though, that some timing modifications with certain medications should be considered to help distinguish between adverse events from the medication versus the vaccine.
The American Society for Bone and Mineral Research “is an international organization, so we brought together our sister societies that have a vested interested in bone health. Vaccination is happening worldwide, and we wanted to present a united front and united recommendations about how to handle osteoporosis medications appropriately during vaccination,” said Suzanne Jan De Beur, MD, who is president of ASBMR and an associate professor of medicine at Johns Hopkins University, Baltimore.
There has been quite a lot of concern from the community about vaccine and medications, from both physicians and patients wondering whether treatments and vaccines should occur in a certain order, and whether there should be a time gap between the two, said Dr. Jan De Beur. “There was a dearth of information about the best practices for osteoporosis treatment management during vaccination, and we didn’t want people missing their opportunity for a vaccine, and we also didn’t want them unnecessarily delaying their osteoporosis treatment.”
There is no evidence that osteoporosis therapies affect the risk or severity of COVID-19 disease, nor do they appear to change the disease course. Osteoporosis itself does not appear associated with increased risk of infection or severe outcomes, so patients with osteoporosis do not need to be prioritized for vaccination based on that condition alone.
There is no evidence that osteoporosis therapies affect the safety or efficacy of vaccination, but given that vaccine availability is currently inconsistent, patients may need to make temporary changes to their osteoporosis regimens to ensure they can receive vaccine when it is available, such as ensuring a delay between medication and vaccination injections.
A key reason for a delay between injectable or infusion medications and a vaccine is to distinguish between adverse events that could occur, so that an adverse reaction to vaccine isn’t mistaken for an adverse reaction to a drug. Nevertheless, the real world is messy. Dr. Jan De Beur noted a recent patient who arrived at her clinic for an injectable treatment who had just received a COVID-19 vaccination that morning. “We decided to put the injection in the other arm, rather than reschedule the person and put them through the risk of coming back. We could distinguish between injection-site reactions, at least,” she said.
No changes should be made to general bone health therapies, such as calcium and vitamin D supplementation, weight-bearing exercises, and maintenance of a balanced diet.
The guidance includes some recommendations for specific osteoporosis medications.
- Oral bisphosphonates: Alendronate, risedronate, and ibandronate should be continued.
- Intravenous bisphosphonates: a 7-day interval (4-day minimum) is recommended between intravenous bisphosphonate (zoledronic acid and ibandronate) infusion and COVID-19 vaccination in order to distinguish potential autoimmune or inflammatory reactions that could be attributable to either intravenous bisphosphonate or the vaccine.
- Denosumab: There should be a 4- to 7-day delay between denosumab infusion and COVID-19 vaccination to account for injection-site reactions. Another option is to have denosumab injected into the contralateral arm or another site like the abdomen or upper thigh, if spacing the injections is not possible. In any case, denosumab injections should be performed within 7 months of the previous dose.
- Teriparatide and abaloparatide should be continued.
- Romosozumab: There should be a 4- to 7-day delay between a romosozumab injection and COVID-19 vaccine, or romosozumab can be injected in the abdomen (with the exception of a 2-inch area around the naval) or thigh if spacing is not possible.
- Raloxifene should be continued in patients receiving COVID-19 vaccination.
Guidance signatories include ASBMR, the American Association of Clinical Endocrinology, the Endocrine Society, the European Calcified Tissue Society, the National Osteoporosis Foundation, and the International Osteoporosis Foundation.
Dr. Jan De Beur has no relevant financial disclosures.
COVID-19 vaccines are safe and effective for patients taking osteoporosis medications, according to joint guidance from six endocrine and osteoporosis societies and foundations.
They noted, though, that some timing modifications with certain medications should be considered to help distinguish between adverse events from the medication versus the vaccine.
The American Society for Bone and Mineral Research “is an international organization, so we brought together our sister societies that have a vested interested in bone health. Vaccination is happening worldwide, and we wanted to present a united front and united recommendations about how to handle osteoporosis medications appropriately during vaccination,” said Suzanne Jan De Beur, MD, who is president of ASBMR and an associate professor of medicine at Johns Hopkins University, Baltimore.
There has been quite a lot of concern from the community about vaccine and medications, from both physicians and patients wondering whether treatments and vaccines should occur in a certain order, and whether there should be a time gap between the two, said Dr. Jan De Beur. “There was a dearth of information about the best practices for osteoporosis treatment management during vaccination, and we didn’t want people missing their opportunity for a vaccine, and we also didn’t want them unnecessarily delaying their osteoporosis treatment.”
There is no evidence that osteoporosis therapies affect the risk or severity of COVID-19 disease, nor do they appear to change the disease course. Osteoporosis itself does not appear associated with increased risk of infection or severe outcomes, so patients with osteoporosis do not need to be prioritized for vaccination based on that condition alone.
There is no evidence that osteoporosis therapies affect the safety or efficacy of vaccination, but given that vaccine availability is currently inconsistent, patients may need to make temporary changes to their osteoporosis regimens to ensure they can receive vaccine when it is available, such as ensuring a delay between medication and vaccination injections.
A key reason for a delay between injectable or infusion medications and a vaccine is to distinguish between adverse events that could occur, so that an adverse reaction to vaccine isn’t mistaken for an adverse reaction to a drug. Nevertheless, the real world is messy. Dr. Jan De Beur noted a recent patient who arrived at her clinic for an injectable treatment who had just received a COVID-19 vaccination that morning. “We decided to put the injection in the other arm, rather than reschedule the person and put them through the risk of coming back. We could distinguish between injection-site reactions, at least,” she said.
No changes should be made to general bone health therapies, such as calcium and vitamin D supplementation, weight-bearing exercises, and maintenance of a balanced diet.
The guidance includes some recommendations for specific osteoporosis medications.
- Oral bisphosphonates: Alendronate, risedronate, and ibandronate should be continued.
- Intravenous bisphosphonates: a 7-day interval (4-day minimum) is recommended between intravenous bisphosphonate (zoledronic acid and ibandronate) infusion and COVID-19 vaccination in order to distinguish potential autoimmune or inflammatory reactions that could be attributable to either intravenous bisphosphonate or the vaccine.
- Denosumab: There should be a 4- to 7-day delay between denosumab infusion and COVID-19 vaccination to account for injection-site reactions. Another option is to have denosumab injected into the contralateral arm or another site like the abdomen or upper thigh, if spacing the injections is not possible. In any case, denosumab injections should be performed within 7 months of the previous dose.
- Teriparatide and abaloparatide should be continued.
- Romosozumab: There should be a 4- to 7-day delay between a romosozumab injection and COVID-19 vaccine, or romosozumab can be injected in the abdomen (with the exception of a 2-inch area around the naval) or thigh if spacing is not possible.
- Raloxifene should be continued in patients receiving COVID-19 vaccination.
Guidance signatories include ASBMR, the American Association of Clinical Endocrinology, the Endocrine Society, the European Calcified Tissue Society, the National Osteoporosis Foundation, and the International Osteoporosis Foundation.
Dr. Jan De Beur has no relevant financial disclosures.
Inpatient sodium imbalances linked to adverse COVID-19 outcomes
Both high and low serum sodium levels are associated with adverse outcomes for hospitalized patients with COVID-19, new research suggests.
In the retrospective study of 488 patients hospitalized with COVID-19 at one of two London hospitals between February and May 2020, hypernatremia (defined as serum sodium level >145 mmol/L) at any time point during hospital stay was associated with a threefold increase in inpatient mortality.
Hyponatremia (serum sodium level <135 mmol/L) was associated with twice the likelihood of requiring advanced ventilatory support. In-hospital mortality was also increased among patients with hypovolemic hyponatremia.
“Serum sodium values could be used in clinical practice to identify patients with COVID-19 at high risk of poor outcomes who would benefit from more intensive monitoring and judicious rehydration,” Ploutarchos Tzoulis, MD, PhD, and colleagues wrote in their article, which was published online on Feb. 24, 2021, in the Journal of Clinical Endocrinology and Metabolism.
The findings will be presented at the upcoming news conference held by the Endocrine Society
Should sodium be included in a risk calculator for COVID-19?
Dr. Tzoulis, professor of endocrinology at the University College London Medical School, said in an interview that “sodium could be incorporated in risk calculators across other routine biomarkers, such as white cell count, lymphocytes, and CRP [C-reactive protein], in order to provide a tool for dynamic risk stratification throughout the clinical course of COVID-19 and assist clinical decision-making.”
Moreover, he said, “we should follow less conservative strategies in the rate and amount of fluid resuscitation in order to prevent hypernatremia, which is induced by negative fluid balance and can often be iatrogenic.”

Asked to comment, Steven Q. Simpson, MD, professor of medicine in the division of pulmonary, critical care, and sleep medicine at the University of Kansas, Kansas City, said that the article is missing key results that would assist in interpreting of the findings.
“Data regarding diuretic use and sparing of fluid administration are not in the paper. ... It is simply not possible to tell whether serum sodium is a ‘predictor’ ... or if it is a side effect of other issues or actions taken by physicians in patients who are progressing poorly.
“To say that sodium needs to be included in a risk calculator is to subtly suggest that there is some causal association with mortality, and that has quite clearly not been established,” stressed Dr. Simpson, who is president of the American College of Chest Physicians but was not speaking for the organization.
He added: “The data are interesting, but not actionable. It is common practice in critical care medicine to adjust water and salt intake to maintain serum sodium within the normal range, so the paper really doesn’t change any behavior.”
Dr. Tzoulis said in an interview that, despite not having electronic medical record data on diuretic use or fluid input and output, “our acute physicians and intensivists at both study sites have been adamant that they’ve not routinely used diuretics in COVID-19 patients. Diuretics have been sparingly used in our cohort, and also the frequency of pulmonary edema was reported as below 5%.”
Regarding volume of fluid intake, Dr. Tzoulis noted, “At our hospital sites, the strategy has been that of cautious fluid resuscitation. In fact, the amount of fluid given has been reported by our physicians and intensivists as ‘on purpose much more conservative than the usual one adopted in patients with community-acquired pneumonia at risk of respiratory failure.’ ”
Hyper- and hyponatremia linked to adverse COVID-19 outcomes
In the study, 5.3% of the 488 patients had hypernatremia at hospital presentation, and 24.6% had hyponatremia. Of note, only 19% of those with hyponatremia underwent laboratory workup to determine the etiology. Of those, three quarters had hypovolemic hyponatremia, determined on the basis of a urinary sodium cutoff of 30 mmol/L.
The total in-hospital mortality rate was 31.1%. There was a strong, although nonsignificant, trend toward higher mortality in association with sodium status at admission. Death rates were 28.4%, 30.8%, and 46.1% for those who were normonatremic, hyponatremic, and hypernatremic, respectively (P = .07). Baseline serum sodium levels didn’t differ between survivors (137 mmol/L) and nonsurvivors (138 mmol/L).
In multivariable analysis, the occurrence of hypernatremia at any point during the first 5 days in the hospital was among three independent risk factors for higher in-hospital mortality (adjusted hazard ratio, 2.74; P = .02). The other risk factors were older age and higher CRP level.
Overall, hyponatremia was not associated with death (P = .41).
During hospitalization, 37.9% of patients remained normonatremic; 36.9% experienced hyponatremia; 10.9% had hypernatremia; and 14.3% had both conditions at some point during their stay.
In-hospital mortality was 21% among those with normonatremia, compared with 56.6% for those with hypernatremia (odds ratio, 3.05; P = .0038) and 45.7% for those with both (OR, 2.25; P < .0001).
The 28.3% mortality rate in the overall group that experienced hyponatremia didn’t differ significantly from the 21.1% in the normonatremic group (OR, 1.34; P = .16). However, the death rate was 40.9% among the subgroup that developed hypovolemic hyponatremia, significantly higher than the normonatremic group (OR, 2.59, P = .0017).
The incidence of hyponatremia decreased from 24.6% at admission to 14.1% 5 days later, whereas the frequency of hypernatremia rose from 5.3% to 13.8%.
Key finding: Link between hospital-acquired hypernatremia and death
“The key novel finding of our study was that hospital-acquired hypernatremia, rather than hypernatremia at admission, was a predictor for in-hospital mortality, with the worst prognosis being reported in patients with the largest increase in serum sodium in the first 5 days of hospitalization,” noted Dr. Tzoulis and colleagues.
Hypernatremia was present in 29.6% of nonsurvivors, compared with 5.2% in survivors.
Among 120 patients with hyponatremia at admission, 31.7% received advanced respiratory support, compared with 17.5% and 7.7% of those with normonatremia or hypernatremia, respectively (OR, 2.18; P = .0011).
In contrast, there was no difference in the proportions needing ventilatory support between those with hypernatremia and those with normonatremia (16.7% vs. 12.4%; OR, 1.44; P = .39).
Acute kidney injury occurred in 181 patients (37.1%). It was not related to serum sodium concentration at any time point.
Dr. Tzoulis and Dr. Simpson disclosed no relevant financial relationships.
A version of this article first appeared on Medscape.com.
Both high and low serum sodium levels are associated with adverse outcomes for hospitalized patients with COVID-19, new research suggests.
In the retrospective study of 488 patients hospitalized with COVID-19 at one of two London hospitals between February and May 2020, hypernatremia (defined as serum sodium level >145 mmol/L) at any time point during hospital stay was associated with a threefold increase in inpatient mortality.
Hyponatremia (serum sodium level <135 mmol/L) was associated with twice the likelihood of requiring advanced ventilatory support. In-hospital mortality was also increased among patients with hypovolemic hyponatremia.
“Serum sodium values could be used in clinical practice to identify patients with COVID-19 at high risk of poor outcomes who would benefit from more intensive monitoring and judicious rehydration,” Ploutarchos Tzoulis, MD, PhD, and colleagues wrote in their article, which was published online on Feb. 24, 2021, in the Journal of Clinical Endocrinology and Metabolism.
The findings will be presented at the upcoming news conference held by the Endocrine Society
Should sodium be included in a risk calculator for COVID-19?
Dr. Tzoulis, professor of endocrinology at the University College London Medical School, said in an interview that “sodium could be incorporated in risk calculators across other routine biomarkers, such as white cell count, lymphocytes, and CRP [C-reactive protein], in order to provide a tool for dynamic risk stratification throughout the clinical course of COVID-19 and assist clinical decision-making.”
Moreover, he said, “we should follow less conservative strategies in the rate and amount of fluid resuscitation in order to prevent hypernatremia, which is induced by negative fluid balance and can often be iatrogenic.”
Asked to comment, Steven Q. Simpson, MD, professor of medicine in the division of pulmonary, critical care, and sleep medicine at the University of Kansas, Kansas City, said that the article is missing key results that would assist in interpreting of the findings.
“Data regarding diuretic use and sparing of fluid administration are not in the paper. ... It is simply not possible to tell whether serum sodium is a ‘predictor’ ... or if it is a side effect of other issues or actions taken by physicians in patients who are progressing poorly.
“To say that sodium needs to be included in a risk calculator is to subtly suggest that there is some causal association with mortality, and that has quite clearly not been established,” stressed Dr. Simpson, who is president of the American College of Chest Physicians but was not speaking for the organization.
He added: “The data are interesting, but not actionable. It is common practice in critical care medicine to adjust water and salt intake to maintain serum sodium within the normal range, so the paper really doesn’t change any behavior.”
Dr. Tzoulis said in an interview that, despite not having electronic medical record data on diuretic use or fluid input and output, “our acute physicians and intensivists at both study sites have been adamant that they’ve not routinely used diuretics in COVID-19 patients. Diuretics have been sparingly used in our cohort, and also the frequency of pulmonary edema was reported as below 5%.”
Regarding volume of fluid intake, Dr. Tzoulis noted, “At our hospital sites, the strategy has been that of cautious fluid resuscitation. In fact, the amount of fluid given has been reported by our physicians and intensivists as ‘on purpose much more conservative than the usual one adopted in patients with community-acquired pneumonia at risk of respiratory failure.’ ”
Hyper- and hyponatremia linked to adverse COVID-19 outcomes
In the study, 5.3% of the 488 patients had hypernatremia at hospital presentation, and 24.6% had hyponatremia. Of note, only 19% of those with hyponatremia underwent laboratory workup to determine the etiology. Of those, three quarters had hypovolemic hyponatremia, determined on the basis of a urinary sodium cutoff of 30 mmol/L.
The total in-hospital mortality rate was 31.1%. There was a strong, although nonsignificant, trend toward higher mortality in association with sodium status at admission. Death rates were 28.4%, 30.8%, and 46.1% for those who were normonatremic, hyponatremic, and hypernatremic, respectively (P = .07). Baseline serum sodium levels didn’t differ between survivors (137 mmol/L) and nonsurvivors (138 mmol/L).
In multivariable analysis, the occurrence of hypernatremia at any point during the first 5 days in the hospital was among three independent risk factors for higher in-hospital mortality (adjusted hazard ratio, 2.74; P = .02). The other risk factors were older age and higher CRP level.
Overall, hyponatremia was not associated with death (P = .41).
During hospitalization, 37.9% of patients remained normonatremic; 36.9% experienced hyponatremia; 10.9% had hypernatremia; and 14.3% had both conditions at some point during their stay.
In-hospital mortality was 21% among those with normonatremia, compared with 56.6% for those with hypernatremia (odds ratio, 3.05; P = .0038) and 45.7% for those with both (OR, 2.25; P < .0001).
The 28.3% mortality rate in the overall group that experienced hyponatremia didn’t differ significantly from the 21.1% in the normonatremic group (OR, 1.34; P = .16). However, the death rate was 40.9% among the subgroup that developed hypovolemic hyponatremia, significantly higher than the normonatremic group (OR, 2.59, P = .0017).
The incidence of hyponatremia decreased from 24.6% at admission to 14.1% 5 days later, whereas the frequency of hypernatremia rose from 5.3% to 13.8%.
Key finding: Link between hospital-acquired hypernatremia and death
“The key novel finding of our study was that hospital-acquired hypernatremia, rather than hypernatremia at admission, was a predictor for in-hospital mortality, with the worst prognosis being reported in patients with the largest increase in serum sodium in the first 5 days of hospitalization,” noted Dr. Tzoulis and colleagues.
Hypernatremia was present in 29.6% of nonsurvivors, compared with 5.2% in survivors.
Among 120 patients with hyponatremia at admission, 31.7% received advanced respiratory support, compared with 17.5% and 7.7% of those with normonatremia or hypernatremia, respectively (OR, 2.18; P = .0011).
In contrast, there was no difference in the proportions needing ventilatory support between those with hypernatremia and those with normonatremia (16.7% vs. 12.4%; OR, 1.44; P = .39).
Acute kidney injury occurred in 181 patients (37.1%). It was not related to serum sodium concentration at any time point.
Dr. Tzoulis and Dr. Simpson disclosed no relevant financial relationships.
A version of this article first appeared on Medscape.com.
Obesity: A ‘double hit’ in pregnant women with heart disease
Being obese and pregnant raises the risk for cardiac complications in women with preexisting heart disease, new research suggests, highlighting the need for earlier interventions in this high-risk population.
The analysis of 790 pregnancies revealed that 23% of women with obesity, defined as body mass index greater than 30 kg/m2, had a cardiac event during pregnancy versus 14% of women with normal body weight (P = .006).
The difference was driven largely by an increase in heart failure (8% vs. 3%; P = .02), although arrhythmias also trended higher in obese women (14% vs. 10%; P = .19).
Nearly half of the women with obesity and a cardiac event presented in the postpartum period (47%).
In multivariate analysis, both obesity and Canadian Cardiac Disease in Pregnancy Study (CARPREG) II risk score were independent predictors of cardiac events (odds ratios for both, 1.7), the investigators, led by Birgit Pfaller, MD, University of Toronto, reported in the Journal of the American College of Cardiology.
Although obesity has been linked to worse pregnancy outcomes and higher cardiovascular risk after delivery in the general population, the authors noted that this is the first study to examine its effect on outcomes in women with heart disease.
“We wanted to look at this high-risk group of women that had preexisting heart disease, but in addition had obesity, to try and find out if there was a kind of double hit for these women – and that, in the end, is what we found. It’s not just simply having heart disease, not simply having obesity, but the combination that’s problematic,” senior author and cardiologist Candice Silversides, MD, University of Toronto, said in an interview.
The findings are concerning given the rising prevalence of obesity worldwide. National data from 2018 show that slightly more than half of women who gave birth in the United States were significantly overweight or obese before becoming pregnant.
Similarly, in the present analysis of 600 women in the CARPREG study who gave birth from 2004 to 2014, nearly 1 in 5 pregnancies (19%) occurred in women with obesity and 25% were in overweight women.
Obese women were significantly more likely than those without obesity to have coronary artery disease (6% vs. 2%), cardiomyopathies (19% vs. 8%) and left ventricular dysfunction (19% vs. 12%) and to be hypertensive or have a hypertensive disorder of pregnancy (13% vs. 3%).
Preeclampsia developed in 32 women during the index pregnancy and 69% of these women were obese or overweight. Cardiac event rates were similar in women with or without preeclampsia but trended higher in women with preeclampsia with versus without obesity (36% vs. 14%; P = .20).
The ill effects of obesity were also reflected in fetal and neonatal events. Overall, 43% of women with obesity and 33% of normal-weight women had at least one fetal event (P = .02), with higher rates of preterm birth (19% vs. 10%; P = .005) and respiratory distress syndrome (8% vs. 3%; P = .02) in women with obesity. Congenital cardiac malformations were present in 6% of women in both groups.
Taken together, the composite of cardiac events, preeclampsia, or fetal events was significantly more common in women with obesity than in normal-weight women (56% vs. 41%; P = .002).
“We’ve spent the last number of years trying to research and understand what the drivers of these adverse outcomes are in this high-risk pregnant cohort, but on a bigger picture the real issue is how do we start intervening in a meaningful way,” Dr. Silversides said.
Like many in the burgeoning field of cardio-obstetrics, the team proposed a multidisciplinary approach that stresses preconception counseling, educating pregnant women with heart disease and obesity about their risks, ensuring that dietary advice, weight-gain recommendations, and comorbidities are addressed as part of routine care, and providing postpartum surveillance.
Preconception screening “has been the recommendation for a long, long time; it’s just that it doesn’t always happen in reality,” she said. “Many pregnancies aren’t planned and not all women are filtered into preconception counseling. So sometimes you’ll do it at the first antenatal visit and try to ensure women are educated but optimally you want to do it well in advance of pregnancy.”
Part of that preconception counseling “should also include giving them appropriate advice for contraception, if what they want to do is avoid pregnancy,” added Dr. Silversides.
Garima Sharma, MD, Ciccarone Center for the Prevention of Cardiovascular Disease, Johns Hopkins University, Baltimore, and colleagues wrote in an accompanying editorial that the adverse events observed in this high-risk cohort have “important implications for cardio-obstetricians and should be incorporated in routine prepregnancy and antenatal counseling, monitoring, and risk stratification for women with existing cardiovascular disease.”
They pointed to a paucity of data incorporating maternal prepregnancy obesity and gestational weight gain in risk prediction and called for larger population-based studies on the additive impact of obesity severity on predicting adverse cardiac events in women with existing cardiovascular disease.
Randomized trials are also urgently needed to evaluate the effect of nutritional and behavioral interventions in pregnancy on short- and long-term outcomes in mother and child.
“As the obesity epidemic continues to grow and public health interventions promoting lifestyle changes for obesity management remain a major challenge, maternal obesity may prove to be the ‘Achilles’ heel’ of sustainable national efforts to reduce maternal mortality and improve health equity. This is a call to action,” Dr. Sharma and colleagues concluded.
The investigators noted that the study was conducted at a single center and used self-reported pregnancy weight collected at the first antenatal visit, which may have underestimated obesity rates. Other limitations are that weight changes over the course of pregnancy were not studied and there was a limited number of women with a body mass index of 40 or higher.
The study was supported by a grant from the Allan E. Tiffin Trust, Toronto General and Western Hospital Foundation, and by a donation from Mrs. Josephine Rogers, Toronto General Hospital. Dr. Silversides is supported by the Miles Nadal Chair in Pregnancy and Heart Disease. Dr. Sharma and colleagues disclosed no relevant financial relationships.
A version of this article first appeared on Medscape.com.
Bone loss common in kidney stone patients, yet rarely detected
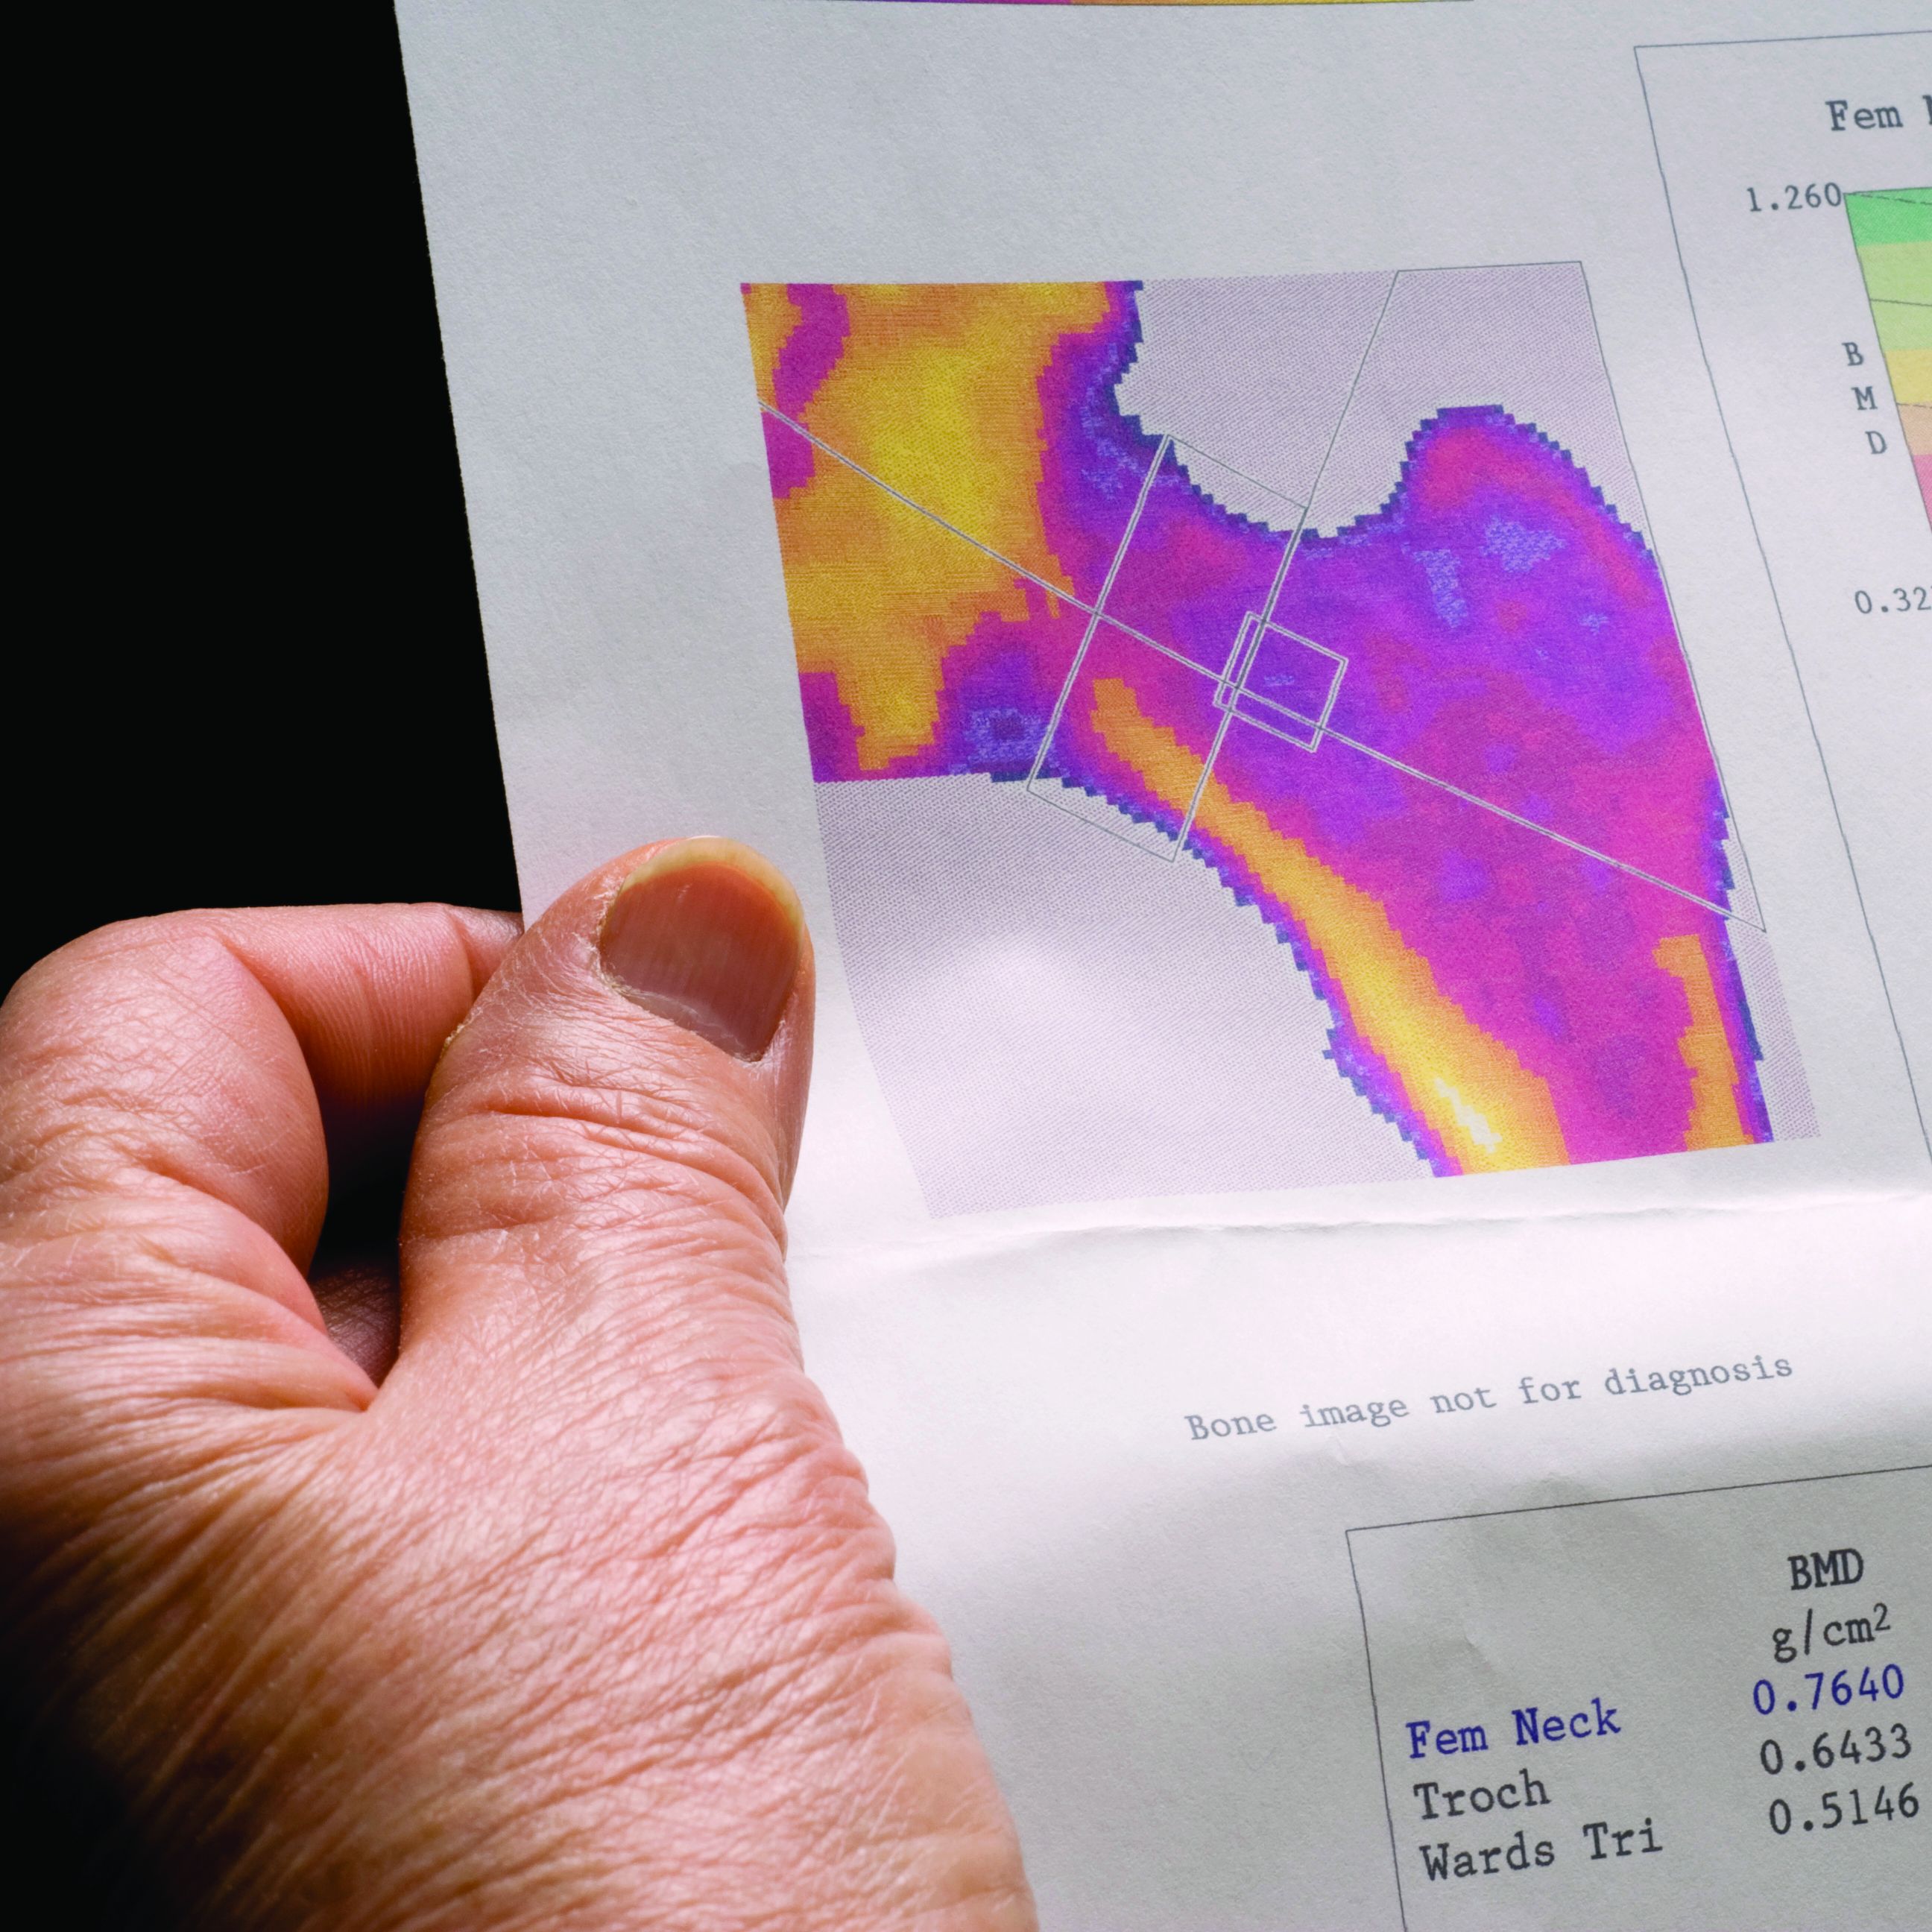
Almost one in four men and women diagnosed with kidney stones have osteoporosis or a history of fracture at the time of their diagnosis, yet fewer than 10% undergo bone mineral density (BMD) screening, a retrospective analysis of a Veterans Health Administration database shows.
Because the majority of those analyzed in the VA dataset were men, this means that middle-aged and older men with kidney stones have about the same risk for osteoporosis as postmenopausal women do, but BMD screening for such men is not currently recommended, the study notes.
“These findings suggest that the risk of osteoporosis or fractures in patients with kidney stone disease is not restricted to postmenopausal women but is also observed in men, a group that is less well recognized to be at risk,” Calyani Ganesan, MD, of Stanford (Calif.) University and colleagues say in their article, published online March 3 in the Journal of Bone and Mineral Research.
“We hope this work raises awareness regarding the possibility of reduced bone strength in patients with kidney stones, [and] in our future work, we hope to identify which patients with kidney stones are at higher risk for osteoporosis or fracture to help guide bone density screening efforts by clinicians in this population,” Dr. Ganesan added in a statement.
VA dataset: Just 9.1% had DXA after kidney stone diagnosed
A total of 531,431 patients with a history of kidney stone disease were identified in the VA dataset. Of these, 23.6% either had been diagnosed with osteoporosis or had a history of fracture around the time of their kidney stone diagnosis. The most common diagnosis was a non-hip fracture, seen in 19% of patients, Dr. Ganesan and colleagues note, followed by osteoporosis in 6.1%, and hip fracture in 2.1%.
The mean age of the patients who concurrently had received a diagnosis of kidney stone disease and osteoporosis or had a fracture history was 64.2 years. In this cohort, more than 91% were men. The majority of the patients were White.
Among some 462,681 patients who had no prior history of either osteoporosis or fracture before their diagnosis of kidney stones, only 9.1% had undergone dual-energy x-ray absorptiometry (DXA) screening for BMD in the 5 years after their kidney stone diagnosis.
“Of those who completed DXA ... 20% were subsequently diagnosed with osteoporosis,” the authors note – 19% with non-hip fracture, and 2.4% with hip fracture.
Importantly, 85% of patients with kidney stone disease who were screened with DXA and were later diagnosed with osteoporosis were men.
“Given that almost 20% of patients in our cohort had a non-hip fracture, we contend that osteoporosis is underdiagnosed and undertreated in older men with kidney stone disease,” the authors stress.
Perform DXA screen in older men, even in absence of hypercalciuria
The authors also explain that the most common metabolic abnormality associated with kidney stones is high urine calcium excretion, or hypercalciuria.
“In a subset of patients with kidney stones, dysregulated calcium homeostasis may be present in which calcium is resorbed from bone and excreted into the urine, which can lead to osteoporosis and the formation of calcium stones,” they explain.
However, when they carried out a 24-hour assessment of urine calcium excretion on a small subset of patients with kidney stones, “we found no correlation between osteoporosis and the level of 24-hour urine calcium excretion,” they point out.
Even when the authors excluded patients who were taking a thiazide diuretic – a class of drugs that decreases urine calcium excretion – there was no correlation between osteoporosis and the level of 24-hour urine calcium excretion.
The investigators suggest it is possible that, in the majority of patients with kidney stones, the cause of hypercalciuria is more closely related to overabsorption of calcium from the gut, not to overresorption of calcium from the bone.
“Nonetheless, our findings indicate that patients with kidney stone disease could benefit from DXA screening even in the absence of hypercalciuria,” they state.
“And our findings provide support for wider use of bone mineral density screening in patients with kidney stone disease, including middle-aged and older men, for whom efforts to mitigate risks of osteoporosis and fractures are not commonly emphasized,” they reaffirm.
The study was funded by the VA Merit Review and the National Institute of Diabetes and Digestive and Kidney Diseases. The authors have disclosed no relevant financial relationships.
A version of this article first appeared on Medscape.com.
Testosterone decline after steroid abuse revealed with new biomarker
Levels of insulinlike factor 3 (INSL3) drop noticeably in men who have abused anabolic androgenic steroids (AAS), even well after stoppage. The results suggest that the effects of AAS use on testosterone-producing Leydig cells may be long-lasting, as some clinicians have suspected. Although there is some variation of INSL3 levels among AAS users, the metric is more accurate than testosterone levels and could be a key element of future diagnostic tests.

Those are the conclusions of a new study, led by Jon Jarløv Rasmussen, MD, PhD, of the department of endocrinology at Rigshospitalet in Copenhagen*, published March 9, 2021, in the Journal of Clinical Endocrinology & Metabolism.
Results mirror clinical experience
The drop in levels, both among current and past users, is in keeping with clinical experience of endocrinologists, according to Channa Jayasena, MD, PhD, a reproductive endocrinologist at Imperial College London. He suspects lasting damage in former and current users who come to him when they discover their sperm count is low. "How long that damage lasts is another matter," Dr. Jayasena, who was not involved in the study, said in an interview.

Dr. Jayasena hopes that INSL3 could find use in tracking damage to Leydig cells from AAS use, as well as to monitor improvements in the event that treatments are found, though he noted that the scatter plots in the study showed quite a bit of variation of INSL3 levels. "So it's a great first step showing that these men, users and past users, have lower INSL3 levels, but it's going to have to be part of a broader suite of factors such as the other hormone [levels], testicular volume, duration of steroid use, etc.," said Dr. Jayasena.
In search of a reliable measure
Low testosterone levels have been shown to be associated with AAS use in some studies, but not in others. That inconsistency led the researchers in search of a more reliable measure. "Serum testosterone is not a stable marker but can fluctuate considerably within minutes to hours, whereas serum insulinlike factor 3 [levels] do not," said Dr. Rasmussen.
INSL3 appears to be involved in bone metabolism regulation as well as spermatogenesis.
Dr. Rasmussen agreed that INSL3 levels could be clinically useful for tracking Leydig cell function, especially in combination with other hormone markers like serum testosterone and gonadotropins. The group is now considering a clinical trial for treatment of hypogonadal men following illicit use of anabolic steroids, which will include INSL3 serum levels as a planned endpoint.
The researchers conducted a cross-sectional study of men aged 18-50 years who had participated in recreational strength training. Cohort 1 included 37 AAS users, 33 former users, and 30 never users. Cohort 2 included 9 current users, 9 former users, and 14 never users. They assigned participant AAS use status based on self-reporting, along with measurement of biomedical parameters including gonadotropins, sexual hormone-binding globulin (SHBG), and hematocrit.
Compared with never users' median value of 0.59 mcg/L, INSL3 serum levels were lower among current AAS (median, 0.04 mcg/L; P < .001) and former AAS (0.39 mcg/L; P = .005) users. A linear multivariate regression that adjusted for luteinizing hormone, SHBG, age, body-fat percentage, smoking status, use of other illicit drugs found lower levels among former users, compared with never users (mean difference, -0.16 mcg/L; P = .011).
An analysis of elapsed duration since AAS cessation found longer duration of AAS use was associated with reduced INSL3 levels (mean difference, -0.08; P = .022).
Although serum inhibin B levels reached the levels of never users after about 21 months, and luteinizing hormone levels recovered in about 12 months, neither serum testosterone nor INSL3 levels recovered in former users.
The study authors received funding from Anti Doping Denmark. Dr. Jayasena has no relevant financial disclosures.
*Dr. Rasmussen's affiliation has been corrected.
Levels of insulinlike factor 3 (INSL3) drop noticeably in men who have abused anabolic androgenic steroids (AAS), even well after stoppage. The results suggest that the effects of AAS use on testosterone-producing Leydig cells may be long-lasting, as some clinicians have suspected. Although there is some variation of INSL3 levels among AAS users, the metric is more accurate than testosterone levels and could be a key element of future diagnostic tests.
Those are the conclusions of a new study, led by Jon Jarløv Rasmussen, MD, PhD, of the department of endocrinology at Rigshospitalet in Copenhagen*, published March 9, 2021, in the Journal of Clinical Endocrinology & Metabolism.
Results mirror clinical experience
The drop in levels, both among current and past users, is in keeping with clinical experience of endocrinologists, according to Channa Jayasena, MD, PhD, a reproductive endocrinologist at Imperial College London. He suspects lasting damage in former and current users who come to him when they discover their sperm count is low. "How long that damage lasts is another matter," Dr. Jayasena, who was not involved in the study, said in an interview.
Dr. Jayasena hopes that INSL3 could find use in tracking damage to Leydig cells from AAS use, as well as to monitor improvements in the event that treatments are found, though he noted that the scatter plots in the study showed quite a bit of variation of INSL3 levels. "So it's a great first step showing that these men, users and past users, have lower INSL3 levels, but it's going to have to be part of a broader suite of factors such as the other hormone [levels], testicular volume, duration of steroid use, etc.," said Dr. Jayasena.
In search of a reliable measure
Low testosterone levels have been shown to be associated with AAS use in some studies, but not in others. That inconsistency led the researchers in search of a more reliable measure. "Serum testosterone is not a stable marker but can fluctuate considerably within minutes to hours, whereas serum insulinlike factor 3 [levels] do not," said Dr. Rasmussen.
INSL3 appears to be involved in bone metabolism regulation as well as spermatogenesis.
Dr. Rasmussen agreed that INSL3 levels could be clinically useful for tracking Leydig cell function, especially in combination with other hormone markers like serum testosterone and gonadotropins. The group is now considering a clinical trial for treatment of hypogonadal men following illicit use of anabolic steroids, which will include INSL3 serum levels as a planned endpoint.
The researchers conducted a cross-sectional study of men aged 18-50 years who had participated in recreational strength training. Cohort 1 included 37 AAS users, 33 former users, and 30 never users. Cohort 2 included 9 current users, 9 former users, and 14 never users. They assigned participant AAS use status based on self-reporting, along with measurement of biomedical parameters including gonadotropins, sexual hormone-binding globulin (SHBG), and hematocrit.
Compared with never users' median value of 0.59 mcg/L, INSL3 serum levels were lower among current AAS (median, 0.04 mcg/L; P < .001) and former AAS (0.39 mcg/L; P = .005) users. A linear multivariate regression that adjusted for luteinizing hormone, SHBG, age, body-fat percentage, smoking status, use of other illicit drugs found lower levels among former users, compared with never users (mean difference, -0.16 mcg/L; P = .011).
An analysis of elapsed duration since AAS cessation found longer duration of AAS use was associated with reduced INSL3 levels (mean difference, -0.08; P = .022).
Although serum inhibin B levels reached the levels of never users after about 21 months, and luteinizing hormone levels recovered in about 12 months, neither serum testosterone nor INSL3 levels recovered in former users.
The study authors received funding from Anti Doping Denmark. Dr. Jayasena has no relevant financial disclosures.
*Dr. Rasmussen's affiliation has been corrected.
FROM THE JOURNAL OF CLINICAL ENDOCRINOLOGY & METABOLISM
Semaglutide for meaningful weight loss in obesity and diabetes?
A 2.4-mg weekly injection of the glucagon-like peptide-1 (GLP-1) receptor agonist semaglutide led to a clinically meaningful 5% loss in weight for roughly two-thirds of patients with both overweight/obesity and type 2 diabetes, researchers report.
These findings from the Semaglutide Treatment Effect in People With Obesity 2 (STEP 2) trial, one of four phase 3 trials of this drug, which is currently under regulatory review for weight loss, were published March 2 in The Lancet.
More than 1,000 patients (mean initial weight, 100 kg [220 pounds]) were randomly assigned to receive a lifestyle intervention plus a weekly injection of semaglutide 2.4 mg or semaglutide 1.0 mg or placebo. At 68 weeks, they had lost a mean of 9.6%, 7.0%, and 3.4%, respectively, of their starting weight.
In addition, 69% of patients who had received semaglutide 2.4 mg experienced a clinically meaningful 5% loss of weight, compared with 57% of patients who had received the lower dose and 29% of patients who had received placebo.
The higher dose of semaglutide was associated with a greater improvement in cardiometabolic risk factors. The safety profile was similar to that seen with other drugs in this class.
“By far the best results with any weight loss medicine in diabetes”
Importantly, “more than a quarter of participants lost over 15% of their body weight,” senior author Ildiko Lingvay, MD, stressed. This “is by far the best result we had with any weight loss medicine in patients with diabetes,” Dr. Lingvay, of the University of Texas, Dallas, said in a statement from the university.

“The drug works by suppressing appetite centers in the brain to reduce caloric intake,” she explained. “The medication continually tells the body that you just ate, you’re full.”
Similarly, lead author Melanie J. Davies, MD, said that the STEP 2 results “are exciting and represent a new era in weight management in people with type 2 diabetes.

“They mark a real paradigm shift in our ability to treat obesity,” with results closer to those achieved with bariatric surgery, Dr. Davies, of the University of Leicester, England, said in a statement from her institution.
“It is really encouraging,” she continued, “that along with the weight loss we saw real improvements in general health, with significant improvement in physical functioning scores, blood pressure, and blood glucose control.”
Dr. Lingvay noted that on average, patients in the four STEP clinical trials lost 10%-17% of their body weight, “which is a huge step forward compared with all other medications currently available to treat obesity.” She stressed that these results are comparable to the 20%-30% weight loss seen with bariatric surgery.
One of four trials under review
More than 90% of people with type 2 diabetes are overweight or have obesity, and more than 20% of people with obesity have diabetes, wrote Dr. Davies and colleagues.
Semaglutide (Ozempic), administered subcutaneously at a dose of 0.5 mg to 1 mg weekly, is approved by the Food and Drug Administration for the treatment of type 2 diabetes. Dosing studies indicated that it is associated with weight loss.
As previously reported, four trials of the use of semaglutide for weight loss (STEP 1, 2, 3, and 4) have been completed. The combined data were submitted to the FDA on Dec. 4, 2020 (a decision is expected within 6 months) and to the European Medicines Agency on Dec. 18, 2020.
The STEP 1 and STEP 3 trials of semaglutide 2.4 mg vs. placebo were recently published. The STEP 1 trial involved 1,961 adults with obesity or overweight; the STEP 3 trial, 611 adults with obesity or overweight. In each of the trials, some patients also underwent an intensive lifestyle intervention, and some did not. In both trials, patients with type 2 diabetes were excluded.
Topline results from STEP 2 were reported in June 2020.
STEP 2 enrolled patients with type 2 diabetes
STEP 2 involved 1,210 adults in 149 outpatient clinics in 12 countries in Europe, North America, South America, the Middle East, South Africa, and Asia. All participants had type 2 diabetes.
For all patients, the body mass index was ≥27 kg/m2, and the A1c concentration was 7%-10%. The mean BMI was 35.7 kg/m2, and the mean A1c was 8.1%.
The mean age of the patients was 55 years, and 51% were women; 62% were White, 26% were Asian, 13% were Hispanic, 8% were Black, and 4% were of other ethnicity.
Participants were managed with diet and exercise alone or underwent treatment with a stable dose of up to three oral glucose-lowering agents (metformin, sulfonylureas, SGLT2 inhibitors, or thiazolidinediones) for at least 90 days. They were then randomly assigned in 1:1:1 ratio to receive semaglutide 2.4 mg, semaglutide 1.0 mg, or placebo.
The starting dose of semaglutide was 0.25 mg/wk; the dose was escalated every 4 weeks to reach the target dose.
All patients received monthly counseling from a dietitian about calories (the goal was a 500-calorie/day deficit) and activity (the goal was 150 minutes of walking or stair climbing per week).
The mean A1c dropped by 1.6% and 1.5% in the semaglutide groups and by 0.4% in the placebo group.
Adverse events were more frequent among the patients who received semaglutide (88% and 82%) than in the placebo group (77%).
Gastrointestinal events that were mainly mild to moderate in severity were reported by 64% of patients in the 2.4-mg semaglutide group, 58% in the 1.0-mg semaglutide group, and 34% in the placebo group.
Semaglutide (Rybelsus) is approved in the United States as a once-daily oral agent for use in type 2 diabetes in doses of 7 mg and 14 mg to improve glycemic control along with diet and exercise. It is the first GLP-1 agonist available in tablet form.
The study was supported by Novo Nordisk. The authors’ relevant financial relationships are listed in the original article.
A version of this article first appeared on Medscape.com.
A 2.4-mg weekly injection of the glucagon-like peptide-1 (GLP-1) receptor agonist semaglutide led to a clinically meaningful 5% loss in weight for roughly two-thirds of patients with both overweight/obesity and type 2 diabetes, researchers report.
These findings from the Semaglutide Treatment Effect in People With Obesity 2 (STEP 2) trial, one of four phase 3 trials of this drug, which is currently under regulatory review for weight loss, were published March 2 in The Lancet.
More than 1,000 patients (mean initial weight, 100 kg [220 pounds]) were randomly assigned to receive a lifestyle intervention plus a weekly injection of semaglutide 2.4 mg or semaglutide 1.0 mg or placebo. At 68 weeks, they had lost a mean of 9.6%, 7.0%, and 3.4%, respectively, of their starting weight.
In addition, 69% of patients who had received semaglutide 2.4 mg experienced a clinically meaningful 5% loss of weight, compared with 57% of patients who had received the lower dose and 29% of patients who had received placebo.
The higher dose of semaglutide was associated with a greater improvement in cardiometabolic risk factors. The safety profile was similar to that seen with other drugs in this class.
“By far the best results with any weight loss medicine in diabetes”
Importantly, “more than a quarter of participants lost over 15% of their body weight,” senior author Ildiko Lingvay, MD, stressed. This “is by far the best result we had with any weight loss medicine in patients with diabetes,” Dr. Lingvay, of the University of Texas, Dallas, said in a statement from the university.
“The drug works by suppressing appetite centers in the brain to reduce caloric intake,” she explained. “The medication continually tells the body that you just ate, you’re full.”
Similarly, lead author Melanie J. Davies, MD, said that the STEP 2 results “are exciting and represent a new era in weight management in people with type 2 diabetes.
“They mark a real paradigm shift in our ability to treat obesity,” with results closer to those achieved with bariatric surgery, Dr. Davies, of the University of Leicester, England, said in a statement from her institution.
“It is really encouraging,” she continued, “that along with the weight loss we saw real improvements in general health, with significant improvement in physical functioning scores, blood pressure, and blood glucose control.”
Dr. Lingvay noted that on average, patients in the four STEP clinical trials lost 10%-17% of their body weight, “which is a huge step forward compared with all other medications currently available to treat obesity.” She stressed that these results are comparable to the 20%-30% weight loss seen with bariatric surgery.
One of four trials under review
More than 90% of people with type 2 diabetes are overweight or have obesity, and more than 20% of people with obesity have diabetes, wrote Dr. Davies and colleagues.
Semaglutide (Ozempic), administered subcutaneously at a dose of 0.5 mg to 1 mg weekly, is approved by the Food and Drug Administration for the treatment of type 2 diabetes. Dosing studies indicated that it is associated with weight loss.
As previously reported, four trials of the use of semaglutide for weight loss (STEP 1, 2, 3, and 4) have been completed. The combined data were submitted to the FDA on Dec. 4, 2020 (a decision is expected within 6 months) and to the European Medicines Agency on Dec. 18, 2020.
The STEP 1 and STEP 3 trials of semaglutide 2.4 mg vs. placebo were recently published. The STEP 1 trial involved 1,961 adults with obesity or overweight; the STEP 3 trial, 611 adults with obesity or overweight. In each of the trials, some patients also underwent an intensive lifestyle intervention, and some did not. In both trials, patients with type 2 diabetes were excluded.
Topline results from STEP 2 were reported in June 2020.
STEP 2 enrolled patients with type 2 diabetes
STEP 2 involved 1,210 adults in 149 outpatient clinics in 12 countries in Europe, North America, South America, the Middle East, South Africa, and Asia. All participants had type 2 diabetes.
For all patients, the body mass index was ≥27 kg/m2, and the A1c concentration was 7%-10%. The mean BMI was 35.7 kg/m2, and the mean A1c was 8.1%.
The mean age of the patients was 55 years, and 51% were women; 62% were White, 26% were Asian, 13% were Hispanic, 8% were Black, and 4% were of other ethnicity.
Participants were managed with diet and exercise alone or underwent treatment with a stable dose of up to three oral glucose-lowering agents (metformin, sulfonylureas, SGLT2 inhibitors, or thiazolidinediones) for at least 90 days. They were then randomly assigned in 1:1:1 ratio to receive semaglutide 2.4 mg, semaglutide 1.0 mg, or placebo.
The starting dose of semaglutide was 0.25 mg/wk; the dose was escalated every 4 weeks to reach the target dose.
All patients received monthly counseling from a dietitian about calories (the goal was a 500-calorie/day deficit) and activity (the goal was 150 minutes of walking or stair climbing per week).
The mean A1c dropped by 1.6% and 1.5% in the semaglutide groups and by 0.4% in the placebo group.
Adverse events were more frequent among the patients who received semaglutide (88% and 82%) than in the placebo group (77%).
Gastrointestinal events that were mainly mild to moderate in severity were reported by 64% of patients in the 2.4-mg semaglutide group, 58% in the 1.0-mg semaglutide group, and 34% in the placebo group.
Semaglutide (Rybelsus) is approved in the United States as a once-daily oral agent for use in type 2 diabetes in doses of 7 mg and 14 mg to improve glycemic control along with diet and exercise. It is the first GLP-1 agonist available in tablet form.
The study was supported by Novo Nordisk. The authors’ relevant financial relationships are listed in the original article.
A version of this article first appeared on Medscape.com.
Call to action on obesity amid COVID-19 pandemic
Hundreds of thousands of deaths worldwide from COVID-19 could have been avoided if obesity rates were lower, a new report says.
An analysis by the World Obesity Federation found that of the 2.5 million COVID-19 deaths reported by the end of February 2021, almost 90% (2.2 million) were in countries where more than half the population is classified as overweight.
The report, released to coincide with World Obesity Day, calls for obesity to be recognized as a disease in its own right around the world, and for people with obesity to be included in priority lists for COVID-19 testing and vaccination.
“Overweight is a highly significant predictor of developing complications from COVID-19, including the need for hospitalization, for intensive care and for mechanical ventilation,” the WOF notes in the report.
It adds that in countries where less than half the adult population is classified as overweight (body mass index > 25 mg/kg2), for example, Vietnam, the likelihood of death from COVID-19 is a small fraction – around one-tenth – of the level seen in countries where more than half the population is classified as overweight.
And while it acknowledges that figures for COVID-19 deaths are affected by the age structure of national populations and a country’s relative wealth and reporting capacity, “our findings appear to be independent of these contributory factors. Furthermore, other studies have found that overweight remains a highly significant predictor of the need for COVID-19 health care after accounting for these other influences.”
As an example, based on the U.K. experience, where an estimated 36% of COVID-19 hospitalizations have been attributed to lack of physical activity and excess body weight, it can be suggested that up to a third of the costs – between $6 trillion and $7 trillion over the longer period – might be attributable to these predisposing risks.
The report said the prevalence of obesity in the United Kingdom is expected to rise from 27.8% in 2016 to more than 35% by 2025.
Rachel Batterham, lead adviser on obesity at the Royal College of Physicians, commented: “The link between high levels of obesity and deaths from COVID-19 in the U.K. is indisputable, as is the urgent need to address the factors that lead so many people to be living with obesity.
“With 30% of COVID-19 hospitalizations in the U.K. directly attributed to overweight and obesity, and three-quarters of all critically ill patients having overweight or obesity, the human and financial costs are high.”
Window of opportunity to prioritize obesity as a disease
WOF says that evolving evidence on the close association between COVID-19 and underlying obesity “provides a new urgency … for political and collective action.”
“Obesity is a disease that does not receive prioritization commensurate with its prevalence and impact, which is rising fastest in emerging economies. It is a gateway to many other noncommunicable diseases and mental-health illness and is now a major factor in COVID-19 complications and mortality.”
The WOF also shows that COVID-19 is not a special case, noting that several other respiratory viruses lead to more severe consequences in people living with excess bodyweight, giving good reasons to expect the next pandemic to have similar effects. “For these reasons we need to recognize overweight as a major risk factor for infectious diseases including respiratory viruses.”
“To prevent pandemic health crises in future requires action now: we call on all readers to support the World Obesity Federation’s call for stronger, more resilient economies that prioritize investment in people’s health.”
There is, it stresses, “a window of opportunity to advocate for, fund and implement these actions in all countries to ensure better, more resilient and sustainable health for all, “now and in our postCOVID-19 future.”
It proposes a ROOTS approach:
- Recognize that obesity is a disease in its own right.
- Obesity monitoring and surveillance must be enhanced.
- Obesity prevention strategies must be developed.
- Treatment of obesity.
- Systems-based approaches should be applied.
A version of this article first appeared on Medscape.com.
Heart failure redefined with new classifications, staging
The terminology and classification scheme for heart failure (HF) is changing in ways that experts hope will directly impact patient outcomes.

In a new consensus statement, a multisociety group of experts proposed a new universal definition of heart failure and made substantial revisions to the way in which the disease is staged and classified.
The authors of the statement, led by writing committee chair and immediate past president of the Heart Failure Society of America Biykem Bozkurt, MD, PhD, hope their efforts will go far to improve standardization of terminology, but more importantly will facilitate better management of the disease in ways that keep pace with current knowledge and advances in the field.
“There is a great need for reframing and standardizing the terminology across societies and different stakeholders, and importantly for patients because a lot of the terminology we were using was understood by academicians, but were not being translated in important ways to ensure patients are being appropriately treated,” said Dr. Bozkurt, of Baylor College of Medicine, Houston.
The consensus statement was a group effort led by the HFSA, the Heart Failure Association of the European Society of Cardiology, and the Japanese Heart Failure Society, with endorsements from the Canadian Heart Failure Society, the Heart Failure Association of India, the Cardiac Society of Australia and New Zealand, and the Chinese Heart Failure Association.
The article was published March 1 in the Journal of Cardiac Failure and the European Journal of Heart Failure, authored by a writing committee of 38 individuals with domain expertise in HF, cardiomyopathy, and cardiovascular disease.
“This is a very thorough and very carefully written document that I think will be helpful for clinicians because they’ve tapped into important changes in the field that have occurred over the past 10 years and that now allow us to do more for patients than we could before,” Eugene Braunwald, MD, said in an interview.

Dr. Braunwald and Elliott M. Antman, MD, both from TIMI Study Group at Brigham and Women’s Hospital and Harvard Medical School in Boston, wrote an editorial that accompanied the European Journal of Heart Failure article.
A new universal definition
“[Heart failure] is a clinical syndrome with symptoms and or signs caused by a structural and/or functional cardiac abnormality and corroborated by elevated natriuretic peptide levels and/or objective evidence of pulmonary or systemic congestion.”
This proposed definition, said the authors, is designed to be contemporary and simple “but conceptually comprehensive, with near universal applicability, prognostic and therapeutic viability, and acceptable sensitivity and specificity.”
Both left and right HF qualifies under this definition, said the authors, but conditions that result in marked volume overload, such as chronic kidney disease, which may present with signs and symptoms of HF, do not.
“Although some of these patients may have concomitant HF, these patients have a primary abnormality that may require a specific treatment beyond that for HF,” said the consensus statement authors.
For his part, Douglas L. Mann, MD, is happy to see what he considers a more accurate and practical definition for heart failure.

“We’ve had some wacky definitions in heart failure that haven’t made sense for 30 years, the principal of which is the definition of heart failure that says it’s the inability of the heart to meet the metabolic demands of the body,” Dr. Mann, of Washington University, St. Louis, said in an interview.
“I think this description was developed thinking about people with end-stage heart failure, but it makes no sense in clinical practice. Does it make sense to say about someone with New York Heart Association class I heart failure that their heart can’t meet the metabolic demands of the body?” said Dr. Mann, who was not involved with the writing of the consensus statement.
Proposed revised stages of the HF continuum
Overall, minimal changes have been made to the HF stages, with tweaks intended to enhance understanding and address the evolving role of biomarkers.
The authors proposed an approach to staging of HF:
- At-risk for HF (stage A), for patients at risk for HF but without current or prior symptoms or signs of HF and without structural or biomarkers evidence of heart disease.
- Pre-HF (stage B), for patients without current or prior symptoms or signs of HF, but evidence of structural heart disease or abnormal cardiac function, or elevated natriuretic peptide levels.
- HF (stage C), for patients with current or prior symptoms and/or signs of HF caused by a structural and/or functional cardiac abnormality.
- Advanced HF (stage D), for patients with severe symptoms and/or signs of HF at rest, recurrent hospitalizations despite guideline-directed management and therapy (GDMT), refractory or intolerant to GDMT, requiring advanced therapies such as consideration for transplant, mechanical circulatory support, or palliative care.
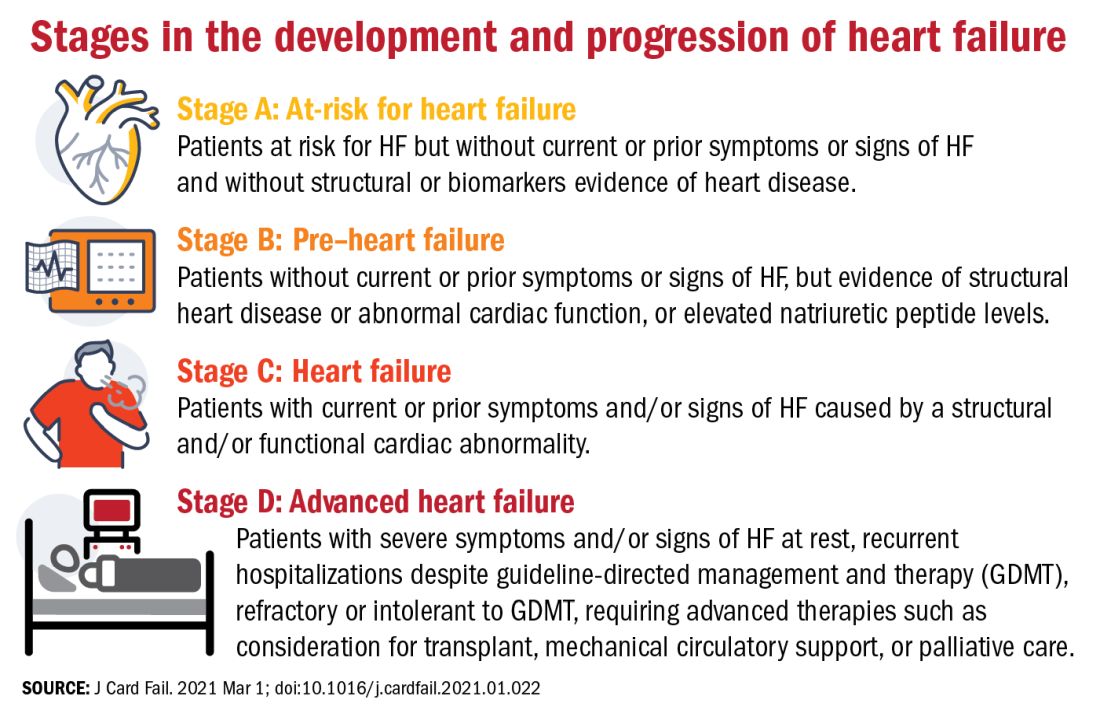
One notable change to the staging scheme is stage B, which the authors have reframed as “pre–heart failure.”
“Pre-cancer is a term widely understood and considered actionable and we wanted to tap into this successful messaging and embrace the pre–heart failure concept as something that is treatable and preventable,” said Dr. Bozkurt.
“We want patients and clinicians to understand that there are things we can do to prevent heart failure, strategies we didn’t have before, like SGLT2 inhibitors in patients with diabetes at risk for HF,” she added.
The revision also avoids the stigma of HF before the symptoms are manifest.
“Not calling it stage A and stage B heart failure you might say is semantics, but it’s important semantics,” said Dr. Braunwald. “When you’re talking to a patient or a relative and tell them they have stage A heart failure, it’s scares them unnecessarily. They don’t hear the stage A or B part, just the heart failure part.”
New classifications according to LVEF
And finally, in what some might consider the most obviously needed modification, the document proposes a new and revised classification of HF according to left ventricular ejection fraction (LVEF). Most agree on how to classify heart failure with reduced ejection fraction (HFrEF) and heart failure with preserved ejection fraction (HFpEF), but although the middle range has long been understood to be a clinically relevant, it has no proper name or clear delineation.
“For standardization across practice guidelines, to recognize clinical trajectories in HF, and to facilitate the recognition of different heart failure entities in a sensitive and specific manner that can guide therapy, we want to formalize the heart failure categories according to ejection fraction,” said Dr. Bozkurt.
To this end, the authors propose the following four classifications of EF:
- HF with reduced EF (HFrEF): LVEF of up to 40%.
- HF with mildly reduced EF (HFmrEF): LVEF of 41-49%.
- HF with preserved EF (HFpEF)HF with an LVEF of at least 50%.
- HF with improved EF (HFimpEF): HF with a baseline LVEF of 40% or less, an increase of at least 10 points from baseline LVEF, and a second measurement of LVEF of greater than 40%.
HFmrEF is usually a transition period, noted Dr. Bozkurt. “Patients with HF in this range may represent a population whose EF is likely to change, either increase or decrease over time and it’s important to be cognizant of that trajectory. Understanding where your patient is headed is crucial for prognosis and optimization of guideline-directed treatment,” she said.
Improved, not recovered, HF
The last classification of heart failure with improved ejection fraction (HFimpEF) represents an important change to the current classification scheme.
“We want to clarify what terms to use but also which not to use. For example, we don’t want people to use recovered heart failure or heart failure in remission, partly because we don’t want the medication to be stopped. We don’t want to give the false message that there has been full recovery,” said Dr. Bozkurt.
As seen in the TRED-HF trial, guideline-directed medical therapy should be continued in patients with HF with improved EF regardless of whether it has improved to a normal range of above 50% in subsequent measurements.
“This is a distinct group of people, and for a while the guidelines were lumping them in with HFpEF, which I think is totally wrong,” said Dr. Mann.
“I think it’s very important that we emphasize heart failure as a continuum, rather than a one-way street of [inevitable] progression. Because we do see improvements in ejection fraction and we do see that we can prevent heart failure if we do the right things, and this should be reflected in the terminology we use,” he added.
Dr. Bozkurt stressed that HFimpEF only applies if the EF improves to above 40%. A move from an EF of 10%-20% would still see the patient classified as having HFrEF, but a patient whose EF improved from, say, 30% to 45% would be classified as HFimpEF.
“The reason for this, again, is because a transition from, say an EF of 10%-20% does not change therapy, but a move upward over 40% might, especially regarding decisions for device therapies, so the trajectory as well as the absolute EF is important,” she added.
“Particularly in the early stages, people are responsive to therapy and it’s possible in some cases to reverse heart failure, so I think this change helps us understand when that’s happened,” said Dr. Braunwald.
One step toward universality
“The implementation of this terminology and nomenclature into practice will require a variety of tactics,” said Dr. Bozkurt. “For example, the current ICD 10 codes need to incorporate the at-risk and pre–heart failure categories, as well as the mid-range EF, preserved, and improved EF classifications, because the treatment differs between those three domains.”
In terms of how these proposed changes will be worked into practice guidelines, Dr. Bozkurt declined to comment on this to avoid any perception of conflict of interest as she is the cochair of the American College of Cardiology/American Heart Association HF guideline writing committee.
Dr. Braunwald and Dr. Antman suggest it may be premature to call the new terminology and classifications “universal.” In an interview, Dr. Braunwald lamented the absence of the World Heart Federation, the ACC, and the AHA as active participants in this effort and suggested this paper is only the first step of a multistep process that requires input from many stakeholders.
“It’s important that these organizations be involved, not just to bless it, but to contribute their expertise to the process,” he said.
For his part, Dr. Mann hopes these changes will gain widespread acceptance and clinical traction. “The problem sometimes with guidelines is that they’re so data driven that you just can’t come out and say the obvious, so making a position statement is a good first step. And they got good international representation on this, so I think these changes will be accepted in the next heart failure guidelines.”
To encourage further discussion and acceptance, Robert J. Mentz, MD, and Anuradha Lala, MD, editor-in-chief and deputy editor of the Journal of Cardiac Failure, respectively, announced a series of multidisciplinary perspective pieces to be published in the journal monthly, starting in May with editorials from Dr. Clyde W Yancy, MD, MSc, and Carolyn S.P. Lam, MBBS, PhD, both of whom were authors of the consensus statement.
Dr. Bozkurt reports being a consultant for Abbott, Amgen, Baxter, Bristol Myers Squibb, Liva Nova Relypsa/Vifor Pharma, Respicardia, and being on the registry steering committee for Sanofi-Aventis. Dr. Braunwald reports research grant support through Brigham and Women’s Hospital from AstraZeneca, Daiichi Sankyo, Merck, and Novartis; and consulting for Amgen, Boehringer-Ingelheim/Lilly, Cardurion, MyoKardia, Novo Nordisk, and Verve. Dr. Mann has been a consultant to Novartis, is on the steering committee for the PARADISE trial, and is on the scientific advisory board for MyoKardia/Bristol Myers Squibb.
The terminology and classification scheme for heart failure (HF) is changing in ways that experts hope will directly impact patient outcomes.
In a new consensus statement, a multisociety group of experts proposed a new universal definition of heart failure and made substantial revisions to the way in which the disease is staged and classified.
The authors of the statement, led by writing committee chair and immediate past president of the Heart Failure Society of America Biykem Bozkurt, MD, PhD, hope their efforts will go far to improve standardization of terminology, but more importantly will facilitate better management of the disease in ways that keep pace with current knowledge and advances in the field.
“There is a great need for reframing and standardizing the terminology across societies and different stakeholders, and importantly for patients because a lot of the terminology we were using was understood by academicians, but were not being translated in important ways to ensure patients are being appropriately treated,” said Dr. Bozkurt, of Baylor College of Medicine, Houston.
The consensus statement was a group effort led by the HFSA, the Heart Failure Association of the European Society of Cardiology, and the Japanese Heart Failure Society, with endorsements from the Canadian Heart Failure Society, the Heart Failure Association of India, the Cardiac Society of Australia and New Zealand, and the Chinese Heart Failure Association.
The article was published March 1 in the Journal of Cardiac Failure and the European Journal of Heart Failure, authored by a writing committee of 38 individuals with domain expertise in HF, cardiomyopathy, and cardiovascular disease.
“This is a very thorough and very carefully written document that I think will be helpful for clinicians because they’ve tapped into important changes in the field that have occurred over the past 10 years and that now allow us to do more for patients than we could before,” Eugene Braunwald, MD, said in an interview.
Dr. Braunwald and Elliott M. Antman, MD, both from TIMI Study Group at Brigham and Women’s Hospital and Harvard Medical School in Boston, wrote an editorial that accompanied the European Journal of Heart Failure article.
A new universal definition
“[Heart failure] is a clinical syndrome with symptoms and or signs caused by a structural and/or functional cardiac abnormality and corroborated by elevated natriuretic peptide levels and/or objective evidence of pulmonary or systemic congestion.”
This proposed definition, said the authors, is designed to be contemporary and simple “but conceptually comprehensive, with near universal applicability, prognostic and therapeutic viability, and acceptable sensitivity and specificity.”
Both left and right HF qualifies under this definition, said the authors, but conditions that result in marked volume overload, such as chronic kidney disease, which may present with signs and symptoms of HF, do not.
“Although some of these patients may have concomitant HF, these patients have a primary abnormality that may require a specific treatment beyond that for HF,” said the consensus statement authors.
For his part, Douglas L. Mann, MD, is happy to see what he considers a more accurate and practical definition for heart failure.
“We’ve had some wacky definitions in heart failure that haven’t made sense for 30 years, the principal of which is the definition of heart failure that says it’s the inability of the heart to meet the metabolic demands of the body,” Dr. Mann, of Washington University, St. Louis, said in an interview.
“I think this description was developed thinking about people with end-stage heart failure, but it makes no sense in clinical practice. Does it make sense to say about someone with New York Heart Association class I heart failure that their heart can’t meet the metabolic demands of the body?” said Dr. Mann, who was not involved with the writing of the consensus statement.
Proposed revised stages of the HF continuum
Overall, minimal changes have been made to the HF stages, with tweaks intended to enhance understanding and address the evolving role of biomarkers.
The authors proposed an approach to staging of HF:
- At-risk for HF (stage A), for patients at risk for HF but without current or prior symptoms or signs of HF and without structural or biomarkers evidence of heart disease.
- Pre-HF (stage B), for patients without current or prior symptoms or signs of HF, but evidence of structural heart disease or abnormal cardiac function, or elevated natriuretic peptide levels.
- HF (stage C), for patients with current or prior symptoms and/or signs of HF caused by a structural and/or functional cardiac abnormality.
- Advanced HF (stage D), for patients with severe symptoms and/or signs of HF at rest, recurrent hospitalizations despite guideline-directed management and therapy (GDMT), refractory or intolerant to GDMT, requiring advanced therapies such as consideration for transplant, mechanical circulatory support, or palliative care.
One notable change to the staging scheme is stage B, which the authors have reframed as “pre–heart failure.”
“Pre-cancer is a term widely understood and considered actionable and we wanted to tap into this successful messaging and embrace the pre–heart failure concept as something that is treatable and preventable,” said Dr. Bozkurt.
“We want patients and clinicians to understand that there are things we can do to prevent heart failure, strategies we didn’t have before, like SGLT2 inhibitors in patients with diabetes at risk for HF,” she added.
The revision also avoids the stigma of HF before the symptoms are manifest.
“Not calling it stage A and stage B heart failure you might say is semantics, but it’s important semantics,” said Dr. Braunwald. “When you’re talking to a patient or a relative and tell them they have stage A heart failure, it’s scares them unnecessarily. They don’t hear the stage A or B part, just the heart failure part.”
New classifications according to LVEF
And finally, in what some might consider the most obviously needed modification, the document proposes a new and revised classification of HF according to left ventricular ejection fraction (LVEF). Most agree on how to classify heart failure with reduced ejection fraction (HFrEF) and heart failure with preserved ejection fraction (HFpEF), but although the middle range has long been understood to be a clinically relevant, it has no proper name or clear delineation.
“For standardization across practice guidelines, to recognize clinical trajectories in HF, and to facilitate the recognition of different heart failure entities in a sensitive and specific manner that can guide therapy, we want to formalize the heart failure categories according to ejection fraction,” said Dr. Bozkurt.
To this end, the authors propose the following four classifications of EF:
- HF with reduced EF (HFrEF): LVEF of up to 40%.
- HF with mildly reduced EF (HFmrEF): LVEF of 41-49%.
- HF with preserved EF (HFpEF)HF with an LVEF of at least 50%.
- HF with improved EF (HFimpEF): HF with a baseline LVEF of 40% or less, an increase of at least 10 points from baseline LVEF, and a second measurement of LVEF of greater than 40%.
HFmrEF is usually a transition period, noted Dr. Bozkurt. “Patients with HF in this range may represent a population whose EF is likely to change, either increase or decrease over time and it’s important to be cognizant of that trajectory. Understanding where your patient is headed is crucial for prognosis and optimization of guideline-directed treatment,” she said.
Improved, not recovered, HF
The last classification of heart failure with improved ejection fraction (HFimpEF) represents an important change to the current classification scheme.
“We want to clarify what terms to use but also which not to use. For example, we don’t want people to use recovered heart failure or heart failure in remission, partly because we don’t want the medication to be stopped. We don’t want to give the false message that there has been full recovery,” said Dr. Bozkurt.
As seen in the TRED-HF trial, guideline-directed medical therapy should be continued in patients with HF with improved EF regardless of whether it has improved to a normal range of above 50% in subsequent measurements.
“This is a distinct group of people, and for a while the guidelines were lumping them in with HFpEF, which I think is totally wrong,” said Dr. Mann.
“I think it’s very important that we emphasize heart failure as a continuum, rather than a one-way street of [inevitable] progression. Because we do see improvements in ejection fraction and we do see that we can prevent heart failure if we do the right things, and this should be reflected in the terminology we use,” he added.
Dr. Bozkurt stressed that HFimpEF only applies if the EF improves to above 40%. A move from an EF of 10%-20% would still see the patient classified as having HFrEF, but a patient whose EF improved from, say, 30% to 45% would be classified as HFimpEF.
“The reason for this, again, is because a transition from, say an EF of 10%-20% does not change therapy, but a move upward over 40% might, especially regarding decisions for device therapies, so the trajectory as well as the absolute EF is important,” she added.
“Particularly in the early stages, people are responsive to therapy and it’s possible in some cases to reverse heart failure, so I think this change helps us understand when that’s happened,” said Dr. Braunwald.
One step toward universality
“The implementation of this terminology and nomenclature into practice will require a variety of tactics,” said Dr. Bozkurt. “For example, the current ICD 10 codes need to incorporate the at-risk and pre–heart failure categories, as well as the mid-range EF, preserved, and improved EF classifications, because the treatment differs between those three domains.”
In terms of how these proposed changes will be worked into practice guidelines, Dr. Bozkurt declined to comment on this to avoid any perception of conflict of interest as she is the cochair of the American College of Cardiology/American Heart Association HF guideline writing committee.
Dr. Braunwald and Dr. Antman suggest it may be premature to call the new terminology and classifications “universal.” In an interview, Dr. Braunwald lamented the absence of the World Heart Federation, the ACC, and the AHA as active participants in this effort and suggested this paper is only the first step of a multistep process that requires input from many stakeholders.
“It’s important that these organizations be involved, not just to bless it, but to contribute their expertise to the process,” he said.
For his part, Dr. Mann hopes these changes will gain widespread acceptance and clinical traction. “The problem sometimes with guidelines is that they’re so data driven that you just can’t come out and say the obvious, so making a position statement is a good first step. And they got good international representation on this, so I think these changes will be accepted in the next heart failure guidelines.”
To encourage further discussion and acceptance, Robert J. Mentz, MD, and Anuradha Lala, MD, editor-in-chief and deputy editor of the Journal of Cardiac Failure, respectively, announced a series of multidisciplinary perspective pieces to be published in the journal monthly, starting in May with editorials from Dr. Clyde W Yancy, MD, MSc, and Carolyn S.P. Lam, MBBS, PhD, both of whom were authors of the consensus statement.
Dr. Bozkurt reports being a consultant for Abbott, Amgen, Baxter, Bristol Myers Squibb, Liva Nova Relypsa/Vifor Pharma, Respicardia, and being on the registry steering committee for Sanofi-Aventis. Dr. Braunwald reports research grant support through Brigham and Women’s Hospital from AstraZeneca, Daiichi Sankyo, Merck, and Novartis; and consulting for Amgen, Boehringer-Ingelheim/Lilly, Cardurion, MyoKardia, Novo Nordisk, and Verve. Dr. Mann has been a consultant to Novartis, is on the steering committee for the PARADISE trial, and is on the scientific advisory board for MyoKardia/Bristol Myers Squibb.
FROM THE JOURNAL OF CARDIAC FAILURE
No vascular benefit of testosterone over exercise in aging men
Exercise training – but not testosterone therapy – improved vascular health in aging men with widening midsections and low to normal testosterone, new research suggests.

“Previous studies have suggested that men with higher levels of testosterone, who were more physically active, might have better health outcomes,” Bu Beng Yeap, MBBS, PhD, University of Western Australia, Perth, said in an interview. “We formulated the hypothesis that the combination of testosterone treatment and exercise training would improve the health of arteries more than either alone.”
To test this hypothesis, the investigators randomly assigned 80 men, aged 50-70 years, to 12 weeks of 5% testosterone cream 2 mL applied daily or placebo plus a supervised exercise program that included machine-based resistance and aerobic (cycling) exercises two to three times a week or no additional exercise.
The men (mean age, 59 years) had low-normal testosterone (6-14 nmol/L), a waist circumference of at least 95 cm (37.4 inches), and no known cardiovascular disease (CVD), type 1 diabetes, or other clinically significant illnesses. Current smokers and men on testosterone or medications that would alter testosterone levels were also excluded.
High-resolution ultrasound of the brachial artery was used to assess flow-mediated dilation (FMD) and sublingual glyceryl trinitrate (GTN) responses. FMD has been shown to be predictive of CVD risk, with a 1% increase in FMD associated with a 9%-13% decrease in future CVD events.
Based on participants’ daily dairies, testosterone adherence was 97.6%. Exercise adherence was 96.5% for twice-weekly attendance and 80.0% for thrice-weekly attendance, with no between-group differences.
As reported Feb. 22, 2021, in Hypertension, testosterone levels increased, on average, 3.0 nmol/L in both testosterone groups by week 12 (P = .003). In all, 62% of these men had levels of the hormone exceeding 14 nmol/L, compared with 29% of those receiving placebo.
Testosterone levels improved with exercise training plus placebo by 0.9 nmol/L, but fell with no exercise and placebo by 0.9 nmol/L.
In terms of vascular function, exercise training increased FMD when expressed as both the delta change (mm; P = .004) and relative rise from baseline diameter (%; P = .033).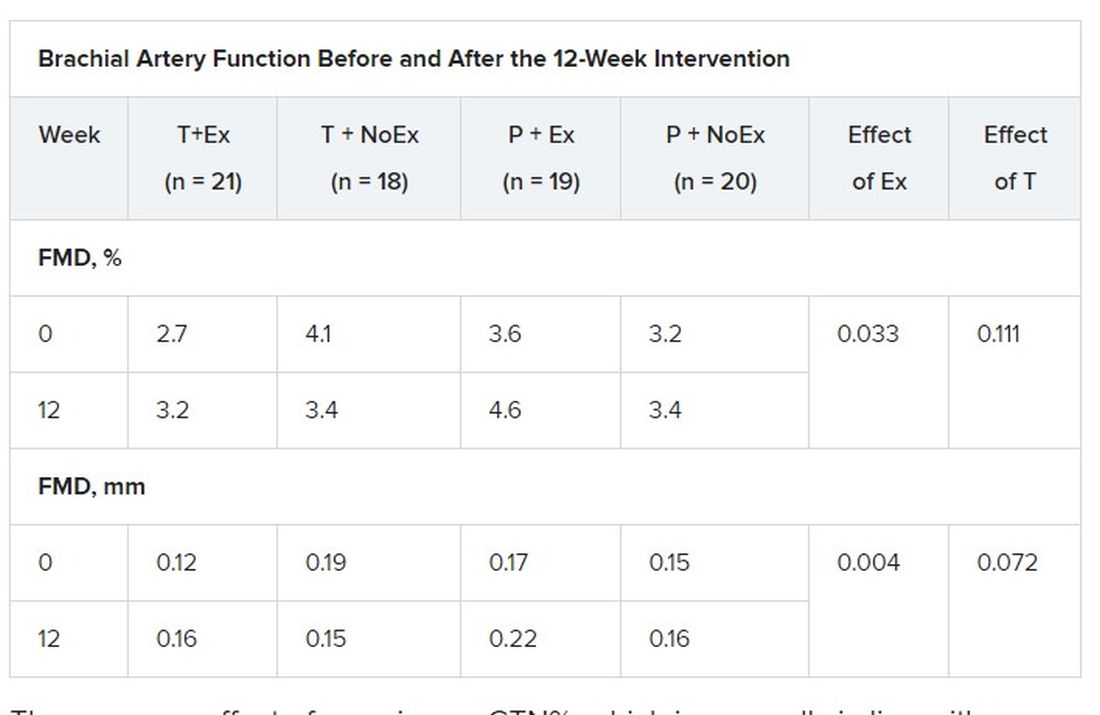
There was no effect of exercise on GTN%, which is generally in line with exercise literature indicating that shear-mediated adaptations in response to episodic exercise occur largely in endothelial cells, the authors noted.
Testosterone did not affect any measures of FMD nor was there an effect on GTN response, despite previous evidence that lower testosterone doses might enhance smooth muscle function.
“Our main finding was that testosterone – at this dose over this duration of treatment – did not have a beneficial effect on artery health, nor did it enhance the effect of exercise,” said Dr. Yeap, who is also president of the Endocrine Society of Australia. “For middle-aged and older men wanting to improve the health of their arteries, exercise is better than testosterone!”
Shalender Bhasin, MBBS, director of research programs in men’s health, aging, and metabolism at Brigham and Women’s Hospital and professor of medicine at Harvard Medical School, both in Boston, said the study is interesting from a mechanistic perspective and adds to the overall body of evidence on how testosterone affects performance, but was narrowly focused.
“They looked at very specific markers and what they’re showing is that this is not the mechanism by which testosterone improves performance,” he said. “That may be so, but it doesn’t negate the finding that testosterone improves endurance and has other vascular effects: it increases capillarity, increases blood flow to the tissues, and improves myocardial function.”
Although well done, the study doesn’t get at the larger question of whether testosterone increases cardiovascular risk, observed Dr. Bhasin. “None of the randomized studies have been large enough or long enough to determine the effect on cardiovascular events rates. There’s a lot of argument on both sides but we need some data to address that.”
The 6,000-patient TRAVERSE trial is specifically looking at long-term major cardiovascular events with topical testosterone, compared with placebo, in hypogonadal men aged 45-80 years age who have evidence of or are at increased risk for CVD. The study, which is set to be completed in April 2022, should also provide information on fracture risk in these men, said Dr. Bhasin, one of the trial’s principal investigators and lead author of the Endocrine Society’s 2018 clinical practice guideline on testosterone therapy for hypogonadism in men.
William Evans, MD, adjunct professor of human nutrition, University of California, Berkley, said in an interview that the positive effects of testosterone occur at much lower doses in men and women who are hypogonadal but, in this particular population, exercise is the key and the major recommendation.
“Testosterone has been overprescribed and overadvertised for essentially a lifetime of sedentary living, and it’s advertised as a way to get all that back without having to work for it,” he said. “Exercise has a profound and positive effect on control of blood pressure, function, and strength, and testosterone may only affect in people who are sick, people who have really low levels.”
The study was funded by the Heart Foundation of Australia. Lawley Pharmaceuticals provided the study medication and placebo. Dr. Yeap has received speaker honoraria and conference support from Bayer, Eli Lilly, and Besins Healthcare; research support from Bayer, Lily, and Lawley; and served as an adviser for Lily, Besins Healthcare, Ferring, and Lawley. Dr. Shalender reports consultation or advisement for GTx, Pfizer, and TAP; grant or other research support from Solvay and GlaxoSmithKline; and honoraria from Solvay and Auxilium. Dr. Evans reported having no relevant conflicts of interest.
A version of this article first appeared on Medscape.com.
Exercise training – but not testosterone therapy – improved vascular health in aging men with widening midsections and low to normal testosterone, new research suggests.
“Previous studies have suggested that men with higher levels of testosterone, who were more physically active, might have better health outcomes,” Bu Beng Yeap, MBBS, PhD, University of Western Australia, Perth, said in an interview. “We formulated the hypothesis that the combination of testosterone treatment and exercise training would improve the health of arteries more than either alone.”
To test this hypothesis, the investigators randomly assigned 80 men, aged 50-70 years, to 12 weeks of 5% testosterone cream 2 mL applied daily or placebo plus a supervised exercise program that included machine-based resistance and aerobic (cycling) exercises two to three times a week or no additional exercise.
The men (mean age, 59 years) had low-normal testosterone (6-14 nmol/L), a waist circumference of at least 95 cm (37.4 inches), and no known cardiovascular disease (CVD), type 1 diabetes, or other clinically significant illnesses. Current smokers and men on testosterone or medications that would alter testosterone levels were also excluded.
High-resolution ultrasound of the brachial artery was used to assess flow-mediated dilation (FMD) and sublingual glyceryl trinitrate (GTN) responses. FMD has been shown to be predictive of CVD risk, with a 1% increase in FMD associated with a 9%-13% decrease in future CVD events.
Based on participants’ daily dairies, testosterone adherence was 97.6%. Exercise adherence was 96.5% for twice-weekly attendance and 80.0% for thrice-weekly attendance, with no between-group differences.
As reported Feb. 22, 2021, in Hypertension, testosterone levels increased, on average, 3.0 nmol/L in both testosterone groups by week 12 (P = .003). In all, 62% of these men had levels of the hormone exceeding 14 nmol/L, compared with 29% of those receiving placebo.
Testosterone levels improved with exercise training plus placebo by 0.9 nmol/L, but fell with no exercise and placebo by 0.9 nmol/L.
In terms of vascular function, exercise training increased FMD when expressed as both the delta change (mm; P = .004) and relative rise from baseline diameter (%; P = .033).
There was no effect of exercise on GTN%, which is generally in line with exercise literature indicating that shear-mediated adaptations in response to episodic exercise occur largely in endothelial cells, the authors noted.
Testosterone did not affect any measures of FMD nor was there an effect on GTN response, despite previous evidence that lower testosterone doses might enhance smooth muscle function.
“Our main finding was that testosterone – at this dose over this duration of treatment – did not have a beneficial effect on artery health, nor did it enhance the effect of exercise,” said Dr. Yeap, who is also president of the Endocrine Society of Australia. “For middle-aged and older men wanting to improve the health of their arteries, exercise is better than testosterone!”
Shalender Bhasin, MBBS, director of research programs in men’s health, aging, and metabolism at Brigham and Women’s Hospital and professor of medicine at Harvard Medical School, both in Boston, said the study is interesting from a mechanistic perspective and adds to the overall body of evidence on how testosterone affects performance, but was narrowly focused.
“They looked at very specific markers and what they’re showing is that this is not the mechanism by which testosterone improves performance,” he said. “That may be so, but it doesn’t negate the finding that testosterone improves endurance and has other vascular effects: it increases capillarity, increases blood flow to the tissues, and improves myocardial function.”
Although well done, the study doesn’t get at the larger question of whether testosterone increases cardiovascular risk, observed Dr. Bhasin. “None of the randomized studies have been large enough or long enough to determine the effect on cardiovascular events rates. There’s a lot of argument on both sides but we need some data to address that.”
The 6,000-patient TRAVERSE trial is specifically looking at long-term major cardiovascular events with topical testosterone, compared with placebo, in hypogonadal men aged 45-80 years age who have evidence of or are at increased risk for CVD. The study, which is set to be completed in April 2022, should also provide information on fracture risk in these men, said Dr. Bhasin, one of the trial’s principal investigators and lead author of the Endocrine Society’s 2018 clinical practice guideline on testosterone therapy for hypogonadism in men.
William Evans, MD, adjunct professor of human nutrition, University of California, Berkley, said in an interview that the positive effects of testosterone occur at much lower doses in men and women who are hypogonadal but, in this particular population, exercise is the key and the major recommendation.
“Testosterone has been overprescribed and overadvertised for essentially a lifetime of sedentary living, and it’s advertised as a way to get all that back without having to work for it,” he said. “Exercise has a profound and positive effect on control of blood pressure, function, and strength, and testosterone may only affect in people who are sick, people who have really low levels.”
The study was funded by the Heart Foundation of Australia. Lawley Pharmaceuticals provided the study medication and placebo. Dr. Yeap has received speaker honoraria and conference support from Bayer, Eli Lilly, and Besins Healthcare; research support from Bayer, Lily, and Lawley; and served as an adviser for Lily, Besins Healthcare, Ferring, and Lawley. Dr. Shalender reports consultation or advisement for GTx, Pfizer, and TAP; grant or other research support from Solvay and GlaxoSmithKline; and honoraria from Solvay and Auxilium. Dr. Evans reported having no relevant conflicts of interest.
A version of this article first appeared on Medscape.com.
Thirteen percent of patients with type 2 diabetes have major ECG abnormalities
Major ECG abnormalities were found in 13% of more than 8,000 unselected patients with type 2 diabetes, including a 9% prevalence in the subgroup of these patients without identified cardiovascular disease (CVD) in a community-based Dutch cohort. Minor ECG abnormalities were even more prevalent.

These prevalence rates were consistent with prior findings from patients with type 2 diabetes, but the current report is notable because “it provides the most thorough description of the prevalence of ECG abnormalities in people with type 2 diabetes,” and used an “unselected and large population with comprehensive measurements,” including many without a history of CVD, said Peter P. Harms, MSc, and associates noted in a recent report in the Journal of Diabetes and Its Complications.
The analysis also identified several parameters that significantly linked with the presence of a major ECG abnormality including hypertension, male sex, older age, and higher levels of hemoglobin A1c.
“Resting ECG abnormalities might be a useful tool for CVD screening in people with type 2 diabetes,” concluded Mr. Harms, a researcher at the Amsterdam University Medical Center, and coauthors.
Findings “not unexpected”
Patients with diabetes have a higher prevalence of ECG abnormalities “because of their higher likelihood of having hypertension and other CVD risk factors,” as well as potentially having subclinical CVD, said Fred M. Kusumoto, MD, so these findings are “not unexpected. The more risk factors a patient has for structural heart disease, atrial fibrillation (AFib), or stroke from AFib, the more a physician must consider whether a baseline ECG and future surveillance is appropriate,” Dr. Kusumoto said in an interview.
But he cautioned against seeing these findings as a rationale to routinely run a resting ECG examination on every adult with diabetes.
“Patients with diabetes are very heterogeneous,” which makes it “difficult to come up with a ‘one size fits all’ recommendation” for ECG screening of patients with diabetes, he said.
While a task force of the European Society of Cardiology and the European Association for the Study of Diabetes set a class I level C guideline for resting ECG screening of patients with diabetes if they also have either hypertension or suspected CVD, the American Diabetes Association has no specific recommendations on which patients with diabetes should receive ECG screening.
“The current absence of U.S. recommendations is reasonable, as it allows patients and physicians to discuss the issues and decide on the utility of an ECG in their specific situation,” said Dr. Kusumoto, director of heart rhythm services at the Mayo Clinic in Jacksonville, Fla. But he also suggested that “the more risk factors that a patient with diabetes has for structural heart disease, AFib, or stroke from AFib the more a physician must consider whether a baseline ECG and future surveillance is appropriate.”
Data from a Dutch prospective cohort
The new study used data collected from 8,068 patients with type 2 diabetes and enrolled in the prospective Hoorn Diabetes Care System cohort, which enrolled patients newly diagnosed with type 2 diabetes in the West Friesland region of the Netherlands starting in 1996. The study includes most of these patients in the region who are under regular care of a general practitioner, and the study protocol calls for an annual resting ECG examination.
The investigators used standard, 12-lead ECG readings taken for each patient during 2018, and classified abnormalities by the Minnesota Code criteria. They divided the abnormalities into major or minor groups “in accordance with consensus between previous studies who categorised abnormalities according to perceived importance and/or severity.” The major subgroup included major QS pattern abnormalities, major ST-segment abnormalities, complete left bundle branch block or intraventricular block, or atrial fibrillation or flutter. Minor abnormalities included minor QS pattern abnormalities, minor ST-segment abnormalities, complete right bundle branch block, or premature atrial or ventricular contractions.
The prevalence of a major abnormality in the entire cohort examined was 13%, and another 16% had a minor abnormality. The most common types of abnormalities were ventricular conduction defects, in 14%; and arrhythmias, in 11%. In the subgroup of 6,494 of these patients with no history of CVD, 9% had a major abnormality and 15% a minor abnormality. Within this subgroup, 23% also had no hypertension, and their prevalence of a major abnormality was 4%, while 9% had a minor abnormality.
A multivariable analysis of potential risk factors among the entire study cohort showed that patients with hypertension had nearly triple the prevalence of a major ECG abnormality as those without hypertension, and men had double the prevalence of a major abnormality compared with women. Other markers that significantly linked with a higher rate of a major abnormality were older age, higher body mass index, higher A1c levels, and moderately depressed renal function.
“While the criteria the authors used for differentiating major and minor criteria are reasonable, in an asymptomatic patient even the presence of frequent premature atrial contractions on a baseline ECG has been associated with the development of AFib and a higher risk for stroke. The presence of left or right bundle branch block could spur additional evaluation with an echocardiogram,” said Dr. Kusumoto, president-elect of the Heart Rhythm Society.
“Generally an ECG abnormality is supplemental to clinical data in deciding the choice and timing of next therapeutic steps or additional testing. Physicians should have a fairly low threshold for obtaining ECG in patients with diabetes since it is inexpensive and can provide supplemental and potentially actionable information,” he said. “The presence of ECG abnormalities increases the possibility of underlying cardiovascular disease. When taking care of patients with diabetes at initial evaluation or without prior cardiac history or symptoms referable to the heart, two main issues are identifying the likelihood of coronary artery disease and atrial fibrillation.”
Mr. Harms and coauthors, and Dr. Kusumoto, had no disclosures.
Major ECG abnormalities were found in 13% of more than 8,000 unselected patients with type 2 diabetes, including a 9% prevalence in the subgroup of these patients without identified cardiovascular disease (CVD) in a community-based Dutch cohort. Minor ECG abnormalities were even more prevalent.
These prevalence rates were consistent with prior findings from patients with type 2 diabetes, but the current report is notable because “it provides the most thorough description of the prevalence of ECG abnormalities in people with type 2 diabetes,” and used an “unselected and large population with comprehensive measurements,” including many without a history of CVD, said Peter P. Harms, MSc, and associates noted in a recent report in the Journal of Diabetes and Its Complications.
The analysis also identified several parameters that significantly linked with the presence of a major ECG abnormality including hypertension, male sex, older age, and higher levels of hemoglobin A1c.
“Resting ECG abnormalities might be a useful tool for CVD screening in people with type 2 diabetes,” concluded Mr. Harms, a researcher at the Amsterdam University Medical Center, and coauthors.
Findings “not unexpected”
Patients with diabetes have a higher prevalence of ECG abnormalities “because of their higher likelihood of having hypertension and other CVD risk factors,” as well as potentially having subclinical CVD, said Fred M. Kusumoto, MD, so these findings are “not unexpected. The more risk factors a patient has for structural heart disease, atrial fibrillation (AFib), or stroke from AFib, the more a physician must consider whether a baseline ECG and future surveillance is appropriate,” Dr. Kusumoto said in an interview.
But he cautioned against seeing these findings as a rationale to routinely run a resting ECG examination on every adult with diabetes.
“Patients with diabetes are very heterogeneous,” which makes it “difficult to come up with a ‘one size fits all’ recommendation” for ECG screening of patients with diabetes, he said.
While a task force of the European Society of Cardiology and the European Association for the Study of Diabetes set a class I level C guideline for resting ECG screening of patients with diabetes if they also have either hypertension or suspected CVD, the American Diabetes Association has no specific recommendations on which patients with diabetes should receive ECG screening.
“The current absence of U.S. recommendations is reasonable, as it allows patients and physicians to discuss the issues and decide on the utility of an ECG in their specific situation,” said Dr. Kusumoto, director of heart rhythm services at the Mayo Clinic in Jacksonville, Fla. But he also suggested that “the more risk factors that a patient with diabetes has for structural heart disease, AFib, or stroke from AFib the more a physician must consider whether a baseline ECG and future surveillance is appropriate.”
Data from a Dutch prospective cohort
The new study used data collected from 8,068 patients with type 2 diabetes and enrolled in the prospective Hoorn Diabetes Care System cohort, which enrolled patients newly diagnosed with type 2 diabetes in the West Friesland region of the Netherlands starting in 1996. The study includes most of these patients in the region who are under regular care of a general practitioner, and the study protocol calls for an annual resting ECG examination.
The investigators used standard, 12-lead ECG readings taken for each patient during 2018, and classified abnormalities by the Minnesota Code criteria. They divided the abnormalities into major or minor groups “in accordance with consensus between previous studies who categorised abnormalities according to perceived importance and/or severity.” The major subgroup included major QS pattern abnormalities, major ST-segment abnormalities, complete left bundle branch block or intraventricular block, or atrial fibrillation or flutter. Minor abnormalities included minor QS pattern abnormalities, minor ST-segment abnormalities, complete right bundle branch block, or premature atrial or ventricular contractions.
The prevalence of a major abnormality in the entire cohort examined was 13%, and another 16% had a minor abnormality. The most common types of abnormalities were ventricular conduction defects, in 14%; and arrhythmias, in 11%. In the subgroup of 6,494 of these patients with no history of CVD, 9% had a major abnormality and 15% a minor abnormality. Within this subgroup, 23% also had no hypertension, and their prevalence of a major abnormality was 4%, while 9% had a minor abnormality.
A multivariable analysis of potential risk factors among the entire study cohort showed that patients with hypertension had nearly triple the prevalence of a major ECG abnormality as those without hypertension, and men had double the prevalence of a major abnormality compared with women. Other markers that significantly linked with a higher rate of a major abnormality were older age, higher body mass index, higher A1c levels, and moderately depressed renal function.
“While the criteria the authors used for differentiating major and minor criteria are reasonable, in an asymptomatic patient even the presence of frequent premature atrial contractions on a baseline ECG has been associated with the development of AFib and a higher risk for stroke. The presence of left or right bundle branch block could spur additional evaluation with an echocardiogram,” said Dr. Kusumoto, president-elect of the Heart Rhythm Society.
“Generally an ECG abnormality is supplemental to clinical data in deciding the choice and timing of next therapeutic steps or additional testing. Physicians should have a fairly low threshold for obtaining ECG in patients with diabetes since it is inexpensive and can provide supplemental and potentially actionable information,” he said. “The presence of ECG abnormalities increases the possibility of underlying cardiovascular disease. When taking care of patients with diabetes at initial evaluation or without prior cardiac history or symptoms referable to the heart, two main issues are identifying the likelihood of coronary artery disease and atrial fibrillation.”
Mr. Harms and coauthors, and Dr. Kusumoto, had no disclosures.
FROM THE JOURNAL OF DIABETES AND ITS COMPLICATIONS