User login
ACC 21 looks to repeat success despite pandemic headwinds
The American College of Cardiology pulled off an impressive all-virtual meeting in March 2020, less than 3 weeks after canceling its in-person event and just 2 weeks after COVID-19 was declared a national emergency.
Optimistic plans for the annual scientific sessions of the American College of Cardiology (ACC 2021) to be a March hybrid affair in Atlanta pivoted not once, but twice, as the pandemic evolved, with the date pushed back 2 full months, to May 15-17, and the format revised to fully virtual.
“While this meeting is being delivered virtually, I think you’ll see there have been benefits in the time to plan and also the lessons that ACC has learned in virtual education over the past year. This has come together to really create a robust educational and scientific agenda,” ACC 2021 chair Pamela B. Morris, MD, said in a press conference focused on the upcoming meeting.
Over the 3 days, there will be more than 200 education sessions, 10 guideline-specific sessions, and 11 learning pathways that include core areas, but also special topics, such as COVID-19 and the emerging cardio-obstetrics subspecialty.
The meeting will be delivered through a new virtual education program built to optimize real-time interaction between faculty members and attendees, she said. A dedicated portal on the platform will allow attendees to interact virtually, for example, with presenters of the nearly 3,000 ePosters and 420 moderated posters.
For those suffering from Zoom fatigue, the increasingly popular Heart2Heart stage talks have also been converted to podcasts, which cover topics like gender equity in cardiology, the evolving role of advanced practice professionals, and “one of my favorites: art as a tool for healing,” said Dr. Morris, from the Medical University of South Carolina, Charleston. “Those sessions are really not to be missed.”
Reconnecting is an underlying theme of the meeting but the great divider will not be ignored. COVID-19 will be the focus of two 90-minute Intensive Sessions on Saturday, May 15, the first kicking off at 10:30 a.m. ET, with the Bishop Keynote lecture on bringing health equity to the frontline of cardiovascular care, followed by lessons learned during the pandemic, how to conduct clinical trials, and vaccine development.
The second session, set for 12:15 p.m., continues the “silver linings” theme, with case presentations on advances in telehealth, myocardial involvement, and thrombosis in COVID. For those wanting more, 18 abstracts are on tap in a 2-hour Spotlight on Special Topics session beginning at 2:30 p.m.
Asked about the pandemic’s effect on bringing science to fruition this past year, Dr. Morris said there’s no question it’s slowed some of the progress the cardiology community had made but, like clinical practice, “we’ve also surmounted many of those obstacles.”
“I think research has rebounded,” she said. “Just in terms of the number of abstracts and the quality of abstracts that were submitted this year, I don’t think there’s any question that we are right on par with previous years.”
Indeed, 5,258 abstracts from 76 countries were submitted, with more than 3,400 chosen for oral and poster presentation, including 25 late-breaking clinical trials to be presented in five sessions.
The late-breaking presentations and discussions will be prerecorded but speakers and panelists have been invited to be present during the streaming to answer live any questions that may arise in the chat box, ACC 2021 vice chair Douglas Drachman, MD, Massachusetts General Hospital, Boston, said in an interview.
Late-breaking clinical trials
The Joint ACC/JACC Late-Breaking Clinical Trials I (Saturday, May 15, 9:00 a.m.–-10:00 a.m.) kicks off with PARADISE-MI, the first head-to-head comparison of an angiotensin receptor neprilysin inhibitor (ARNI) and an ACE inhibitor in patients with reduced ejection fractions (EFs) after MI but no history of heart failure (HF), studying 200 mg sacubitril/valsartan (Entresto) versus 5 mg of ramipril, both twice daily, in 5,669 patients.
Sacubitril/valsartan was initially approved for HF with reduced EF and added a new indication to treat some HF patients with preserved EF. Novartis, however, recently told investors that although numerical trends consistently favored the ARNI over the ACE inhibitor ramipril, the phase 3 study failed to meet the primary endpoint for efficacy superiority of reducing the risk for cardiovascular (CV) death and HF events after an acute MI.
Second up is ADAPTABLE, which looks to close a surprising evidence gap over whether 81 mg or 325 mg daily is the optimal dose of the ubiquitously prescribed aspirin for secondary prevention in high-risk patients with established atherosclerotic CV disease.
The open-label, randomized study will look at efficacy and major bleeding over roughly 4 years in 15,000 patients within PCORnet, the National Patient-centered Clinical Research Network, a partnership of clinical research, health plan research, and patient-powered networks created to streamline patient-reported outcomes research.
“This study will not only give important clinical information for us, practically speaking, whether we should prescribe lower- or higher-dose aspirin, but it may also serve as a template for future pragmatic clinical trial design in the real world,” Dr. Drachman said during the press conference.
Up next is the 4,812-patient Canadian LAAOS III, the largest trial to examine the efficacy of left atrial appendage occlusion for stroke prevention in patients with atrial fibrillation (AFib) already undergoing cardiac surgery. The primary outcome is the first occurrence of stroke or systemic arterial embolism over an average follow-up of 4 years.
Percutaneous closure of the left atrial appendage (LAA) has been shown to reduce stroke in AFib patients at high-risk of bleeding on systemic anticoagulation. But these devices can be expensive and studies haven’t included patients who also have valvular heart disease, a group that actually comprises more than half of patients undergoing cardiac surgery who also have AFib, he noted.
At the same time, surgical LAA closure studies have been small and have had very mixed results. “There isn’t a large-scale rigorous assessment out there for these patients undergoing surgery, so I think this is going to be fascinating to see,” Dr. Drachman said.
The session closes with ATLANTIS, which looks to shed some light on the role of anticoagulation therapy in patients after transcatheter aortic valve replacement (TAVR or TAVI). POPular TAVI, presented at ACC 2020, showed aspirin alone was the preferred antithrombotic therapy over aspirin plus clopidogrel (Plavix) in patients not on oral anticoagulants, but the optimal anticoagulation regimen remains unsettled.
The French open-label, 1,510-patient ATLANTIS trial examined whether the novel oral anticoagulant apixaban (Eliquis) is superior in preventing CV events after TAVR, compared with antiplatelet therapy in patients without an indication for anticoagulation and compared with vitamin K antagonists in those receiving anticoagulants.
An ATLANTIS 4D CT substudy of valve thrombosis is also slated for Saturday’s Featured Clinical Research 1 session at 12:15 p.m. to 1:45 p.m..
Sunday LBCTs
Dr. Drachman highlighted a series of other late-breaking studies, including the global DARE-19 trial testing the diabetes and HF drug dapagliflozin (Farxiga) given with local standard-of-care therapy for 30 days in hospitalized COVID-19 patients with CV, metabolic, or renal risk factors.
Although sodium-glucose cotransporter-2 inhibitors have been white-hot of late, top-line results reported last month show dapagliflozin failed to achieve statistical significance for the primary endpoints of reducing organ dysfunction and all-cause mortality and for improving recovery. Details will be presented in the Joint ACC/JAMA Late-Breaking Clinical Trials II (Sunday, May 16, 8:00 a.m.-9:30 a.m.).
Two trials, FLOWER-MI and RADIANCE-HTN TRIO, were singled out in the Joint ACC/New England Journal of Medicine Late-Breaking Clinical Trials III (Sunday, May 16, 10:45 a.m.-12:00 p.m.). FLOWER-MI examines whether fractional flow reserve (FFR) is better than angiography to guide complete multivessel revascularization in ST-elevation MI patients with at least 50% stenosis in at least one nonculprit lesion requiring percutaneous coronary intervention (PCI). Recent studies have shown the superiority of FFR-guided PCI for nonculprit lesions, compared with culprit lesion treatment-only, but this is the first time FFR- and angiography-guided PCI have been compared in STEMI patients.
RADIANCE-HTN TRIO already tipped its hand, with top-line results reported in late 2020 showing that the trial met its primary efficacy endpoint of greater reduction in daytime blood pressure over 2 months with the Paradise endovascular ultrasound renal denervation system, compared with a sham procedure, in 136 patients with resistant hypertension, importantly, after being given a single pill containing a calcium channel blocker, angiotensin II receptor blocker, and diuretic.
Renal denervation for hypertension has been making something of a comeback, with the 2018 RADIANCE-HTN SOLO reporting better ambulatory blood pressure control with the Paradise system than with a sham procedure in the absence of antihypertensive agents. The device has been granted breakthrough device designation from the Food and Drug Administration for the treatment of hypertensive patients who are unable to sufficiently respond to or are intolerant of antihypertensive therapy.
Monday LBCTs
In the Late-Breaking Clinical Trials IV session (Monday, May 17, 8 a.m.–9:30 a.m.), Drachman called out a secondary analysis from GALATIC-HF looking at the impact of EF on the therapeutic effect of omecamtiv mecarbil. In last year’s primary analysis, the selective cardiac myosin activator produced a modest but significant reduction in HF events or CV death in 8,232 patients with HF and an EF of 35% or less.
Rounding out the list is the Canadian CAPITAL CHILL study of moderate versus mild therapeutic hypothermia in out-of-hospital cardiac arrest, to be presented in the final Late-Breaking Clinical Trials V session (Monday, May 17, 10:45 a.m.–12:00 p.m.).
The double-blind trial sought to determine whether neurologic outcomes at 6 months are improved by targeting a core temperature of 31 ˚C versus 34 ˚C after the return of spontaneous circulation in comatose survivors of out-of-hospital cardiac arrest.
“For me, I think this could really change practice and has personal relevance from experience with cardiac arrest survivors that I’ve known and care for very deeply,” Dr. Drachman said in an interview. “I think that there’s a lot of opportunity here as well.”
Asked what other trials have the potential to change practice, Dr. Drachman said FLOWER-MI holds particular interest because it looks at how to manage patients with STEMI with multiple lesions at the point of care.
“We’ve gained a lot of clarity from several other prior clinical trials, but this will help to answer the question in a slightly different way of saying: can you eyeball it, can you look at the angiogram and say whether or not that other, nonculprit lesion ought to be treated in the same hospitalization or should you really be using a pressure wire,” he said. “For me as an interventionalist, this is really important because when you finish up doing an intervention on a patient it might be the middle of the night and the patient may be more or less stable, but you’ve already exposed them to the risk of a procedure, should you then move on and do another aspect of the procedure to interrogate with a pressure wire a remaining narrowing? I think that’s very important; that’ll help me make decisions on a day-to-day basis.”
Dr. Drachman also cited RADIANCE-HTN TRIO because it employs an endovascular technique to control blood pressure in patients with hypertension, specifically those resistant to multiple drugs.
During the press conference, Dr. Morris, a preventive cardiologist, put her money on the ADAPTABLE study of aspirin dosing, reiterating that the unique trial design could inform future research, and on Sunday’s 8:45 a.m. late-breaking post hoc analysis from the STRENGTH trial that looks to pick up where the controversy over omega-3 fatty acid preparations left off at last year’s American Heart Association meeting.
A lack of benefit on CV event rates reported with Epanova, a high-dose combination of eicosapentaenoic acid (EPA) and docosahexaenoic acid, led to a contentious debate over how to reconcile STRENGTH with the findings from REDUCE-IT, which showed a 25% relative risk reduction in major CV events with the EPA product icosapent ethyl (Vascepa).
STRENGTH investigator Steven Nissen, MD, Cleveland Clinic, and REDUCE-IT investigator and session panelist Deepak Bhatt, MD, Brigham and Women’s Hospital, Boston, will share the virtual stage at ACC 2021, but Dr. Morris said the “good news” is both researchers know one another very well and “will really be focusing on no political issues, just the omega-3 fatty levels in the bloodstream and what does that mean in either trial.
“This is not designed to be a debate, point counterpoint,” she added.
For that, as all cardiologists and journalists know, there will be the wild and woolly #CardioTwitter sphere.
A version of this article first appeared on Medscape.com.
Canned diabetes prevention and a haunted COVID castle
Lower blood sugar with sardines

If you’ve ever turned your nose up at someone eating sardines straight from the can, you could be the one missing out on a good way to boost your own health.
New research from Open University of Catalonia (Spain) has found that eating two cans of whole sardines a week can help prevent people from developing type 2 diabetes (T2D). Now you might be thinking: That’s a lot of fish, can’t I just take a supplement pill? Actually, no.
“Nutrients can play an essential role in the prevention and treatment of many different pathologies, but their effect is usually caused by the synergy that exists between them and the food that they are contained in,” study coauthor Diana Rizzolo, PhD, said in a written statement. See, we told you.
In a study of 152 patients with prediabetes, each participant was put on a specific diet to reduce their chances of developing T2D. Among the patients who were not given sardines each week, the proportion considered to be at the highest risk fell from 27% to 22% after 1 year, but for those who did get the sardines, the size of the high-risk group shrank from 37% to just 8%.
Suggesting sardines during checkups could make eating them more widely accepted, Dr. Rizzolo and associates said. Sardines are cheap, easy to find, and also have the benefits of other oily fish, like boosting insulin resistance and increasing good cholesterol.
So why not have a can with a couple of saltine crackers for lunch? Your blood sugar will thank you. Just please avoid indulging on a plane or in your office, where workers are slowly returning – no need to give them another excuse to avoid their cubicle.
Come for the torture, stay for the vaccine

Bran Castle. Home of Dracula and Vlad the Impaler (at least in pop culture’s eyes). A moody Gothic structure atop a hill. You can practically hear the ancient screams of thousands of tortured souls as you wander the grounds and its cursed halls. Naturally, it’s a major tourist destination.
Unfortunately for Romania, the pandemic has rather put a damper on tourism. The restrictions have done their damage, but here’s a quick LOTME theory: Perhaps people don’t want to be reminded of medieval tortures when we’ve got plenty of modern-day ones right now.
The management of Bran Castle has developed a new gimmick to drum up attendance – come to Bran Castle and get your COVID vaccine. Anyone can come and get jabbed with the Pfizer vaccine on all weekends in May, and when they do, they gain free admittance to the castle and the exhibit within, home to 52 medieval torture instruments. “The idea … was to show how people got jabbed 500-600 years ago in Europe,” the castle’s marketing director said.
While it may not be kind of the jabbing ole Vladdy got his name for – fully impaling people on hundreds of wooden stakes while you eat a nice dinner isn’t exactly smiled upon in today’s world – we’re sure he’d approve of this more limited but ultimately beneficial version. Jabbing people while helping them really is the dream.
Fuzzy little COVID detectors

Before we get started, we need a moment to get our deep, movie trailer announcer-type voice ready. Okay, here goes.
“In a world where an organism too tiny to see brings entire economies to a standstill and pits scientists against doofuses, who can humanity turn to for help?”
How about bees? That’s right, we said bees. But not just any bees. Specially trained bees. Specially trained Dutch bees. Bees trained to sniff out our greatest nemesis. No, we’re not talking about Ted Cruz anymore. Let it go, that was just a joke. We’re talking COVID.
We’ll let Wim van der Poel, professor of virology at Wageningen (the Netherlands) University, explain the process: “We collect normal honeybees from a beekeeper, and we put the bees in harnesses.” And you thought their tulips were pretty great – the Dutch are putting harnesses on bees! (Which is much better than our previous story of bees involving a Taiwanese patient.)
The researchers presented the bees with two types of samples: COVID infected and non–COVID infected. The infected samples came with a sugary water reward and the noninfected samples did not, so the bees quickly learned to tell the difference.
The bees, then, could cut the waiting time for test results down to seconds, and at a fraction of the cost, making them an option in countries without a lot of testing infrastructure, the research team suggested.
The plan is not without its flaws, of course, but we’re convinced. More than that, we are true bee-lievers.
A little slice of … well, not heaven

If you’ve been around for the last 2 decades, you’ve seen your share of Internet trends: Remember the ice bucket challenge? Tide pod eating? We know what you’re thinking: Sigh, what could they be doing now?
Well, people are eating old meat, and before you think about the expired ground beef you got on special from the grocery store yesterday, that’s not quite what we mean. We all know expiration dates are “suggestions,” like yield signs and yellow lights. People are eating rotten, decomposing, borderline moldy meat.
They claim that the meat tastes better. We’re not so sure, but don’t worry, because it gets weirder. Some folks, apparently, are getting high from eating this meat, experiencing a feeling of euphoria. Personally, we think that rotten fumes probably knocked these people out and made them hallucinate.
Singaporean dietitian Naras Lapsys says that eating rotten meat can possibly cause a person to go into another state of consciousness, but it’s not a good thing. We don’t think you have to be a dietitian to know that.
It has not been definitively proven that eating rotting meat makes you high, but it’s definitely proven that this is disgusting … and very dangerous.
Lower blood sugar with sardines
If you’ve ever turned your nose up at someone eating sardines straight from the can, you could be the one missing out on a good way to boost your own health.
New research from Open University of Catalonia (Spain) has found that eating two cans of whole sardines a week can help prevent people from developing type 2 diabetes (T2D). Now you might be thinking: That’s a lot of fish, can’t I just take a supplement pill? Actually, no.
“Nutrients can play an essential role in the prevention and treatment of many different pathologies, but their effect is usually caused by the synergy that exists between them and the food that they are contained in,” study coauthor Diana Rizzolo, PhD, said in a written statement. See, we told you.
In a study of 152 patients with prediabetes, each participant was put on a specific diet to reduce their chances of developing T2D. Among the patients who were not given sardines each week, the proportion considered to be at the highest risk fell from 27% to 22% after 1 year, but for those who did get the sardines, the size of the high-risk group shrank from 37% to just 8%.
Suggesting sardines during checkups could make eating them more widely accepted, Dr. Rizzolo and associates said. Sardines are cheap, easy to find, and also have the benefits of other oily fish, like boosting insulin resistance and increasing good cholesterol.
So why not have a can with a couple of saltine crackers for lunch? Your blood sugar will thank you. Just please avoid indulging on a plane or in your office, where workers are slowly returning – no need to give them another excuse to avoid their cubicle.
Come for the torture, stay for the vaccine
Bran Castle. Home of Dracula and Vlad the Impaler (at least in pop culture’s eyes). A moody Gothic structure atop a hill. You can practically hear the ancient screams of thousands of tortured souls as you wander the grounds and its cursed halls. Naturally, it’s a major tourist destination.
Unfortunately for Romania, the pandemic has rather put a damper on tourism. The restrictions have done their damage, but here’s a quick LOTME theory: Perhaps people don’t want to be reminded of medieval tortures when we’ve got plenty of modern-day ones right now.
The management of Bran Castle has developed a new gimmick to drum up attendance – come to Bran Castle and get your COVID vaccine. Anyone can come and get jabbed with the Pfizer vaccine on all weekends in May, and when they do, they gain free admittance to the castle and the exhibit within, home to 52 medieval torture instruments. “The idea … was to show how people got jabbed 500-600 years ago in Europe,” the castle’s marketing director said.
While it may not be kind of the jabbing ole Vladdy got his name for – fully impaling people on hundreds of wooden stakes while you eat a nice dinner isn’t exactly smiled upon in today’s world – we’re sure he’d approve of this more limited but ultimately beneficial version. Jabbing people while helping them really is the dream.
Fuzzy little COVID detectors
Before we get started, we need a moment to get our deep, movie trailer announcer-type voice ready. Okay, here goes.
“In a world where an organism too tiny to see brings entire economies to a standstill and pits scientists against doofuses, who can humanity turn to for help?”
How about bees? That’s right, we said bees. But not just any bees. Specially trained bees. Specially trained Dutch bees. Bees trained to sniff out our greatest nemesis. No, we’re not talking about Ted Cruz anymore. Let it go, that was just a joke. We’re talking COVID.
We’ll let Wim van der Poel, professor of virology at Wageningen (the Netherlands) University, explain the process: “We collect normal honeybees from a beekeeper, and we put the bees in harnesses.” And you thought their tulips were pretty great – the Dutch are putting harnesses on bees! (Which is much better than our previous story of bees involving a Taiwanese patient.)
The researchers presented the bees with two types of samples: COVID infected and non–COVID infected. The infected samples came with a sugary water reward and the noninfected samples did not, so the bees quickly learned to tell the difference.
The bees, then, could cut the waiting time for test results down to seconds, and at a fraction of the cost, making them an option in countries without a lot of testing infrastructure, the research team suggested.
The plan is not without its flaws, of course, but we’re convinced. More than that, we are true bee-lievers.
A little slice of … well, not heaven
If you’ve been around for the last 2 decades, you’ve seen your share of Internet trends: Remember the ice bucket challenge? Tide pod eating? We know what you’re thinking: Sigh, what could they be doing now?
Well, people are eating old meat, and before you think about the expired ground beef you got on special from the grocery store yesterday, that’s not quite what we mean. We all know expiration dates are “suggestions,” like yield signs and yellow lights. People are eating rotten, decomposing, borderline moldy meat.
They claim that the meat tastes better. We’re not so sure, but don’t worry, because it gets weirder. Some folks, apparently, are getting high from eating this meat, experiencing a feeling of euphoria. Personally, we think that rotten fumes probably knocked these people out and made them hallucinate.
Singaporean dietitian Naras Lapsys says that eating rotten meat can possibly cause a person to go into another state of consciousness, but it’s not a good thing. We don’t think you have to be a dietitian to know that.
It has not been definitively proven that eating rotting meat makes you high, but it’s definitely proven that this is disgusting … and very dangerous.
Subcutaneous, Mucocutaneous, and Mucous Membrane Tumors
The Diagnosis: Granular Cell Tumor
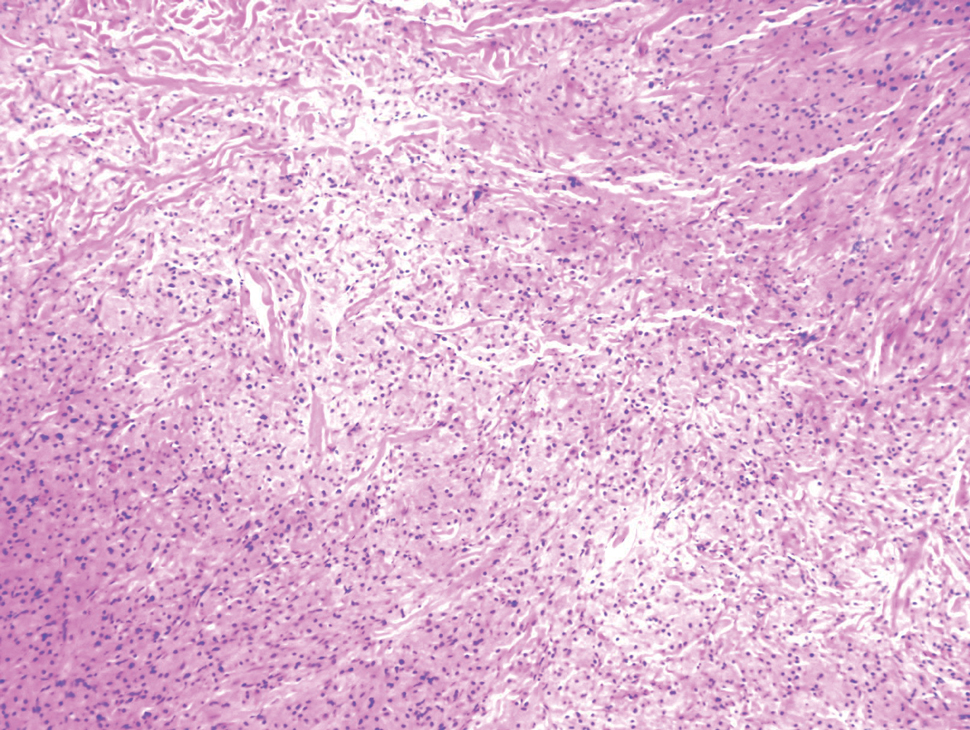
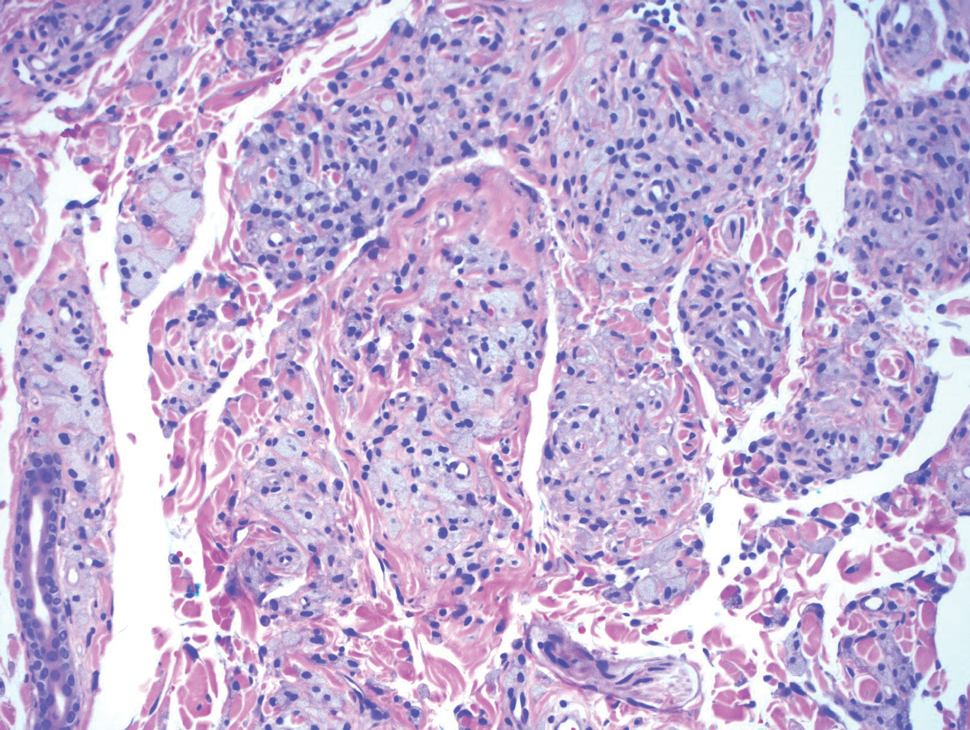
Histopathologic analysis from the axillary excision demonstrated cords and sheets of large polygonal cells in the dermis with uniform, oval, hyperchromatic nuclei and ample pink granular-staining cytoplasm (quiz images). An infiltrative growth pattern was noted; however, there was no evidence of conspicuous mitoses, nuclear pleomorphism, or necrosis. These results in conjunction with the immunohistochemistry findings were consistent with a benign granular cell tumor (GCT), a rare neoplasm considered to have neural/Schwann cell origin.1-3
Our case demonstrates the difficulty in clinically diagnosing cutaneous GCTs. The tumor often presents as a solitary, 0.5- to 3-cm, asymptomatic, firm nodule4,5; however, GCTs also can appear verrucous, eroded, or with other variable morphologies, which can create diagnostic challenges.5,6 Accordingly, a 1980 study of 110 patients with GCTs found that the preoperative clinical diagnosis was incorrect in all but 3 cases,7 emphasizing the need for histologic evaluation. Benign GCTs tend to exhibit sheets of polygonal tumor cells with eosinophilic granular cytoplasm and small central nuclei.3,5 The cytoplasmic granules are periodic acid-Schiff positive and diastase resistant.6 Many cases feature pseudoepitheliomatous hyperplasia, which can misleadingly resemble squamous cell carcinoma.3,5,6 Of note, invasive growth patterns on histology can occur with benign GCTs, as in our patient's case, and do not impact prognosis.3,4 On immunohistochemistry, benign, atypical, and malignant GCTs often stain positive for S-100 protein, vimentin, neuron-specific enolase, SOX10, and CD68.1,3
Although our patient's GCTs were benign, an estimated 1% to 2% are malignant.1,4 In 1998, Fanburg-Smith et al1 defined 6 histologic criteria that characterize malignant GCTs: necrosis, tumor cell spindling, vesicular nuclei with large nucleoli, high nuclear to cytoplasmic ratio, increased mitosis, and pleomorphism. Neoplasms with 3 or more of these features are classified as malignant, those with 1 or 2 are considered atypical, and those with only pleomorphism or no other criteria met are diagnosed as benign.1
Multiple GCTs have been reported in 10% to 25% of cases and, as highlighted in our case, can occur in both a metachronous and synchronous manner.2-4,6 Our patient developed a solitary GCT on the inferior lip 3 years prior to the appearance of 2 additional GCTs within 6 months of each other. The presence of multiple GCTs has been associated with genetic syndromes, such as neurofibromatosis type 1 and Noonan syndrome with multiple lentigines3,8; however, as our case demonstrates, multiple GCTs can occur in nonsyndromic patients as well. When multiple GCTs develop at distant sites, they can resemble metastasis.3 To differentiate these clinical scenarios, Machado et al3 proposed utilizing histology and anatomic location. Multiple tumors with benign characteristics on histology likely represent multiple GCTs, whereas tumors arising at sites common to GCT metastasis, such as lymph node, bone, or viscera, are more concerning for metastatic disease. It has been suggested that patients with multiple GCTs should be monitored with physical examination and repeat magnetic resonance imaging or computed tomography every 6 to 12 months.2 Given our patient's presentation with new tumors arising within 6 months of one another, we recommended a 6-month follow-up interval rather than 1 year. Due to the rarity of GCTs, clinical trials to define treatment guidelines and recommendations have not been performed.3 However, the most commonly utilized treatment modality is wide local excision, as performed in our patient.2,4
Melanoma, atypical fibroxanthoma (AFX), xanthoma, and leiomyosarcoma may be difficult to distinguish from GCT.1,3,4 Melanoma incidence has increased dramatically over the last several decades, with rates in the United States rising from 6.8 cases per 100,000 individuals in the 1970s to 20.1 in the early 2000s. Risk factors for its development include UV radiation exposure and particularly severe sunburns during childhood, along with a number of host risk factors such as total number of melanocytic nevi, family history, and fair complexion.9 Histologically, it often demonstrates irregularly distributed, poorly defined melanocytes with pagetoid spread and dyscohesive nests (Figure 1).10 Melanoma metastasis occasionally can present as a soft-tissue mass and often stains positive for S-100 and vimentin, thus resembling GCT1,4; however, unlike melanoma, GCTs lack melanosomes and stain negative for more specific melanocyte markers, such as melanoma antigen recognized by T cells 1 (MART-1).1,3,4
Atypical fibroxanthoma is a cutaneous neoplasm with fibrohistiocytic mesenchymal origin.11 These tumors typically arise on the head and neck in elderly individuals, particularly men with sun-damaged skin. They often present as superficial, rapidly growing nodules with the potential to ulcerate and bleed.11,12 Histologic features include pleomorphic spindle and epithelioid cells, whose nuclei appear hyperchromatic with atypical mitoses (Figure 2).12 Granular cell changes occur infrequently with AFXs, but in such cases immunohistochemistry can readily distinguish AFX from GCT. Although both tend to stain positive for CD68 and vimentin, AFXs lack S-100 protein and SOX10 expression that frequently is observed in GCTs.3,12

Xanthomas are localized lipid deposits in the connective tissue of the skin that often arise in association with dyslipidemia.13 They typically present as soft to semisolid yellow papules, plaques, or nodules. Their clinical appearance can resemble GCTs; however, histologic analysis enables differentiation with ease, as xanthomas demonstrate characteristic foam cells, consisting of lipid-laden macrophages (Figure 3).13
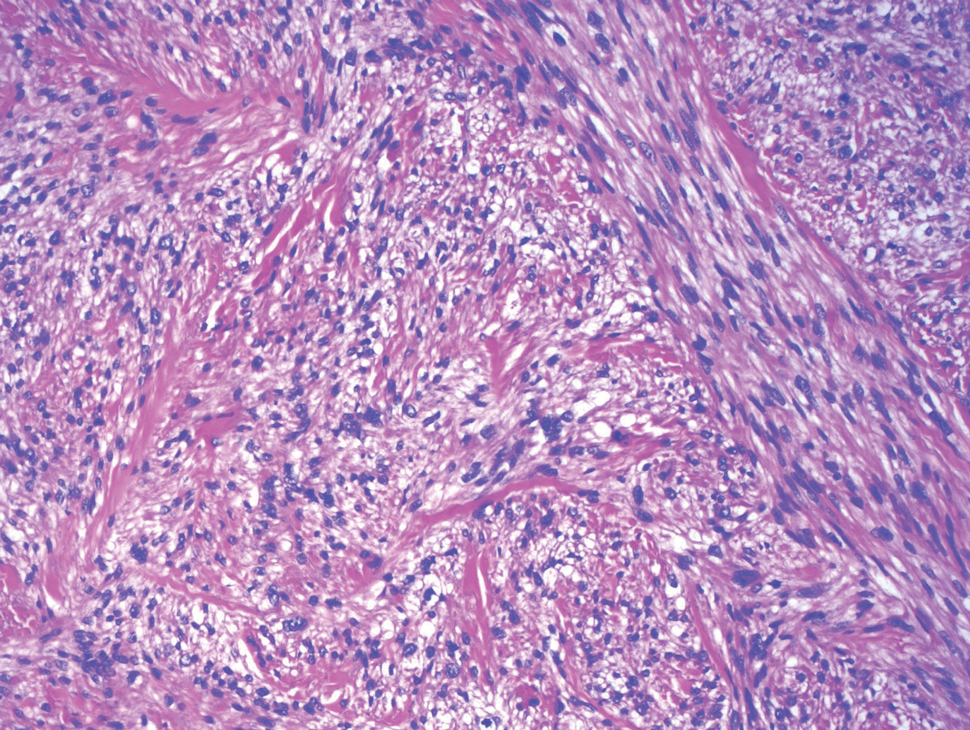
Cutaneous leiomyosarcoma is a rare dermal neoplasm, accounting for 2% to 3% of all sarcomas.14 They typically occur in White males during the fifth to seventh decades of life and often present as asymptomatic lesions on the lower extremities. They frequently arise from pilar smooth muscle. Unlike uterine and soft-tissue leiomyosarcoma, cutaneous leiomyosarcoma tends to follow an indolent course and rarely metastasizes.14 Histologically, these tumors display intersecting, well-defined, spindle-cell fascicles with abundant eosinophilic cytoplasm and cigar-shaped, blunt-ended nuclei (Figure 4).15 Occasionally, leiomyosarcomas can demonstrate cytoplasmic granularity due to lysosome accumulation4; nevertheless, the diagnosis usually can be elucidated by examining more typical histologic areas and utilizing immunohistochemistry, which often stains positive for α-smooth muscle actin, desmin, and h-caldesmon.4,15
- Fanburg-Smith JC, Meis-Kindblom JM, Fante R, et al. Malignant granular cell tumor of soft tissue: diagnostic criteria and clinicopathologic correlation. Am J Surg Pathol. 1998;22:779-794.
- Moten AS, Movva S, von Mehren M, et al. Granular cell tumor experience at a comprehensive cancer center. J Surg Res. 2018;226:1-7.
- Machado I, Cruz J, Lavernia J, et al. Solitary, multiple, benign, atypical, or malignant: the "granular cell tumor" puzzle. Virchows Arch. 2016;468:527-538.
- Ordóñez NG. Granular cell tumor: a review and update. Adv Anat Pathol. 1999;6:186-203.
- Vaughan V, Ferringer T. Granular cell tumor. Cutis. 2014;94:275, 279-280.
- Van L, Parker SR. Multiple morphologically distinct cutaneous granular cell tumors occurring in a single patient. Cutis. 2016;97:E26-E29.
- Lack EE, Worsham GF, Callihan MD, et al. Granular cell tumor: a clinicopathologic study of 110 patients. J Surg Oncol. 1980;13:301-316.
- Bamps S, Oyen T, Legius E, et al. Multiple granular cell tumors in a child with Noonan syndrome. Eur J Pediatr Surg. 2013;23:257-259.
- Rastrelli M, Tropea S, Rossi CR, et al. Melanoma: epidemiology, risk factors, pathogenesis, diagnosis and classification. In Vivo. 2014;28:1005-1011.
- Smoller BR. Histologic criteria for diagnosing primary cutaneousmalignant melanoma. Mod Pathol. 2006;19(suppl 2):S34-S40.
- Soleymani T, Aasi SZ, Novoa R, et al. Atypical fibroxanthoma and pleomorphic dermal sarcoma: updates on classification and management. Dermatol Clin. 2019;37:253-259.
- Cardis MA, Ni J, Bhawan J. Granular cell differentiation: a review of the published work. J Dermatol. 2017;44:251-258.
- Zak A, Zeman M, Slaby A, et al. Xanthomas: clinical and pathophysiological relations [published online April 29, 2014]. Biomed Pap Med Fac Univ Palacky Olomouc Czech Repub. 2014;158:181-188.
- Sandhu N, Sauvageau AP, Groman A, et al. Cutaneous leiomyosarcoma: a SEER database analysis. Dermatol Surg. 2020;46:159-164.
- George S, Serrano C, Hensley ML, et al. Soft tissue and uterine leiomyosarcoma. J Clin Oncol. 2018;36:144-150.
The Diagnosis: Granular Cell Tumor
Histopathologic analysis from the axillary excision demonstrated cords and sheets of large polygonal cells in the dermis with uniform, oval, hyperchromatic nuclei and ample pink granular-staining cytoplasm (quiz images). An infiltrative growth pattern was noted; however, there was no evidence of conspicuous mitoses, nuclear pleomorphism, or necrosis. These results in conjunction with the immunohistochemistry findings were consistent with a benign granular cell tumor (GCT), a rare neoplasm considered to have neural/Schwann cell origin.1-3
Our case demonstrates the difficulty in clinically diagnosing cutaneous GCTs. The tumor often presents as a solitary, 0.5- to 3-cm, asymptomatic, firm nodule4,5; however, GCTs also can appear verrucous, eroded, or with other variable morphologies, which can create diagnostic challenges.5,6 Accordingly, a 1980 study of 110 patients with GCTs found that the preoperative clinical diagnosis was incorrect in all but 3 cases,7 emphasizing the need for histologic evaluation. Benign GCTs tend to exhibit sheets of polygonal tumor cells with eosinophilic granular cytoplasm and small central nuclei.3,5 The cytoplasmic granules are periodic acid-Schiff positive and diastase resistant.6 Many cases feature pseudoepitheliomatous hyperplasia, which can misleadingly resemble squamous cell carcinoma.3,5,6 Of note, invasive growth patterns on histology can occur with benign GCTs, as in our patient's case, and do not impact prognosis.3,4 On immunohistochemistry, benign, atypical, and malignant GCTs often stain positive for S-100 protein, vimentin, neuron-specific enolase, SOX10, and CD68.1,3
Although our patient's GCTs were benign, an estimated 1% to 2% are malignant.1,4 In 1998, Fanburg-Smith et al1 defined 6 histologic criteria that characterize malignant GCTs: necrosis, tumor cell spindling, vesicular nuclei with large nucleoli, high nuclear to cytoplasmic ratio, increased mitosis, and pleomorphism. Neoplasms with 3 or more of these features are classified as malignant, those with 1 or 2 are considered atypical, and those with only pleomorphism or no other criteria met are diagnosed as benign.1
Multiple GCTs have been reported in 10% to 25% of cases and, as highlighted in our case, can occur in both a metachronous and synchronous manner.2-4,6 Our patient developed a solitary GCT on the inferior lip 3 years prior to the appearance of 2 additional GCTs within 6 months of each other. The presence of multiple GCTs has been associated with genetic syndromes, such as neurofibromatosis type 1 and Noonan syndrome with multiple lentigines3,8; however, as our case demonstrates, multiple GCTs can occur in nonsyndromic patients as well. When multiple GCTs develop at distant sites, they can resemble metastasis.3 To differentiate these clinical scenarios, Machado et al3 proposed utilizing histology and anatomic location. Multiple tumors with benign characteristics on histology likely represent multiple GCTs, whereas tumors arising at sites common to GCT metastasis, such as lymph node, bone, or viscera, are more concerning for metastatic disease. It has been suggested that patients with multiple GCTs should be monitored with physical examination and repeat magnetic resonance imaging or computed tomography every 6 to 12 months.2 Given our patient's presentation with new tumors arising within 6 months of one another, we recommended a 6-month follow-up interval rather than 1 year. Due to the rarity of GCTs, clinical trials to define treatment guidelines and recommendations have not been performed.3 However, the most commonly utilized treatment modality is wide local excision, as performed in our patient.2,4
Melanoma, atypical fibroxanthoma (AFX), xanthoma, and leiomyosarcoma may be difficult to distinguish from GCT.1,3,4 Melanoma incidence has increased dramatically over the last several decades, with rates in the United States rising from 6.8 cases per 100,000 individuals in the 1970s to 20.1 in the early 2000s. Risk factors for its development include UV radiation exposure and particularly severe sunburns during childhood, along with a number of host risk factors such as total number of melanocytic nevi, family history, and fair complexion.9 Histologically, it often demonstrates irregularly distributed, poorly defined melanocytes with pagetoid spread and dyscohesive nests (Figure 1).10 Melanoma metastasis occasionally can present as a soft-tissue mass and often stains positive for S-100 and vimentin, thus resembling GCT1,4; however, unlike melanoma, GCTs lack melanosomes and stain negative for more specific melanocyte markers, such as melanoma antigen recognized by T cells 1 (MART-1).1,3,4
Atypical fibroxanthoma is a cutaneous neoplasm with fibrohistiocytic mesenchymal origin.11 These tumors typically arise on the head and neck in elderly individuals, particularly men with sun-damaged skin. They often present as superficial, rapidly growing nodules with the potential to ulcerate and bleed.11,12 Histologic features include pleomorphic spindle and epithelioid cells, whose nuclei appear hyperchromatic with atypical mitoses (Figure 2).12 Granular cell changes occur infrequently with AFXs, but in such cases immunohistochemistry can readily distinguish AFX from GCT. Although both tend to stain positive for CD68 and vimentin, AFXs lack S-100 protein and SOX10 expression that frequently is observed in GCTs.3,12
Xanthomas are localized lipid deposits in the connective tissue of the skin that often arise in association with dyslipidemia.13 They typically present as soft to semisolid yellow papules, plaques, or nodules. Their clinical appearance can resemble GCTs; however, histologic analysis enables differentiation with ease, as xanthomas demonstrate characteristic foam cells, consisting of lipid-laden macrophages (Figure 3).13
Cutaneous leiomyosarcoma is a rare dermal neoplasm, accounting for 2% to 3% of all sarcomas.14 They typically occur in White males during the fifth to seventh decades of life and often present as asymptomatic lesions on the lower extremities. They frequently arise from pilar smooth muscle. Unlike uterine and soft-tissue leiomyosarcoma, cutaneous leiomyosarcoma tends to follow an indolent course and rarely metastasizes.14 Histologically, these tumors display intersecting, well-defined, spindle-cell fascicles with abundant eosinophilic cytoplasm and cigar-shaped, blunt-ended nuclei (Figure 4).15 Occasionally, leiomyosarcomas can demonstrate cytoplasmic granularity due to lysosome accumulation4; nevertheless, the diagnosis usually can be elucidated by examining more typical histologic areas and utilizing immunohistochemistry, which often stains positive for α-smooth muscle actin, desmin, and h-caldesmon.4,15
- Fanburg-Smith JC, Meis-Kindblom JM, Fante R, et al. Malignant granular cell tumor of soft tissue: diagnostic criteria and clinicopathologic correlation. Am J Surg Pathol. 1998;22:779-794.
- Moten AS, Movva S, von Mehren M, et al. Granular cell tumor experience at a comprehensive cancer center. J Surg Res. 2018;226:1-7.
- Machado I, Cruz J, Lavernia J, et al. Solitary, multiple, benign, atypical, or malignant: the "granular cell tumor" puzzle. Virchows Arch. 2016;468:527-538.
- Ordóñez NG. Granular cell tumor: a review and update. Adv Anat Pathol. 1999;6:186-203.
- Vaughan V, Ferringer T. Granular cell tumor. Cutis. 2014;94:275, 279-280.
- Van L, Parker SR. Multiple morphologically distinct cutaneous granular cell tumors occurring in a single patient. Cutis. 2016;97:E26-E29.
- Lack EE, Worsham GF, Callihan MD, et al. Granular cell tumor: a clinicopathologic study of 110 patients. J Surg Oncol. 1980;13:301-316.
- Bamps S, Oyen T, Legius E, et al. Multiple granular cell tumors in a child with Noonan syndrome. Eur J Pediatr Surg. 2013;23:257-259.
- Rastrelli M, Tropea S, Rossi CR, et al. Melanoma: epidemiology, risk factors, pathogenesis, diagnosis and classification. In Vivo. 2014;28:1005-1011.
- Smoller BR. Histologic criteria for diagnosing primary cutaneousmalignant melanoma. Mod Pathol. 2006;19(suppl 2):S34-S40.
- Soleymani T, Aasi SZ, Novoa R, et al. Atypical fibroxanthoma and pleomorphic dermal sarcoma: updates on classification and management. Dermatol Clin. 2019;37:253-259.
- Cardis MA, Ni J, Bhawan J. Granular cell differentiation: a review of the published work. J Dermatol. 2017;44:251-258.
- Zak A, Zeman M, Slaby A, et al. Xanthomas: clinical and pathophysiological relations [published online April 29, 2014]. Biomed Pap Med Fac Univ Palacky Olomouc Czech Repub. 2014;158:181-188.
- Sandhu N, Sauvageau AP, Groman A, et al. Cutaneous leiomyosarcoma: a SEER database analysis. Dermatol Surg. 2020;46:159-164.
- George S, Serrano C, Hensley ML, et al. Soft tissue and uterine leiomyosarcoma. J Clin Oncol. 2018;36:144-150.

A 26-year-old woman with a history of dysplastic nevi with severe atypia presented with a growth on the lower lip of 3 years’ duration. She denied any inciting event, such as prior trauma to the area, and reported that the lesion had been asymptomatic without a notable change in size. Physical examination revealed a translucent, soft, compressible cystic papule on the left inferior vermilion lip. Wide local excision following incisional biopsy was performed. Six months later, the patient returned to our clinic with a lesion on the right lateral tongue of 6 weeks’ duration as well as a 1-cm subcutaneous cyst in the left axilla of 6 months’ duration. Excisional biopsies of both lesions were performed for histopathologic analysis. Pathology results were similar among the lip, tongue, and axillary lesions. Immunohistochemistry revealed strong positive staining with antibodies to S-100 protein, SOX10, and CD68.
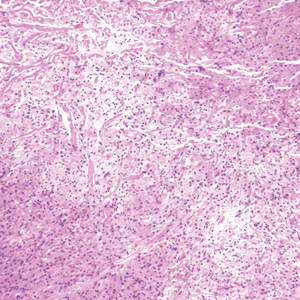
Genetic testing and the future of cerebral palsy malpractice cases
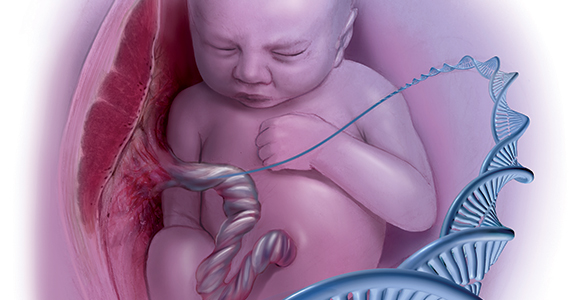
CASE Mixed CP diagnosed at age 6 months
After learning that the statute of limitations was to run out in the near future, the parents of a 17-year-old with cerebral palsy (CP) initiated a lawsuit. At the time of her pregnancy, the mother (G2P2002) was age 39 and first sought prenatal care at 14 weeks.
Her past medical history was largely noncontributory to her current pregnancy, except for that she had hypothyroidism that was being treated with levothyroxine. She also had a history of asthma, but had had no acute episodes for years. During the course of the pregnancy there was evidence of polyhydramnios; her initial thyroid studies were abnormal (thyroid-stimulating hormone levels, 7.1 mIU/L), in part due to lack of adherence with prescribed medications. She was noted to have elevated blood pressure (BP) 150/100 mm Hg but no proteinuria, with BP monitoring during her last trimester.
The patient went into labor at 40 3/7 weeks, after spontaneous rupture of membranes. In labor and delivery she was placed on a monitor, and irregular contractions were noted. The initial vaginal examination was noted as 1-cm cervical dilation, 90% effaced, and station zero. The obstetrician evaluated the patient and ordered Pitocin augmentation. The next vaginal exam several hours later noted 3-cm dilation and 100% effacement. The Pitocin was continued. Several early decelerations, moderate variability, and better contraction pattern was noted. Eight hours into the Pitocin, there were repetitive late decelerations; the obstetrician was not notified. The nursing staff proceeded with vaginal examination, and the patient was fully dilated at station +1. Again, the doctor was not informed of the patient’s status. At 10 hours post-Pitocin initiation, the patient felt the urge to push. The obstetrician was notified, and he promptly arrived to the unit and patient’s bedside. His decision was to use forceps for the delivery, feeling this would be the most expedient way to proceed, although cesarean delivery (CD) was a definite consideration. Forceps were applied, and as the nursing staff noted,” the doctor really had to pull to deliver the head.” A male baby, 8 lb 8 oz, was delivered. A second-degree tear was noted and easily repaired following delivery of the placenta. Apgar scores were 5 and 7 at 1 and 5 minutes after birth, respectively.
The patient’s postpartum course was uneventful. The patient and baby were discharged on the third day postpartum.
As the child was evaluated by the pediatrician, the mother noted at 6 months that the child’s head lagged behind when he was picked up. He appeared stiff at times and floppy at other times according to the parents. As the child progressed he had problems with hand-to-mouth coordination, and when he would crawl he seemed to “scoot his butt,” as they stated.
The child was tested and a diagnosis of mixed cerebral palsy was made, implying a combination of spastic CP and dyskinetic CP. He is wheelchair bound. The parents filed a lawsuit against the obstetrician and the hospital, focused on hypoxic-ischemic encephalopathy (HIE) due to labor and delivery management being below the standard of care. They claimed that the obstetrician should have been informed by the hospital staff during the course of labor, and the obstetrician should have been more proactive in monitoring the deteriorating circumstances. This included performing a CD based on “the Category III fetal heart tracing.”
At trial, the plaintiff expert argued that failure of nursing staff to properly communicate with the obstetrician led to mismanagement. Furthermore, the obstetrician used poor judgement (ie, below the standard of care) in not performing a CD. The defense expert argued that, overall, the fetal heart tracing was Category II, and the events occurred in utero, in part reflected by the mother having polyhydramnios and hypothyroidism that was not well controlled due to lack of adherence with prescribed medications. The child in his wheelchair was brought into the courtroom. The trial went on for more than 1 week, and the jury deliberated for several hours. (Note: This case is a composite of several different events and claims.) strong="">
Continue to: WHAT’S THE VERDICT?
WHAT’S THE VERDICT?
The jury returns a verdict for the defense.
Should anything have been done differently in this trial?
Medical considerations
Cerebral palsy is a neurodevelopmental disorder affecting 1 in 500 children.1 Other prevalence data (from a European study) indicate an incidence of 1.3–1.9 cases per 1,000 livebirths.1 The controversy continues with respect to the disorder’s etiology, especially when the infant’s magnetic resonance imaging (MRI) does not identify specific pathology. The finger is then pointed at HIE and thus the fault of the obstetrician and labor and delivery staff. In reality, HIE accounts for less than 10% of all cases of CP.2 Overall, CP is a condition focused on progressive motor impairments, many times associated with specific MRI findings.3 In addition, “MRI-negative” CP is a more vague diagnosis as discussed among neurologists.
The International Consensus Definition of CP is “a group of permanent disorders of the development of movement and posture, causing activity limitations, that are attributed to nonprogressive disturbances that occurred in the developing fetal or infant brain.”4 The International Cerebral Palsy Genomics Consortium have provided a consensus statement that defines CP based upon clinical type as opposed to etiology.5 Many times, however, ascribing an HIE cause to CP is “barking up the wrong tree,” in that we now know there are clear cut genetic causes of CP, and etiology attributed to perinatal causes, in reality, are genetic in up to 80% of cases.3 Types of CP are addressed in FIGURE 1. Overall, the pathophysiology of the disorder remains unknown. Some affected children have intellectual disabilities, as well as visual, hearing, and/or speech impairment.
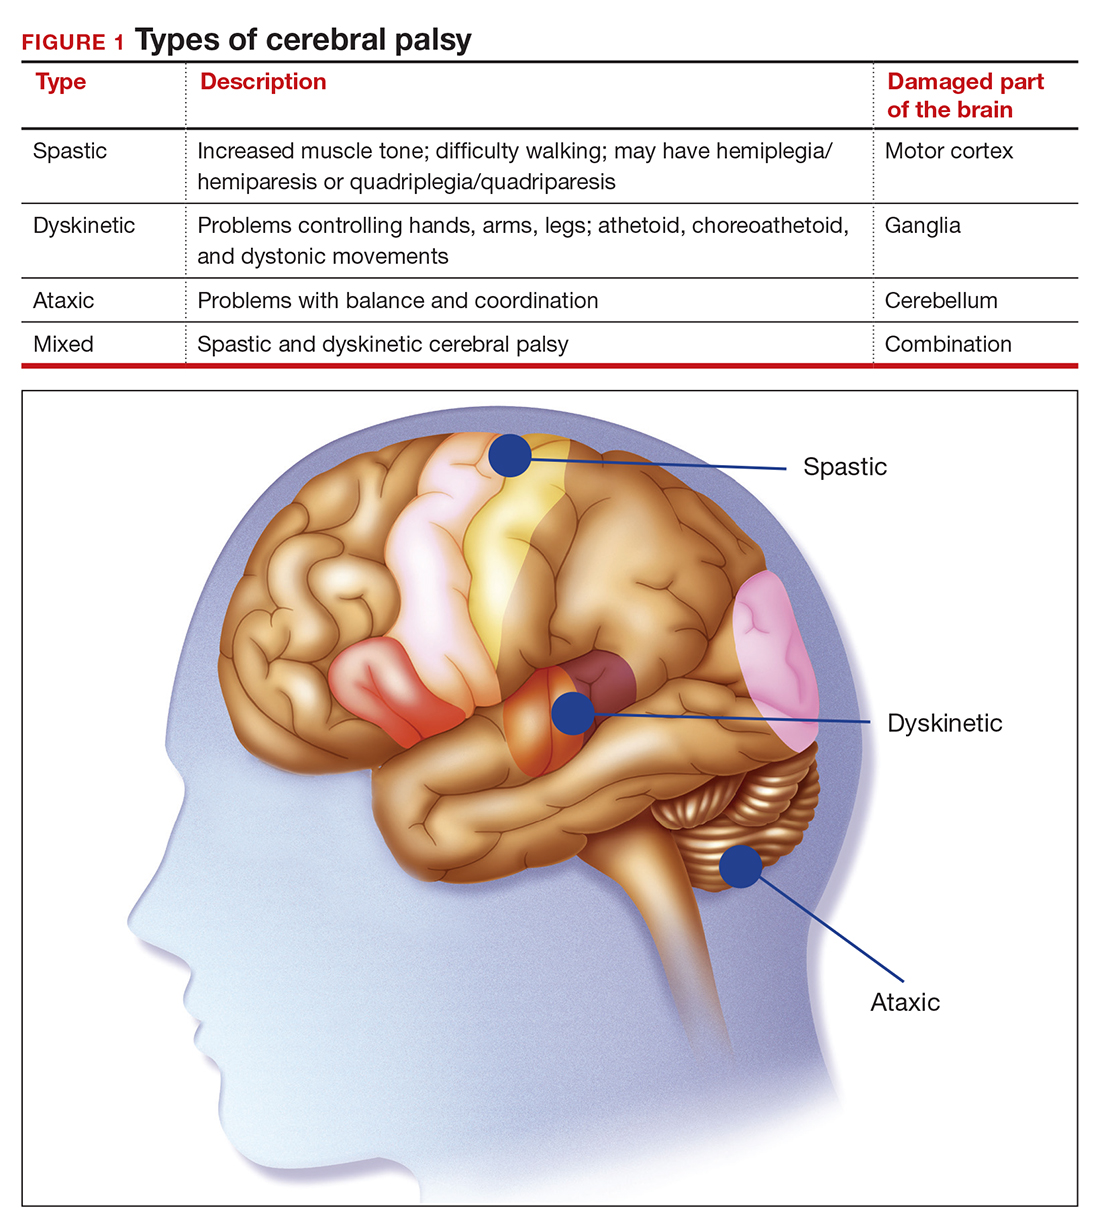
A number of risk factors have been associated with CP (TABLE 1),3,6 which contribute to cell death in the brain or altered maturation of neurons and glia, resulting in abnormal white matter tracts and smaller central nervous system (CNS) volume or cerebellar hypoxia.6 One very important aspect of assessment for CP is specific gene mutations, which may vary in part dependent upon the presence or absence of environmental factors (insults).1 Mutations can lead to profound adverse effects with resultant CNS ischemia and neuromotor disability. In fact, genetics play a major role in determining the etiology of CP.1 Of interest, animal models who are subject to HIE induction have CNS effects resulting in permanent motor impairment.7
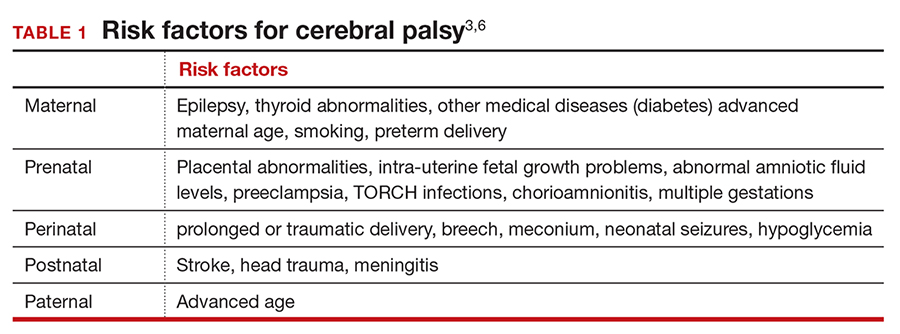
DNA sequencing
The DNA story continues to unfold with the concept that DNA variants alter susceptibility to environmental influences. These insults are, for example, thrombosis or hemorrhage, all of which affect motor function.1 Duplications or deletions of portions of a chromosome, related to copy number variants (CNVs) as well as advances in human-genome sequencing, can identify a single gene mutation leading to CP.1 Microdeletions, microduplications, and single nucleotide variants (SNVs) are to be included in genetic-related problems causing CP.3
A number of candidate genes have been considered and include “de novo heterozygous mutations in known Online Mendelian Inheritance (OMIM).” TIBA1A and SCN8A genes are highly associated with CP.8 Genetic assessment, as it evolves and more recently with the advent of exome sequencing, appears to provide a new and unprecedented level of understanding of CP. Specifically, exome sequencing provides a diagnostic tool with which to identify the prevalence of pathogenic and pathogenic variants (the latter encompassing genomic variants) with CP.9 A retrospective study assessed a cohort of patients with CP and noted that 32.7% of the pediatric-aged patients who underwent exome sequencing had pathogenic and pathogenic variants in the sequencing.9 Thus, we have a tool to identify underlying genetic pathogenesis with CP. This theoretically can change the outcome of lawsuits initiated for CP that ascribe an HIE etiology. Clinicians need to stay tuned as the genetic repertoire continues to unfold.
Continue to: Legal considerations...
Legal considerations
Although CP is not a common event, it has been a major factor in the total malpractice payments for ObGyns, neonatologists, and related medical disciplines. That is because the per-event liability can be staggering. Some law firms provide a “checklist” for plaintiffs early on in assessing a potential case (FIGURE 2).10
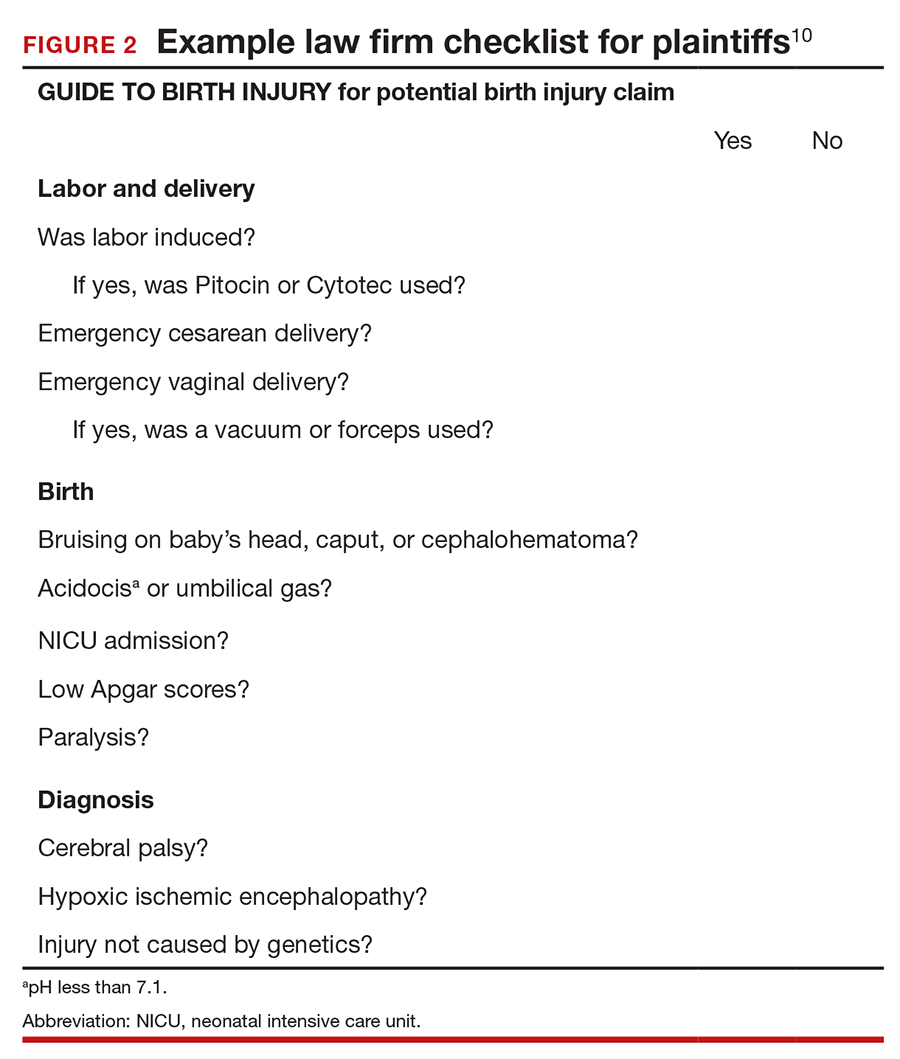
The financial risks and incentives
To understand what the current settlements and verdicts are in birth-related CP cases, a search of Lexis files revealed the reported outcomes of cases in 2019 and 2020 (FIGURE 3). Taking into account that the pandemic limited legal activity, 23 unduplicated cases were described with a reported settlement or verdict. Four cases resulted in verdicts for the injured patients, with the mean of these awards substantially higher than the settlements ($88.3 million vs $11.1 million, respectively).
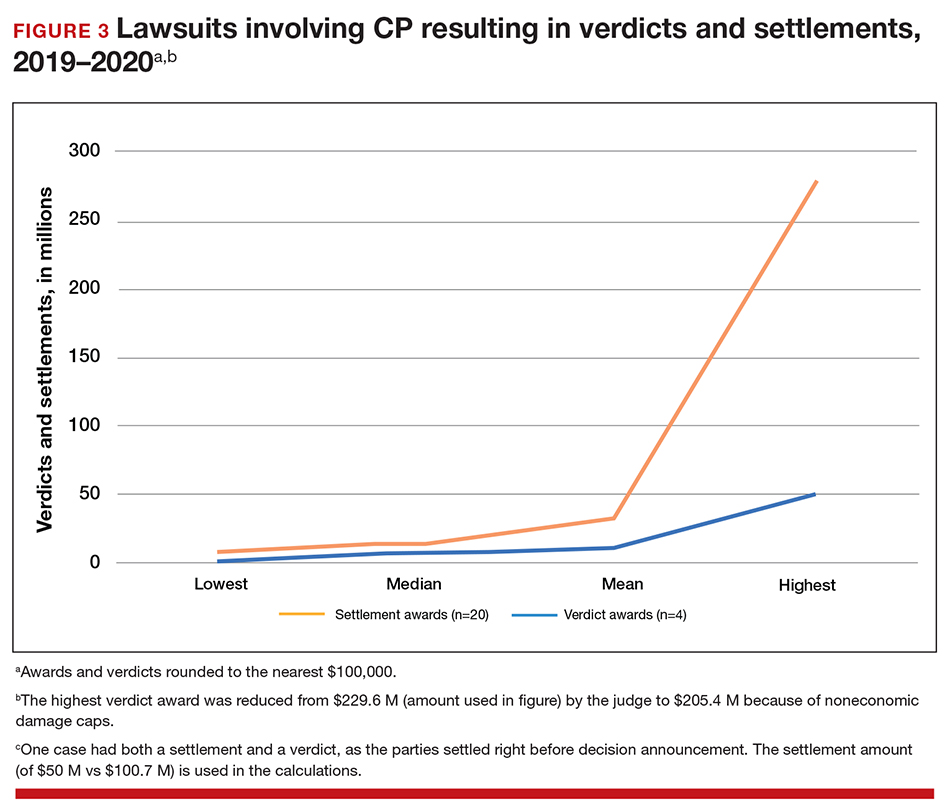
These numbers are a glimpse at some of the very high settlements and verdicts that are common in CP cases. Notably, these are not a random sample of CP cases, but only those with the amount of the verdict or settlement reported. Potentially tried cases that may have been simply abandoned or dismissed are not reported. Furthermore, most settlements include confidentiality clauses, which may preclude the release of the financial value of the settlement. Cases in which the defense won (for example, a jury verdict in favor of the physician) are not included.
The high monetary awards in some CP cases are indirectly backed by Google search results for “cerebral palsy and liability” or “cerebral palsy and malpractice.” A very large number of results for law firms seeking clients with CP injuries is produced. Some of the websites note that only 10% (or 20% on some sites) of CP cases are caused by medical negligence, offering a “free legal case review” and a phone number for callers to “ask a legal question.” In the fine print one site notes that, “if you request any information you may receive a phone call or email from a partner law firm.”11 US physicians may be interested to note that a recent study of CP-based malpractice cases in China found that, although nearly 90% of the claims resulted in compensation, the mean damage award was $73,500.12 This was compared with a mean actual loss to the family of $128,200.
The interest by law firms in CP cases may be generated in part by the opportunity to assist a settlement or judgement that may be in the tens of millions of dollars. It is financially sensible to take a substantial risk on a contingency fee in a CP case compared with many other malpractice areas or claims where the likely damages are much lower. In addition, the vast majority of the damages in CP cases are for economic damages (cost of care and treatment and lost earning capacity), not noneconomic damages (pain and suffering). Therefore, the cap on noneconomic damages available in many states would not reduce the damages by a significant percentage.
CP cases are a significant part of the malpractice costs for ObGyns. Nearly one-third of obstetric claims are for neurologic injuries, including CP.13,14 These cases are often very complex and difficult, meaning that, in addition to the payments to the injured, there are considerable litigation costs associated with defending the cases. Perhaps as much as 60% of malpractice costs in obstetrics are in some way related to CP claims.15,16
Continue to: Negligence...
Negligence
Malpractice cases require not only damages (which clearly there are with CP) but also negligence and causation. (A more complete discussion of the elements of professional liability are included in a recent “What’s the Verdict?” column within
Several areas of negligence are common in CP related to delivery, including failure to monitor properly or ignoring, or not responding to, fetal heart rate (FHR) monitoring.18,19 For FHR monitoring, the claim is that problems can lead to asphyxia, resulting in HIE. Electronic fetal monitoring (EFM) has been an especially contentious matter. On one hand, the evidence of its efficacy is doubtful, but it has remained a standard practice, and it is often a centerpiece of delivery.20 Attorney Thomas Sartwelle has been prolific in suggesting that it not only has created legal problems for physicians but also results in unnecessary cesarean deliveries (CDs), which carry attendant risks for mother and infant.21 (It should be noted that other attorneys have expressed quite different views.22) He has argued that experts relying on EFM should be excluded from testifying because the technology is not based on sufficient science to meet the standard criteria used to determine the admissibility of expert witness (the Daubert standard).23 This argument is a difficult one so long as EFM is standard practice. Other claims of negligence include improper use of instruments at delivery, resulting in physical damage to the baby’s head, neck, or shoulders or internal hemorrhage. In addition, failure to deal with neonatal infection may be the basis for negligence.24
Causation
The question of whether or not the negligence (no matter how bad it was) caused the CP still needs to be addressed. Because a number of factors may cause CP, it has often been difficult to determine for any individual what the cause, or contributing causes, were. This fact would ordinarily work to the advantage of defendant-physicians and hospitals because the plaintiff in a malpractice case must prove by a preponderance of the evidence that the defendant’s negligence caused the CP. “Caused” is a term of art in the law; at the most basic level it means that the harm would not have occurred (or would have been less severe) but for the negligence.
In most CP cases the real cause is unknowable. It is, therefore, important to understand the difference between the certainty required in negligence cases and the certainty required in scientific studies (eg, 95% confidence). Negligence and causation in civil cases (including malpractice) must only be demonstrated by a preponderance of the evidence, which means “more likely than not.” For recovery in malpractice cases, states may require only that negligence be a “substantial factor.”
The theory that this lack of knowledge means that the plaintiff cannot prove causation, however, does not always hold.25 The following is what a jury might see: a child who will have a lifetime of medical, social, and financial burdens. Clear negligent practice by the physician coupled with severe injury can create considerable sympathy for the family. Then there are experts on both sides claiming that it is reasonably certain, in their opinions, that the injury was/was not caused by the negligence of the physician and health care team. The plaintiff’s witnesses will start eliminating other causes of CP in a form of differential diagnosis, stating that the remaining possibilities of causation clearly point to malpractice as the cause of CP. At some point, the elimination of alternative explanations for CP makes malpractice more likely than not to be a substantial factor in causing CP. On the other hand, the defense witnesses will stress that CP occurs most often without any negligence, and that, in this case, there are remaining, perhaps unknown, possible causes that are more likely than malpractice.
In this trial mix, it is not unthinkable that a jury or judge might find the plaintiff’s opinions more appealing. As a practical matter, and contrary to the technical rules, the burden of proof can seem to shift. The defendant clinician may, in effect, have to prove that the CP was caused by something other than the clinician’s negligence.
The role of insurance in award amounts
One reason that malpractice insurance companies settle CP cases for millions of dollars is that they face the possibility of judgements in the tens of millions. We saw even more than $100 million, in the 2019-2020 CP cases reported above. Another risk for malpractice insurance companies is that, if they do not settle, they may have liability beyond the policy limits. (Policy limits are the maximum an insurance policy is obligated to pay for any occurrence, or the total for all claims for the time covered by the premium.) For example, assume a malpractice policy has a $5 million policy limit covering Dr. Defendant, who has been sued for CP resulting from malpractice. There was apparently negligence during delivery in monitoring the fetus, but on the issue of causation the best estimate is that there is a 75% probability a jury would find no causal link between the negligence and the CP. If there is liability, damages would likely range from $5 to $25 million. Assume that the plaintiff has signaled it would settle for the policy limits ($5 million). Based purely on the odds and the policy limits, the insurance company should go to trial as opposed to settling for $5 million. That is because the physician personally (as opposed to the insurance company) is responsible for that part of a verdict that exceeds $5 million.
To prevent just such abuse (or bad faith), in most states, if the insurance company declines to settle the case for $5 million, it may become liable for the excess verdict above the policy limits. One reason that the cases that result in a verdict on damages—the 4 cases reported above for 2019‒2020—are interesting is that they help establish the risk of failing to settle a CP case.
Genetic understanding of causation
Given the importance of defendant-clinicians to be able to find a cause other than negligence to explain CP, the recent research of Moreno-De-Luca and colleagues may be especially meaningful.9 Using exome sequencing, the researchers found that 32.7% of pediatric-aged CP patients had pathogenic variance in the sequencing. In theory, this might mean that for about one-third of the CP plaintiffs, there may be genomic (rather than malpractice) explanations for CP, which might ultimately result in fewer cases of CP.
As significant as these findings are, caution is warranted. As the authors note, “this was an observational study and a causal relationship between detected gene variants and phenotypes in participants was not definitively established.”9 Until the causal relationship is established, it is not clear how much influence such a study would have in CP malpractice cases. Another caveat is that, at most, the genetic variants accounted for less than a third of CP cases studied, leaving many cases in which the cause remains unknown. In those cases in which a genomic association was not found, the case may be stronger for the “malpractice was the cause” claim. The follow-up research will likely shed light on some of these issues. Of course, if the genetic research demonstrates that in some proportion of cases there are genetic factors that contribute to the probability of CP, then the search will be for other triggering elements, which could possibly include poor care (that might well be a substantial factor for malpractice). Therefore, the preliminary genetic research likely represents only a part of the CP puzzle in malpractice cases.
Continue to: Why the opening case outcome was for the defense...
Why the opening case outcome was for the defense
Juries, of course, do not write opinions, so the basis for the jury’s decision in the example case is somewhat speculative. It seems most likely that causation had not been established. That is, the plaintiff-patient did not demonstrate that any malpractice was the likely, or substantial contributing, cause of the CP. The case illustrates several important issues.
Statute of limitations. This issue is common in CP cases because the condition may not be diagnosed for some time after birth. The statute of limitations can vary by state for medical malpractice cases “from 2 years to 22 years.”26 Many states begin with a 2-year statute but extend it if the injury or harm is not discovered. The extension is sometimes referred to as a statute of repose because, after that time, there is no extension even if the harm is discovered only later. In some states the statute does not run until the plaintiff is at or near the time of majority (usually age 18).27
Establishing negligence. The information provided about the presented case is mixed on the question of negligence, both regarding the hospital (through its nursing staff) for not properly contacting the obstetrician over the 10 hours, or the physician for inadequate monitoring. In addition, the reference to “really had to pull to deliver the head” may be the basis for claiming excessive, and potentially harmful use of force, which may have caused injury. In addition, the question remains whether the combination of these factors, including the Category III fetal heart tracing, made a cesarean delivery the appropriate standard of care.
Addressing causation. Assuming negligence, there is still a question of causation. It is far from clear that what the clinician did, or did not do, in terms of monitoring caused the CP injury. There is, however, no alternative causation that appeared in the case record, and this may be because of dueling expert witnesses.
The plaintiff sued both the obstetrician and the hospital, which is common among CP cases. While the legal interest of the two parties are aligned in some areas (causation), they may be in conflict in others (the failure of the hospital staff to keep the obstetrician informed). These potential conflicts are not for the clinicians to try to work out on their own. There is the potential for their actions to be misunderstood. When such a case is filed or threatened, the obstetrician should immediately discuss these matters with their attorney. In malpractice cases, malpractice insurance companies often select the attorneys who are experienced in such conflicts. If clinicians are not entirely comfortable that the appointed attorney is representing their interest and preserving a relationship with the hospital or other institution, however, they may engage their own legal counsel to protect their interests.
Practical considerations for avoiding malpractice claims
Good practices for avoiding malpractice claims apply with special force as it relates to CP.28,29
Uphold practice standards and good patient records. The causation element of these legal cases will remain problematic in the foreseeable future. But causation does not matter if negligent practice is not demonstrated. Therefore, maintaining best practices and continuous efforts at quality assurance and following all relevant professional practice guidelines is a good start. More than good intentions, it is essential that policies are implemented and reviewed. Among the areas of ongoing concern is the failure to monitor patients sufficiently. The long period of labor—where perhaps no physician is present for many hours—can introduce problems, as laypersons may have the impression that medical personnel were not on top of the situation.
Maintaining excellent records is also key for clinicians. The more complete the record, the fewer opportunities there are for faulty memories of parties and caregivers to fill in the gaps (especially when causation is so difficult to establish). Under absolutely no circumstances should records be changed or modified to eliminate damaging or an otherwise unfortunate notation. Few things are as harmful to credibility as discovered record tampering.
Inform patients of what is to come. Expectations are an important part of patient satisfaction. While not unduly frightening pregnant patients or eliminating reassurance, the informed consent process and patient counseling should be opportunities to avoid unreasonable expectations.
Stay alert to early genetic counseling, which is becoming increasingly available and important. Maintaining currency with what early testing can be done will become a critical part of ObGyn practice. For CP cases, in the near future, genetic testing may become part of determining causation. In the longer term, it will be part of counseling women and couples in deciding whether to have children, or potentially to end a pregnancy.
Expect the unexpected, and plan for it. Sometimes things just go wrong—there is a bad outcome, mistakes are made, patients are upset. It is important that any practice or institution have a clear plan for when such things happen. Some organizations have used apologies when appropriate,30 others have more complex plans for dealing with bad outcomes.31 Implement developed plans when they are needed. Individual practitioners also should consult with their attorney, who is familiar with their practice and who can help them maintain adherence to legal requirements and good legal problem prevention. ●
During a trial, all parties generally present evidence on negligence, causation, and damages. They do so without knowing whether a jury will find negligence and causation. The question of what the damages should be in cerebral palsy (CP) cases is also quite complex and expensive, but neither the defense nor the plaintiff can afford to ignore it. Past economic damages are relatively easy to calculate. Damages, for instance, includes medical care (pharmaceuticals and supplies, tests and procedures) and personal care (physical, occupational, and psychological therapy; long-term care; special educational costs; assistive equipment; and home modifications) that would have been avoided if it were not for CP. Future and personal care costs are more speculative, and must be estimated with the help of experts. In addition to future costs for the medical and personal care suggested above, depending on the state, the cost of lost future earnings (or earning capacity) may be additional economic damages. The cost of such intensive care, over a lifetime, accounts for many of the large verdicts and settlements.
Noneconomic damages are also available for such things as pain and suffering and diminished quality of life, both past and future. A number of states cap these noneconomic damages.
The wide range of damages correctly suggests that experts from several disciplines must be engaged to cover the damages landscape. This fact accounts for some of the costs of litigating these cases, and also for why damage calculations can be so complex.
- Fahey M, Macleenan A, Kretzschmar D, et al. The genetic basis of cerebral palsy. Dev Med Child Neurol. 2017;59:462-469. doi: 10.1111/dmcn.13363.
- Ellenberg J, Nelson, K. The association of cerebral palsy with birth asphyxia: a definitional quagmire. Dev Med Child Neurol. 2013;55:210-216. doi: 10.1111/dmcn.12016.
- Emrick L, DiCarlo S. The expanding role of genetics in cerebral palsy. Phys Med Rehabil Clin N Am. 2020;31:15-24. doi: 10.1016/j.pmr.2019.09.006.
- Rosenbaum P, Paneth N, Leviton A, et al. A report: the definition and classification of cerebral palsy [published correction appears in Dev Med Child Neurol. 2007;49:480]. Dev Med Child Neuro. 2007;109(suppl):8-14.
- MacLenan A, Lewis S, Moreno-DeLuca A, et al. Genetic or other causation should not change the clinical diagnosis of cerebral palsy. J Child Neurol. 2019;34:472-476. doi: 10.1177/0883073819840449.
- Lewis S, Shetty S, Wilson B, et al. Insights from genetic studies of cerebral palsy. Front Neurol. 2021;11:1-10. doi: 10.3389/fneur.2020.625428.
- Derick M, Drobyshevsky A, Ji X. A model of cerebral palsy from fetal hypoxia-ischemia. Stroke. 2007;38:731-735. doi: 10.1161/01.STR.0000251445.94697.64.
- McMichael G, Bainbridge M, Haan E, et al. Whole exome sequencing points to considerable genetic heterogeneity of cerebral palsy. Mol Psychiatry. 2015;20:176-182. doi: 10.1038/mp.2014.189.
- Moreno-DeLuca A, Milan F, Pesacreta D, et al. Molecular diagnostic yield of exome sequencing in patients with cerebral palsy. JAMA. 2021;325:467-475. doi: 10.1001/jama.2020.26148.
- Helping disabled children across Maryland & throughout the U.S. The Law Firm of Michael H. Bereston, Inc. website. https://www.berestonlaw.com/birth-injury/. Accessed April 26, 2021.
- Cerebral palsy lawsuits explained. Cerebral Palsy Guide website. https://www.cerebralpalsyguide.com/legal/. Accessed March 22, 2021.
- Zhou L, Li H, Li C, et al. Risk management and provider liabilities in infantile cerebral palsy based on malpractice litigation cases. J Forensic Leg Med. 2019;61:82-88. doi: 10.1016/j.jflm.2018.11.010.
- Cavanaugh MA. Bad cures for bad babies: policy challenges to the statutory removal of the common law claim for birth-related neurological injuries. Case West Res L Rev. 1992;43:1299-1346.
- Kain ZN, Caldwell-Andrews AA. What pediatricians should know about child-related malpractice payments in the United States. Pediatrics. 2006;118:464-468. doi: 10.1542/peds.2005-3112.
- Tabarrok A, Agan A. Medical malpractice awards, insurance, and negligence: which are related? Manhattan Institute Policy Research. Civil Justice Report; 2006. https://media4.manhattan-institute.org/pdf/cjr_10.pdf. Accessed April 27, 2021.
- Freeman AD, Freeman JM. No-fault cerebral palsy insurance: an alternative to the obstetrical malpractice lottery. J Health Politics Policy Law. 1989;14:707-718. doi: 10.1215/03616878-14-4-707.
- Sanfilippo JS, Smith SR. Is there liability if you don’t test for BRCA? OBG Manag. 2021;33:39-46. doi: 10.12788/obgm.0077.
- Fanaroff JM, Goldsmith JP. The most common patient safety issues resulting in legal action against neonatologists. Semin Perinatol. 2019;43:151181-1-9. doi: 10.1053/j.semperi.2019.08.010.
- Sartwelle TP, Johnston, JC. Cerebral palsy litigation: change course or abandon ship. J Child Neurol. 2015;30:828-841. doi: 10.1177/0883073814543306.
- Roth LM. The Business of Birth. NYU Press: New York, NY; 2021.
- Sartwelle TP. Electronic fetal monitoring: a bridge too far. J Legal Med. 2012;33:313-379. doi: 10.1080/01947648.2012.714321.
- Reiter JM, Walsh RS, Thomas EG. Best practices in birth injury litigation: timing hypoxic-ischemic fetal brain injury. Michigan Bar J. 2018;97:42-44.
- Sartwelle TP. Defending a neurologic birth injury: asphyxia neonatorum redux. J Legal Med. 2009;30:181-247. doi: 10.1080/01947640902936522.
- Daubert v Merrell Dow Pharm, Inc. 509 U.S. 579 (1993).
- Jha S. The factors making Americans litigious. J Am College Radiology. 2019;17:551-553. doi: 10.1016/j.jacr.2019.10.011.
- Salvi S, Pritchard PC. Statute of limitations on cerebral palsy cases. Personal Injury Lawyers website. https://www.salvilaw.com/birth-injury-lawyers/cerebral-palsy/time-limits/. Accessed March 24, 2021.
- Wharton R. Cerebral palsy statute of limitations. Cerebral Palsy Guidance website. October 16, 2020. https://www.cerebralpalsyguidance.com/cerebral-palsy-lawyer/statute-of-limitations/. Accessed March 24, 2021.
- Kassim PJ, Ushiro S, Najid KM. Compensating cerebral palsy cases: problems in court litigation and the no-fault alternative. Med Law. 2015;34:335-355.
- Williams D. Practice patterns to decrease the risk of malpractice suit. Clin Obstet Gynecol. 2008;51:680-687. doi: 10.1097/GRF.0b013e3181899bc7.
- McMichael BJ, Van Horn RL, Viscusi WK. “Sorry” is never enough: how state apology laws fail to reduce medical malpractice liability risk. Stanford Law Rev. 2019;71:341-409.
- Kachalia A, Kaufman SR, Boothman R, et al. Liability claims and costs before and after implementation of a medical error disclosure program. Ann Intern Med. 2010;153:213-221. doi: 10.7326/0003-4819-153-4-201008170-00002.

Dr. Sanfilippo is Professor, Department of Obstetrics, Gynecology, and Reproductive Sciences, University of Pittsburgh, and Director, Reproductive Endocrinology and Infertility, at Magee-Womens Hospital, Pittsburgh, Pennsylvania. He also serves on the OBG Management Board of Editors.

Mr. Smith is Professor Emeritus and Dean Emeritus at California Western School of Law, San Diego, California.
The authors report no financial relationships relevant to this article.
Dr. Sanfilippo is Professor, Department of Obstetrics, Gynecology, and Reproductive Sciences, University of Pittsburgh, and Director, Reproductive Endocrinology and Infertility, at Magee-Womens Hospital, Pittsburgh, Pennsylvania. He also serves on the OBG Management Board of Editors.
Mr. Smith is Professor Emeritus and Dean Emeritus at California Western School of Law, San Diego, California.
The authors report no financial relationships relevant to this article.
CASE Mixed CP diagnosed at age 6 months
After learning that the statute of limitations was to run out in the near future, the parents of a 17-year-old with cerebral palsy (CP) initiated a lawsuit. At the time of her pregnancy, the mother (G2P2002) was age 39 and first sought prenatal care at 14 weeks.
Her past medical history was largely noncontributory to her current pregnancy, except for that she had hypothyroidism that was being treated with levothyroxine. She also had a history of asthma, but had had no acute episodes for years. During the course of the pregnancy there was evidence of polyhydramnios; her initial thyroid studies were abnormal (thyroid-stimulating hormone levels, 7.1 mIU/L), in part due to lack of adherence with prescribed medications. She was noted to have elevated blood pressure (BP) 150/100 mm Hg but no proteinuria, with BP monitoring during her last trimester.
The patient went into labor at 40 3/7 weeks, after spontaneous rupture of membranes. In labor and delivery she was placed on a monitor, and irregular contractions were noted. The initial vaginal examination was noted as 1-cm cervical dilation, 90% effaced, and station zero. The obstetrician evaluated the patient and ordered Pitocin augmentation. The next vaginal exam several hours later noted 3-cm dilation and 100% effacement. The Pitocin was continued. Several early decelerations, moderate variability, and better contraction pattern was noted. Eight hours into the Pitocin, there were repetitive late decelerations; the obstetrician was not notified. The nursing staff proceeded with vaginal examination, and the patient was fully dilated at station +1. Again, the doctor was not informed of the patient’s status. At 10 hours post-Pitocin initiation, the patient felt the urge to push. The obstetrician was notified, and he promptly arrived to the unit and patient’s bedside. His decision was to use forceps for the delivery, feeling this would be the most expedient way to proceed, although cesarean delivery (CD) was a definite consideration. Forceps were applied, and as the nursing staff noted,” the doctor really had to pull to deliver the head.” A male baby, 8 lb 8 oz, was delivered. A second-degree tear was noted and easily repaired following delivery of the placenta. Apgar scores were 5 and 7 at 1 and 5 minutes after birth, respectively.
The patient’s postpartum course was uneventful. The patient and baby were discharged on the third day postpartum.
As the child was evaluated by the pediatrician, the mother noted at 6 months that the child’s head lagged behind when he was picked up. He appeared stiff at times and floppy at other times according to the parents. As the child progressed he had problems with hand-to-mouth coordination, and when he would crawl he seemed to “scoot his butt,” as they stated.
The child was tested and a diagnosis of mixed cerebral palsy was made, implying a combination of spastic CP and dyskinetic CP. He is wheelchair bound. The parents filed a lawsuit against the obstetrician and the hospital, focused on hypoxic-ischemic encephalopathy (HIE) due to labor and delivery management being below the standard of care. They claimed that the obstetrician should have been informed by the hospital staff during the course of labor, and the obstetrician should have been more proactive in monitoring the deteriorating circumstances. This included performing a CD based on “the Category III fetal heart tracing.”
At trial, the plaintiff expert argued that failure of nursing staff to properly communicate with the obstetrician led to mismanagement. Furthermore, the obstetrician used poor judgement (ie, below the standard of care) in not performing a CD. The defense expert argued that, overall, the fetal heart tracing was Category II, and the events occurred in utero, in part reflected by the mother having polyhydramnios and hypothyroidism that was not well controlled due to lack of adherence with prescribed medications. The child in his wheelchair was brought into the courtroom. The trial went on for more than 1 week, and the jury deliberated for several hours. (Note: This case is a composite of several different events and claims.) strong="">
Continue to: WHAT’S THE VERDICT?
WHAT’S THE VERDICT?
The jury returns a verdict for the defense.
Should anything have been done differently in this trial?
Medical considerations
Cerebral palsy is a neurodevelopmental disorder affecting 1 in 500 children.1 Other prevalence data (from a European study) indicate an incidence of 1.3–1.9 cases per 1,000 livebirths.1 The controversy continues with respect to the disorder’s etiology, especially when the infant’s magnetic resonance imaging (MRI) does not identify specific pathology. The finger is then pointed at HIE and thus the fault of the obstetrician and labor and delivery staff. In reality, HIE accounts for less than 10% of all cases of CP.2 Overall, CP is a condition focused on progressive motor impairments, many times associated with specific MRI findings.3 In addition, “MRI-negative” CP is a more vague diagnosis as discussed among neurologists.
The International Consensus Definition of CP is “a group of permanent disorders of the development of movement and posture, causing activity limitations, that are attributed to nonprogressive disturbances that occurred in the developing fetal or infant brain.”4 The International Cerebral Palsy Genomics Consortium have provided a consensus statement that defines CP based upon clinical type as opposed to etiology.5 Many times, however, ascribing an HIE cause to CP is “barking up the wrong tree,” in that we now know there are clear cut genetic causes of CP, and etiology attributed to perinatal causes, in reality, are genetic in up to 80% of cases.3 Types of CP are addressed in FIGURE 1. Overall, the pathophysiology of the disorder remains unknown. Some affected children have intellectual disabilities, as well as visual, hearing, and/or speech impairment.
A number of risk factors have been associated with CP (TABLE 1),3,6 which contribute to cell death in the brain or altered maturation of neurons and glia, resulting in abnormal white matter tracts and smaller central nervous system (CNS) volume or cerebellar hypoxia.6 One very important aspect of assessment for CP is specific gene mutations, which may vary in part dependent upon the presence or absence of environmental factors (insults).1 Mutations can lead to profound adverse effects with resultant CNS ischemia and neuromotor disability. In fact, genetics play a major role in determining the etiology of CP.1 Of interest, animal models who are subject to HIE induction have CNS effects resulting in permanent motor impairment.7
DNA sequencing
The DNA story continues to unfold with the concept that DNA variants alter susceptibility to environmental influences. These insults are, for example, thrombosis or hemorrhage, all of which affect motor function.1 Duplications or deletions of portions of a chromosome, related to copy number variants (CNVs) as well as advances in human-genome sequencing, can identify a single gene mutation leading to CP.1 Microdeletions, microduplications, and single nucleotide variants (SNVs) are to be included in genetic-related problems causing CP.3
A number of candidate genes have been considered and include “de novo heterozygous mutations in known Online Mendelian Inheritance (OMIM).” TIBA1A and SCN8A genes are highly associated with CP.8 Genetic assessment, as it evolves and more recently with the advent of exome sequencing, appears to provide a new and unprecedented level of understanding of CP. Specifically, exome sequencing provides a diagnostic tool with which to identify the prevalence of pathogenic and pathogenic variants (the latter encompassing genomic variants) with CP.9 A retrospective study assessed a cohort of patients with CP and noted that 32.7% of the pediatric-aged patients who underwent exome sequencing had pathogenic and pathogenic variants in the sequencing.9 Thus, we have a tool to identify underlying genetic pathogenesis with CP. This theoretically can change the outcome of lawsuits initiated for CP that ascribe an HIE etiology. Clinicians need to stay tuned as the genetic repertoire continues to unfold.
Continue to: Legal considerations...
Legal considerations
Although CP is not a common event, it has been a major factor in the total malpractice payments for ObGyns, neonatologists, and related medical disciplines. That is because the per-event liability can be staggering. Some law firms provide a “checklist” for plaintiffs early on in assessing a potential case (FIGURE 2).10
The financial risks and incentives
To understand what the current settlements and verdicts are in birth-related CP cases, a search of Lexis files revealed the reported outcomes of cases in 2019 and 2020 (FIGURE 3). Taking into account that the pandemic limited legal activity, 23 unduplicated cases were described with a reported settlement or verdict. Four cases resulted in verdicts for the injured patients, with the mean of these awards substantially higher than the settlements ($88.3 million vs $11.1 million, respectively).
These numbers are a glimpse at some of the very high settlements and verdicts that are common in CP cases. Notably, these are not a random sample of CP cases, but only those with the amount of the verdict or settlement reported. Potentially tried cases that may have been simply abandoned or dismissed are not reported. Furthermore, most settlements include confidentiality clauses, which may preclude the release of the financial value of the settlement. Cases in which the defense won (for example, a jury verdict in favor of the physician) are not included.
The high monetary awards in some CP cases are indirectly backed by Google search results for “cerebral palsy and liability” or “cerebral palsy and malpractice.” A very large number of results for law firms seeking clients with CP injuries is produced. Some of the websites note that only 10% (or 20% on some sites) of CP cases are caused by medical negligence, offering a “free legal case review” and a phone number for callers to “ask a legal question.” In the fine print one site notes that, “if you request any information you may receive a phone call or email from a partner law firm.”11 US physicians may be interested to note that a recent study of CP-based malpractice cases in China found that, although nearly 90% of the claims resulted in compensation, the mean damage award was $73,500.12 This was compared with a mean actual loss to the family of $128,200.
The interest by law firms in CP cases may be generated in part by the opportunity to assist a settlement or judgement that may be in the tens of millions of dollars. It is financially sensible to take a substantial risk on a contingency fee in a CP case compared with many other malpractice areas or claims where the likely damages are much lower. In addition, the vast majority of the damages in CP cases are for economic damages (cost of care and treatment and lost earning capacity), not noneconomic damages (pain and suffering). Therefore, the cap on noneconomic damages available in many states would not reduce the damages by a significant percentage.
CP cases are a significant part of the malpractice costs for ObGyns. Nearly one-third of obstetric claims are for neurologic injuries, including CP.13,14 These cases are often very complex and difficult, meaning that, in addition to the payments to the injured, there are considerable litigation costs associated with defending the cases. Perhaps as much as 60% of malpractice costs in obstetrics are in some way related to CP claims.15,16
Continue to: Negligence...
Negligence
Malpractice cases require not only damages (which clearly there are with CP) but also negligence and causation. (A more complete discussion of the elements of professional liability are included in a recent “What’s the Verdict?” column within
Several areas of negligence are common in CP related to delivery, including failure to monitor properly or ignoring, or not responding to, fetal heart rate (FHR) monitoring.18,19 For FHR monitoring, the claim is that problems can lead to asphyxia, resulting in HIE. Electronic fetal monitoring (EFM) has been an especially contentious matter. On one hand, the evidence of its efficacy is doubtful, but it has remained a standard practice, and it is often a centerpiece of delivery.20 Attorney Thomas Sartwelle has been prolific in suggesting that it not only has created legal problems for physicians but also results in unnecessary cesarean deliveries (CDs), which carry attendant risks for mother and infant.21 (It should be noted that other attorneys have expressed quite different views.22) He has argued that experts relying on EFM should be excluded from testifying because the technology is not based on sufficient science to meet the standard criteria used to determine the admissibility of expert witness (the Daubert standard).23 This argument is a difficult one so long as EFM is standard practice. Other claims of negligence include improper use of instruments at delivery, resulting in physical damage to the baby’s head, neck, or shoulders or internal hemorrhage. In addition, failure to deal with neonatal infection may be the basis for negligence.24
Causation
The question of whether or not the negligence (no matter how bad it was) caused the CP still needs to be addressed. Because a number of factors may cause CP, it has often been difficult to determine for any individual what the cause, or contributing causes, were. This fact would ordinarily work to the advantage of defendant-physicians and hospitals because the plaintiff in a malpractice case must prove by a preponderance of the evidence that the defendant’s negligence caused the CP. “Caused” is a term of art in the law; at the most basic level it means that the harm would not have occurred (or would have been less severe) but for the negligence.
In most CP cases the real cause is unknowable. It is, therefore, important to understand the difference between the certainty required in negligence cases and the certainty required in scientific studies (eg, 95% confidence). Negligence and causation in civil cases (including malpractice) must only be demonstrated by a preponderance of the evidence, which means “more likely than not.” For recovery in malpractice cases, states may require only that negligence be a “substantial factor.”
The theory that this lack of knowledge means that the plaintiff cannot prove causation, however, does not always hold.25 The following is what a jury might see: a child who will have a lifetime of medical, social, and financial burdens. Clear negligent practice by the physician coupled with severe injury can create considerable sympathy for the family. Then there are experts on both sides claiming that it is reasonably certain, in their opinions, that the injury was/was not caused by the negligence of the physician and health care team. The plaintiff’s witnesses will start eliminating other causes of CP in a form of differential diagnosis, stating that the remaining possibilities of causation clearly point to malpractice as the cause of CP. At some point, the elimination of alternative explanations for CP makes malpractice more likely than not to be a substantial factor in causing CP. On the other hand, the defense witnesses will stress that CP occurs most often without any negligence, and that, in this case, there are remaining, perhaps unknown, possible causes that are more likely than malpractice.
In this trial mix, it is not unthinkable that a jury or judge might find the plaintiff’s opinions more appealing. As a practical matter, and contrary to the technical rules, the burden of proof can seem to shift. The defendant clinician may, in effect, have to prove that the CP was caused by something other than the clinician’s negligence.
The role of insurance in award amounts
One reason that malpractice insurance companies settle CP cases for millions of dollars is that they face the possibility of judgements in the tens of millions. We saw even more than $100 million, in the 2019-2020 CP cases reported above. Another risk for malpractice insurance companies is that, if they do not settle, they may have liability beyond the policy limits. (Policy limits are the maximum an insurance policy is obligated to pay for any occurrence, or the total for all claims for the time covered by the premium.) For example, assume a malpractice policy has a $5 million policy limit covering Dr. Defendant, who has been sued for CP resulting from malpractice. There was apparently negligence during delivery in monitoring the fetus, but on the issue of causation the best estimate is that there is a 75% probability a jury would find no causal link between the negligence and the CP. If there is liability, damages would likely range from $5 to $25 million. Assume that the plaintiff has signaled it would settle for the policy limits ($5 million). Based purely on the odds and the policy limits, the insurance company should go to trial as opposed to settling for $5 million. That is because the physician personally (as opposed to the insurance company) is responsible for that part of a verdict that exceeds $5 million.
To prevent just such abuse (or bad faith), in most states, if the insurance company declines to settle the case for $5 million, it may become liable for the excess verdict above the policy limits. One reason that the cases that result in a verdict on damages—the 4 cases reported above for 2019‒2020—are interesting is that they help establish the risk of failing to settle a CP case.
Genetic understanding of causation
Given the importance of defendant-clinicians to be able to find a cause other than negligence to explain CP, the recent research of Moreno-De-Luca and colleagues may be especially meaningful.9 Using exome sequencing, the researchers found that 32.7% of pediatric-aged CP patients had pathogenic variance in the sequencing. In theory, this might mean that for about one-third of the CP plaintiffs, there may be genomic (rather than malpractice) explanations for CP, which might ultimately result in fewer cases of CP.
As significant as these findings are, caution is warranted. As the authors note, “this was an observational study and a causal relationship between detected gene variants and phenotypes in participants was not definitively established.”9 Until the causal relationship is established, it is not clear how much influence such a study would have in CP malpractice cases. Another caveat is that, at most, the genetic variants accounted for less than a third of CP cases studied, leaving many cases in which the cause remains unknown. In those cases in which a genomic association was not found, the case may be stronger for the “malpractice was the cause” claim. The follow-up research will likely shed light on some of these issues. Of course, if the genetic research demonstrates that in some proportion of cases there are genetic factors that contribute to the probability of CP, then the search will be for other triggering elements, which could possibly include poor care (that might well be a substantial factor for malpractice). Therefore, the preliminary genetic research likely represents only a part of the CP puzzle in malpractice cases.
Continue to: Why the opening case outcome was for the defense...
Why the opening case outcome was for the defense
Juries, of course, do not write opinions, so the basis for the jury’s decision in the example case is somewhat speculative. It seems most likely that causation had not been established. That is, the plaintiff-patient did not demonstrate that any malpractice was the likely, or substantial contributing, cause of the CP. The case illustrates several important issues.
Statute of limitations. This issue is common in CP cases because the condition may not be diagnosed for some time after birth. The statute of limitations can vary by state for medical malpractice cases “from 2 years to 22 years.”26 Many states begin with a 2-year statute but extend it if the injury or harm is not discovered. The extension is sometimes referred to as a statute of repose because, after that time, there is no extension even if the harm is discovered only later. In some states the statute does not run until the plaintiff is at or near the time of majority (usually age 18).27
Establishing negligence. The information provided about the presented case is mixed on the question of negligence, both regarding the hospital (through its nursing staff) for not properly contacting the obstetrician over the 10 hours, or the physician for inadequate monitoring. In addition, the reference to “really had to pull to deliver the head” may be the basis for claiming excessive, and potentially harmful use of force, which may have caused injury. In addition, the question remains whether the combination of these factors, including the Category III fetal heart tracing, made a cesarean delivery the appropriate standard of care.
Addressing causation. Assuming negligence, there is still a question of causation. It is far from clear that what the clinician did, or did not do, in terms of monitoring caused the CP injury. There is, however, no alternative causation that appeared in the case record, and this may be because of dueling expert witnesses.
The plaintiff sued both the obstetrician and the hospital, which is common among CP cases. While the legal interest of the two parties are aligned in some areas (causation), they may be in conflict in others (the failure of the hospital staff to keep the obstetrician informed). These potential conflicts are not for the clinicians to try to work out on their own. There is the potential for their actions to be misunderstood. When such a case is filed or threatened, the obstetrician should immediately discuss these matters with their attorney. In malpractice cases, malpractice insurance companies often select the attorneys who are experienced in such conflicts. If clinicians are not entirely comfortable that the appointed attorney is representing their interest and preserving a relationship with the hospital or other institution, however, they may engage their own legal counsel to protect their interests.
Practical considerations for avoiding malpractice claims
Good practices for avoiding malpractice claims apply with special force as it relates to CP.28,29
Uphold practice standards and good patient records. The causation element of these legal cases will remain problematic in the foreseeable future. But causation does not matter if negligent practice is not demonstrated. Therefore, maintaining best practices and continuous efforts at quality assurance and following all relevant professional practice guidelines is a good start. More than good intentions, it is essential that policies are implemented and reviewed. Among the areas of ongoing concern is the failure to monitor patients sufficiently. The long period of labor—where perhaps no physician is present for many hours—can introduce problems, as laypersons may have the impression that medical personnel were not on top of the situation.
Maintaining excellent records is also key for clinicians. The more complete the record, the fewer opportunities there are for faulty memories of parties and caregivers to fill in the gaps (especially when causation is so difficult to establish). Under absolutely no circumstances should records be changed or modified to eliminate damaging or an otherwise unfortunate notation. Few things are as harmful to credibility as discovered record tampering.
Inform patients of what is to come. Expectations are an important part of patient satisfaction. While not unduly frightening pregnant patients or eliminating reassurance, the informed consent process and patient counseling should be opportunities to avoid unreasonable expectations.
Stay alert to early genetic counseling, which is becoming increasingly available and important. Maintaining currency with what early testing can be done will become a critical part of ObGyn practice. For CP cases, in the near future, genetic testing may become part of determining causation. In the longer term, it will be part of counseling women and couples in deciding whether to have children, or potentially to end a pregnancy.
Expect the unexpected, and plan for it. Sometimes things just go wrong—there is a bad outcome, mistakes are made, patients are upset. It is important that any practice or institution have a clear plan for when such things happen. Some organizations have used apologies when appropriate,30 others have more complex plans for dealing with bad outcomes.31 Implement developed plans when they are needed. Individual practitioners also should consult with their attorney, who is familiar with their practice and who can help them maintain adherence to legal requirements and good legal problem prevention. ●
During a trial, all parties generally present evidence on negligence, causation, and damages. They do so without knowing whether a jury will find negligence and causation. The question of what the damages should be in cerebral palsy (CP) cases is also quite complex and expensive, but neither the defense nor the plaintiff can afford to ignore it. Past economic damages are relatively easy to calculate. Damages, for instance, includes medical care (pharmaceuticals and supplies, tests and procedures) and personal care (physical, occupational, and psychological therapy; long-term care; special educational costs; assistive equipment; and home modifications) that would have been avoided if it were not for CP. Future and personal care costs are more speculative, and must be estimated with the help of experts. In addition to future costs for the medical and personal care suggested above, depending on the state, the cost of lost future earnings (or earning capacity) may be additional economic damages. The cost of such intensive care, over a lifetime, accounts for many of the large verdicts and settlements.
Noneconomic damages are also available for such things as pain and suffering and diminished quality of life, both past and future. A number of states cap these noneconomic damages.
The wide range of damages correctly suggests that experts from several disciplines must be engaged to cover the damages landscape. This fact accounts for some of the costs of litigating these cases, and also for why damage calculations can be so complex.
- Fahey M, Macleenan A, Kretzschmar D, et al. The genetic basis of cerebral palsy. Dev Med Child Neurol. 2017;59:462-469. doi: 10.1111/dmcn.13363.
- Ellenberg J, Nelson, K. The association of cerebral palsy with birth asphyxia: a definitional quagmire. Dev Med Child Neurol. 2013;55:210-216. doi: 10.1111/dmcn.12016.
- Emrick L, DiCarlo S. The expanding role of genetics in cerebral palsy. Phys Med Rehabil Clin N Am. 2020;31:15-24. doi: 10.1016/j.pmr.2019.09.006.
- Rosenbaum P, Paneth N, Leviton A, et al. A report: the definition and classification of cerebral palsy [published correction appears in Dev Med Child Neurol. 2007;49:480]. Dev Med Child Neuro. 2007;109(suppl):8-14.
- MacLenan A, Lewis S, Moreno-DeLuca A, et al. Genetic or other causation should not change the clinical diagnosis of cerebral palsy. J Child Neurol. 2019;34:472-476. doi: 10.1177/0883073819840449.
- Lewis S, Shetty S, Wilson B, et al. Insights from genetic studies of cerebral palsy. Front Neurol. 2021;11:1-10. doi: 10.3389/fneur.2020.625428.
- Derick M, Drobyshevsky A, Ji X. A model of cerebral palsy from fetal hypoxia-ischemia. Stroke. 2007;38:731-735. doi: 10.1161/01.STR.0000251445.94697.64.
- McMichael G, Bainbridge M, Haan E, et al. Whole exome sequencing points to considerable genetic heterogeneity of cerebral palsy. Mol Psychiatry. 2015;20:176-182. doi: 10.1038/mp.2014.189.
- Moreno-DeLuca A, Milan F, Pesacreta D, et al. Molecular diagnostic yield of exome sequencing in patients with cerebral palsy. JAMA. 2021;325:467-475. doi: 10.1001/jama.2020.26148.
- Helping disabled children across Maryland & throughout the U.S. The Law Firm of Michael H. Bereston, Inc. website. https://www.berestonlaw.com/birth-injury/. Accessed April 26, 2021.
- Cerebral palsy lawsuits explained. Cerebral Palsy Guide website. https://www.cerebralpalsyguide.com/legal/. Accessed March 22, 2021.
- Zhou L, Li H, Li C, et al. Risk management and provider liabilities in infantile cerebral palsy based on malpractice litigation cases. J Forensic Leg Med. 2019;61:82-88. doi: 10.1016/j.jflm.2018.11.010.
- Cavanaugh MA. Bad cures for bad babies: policy challenges to the statutory removal of the common law claim for birth-related neurological injuries. Case West Res L Rev. 1992;43:1299-1346.
- Kain ZN, Caldwell-Andrews AA. What pediatricians should know about child-related malpractice payments in the United States. Pediatrics. 2006;118:464-468. doi: 10.1542/peds.2005-3112.
- Tabarrok A, Agan A. Medical malpractice awards, insurance, and negligence: which are related? Manhattan Institute Policy Research. Civil Justice Report; 2006. https://media4.manhattan-institute.org/pdf/cjr_10.pdf. Accessed April 27, 2021.
- Freeman AD, Freeman JM. No-fault cerebral palsy insurance: an alternative to the obstetrical malpractice lottery. J Health Politics Policy Law. 1989;14:707-718. doi: 10.1215/03616878-14-4-707.
- Sanfilippo JS, Smith SR. Is there liability if you don’t test for BRCA? OBG Manag. 2021;33:39-46. doi: 10.12788/obgm.0077.
- Fanaroff JM, Goldsmith JP. The most common patient safety issues resulting in legal action against neonatologists. Semin Perinatol. 2019;43:151181-1-9. doi: 10.1053/j.semperi.2019.08.010.
- Sartwelle TP, Johnston, JC. Cerebral palsy litigation: change course or abandon ship. J Child Neurol. 2015;30:828-841. doi: 10.1177/0883073814543306.
- Roth LM. The Business of Birth. NYU Press: New York, NY; 2021.
- Sartwelle TP. Electronic fetal monitoring: a bridge too far. J Legal Med. 2012;33:313-379. doi: 10.1080/01947648.2012.714321.
- Reiter JM, Walsh RS, Thomas EG. Best practices in birth injury litigation: timing hypoxic-ischemic fetal brain injury. Michigan Bar J. 2018;97:42-44.
- Sartwelle TP. Defending a neurologic birth injury: asphyxia neonatorum redux. J Legal Med. 2009;30:181-247. doi: 10.1080/01947640902936522.
- Daubert v Merrell Dow Pharm, Inc. 509 U.S. 579 (1993).
- Jha S. The factors making Americans litigious. J Am College Radiology. 2019;17:551-553. doi: 10.1016/j.jacr.2019.10.011.
- Salvi S, Pritchard PC. Statute of limitations on cerebral palsy cases. Personal Injury Lawyers website. https://www.salvilaw.com/birth-injury-lawyers/cerebral-palsy/time-limits/. Accessed March 24, 2021.
- Wharton R. Cerebral palsy statute of limitations. Cerebral Palsy Guidance website. October 16, 2020. https://www.cerebralpalsyguidance.com/cerebral-palsy-lawyer/statute-of-limitations/. Accessed March 24, 2021.
- Kassim PJ, Ushiro S, Najid KM. Compensating cerebral palsy cases: problems in court litigation and the no-fault alternative. Med Law. 2015;34:335-355.
- Williams D. Practice patterns to decrease the risk of malpractice suit. Clin Obstet Gynecol. 2008;51:680-687. doi: 10.1097/GRF.0b013e3181899bc7.
- McMichael BJ, Van Horn RL, Viscusi WK. “Sorry” is never enough: how state apology laws fail to reduce medical malpractice liability risk. Stanford Law Rev. 2019;71:341-409.
- Kachalia A, Kaufman SR, Boothman R, et al. Liability claims and costs before and after implementation of a medical error disclosure program. Ann Intern Med. 2010;153:213-221. doi: 10.7326/0003-4819-153-4-201008170-00002.
2021 Update on cervical disease
Infection with high-risk human papillomavirus (hrHPV) is an essential step in the development of cervical cancer and its precursors, as well as in several other cancers, including oropharyngeal, vulvar, vaginal, anal, and penile cancers. At least 13 HPV strains, known collectively as hrHPV, have been associated with cervical cancer, in addition to more than 150 low-risk HPV types that have not been associated with cancer (for example, HPV 6 and 11).1 Up to 80% of women (and most men, although men are not tested routinely) will become infected with at least one of the high-risk HPV types throughout their lives, although in most cases these infections will be transient and have no clinical impact for the patient. Patients who test positive consecutively over time for hrHPV, and especially those who test positive for one of the most virulent HPV types (HPV 16 or 18), have a higher risk of developing cervical cancer or precancer. In addition, many patients who acquire HPV at a young age may “clear” the infection, which usually means that the virus becomes inactive; however, often, for unknown reasons, the virus can be reactivated in some women later in life.
This knowledge of the natural history of HPV has led to improved approaches to cervical cancer prevention, which relies on a combined strategy that includes vaccinating as many children and young adults as possible against hrHPV, screening and triaging approaches that use HPV-based tests, and applying risk-based evaluation for abnormal screening results. New guidelines and information address the best approaches to each of these aspects of cervical cancer prevention, which we review here.
HPV vaccination: Recommendations and effect on cervical cancer rates
Meites E, Szilagyi PG, Chesson HW, et al. Human papillomavirus vaccination for adults: updated recommendations of the Advisory Committee on Immunization Practices. MMWR Morb Mortal Wkly Rep. 2019;68:698-702.
Lei J, Ploner A, Elfstrom KM, et al. HPV vaccination and the risk of invasive cervical cancer. N Engl J Med. 2020;383;1340-1348.

Vaccination at ages 27 to 45, although approved by the US Food and Drug Administration, is recommended only in a shared decision-making capacity by ACIP and the American College of Obstetricians and Gynecologists (ACOG) due to the vaccine’s minimal effect on cancer prevention in this age group. The ACIP and ACOG do not recommend catch-up vaccination for adults aged 27 to 45 years, but they recognize that some who are not adequately vaccinated might be at risk for new HPV infection and thus may benefit from vaccination.4
In contrast, the American Cancer Society (ACS) does not endorse the 2019 ACIP recommendation for shared clinical decision making in 27- to 45-year-olds because of the low effectiveness and low cancer prevention potential of vaccination in this age group, the burden of decision making on patients and clinicians, and the lack of sufficient guidance on selecting individuals who might benefit.5
Decline in HPV infections
A study in the United States between 2003 and 2014 showed a 71% decline in vaccine-type HPV infections among girls and women aged 14 to 19 in the post–vaccine available era as compared with the prevaccine era, and a lesser but still reasonable decline among women in the 20- to 24-year-old age group.6 Overall, vaccine-type HPV infections decreased 89% for vaccinated girls and 34% for unvaccinated girls, demonstrating some herd immunity.6 Ideally, the vaccine is given before the onset of skin-to-skin genital sexual activity. Many studies have found the vaccine to be safe and that immunogenicity is maintained for at least 9 years.7-11
Decrease in invasive cervical cancer
Recently, Lei and colleagues published a study in the New England Journal of Medicine that reviewed outcomes for more than 1.6 million girls and women vaccinated against HPV in Sweden between 2006 and 2017.12 Among girls who were vaccinated at younger than 17 years of age, there were only 2 cases of cancer, in contrast to 17 cases among those vaccinated at age 17 to 30 and 538 cases among those not vaccinated.
This is the first study to show definitively the preventive effect of HPV vaccination on the development of invasive cancer and the tremendous advantage of vaccinating at a young age. Nonetheless, the advantage conferred by catch-up vaccination (that is, vaccinating those at ages 17–30) also was significant.
Despite the well-established benefits of HPV vaccination, only 57% of women and 52% of men in the recommended age groups have received all recommended doses.13 Based on these findings, we need to advocate to our patients to vaccinate all children as early as recommended or possible and to continue catch-up vaccination for those in their 20s, even if they have hrHPV, given the efficacy of the current nonvalent vaccine against at least 7 oncogenic types. It is not at all clear that there is a benefit to vaccinating older women to prevent cancer, and we should currently focus on vaccinating younger people and continue to screen older women as newer research indicates that cervical cancer is increasing among women older than age 65.14
Continue to: Updated guidance on cervical cancer screening for average-risk women...
Updated guidance on cervical cancer screening for average-risk women
US Preventive Services Task Force; Curry SJ, Frist AH, Owens DK, et al. Screening for cervical cancer: US Preventive Services Task Force recommendation statement. JAMA. 2018;320:674-686.
Fontham ET, Wolf AM, Church TR, et al. Cervical cancer screening for individuals at average risk: 2020 guideline update from the American Cancer Society. CA Cancer J Clin. 2020;70:321-346.
As more is understood about the natural history of HPV and its role in the development of cervical cancer and its precursors, refinements and updates have been made to our approaches for screening people at risk. There is much evidence and experience available on recommending Pap testing and HPV cotesting (testing for HPV along with cytology even if the cytology result is normal) among women aged 30 to 65 years, as that has been an option since the 2012 guidelines were published.15
We know also that HPV testing is more sensitive for detecting cervical intraepithelial neoplasia grade 3 (CIN 3) or greater at 5 years and that a negative HPV test is more reassuring than a negative Pap test.16
Primary HPV tests
HPV tests can be used in conjunction with cytology (that is, cotesting) or as a primary screening that if positive, can reflex either to cytology or to testing for the most oncogenic subtypes. Currently, only 2 FDA-approved primary screening tests are available, the cobas 4800 HPV test system (Roche Diagnostics) and the BD Onclarity HPV assay (Becton, Dickinson and Company).17 Most laboratories in the United States do not yet have the technology for primary testing, and so instead they offer one of the remaining tests (Hybrid Capture 2 [Qiagen] and Cervista and Aptima [Hologic]), which do not necessarily have the same positive and negative predictive value as the tests specifically approved for primary testing. Thus, many clinicians and patients do not yet have access to primary HPV testing.
In addition, due to slow uptake of the HPV vaccine in many parts of the United States,13 there is concern that adding HPV testing in nonvaccinated women under age 30 would result in a surge of unnecessary colposcopy procedures for women with transient infections. Thus, several large expert organizations differ in opinion regarding screening among certain populations and by which test.
Screening guidance from national organizations
The US Preventive Services Task Force (USPSTF) and the American Cancer Society (ACS) differ in their recommendations for screening women in their 20s for cervical cancer.18,19 The USPSTF guidelines, which were published first, focus not only on the best test but also on what is feasible and likely to benefit public health, given our current testing capacity and vaccine coverage. The USPSTF recommends starting screening at age 21 with cytology and, if all results are normal, continuing every 3 years until age 30, at which point they recommend cytology every 3 years or cotesting every 5 years or primary HPV testing alone every 5 years (if all results are normal in each case).
In contrast, the ACS published "aspirational” guidelines, with the best evidence-based recommendations, but they acknowledge that due to availability of different testing options, some patients still need to be screened with existing modalities. The ACS recommends the onset of screening at age 25 with either primary HPV testing every 5 years (preferred) or cotesting every 5 years or cytology every 3 years.
Both the USPSTF and ACS guidelines state that if using cytology alone, the screening frequency should be every 3 years, and if using an HPV-based test, the screening interval (if all results are normal) can be extended to every 5 years.
Notably, the newest guidelines for cervical cancer screening essentially limit “screening” to low-risk women who are immunocompetent and who have never had an abnormal result, specifically high-grade dysplasia (that is, CIN 2 or CIN 3). Guidelines for higher-risk groups, including the immunosuppressed, and surveillance among women with prior abnormal results can be accessed (as can all the US guidelines) at the American Society for Colposcopy and Cervical Pathology (ASCCP) website (http://www.asccp.org/).
Continue to: New ASCCP management guidelines focus on individualized risk assessment...
New ASCCP management guidelines focus on individualized risk assessment
Perkins RB, Guido RS, Castle PE, et al; 2019 ASCCP Risk-Based Management Consensus Guidelines Committee. 2019 ASCCP risk-based management consensus guidelines for abnormal cervical cancer screening tests and cancer precursors. J Low Genit Tract Dis. 2020;24:102-131.
The ASCCP risk-based management guidelines introduce a paradigm shift from managing a specific cervical cancer screening result to using a clinical action threshold based on risk estimates that use both current and past test results to determine frequency and urgency of testing, management, and surveillance (FIGURE).20 The individualized risk estimate helps to target prevention for those at highest risk while minimizing overtesting and overtreatment.
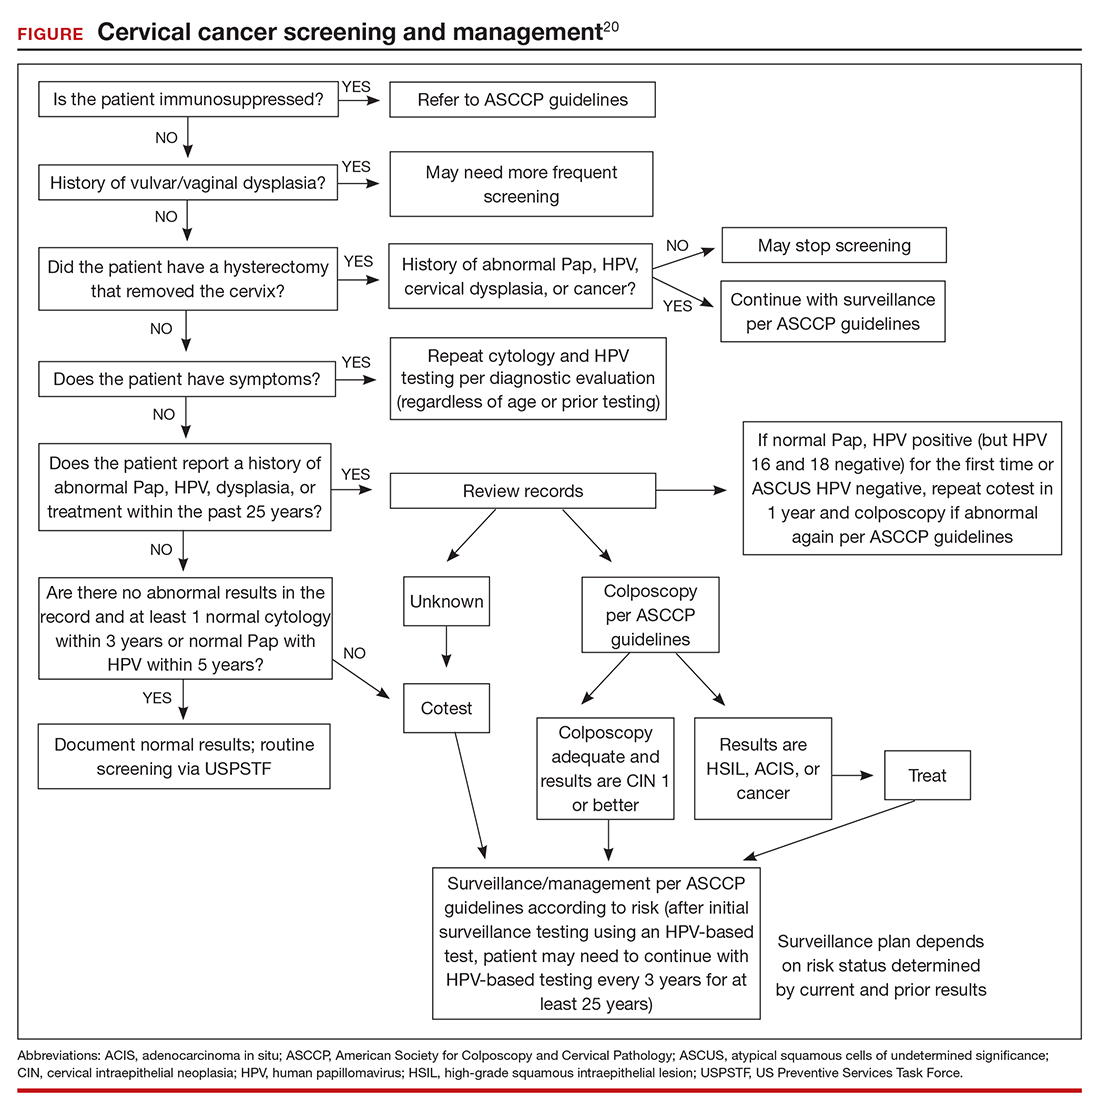
Estimating risk and determining management
The new risk-based management consensus guidelines use risk and clinical action thresholds to determine the appropriate management course for cervical screening abnormalities.20 New data indicate that a patient’s risk of developing cervical precancer or cancer can be estimated using current screening results and previous screening test and biopsy results, while considering personal factors such as age and immunosuppression.20 For each combination of current test results and screening history (including unknown history), the immediate and 5-year risk of CIN 3+ is estimated.
With respect to risk, the following concepts underlie the changes from the 2012 guidelines:
- Negative HPV tests reduce risk.
- Colposcopy performed for low-grade abnormalities, which confirms the absence of CIN 2+, reduces risk.
- A history of HPV-positive results increases risk.
- Prior treatment for CIN 2 or CIN 3 increases risk, and women with this history need to be followed closely for at least 25 years, regardless of age.
Once an individual’s risk is estimated, it is compared with 1 of the 6 proposed “clinical action thresholds”: treatment, optional treatment or colposcopy/biopsy, colposcopy/ biopsy, 1-year surveillance, 3-year surveillance, or 5-year return to regular screening (<0.15% 5-year CIN 3+ risk).
Key takeaways
Increasing knowledge of the natural history of HPV has led to improved approaches to prevention, including the nonvalent HPV vaccine, which protects against 7 high-risk and 2 low-risk HPV types; specific screening guidelines that take into consideration age, immune status, and prior abnormality; and risk-based management guidelines that use both current and prior results as well as age to recommend the best approach for managing an abnormal result and providing surveillance after an abnormal result. ●
Using the ASCCP risk thresholds, most patients with a history of an abnormal result, especially CIN 2+, likely will need more frequent surveillance testing for the foreseeable future. As increasing cohorts are vaccinated and as new biomarkers emerge that can help triage patients into more precise categories, the current risk categories likely will evolve. Hopefully, women at high risk will be appropriately managed, and those at low risk will avoid overtreatment.
- Burd EM. Human papillomavirus and cervical cancer. Clin Microbiol Rev. 2003;16:1-17.
- Meites E, Szilagyi PG, Chesson HW, et al. Human papillomavirus vaccination for adults: updated recommendations of the Advisory Committee on Immunization Practices. MMWR Morb Mortal Wkly Rep. 2019;68;698-702.
- Meites E, Kempe A, Markowitz LE. Use of a 2-dose schedule for human papillomavirus vaccination—updated recommendations of the Advisory Committee on Immunization Practices. MMWR Morb Mortal Wkly Rep. 2016;65:1405-1408.
- American College of Obstetricians and Gynecologists. Human papillomavirus vaccination: ACOG committee opinion no. 809. Obstet Gynecol. 2020;136:e15-e21.
- Saslow D, Andrews KS, Manassaram-Baptiste D, et al; American Cancer Society Guideline Development Group. Human papillomavirus vaccination 2020 guideline update: American Cancer Society guideline adaptation. CA Cancer J Clin. 2020;70:274-280.
- Oliver SE, Unger ER, Lewis R, et al. Prevalence of human papillomavirus among females after vaccine introduction— National Health and Nutrition Examination Survey, United States, 2003–2014. J Infect Dis. 2017;216:594-603.
- Gee J, Weinbaum C, Sukumaran L, et al. Quadrivalent HPV vaccine safety review and safety monitoring plans for ninevalent HPV vaccine in the United States. Hum Vaccin Immunother. 2016;12:1406-1417.
- Cameron RL, Ahmed S, Pollock KG. Adverse event monitoring of the human papillomavirus vaccines in Scotland. Intern Med J. 2016;46:452-457.
- Chao C, Klein NP, Velicer CM, et al. Surveillance of autoimmune conditions following routine use of quadrivalent human papillomavirus vaccine. J Intern Med. 2012;271:193- 203.
- Suragh TA, Lewis P, Arana J, et al. Safety of bivalent human papillomavirus vaccine in the US Vaccine Adverse Event Reporting System (VAERS), 2009–2017. Br J Clin Pharmacol. 2018;84:2928-2932.
- Pinto LA, Dillner J, Beddows S, et al. Immunogenicity of HPV prophylactic vaccines: serology assays and their use in HPV vaccine evaluation and development. Vaccine. 2018;36(32 pt A):4792-4799.
- Lei J, Ploner A, Elfstrom KM et al. HPV vaccination and the risk of invasive cervical cancer. N Engl J Med. 2020;383:1340- 1348.
- Elam-Evans LD, Yankey D, Singleton JA, et al. National, regional, state, and selected local area vaccination coverage among adolescents aged 13–17 years—United States, 2019. MMWR Morb Mortal Wkly Rep. 2020;69:1109-1116.
- Feldman S, Cook E, Davis M, et al. Cervical cancer incidence among elderly women in Massachusetts compared with younger women. J Lower Genit Tract Dis. 2018;22: 314-317.
- Saslow D, Solomon D, Lawson HW, et al; ACS-ASCCP-ASCP Cervical Cancer Guideline Committee. American Cancer Society, American Society for Colposcopy and Cervical Pathology, and American Society for Clinical Pathology screening guidelines for the prevention and early detection of cervical cancer. CA Cancer J Clin. 2012;62:147-172.
- Katki HA, Schiffman M, Castle PE, et al. Benchmarking CIN 3+ risk as the basis for incorporating HPV and Pap cotesting into cervical screening and management guidelines. J Low Genit Tract Dis. 2013;17(5 suppl 1):S28-35.
- Salazar KL, Duhon DJ, Olsen R, et al. A review of the FDA-approved molecular testing platforms for human papillomavirus. J Am Soc Cytopathol. 2019;8:284-292.
- US Preventive Services Task Force; Curry SJ, Krist AH, Owens DK, et al. Screening for cervical cancer: US Preventive Services Task Force recommendation statement. JAMA. 2018;320:674-686.
- Fontham ET, Wolf AM, Church TR, et al. Cervical cancer screening for individuals at average risk: 2020 guideline update from the American Cancer Society. CA Cancer Clin. 2020;70:321-346.
- Perkins RB, Guido RS, Castle PE, et al; 2019 ASCCP Risk-Based Management Consensus Guidelines Committee. 2019 ASCCP risk-based management consensus guidelines for abnormal cervical cancer screening tests and cancer precursors. J Low Genit Tract Dis. 2020;24:102-131.

Shuk On Annie Leung, MD
Dr. Leung is a Clinical Fellow in Gynecologic Oncology, Obstetrics and Gynecology, Harvard Medical School, Brigham and Women’s Hospital, Division of Gynecologic Oncology, Boston, Massachusetts.

Sarah Feldman, MD, MPH
Dr. Feldman is Associate Professor, Obstetrics and Gynecology, and Medical Director, Ambulatory Gynecologic Oncology, Harvard Medical School, Brigham and Women’s Hospital, Division of Gynecologic Oncology, Boston.
Dr. Feldman reports serving as an author and peer editor for UpToDate, Inc. Dr. Leung reports no financial relationships relevant to this article.
Shuk On Annie Leung, MD
Dr. Leung is a Clinical Fellow in Gynecologic Oncology, Obstetrics and Gynecology, Harvard Medical School, Brigham and Women’s Hospital, Division of Gynecologic Oncology, Boston, Massachusetts.
Sarah Feldman, MD, MPH
Dr. Feldman is Associate Professor, Obstetrics and Gynecology, and Medical Director, Ambulatory Gynecologic Oncology, Harvard Medical School, Brigham and Women’s Hospital, Division of Gynecologic Oncology, Boston.
Dr. Feldman reports serving as an author and peer editor for UpToDate, Inc. Dr. Leung reports no financial relationships relevant to this article.
Infection with high-risk human papillomavirus (hrHPV) is an essential step in the development of cervical cancer and its precursors, as well as in several other cancers, including oropharyngeal, vulvar, vaginal, anal, and penile cancers. At least 13 HPV strains, known collectively as hrHPV, have been associated with cervical cancer, in addition to more than 150 low-risk HPV types that have not been associated with cancer (for example, HPV 6 and 11).1 Up to 80% of women (and most men, although men are not tested routinely) will become infected with at least one of the high-risk HPV types throughout their lives, although in most cases these infections will be transient and have no clinical impact for the patient. Patients who test positive consecutively over time for hrHPV, and especially those who test positive for one of the most virulent HPV types (HPV 16 or 18), have a higher risk of developing cervical cancer or precancer. In addition, many patients who acquire HPV at a young age may “clear” the infection, which usually means that the virus becomes inactive; however, often, for unknown reasons, the virus can be reactivated in some women later in life.
This knowledge of the natural history of HPV has led to improved approaches to cervical cancer prevention, which relies on a combined strategy that includes vaccinating as many children and young adults as possible against hrHPV, screening and triaging approaches that use HPV-based tests, and applying risk-based evaluation for abnormal screening results. New guidelines and information address the best approaches to each of these aspects of cervical cancer prevention, which we review here.
HPV vaccination: Recommendations and effect on cervical cancer rates
Meites E, Szilagyi PG, Chesson HW, et al. Human papillomavirus vaccination for adults: updated recommendations of the Advisory Committee on Immunization Practices. MMWR Morb Mortal Wkly Rep. 2019;68:698-702.
Lei J, Ploner A, Elfstrom KM, et al. HPV vaccination and the risk of invasive cervical cancer. N Engl J Med. 2020;383;1340-1348.
Vaccination at ages 27 to 45, although approved by the US Food and Drug Administration, is recommended only in a shared decision-making capacity by ACIP and the American College of Obstetricians and Gynecologists (ACOG) due to the vaccine’s minimal effect on cancer prevention in this age group. The ACIP and ACOG do not recommend catch-up vaccination for adults aged 27 to 45 years, but they recognize that some who are not adequately vaccinated might be at risk for new HPV infection and thus may benefit from vaccination.4
In contrast, the American Cancer Society (ACS) does not endorse the 2019 ACIP recommendation for shared clinical decision making in 27- to 45-year-olds because of the low effectiveness and low cancer prevention potential of vaccination in this age group, the burden of decision making on patients and clinicians, and the lack of sufficient guidance on selecting individuals who might benefit.5
Decline in HPV infections
A study in the United States between 2003 and 2014 showed a 71% decline in vaccine-type HPV infections among girls and women aged 14 to 19 in the post–vaccine available era as compared with the prevaccine era, and a lesser but still reasonable decline among women in the 20- to 24-year-old age group.6 Overall, vaccine-type HPV infections decreased 89% for vaccinated girls and 34% for unvaccinated girls, demonstrating some herd immunity.6 Ideally, the vaccine is given before the onset of skin-to-skin genital sexual activity. Many studies have found the vaccine to be safe and that immunogenicity is maintained for at least 9 years.7-11
Decrease in invasive cervical cancer
Recently, Lei and colleagues published a study in the New England Journal of Medicine that reviewed outcomes for more than 1.6 million girls and women vaccinated against HPV in Sweden between 2006 and 2017.12 Among girls who were vaccinated at younger than 17 years of age, there were only 2 cases of cancer, in contrast to 17 cases among those vaccinated at age 17 to 30 and 538 cases among those not vaccinated.
This is the first study to show definitively the preventive effect of HPV vaccination on the development of invasive cancer and the tremendous advantage of vaccinating at a young age. Nonetheless, the advantage conferred by catch-up vaccination (that is, vaccinating those at ages 17–30) also was significant.
Despite the well-established benefits of HPV vaccination, only 57% of women and 52% of men in the recommended age groups have received all recommended doses.13 Based on these findings, we need to advocate to our patients to vaccinate all children as early as recommended or possible and to continue catch-up vaccination for those in their 20s, even if they have hrHPV, given the efficacy of the current nonvalent vaccine against at least 7 oncogenic types. It is not at all clear that there is a benefit to vaccinating older women to prevent cancer, and we should currently focus on vaccinating younger people and continue to screen older women as newer research indicates that cervical cancer is increasing among women older than age 65.14
Continue to: Updated guidance on cervical cancer screening for average-risk women...
Updated guidance on cervical cancer screening for average-risk women
US Preventive Services Task Force; Curry SJ, Frist AH, Owens DK, et al. Screening for cervical cancer: US Preventive Services Task Force recommendation statement. JAMA. 2018;320:674-686.
Fontham ET, Wolf AM, Church TR, et al. Cervical cancer screening for individuals at average risk: 2020 guideline update from the American Cancer Society. CA Cancer J Clin. 2020;70:321-346.
As more is understood about the natural history of HPV and its role in the development of cervical cancer and its precursors, refinements and updates have been made to our approaches for screening people at risk. There is much evidence and experience available on recommending Pap testing and HPV cotesting (testing for HPV along with cytology even if the cytology result is normal) among women aged 30 to 65 years, as that has been an option since the 2012 guidelines were published.15
We know also that HPV testing is more sensitive for detecting cervical intraepithelial neoplasia grade 3 (CIN 3) or greater at 5 years and that a negative HPV test is more reassuring than a negative Pap test.16
Primary HPV tests
HPV tests can be used in conjunction with cytology (that is, cotesting) or as a primary screening that if positive, can reflex either to cytology or to testing for the most oncogenic subtypes. Currently, only 2 FDA-approved primary screening tests are available, the cobas 4800 HPV test system (Roche Diagnostics) and the BD Onclarity HPV assay (Becton, Dickinson and Company).17 Most laboratories in the United States do not yet have the technology for primary testing, and so instead they offer one of the remaining tests (Hybrid Capture 2 [Qiagen] and Cervista and Aptima [Hologic]), which do not necessarily have the same positive and negative predictive value as the tests specifically approved for primary testing. Thus, many clinicians and patients do not yet have access to primary HPV testing.
In addition, due to slow uptake of the HPV vaccine in many parts of the United States,13 there is concern that adding HPV testing in nonvaccinated women under age 30 would result in a surge of unnecessary colposcopy procedures for women with transient infections. Thus, several large expert organizations differ in opinion regarding screening among certain populations and by which test.
Screening guidance from national organizations
The US Preventive Services Task Force (USPSTF) and the American Cancer Society (ACS) differ in their recommendations for screening women in their 20s for cervical cancer.18,19 The USPSTF guidelines, which were published first, focus not only on the best test but also on what is feasible and likely to benefit public health, given our current testing capacity and vaccine coverage. The USPSTF recommends starting screening at age 21 with cytology and, if all results are normal, continuing every 3 years until age 30, at which point they recommend cytology every 3 years or cotesting every 5 years or primary HPV testing alone every 5 years (if all results are normal in each case).
In contrast, the ACS published "aspirational” guidelines, with the best evidence-based recommendations, but they acknowledge that due to availability of different testing options, some patients still need to be screened with existing modalities. The ACS recommends the onset of screening at age 25 with either primary HPV testing every 5 years (preferred) or cotesting every 5 years or cytology every 3 years.
Both the USPSTF and ACS guidelines state that if using cytology alone, the screening frequency should be every 3 years, and if using an HPV-based test, the screening interval (if all results are normal) can be extended to every 5 years.
Notably, the newest guidelines for cervical cancer screening essentially limit “screening” to low-risk women who are immunocompetent and who have never had an abnormal result, specifically high-grade dysplasia (that is, CIN 2 or CIN 3). Guidelines for higher-risk groups, including the immunosuppressed, and surveillance among women with prior abnormal results can be accessed (as can all the US guidelines) at the American Society for Colposcopy and Cervical Pathology (ASCCP) website (http://www.asccp.org/).
Continue to: New ASCCP management guidelines focus on individualized risk assessment...
New ASCCP management guidelines focus on individualized risk assessment
Perkins RB, Guido RS, Castle PE, et al; 2019 ASCCP Risk-Based Management Consensus Guidelines Committee. 2019 ASCCP risk-based management consensus guidelines for abnormal cervical cancer screening tests and cancer precursors. J Low Genit Tract Dis. 2020;24:102-131.
The ASCCP risk-based management guidelines introduce a paradigm shift from managing a specific cervical cancer screening result to using a clinical action threshold based on risk estimates that use both current and past test results to determine frequency and urgency of testing, management, and surveillance (FIGURE).20 The individualized risk estimate helps to target prevention for those at highest risk while minimizing overtesting and overtreatment.
Estimating risk and determining management
The new risk-based management consensus guidelines use risk and clinical action thresholds to determine the appropriate management course for cervical screening abnormalities.20 New data indicate that a patient’s risk of developing cervical precancer or cancer can be estimated using current screening results and previous screening test and biopsy results, while considering personal factors such as age and immunosuppression.20 For each combination of current test results and screening history (including unknown history), the immediate and 5-year risk of CIN 3+ is estimated.
With respect to risk, the following concepts underlie the changes from the 2012 guidelines:
- Negative HPV tests reduce risk.
- Colposcopy performed for low-grade abnormalities, which confirms the absence of CIN 2+, reduces risk.
- A history of HPV-positive results increases risk.
- Prior treatment for CIN 2 or CIN 3 increases risk, and women with this history need to be followed closely for at least 25 years, regardless of age.
Once an individual’s risk is estimated, it is compared with 1 of the 6 proposed “clinical action thresholds”: treatment, optional treatment or colposcopy/biopsy, colposcopy/ biopsy, 1-year surveillance, 3-year surveillance, or 5-year return to regular screening (<0.15% 5-year CIN 3+ risk).
Key takeaways
Increasing knowledge of the natural history of HPV has led to improved approaches to prevention, including the nonvalent HPV vaccine, which protects against 7 high-risk and 2 low-risk HPV types; specific screening guidelines that take into consideration age, immune status, and prior abnormality; and risk-based management guidelines that use both current and prior results as well as age to recommend the best approach for managing an abnormal result and providing surveillance after an abnormal result. ●
Using the ASCCP risk thresholds, most patients with a history of an abnormal result, especially CIN 2+, likely will need more frequent surveillance testing for the foreseeable future. As increasing cohorts are vaccinated and as new biomarkers emerge that can help triage patients into more precise categories, the current risk categories likely will evolve. Hopefully, women at high risk will be appropriately managed, and those at low risk will avoid overtreatment.
- Burd EM. Human papillomavirus and cervical cancer. Clin Microbiol Rev. 2003;16:1-17.
- Meites E, Szilagyi PG, Chesson HW, et al. Human papillomavirus vaccination for adults: updated recommendations of the Advisory Committee on Immunization Practices. MMWR Morb Mortal Wkly Rep. 2019;68;698-702.
- Meites E, Kempe A, Markowitz LE. Use of a 2-dose schedule for human papillomavirus vaccination—updated recommendations of the Advisory Committee on Immunization Practices. MMWR Morb Mortal Wkly Rep. 2016;65:1405-1408.
- American College of Obstetricians and Gynecologists. Human papillomavirus vaccination: ACOG committee opinion no. 809. Obstet Gynecol. 2020;136:e15-e21.
- Saslow D, Andrews KS, Manassaram-Baptiste D, et al; American Cancer Society Guideline Development Group. Human papillomavirus vaccination 2020 guideline update: American Cancer Society guideline adaptation. CA Cancer J Clin. 2020;70:274-280.
- Oliver SE, Unger ER, Lewis R, et al. Prevalence of human papillomavirus among females after vaccine introduction— National Health and Nutrition Examination Survey, United States, 2003–2014. J Infect Dis. 2017;216:594-603.
- Gee J, Weinbaum C, Sukumaran L, et al. Quadrivalent HPV vaccine safety review and safety monitoring plans for ninevalent HPV vaccine in the United States. Hum Vaccin Immunother. 2016;12:1406-1417.
- Cameron RL, Ahmed S, Pollock KG. Adverse event monitoring of the human papillomavirus vaccines in Scotland. Intern Med J. 2016;46:452-457.
- Chao C, Klein NP, Velicer CM, et al. Surveillance of autoimmune conditions following routine use of quadrivalent human papillomavirus vaccine. J Intern Med. 2012;271:193- 203.
- Suragh TA, Lewis P, Arana J, et al. Safety of bivalent human papillomavirus vaccine in the US Vaccine Adverse Event Reporting System (VAERS), 2009–2017. Br J Clin Pharmacol. 2018;84:2928-2932.
- Pinto LA, Dillner J, Beddows S, et al. Immunogenicity of HPV prophylactic vaccines: serology assays and their use in HPV vaccine evaluation and development. Vaccine. 2018;36(32 pt A):4792-4799.
- Lei J, Ploner A, Elfstrom KM et al. HPV vaccination and the risk of invasive cervical cancer. N Engl J Med. 2020;383:1340- 1348.
- Elam-Evans LD, Yankey D, Singleton JA, et al. National, regional, state, and selected local area vaccination coverage among adolescents aged 13–17 years—United States, 2019. MMWR Morb Mortal Wkly Rep. 2020;69:1109-1116.
- Feldman S, Cook E, Davis M, et al. Cervical cancer incidence among elderly women in Massachusetts compared with younger women. J Lower Genit Tract Dis. 2018;22: 314-317.
- Saslow D, Solomon D, Lawson HW, et al; ACS-ASCCP-ASCP Cervical Cancer Guideline Committee. American Cancer Society, American Society for Colposcopy and Cervical Pathology, and American Society for Clinical Pathology screening guidelines for the prevention and early detection of cervical cancer. CA Cancer J Clin. 2012;62:147-172.
- Katki HA, Schiffman M, Castle PE, et al. Benchmarking CIN 3+ risk as the basis for incorporating HPV and Pap cotesting into cervical screening and management guidelines. J Low Genit Tract Dis. 2013;17(5 suppl 1):S28-35.
- Salazar KL, Duhon DJ, Olsen R, et al. A review of the FDA-approved molecular testing platforms for human papillomavirus. J Am Soc Cytopathol. 2019;8:284-292.
- US Preventive Services Task Force; Curry SJ, Krist AH, Owens DK, et al. Screening for cervical cancer: US Preventive Services Task Force recommendation statement. JAMA. 2018;320:674-686.
- Fontham ET, Wolf AM, Church TR, et al. Cervical cancer screening for individuals at average risk: 2020 guideline update from the American Cancer Society. CA Cancer Clin. 2020;70:321-346.
- Perkins RB, Guido RS, Castle PE, et al; 2019 ASCCP Risk-Based Management Consensus Guidelines Committee. 2019 ASCCP risk-based management consensus guidelines for abnormal cervical cancer screening tests and cancer precursors. J Low Genit Tract Dis. 2020;24:102-131.

Stop checking routine lipid panels every year
CASE 34-year-old woman with lipid panel results from 1 year ago
A woman with no chronic medical conditions was seen by her gynecologist for a routine well-woman examination. She does not see another primary care provider. She is age 34 years and has a levonorgestrel intrauterine device that was placed after the birth of her second child 2 years prior. She does not take any other medications. She has never smoked and drinks a glass of wine with dinner a couple of times each week. She finds it challenging with her full-time job and her parental responsibilities with 2 young children to get regular exercise but otherwise is active. She does not have a family history of premature cardiovascular disease. Last year, during her prior well-woman examination, she had a fasting lipid panel: her low-density lipoprotein (LDL) was 102 mg/dL (reference range, ≤160 mg/dL), high-density lipoprotein (HDL) 52 mg/dL (reference range, ≥40 mg/dL), triglycerides 140 mg/dL (reference range, <160 mg/dL), and total cholesterol 182 mg/dL (reference range, <200 mg/dL).
During this visit, the patient’s vitals are normal (blood pressure 116/58) and her physical examination is unremarkable. Her physician orders routine labs to be checked, including a fasting lipid panel. She has to figure out when she will be able to get these labs drawn, as she needs to coordinate with her work and childcare schedules. A week later, she leaves work at 4:00 PM and picks up her young children (aged 2 and 4 years) from childcare, bringing them to the laboratory to have her blood drawn. Not only are her children cranky in the waiting room, but she is feeling tired as she hasn’t eaten all day because her physician told her she is supposed to be fasting. She has to pay for parking at the lot for the laboratory since it is connected to the medical center.
Was this lipid panel high value?
When and how often should we be checking lipid panels?
Do patients need to fast for these tests?
The potential benefits and costs of routine lipid panel screening
Hyperlipidemia is relatively prevalent, usually asymptomatic, and has been linked to cardiovascular outcomes. Thus, screening for lipid abnormalities is recommended to identify patients that would benefit from various interventions aimed at reducing cardiovascular disease risk, including lipid-lowering therapy.1 High levels of LDL cholesterol and low levels of HDL cholesterol are important risk factors for coronary heart disease.
Lipid panels are widely available blood tests with modest monetary costs, generally ranging from about $10 to $100 in the outpatient setting. Of note, a 2014 study examining inpatient charges for this common laboratory test found that hospital charges in California ranged from about $10 to $10,000 for a lipid panel.2 Despite the relatively low cost of each individual lipid panel, the aggregate costs to the health system of these frequently and widely performed tests are large. In fact, low-cost, high-volume health services, such as repeat cholesterol testing, account for the majority of unnecessary health spending in the United States, contributing nearly twice as much unnecessary cost as high-priced low-value services.3
To the patient, the cost is not only monetary. Some patients will need to take an additional hour or two off work as well as consider childcare, transportation, parking, and other mundane logistics to sit in a laboratory waiting room—a cost that may not be considered modest at all by the patient.4,5
Therefore, like most services in health care, the answer to whether or not a lipid panel is high-value care is: it depends.5 In the correct circumstances, the test generally is regarded as high value due to well-documented potential benefits and low monetary costs. However, when performed unnecessarily—either in patient groups that are unlikely to benefit or at intervals that are too soon to add helpful information—then all that is left are the financial and psychosocial costs, which make this a low-value test in these scenarios. For this patient, this test contributed to inconvenience and mild hardships with essentially no benefit, thus would be considered low-value care.
Continue to: When should we perform lipid screening in low-risk women?
When should we perform lipid screening in low-risk women?
There are conflicting guidelines and opinions about at what age lipid screening should be routinely performed in adults. The United States Preventive Services Task Force (USPSTF) 2016 guidelines found “insufficient evidence that screening for dyslipidemia before age 40 years has an effect on either short- or longer-term cardiovascular outcomes.”6 Therefore, the USPSTF “recommends neither for nor against screening for dyslipidemia in this age group,” and instead encourages “clinicians to use their clinical judgment for [these] patients.”6
A common practice is to obtain a baseline lipid profile at the time of initiation of care with an adult primary care practitioner, if the patient was not previously screened, and to then determine subsequent testing based on these results and the patient’s risk factors for cardiovascular disease. For patients with normal lipid screening results and lower cardiovascular risk factors (no hypertension, diabetes mellitus, cigarette smoking, family history of premature coronary heart disease), experts suggest follow-up lipid screening be performed in men at age 35 and in women at age 45.7 Therefore, for this patient who had essentially a normal lipid panel a year prior, she should not have required repeat lipid testing until she is age 45.
As for how frequently subsequent lipid testing should be performed, the Centers for Disease Control and Prevention states, “most healthy adults should have their cholesterol checked every 4 to 6 years.”8 Those taking lipid-lowering medications or those with risk factors such as heart disease, diabetes, or concerning family history should have their cholesterol checked more frequently. If patients are near a threshold for treatment, some experts suggest repeating measurements every 3 years, but even in these settings, annual testing would be considered excessive.7
A standard lipid panel screen includes total cholesterol, LDL, HDL, and triglycerides. While a variety of assays have been developed that subfractionate lipoprotein particles based on size, density, or charge, these tests do not add value for low-risk patient screening and should only be used on an individualized basis for selected intermediate to high-risk patients. The American Society for Clinical Pathology released a Choosing Wisely recommendation that advises, “Do not routinely order expanded lipid panels (particle sizing, nuclear magnetic resonance) as screening tests for cardiovascular disease.”9
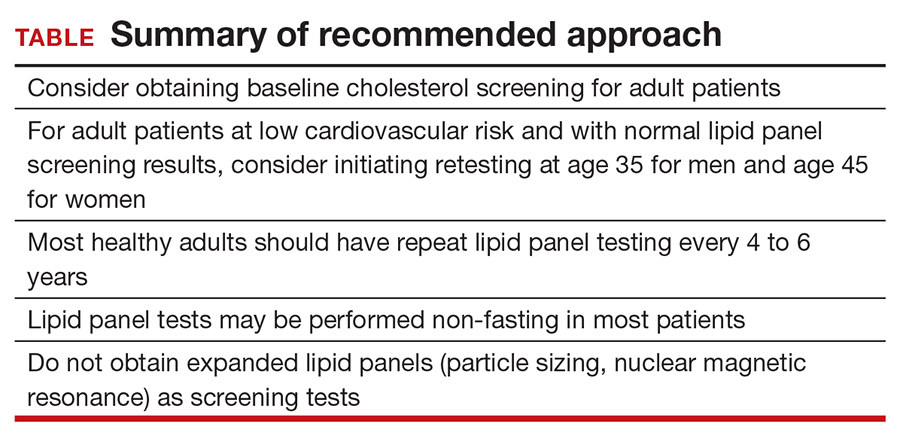
Do lipid panels need to be fasting?
For adults who are not taking lipid-lowering therapy, measurement of either a fasting or a nonfasting plasma lipid profile is effective for documenting baseline LDL and estimating cardiovascular risk.1 In other words, nonfasting lipid testing is appropriate for most low-risk screening. Nonfasting testing generally is more convenient for patients; however, nonfasting lipid panels could result in elevated triglyceride levels. If an initial nonfasting lipid profile reveals a triglyceride level of 400 mg/dL or higher, then a repeat lipid profile in the fasting state should be performed for assessment of fasting triglyceride levels and baseline LDL.1 Some patients may prefer to simply get a fasting lipid panel initially so that they do not run the risk of having to return for a second test, especially if they are at increased risk for high triglyceride levels (ie, if they are obese, have diabetes, or are taking medications such as steroids, which can increase triglyceride levels).
The bottom line
Some patients receive primary care directly from their gynecologist, and thus it is important for women’s health clinicians to be aware of appropriate cholesterol screening practices. While lipid panels may commonly be ordered routinely as part of annual health check-ups, the evidence suggests that this is an unnecessary practice that contributes to wasteful health spending at both individual and system levels; it also is an avoidable inconvenience for patients. It is unclear when lipid screening should be initiated for adult patients, but it seems reasonable to check baseline levels for a new patient who has not previously been screened. In low-risk patients with normal lipid panel levels, experts recommend initiating retesting at age 45 for women and obtaining repeat lipid levels no more than every 4 to 6 years. For most patients, nonfasting lipid levels will suffice for screening. Avoiding common unnecessary testing is an effective way to improve value for patients. ●
- Grundy SM, Stone NJ, Bailey AL, et al. 2018 AHA/ACC/AACVPR/AAPA/ABC/ACPM/ADA/AGS/APhA/ASPC/NLA/PCNA guideline on the management of blood cholesterol: executive summary: a report of the American College of Cardiology/American Heart Association Task Force on Clinical Practice Guidelines. J Am Coll Cardiol. 2019;73:3168-3209.
- Hsia RY, Akosa Antwi Y, Nath JB, et al. Variation in charges for 10 common blood tests in California hospitals: a cross-sectional analysis. BMJ Open. 2014;4:E005482.
- Mafi JN, Russell K, Bortz BA, et al. Low-cost, high-volume health services contribute the most to unnecessary health spending. Health Aff. 2017;36:1701-1704.
- Covinsky KE. The problem of overuse. JAMA Intern Med. 2013;173:1446.
- Moriates C, Arora V, Shah N. Understanding Value-Based Healthcare. McGraw-Hill; 2015.
- Chou R, Dana T, Blazina I, et al. Statins for prevention of cardiovascular disease in adults: evidence report and systematic review for the US Preventive Services Task Force. JAMA. 2016;316:2008.
- Vijan S. Screening for lipid disorders in adults. UpToDate website. Updated February 28, 2020. Accessed April 9, 2021. https://www.uptodate.com/contents/screening-for-lipid-disorders-in-adults
- Getting your cholesterol checked. Centers for Disease Control and Prevention. Published September 8, 2020. Accessed April 9, 2021. https://www.cdc.gov/cholesterol/cholesterol_screening.htm
- American Society for Clinical Pathology. Choosing Wisely website. Published September 14, 2016. Accessed April 9, 2021. https://www.choosingwisely.org/clinician-lists/american-society-clinical-pathology-expanded-lipid-panels-to-screen-for-cardiovascular-disease

Dr. Moriates is Assistant Dean for Healthcare Value and Associate Professor of Internal Medicine, Department of Internal Medicine, Dell Medical School, The University of Texas at Austin.
The author reports no financial relationships relevant to this article.
Dr. Moriates is Assistant Dean for Healthcare Value and Associate Professor of Internal Medicine, Department of Internal Medicine, Dell Medical School, The University of Texas at Austin.
The author reports no financial relationships relevant to this article.
Dr. Moriates is Assistant Dean for Healthcare Value and Associate Professor of Internal Medicine, Department of Internal Medicine, Dell Medical School, The University of Texas at Austin.
The author reports no financial relationships relevant to this article.
CASE 34-year-old woman with lipid panel results from 1 year ago
A woman with no chronic medical conditions was seen by her gynecologist for a routine well-woman examination. She does not see another primary care provider. She is age 34 years and has a levonorgestrel intrauterine device that was placed after the birth of her second child 2 years prior. She does not take any other medications. She has never smoked and drinks a glass of wine with dinner a couple of times each week. She finds it challenging with her full-time job and her parental responsibilities with 2 young children to get regular exercise but otherwise is active. She does not have a family history of premature cardiovascular disease. Last year, during her prior well-woman examination, she had a fasting lipid panel: her low-density lipoprotein (LDL) was 102 mg/dL (reference range, ≤160 mg/dL), high-density lipoprotein (HDL) 52 mg/dL (reference range, ≥40 mg/dL), triglycerides 140 mg/dL (reference range, <160 mg/dL), and total cholesterol 182 mg/dL (reference range, <200 mg/dL).
During this visit, the patient’s vitals are normal (blood pressure 116/58) and her physical examination is unremarkable. Her physician orders routine labs to be checked, including a fasting lipid panel. She has to figure out when she will be able to get these labs drawn, as she needs to coordinate with her work and childcare schedules. A week later, she leaves work at 4:00 PM and picks up her young children (aged 2 and 4 years) from childcare, bringing them to the laboratory to have her blood drawn. Not only are her children cranky in the waiting room, but she is feeling tired as she hasn’t eaten all day because her physician told her she is supposed to be fasting. She has to pay for parking at the lot for the laboratory since it is connected to the medical center.
Was this lipid panel high value?
When and how often should we be checking lipid panels?
Do patients need to fast for these tests?
The potential benefits and costs of routine lipid panel screening
Hyperlipidemia is relatively prevalent, usually asymptomatic, and has been linked to cardiovascular outcomes. Thus, screening for lipid abnormalities is recommended to identify patients that would benefit from various interventions aimed at reducing cardiovascular disease risk, including lipid-lowering therapy.1 High levels of LDL cholesterol and low levels of HDL cholesterol are important risk factors for coronary heart disease.
Lipid panels are widely available blood tests with modest monetary costs, generally ranging from about $10 to $100 in the outpatient setting. Of note, a 2014 study examining inpatient charges for this common laboratory test found that hospital charges in California ranged from about $10 to $10,000 for a lipid panel.2 Despite the relatively low cost of each individual lipid panel, the aggregate costs to the health system of these frequently and widely performed tests are large. In fact, low-cost, high-volume health services, such as repeat cholesterol testing, account for the majority of unnecessary health spending in the United States, contributing nearly twice as much unnecessary cost as high-priced low-value services.3
To the patient, the cost is not only monetary. Some patients will need to take an additional hour or two off work as well as consider childcare, transportation, parking, and other mundane logistics to sit in a laboratory waiting room—a cost that may not be considered modest at all by the patient.4,5
Therefore, like most services in health care, the answer to whether or not a lipid panel is high-value care is: it depends.5 In the correct circumstances, the test generally is regarded as high value due to well-documented potential benefits and low monetary costs. However, when performed unnecessarily—either in patient groups that are unlikely to benefit or at intervals that are too soon to add helpful information—then all that is left are the financial and psychosocial costs, which make this a low-value test in these scenarios. For this patient, this test contributed to inconvenience and mild hardships with essentially no benefit, thus would be considered low-value care.
Continue to: When should we perform lipid screening in low-risk women?
When should we perform lipid screening in low-risk women?
There are conflicting guidelines and opinions about at what age lipid screening should be routinely performed in adults. The United States Preventive Services Task Force (USPSTF) 2016 guidelines found “insufficient evidence that screening for dyslipidemia before age 40 years has an effect on either short- or longer-term cardiovascular outcomes.”6 Therefore, the USPSTF “recommends neither for nor against screening for dyslipidemia in this age group,” and instead encourages “clinicians to use their clinical judgment for [these] patients.”6
A common practice is to obtain a baseline lipid profile at the time of initiation of care with an adult primary care practitioner, if the patient was not previously screened, and to then determine subsequent testing based on these results and the patient’s risk factors for cardiovascular disease. For patients with normal lipid screening results and lower cardiovascular risk factors (no hypertension, diabetes mellitus, cigarette smoking, family history of premature coronary heart disease), experts suggest follow-up lipid screening be performed in men at age 35 and in women at age 45.7 Therefore, for this patient who had essentially a normal lipid panel a year prior, she should not have required repeat lipid testing until she is age 45.
As for how frequently subsequent lipid testing should be performed, the Centers for Disease Control and Prevention states, “most healthy adults should have their cholesterol checked every 4 to 6 years.”8 Those taking lipid-lowering medications or those with risk factors such as heart disease, diabetes, or concerning family history should have their cholesterol checked more frequently. If patients are near a threshold for treatment, some experts suggest repeating measurements every 3 years, but even in these settings, annual testing would be considered excessive.7
A standard lipid panel screen includes total cholesterol, LDL, HDL, and triglycerides. While a variety of assays have been developed that subfractionate lipoprotein particles based on size, density, or charge, these tests do not add value for low-risk patient screening and should only be used on an individualized basis for selected intermediate to high-risk patients. The American Society for Clinical Pathology released a Choosing Wisely recommendation that advises, “Do not routinely order expanded lipid panels (particle sizing, nuclear magnetic resonance) as screening tests for cardiovascular disease.”9
Do lipid panels need to be fasting?
For adults who are not taking lipid-lowering therapy, measurement of either a fasting or a nonfasting plasma lipid profile is effective for documenting baseline LDL and estimating cardiovascular risk.1 In other words, nonfasting lipid testing is appropriate for most low-risk screening. Nonfasting testing generally is more convenient for patients; however, nonfasting lipid panels could result in elevated triglyceride levels. If an initial nonfasting lipid profile reveals a triglyceride level of 400 mg/dL or higher, then a repeat lipid profile in the fasting state should be performed for assessment of fasting triglyceride levels and baseline LDL.1 Some patients may prefer to simply get a fasting lipid panel initially so that they do not run the risk of having to return for a second test, especially if they are at increased risk for high triglyceride levels (ie, if they are obese, have diabetes, or are taking medications such as steroids, which can increase triglyceride levels).
The bottom line
Some patients receive primary care directly from their gynecologist, and thus it is important for women’s health clinicians to be aware of appropriate cholesterol screening practices. While lipid panels may commonly be ordered routinely as part of annual health check-ups, the evidence suggests that this is an unnecessary practice that contributes to wasteful health spending at both individual and system levels; it also is an avoidable inconvenience for patients. It is unclear when lipid screening should be initiated for adult patients, but it seems reasonable to check baseline levels for a new patient who has not previously been screened. In low-risk patients with normal lipid panel levels, experts recommend initiating retesting at age 45 for women and obtaining repeat lipid levels no more than every 4 to 6 years. For most patients, nonfasting lipid levels will suffice for screening. Avoiding common unnecessary testing is an effective way to improve value for patients. ●
- Grundy SM, Stone NJ, Bailey AL, et al. 2018 AHA/ACC/AACVPR/AAPA/ABC/ACPM/ADA/AGS/APhA/ASPC/NLA/PCNA guideline on the management of blood cholesterol: executive summary: a report of the American College of Cardiology/American Heart Association Task Force on Clinical Practice Guidelines. J Am Coll Cardiol. 2019;73:3168-3209.
- Hsia RY, Akosa Antwi Y, Nath JB, et al. Variation in charges for 10 common blood tests in California hospitals: a cross-sectional analysis. BMJ Open. 2014;4:E005482.
- Mafi JN, Russell K, Bortz BA, et al. Low-cost, high-volume health services contribute the most to unnecessary health spending. Health Aff. 2017;36:1701-1704.
- Covinsky KE. The problem of overuse. JAMA Intern Med. 2013;173:1446.
- Moriates C, Arora V, Shah N. Understanding Value-Based Healthcare. McGraw-Hill; 2015.
- Chou R, Dana T, Blazina I, et al. Statins for prevention of cardiovascular disease in adults: evidence report and systematic review for the US Preventive Services Task Force. JAMA. 2016;316:2008.
- Vijan S. Screening for lipid disorders in adults. UpToDate website. Updated February 28, 2020. Accessed April 9, 2021. https://www.uptodate.com/contents/screening-for-lipid-disorders-in-adults
- Getting your cholesterol checked. Centers for Disease Control and Prevention. Published September 8, 2020. Accessed April 9, 2021. https://www.cdc.gov/cholesterol/cholesterol_screening.htm
- American Society for Clinical Pathology. Choosing Wisely website. Published September 14, 2016. Accessed April 9, 2021. https://www.choosingwisely.org/clinician-lists/american-society-clinical-pathology-expanded-lipid-panels-to-screen-for-cardiovascular-disease
Are pregnant and lactating women and their infants protected with the COVID-19 mRNA vaccines?
Gray KJ, Bordt EA, Atyeo C, et al. COVID-19 vaccine response in pregnant and lactating women: a cohort study. Am J Obstet Gynecol. 2021;S0002-9378(21)00187-3. doi: 10.1016/j.ajog.2021.03.023
EXPERT COMMENTARY
Pregnant women are among those at highest risk for severe disease and death from SARS-CoV-2 infection. However, exclusion of pregnant and lactating women from the initial COVID-19 vaccine trials has made counseling these patients challenging due to both the novelty of the vaccines themselves and the general lack of data in this vulnerable population. Data for the efficacy and risks of vaccination are needed to inform shared decision making between clinician and patient.
Details of the study
Gray and colleagues conducted a prospective cohort study of 84 pregnant, 31 lactating, and 16 nonpregnant women who received 1 of the 2 COVID-19 mRNA vaccines approved by the US Food and Drug Administration for emergency use authorization (BNT162b2 Pfizer/BioNTech or mRNA-1273 Moderna). The study’s primary objective was to evaluate the humoral immune response (antibody quantification) and adverse effects of these vaccines in the pregnant and lactating women compared with both nonpregnant women and a cohort of 37 women who had natural COVID-19 infection during pregnancy.
Antibody quantification from blood and breast milk was performed at 4 time points: V0, the first vaccine dose; V1, the second vaccine dose; V2, 2 to 6 weeks after the second vaccine dose; and at delivery. Umbilical cord blood also was collected from the subset of delivered patients (n = 13).
Results. The ultimately IgG-dominated antibody response to the vaccine in pregnant and lactating women was comparable to that in nonpregnant women, and all vaccine antibody responses were significantly higher than that in response to natural SARS-CoV-2 infection. IgG antibodies also were found in umbilical cord blood and breast milk, supporting the transfer of immunity to both the fetus and infant. There were no significant differences in adverse effects between pregnant and nonpregnant women.
Study strengths and limitations
This study’s main strength is that it demonstrated a similar increase in humoral immune response to the COVID-19 mRNA vaccines in a previously unstudied population of pregnant and lactating women, supporting the potential efficacy of the vaccines in this group at high risk for complications from SARS-CoV-2. Other data to support this include the increased vaccine antibody response compared with the antibody response after SARS-CoV-2 infection in pregnant women as well as the presence of maternal-infant transfer of antibodies via cord blood and breast milk. All of these are important data to inform patients and practitioners who are trying to make shared, informed decisions about a novel vaccine during a global pandemic.
The main limitation of this study is a limited patient population of mostly White, non-Hispanic, health care workers with few comorbidities and only 13 delivered vaccinated patients within the study period. Long-term immunity, immune responses other than antibody titers, and potential fetal effects also were not explored in this study. ●
The study by Gray and colleagues provides some of the first data supporting the potential efficacy of the novel mRNA vaccines in pregnant and lactating women, as the antibody-mediated response is similar in this population to that in the nonpregnant population. Moreover, it provides reassurance that the antibodies are getting to the fetus and the infant via the umbilical cord blood and breast milk and that the adverse effect profile is similar. Clinicians can use these data to help their patients make more informed decisions about COVID-19 vaccination. Future studies still are needed for long-term data on immunity and safety for the fetus.
JAIMEY M. PAULI, MD

Obstetric anal sphincter injury: Prevention and repair
The rate of obstetric anal sphincter injury (OASIS) is approximately 4.4% of vaginal deliveries, with 3.3% 3rd-degree tears and 1.1% 4th-degree tears.1 In the United States in 2019 there were 3,745,540 births—a 31.7% rate of cesarean delivery (CD) and a 68.3% rate of vaginal delivery—resulting in approximately 112,600 births with OASIS.2 A meta-analysis reported that, among 716,031 vaginal births, the risk factors for OASIS included: forceps delivery (relative risk [RR], 3.15), midline episiotomy (RR, 2.88), occiput posterior fetal position (RR, 2.73), vacuum delivery (RR, 2.60), Asian race (RR, 1.87), primiparity (RR, 1.59), mediolateral episiotomy (RR, 1.55), augmentation of labor (RR, 1.46), and epidural anesthesia (RR, 1.21).3 OASIS is associated with an increased risk for developing postpartum perineal pain, anal incontinence, dyspareunia, and wound breakdown.4 Complications following OASIS repair can trigger many follow-up appointments to assess wound healing and provide physical therapy.
This editorial review focuses on evolving recommendations for preventing and repairing OASIS.
The optimal cutting angle for a mediolateral episiotomy is 60 degrees from the midline
For spontaneous vaginal delivery, a policy of restricted episiotomy reduces the risk of OASIS by approximately 30%.5 With an operative vaginal delivery, especially forceps delivery of a large fetus in the occiput posterior position, a mediolateral episiotomy may help to reduce the risk of OASIS, although there are minimal data from clinical trials to support this practice. In one clinical trial, 407 women were randomly assigned to either a mediolateral or midline episiotomy.6 Approximately 25% of the births in both groups were operative deliveries. The mediolateral episiotomy began in the posterior midline of the vaginal introitus and was carried to the right side of the anal sphincter for 3 cm to 4 cm. The midline episiotomy began in the posterior midline of the vagina and was carried 2 cm to 3 cm into the midline perineal tissue. In the women having a midline or mediolateral episiotomy, a 4th-degree tear occurred in 5.5% and 0.4% of births, respectively. For the midline or mediolateral episiotomy, a third-degree tear occurred in 18.4% and 8.6%, respectively. In a prospective cohort study of 1,302 women with an episiotomy and vaginal birth, the rate of OASIS associated with midline or mediolateral episiotomy was 14.8% and 7%, respectively (P<.05).7 In this study, the operative vaginal delivery rate was 11.6% and 15.2% for the women in the midline and mediolateral groups, respectively.
The angle of the mediolateral episiotomy may influence the rate of OASIS and persistent postpartum perineal pain. In one study, 330 nulliparous women who were assessed to need a mediolateral episiotomy at delivery were randomized to an incision with a 40- or 60-degree angle from the midline.8 Prior to incision, a line was drawn on the skin to mark the course of the incision and then infiltrated with 10 mL of lignocaine. The fetal head was delivered with a Ritgen maneuver. The length of the episiotomy averaged 4 cm in both groups. After delivery, the angle of the episiotomy incision was reassessed. The episiotomy incision cut 60 degrees from the midline was measured on average to be 44 degrees from the midline after delivery of the newborn. Similarly, the incision cut at a 40-degree angle was measured to be 24 degrees from the midline after delivery. The rates of OASIS in the women who had a 40- and 60-degree angle incision were 5.5% and 2.4%, respectively (P = .16).
Continue to: Use a prophylactic antibiotic with extended coverage for anaerobes prior to or during your anal sphincter repair...
Use a prophylactic antibiotic with extended coverage for anaerobes prior to or during your anal sphincter repair
Many experts recommend one dose of a prophylactic antibiotic prior to, or during, OASIS repair in order to reduce the risk of wound complications. In a trial 147 women with OASIS were randomly assigned to receive one dose of a second-generation cephalosporin (cefotetan or cefoxitin) with extended anaerobic coverage or a placebo just before repair of the laceration.9 At 2 weeks postpartum, perineal wound complications were significantly lower in women receiving one dose of prophylactic antibiotic with extended anaerobe coverage compared with placebo—8.2% and 24.1%, respectively (P = .037). Additionally, at 2 weeks postpartum, purulent wound discharge was significantly lower in women receiving antibiotic versus placebo, 4% and 17%, respectively (P = .036). Experts writing for the Society of Obstetricians and Gynaecologists of Canada also recommend one dose of cefotetan or cefoxitin.10 Extended anaerobic coverage also can be achieved by administering a single dose of BOTH cefazolin 2 g by intravenous (IV) infusion PLUS metronidazole 500 mg by IV infusion or oral medication.11 For women with severe penicillin allergy, a recommended regimen is gentamicin 5 mg/kg plus clindamycin 900 mg by IV infusion.11 There is evidence that for colorectal or hysterectomy surgery, expanding prophylactic antibiotic coverage of anaerobes with cefazolin PLUS metronidazole significantly reduces postoperative surgical site infection.12,13 Following an OASIS repair, wound breakdown is a catastrophic problem that may take many months to resolve. Administration of a prophylactic antibiotic with extended coverage of anaerobes may help to prevent wound breakdown.
Prioritize identifying and separately repairing the internal anal sphincter
The internal anal sphincter is a smooth muscle that runs along the outside of the rectal wall and thickens into a sphincter toward the anal canal. The internal anal sphincter is thin and grey-white in appearance, like a veil. By contrast, the external anal sphincter is a thick band of red striated muscle tissue. In one study of 3,333 primiparous women with OASIS, an internal anal sphincter injury was detected in 33% of cases.14 In this large cohort, the rate of internal anal sphincter injury with a 3A tear, a 3B tear, a complete tear of the external sphincter and a 4th-degree perineal tear was 22%, 23%, 42%, and 71%, respectively. The internal anal sphincter is important for maintaining rectal continence and is estimated to contribute 50% to 85% of resting anal tone.15 If injury to the internal anal sphincter is detected at a birth with an OASIS, it is important to separately repair the internal anal sphincter to reduce the risk of postpartum rectal incontinence.16
Polyglactin 910 vs Polydioxanone (PDS) Suture—Is PDS the winner?
Polyglactin 910 (Vicryl) is a braided suture that is absorbed within 56 to 70 days. Polydioxanone suture is a long-lasting monofilament suture that is absorbed within 200 days. Many colorectal surgeons and urogynecologists prefer PDS suture for the repair of both the internal and external anal sphincters.16 Authors of one randomized trial of OASIS repair with Vicryl or PDS suture did not report significant differences in most clinical outcomes.17 However, in this study, anal endosonographic imaging of the internal and external anal sphincter demonstrated more internal sphincter defects but not external sphincter defects when the repair was performed with Vicryl rather than PDS. The investigators concluded that comprehensive training of the surgeon, not choice of suture, is probably the most important factor in achieving a good OASIS repair. However, because many subspecialists favor PDS suture for sphincter repair, specialists in obstetrics and gynecology should consider this option.
Continue to: Can your patient access early secondary repair if they develop a perineal laceration wound breakdown?
Can your patient access early secondary repair if they develop a perineal laceration wound breakdown?
The breakdown of an OASIS repair is an obstetric catastrophe with complications that can last many months and sometimes stretch into years. The best approach to a perineal laceration wound breakdown remains controversial. It is optimal if all patients with a wound breakdown can be offered an early secondary repair or healing by secondary intention, permitting the patient to select the best approach for their specific situation.
As noted by the pioneers of early repair of episiotomy dehiscence, Drs. Hankins, Haugh, Gilstrap, Ramin, and others,18-20 conventional doctrine is that an episiotomy repair dehiscence should be managed expectantly, allowing healing by secondary intention and delaying repair of the sphincters for a minimum of 3 to 4 months.21 However, many small case-series report that early secondary repair of a perineal laceration wound breakdown is possible following multiple days of wound preparation prior to the repair, good surgical technique and diligent postoperative follow-up care. One large case series reported on 72 women with complete perineal wound dehiscence who had early secondary repair.22 The median time to complete wound healing following early repair was 28 days. About 36% of the patients had one or more complications, including skin dehiscence, granuloma formation, perineal pain, and sinus formation. A pilot randomized trial reported that, compared with expectant management of a wound breakdown, early repair resulted in a shorter time to wound healing.23
Early repair of perineal wound dehiscence often involves a course of care that extends over multiple weeks. As an example, following a vaginal birth with OASIS and immediate repair, the patient is often discharged from the hospital to home on postpartum day 3. The wound breakdown often is detected between postpartum days 6 to 10. If early secondary repair is selected as the best treatment, 1 to 6 days of daily debridement of the wound is needed to prepare the wound for early secondary repair. The daily debridement required to prepare the wound for early repair is often performed in the hospital, potentially disrupting early mother-newborn bonding. Following the repair, the patient is observed in the hospital for 1 to 3 days and then discharged home with daily wound care and multiple follow-up visits to monitor wound healing. Pelvic floor physical therapy may be initiated when the wound is healed. The prolonged process required for early secondary repair may be best undertaken by a subspecialty practice.24
The surgical repair and postpartum care of OASIS continues to evolve. In your practice you should consider:
- performing a mediolateral episiotomy at a 60-degree angle to reduce the risk of OASIS in situations where there is a high risk of anal sphincter injury, such as in forceps delivery
- using one dose of a prophylactic antibiotic with extended anaerobic coverage, such as cefotetan or cefoxitin
- focus on identifying and separately repairing an internal anal sphincter injury
- using a long-lasting absorbable suture, such as PDS, to repair the internal and external anal sphincters
- ensuring that the patient with a dehiscence following an episiotomy or anal sphincter injury has access to early secondary repair. Standardizing your approach to the prevention and repair of anal sphincter injury will benefit the approximately 112,600 US women who experience OASIS each year. ●
A Cochrane Database Systematic Review reported that moderate-quality evidence showed a decrease in OASIS with the use of intrapartum warm compresses to the perineum and perineal massage.1 Compared with control, intrapartum warm compresses to the perineum did not result in a reduction in first- or second-degree tears, suturing of perineal tears, or use of episiotomy. However, compared with control, intrapartum warm compresses to the perineum was associated with a reduction in OASIS (relative risk [RR], 0.46; 95% confidence interval [CI], 0.27–0.79; 1,799 women; 4 studies; moderate quality evidence; substantial heterogeneity among studies). In addition to a possible reduction in OASIS, warm compresses also may provide the laboring woman, especially those having a natural childbirth, a positive sensory experience and reinforce her perception of the thoughtfulness and caring of her clinicians.
Compared with control, perineal massage was associated with an increase in the rate of an intact perineum (RR, 1.74; 95% CI, 1.11–2.73; 6 studies; 2,618 women; low-quality evidence; substantial heterogeneity among studies) and a decrease in OASIS (RR, 0.49; 95% CI, 0.25–0.94; 5 studies; 2,477 women; moderate quality evidence). Compared with control, perineal massage did not significantly reduce first- or second-degree tears, perineal tears requiring suturing, or the use of episiotomy (very low-quality evidence). Although perineal massage may have benefit, excessive perineal massage likely can contribute to tissue edema and epithelial trauma.
Reference
1. Aasheim V, Nilsen ABC, Reinar LM, et al. Perineal techniques during the second stage of labour for reducing perineal trauma. Cochrane Database Syst Rev. 2017;CD006672.
- Friedman AM, Ananth CV, Prendergast E, et al. Evaluation of third-degree and fourth-degree laceration rates as quality indicators. Obstet Gynecol. 2015;125:927-937.
- Hamilton BE, Martin JA, Osterman MK. Births: Provisional data for 2019. Vital Statistics Rapid Release; No. 8. Hyattsville MD: National Center for Health Statistics; May 2020. https://www.cdc.gov/nchs/data/vsrr/vsrr-8-508.pdf
- Pergialitotis V, Bellos I, Fanaki M, et al. Risk factors for severe perineal trauma during childbirth: an updated meta-analysis. European J Obstet Gynecol Repro Biol. 2020;247:94-100.
- Sultan AH, Kettle C. Diagnosis of perineal trauma. In: Sultan AH, Thakar R, Fenner DE, eds. Perineal and anal sphincter trauma. 1st ed. London, England: Springer-Verlag; 2009:33-51.
- Jiang H, Qian X, Carroli G, et al. Selective versus routine use of episiotomy for vaginal birth. Cochrane Database Syst Rev. 2017;CD000081.
- Coats PM, Chan KK, Wilkins M, et al. A comparison between midline and mediolateral episiotomies. Br J Obstet Gynaecol. 1980;87:408-412.
- Sooklim R, Thinkhamrop J, Lumbiganon P, et al. The outcomes of midline versus medio-lateral episiotomy. Reprod Health. 2007;4:10.
- El-Din AS, Kamal MM, Amin MA. Comparison between two incision angles of mediolateral episiotomy in primiparous women: a randomized controlled trial. J Obstet Gynaecol Res. 2014;40:1877-1882.
- Duggal N, Mercado C, Daniels K, et al. Antibiotic prophylaxis for prevention of postpartum perineal wound complications: a randomized controlled trial. Obstet Gynecol. 2008;111:1268-1273.
- Harvey MA, Pierce M. Obstetrical anal sphincter injuries (OASIS): prevention, recognition and repair. J Obstet Gynecol Can. 2015;37:1131-1148.
- Cox CK, Bugosh MD, Fenner DE, et al. Antibiotic use during repair of obstetrical anal sphincter injury: a qualitative improvement initiative. Int J Gynaecol Obstet. 2021; Epub January 28.
- Deierhoi RJ, Dawes LG, Vick C, et al. Choice of intravenous antibiotic prophylaxis for colorectal surgery does matter. J Am Coll Surg. 2013;217:763-769.
- Till Sr, Morgan DM, Bazzi AA, et al. Reducing surgical site infections after hysterectomy: metronidazole plus cefazolin compared with cephalosporin alone. Am J Obstet Gynecol. 2017;217:187.e1-e11.
- Pihl S, Blomberg M, Uustal E. Internal anal sphincter injury in the immediate postpartum period: prevalence, risk factors and diagnostic methods in the Swedish perineal laceration registry. European J Obst Gynecol Repro Biol. 2020;245:1-6.
- Fornell EU, Matthiesen L, Sjodahl R, et al. Obstetric anal sphincter injury ten years after: subjective and objective long-term effects. BJOG. 2005;112:312-316.
- Sultan AH, Monga AK, Kumar D, et al. Primary repair of obstetric anal sphincter rupture using the overlap technique. Br J Obstet Gynaecol. 1999;106:318-323.
- Williams A, Adams EJ, Tincello DG, et al. How to repair an anal sphincter injury after vaginal delivery: results of a randomised controlled trial. BJOG. 2006;113:201-207.
- Hauth JC, Gilstrap LC, Ward SC, et al. Early repair of an external sphincter ani muscle and rectal mucosal dehiscence. Obstet Gynecol. 1986;67:806-809.
- Hankins GD, Hauth JC, Gilstrap LC, et al. Early repair of episiotomy dehiscence. Obstet Gynecol. 1990;75:48-51.
- Ramin SR, Ramus RM, Little BB, et al. Early repair of episiotomy dehiscence associated with infection. Am J Obstet Gynecol. 1992;167:1104-1107.
- Pritchard JA, MacDonald PC, Gant NF. Williams Obstetrics, 17th ed. Norwalk Connecticut: Appleton-Century-Crofts; 1985:349-350.
- Okeahialam NA, Thakar R, Kleprlikova H, et al. Early re-suturing of dehisced obstetric perineal woulds: a 13-year experience. Eur J Obstet Gynecol Repro Biol. 2020;254:69-73.
- Dudley L, Kettle C, Thomas PW, et al. Perineal resuturing versus expectant management following vaginal delivery complicated by a dehisced wound (PREVIEW): a pilot and feasibility randomised controlled trial. BMJ Open. 2017;7:e012766.
- Lewicky-Gaupp C, Leader-Cramer A, Johnson LL, et al. Wound complications after obstetrical anal sphincter injuries. Obstet Gynecol. 2015;125:1088-1093.

Robert L. Barbieri, MD
Chair Emeritus, Department of Obstetrics and Gynecology
Interim Chief, Obstetrics
Brigham and Women’s Hospital
Kate Macy Ladd Distinguished Professor of Obstetrics,
Gynecology and Reproductive Biology
Harvard Medical School
Boston, Massachusetts
Dr. Barbieri reports no financial relationships relevant to this article.
The rate of obstetric anal sphincter injury (OASIS) is approximately 4.4% of vaginal deliveries, with 3.3% 3rd-degree tears and 1.1% 4th-degree tears.1 In the United States in 2019 there were 3,745,540 births—a 31.7% rate of cesarean delivery (CD) and a 68.3% rate of vaginal delivery—resulting in approximately 112,600 births with OASIS.2 A meta-analysis reported that, among 716,031 vaginal births, the risk factors for OASIS included: forceps delivery (relative risk [RR], 3.15), midline episiotomy (RR, 2.88), occiput posterior fetal position (RR, 2.73), vacuum delivery (RR, 2.60), Asian race (RR, 1.87), primiparity (RR, 1.59), mediolateral episiotomy (RR, 1.55), augmentation of labor (RR, 1.46), and epidural anesthesia (RR, 1.21).3 OASIS is associated with an increased risk for developing postpartum perineal pain, anal incontinence, dyspareunia, and wound breakdown.4 Complications following OASIS repair can trigger many follow-up appointments to assess wound healing and provide physical therapy.
This editorial review focuses on evolving recommendations for preventing and repairing OASIS.
The optimal cutting angle for a mediolateral episiotomy is 60 degrees from the midline
For spontaneous vaginal delivery, a policy of restricted episiotomy reduces the risk of OASIS by approximately 30%.5 With an operative vaginal delivery, especially forceps delivery of a large fetus in the occiput posterior position, a mediolateral episiotomy may help to reduce the risk of OASIS, although there are minimal data from clinical trials to support this practice. In one clinical trial, 407 women were randomly assigned to either a mediolateral or midline episiotomy.6 Approximately 25% of the births in both groups were operative deliveries. The mediolateral episiotomy began in the posterior midline of the vaginal introitus and was carried to the right side of the anal sphincter for 3 cm to 4 cm. The midline episiotomy began in the posterior midline of the vagina and was carried 2 cm to 3 cm into the midline perineal tissue. In the women having a midline or mediolateral episiotomy, a 4th-degree tear occurred in 5.5% and 0.4% of births, respectively. For the midline or mediolateral episiotomy, a third-degree tear occurred in 18.4% and 8.6%, respectively. In a prospective cohort study of 1,302 women with an episiotomy and vaginal birth, the rate of OASIS associated with midline or mediolateral episiotomy was 14.8% and 7%, respectively (P<.05).7 In this study, the operative vaginal delivery rate was 11.6% and 15.2% for the women in the midline and mediolateral groups, respectively.
The angle of the mediolateral episiotomy may influence the rate of OASIS and persistent postpartum perineal pain. In one study, 330 nulliparous women who were assessed to need a mediolateral episiotomy at delivery were randomized to an incision with a 40- or 60-degree angle from the midline.8 Prior to incision, a line was drawn on the skin to mark the course of the incision and then infiltrated with 10 mL of lignocaine. The fetal head was delivered with a Ritgen maneuver. The length of the episiotomy averaged 4 cm in both groups. After delivery, the angle of the episiotomy incision was reassessed. The episiotomy incision cut 60 degrees from the midline was measured on average to be 44 degrees from the midline after delivery of the newborn. Similarly, the incision cut at a 40-degree angle was measured to be 24 degrees from the midline after delivery. The rates of OASIS in the women who had a 40- and 60-degree angle incision were 5.5% and 2.4%, respectively (P = .16).
Continue to: Use a prophylactic antibiotic with extended coverage for anaerobes prior to or during your anal sphincter repair...
Use a prophylactic antibiotic with extended coverage for anaerobes prior to or during your anal sphincter repair
Many experts recommend one dose of a prophylactic antibiotic prior to, or during, OASIS repair in order to reduce the risk of wound complications. In a trial 147 women with OASIS were randomly assigned to receive one dose of a second-generation cephalosporin (cefotetan or cefoxitin) with extended anaerobic coverage or a placebo just before repair of the laceration.9 At 2 weeks postpartum, perineal wound complications were significantly lower in women receiving one dose of prophylactic antibiotic with extended anaerobe coverage compared with placebo—8.2% and 24.1%, respectively (P = .037). Additionally, at 2 weeks postpartum, purulent wound discharge was significantly lower in women receiving antibiotic versus placebo, 4% and 17%, respectively (P = .036). Experts writing for the Society of Obstetricians and Gynaecologists of Canada also recommend one dose of cefotetan or cefoxitin.10 Extended anaerobic coverage also can be achieved by administering a single dose of BOTH cefazolin 2 g by intravenous (IV) infusion PLUS metronidazole 500 mg by IV infusion or oral medication.11 For women with severe penicillin allergy, a recommended regimen is gentamicin 5 mg/kg plus clindamycin 900 mg by IV infusion.11 There is evidence that for colorectal or hysterectomy surgery, expanding prophylactic antibiotic coverage of anaerobes with cefazolin PLUS metronidazole significantly reduces postoperative surgical site infection.12,13 Following an OASIS repair, wound breakdown is a catastrophic problem that may take many months to resolve. Administration of a prophylactic antibiotic with extended coverage of anaerobes may help to prevent wound breakdown.
Prioritize identifying and separately repairing the internal anal sphincter
The internal anal sphincter is a smooth muscle that runs along the outside of the rectal wall and thickens into a sphincter toward the anal canal. The internal anal sphincter is thin and grey-white in appearance, like a veil. By contrast, the external anal sphincter is a thick band of red striated muscle tissue. In one study of 3,333 primiparous women with OASIS, an internal anal sphincter injury was detected in 33% of cases.14 In this large cohort, the rate of internal anal sphincter injury with a 3A tear, a 3B tear, a complete tear of the external sphincter and a 4th-degree perineal tear was 22%, 23%, 42%, and 71%, respectively. The internal anal sphincter is important for maintaining rectal continence and is estimated to contribute 50% to 85% of resting anal tone.15 If injury to the internal anal sphincter is detected at a birth with an OASIS, it is important to separately repair the internal anal sphincter to reduce the risk of postpartum rectal incontinence.16
Polyglactin 910 vs Polydioxanone (PDS) Suture—Is PDS the winner?
Polyglactin 910 (Vicryl) is a braided suture that is absorbed within 56 to 70 days. Polydioxanone suture is a long-lasting monofilament suture that is absorbed within 200 days. Many colorectal surgeons and urogynecologists prefer PDS suture for the repair of both the internal and external anal sphincters.16 Authors of one randomized trial of OASIS repair with Vicryl or PDS suture did not report significant differences in most clinical outcomes.17 However, in this study, anal endosonographic imaging of the internal and external anal sphincter demonstrated more internal sphincter defects but not external sphincter defects when the repair was performed with Vicryl rather than PDS. The investigators concluded that comprehensive training of the surgeon, not choice of suture, is probably the most important factor in achieving a good OASIS repair. However, because many subspecialists favor PDS suture for sphincter repair, specialists in obstetrics and gynecology should consider this option.
Continue to: Can your patient access early secondary repair if they develop a perineal laceration wound breakdown?
Can your patient access early secondary repair if they develop a perineal laceration wound breakdown?
The breakdown of an OASIS repair is an obstetric catastrophe with complications that can last many months and sometimes stretch into years. The best approach to a perineal laceration wound breakdown remains controversial. It is optimal if all patients with a wound breakdown can be offered an early secondary repair or healing by secondary intention, permitting the patient to select the best approach for their specific situation.
As noted by the pioneers of early repair of episiotomy dehiscence, Drs. Hankins, Haugh, Gilstrap, Ramin, and others,18-20 conventional doctrine is that an episiotomy repair dehiscence should be managed expectantly, allowing healing by secondary intention and delaying repair of the sphincters for a minimum of 3 to 4 months.21 However, many small case-series report that early secondary repair of a perineal laceration wound breakdown is possible following multiple days of wound preparation prior to the repair, good surgical technique and diligent postoperative follow-up care. One large case series reported on 72 women with complete perineal wound dehiscence who had early secondary repair.22 The median time to complete wound healing following early repair was 28 days. About 36% of the patients had one or more complications, including skin dehiscence, granuloma formation, perineal pain, and sinus formation. A pilot randomized trial reported that, compared with expectant management of a wound breakdown, early repair resulted in a shorter time to wound healing.23
Early repair of perineal wound dehiscence often involves a course of care that extends over multiple weeks. As an example, following a vaginal birth with OASIS and immediate repair, the patient is often discharged from the hospital to home on postpartum day 3. The wound breakdown often is detected between postpartum days 6 to 10. If early secondary repair is selected as the best treatment, 1 to 6 days of daily debridement of the wound is needed to prepare the wound for early secondary repair. The daily debridement required to prepare the wound for early repair is often performed in the hospital, potentially disrupting early mother-newborn bonding. Following the repair, the patient is observed in the hospital for 1 to 3 days and then discharged home with daily wound care and multiple follow-up visits to monitor wound healing. Pelvic floor physical therapy may be initiated when the wound is healed. The prolonged process required for early secondary repair may be best undertaken by a subspecialty practice.24
The surgical repair and postpartum care of OASIS continues to evolve. In your practice you should consider:
- performing a mediolateral episiotomy at a 60-degree angle to reduce the risk of OASIS in situations where there is a high risk of anal sphincter injury, such as in forceps delivery
- using one dose of a prophylactic antibiotic with extended anaerobic coverage, such as cefotetan or cefoxitin
- focus on identifying and separately repairing an internal anal sphincter injury
- using a long-lasting absorbable suture, such as PDS, to repair the internal and external anal sphincters
- ensuring that the patient with a dehiscence following an episiotomy or anal sphincter injury has access to early secondary repair. Standardizing your approach to the prevention and repair of anal sphincter injury will benefit the approximately 112,600 US women who experience OASIS each year. ●
A Cochrane Database Systematic Review reported that moderate-quality evidence showed a decrease in OASIS with the use of intrapartum warm compresses to the perineum and perineal massage.1 Compared with control, intrapartum warm compresses to the perineum did not result in a reduction in first- or second-degree tears, suturing of perineal tears, or use of episiotomy. However, compared with control, intrapartum warm compresses to the perineum was associated with a reduction in OASIS (relative risk [RR], 0.46; 95% confidence interval [CI], 0.27–0.79; 1,799 women; 4 studies; moderate quality evidence; substantial heterogeneity among studies). In addition to a possible reduction in OASIS, warm compresses also may provide the laboring woman, especially those having a natural childbirth, a positive sensory experience and reinforce her perception of the thoughtfulness and caring of her clinicians.
Compared with control, perineal massage was associated with an increase in the rate of an intact perineum (RR, 1.74; 95% CI, 1.11–2.73; 6 studies; 2,618 women; low-quality evidence; substantial heterogeneity among studies) and a decrease in OASIS (RR, 0.49; 95% CI, 0.25–0.94; 5 studies; 2,477 women; moderate quality evidence). Compared with control, perineal massage did not significantly reduce first- or second-degree tears, perineal tears requiring suturing, or the use of episiotomy (very low-quality evidence). Although perineal massage may have benefit, excessive perineal massage likely can contribute to tissue edema and epithelial trauma.
Reference
1. Aasheim V, Nilsen ABC, Reinar LM, et al. Perineal techniques during the second stage of labour for reducing perineal trauma. Cochrane Database Syst Rev. 2017;CD006672.
- Friedman AM, Ananth CV, Prendergast E, et al. Evaluation of third-degree and fourth-degree laceration rates as quality indicators. Obstet Gynecol. 2015;125:927-937.
- Hamilton BE, Martin JA, Osterman MK. Births: Provisional data for 2019. Vital Statistics Rapid Release; No. 8. Hyattsville MD: National Center for Health Statistics; May 2020. https://www.cdc.gov/nchs/data/vsrr/vsrr-8-508.pdf
- Pergialitotis V, Bellos I, Fanaki M, et al. Risk factors for severe perineal trauma during childbirth: an updated meta-analysis. European J Obstet Gynecol Repro Biol. 2020;247:94-100.
- Sultan AH, Kettle C. Diagnosis of perineal trauma. In: Sultan AH, Thakar R, Fenner DE, eds. Perineal and anal sphincter trauma. 1st ed. London, England: Springer-Verlag; 2009:33-51.
- Jiang H, Qian X, Carroli G, et al. Selective versus routine use of episiotomy for vaginal birth. Cochrane Database Syst Rev. 2017;CD000081.
- Coats PM, Chan KK, Wilkins M, et al. A comparison between midline and mediolateral episiotomies. Br J Obstet Gynaecol. 1980;87:408-412.
- Sooklim R, Thinkhamrop J, Lumbiganon P, et al. The outcomes of midline versus medio-lateral episiotomy. Reprod Health. 2007;4:10.
- El-Din AS, Kamal MM, Amin MA. Comparison between two incision angles of mediolateral episiotomy in primiparous women: a randomized controlled trial. J Obstet Gynaecol Res. 2014;40:1877-1882.
- Duggal N, Mercado C, Daniels K, et al. Antibiotic prophylaxis for prevention of postpartum perineal wound complications: a randomized controlled trial. Obstet Gynecol. 2008;111:1268-1273.
- Harvey MA, Pierce M. Obstetrical anal sphincter injuries (OASIS): prevention, recognition and repair. J Obstet Gynecol Can. 2015;37:1131-1148.
- Cox CK, Bugosh MD, Fenner DE, et al. Antibiotic use during repair of obstetrical anal sphincter injury: a qualitative improvement initiative. Int J Gynaecol Obstet. 2021; Epub January 28.
- Deierhoi RJ, Dawes LG, Vick C, et al. Choice of intravenous antibiotic prophylaxis for colorectal surgery does matter. J Am Coll Surg. 2013;217:763-769.
- Till Sr, Morgan DM, Bazzi AA, et al. Reducing surgical site infections after hysterectomy: metronidazole plus cefazolin compared with cephalosporin alone. Am J Obstet Gynecol. 2017;217:187.e1-e11.
- Pihl S, Blomberg M, Uustal E. Internal anal sphincter injury in the immediate postpartum period: prevalence, risk factors and diagnostic methods in the Swedish perineal laceration registry. European J Obst Gynecol Repro Biol. 2020;245:1-6.
- Fornell EU, Matthiesen L, Sjodahl R, et al. Obstetric anal sphincter injury ten years after: subjective and objective long-term effects. BJOG. 2005;112:312-316.
- Sultan AH, Monga AK, Kumar D, et al. Primary repair of obstetric anal sphincter rupture using the overlap technique. Br J Obstet Gynaecol. 1999;106:318-323.
- Williams A, Adams EJ, Tincello DG, et al. How to repair an anal sphincter injury after vaginal delivery: results of a randomised controlled trial. BJOG. 2006;113:201-207.
- Hauth JC, Gilstrap LC, Ward SC, et al. Early repair of an external sphincter ani muscle and rectal mucosal dehiscence. Obstet Gynecol. 1986;67:806-809.
- Hankins GD, Hauth JC, Gilstrap LC, et al. Early repair of episiotomy dehiscence. Obstet Gynecol. 1990;75:48-51.
- Ramin SR, Ramus RM, Little BB, et al. Early repair of episiotomy dehiscence associated with infection. Am J Obstet Gynecol. 1992;167:1104-1107.
- Pritchard JA, MacDonald PC, Gant NF. Williams Obstetrics, 17th ed. Norwalk Connecticut: Appleton-Century-Crofts; 1985:349-350.
- Okeahialam NA, Thakar R, Kleprlikova H, et al. Early re-suturing of dehisced obstetric perineal woulds: a 13-year experience. Eur J Obstet Gynecol Repro Biol. 2020;254:69-73.
- Dudley L, Kettle C, Thomas PW, et al. Perineal resuturing versus expectant management following vaginal delivery complicated by a dehisced wound (PREVIEW): a pilot and feasibility randomised controlled trial. BMJ Open. 2017;7:e012766.
- Lewicky-Gaupp C, Leader-Cramer A, Johnson LL, et al. Wound complications after obstetrical anal sphincter injuries. Obstet Gynecol. 2015;125:1088-1093.
Genetic variants account for up to one-third of cases of cerebral palsy

Cerebral palsy (CP) is the most common cause of severe neurodisability in children, and it occurs in about 2 to 3 per 1,000 births worldwide.1 This nonprogressive disorder is characterized by symptoms that include spasticity, dystonia, choreoathetosis, and/or ataxia that are evident in the first few years of life. While many perinatal variables have been associated with CP, in most cases a specific cause is not identified.
Other neurodevelopmental disorders, such as intellectual disability, epilepsy, and autism spectrum disorder, are often associated with CP.2 These other neurodevelopmental disorders are often genetic, and this has raised the question as to whether CP also might have a substantial genetic component, although this has not been investigated in any significant way until recently. This topic is of great interest to the obstetric community, given that CP often is attributed to obstetric events, including mismanagement of labor and delivery.
Emerging evidence of a genetic-CP association
In an article published recently in JAMA, Moreno-De-Luca and colleagues sought to determine the diagnostic yield of exome sequencing for CP.3 This large cross-sectional study included results of exome sequencing performed in 2 settings. The first setting was a commercial laboratory in which samples were sent for analysis due to a diagnosis of CP, primarily in children (n = 1,345) with a median age of 8.8 years. A second cohort, recruited from a neurodevelopmental disorders clinic at Geisinger, included primarily adults (n = 181) with a median age of 41.9 years.
As is standard in exome sequencing, results were considered likely causative if they were classified as pathogenic or likely pathogenic based on criteria of the American College of Genetics and Genomics. In the laboratory group, 32.7% (440 of 1,345) had a genetic cause of the CP identified, while in the clinic group, 10.5% (19 of 181) had a genetic etiology found. Although most of the identified genetic variants were de novo (that is, they arose in the affected individual and were not clearly inherited), some were inherited from carrier parents.3
A number of other recent studies also have investigated genetic causes of CP and similarly have reported that a substantial number of cases are genetic. Several studies that performed chromosomal microarray analysis in individuals with CP found deleterious copy number variants in 10% to 31% of cases.4-6 Genomic variants detectable by exome sequencing have been reported in 15% to 20% of cases.3 In a recent study in Nature Genetics, researchers performed exome sequencing on 250 parent-child “trios” in which the child had CP, and they found that 14% of cases had an associated genetic variant that was thought to be causative.4 These studies all provide consistent evidence that a substantial proportion of CP cases are due to genetic causes.
Contributors to CP risk
Historically, CP was considered to occur largely as a result of perinatal anoxia. In 1862, the British orthopedic surgeon William John Little first reported an association between prematurity, asphyxia, difficult delivery, and CP in a paper presented to the Obstetrical Society of London.7 Subsequently, much effort has gone into the prevention of perinatal asphyxia and birth injury, although our ability to monitor fetal well-being remains limited. Nonreassuring fetal heart rate patterns are nonspecific and can occur for many reasons other than fetal asphyxia. Studies of electronic fetal monitoring have found that continuous monitoring primarily leads to an increase in cesarean delivery with no decrease in CP or infant mortality.8
While some have attributed this to failure to accurately interpret the fetal heart rate tracing, it also may be because a substantial number of CP cases are due to genetic and other causes, and that very few in fact result from preventable intrapartum injury.
The American College of Obstetricians and Gynecologists and the American Academy of Pediatrics agree that knowledge gaps preclude definitive determination that a given case of neonatal encephalopathy is attributable to an acute intrapartum event, and they provide criteria that must be fulfilled to establish a reasonable causal link between an intrapartum event and subsequent long-term neurologic disability.9 However, there continues to be a belief in the medical, scientific, and lay communities that birth asphyxia, secondary to adverse intrapartum events, is the leading cause of CP. A “brain-damaged infant” remains one of the most common malpractice claims, and birth injury one of the highest paid claims. Such claims generally allege that intrapartum asphyxia has caused long-term neurologic sequelae, including CP.
While it is true that prematurity, infection, hypoxia-ischemia, and pre- and perinatal stroke all have been implicated as contributing to CP risk, large population-based studies have shown that birth asphyxia accounts for less than 12% of CP cases.10 Specifically, recent data indicate that acute intrapartum hypoxia-ischemia occurs only in about 6% of CP cases. In other words, it does occur and may contribute to some cases, but this is likely a smaller percent than previously thought, and genetic factors now appear to be far more significant contributors.11
Continue to: Exploring a genetic etiology...
Exploring a genetic etiology
In considering the etiologies of CP, it is important to note that 21% to 40% of individuals with CP have an associated congenital anomaly, suggesting a genetic origin in at least some individuals. Moreover, a 40% heritability has been estimated in CP, which is comparable to the heritability rate for autism spectrum disorders.12
In the recent study by Moreno-De-Luca and colleagues, some of the gene variants detected were previously associated with other forms of neurodevelopmental disability, such as epilepsy and autism spectrum disorder.3 Many individuals in the study cohort were found to have multiple neurologic comorbidities, for example, CP as well as epilepsy, autism spectrum disorder, and/or intellectual disability. The presence of these additional comorbidities increased the likelihood of finding a genetic cause; the authors found that the diagnostic yield ranged from 11.2% with isolated CP to 32.9% with all 3 comorbidities. The yield was highest with CP and intellectual disability and CP with all 3 comorbidities. A few genes were particularly common, and some were reported previously in association with CP and/or other neurodevelopmental disorders. In some patients, variants were found in genes or gene regions associated with disorders that do not frequently include CP, such as Rett syndrome.3
Implications for ObGyns
The data from the study by Moreno-De-Luca and colleagues are interesting and relevant to pediatricians, neurologists, and geneticists, as well as obstetricians. Understanding the cause of any disease or disorder improves care, including counseling regarding the cause, the appropriate interventions or therapy, and in some families, the recurrence risk in another pregnancy. The treatment for CP has not changed significantly in many years. Increasingly, detection of an underlying genetic cause can guide precision treatments; thus, the detection of specific gene variants allows a targeted approach to therapy.
Identification of a genetic cause also can significantly impact recurrence risk counseling and prenatal diagnosis options in another pregnancy. In general, the empiric recurrence risk of CP is quoted as 1% to 2%,13 and with de novo variants this does not change. However, with inherited variants the recurrence risk in future children is substantially higher. While 72% of the genetic variants associated with CP in the Moreno-De-Luca study were de novo with a low recurrence risk, in the other 28% the mode of inheritance indicated a substantial risk of recurrence (25%–50%) in another pregnancy.3 Detecting such causative variant(s) allows not only accurate counseling about recurrence risk but also preimplantation genetic testing or prenatal diagnosis when recurrence risk is high.
In the field of obstetrics, the debate about the etiology of CP is important largely due to the medicolegal implications. Patient-oriented information on the internet often states that CP is caused by damage to the child’s brain just before, during, or soon after birth, supporting potential blame of those providing care during those times. Patient-oriented websites regarding CP do not list genetic disorders among the causes but rather include primarily environmental factors, such as prematurity, low birth weight, in utero infections, anoxia or other brain injury, or perinatal stroke. Even the Centers for Disease Control and Prevention website lists brain damage as the primary etiology of CP.14 Hopefully, these new data will increase a broader understanding of this condition.
Exome sequencing is now recommended as a first-tier test for individuals with many neurodevelopmental disorders, including epilepsy, intellectual disability, and autism spectrum disorder.15 However, comprehensive genetic testing is not typically recommended or performed in cases of CP. Based on recent data, including the report by Moreno-De-Luca and colleagues, it would seem that CP should be added to the list of disorders for which exome sequencing is ordered, given the similar prevalence and diagnostic yield. ●
- Oskoui M, Coutinho F, Dykeman J, et al. An update on the prevalence of cerebral palsy: a systematic review and meta-analysis. Dev Med Child Neurol. 2013;55:509-519.
- Rosenbaum P, Paneth N, Leviton A, et al. A report: the definition and classification of cerebral palsy April 2006. Dev Med Child Neurol Suppl. 2007;109:8-14.
- Moreno-De-Luca A, Millan F, Pesacreta DR, et al. Molecular diagnostic yield of exome sequencing in patients with cerebral palsy. JAMA. 2021;325:467-475.
- Jin SC, Lewis SA, Bakhtiari S, et al. Mutations disrupting neuritogenesis genes confer risk for cerebral palsy. Nat Genet. 2020;52:1046-1056.
- Segel R, Ben-Pazi H, Zeligson S, et al. Copy number variations in cryptogenic cerebral palsy. Neurology. 2015;84:1660-1668.
- McMichael G, Girirrajan S, Moreno-De-Luca A, et al. Rare copy number variation in cerebral palsy. Eur J Hum Genet. 2014;22:40-45.
- Little WJ. On the influence of abnormal parturition, difficult labours, premature births, and asphyxia neonatorum, on the mental and physical condition of the child, especially in relation to deformities. Trans Obstet Soc Lond. 1862;3:293-344.
- Alfirevic Z, Devane D, Gyte GM. Continuous cardiotocography (CTG) as a form of electronic fetal monitoring (EFM) for fetal assessment during labour. Cochrane Database Syst Rev. 2013;5;CD006066.
- American College of Obstetricians and Gynecologists. Executive summary: neonatal encephalopathy and neurologic outcome second edition. Report of the American College of Obstetricians and Gynecologists’ Task Force on Neonatal Encephalopathy. Obstet Gynecol. 2014;123:896- 901.
- Ellenberg JH, Nelson KB. The association of cerebral palsy with birth asphyxia: a definitional quagmire. Dev Med Child Neurol. 2013;55:210- 216.
- Himmelmann K, Uvebrant P. The panorama of cerebral palsy in Sweden part XII shows that patterns changed in the birth years 2007–2010. Acta Paediatr. 2018;107: 462-468.
- Petterson B, Stanley F, Henderson D. Cerebral palsy in multiple births in Western Australia: genetic aspects. Am J Med Genet. 1990;37:346- 351.
- Korzeniewski SJ, Slaughter J, Lenski M, et al. The complex aetiology of cerebral palsy. Nat Rev Neurol. 2018;14:528-543.
- Centers for Disease Control and Prevention. Causes and risk factors of cerebral palsy. https:// www.cdc.gov/ncbddd/cp/causes.html. Accessed March 23, 2021.
- Srivastava S, Love-Nichols JA, Dies KA, et al; NDD Exome Scoping Review Work Group. Meta-analysis and multidisciplinary consensus statement: exome sequencing is a first-tier clinical diagnostic test for individuals with neurodevelopmental disorders. Genet Med. 2019;21:2413-2421.

Mary E. Norton, MD
Professor of Obstetrics, Gynecology, and Reproductive Sciences, Director, Division of Maternal-Fetal Medicine, University of California, San Francisco
The author reports no financial relationships relevant to this article.
Mary E. Norton, MD
Professor of Obstetrics, Gynecology, and Reproductive Sciences, Director, Division of Maternal-Fetal Medicine, University of California, San Francisco
The author reports no financial relationships relevant to this article.
Mary E. Norton, MD
Professor of Obstetrics, Gynecology, and Reproductive Sciences, Director, Division of Maternal-Fetal Medicine, University of California, San Francisco
The author reports no financial relationships relevant to this article.
Cerebral palsy (CP) is the most common cause of severe neurodisability in children, and it occurs in about 2 to 3 per 1,000 births worldwide.1 This nonprogressive disorder is characterized by symptoms that include spasticity, dystonia, choreoathetosis, and/or ataxia that are evident in the first few years of life. While many perinatal variables have been associated with CP, in most cases a specific cause is not identified.
Other neurodevelopmental disorders, such as intellectual disability, epilepsy, and autism spectrum disorder, are often associated with CP.2 These other neurodevelopmental disorders are often genetic, and this has raised the question as to whether CP also might have a substantial genetic component, although this has not been investigated in any significant way until recently. This topic is of great interest to the obstetric community, given that CP often is attributed to obstetric events, including mismanagement of labor and delivery.
Emerging evidence of a genetic-CP association
In an article published recently in JAMA, Moreno-De-Luca and colleagues sought to determine the diagnostic yield of exome sequencing for CP.3 This large cross-sectional study included results of exome sequencing performed in 2 settings. The first setting was a commercial laboratory in which samples were sent for analysis due to a diagnosis of CP, primarily in children (n = 1,345) with a median age of 8.8 years. A second cohort, recruited from a neurodevelopmental disorders clinic at Geisinger, included primarily adults (n = 181) with a median age of 41.9 years.
As is standard in exome sequencing, results were considered likely causative if they were classified as pathogenic or likely pathogenic based on criteria of the American College of Genetics and Genomics. In the laboratory group, 32.7% (440 of 1,345) had a genetic cause of the CP identified, while in the clinic group, 10.5% (19 of 181) had a genetic etiology found. Although most of the identified genetic variants were de novo (that is, they arose in the affected individual and were not clearly inherited), some were inherited from carrier parents.3
A number of other recent studies also have investigated genetic causes of CP and similarly have reported that a substantial number of cases are genetic. Several studies that performed chromosomal microarray analysis in individuals with CP found deleterious copy number variants in 10% to 31% of cases.4-6 Genomic variants detectable by exome sequencing have been reported in 15% to 20% of cases.3 In a recent study in Nature Genetics, researchers performed exome sequencing on 250 parent-child “trios” in which the child had CP, and they found that 14% of cases had an associated genetic variant that was thought to be causative.4 These studies all provide consistent evidence that a substantial proportion of CP cases are due to genetic causes.
Contributors to CP risk
Historically, CP was considered to occur largely as a result of perinatal anoxia. In 1862, the British orthopedic surgeon William John Little first reported an association between prematurity, asphyxia, difficult delivery, and CP in a paper presented to the Obstetrical Society of London.7 Subsequently, much effort has gone into the prevention of perinatal asphyxia and birth injury, although our ability to monitor fetal well-being remains limited. Nonreassuring fetal heart rate patterns are nonspecific and can occur for many reasons other than fetal asphyxia. Studies of electronic fetal monitoring have found that continuous monitoring primarily leads to an increase in cesarean delivery with no decrease in CP or infant mortality.8
While some have attributed this to failure to accurately interpret the fetal heart rate tracing, it also may be because a substantial number of CP cases are due to genetic and other causes, and that very few in fact result from preventable intrapartum injury.
The American College of Obstetricians and Gynecologists and the American Academy of Pediatrics agree that knowledge gaps preclude definitive determination that a given case of neonatal encephalopathy is attributable to an acute intrapartum event, and they provide criteria that must be fulfilled to establish a reasonable causal link between an intrapartum event and subsequent long-term neurologic disability.9 However, there continues to be a belief in the medical, scientific, and lay communities that birth asphyxia, secondary to adverse intrapartum events, is the leading cause of CP. A “brain-damaged infant” remains one of the most common malpractice claims, and birth injury one of the highest paid claims. Such claims generally allege that intrapartum asphyxia has caused long-term neurologic sequelae, including CP.
While it is true that prematurity, infection, hypoxia-ischemia, and pre- and perinatal stroke all have been implicated as contributing to CP risk, large population-based studies have shown that birth asphyxia accounts for less than 12% of CP cases.10 Specifically, recent data indicate that acute intrapartum hypoxia-ischemia occurs only in about 6% of CP cases. In other words, it does occur and may contribute to some cases, but this is likely a smaller percent than previously thought, and genetic factors now appear to be far more significant contributors.11
Continue to: Exploring a genetic etiology...
Exploring a genetic etiology
In considering the etiologies of CP, it is important to note that 21% to 40% of individuals with CP have an associated congenital anomaly, suggesting a genetic origin in at least some individuals. Moreover, a 40% heritability has been estimated in CP, which is comparable to the heritability rate for autism spectrum disorders.12
In the recent study by Moreno-De-Luca and colleagues, some of the gene variants detected were previously associated with other forms of neurodevelopmental disability, such as epilepsy and autism spectrum disorder.3 Many individuals in the study cohort were found to have multiple neurologic comorbidities, for example, CP as well as epilepsy, autism spectrum disorder, and/or intellectual disability. The presence of these additional comorbidities increased the likelihood of finding a genetic cause; the authors found that the diagnostic yield ranged from 11.2% with isolated CP to 32.9% with all 3 comorbidities. The yield was highest with CP and intellectual disability and CP with all 3 comorbidities. A few genes were particularly common, and some were reported previously in association with CP and/or other neurodevelopmental disorders. In some patients, variants were found in genes or gene regions associated with disorders that do not frequently include CP, such as Rett syndrome.3
Implications for ObGyns
The data from the study by Moreno-De-Luca and colleagues are interesting and relevant to pediatricians, neurologists, and geneticists, as well as obstetricians. Understanding the cause of any disease or disorder improves care, including counseling regarding the cause, the appropriate interventions or therapy, and in some families, the recurrence risk in another pregnancy. The treatment for CP has not changed significantly in many years. Increasingly, detection of an underlying genetic cause can guide precision treatments; thus, the detection of specific gene variants allows a targeted approach to therapy.
Identification of a genetic cause also can significantly impact recurrence risk counseling and prenatal diagnosis options in another pregnancy. In general, the empiric recurrence risk of CP is quoted as 1% to 2%,13 and with de novo variants this does not change. However, with inherited variants the recurrence risk in future children is substantially higher. While 72% of the genetic variants associated with CP in the Moreno-De-Luca study were de novo with a low recurrence risk, in the other 28% the mode of inheritance indicated a substantial risk of recurrence (25%–50%) in another pregnancy.3 Detecting such causative variant(s) allows not only accurate counseling about recurrence risk but also preimplantation genetic testing or prenatal diagnosis when recurrence risk is high.
In the field of obstetrics, the debate about the etiology of CP is important largely due to the medicolegal implications. Patient-oriented information on the internet often states that CP is caused by damage to the child’s brain just before, during, or soon after birth, supporting potential blame of those providing care during those times. Patient-oriented websites regarding CP do not list genetic disorders among the causes but rather include primarily environmental factors, such as prematurity, low birth weight, in utero infections, anoxia or other brain injury, or perinatal stroke. Even the Centers for Disease Control and Prevention website lists brain damage as the primary etiology of CP.14 Hopefully, these new data will increase a broader understanding of this condition.
Exome sequencing is now recommended as a first-tier test for individuals with many neurodevelopmental disorders, including epilepsy, intellectual disability, and autism spectrum disorder.15 However, comprehensive genetic testing is not typically recommended or performed in cases of CP. Based on recent data, including the report by Moreno-De-Luca and colleagues, it would seem that CP should be added to the list of disorders for which exome sequencing is ordered, given the similar prevalence and diagnostic yield. ●
- Oskoui M, Coutinho F, Dykeman J, et al. An update on the prevalence of cerebral palsy: a systematic review and meta-analysis. Dev Med Child Neurol. 2013;55:509-519.
- Rosenbaum P, Paneth N, Leviton A, et al. A report: the definition and classification of cerebral palsy April 2006. Dev Med Child Neurol Suppl. 2007;109:8-14.
- Moreno-De-Luca A, Millan F, Pesacreta DR, et al. Molecular diagnostic yield of exome sequencing in patients with cerebral palsy. JAMA. 2021;325:467-475.
- Jin SC, Lewis SA, Bakhtiari S, et al. Mutations disrupting neuritogenesis genes confer risk for cerebral palsy. Nat Genet. 2020;52:1046-1056.
- Segel R, Ben-Pazi H, Zeligson S, et al. Copy number variations in cryptogenic cerebral palsy. Neurology. 2015;84:1660-1668.
- McMichael G, Girirrajan S, Moreno-De-Luca A, et al. Rare copy number variation in cerebral palsy. Eur J Hum Genet. 2014;22:40-45.
- Little WJ. On the influence of abnormal parturition, difficult labours, premature births, and asphyxia neonatorum, on the mental and physical condition of the child, especially in relation to deformities. Trans Obstet Soc Lond. 1862;3:293-344.
- Alfirevic Z, Devane D, Gyte GM. Continuous cardiotocography (CTG) as a form of electronic fetal monitoring (EFM) for fetal assessment during labour. Cochrane Database Syst Rev. 2013;5;CD006066.
- American College of Obstetricians and Gynecologists. Executive summary: neonatal encephalopathy and neurologic outcome second edition. Report of the American College of Obstetricians and Gynecologists’ Task Force on Neonatal Encephalopathy. Obstet Gynecol. 2014;123:896- 901.
- Ellenberg JH, Nelson KB. The association of cerebral palsy with birth asphyxia: a definitional quagmire. Dev Med Child Neurol. 2013;55:210- 216.
- Himmelmann K, Uvebrant P. The panorama of cerebral palsy in Sweden part XII shows that patterns changed in the birth years 2007–2010. Acta Paediatr. 2018;107: 462-468.
- Petterson B, Stanley F, Henderson D. Cerebral palsy in multiple births in Western Australia: genetic aspects. Am J Med Genet. 1990;37:346- 351.
- Korzeniewski SJ, Slaughter J, Lenski M, et al. The complex aetiology of cerebral palsy. Nat Rev Neurol. 2018;14:528-543.
- Centers for Disease Control and Prevention. Causes and risk factors of cerebral palsy. https:// www.cdc.gov/ncbddd/cp/causes.html. Accessed March 23, 2021.
- Srivastava S, Love-Nichols JA, Dies KA, et al; NDD Exome Scoping Review Work Group. Meta-analysis and multidisciplinary consensus statement: exome sequencing is a first-tier clinical diagnostic test for individuals with neurodevelopmental disorders. Genet Med. 2019;21:2413-2421.

Focus on obesity
![]()
Obesity affects approximately 30% of American women, and while it is easy to diagnose, it is often difficult to address with our patients. Healthy eating and regular physical activity are the time-tested ways to achieve and maintain an appropriate weight.
For women with moderate obesity, leveraging technology is a great way to help them sensibly achieve weight loss. To evaluate the quality of a mobile app targeted to address obesity, it is particularly important to consider an app’s usefulness, functionality, and design. Clinicians can evaluate these elements with the use of the ACOG-recommended rubric, which provides criteria for judging usefulness, accuracy, authority, objectivity, timeliness, functionality, design, security, and value.
Obesity app considerations
A particularly valuable app feature that rates high on the usefulness measure is the capability for real-time motivational guidance that encourages the user to meet her daily goals. The ability to quickly and accurately scan and upload food items to an app and quantify portions using common comparative illustrations for measurement would give an app a high score on functionality. Coveted design features to enhance the user’s experience, such as syncing real time with wearable devices and catering to both visual and text learners, increase the value of an app.
In addition, an app with the combined features of a personal dietitian and a fitness trainer can employ techniques to encourage healthy eating and physical activity to self-monitor food intake and exercise. Features that calculate the user’s calorie level based on age, sex, height, and activity and offer a personalized dashboard to track carbohydrates, proteins, and fat breakdown (including nutrients and water intake) also can increase effectiveness. These features engage users to become more motivated toward an active lifestyle to balance food intake.
By incorporating apps that combine behavioral strategies with individualization, community presence, and feedback, we can successfully partner with our patients to address obesity. ●

Donna Montalto, MPP
Ms. Montalto is Chief of Staff and SVP, Marketing and Communications, Optum Tri-State, Westchester, New York.
The author reports no financial relationships relevant to this article.
Donna Montalto, MPP
Ms. Montalto is Chief of Staff and SVP, Marketing and Communications, Optum Tri-State, Westchester, New York.
The author reports no financial relationships relevant to this article.
Donna Montalto, MPP
Ms. Montalto is Chief of Staff and SVP, Marketing and Communications, Optum Tri-State, Westchester, New York.
The author reports no financial relationships relevant to this article.
![]()
Obesity affects approximately 30% of American women, and while it is easy to diagnose, it is often difficult to address with our patients. Healthy eating and regular physical activity are the time-tested ways to achieve and maintain an appropriate weight.
For women with moderate obesity, leveraging technology is a great way to help them sensibly achieve weight loss. To evaluate the quality of a mobile app targeted to address obesity, it is particularly important to consider an app’s usefulness, functionality, and design. Clinicians can evaluate these elements with the use of the ACOG-recommended rubric, which provides criteria for judging usefulness, accuracy, authority, objectivity, timeliness, functionality, design, security, and value.
Obesity app considerations
A particularly valuable app feature that rates high on the usefulness measure is the capability for real-time motivational guidance that encourages the user to meet her daily goals. The ability to quickly and accurately scan and upload food items to an app and quantify portions using common comparative illustrations for measurement would give an app a high score on functionality. Coveted design features to enhance the user’s experience, such as syncing real time with wearable devices and catering to both visual and text learners, increase the value of an app.
In addition, an app with the combined features of a personal dietitian and a fitness trainer can employ techniques to encourage healthy eating and physical activity to self-monitor food intake and exercise. Features that calculate the user’s calorie level based on age, sex, height, and activity and offer a personalized dashboard to track carbohydrates, proteins, and fat breakdown (including nutrients and water intake) also can increase effectiveness. These features engage users to become more motivated toward an active lifestyle to balance food intake.
By incorporating apps that combine behavioral strategies with individualization, community presence, and feedback, we can successfully partner with our patients to address obesity. ●