User login
What’s the proper place of benzodiazepines in psychiatry?
Tread carefully, but do not eliminate them as an option, two experts advise.
SAN DIEGO – Not long before his presentation at Psych Congress 2019, psychiatrist Rakesh Jain, MD, MPH, chatted with a fellow attendee, a nurse practitioner from Tyler, Tex. As Dr. Jain recalled later, his fellow Texan told him that “it’s not unusual to see patients on three benzodiazepines.”
The nurse practitioner “talks to them about how they need to do things differently, and they forget,” Dr. Jain said. “He’s very worried about them.”
Dr. Jain is familiar with the feeling. Like many mental health professionals, he worries about the role of benzodiazepines, which seem to be both widely used and misused. Figuring out their proper place in psychiatry “may require us to raise our game,” said Dr. Jain, of Texas Tech University in Midland.
What to do? Dr. Jain and a colleague offered the same answer – tread carefully, but do not eliminate them as an option – in two separate sessions at the annual Psych Congress.
As Dr. Jain noted, benzodiazepines are popular, and for good reason. “There are many patients, perhaps hundreds of thousands, who are using benzodiazepines chronically, and they’re doing it right. There’s not a CVS in America where benzodiazepines aren’t well stocked. They’re very inexpensive, and the most costly benzodiazepine is still cheaper than Motrin.”
On the other hand, he said, the medications are linked to addiction and physical dependence. “Thirty percent of those who die of opioid overdoses may not have died if they didn’t have benzodiazepines [in their systems].”
In another presentation, psychiatrist Murray B. Stein, MD, MPH, of the University of California at San Diego and VA San Diego Healthcare System, offered these tips about prescribing benzodiazepines for patients with anxiety.
Be very cautious about prescribing as needed
“It’s rarely indicated to prescribe benzodiazepine [as needed] when you’re treating people with anxiety,” he said. “The main reason is patients don’t know when they need it. They take their pills either when they’re so anxious that they’ve already been freaking out for a long time, or they take it when they’re first starting to feel at least a bit anxious. That leads to taking it to prevent being anxious.”
Allow an as-needed approach in certain situations
However, he said, advise patients to try the medication beforehand so they understand its effects. “I’ve had one occasion where I thought we had a dose worked out well. Somebody had to do a work presentation, and he took the medicine and got up in front of the group. He wasn’t anxious at all. But he couldn’t remember a single thing.”
Don’t use them as patients start SSRIs
Patients can get anxious as they start SSRIs, especially for panic disorders, Dr. Stein said. So it might seem reasonable, as some psychiatrists believe, to add benzodiazepines on a short-term basis.
But Dr. Stein said he is not a fan of this approach. As he noted, benzodiazepines are hard to stop. He prefers to help patients understand possible side effects of SSRIs instead, and he emphasized the importance of being available to help patients get through them.
Dr. Jain and Dr. Stein each reported multiple relationships with industry.
Tread carefully, but do not eliminate them as an option, two experts advise.
Tread carefully, but do not eliminate them as an option, two experts advise.
SAN DIEGO – Not long before his presentation at Psych Congress 2019, psychiatrist Rakesh Jain, MD, MPH, chatted with a fellow attendee, a nurse practitioner from Tyler, Tex. As Dr. Jain recalled later, his fellow Texan told him that “it’s not unusual to see patients on three benzodiazepines.”
The nurse practitioner “talks to them about how they need to do things differently, and they forget,” Dr. Jain said. “He’s very worried about them.”
Dr. Jain is familiar with the feeling. Like many mental health professionals, he worries about the role of benzodiazepines, which seem to be both widely used and misused. Figuring out their proper place in psychiatry “may require us to raise our game,” said Dr. Jain, of Texas Tech University in Midland.
What to do? Dr. Jain and a colleague offered the same answer – tread carefully, but do not eliminate them as an option – in two separate sessions at the annual Psych Congress.
As Dr. Jain noted, benzodiazepines are popular, and for good reason. “There are many patients, perhaps hundreds of thousands, who are using benzodiazepines chronically, and they’re doing it right. There’s not a CVS in America where benzodiazepines aren’t well stocked. They’re very inexpensive, and the most costly benzodiazepine is still cheaper than Motrin.”
On the other hand, he said, the medications are linked to addiction and physical dependence. “Thirty percent of those who die of opioid overdoses may not have died if they didn’t have benzodiazepines [in their systems].”
In another presentation, psychiatrist Murray B. Stein, MD, MPH, of the University of California at San Diego and VA San Diego Healthcare System, offered these tips about prescribing benzodiazepines for patients with anxiety.
Be very cautious about prescribing as needed
“It’s rarely indicated to prescribe benzodiazepine [as needed] when you’re treating people with anxiety,” he said. “The main reason is patients don’t know when they need it. They take their pills either when they’re so anxious that they’ve already been freaking out for a long time, or they take it when they’re first starting to feel at least a bit anxious. That leads to taking it to prevent being anxious.”
Allow an as-needed approach in certain situations
However, he said, advise patients to try the medication beforehand so they understand its effects. “I’ve had one occasion where I thought we had a dose worked out well. Somebody had to do a work presentation, and he took the medicine and got up in front of the group. He wasn’t anxious at all. But he couldn’t remember a single thing.”
Don’t use them as patients start SSRIs
Patients can get anxious as they start SSRIs, especially for panic disorders, Dr. Stein said. So it might seem reasonable, as some psychiatrists believe, to add benzodiazepines on a short-term basis.
But Dr. Stein said he is not a fan of this approach. As he noted, benzodiazepines are hard to stop. He prefers to help patients understand possible side effects of SSRIs instead, and he emphasized the importance of being available to help patients get through them.
Dr. Jain and Dr. Stein each reported multiple relationships with industry.
REPORTING FROM PSYCH CONGRESS 2019
Three companies issue recall for ranitidine because of NDMA impurities
The Food and Drug Administration has issued an alert to health care providers and patients about voluntary recalls of ranitidine (Zantac) from three separate companies because of the potential of N-nitrosodimethylamine (NDMA) in the medicine.

According to the FDA alert, Perrigo is recalling over-the-counter ranitidine tablets of all sizes, Novitium Pharma is recalling all unexpired quantities and lots of ranitidine hydrochloride capsules, and Lannett is recalling all unexpired lots of prescription ranitidine syrup (ranitidine oral solution (15 mg/mL).
Patients who are using over-the-counter ranitidine should consider switching to an alternative, such as famotidine, cimetidine, esomeprazole, lansoprazole, and omeprazole, the FDA noted. None of these medications have shown evidence of containing NDMA.
The alert is the fifth update on ranitidine since the initial FDA announcement that NDMA had been found in ranitidine on Sept. 13, 2019.
Lillian M. Beard, MD, who has a private pediatrics practice in Silver Spring, Md., commented, “We have been grappling with concerns about our patients currently taking ranitidine and how we might address the issue. In our practice, we have had very few questions so far. We anticipate that as their awareness is heightened, our parents will seek our advice. In querying our GI colleagues for recommendations on managing the conversations with parents about their concerns about possible carcinogen contamination in ranitidine samples, our practice group was advised that the FDA is not currently recommending that patients on the medication need to immediately stop, pending further investigation.”*
Dr. Beard, also an associate clinical professor of pediatrics at George Washington University in Washington, continued, “Our GI colleagues at Children’s National currently are not starting patients on ranitidine, but choosing a different H2 blocker, famotidine (Pepsid). They are not trying to reach out to patients on ranitidine to ‘switch,’ but when parents call in to refill prescriptions or for management advice, they are switching them to famotidine. Until further notification and or clarification, I will do the same.”
*Updated 11/5/2019
The Food and Drug Administration has issued an alert to health care providers and patients about voluntary recalls of ranitidine (Zantac) from three separate companies because of the potential of N-nitrosodimethylamine (NDMA) in the medicine.
According to the FDA alert, Perrigo is recalling over-the-counter ranitidine tablets of all sizes, Novitium Pharma is recalling all unexpired quantities and lots of ranitidine hydrochloride capsules, and Lannett is recalling all unexpired lots of prescription ranitidine syrup (ranitidine oral solution (15 mg/mL).
Patients who are using over-the-counter ranitidine should consider switching to an alternative, such as famotidine, cimetidine, esomeprazole, lansoprazole, and omeprazole, the FDA noted. None of these medications have shown evidence of containing NDMA.
The alert is the fifth update on ranitidine since the initial FDA announcement that NDMA had been found in ranitidine on Sept. 13, 2019.
Lillian M. Beard, MD, who has a private pediatrics practice in Silver Spring, Md., commented, “We have been grappling with concerns about our patients currently taking ranitidine and how we might address the issue. In our practice, we have had very few questions so far. We anticipate that as their awareness is heightened, our parents will seek our advice. In querying our GI colleagues for recommendations on managing the conversations with parents about their concerns about possible carcinogen contamination in ranitidine samples, our practice group was advised that the FDA is not currently recommending that patients on the medication need to immediately stop, pending further investigation.”*
Dr. Beard, also an associate clinical professor of pediatrics at George Washington University in Washington, continued, “Our GI colleagues at Children’s National currently are not starting patients on ranitidine, but choosing a different H2 blocker, famotidine (Pepsid). They are not trying to reach out to patients on ranitidine to ‘switch,’ but when parents call in to refill prescriptions or for management advice, they are switching them to famotidine. Until further notification and or clarification, I will do the same.”
*Updated 11/5/2019
Three companies issue recall for ranitidine because of NDMA impurities
The Food and Drug Administration has issued an alert to health care providers and patients about voluntary recalls of ranitidine (Zantac) from three separate companies because of the potential of N-nitrosodimethylamine (NDMA) in the medicine.
According to the FDA alert, Perrigo is recalling over-the-counter ranitidine tablets of all sizes, Novitium Pharma is recalling all unexpired quantities and lots of ranitidine hydrochloride capsules, and Lannett is recalling all unexpired lots of prescription ranitidine syrup (ranitidine oral solution (15 mg/mL).
Patients who are using over-the-counter ranitidine should consider switching to an alternative, such as famotidine, cimetidine, esomeprazole, lansoprazole, and omeprazole, the FDA noted. None of these medications have shown evidence of containing NDMA.
The alert is the fifth update on ranitidine since the initial FDA announcement that NDMA had been found in ranitidine on Sept. 13, 2019.
The recent FDA safety alerts on ranitidine might be causing concern among your patients about their heartburn treatment. AGA offers key points that you can share with your patients at www.gastro.org/news/talking-to-your-patients-about-ranitidine.
Behind the scenes of a radical new cancer cure
An unexpected early morning phone call from the hospital is never good news. When Joy Johnson answered, her first thought was that Sharon Birzer, her partner of 15 years, was dead. Her fears were amplified by the voice on the other end refusing to confirm or deny it. Just “come in and talk to one of the doctors,” she remembers the voice saying.
Johnson knew this was a real possibility. A few weeks earlier, she and Birzer sat in the exam room of a lymphoma specialist at Stanford University. Birzer’s cancer had grown, and fast — first during one type of chemotherapy, then through a second. Out of standard options, Birzer’s local oncologist had referred her for a novel treatment called chimeric antigen receptor T-cell therapy — or CAR-T. Birzer and Johnson knew the treatment was risky. They were warned there was a chance of death. There was also a chance of serious complications such as multi-organ failure and neurological impairment. But it was like warning a drowning person that her lifeboat could have problems. Without treatment, the chance of Birzer’s death was all but certain. She signed the consent form.
Johnson hung up the phone that early morning and sped to the hospital. She met with a doctor and two chaplains in a windowless room in the cancer ward, where happy photos of cancer “alumni” smiled down from the walls. This is getting worse and worse, Johnson thought. As she remembers it, the doctor went through the timeline of what happened for 10 minutes, explaining how Birzer became sicker and sicker, before Johnson interrupted with the thought splitting her world in two: “I need you to tell me whether she’s alive or dead.”
Birzer wasn’t dead. But she was far from okay. The ordeal began with Birzer speaking gibberish. Then came seizures so severe there was concern she wouldn’t be able to breathe on her own. When it took a few different medications to stop Birzer from seizing, her doctors sedated her, put a breathing tube down her throat, and connected her to a ventilator. Now, she was unconscious and in the intensive care unit (ICU).
Birzer was one of the early patients to receive CAR-T, a radical new therapy to treat cancer. It involved removing Birzer’s own blood, filtering for immune cells called T-cells, and genetically engineering those cells to recognize and attack her lymphoma. CAR-T made history in 2017 as the first FDA-approved gene therapy to treat any disease. After three to six months of follow-up, the trials that led to approval showed response rates of 80 percent and above in aggressive leukemias and lymphomas that had resisted chemotherapy. Patients on the brink of death were coming back to life.
This is something I often dream of seeing but rarely do. As a doctor who treats cancer, I think a lot about how to frame new treatments to my patients. I never want to give false hope. But the uncertainty inherent to my field also cautions me against closing the door on optimism prematurely. We take it as a point of pride that no field of medicine evolves as rapidly as cancer — the FDA approves dozens of new treatments a year. One of my biggest challenges is staying up to date on every development and teasing apart what should — and shouldn’t — change my practice. I am often a mediator for my patients, tempering theoretical promises with everyday realism. To accept a research finding into medical practice, I prefer slow steps showing me proof of concept, safety, and efficacy.
CAR-T, nearly three decades in the making, systemically cleared these hurdles. Not only did the product work, its approach was also unique among cancer treatments. Unlike our usual advances, this wasn’t a matter of prescribing an old drug for a new disease or remixing known medications. CAR-T isn’t even a drug. This is a one-time infusion giving a person a better version of her own immune system. When the FDA approved its use, it wasn’t a question of whether my hospital would be involved, but how we could stay ahead. We weren’t alone.
Today, two FDA-approved CAR-T products called Kymriah and Yescarta are available in more than 100 hospitals collectively across the U.S. Hundreds of clinical trials are tinkering with dosages, patient populations, and types of cancer. Some medical centers are manufacturing the cells on-site.
The FDA approved CAR-T with a drug safety program called a Risk Evaluation and Mitigation Strategy (REMS). As I cared for these patients, I quickly realized the FDA’s concerns. Of the 10 or so patients I’ve treated, more than half developed strange neurologic side effects ranging from headaches to difficulty speaking to seizures to falling unconscious. We scrambled to learn how to manage the side effects in real time.
Johnson and Birzer, who I didn’t treat personally but spoke to at length for this essay, understood this better than most. Both had worked in quality control for a blood bank and were medically savvier than the average patient. They accepted a medical system with a learning curve. They were fine with hearing “I don’t know.” Signing up for a trailblazing treatment meant going along for the ride. Twists and bumps were par for the course.
Cancer, by definition, means something has gone very wrong within — a cell has malfunctioned and multiplied. The philosophy for fighting cancer has been, for the most part, creating and bringing in treatments from outside the body. That’s how we got to the most common modern approaches: Chemotherapy (administering drugs to kill cancer), radiation (using high energy beams to kill cancer), and surgery (cutting cancer out with a scalpel and other tools). Next came the genetics revolution, with a focus on creating drugs that target a precise genetic mutation separating a cancer cell from a normal one. But cancers are genetically complex, with legions of mutations and the talent to develop new ones. It’s rare to have that one magic bullet.
Over the last decade or so, our approach shifted. Instead of fighting cancer from the outside, we are increasingly turning in. The human body is already marvelously equipped to recognize and attack invaders, from the common cold to food poisoning, even if the invaders are ones the body has never seen before. Cancer doesn’t belong either. But since cancer cells come from normal ones, they’ve developed clever camouflages to trick and evade the immune system. The 2018 Nobel Prize in Physiology or Medicine was jointly awarded to two researchers for their work in immunotherapy, a class of medications devoted to wiping out the camouflages and restoring the immune system’s upper hand. As I once watched a fellow oncologist describe it to a patient: “I’m not treating you. You are treating you.”
What if we could go one step further? What if we could genetically engineer a patient’s own immune cells to spot and fight cancer, as a sort of “best hits” of genetic therapy and immunotherapy?
Enter CAR-T. The technology uses T-cells, which are like the bouncers of the immune system. T-cells survey the body and make sure everything belongs. CAR-T involves removing a person’s T-cells from her blood and using a disarmed virus to deliver new genetic material to the cells. The new genes given to the T-cells help them make two types of proteins. The first — giving the technology its name — is a CAR, which sits on the T-cell’s surface and binds to a protein on the tumor cell’s surface, like a lock and key. The second serves as the T-cell’s caffeine jolt, rousing it to activate. Once the genetic engineering part is done, the T-cells are prodded to multiply by being placed on a rocking device that feeds them nutrients while filtering their wastes. When the cells reach a high enough number — a typical “dose” ranges from hundreds of thousands to hundreds of millions — they are formidable enough to go back into the patient. Once inside, the cancer provokes the new cells to replicate even more. After one week, a typical expansion means multiplying by about another 1,000-fold.
Practically, it looks like this: A person comes in for an appointment. She has a catheter placed in a vein, perhaps in her arm or her chest, that connects to a large, whirring machine which pulls in her blood and separates it into its components. The medical team set the T-cells aside to freeze while the rest of the blood circulates back into the patient in a closed loop. Then, the hospital ships the cells frozen to the relevant pharmaceutical company’s headquarters or transports them to a lab on-site, where thawing and manufacturing takes from a few days to a few weeks. When the cells are ready, the patient undergoes about three days of chemotherapy to kill both cancer and normal cells, making room for the millions of new cells and eradicating normal immune players that could jeopardize their existence. She then gets a day or two to rest. When the new cells are infused back into her blood, we call that Day 0.
I remember the first time I watched a patient get his Day 0 infusion. It felt anti-climactic. The entire process took about 15 minutes. The CAR-T cells are invisible to the naked eye, housed in a small plastic bag containing clear liquid.
“That’s it?” my patient asked when the nurse said it was over. The infusion part is easy. The hard part is everything that comes next.
Once the cells are in, they can’t turn off. That this may cause collateral damage was evident from the start. In 2009 — working in parallel with other researchers at Memorial Sloan Kettering Cancer Center in New York and the National Cancer Institute in Maryland — oncologists at the University of Pennsylvania opened a clinical trial for CAR-T in human leukemia patients. (Carl June, who led the CAR-T development, did not respond to Undark’s interview request.) Of the first three patients who got CAR-T infusions, two achieved complete remission — but nearly died in the process. The first was a retired corrections officer named Bill Ludwig, who developed extremely high fevers and went into multi-organ failure requiring time in the ICU. At the time, the medical teams had no idea why it was happening or how to stop it. But time passed. Ludwig got better. Then came the truly incredible part: His cancer was gone.
With only philanthropic support, the trial ran out of funding. Of the eligible patients they intended to treat, the Penn doctors only treated three. So they published the results of one patient in the New England Journal of Medicine and presented the outcomes of all three patients, including Ludwig, at a cancer conference anyway. From there, the money poured in. Based on the results, the Swiss pharmaceutical company Novartis licensed the rights of the therapy.
The next year, six-year-old Emily Whitehead was on the brink of death when she became the first child to receive CAR-T. She also became extremely ill in the ICU, and her cancer was also eventually cured. Her media savvy parents helped bring her story public, making her the poster child for CAR-T. In 2014, the FDA granted CAR-T a breakthrough therapy designation to expedite the development of extremely promising therapies. By 2017, a larger trial gave the treatment to 75 children and young adults with a type of leukemia — B-cell acute lymphoblastic leukemia — that failed to respond to chemotherapy. Eighty-one percent had no sign of cancer after three months.
In August 2017, the FDA approved a CAR-T treatment as the first gene therapy in the U.S. The decision was unanimous. The Oncologic Drugs Advisory Committee, a branch of the FDA that reviews new cancer products, voted 10 to zero in favor of Kymriah. Committee members called the responses “remarkable” and “potentially paradigm changing.” When the announcement broke, a crowd formed in the medical education center of Penn Medicine, made up of ecstatic faculty and staff. There were banners and T-shirts. “A remarkable thing happened” was the tagline, above a cartoon image of a heroic T-cell. Two months later, in October 2017, the FDA approved a second CAR-T formulation called Yescarta from Kite Pharma, a subsidiary of Gilead Sciences, to treat an aggressive blood cancer in adults called diffuse large B-cell lymphoma, the trial of which had shown a 54 percent complete response rate, meaning all signs of cancer had disappeared. In May 2018, Kymriah was approved to treat adults with non-Hodgkin lymphoma.
That year, the American Society of Clinical Oncology named CAR-T the Advance of the Year, beating out immunotherapy, which had won two years in a row. When I attended the last American Society of Hematology meeting in December 2018, CAR-T stole the show. Trying to get into CAR-T talks felt like trying to get a photo with a celebrity. Running five minutes late to one session meant facing closed doors. Others were standing room only. With every slide, it became difficult to see over a sea of smartphones snapping photos. At one session I found a seat next to the oncologist from my hospital who treated Birzer. “Look,” she nudged me. “Do you see all these ‘non-member’ badges?” I turned. Members were doctors like us who treated blood cancers. I couldn’t imagine who else would want to be here. “Who are they?” I asked. “Investors,” she said. It felt obvious the moment she said it.
For patients, the dreaded “c” word is cancer. For oncologists, it’s cure. When patients ask, I’ve noticed how we gently steer the conversation toward safer lingo. We talk about keeping the cancer in check. Cure is a dangerous word, used only when so much time has passed from her cancer diagnosis we can be reasonably certain it’s gone. But that line is arbitrary. We celebrate therapies that add weeks or months because the diseases are pugnacious, the biology diverse, and the threat of relapse looming. Oncologists are a tempered group, or so I’ve learned, finding inspiration in slow, incremental change.
This was completely different. These were patients who would have otherwise died, and the trials were boasting that 54 to 81 percent were cancer-free upon initial follow-up. PET scans showed tumors that had speckled an entire body melt away. Bone marrow biopsies were clear, with even the most sensitive testing unable to detect disease.
The dreaded word was being tossed around — could this be the cure we’ve always wanted?
When a new drug gets FDA approval, it makes its way into clinical practice, swiftly and often with little fanfare. Under the drug safety program REMS, hospitals offering CAR-T were obligated to undergo special training to monitor and manage side effects. As hospitals worked to create CAR-T programs, oncologists like me made the all too familiar transition from first-time user to expert.
It was May 2018 when I rotated through my hospital’s unit and cared for my first patients on CAR-T. As I covered 24-hour shifts, I quickly learned that whether I would sleep that night depended on how many CAR-T patients I was covering. With each treatment, it felt like we were pouring gasoline on the fire of patients’ immune systems. Some developed high fevers and their blood pressures plummeted, mimicking a serious infection. But there was no infection to be found. When resuscitating with fluids couldn’t maintain my patients’ blood pressures, I sent them to the ICU where they required intensive support to supply blood to their critical organs.
We now have a name for this effect — cytokine release syndrome — that occurs in more than half of patients who receive CAR-T, starting with Ludwig and Whitehead. The syndrome is the collateral damage of an immune system on the highest possible alert. This was first seen with other types of immunotherapy, but CAR-T took its severity to a new level. Usually starting the week after CAR-T, cytokine release syndrome can range from simple fevers to multi-organ failure affecting the liver, kidneys, heart, and more. The activated T-cells make and recruit other immune players called cytokines to join in the fight. Cytokines then recruit more immune cells. Unlike in the early trials at Penn, we now have two medicines to dampen the effect. Steroids calm the immune system in general, while a medication called tocilizumab, used to treat autoimmune disorders such as rheumatoid arthritis, blocks cytokines specifically.
Fortuity was behind the idea of tocilizumab: When Emily Whitehead, the first child to receive CAR-T, developed cytokine release syndrome, her medical team noted that her blood contained high levels of a cytokine called interleukin 6. Carl June thought of his own daughter, who had juvenile rheumatoid arthritis and was on a new FDA-approved medication that suppressed the same cytokine. The team tried the drug, tocilizumab, in Whitehead. It worked.
Still, we were cautious in our early treatments. The symptoms of cytokine release syndrome mimic the symptoms of severe infection. If this were infection, medicines that dampen a patient’s immune system would be the opposite of what you’d want to give. There was another concern: Would these medications dampen the anti-cancer activity too? We didn’t know. Whenever a CAR-T patient spiked a fever, I struggled with the question — is it cytokine release syndrome, or is it infection? I often played it safe and covered all bases, starting antibiotics and steroids at the same time. It was counterintuitive, like pressing both heat and ice on a strain, or treating a patient simultaneously with fluids and diuretics.
The second side effect was even scarier: Patients stopped talking. Some, like Sharon Birzer spoke gibberish or had violent seizures. Some couldn’t interact at all, unable to follow simple commands like “squeeze my fingers.” How? Why? At hospitals across the nation, perfectly cognitively intact people who had signed up to treat their cancer were unable to ask what was happening.
Our nurses learned to ask a standardized list of questions to catch the effect, which we called neurotoxicity: Where are we? Who is the president? What is 100 minus 10? When the patients scored too low on these quizzes, they called me to the bedside.
In turn, I relied heavily on a laminated booklet, made by other doctors who were using CAR-T, which we tacked to a bulletin board in our doctors’ workroom. It contained a short chart noting how to score severity and what to do next. I flipped through the brightly color-coded pages telling me when to order a head CT-scan to look for brain swelling and when to place scalp electrodes looking for seizures. Meanwhile, we formed new channels of communication. As I routinely called a handful of CAR-T specialists at my hospital in the middle of the night, national consortiums formed where specialists around the country shared their experiences. As we tweaked the instructions, we scribbled updates to the booklet in pen.
I wanted to know whether my experience was representative. I came across an abstract and conference talk that explored what happened to 277 patients who received CAR-T in the real world, so I emailed the lead author, Loretta Nastoupil, director of the Department of Lymphoma and Myeloma at the University of Texas MD Anderson Cancer Center in Houston. Fortuitously, she was planning a trip to my university to give a talk that month. We met at a café and I asked what her research found. Compared to the earlier trials, the patients were much sicker, she said. Of the 277 patients, more than 40 percent wouldn’t have been eligible for the very trials that got CAR-T approved. Was her team calling other centers for advice? “They were calling us,” she said.
Patients included in clinical trials are carefully selected. They tend not to have other major medical problems, as we want them to survive whatever rigorous new therapy we put them through. Nastoupil admits some of it is arbitrary. Many criteria in the CAR-T trials were based on criteria that had been used in chemotherapy trials. “These become standard languages that apply to all studies,” she said, listing benchmarks like a patient’s age, kidney function, and platelet count. “But we have no idea whether criteria for chemotherapy would apply to cellular therapy.”
Now, with a blanket FDA approval comes clinical judgment. Patients want a chance. Oncologists want to give their patients a chance. Young, old, prior cancer, heart disease, or liver disease — without strict trial criteria, anyone is fair game.
When I was making rounds at my hospital, I never wandered too far from these patients’ rooms, medically prepared for them to crash at any moment. At the same time, early side effects made me optimistic. A bizarre truism in cancer is that side effects may bode well. They could mean the treatment is working. Cancer is usually a waiting game, requiring months to learn an answer. Patients and doctors alike seek clues, but the only real way to know is waiting: Will the next PET scan show anything? What are the biopsy results?
CAR-T was fundamentally different from other cancer treatments in that it worked fast. Birzer’s first clue came just a few hours after her infusion. She developed pain in her lower back. She described it as feeling like she had menstrual cramps. A heavy burden of lymphoma lay in her uterus. Could the pain mean that the CAR-T cells had migrated to the right spot and started to work? Her medical team didn’t know, but the lead doctor’s instinct was that it was a good sign.
Two days later, her temperature shot up to 102. Her blood pressure dropped. The medical team diagnosed cytokine release syndrome, as though right on schedule, and gave her tocilizumab.
Every day, the nurses would ask her questions and have her write simple sentences on a slip of paper to monitor for neurotoxicity. By the fifth day, her answers changed. “She started saying things that were crazy,” Johnson explained.
One of Birzer's sentences was “guinea pigs eat greens like hay and pizza.” Birzer and Johnson owned two guinea pigs, so their diet would be something Birzer normally knew well. So Johnson tried to reason with her: “They don’t eat pizza.” And Birzer replied, “They do eat pizza, but only gluten-free.”
Johnson remembers being struck by the certainty in her partner’s delirium. Not only was Birzer confused, she was confident she was not. “She was doubling down on everything,” Johnson described. “She was absolutely sure she was right.”
Johnson vividly remembers the evening before the frightening early-morning phone call that brought her rushing back to the hospital. Birzer had said there was no point in Johnson staying overnight; she would only watch her be in pain. So Johnson went home. After she did, the doctor came by multiple times to evaluate Birzer. She was deteriorating — and fast. Her speech became more and more garbled. Soon she couldn’t name simple objects and didn’t know where she was. At 3 a.m., the doctor ordered a head CT to make sure Birzer wasn’t bleeding into her brain.
Fortunately, she wasn’t. But by 7 a.m. Birzer stopped speaking altogether. Then she seized. Birzer’s nurse was about to step out of the room when she noticed Birzer’s arms and legs shaking. Her eyes stared vacantly and she wet the bed. The nurse called a code blue, and a team of more doctors and nurses ran over. Birzer was loaded with high-dose anti-seizure medications through her IV. But she continued to seize. As nurses infused more medications into her IV, a doctor placed a breathing tube down her throat.
Birzer’s saga poses the big question: Why does CAR-T cause seizures and other neurologic problems? No one seemed to know. My search of the published scientific literature was thin, but one name kept cropping up. So I called her. Juliane Gust, a pediatric neurologist and scientist at Seattle Children’s Hospital, told me her investigations of how CAR-T affects the brain were motivated by her own experiences. When the early CAR-T trials opened at her hospital in 2014, she and her colleagues began getting calls from oncologists about brain toxicities they knew nothing about. “Where are the papers?” she remembered thinking. “There was nothing.”
Typically, the brain is protected by a collection of cells aptly named the blood-brain-barrier. But with severe CAR-T neurotoxicity, research suggests, this defense breaks down. Gust explained that spinal taps on these patients show high levels of cytokines floating in the fluid surrounding the spine and brain. Some CAR-T cells circulate in the fluid too, she said, but these numbers do not correlate with sicker patients. CAR-T cells are even seen in the spinal fluid of patients without any symptoms.
What does this mean? Gust interprets it as a patient’s symptoms having more to do with cytokines than the CAR-T cells. “Cytokine release syndrome is the number one risk factor” for developing neurotoxicity over the next few days, she said. The mainstay for neurotoxicity is starting steroids as soon as possible. “In the beginning we didn’t manage as aggressively. We were worried about impairing the function of the CAR-T,” she added. “Now we give steroids right away.”
But the steroids don’t always work. Several doses of steroids didn’t prevent Birzer from seizing. The morning after Johnson’s alarming phone call, after the meeting at the hospital when she learned what had happened, a chaplain walked her from the conference room to the ICU. The first day, Johnson sat by her partner’s bedside while Birzer remained unconscious. By the next evening, she woke up enough to breathe on her own. The doctors removed her breathing tube, and Birzer looked around. She had no idea who she was or where she was.
Birzer was like a newborn baby, confused and sometimes frightened by her surroundings. She frequently looked like she was about to say something, but she couldn’t find the words despite the nurses and Johnson’s encouragement. One day she spoke a few words. Eventually she learned her name. A few days later she recognized Johnson. Her life was coming back to her, though she was still suspicious of her reality. She accused the nurses of tricking her, for instance, when they told her Donald Trump was president.
She took cues from the adults around her on whether her actions were appropriate. The best example of this was her “I love you” phase. One day, she said it to Johnson in the hospital. A few nurses overheard it and commented on how sweet it was. Birzer was pleased with the reaction. So she turned to the nurse: “I love you!” And the person emptying the trash: “I love you!” Months later, she was having lunch with a friend who asked, “Do you remember when you told me you loved me?” Birzer said, “Well, I stand by that one.”
When she got home, she needed a walker to help with her shakiness on her feet. When recounting her everyday interactions, she would swap in the wrong people, substituting a friend for someone else. She saw bugs that didn’t exist. She couldn’t hold a spoon or a cup steady. Johnson would try to slow her down, but Birzer was adamant she could eat and drink without help. “Then peas would fly in my face,” Johnson said.
Patients who experience neurotoxicity fall into one of three categories. The majority are impaired but then return to normal without long-term damage. A devastating handful, less than 1 percent, develop severe brain swelling and die. The rest fall into a minority that have lingering problems even months out. These are usually struggles to think up the right word, trouble concentrating, and weakness, often requiring long courses of rehabilitation and extra help at home.
As Birzer told me about her months of rehab, I thought how she did seem to fall somewhere in the middle among the patients I’ve treated. On one end of the spectrum was the rancher who remained profoundly weak a year after his infusion. Before CAR-T, he walked across his ranch without issue; six months later, he needed a walker. Even with it, he fell on a near weekly basis. On the other end was the retired teacher who couldn’t speak for a week – she would look around her ICU room and move her mouth as though trying her hardest — and then woke up as though nothing happened. She left the hospital and instantly resumed her life, which included a recent trip across the country. In hindsight, I remember how we worried more about giving the therapy to the teacher than the rancher, as she seemed frailer. Outcomes like theirs leave me with a familiar humility I keep learning in new ways as a doctor: We often can’t predict how a patient will do. Our instincts can be just plain wrong.
I asked Gust if we have data to predict who will land in which group. While we can point to some risk factors — higher burdens of cancer, baseline cognitive problems before therapy — “the individual patient tells you nothing,” she confirmed.
So we wait.
Doctors like me who specialize in cancer regularly field heart-wrenching questions from patients. They have read about CAR-T in the news, and now they want to know: What about me? What about my cancer?
So, who gets CAR-T? That leads to the tougher question — who doesn’t? That depends on the type of cancer and whether their insurance can pay.
CAR-T is approved to treat certain leukemias and lymphomas that come from the blood and bone marrow. Since the initial approval, researchers have also set up new CAR-T trials for all sorts of solid tumors from lung cancer to kidney cancer to sarcoma. But progress has been slow. While some promising findings are coming from the lab and in small numbers of patients on early phase trials, nothing is yet approved in humans. The remarkable responses occurring in blood cancers just weren’t happening in solid tumors.
Cancer is one word, but it’s not one disease. “It’s easier to prove why something works when it works than show why it doesn’t work when it doesn’t work,” said Saar Gill, a hematologist and scientist at the University of Pennsylvania who co-founded a company called Carisma Therapeutics using CAR-T technology against solid tumors. That was his short answer, at least. The longer answer to why CAR-T hasn’t worked in solid cancers involves what Gill believes are two main barriers. First, it’s a trafficking problem. Leukemia cells tend to be easier targets; they bob through the bloodstream like buoys in an ocean. Solid tumors are more like trash islands. The cancer cells stick together and grow an assortment of supporting structures to hold the mound together. The first problem for CAR-T is that the T-cells may not be able to penetrate the islands. Then, even if the T-cells make it in, they’re faced with a hostile environment and will likely die before they can work.
At Carisma, Gill and his colleagues look to get around these obstacles though a different immune cell called the macrophage. T-cells are not the only players of the immune system, after all. Macrophages are gluttonous cells that recognize invaders and engulf them for destruction. But studies have shown they cluster in solid tumors in a way T-cells don’t. Gill hopes genetically engineered macrophages can be the stowaways that sneak into solid tumor and attack from the inside out.
Another big challenge, even for leukemias and lymphomas, is resistance, where the cancers learn to survive the CAR-T infusion. While many patients in the trials achieved remission after a month, we now have two years’ worth of data and the outlook isn’t as rosy. For lymphoma, that number is closer to 40 percent. Patients celebrating cures initially are relapsing later. Why?
The CAR-T cells we use target a specific protein on cancer cells. But if the cancer no longer expresses that protein, that can be a big problem, and we’re finding that’s exactly what’s happening. Through blood testing, we see that many patients who relapse lose the target.
Researchers are trying to regain the upper hand by designing CAR-Ts to target more than one receptor. It’s an old idea in a new frame: An arms race between our medicines and the illnesses that can evolve to evade them. Too much medical precision in these cases is actually not what we want, as it makes it easier for cancer to pinpoint what’s after it and develop an escape route. So, the reasoning goes, target multiple pieces at once. Confuse the cancer.
Then there’s the other dreaded “c” word: Cost. Novartis’ Kymriah runs up to $475,000 while Kite Pharma’s Yescarta is $373,000. That covers manufacturing and infusion. Not included is the minimum one-week hospital stay or any complications.
They are daunting numbers. Some limitations on health care we accept — maybe the patients are too sick; maybe they have the wrong disease. The wrong cost is not one we as a society look kindly upon. And drug companies shy away from that kind of attention.
Cost origins in medicine are notoriously murky. Novartis, confident in its technology, made an offer to offset the scrutiny in CAR-T. If the treatment didn’t work after one month, the company said it wouldn’t send a bill.
Not everyone agrees that cost is an issue. Gill, for example, believes the concern is over-hyped. It’s not “a major issue,” he told me over the phone. “Look, of course — [with] health care in this country, if you don’t have insurance, then you’re screwed. That is no different when it comes to CAR-T as it is for anything else,” he said. The cost conversation must also put CAR-T in context. Gill went on to list what these patients would be doing otherwise — months of chemotherapy, bone marrow transplants, hospital stays for cancer-associated complications and the associated loss of income as patients and caregivers miss work. These could add up to far more than a one-time CAR-T infusion. A bone marrow transplant, for example, can cost from $100,000 to more than $300,000. The cancer-fighting drug blinatumomab, also used to treat relapsed leukemia, costs $178,000 a year. “Any discussion of cost is completely irresponsible without weighing the other side of the equation,” Gill said.
How the system will get on board is another question. Logistics will be an issue, Gill conceded. The first national Medicare policy for covering CAR-T was announced in August 2019, two years after the first product was approved. The Centers for Medicare and Medicaid Services has offered to reimburse a set rate for CAR T-cell infusion, and while this figure was recently raised, it remains less than the total cost. Despite the expansion of medical uses, at some centers referrals for CAR-T are dropping as hospitals worry it’s a net loss. And while most commercial insurers are covering CAR-T therapies, companies less accustomed to handling complex therapies can postpone approval. Ironically, the patients considering CAR-T are the ones for whom the window for treatment is narrowest. A delay of even a few weeks can mean the difference between a cure and hospice.
This, of course, poses a big problem. A breakthrough technology is only as good as its access. A major selling point of CAR-T — besides the efficacy — is its ease. It’s a one-and-done treatment. Engineered T-cells are intended to live indefinitely, constantly on the alert if cancer tries to come back. Compare that to chemotherapy or immunotherapy, which is months of infusions or a pill taken indefinitely. CAR-T is more akin to surgery: Cut it out, pay the entire cost upfront, and you’re done.
Birzer was lucky in this respect. I asked her and Johnson if cost had factored into their decision to try CAR-T. They looked at each other. “It wasn’t an issue,” said Johnson. They remembered getting a statement in the mail for a large sum when they got home. But Birzer had good insurance. She didn’t pay a cent.
One year after Birzer’s infusion, I met her and Johnson at a coffee shop near their home in San Francisco. They had saved a table. Johnson had a newspaper open. Birzer already had her coffee, and I noticed her hand trembling as she brought it to her mouth. She described how she still struggles to find exactly the right words. She sometimes flings peas. But she’s mostly back to normal, living her everyday life. She has even returned to her passion, performing stand-up comedy, though she admitted that at least for general audiences: “My jokes about cancer didn’t kill.”
People handed a devastating diagnosis don’t spend most of their time dying. They are living, but with a heightened awareness for a timeline the rest of us take for granted. They sip coffee, enjoy their hobbies, and read the news while also getting their affairs in order and staying on the lookout, constantly, for the next treatment that could save them.
Hoping for a miracle while preparing to die are mutually compatible ideas. Many of my patients have become accustomed to living somewhere in that limbo. It is humbling to witness. They hold out hope for a plan A, however unlikely it may be, while also adjusting to the reality of a plan B. They live their lives; and they live in uncertainty.
I see patients in various stages of this limbo. In clinic, I met a man with multiple myeloma six months after a CAR-T trial that supposedly cured him. He came in with a big smile but then quietly began praying when it was time to view PET results. He asked how the other patients on the trial were doing, and I shared the stats. While percentages don’t say anything about an individual experience, they’re also all patients have to go on. When someone on the same treatment dies, it’s shattering for everyone. Was one person the exception, or a harbinger another’s fate? Who is the outlier?
I look at these patients and think a sober truth: Before CAR-T, all would likely die within six months. Now, imagine taking 40 percent and curing them. Sure, a naysayer might point out, it’s only 40 percent. What’s the hype if most still succumb to their cancer? But there was nothing close to that before CAR-T. I agree with how Gill described it: “I think CAR-T cells are like chemotherapy in the 1950s. They’re not better than chemotherapy — they’re just different.” For an adversary as tough as cancer, we’ll take any tool we can get.
There remain many questions. Can we use CAR-T earlier in a cancer’s course? Lessen the side effects? Overcome resistance? Streamline manufacturing and reimbursement? Will it work in other cancers? Patients will sign up to answer.
For now, Birzer seems to be in the lucky 40 percent. Her one-year PET scan showed no cancer. I thought of our last coffee meeting, where I had asked if she ever worried she wouldn’t return to normal. She didn’t even pause. “If you’re not dead,” she said, “you’re winning.”
Ilana Yurkiewicz, M.D., is a physician at Stanford University and a medical journalist. She is a former Scientific American Blog Network columnist and AAAS Mass Media Fellow. Her writing has also appeared in Aeon Magazine, Health Affairs, and STAT News, and has been featured in "The Best American Science and Nature Writing."
This article was originally published on Undark. Read the original article.
Collaborating in the Care of Spinal Muscular Atrophy: A Multidisciplinary Approach to Timely Screening, Diagnosis, and Management
How prepared are you to recognize and meet the needs of patients with spinal muscular atrophy?
Learn more about spinal muscular atrophy in this supplement to Neurology Reviews.
Click here to read.
Supplement Faculty
How prepared are you to recognize and meet the needs of patients with spinal muscular atrophy?
Learn more about spinal muscular atrophy in this supplement to Neurology Reviews.
Click here to read.
Supplement Faculty
How prepared are you to recognize and meet the needs of patients with spinal muscular atrophy?
Learn more about spinal muscular atrophy in this supplement to Neurology Reviews.
Click here to read.
Supplement Faculty
No infection increase seen with biologics in older psoriasis patients
MADRID – Psoriasis patients aged 65 years and older are at more than twice the risk of serious bacterial and opportunistic infections, compared with younger patients, but that risk is not further elevated by being on biologic agents, Joseph F. Merola, MD, reported at the annual congress of the European Academy of Dermatology and Venereology.

He presented a large, The study implications, he said, are clear: When moderate to severe psoriasis warrants consideration of highly effective biologic therapies, that therapeutic option shouldn’t be taken off the table on the basis of a mistaken belief that biologics pose a greater infection risk just because the affected patient is over age 65 years.
“We really think that older patients should be offered treatments at the same level of disease control as all the rest of our psoriasis patients, in the context of shared decision making,” said Dr. Merola, a dermatologist and rheumatologist who is the director of the Center for Skin and Related Musculoskeletal Diseases at Brigham and Women’s Hospital, Boston.
The study utilized longitudinal claims data from a very large U.S. database covering the years 2003-2017. Among the 185 million covered lives were 1.1 million individuals with psoriasis, including 150,000 aged 65 years or older. After excluding older psoriasis patients with comorbid cancer or autoimmune disease, the investigators were left with 11,218 older psoriasis patients initiating systemic therapy for the first time and therefore eligible for propensity score matching using a highly accurate proprietary platform. The final study population consisted of 2,795 older psoriasis patients newly initiating biologic therapy, 2,795 others newly initiating nonbiologic systemic agents, and 2,529 seniors starting phototherapy. The matching was based upon factors including age, sex, prior infections, comorbid psoriatic arthritis, diabetes, and obesity.
The primary study endpoint was the rate of serious bacterial or opportunistic infections requiring hospitalization during the first 6 months of treatment. The bottom line: The rates were closely similar across all three groups, with the most common serious infections being pneumonia and cellulitis.
In contrast, among a population of 115,047 senior psoriasis patients who never used systemic therapy, the risk of serious infection was 12.2 events per 1,000 patients over 6 months, compared with 5.3 events in 120,174 matched controls without psoriasis. That translates to a 2.24-fold increased risk.
One audience member commented that a limitation of the study was that all biologics were lumped together. He would expect that the tumor necrosis factor inhibitors, for example, would be associated with a significantly higher serious infection risk than biologics with other targets.
Dr. Merola conceded the point, adding that the investigators are trying to reanalyze the data in a more granular way to address that shortcoming. Other study limitations included an inability to access the specific doses of systemic treatments used or to stratify patients by disease severity.
Another audience member noted that dermatologists often reassure surgeons that there’s no increased risk of infection associated with psoriasis when in fact there is increased risk in older psoriasis patients, according to these new data.
“We’re not trying to send a message to surgeons to withhold a knee transplant because of a psoriasis plaque over the knee,” Dr. Merola replied. “I think we’ve all been there; we’ve all fought that battle.” Based on the data, he said, he would advise that “our patients who need to be on systemics should remain appropriately on systemics as we see fit.”
The study was entirely funded by Brigham and Women’s Hospital. Dr. Merola reported serving as a consultant to and/or recipient of research grants from nearly two dozen pharmaceutical companies.
MADRID – Psoriasis patients aged 65 years and older are at more than twice the risk of serious bacterial and opportunistic infections, compared with younger patients, but that risk is not further elevated by being on biologic agents, Joseph F. Merola, MD, reported at the annual congress of the European Academy of Dermatology and Venereology.
He presented a large, The study implications, he said, are clear: When moderate to severe psoriasis warrants consideration of highly effective biologic therapies, that therapeutic option shouldn’t be taken off the table on the basis of a mistaken belief that biologics pose a greater infection risk just because the affected patient is over age 65 years.
“We really think that older patients should be offered treatments at the same level of disease control as all the rest of our psoriasis patients, in the context of shared decision making,” said Dr. Merola, a dermatologist and rheumatologist who is the director of the Center for Skin and Related Musculoskeletal Diseases at Brigham and Women’s Hospital, Boston.
The study utilized longitudinal claims data from a very large U.S. database covering the years 2003-2017. Among the 185 million covered lives were 1.1 million individuals with psoriasis, including 150,000 aged 65 years or older. After excluding older psoriasis patients with comorbid cancer or autoimmune disease, the investigators were left with 11,218 older psoriasis patients initiating systemic therapy for the first time and therefore eligible for propensity score matching using a highly accurate proprietary platform. The final study population consisted of 2,795 older psoriasis patients newly initiating biologic therapy, 2,795 others newly initiating nonbiologic systemic agents, and 2,529 seniors starting phototherapy. The matching was based upon factors including age, sex, prior infections, comorbid psoriatic arthritis, diabetes, and obesity.
The primary study endpoint was the rate of serious bacterial or opportunistic infections requiring hospitalization during the first 6 months of treatment. The bottom line: The rates were closely similar across all three groups, with the most common serious infections being pneumonia and cellulitis.
In contrast, among a population of 115,047 senior psoriasis patients who never used systemic therapy, the risk of serious infection was 12.2 events per 1,000 patients over 6 months, compared with 5.3 events in 120,174 matched controls without psoriasis. That translates to a 2.24-fold increased risk.
One audience member commented that a limitation of the study was that all biologics were lumped together. He would expect that the tumor necrosis factor inhibitors, for example, would be associated with a significantly higher serious infection risk than biologics with other targets.
Dr. Merola conceded the point, adding that the investigators are trying to reanalyze the data in a more granular way to address that shortcoming. Other study limitations included an inability to access the specific doses of systemic treatments used or to stratify patients by disease severity.
Another audience member noted that dermatologists often reassure surgeons that there’s no increased risk of infection associated with psoriasis when in fact there is increased risk in older psoriasis patients, according to these new data.
“We’re not trying to send a message to surgeons to withhold a knee transplant because of a psoriasis plaque over the knee,” Dr. Merola replied. “I think we’ve all been there; we’ve all fought that battle.” Based on the data, he said, he would advise that “our patients who need to be on systemics should remain appropriately on systemics as we see fit.”
The study was entirely funded by Brigham and Women’s Hospital. Dr. Merola reported serving as a consultant to and/or recipient of research grants from nearly two dozen pharmaceutical companies.
REPORTING FROM EADV 2019
GABA falls short for type 1 diabetes prevention in children
BARCELONA – Gamma aminobutyric acid (GABA) alone or given in combination with glutamic acid decarboxylase (GAD) had little to no effect on the progression of type 1 diabetes in children, according to early data presented at the annual meeting of the European Association for the Study of Diabetes.
There was no difference between the two active treatment groups and placebo for the primary outcome measure, which was the effect on meal-stimulated C-peptide secretion before and after 1 year of treatment, study investigator Kenneth L. McCormick, MD, reported, nor was there any difference in glycemic control, based on hemoglobin A1c (HbA1c) and insulin dose, between the children who received GABA alone (n = 39) or combined with GAD (n = 22), and those who received placebo (n = 30).
“However, the GABA–GAD combination tended to have greater efficacy [than placebo] in terms of the daily insulin dose and the fasting C-peptide–to–glucagon ratio,” said Dr. McCormick, a pediatric endocrinologist at the University of Alabama at Birmingham.
“At 12 months, fasting glucagon was reduced [P less than .013] in the GABA–GAD group, compared with placebo,” he said. This was a “novel observation,” because stimulated glucagon was also reduced in this cohort. “This could be a potential salutatory metabolic effect in diabetes.”
The data were the first to be reported from the trial, and results of the immunologic analyses should be available by the end of the year and might reveal more positive effects of GABA and GAD, Dr. McCormick suggested. Data from a “proinsulin analysis” will also be available later.
The inspiration for the trial was a study performed in mice showing that GABA exerted a protective and regenerative effect on the islet beta cells and “reversed diabetes” (Proc Natl Acad Sci USA. 2011;108:11692-7). It took almost 4 years from the publication of that study to enroll the first patient for the current study.
“GABA was intriguing ... first of all, it is available in health food stores and in supermarkets in the United States,” said Dr. McCormick. “It has a strong safety profile, it’s tasteless, and can be given orally – what better could you ask for in a trial of children with type 1 diabetes?”
GABA is thought to have multiple effects in the pancreas, from increasing insulin secretion and suppressing glucagon secretion, to altering inflammation and T-cell populations. “That’s what’s so important to emphasize, besides its metabolic effects, this compound also has immunosuppressant action,” Dr. McCormick noted.
The study hypothesis was that treatment with oral GABA, or a combination of GABA–GAD, would hinder the progression of new-onset type 1 diabetes. The double-blind trial was designed to run for 1 year (Contemp Clin Trials. 2019;82:93-100) and recruited 97 children with newly diagnosed type 1 diabetes, aged 4-18 years, who were randomized to the three study groups. They were evaluated at baseline and months 1, 5, 8, and 12.
The trial had several limitations, however, which might explain the findings. A key limitation was that the researchers used a low dose of GABA – 1 to 1.5 g/m2 a day, given as a twice-daily oral dose, as mandated by the Food and Drug Administration. “For the GABA dose and the response, we are at the threshold. I don’t believe we are overdosing these kids,” Dr. McCormick said, noting that this is the first study done with GABA in humans.
In fact, GABA has a short half-life of around 2.5-5 hours, so the dose may need to be much higher to show an effect and perhaps administered three times a day, he said.
Another limitation was compliance with the twice-daily medication, especially because 35% of the patients were teenagers, and that it was a young population, with about a third of the patients aged younger that 8 years.
GABA and GABA–GAD should still be studied further, Dr. McCormick concluded, but “additional studies with a higher dose of GABA [given] three times a day, and not twice, are warranted.” Such studies also need to have more participants in each group.
The University of Alabama at Birmingham sponsored the study. Collaborators included Diamyd, NOW Foods, Janssen, and the Juvenile Diabetes Research Foundation. Dr. McCormick did not have any disclosures.
SOURCE: McCormick KL et al. EASD 2019, Abstract S05.1.
REPORTING FROM EASD 2019
Thromboembolic events more likely among CIDP patients with CVAD
AUSTIN, TEX. – Patients with chronic inflammatory demyelinating polyneuropathy (CIDP) who receive intravenous immunoglobulin (IVIg) appear to have an increased risk of thromboembolic events if it is administered with a central venous access device (CVAD) when compared against those without a CVAD, according to a recent study.
Although CVADs can reliably deliver IVIg, they also represent an established risk factor for thromboembolic events, Ami Patel, PhD, a senior epidemiologist at CSL Behring, and colleagues noted on their poster at the annual meeting of the American Association for Neuromuscular and Electrodiagnostic Medicine.
The results suggest a need for physicians to be vigilant about patients’ potential risk factors for thromboembolic events, Dr. Patel said in an interview. Further research is planned, however, because the current study did not control for other risk factors or explore other possible confounding, she said.
Dr. Patel and her associates analyzed U.S. claims data (IBM/Truven MarketScan) from 2006 to 2018 and included all patients with a CIDP diagnosis claim and a postdiagnosis code for IVIg. A code for CVAD up to 2 months before CIDP diagnosis without removal before IVIg treatment ended determined those with CVAD exposure, and thromboembolic events included any codes related to arterial, venous, or vascular prostheses.
The researchers then compared patients in a case-control fashion, matching each one with a CVAD to five patients of similar demographics without a CVAD. Characteristics used for matching included medical insurance type, prescription data availability, sex, age, geographic region, and years enrolled in the database.
Among 7,447 patients with at least one IVIg claim, 11.8% (n = 882) had CVAD exposure and 88.2% (n = 6,565) did not. Of those without a CVAD, 3,642 patients were matched to patients with CVAD. A quarter (25.4%) of patients with a CVAD had a thromboembolic event, compared with 11.2% of matched patients without CVADs (P less than .0001).
In the year leading up to IVIg therapy, 16.9% of those with a CVAD and 10.9% of matched patients without one had a previous thromboembolic event (P less than .0001). Patients with a CVAD also had significantly higher rates of hypertension (51.9% vs. 45.0% with placebo; P less than .001) and anticoagulation therapy (7.0% vs. 5.2% with placebo; P less than .05). Differences between the groups were not significant for diabetes (26.9% vs. 24.2%) and hyperlipidemia (19.1% vs. 17.8%).
Occlusion and stenosis of the carotid artery was the most common arterial thromboembolic outcome, occurring in 5.3% of those with a CVAD and in 2.8% of those without a CVAD. The most common venous thromboembolic event was acute venous embolism and thrombosis of lower-extremity deep vessels, which occurred in 7% of those with a CVAD and in 1.8% of those without.
The researchers also compared inpatient admissions and emergency department visits among those with and without a CVAD; both rates were higher in patients with a CVAD. Visits to the emergency department occurred at a rate of 0.14 events per month for those with a CVAD (2.01 distinct months with a claim) and 0.09 events per month for those without a CVAD (0.65 distinct months with a claim). Patients with a CVAD had 1.44 months with an inpatient admissions claim, in comparison with 0.41 months among matched patients without a CVAD. Inpatient admission frequency per month was 0.14 for those with a CVAD and 0.08 for those without.
The research was funded by CSL Behring. Dr. Patel and two of the other five authors are employees of CSL Behring.
SOURCE: Patel A et al. AANEM 2019, Abstract 94.
REPORTING FROM AANEM 2019
Consider renal function in TLS risk assessment of venetoclax-treated CLL
EDINBURGH – Impaired renal function may indicate excess risk of tumor lysis syndrome (TLS) in venetoclax-treated chronic lymphocytic leukemia (CLL) patients and should be considered when assessing TLS risk, according to findings from a retrospective cohort study.

Complex karyotype may also affect TLS risk, Anthony Mato, MD, reported at the International Workshop on Chronic Lymphocytic Leukemia.
Of 339 CLL patients who were treated with venetoclax, 38%, 34%, and 28% were considered to have low, medium, or high risk for TLS, respectively, according to the standard definition based on absolute lymphocyte count as a measure of tumor burden and/or lymph node size.
TLS occurred in 35 patients (10%), including 26 cases of laboratory-confirmed TLS and 9 clinical TLS cases; 1 patient required dialysis and 1 death occurred, which was attributable to the TLS, Dr. Mato of Memorial Sloan Kettering Cancer Center, New York, and colleagues reported in a poster at the workshop.
Univariate analysis was performed to “understand baseline factors associated with TLS development during dose escalation,” and it examined sex, creatinine clearance (CrCl), complex karyotype, immunoglobulin heavy chain variable mutation status, prior ibrutinib exposure, venetoclax monotherapy vs. combination therapy, and TLS risk group. The investigators observed no significant difference between the low- and medium-risk patients, therefore those two groups were combined and compared with the high-risk patients.
The univariate analysis showed significant associations between TLS and CrCl (odds ratio, 2.9 for 80 mL/min or less vs. greater than 80 mL/min), complex karyotype (OR, 2.2), and low/medium vs. high TLS risk based on the standard definition (OR, 2.56).
A multivariable analysis of the predictors identified as significant in the univariate analyses showed that standard TLS risk group and CrCl remained independent predictors of TLS.
“Although the odds ratio for complex karyotype suggested potential clinical significance, this did not meet the threshold for statistical significance and was not included in the final model,” they wrote.
The area under the receiver operating characteristic curve for a model including TLS risk group and CrCl was 74.6%, compared with 65% for the area under the ROC curve using the standard tumor burden/lymph node size approach for defining TLS risk, which is described in the venetoclax package insert.
Patients included in the study had a median age of 67 years at venetoclax initiation, 69% were men, 85% were white, and 13% were treated on a clinical trial. Complex karyotype was present in 39%, del(17p) in 43%, and 84% had immunoglobulin heavy chain variable–unmutated disease.
Most patients received venetoclax monotherapy (79%), had relapsed/refractory disease (94%), and had previously received ibrutinib (78%). The median number of prior therapies was 3, but the number ranged from 0-15, the investigators noted.
The findings of this study suggest that, in addition to defining risk based on absolute lymphocyte count and lymph node size, patients with CrCl less than 80 mL/min – indicating impaired renal function – have excess risk of TLS.
Although complex karyotype did not reach statistical significance as an independent predictor of TLS, the findings in this study suggest it “may impact TLS risk and is worthy of further study in larger samples,” they said, concluding that consideration of baseline renal function, and possibly karyotype, could “further guide practitioners in their approach to prophylaxis and patient counseling, allowing for improved safety in the use of this effective agent in CLL.”
Additional planned analyses will focus on TLS risk score development and further refinement of TLS risk stratification, they noted.
Dr. Mato has received grant support, consulting fees, and/or fees for serving on a data and safety monitoring board or advisory board from AbbVie, AstraZeneca, Celgene, Janssen, TG Therapeutics, Pharmacyclics, Loxo, Sunesis, prIME Oncology, Pfizer, Johnson & Johnson, and Regeneron.
EDINBURGH – Impaired renal function may indicate excess risk of tumor lysis syndrome (TLS) in venetoclax-treated chronic lymphocytic leukemia (CLL) patients and should be considered when assessing TLS risk, according to findings from a retrospective cohort study.
Complex karyotype may also affect TLS risk, Anthony Mato, MD, reported at the International Workshop on Chronic Lymphocytic Leukemia.
Of 339 CLL patients who were treated with venetoclax, 38%, 34%, and 28% were considered to have low, medium, or high risk for TLS, respectively, according to the standard definition based on absolute lymphocyte count as a measure of tumor burden and/or lymph node size.
TLS occurred in 35 patients (10%), including 26 cases of laboratory-confirmed TLS and 9 clinical TLS cases; 1 patient required dialysis and 1 death occurred, which was attributable to the TLS, Dr. Mato of Memorial Sloan Kettering Cancer Center, New York, and colleagues reported in a poster at the workshop.
Univariate analysis was performed to “understand baseline factors associated with TLS development during dose escalation,” and it examined sex, creatinine clearance (CrCl), complex karyotype, immunoglobulin heavy chain variable mutation status, prior ibrutinib exposure, venetoclax monotherapy vs. combination therapy, and TLS risk group. The investigators observed no significant difference between the low- and medium-risk patients, therefore those two groups were combined and compared with the high-risk patients.
The univariate analysis showed significant associations between TLS and CrCl (odds ratio, 2.9 for 80 mL/min or less vs. greater than 80 mL/min), complex karyotype (OR, 2.2), and low/medium vs. high TLS risk based on the standard definition (OR, 2.56).
A multivariable analysis of the predictors identified as significant in the univariate analyses showed that standard TLS risk group and CrCl remained independent predictors of TLS.
“Although the odds ratio for complex karyotype suggested potential clinical significance, this did not meet the threshold for statistical significance and was not included in the final model,” they wrote.
The area under the receiver operating characteristic curve for a model including TLS risk group and CrCl was 74.6%, compared with 65% for the area under the ROC curve using the standard tumor burden/lymph node size approach for defining TLS risk, which is described in the venetoclax package insert.
Patients included in the study had a median age of 67 years at venetoclax initiation, 69% were men, 85% were white, and 13% were treated on a clinical trial. Complex karyotype was present in 39%, del(17p) in 43%, and 84% had immunoglobulin heavy chain variable–unmutated disease.
Most patients received venetoclax monotherapy (79%), had relapsed/refractory disease (94%), and had previously received ibrutinib (78%). The median number of prior therapies was 3, but the number ranged from 0-15, the investigators noted.
The findings of this study suggest that, in addition to defining risk based on absolute lymphocyte count and lymph node size, patients with CrCl less than 80 mL/min – indicating impaired renal function – have excess risk of TLS.
Although complex karyotype did not reach statistical significance as an independent predictor of TLS, the findings in this study suggest it “may impact TLS risk and is worthy of further study in larger samples,” they said, concluding that consideration of baseline renal function, and possibly karyotype, could “further guide practitioners in their approach to prophylaxis and patient counseling, allowing for improved safety in the use of this effective agent in CLL.”
Additional planned analyses will focus on TLS risk score development and further refinement of TLS risk stratification, they noted.
Dr. Mato has received grant support, consulting fees, and/or fees for serving on a data and safety monitoring board or advisory board from AbbVie, AstraZeneca, Celgene, Janssen, TG Therapeutics, Pharmacyclics, Loxo, Sunesis, prIME Oncology, Pfizer, Johnson & Johnson, and Regeneron.
REPORTING FROM iwCLL 2019
CDC, FDA in hot pursuit of source of vaping lung injuries
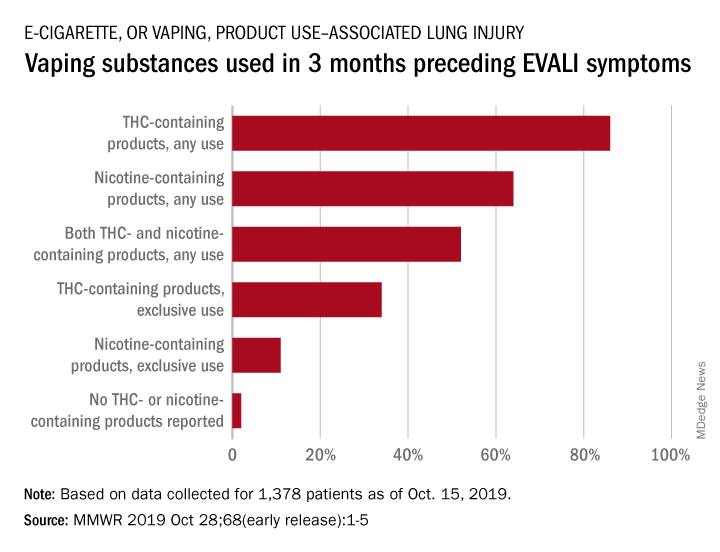
The Centers for Disease Control and Prevention is providing frequent updates of the wide-ranging and aggressive investigation of the cases and deaths linked to vaping, and although a definitive cause remains unknown, evidence is accumulating to implicate tetrahydrocannabinol (THC)-containing devices. The investigation is being conducted in concert with the Food and Drug Administration, many state and local health departments, and public health and clinical partners.
The acronym EVALI has been developed by CDC to refer to e-cigarette, or vaping products use–associated lung injury. In a report summarizing data up to Oct. 22, CDC reported 1,604 EVALI cases and 34 deaths. These cases have occurred in all U.S. states (except Alaska), the District of Columbia, and the U.S. Virgin Islands. The CDC also published a report in the Morbidity and Mortality Weekly report on characteristics of those patients who have died from EVALI-based symptoms as of Oct. 15, 2019.
With data available for more than 867 patients with EVALI, about 86% had a history of using e-cigarette or vaping products that contained THC in the previous 90 days; 64% reported using nicotine-containing products; 34% reported exclusive use of THC-containing products, and 11% reported exclusive use of nicotine-containing products; 52% reported use of both.
In a telebriefing on Oct. 25, Anne Schuchat, MD, CDC principal deputy director, said, “The data do continue to point towards THC-containing products as the source of the vast majority of individuals’ lung injury. There are continuing cases that do not report that history. But I’d like to stress that we don’t know what the risky material or substance is. THC may be a marker for a way that cartridges were prepared or the way that the devices are producing harm. Whether there are similar activities going on with cartridges that don’t contain THC, for instance, remains to be seen. So, I think we are seeing the THC as a marker for products that are risky.”
EVALI deaths
Among the 29 deaths reported as of Oct. 15, 59% (17) were male; the median age was 45 years (range, 17-75 years), 55 years (range, 17-71 years) among males, and 43 years (range, 27-75 years) among females; the age difference between males and females was not statistically significant. Patients who died tended to be older than patients who survived. Among 19 EVALI patients who died and for whom data on substance use was available, the use of any THC-containing products was reported by patients or proxies for 84% (16), including 63% (12) who exclusively used THC-containing products. Use of any nicotine-containing products was reported for 37% (7), including 16% (3) who exclusively used nicotine-containing products. Use of both THC- and nicotine-containing products was reported in four of those who died.
Investigation update
Mitch Zeller, JD, director, Center for Tobacco Products at the Food and Drug Administration, participated in the telebriefing and provided an update on the ongoing investigation. “State of the art methods are being used to assess the presence of a broad range of chemicals including nicotine, THC, and other cannabinoids, opioids, additives, pesticides, poisons and toxins,” he said. “FDA has received or collected over 900 samples from 25 states to date. Those numbers continue to increase. The samples [were] collected directly from consumers, hospitals, and from state offices include vaping devices and products that contain liquid as well as packaging and some nearly empty containers.” He cautioned that identifying the substance is “but one piece of the puzzle and will not necessarily answer questions about causality.” He also noted that the self-reports of THC and/or nicotine could mean that there is misreported data, because reports in many cases are coming from teens and from jurisdictions in which THC is not legal.

The issue of whether EVALI has been seen in recent years but not recognized or whether EVALI is a new phenomenon was raised by a caller at the telebriefing. Dr. Schuchat responded, “We are aware of older cases that look similar to what we are seeing now. But we do not believe that this outbreak or surge in cases is due to better recognition.” She suggested that some evidence points to cutting agents being introduced to increase profits of e-cigarettes and that risky and unknown substances have been introduced into the supply chain.
A “handful” of cases of readmission have been reported, and the CDC is currently investigating whether these cases included patients who took up vaping again or had some other possible contributing factor. Dr. Schuchat cautioned recovering patients not to resume vaping because of the risk of readmission and the probability that their lungs will remain in a weakened state.
Clinical guidance update
The CDC provided detailed interim clinical guidance on evaluating and caring for patients with EVALI. The recommendations focus on patient history, lab testing, criteria for hospitalization, and follow-up for these patients.
Obtaining a detailed history of patients presenting with suspected EVALI is especially important for this patient population, given the many unknowns surrounding this condition, according to the CDC. The updated guidance states, “All health care providers evaluating patients for EVALI should ask about the use of e-cigarette or vaping products, and ideally should ask about types of substances used (e.g.,THC, cannabis [oil, dabs], nicotine, modified products or the addition of substances not intended by the manufacturer); product source, specific product brand and name; duration and frequency of use, time of last use; product delivery system and method of use (aerosolization, dabbing, or dripping).” The approach recommended for soliciting accurate information is “empathetic, nonjudgmental” and, the guidelines say, patients should be questioned in private regarding sensitive information to assure confidentiality.
A respiratory virus panel is recommended for all suspected EVALI patients, although at this time, these tests cannot be used to distinguish EVALI from infectious etiologies. All patients should be considered for urine toxicology testing, including testing for THC.
Imaging guidance for suspected EVALI patients includes chest x-ray, with additional CT scan when the x-ray result does not correlate with clinical findings or to evaluate severe or worsening disease.
Recommended criteria for hospitalization of patients with suspected EVALI are those patients with decreased O2 saturation (less than 95%) on room air, in respiratory distress, or with comorbidities that compromise pulmonary reserve. As of Oct. 8, 96% of patients with suspected EVALI reported to the CDC have been hospitalized.
As for medical treatment of these patients, corticosteroids have been found to be helpful. The statement noted, “Among 140 cases reported nationally to CDC that received corticosteroids, 82% of patients improved.”
The natural progression of this injury is not known, however, and it is possible that patients might recover without corticosteroids. Given the unknown etiology of the disease and “because the diagnosis remains one of exclusion, aggressive empiric therapy with corticosteroids, antimicrobial, and antiviral therapy might be warranted for patients with severe illness. A range of corticosteroid doses, durations, and taper plans might be considered on a case-by-case basis.”
The report concluded with a strong recommendation that patients hospitalized with EVALI are followed closely with a visit 1-2 weeks after discharge and again with additional testing 1-2 months later. Health care providers are also advised to consult medical specialists, in particular pulmonologists, who can offer further evaluation, recommend empiric treatment, and review indications for bronchoscopy.
CPT coding for EVALI
CDC has issued coding guidance to help track EVALI. The document was posted on the CDC website. The coding guidance is consistent with current clinical knowledge about EVALI-related disorders and is intended for use in conjunction with current ICD-10-CM classifications.
The following conditions associated with EVALI are covered in the new coding guidance:
- Bronchitis and pneumonitis caused by chemicals, gases, and fumes; including chemical pneumonitis; J68.0.
- Pneumonitis caused by inhalation of oils and essences; including lipoid pneumonia; J69.1.
- Acute respiratory distress syndrome; J80.
- Pulmonary eosinophilia, not elsewhere classified; J82.
- Acute interstitial pneumonitis; J84.114.
The document notes that the coding guidance has been approved by the National Center for Health Statistics, the American Health Information Management Association, the American Hospital Association, and the Centers for Medicare & Medicaid Services.
Investigation continues
Mr. Zeller cautioned that this investigation will not be concluded in the near future. He noted, “We are committed to working to [solve the mystery] just as quickly as we can, but we also recognize that it will likely take some time. Importantly, the diversity of the patients and the products or substances they have reported using and the samples being tested may mean ultimately that there are multiple causes of these injuries.”
Richard Franki and Gregory Twachtman contributed to this story.
The Centers for Disease Control and Prevention is providing frequent updates of the wide-ranging and aggressive investigation of the cases and deaths linked to vaping, and although a definitive cause remains unknown, evidence is accumulating to implicate tetrahydrocannabinol (THC)-containing devices. The investigation is being conducted in concert with the Food and Drug Administration, many state and local health departments, and public health and clinical partners.
The acronym EVALI has been developed by CDC to refer to e-cigarette, or vaping products use–associated lung injury. In a report summarizing data up to Oct. 22, CDC reported 1,604 EVALI cases and 34 deaths. These cases have occurred in all U.S. states (except Alaska), the District of Columbia, and the U.S. Virgin Islands. The CDC also published a report in the Morbidity and Mortality Weekly report on characteristics of those patients who have died from EVALI-based symptoms as of Oct. 15, 2019.
With data available for more than 867 patients with EVALI, about 86% had a history of using e-cigarette or vaping products that contained THC in the previous 90 days; 64% reported using nicotine-containing products; 34% reported exclusive use of THC-containing products, and 11% reported exclusive use of nicotine-containing products; 52% reported use of both.
In a telebriefing on Oct. 25, Anne Schuchat, MD, CDC principal deputy director, said, “The data do continue to point towards THC-containing products as the source of the vast majority of individuals’ lung injury. There are continuing cases that do not report that history. But I’d like to stress that we don’t know what the risky material or substance is. THC may be a marker for a way that cartridges were prepared or the way that the devices are producing harm. Whether there are similar activities going on with cartridges that don’t contain THC, for instance, remains to be seen. So, I think we are seeing the THC as a marker for products that are risky.”
EVALI deaths
Among the 29 deaths reported as of Oct. 15, 59% (17) were male; the median age was 45 years (range, 17-75 years), 55 years (range, 17-71 years) among males, and 43 years (range, 27-75 years) among females; the age difference between males and females was not statistically significant. Patients who died tended to be older than patients who survived. Among 19 EVALI patients who died and for whom data on substance use was available, the use of any THC-containing products was reported by patients or proxies for 84% (16), including 63% (12) who exclusively used THC-containing products. Use of any nicotine-containing products was reported for 37% (7), including 16% (3) who exclusively used nicotine-containing products. Use of both THC- and nicotine-containing products was reported in four of those who died.
Investigation update
Mitch Zeller, JD, director, Center for Tobacco Products at the Food and Drug Administration, participated in the telebriefing and provided an update on the ongoing investigation. “State of the art methods are being used to assess the presence of a broad range of chemicals including nicotine, THC, and other cannabinoids, opioids, additives, pesticides, poisons and toxins,” he said. “FDA has received or collected over 900 samples from 25 states to date. Those numbers continue to increase. The samples [were] collected directly from consumers, hospitals, and from state offices include vaping devices and products that contain liquid as well as packaging and some nearly empty containers.” He cautioned that identifying the substance is “but one piece of the puzzle and will not necessarily answer questions about causality.” He also noted that the self-reports of THC and/or nicotine could mean that there is misreported data, because reports in many cases are coming from teens and from jurisdictions in which THC is not legal.
The issue of whether EVALI has been seen in recent years but not recognized or whether EVALI is a new phenomenon was raised by a caller at the telebriefing. Dr. Schuchat responded, “We are aware of older cases that look similar to what we are seeing now. But we do not believe that this outbreak or surge in cases is due to better recognition.” She suggested that some evidence points to cutting agents being introduced to increase profits of e-cigarettes and that risky and unknown substances have been introduced into the supply chain.
A “handful” of cases of readmission have been reported, and the CDC is currently investigating whether these cases included patients who took up vaping again or had some other possible contributing factor. Dr. Schuchat cautioned recovering patients not to resume vaping because of the risk of readmission and the probability that their lungs will remain in a weakened state.
Clinical guidance update
The CDC provided detailed interim clinical guidance on evaluating and caring for patients with EVALI. The recommendations focus on patient history, lab testing, criteria for hospitalization, and follow-up for these patients.
Obtaining a detailed history of patients presenting with suspected EVALI is especially important for this patient population, given the many unknowns surrounding this condition, according to the CDC. The updated guidance states, “All health care providers evaluating patients for EVALI should ask about the use of e-cigarette or vaping products, and ideally should ask about types of substances used (e.g.,THC, cannabis [oil, dabs], nicotine, modified products or the addition of substances not intended by the manufacturer); product source, specific product brand and name; duration and frequency of use, time of last use; product delivery system and method of use (aerosolization, dabbing, or dripping).” The approach recommended for soliciting accurate information is “empathetic, nonjudgmental” and, the guidelines say, patients should be questioned in private regarding sensitive information to assure confidentiality.
A respiratory virus panel is recommended for all suspected EVALI patients, although at this time, these tests cannot be used to distinguish EVALI from infectious etiologies. All patients should be considered for urine toxicology testing, including testing for THC.
Imaging guidance for suspected EVALI patients includes chest x-ray, with additional CT scan when the x-ray result does not correlate with clinical findings or to evaluate severe or worsening disease.
Recommended criteria for hospitalization of patients with suspected EVALI are those patients with decreased O2 saturation (less than 95%) on room air, in respiratory distress, or with comorbidities that compromise pulmonary reserve. As of Oct. 8, 96% of patients with suspected EVALI reported to the CDC have been hospitalized.
As for medical treatment of these patients, corticosteroids have been found to be helpful. The statement noted, “Among 140 cases reported nationally to CDC that received corticosteroids, 82% of patients improved.”
The natural progression of this injury is not known, however, and it is possible that patients might recover without corticosteroids. Given the unknown etiology of the disease and “because the diagnosis remains one of exclusion, aggressive empiric therapy with corticosteroids, antimicrobial, and antiviral therapy might be warranted for patients with severe illness. A range of corticosteroid doses, durations, and taper plans might be considered on a case-by-case basis.”
The report concluded with a strong recommendation that patients hospitalized with EVALI are followed closely with a visit 1-2 weeks after discharge and again with additional testing 1-2 months later. Health care providers are also advised to consult medical specialists, in particular pulmonologists, who can offer further evaluation, recommend empiric treatment, and review indications for bronchoscopy.
CPT coding for EVALI
CDC has issued coding guidance to help track EVALI. The document was posted on the CDC website. The coding guidance is consistent with current clinical knowledge about EVALI-related disorders and is intended for use in conjunction with current ICD-10-CM classifications.
The following conditions associated with EVALI are covered in the new coding guidance:
- Bronchitis and pneumonitis caused by chemicals, gases, and fumes; including chemical pneumonitis; J68.0.
- Pneumonitis caused by inhalation of oils and essences; including lipoid pneumonia; J69.1.
- Acute respiratory distress syndrome; J80.
- Pulmonary eosinophilia, not elsewhere classified; J82.
- Acute interstitial pneumonitis; J84.114.
The document notes that the coding guidance has been approved by the National Center for Health Statistics, the American Health Information Management Association, the American Hospital Association, and the Centers for Medicare & Medicaid Services.
Investigation continues
Mr. Zeller cautioned that this investigation will not be concluded in the near future. He noted, “We are committed to working to [solve the mystery] just as quickly as we can, but we also recognize that it will likely take some time. Importantly, the diversity of the patients and the products or substances they have reported using and the samples being tested may mean ultimately that there are multiple causes of these injuries.”
Richard Franki and Gregory Twachtman contributed to this story.