User login
Data-driven prescribing
Computational psychiatry is an emerging field in which artificial intelligence and machine learning are used to find hidden patterns in big data to better understand, predict, and treat mental illness. The field uses various mathematical models to predict the dependent variable y based on the independent variable x. One application of analytics in medicine was the Framingham Heart Study, which used multivariate logistic regression to predict heart disease.1
Analytics could be used to predict the number of bad outcomes associated with different psychiatric medications over time. To demonstrate this, I examined a select data set of 8 psychiatric medications (aripiprazole, ziprasidone, risperidone, olanzapine, sertraline, trazodone, amitriptyline, and lithium) accounting for 59,827 bad outcomes during a 15-year period as reported by U.S. poison control centers,2 and plotted these on the y-axis.
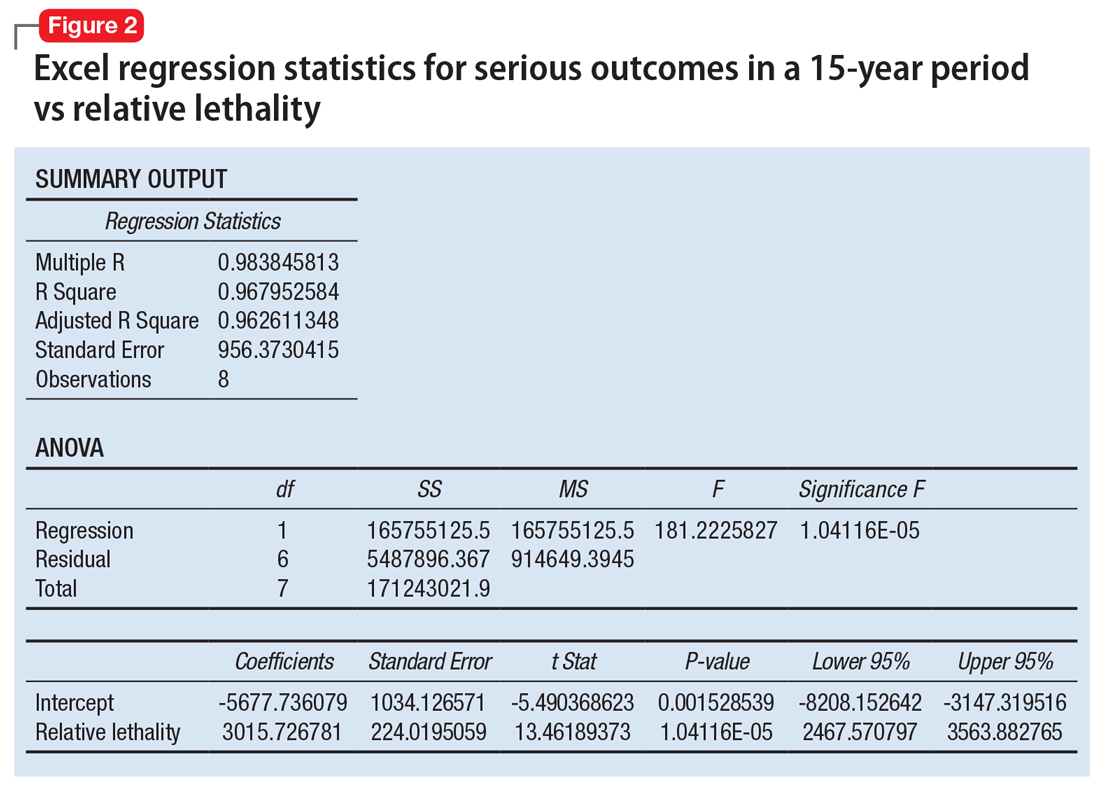
When considering the independent variable to use as a predictor for bad outcomes, I used a composite index derived with the relative lethality (RL) equation, f(x) = 310x /LD50, where x is the daily dose of a medication prescribed for 30 days, and LD50 is the rat oral lethal dose 50.3 I plotted the RL of the 8 medications on the x-axis. Then I attempted to find a mathematical function that would best fit the x and y intersection points (Figure 1). I used the Excel data analysis pack to run a logarithmic regression model (Figure 2).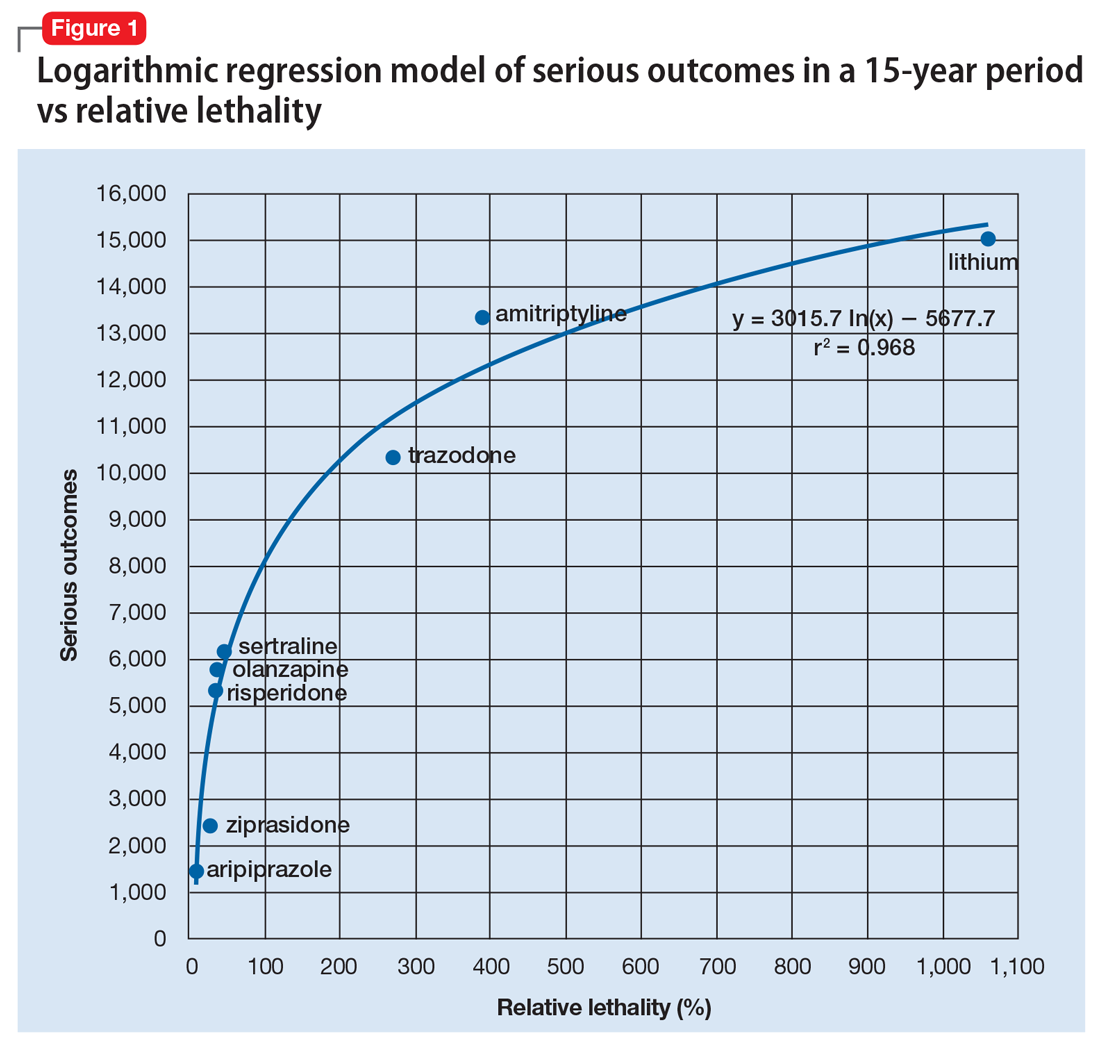
The model predicts that medications with a lower RL will have fewer serious outcomes, including mortality. The coefficient of determination r2 = 0.968, which indicates that 97% of the variation in serious outcomes is attributed to variation in RL, and 3% may be due to other factors, such as the poor quality of U.S. poison control data. This is a very significant correlation, and the causality is self-evident.
Continued to: The distribution of bad outcomes in the model was...
The distribution of bad outcomes in the model was: 1,446 for aripiprazole (RL = 9.76%), 2,387 for ziprasidone (RL = 24.80%), 5,352 for risperidone (RL = 32.63%), 5,798 for olanzapine (RL = 35.03%), 6,120 for sertraline (RL = 46.72%), 10,343 for trazodone (RL = 269.57%), 13,345 for amitriptyline (RL = 387.50%), and 15,036 for lithium (RL = 1,062.86%). The regression equation is: serious outcomes = –5,677.7 + 3,015.7 × ln (RL).
Some doctors may argue that such a data set is too small to make a meaningful model. However, the number of possible ways of ranking the drugs by bad outcomes is 8! = 40,320, so the probability of guessing the right sequence is P = .000024801. To appreciate how small this probability is, imagine trying to find a person of interest in half a football stadium on Superbowl Sunday.
The RL composite index correctly predicted the ranking order of serious outcomes for the 8 medications and may be useful for finding such outcomes in any drug class. For example, with angiotensin-converting enzyme inhibitors (n = 11) the number of possible combinations is 11! = 39,916,800. The probability of guessing the right sequence is like finding a person of interest in Poland. The model predicts the following decreasing sequence: 1) captopril, 2) fosinopril, 3) quinapril, 4) benazepril, 5) enalapril, 6) lisinopril, 7) moexipril, 8) perindopril, 9) cilazapril, 10) ramipril, 11) trandolapril. The predicted number of bad outcomes is highest for captopril, and lowest for trandolapril. The usefulness of the machine learning algorithm becomes immediately apparent.
Data can inform prescribing
Analytics can expose a critical flaw in the academic psychiatry paradigm for prescribing medications. For example, some doctors may regard lithium as the “gold standard” for treating certain mood disorders, but there is evidence that olanzapine is “significantly more effective than lithium in preventing recurrence of manic and mixed episodes.”4 Olanzapine is also 30 times safer than lithium based on its RL index, and had 9,238 fewer bad outcomes based on the 15-year data from U.S. poison control centers.2 A patient who intends to attempt suicide would easily be able to find the lethal dose of lithium from a “suicide” web site, and would quickly be able to figure out that the monthly amount of lithium his or her psychiatrist prescribed, would exceed the lethal dose.
When academia and reality collide, the use of analytics will have the final word by preventing suicide in the short term and reducing the number of bad outcomes in the long term. The irony of data science is that mathematical models can find optimal solutions to complex problems in a fraction of a second, but it may take years for a paradigm shift.
1. Bertsimas D, O’Hair AK, Pulleyblank WR. The analytics edge. Belmont, MA: Dynamic Ideas LLC; 2016.
2. Nelson JC, Spyker DA. Morbidity and mortality associated with medications used in the treatment of depression: an analysis of cases reported to U.S. poison control centers, 2000-2014. Am J Psychiatry. 2017;174(5):438-450.
3. Giurca D. Decreasing suicide risk with math. Current Psychiatry. 2018;17(2):57-59,A,B.
4. Tohen M, Greil W, Calabrese JR, et al. Olanzapine versus lithium in the maintenance treatment of bipolar disorder: a 12-month, randomized, double-blind, controlled clinical trial. Am J Psychiatry. 2005;162(7):1281-1290.
Computational psychiatry is an emerging field in which artificial intelligence and machine learning are used to find hidden patterns in big data to better understand, predict, and treat mental illness. The field uses various mathematical models to predict the dependent variable y based on the independent variable x. One application of analytics in medicine was the Framingham Heart Study, which used multivariate logistic regression to predict heart disease.1
Analytics could be used to predict the number of bad outcomes associated with different psychiatric medications over time. To demonstrate this, I examined a select data set of 8 psychiatric medications (aripiprazole, ziprasidone, risperidone, olanzapine, sertraline, trazodone, amitriptyline, and lithium) accounting for 59,827 bad outcomes during a 15-year period as reported by U.S. poison control centers,2 and plotted these on the y-axis.
When considering the independent variable to use as a predictor for bad outcomes, I used a composite index derived with the relative lethality (RL) equation, f(x) = 310x /LD50, where x is the daily dose of a medication prescribed for 30 days, and LD50 is the rat oral lethal dose 50.3 I plotted the RL of the 8 medications on the x-axis. Then I attempted to find a mathematical function that would best fit the x and y intersection points (Figure 1). I used the Excel data analysis pack to run a logarithmic regression model (Figure 2).
The model predicts that medications with a lower RL will have fewer serious outcomes, including mortality. The coefficient of determination r2 = 0.968, which indicates that 97% of the variation in serious outcomes is attributed to variation in RL, and 3% may be due to other factors, such as the poor quality of U.S. poison control data. This is a very significant correlation, and the causality is self-evident.
Continued to: The distribution of bad outcomes in the model was...
The distribution of bad outcomes in the model was: 1,446 for aripiprazole (RL = 9.76%), 2,387 for ziprasidone (RL = 24.80%), 5,352 for risperidone (RL = 32.63%), 5,798 for olanzapine (RL = 35.03%), 6,120 for sertraline (RL = 46.72%), 10,343 for trazodone (RL = 269.57%), 13,345 for amitriptyline (RL = 387.50%), and 15,036 for lithium (RL = 1,062.86%). The regression equation is: serious outcomes = –5,677.7 + 3,015.7 × ln (RL).
Some doctors may argue that such a data set is too small to make a meaningful model. However, the number of possible ways of ranking the drugs by bad outcomes is 8! = 40,320, so the probability of guessing the right sequence is P = .000024801. To appreciate how small this probability is, imagine trying to find a person of interest in half a football stadium on Superbowl Sunday.
The RL composite index correctly predicted the ranking order of serious outcomes for the 8 medications and may be useful for finding such outcomes in any drug class. For example, with angiotensin-converting enzyme inhibitors (n = 11) the number of possible combinations is 11! = 39,916,800. The probability of guessing the right sequence is like finding a person of interest in Poland. The model predicts the following decreasing sequence: 1) captopril, 2) fosinopril, 3) quinapril, 4) benazepril, 5) enalapril, 6) lisinopril, 7) moexipril, 8) perindopril, 9) cilazapril, 10) ramipril, 11) trandolapril. The predicted number of bad outcomes is highest for captopril, and lowest for trandolapril. The usefulness of the machine learning algorithm becomes immediately apparent.
Data can inform prescribing
Analytics can expose a critical flaw in the academic psychiatry paradigm for prescribing medications. For example, some doctors may regard lithium as the “gold standard” for treating certain mood disorders, but there is evidence that olanzapine is “significantly more effective than lithium in preventing recurrence of manic and mixed episodes.”4 Olanzapine is also 30 times safer than lithium based on its RL index, and had 9,238 fewer bad outcomes based on the 15-year data from U.S. poison control centers.2 A patient who intends to attempt suicide would easily be able to find the lethal dose of lithium from a “suicide” web site, and would quickly be able to figure out that the monthly amount of lithium his or her psychiatrist prescribed, would exceed the lethal dose.
When academia and reality collide, the use of analytics will have the final word by preventing suicide in the short term and reducing the number of bad outcomes in the long term. The irony of data science is that mathematical models can find optimal solutions to complex problems in a fraction of a second, but it may take years for a paradigm shift.
Computational psychiatry is an emerging field in which artificial intelligence and machine learning are used to find hidden patterns in big data to better understand, predict, and treat mental illness. The field uses various mathematical models to predict the dependent variable y based on the independent variable x. One application of analytics in medicine was the Framingham Heart Study, which used multivariate logistic regression to predict heart disease.1
Analytics could be used to predict the number of bad outcomes associated with different psychiatric medications over time. To demonstrate this, I examined a select data set of 8 psychiatric medications (aripiprazole, ziprasidone, risperidone, olanzapine, sertraline, trazodone, amitriptyline, and lithium) accounting for 59,827 bad outcomes during a 15-year period as reported by U.S. poison control centers,2 and plotted these on the y-axis.
When considering the independent variable to use as a predictor for bad outcomes, I used a composite index derived with the relative lethality (RL) equation, f(x) = 310x /LD50, where x is the daily dose of a medication prescribed for 30 days, and LD50 is the rat oral lethal dose 50.3 I plotted the RL of the 8 medications on the x-axis. Then I attempted to find a mathematical function that would best fit the x and y intersection points (Figure 1). I used the Excel data analysis pack to run a logarithmic regression model (Figure 2).
The model predicts that medications with a lower RL will have fewer serious outcomes, including mortality. The coefficient of determination r2 = 0.968, which indicates that 97% of the variation in serious outcomes is attributed to variation in RL, and 3% may be due to other factors, such as the poor quality of U.S. poison control data. This is a very significant correlation, and the causality is self-evident.
Continued to: The distribution of bad outcomes in the model was...
The distribution of bad outcomes in the model was: 1,446 for aripiprazole (RL = 9.76%), 2,387 for ziprasidone (RL = 24.80%), 5,352 for risperidone (RL = 32.63%), 5,798 for olanzapine (RL = 35.03%), 6,120 for sertraline (RL = 46.72%), 10,343 for trazodone (RL = 269.57%), 13,345 for amitriptyline (RL = 387.50%), and 15,036 for lithium (RL = 1,062.86%). The regression equation is: serious outcomes = –5,677.7 + 3,015.7 × ln (RL).
Some doctors may argue that such a data set is too small to make a meaningful model. However, the number of possible ways of ranking the drugs by bad outcomes is 8! = 40,320, so the probability of guessing the right sequence is P = .000024801. To appreciate how small this probability is, imagine trying to find a person of interest in half a football stadium on Superbowl Sunday.
The RL composite index correctly predicted the ranking order of serious outcomes for the 8 medications and may be useful for finding such outcomes in any drug class. For example, with angiotensin-converting enzyme inhibitors (n = 11) the number of possible combinations is 11! = 39,916,800. The probability of guessing the right sequence is like finding a person of interest in Poland. The model predicts the following decreasing sequence: 1) captopril, 2) fosinopril, 3) quinapril, 4) benazepril, 5) enalapril, 6) lisinopril, 7) moexipril, 8) perindopril, 9) cilazapril, 10) ramipril, 11) trandolapril. The predicted number of bad outcomes is highest for captopril, and lowest for trandolapril. The usefulness of the machine learning algorithm becomes immediately apparent.
Data can inform prescribing
Analytics can expose a critical flaw in the academic psychiatry paradigm for prescribing medications. For example, some doctors may regard lithium as the “gold standard” for treating certain mood disorders, but there is evidence that olanzapine is “significantly more effective than lithium in preventing recurrence of manic and mixed episodes.”4 Olanzapine is also 30 times safer than lithium based on its RL index, and had 9,238 fewer bad outcomes based on the 15-year data from U.S. poison control centers.2 A patient who intends to attempt suicide would easily be able to find the lethal dose of lithium from a “suicide” web site, and would quickly be able to figure out that the monthly amount of lithium his or her psychiatrist prescribed, would exceed the lethal dose.
When academia and reality collide, the use of analytics will have the final word by preventing suicide in the short term and reducing the number of bad outcomes in the long term. The irony of data science is that mathematical models can find optimal solutions to complex problems in a fraction of a second, but it may take years for a paradigm shift.
1. Bertsimas D, O’Hair AK, Pulleyblank WR. The analytics edge. Belmont, MA: Dynamic Ideas LLC; 2016.
2. Nelson JC, Spyker DA. Morbidity and mortality associated with medications used in the treatment of depression: an analysis of cases reported to U.S. poison control centers, 2000-2014. Am J Psychiatry. 2017;174(5):438-450.
3. Giurca D. Decreasing suicide risk with math. Current Psychiatry. 2018;17(2):57-59,A,B.
4. Tohen M, Greil W, Calabrese JR, et al. Olanzapine versus lithium in the maintenance treatment of bipolar disorder: a 12-month, randomized, double-blind, controlled clinical trial. Am J Psychiatry. 2005;162(7):1281-1290.
1. Bertsimas D, O’Hair AK, Pulleyblank WR. The analytics edge. Belmont, MA: Dynamic Ideas LLC; 2016.
2. Nelson JC, Spyker DA. Morbidity and mortality associated with medications used in the treatment of depression: an analysis of cases reported to U.S. poison control centers, 2000-2014. Am J Psychiatry. 2017;174(5):438-450.
3. Giurca D. Decreasing suicide risk with math. Current Psychiatry. 2018;17(2):57-59,A,B.
4. Tohen M, Greil W, Calabrese JR, et al. Olanzapine versus lithium in the maintenance treatment of bipolar disorder: a 12-month, randomized, double-blind, controlled clinical trial. Am J Psychiatry. 2005;162(7):1281-1290.

Analysis of Incidence and Outcome Predictors for Patients Admitted to US Hospitals with Acetabular Fractures from 1990 to 2010
ABSTRACT
The incidence of acetabular fractures and associated in-hospital complication rates in the United States are poorly defined. Studies evaluating predictors of outcome for isolated acetabular fractures are weakly generalizable due to small sample sizes or the inclusion of all types of pelvic fractures. This study sought to analyze trends in acetabular fractures and associated complications in the US using the largest and most recent national dataset available.
The National Hospital Discharge Survey was queried to identify all patients admitted to US hospitals with acetabular fractures between 1990 and 2010. A representative cohort of 497,389 patients was identified, and multivariable logistic regression was used to identify independent predictors of mortality, adverse events, requirement of blood transfusion, and operative treatment with open reduction and internal fixation (ORIF).
Between 1990 and 2010, the population-adjusted incidence of acetabular fractures increased from 7.8 to 9.5/100,000 capita (P < .001). Mortality declined from 5.9% to 0.4% (P < .001), paralleling an increase in the proportion of patients treated with ORIF (12.6%-20.4%, P < .001), which was the variable associated with the lowest odds of mortality. Surgical intervention was associated with higher odds of adverse events and a requirement for blood transfusion. The average in-hospital length of stay decreased from 17.0 days to 10.3 days (P < .001).
This study provides the largest and most comprehensive epidemiologic analysis of acetabular fractures in the US. Knowledge of the increasing incidence of acetabular fractures and prognostic factors associated with poor outcomes may improve outcomes.
Continue to: Acetabular fractures are major injuries...
Acetabular fractures are major injuries frequently associated with life-altering sequelae1 and a significant resulting cost to society.2 Acetabular fractures are most often the result of a high-energy trauma3-5 or fall from a height.5,6 Functional outcomes and the prevention of post-traumatic arthritis have been shown to depend upon the accuracy of operative reduction.7-9 However, literature on the epidemiology of acetabular fractures is largely limited to European countries,1,10 and their incidence in the United States is more poorly defined.11 Published mortality rates in the existing literature vary widely from 2% to 45%,12-14 and few studies have identified the risk factors associated with in-hospital complications.15 While age, gender, and high-velocity mechanisms have been linked to increased mortality and complications,14-16 the evidence for these associations is poorly generalizable due to the inclusion of all pelvic fractures in these studies. Some reports suggest that advances in surgical management have improved survival and functional outcome,15,17 but these are based upon small cohorts. Knowledge of the incidence and patterns of disease burden are crucial for the allocation of limited healthcare resources.
This study sought to describe the trends in incidence as well as the factors influencing mortality and the risk of complications for patients admitted to US hospitals with an acetabular fracture using the National Hospital Discharge Survey (NHDS), the most recently available Centers for Disease Control and Prevention data, which is also one of the largest inpatient databases in the US. Knowledge of the factors influencing outcomes for patients admitted with acetabular fractures may improve management and decrease complications.
METHODS
NATIONAL HOSPITAL DISCHARGE SURVEY
The NHDS, developed by the National Center for Healthcare Statistics division of the Centers for Disease Control and Prevention,18 was used to estimate the incidence of acetabular fractures and to evaluate the risk factors for ensuing mortality and inpatient complications. The NHDS is a publically available survey providing demographic and medical data for inpatients discharged from non-federal, short-stay hospitals in the US.19 The NHDS is the principal database used by the US government for monitoring hospital use and is considered the most comprehensive of all inpatient surgical databases in use today.19 The survey uses International Classification of Diseases, 9th Revision, Clinical Modification (ICD-9-CM) codes20 to classify medical diagnoses and procedures. The NHDS uses a stratified, multistage probability design to collect demographic information (age, gender, race), expected source of payment (insurance status), medical information of up to 7 discharge diagnoses and up to 4 procedures, length of care, hospital size, US region, and inpatient outcomes including discharge destination.21 To ensure unbiased national sampling of inpatient records, the NHDS uses a complex, 3-stage probability design including inflation by reciprocals of the probabilities of sample selection, adjustment for no response, and population weighting ratio adjustments.19 This study did not require approval by the Institutional Review Board because the NHDS is a publically available database with no patient-identifying information.
Continue to: PATIENT SELECTION...
PATIENT SELECTION
All patients admitted to hospitals in the US with a fracture of the acetabulum between 1990 and 2010 were identified using ICD-9-CM codes. Discharges with a diagnosis code (ICD-9-CM) of closed fracture of the acetabulum (808.0) or open fracture of the acetabulum (808.1) were identified using previously described techniques.22 The database was subsequently queried to identify patients treated using open reduction and internal fixation (ORIF) (ICD-9-CM, 79.30/79.39), closed reduction and internal fixation (CRIF) (ICD-9-CM, 79.10/79.19), or external (ICD-9-CM, 78.10/78.19) or internal (ICD-9-CM, 78.50/78.59) fixation without reduction. Demographic variables were then collected, including age, sex, primary diagnosis, associated diagnoses, type of fracture (open vs closed), prevalence of comorbidities, length of stay, and discharge destination. The complication screening package23 was used to determine the incidence of complications. The variable adverse event was created on the basis of the variables postoperative bleeding (998.1), acute postoperative infection (998.5), acute postoperative anemia (285.1), acute renal failure (584), acute myocardial infarction (410), pulmonary embolism (415.1), induced mental disorder (293), pneumonia (480-486), pulmonary insufficiency (518.5), deep venous thrombosis (453.4), intubation (96.xx), and blood transfusion (99.x).
STATISTICAL ANALYSIS
Because of the large sample size, a normal distribution of the data was assumed. Differences between categorical variables were compared using the Pearson chi square test, while the independent-samples t test was used to compare differences between continuous variables. To determine independent predictors of in-hospital outcomes (death, adverse events, requirement for blood transfusion, or treatment with ORIF), all variables present in at least 2% of the population24 were included in a multivariable binary logistic regression model. For in-hospital adverse events, a 1% cutoff was used due to their lower rates of occurrence, as previously described.25The dichotomous variables were death, presence of adverse events, receipt of blood transfusion, and treatment with ORIF. A multivariable regression model allows for the control of potential confounders, isolating the effect of individual variables on inpatient outcomes. Covariates accounted for in the regression model included gender, age, region of the country, and preexisting comorbidities (diabetes mellitus, hypertension, congestive heart failure, coronary artery disease, atrial fibrillation). To assess the association between individual variables and inpatient outcomes, odds ratios and confidence intervals were calculated. A P value of <.001 was used to define statistical significance, correcting for multiple comparisons, as previously described.25 US census data were used to obtain national population estimates for each year of the study from 1990 to 2010.26 Rates were presented as the number of acetabular fractures per 100,000 standard population. All data were analyzed using the software Statistical Package for the Social Sciences [SPSS] version 20.
RESULTS
INCIDENCE AND DEMOGRAPHICS
A cohort representative of 497,389 patients with a diagnosis of acetabular fracture was identified between 1990 and 2010 (Table 1). In 1990, 19,560 cases (7.84 per 100,000 capita) of acetabular fractures were recoded, while in 2010, the number of cases increased to 29,373 or 9.5 per 100,000 capita (P < .001) (Table 2). The mean age of patients with an acetabular fracture was 52.6 years (standard deviation [SD], 23.7) and 60.6% were male (Table 1). The most frequently associated diagnosis was closed fracture of the pelvis (29.8%) followed by fracture of the femur (13.1%) and closed fracture of the ilium (3.8%) (Table 1). Of the total cohort, 23.2% underwent ORIF (Table 1). In 1990, 12.6% of patients with a diagnosis of acetabular fracture underwent ORIF, whereas 20.4% of patients underwent ORIF in 2010 (P < .001) (Table 2). Average length of hospital stay was 8.3 days (SD, 17.9) overall (Table 1). In 1990 the average length of stay was 17.0 days (SD, 14.9), decreasing to 10.3 days (SD, 9.3) in 2010 (P < .001) (Table 2).
Table 1. Patient Characteristics for Patients with Acetabular Fractures in the United States from 1990 to 2007
Parameter | Total 1990-2010 |
Total Number | 497,389 |
Gender (%) |
|
Male | 60.6 |
Female | 39.4 |
Age, years (%) |
|
<20 | 6.7 |
20-40 | 31.5 |
41-60 | 22.3 |
61-85 | 30.4 |
>85 | 23.5 |
Race (%) |
|
White | 66.4 |
Black | 9.3 |
Asian | 1.7 |
Other | 2.4 |
Not stated | 20.2 |
Primary Diagnosis (%) |
|
Closed fracture of acetabulum (808.0) | 98.9 |
Open fracture of acetabulum (808.1) | 1.1 |
Associated diagnoses (%) |
|
Closed fracture of pubis (808.2) | 26.1 |
Open fracture of pubis (808.3) | 0.1 |
Closed fracture of ischium (808.42) | 1.7 |
Open fracture of ischium (808.52) | 0.0 |
Closed fracture of ilium (808.41) | 3.8 |
Open fracture of ilium (808.51) | 0.0 |
Closed fracture other part pelvis (808.49) | 0.7 |
Open fracture other part pelvis (808.59) | 0.0 |
Multiple closed pelvic fractures (808.43) | 0.5 |
Multiple open pelvic fractures (808.53) | 0.0 |
Any pelvic fracture from above | 29.8 |
Fracture of neck of femur (820) | 7.2 |
Fracture of any part of femur (820/821) | 13.1 |
Head trauma (959.01) | 0.7 |
Head/face trauma (959.0/959.01) | 0.7 |
Chest trauma (959.11) | 0.1 |
Chest/trunk trauma (959.1/959.11) | 0.1 |
Procedures (%) |
|
Open reduction internal fixation (79.30/79.39) | 23.2 |
Closed reduction internal fixation (79.10/79.19) | 1.3 |
External fixation (78.10/78.19) | 0.7 |
Internal fixation without reduction (78.50/78.59) | 0.4 |
Comorbidities (%) |
|
No | 72.9 |
Yes | 27.1 |
Adverse Events (%) |
|
No | 74.1 |
Yes | 25.9 |
Discharge Disposition (%) |
|
Routine/home (1) | 45.4 |
Left against medical advice (2) | 0.2 |
Short term fac (3) | 13.1 |
Long term fac (4) | 22.2 |
Alive, not stated (5) | 12 |
Dead (6) | 3.5 |
Not reported (9) | 3.6 |
Mortality (%) | 3.5 |
Age (y), mean (SD) | 52.6 (23.7) |
Days of Care, mean (SD) | 8.3 (17.9) |
Principal Source of Payment (%) |
|
Private insurance | 39 |
Medicare | 30.5 |
Medicaid | 7.7 |
Other government | 1.9 |
Self-pay | 7.9 |
Workmen’s comp | 4 |
Other | 4.7 |
Not stated | 4.4 |
Abbreviation: SD, standard deviation.
Table 2. Patient Characteristics in 1990, 1995, 1999, 2003, and 2007 Among Patients with Acetabular Fractures
Variable | 1990 | 1995 | 1999 | 2003 | 2007 | 2010 |
Total number | 19,560 | 17,506 | 22,767 | 27,133 | 34,027 | 29,373 |
Incidence per 100,000 capita | 7.84 | 6.57 | 8.16 | 9.35 | 11.30 | 9.5 |
Gender (%) |
| |||||
Male | 51.0 | 70.7 | 61.2 | 62.6 | 62.5 | 64.9 |
Female | 49.0 | 29.3 | 38.8 | 37.4 | 37.5 | 35.1 |
Fracture (%) |
| |||||
Open | 2.1 | 1.7 | 3.3 | 1.4 | 0.1 | 1.8 |
Closed | 97.9 | 98.3 | 96.7 | 98.6 | 99.9 | 98.2 |
Underwent ORIF (%) | 12.6 | 20.9 | 20.2 | 22.9 | 27.8 | 20.4 |
Adverse events (%) | 10.9 | 16.2 | 23.7 | 31 | 35.1 | 37.6 |
Transfusion (%) | 0.3 | 2.2 | 7.4 | 6.5 | 10.5 | 9.5 |
Discharge (%) |
| |||||
Routine | 58 | 65.6 | 35.6 | 45.9 | 40.2 | 41.6 |
Non-routine to inpatient facility | 26.8 | 23.1 | 46.4 | 33.8 | 40.8 | 34.6 |
Mortality (%) | 5.9 | 3.6 | 2 | 2.9 | 1.5 | 0.4 |
Mean Age (y) | 52.9 | 48.4 | 52.3 | 56.3 | 57 | 53.2 |
Mean DOC (days) | 17.0 | 13.4 | 8.7 | 10.8 | 8.5 | 10.3 |
Abbreviations: DOC, days of care; ORIF, open reduction internal fixation.
Continue to: MORTALITY...
MORTALITY
In-hospital mortality decreased from 5.9% in 1990 to 0.4% in 2010 (P < .001) (3.5% for the total cohort) (Tables 1 and 2). Multivariable logistic regression analysis demonstrated pulmonary insufficiency (odds ratio [OR], 9.07; 95% confidence interval [CI], 8.52-9.66; P < .01), pneumonia (OR, 3.22; 95% CI, 3.05-3.39; P < .01), and age >85 years (OR, 2.28; 95% CI, 2.16-2.40; P < .01) to be associated with the highest odds of inpatient mortality. CRIF (OR, 1.99; 95% CI, 1.78-2.23; P < .01), external fixator (OR, 1.82; 95% CI, 1.45-2.29; P < .01), and having received a blood transfusion (OR, 1.81; 95% CI, 1.71-1.91; P < .01) were also associated with increased odds of mortality. Treatment with ORIF (OR, 0.19; 95% CI, 0.17-0.20; P < .01) was independently associated with decreased odds of inpatient mortality, as was age <20 years (OR, 0.26; 95% CI, 0.23-0.30; P < .01) (model fit: for omnibus test of model coefficients, X = 25,966 P < .01; Nagelkerke, R2 = 0.20) (Table 3).
Table 3. Logistic Regression for Predictors of Mortality Among Patients with Acetabular Fractures (n = 403,927)
Variable | OR (95% CI) | P |
Pulmonary insufficiency | 9.07 (8.52–9.66) | < 0.01 |
Pneumonia | 3.22 (3.05–3.39) | < 0.01 |
Age >85 years | 2.28 (2.16–2.40) | < 0.01 |
Closed reduction internal fixation | 1.99 (1.78–2.23) | < 0.01 |
External Fixator | 1.82 (1.45–2.29) | < 0.01 |
Blood transfusion | 1.81 (1.71–1.91) | < 0.01 |
Gender (male) | 1.76 (1.70–1.83) | < 0.01 |
Associated femoral neck fracture | 1.23 (1.15–1.30) | < 0.01 |
Age 41-60 years | 1.19 (1.11–1.29) | < 0.01 |
Age 61-85 years | 1.17 (1.11–1.23) | < 0.01 |
Congestive heart failure | 1.14 (1.07–1.22) | < 0.01 |
Associated pelvic fracture | 1.13 (1.10–1.17) | < 0.01 |
Geographic region | 1.11 (1.09–1.12) | < 0.01 |
Source of payment | 1.02 (1.01–1.02) | < 0.01 |
Race | 0.99 (0.98–0.99) | < 0.01 |
DOC | 0.98 (0.98–0.98) | < 0.01 |
Hypertension | 0.67 (0.64–0.71) | < 0.01 |
Atrial fibrillation | 0.52 (0.48–0.57) | < 0.01 |
Diabetes mellitus | 0.35 (0.32–0.38) | < 0.01 |
Age 20-40 years | 0.32 (0.30–0.35) | < 0.01 |
Age <20 years | 0.26 (0.23–0.30) | < 0.01 |
Coronary artery disease | 0.21 (0.18–0.24) | < 0.01 |
Open reduction internal fixation | 0.19 (0.17–0.20) | < 0.01 |
Omnibus X 25,966, P < .01 | ||
Nagelkerke R2= 0.20 |
Abbreviations: CI, confidence interval; DOC, days of care; OR, odds ratio.
COMORBIDITIES AND ADVERSE EVENTS
The prevalence of comorbidities and adverse events is listed in Tables 4 and 5, respectively. Hypertensive disease was the most common comorbidity at 15.3%, followed by diabetes mellitus at 6.9%. Overall, 25.9% of patients experienced an in-hospital adverse event, with the most common being postoperative anemia (7.3%) and blood transfusion (8.1%) (Tables 1 and 5). The percentage of patients experiencing an adverse event increased from 10.9% in 1990 to 37.6% in 2010 (P < .01) (Table 2). Multivariable logistic regression analysis revealed CRIF (OR, 3.08; 95% CI, 2.91-3.26; P < .01), coronary artery disease (OR, 2.02; 95% CI, 1.91-2.15; P < .01), associated femoral neck fracture (OR, 1.53; 95% CI, 1.47-1.60; P < .01), and ORIF (OR, 1.22; 95% CI, 1.20-1.24; P < .01) to be associated with higher odds of inpatient adverse events (model fit: for omnibus test of model coefficients, X = 160,275, P < .01; Nagelkerke, R2 = 0.41) (Table 6).
Table 4. Prevalence of Comorbidities in Patients with Acetabular Fractures Between 1990 and 2007 (n = 403.927)
Parameter (ICD-9) | Percentage of Total |
Hypertensive disease (401–405) | 15.3% |
Diabetes mellitus (250) | 6.9% |
Atrial fibrillation (427.31) | 4.0% |
Congestive heart failure (428) | 3.9% |
Osteoporosis (733.0) | 2.1% |
Coronary artery disease (414.01) | 2.0% |
Obesity (278.00, 278.01) | 2.0% |
Abbreviation: ICD-9, International Classifications of Diseases, 9th Revision.
Table 5. Prevalence of In-Hospital Adverse Events Among Patients with Acetabular Fractures Between 1990 and 2007 (n = 403,927)
Parameter (ICD-9) | Percentage of Total |
Transfusion of blood (99.0) | 8.1% |
Acute postoperative anemia (285.1) | 7.3% |
Intubation (96.x) | 4.9% |
Acute renal failure (584) | 3.4% |
Pneumonia (480-486) | 3.2% |
Pulmonary insufficiency (518.5) | 2.3% |
Pulmonary embolism (415.1) | 1.6% |
Deep venous thrombosis (453.4) | 1.0% |
Acute myocardial infarction (410) | 0.9% |
Postoperative bleeding (998.1) | 0.7% |
Acute postoperative infection (998.5) | 0.5% |
Induced mental disorder (293) | 0.4% |
Abbreviation: ICD-9, International Classifications of Diseases, 9th Revision.
Table 6. Logistic Regression for Predictors of Adverse Events Among Patients Hospitalized for Acetabular Fracture (n = 403,927)
Variable | OR (95% CI) | P |
Closed reduction internal fixation | 3.08 (2.91-3.26) | < 0.01 |
Coronary artery disease | 2.02 (1.91-2.15) | < 0.01 |
Associated femoral neck fracture | 1.53 (1.47-1.60) | < 0.01 |
Open reduction internal fixation | 1.22 (1.20-1.24) | < 0.01 |
Gender (male) | 1.16 (1.14-1.18) | < 0.01 |
Associated fracture of any part of femur | 1.13 (1.10-1.17) | < 0.01 |
Age >85 years | 1.08 (1.05-1.12) | < 0.01 |
Geographic region | 1.07 (1.06-1.07) | < 0.01 |
DOC | 1.04 (1.04-1.04) | < 0.01 |
Race | 1.02 (1.02-1.03) | < 0.01 |
Source of payment | 1.01 (1.01-1.01) | < 0.01 |
Congestive heart failure | 1.01 (0.96-1.06) | 0.78 |
Atrial fibrillation | 0.88 (0.84-0.92) | < 0.01 |
Age 61-85 years | 0.68 (0.66-0.71) | < 0.01 |
Age <20 years | 0.67 (0.64-0.70) | < 0.01 |
Associated pelvis fracture | 0.64 (0.63-0.66) | < 0.01 |
Age 41-60 years | 0.58 (0.56-0.61) | < 0.01 |
Diabetes mellitus | 0.48 (0.46-0.50) | < 0.01 |
Age 20-40 years | 0.45 (0.43-0.47) | < 0.01 |
Hypertension | 0.44 (0.43-0.45) | < 0.01 |
External Fixator | 0.39 (0.35-0.44) | < 0.01 |
Omnibus X 160,275, P < .01 | ||
Nagelkerke R2 = 0.41 |
Abbreviations: CI, confidence interval; DOC, days of care; OR, odds ratio.
BLOOD TRANSFUSION
Overall, 7.3% of patients experienced acute postoperative anemia (Table 5). Between 1990 and 2010, the percentage of patients receiving blood transfusions increased from 0.3% to 9.5%, respectively (P < .01) (Table 2). In multivariable logistic regression analysis, patients treated with ORIF (OR, 8.13; 95% CI, 7.91-8.36; P < .01), those with congestive heart failure (OR, 4.23; 95% CI, 4.06-4.41; P < .01), those with an associated femur fracture (OR, 3.13; 95% CI, 2.99-3.27; P < .01), those with atrial fibrillation (OR, 1.96; 95% CI, 1.88-2.05; P < .01), and those treated with CRIF (OR, 1.42; 95% CI, 1.29-1.56; P < .01) were associated with significantly higher odds of blood transfusion (model fit: omnibus test of model coefficients, X = 42,653, P < .01; Nagelkerke, R2 = 0.19) (Table 7).
Table 7. Logistic Regression for Predictors of the Requirement for Blood Transfusion Among Patients with Acetabular Fractures (n = 403,927)
Variable | OR (95% CI) | P |
Open reduction internal fixation | 8.13 (7.91-8.36) | < 0.01 |
Congestive heart failure | 4.23 (4.06-4.41) | < 0.01 |
Associated fracture of any part of femur | 3.13 (2.99-3.27) | < 0.01 |
Atrial fibrillation | 1.96 (1.88-2.05) | < 0.01 |
Closed reduction internal fixation | 1.42 (1.29-1.56) | < 0.01 |
Geographic region | 1.38 (1.36-1.39) | < 0.01 |
Hypertension | 1.38 (1.34-1.42) | < 0.01 |
Associated pelvic fracture | 1.28 (1.25-1.31) | < 0.01 |
Age 61-85 years | 1.06 (1.02-1.11) | 0.01 |
Source of payment | 0.99 (0.98-0.99) | < 0.01 |
Race | 0.98 (0.97-0.98) | < 0.01 |
DOC | 0.96 (0.96-0.96) | < 0.01 |
Age >85 years | 0.74 (0.72-0.77) | < 0.01 |
External fixator | 0.69 (0.59-0.80) | < 0.01 |
Coronary artery disease | 0.62 (0.57-0.68) | < 0.01 |
Age 41-60 years | 0.57 (0.54-0.60) | < 0.01 |
Gender (male) | 0.54 (0.52-0.55) | < 0.01 |
Diabetes mellitus | 0.38 (0.36-0.41) | < 0.01 |
Age 20-40 years | 0.32 (0.30-0.34) | < 0.01 |
Associated femoral neck fracture | 0.29 (0.27-0.31) | < 0.01 |
Age <20 years | 0.24 (0.22-0.26) | < 0.01 |
Omnibus X = 42,653, P < .01 | ||
Nagelkerke R2 = 0.19 |
Abbreviations: CI, confidence interval; DOC, days of care; OR, odds ratio.
TREATMENT WITH ORIF
Over the 20-year study period, 23.2% of patients with acetabular fractures were treated with ORIF (Table 1). In 1990, 12.6% of patients underwent ORIF, while in 2010 this percentage increased to 20.4% (P < .001) (Table 2). Multivariable logistic regression analysis demonstrated that age between 41 and 60 years (OR, 1.88; 95% CI, 1.78-1.98; P < .01) was associated with the highest odds of undergoing ORIF. Age 20 to 40 years (OR, 1.86; 95% CI, 1.76-1.97; P < .01), age <20 years (OR, 1.82; 95% CI, 1.72-1.93; P < .01), and male gender (OR, 1.65; 95% CI, 1.63-1.68; P < .01) were also associated with being treated by ORIF. In contrast, coronary artery disease (OR, 0.27; 95% CI, 0.25-0.30; P < .01), age >85 years (OR, 0.46; 95% CI, 0.44-0.47; P < .01), and congestive heart failure (OR, 0.48; 95% CI, 0.46-0.51; P < .01) were associated with the lowest odds of undergoing ORIF (model fit: omnibus test of model coefficients, X = 71,118, P < .01; Nagelkerke, R2 = 0.20) (Table 8).
Table 8. Logistic Regression for Predictors of the Requirement for Discharge to Another Inpatient Facility Among Patients with Acetabular Fractures (n = 403,927)
Variable | OR (95% CI) | P |
Age 41-60 years | 1.88 (1.78-1.98) | < 0.01 |
Age 20-40 years | 1.86 (1.76-1.97) | < 0.01 |
Age <20 years | 1.82 (1.72-1.93) | < 0.01 |
Gender (male) | 1.65 (1.63-1.68) | < 0.01 |
Larger hospital bed size | 1.46 (1.45-1.47) | < 0.01 |
Hypertension | 1.35 (1.32-1.38) | < 0.01 |
Diabetes mellitus | 1.09 (1.05-1.13) | < 0.01 |
DOC | 1.02 (1.02-1.02) | < 0.01 |
Source of payment | 1.01 (1.01-1.02) | < 0.01 |
Race | 1.00 (0.99-1.00) | 0.17 |
Age 61-85 years | 0.94 (0.90-0.99) | 0.02 |
Region | 0.92 (0.91-0.93) | < 0.01 |
Atrial fibrillation | 0.83 (0.79-0.87) | < 0.01 |
Congestive heart failure | 0.48 (0.46-0.51) | < 0.01 |
Age >85 years | 0.46 (0.44-0.47) | < 0.01 |
Coronary artery disease | 0.27 (0.25-0.30) | < 0.01 |
Omnibus X 71,118, P < .01 | ||
Nagelkerke R2 = 0.20 |
Abbreviations: CI, confidence interval; DOC, days of care; OR, odds ratio.
Continue to: DISCUSSION...
DISCUSSION
This study evaluates the incidence of acetabular fractures in the US between 1990 and 2010, and identifies prognostic factors associated with complications and death. The study demonstrates an increase in the population-adjusted incidence of acetabular fractures between 1990 and 2010 (7.84 cases per 100,000 capita to 9.5 cases per 100,000 capita), in contrast to the decreasing trend reported by Mauffrey and colleagues.11 Some studies suggest that up to 80% of acetabular fractures are associated with motor vehicle collisions and motorcycle accidents.9,27 While the rate of motor vehicle accidents has remained stable over the study period, motorcycle ownership and deaths more than doubled between 2001 and 2008,28 primarily among individuals over 40 years of age. In this study, the mean age of patients with acetabular fractures ranged from 48 to 57 years. The dramatic increase in motorcycle ownership and deaths in these age groups may partially explain the rising incidence of acetabular fractures. The other possibility is that changes in automobile design and safety equipment may have altered the injury patterns observed in patients surviving motor vehicle crashes. Compared to the United Kingdom, in which studies report a fixed incidence of 3 per 100,000 capita1 between 1988 and 2003, the incidence of acetabular fractures in the US is greater. In contrast, the incidence of acetabular fractures reported in this study is less than the 20 per 100,000 reported in Sweden between 1976 and 1985,29 or the 37 per 100,000 reported in Rochester, Minnesota between 1968 and 1977,30 which may be due to increased seatbelt usage.31
In addition to the national incidence, this study demonstrated that the proportion of patients with acetabular fractures treated with ORIF increased from 12.6% to 20.4% between 1990 and 2010. This is substantially lower than the 77% reported by Ochs and colleagues32 in a German population. Concurrent with the increase in ORIF, there was a decrease in in-hospital mortality from 5.9% in 1990 to 0.4% in 2010. The initial mortality rates in this study are comparable to much earlier reports and some small studies,9,32-37 but the rates reported in the later years of this study show a substantial decrease that is likely a more accurate estimation of the current incidence. The improved survival rates may be due to advances in the operative treatment of acetabular fractures, in which mechanical stabilization allows for early patient mobilization and facilitation of optimal nursing care.38 With ORIF becoming the standard of care for displaced acetabular fractures,9 numerous reports have demonstrated an association between early definitive fixation and improved survival.17,39,40 This is similar to our study, which found ORIF to be associated with the lowest odds of mortality in multivariate logistic regression analysis. It is possible that advances in patient care by intensivists over this period have also contributed to the decrease in mortality, but the correlation with operative treatment in this study is very strong and agrees well with prior studies.16 Moreover, multiple studies have demonstrated decreased in-hospital mortality among patients undergoing various orthopedic surgical procedures during this period.41-43 The correlation with operative treatment in this study agrees well with prior studies.16
In contrast, higher odds of mortality were seen in patients over the age of 85 years with pulmonary insufficiency, congestive heart failure, pneumonia, or an associated femur or pelvic fracture. This is similar to prior reports in which patients with combined acetabulum and pelvic ring injuries fared worse than those with isolated injures,44,45 as did patients with associated non-musculoskeletal injuries.46 The finding that age over 85 years was associated with higher odds of mortality likely reflects the increased number of comorbidities and decreased physiologic reserve seen in this patient population. Finally, male gender was associated with higher odds of in-hospital mortality. There are 2 possible explanations for this: Either there is gender dimorphism in sex hormones and cytokine activity in response to hemorrhage and sepsis,38,47 or there is a greater tendency for males to be involved in higher energy accidents with more severe concomitant injuries.
The results of multivariable regression analysis demonstrated that patients were more likely to require blood transfusion if they were managed surgically or had atrial fibrillation, congestive heart failure, or associated femur fracture. Not surprisingly, concurrent pelvic fracture was also associated with higher odds of blood transfusion, as pelvic hemorrhage is reported to be the cause of death in up to half of patients who die following a pelvic fracture.46
Between 1990 and 2010, in-hospital days of care decreased from 17.0 days to 10.3 days. While a decreased length of stay has been demonstrated in other orthopedic conditions over the study period,41 it is possible the decrease in length of stay demonstrated in this study is due to improved surgical technique and the implementation of early surgical intervention.39,48-50 Plaisier and colleagues17 demonstrated superior functional outcomes, quicker return to baseline function, and decreased length of stay in patients treated with early ORIF of their acetabular fractures. Other studies have shown that the benefits of early surgery include improved reduction quality and ease of reduction,51 as well as control of bleeding, pain relief, and mobilization of the patient.39 Another possible explanation for the decreased length of stay is the increased rate of discharge to other inpatient facilities, such as rehabilitation facilities, which was demonstrated in this study.
Continue to: Interestingly, male gender and younger age...
Interestingly, male gender and younger age were associated with operative management of the acetabular fracture. In contrast, there was a decreased likelihood of operative treatment among elderly patients and those patients with cardiac comorbidities. It is possible that the relationship we found between the likelihood of ORIF and age relates to the bimodal distribution of fractures, with higher energy and potentially more displaced fractures occurring in younger patients3-5 and lower energy fractures in the elderly.
In contrast to decreasing in-hospital days of care, there was a rise in the number of adverse events between 1990 (10.9%) and 2010 (37.6%). This can be partially attributed to the increased rates of blood transfusion, which was received by 9.5% of patients with acetabular fractures in the final study year. Additionally, surgical intervention was associated with increased adverse events in this study, and surgical intervention increased over the study period. Other factors that may have contributed to an increase in adverse events include an aging population,52 as advanced age was independently associated with higher odds of adverse events in this study.
Despite the strengths of using large, national databases for epidemiological research,53 this study has several limitations. Like all large databases, the NHDS is subject to error in coding and data entry.54 Additionally, the database only allows for 7 diagnostic codes and 4 procedure codes per entry. As a result, the prevalence of comorbid conditions and adverse events may be underreported.25 Moreover, the severity of a comorbid disease cannot be appreciated when dichotomously classified.55 Another limitation is that the database only provides inpatient data, so complications that arise after discharge, as well as follow-up data, are unknown. Furthermore, the results of this study are limited to practice patterns in the US from 1990 to 2010. This database does not provide injury mechanisms, so we cannot distinguish between high-energy and low-energy injuries. Lastly, analysis of the different types of acetabular fractures was not performed since classification of acetabular fractures cannot be assessed with ICD-9 codes.
CONCLUSION
This study is the largest epidemiologic analysis of acetabular fractures in the US and also provides predictors of in-hospital mortality. The incidence of acetabular fractures in the US is increasing, while mortality is decreasing. Identifying risk factors associated with poor outcomes has the potential to change treatment strategies, resource allocation, in-hospital monitoring, and discharge planning for this patient population.
This paper will be judged for the Resident Writer’s Award.
1. Laird A, Keating JF. Acetabular fractures: a 16-year prospective epidemiological study. J Bone Joint Surg Br. 2005;87(7):969-973. doi:10.1302/0301-620X.87B7.16017.
2. Geoghegan JM, Longdon EJ, Hassan K, Calthorpe D. Acetabular fractures in the UK. What are the numbers? Injury. 2007;38(3):329-333. doi:10.1016/j.injury.2006.09.015.
3. Tavakoli Darestani R, Kazemian G, Emami Moghaddam M, Manafi Rasi A, Alipour Y, Bagherian Lemraski MM. An unusual combination of acetabular and pelvic fracture: is this a new subtype of acetabular fracture? Trauma Mon. 2013;18(1):37-40. doi:10.5812/traumamon.9613.
4. McDonnell M, Schachter AK, Phillips DP, Liporace FA. Acetabular fracture through the triradiate cartilage after low-energy trauma. J Orthop Trauma. 2007;21(7):495-498. doi:10.1097/BOT.0b013e31812f67ff.
5. Giannoudis PV, Grotz MR, Tzioupis C, et al. Prevalence of pelvic fractures, associated injuries, and mortality: the United Kingdom perspective. J Trauma. 2007;63(4):875-883. doi:10.1097/01.ta.0000242259.67486.15.
6. Gänsslen A, Pohlemann T, Paul C, Lobenhoffer P, Tscherne H. Epidemiology of pelvic ring injuries. Injury. 1996;27 Suppl 1:S-A13-A20. doi:10.1016/S0020-1383(96)90106-0.
7. Matta JM. Fractures of the acetabulum: accuracy of reduction and clinical results in patients managed operatively within three weeks after the injury. J Bone Joint Surg Am. 1996;78(11):1632-1645. doi:10.2106/00004623-199611000-00002.
8. Wright R, Barrett K, Christie MJ, Johnson KD. Acetabular fractures: long-term follow-up of open reduction and internal fixation. J Orthop Trauma. 1994;8(5):397-403. doi:10.1097/00005131-199410000-00005.
9. Giannoudis PV, Grotz MR, Papakostidis C, Dinopoulos H. Operative treatment of displaced fractures of the acetabulum. A meta-analysis. J Bone Joint Surg Br. 2005;87(1):2-9.
10. Davarinos N, Ellanti P, Morris S, Mc Elwain JP. Epidemiology of pelvic and acetabular trauma in a Dublin tertiary hospital: a 10-year experience. Ir J Med Sci. 2012;181(2):243-246. doi:10.1007/s11845-011-0791-4.
11. Mauffrey C, Hao J, Cuellar DO 3rd, et al. The epidemiology and injury patterns of acetabular fractures: are the USA and China comparable? Clin Orthop Relat Res. 2014;472(11):3332-3337. doi:10.1007/s11999-014-3462-8.
12. Dente CJ, Feliciano DV, Rozycki GS, et al. The outcome of open pelvic fractures in the modern era. Am J Surg. 2005;190(6):830-835. doi:10.1016/j.amjsurg.2005.05.050.
13. Grotz MR, Allami MK, Harwood P, Pape HC, Krettek C, Giannoudis PV. Open pelvic fractures: epidemiology, current concepts of management and outcome. Injury. 2005;36(1):1-13. doi:10.1016/j.injury.2004.05.029.
14. Gabbe BJ, de Steiger R, Esser M, Bucknill A, Russ MK, Cameron PA. Predictors of mortality following severe pelvic ring fracture: results of a population-based study. Injury. 2011;42(10):985-991. doi:10.1016/j.injury.2011.06.003.
15. Arroyo W, Nelson KJ, Belmont PJ Jr, Bader JO, Schoenfeld AJ. Pelvic trauma: what are the predictors of mortality and cardiac, venous thrombo-embolic and infectious complications following injury? Injury. 2013;44(12):1745-1749. doi:10.1016/j.injury.2013.08.007.
16. Flint L, Cryer HG. Pelvic fracture: the last 50 years. J Trauma. 2010;69(3):483-488. doi:10.1097/TA.0b013e3181ef9ce1.
17. Plaisier BR, Meldon SW, Super DM, Malangoni MA. Improved outcome after early fixation of acetabular fractures. Injury. 2000;31(2):81-84. doi:10.1016/S0020-1383(99)00233-8.
18. Centers for Disease Control and Prevention: National Hospital. Discharge survey. http://www.cdc.gov/nchs/nhds.htm. Accessed August 22, 2013.
19. Dennison C, Pokras R. Design and operation of the National Hospital Discharge Survey: 1988 redesign. Vital Health Stat. 2000;(39):1-42.
20. Centers for Disease Control and Prevention, National Center for Health Statistics. International Classification of Diseases, Ninth Revision, Clinical Modification (ICD-9-CM). http://www.cdc.gov/nchs/icd/icd9cm.htm. Accessed June 18, 2013.
21. Memtsoudis SG, González Della Valle A, Besculides MC, Gaber L, Sculco TP. In-hospital complications and mortality of unilateral, bilateral, and revision TKA: based on an estimate of 4,159,661 discharges. Clin Orthop Relat Res. 2008;466(11):2617-2627. doi:10.1007/s11999-008-0402-5.
22. Stundner O, Kirksey M, Chiu YL, et al. Demographics and perioperative outcome in patients with depression and anxiety undergoing total joint arthroplasty: a population-based study. Psychosomatics. 2013;54(2):149-157. doi:10.1016/j.psym.2012.08.009.
23. Iezzoni LI, Daley J, Heeren T, et al. Using administrative data to screen hospitals for high complication rates. Inquiry. 1994;31(1):40-55.
24. Lemeshow S, Teres D, Klar J, Avrunin JS, Gehlbach SH, Rapoport J. Mortality Probability Models (MPM II) based on an international cohort of intensive care unit patients. JAMA. 1993;270(20):2478-2486.
25. Bot AG, Menendez ME, Neuhaus V, Ring D. The influence of psychiatric comorbidity on perioperative outcomes after shoulder arthroplasty. J Shoulder Elbow Surg. 2014;23(4):519-527. doi:10.1016/j.jse.2013.12.006.
26. United States Census Bureau. Population. https://www.census.gov/topics/population.html. Accessed December 4, 2012.
27. Porter SE, Schroeder AC, Dzugan SS, Graves ML, Zhang L, Russell GV. Acetabular fracture patterns and their associated injuries. J Orthop Trauma. 2008;22(3):165-170. doi:10.1097/BOT.0b013e318165918b.
28. Centers for Disease Control and Prevention. Motorcycle Crash-Related Data. https://www.cdc.gov/motorvehiclesafety/mc/index.html Accessed September 23, 2018
29. Ragnarsson B, Jacobsson B. Epidemiology of pelvic fractures in a Swedish county. Acta Orthop Scand. 1992;63(3):297-300. doi:10.3109/17453679209154786.
30. Melton LJ 3rd, Sampson JM, Morrey BF, Ilstrup DM. Epidemiologic features of pelvic fractures. Clin Orthop Relat Res. 1981;155(155):43-47. doi:10.1097/00003086-198103000-00008.
31. al-Qahtani S, O'Connor G. Acetabular fractures before and after the introduction of seatbelt legislation. Can J Surg. 1996;39(4):317-320.
32. Ochs BG, Marintschev I, Hoyer H, et al. Changes in the treatment of acetabular fractures over 15 years: analysis of 1266 cases treated by the German Pelvic Multicentre Study Group (DAO/DGU). Injury. 2010;41(8):839-851. doi:10.1016/j.injury.2010.04.010.
33. Letournel E. Acetabulum fractures: classification and management. Clin Orthop Relat Res. 1980;151(151):81-106. doi:10.1055/s-2007-980136.
34. de Ridder VA, de Lange S, Kingma L, Hogervorst M. Results of 75 consecutive patients with an acetabular fracture. Clin Orthop Relat Res. 1994;305(305):53-57. doi:10.1097/00003086-199408000-00008.
35. Aho AJ, Isberg UK, Katevuo VK. Acetabular posterior wall fracture. 38 Cases followed for 5 years. Acta Orthop Scand. 1986;57(2):101-105. doi:10.3109/17453678609000878.
36. Stöckle U, Hoffmann R, Südkamp NP, Reindl R, Haas NP. Treatment of complex acetabular fractures through a modified extended iliofemoral approach. J Orthop Trauma. 2002;16(4):220-230. doi:10.1097/00005131-200204000-00002.
37. Tibbs BM, Kopar P, Dente CJ. Acetabular and isolated pelvic ring fractures: a comparison of initial assessment and outcome. Am Surg. 2008;74(6):538-541; discussion 541.
38. Holstein JH, Culemann U, Pohlemann T, Working Group Mortality in Pelvic Fracture Patients. What are predictors of mortality in patients with pelvic fractures? Clin Orthop Relat Res. 2012;470(8):2090-2097. doi:10.1007/s11999-012-2276-9.
39. Vallier HA, Cureton BA, Ekstein C, Oldenburg FP, Wilber JH. Early definitive stabilization of unstable pelvis and acetabulum fractures reduces morbidity. J Trauma. 2010;69(3):677-684. doi:10.1097/TA.0b013e3181e50914.
40. Enninghorst N, Toth L, King KL, McDougall D, Mackenzie S, Balogh ZJ. Acute definitive internal fixation of pelvic ring fractures in polytrauma patients: a feasible option. J Trauma. 2010;68(4):935-941. doi:10.1097/TA.0b013e3181d27b48.
41. Buller LT, Best MJ, Quinnan SM. A nationwide analysis of pelvic ring fractures: incidence and trends in treatment, length of stay, and mortality. Geriatr Orthop Surg Rehabil. 2016;7(1):9-17. doi:10.1177/2151458515616250.
42. Yoshihara H, Yoneoka D. Trends in the incidence and in-hospital outcomes of elective major orthopaedic surgery in patients eighty years of age and older in the United States from 2000 to 2009. J Bone Joint Surg Am. 2014;96(14):1185-1191. doi:10.2106/JBJS.M.01126.
43. Lo JC, Srinivasan S, Chandra M, et al. Trends in mortality following hip fracture in older women. Am J Manag Care. 2015;21(3):e206-e214.
44. Halvorson JJ, Lamothe J, Martin CR, et al. Combined acetabulum and pelvic ring injuries. J Am Acad Orthop Surg. 2014;22(5):304-314. doi:10.5435/JAAOS-22-05-304.
45. Osgood GM, Manson TT, O'Toole RV, Turen CH. Combined pelvic ring disruption and acetabular fracture: associated injury patterns in 40 patients. J Orthop Trauma. 2013;27(5):243-247. doi:10.1097/BOT.0b013e31826c2751.
46. Poole GV, Ward EF, Muakkassa FF. Pelvic fracture from major blunt trauma. Outcome is determined by associated injuries. Ann Surg. 1991;213(6):532-538; discussion 538.
47. Knöferl MW, Angele MK, Diodato MD, et al. Female sex hormones regulate macrophage function after trauma-hemorrhage and prevent increased death rate from subsequent sepsis. Ann Surg. 2002;235(1):105-112. doi:10.1097/00000658-200201000-00014.
48. Goldstein A, Phillips T, Sclafani SJ, et al. Early open reduction and internal fixation of the disrupted pelvic ring. J Trauma. 1986;26(4):325-333. doi:10.1097/00005373-198604000-00004.
49. Latenser BA, Gentilello LM, Tarver AA, Thalgott JS, Batdorf JW. Improved outcome with early fixation of skeletally unstable pelvic fractures. J Trauma. 1991;31(1):28-31. doi:10.1097/00005373-199101000-00006.
50. Riemer BL, Butterfield SL, Diamond DL, et al. Acute mortality associated with injuries to the pelvic ring: the role of early patient mobilization and external fixation. J Trauma. 1993;35(5):671-675; discussion 676.
51. Madhu R, Kotnis R, Al-Mousawi A, et al. Outcome of surgery for reconstruction of fractures of the acetabulum. The time dependent effect of delay. J Bone Joint Surg Br. 2006;88(9):1197-1203. doi:10.1302/0301-620X.88B9.17588.
52. Centers for Disease Control and Prevention. The State of Aging & Health in America 2013. https://www.cdc.gov/aging/pdf/state-aging-health-in-america-2013.pdf. Accessed December 5, 2013.
53. Bohl DD, Basques BA, Golinvaux NS, Baumgaertner MR, Grauer JN. Nationwide Inpatient Sample and National Surgical Quality Improvement Program give different results in hip fracture studies. Clin Orthop Relat Res. 2014;472(6):1672-1680. doi:10.1007/s11999-014-3559-0.
54. Memtsoudis SG. Limitations associated with the analysis of data from administrative databases. Anesthesiology. 2009;111(2):449. [author reply:450-451]. doi:10.1097/ALN.0b013e3181adf739.
55. Neuhaus V, Swellengrebel CH, Bossen JK, Ring D. What are the factors influencing outcome among patients admitted to a hospital with a proximal humeral fracture? Clin Orthop Relat Res. 2013;471(5):1698-1706. doi:10.1007/s11999-013-2876-z.
ABSTRACT
The incidence of acetabular fractures and associated in-hospital complication rates in the United States are poorly defined. Studies evaluating predictors of outcome for isolated acetabular fractures are weakly generalizable due to small sample sizes or the inclusion of all types of pelvic fractures. This study sought to analyze trends in acetabular fractures and associated complications in the US using the largest and most recent national dataset available.
The National Hospital Discharge Survey was queried to identify all patients admitted to US hospitals with acetabular fractures between 1990 and 2010. A representative cohort of 497,389 patients was identified, and multivariable logistic regression was used to identify independent predictors of mortality, adverse events, requirement of blood transfusion, and operative treatment with open reduction and internal fixation (ORIF).
Between 1990 and 2010, the population-adjusted incidence of acetabular fractures increased from 7.8 to 9.5/100,000 capita (P < .001). Mortality declined from 5.9% to 0.4% (P < .001), paralleling an increase in the proportion of patients treated with ORIF (12.6%-20.4%, P < .001), which was the variable associated with the lowest odds of mortality. Surgical intervention was associated with higher odds of adverse events and a requirement for blood transfusion. The average in-hospital length of stay decreased from 17.0 days to 10.3 days (P < .001).
This study provides the largest and most comprehensive epidemiologic analysis of acetabular fractures in the US. Knowledge of the increasing incidence of acetabular fractures and prognostic factors associated with poor outcomes may improve outcomes.
Continue to: Acetabular fractures are major injuries...
Acetabular fractures are major injuries frequently associated with life-altering sequelae1 and a significant resulting cost to society.2 Acetabular fractures are most often the result of a high-energy trauma3-5 or fall from a height.5,6 Functional outcomes and the prevention of post-traumatic arthritis have been shown to depend upon the accuracy of operative reduction.7-9 However, literature on the epidemiology of acetabular fractures is largely limited to European countries,1,10 and their incidence in the United States is more poorly defined.11 Published mortality rates in the existing literature vary widely from 2% to 45%,12-14 and few studies have identified the risk factors associated with in-hospital complications.15 While age, gender, and high-velocity mechanisms have been linked to increased mortality and complications,14-16 the evidence for these associations is poorly generalizable due to the inclusion of all pelvic fractures in these studies. Some reports suggest that advances in surgical management have improved survival and functional outcome,15,17 but these are based upon small cohorts. Knowledge of the incidence and patterns of disease burden are crucial for the allocation of limited healthcare resources.
This study sought to describe the trends in incidence as well as the factors influencing mortality and the risk of complications for patients admitted to US hospitals with an acetabular fracture using the National Hospital Discharge Survey (NHDS), the most recently available Centers for Disease Control and Prevention data, which is also one of the largest inpatient databases in the US. Knowledge of the factors influencing outcomes for patients admitted with acetabular fractures may improve management and decrease complications.
METHODS
NATIONAL HOSPITAL DISCHARGE SURVEY
The NHDS, developed by the National Center for Healthcare Statistics division of the Centers for Disease Control and Prevention,18 was used to estimate the incidence of acetabular fractures and to evaluate the risk factors for ensuing mortality and inpatient complications. The NHDS is a publically available survey providing demographic and medical data for inpatients discharged from non-federal, short-stay hospitals in the US.19 The NHDS is the principal database used by the US government for monitoring hospital use and is considered the most comprehensive of all inpatient surgical databases in use today.19 The survey uses International Classification of Diseases, 9th Revision, Clinical Modification (ICD-9-CM) codes20 to classify medical diagnoses and procedures. The NHDS uses a stratified, multistage probability design to collect demographic information (age, gender, race), expected source of payment (insurance status), medical information of up to 7 discharge diagnoses and up to 4 procedures, length of care, hospital size, US region, and inpatient outcomes including discharge destination.21 To ensure unbiased national sampling of inpatient records, the NHDS uses a complex, 3-stage probability design including inflation by reciprocals of the probabilities of sample selection, adjustment for no response, and population weighting ratio adjustments.19 This study did not require approval by the Institutional Review Board because the NHDS is a publically available database with no patient-identifying information.
Continue to: PATIENT SELECTION...
PATIENT SELECTION
All patients admitted to hospitals in the US with a fracture of the acetabulum between 1990 and 2010 were identified using ICD-9-CM codes. Discharges with a diagnosis code (ICD-9-CM) of closed fracture of the acetabulum (808.0) or open fracture of the acetabulum (808.1) were identified using previously described techniques.22 The database was subsequently queried to identify patients treated using open reduction and internal fixation (ORIF) (ICD-9-CM, 79.30/79.39), closed reduction and internal fixation (CRIF) (ICD-9-CM, 79.10/79.19), or external (ICD-9-CM, 78.10/78.19) or internal (ICD-9-CM, 78.50/78.59) fixation without reduction. Demographic variables were then collected, including age, sex, primary diagnosis, associated diagnoses, type of fracture (open vs closed), prevalence of comorbidities, length of stay, and discharge destination. The complication screening package23 was used to determine the incidence of complications. The variable adverse event was created on the basis of the variables postoperative bleeding (998.1), acute postoperative infection (998.5), acute postoperative anemia (285.1), acute renal failure (584), acute myocardial infarction (410), pulmonary embolism (415.1), induced mental disorder (293), pneumonia (480-486), pulmonary insufficiency (518.5), deep venous thrombosis (453.4), intubation (96.xx), and blood transfusion (99.x).
STATISTICAL ANALYSIS
Because of the large sample size, a normal distribution of the data was assumed. Differences between categorical variables were compared using the Pearson chi square test, while the independent-samples t test was used to compare differences between continuous variables. To determine independent predictors of in-hospital outcomes (death, adverse events, requirement for blood transfusion, or treatment with ORIF), all variables present in at least 2% of the population24 were included in a multivariable binary logistic regression model. For in-hospital adverse events, a 1% cutoff was used due to their lower rates of occurrence, as previously described.25The dichotomous variables were death, presence of adverse events, receipt of blood transfusion, and treatment with ORIF. A multivariable regression model allows for the control of potential confounders, isolating the effect of individual variables on inpatient outcomes. Covariates accounted for in the regression model included gender, age, region of the country, and preexisting comorbidities (diabetes mellitus, hypertension, congestive heart failure, coronary artery disease, atrial fibrillation). To assess the association between individual variables and inpatient outcomes, odds ratios and confidence intervals were calculated. A P value of <.001 was used to define statistical significance, correcting for multiple comparisons, as previously described.25 US census data were used to obtain national population estimates for each year of the study from 1990 to 2010.26 Rates were presented as the number of acetabular fractures per 100,000 standard population. All data were analyzed using the software Statistical Package for the Social Sciences [SPSS] version 20.
RESULTS
INCIDENCE AND DEMOGRAPHICS
A cohort representative of 497,389 patients with a diagnosis of acetabular fracture was identified between 1990 and 2010 (Table 1). In 1990, 19,560 cases (7.84 per 100,000 capita) of acetabular fractures were recoded, while in 2010, the number of cases increased to 29,373 or 9.5 per 100,000 capita (P < .001) (Table 2). The mean age of patients with an acetabular fracture was 52.6 years (standard deviation [SD], 23.7) and 60.6% were male (Table 1). The most frequently associated diagnosis was closed fracture of the pelvis (29.8%) followed by fracture of the femur (13.1%) and closed fracture of the ilium (3.8%) (Table 1). Of the total cohort, 23.2% underwent ORIF (Table 1). In 1990, 12.6% of patients with a diagnosis of acetabular fracture underwent ORIF, whereas 20.4% of patients underwent ORIF in 2010 (P < .001) (Table 2). Average length of hospital stay was 8.3 days (SD, 17.9) overall (Table 1). In 1990 the average length of stay was 17.0 days (SD, 14.9), decreasing to 10.3 days (SD, 9.3) in 2010 (P < .001) (Table 2).
Table 1. Patient Characteristics for Patients with Acetabular Fractures in the United States from 1990 to 2007
Parameter | Total 1990-2010 |
Total Number | 497,389 |
Gender (%) |
|
Male | 60.6 |
Female | 39.4 |
Age, years (%) |
|
<20 | 6.7 |
20-40 | 31.5 |
41-60 | 22.3 |
61-85 | 30.4 |
>85 | 23.5 |
Race (%) |
|
White | 66.4 |
Black | 9.3 |
Asian | 1.7 |
Other | 2.4 |
Not stated | 20.2 |
Primary Diagnosis (%) |
|
Closed fracture of acetabulum (808.0) | 98.9 |
Open fracture of acetabulum (808.1) | 1.1 |
Associated diagnoses (%) |
|
Closed fracture of pubis (808.2) | 26.1 |
Open fracture of pubis (808.3) | 0.1 |
Closed fracture of ischium (808.42) | 1.7 |
Open fracture of ischium (808.52) | 0.0 |
Closed fracture of ilium (808.41) | 3.8 |
Open fracture of ilium (808.51) | 0.0 |
Closed fracture other part pelvis (808.49) | 0.7 |
Open fracture other part pelvis (808.59) | 0.0 |
Multiple closed pelvic fractures (808.43) | 0.5 |
Multiple open pelvic fractures (808.53) | 0.0 |
Any pelvic fracture from above | 29.8 |
Fracture of neck of femur (820) | 7.2 |
Fracture of any part of femur (820/821) | 13.1 |
Head trauma (959.01) | 0.7 |
Head/face trauma (959.0/959.01) | 0.7 |
Chest trauma (959.11) | 0.1 |
Chest/trunk trauma (959.1/959.11) | 0.1 |
Procedures (%) |
|
Open reduction internal fixation (79.30/79.39) | 23.2 |
Closed reduction internal fixation (79.10/79.19) | 1.3 |
External fixation (78.10/78.19) | 0.7 |
Internal fixation without reduction (78.50/78.59) | 0.4 |
Comorbidities (%) |
|
No | 72.9 |
Yes | 27.1 |
Adverse Events (%) |
|
No | 74.1 |
Yes | 25.9 |
Discharge Disposition (%) |
|
Routine/home (1) | 45.4 |
Left against medical advice (2) | 0.2 |
Short term fac (3) | 13.1 |
Long term fac (4) | 22.2 |
Alive, not stated (5) | 12 |
Dead (6) | 3.5 |
Not reported (9) | 3.6 |
Mortality (%) | 3.5 |
Age (y), mean (SD) | 52.6 (23.7) |
Days of Care, mean (SD) | 8.3 (17.9) |
Principal Source of Payment (%) |
|
Private insurance | 39 |
Medicare | 30.5 |
Medicaid | 7.7 |
Other government | 1.9 |
Self-pay | 7.9 |
Workmen’s comp | 4 |
Other | 4.7 |
Not stated | 4.4 |
Abbreviation: SD, standard deviation.
Table 2. Patient Characteristics in 1990, 1995, 1999, 2003, and 2007 Among Patients with Acetabular Fractures
Variable | 1990 | 1995 | 1999 | 2003 | 2007 | 2010 |
Total number | 19,560 | 17,506 | 22,767 | 27,133 | 34,027 | 29,373 |
Incidence per 100,000 capita | 7.84 | 6.57 | 8.16 | 9.35 | 11.30 | 9.5 |
Gender (%) |
| |||||
Male | 51.0 | 70.7 | 61.2 | 62.6 | 62.5 | 64.9 |
Female | 49.0 | 29.3 | 38.8 | 37.4 | 37.5 | 35.1 |
Fracture (%) |
| |||||
Open | 2.1 | 1.7 | 3.3 | 1.4 | 0.1 | 1.8 |
Closed | 97.9 | 98.3 | 96.7 | 98.6 | 99.9 | 98.2 |
Underwent ORIF (%) | 12.6 | 20.9 | 20.2 | 22.9 | 27.8 | 20.4 |
Adverse events (%) | 10.9 | 16.2 | 23.7 | 31 | 35.1 | 37.6 |
Transfusion (%) | 0.3 | 2.2 | 7.4 | 6.5 | 10.5 | 9.5 |
Discharge (%) |
| |||||
Routine | 58 | 65.6 | 35.6 | 45.9 | 40.2 | 41.6 |
Non-routine to inpatient facility | 26.8 | 23.1 | 46.4 | 33.8 | 40.8 | 34.6 |
Mortality (%) | 5.9 | 3.6 | 2 | 2.9 | 1.5 | 0.4 |
Mean Age (y) | 52.9 | 48.4 | 52.3 | 56.3 | 57 | 53.2 |
Mean DOC (days) | 17.0 | 13.4 | 8.7 | 10.8 | 8.5 | 10.3 |
Abbreviations: DOC, days of care; ORIF, open reduction internal fixation.
Continue to: MORTALITY...
MORTALITY
In-hospital mortality decreased from 5.9% in 1990 to 0.4% in 2010 (P < .001) (3.5% for the total cohort) (Tables 1 and 2). Multivariable logistic regression analysis demonstrated pulmonary insufficiency (odds ratio [OR], 9.07; 95% confidence interval [CI], 8.52-9.66; P < .01), pneumonia (OR, 3.22; 95% CI, 3.05-3.39; P < .01), and age >85 years (OR, 2.28; 95% CI, 2.16-2.40; P < .01) to be associated with the highest odds of inpatient mortality. CRIF (OR, 1.99; 95% CI, 1.78-2.23; P < .01), external fixator (OR, 1.82; 95% CI, 1.45-2.29; P < .01), and having received a blood transfusion (OR, 1.81; 95% CI, 1.71-1.91; P < .01) were also associated with increased odds of mortality. Treatment with ORIF (OR, 0.19; 95% CI, 0.17-0.20; P < .01) was independently associated with decreased odds of inpatient mortality, as was age <20 years (OR, 0.26; 95% CI, 0.23-0.30; P < .01) (model fit: for omnibus test of model coefficients, X = 25,966 P < .01; Nagelkerke, R2 = 0.20) (Table 3).
Table 3. Logistic Regression for Predictors of Mortality Among Patients with Acetabular Fractures (n = 403,927)
Variable | OR (95% CI) | P |
Pulmonary insufficiency | 9.07 (8.52–9.66) | < 0.01 |
Pneumonia | 3.22 (3.05–3.39) | < 0.01 |
Age >85 years | 2.28 (2.16–2.40) | < 0.01 |
Closed reduction internal fixation | 1.99 (1.78–2.23) | < 0.01 |
External Fixator | 1.82 (1.45–2.29) | < 0.01 |
Blood transfusion | 1.81 (1.71–1.91) | < 0.01 |
Gender (male) | 1.76 (1.70–1.83) | < 0.01 |
Associated femoral neck fracture | 1.23 (1.15–1.30) | < 0.01 |
Age 41-60 years | 1.19 (1.11–1.29) | < 0.01 |
Age 61-85 years | 1.17 (1.11–1.23) | < 0.01 |
Congestive heart failure | 1.14 (1.07–1.22) | < 0.01 |
Associated pelvic fracture | 1.13 (1.10–1.17) | < 0.01 |
Geographic region | 1.11 (1.09–1.12) | < 0.01 |
Source of payment | 1.02 (1.01–1.02) | < 0.01 |
Race | 0.99 (0.98–0.99) | < 0.01 |
DOC | 0.98 (0.98–0.98) | < 0.01 |
Hypertension | 0.67 (0.64–0.71) | < 0.01 |
Atrial fibrillation | 0.52 (0.48–0.57) | < 0.01 |
Diabetes mellitus | 0.35 (0.32–0.38) | < 0.01 |
Age 20-40 years | 0.32 (0.30–0.35) | < 0.01 |
Age <20 years | 0.26 (0.23–0.30) | < 0.01 |
Coronary artery disease | 0.21 (0.18–0.24) | < 0.01 |
Open reduction internal fixation | 0.19 (0.17–0.20) | < 0.01 |
Omnibus X 25,966, P < .01 | ||
Nagelkerke R2= 0.20 |
Abbreviations: CI, confidence interval; DOC, days of care; OR, odds ratio.
COMORBIDITIES AND ADVERSE EVENTS
The prevalence of comorbidities and adverse events is listed in Tables 4 and 5, respectively. Hypertensive disease was the most common comorbidity at 15.3%, followed by diabetes mellitus at 6.9%. Overall, 25.9% of patients experienced an in-hospital adverse event, with the most common being postoperative anemia (7.3%) and blood transfusion (8.1%) (Tables 1 and 5). The percentage of patients experiencing an adverse event increased from 10.9% in 1990 to 37.6% in 2010 (P < .01) (Table 2). Multivariable logistic regression analysis revealed CRIF (OR, 3.08; 95% CI, 2.91-3.26; P < .01), coronary artery disease (OR, 2.02; 95% CI, 1.91-2.15; P < .01), associated femoral neck fracture (OR, 1.53; 95% CI, 1.47-1.60; P < .01), and ORIF (OR, 1.22; 95% CI, 1.20-1.24; P < .01) to be associated with higher odds of inpatient adverse events (model fit: for omnibus test of model coefficients, X = 160,275, P < .01; Nagelkerke, R2 = 0.41) (Table 6).
Table 4. Prevalence of Comorbidities in Patients with Acetabular Fractures Between 1990 and 2007 (n = 403.927)
Parameter (ICD-9) | Percentage of Total |
Hypertensive disease (401–405) | 15.3% |
Diabetes mellitus (250) | 6.9% |
Atrial fibrillation (427.31) | 4.0% |
Congestive heart failure (428) | 3.9% |
Osteoporosis (733.0) | 2.1% |
Coronary artery disease (414.01) | 2.0% |
Obesity (278.00, 278.01) | 2.0% |
Abbreviation: ICD-9, International Classifications of Diseases, 9th Revision.
Table 5. Prevalence of In-Hospital Adverse Events Among Patients with Acetabular Fractures Between 1990 and 2007 (n = 403,927)
Parameter (ICD-9) | Percentage of Total |
Transfusion of blood (99.0) | 8.1% |
Acute postoperative anemia (285.1) | 7.3% |
Intubation (96.x) | 4.9% |
Acute renal failure (584) | 3.4% |
Pneumonia (480-486) | 3.2% |
Pulmonary insufficiency (518.5) | 2.3% |
Pulmonary embolism (415.1) | 1.6% |
Deep venous thrombosis (453.4) | 1.0% |
Acute myocardial infarction (410) | 0.9% |
Postoperative bleeding (998.1) | 0.7% |
Acute postoperative infection (998.5) | 0.5% |
Induced mental disorder (293) | 0.4% |
Abbreviation: ICD-9, International Classifications of Diseases, 9th Revision.
Table 6. Logistic Regression for Predictors of Adverse Events Among Patients Hospitalized for Acetabular Fracture (n = 403,927)
Variable | OR (95% CI) | P |
Closed reduction internal fixation | 3.08 (2.91-3.26) | < 0.01 |
Coronary artery disease | 2.02 (1.91-2.15) | < 0.01 |
Associated femoral neck fracture | 1.53 (1.47-1.60) | < 0.01 |
Open reduction internal fixation | 1.22 (1.20-1.24) | < 0.01 |
Gender (male) | 1.16 (1.14-1.18) | < 0.01 |
Associated fracture of any part of femur | 1.13 (1.10-1.17) | < 0.01 |
Age >85 years | 1.08 (1.05-1.12) | < 0.01 |
Geographic region | 1.07 (1.06-1.07) | < 0.01 |
DOC | 1.04 (1.04-1.04) | < 0.01 |
Race | 1.02 (1.02-1.03) | < 0.01 |
Source of payment | 1.01 (1.01-1.01) | < 0.01 |
Congestive heart failure | 1.01 (0.96-1.06) | 0.78 |
Atrial fibrillation | 0.88 (0.84-0.92) | < 0.01 |
Age 61-85 years | 0.68 (0.66-0.71) | < 0.01 |
Age <20 years | 0.67 (0.64-0.70) | < 0.01 |
Associated pelvis fracture | 0.64 (0.63-0.66) | < 0.01 |
Age 41-60 years | 0.58 (0.56-0.61) | < 0.01 |
Diabetes mellitus | 0.48 (0.46-0.50) | < 0.01 |
Age 20-40 years | 0.45 (0.43-0.47) | < 0.01 |
Hypertension | 0.44 (0.43-0.45) | < 0.01 |
External Fixator | 0.39 (0.35-0.44) | < 0.01 |
Omnibus X 160,275, P < .01 | ||
Nagelkerke R2 = 0.41 |
Abbreviations: CI, confidence interval; DOC, days of care; OR, odds ratio.
BLOOD TRANSFUSION
Overall, 7.3% of patients experienced acute postoperative anemia (Table 5). Between 1990 and 2010, the percentage of patients receiving blood transfusions increased from 0.3% to 9.5%, respectively (P < .01) (Table 2). In multivariable logistic regression analysis, patients treated with ORIF (OR, 8.13; 95% CI, 7.91-8.36; P < .01), those with congestive heart failure (OR, 4.23; 95% CI, 4.06-4.41; P < .01), those with an associated femur fracture (OR, 3.13; 95% CI, 2.99-3.27; P < .01), those with atrial fibrillation (OR, 1.96; 95% CI, 1.88-2.05; P < .01), and those treated with CRIF (OR, 1.42; 95% CI, 1.29-1.56; P < .01) were associated with significantly higher odds of blood transfusion (model fit: omnibus test of model coefficients, X = 42,653, P < .01; Nagelkerke, R2 = 0.19) (Table 7).
Table 7. Logistic Regression for Predictors of the Requirement for Blood Transfusion Among Patients with Acetabular Fractures (n = 403,927)
Variable | OR (95% CI) | P |
Open reduction internal fixation | 8.13 (7.91-8.36) | < 0.01 |
Congestive heart failure | 4.23 (4.06-4.41) | < 0.01 |
Associated fracture of any part of femur | 3.13 (2.99-3.27) | < 0.01 |
Atrial fibrillation | 1.96 (1.88-2.05) | < 0.01 |
Closed reduction internal fixation | 1.42 (1.29-1.56) | < 0.01 |
Geographic region | 1.38 (1.36-1.39) | < 0.01 |
Hypertension | 1.38 (1.34-1.42) | < 0.01 |
Associated pelvic fracture | 1.28 (1.25-1.31) | < 0.01 |
Age 61-85 years | 1.06 (1.02-1.11) | 0.01 |
Source of payment | 0.99 (0.98-0.99) | < 0.01 |
Race | 0.98 (0.97-0.98) | < 0.01 |
DOC | 0.96 (0.96-0.96) | < 0.01 |
Age >85 years | 0.74 (0.72-0.77) | < 0.01 |
External fixator | 0.69 (0.59-0.80) | < 0.01 |
Coronary artery disease | 0.62 (0.57-0.68) | < 0.01 |
Age 41-60 years | 0.57 (0.54-0.60) | < 0.01 |
Gender (male) | 0.54 (0.52-0.55) | < 0.01 |
Diabetes mellitus | 0.38 (0.36-0.41) | < 0.01 |
Age 20-40 years | 0.32 (0.30-0.34) | < 0.01 |
Associated femoral neck fracture | 0.29 (0.27-0.31) | < 0.01 |
Age <20 years | 0.24 (0.22-0.26) | < 0.01 |
Omnibus X = 42,653, P < .01 | ||
Nagelkerke R2 = 0.19 |
Abbreviations: CI, confidence interval; DOC, days of care; OR, odds ratio.
TREATMENT WITH ORIF
Over the 20-year study period, 23.2% of patients with acetabular fractures were treated with ORIF (Table 1). In 1990, 12.6% of patients underwent ORIF, while in 2010 this percentage increased to 20.4% (P < .001) (Table 2). Multivariable logistic regression analysis demonstrated that age between 41 and 60 years (OR, 1.88; 95% CI, 1.78-1.98; P < .01) was associated with the highest odds of undergoing ORIF. Age 20 to 40 years (OR, 1.86; 95% CI, 1.76-1.97; P < .01), age <20 years (OR, 1.82; 95% CI, 1.72-1.93; P < .01), and male gender (OR, 1.65; 95% CI, 1.63-1.68; P < .01) were also associated with being treated by ORIF. In contrast, coronary artery disease (OR, 0.27; 95% CI, 0.25-0.30; P < .01), age >85 years (OR, 0.46; 95% CI, 0.44-0.47; P < .01), and congestive heart failure (OR, 0.48; 95% CI, 0.46-0.51; P < .01) were associated with the lowest odds of undergoing ORIF (model fit: omnibus test of model coefficients, X = 71,118, P < .01; Nagelkerke, R2 = 0.20) (Table 8).
Table 8. Logistic Regression for Predictors of the Requirement for Discharge to Another Inpatient Facility Among Patients with Acetabular Fractures (n = 403,927)
Variable | OR (95% CI) | P |
Age 41-60 years | 1.88 (1.78-1.98) | < 0.01 |
Age 20-40 years | 1.86 (1.76-1.97) | < 0.01 |
Age <20 years | 1.82 (1.72-1.93) | < 0.01 |
Gender (male) | 1.65 (1.63-1.68) | < 0.01 |
Larger hospital bed size | 1.46 (1.45-1.47) | < 0.01 |
Hypertension | 1.35 (1.32-1.38) | < 0.01 |
Diabetes mellitus | 1.09 (1.05-1.13) | < 0.01 |
DOC | 1.02 (1.02-1.02) | < 0.01 |
Source of payment | 1.01 (1.01-1.02) | < 0.01 |
Race | 1.00 (0.99-1.00) | 0.17 |
Age 61-85 years | 0.94 (0.90-0.99) | 0.02 |
Region | 0.92 (0.91-0.93) | < 0.01 |
Atrial fibrillation | 0.83 (0.79-0.87) | < 0.01 |
Congestive heart failure | 0.48 (0.46-0.51) | < 0.01 |
Age >85 years | 0.46 (0.44-0.47) | < 0.01 |
Coronary artery disease | 0.27 (0.25-0.30) | < 0.01 |
Omnibus X 71,118, P < .01 | ||
Nagelkerke R2 = 0.20 |
Abbreviations: CI, confidence interval; DOC, days of care; OR, odds ratio.
Continue to: DISCUSSION...
DISCUSSION
This study evaluates the incidence of acetabular fractures in the US between 1990 and 2010, and identifies prognostic factors associated with complications and death. The study demonstrates an increase in the population-adjusted incidence of acetabular fractures between 1990 and 2010 (7.84 cases per 100,000 capita to 9.5 cases per 100,000 capita), in contrast to the decreasing trend reported by Mauffrey and colleagues.11 Some studies suggest that up to 80% of acetabular fractures are associated with motor vehicle collisions and motorcycle accidents.9,27 While the rate of motor vehicle accidents has remained stable over the study period, motorcycle ownership and deaths more than doubled between 2001 and 2008,28 primarily among individuals over 40 years of age. In this study, the mean age of patients with acetabular fractures ranged from 48 to 57 years. The dramatic increase in motorcycle ownership and deaths in these age groups may partially explain the rising incidence of acetabular fractures. The other possibility is that changes in automobile design and safety equipment may have altered the injury patterns observed in patients surviving motor vehicle crashes. Compared to the United Kingdom, in which studies report a fixed incidence of 3 per 100,000 capita1 between 1988 and 2003, the incidence of acetabular fractures in the US is greater. In contrast, the incidence of acetabular fractures reported in this study is less than the 20 per 100,000 reported in Sweden between 1976 and 1985,29 or the 37 per 100,000 reported in Rochester, Minnesota between 1968 and 1977,30 which may be due to increased seatbelt usage.31
In addition to the national incidence, this study demonstrated that the proportion of patients with acetabular fractures treated with ORIF increased from 12.6% to 20.4% between 1990 and 2010. This is substantially lower than the 77% reported by Ochs and colleagues32 in a German population. Concurrent with the increase in ORIF, there was a decrease in in-hospital mortality from 5.9% in 1990 to 0.4% in 2010. The initial mortality rates in this study are comparable to much earlier reports and some small studies,9,32-37 but the rates reported in the later years of this study show a substantial decrease that is likely a more accurate estimation of the current incidence. The improved survival rates may be due to advances in the operative treatment of acetabular fractures, in which mechanical stabilization allows for early patient mobilization and facilitation of optimal nursing care.38 With ORIF becoming the standard of care for displaced acetabular fractures,9 numerous reports have demonstrated an association between early definitive fixation and improved survival.17,39,40 This is similar to our study, which found ORIF to be associated with the lowest odds of mortality in multivariate logistic regression analysis. It is possible that advances in patient care by intensivists over this period have also contributed to the decrease in mortality, but the correlation with operative treatment in this study is very strong and agrees well with prior studies.16 Moreover, multiple studies have demonstrated decreased in-hospital mortality among patients undergoing various orthopedic surgical procedures during this period.41-43 The correlation with operative treatment in this study agrees well with prior studies.16
In contrast, higher odds of mortality were seen in patients over the age of 85 years with pulmonary insufficiency, congestive heart failure, pneumonia, or an associated femur or pelvic fracture. This is similar to prior reports in which patients with combined acetabulum and pelvic ring injuries fared worse than those with isolated injures,44,45 as did patients with associated non-musculoskeletal injuries.46 The finding that age over 85 years was associated with higher odds of mortality likely reflects the increased number of comorbidities and decreased physiologic reserve seen in this patient population. Finally, male gender was associated with higher odds of in-hospital mortality. There are 2 possible explanations for this: Either there is gender dimorphism in sex hormones and cytokine activity in response to hemorrhage and sepsis,38,47 or there is a greater tendency for males to be involved in higher energy accidents with more severe concomitant injuries.
The results of multivariable regression analysis demonstrated that patients were more likely to require blood transfusion if they were managed surgically or had atrial fibrillation, congestive heart failure, or associated femur fracture. Not surprisingly, concurrent pelvic fracture was also associated with higher odds of blood transfusion, as pelvic hemorrhage is reported to be the cause of death in up to half of patients who die following a pelvic fracture.46
Between 1990 and 2010, in-hospital days of care decreased from 17.0 days to 10.3 days. While a decreased length of stay has been demonstrated in other orthopedic conditions over the study period,41 it is possible the decrease in length of stay demonstrated in this study is due to improved surgical technique and the implementation of early surgical intervention.39,48-50 Plaisier and colleagues17 demonstrated superior functional outcomes, quicker return to baseline function, and decreased length of stay in patients treated with early ORIF of their acetabular fractures. Other studies have shown that the benefits of early surgery include improved reduction quality and ease of reduction,51 as well as control of bleeding, pain relief, and mobilization of the patient.39 Another possible explanation for the decreased length of stay is the increased rate of discharge to other inpatient facilities, such as rehabilitation facilities, which was demonstrated in this study.
Continue to: Interestingly, male gender and younger age...
Interestingly, male gender and younger age were associated with operative management of the acetabular fracture. In contrast, there was a decreased likelihood of operative treatment among elderly patients and those patients with cardiac comorbidities. It is possible that the relationship we found between the likelihood of ORIF and age relates to the bimodal distribution of fractures, with higher energy and potentially more displaced fractures occurring in younger patients3-5 and lower energy fractures in the elderly.
In contrast to decreasing in-hospital days of care, there was a rise in the number of adverse events between 1990 (10.9%) and 2010 (37.6%). This can be partially attributed to the increased rates of blood transfusion, which was received by 9.5% of patients with acetabular fractures in the final study year. Additionally, surgical intervention was associated with increased adverse events in this study, and surgical intervention increased over the study period. Other factors that may have contributed to an increase in adverse events include an aging population,52 as advanced age was independently associated with higher odds of adverse events in this study.
Despite the strengths of using large, national databases for epidemiological research,53 this study has several limitations. Like all large databases, the NHDS is subject to error in coding and data entry.54 Additionally, the database only allows for 7 diagnostic codes and 4 procedure codes per entry. As a result, the prevalence of comorbid conditions and adverse events may be underreported.25 Moreover, the severity of a comorbid disease cannot be appreciated when dichotomously classified.55 Another limitation is that the database only provides inpatient data, so complications that arise after discharge, as well as follow-up data, are unknown. Furthermore, the results of this study are limited to practice patterns in the US from 1990 to 2010. This database does not provide injury mechanisms, so we cannot distinguish between high-energy and low-energy injuries. Lastly, analysis of the different types of acetabular fractures was not performed since classification of acetabular fractures cannot be assessed with ICD-9 codes.
CONCLUSION
This study is the largest epidemiologic analysis of acetabular fractures in the US and also provides predictors of in-hospital mortality. The incidence of acetabular fractures in the US is increasing, while mortality is decreasing. Identifying risk factors associated with poor outcomes has the potential to change treatment strategies, resource allocation, in-hospital monitoring, and discharge planning for this patient population.
This paper will be judged for the Resident Writer’s Award.
ABSTRACT
The incidence of acetabular fractures and associated in-hospital complication rates in the United States are poorly defined. Studies evaluating predictors of outcome for isolated acetabular fractures are weakly generalizable due to small sample sizes or the inclusion of all types of pelvic fractures. This study sought to analyze trends in acetabular fractures and associated complications in the US using the largest and most recent national dataset available.
The National Hospital Discharge Survey was queried to identify all patients admitted to US hospitals with acetabular fractures between 1990 and 2010. A representative cohort of 497,389 patients was identified, and multivariable logistic regression was used to identify independent predictors of mortality, adverse events, requirement of blood transfusion, and operative treatment with open reduction and internal fixation (ORIF).
Between 1990 and 2010, the population-adjusted incidence of acetabular fractures increased from 7.8 to 9.5/100,000 capita (P < .001). Mortality declined from 5.9% to 0.4% (P < .001), paralleling an increase in the proportion of patients treated with ORIF (12.6%-20.4%, P < .001), which was the variable associated with the lowest odds of mortality. Surgical intervention was associated with higher odds of adverse events and a requirement for blood transfusion. The average in-hospital length of stay decreased from 17.0 days to 10.3 days (P < .001).
This study provides the largest and most comprehensive epidemiologic analysis of acetabular fractures in the US. Knowledge of the increasing incidence of acetabular fractures and prognostic factors associated with poor outcomes may improve outcomes.
Continue to: Acetabular fractures are major injuries...
Acetabular fractures are major injuries frequently associated with life-altering sequelae1 and a significant resulting cost to society.2 Acetabular fractures are most often the result of a high-energy trauma3-5 or fall from a height.5,6 Functional outcomes and the prevention of post-traumatic arthritis have been shown to depend upon the accuracy of operative reduction.7-9 However, literature on the epidemiology of acetabular fractures is largely limited to European countries,1,10 and their incidence in the United States is more poorly defined.11 Published mortality rates in the existing literature vary widely from 2% to 45%,12-14 and few studies have identified the risk factors associated with in-hospital complications.15 While age, gender, and high-velocity mechanisms have been linked to increased mortality and complications,14-16 the evidence for these associations is poorly generalizable due to the inclusion of all pelvic fractures in these studies. Some reports suggest that advances in surgical management have improved survival and functional outcome,15,17 but these are based upon small cohorts. Knowledge of the incidence and patterns of disease burden are crucial for the allocation of limited healthcare resources.
This study sought to describe the trends in incidence as well as the factors influencing mortality and the risk of complications for patients admitted to US hospitals with an acetabular fracture using the National Hospital Discharge Survey (NHDS), the most recently available Centers for Disease Control and Prevention data, which is also one of the largest inpatient databases in the US. Knowledge of the factors influencing outcomes for patients admitted with acetabular fractures may improve management and decrease complications.
METHODS
NATIONAL HOSPITAL DISCHARGE SURVEY
The NHDS, developed by the National Center for Healthcare Statistics division of the Centers for Disease Control and Prevention,18 was used to estimate the incidence of acetabular fractures and to evaluate the risk factors for ensuing mortality and inpatient complications. The NHDS is a publically available survey providing demographic and medical data for inpatients discharged from non-federal, short-stay hospitals in the US.19 The NHDS is the principal database used by the US government for monitoring hospital use and is considered the most comprehensive of all inpatient surgical databases in use today.19 The survey uses International Classification of Diseases, 9th Revision, Clinical Modification (ICD-9-CM) codes20 to classify medical diagnoses and procedures. The NHDS uses a stratified, multistage probability design to collect demographic information (age, gender, race), expected source of payment (insurance status), medical information of up to 7 discharge diagnoses and up to 4 procedures, length of care, hospital size, US region, and inpatient outcomes including discharge destination.21 To ensure unbiased national sampling of inpatient records, the NHDS uses a complex, 3-stage probability design including inflation by reciprocals of the probabilities of sample selection, adjustment for no response, and population weighting ratio adjustments.19 This study did not require approval by the Institutional Review Board because the NHDS is a publically available database with no patient-identifying information.
Continue to: PATIENT SELECTION...
PATIENT SELECTION
All patients admitted to hospitals in the US with a fracture of the acetabulum between 1990 and 2010 were identified using ICD-9-CM codes. Discharges with a diagnosis code (ICD-9-CM) of closed fracture of the acetabulum (808.0) or open fracture of the acetabulum (808.1) were identified using previously described techniques.22 The database was subsequently queried to identify patients treated using open reduction and internal fixation (ORIF) (ICD-9-CM, 79.30/79.39), closed reduction and internal fixation (CRIF) (ICD-9-CM, 79.10/79.19), or external (ICD-9-CM, 78.10/78.19) or internal (ICD-9-CM, 78.50/78.59) fixation without reduction. Demographic variables were then collected, including age, sex, primary diagnosis, associated diagnoses, type of fracture (open vs closed), prevalence of comorbidities, length of stay, and discharge destination. The complication screening package23 was used to determine the incidence of complications. The variable adverse event was created on the basis of the variables postoperative bleeding (998.1), acute postoperative infection (998.5), acute postoperative anemia (285.1), acute renal failure (584), acute myocardial infarction (410), pulmonary embolism (415.1), induced mental disorder (293), pneumonia (480-486), pulmonary insufficiency (518.5), deep venous thrombosis (453.4), intubation (96.xx), and blood transfusion (99.x).
STATISTICAL ANALYSIS
Because of the large sample size, a normal distribution of the data was assumed. Differences between categorical variables were compared using the Pearson chi square test, while the independent-samples t test was used to compare differences between continuous variables. To determine independent predictors of in-hospital outcomes (death, adverse events, requirement for blood transfusion, or treatment with ORIF), all variables present in at least 2% of the population24 were included in a multivariable binary logistic regression model. For in-hospital adverse events, a 1% cutoff was used due to their lower rates of occurrence, as previously described.25The dichotomous variables were death, presence of adverse events, receipt of blood transfusion, and treatment with ORIF. A multivariable regression model allows for the control of potential confounders, isolating the effect of individual variables on inpatient outcomes. Covariates accounted for in the regression model included gender, age, region of the country, and preexisting comorbidities (diabetes mellitus, hypertension, congestive heart failure, coronary artery disease, atrial fibrillation). To assess the association between individual variables and inpatient outcomes, odds ratios and confidence intervals were calculated. A P value of <.001 was used to define statistical significance, correcting for multiple comparisons, as previously described.25 US census data were used to obtain national population estimates for each year of the study from 1990 to 2010.26 Rates were presented as the number of acetabular fractures per 100,000 standard population. All data were analyzed using the software Statistical Package for the Social Sciences [SPSS] version 20.
RESULTS
INCIDENCE AND DEMOGRAPHICS
A cohort representative of 497,389 patients with a diagnosis of acetabular fracture was identified between 1990 and 2010 (Table 1). In 1990, 19,560 cases (7.84 per 100,000 capita) of acetabular fractures were recoded, while in 2010, the number of cases increased to 29,373 or 9.5 per 100,000 capita (P < .001) (Table 2). The mean age of patients with an acetabular fracture was 52.6 years (standard deviation [SD], 23.7) and 60.6% were male (Table 1). The most frequently associated diagnosis was closed fracture of the pelvis (29.8%) followed by fracture of the femur (13.1%) and closed fracture of the ilium (3.8%) (Table 1). Of the total cohort, 23.2% underwent ORIF (Table 1). In 1990, 12.6% of patients with a diagnosis of acetabular fracture underwent ORIF, whereas 20.4% of patients underwent ORIF in 2010 (P < .001) (Table 2). Average length of hospital stay was 8.3 days (SD, 17.9) overall (Table 1). In 1990 the average length of stay was 17.0 days (SD, 14.9), decreasing to 10.3 days (SD, 9.3) in 2010 (P < .001) (Table 2).
Table 1. Patient Characteristics for Patients with Acetabular Fractures in the United States from 1990 to 2007
Parameter | Total 1990-2010 |
Total Number | 497,389 |
Gender (%) |
|
Male | 60.6 |
Female | 39.4 |
Age, years (%) |
|
<20 | 6.7 |
20-40 | 31.5 |
41-60 | 22.3 |
61-85 | 30.4 |
>85 | 23.5 |
Race (%) |
|
White | 66.4 |
Black | 9.3 |
Asian | 1.7 |
Other | 2.4 |
Not stated | 20.2 |
Primary Diagnosis (%) |
|
Closed fracture of acetabulum (808.0) | 98.9 |
Open fracture of acetabulum (808.1) | 1.1 |
Associated diagnoses (%) |
|
Closed fracture of pubis (808.2) | 26.1 |
Open fracture of pubis (808.3) | 0.1 |
Closed fracture of ischium (808.42) | 1.7 |
Open fracture of ischium (808.52) | 0.0 |
Closed fracture of ilium (808.41) | 3.8 |
Open fracture of ilium (808.51) | 0.0 |
Closed fracture other part pelvis (808.49) | 0.7 |
Open fracture other part pelvis (808.59) | 0.0 |
Multiple closed pelvic fractures (808.43) | 0.5 |
Multiple open pelvic fractures (808.53) | 0.0 |
Any pelvic fracture from above | 29.8 |
Fracture of neck of femur (820) | 7.2 |
Fracture of any part of femur (820/821) | 13.1 |
Head trauma (959.01) | 0.7 |
Head/face trauma (959.0/959.01) | 0.7 |
Chest trauma (959.11) | 0.1 |
Chest/trunk trauma (959.1/959.11) | 0.1 |
Procedures (%) |
|
Open reduction internal fixation (79.30/79.39) | 23.2 |
Closed reduction internal fixation (79.10/79.19) | 1.3 |
External fixation (78.10/78.19) | 0.7 |
Internal fixation without reduction (78.50/78.59) | 0.4 |
Comorbidities (%) |
|
No | 72.9 |
Yes | 27.1 |
Adverse Events (%) |
|
No | 74.1 |
Yes | 25.9 |
Discharge Disposition (%) |
|
Routine/home (1) | 45.4 |
Left against medical advice (2) | 0.2 |
Short term fac (3) | 13.1 |
Long term fac (4) | 22.2 |
Alive, not stated (5) | 12 |
Dead (6) | 3.5 |
Not reported (9) | 3.6 |
Mortality (%) | 3.5 |
Age (y), mean (SD) | 52.6 (23.7) |
Days of Care, mean (SD) | 8.3 (17.9) |
Principal Source of Payment (%) |
|
Private insurance | 39 |
Medicare | 30.5 |
Medicaid | 7.7 |
Other government | 1.9 |
Self-pay | 7.9 |
Workmen’s comp | 4 |
Other | 4.7 |
Not stated | 4.4 |
Abbreviation: SD, standard deviation.
Table 2. Patient Characteristics in 1990, 1995, 1999, 2003, and 2007 Among Patients with Acetabular Fractures
Variable | 1990 | 1995 | 1999 | 2003 | 2007 | 2010 |
Total number | 19,560 | 17,506 | 22,767 | 27,133 | 34,027 | 29,373 |
Incidence per 100,000 capita | 7.84 | 6.57 | 8.16 | 9.35 | 11.30 | 9.5 |
Gender (%) |
| |||||
Male | 51.0 | 70.7 | 61.2 | 62.6 | 62.5 | 64.9 |
Female | 49.0 | 29.3 | 38.8 | 37.4 | 37.5 | 35.1 |
Fracture (%) |
| |||||
Open | 2.1 | 1.7 | 3.3 | 1.4 | 0.1 | 1.8 |
Closed | 97.9 | 98.3 | 96.7 | 98.6 | 99.9 | 98.2 |
Underwent ORIF (%) | 12.6 | 20.9 | 20.2 | 22.9 | 27.8 | 20.4 |
Adverse events (%) | 10.9 | 16.2 | 23.7 | 31 | 35.1 | 37.6 |
Transfusion (%) | 0.3 | 2.2 | 7.4 | 6.5 | 10.5 | 9.5 |
Discharge (%) |
| |||||
Routine | 58 | 65.6 | 35.6 | 45.9 | 40.2 | 41.6 |
Non-routine to inpatient facility | 26.8 | 23.1 | 46.4 | 33.8 | 40.8 | 34.6 |
Mortality (%) | 5.9 | 3.6 | 2 | 2.9 | 1.5 | 0.4 |
Mean Age (y) | 52.9 | 48.4 | 52.3 | 56.3 | 57 | 53.2 |
Mean DOC (days) | 17.0 | 13.4 | 8.7 | 10.8 | 8.5 | 10.3 |
Abbreviations: DOC, days of care; ORIF, open reduction internal fixation.
Continue to: MORTALITY...
MORTALITY
In-hospital mortality decreased from 5.9% in 1990 to 0.4% in 2010 (P < .001) (3.5% for the total cohort) (Tables 1 and 2). Multivariable logistic regression analysis demonstrated pulmonary insufficiency (odds ratio [OR], 9.07; 95% confidence interval [CI], 8.52-9.66; P < .01), pneumonia (OR, 3.22; 95% CI, 3.05-3.39; P < .01), and age >85 years (OR, 2.28; 95% CI, 2.16-2.40; P < .01) to be associated with the highest odds of inpatient mortality. CRIF (OR, 1.99; 95% CI, 1.78-2.23; P < .01), external fixator (OR, 1.82; 95% CI, 1.45-2.29; P < .01), and having received a blood transfusion (OR, 1.81; 95% CI, 1.71-1.91; P < .01) were also associated with increased odds of mortality. Treatment with ORIF (OR, 0.19; 95% CI, 0.17-0.20; P < .01) was independently associated with decreased odds of inpatient mortality, as was age <20 years (OR, 0.26; 95% CI, 0.23-0.30; P < .01) (model fit: for omnibus test of model coefficients, X = 25,966 P < .01; Nagelkerke, R2 = 0.20) (Table 3).
Table 3. Logistic Regression for Predictors of Mortality Among Patients with Acetabular Fractures (n = 403,927)
Variable | OR (95% CI) | P |
Pulmonary insufficiency | 9.07 (8.52–9.66) | < 0.01 |
Pneumonia | 3.22 (3.05–3.39) | < 0.01 |
Age >85 years | 2.28 (2.16–2.40) | < 0.01 |
Closed reduction internal fixation | 1.99 (1.78–2.23) | < 0.01 |
External Fixator | 1.82 (1.45–2.29) | < 0.01 |
Blood transfusion | 1.81 (1.71–1.91) | < 0.01 |
Gender (male) | 1.76 (1.70–1.83) | < 0.01 |
Associated femoral neck fracture | 1.23 (1.15–1.30) | < 0.01 |
Age 41-60 years | 1.19 (1.11–1.29) | < 0.01 |
Age 61-85 years | 1.17 (1.11–1.23) | < 0.01 |
Congestive heart failure | 1.14 (1.07–1.22) | < 0.01 |
Associated pelvic fracture | 1.13 (1.10–1.17) | < 0.01 |
Geographic region | 1.11 (1.09–1.12) | < 0.01 |
Source of payment | 1.02 (1.01–1.02) | < 0.01 |
Race | 0.99 (0.98–0.99) | < 0.01 |
DOC | 0.98 (0.98–0.98) | < 0.01 |
Hypertension | 0.67 (0.64–0.71) | < 0.01 |
Atrial fibrillation | 0.52 (0.48–0.57) | < 0.01 |
Diabetes mellitus | 0.35 (0.32–0.38) | < 0.01 |
Age 20-40 years | 0.32 (0.30–0.35) | < 0.01 |
Age <20 years | 0.26 (0.23–0.30) | < 0.01 |
Coronary artery disease | 0.21 (0.18–0.24) | < 0.01 |
Open reduction internal fixation | 0.19 (0.17–0.20) | < 0.01 |
Omnibus X 25,966, P < .01 | ||
Nagelkerke R2= 0.20 |
Abbreviations: CI, confidence interval; DOC, days of care; OR, odds ratio.
COMORBIDITIES AND ADVERSE EVENTS
The prevalence of comorbidities and adverse events is listed in Tables 4 and 5, respectively. Hypertensive disease was the most common comorbidity at 15.3%, followed by diabetes mellitus at 6.9%. Overall, 25.9% of patients experienced an in-hospital adverse event, with the most common being postoperative anemia (7.3%) and blood transfusion (8.1%) (Tables 1 and 5). The percentage of patients experiencing an adverse event increased from 10.9% in 1990 to 37.6% in 2010 (P < .01) (Table 2). Multivariable logistic regression analysis revealed CRIF (OR, 3.08; 95% CI, 2.91-3.26; P < .01), coronary artery disease (OR, 2.02; 95% CI, 1.91-2.15; P < .01), associated femoral neck fracture (OR, 1.53; 95% CI, 1.47-1.60; P < .01), and ORIF (OR, 1.22; 95% CI, 1.20-1.24; P < .01) to be associated with higher odds of inpatient adverse events (model fit: for omnibus test of model coefficients, X = 160,275, P < .01; Nagelkerke, R2 = 0.41) (Table 6).
Table 4. Prevalence of Comorbidities in Patients with Acetabular Fractures Between 1990 and 2007 (n = 403.927)
Parameter (ICD-9) | Percentage of Total |
Hypertensive disease (401–405) | 15.3% |
Diabetes mellitus (250) | 6.9% |
Atrial fibrillation (427.31) | 4.0% |
Congestive heart failure (428) | 3.9% |
Osteoporosis (733.0) | 2.1% |
Coronary artery disease (414.01) | 2.0% |
Obesity (278.00, 278.01) | 2.0% |
Abbreviation: ICD-9, International Classifications of Diseases, 9th Revision.
Table 5. Prevalence of In-Hospital Adverse Events Among Patients with Acetabular Fractures Between 1990 and 2007 (n = 403,927)
Parameter (ICD-9) | Percentage of Total |
Transfusion of blood (99.0) | 8.1% |
Acute postoperative anemia (285.1) | 7.3% |
Intubation (96.x) | 4.9% |
Acute renal failure (584) | 3.4% |
Pneumonia (480-486) | 3.2% |
Pulmonary insufficiency (518.5) | 2.3% |
Pulmonary embolism (415.1) | 1.6% |
Deep venous thrombosis (453.4) | 1.0% |
Acute myocardial infarction (410) | 0.9% |
Postoperative bleeding (998.1) | 0.7% |
Acute postoperative infection (998.5) | 0.5% |
Induced mental disorder (293) | 0.4% |
Abbreviation: ICD-9, International Classifications of Diseases, 9th Revision.
Table 6. Logistic Regression for Predictors of Adverse Events Among Patients Hospitalized for Acetabular Fracture (n = 403,927)
Variable | OR (95% CI) | P |
Closed reduction internal fixation | 3.08 (2.91-3.26) | < 0.01 |
Coronary artery disease | 2.02 (1.91-2.15) | < 0.01 |
Associated femoral neck fracture | 1.53 (1.47-1.60) | < 0.01 |
Open reduction internal fixation | 1.22 (1.20-1.24) | < 0.01 |
Gender (male) | 1.16 (1.14-1.18) | < 0.01 |
Associated fracture of any part of femur | 1.13 (1.10-1.17) | < 0.01 |
Age >85 years | 1.08 (1.05-1.12) | < 0.01 |
Geographic region | 1.07 (1.06-1.07) | < 0.01 |
DOC | 1.04 (1.04-1.04) | < 0.01 |
Race | 1.02 (1.02-1.03) | < 0.01 |
Source of payment | 1.01 (1.01-1.01) | < 0.01 |
Congestive heart failure | 1.01 (0.96-1.06) | 0.78 |
Atrial fibrillation | 0.88 (0.84-0.92) | < 0.01 |
Age 61-85 years | 0.68 (0.66-0.71) | < 0.01 |
Age <20 years | 0.67 (0.64-0.70) | < 0.01 |
Associated pelvis fracture | 0.64 (0.63-0.66) | < 0.01 |
Age 41-60 years | 0.58 (0.56-0.61) | < 0.01 |
Diabetes mellitus | 0.48 (0.46-0.50) | < 0.01 |
Age 20-40 years | 0.45 (0.43-0.47) | < 0.01 |
Hypertension | 0.44 (0.43-0.45) | < 0.01 |
External Fixator | 0.39 (0.35-0.44) | < 0.01 |
Omnibus X 160,275, P < .01 | ||
Nagelkerke R2 = 0.41 |
Abbreviations: CI, confidence interval; DOC, days of care; OR, odds ratio.
BLOOD TRANSFUSION
Overall, 7.3% of patients experienced acute postoperative anemia (Table 5). Between 1990 and 2010, the percentage of patients receiving blood transfusions increased from 0.3% to 9.5%, respectively (P < .01) (Table 2). In multivariable logistic regression analysis, patients treated with ORIF (OR, 8.13; 95% CI, 7.91-8.36; P < .01), those with congestive heart failure (OR, 4.23; 95% CI, 4.06-4.41; P < .01), those with an associated femur fracture (OR, 3.13; 95% CI, 2.99-3.27; P < .01), those with atrial fibrillation (OR, 1.96; 95% CI, 1.88-2.05; P < .01), and those treated with CRIF (OR, 1.42; 95% CI, 1.29-1.56; P < .01) were associated with significantly higher odds of blood transfusion (model fit: omnibus test of model coefficients, X = 42,653, P < .01; Nagelkerke, R2 = 0.19) (Table 7).
Table 7. Logistic Regression for Predictors of the Requirement for Blood Transfusion Among Patients with Acetabular Fractures (n = 403,927)
Variable | OR (95% CI) | P |
Open reduction internal fixation | 8.13 (7.91-8.36) | < 0.01 |
Congestive heart failure | 4.23 (4.06-4.41) | < 0.01 |
Associated fracture of any part of femur | 3.13 (2.99-3.27) | < 0.01 |
Atrial fibrillation | 1.96 (1.88-2.05) | < 0.01 |
Closed reduction internal fixation | 1.42 (1.29-1.56) | < 0.01 |
Geographic region | 1.38 (1.36-1.39) | < 0.01 |
Hypertension | 1.38 (1.34-1.42) | < 0.01 |
Associated pelvic fracture | 1.28 (1.25-1.31) | < 0.01 |
Age 61-85 years | 1.06 (1.02-1.11) | 0.01 |
Source of payment | 0.99 (0.98-0.99) | < 0.01 |
Race | 0.98 (0.97-0.98) | < 0.01 |
DOC | 0.96 (0.96-0.96) | < 0.01 |
Age >85 years | 0.74 (0.72-0.77) | < 0.01 |
External fixator | 0.69 (0.59-0.80) | < 0.01 |
Coronary artery disease | 0.62 (0.57-0.68) | < 0.01 |
Age 41-60 years | 0.57 (0.54-0.60) | < 0.01 |
Gender (male) | 0.54 (0.52-0.55) | < 0.01 |
Diabetes mellitus | 0.38 (0.36-0.41) | < 0.01 |
Age 20-40 years | 0.32 (0.30-0.34) | < 0.01 |
Associated femoral neck fracture | 0.29 (0.27-0.31) | < 0.01 |
Age <20 years | 0.24 (0.22-0.26) | < 0.01 |
Omnibus X = 42,653, P < .01 | ||
Nagelkerke R2 = 0.19 |
Abbreviations: CI, confidence interval; DOC, days of care; OR, odds ratio.
TREATMENT WITH ORIF
Over the 20-year study period, 23.2% of patients with acetabular fractures were treated with ORIF (Table 1). In 1990, 12.6% of patients underwent ORIF, while in 2010 this percentage increased to 20.4% (P < .001) (Table 2). Multivariable logistic regression analysis demonstrated that age between 41 and 60 years (OR, 1.88; 95% CI, 1.78-1.98; P < .01) was associated with the highest odds of undergoing ORIF. Age 20 to 40 years (OR, 1.86; 95% CI, 1.76-1.97; P < .01), age <20 years (OR, 1.82; 95% CI, 1.72-1.93; P < .01), and male gender (OR, 1.65; 95% CI, 1.63-1.68; P < .01) were also associated with being treated by ORIF. In contrast, coronary artery disease (OR, 0.27; 95% CI, 0.25-0.30; P < .01), age >85 years (OR, 0.46; 95% CI, 0.44-0.47; P < .01), and congestive heart failure (OR, 0.48; 95% CI, 0.46-0.51; P < .01) were associated with the lowest odds of undergoing ORIF (model fit: omnibus test of model coefficients, X = 71,118, P < .01; Nagelkerke, R2 = 0.20) (Table 8).
Table 8. Logistic Regression for Predictors of the Requirement for Discharge to Another Inpatient Facility Among Patients with Acetabular Fractures (n = 403,927)
Variable | OR (95% CI) | P |
Age 41-60 years | 1.88 (1.78-1.98) | < 0.01 |
Age 20-40 years | 1.86 (1.76-1.97) | < 0.01 |
Age <20 years | 1.82 (1.72-1.93) | < 0.01 |
Gender (male) | 1.65 (1.63-1.68) | < 0.01 |
Larger hospital bed size | 1.46 (1.45-1.47) | < 0.01 |
Hypertension | 1.35 (1.32-1.38) | < 0.01 |
Diabetes mellitus | 1.09 (1.05-1.13) | < 0.01 |
DOC | 1.02 (1.02-1.02) | < 0.01 |
Source of payment | 1.01 (1.01-1.02) | < 0.01 |
Race | 1.00 (0.99-1.00) | 0.17 |
Age 61-85 years | 0.94 (0.90-0.99) | 0.02 |
Region | 0.92 (0.91-0.93) | < 0.01 |
Atrial fibrillation | 0.83 (0.79-0.87) | < 0.01 |
Congestive heart failure | 0.48 (0.46-0.51) | < 0.01 |
Age >85 years | 0.46 (0.44-0.47) | < 0.01 |
Coronary artery disease | 0.27 (0.25-0.30) | < 0.01 |
Omnibus X 71,118, P < .01 | ||
Nagelkerke R2 = 0.20 |
Abbreviations: CI, confidence interval; DOC, days of care; OR, odds ratio.
Continue to: DISCUSSION...
DISCUSSION
This study evaluates the incidence of acetabular fractures in the US between 1990 and 2010, and identifies prognostic factors associated with complications and death. The study demonstrates an increase in the population-adjusted incidence of acetabular fractures between 1990 and 2010 (7.84 cases per 100,000 capita to 9.5 cases per 100,000 capita), in contrast to the decreasing trend reported by Mauffrey and colleagues.11 Some studies suggest that up to 80% of acetabular fractures are associated with motor vehicle collisions and motorcycle accidents.9,27 While the rate of motor vehicle accidents has remained stable over the study period, motorcycle ownership and deaths more than doubled between 2001 and 2008,28 primarily among individuals over 40 years of age. In this study, the mean age of patients with acetabular fractures ranged from 48 to 57 years. The dramatic increase in motorcycle ownership and deaths in these age groups may partially explain the rising incidence of acetabular fractures. The other possibility is that changes in automobile design and safety equipment may have altered the injury patterns observed in patients surviving motor vehicle crashes. Compared to the United Kingdom, in which studies report a fixed incidence of 3 per 100,000 capita1 between 1988 and 2003, the incidence of acetabular fractures in the US is greater. In contrast, the incidence of acetabular fractures reported in this study is less than the 20 per 100,000 reported in Sweden between 1976 and 1985,29 or the 37 per 100,000 reported in Rochester, Minnesota between 1968 and 1977,30 which may be due to increased seatbelt usage.31
In addition to the national incidence, this study demonstrated that the proportion of patients with acetabular fractures treated with ORIF increased from 12.6% to 20.4% between 1990 and 2010. This is substantially lower than the 77% reported by Ochs and colleagues32 in a German population. Concurrent with the increase in ORIF, there was a decrease in in-hospital mortality from 5.9% in 1990 to 0.4% in 2010. The initial mortality rates in this study are comparable to much earlier reports and some small studies,9,32-37 but the rates reported in the later years of this study show a substantial decrease that is likely a more accurate estimation of the current incidence. The improved survival rates may be due to advances in the operative treatment of acetabular fractures, in which mechanical stabilization allows for early patient mobilization and facilitation of optimal nursing care.38 With ORIF becoming the standard of care for displaced acetabular fractures,9 numerous reports have demonstrated an association between early definitive fixation and improved survival.17,39,40 This is similar to our study, which found ORIF to be associated with the lowest odds of mortality in multivariate logistic regression analysis. It is possible that advances in patient care by intensivists over this period have also contributed to the decrease in mortality, but the correlation with operative treatment in this study is very strong and agrees well with prior studies.16 Moreover, multiple studies have demonstrated decreased in-hospital mortality among patients undergoing various orthopedic surgical procedures during this period.41-43 The correlation with operative treatment in this study agrees well with prior studies.16
In contrast, higher odds of mortality were seen in patients over the age of 85 years with pulmonary insufficiency, congestive heart failure, pneumonia, or an associated femur or pelvic fracture. This is similar to prior reports in which patients with combined acetabulum and pelvic ring injuries fared worse than those with isolated injures,44,45 as did patients with associated non-musculoskeletal injuries.46 The finding that age over 85 years was associated with higher odds of mortality likely reflects the increased number of comorbidities and decreased physiologic reserve seen in this patient population. Finally, male gender was associated with higher odds of in-hospital mortality. There are 2 possible explanations for this: Either there is gender dimorphism in sex hormones and cytokine activity in response to hemorrhage and sepsis,38,47 or there is a greater tendency for males to be involved in higher energy accidents with more severe concomitant injuries.
The results of multivariable regression analysis demonstrated that patients were more likely to require blood transfusion if they were managed surgically or had atrial fibrillation, congestive heart failure, or associated femur fracture. Not surprisingly, concurrent pelvic fracture was also associated with higher odds of blood transfusion, as pelvic hemorrhage is reported to be the cause of death in up to half of patients who die following a pelvic fracture.46
Between 1990 and 2010, in-hospital days of care decreased from 17.0 days to 10.3 days. While a decreased length of stay has been demonstrated in other orthopedic conditions over the study period,41 it is possible the decrease in length of stay demonstrated in this study is due to improved surgical technique and the implementation of early surgical intervention.39,48-50 Plaisier and colleagues17 demonstrated superior functional outcomes, quicker return to baseline function, and decreased length of stay in patients treated with early ORIF of their acetabular fractures. Other studies have shown that the benefits of early surgery include improved reduction quality and ease of reduction,51 as well as control of bleeding, pain relief, and mobilization of the patient.39 Another possible explanation for the decreased length of stay is the increased rate of discharge to other inpatient facilities, such as rehabilitation facilities, which was demonstrated in this study.
Continue to: Interestingly, male gender and younger age...
Interestingly, male gender and younger age were associated with operative management of the acetabular fracture. In contrast, there was a decreased likelihood of operative treatment among elderly patients and those patients with cardiac comorbidities. It is possible that the relationship we found between the likelihood of ORIF and age relates to the bimodal distribution of fractures, with higher energy and potentially more displaced fractures occurring in younger patients3-5 and lower energy fractures in the elderly.
In contrast to decreasing in-hospital days of care, there was a rise in the number of adverse events between 1990 (10.9%) and 2010 (37.6%). This can be partially attributed to the increased rates of blood transfusion, which was received by 9.5% of patients with acetabular fractures in the final study year. Additionally, surgical intervention was associated with increased adverse events in this study, and surgical intervention increased over the study period. Other factors that may have contributed to an increase in adverse events include an aging population,52 as advanced age was independently associated with higher odds of adverse events in this study.
Despite the strengths of using large, national databases for epidemiological research,53 this study has several limitations. Like all large databases, the NHDS is subject to error in coding and data entry.54 Additionally, the database only allows for 7 diagnostic codes and 4 procedure codes per entry. As a result, the prevalence of comorbid conditions and adverse events may be underreported.25 Moreover, the severity of a comorbid disease cannot be appreciated when dichotomously classified.55 Another limitation is that the database only provides inpatient data, so complications that arise after discharge, as well as follow-up data, are unknown. Furthermore, the results of this study are limited to practice patterns in the US from 1990 to 2010. This database does not provide injury mechanisms, so we cannot distinguish between high-energy and low-energy injuries. Lastly, analysis of the different types of acetabular fractures was not performed since classification of acetabular fractures cannot be assessed with ICD-9 codes.
CONCLUSION
This study is the largest epidemiologic analysis of acetabular fractures in the US and also provides predictors of in-hospital mortality. The incidence of acetabular fractures in the US is increasing, while mortality is decreasing. Identifying risk factors associated with poor outcomes has the potential to change treatment strategies, resource allocation, in-hospital monitoring, and discharge planning for this patient population.
This paper will be judged for the Resident Writer’s Award.
1. Laird A, Keating JF. Acetabular fractures: a 16-year prospective epidemiological study. J Bone Joint Surg Br. 2005;87(7):969-973. doi:10.1302/0301-620X.87B7.16017.
2. Geoghegan JM, Longdon EJ, Hassan K, Calthorpe D. Acetabular fractures in the UK. What are the numbers? Injury. 2007;38(3):329-333. doi:10.1016/j.injury.2006.09.015.
3. Tavakoli Darestani R, Kazemian G, Emami Moghaddam M, Manafi Rasi A, Alipour Y, Bagherian Lemraski MM. An unusual combination of acetabular and pelvic fracture: is this a new subtype of acetabular fracture? Trauma Mon. 2013;18(1):37-40. doi:10.5812/traumamon.9613.
4. McDonnell M, Schachter AK, Phillips DP, Liporace FA. Acetabular fracture through the triradiate cartilage after low-energy trauma. J Orthop Trauma. 2007;21(7):495-498. doi:10.1097/BOT.0b013e31812f67ff.
5. Giannoudis PV, Grotz MR, Tzioupis C, et al. Prevalence of pelvic fractures, associated injuries, and mortality: the United Kingdom perspective. J Trauma. 2007;63(4):875-883. doi:10.1097/01.ta.0000242259.67486.15.
6. Gänsslen A, Pohlemann T, Paul C, Lobenhoffer P, Tscherne H. Epidemiology of pelvic ring injuries. Injury. 1996;27 Suppl 1:S-A13-A20. doi:10.1016/S0020-1383(96)90106-0.
7. Matta JM. Fractures of the acetabulum: accuracy of reduction and clinical results in patients managed operatively within three weeks after the injury. J Bone Joint Surg Am. 1996;78(11):1632-1645. doi:10.2106/00004623-199611000-00002.
8. Wright R, Barrett K, Christie MJ, Johnson KD. Acetabular fractures: long-term follow-up of open reduction and internal fixation. J Orthop Trauma. 1994;8(5):397-403. doi:10.1097/00005131-199410000-00005.
9. Giannoudis PV, Grotz MR, Papakostidis C, Dinopoulos H. Operative treatment of displaced fractures of the acetabulum. A meta-analysis. J Bone Joint Surg Br. 2005;87(1):2-9.
10. Davarinos N, Ellanti P, Morris S, Mc Elwain JP. Epidemiology of pelvic and acetabular trauma in a Dublin tertiary hospital: a 10-year experience. Ir J Med Sci. 2012;181(2):243-246. doi:10.1007/s11845-011-0791-4.
11. Mauffrey C, Hao J, Cuellar DO 3rd, et al. The epidemiology and injury patterns of acetabular fractures: are the USA and China comparable? Clin Orthop Relat Res. 2014;472(11):3332-3337. doi:10.1007/s11999-014-3462-8.
12. Dente CJ, Feliciano DV, Rozycki GS, et al. The outcome of open pelvic fractures in the modern era. Am J Surg. 2005;190(6):830-835. doi:10.1016/j.amjsurg.2005.05.050.
13. Grotz MR, Allami MK, Harwood P, Pape HC, Krettek C, Giannoudis PV. Open pelvic fractures: epidemiology, current concepts of management and outcome. Injury. 2005;36(1):1-13. doi:10.1016/j.injury.2004.05.029.
14. Gabbe BJ, de Steiger R, Esser M, Bucknill A, Russ MK, Cameron PA. Predictors of mortality following severe pelvic ring fracture: results of a population-based study. Injury. 2011;42(10):985-991. doi:10.1016/j.injury.2011.06.003.
15. Arroyo W, Nelson KJ, Belmont PJ Jr, Bader JO, Schoenfeld AJ. Pelvic trauma: what are the predictors of mortality and cardiac, venous thrombo-embolic and infectious complications following injury? Injury. 2013;44(12):1745-1749. doi:10.1016/j.injury.2013.08.007.
16. Flint L, Cryer HG. Pelvic fracture: the last 50 years. J Trauma. 2010;69(3):483-488. doi:10.1097/TA.0b013e3181ef9ce1.
17. Plaisier BR, Meldon SW, Super DM, Malangoni MA. Improved outcome after early fixation of acetabular fractures. Injury. 2000;31(2):81-84. doi:10.1016/S0020-1383(99)00233-8.
18. Centers for Disease Control and Prevention: National Hospital. Discharge survey. http://www.cdc.gov/nchs/nhds.htm. Accessed August 22, 2013.
19. Dennison C, Pokras R. Design and operation of the National Hospital Discharge Survey: 1988 redesign. Vital Health Stat. 2000;(39):1-42.
20. Centers for Disease Control and Prevention, National Center for Health Statistics. International Classification of Diseases, Ninth Revision, Clinical Modification (ICD-9-CM). http://www.cdc.gov/nchs/icd/icd9cm.htm. Accessed June 18, 2013.
21. Memtsoudis SG, González Della Valle A, Besculides MC, Gaber L, Sculco TP. In-hospital complications and mortality of unilateral, bilateral, and revision TKA: based on an estimate of 4,159,661 discharges. Clin Orthop Relat Res. 2008;466(11):2617-2627. doi:10.1007/s11999-008-0402-5.
22. Stundner O, Kirksey M, Chiu YL, et al. Demographics and perioperative outcome in patients with depression and anxiety undergoing total joint arthroplasty: a population-based study. Psychosomatics. 2013;54(2):149-157. doi:10.1016/j.psym.2012.08.009.
23. Iezzoni LI, Daley J, Heeren T, et al. Using administrative data to screen hospitals for high complication rates. Inquiry. 1994;31(1):40-55.
24. Lemeshow S, Teres D, Klar J, Avrunin JS, Gehlbach SH, Rapoport J. Mortality Probability Models (MPM II) based on an international cohort of intensive care unit patients. JAMA. 1993;270(20):2478-2486.
25. Bot AG, Menendez ME, Neuhaus V, Ring D. The influence of psychiatric comorbidity on perioperative outcomes after shoulder arthroplasty. J Shoulder Elbow Surg. 2014;23(4):519-527. doi:10.1016/j.jse.2013.12.006.
26. United States Census Bureau. Population. https://www.census.gov/topics/population.html. Accessed December 4, 2012.
27. Porter SE, Schroeder AC, Dzugan SS, Graves ML, Zhang L, Russell GV. Acetabular fracture patterns and their associated injuries. J Orthop Trauma. 2008;22(3):165-170. doi:10.1097/BOT.0b013e318165918b.
28. Centers for Disease Control and Prevention. Motorcycle Crash-Related Data. https://www.cdc.gov/motorvehiclesafety/mc/index.html Accessed September 23, 2018
29. Ragnarsson B, Jacobsson B. Epidemiology of pelvic fractures in a Swedish county. Acta Orthop Scand. 1992;63(3):297-300. doi:10.3109/17453679209154786.
30. Melton LJ 3rd, Sampson JM, Morrey BF, Ilstrup DM. Epidemiologic features of pelvic fractures. Clin Orthop Relat Res. 1981;155(155):43-47. doi:10.1097/00003086-198103000-00008.
31. al-Qahtani S, O'Connor G. Acetabular fractures before and after the introduction of seatbelt legislation. Can J Surg. 1996;39(4):317-320.
32. Ochs BG, Marintschev I, Hoyer H, et al. Changes in the treatment of acetabular fractures over 15 years: analysis of 1266 cases treated by the German Pelvic Multicentre Study Group (DAO/DGU). Injury. 2010;41(8):839-851. doi:10.1016/j.injury.2010.04.010.
33. Letournel E. Acetabulum fractures: classification and management. Clin Orthop Relat Res. 1980;151(151):81-106. doi:10.1055/s-2007-980136.
34. de Ridder VA, de Lange S, Kingma L, Hogervorst M. Results of 75 consecutive patients with an acetabular fracture. Clin Orthop Relat Res. 1994;305(305):53-57. doi:10.1097/00003086-199408000-00008.
35. Aho AJ, Isberg UK, Katevuo VK. Acetabular posterior wall fracture. 38 Cases followed for 5 years. Acta Orthop Scand. 1986;57(2):101-105. doi:10.3109/17453678609000878.
36. Stöckle U, Hoffmann R, Südkamp NP, Reindl R, Haas NP. Treatment of complex acetabular fractures through a modified extended iliofemoral approach. J Orthop Trauma. 2002;16(4):220-230. doi:10.1097/00005131-200204000-00002.
37. Tibbs BM, Kopar P, Dente CJ. Acetabular and isolated pelvic ring fractures: a comparison of initial assessment and outcome. Am Surg. 2008;74(6):538-541; discussion 541.
38. Holstein JH, Culemann U, Pohlemann T, Working Group Mortality in Pelvic Fracture Patients. What are predictors of mortality in patients with pelvic fractures? Clin Orthop Relat Res. 2012;470(8):2090-2097. doi:10.1007/s11999-012-2276-9.
39. Vallier HA, Cureton BA, Ekstein C, Oldenburg FP, Wilber JH. Early definitive stabilization of unstable pelvis and acetabulum fractures reduces morbidity. J Trauma. 2010;69(3):677-684. doi:10.1097/TA.0b013e3181e50914.
40. Enninghorst N, Toth L, King KL, McDougall D, Mackenzie S, Balogh ZJ. Acute definitive internal fixation of pelvic ring fractures in polytrauma patients: a feasible option. J Trauma. 2010;68(4):935-941. doi:10.1097/TA.0b013e3181d27b48.
41. Buller LT, Best MJ, Quinnan SM. A nationwide analysis of pelvic ring fractures: incidence and trends in treatment, length of stay, and mortality. Geriatr Orthop Surg Rehabil. 2016;7(1):9-17. doi:10.1177/2151458515616250.
42. Yoshihara H, Yoneoka D. Trends in the incidence and in-hospital outcomes of elective major orthopaedic surgery in patients eighty years of age and older in the United States from 2000 to 2009. J Bone Joint Surg Am. 2014;96(14):1185-1191. doi:10.2106/JBJS.M.01126.
43. Lo JC, Srinivasan S, Chandra M, et al. Trends in mortality following hip fracture in older women. Am J Manag Care. 2015;21(3):e206-e214.
44. Halvorson JJ, Lamothe J, Martin CR, et al. Combined acetabulum and pelvic ring injuries. J Am Acad Orthop Surg. 2014;22(5):304-314. doi:10.5435/JAAOS-22-05-304.
45. Osgood GM, Manson TT, O'Toole RV, Turen CH. Combined pelvic ring disruption and acetabular fracture: associated injury patterns in 40 patients. J Orthop Trauma. 2013;27(5):243-247. doi:10.1097/BOT.0b013e31826c2751.
46. Poole GV, Ward EF, Muakkassa FF. Pelvic fracture from major blunt trauma. Outcome is determined by associated injuries. Ann Surg. 1991;213(6):532-538; discussion 538.
47. Knöferl MW, Angele MK, Diodato MD, et al. Female sex hormones regulate macrophage function after trauma-hemorrhage and prevent increased death rate from subsequent sepsis. Ann Surg. 2002;235(1):105-112. doi:10.1097/00000658-200201000-00014.
48. Goldstein A, Phillips T, Sclafani SJ, et al. Early open reduction and internal fixation of the disrupted pelvic ring. J Trauma. 1986;26(4):325-333. doi:10.1097/00005373-198604000-00004.
49. Latenser BA, Gentilello LM, Tarver AA, Thalgott JS, Batdorf JW. Improved outcome with early fixation of skeletally unstable pelvic fractures. J Trauma. 1991;31(1):28-31. doi:10.1097/00005373-199101000-00006.
50. Riemer BL, Butterfield SL, Diamond DL, et al. Acute mortality associated with injuries to the pelvic ring: the role of early patient mobilization and external fixation. J Trauma. 1993;35(5):671-675; discussion 676.
51. Madhu R, Kotnis R, Al-Mousawi A, et al. Outcome of surgery for reconstruction of fractures of the acetabulum. The time dependent effect of delay. J Bone Joint Surg Br. 2006;88(9):1197-1203. doi:10.1302/0301-620X.88B9.17588.
52. Centers for Disease Control and Prevention. The State of Aging & Health in America 2013. https://www.cdc.gov/aging/pdf/state-aging-health-in-america-2013.pdf. Accessed December 5, 2013.
53. Bohl DD, Basques BA, Golinvaux NS, Baumgaertner MR, Grauer JN. Nationwide Inpatient Sample and National Surgical Quality Improvement Program give different results in hip fracture studies. Clin Orthop Relat Res. 2014;472(6):1672-1680. doi:10.1007/s11999-014-3559-0.
54. Memtsoudis SG. Limitations associated with the analysis of data from administrative databases. Anesthesiology. 2009;111(2):449. [author reply:450-451]. doi:10.1097/ALN.0b013e3181adf739.
55. Neuhaus V, Swellengrebel CH, Bossen JK, Ring D. What are the factors influencing outcome among patients admitted to a hospital with a proximal humeral fracture? Clin Orthop Relat Res. 2013;471(5):1698-1706. doi:10.1007/s11999-013-2876-z.
1. Laird A, Keating JF. Acetabular fractures: a 16-year prospective epidemiological study. J Bone Joint Surg Br. 2005;87(7):969-973. doi:10.1302/0301-620X.87B7.16017.
2. Geoghegan JM, Longdon EJ, Hassan K, Calthorpe D. Acetabular fractures in the UK. What are the numbers? Injury. 2007;38(3):329-333. doi:10.1016/j.injury.2006.09.015.
3. Tavakoli Darestani R, Kazemian G, Emami Moghaddam M, Manafi Rasi A, Alipour Y, Bagherian Lemraski MM. An unusual combination of acetabular and pelvic fracture: is this a new subtype of acetabular fracture? Trauma Mon. 2013;18(1):37-40. doi:10.5812/traumamon.9613.
4. McDonnell M, Schachter AK, Phillips DP, Liporace FA. Acetabular fracture through the triradiate cartilage after low-energy trauma. J Orthop Trauma. 2007;21(7):495-498. doi:10.1097/BOT.0b013e31812f67ff.
5. Giannoudis PV, Grotz MR, Tzioupis C, et al. Prevalence of pelvic fractures, associated injuries, and mortality: the United Kingdom perspective. J Trauma. 2007;63(4):875-883. doi:10.1097/01.ta.0000242259.67486.15.
6. Gänsslen A, Pohlemann T, Paul C, Lobenhoffer P, Tscherne H. Epidemiology of pelvic ring injuries. Injury. 1996;27 Suppl 1:S-A13-A20. doi:10.1016/S0020-1383(96)90106-0.
7. Matta JM. Fractures of the acetabulum: accuracy of reduction and clinical results in patients managed operatively within three weeks after the injury. J Bone Joint Surg Am. 1996;78(11):1632-1645. doi:10.2106/00004623-199611000-00002.
8. Wright R, Barrett K, Christie MJ, Johnson KD. Acetabular fractures: long-term follow-up of open reduction and internal fixation. J Orthop Trauma. 1994;8(5):397-403. doi:10.1097/00005131-199410000-00005.
9. Giannoudis PV, Grotz MR, Papakostidis C, Dinopoulos H. Operative treatment of displaced fractures of the acetabulum. A meta-analysis. J Bone Joint Surg Br. 2005;87(1):2-9.
10. Davarinos N, Ellanti P, Morris S, Mc Elwain JP. Epidemiology of pelvic and acetabular trauma in a Dublin tertiary hospital: a 10-year experience. Ir J Med Sci. 2012;181(2):243-246. doi:10.1007/s11845-011-0791-4.
11. Mauffrey C, Hao J, Cuellar DO 3rd, et al. The epidemiology and injury patterns of acetabular fractures: are the USA and China comparable? Clin Orthop Relat Res. 2014;472(11):3332-3337. doi:10.1007/s11999-014-3462-8.
12. Dente CJ, Feliciano DV, Rozycki GS, et al. The outcome of open pelvic fractures in the modern era. Am J Surg. 2005;190(6):830-835. doi:10.1016/j.amjsurg.2005.05.050.
13. Grotz MR, Allami MK, Harwood P, Pape HC, Krettek C, Giannoudis PV. Open pelvic fractures: epidemiology, current concepts of management and outcome. Injury. 2005;36(1):1-13. doi:10.1016/j.injury.2004.05.029.
14. Gabbe BJ, de Steiger R, Esser M, Bucknill A, Russ MK, Cameron PA. Predictors of mortality following severe pelvic ring fracture: results of a population-based study. Injury. 2011;42(10):985-991. doi:10.1016/j.injury.2011.06.003.
15. Arroyo W, Nelson KJ, Belmont PJ Jr, Bader JO, Schoenfeld AJ. Pelvic trauma: what are the predictors of mortality and cardiac, venous thrombo-embolic and infectious complications following injury? Injury. 2013;44(12):1745-1749. doi:10.1016/j.injury.2013.08.007.
16. Flint L, Cryer HG. Pelvic fracture: the last 50 years. J Trauma. 2010;69(3):483-488. doi:10.1097/TA.0b013e3181ef9ce1.
17. Plaisier BR, Meldon SW, Super DM, Malangoni MA. Improved outcome after early fixation of acetabular fractures. Injury. 2000;31(2):81-84. doi:10.1016/S0020-1383(99)00233-8.
18. Centers for Disease Control and Prevention: National Hospital. Discharge survey. http://www.cdc.gov/nchs/nhds.htm. Accessed August 22, 2013.
19. Dennison C, Pokras R. Design and operation of the National Hospital Discharge Survey: 1988 redesign. Vital Health Stat. 2000;(39):1-42.
20. Centers for Disease Control and Prevention, National Center for Health Statistics. International Classification of Diseases, Ninth Revision, Clinical Modification (ICD-9-CM). http://www.cdc.gov/nchs/icd/icd9cm.htm. Accessed June 18, 2013.
21. Memtsoudis SG, González Della Valle A, Besculides MC, Gaber L, Sculco TP. In-hospital complications and mortality of unilateral, bilateral, and revision TKA: based on an estimate of 4,159,661 discharges. Clin Orthop Relat Res. 2008;466(11):2617-2627. doi:10.1007/s11999-008-0402-5.
22. Stundner O, Kirksey M, Chiu YL, et al. Demographics and perioperative outcome in patients with depression and anxiety undergoing total joint arthroplasty: a population-based study. Psychosomatics. 2013;54(2):149-157. doi:10.1016/j.psym.2012.08.009.
23. Iezzoni LI, Daley J, Heeren T, et al. Using administrative data to screen hospitals for high complication rates. Inquiry. 1994;31(1):40-55.
24. Lemeshow S, Teres D, Klar J, Avrunin JS, Gehlbach SH, Rapoport J. Mortality Probability Models (MPM II) based on an international cohort of intensive care unit patients. JAMA. 1993;270(20):2478-2486.
25. Bot AG, Menendez ME, Neuhaus V, Ring D. The influence of psychiatric comorbidity on perioperative outcomes after shoulder arthroplasty. J Shoulder Elbow Surg. 2014;23(4):519-527. doi:10.1016/j.jse.2013.12.006.
26. United States Census Bureau. Population. https://www.census.gov/topics/population.html. Accessed December 4, 2012.
27. Porter SE, Schroeder AC, Dzugan SS, Graves ML, Zhang L, Russell GV. Acetabular fracture patterns and their associated injuries. J Orthop Trauma. 2008;22(3):165-170. doi:10.1097/BOT.0b013e318165918b.
28. Centers for Disease Control and Prevention. Motorcycle Crash-Related Data. https://www.cdc.gov/motorvehiclesafety/mc/index.html Accessed September 23, 2018
29. Ragnarsson B, Jacobsson B. Epidemiology of pelvic fractures in a Swedish county. Acta Orthop Scand. 1992;63(3):297-300. doi:10.3109/17453679209154786.
30. Melton LJ 3rd, Sampson JM, Morrey BF, Ilstrup DM. Epidemiologic features of pelvic fractures. Clin Orthop Relat Res. 1981;155(155):43-47. doi:10.1097/00003086-198103000-00008.
31. al-Qahtani S, O'Connor G. Acetabular fractures before and after the introduction of seatbelt legislation. Can J Surg. 1996;39(4):317-320.
32. Ochs BG, Marintschev I, Hoyer H, et al. Changes in the treatment of acetabular fractures over 15 years: analysis of 1266 cases treated by the German Pelvic Multicentre Study Group (DAO/DGU). Injury. 2010;41(8):839-851. doi:10.1016/j.injury.2010.04.010.
33. Letournel E. Acetabulum fractures: classification and management. Clin Orthop Relat Res. 1980;151(151):81-106. doi:10.1055/s-2007-980136.
34. de Ridder VA, de Lange S, Kingma L, Hogervorst M. Results of 75 consecutive patients with an acetabular fracture. Clin Orthop Relat Res. 1994;305(305):53-57. doi:10.1097/00003086-199408000-00008.
35. Aho AJ, Isberg UK, Katevuo VK. Acetabular posterior wall fracture. 38 Cases followed for 5 years. Acta Orthop Scand. 1986;57(2):101-105. doi:10.3109/17453678609000878.
36. Stöckle U, Hoffmann R, Südkamp NP, Reindl R, Haas NP. Treatment of complex acetabular fractures through a modified extended iliofemoral approach. J Orthop Trauma. 2002;16(4):220-230. doi:10.1097/00005131-200204000-00002.
37. Tibbs BM, Kopar P, Dente CJ. Acetabular and isolated pelvic ring fractures: a comparison of initial assessment and outcome. Am Surg. 2008;74(6):538-541; discussion 541.
38. Holstein JH, Culemann U, Pohlemann T, Working Group Mortality in Pelvic Fracture Patients. What are predictors of mortality in patients with pelvic fractures? Clin Orthop Relat Res. 2012;470(8):2090-2097. doi:10.1007/s11999-012-2276-9.
39. Vallier HA, Cureton BA, Ekstein C, Oldenburg FP, Wilber JH. Early definitive stabilization of unstable pelvis and acetabulum fractures reduces morbidity. J Trauma. 2010;69(3):677-684. doi:10.1097/TA.0b013e3181e50914.
40. Enninghorst N, Toth L, King KL, McDougall D, Mackenzie S, Balogh ZJ. Acute definitive internal fixation of pelvic ring fractures in polytrauma patients: a feasible option. J Trauma. 2010;68(4):935-941. doi:10.1097/TA.0b013e3181d27b48.
41. Buller LT, Best MJ, Quinnan SM. A nationwide analysis of pelvic ring fractures: incidence and trends in treatment, length of stay, and mortality. Geriatr Orthop Surg Rehabil. 2016;7(1):9-17. doi:10.1177/2151458515616250.
42. Yoshihara H, Yoneoka D. Trends in the incidence and in-hospital outcomes of elective major orthopaedic surgery in patients eighty years of age and older in the United States from 2000 to 2009. J Bone Joint Surg Am. 2014;96(14):1185-1191. doi:10.2106/JBJS.M.01126.
43. Lo JC, Srinivasan S, Chandra M, et al. Trends in mortality following hip fracture in older women. Am J Manag Care. 2015;21(3):e206-e214.
44. Halvorson JJ, Lamothe J, Martin CR, et al. Combined acetabulum and pelvic ring injuries. J Am Acad Orthop Surg. 2014;22(5):304-314. doi:10.5435/JAAOS-22-05-304.
45. Osgood GM, Manson TT, O'Toole RV, Turen CH. Combined pelvic ring disruption and acetabular fracture: associated injury patterns in 40 patients. J Orthop Trauma. 2013;27(5):243-247. doi:10.1097/BOT.0b013e31826c2751.
46. Poole GV, Ward EF, Muakkassa FF. Pelvic fracture from major blunt trauma. Outcome is determined by associated injuries. Ann Surg. 1991;213(6):532-538; discussion 538.
47. Knöferl MW, Angele MK, Diodato MD, et al. Female sex hormones regulate macrophage function after trauma-hemorrhage and prevent increased death rate from subsequent sepsis. Ann Surg. 2002;235(1):105-112. doi:10.1097/00000658-200201000-00014.
48. Goldstein A, Phillips T, Sclafani SJ, et al. Early open reduction and internal fixation of the disrupted pelvic ring. J Trauma. 1986;26(4):325-333. doi:10.1097/00005373-198604000-00004.
49. Latenser BA, Gentilello LM, Tarver AA, Thalgott JS, Batdorf JW. Improved outcome with early fixation of skeletally unstable pelvic fractures. J Trauma. 1991;31(1):28-31. doi:10.1097/00005373-199101000-00006.
50. Riemer BL, Butterfield SL, Diamond DL, et al. Acute mortality associated with injuries to the pelvic ring: the role of early patient mobilization and external fixation. J Trauma. 1993;35(5):671-675; discussion 676.
51. Madhu R, Kotnis R, Al-Mousawi A, et al. Outcome of surgery for reconstruction of fractures of the acetabulum. The time dependent effect of delay. J Bone Joint Surg Br. 2006;88(9):1197-1203. doi:10.1302/0301-620X.88B9.17588.
52. Centers for Disease Control and Prevention. The State of Aging & Health in America 2013. https://www.cdc.gov/aging/pdf/state-aging-health-in-america-2013.pdf. Accessed December 5, 2013.
53. Bohl DD, Basques BA, Golinvaux NS, Baumgaertner MR, Grauer JN. Nationwide Inpatient Sample and National Surgical Quality Improvement Program give different results in hip fracture studies. Clin Orthop Relat Res. 2014;472(6):1672-1680. doi:10.1007/s11999-014-3559-0.
54. Memtsoudis SG. Limitations associated with the analysis of data from administrative databases. Anesthesiology. 2009;111(2):449. [author reply:450-451]. doi:10.1097/ALN.0b013e3181adf739.
55. Neuhaus V, Swellengrebel CH, Bossen JK, Ring D. What are the factors influencing outcome among patients admitted to a hospital with a proximal humeral fracture? Clin Orthop Relat Res. 2013;471(5):1698-1706. doi:10.1007/s11999-013-2876-z.
TAKE-HOME POINTS
- The population-adjusted incidence of acetabular fractures increased between 1990 and 2010. Mortality associated with acetabular fractures decreased from 5.9% to 0.4% between 1990 and 2010.
- The proportion of patients treated with ORIF increased from 12.6% to 20.4% between 1990 and 2010.
- The average in-patient hospital length of stay following acetabular fracture decreased from 17.0 to 10.4 days between 1990 and 2010.
- ORIF is associated with the lowest odds of mortality following acetabular fracture.
Top news from TCT, anticoagulation guidelines, and more
This week, a breakthrough for heart failure patients with mitral regurgitation emerges, prosthesis-patient mismatch raises the risk of death following TAVR, a new study challenges anticoagulation guidelines, and a possible blessing in disguise for rivaroxaban comes from the massive COMPASS trial. Subscribe to Cardiocast wherever you get your podcasts.
This week, a breakthrough for heart failure patients with mitral regurgitation emerges, prosthesis-patient mismatch raises the risk of death following TAVR, a new study challenges anticoagulation guidelines, and a possible blessing in disguise for rivaroxaban comes from the massive COMPASS trial. Subscribe to Cardiocast wherever you get your podcasts.
This week, a breakthrough for heart failure patients with mitral regurgitation emerges, prosthesis-patient mismatch raises the risk of death following TAVR, a new study challenges anticoagulation guidelines, and a possible blessing in disguise for rivaroxaban comes from the massive COMPASS trial. Subscribe to Cardiocast wherever you get your podcasts.

Maximize well-woman visits for preventive services, counseling
A well-woman visit with an ob.gyn. should include preventive services and counseling, according to an updated committee opinion from the American College of Obstetricians and Gynecologists’ Committee on Gynecologic Practice.

“A well-woman visit provides an excellent opportunity to counsel patients about maintaining a healthy lifestyle and minimizing health risks,” according to the opinion, published in Obstetrics & Gynecology. The updated opinion coincides with the release of the new Well-Woman Chart from the Women’s Preventive Services Initiative.
Previous research suggests that many women prefer an ob.gyn. or other women’s health care specialist not only for reproductive health care but also for services such as cervical cancer screening, contraception, and treatment for sexually transmitted infections, the committee members wrote. Although surveys of ob.gyns. show that most provide some level of overall health and primary care, the screening and other clinical preventive services were not consistent.
The committee opinion consequently recommends that the “periodic well-woman care visit should include screening, evaluation and counseling, and immunizations based on age and risk factors.” However, the committee acknowledged that the interval for specific services varies among patients, as does the scope of services provided in different settings.
“Taking a comprehensive history (specifically obtaining detailed information on symptoms and past medical and gynecologic history) will inform if certain components of the physical examination, including breast or pelvic examination, are indicated at that visit and will inform shared decision making for these examinations,” committee members wrote. Topics that should be addressed during lifespan include sexual health (which may include contraception, prepregnancy counseling, sexually transmitted infections, and infertility), vulvovaginal symptoms, and bone health.
Not all components of a physical may be required at a well-woman visit, but ob.gyns. can play a key role by encouraging and facilitating healthy behaviors, counseling on preventive health strategies, and engaging women in shared decision-making. Screening for smoking, poor diet, and lack of physical activity are important. Ob.gyns. also can be part of the team-based care for women that may include physician assistants, nurse practitioners, and other medical professionals.
The most notable change from the previous opinion is that it coincides with the Women’s Preventive Services Initiative’s release of a Well-Woman Chart, which is designed to help ob.gyns. navigate the implementation of ACOG’s well-woman guidance, Christopher Zahn, MD, vice president of practice activities for ACOG, said in an interview.
“In tandem, these documents support ob.gyns. and other women’s health care providers’ efforts to make well-woman visits more personalized care that prioritizes shared decision-making over a woman’s lifetime,” he said. The opinion statement also includes the Women’s Preventive Services Initiative as a source of information for recommendations on well-woman care, and includes new guidance on the elements of a physical exam, including the pelvic exam.
“Ob.gyns. care for women over their lifetime, and increasingly this includes a lot of preventive care. The committee opinion details ACOG’s overall approach to well-women care and the role of the ob.gyn. as a provider of preventive services,” said Dr. Zahn. “The accompanying well-woman chart, targeted to providers, summarizes needed preventive services ensuring that time can be spent effectively and productively during each well-woman visit. By centering shared decision making and care tailored to each woman’s health care needs at every life stage, the well-woman visit is a fundamental part of the patient-provider relationship.”
Dr. Zahn noted that ongoing, high-quality research is essential to determine what strategies are most effective for women’s preventive care needs at every life stage. “Further research is also needed to identify screening strategies for women in certain higher risk groups and to reduce disparities in outcomes in certain populations of women. From cancer screening to new contraceptive methods, to managing symptoms of menopause, the more research we have to support our recommendations for these services, the more effectively we can care for women and help to keep them healthy for many, many years,” he emphasized.
The committee recommended additional resources for ob.gyns. and other health care providers, as well as for patients. The resources are available online at www.acog.org/More-Info/WellWoman.
The new opinion statement, which replaces the previous opinion issued in 2012, was developed by the ACOG Committee on Gynecologic Practice in collaboration with committee member Catherine Witkop, MD, MPH, of the Uniformed Health Sciences University in Bethesda, Md. The committee members had no relevant financial conflicts to disclose.
A well-woman visit with an ob.gyn. should include preventive services and counseling, according to an updated committee opinion from the American College of Obstetricians and Gynecologists’ Committee on Gynecologic Practice.
“A well-woman visit provides an excellent opportunity to counsel patients about maintaining a healthy lifestyle and minimizing health risks,” according to the opinion, published in Obstetrics & Gynecology. The updated opinion coincides with the release of the new Well-Woman Chart from the Women’s Preventive Services Initiative.
Previous research suggests that many women prefer an ob.gyn. or other women’s health care specialist not only for reproductive health care but also for services such as cervical cancer screening, contraception, and treatment for sexually transmitted infections, the committee members wrote. Although surveys of ob.gyns. show that most provide some level of overall health and primary care, the screening and other clinical preventive services were not consistent.
The committee opinion consequently recommends that the “periodic well-woman care visit should include screening, evaluation and counseling, and immunizations based on age and risk factors.” However, the committee acknowledged that the interval for specific services varies among patients, as does the scope of services provided in different settings.
“Taking a comprehensive history (specifically obtaining detailed information on symptoms and past medical and gynecologic history) will inform if certain components of the physical examination, including breast or pelvic examination, are indicated at that visit and will inform shared decision making for these examinations,” committee members wrote. Topics that should be addressed during lifespan include sexual health (which may include contraception, prepregnancy counseling, sexually transmitted infections, and infertility), vulvovaginal symptoms, and bone health.
Not all components of a physical may be required at a well-woman visit, but ob.gyns. can play a key role by encouraging and facilitating healthy behaviors, counseling on preventive health strategies, and engaging women in shared decision-making. Screening for smoking, poor diet, and lack of physical activity are important. Ob.gyns. also can be part of the team-based care for women that may include physician assistants, nurse practitioners, and other medical professionals.
The most notable change from the previous opinion is that it coincides with the Women’s Preventive Services Initiative’s release of a Well-Woman Chart, which is designed to help ob.gyns. navigate the implementation of ACOG’s well-woman guidance, Christopher Zahn, MD, vice president of practice activities for ACOG, said in an interview.
“In tandem, these documents support ob.gyns. and other women’s health care providers’ efforts to make well-woman visits more personalized care that prioritizes shared decision-making over a woman’s lifetime,” he said. The opinion statement also includes the Women’s Preventive Services Initiative as a source of information for recommendations on well-woman care, and includes new guidance on the elements of a physical exam, including the pelvic exam.
“Ob.gyns. care for women over their lifetime, and increasingly this includes a lot of preventive care. The committee opinion details ACOG’s overall approach to well-women care and the role of the ob.gyn. as a provider of preventive services,” said Dr. Zahn. “The accompanying well-woman chart, targeted to providers, summarizes needed preventive services ensuring that time can be spent effectively and productively during each well-woman visit. By centering shared decision making and care tailored to each woman’s health care needs at every life stage, the well-woman visit is a fundamental part of the patient-provider relationship.”
Dr. Zahn noted that ongoing, high-quality research is essential to determine what strategies are most effective for women’s preventive care needs at every life stage. “Further research is also needed to identify screening strategies for women in certain higher risk groups and to reduce disparities in outcomes in certain populations of women. From cancer screening to new contraceptive methods, to managing symptoms of menopause, the more research we have to support our recommendations for these services, the more effectively we can care for women and help to keep them healthy for many, many years,” he emphasized.
The committee recommended additional resources for ob.gyns. and other health care providers, as well as for patients. The resources are available online at www.acog.org/More-Info/WellWoman.
The new opinion statement, which replaces the previous opinion issued in 2012, was developed by the ACOG Committee on Gynecologic Practice in collaboration with committee member Catherine Witkop, MD, MPH, of the Uniformed Health Sciences University in Bethesda, Md. The committee members had no relevant financial conflicts to disclose.
A well-woman visit with an ob.gyn. should include preventive services and counseling, according to an updated committee opinion from the American College of Obstetricians and Gynecologists’ Committee on Gynecologic Practice.
“A well-woman visit provides an excellent opportunity to counsel patients about maintaining a healthy lifestyle and minimizing health risks,” according to the opinion, published in Obstetrics & Gynecology. The updated opinion coincides with the release of the new Well-Woman Chart from the Women’s Preventive Services Initiative.
Previous research suggests that many women prefer an ob.gyn. or other women’s health care specialist not only for reproductive health care but also for services such as cervical cancer screening, contraception, and treatment for sexually transmitted infections, the committee members wrote. Although surveys of ob.gyns. show that most provide some level of overall health and primary care, the screening and other clinical preventive services were not consistent.
The committee opinion consequently recommends that the “periodic well-woman care visit should include screening, evaluation and counseling, and immunizations based on age and risk factors.” However, the committee acknowledged that the interval for specific services varies among patients, as does the scope of services provided in different settings.
“Taking a comprehensive history (specifically obtaining detailed information on symptoms and past medical and gynecologic history) will inform if certain components of the physical examination, including breast or pelvic examination, are indicated at that visit and will inform shared decision making for these examinations,” committee members wrote. Topics that should be addressed during lifespan include sexual health (which may include contraception, prepregnancy counseling, sexually transmitted infections, and infertility), vulvovaginal symptoms, and bone health.
Not all components of a physical may be required at a well-woman visit, but ob.gyns. can play a key role by encouraging and facilitating healthy behaviors, counseling on preventive health strategies, and engaging women in shared decision-making. Screening for smoking, poor diet, and lack of physical activity are important. Ob.gyns. also can be part of the team-based care for women that may include physician assistants, nurse practitioners, and other medical professionals.
The most notable change from the previous opinion is that it coincides with the Women’s Preventive Services Initiative’s release of a Well-Woman Chart, which is designed to help ob.gyns. navigate the implementation of ACOG’s well-woman guidance, Christopher Zahn, MD, vice president of practice activities for ACOG, said in an interview.
“In tandem, these documents support ob.gyns. and other women’s health care providers’ efforts to make well-woman visits more personalized care that prioritizes shared decision-making over a woman’s lifetime,” he said. The opinion statement also includes the Women’s Preventive Services Initiative as a source of information for recommendations on well-woman care, and includes new guidance on the elements of a physical exam, including the pelvic exam.
“Ob.gyns. care for women over their lifetime, and increasingly this includes a lot of preventive care. The committee opinion details ACOG’s overall approach to well-women care and the role of the ob.gyn. as a provider of preventive services,” said Dr. Zahn. “The accompanying well-woman chart, targeted to providers, summarizes needed preventive services ensuring that time can be spent effectively and productively during each well-woman visit. By centering shared decision making and care tailored to each woman’s health care needs at every life stage, the well-woman visit is a fundamental part of the patient-provider relationship.”
Dr. Zahn noted that ongoing, high-quality research is essential to determine what strategies are most effective for women’s preventive care needs at every life stage. “Further research is also needed to identify screening strategies for women in certain higher risk groups and to reduce disparities in outcomes in certain populations of women. From cancer screening to new contraceptive methods, to managing symptoms of menopause, the more research we have to support our recommendations for these services, the more effectively we can care for women and help to keep them healthy for many, many years,” he emphasized.
The committee recommended additional resources for ob.gyns. and other health care providers, as well as for patients. The resources are available online at www.acog.org/More-Info/WellWoman.
The new opinion statement, which replaces the previous opinion issued in 2012, was developed by the ACOG Committee on Gynecologic Practice in collaboration with committee member Catherine Witkop, MD, MPH, of the Uniformed Health Sciences University in Bethesda, Md. The committee members had no relevant financial conflicts to disclose.
FROM OBSTETRICS & GYNECOLOGY

ID experts urge widespread flu vaccination for 2018-2019 season
WASHINGTON – The flu vaccine may not be perfect, but it can reduce the severity of illness and curb the risk of spreading the disease to others, William Schaffner, MD, emphasized at a press conference held by the National Foundation for Infectious Diseases.
“Give the vaccine credit for softening the blow,” said Dr. Schaffner, medical director of NFID and a professor at Vanderbilt University in Nashville.
Dr. Schaffner and a panel of experts including U.S. Surgeon General Jerome M. Adams, MD, encouraged the public and the health care community to follow recommendation from the Centers for Disease Control & Prevention that everyone aged 6 months and older receive an influenza vaccine.
Dr. Schaffner shared recent data showing that complications from the flu don’t stop when the acute illness resolves. Acute influenza causes a whole-body inflammatory reaction, and consequently “there is an increased risk of heart attack and stroke during the 2-4 weeks of recovery from acute influenza,” he said. In addition, older adults who experience acute flu and are already frail may never regain their pre-flu level of function, as the flu can start a “domino effect of decline and disability.”
Despite last year’s severe flu season that included 180 deaths in children, vaccination remains the most effective protection against the flu, Dr. Adams said.
This year, between 163 million and 168 million doses of vaccine will be available in the United States. The vaccine is available in a range of settings including doctors’ offices, pharmacies, grocery stores, and workplaces, said Dr. Adams.
Flu vaccine choices this year include a return of the live-attenuated influenza vaccine (LAIV) given via nasal spray, along with the standard influenza vaccine that includes either three influenza viruses (trivalent, with two influenza A and one influenza B) or four influenza viruses (quadrivalent, with two influenza A and two influenza B). Other options are adjuvanted vaccine and high-dose vaccine for adults aged 65 years and older, and a cell-based and recombinant vaccine as alternatives to egg-based vaccines.
Dr. Adams emphasized the importance of healthy people getting vaccinated to protect the community. “All the people who died from the flu caught it from someone else,” he said.

The message to health care providers remains the same: Recommend the flu vaccine to patients at every opportunity, and lead by example and get vaccinated yourself, Dr. Adams said. He noted this year’s strategies to promote flu vaccination on social media, and encouraged clinicians to recommend the flu shot to their patients and to showcase their own shots via the #FightFlu hashtag.
Vaccination among health care personnel last year was approximately 78%, which is a plateau over the past several years (MMWR 2018; 67:1050-54).
Be prepared to offer antivirals to patients as appropriate, and to promote the pneumococcal vaccine to eligible older adults as well, to protect not only themselves, but their contacts and the community, Dr. Adams emphasized. Currently approved antiviral drugs recommended for the 2018-2019 flu season: oseltamivir, zanamivir, and peramivir.
Wendy Sue Swanson, MD, of Seattle Children’s Hospital, stressed the importance of flu vaccination for all children, given their ability to spread viral infections. She noted a concerning 2% drop in vaccinations for children aged 6 months to 4 years, although vaccination coverage in this group was highest among children overall, at approximately 68% last season.
Last year, approximately 80% of the child deaths from flu occurred in unvaccinated children, but the vaccine has been shown to reduce the likelihood of hospitalization or death even if a child does become ill, Dr. Swanson said.
Laura E. Riley, MD, of Weill Cornell Medical Center, noted that vaccination of pregnant women has plateaued in recent years, and was 49% last year. “Our goal is 80% plus,” she said. Data show that pregnant women who received flu vaccination were 40% less likely to be hospitalized for the flu, she noted. The American College of Obstetricians and Gynecologists recommends flu vaccination as safe during any trimester, and valuable to both mothers and newborns because it provides protective antibodies during the first 6 months of life before babies can receive their own vaccinations, Dr. Riley said.
More information about this year’s flu season is available from the CDC and NFID.
WASHINGTON – The flu vaccine may not be perfect, but it can reduce the severity of illness and curb the risk of spreading the disease to others, William Schaffner, MD, emphasized at a press conference held by the National Foundation for Infectious Diseases.
“Give the vaccine credit for softening the blow,” said Dr. Schaffner, medical director of NFID and a professor at Vanderbilt University in Nashville.
Dr. Schaffner and a panel of experts including U.S. Surgeon General Jerome M. Adams, MD, encouraged the public and the health care community to follow recommendation from the Centers for Disease Control & Prevention that everyone aged 6 months and older receive an influenza vaccine.
Dr. Schaffner shared recent data showing that complications from the flu don’t stop when the acute illness resolves. Acute influenza causes a whole-body inflammatory reaction, and consequently “there is an increased risk of heart attack and stroke during the 2-4 weeks of recovery from acute influenza,” he said. In addition, older adults who experience acute flu and are already frail may never regain their pre-flu level of function, as the flu can start a “domino effect of decline and disability.”
Despite last year’s severe flu season that included 180 deaths in children, vaccination remains the most effective protection against the flu, Dr. Adams said.
This year, between 163 million and 168 million doses of vaccine will be available in the United States. The vaccine is available in a range of settings including doctors’ offices, pharmacies, grocery stores, and workplaces, said Dr. Adams.
Flu vaccine choices this year include a return of the live-attenuated influenza vaccine (LAIV) given via nasal spray, along with the standard influenza vaccine that includes either three influenza viruses (trivalent, with two influenza A and one influenza B) or four influenza viruses (quadrivalent, with two influenza A and two influenza B). Other options are adjuvanted vaccine and high-dose vaccine for adults aged 65 years and older, and a cell-based and recombinant vaccine as alternatives to egg-based vaccines.
Dr. Adams emphasized the importance of healthy people getting vaccinated to protect the community. “All the people who died from the flu caught it from someone else,” he said.
The message to health care providers remains the same: Recommend the flu vaccine to patients at every opportunity, and lead by example and get vaccinated yourself, Dr. Adams said. He noted this year’s strategies to promote flu vaccination on social media, and encouraged clinicians to recommend the flu shot to their patients and to showcase their own shots via the #FightFlu hashtag.
Vaccination among health care personnel last year was approximately 78%, which is a plateau over the past several years (MMWR 2018; 67:1050-54).
Be prepared to offer antivirals to patients as appropriate, and to promote the pneumococcal vaccine to eligible older adults as well, to protect not only themselves, but their contacts and the community, Dr. Adams emphasized. Currently approved antiviral drugs recommended for the 2018-2019 flu season: oseltamivir, zanamivir, and peramivir.
Wendy Sue Swanson, MD, of Seattle Children’s Hospital, stressed the importance of flu vaccination for all children, given their ability to spread viral infections. She noted a concerning 2% drop in vaccinations for children aged 6 months to 4 years, although vaccination coverage in this group was highest among children overall, at approximately 68% last season.
Last year, approximately 80% of the child deaths from flu occurred in unvaccinated children, but the vaccine has been shown to reduce the likelihood of hospitalization or death even if a child does become ill, Dr. Swanson said.
Laura E. Riley, MD, of Weill Cornell Medical Center, noted that vaccination of pregnant women has plateaued in recent years, and was 49% last year. “Our goal is 80% plus,” she said. Data show that pregnant women who received flu vaccination were 40% less likely to be hospitalized for the flu, she noted. The American College of Obstetricians and Gynecologists recommends flu vaccination as safe during any trimester, and valuable to both mothers and newborns because it provides protective antibodies during the first 6 months of life before babies can receive their own vaccinations, Dr. Riley said.
More information about this year’s flu season is available from the CDC and NFID.
WASHINGTON – The flu vaccine may not be perfect, but it can reduce the severity of illness and curb the risk of spreading the disease to others, William Schaffner, MD, emphasized at a press conference held by the National Foundation for Infectious Diseases.
“Give the vaccine credit for softening the blow,” said Dr. Schaffner, medical director of NFID and a professor at Vanderbilt University in Nashville.
Dr. Schaffner and a panel of experts including U.S. Surgeon General Jerome M. Adams, MD, encouraged the public and the health care community to follow recommendation from the Centers for Disease Control & Prevention that everyone aged 6 months and older receive an influenza vaccine.
Dr. Schaffner shared recent data showing that complications from the flu don’t stop when the acute illness resolves. Acute influenza causes a whole-body inflammatory reaction, and consequently “there is an increased risk of heart attack and stroke during the 2-4 weeks of recovery from acute influenza,” he said. In addition, older adults who experience acute flu and are already frail may never regain their pre-flu level of function, as the flu can start a “domino effect of decline and disability.”
Despite last year’s severe flu season that included 180 deaths in children, vaccination remains the most effective protection against the flu, Dr. Adams said.
This year, between 163 million and 168 million doses of vaccine will be available in the United States. The vaccine is available in a range of settings including doctors’ offices, pharmacies, grocery stores, and workplaces, said Dr. Adams.
Flu vaccine choices this year include a return of the live-attenuated influenza vaccine (LAIV) given via nasal spray, along with the standard influenza vaccine that includes either three influenza viruses (trivalent, with two influenza A and one influenza B) or four influenza viruses (quadrivalent, with two influenza A and two influenza B). Other options are adjuvanted vaccine and high-dose vaccine for adults aged 65 years and older, and a cell-based and recombinant vaccine as alternatives to egg-based vaccines.
Dr. Adams emphasized the importance of healthy people getting vaccinated to protect the community. “All the people who died from the flu caught it from someone else,” he said.
The message to health care providers remains the same: Recommend the flu vaccine to patients at every opportunity, and lead by example and get vaccinated yourself, Dr. Adams said. He noted this year’s strategies to promote flu vaccination on social media, and encouraged clinicians to recommend the flu shot to their patients and to showcase their own shots via the #FightFlu hashtag.
Vaccination among health care personnel last year was approximately 78%, which is a plateau over the past several years (MMWR 2018; 67:1050-54).
Be prepared to offer antivirals to patients as appropriate, and to promote the pneumococcal vaccine to eligible older adults as well, to protect not only themselves, but their contacts and the community, Dr. Adams emphasized. Currently approved antiviral drugs recommended for the 2018-2019 flu season: oseltamivir, zanamivir, and peramivir.
Wendy Sue Swanson, MD, of Seattle Children’s Hospital, stressed the importance of flu vaccination for all children, given their ability to spread viral infections. She noted a concerning 2% drop in vaccinations for children aged 6 months to 4 years, although vaccination coverage in this group was highest among children overall, at approximately 68% last season.
Last year, approximately 80% of the child deaths from flu occurred in unvaccinated children, but the vaccine has been shown to reduce the likelihood of hospitalization or death even if a child does become ill, Dr. Swanson said.
Laura E. Riley, MD, of Weill Cornell Medical Center, noted that vaccination of pregnant women has plateaued in recent years, and was 49% last year. “Our goal is 80% plus,” she said. Data show that pregnant women who received flu vaccination were 40% less likely to be hospitalized for the flu, she noted. The American College of Obstetricians and Gynecologists recommends flu vaccination as safe during any trimester, and valuable to both mothers and newborns because it provides protective antibodies during the first 6 months of life before babies can receive their own vaccinations, Dr. Riley said.
More information about this year’s flu season is available from the CDC and NFID.
FROM AN NFID PRESS CONFERENCE
Point-of-care test for respiratory viruses lowers antibiotic use
Routine testing in the ED is advocated
PARIS – Using a point-of-care test for viral pathogens, hospital admissions were avoided in about a third of emergency department patients with suspected respiratory infection when other clinical signs also suggested a low risk of a bacterial pathogen, according to a single-center experience presented at the annual congress of the European Respiratory Society.
“We found that when patients had point-of-care respiratory viral testing soon after they were admitted to the emergency department, we were able to reduce unnecessary admission and improve bed flow in our center,” reported Kay Roy, MBBS, consultant physician in respiratory medicine, West Hertfordshire (England) Hospital NHS Trust.
In a protocol that was launched at Dr. Kay’s institution in January 2018, the point-of-care viral test was combined with other clinical factors, particularly chest x-rays and elevated C-reactive protein (CRP), to determine whether patients had a viral pathogen and whether they could be discharged without antibiotics.
“Clinical judgment will always be required in individual patient decisions regarding antibiotic avoidance and early discharge,” Dr. Roy maintained. “But the point-of-care viral assay can be integrated into a strategy that permits more informed and rapid decision-making.”
This assertion is supported by the experience using a protocol anchored with the point-of-care viral test over a 4-month period. During this time, 901 patients with respiratory symptoms suspected of having a viral etiology were evaluated with the proprietary point-of-care device called FilmArray (bioMérieux).
From a sample taken with a nasopharyngeal swab, the test can identify a broad array of viruses using polymerase chain reaction technology in less than 45 minutes. However, the ED protocol for considering discharge without antibiotics requires additional evidence that the pathogen is viral, including a normal chest x-ray and a CRP less than 50 mg/L.
Of the 901 patients tested, a substantial proportion of whom had chronic obstructive pulmonary disease (COPD) or asthma, 507 (56%) tested positive for at least one virus, including influenza, rhinoviruses, coronaviruses, and adenovirus. Of these, 239 had normal chest x-rays and CRPs less than 50 mg/L. Because of the severity of symptoms or other clinical considerations, 154 patients were admitted, but 85 (36% of those meeting protocol criteria) were discharged without an antibiotic prescription.
“Antibiotics were continued in 90% of the patients who had an abnormal chest x-ray and abnormal CRP,” Dr. Roy reported. However, an objective strategy that permits clinicians to discharge patients at very low risk of a bacterial infection has many advantages even if it applies to a relatively modest proportion of those tested, according to Dr. Roy.
“Each respiratory admission can cost around [2,000 pounds] at our center,” reported Dr. Kay, referring to a figure equivalent to more than $2,600. In addition, she said that avoiding hospitalization frees up hospital beds and facilitates improved antimicrobial stewardship, which is vital to stem resistance.
Avoiding antibiotic use in patients with viral respiratory infections also is relevant to improved antibiotic stewardship in the community. For this reason, a randomized trial with a similar protocol involving the point-of-care viral test is planned in the outpatient setting. According to Dr. Roy, this will involve a community hub to which patients can be referred for testing and clinical evaluation.
“We hope that the quality of care can be improved with the point-of-care test for respiratory viruses as well as helping to reduce antibiotic resistance,” Dr. Roy said.
This approach is promising, according to Tobias Welte, MD, of the department of respiratory medicine at Hannover (Germany) Medical School, but he cautioned that it is not a standard approach.
“The protocol described by Dr. Roy will have to be compared to guidelines and recommended best clinical practice to confirm its usefulness,” he said, while conceding that any strategy that reduces unnecessary hospitalizations deserves further evaluation.
Routine testing in the ED is advocated
Routine testing in the ED is advocated
PARIS – Using a point-of-care test for viral pathogens, hospital admissions were avoided in about a third of emergency department patients with suspected respiratory infection when other clinical signs also suggested a low risk of a bacterial pathogen, according to a single-center experience presented at the annual congress of the European Respiratory Society.
“We found that when patients had point-of-care respiratory viral testing soon after they were admitted to the emergency department, we were able to reduce unnecessary admission and improve bed flow in our center,” reported Kay Roy, MBBS, consultant physician in respiratory medicine, West Hertfordshire (England) Hospital NHS Trust.
In a protocol that was launched at Dr. Kay’s institution in January 2018, the point-of-care viral test was combined with other clinical factors, particularly chest x-rays and elevated C-reactive protein (CRP), to determine whether patients had a viral pathogen and whether they could be discharged without antibiotics.
“Clinical judgment will always be required in individual patient decisions regarding antibiotic avoidance and early discharge,” Dr. Roy maintained. “But the point-of-care viral assay can be integrated into a strategy that permits more informed and rapid decision-making.”
This assertion is supported by the experience using a protocol anchored with the point-of-care viral test over a 4-month period. During this time, 901 patients with respiratory symptoms suspected of having a viral etiology were evaluated with the proprietary point-of-care device called FilmArray (bioMérieux).
From a sample taken with a nasopharyngeal swab, the test can identify a broad array of viruses using polymerase chain reaction technology in less than 45 minutes. However, the ED protocol for considering discharge without antibiotics requires additional evidence that the pathogen is viral, including a normal chest x-ray and a CRP less than 50 mg/L.
Of the 901 patients tested, a substantial proportion of whom had chronic obstructive pulmonary disease (COPD) or asthma, 507 (56%) tested positive for at least one virus, including influenza, rhinoviruses, coronaviruses, and adenovirus. Of these, 239 had normal chest x-rays and CRPs less than 50 mg/L. Because of the severity of symptoms or other clinical considerations, 154 patients were admitted, but 85 (36% of those meeting protocol criteria) were discharged without an antibiotic prescription.
“Antibiotics were continued in 90% of the patients who had an abnormal chest x-ray and abnormal CRP,” Dr. Roy reported. However, an objective strategy that permits clinicians to discharge patients at very low risk of a bacterial infection has many advantages even if it applies to a relatively modest proportion of those tested, according to Dr. Roy.
“Each respiratory admission can cost around [2,000 pounds] at our center,” reported Dr. Kay, referring to a figure equivalent to more than $2,600. In addition, she said that avoiding hospitalization frees up hospital beds and facilitates improved antimicrobial stewardship, which is vital to stem resistance.
Avoiding antibiotic use in patients with viral respiratory infections also is relevant to improved antibiotic stewardship in the community. For this reason, a randomized trial with a similar protocol involving the point-of-care viral test is planned in the outpatient setting. According to Dr. Roy, this will involve a community hub to which patients can be referred for testing and clinical evaluation.
“We hope that the quality of care can be improved with the point-of-care test for respiratory viruses as well as helping to reduce antibiotic resistance,” Dr. Roy said.
This approach is promising, according to Tobias Welte, MD, of the department of respiratory medicine at Hannover (Germany) Medical School, but he cautioned that it is not a standard approach.
“The protocol described by Dr. Roy will have to be compared to guidelines and recommended best clinical practice to confirm its usefulness,” he said, while conceding that any strategy that reduces unnecessary hospitalizations deserves further evaluation.
PARIS – Using a point-of-care test for viral pathogens, hospital admissions were avoided in about a third of emergency department patients with suspected respiratory infection when other clinical signs also suggested a low risk of a bacterial pathogen, according to a single-center experience presented at the annual congress of the European Respiratory Society.
“We found that when patients had point-of-care respiratory viral testing soon after they were admitted to the emergency department, we were able to reduce unnecessary admission and improve bed flow in our center,” reported Kay Roy, MBBS, consultant physician in respiratory medicine, West Hertfordshire (England) Hospital NHS Trust.
In a protocol that was launched at Dr. Kay’s institution in January 2018, the point-of-care viral test was combined with other clinical factors, particularly chest x-rays and elevated C-reactive protein (CRP), to determine whether patients had a viral pathogen and whether they could be discharged without antibiotics.
“Clinical judgment will always be required in individual patient decisions regarding antibiotic avoidance and early discharge,” Dr. Roy maintained. “But the point-of-care viral assay can be integrated into a strategy that permits more informed and rapid decision-making.”
This assertion is supported by the experience using a protocol anchored with the point-of-care viral test over a 4-month period. During this time, 901 patients with respiratory symptoms suspected of having a viral etiology were evaluated with the proprietary point-of-care device called FilmArray (bioMérieux).
From a sample taken with a nasopharyngeal swab, the test can identify a broad array of viruses using polymerase chain reaction technology in less than 45 minutes. However, the ED protocol for considering discharge without antibiotics requires additional evidence that the pathogen is viral, including a normal chest x-ray and a CRP less than 50 mg/L.
Of the 901 patients tested, a substantial proportion of whom had chronic obstructive pulmonary disease (COPD) or asthma, 507 (56%) tested positive for at least one virus, including influenza, rhinoviruses, coronaviruses, and adenovirus. Of these, 239 had normal chest x-rays and CRPs less than 50 mg/L. Because of the severity of symptoms or other clinical considerations, 154 patients were admitted, but 85 (36% of those meeting protocol criteria) were discharged without an antibiotic prescription.
“Antibiotics were continued in 90% of the patients who had an abnormal chest x-ray and abnormal CRP,” Dr. Roy reported. However, an objective strategy that permits clinicians to discharge patients at very low risk of a bacterial infection has many advantages even if it applies to a relatively modest proportion of those tested, according to Dr. Roy.
“Each respiratory admission can cost around [2,000 pounds] at our center,” reported Dr. Kay, referring to a figure equivalent to more than $2,600. In addition, she said that avoiding hospitalization frees up hospital beds and facilitates improved antimicrobial stewardship, which is vital to stem resistance.
Avoiding antibiotic use in patients with viral respiratory infections also is relevant to improved antibiotic stewardship in the community. For this reason, a randomized trial with a similar protocol involving the point-of-care viral test is planned in the outpatient setting. According to Dr. Roy, this will involve a community hub to which patients can be referred for testing and clinical evaluation.
“We hope that the quality of care can be improved with the point-of-care test for respiratory viruses as well as helping to reduce antibiotic resistance,” Dr. Roy said.
This approach is promising, according to Tobias Welte, MD, of the department of respiratory medicine at Hannover (Germany) Medical School, but he cautioned that it is not a standard approach.
“The protocol described by Dr. Roy will have to be compared to guidelines and recommended best clinical practice to confirm its usefulness,” he said, while conceding that any strategy that reduces unnecessary hospitalizations deserves further evaluation.
REPORTING FROM THE ERS CONGRESS 2018
Key clinical point:
Major finding: Of patients with a negative chest x-ray and low CRP level, 36% avoided hospital admission due to a positive test for a virus.
Study details: A case series.
Disclosures: Dr. Roy reports no financial relationships relevant to this study.
Get on top of home BP monitoring now
CHICAGO – Home BP monitoring has proved its worth, and it’s now time to integrate it into health care and get insurers to pay for it, according to Hayden Bosworth, PhD, a population health sciences professor and health services researcher at Duke University, Durham, N.C.
The devices are on the shelves of pharmacies and discount stores nationwide, sometimes for less than $50, but what to do with them in the clinic hasn’t been worked out. It’s likely patients are soon going to want help interpreting the results, if they aren’t already, but a leap in technology has left clinicians and payors scratching their heads.
There’s more than enough evidence of benefit. Dr. Bosworth has been involved with several trials of home BP monitoring with good results. He was one of the many authors on a recent meta-analysis that found when patients check their BP at home, it can lead to a “clinically significant” reduction “which persists for at least 12 months” (PLoS Med. 2017 Sep 19;14[9]:e1002389).
“Are we talking about efficacy or proof of concept? I think we are beyond that. Now we have to think about how we put it into the system, how do we integrate it, what’s the best way of delivery. I think that’s where the future is,” he said in an interview at the joint scientific sessions of the American Heart Association Council on Hypertension, AHA Council on Kidney in Cardiovascular Disease, and American Society of Hypertension.
Home monitoring came up far more often at this year’s joint sessions than in 2017, which might indicate growing interest, but reimbursement remains a challenge. American Medical Association staff said at this year’s meeting that they are working with the Centers for Medicare & Medicaid Services for coverage of the devices and their use. It seemed likely to them.
In the meantime, Dr. Bosworth had some useful advice for those who are thinking about incorporating home BP monitoring into their practices.
He shared his tips on how to pick out a device – there’s actually a journal called Blood Pressure Monitoring that can help – as well as his thoughts on how often people should monitor themselves and what to do with the numbers.
He envisions a future when patients routinely check their BP at home; it’s even possible they could adjust their medications based on the results, much like diabetes patients track their blood glucose and adjust their insulin. It’s been shown to work in Britain (JAMA. 2014 Aug 27;312[8]:799-808).
Dr. Bosworth reported no relevant disclosures.
CHICAGO – Home BP monitoring has proved its worth, and it’s now time to integrate it into health care and get insurers to pay for it, according to Hayden Bosworth, PhD, a population health sciences professor and health services researcher at Duke University, Durham, N.C.
The devices are on the shelves of pharmacies and discount stores nationwide, sometimes for less than $50, but what to do with them in the clinic hasn’t been worked out. It’s likely patients are soon going to want help interpreting the results, if they aren’t already, but a leap in technology has left clinicians and payors scratching their heads.
There’s more than enough evidence of benefit. Dr. Bosworth has been involved with several trials of home BP monitoring with good results. He was one of the many authors on a recent meta-analysis that found when patients check their BP at home, it can lead to a “clinically significant” reduction “which persists for at least 12 months” (PLoS Med. 2017 Sep 19;14[9]:e1002389).
“Are we talking about efficacy or proof of concept? I think we are beyond that. Now we have to think about how we put it into the system, how do we integrate it, what’s the best way of delivery. I think that’s where the future is,” he said in an interview at the joint scientific sessions of the American Heart Association Council on Hypertension, AHA Council on Kidney in Cardiovascular Disease, and American Society of Hypertension.
Home monitoring came up far more often at this year’s joint sessions than in 2017, which might indicate growing interest, but reimbursement remains a challenge. American Medical Association staff said at this year’s meeting that they are working with the Centers for Medicare & Medicaid Services for coverage of the devices and their use. It seemed likely to them.
In the meantime, Dr. Bosworth had some useful advice for those who are thinking about incorporating home BP monitoring into their practices.
He shared his tips on how to pick out a device – there’s actually a journal called Blood Pressure Monitoring that can help – as well as his thoughts on how often people should monitor themselves and what to do with the numbers.
He envisions a future when patients routinely check their BP at home; it’s even possible they could adjust their medications based on the results, much like diabetes patients track their blood glucose and adjust their insulin. It’s been shown to work in Britain (JAMA. 2014 Aug 27;312[8]:799-808).
Dr. Bosworth reported no relevant disclosures.
CHICAGO – Home BP monitoring has proved its worth, and it’s now time to integrate it into health care and get insurers to pay for it, according to Hayden Bosworth, PhD, a population health sciences professor and health services researcher at Duke University, Durham, N.C.
The devices are on the shelves of pharmacies and discount stores nationwide, sometimes for less than $50, but what to do with them in the clinic hasn’t been worked out. It’s likely patients are soon going to want help interpreting the results, if they aren’t already, but a leap in technology has left clinicians and payors scratching their heads.
There’s more than enough evidence of benefit. Dr. Bosworth has been involved with several trials of home BP monitoring with good results. He was one of the many authors on a recent meta-analysis that found when patients check their BP at home, it can lead to a “clinically significant” reduction “which persists for at least 12 months” (PLoS Med. 2017 Sep 19;14[9]:e1002389).
“Are we talking about efficacy or proof of concept? I think we are beyond that. Now we have to think about how we put it into the system, how do we integrate it, what’s the best way of delivery. I think that’s where the future is,” he said in an interview at the joint scientific sessions of the American Heart Association Council on Hypertension, AHA Council on Kidney in Cardiovascular Disease, and American Society of Hypertension.
Home monitoring came up far more often at this year’s joint sessions than in 2017, which might indicate growing interest, but reimbursement remains a challenge. American Medical Association staff said at this year’s meeting that they are working with the Centers for Medicare & Medicaid Services for coverage of the devices and their use. It seemed likely to them.
In the meantime, Dr. Bosworth had some useful advice for those who are thinking about incorporating home BP monitoring into their practices.
He shared his tips on how to pick out a device – there’s actually a journal called Blood Pressure Monitoring that can help – as well as his thoughts on how often people should monitor themselves and what to do with the numbers.
He envisions a future when patients routinely check their BP at home; it’s even possible they could adjust their medications based on the results, much like diabetes patients track their blood glucose and adjust their insulin. It’s been shown to work in Britain (JAMA. 2014 Aug 27;312[8]:799-808).
Dr. Bosworth reported no relevant disclosures.
EXPERT ANALYSIS FROM JOINT HYPERTENSION 2018

Online diabetes prevention programs as good as face-to-face programs
, researchers report.
Writing in background information to their paper, Tannaz Moin, MD, an endocrinologist at the VA Greater Los Angeles Healthcare System and the Veterans Affairs’ Health Services Research and Development Center for the Study of Healthcare Innovation, Implementation, and Policy, and her associates, said intensive lifestyle interventions such as diabetes prevention programs (DPP) could lower the risk of incident diabetes by 58%, but a lack of reach significantly attenuated their population impact in real-world settings.
“Building evidence for online DPP is important because of its potential for increasing reach because most U.S. adults (87%) use the Internet,” they wrote in their paper, published in the American Journal of Preventive Medicine.
They therefore set out to compare weight loss results from 114 veterans taking part in the Veterans Administration’s face-to-face standard-of-care weight management program MOVE! with an online program involving 268 obese or overweight veterans with prediabetes and 273 people taking part in an in-person program.
MOVE! included 8-12 face-to-face healthy-lifestyle sessions and monthly maintenance sessions but with no specified goals. The online program involved virtual groups of participants: live e-coaches who monitored group interactions and provided the participants with feedback via phone and private online messages; weekly educational modules on healthy eating and exercise; and wireless scales to record participant weights.
The in-person program consisted of 8-22 group-based face-to-face sessions focused on 7% weight loss and at least 150 minutes per session of moderate physical activity.
Weight loss, considered by the authors to be a significant predictor of diabetes risk reduction, was recorded at 6 months and then again at 12 months in all three interventions.
An analysis of 242 participants enrolled in the intensive, multifaceted online DPP intervention (26 were excluded because they did not have more than two available weights) revealed a significant weight change of –4.7 kg at 6 months and –4 kg at 12 months’ follow-up. On average, these participants lost 3.7% of their baseline weight at 12 months.
At both times weight change (kg and percentage) was not significantly different between the online intervention and those taking part in the in-person DPP (–4.8 and –4.1 kg for online vs –4 kg and –3.9 kg in-person for those completing more than one module/session). Both groups also had higher weight loss (percentage and kg) at 6 and 12 months compared with MOVE! participants (–1.1kg and 0.10 kg).
The research team noted that the online program had better participation than did the in-person program, with 87% of online participants completing eight or more sessions, compared with 59% for the in-person program and 55% for MOVE!
They suggested this was because the online program had several user-friendly features that increased the frequency of potential “touches” participants received over time.
“Future studies examining how inline DPP intervention components can work together to impact participation and engagement are key,” they said.
“This is one of the first studies to report weight outcomes irrespective of the level of engagement with an online DPP intervention and to examine outcomes compared with in person DPP. Overall, these findings may have important implications for national efforts to disseminate DPP,” they concluded.
The authors conceded that the generalizability of their study was limited as it included veterans receiving care in the VHA.
SOURCE: Am J Prev Med. 2018 Sep 24. doi: 10.1016/j.amepre.2018.06.028
, researchers report.
Writing in background information to their paper, Tannaz Moin, MD, an endocrinologist at the VA Greater Los Angeles Healthcare System and the Veterans Affairs’ Health Services Research and Development Center for the Study of Healthcare Innovation, Implementation, and Policy, and her associates, said intensive lifestyle interventions such as diabetes prevention programs (DPP) could lower the risk of incident diabetes by 58%, but a lack of reach significantly attenuated their population impact in real-world settings.
“Building evidence for online DPP is important because of its potential for increasing reach because most U.S. adults (87%) use the Internet,” they wrote in their paper, published in the American Journal of Preventive Medicine.
They therefore set out to compare weight loss results from 114 veterans taking part in the Veterans Administration’s face-to-face standard-of-care weight management program MOVE! with an online program involving 268 obese or overweight veterans with prediabetes and 273 people taking part in an in-person program.
MOVE! included 8-12 face-to-face healthy-lifestyle sessions and monthly maintenance sessions but with no specified goals. The online program involved virtual groups of participants: live e-coaches who monitored group interactions and provided the participants with feedback via phone and private online messages; weekly educational modules on healthy eating and exercise; and wireless scales to record participant weights.
The in-person program consisted of 8-22 group-based face-to-face sessions focused on 7% weight loss and at least 150 minutes per session of moderate physical activity.
Weight loss, considered by the authors to be a significant predictor of diabetes risk reduction, was recorded at 6 months and then again at 12 months in all three interventions.
An analysis of 242 participants enrolled in the intensive, multifaceted online DPP intervention (26 were excluded because they did not have more than two available weights) revealed a significant weight change of –4.7 kg at 6 months and –4 kg at 12 months’ follow-up. On average, these participants lost 3.7% of their baseline weight at 12 months.
At both times weight change (kg and percentage) was not significantly different between the online intervention and those taking part in the in-person DPP (–4.8 and –4.1 kg for online vs –4 kg and –3.9 kg in-person for those completing more than one module/session). Both groups also had higher weight loss (percentage and kg) at 6 and 12 months compared with MOVE! participants (–1.1kg and 0.10 kg).
The research team noted that the online program had better participation than did the in-person program, with 87% of online participants completing eight or more sessions, compared with 59% for the in-person program and 55% for MOVE!
They suggested this was because the online program had several user-friendly features that increased the frequency of potential “touches” participants received over time.
“Future studies examining how inline DPP intervention components can work together to impact participation and engagement are key,” they said.
“This is one of the first studies to report weight outcomes irrespective of the level of engagement with an online DPP intervention and to examine outcomes compared with in person DPP. Overall, these findings may have important implications for national efforts to disseminate DPP,” they concluded.
The authors conceded that the generalizability of their study was limited as it included veterans receiving care in the VHA.
SOURCE: Am J Prev Med. 2018 Sep 24. doi: 10.1016/j.amepre.2018.06.028
, researchers report.
Writing in background information to their paper, Tannaz Moin, MD, an endocrinologist at the VA Greater Los Angeles Healthcare System and the Veterans Affairs’ Health Services Research and Development Center for the Study of Healthcare Innovation, Implementation, and Policy, and her associates, said intensive lifestyle interventions such as diabetes prevention programs (DPP) could lower the risk of incident diabetes by 58%, but a lack of reach significantly attenuated their population impact in real-world settings.
“Building evidence for online DPP is important because of its potential for increasing reach because most U.S. adults (87%) use the Internet,” they wrote in their paper, published in the American Journal of Preventive Medicine.
They therefore set out to compare weight loss results from 114 veterans taking part in the Veterans Administration’s face-to-face standard-of-care weight management program MOVE! with an online program involving 268 obese or overweight veterans with prediabetes and 273 people taking part in an in-person program.
MOVE! included 8-12 face-to-face healthy-lifestyle sessions and monthly maintenance sessions but with no specified goals. The online program involved virtual groups of participants: live e-coaches who monitored group interactions and provided the participants with feedback via phone and private online messages; weekly educational modules on healthy eating and exercise; and wireless scales to record participant weights.
The in-person program consisted of 8-22 group-based face-to-face sessions focused on 7% weight loss and at least 150 minutes per session of moderate physical activity.
Weight loss, considered by the authors to be a significant predictor of diabetes risk reduction, was recorded at 6 months and then again at 12 months in all three interventions.
An analysis of 242 participants enrolled in the intensive, multifaceted online DPP intervention (26 were excluded because they did not have more than two available weights) revealed a significant weight change of –4.7 kg at 6 months and –4 kg at 12 months’ follow-up. On average, these participants lost 3.7% of their baseline weight at 12 months.
At both times weight change (kg and percentage) was not significantly different between the online intervention and those taking part in the in-person DPP (–4.8 and –4.1 kg for online vs –4 kg and –3.9 kg in-person for those completing more than one module/session). Both groups also had higher weight loss (percentage and kg) at 6 and 12 months compared with MOVE! participants (–1.1kg and 0.10 kg).
The research team noted that the online program had better participation than did the in-person program, with 87% of online participants completing eight or more sessions, compared with 59% for the in-person program and 55% for MOVE!
They suggested this was because the online program had several user-friendly features that increased the frequency of potential “touches” participants received over time.
“Future studies examining how inline DPP intervention components can work together to impact participation and engagement are key,” they said.
“This is one of the first studies to report weight outcomes irrespective of the level of engagement with an online DPP intervention and to examine outcomes compared with in person DPP. Overall, these findings may have important implications for national efforts to disseminate DPP,” they concluded.
The authors conceded that the generalizability of their study was limited as it included veterans receiving care in the VHA.
SOURCE: Am J Prev Med. 2018 Sep 24. doi: 10.1016/j.amepre.2018.06.028
FROM AMERICAN JOURNAL OF PREVENTIVE MEDICINE
Key clinical point: Online diabetes prevention programs (DPP) are as effective as in-person programs in terms of weight loss, and they have a wider reach.
Major finding: Participants enrolled in an intensive, multifaceted online DPP intervention had significant weight change of −4.7 kg at 6 months and −4.0 kg at 12-month follow-up, similar to that of participants enrolled in a face-to face program.
Study details: A large nonrandomized trial and a comparative analysis of individuals from a concurrent trial of two parallel in-person programs.
Disclosures: The Department of Veteran Affairs funded the study. One author reported co-owning shares in Amgen, and another reported receiving personal fees from two pharmaceutical companies.
Source: Am J Prev Med. 2018 Sep 24. doi: 10.1016/j.amepre.2018.06.028.
Apomorphine Reduces Off Time in First Randomized Trial
The drug reduces motor fluctuations in Parkinson’s disease without exacerbating troublesome dyskinesia.
Subcutaneous apomorphine infusion significantly reduces off time in patients with Parkinson’s disease and inadequately controlled motor fluctuations, according to data published in the September issue of Lancet Neurology. The data result from the first randomized controlled trial of apomorphine in this population.
In 1988, an open-label study indicated that apomorphine had antiparkinsonian efficacy equivalent to that of levodopa. Several uncontrolled studies have indicated that it effectively reduces off time, improves dyskinesias, and allows doses of oral levodopa to be decreased.
A Multicenter European Study
Regina Katzenschlager, MD, a neurologist at Danube Hospital in Vienna, and colleagues investigated the safety and efficacy of apomorphine infusion in a randomized, placebo-controlled, double-blind trial. They enrolled patients at 23 European hospitals who had received a diagnosis of Parkinson’s disease more than three years previously and had motor fluctuations that were inadequately controlled. Patients were randomized in equal groups to 3–8-mg/h infusions of apomorphine or saline for approximately 16 h/day. The treatment period lasted for 12 weeks. During the first four weeks, investigators adjusted the dose according to efficacy and tolerability, and the remaining eight weeks were a maintenance period.

Patients completed home diary assessments of motor status and visited the hospital for regular evaluations. The study’s primary end point was the absolute change in off time from baseline to 12 weeks, based on diary assessments. Secondary end points included response to therapy (ie, a reduction in off time of at least two hours from baseline), absolute change in on time without troublesome dyskinesia, Patient Global Impression of Change (PGIC) score, change in levodopa dose, change in motor score, and change in quality of life.
Results Were Consistent in Prespecified Subgroups
A total of 53 patients were randomized to apomorphine, and 54 patients were randomized to placebo. The mean final dose of study drug was 4.68 mg/h in the apomorphine group and 5.76 mg/h in the placebo group.
Mean reduction in off time was significantly greater at week 12 in the apomorphine group (−2.47 h/day) than among controls (−0.58 h/day). The results were consistent in sensitivity analyses. Approximately 62% of patients in the apomorphine group responded to therapy, compared with 29% of controls.
Mean on time without troublesome dyskinesia was significantly increased in the apomorphine group (2.77 h/day), compared with the placebo group (0.80 h/day). Apomorphine also improved PGIC scores significantly at 12 weeks, compared with placebo. Mean reduction in oral levodopa dose was greater in the apomorphine group, but the difference between groups was not statistically significant. Changes in motor score and quality of life were not significantly different between groups at 12 weeks.
The treatment was well tolerated, and the researchers found no unexpected safety signals. The rate of treatment-emergent adverse events was 93% in the apomorphine group and 57% among controls. The most common adverse events were skin reactions, nausea, and somnolence. Six patients had an adverse event that prompted study withdrawal; all were in the apomorphine group. Five patients in the apomorphine group had serious adverse events, including severe hypotension, myocardial infarction, and persistently abnormal hematology test results indicating mild leukopenia and moderate anemia.
“From a practical viewpoint, our study shows that some patients tolerate and receive benefit from doses exceeding the common range of hourly flow rates currently used in practice,” said the authors. “Many centers use higher flow rates than the mean dose in our study, and it is possible that the full potential of apomorphine has not been investigated here.”
How Effective Would Apomorphine Monotherapy Be?
The findings of Dr. Katzenschlager and colleagues “should help guide clinicians in making decisions about management of patients with advanced Parkinson’s disease, particularly when considering use of deep brain stimulation or intestinal infusion of levodopa–carbidopa gel,” said Peter A. LeWitt, MD, Director of the Parkinson’s Disease and Movement Disorder Program at Henry Ford Hospital in West Bloomfield, Michigan, in an accompanying editorial. “In view of its efficacy and safety profile, apomorphine infusion should be considered before embarking on other invasive therapies.”
On average, apomorphine infusion decreased off time by approximately one-third from patients’ baseline levels. “One might ask why the study did not achieve better results,” said Dr. LeWitt. A potential explanation is that impaired brain circuitry in patients with advanced Parkinson’s disease loses its long-term response to levodopa and is associated with dyskinesias and freezing of gait, he added. It also is possible that participants’ medical treatment had not been optimized at baseline.
“Despite a heavy load of levodopa and adjunctive medications (most participants in the study also received dopaminergic agonists, and inhibitors of catechol-O-methyltransferase and monoamine oxidase type B were used liberally), many patients continue to be burdened by substantial daily off time fluctuations,” said Dr. LeWitt. “A final question unanswered by this study is the effectiveness of apomorphine monotherapy, which has been previously tested in only a few studies. Future studies might investigate this question and what benefit, if any, is offered by concomitant levodopa treatment.”
—Erik Greb
Suggested Reading
Katzenschlager R, Poewe W, Rascol O, et al. Apomorphine subcutaneous infusion in patients with Parkinson’s disease with persistent motor fluctuations (TOLEDO): a multicentre, double-blind, randomised, placebo-controlled trial. Lancet Neurol. 2018;17(9):749-759.
LeWitt PA. At last, a randomised controlled trial of apomorphine infusion. Lancet Neurol. 2018;17(9):732-733.
The drug reduces motor fluctuations in Parkinson’s disease without exacerbating troublesome dyskinesia.
The drug reduces motor fluctuations in Parkinson’s disease without exacerbating troublesome dyskinesia.
Subcutaneous apomorphine infusion significantly reduces off time in patients with Parkinson’s disease and inadequately controlled motor fluctuations, according to data published in the September issue of Lancet Neurology. The data result from the first randomized controlled trial of apomorphine in this population.
In 1988, an open-label study indicated that apomorphine had antiparkinsonian efficacy equivalent to that of levodopa. Several uncontrolled studies have indicated that it effectively reduces off time, improves dyskinesias, and allows doses of oral levodopa to be decreased.
A Multicenter European Study
Regina Katzenschlager, MD, a neurologist at Danube Hospital in Vienna, and colleagues investigated the safety and efficacy of apomorphine infusion in a randomized, placebo-controlled, double-blind trial. They enrolled patients at 23 European hospitals who had received a diagnosis of Parkinson’s disease more than three years previously and had motor fluctuations that were inadequately controlled. Patients were randomized in equal groups to 3–8-mg/h infusions of apomorphine or saline for approximately 16 h/day. The treatment period lasted for 12 weeks. During the first four weeks, investigators adjusted the dose according to efficacy and tolerability, and the remaining eight weeks were a maintenance period.
Patients completed home diary assessments of motor status and visited the hospital for regular evaluations. The study’s primary end point was the absolute change in off time from baseline to 12 weeks, based on diary assessments. Secondary end points included response to therapy (ie, a reduction in off time of at least two hours from baseline), absolute change in on time without troublesome dyskinesia, Patient Global Impression of Change (PGIC) score, change in levodopa dose, change in motor score, and change in quality of life.
Results Were Consistent in Prespecified Subgroups
A total of 53 patients were randomized to apomorphine, and 54 patients were randomized to placebo. The mean final dose of study drug was 4.68 mg/h in the apomorphine group and 5.76 mg/h in the placebo group.
Mean reduction in off time was significantly greater at week 12 in the apomorphine group (−2.47 h/day) than among controls (−0.58 h/day). The results were consistent in sensitivity analyses. Approximately 62% of patients in the apomorphine group responded to therapy, compared with 29% of controls.
Mean on time without troublesome dyskinesia was significantly increased in the apomorphine group (2.77 h/day), compared with the placebo group (0.80 h/day). Apomorphine also improved PGIC scores significantly at 12 weeks, compared with placebo. Mean reduction in oral levodopa dose was greater in the apomorphine group, but the difference between groups was not statistically significant. Changes in motor score and quality of life were not significantly different between groups at 12 weeks.
The treatment was well tolerated, and the researchers found no unexpected safety signals. The rate of treatment-emergent adverse events was 93% in the apomorphine group and 57% among controls. The most common adverse events were skin reactions, nausea, and somnolence. Six patients had an adverse event that prompted study withdrawal; all were in the apomorphine group. Five patients in the apomorphine group had serious adverse events, including severe hypotension, myocardial infarction, and persistently abnormal hematology test results indicating mild leukopenia and moderate anemia.
“From a practical viewpoint, our study shows that some patients tolerate and receive benefit from doses exceeding the common range of hourly flow rates currently used in practice,” said the authors. “Many centers use higher flow rates than the mean dose in our study, and it is possible that the full potential of apomorphine has not been investigated here.”
How Effective Would Apomorphine Monotherapy Be?
The findings of Dr. Katzenschlager and colleagues “should help guide clinicians in making decisions about management of patients with advanced Parkinson’s disease, particularly when considering use of deep brain stimulation or intestinal infusion of levodopa–carbidopa gel,” said Peter A. LeWitt, MD, Director of the Parkinson’s Disease and Movement Disorder Program at Henry Ford Hospital in West Bloomfield, Michigan, in an accompanying editorial. “In view of its efficacy and safety profile, apomorphine infusion should be considered before embarking on other invasive therapies.”
On average, apomorphine infusion decreased off time by approximately one-third from patients’ baseline levels. “One might ask why the study did not achieve better results,” said Dr. LeWitt. A potential explanation is that impaired brain circuitry in patients with advanced Parkinson’s disease loses its long-term response to levodopa and is associated with dyskinesias and freezing of gait, he added. It also is possible that participants’ medical treatment had not been optimized at baseline.
“Despite a heavy load of levodopa and adjunctive medications (most participants in the study also received dopaminergic agonists, and inhibitors of catechol-O-methyltransferase and monoamine oxidase type B were used liberally), many patients continue to be burdened by substantial daily off time fluctuations,” said Dr. LeWitt. “A final question unanswered by this study is the effectiveness of apomorphine monotherapy, which has been previously tested in only a few studies. Future studies might investigate this question and what benefit, if any, is offered by concomitant levodopa treatment.”
—Erik Greb
Suggested Reading
Katzenschlager R, Poewe W, Rascol O, et al. Apomorphine subcutaneous infusion in patients with Parkinson’s disease with persistent motor fluctuations (TOLEDO): a multicentre, double-blind, randomised, placebo-controlled trial. Lancet Neurol. 2018;17(9):749-759.
LeWitt PA. At last, a randomised controlled trial of apomorphine infusion. Lancet Neurol. 2018;17(9):732-733.
Subcutaneous apomorphine infusion significantly reduces off time in patients with Parkinson’s disease and inadequately controlled motor fluctuations, according to data published in the September issue of Lancet Neurology. The data result from the first randomized controlled trial of apomorphine in this population.
In 1988, an open-label study indicated that apomorphine had antiparkinsonian efficacy equivalent to that of levodopa. Several uncontrolled studies have indicated that it effectively reduces off time, improves dyskinesias, and allows doses of oral levodopa to be decreased.
A Multicenter European Study
Regina Katzenschlager, MD, a neurologist at Danube Hospital in Vienna, and colleagues investigated the safety and efficacy of apomorphine infusion in a randomized, placebo-controlled, double-blind trial. They enrolled patients at 23 European hospitals who had received a diagnosis of Parkinson’s disease more than three years previously and had motor fluctuations that were inadequately controlled. Patients were randomized in equal groups to 3–8-mg/h infusions of apomorphine or saline for approximately 16 h/day. The treatment period lasted for 12 weeks. During the first four weeks, investigators adjusted the dose according to efficacy and tolerability, and the remaining eight weeks were a maintenance period.
Patients completed home diary assessments of motor status and visited the hospital for regular evaluations. The study’s primary end point was the absolute change in off time from baseline to 12 weeks, based on diary assessments. Secondary end points included response to therapy (ie, a reduction in off time of at least two hours from baseline), absolute change in on time without troublesome dyskinesia, Patient Global Impression of Change (PGIC) score, change in levodopa dose, change in motor score, and change in quality of life.
Results Were Consistent in Prespecified Subgroups
A total of 53 patients were randomized to apomorphine, and 54 patients were randomized to placebo. The mean final dose of study drug was 4.68 mg/h in the apomorphine group and 5.76 mg/h in the placebo group.
Mean reduction in off time was significantly greater at week 12 in the apomorphine group (−2.47 h/day) than among controls (−0.58 h/day). The results were consistent in sensitivity analyses. Approximately 62% of patients in the apomorphine group responded to therapy, compared with 29% of controls.
Mean on time without troublesome dyskinesia was significantly increased in the apomorphine group (2.77 h/day), compared with the placebo group (0.80 h/day). Apomorphine also improved PGIC scores significantly at 12 weeks, compared with placebo. Mean reduction in oral levodopa dose was greater in the apomorphine group, but the difference between groups was not statistically significant. Changes in motor score and quality of life were not significantly different between groups at 12 weeks.
The treatment was well tolerated, and the researchers found no unexpected safety signals. The rate of treatment-emergent adverse events was 93% in the apomorphine group and 57% among controls. The most common adverse events were skin reactions, nausea, and somnolence. Six patients had an adverse event that prompted study withdrawal; all were in the apomorphine group. Five patients in the apomorphine group had serious adverse events, including severe hypotension, myocardial infarction, and persistently abnormal hematology test results indicating mild leukopenia and moderate anemia.
“From a practical viewpoint, our study shows that some patients tolerate and receive benefit from doses exceeding the common range of hourly flow rates currently used in practice,” said the authors. “Many centers use higher flow rates than the mean dose in our study, and it is possible that the full potential of apomorphine has not been investigated here.”
How Effective Would Apomorphine Monotherapy Be?
The findings of Dr. Katzenschlager and colleagues “should help guide clinicians in making decisions about management of patients with advanced Parkinson’s disease, particularly when considering use of deep brain stimulation or intestinal infusion of levodopa–carbidopa gel,” said Peter A. LeWitt, MD, Director of the Parkinson’s Disease and Movement Disorder Program at Henry Ford Hospital in West Bloomfield, Michigan, in an accompanying editorial. “In view of its efficacy and safety profile, apomorphine infusion should be considered before embarking on other invasive therapies.”
On average, apomorphine infusion decreased off time by approximately one-third from patients’ baseline levels. “One might ask why the study did not achieve better results,” said Dr. LeWitt. A potential explanation is that impaired brain circuitry in patients with advanced Parkinson’s disease loses its long-term response to levodopa and is associated with dyskinesias and freezing of gait, he added. It also is possible that participants’ medical treatment had not been optimized at baseline.
“Despite a heavy load of levodopa and adjunctive medications (most participants in the study also received dopaminergic agonists, and inhibitors of catechol-O-methyltransferase and monoamine oxidase type B were used liberally), many patients continue to be burdened by substantial daily off time fluctuations,” said Dr. LeWitt. “A final question unanswered by this study is the effectiveness of apomorphine monotherapy, which has been previously tested in only a few studies. Future studies might investigate this question and what benefit, if any, is offered by concomitant levodopa treatment.”
—Erik Greb
Suggested Reading
Katzenschlager R, Poewe W, Rascol O, et al. Apomorphine subcutaneous infusion in patients with Parkinson’s disease with persistent motor fluctuations (TOLEDO): a multicentre, double-blind, randomised, placebo-controlled trial. Lancet Neurol. 2018;17(9):749-759.
LeWitt PA. At last, a randomised controlled trial of apomorphine infusion. Lancet Neurol. 2018;17(9):732-733.
Fremanezumab May Improve Migraineurs’ Function on Headache-Free Days
The mechanism underlying the benefit observed in the post hoc analyses is unclear.
Fremanezumab increases the number of headache-free days with normal function for patients with episodic or chronic migraine, according to post hoc analyses published online ahead of print August 17 in Neurology. Fremanezumab appears to improve all measures of function in patients with episodic migraine, and some measures in patients with chronic migraine.
“The results should be considered exploratory,” said Juliana VanderPluym, MD, a neurologist at Mayo Clinic in Phoenix, and colleagues. “Further research is needed to confirm these preliminary findings and to understand the factors contributing to perceived functional status on headache-free days.”

Examining Two Phase II Trials
Fremanezumab is a fully humanized monoclonal antibody that binds to calcitonin gene-related peptide (CGRP). Dr. VanderPluym and colleagues analyzed data from randomized, double-blind phase II trials of the therapy for prevention of high-frequency episodic migraine (ie, eight to 14 headache days per month) and chronic migraine. Patients with high-frequency episodic migraine received placebo or monthly subcutaneous fremanezumab injections of 225 mg or 675 mg. Patients with chronic migraine received placebo or an initial 675-mg fremanezumab dose followed by monthly subcutaneous injections of 225 mg or 900 mg. The treatment period was three months.
Participants entered information into an electronic diary daily. Questions about functional performance elicited information about “work/school/household chore performance” and “concentration/mental fatigue.” For the former category, patients recorded their performance as normal, less than 50% impaired, or at least 50% impaired. For the latter category, patients recorded how much time they had spent working more slowly, finding it difficult to concentrate, and feeling tired or drained.
Fremanezumab Improved Concentration
In the high-frequency episodic migraine study, patients who received fremanezumab had a greater increase in headache-free days with normal concentration and normal performance at work, school, and home, compared with controls.
In the study of chronic migraine, the 900-mg dose was associated with consistent improvements in function on headache-free days. Patients with chronic migraine in the 225-mg dose group had increases compared with controls in the number of headache-free days in which they performed household chores normally and had no time with difficulty concentrating. The 225-mg group had minimal changes in the number of headache-free days in which work/study and household chore performance was impaired by 50% or more, as well as in in time with difficulty concentrating, but its results were better than those of controls.
“One could postulate that patients had more headache-free days with normal functional performance simply because they had more headache-free days on fremanezumab,” said Dr. VanderPluym. “With increased headache-free days, patients may have had reduced interictal anxiety and thus reduced avoidance behavior and lifestyle compromise, allowing them to function normally.”
Patients receiving fremanezumab significantly reduced their intake of acute medications, compared with controls. This reduction likely decreased the number of side effects associated with acute medications and could have contributed to better functional performance, said the authors.
A limitation of the analysis is that the assessment of function was not based on standardized questionnaires such as the Headache Impact Test-6 or the Migraine-Specific Quality of Life Questionnaire.
—Erik Greb
Suggested Reading
VanderPluym J, Dodick DW, Lipton RB, et al. Fremanezumab for preventive treatment of migraine: functional status on headache-free days. Neurology. 2018 Aug 17 [Epub ahead of print].
The mechanism underlying the benefit observed in the post hoc analyses is unclear.
The mechanism underlying the benefit observed in the post hoc analyses is unclear.
Fremanezumab increases the number of headache-free days with normal function for patients with episodic or chronic migraine, according to post hoc analyses published online ahead of print August 17 in Neurology. Fremanezumab appears to improve all measures of function in patients with episodic migraine, and some measures in patients with chronic migraine.
“The results should be considered exploratory,” said Juliana VanderPluym, MD, a neurologist at Mayo Clinic in Phoenix, and colleagues. “Further research is needed to confirm these preliminary findings and to understand the factors contributing to perceived functional status on headache-free days.”
Examining Two Phase II Trials
Fremanezumab is a fully humanized monoclonal antibody that binds to calcitonin gene-related peptide (CGRP). Dr. VanderPluym and colleagues analyzed data from randomized, double-blind phase II trials of the therapy for prevention of high-frequency episodic migraine (ie, eight to 14 headache days per month) and chronic migraine. Patients with high-frequency episodic migraine received placebo or monthly subcutaneous fremanezumab injections of 225 mg or 675 mg. Patients with chronic migraine received placebo or an initial 675-mg fremanezumab dose followed by monthly subcutaneous injections of 225 mg or 900 mg. The treatment period was three months.
Participants entered information into an electronic diary daily. Questions about functional performance elicited information about “work/school/household chore performance” and “concentration/mental fatigue.” For the former category, patients recorded their performance as normal, less than 50% impaired, or at least 50% impaired. For the latter category, patients recorded how much time they had spent working more slowly, finding it difficult to concentrate, and feeling tired or drained.
Fremanezumab Improved Concentration
In the high-frequency episodic migraine study, patients who received fremanezumab had a greater increase in headache-free days with normal concentration and normal performance at work, school, and home, compared with controls.
In the study of chronic migraine, the 900-mg dose was associated with consistent improvements in function on headache-free days. Patients with chronic migraine in the 225-mg dose group had increases compared with controls in the number of headache-free days in which they performed household chores normally and had no time with difficulty concentrating. The 225-mg group had minimal changes in the number of headache-free days in which work/study and household chore performance was impaired by 50% or more, as well as in in time with difficulty concentrating, but its results were better than those of controls.
“One could postulate that patients had more headache-free days with normal functional performance simply because they had more headache-free days on fremanezumab,” said Dr. VanderPluym. “With increased headache-free days, patients may have had reduced interictal anxiety and thus reduced avoidance behavior and lifestyle compromise, allowing them to function normally.”
Patients receiving fremanezumab significantly reduced their intake of acute medications, compared with controls. This reduction likely decreased the number of side effects associated with acute medications and could have contributed to better functional performance, said the authors.
A limitation of the analysis is that the assessment of function was not based on standardized questionnaires such as the Headache Impact Test-6 or the Migraine-Specific Quality of Life Questionnaire.
—Erik Greb
Suggested Reading
VanderPluym J, Dodick DW, Lipton RB, et al. Fremanezumab for preventive treatment of migraine: functional status on headache-free days. Neurology. 2018 Aug 17 [Epub ahead of print].
Fremanezumab increases the number of headache-free days with normal function for patients with episodic or chronic migraine, according to post hoc analyses published online ahead of print August 17 in Neurology. Fremanezumab appears to improve all measures of function in patients with episodic migraine, and some measures in patients with chronic migraine.
“The results should be considered exploratory,” said Juliana VanderPluym, MD, a neurologist at Mayo Clinic in Phoenix, and colleagues. “Further research is needed to confirm these preliminary findings and to understand the factors contributing to perceived functional status on headache-free days.”
Examining Two Phase II Trials
Fremanezumab is a fully humanized monoclonal antibody that binds to calcitonin gene-related peptide (CGRP). Dr. VanderPluym and colleagues analyzed data from randomized, double-blind phase II trials of the therapy for prevention of high-frequency episodic migraine (ie, eight to 14 headache days per month) and chronic migraine. Patients with high-frequency episodic migraine received placebo or monthly subcutaneous fremanezumab injections of 225 mg or 675 mg. Patients with chronic migraine received placebo or an initial 675-mg fremanezumab dose followed by monthly subcutaneous injections of 225 mg or 900 mg. The treatment period was three months.
Participants entered information into an electronic diary daily. Questions about functional performance elicited information about “work/school/household chore performance” and “concentration/mental fatigue.” For the former category, patients recorded their performance as normal, less than 50% impaired, or at least 50% impaired. For the latter category, patients recorded how much time they had spent working more slowly, finding it difficult to concentrate, and feeling tired or drained.
Fremanezumab Improved Concentration
In the high-frequency episodic migraine study, patients who received fremanezumab had a greater increase in headache-free days with normal concentration and normal performance at work, school, and home, compared with controls.
In the study of chronic migraine, the 900-mg dose was associated with consistent improvements in function on headache-free days. Patients with chronic migraine in the 225-mg dose group had increases compared with controls in the number of headache-free days in which they performed household chores normally and had no time with difficulty concentrating. The 225-mg group had minimal changes in the number of headache-free days in which work/study and household chore performance was impaired by 50% or more, as well as in in time with difficulty concentrating, but its results were better than those of controls.
“One could postulate that patients had more headache-free days with normal functional performance simply because they had more headache-free days on fremanezumab,” said Dr. VanderPluym. “With increased headache-free days, patients may have had reduced interictal anxiety and thus reduced avoidance behavior and lifestyle compromise, allowing them to function normally.”
Patients receiving fremanezumab significantly reduced their intake of acute medications, compared with controls. This reduction likely decreased the number of side effects associated with acute medications and could have contributed to better functional performance, said the authors.
A limitation of the analysis is that the assessment of function was not based on standardized questionnaires such as the Headache Impact Test-6 or the Migraine-Specific Quality of Life Questionnaire.
—Erik Greb
Suggested Reading
VanderPluym J, Dodick DW, Lipton RB, et al. Fremanezumab for preventive treatment of migraine: functional status on headache-free days. Neurology. 2018 Aug 17 [Epub ahead of print].