User login
Minimally invasive screening for Barrett’s esophagus offers cost-effective alternative
The high costs of endoscopy make screening patients with gastroesophageal reflux disease (GERD) for Barrett’s esophagus a costly endeavor. But using a minimally invasive test followed by endoscopy only if results are positive could cut costs by up to 41%, according to investigators.
The report is in the September issue of Clinical Gastroenterology and Hepatology (doi: 10.1016/j.cgh.2017.02.017).
The findings mirror those from a prior study (Gastroenterology. 2013 Jan;144[1]:62-73.e60) of the new cytosponge device, which tests surface esophageal tissue for trefoil factor 3, a biomarker for Barrett’s esophagus, said Curtis R. Heberle, of Massachusetts General Hospital in Boston, and his associates. In addition, two separate models found the cytosponge strategy cost effective compared with no screening (incremental cost-effectiveness ratios [ICERs], about $26,000-$33,000). However, using the cytosponge instead of screening all GERD patients with endoscopy would reduce quality-adjusted life-years (QALYs) by about 1.8-5.5 years for every 1,000 patients.
Rates of esophageal adenocarcinoma have climbed more than sixfold in the United States in 4 decades, and 5-year survival rates remain below 20%. Nonetheless, the high cost of endoscopy and 10%-20% prevalence of GERD makes screening all patients for Barrett’s esophagus infeasible. To evaluate the cytosponge strategy, the researchers fit data from the multicenter BEST2 study (PLoS Med. 2015 Jan; 12[1]: e1001780) into two validated models calibrated to high-quality Surveillance, Epidemiology and End Results (SEER) data on esophageal cancer. Both models compared no screening with a one-time screen by either endoscopy alone or cytosponge with follow-up endoscopy in the event of a positive test. The models assumed patients were male, were 60 years old, and had GERD but not esophageal adenocarcinoma.
Without screening, there were about 14-16 cancer cases and about 15,077 quality-adjusted life years (QALYs) for every 1,000 patients. The cytosponge strategy was associated with about 8-13 cancer cases and about 15,105 QALYs. Endoscopic screening produced the most benefit overall – only about 7-12 cancer cases, with more than 15,100 QALYs. “However, greater benefits were accompanied by higher total costs,” the researchers said. For every 1,000 patients, no screening cost about $704,000 to $762,000, the cytosponge strategy cost about $1.5 to $1.6 million, and population-wide endoscopy cost about $2.1 to $2.2 million. Thus, the cytosponge method would lower the cost of screening by 37%-41% compared with endoscopically screening all men with GERD. The cytosponge was also cost effective in a model of 60-year-old women with GERD.
Using only endoscopic screening was not cost effective in either model, exceeding a $100,000 threshold of willingness to pay by anywhere from $107,000 to $330,000. The cytosponge is not yet available commercially, but the investigators assumed it cost $182 based on information from the manufacturer (Medtronic) and Medicare payments for similar devices. Although the findings withstood variations in indirect costs and age at initial screening, they were “somewhat sensitive” to variations in costs of the cytosponge and its presumed sensitivity and specificity in clinical settings. However, endoscopic screening only became cost effective when the cytosponge test cost at least $225.
The models assumed perfect adherence to screening, which probably exaggerated the effectiveness of the cytosponge and endoscopic screening, the investigators said. They noted that cytosponge screening can be performed without sedation during a short outpatient visit.
The National Institutes of Health provided funding. The investigators had no relevant disclosures.
FROM CLINICAL GASTROENTEROLOGY AND HEPATOLOGY
Key clinical point: Using a minimally invasive screen for Barrett’s esophagus and following up with endoscopy if results are positive is a cost-effective alternative to endoscopy alone in patients with gastroesophageal reflux disease.
Major finding: The two-step screening strategy cut screening costs by 37%-41% but was associated with 1.8-5.5 fewer quality-adjusted life years for every 1,000 patients with GERD.
Data source: Two validated models based on Surveillance, Epidemiology, and End Results data, and data from the multicenter BEST2 trial.
Disclosures: The National Institutes of Health provided funding. The investigators had no relevant disclosures.
Ex Vivo Confocal Microscopy: A Diagnostic Tool for Skin Malignancies
Skin cancer is diagnosed in approximately 5.4 million individuals annually in the United States, more than the total number of breast, lung, colon, and prostate cancers diagnosed per year.1 It is estimated that 1 in 5 Americans will develop skin cancer during their lifetime.2 The 2 most common forms of skin cancer are basal cell carcinoma (BCC) and squamous cell carcinoma (SCC), accounting for 4 million and 1 million cases diagnosed each year, respectively.3 With the increasing incidence of these skin cancers, the use of noninvasive imaging tools for detection and diagnosis has grown.
Ex vivo confocal microscopy is a diagnostic imaging tool that can be used in real-time at the bedside to assess freshly excised tissue for malignancies. It images tissue samples with cellular resolution and within minutes of biopsy or excision. Ex vivo confocal microscopy is a versatile tool that can assist in the diagnosis and management of skin malignancies such as melanoma, BCC, and SCC.
Reflectance vs Fluorescence Mode
Excised lesions can be examined in reflectance or fluorescence mode in great detail but with slightly varying nuclear-to-dermis contrasts depending on the chromophore that is targeted. In reflectance mode (reflectance confocal microscopy [RCM]), melanin and keratin act as endogenous chromophores because of their high refractive index relative to water,4,5 which allows for the visualization of cellular structures of the skin at low power, as well as microscopic substructures such as melanosomes, cytoplasmic granules, and other cellular organelles at high power. Although an exogenous contrast agent is not required, acetic acid has the capability to highlight nuclei, enhancing the tumor cell-to-dermis contrast in RCM.6 Acetic acid is clinically used as a predictor for certain skin and mucosal membrane neoplasms that blanch when exposed to the solution. In the case of RCM, acetic acid increases the visibility of nuclei by inducing the compaction of chromatin. For the acetowhitening to be effective, the sample must be soaked in the solution for a specific amount of time, depending on the concentration.7 A concentration between 1% and 10% can be used, but the less concentrated the solution, the longer the time of soaking that is required to achieve sufficiently bright nuclei.6
The contrast with acetic acid, however, is quite weak when the tissue is imaged en face, or along the horizontal surface of the sample, due to the collagen in the dermal layer, which has a high reflectance index. This issue is rectified when using the confocal microscope in the fluorescence mode with an exogenous fluorescent dye as a nuclear stain. Fluorescence confocal microscopy (FCM), results in a stronger nuclear-to-dermal contrast because of the role of contrast agents.8 The 1000-fold increase in contrast between nuclei and dermis is the result of dye agents that preferentially bind to nuclear DNA, of which acridine orange is the most commonly used.5,8 Basal cell carcinoma and SCC tumor cells can be visualized with FCM because they appear hyperfluorescent when stained with acridine orange.9 The acridine orange–stained cells display bright nuclei, while the cytoplasm and collagen remains dark. A positive feature of acridine orange is that it does not alter the tissue sample during freezing or formalin fixation and thus has no effect on subsequent histopathology that may need to be performed on the sample.10
High-Resolution Images Aid in Diagnosis
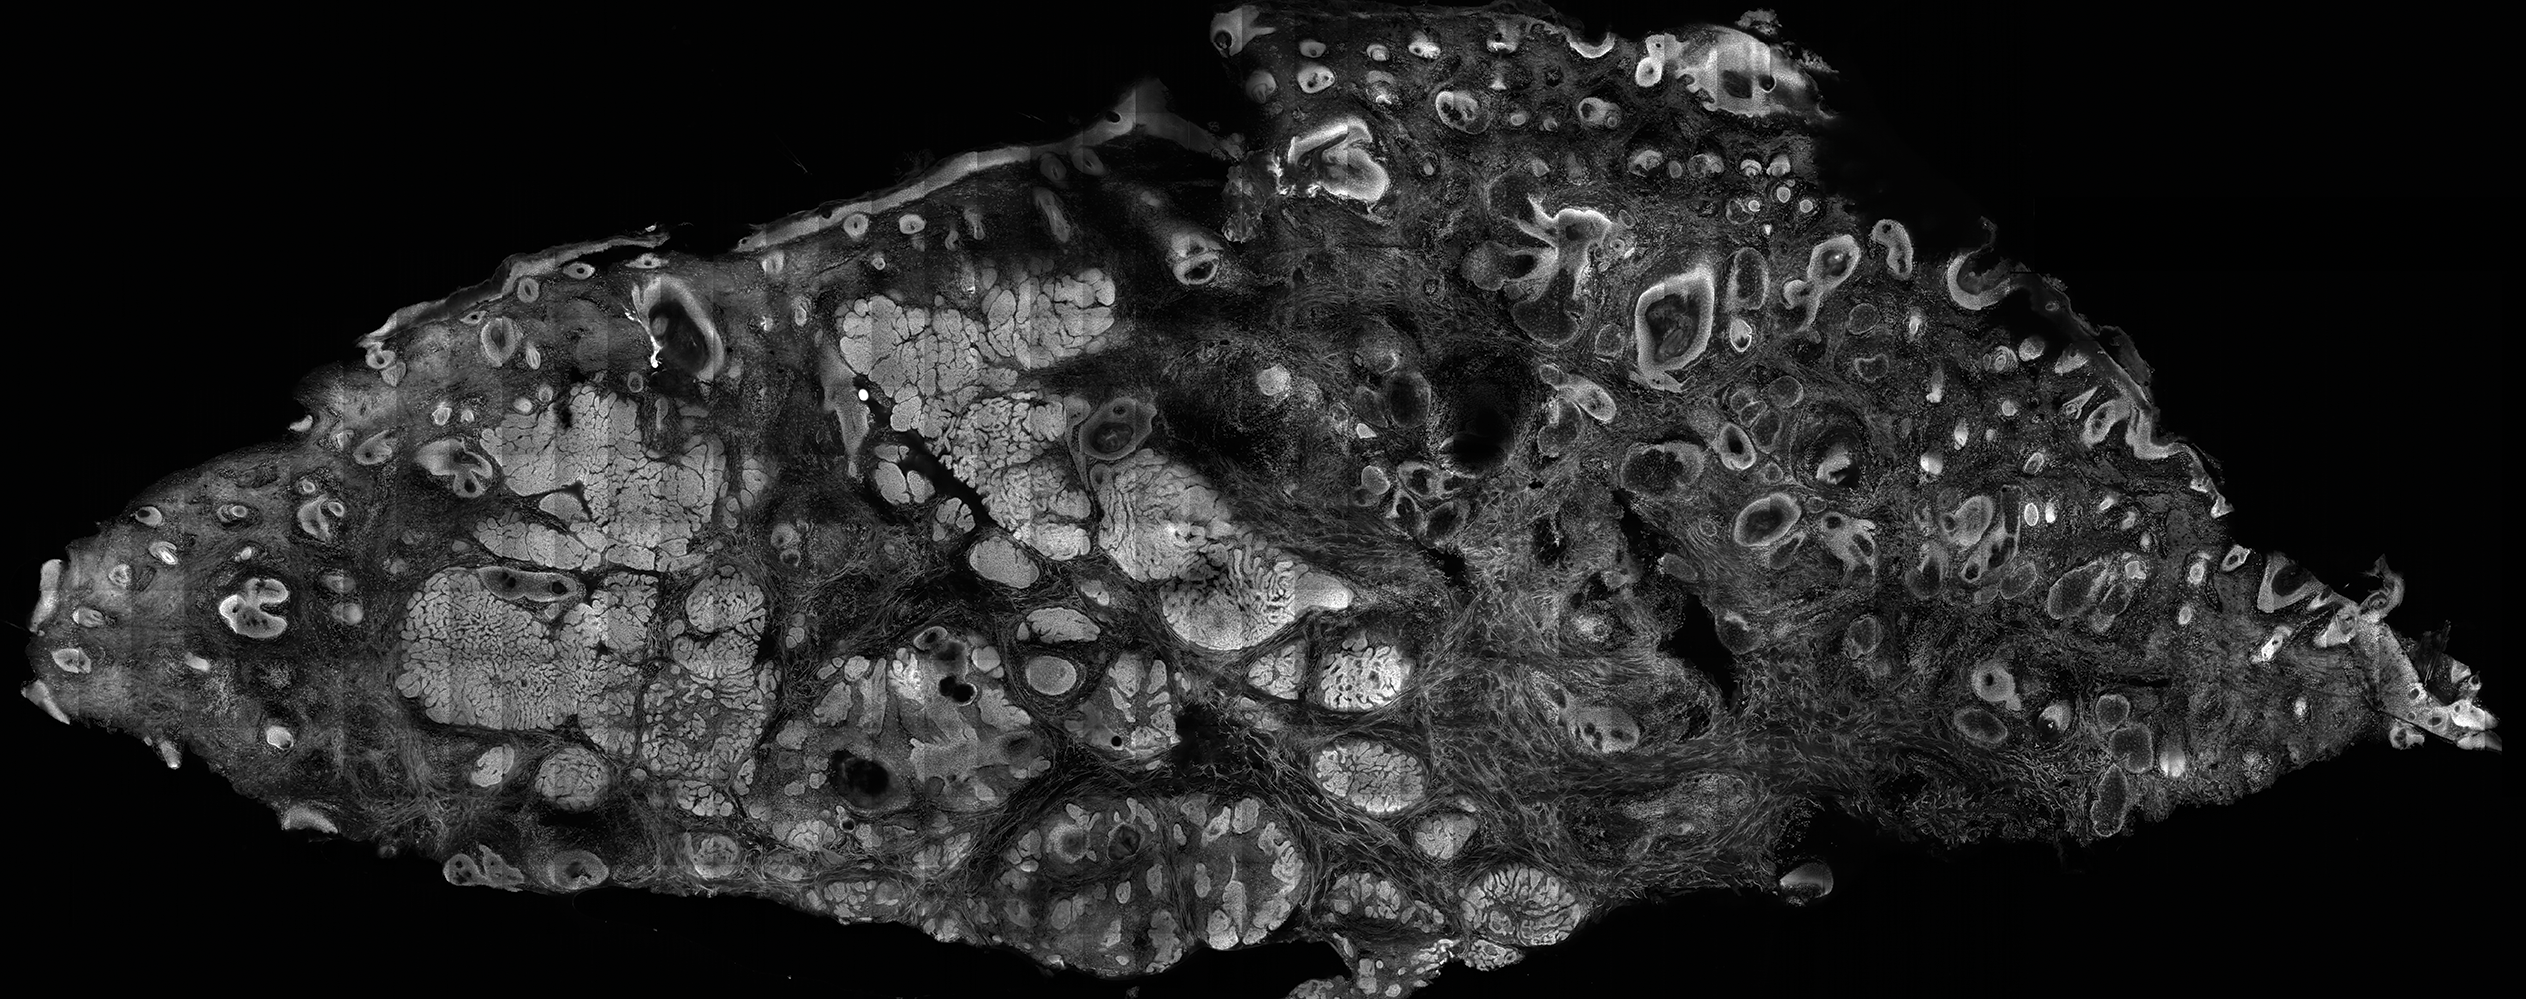
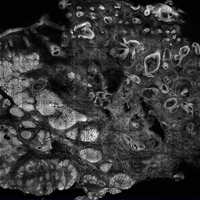
After it is harvested, the tissue sample is soaked in a contrast agent or dye, if needed, depending on the confocal mode to be used. The confocal microscope is then used to take a series of high-resolution individual en face images that are then stitched together to create a final mosaic image that can be up to 12×12 mm.6,11 With a 200-µm depth visibility, confocal microscopy can capture the cellular structures in the epidermis, dermis, and (if compressed enough) subcutaneous fat in just under 3 minutes.12
The images produced through confocal microscopy have an excellent correlation to frozen histological sections and can aid in the diagnosis of many epidermal and dermal malignancies including melanoma, BCC, and SCC. New criteria have been established to aid in the interpretation of the confocal images and identify some of the more common skin cancers.5,12,13 Basal cell carcinoma samples imaged through fluorescence and reflectance in low-power mode display the distinct nodular patterns with well-demarcated edges, as seen on classical histopathology. In the case of FCM, the cells that make up the tumor display hyperfluorescent areas consistent with nucleated cells that are stained with acridine orange. The main features that identify BCC on FCM images include nuclear pleomorphism and crowding, peripheral palisading, clefting of the basaloid islands, increased nucleus-to-cytoplasm ratio, and the presence of a modified dermis surrounding the mass known as the tumoral stroma5,12 (Figure).
In addition to fluorescence and a well-defined tumor silhouette, SCC under FCM displays keratin pearls composed of keratinized squames, nuclear pleomorphism, and fluorescent scales in the stratum corneum that are a result of keratin formation.5,13 The extent of differentiation of the SCC lesion also can be determined by assessing if the silhouette is well defined. A well-defined tumor silhouette is consistent with the diagnosis of a well-differentiated SCC, and vice versa.13 Ex vivo RCM also has been shown to be useful in diagnosing malignant melanomas, with melanin acting as an endogenous chromophore. Some of the features seen on imaging include a disarranged epithelium, hyperreflective roundish and dendritic pagetoid cells, and large hyperreflective polymorphic cells in the superficial chorion.14
Comparison to Conventional Histopathology
Ex vivo confocal microscopy in both the reflectance and fluorescence mode has been shown to perform well compared to conventional histopathology in the diagnosis of biopsy specimens. Ex vivo FCM has been shown to have an overall sensitivity of 88% and specificity of 99% in detecting residual BCC at the margins of excised tissue samples and in the fraction of the time it takes to attain similar results with frozen histopathology.9 Ex vivo RCM has been shown to have a higher prognostic capability, with 100% sensitivity and specificity in identifying BCC when scanning the tissue samples en face.15
Qualitatively, the images produced by RCM and FCM are similar to histopathology in overall architecture. Both techniques enhance the contrast between the epithelium and stroma and create images that can be examined in low as well as high resolution. A substantial difference between confocal microscopy and conventional hematoxylin and eosin–stained histopathology is that the confocal microscope produces images in gray scale. One way to alter the black-and-white images to resemble hematoxylin and eosin–stained slides is through the use of digital staining,16 which could boost clinical acceptance by physicians who are accustomed to the classical pink-purple appearance of pathology slides and could potentially limit the learning curve needed to read the confocal images.
Application in Mohs Micrographic Surgery
An important clinical application of ex vivo FCM imaging that has emerged is the detection of malignant cells at the excision margins during Mohs micrographic surgery. The use of confocal microscopy has the potential to save time by eliminating the need for tissue fixation while still providing good diagnostic accuracy. Implementing FCM as an imaging tool to guide surgical excisions could provide rapid diagnosis of the tissue, expediting excisions and reconstruction or the Mohs procedure while eliminating patient wait time and the need for frozen histopathology. Ex vivo RCM also has been used to establish laser parameters for CO2 laser ablation of superficial and early nodular BCC lesions.17 Other potential uses for ex vivo RCM/FCM could include rapid evaluation of tissue during operating room procedures where rapid frozen sections are currently utilized.
Combining In Vivo and Ex Vivo Confocal Microscopy
Many of the diagnostic guidelines created with the use of ex vivo confocal microscopy have been applied to in vivo use, and therefore the use of both modalities is appealing. In vivo confocal microscopy is a noninvasive technique that has been used to map margins of skin tumors such as BCC and lentigo maligna at the bedside.5 It also has been shown to help plan both surgical and nonsurgical treatment modalities and reconstruction before the tumor is excised.18 This technique also can help the patient understand the extent of the excision and any subsequent reconstruction that may be needed.
Limitations
Ex vivo confocal microscopy used as a diagnostic tool does have some limitations. Its novelty may require surgeons and pathologists to be trained to interpret the images properly and correlate them to conventional diagnostic guidelines. The imaging also is limited to a depth of approximately 200 µm; however, the sample may be flipped so that the underside can be imaged as well, which increases the depth to approximately 400 µm. The tissue being imaged must be fixed flat, which may alter its shape. Complex tissue samples may be difficult to flatten out completely and therefore may be difficult to image. A special mount may be required for the sample to be fixed in a proper position for imaging.6
Final Thoughts
Despite some of these limitations, the need for rapid bedside tissue diagnosis makes ex vivo confocal microscopy an attractive device that can be used as an additional diagnostic tool to histopathology and also has been tested in other disciplines, such as breast cancer pathology. In the future, both in vivo and ex vivo confocal microscopy may be utilized to diagnose cutaneous malignancies, guide surgical excisions, and detect lesion progression, and it may become a basis for rapid diagnosis and detection.19
- Siegel RL, Miller KD, Jemal A. Cancer statistics, 2016 [published online January 7, 2016]. CA Cancer J Clin. 2016;66:7-30.
- Robinson JK. Sun exposure, sun protection, and vitamin D. JAMA. 2005;294:1541-1543.
- Rogers HW, Weinstock MA, Feldman SR, et al. Incidence estimate of nonmelanoma skin cancer (keratinocyte carcinomas) in the US population, 2012. JAMA Dermatol. 2015;151:1081-1086.
- Welzel J, Kästle R, Sattler EC. Fluorescence (multiwave) confocal microscopy. Dermatol Clin. 2016;34:527-533.
- Longo C, Ragazzi M, Rajadhyaksha M, et al. In vivo and ex vivo confocal microscopy for dermatologic and Mohs surgeons. Dermatol Clin. 2016;34:497-504.
- Patel YG, Nehal KS, Aranda I, et al. Confocal reflectance mosaicing of basal cell carcinomas in Mohs surgical skin excisions. J Biomed Opt. 2007;12:034027.
- Rajadhyaksha M, Gonzalez S, Zavislan JM. Detectability of contrast agents for confocal reflectance imaging of skin and microcirculation. J Biomed Opt. 2004;9:323-331.
- Karen JK, Gareau DS, Dusza SW, et al. Detection of basal cell carcinomas in Mohs excisions with fluorescence confocal mosaicing microscopy. Br J Dermatol. 2009;160:1242-1250.
- Bennàssar A, Vilata A, Puig S, et al. Ex vivo fluorescence confocal microscopy for fast evaluation of tumour margins during Mohs surgery. Br J Dermatol. 2014;170:360-365.
- Gareau DS, Li Y, Huang B, et al. Confocal mosaicing microscopy in Mohs skin excisions: feasibility of rapid surgical pathology. J Biomed Opt. 2008;13:054001.
- Bini J, Spain J, Nehal K, et al. Confocal mosaicing microscopy of human skin ex vivo: spectral analysis for digital staining to simulate histology-like appearance. J Biomed Opt. 2011;16:076008.
- Bennàssar A, Carrera C, Puig S, et al. Fast evaluation of 69 basal cell carcinomas with ex vivo fluorescence confocal microscopy: criteria description, histopathological correlation, and interobserver agreement. JAMA Dermatol. 2013;149:839-847.
- Longo C, Ragazzi M, Gardini S, et al. Ex vivo fluorescence confocal microscopy in conjunction with Mohs micrographic surgery for cutaneous squamous cell carcinoma. J Am Acad Dermatol. 2015;73:321-322.
- Cinotti E, Haouas M, Grivet D, et al. In vivo and ex vivo confocal microscopy for the management of a melanoma of the eyelid margin. Dermatol Surg. 2015;41:1437-1440.
- , , , ‘En face’ ex vivo reflectance confocal microscopy to help the surgery of basal cell carcinoma of the eyelid [published online December 19, 2016]. Clin Exp Ophthalmol. doi:10.1111/ceo.12904.
- Gareau DS, Jeon H, Nehal KS, et al. Rapid screening of cancer margins in tissue with multimodal confocal microscopy. J Surg Res. 2012;178:533-538.
- Sierra H, Damanpour S, Hibler B, et al. Confocal imaging of carbon dioxide laser-ablated basal cell carcinomas: an ex-vivo study on the uptake of contrast agent and ablation parameters [published online September 22, 2015]. Lasers Surg Med. 2016;48:133-139.
- Hibler BP, Yélamos O, Cordova M, et al. Handheld reflectance confocal microscopy to aid in the management of complex facial lentigo maligna. Cutis. 2017;99:346-352.
- Rajadhyaksha M, Marghoob A, Rossi A, et al. Reflectance confocal microscopy of skin in vivo: from bench to bedside. Lasers Surg Med. 2017;49:7-19.
Skin cancer is diagnosed in approximately 5.4 million individuals annually in the United States, more than the total number of breast, lung, colon, and prostate cancers diagnosed per year.1 It is estimated that 1 in 5 Americans will develop skin cancer during their lifetime.2 The 2 most common forms of skin cancer are basal cell carcinoma (BCC) and squamous cell carcinoma (SCC), accounting for 4 million and 1 million cases diagnosed each year, respectively.3 With the increasing incidence of these skin cancers, the use of noninvasive imaging tools for detection and diagnosis has grown.
Ex vivo confocal microscopy is a diagnostic imaging tool that can be used in real-time at the bedside to assess freshly excised tissue for malignancies. It images tissue samples with cellular resolution and within minutes of biopsy or excision. Ex vivo confocal microscopy is a versatile tool that can assist in the diagnosis and management of skin malignancies such as melanoma, BCC, and SCC.
Reflectance vs Fluorescence Mode
Excised lesions can be examined in reflectance or fluorescence mode in great detail but with slightly varying nuclear-to-dermis contrasts depending on the chromophore that is targeted. In reflectance mode (reflectance confocal microscopy [RCM]), melanin and keratin act as endogenous chromophores because of their high refractive index relative to water,4,5 which allows for the visualization of cellular structures of the skin at low power, as well as microscopic substructures such as melanosomes, cytoplasmic granules, and other cellular organelles at high power. Although an exogenous contrast agent is not required, acetic acid has the capability to highlight nuclei, enhancing the tumor cell-to-dermis contrast in RCM.6 Acetic acid is clinically used as a predictor for certain skin and mucosal membrane neoplasms that blanch when exposed to the solution. In the case of RCM, acetic acid increases the visibility of nuclei by inducing the compaction of chromatin. For the acetowhitening to be effective, the sample must be soaked in the solution for a specific amount of time, depending on the concentration.7 A concentration between 1% and 10% can be used, but the less concentrated the solution, the longer the time of soaking that is required to achieve sufficiently bright nuclei.6
The contrast with acetic acid, however, is quite weak when the tissue is imaged en face, or along the horizontal surface of the sample, due to the collagen in the dermal layer, which has a high reflectance index. This issue is rectified when using the confocal microscope in the fluorescence mode with an exogenous fluorescent dye as a nuclear stain. Fluorescence confocal microscopy (FCM), results in a stronger nuclear-to-dermal contrast because of the role of contrast agents.8 The 1000-fold increase in contrast between nuclei and dermis is the result of dye agents that preferentially bind to nuclear DNA, of which acridine orange is the most commonly used.5,8 Basal cell carcinoma and SCC tumor cells can be visualized with FCM because they appear hyperfluorescent when stained with acridine orange.9 The acridine orange–stained cells display bright nuclei, while the cytoplasm and collagen remains dark. A positive feature of acridine orange is that it does not alter the tissue sample during freezing or formalin fixation and thus has no effect on subsequent histopathology that may need to be performed on the sample.10
High-Resolution Images Aid in Diagnosis
After it is harvested, the tissue sample is soaked in a contrast agent or dye, if needed, depending on the confocal mode to be used. The confocal microscope is then used to take a series of high-resolution individual en face images that are then stitched together to create a final mosaic image that can be up to 12×12 mm.6,11 With a 200-µm depth visibility, confocal microscopy can capture the cellular structures in the epidermis, dermis, and (if compressed enough) subcutaneous fat in just under 3 minutes.12
The images produced through confocal microscopy have an excellent correlation to frozen histological sections and can aid in the diagnosis of many epidermal and dermal malignancies including melanoma, BCC, and SCC. New criteria have been established to aid in the interpretation of the confocal images and identify some of the more common skin cancers.5,12,13 Basal cell carcinoma samples imaged through fluorescence and reflectance in low-power mode display the distinct nodular patterns with well-demarcated edges, as seen on classical histopathology. In the case of FCM, the cells that make up the tumor display hyperfluorescent areas consistent with nucleated cells that are stained with acridine orange. The main features that identify BCC on FCM images include nuclear pleomorphism and crowding, peripheral palisading, clefting of the basaloid islands, increased nucleus-to-cytoplasm ratio, and the presence of a modified dermis surrounding the mass known as the tumoral stroma5,12 (Figure).
In addition to fluorescence and a well-defined tumor silhouette, SCC under FCM displays keratin pearls composed of keratinized squames, nuclear pleomorphism, and fluorescent scales in the stratum corneum that are a result of keratin formation.5,13 The extent of differentiation of the SCC lesion also can be determined by assessing if the silhouette is well defined. A well-defined tumor silhouette is consistent with the diagnosis of a well-differentiated SCC, and vice versa.13 Ex vivo RCM also has been shown to be useful in diagnosing malignant melanomas, with melanin acting as an endogenous chromophore. Some of the features seen on imaging include a disarranged epithelium, hyperreflective roundish and dendritic pagetoid cells, and large hyperreflective polymorphic cells in the superficial chorion.14
Comparison to Conventional Histopathology
Ex vivo confocal microscopy in both the reflectance and fluorescence mode has been shown to perform well compared to conventional histopathology in the diagnosis of biopsy specimens. Ex vivo FCM has been shown to have an overall sensitivity of 88% and specificity of 99% in detecting residual BCC at the margins of excised tissue samples and in the fraction of the time it takes to attain similar results with frozen histopathology.9 Ex vivo RCM has been shown to have a higher prognostic capability, with 100% sensitivity and specificity in identifying BCC when scanning the tissue samples en face.15
Qualitatively, the images produced by RCM and FCM are similar to histopathology in overall architecture. Both techniques enhance the contrast between the epithelium and stroma and create images that can be examined in low as well as high resolution. A substantial difference between confocal microscopy and conventional hematoxylin and eosin–stained histopathology is that the confocal microscope produces images in gray scale. One way to alter the black-and-white images to resemble hematoxylin and eosin–stained slides is through the use of digital staining,16 which could boost clinical acceptance by physicians who are accustomed to the classical pink-purple appearance of pathology slides and could potentially limit the learning curve needed to read the confocal images.
Application in Mohs Micrographic Surgery
An important clinical application of ex vivo FCM imaging that has emerged is the detection of malignant cells at the excision margins during Mohs micrographic surgery. The use of confocal microscopy has the potential to save time by eliminating the need for tissue fixation while still providing good diagnostic accuracy. Implementing FCM as an imaging tool to guide surgical excisions could provide rapid diagnosis of the tissue, expediting excisions and reconstruction or the Mohs procedure while eliminating patient wait time and the need for frozen histopathology. Ex vivo RCM also has been used to establish laser parameters for CO2 laser ablation of superficial and early nodular BCC lesions.17 Other potential uses for ex vivo RCM/FCM could include rapid evaluation of tissue during operating room procedures where rapid frozen sections are currently utilized.
Combining In Vivo and Ex Vivo Confocal Microscopy
Many of the diagnostic guidelines created with the use of ex vivo confocal microscopy have been applied to in vivo use, and therefore the use of both modalities is appealing. In vivo confocal microscopy is a noninvasive technique that has been used to map margins of skin tumors such as BCC and lentigo maligna at the bedside.5 It also has been shown to help plan both surgical and nonsurgical treatment modalities and reconstruction before the tumor is excised.18 This technique also can help the patient understand the extent of the excision and any subsequent reconstruction that may be needed.
Limitations
Ex vivo confocal microscopy used as a diagnostic tool does have some limitations. Its novelty may require surgeons and pathologists to be trained to interpret the images properly and correlate them to conventional diagnostic guidelines. The imaging also is limited to a depth of approximately 200 µm; however, the sample may be flipped so that the underside can be imaged as well, which increases the depth to approximately 400 µm. The tissue being imaged must be fixed flat, which may alter its shape. Complex tissue samples may be difficult to flatten out completely and therefore may be difficult to image. A special mount may be required for the sample to be fixed in a proper position for imaging.6
Final Thoughts
Despite some of these limitations, the need for rapid bedside tissue diagnosis makes ex vivo confocal microscopy an attractive device that can be used as an additional diagnostic tool to histopathology and also has been tested in other disciplines, such as breast cancer pathology. In the future, both in vivo and ex vivo confocal microscopy may be utilized to diagnose cutaneous malignancies, guide surgical excisions, and detect lesion progression, and it may become a basis for rapid diagnosis and detection.19
- Siegel RL, Miller KD, Jemal A. Cancer statistics, 2016 [published online January 7, 2016]. CA Cancer J Clin. 2016;66:7-30.
- Robinson JK. Sun exposure, sun protection, and vitamin D. JAMA. 2005;294:1541-1543.
- Rogers HW, Weinstock MA, Feldman SR, et al. Incidence estimate of nonmelanoma skin cancer (keratinocyte carcinomas) in the US population, 2012. JAMA Dermatol. 2015;151:1081-1086.
- Welzel J, Kästle R, Sattler EC. Fluorescence (multiwave) confocal microscopy. Dermatol Clin. 2016;34:527-533.
- Longo C, Ragazzi M, Rajadhyaksha M, et al. In vivo and ex vivo confocal microscopy for dermatologic and Mohs surgeons. Dermatol Clin. 2016;34:497-504.
- Patel YG, Nehal KS, Aranda I, et al. Confocal reflectance mosaicing of basal cell carcinomas in Mohs surgical skin excisions. J Biomed Opt. 2007;12:034027.
- Rajadhyaksha M, Gonzalez S, Zavislan JM. Detectability of contrast agents for confocal reflectance imaging of skin and microcirculation. J Biomed Opt. 2004;9:323-331.
- Karen JK, Gareau DS, Dusza SW, et al. Detection of basal cell carcinomas in Mohs excisions with fluorescence confocal mosaicing microscopy. Br J Dermatol. 2009;160:1242-1250.
- Bennàssar A, Vilata A, Puig S, et al. Ex vivo fluorescence confocal microscopy for fast evaluation of tumour margins during Mohs surgery. Br J Dermatol. 2014;170:360-365.
- Gareau DS, Li Y, Huang B, et al. Confocal mosaicing microscopy in Mohs skin excisions: feasibility of rapid surgical pathology. J Biomed Opt. 2008;13:054001.
- Bini J, Spain J, Nehal K, et al. Confocal mosaicing microscopy of human skin ex vivo: spectral analysis for digital staining to simulate histology-like appearance. J Biomed Opt. 2011;16:076008.
- Bennàssar A, Carrera C, Puig S, et al. Fast evaluation of 69 basal cell carcinomas with ex vivo fluorescence confocal microscopy: criteria description, histopathological correlation, and interobserver agreement. JAMA Dermatol. 2013;149:839-847.
- Longo C, Ragazzi M, Gardini S, et al. Ex vivo fluorescence confocal microscopy in conjunction with Mohs micrographic surgery for cutaneous squamous cell carcinoma. J Am Acad Dermatol. 2015;73:321-322.
- Cinotti E, Haouas M, Grivet D, et al. In vivo and ex vivo confocal microscopy for the management of a melanoma of the eyelid margin. Dermatol Surg. 2015;41:1437-1440.
- , , , ‘En face’ ex vivo reflectance confocal microscopy to help the surgery of basal cell carcinoma of the eyelid [published online December 19, 2016]. Clin Exp Ophthalmol. doi:10.1111/ceo.12904.
- Gareau DS, Jeon H, Nehal KS, et al. Rapid screening of cancer margins in tissue with multimodal confocal microscopy. J Surg Res. 2012;178:533-538.
- Sierra H, Damanpour S, Hibler B, et al. Confocal imaging of carbon dioxide laser-ablated basal cell carcinomas: an ex-vivo study on the uptake of contrast agent and ablation parameters [published online September 22, 2015]. Lasers Surg Med. 2016;48:133-139.
- Hibler BP, Yélamos O, Cordova M, et al. Handheld reflectance confocal microscopy to aid in the management of complex facial lentigo maligna. Cutis. 2017;99:346-352.
- Rajadhyaksha M, Marghoob A, Rossi A, et al. Reflectance confocal microscopy of skin in vivo: from bench to bedside. Lasers Surg Med. 2017;49:7-19.
Practice Points
- Confocal microscopy is an imaging tool that can be used both in vivo and ex vivo to aid in the diagnosis and management of cutaneous neoplasms, including melanoma, basal cell carcinoma, and squamous cell carcinoma, as well as inflammatory dermatoses.
- Ex vivo confocal microscopy can be used in both reflectance and fluorescent modes to render diagnosis in excised tissue or check surgical margins.
- Both in vivo and ex vivo confocal microscopy produces images with cellular resolution with a main limitation being depth of imaging.
Surveillance Colonoscopy After Screening Polypectomy Reduces Colorectal Cancer Incidence in Intermediate-Risk Patients
Study Overview
Objective. To examine the heterogeneity in colorectal cancer (CRC) incidence in intermediate-risk patients and the effect of surveillance on CRC incidence.
Design. Retrospective, multicenter cohort study.
Setting and participants. Study patients underwent colonoscopy between 1 January 1990 and 21 December 2010 at 17 hospitals in the United Kingdom. Patients were eligible for the study if they had a baseline colonoscopy with a newly diagnosed intermediate-risk adenoma. Intermediate-risk adenomas (as defined by the UK guidelines) included 1 to 2 large adenomas ≥ 10 mm or 3 to 4 small adenomas < 10 mm in size. Patients with a history of prior resections, colorectal cancer, inflammatory bowel disease or a family history of CRC were excluded from the study. Patient, procedural, and polyp characteristics were assessed at baseline.
Main outcome measures. The primary outcome was inci-dence of CRC. Additional factors assessed included age at first polyp detection, sex, completeness of colonoscopy, preparation quality, number of adenomas, size of largest adenoma, histology, and location. Proximal polyps were defined as those proximal to the descending colon. Information regarding social history (eg, smoking status) was not available.
Results. The authors identified 253,798 patients who underwent colonoscopy between 1 January 1990 and 21 December 2010. Of those, 223,539 were excluded based on not meeting the pre-specified inclusion criteria, resulting in 30,259 eligible patients for analysis. Review of histological data confirmed intermediate-risk adenomas in 11,995 (40%) of the patients. The median age in this study was 66 years and 55% were men. Fifty-eight percent attended 1 or more follow-up surveillance visits while 42% had no follow-up surveillance colonoscopy. Those who attended more than 1 follow-up surveillance visits were younger, had a greater proportion of large adenomas (> 20 mm), or had an adenoma with high-grade dysplasia. Both groups had similar rates of villous histology (9% vs. 10%).
After a median follow-up of 7.9 years, 210 CRCs were diagnosed and 32% of patients died. In the group with no follow-up surveillance, 46% died and 2% were diagnosed with cancer. In the group who had 1 or more follow-up colonoscopies, 21% died and 1% were diagnosed with cancer. One or 2 surveillance visits were associated with a significant reduction in CRC incidence (HR 0.57 [95% confidence interval {CI} 0.4–0.8) and 0.51 [95% CI 0.31–0.84], respectively). Three or more surveillance exams were also associated with a similar reduction in CRC incidence (HR 0.54; CI 0.29–0.99). Characteristics associated with increased CRC incidence were older age, adenomas > 20 mm, high-grade dysplasia, proximal polyps, and colonoscopies that were either incomplete or with poor preparation. The number of adenomas was not independently associated with CRC incidence.
The authors divided the cohort into higher-risk (74%) and lower-risk (26%) subgroups based on polyp and procedural characteristics. The higher-risk group included patients with baseline adenomas ≥ 20 mm, high-grade dysplasia, proximal polyps, or suboptimal evaluation. The lower-risk group included all others. CRC incidence was higher in the “higher-risk” subgroup (247 CRC per 100,000 vs. 93 CRC per 100,000). In the higher-risk group, risk of CRC decreased with more surveillance visits, a finding that was not observed in the lower-risk group. The 10-year incidence of CRC in the cohort overall was 2.7%, in the higher-risk group was 3.3% and in the lower risk group was 1.1%. CRC incidence was significantly higher in the higher-risk subgroup compared with the general population.
Conclusion. Colonoscopy surveillance significantly reducedthe incidence of CRC in intermediate-risk patients (1 to 3 large adenomas ≥ 10 mm or 3 to 4 small adenomas < 10 mm in size) who were offered surveillance at 3-year intervals. Moreover, the benefit of surveillance was particularly noted in a sub-group of patients who had large adenomas (≥ 20 mm), high-grade dysplasia, proximal polyps or poor endoscopic evaluation at the time of initial screening.
Commentary
Screening colonoscopy with removal of adenomatous polyps prevents many CRCs and has been shown to reduce mortality [1]. The results of this retrospective study suggest that patients with intermediate-risk adenomas who underwent at least 1 surveillance colonoscopy at 3-year intervals had a significant reduction in the incidence of CRC. The authors have identified a subgroup of patients at higher risk for CRC, which included those who had a suboptimal initial colonoscopy including poor bowel preparation, adenomas ≥ 20 mm, adenomas with high-grade dysplasia, or proximal adenomas. In particular, ongoing surveillance in this high-risk cohort was associated with significant reductions in CRC incidence. Conversely, those in the lower-risk group had a CRC incidence lower than that of the general population, raising some questions as to whether this group benefits from ongoing surveillance. However, definitive conclusions are difficult to make given the relatively low incidence of CRC in this group.
The risk of neoplasia in patients with colorectal ade-nomas has been evaluated in multiple studies. A pooled analysis by Martinez and colleagues examined over 9000 patients and noted advanced adenomas were found during follow up in 11.2% of the population, with 0.6% of the population developing invasive CRC [2]. Compared with adenomas < 5 mm, those with baseline adenomas 10–19 mm had a higher risk of advanced neoplasia (15.9% vs 7.7%; OR 2.2). Moreover, those with a baseline polyp ≥ 20 mm had a risk of advanced neoplasia at follow-up of 19.3% (OR 2.99). The results of the current investigation also suggest an increased risk of neoplasia with increased polyp size. Interestingly, the polyp size that conferred a higher risk in this study was ≥ 20 mm. The authors of this study suggest that polyps ≥ 20 mm along with the previously mentioned high-risk features may identify a subgroup within the intermediate-risk population who may benefit from close surveillance. One particularly interesting finding in this study was the identification of proximal colon polyps as a risk factor. While less well defined, previous investigations have noted a similar finding suggesting a risk of advanced neoplasia of up to 80% in patients with proximal polyps [3]. Given such, intensive surveillance may not be appropriate for all intermediate-risk patients and a more refined risk-adapted approach may be preferred.
There are some important limitations of the current study that warrant discussion. First, it should be emphasized that this study is observational in nature and therefore, definitive conclusions cannot be made despite the significant effect of surveillance colonoscopy in patients with high-risk features. In addition, the median follow-up in this study was 7.9 years and one could argue that longer-follow up is needed in order to validate the findings of this study, particularly in patients in the lower-risk cohort. Nevertheless, this study does suggest that there may be a population of patients that harbor higher-risk features and close surveillance limited to this group may be more appropriate. Furthermore, the duration of surveillance remains an important clinical question that requires further research.
Applications for Clinical Practice
In 2012, the United States Multi-Society Task Force (MSTF) on CRC issued updated guidelines defining adenoma risk and postpolypectomy surveillance. Low-risk adenomas (1 to 2 tubular adenomas ≤ 10 mm at baseline) should have repeat surveillance colonoscopy in 5 to 10 years. Advanced adenomas (≥ 10 mm, villous histology, or high-grade dysplasia) or those with 3 to 10 adenomas at baseline should undergo first surveillance in 3 years [4]. The authors of the current study suggest that surveillance colonoscopy at 3-year intervals for patients with particularly high-risk features including those with poor bowel preparation, adenomas ≥ 20 mm, adenomas with high-grade dysplasia or proximal adenomas benefit the greatest from at least 1 surveillance colonoscopy. Those with lower- risk features may not require such rigorous follow-up; however, further work to define which high-risk cohorts should undergo close surveillance is warranted. It is vital that the primary care provider understand such guidelines in order to facilitate the appropriate follow-up.
—Daniel Isaac, DO, MS, Michigan State University, East Lansing, MI
1. Zauber AG, Winawer SJ, O’Brien MJ, et al. Colonoscopic polypectomy and long-term prevention of colorectal cancer deaths. N Engl J Med 2012;366:687–96.
2. Martinez ME, Baron JA, Lieberman DA, et al. A pooled analysis of advanced colorectal neoplasia diagnosis after colonoscopic polypectomy. Gastroenterology 2009;136:832–41.
3. Pinsky PF, Schoen RE, Weissfeld JL, et al. The yield of surveillance colonoscopy by adenoma history and time to examination. Clin Gastroenterol Hepatol 2009;7:86–92.
4. Lieberman DA, Rex DK, Winawer SJ, et al. Guidelines for colonoscopy surveillance after screening and polypectomy: A consensus update by the US Multi-Society Task Force on Colorectal Cancer. Gastroenterology 2012;143:844–57.
Study Overview
Objective. To examine the heterogeneity in colorectal cancer (CRC) incidence in intermediate-risk patients and the effect of surveillance on CRC incidence.
Design. Retrospective, multicenter cohort study.
Setting and participants. Study patients underwent colonoscopy between 1 January 1990 and 21 December 2010 at 17 hospitals in the United Kingdom. Patients were eligible for the study if they had a baseline colonoscopy with a newly diagnosed intermediate-risk adenoma. Intermediate-risk adenomas (as defined by the UK guidelines) included 1 to 2 large adenomas ≥ 10 mm or 3 to 4 small adenomas < 10 mm in size. Patients with a history of prior resections, colorectal cancer, inflammatory bowel disease or a family history of CRC were excluded from the study. Patient, procedural, and polyp characteristics were assessed at baseline.
Main outcome measures. The primary outcome was inci-dence of CRC. Additional factors assessed included age at first polyp detection, sex, completeness of colonoscopy, preparation quality, number of adenomas, size of largest adenoma, histology, and location. Proximal polyps were defined as those proximal to the descending colon. Information regarding social history (eg, smoking status) was not available.
Results. The authors identified 253,798 patients who underwent colonoscopy between 1 January 1990 and 21 December 2010. Of those, 223,539 were excluded based on not meeting the pre-specified inclusion criteria, resulting in 30,259 eligible patients for analysis. Review of histological data confirmed intermediate-risk adenomas in 11,995 (40%) of the patients. The median age in this study was 66 years and 55% were men. Fifty-eight percent attended 1 or more follow-up surveillance visits while 42% had no follow-up surveillance colonoscopy. Those who attended more than 1 follow-up surveillance visits were younger, had a greater proportion of large adenomas (> 20 mm), or had an adenoma with high-grade dysplasia. Both groups had similar rates of villous histology (9% vs. 10%).
After a median follow-up of 7.9 years, 210 CRCs were diagnosed and 32% of patients died. In the group with no follow-up surveillance, 46% died and 2% were diagnosed with cancer. In the group who had 1 or more follow-up colonoscopies, 21% died and 1% were diagnosed with cancer. One or 2 surveillance visits were associated with a significant reduction in CRC incidence (HR 0.57 [95% confidence interval {CI} 0.4–0.8) and 0.51 [95% CI 0.31–0.84], respectively). Three or more surveillance exams were also associated with a similar reduction in CRC incidence (HR 0.54; CI 0.29–0.99). Characteristics associated with increased CRC incidence were older age, adenomas > 20 mm, high-grade dysplasia, proximal polyps, and colonoscopies that were either incomplete or with poor preparation. The number of adenomas was not independently associated with CRC incidence.
The authors divided the cohort into higher-risk (74%) and lower-risk (26%) subgroups based on polyp and procedural characteristics. The higher-risk group included patients with baseline adenomas ≥ 20 mm, high-grade dysplasia, proximal polyps, or suboptimal evaluation. The lower-risk group included all others. CRC incidence was higher in the “higher-risk” subgroup (247 CRC per 100,000 vs. 93 CRC per 100,000). In the higher-risk group, risk of CRC decreased with more surveillance visits, a finding that was not observed in the lower-risk group. The 10-year incidence of CRC in the cohort overall was 2.7%, in the higher-risk group was 3.3% and in the lower risk group was 1.1%. CRC incidence was significantly higher in the higher-risk subgroup compared with the general population.
Conclusion. Colonoscopy surveillance significantly reducedthe incidence of CRC in intermediate-risk patients (1 to 3 large adenomas ≥ 10 mm or 3 to 4 small adenomas < 10 mm in size) who were offered surveillance at 3-year intervals. Moreover, the benefit of surveillance was particularly noted in a sub-group of patients who had large adenomas (≥ 20 mm), high-grade dysplasia, proximal polyps or poor endoscopic evaluation at the time of initial screening.
Commentary
Screening colonoscopy with removal of adenomatous polyps prevents many CRCs and has been shown to reduce mortality [1]. The results of this retrospective study suggest that patients with intermediate-risk adenomas who underwent at least 1 surveillance colonoscopy at 3-year intervals had a significant reduction in the incidence of CRC. The authors have identified a subgroup of patients at higher risk for CRC, which included those who had a suboptimal initial colonoscopy including poor bowel preparation, adenomas ≥ 20 mm, adenomas with high-grade dysplasia, or proximal adenomas. In particular, ongoing surveillance in this high-risk cohort was associated with significant reductions in CRC incidence. Conversely, those in the lower-risk group had a CRC incidence lower than that of the general population, raising some questions as to whether this group benefits from ongoing surveillance. However, definitive conclusions are difficult to make given the relatively low incidence of CRC in this group.
The risk of neoplasia in patients with colorectal ade-nomas has been evaluated in multiple studies. A pooled analysis by Martinez and colleagues examined over 9000 patients and noted advanced adenomas were found during follow up in 11.2% of the population, with 0.6% of the population developing invasive CRC [2]. Compared with adenomas < 5 mm, those with baseline adenomas 10–19 mm had a higher risk of advanced neoplasia (15.9% vs 7.7%; OR 2.2). Moreover, those with a baseline polyp ≥ 20 mm had a risk of advanced neoplasia at follow-up of 19.3% (OR 2.99). The results of the current investigation also suggest an increased risk of neoplasia with increased polyp size. Interestingly, the polyp size that conferred a higher risk in this study was ≥ 20 mm. The authors of this study suggest that polyps ≥ 20 mm along with the previously mentioned high-risk features may identify a subgroup within the intermediate-risk population who may benefit from close surveillance. One particularly interesting finding in this study was the identification of proximal colon polyps as a risk factor. While less well defined, previous investigations have noted a similar finding suggesting a risk of advanced neoplasia of up to 80% in patients with proximal polyps [3]. Given such, intensive surveillance may not be appropriate for all intermediate-risk patients and a more refined risk-adapted approach may be preferred.
There are some important limitations of the current study that warrant discussion. First, it should be emphasized that this study is observational in nature and therefore, definitive conclusions cannot be made despite the significant effect of surveillance colonoscopy in patients with high-risk features. In addition, the median follow-up in this study was 7.9 years and one could argue that longer-follow up is needed in order to validate the findings of this study, particularly in patients in the lower-risk cohort. Nevertheless, this study does suggest that there may be a population of patients that harbor higher-risk features and close surveillance limited to this group may be more appropriate. Furthermore, the duration of surveillance remains an important clinical question that requires further research.
Applications for Clinical Practice
In 2012, the United States Multi-Society Task Force (MSTF) on CRC issued updated guidelines defining adenoma risk and postpolypectomy surveillance. Low-risk adenomas (1 to 2 tubular adenomas ≤ 10 mm at baseline) should have repeat surveillance colonoscopy in 5 to 10 years. Advanced adenomas (≥ 10 mm, villous histology, or high-grade dysplasia) or those with 3 to 10 adenomas at baseline should undergo first surveillance in 3 years [4]. The authors of the current study suggest that surveillance colonoscopy at 3-year intervals for patients with particularly high-risk features including those with poor bowel preparation, adenomas ≥ 20 mm, adenomas with high-grade dysplasia or proximal adenomas benefit the greatest from at least 1 surveillance colonoscopy. Those with lower- risk features may not require such rigorous follow-up; however, further work to define which high-risk cohorts should undergo close surveillance is warranted. It is vital that the primary care provider understand such guidelines in order to facilitate the appropriate follow-up.
—Daniel Isaac, DO, MS, Michigan State University, East Lansing, MI
1. Zauber AG, Winawer SJ, O’Brien MJ, et al. Colonoscopic polypectomy and long-term prevention of colorectal cancer deaths. N Engl J Med 2012;366:687–96.
2. Martinez ME, Baron JA, Lieberman DA, et al. A pooled analysis of advanced colorectal neoplasia diagnosis after colonoscopic polypectomy. Gastroenterology 2009;136:832–41.
3. Pinsky PF, Schoen RE, Weissfeld JL, et al. The yield of surveillance colonoscopy by adenoma history and time to examination. Clin Gastroenterol Hepatol 2009;7:86–92.
4. Lieberman DA, Rex DK, Winawer SJ, et al. Guidelines for colonoscopy surveillance after screening and polypectomy: A consensus update by the US Multi-Society Task Force on Colorectal Cancer. Gastroenterology 2012;143:844–57.
What’s on the dermatopathologist’s wish list
NEW YORK – If dermatopathologists had a wish list they could give their dermatologist colleagues, what might it include? High up on the list for many, said Robert Phelps, MD, might be to have them share the clinical picture, treat the specimen gently, and give the best landmarks possible.
Speaking at the summer meeting of the American Academy of Dermatology, Dr. Phelps, director of the dermatopathology service at Mount Sinai Medical Center in New York, led off the dermatopathologist-run session – appropriately titled “Help Me Help You” – by asking, “How can the clinician provide the optimal biopsy?”
It’s always helpful to have as much clinical information as possible, said Dr. Phelps, whose discussion focused on tips for neoplastic lesions. This might include prior history of malignancy, autoimmune disease, pathergy, or other relevant medical history, but clinical pictures can also be a big help, although there can be technical and patient privacy issues to overcome, he noted. If, for example, a larger lesion or rash is being biopsied rather than excised, it can be very helpful to see the larger field and full area of distribution of the lesion in question. Submitting multiple specimens for rashes and larger lesions is always a good idea too, he added.
Although curettage can be a great way to biopsy – and perhaps even definitively treat some lesions – problems can arise on the dermatopathologist’s side when melanocytic lesions are curetted for biopsy, according to Dr. Phelps, a practicing dermatologist and a dermatopathologist. “By virtue of the force of the biopsy, the specimen is often fragmented, and histology can be distorted,” he said. One element of that distortion can be that melanocytes can appear to be free floating, which is a problem. “Dyshesion of melanocytes is usually an indication of atypia … It is an important histologic clue as to the possibility of a malignancy supervening.”
These factors can make it tough for a dermatopathologist to make an accurate call. “If there are free-floating melanocytes from a curetted specimen, I can’t rule out invasive melanoma,” explained Dr. Phelps, since he can’t tell if he is seeing true atypia or disruption that’s an artifact of the collection technique.
In this instance, he said, a dermatopathologist would be “obligated to overcall, because one couldn’t really determine the pathology.” The bottom line? “Don’t curette biopsies of melanocytic lesions.”
Another technique that can interfere with the ability to read a tissue specimen accurately is electrodesiccation. Although it’s often performed in conjunction with curettage, electrodesiccation can cause changes in tissue consistent with thermal injury. “Essentially, the tissue has been burned,” Dr. Phelps pointed out. This can result in a characteristic streaming pattern of nuclei, and the dermis can acquire a “peculiar homogenized appearance,” he said.
Although electrodesiccation can be a useful technique to make sure margins are controlled, “when you do this, just be aware that the interpretation is difficult,” he noted. “It’s difficult to tell where the margins are and if they are the appropriate and correct margins,” he said.
When possible, try to avoid squeezing the tumor, Dr. Phelps advised. Excessive pressure on the specimen can distort cell architecture and make pathological diagnosis really challenging, particularly in lymphoid tumors, he said.
“Often, the tumor is not recognizable,” he added. Crush artifact can result in an appearance of small bluish clumps and smearing of collagen fibers. The effect, he said, can be particularly pronounced with small cell carcinoma and lymphoma, and with rapidly proliferating tumors.
Dr. Phelps said that during his training, he was taught not to use forceps to extract a stubborn punch biopsy specimen; rather, he was trained to use a needle to tease out the specimen. Fear of a self-inflicted needle stick with this technique may be a deterrent, he acknowledged. If forceps are used, he suggested being as gentle as possible and using the finest forceps available.
When pathologists receive an intact excised lesion – one not obtained using a Mohs technique, “delineation of the margin is essential,” Dr. Phelps said. Further, accurate mapping is critical to helping the examiner understand the anatomic orientation of the specimen, a key prerequisite that enables accurate communication from the dermatopathologist back to the clinician if there’s a question regarding the need for retreatment, he added.
For an elliptical excision, ideally, both poles of the ellipse would be suture-tagged, and at least one tag is essential, he said. Then superior and inferior borders can be inked with contrasting colors, and the epidermal borders of the lesion should be marked as well. When the specimen is submitted, it should be accompanied by an accurate map that clearly indicates the coding for medial, lateral, inferior, and superior aspects of the specimen. “Always prepare a specimen diagram for oriented specimens,” Dr. Phelps noted.
Don’t forget to make sure that the left-right orientation on the diagram corresponds to the specimen’s orientation on the patient, he added. Some facilities use a clock face system to indicate orientation and positioning, which may be the clearest method of all.
Sometimes, it’s difficult for the dermatopathologist to visualize whether the specimen is aligned in true medial-lateral fashion, or along skin tension lines, which tend to run diagonally, so “the more clinical information, the better,” he said. “With good mapping, precise retreatment can be optimal,” he said.
Dr. Phelps reported that he had no relevant conflicts of interest.
[email protected]
On Twitter @karioakes
EXPERT ANALYSIS FROM THE 2017 AAD SUMMER MEETING
Woman dies after robotic hysterectomy: $5M verdict
Woman dies after robotic hysterectomy: $5M verdict
When a 36-year-old woman underwent robotic hysterectomy, the gynecologist inserted a plastic trocar and sleeve through the patient's umbilicus to access the abdominal cavity at 7:30 am.
The certified registered nurse anesthetist (CRNA) noted a significant abnormality in the patient's vital signs at 8:07 am and administered medication and fluids to treat a suspected blood loss. When the patient's heart rate became extremely elevated at 8:25 am, the CRNA administered another drug, which failed to bring the patient's heart rate down. At 8:37 am, the monitoring machine could not record the patient's blood pressure. The CRNA informed the surgeon of the patient's condition. The supervising anesthesiologist was called; he arrived at 8:45 am and determined that the patient was bleeding internally. He asked the surgeon if he could visualize any bleeding; the surgeon could not.
The patient's condition continued to deteriorate. At 9:05 am, her blood pressure was still undetectable on the monitor. A Code Blue was called at 9:30 am. Exploratory surgery and blood transfusions begun at 9:43 am were not able to counteract the patient's massive blood loss. After cardiac arrest, she was pronounced dead at 11:18 am.
ESTATE'S CLAIM:
The surgeon was negligent in lacerating the left common iliac artery when inserting the trocar, and in not detecting the injury intraoperatively.
The anesthesia staff was negligent. The CRNA did not inform the surgeon until the situation was dire. A simple procedure could have been performed at any time to check the patient's hematocrit and hemoglobin levels, but that was not done until 9:30 am. If the severity of the patient's condition had been determined earlier, blood transfusions and further treatment could have saved her life.
DEFENDANTS' DEFENSE:
There was no negligence on the part of the surgeon or anesthesia team. The standard of care was met. Arterial laceration is a known risk of the surgery.
VERDICT:
A $5,008,922 Illinois verdict was returned against all defendants except the CRNA.
A woman with MS becomes incontinent after surgery
A 43-year-old woman with multiple sclerosis (MS) underwent a hysterectomy performed by a gynecologic surgeon. During surgery, the patient's ureter was injured, requiring additional surgery. The patient is now permanently incontinent.
PATIENT'S CLAIM:
During surgery, the surgeon constricted the ureter with stitches. A second surgery was needed to remove the stitches and reimplant the ureter. The second surgery left her permanently incontinent. Although incontinence is a known complication of the second surgery, the second surgery would not have been necessary if the surgeon had not injured the ureter during the first surgery. Incontinence was not a result of her MS as she was not incontinent before the second surgery.
DEFENDANTS' DEFENSE:
There was no deviation from the standard of care. There was no stitching around the ureter. The ureter was damaged by kinking, which was addressed during the second surgery. Incontinence was a result of her MS.
VERDICT:
A $700,000 South Carolina verdict was returned.
Bowel injury during robotic procedure: $6.25M settlement
A woman in her late 60s reported minor urinary incontinence to her gynecologist. She underwent robot-assisted laparoscopic hysterectomy with a sling procedure for pelvic prolapse. During the sling procedure, the transverse colon was injured. The patient developed sepsis, requiring multiple attempts at surgical repair, including colostomy. The patient requires a permanent colostomy. She has a malabsorption disorder and needs frequent intravenous treatment for dehydration.
PATIENT'S CLAIM:
The surgeon failed to properly control the robotic device, causing injury to the patient's bowel. The surgeon deviated from the standard of care by failing to convert from the robot-assisted laparoscopic procedure to an open procedure when complications arose. The injury was not properly treated before the surgeon closed the initial surgery, causing the patient to develop sepsis.
PHYSICIAN'S DEFENSE:
The surgeon claimed that the injuries and resulting sepsis were the fault of other physicians and hospital staff. The case settled during trial.
VERDICT:
A $6.25 million New Jersey settlement was reached.
Hydrothermal ablation led to genital burns
A woman SAW AN OBGYN on October 2 to report menorrhagia. She had been treated for uterine fibroids with a Mirena intrauterine device and hydrothermal ablation. Another physician had suggested hysterectomy, which she declined.
When the ObGyn found that the patient had an enlarged uterus, he ordered ultrasonography and an endometrial biopsy. On follow-up, the ObGyn provided options of robotic hysterectomy or operative hysteroscopy with hydrothermal ablation. The patient chose hysteroscopy and the procedure was scheduled for December 28.
During surgery, an improper seal to the cervix around the hydrothermal ablation sheath was detected before heating the fluid. A tenaculum and 2 sponges were placed on the cervix to help form a seal and the fluid was heated for 4 minutes. The procedure was aborted when fluid was seen to be leaking again. Instruments were removed after a cooling period. The patient was discharged from the surgery center the same day with a prescription for oral hydrocodone bitartrate and acetaminophen for pain.
On January 4, the patient reported severe vulvar pain. The ObGyn found thermal burns on both labia with possible cellulitis. He prescribed silver sulfadiazine cream twice daily, levofloxacin 500 mg for 7 days, and warm-water soaks. When the patient called to report continued pain on January 7, the hydrocodone and acetaminophen prescription was renewed. On January 8, the ObGyn found continued evidence of labia and introitus burns with no signs of infection. The patient was told to continue taking the oral pain medication and to apply topical lidocaine gel and silver sulfadiazine cream.
Examinations on January 11, 17, 24, and 31 showed continued evidence of active healing. When new evidence of vulvar ulceration with inflammation and infection appeared, supportive care and antibiotics were given. On February 7, granulation tissue had developed at the introitus with continued healing.
On March 27, she saw a gynecologist for dyspareunia. The skin was healed but a tender band of scar tissue was noted at the burn site. She was referred for physical therapy and given estradiol vaginal cream.
On December 11, the patient reported dyspareunia and depression to the gynecologist, who prescribed medication for depression and referred her to counseling.
PATIENT'S CLAIM:
The ObGyn was negligent in failing to maintain a proper seal around the hydrothermal ablation shield. The patient sustained second-degree burns to her genital area from the hot saline solution that leaked from the uterus. The injury caused lasting dyspareunia and depression.
PHYSICIAN'S DEFENSE:
There was no negligence. Once the ObGyn realized that the seal was incomplete, the procedure was stopped and the fluid cooled before being released. Burns were treated within the standard of care.
VERDICT:
A Texas defense verdict was returned based on a no- evidence partial summary judgment: neither the patient nor the expert witness supplied evidence to support the claims of gross negligence or exemplary damages against the ObGyn.
These cases were selected by the editors of OBG Management from Medical Malpractice Verdicts, Settlements & Experts, with permission of the editor, Lewis Laska (www.verdictslaska.com). The information available to the editors about the cases presented here is sometimes incomplete. Moreover, the cases may or may not have merit. Nevertheless, these cases represent the types of clinical situations that typically result in litigation and are meant to illustrate nationwide variation in jury verdicts and awards.
Share your thoughts! Send your Letter to the Editor to [email protected]. Please include your name and the city and state in which you practice.
VIDEO: Large distal nongranular colorectal polyps were most likely to contain occult invasive cancers
Large sessile or flat colorectal polyps or laterally spreading lesions were most likely to contain covert malignancies when their location was rectosigmoid, their Paris classification was 0-Is or 0-IIa+Is, and they were nongranular, according to the results of a multicenter prospective cohort study of 2,106 consecutive patients reported in the September issue of Gastroenterology (doi: 10.1053/j.gastro.2017.05.047).
“Distal nongranular lesions have a high risk of occult SMIC [submucosal invasive cancer], whereas proximal, granular 0-IIa lesions, after a careful assessment for features associated with SMIC, have a very low risk,” wrote Nicholas G. Burgess, MD, of Westmead Hospital, Sydney, with his associates. “These findings can be used to inform decisions [about] which patients should undergo endoscopic submucosal dissection, endoscopic mucosal resection, or surgery.”
Source: American Gastroenterological Association
Many studies of colonic lesions have examined predictors of SMIC. Nonetheless, clinicians need more information on factors that improve clinical decision making, especially as colonic endoscopic submucosal dissection becomes more accessible, the researchers said. Large colonic lesions can contain submucosal invasive SMICs that are not visible on endoscopy, and characterizing predictors of this occurrence could help patients and clinicians decide between endoscopic submucosal dissection and endoscopic mucosal resection. To do so, the researchers analyzed histologic specimens from 2,277 colonic lesions above 20 mm (average size, 37 mm) that lacked overt endoscopic high-risk features. The study ran from 2008 through 2016, study participants averaged 68 years of age, and 53% were male. A total of 171 lesions (8%) had evidence of SMIC on pathologic review, and 138 lesions had covert SMIC. Predictors of overt and occult SMIC included Kudo pit pattern V, a depressed component (0-IIc), rectosigmoid location, 0-Is or 0-IIa+Is Paris classification, nongranular surface morphology, and larger size. After excluding lesions with obvious SMIC features – including serrated lesions and those with depressed components (Kudo pit pattern of V and Paris 0-IIc) – the strongest predictors of occult SMIC included Paris classification, surface morphology, size, and location.
“Proximal 0-IIa G or 0-Is granular lesions had the lowest risk of SMIC (0.7% and 2.3%), whereas distal 0-Is nongranular lesions had the highest risk (21.4%),” the investigators added. Lesion location, size, and combined Paris classification and surface topography showed the best fit in a multivariable model. Notably, rectosigmoid lesions had nearly twice the odds of containing covert SMIC, compared with proximal lesions (odds ratio, 1.9; 95% confidence interval, 1.2-3.0; P = .01). Other significant predictors of covert SMIC in the multivariable model included combined Paris classification, surface morphology (OR, 4.0; 95% CI, 1.2-12.7; P = .02), and increasing size (OR, 1.2 per 10-mm increase; 95% CI, 1.04-1.3; P = .01). Increased size showed an even greater effect in lesions exceeding 50 mm.
Clinicians can use these factors to help evaluate risk of invasive cancer in lesions without overt SMIC, the researchers said. “One lesion type that differs from the pattern is 0-IIa nongranular lesions,” they noted. “Once lesions with overt evidence of SMIC are excluded, these lesions have a low risk (4.2%) of harboring underlying cancer.” Although 42% of lesions with covert SMIC were SM1 (potentially curable by endoscopic resection), no predictor of covert SMIC also predicted SMI status.
Funders included Cancer Institute of New South Wales and Gallipoli Medical Research Foundation. The investigators had no conflicts of interest.
In recent years, substantial efforts have been made to improve both colonoscopy preparation and endoscopic image quality to achieve improved polyp detection. In addition, while large, complex colon polyps (typically greater than 20 mm in size) previously were often referred for surgical resection, improved polyp resection techniques and equipment have led to the ability to remove many such lesions in a piecemeal fashion or en bloc via endoscopic mucosal resection (EMR) and endoscopic submucosal dissection (ESD).

The authors are to be congratulated for their meticulous and sustained efforts in acquiring and analyzing this data. These results provide endoscopists with some important, practical, and entirely visual criteria to assess upon identification of large colon polyps that can aid in determining which type of endoscopy therapy, if any, to embark upon. Avoiding EMR when there is a reasonably high probability of invasive disease will allow for choosing a more appropriate technique such as ESD (which is becoming increasingly available in the West) or surgery. In addition, patients can avoid the unnecessary EMR-related risks of bleeding and perforation when this technique is likely to result in an inadequate resection. Future work should assess whether this information can be widely adopted and utilized to achieve similar predictive accuracy in nonexpert settings.
V. Raman Muthusamy, MD, is director, interventional and general endoscopy, clinical professor of medicine, digestive diseases/gastroenterology, University of California, Los Angeles School of Medicine. He is a consultant for Medtronic and Boston Scientific.
In recent years, substantial efforts have been made to improve both colonoscopy preparation and endoscopic image quality to achieve improved polyp detection. In addition, while large, complex colon polyps (typically greater than 20 mm in size) previously were often referred for surgical resection, improved polyp resection techniques and equipment have led to the ability to remove many such lesions in a piecemeal fashion or en bloc via endoscopic mucosal resection (EMR) and endoscopic submucosal dissection (ESD).
The authors are to be congratulated for their meticulous and sustained efforts in acquiring and analyzing this data. These results provide endoscopists with some important, practical, and entirely visual criteria to assess upon identification of large colon polyps that can aid in determining which type of endoscopy therapy, if any, to embark upon. Avoiding EMR when there is a reasonably high probability of invasive disease will allow for choosing a more appropriate technique such as ESD (which is becoming increasingly available in the West) or surgery. In addition, patients can avoid the unnecessary EMR-related risks of bleeding and perforation when this technique is likely to result in an inadequate resection. Future work should assess whether this information can be widely adopted and utilized to achieve similar predictive accuracy in nonexpert settings.
V. Raman Muthusamy, MD, is director, interventional and general endoscopy, clinical professor of medicine, digestive diseases/gastroenterology, University of California, Los Angeles School of Medicine. He is a consultant for Medtronic and Boston Scientific.
Large sessile or flat colorectal polyps or laterally spreading lesions were most likely to contain covert malignancies when their location was rectosigmoid, their Paris classification was 0-Is or 0-IIa+Is, and they were nongranular, according to the results of a multicenter prospective cohort study of 2,106 consecutive patients reported in the September issue of Gastroenterology (doi: 10.1053/j.gastro.2017.05.047).
“Distal nongranular lesions have a high risk of occult SMIC [submucosal invasive cancer], whereas proximal, granular 0-IIa lesions, after a careful assessment for features associated with SMIC, have a very low risk,” wrote Nicholas G. Burgess, MD, of Westmead Hospital, Sydney, with his associates. “These findings can be used to inform decisions [about] which patients should undergo endoscopic submucosal dissection, endoscopic mucosal resection, or surgery.”
Source: American Gastroenterological Association
Many studies of colonic lesions have examined predictors of SMIC. Nonetheless, clinicians need more information on factors that improve clinical decision making, especially as colonic endoscopic submucosal dissection becomes more accessible, the researchers said. Large colonic lesions can contain submucosal invasive SMICs that are not visible on endoscopy, and characterizing predictors of this occurrence could help patients and clinicians decide between endoscopic submucosal dissection and endoscopic mucosal resection. To do so, the researchers analyzed histologic specimens from 2,277 colonic lesions above 20 mm (average size, 37 mm) that lacked overt endoscopic high-risk features. The study ran from 2008 through 2016, study participants averaged 68 years of age, and 53% were male. A total of 171 lesions (8%) had evidence of SMIC on pathologic review, and 138 lesions had covert SMIC. Predictors of overt and occult SMIC included Kudo pit pattern V, a depressed component (0-IIc), rectosigmoid location, 0-Is or 0-IIa+Is Paris classification, nongranular surface morphology, and larger size. After excluding lesions with obvious SMIC features – including serrated lesions and those with depressed components (Kudo pit pattern of V and Paris 0-IIc) – the strongest predictors of occult SMIC included Paris classification, surface morphology, size, and location.
“Proximal 0-IIa G or 0-Is granular lesions had the lowest risk of SMIC (0.7% and 2.3%), whereas distal 0-Is nongranular lesions had the highest risk (21.4%),” the investigators added. Lesion location, size, and combined Paris classification and surface topography showed the best fit in a multivariable model. Notably, rectosigmoid lesions had nearly twice the odds of containing covert SMIC, compared with proximal lesions (odds ratio, 1.9; 95% confidence interval, 1.2-3.0; P = .01). Other significant predictors of covert SMIC in the multivariable model included combined Paris classification, surface morphology (OR, 4.0; 95% CI, 1.2-12.7; P = .02), and increasing size (OR, 1.2 per 10-mm increase; 95% CI, 1.04-1.3; P = .01). Increased size showed an even greater effect in lesions exceeding 50 mm.
Clinicians can use these factors to help evaluate risk of invasive cancer in lesions without overt SMIC, the researchers said. “One lesion type that differs from the pattern is 0-IIa nongranular lesions,” they noted. “Once lesions with overt evidence of SMIC are excluded, these lesions have a low risk (4.2%) of harboring underlying cancer.” Although 42% of lesions with covert SMIC were SM1 (potentially curable by endoscopic resection), no predictor of covert SMIC also predicted SMI status.
Funders included Cancer Institute of New South Wales and Gallipoli Medical Research Foundation. The investigators had no conflicts of interest.
FROM GASTROENTEROLOGY
Key clinical point: Large sessile or flat colorectal polyps or laterally spreading lesions had the highest risk of occult malignancy when they were distal 0-Is or 0–IIa+Is nongranular lesions. Proximally located 0-Is or 0-IIa granular lesions had the lowest risk.
Major finding: Only 0.7% of proximal 0-IIa granular lesions and 2.3% of 0-Is granular lesions contained occult submucosal invasive malignancies, compared with 21% of distal 0-Is nongranular lesions.
Data source: A multicenter prospective cohort study of 2,277 large colonic lesions from 2,106 consecutive patients.
Disclosures: Funders included Cancer Institute of New South Wales and Gallipoli Medical Research Foundation. The investigators had no conflicts of interest.
Enasidenib gets FDA approval for AML with IDH2 mutations
Enasidenib has been approved for the treatment of adult patients with relapsed or refractory acute myeloid leukemia (AML) and specific mutations in the IDH2 gene, the U.S. Food and Drug Administration announced on Aug. 1.
The drug is approved for use with a companion diagnostic, the RealTime IDH2 Assay, which is used to detect IDH2 gene mutations. The FDA granted the approval of enasidenib (Idhifa) to the Celgene Corp. and the approval of the companion RealTime IDH2 Assay to Abbott Laboratories. Idhifa had Priority Review and Orphan Drug designations.
In data reported at the annual congress of the European Hematology Association, the overall response rate to enasidenib among 214 patients with IDH2 gene mutations treated at the 100-mg/day dose was 37%. This included 20.1% with a complete remission, 7.9% with complete remission with incomplete recovery of platelets or incomplete hematologic recovery, 3.7% with partial responses, and 5.1% with a morphologic leukemia-free state, according to Eytan M. Stein, MD, an internist and hematologic oncologist at the Memorial Sloan Kettering Cancer Center in New York.
According to an FDA press release, 34% of 157 patients who required transfusions of blood or platelets at the start of the study no longer required transfusions after treatment.
For 8%-19% of AML patients, the mutated IDH2 enzyme blocks normal blood cell development and results in an overabundance of immature blood cells, Celgene said in an announcement.
Common side effects of enasidenib, an isocitrate dehydrogenase-2 inhibitor, include nausea, vomiting, diarrhea, hyperbilirubinemia, and decreased appetite.
Fatal differentiation syndrome can occur and is treated with corticosteroids. The prescribing information for Idhifa includes a boxed warning regarding that risk. Symptoms of differentiation syndrome may include fever, dyspnea, acute respiratory distress, radiographic pulmonary infiltrates, pleural or pericardial effusions, rapid weight gain, peripheral edema, or hepatic, renal or multi-organ dysfunction, according to a press release issued by the FDA.
[email protected]
On Twitter @maryjodales
Clinical Challenges - August 2017 What is the likely diagnosis and pathogenetic mechanisms?
The diagnosis
Answer to “What’s your diagnosis?” on page 2: Lemmel’s syndrome
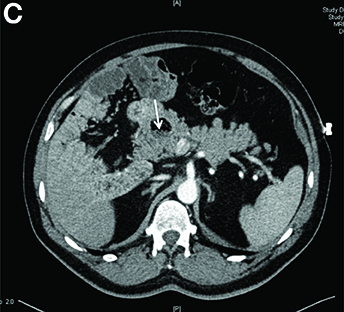
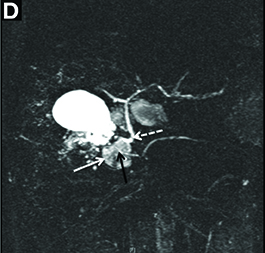
References
1. Egawa, N., Anjiki, H., Takuma, K., et al. Juxtapapillary duodenal diverticula and pancreatobiliary disease. Dig Surg. 2010;27:105-9.
2. Lobo, D.N., Balfour, T.W., Iftikhar, S.Y. Periampullary diverticula: consequences of failed ERCP. Ann Royal Coll Surg. 1998;80:326-31.
3. Lemmel, G. Die klinische Bedeutung der Duodenaldivertikel. Archiv fur Verdauungskrankheiten. 1934;56:59-70.
The diagnosis
Answer to “What’s your diagnosis?” on page 2: Lemmel’s syndrome
References
1. Egawa, N., Anjiki, H., Takuma, K., et al. Juxtapapillary duodenal diverticula and pancreatobiliary disease. Dig Surg. 2010;27:105-9.
2. Lobo, D.N., Balfour, T.W., Iftikhar, S.Y. Periampullary diverticula: consequences of failed ERCP. Ann Royal Coll Surg. 1998;80:326-31.
3. Lemmel, G. Die klinische Bedeutung der Duodenaldivertikel. Archiv fur Verdauungskrankheiten. 1934;56:59-70.
By Crispin Musumba, MBChB, PhD, Edward Britton, MBBS, MRCP, and Howard Smart, MBBS, DM. Published previously in Gastroenterology (2013;144:274, 468-469).
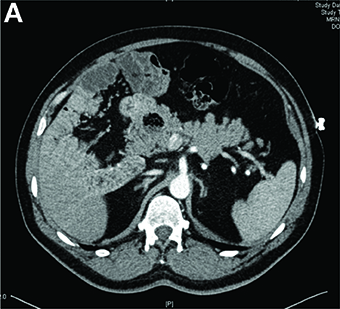
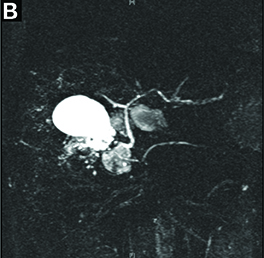
Effect of frailty on HF readmissions
Title: Frailty is an independent risk factor for short-term mortality in older patients hospitalized with acute decompensated heart failure
Clinical Question: What is the effect of frailty on 30-day mortality in non–severely disabled older patients with acute decompensated heart failure?
Study Design: Retrospective secondary analysis of a prospective observational multicenter cohort study.
Setting: Three Spanish EDs.
Synopsis: In 465 patients age 65 and older with acute decompensated heart failure who did not have an ST-segment elevation myocardial infarction, severe functional dependence, or dementia, 36.3% were categorized as frail on a validated performance status scoring system. Frail patients had a higher 30-day mortality rate than did non-frail patients (13.0% versus 4.1% in non-frail patients). Frailty was independently associated with a 30-day mortality (hazard ratio = 2.5, P = .047).
The major limitations of this study are that the researchers did not report how many patients were discharged versus admitted from the ED and they did not stratify short-term mortality attributable to frailty by degree of medical comorbidity.
Bottom Line: Frailty is common in older patients with acute decompensated heart failure and is also an independent risk factor for short-term mortality.
Citation: Martin-Sanchez FJ, Rodriguez-Adrada E, Mueller C, et al. The effect of frailty on 30-day mortality risk in older patients with acute heart failure attended in the emergency department. Acad Em Med. 2017;24(3):298-307.
Dr. Barrett is assistant professor in the division of hospital medicine at the University of New Mexico.
HM17 session summary: Updates in Antibiotics – Determining duration and when to switch to PO
Presenters
Samir Shah, MD, MSCE
Session summary
Antibiotic stewardship is more than narrowing coverage once susceptibilities are available. It also means conversion of antibiotics to oral therapy when clinically appropriate.
Previously, many childhood infections were treated with IV therapy due to severity or concern that oral absorption delayed or limited response. Multiple studies have shown that early conversion is not only safe, but safer than prolonging IV therapy. At HM 17, we had the opportunity to hear from Samir Shah, MD, about the current literature that supports safe transitions to oral therapy, including the “when” and the “how.”
Terminology for conversion to oral therapy should not state that it is “step-down” therapy, but rather switch therapy or sequential therapy. This conversion reduces likelihood of treatment complications, reduces length of hospital stay, reduces nursing and pharmacy time, decreases discomfort for the patient, and reduces cost.
Antibiotics such as levofloxacin, clindamycin, ciprofloxacin, and metronidazole have excellent bioavailability when taken orally. Other commonly used IV medications such as ampicillin, ampicillin-sulbactam, and cefazolin can be substituted with amoxicillin, amoxicillin-clavulanate, and cephalexin, which have similar penetration characteristics.
In general, unless there are serious complications, such as endocarditis and meningitis, most patients should be switched to oral therapy as soon as clinically warranted to complete therapy. For example, the incidence of meningitis in patients less than 1 month of age with UTI is 1%-2% and the incidence of meningitis in those 1-2 months of age is 0.3%-0.5%. Therefore, these patients can be treated with oral therapy earlier in their course when meningitis is not suspected. The likelihood of endocarditis in a pediatric patient without a known heart lesion is very low, even in patients with repeat positive blood cultures, unlike our adult colleagues who have much higher incidence of endocarditis in bacteremic patients.
Further studies are emerging to help reduce total length of therapy for many bacterial infections. For example, good evidence now exists that skin and soft tissue infections can now be treated safely with 5-day courses.

Key takeaways for HM
• Transition to oral therapy earlier in the hospital course is justified and much safer than IV therapy.
• Conversion to oral antibiotic therapy reduces the likelihood of treatment complications, length of hospital stay, nursing time, pharmacy time, discomfort to the patient, and costs.
• Do not use the term “step-down” when referencing a transition to oral therapy.
• Oral therapy is effective in most bacterial infections in children except for meningitis and endocarditis.
• Levofloxacin, clindamycin, ciprofloxacin, and metronidazole have excellent bioavailability when taken orally and can be easily swapped for IV therapy.
Dr. Schwenk is a pediatric hospitalist at Norton Children’s Hospital and associate professor of pediatrics at the University of Louisville (Ky.), and a member of the Pediatrics Committee for SHM.
Presenters
Samir Shah, MD, MSCE
Session summary
Antibiotic stewardship is more than narrowing coverage once susceptibilities are available. It also means conversion of antibiotics to oral therapy when clinically appropriate.
Previously, many childhood infections were treated with IV therapy due to severity or concern that oral absorption delayed or limited response. Multiple studies have shown that early conversion is not only safe, but safer than prolonging IV therapy. At HM 17, we had the opportunity to hear from Samir Shah, MD, about the current literature that supports safe transitions to oral therapy, including the “when” and the “how.”
Terminology for conversion to oral therapy should not state that it is “step-down” therapy, but rather switch therapy or sequential therapy. This conversion reduces likelihood of treatment complications, reduces length of hospital stay, reduces nursing and pharmacy time, decreases discomfort for the patient, and reduces cost.
Antibiotics such as levofloxacin, clindamycin, ciprofloxacin, and metronidazole have excellent bioavailability when taken orally. Other commonly used IV medications such as ampicillin, ampicillin-sulbactam, and cefazolin can be substituted with amoxicillin, amoxicillin-clavulanate, and cephalexin, which have similar penetration characteristics.
In general, unless there are serious complications, such as endocarditis and meningitis, most patients should be switched to oral therapy as soon as clinically warranted to complete therapy. For example, the incidence of meningitis in patients less than 1 month of age with UTI is 1%-2% and the incidence of meningitis in those 1-2 months of age is 0.3%-0.5%. Therefore, these patients can be treated with oral therapy earlier in their course when meningitis is not suspected. The likelihood of endocarditis in a pediatric patient without a known heart lesion is very low, even in patients with repeat positive blood cultures, unlike our adult colleagues who have much higher incidence of endocarditis in bacteremic patients.
Further studies are emerging to help reduce total length of therapy for many bacterial infections. For example, good evidence now exists that skin and soft tissue infections can now be treated safely with 5-day courses.
Key takeaways for HM
• Transition to oral therapy earlier in the hospital course is justified and much safer than IV therapy.
• Conversion to oral antibiotic therapy reduces the likelihood of treatment complications, length of hospital stay, nursing time, pharmacy time, discomfort to the patient, and costs.
• Do not use the term “step-down” when referencing a transition to oral therapy.
• Oral therapy is effective in most bacterial infections in children except for meningitis and endocarditis.
• Levofloxacin, clindamycin, ciprofloxacin, and metronidazole have excellent bioavailability when taken orally and can be easily swapped for IV therapy.
Dr. Schwenk is a pediatric hospitalist at Norton Children’s Hospital and associate professor of pediatrics at the University of Louisville (Ky.), and a member of the Pediatrics Committee for SHM.