User login
What Therapy-Related Risks Can Patients With MS Tolerate?
NEW ORLEANS—Tolerance of risk related to current disease-modifying therapies (DMTs) on the part of patients with multiple sclerosis (MS) varies widely, according to results from a large national survey presented at the 31st Annual Meeting of the Consortium of MS Centers.
“We have therapies available with a wide range of risks,” said Sneha Natarajan, PhD, a research coordinator at the Mellen Center for MS Treatment and Research at the Cleveland Clinic. “Some of the risks are relatively minor, like injection-site reactions or flu-like symptoms, and some are as bad as progressive multifocal leukoencephalopathy [PML], which can be fatal. We do not know what kind of risks people tolerate.”
To address these questions, Dr. Natarajan and colleagues conducted a survey of participants in the North American Research Committee on MS Registry and visitors to the National MS Society website who reported having MS. The benefit of a hypothetical oral DMT was set at 50% reduction in clinical relapses and 30% reduction in disability progression. The researchers chose six risk scenarios to evaluate tolerance to the following six risks: infection, skin rash, kidney injury, thyroid injury, liver injury, and PML. Starting from a risk tolerance of 1:1,000, the risk was adjusted to identify the highest risk tolerated, ranging from “would take regardless of the risk of death” to “no acceptable risk.”
Dr. Natarajan and colleagues reported results from 3,371 survey respondents. The mean age was 55, 93% of participants were white, 61% of participants had relapsing-remitting MS, and 53% of participants were currently taking a DMT. Overall, respondents reported the highest risk tolerance for infection or thyroid risks (1:1,000 for both) and lowest risk tolerance for PML and kidney injury (1:1,000,000 for both). Males reported a higher risk tolerance to all six risks. Females reported a risk tolerance to skin rash that was similar to that of kidney injury and PML.
“There is a pattern to the risks that our patients accept,” Dr. Natarajan said. “I do not think a doctor would not recommend a therapy benefit because of a skin rash [risk], but he may need to address the concerns of the patient up front and have a talk with the patient.”
Researchers also found that current DMT users expressed increased risk tolerance for all outcomes, compared with those not using any DMT. Respondents who were older, those who were more disabled, and those taking infusion therapies also reported higher risk tolerance.
The National MS Society funded this study. Dr. Natarajan reported having no financial disclosures.
—Doug Brunk
When – and how – to do a full-thickness graft repair
NEW YORK – Though flap reconstruction can provide elegant solutions with very good cosmesis after Mohs surgery and other excisional procedures, skin grafts provide another set of options.
Both split and full thickness grafts have a place in the dermatologist’s repertoire, but some tips and tricks can make a full thickness graft an attractive option in many instances, according to Marc Brown, MD, professor of dermatology and oncology at the University of Rochester (N.Y.).
Speaking at the summer meeting of the American Academy of Dermatology, Dr. Brown said that retrospective studies have shown that patients are highly satisfied with the cosmesis of full thickness skin grafting for reconstruction post Mohs surgery – if they’re asked after enough time has passed for the graft to mature and the dermatologist to perform some of the tweaks that are occasionally necessary. “It takes time to get to that point, but the overall satisfaction improves over time,” he said.

Full thickness skin grafts may be a good option when flap coverage is suboptimal or infeasible, he said. Some other pros of opting for a full thickness graft are that better cosmesis can be achieved in certain cases, and the donor site can be sutured, allowing for quicker healing with less downtime. However, a full thickness graft is a thicker graft, with resulting high metabolic demand. To ensure good “take,” dermatologists must be mindful that the graft site has a good vascular supply. Also, he added, full thickness grafts often need thinning, and physicians shouldn’t be afraid of being aggressive.
Both to reduce unwanted bulk and to help with better graft take, subcutaneous fat should be stripped completely from the graft, Dr. Brown noted. “You should see nothing that looks yellow,” he said. Fine serrated scissors are an excellent defatting tool, and while expensive, “they’re worth the cost,” he added.
Areas to be considered for full thickness grafts include the nasal ala, the medial canthus of the eye, the upper eyelid, fingers, and the ear. Larger defects on the scalp or forehead may also be good candidates, and full thickness grafts can work well on the lower leg.
For smaller grafts – those less than 1 or 2 cm diameter – Dr. Brown said that the preauricular area can work well as a donor site for facial grafts, since there’s often extra tissue with little tension there. Patients who are worried about donor site cosmesis may prefer the postauricular area, though the result is usually very good in either case, he said. Other potential donor sites are the glabella, nasolabial area, and the eyelid.
When grafts of more than 2 cm diameter are needed, Dr. Brown said the lateral neck, the supraclavicular area, or the lateral chest area can provide a good match in color and texture to facial skin.
Other tips for surgical technique are to use an appropriately-sized nonadherent gauze pad as a template for exact graft sizing. Precision counts, said Dr. Brown: “Measure twice, cut once.”
A central basting suture can be used to hold the graft in place while getting started, and Dr. Brown often uses a bolster for grafts of less than 1 cm. “Bolsters are helpful to prevent bleeding and improve contact in larger grafts,” he added.
Sutures should be placed graft to skin – “up and under,” Dr. Brown noted. He uses rapid-absorbing chromic suture material, with silk on the outside for the tie-over bolster. It’s also important to avoid tension on the wound edge, and he advised always using a pressure bandage for 48-72 hours.
If there’s concern about blood supply when grafting over cartilage, Dr. Brown advises making a few 2-mm punch defects in the cartilage to boost blood supply and help with engraftment.
For larger grafts where hematoma formation might result in graft failure, he will place a few parallel incisions through the graft as a means of escape should there be significant bleeding. At about 1 week post procedure, the graft should be purplish-pink in color, and patients should be counseled about the appearance of the graft as healing progresses, he said.
Physicians can manage patient expectations by letting them know not to expect the best cosmesis right away. However, said Dr. Brown, if the graft remains thickened, there are lots of options. Intralesional triamcinolone injections can help with thinning, and can be used beginning about 3 months after the graft. Dermabrasion is another good option, but he likes to wait 4-6 months before performing this procedure.
With appropriate site selection, meticulous technique, and good patient communication, dermatologists can keep full thickness skin grafting in the repertoire of viable options for excellent cosmesis, and a valuable tool in their own right. “Skin grafts are not a failure of reconstruction,” Dr. Brown said.
Dr. Brown had no conflicts to disclose.
[email protected]
On Twitter @karioakes
NEW YORK – Though flap reconstruction can provide elegant solutions with very good cosmesis after Mohs surgery and other excisional procedures, skin grafts provide another set of options.
Both split and full thickness grafts have a place in the dermatologist’s repertoire, but some tips and tricks can make a full thickness graft an attractive option in many instances, according to Marc Brown, MD, professor of dermatology and oncology at the University of Rochester (N.Y.).
Speaking at the summer meeting of the American Academy of Dermatology, Dr. Brown said that retrospective studies have shown that patients are highly satisfied with the cosmesis of full thickness skin grafting for reconstruction post Mohs surgery – if they’re asked after enough time has passed for the graft to mature and the dermatologist to perform some of the tweaks that are occasionally necessary. “It takes time to get to that point, but the overall satisfaction improves over time,” he said.
Full thickness skin grafts may be a good option when flap coverage is suboptimal or infeasible, he said. Some other pros of opting for a full thickness graft are that better cosmesis can be achieved in certain cases, and the donor site can be sutured, allowing for quicker healing with less downtime. However, a full thickness graft is a thicker graft, with resulting high metabolic demand. To ensure good “take,” dermatologists must be mindful that the graft site has a good vascular supply. Also, he added, full thickness grafts often need thinning, and physicians shouldn’t be afraid of being aggressive.
Both to reduce unwanted bulk and to help with better graft take, subcutaneous fat should be stripped completely from the graft, Dr. Brown noted. “You should see nothing that looks yellow,” he said. Fine serrated scissors are an excellent defatting tool, and while expensive, “they’re worth the cost,” he added.
Areas to be considered for full thickness grafts include the nasal ala, the medial canthus of the eye, the upper eyelid, fingers, and the ear. Larger defects on the scalp or forehead may also be good candidates, and full thickness grafts can work well on the lower leg.
For smaller grafts – those less than 1 or 2 cm diameter – Dr. Brown said that the preauricular area can work well as a donor site for facial grafts, since there’s often extra tissue with little tension there. Patients who are worried about donor site cosmesis may prefer the postauricular area, though the result is usually very good in either case, he said. Other potential donor sites are the glabella, nasolabial area, and the eyelid.
When grafts of more than 2 cm diameter are needed, Dr. Brown said the lateral neck, the supraclavicular area, or the lateral chest area can provide a good match in color and texture to facial skin.
Other tips for surgical technique are to use an appropriately-sized nonadherent gauze pad as a template for exact graft sizing. Precision counts, said Dr. Brown: “Measure twice, cut once.”
A central basting suture can be used to hold the graft in place while getting started, and Dr. Brown often uses a bolster for grafts of less than 1 cm. “Bolsters are helpful to prevent bleeding and improve contact in larger grafts,” he added.
Sutures should be placed graft to skin – “up and under,” Dr. Brown noted. He uses rapid-absorbing chromic suture material, with silk on the outside for the tie-over bolster. It’s also important to avoid tension on the wound edge, and he advised always using a pressure bandage for 48-72 hours.
If there’s concern about blood supply when grafting over cartilage, Dr. Brown advises making a few 2-mm punch defects in the cartilage to boost blood supply and help with engraftment.
For larger grafts where hematoma formation might result in graft failure, he will place a few parallel incisions through the graft as a means of escape should there be significant bleeding. At about 1 week post procedure, the graft should be purplish-pink in color, and patients should be counseled about the appearance of the graft as healing progresses, he said.
Physicians can manage patient expectations by letting them know not to expect the best cosmesis right away. However, said Dr. Brown, if the graft remains thickened, there are lots of options. Intralesional triamcinolone injections can help with thinning, and can be used beginning about 3 months after the graft. Dermabrasion is another good option, but he likes to wait 4-6 months before performing this procedure.
With appropriate site selection, meticulous technique, and good patient communication, dermatologists can keep full thickness skin grafting in the repertoire of viable options for excellent cosmesis, and a valuable tool in their own right. “Skin grafts are not a failure of reconstruction,” Dr. Brown said.
Dr. Brown had no conflicts to disclose.
[email protected]
On Twitter @karioakes
EXPERT ANALYSIS FROM the 2017 AAD SUMMER MEETING
Severity Weighting of Postoperative Adverse Events in Orthopedic Surgery
Take-Home Points
- Studies of AEs after orthopedic surgery commonly use composite AE outcomes.
- These types of outcomes treat AEs with different clinical significance similarly.
- This study created a single severity-weighted outcome that can be used to characterize the overall severity of a given patient’s postoperative course.
- Future studies may benefit from using this new severity-weighted outcome score.
Recently there has been an increase in the use of national databases for orthopedic surgery research.1-4 Studies commonly compare rates of postoperative adverse events (AEs) across different demographic, comorbidity, and procedural characteristics.5-23 Their conclusions often highlight different modifiable and/or nonmodifiable risk factors associated with the occurrence of postoperative events.
The several dozen AEs that have been investigated range from very severe (eg, death, myocardial infarction, coma) to less severe (eg, urinary tract infection [UTI], anemia requiring blood transfusion). A common approach for these studies is to consider many AEs together in the same analysis, asking a question such as, “What are risk factors for the occurrence of ‘adverse events’ after spine surgery?” Such studies test for associations with the occurrence of “any adverse event,” the occurrence of any “serious adverse event,” or similar composite outcomes. How common this type of study has become is indicated by the fact that in 2013 and 2014, at least 12 such studies were published in Clinical Orthopaedics and Related Research and the Journal of Bone and Joint Surgery,5-14,21-23 and many more in other orthopedic journals.15-20 However, there is a problem in using this type of composite outcome to perform such analyses: AEs with highly varying degrees of severity have identical impacts on the outcome variable, changing it from negative (“no adverse event”) to positive (“at least one adverse event”). As a result, the system may treat a very severe AE such as death and a very minor AE such as UTI similarly. Even in studies that use the slightly more specific composite outcome of “serious adverse events,” death and a nonlethal thromboembolic event would be treated similarly. Failure to differentiate these AEs in terms of their clinical significance detracts from the clinical applicability of conclusions drawn from studies using these types of composite AE outcomes.
In one of many examples that can be considered, a retrospective cohort study compared general and spinal anesthesia used in total knee arthroplasty.10 The rate of any AEs was higher with general anesthesia than with spinal anesthesia (12.34% vs 10.72%; P = .003). However, the only 2 specific AEs that had statistically significant differences were anemia requiring blood transfusion (6.07% vs 5.02%; P = .009) and superficial surgical-site infection (SSI; 0.92% vs 0.68%; P < .001). These 2 AEs are of relatively low severity; nevertheless, because these AEs are common, their differences constituted the majority of the difference in the rate of any AEs. In contrast, differences in the more severe AEs, such as death (0.11% vs 0.22%; P > .05), septic shock (0.14% vs 0.12%; P > .05), and myocardial infarction (0.20% vs 0.20%; P > .05), were small and not statistically significant. Had more weight been given to these more severe events, the outcome of the study likely would have been “no difference.”
To address this shortcoming in orthopedic research methodology, we created a severity-weighted outcome score that can be used to determine the overall “severity” of any given patient’s postoperative course. We also tested this novel outcome score for correlation with procedure type and patient characteristics using orthopedic patients from the American College of Surgeons (ACS) National Surgical Quality Improvement Program (NSQIP). Our intention is for database investigators to be able to use this outcome score in place of the composite outcomes that are dominating this type of research.
Methods
Generation of Severity Weights
Our method is described generally as utility weighting, assigning value weights reflective of overall impact to differing outcome states.24 Parallel methods have been used to generate the disability weights used to determine disability-adjusted life years for the Global Burden of Disease project25 and many other areas of health, economic, and policy research.
All orthopedic faculty members at 2 geographically disparate, large US academic institutions were invited to participate in a severity-weighting exercise. Each surgeon who agreed to participate performed the exercise independently. 
- STEP 1: Please reorder the AE cards by your perception of “severity” for a patient experiencing that event after an orthopedic procedure.
- STEP 2: Once your cards are in order, please determine how many postoperative occurrences of each event you would “trade” for 1 patient experiencing postoperative death. Place this number of occurrences in the box in the upper right corner of each card.
- NOTES: As you consider each AE:
- Please consider an “average” occurrence of that AE, but note that in no case does the AE result in perioperative death.
- Please consider only the “severity” for the patient. (Do not consider the extent to which the event may be related to surgical error.)
- Please consider that the numbers you assign are relative to each other. Hence, if you would trade 20 of “event A” for 1 death, and if you would trade 40 of “event B” for 1 death, the implication is that you would trade 20 of “event A” for 40 of “event B.”
- You may readjust the order of your cards at any point.
Participants’ responses were recorded. For each number provided by each participant, the inverse (reciprocal) was taken and multiplied by 100%. This new number was taken to be the percentage severity of death that the given participant considered the given AE to embody. For example, as a hypothetical on one end of the spectrum, if a participant reported 1 (he/she would trade 1 AE X for 1 death), then the severity would be 1/1 × 100% = 100% of death, a very severe AE. Conversely, if a participant reported a very large number like 100,000 (he/she would trade 100,000 AEs X for 1 death), then the severity would be 1/100,000 × 100% = 0.001% of death, a very minor AE. More commonly, a participant will report a number like 25, which would translate to 4% of death (1/25 × 100% = 4%). For each AE, weights were then averaged across participants to derive a mean severity weight to be used to generate a novel composite outcome score.
Definition of Novel Composite Outcome Score
The novel composite outcome score would be expressed as a percentage to be interpreted as percentage severity of death, which we termed severity-weighted outcome relative to death (SWORD). For each patient, SWORD was defined as no AE (0%) or postoperative death (100%), with other AEs assigned mean severity weights based on faculty members’ survey responses. A patient with multiple AEs would be assigned the weight for the more severe AE. This method was chosen over summing the AE weights because in many cases the AEs were thought to overlap; hence, summing would be inappropriate. For example, generally a deep SSI would result in a return to the operating room, and one would not want to double-count this AE. Similarly, it would not make sense for a patient who died of a complication to have a SWORD of >100%, which would be the summing result.
Application to ACS-NSQIP Patients
ACS-NSQIP is a surgical registry that prospectively identifies patients undergoing major surgery at any of >500 institutions nationwide.26,27 Patients are characterized at baseline and are followed for AEs over the first 30 postoperative days. 
First, mean SWORD was calculated and reported for patients undergoing each of the 8 procedures. Analysis of variance (ANOVA) was used to test for associations of mean SWORD with type of procedure both before and after multivariate adjustment for demographics (sex; age in years, <40, 40-49, 50-59, 60-69, 70-79, 80-89, ≥90) and comorbidities (diabetes, hypertension, chronic obstructive pulmonary disease, exertional dyspnea, end-stage renal disease, congestive heart failure).
Second, patients undergoing the procedure with the highest mean SWORD (hip fracture surgery) were examined in depth. Among only these patients, multivariate ANOVA was used to test for associations of mean SWORD with the same demographics and comorbidities.
All statistical tests were 2-tailed. Significance was set at α = 0.05 (P < .05).
All 23 institution A faculty members (100%) and 24 (89%) of the 27 institution B faculty members completed the exercise. 
In the ACS-NSQIP database, 85,109 patients were identified on the basis of the initial inclusion criteria. 
Results
Figure 1 shows mean severity weights and standard errors generated from faculty responses. Mean (standard error) severity weight for UTI was 0.23% (0.08%); blood transfusion, 0.28% (0.09%); pneumonia, 0.55% (0.15%); hospital readmission, 0.59% (0.23%); wound dehiscence, 0.64% (0.17%); deep vein thrombosis, 0.64% (0.19%); superficial SSI, 0.68% (0.23%); return to operating room, 0.91% (0.29%); progressive renal insufficiency, 0.93% (0.27%); graft/prosthesis/flap failure, 1.20% (0.34%); unplanned intubation, 1.38% (0.53%); deep SSI, 1.45% (0.38%); failure to wean from ventilator, 1.45% (0.48%); organ/space SSI, 1.76% (0.46%); sepsis without shock, 1.77% (0.42%); peripheral nerve injury, 1.83% (0.47%); pulmonary embolism, 2.99% (0.76%); acute renal failure, 3.95% (0.85%); myocardial infarction, 4.16% (0.98%); septic shock, 7.17% (1.36%); stroke, 8.73% (1.74%); cardiac arrest requiring cardiopulmonary resuscitation, 9.97% (2.46%); and coma, 15.14% (3.04%).
Among ACS-NSQIP patients, mean SWORD ranged from 0.2% (elective anterior cervical decompression and fusion) to 6.0% (hip fracture surgery) (Figure 2). 
Discussion
The use of national databases in studies has become increasingly common in orthopedic surgery.1-4 
The academic orthopedic surgeons who participated in our severity-weighting exercise thought the various AEs have markedly different severities. The least severe AE (UTI) was considered 0.23% as severe as postoperative death, with other events spanning the range up to 15.14% as severe as death. This wide range of severities demonstrates the problem with composite outcomes that implicitly consider all AEs similarly severe. Use of these markedly disparate weights in the development of SWORD enables this outcome to be more clinically applicable than outcomes such as “any adverse events.”
SWORD was highly associated with procedure type both before and after adjustment for demographics and comorbidities. Among patients undergoing the highest SWORD procedure (hip fracture surgery), SWORD was also associated with age, sex, and 4 of 6 tested comorbidities. Together, our findings show how SWORD is intended to be used in studies: to identify demographic, comorbidity, and procedural risk factors for an adverse postoperative course. We propose that researchers use our weighted outcome as their primary outcome—it is more meaningful than the simpler composite outcomes commonly used.
Outside orthopedic surgery, a small series of studies has addressed severity weighting of postoperative AEs.25,28-30 However, their approach was very different, as they were not designed to generate weights that could be transferred to future studies; rather, they simply compared severities of postoperative courses for patients within each individual study. In each study, a review of each original patient record was required, as the severity of each patient’s postoperative course was characterized according to the degree of any postoperative intervention—from no intervention to minor interventions such as placement of an intravenous catheter and major interventions such as endoscopic, radiologic, and surgical procedures. Only after the degree of intervention was defined could an outcome score be assigned to a given patient. However, databases do not depict the degree of intervention with nearly enough detail for this type of approach; they typically identify only occurrence or nonoccurrence of each event. Our work, which arose independently from this body of literature, enables an entirely different type of analysis. SWORD, which is not based on degree of intervention but on perceived severity of an “average” event, enables direct application of severity weights to large databases that store simple information on occurrence and nonoccurrence of specific AEs.
This study had several limitations. Most significantly, the generated severity weights were based on the surgeons’ subjective perceptions of severity, not on definitive assessments of the impacts of specific AEs on actual patients. We did not query the specialists who treat the complications or who present data on the costs and disabilities that may arise from these AEs. In addition, to develop our severity weighting scale, we queried faculty at only 2 institutions. A survey of surgeons throughout the United States would be more representative and would minimize selection bias. This is a potential research area. Another limitation is that scoring was subjective, based on surgeons’ perceptions of patients—in contrast to the Global Burden of Disease project, in which severity was based more objectively on epidemiologic data from >150 countries.
Orthopedic database research itself has often-noted limitations, including inability to sufficiently control for confounders, potential inaccuracies in data coding, limited follow-up, and lack of orthopedic-specific outcomes.1-4,31-33 However, this research also has much to offer, has increased tremendously over the past several years, and is expected to continue to expand. Many of the limitations of database studies cannot be entirely reversed. In providing a system for weighting postoperative AEs, our study fills a methodologic void. Future studies in orthopedics may benefit from using the severity-weighted outcome score presented here. Other fields with growth in database research may consider using similar methods to create severity-weighting systems of their own.
Am J Orthop. 2017;46(4):E235-E243. Copyright Frontline Medical Communications Inc. 2017. All rights reserved.
1. Bohl DD, Basques BA, Golinvaux NS, Baumgaertner MR, Grauer JN. Nationwide Inpatient Sample and National Surgical Quality Improvement Program give different results in hip fracture studies. Clin Orthop Relat Res. 2014;472(6):1672-1680.
2. Bohl DD, Russo GS, Basques BA, et al. Variations in data collection methods between national databases affect study results: a comparison of the Nationwide Inpatient Sample and National Surgical Quality Improvement Program databases for lumbar spine fusion procedures. J Bone Joint Surg Am. 2014;96(23):e193.
3. Bohl DD, Grauer JN, Leopold SS. Editor’s spotlight/Take 5: Nationwide Inpatient Sample and National Surgical Quality Improvement Program give different results in hip fracture studies. Clin Orthop Relat Res. 2014;472(6):1667-1671.
4. Levin PE. Apples, oranges, and national databases: commentary on an article by Daniel D. Bohl, MPH, et al.: “Variations in data collection methods between national databases affect study results: a comparison of the Nationwide Inpatient Sample and National Surgical Quality Improvement Program databases for lumbar spine fusion procedures.” J Bone Joint Surg Am. 2014;96(23):e198.
5. Duchman KR, Gao Y, Pugely AJ, Martin CT, Callaghan JJ. Differences in short-term complications between unicompartmental and total knee arthroplasty: a propensity score matched analysis. J Bone Joint Surg Am. 2014;96(16):1387-1394.
6. Edelstein AI, Lovecchio FC, Saha S, Hsu WK, Kim JY. Impact of resident involvement on orthopaedic surgery outcomes: an analysis of 30,628 patients from the American College of Surgeons National Surgical Quality Improvement Program database. J Bone Joint Surg Am. 2014;96(15):e131.
7. Belmont PJ Jr, Goodman GP, Waterman BR, Bader JO, Schoenfeld AJ. Thirty-day postoperative complications and mortality following total knee arthroplasty: incidence and risk factors among a national sample of 15,321 patients. J Bone Joint Surg Am. 2014;96(1):20-26.
8. Martin CT, Pugely AJ, Gao Y, Mendoza-Lattes S. Thirty-day morbidity after single-level anterior cervical discectomy and fusion: identification of risk factors and emphasis on the safety of outpatient procedures. J Bone Joint Surg Am. 2014;96(15):1288-1294.
9. Martin CT, Pugely AJ, Gao Y, Wolf BR. Risk factors for thirty-day morbidity and mortality following knee arthroscopy: a review of 12,271 patients from the National Surgical Quality Improvement Program database. J Bone Joint Surg Am. 2013;95(14):e98 1-10.
10. Pugely AJ, Martin CT, Gao Y, Mendoza-Lattes S, Callaghan JJ. Differences in short-term complications between spinal and general anesthesia for primary total knee arthroplasty. J Bone Joint Surg Am. 2013;95(3):193-199.
11. Odum SM, Springer BD. In-hospital complication rates and associated factors after simultaneous bilateral versus unilateral total knee arthroplasty. J Bone Joint Surg Am. 2014;96(13):1058-1065.
12. Yoshihara H, Yoneoka D. Trends in the incidence and in-hospital outcomes of elective major orthopaedic surgery in patients eighty years of age and older in the United States from 2000 to 2009. J Bone Joint Surg Am. 2014;96(14):1185-1191.
13. Lin CA, Kuo AC, Takemoto S. Comorbidities and perioperative complications in HIV-positive patients undergoing primary total hip and knee arthroplasty. J Bone Joint Surg Am. 2013;95(11):1028-1036.
14. Mednick RE, Alvi HM, Krishnan V, Lovecchio F, Manning DW. Factors affecting readmission rates following primary total hip arthroplasty. J Bone Joint Surg Am. 2014;96(14):1201-1209.
15. Pugely AJ, Martin CT, Gao Y, Ilgenfritz R, Weinstein SL. The incidence and risk factors for short-term morbidity and mortality in pediatric deformity spinal surgery: an analysis of the NSQIP pediatric database. Spine. 2014;39(15):1225-1234.
16. Haughom BD, Schairer WW, Hellman MD, Yi PH, Levine BR. Resident involvement does not influence complication after total hip arthroplasty: an analysis of 13,109 cases. J Arthroplasty. 2014;29(10):1919-1924.
17. Belmont PJ Jr, Goodman GP, Hamilton W, Waterman BR, Bader JO, Schoenfeld AJ. Morbidity and mortality in the thirty-day period following total hip arthroplasty: risk factors and incidence. J Arthroplasty. 2014;29(10):2025-2030.
18. Bohl DD, Fu MC, Golinvaux NS, Basques BA, Gruskay JA, Grauer JN. The “July effect” in primary total hip and knee arthroplasty: analysis of 21,434 cases from the ACS-NSQIP database. J Arthroplasty. 2014;29(7):1332-1338.
19. Bohl DD, Fu MC, Gruskay JA, Basques BA, Golinvaux NS, Grauer JN. “July effect” in elective spine surgery: analysis of the American College of Surgeons National Surgical Quality Improvement Program database. Spine. 2014;39(7):603-611.
20. Babu R, Thomas S, Hazzard MA, et al. Morbidity, mortality, and health care costs for patients undergoing spine surgery following the ACGME resident duty-hour reform: clinical article. J Neurosurg Spine. 2014;21(4):502-515.
21. Lovecchio F, Beal M, Kwasny M, Manning D. Do patients with insulin-dependent and noninsulin-dependent diabetes have different risks for complications after arthroplasty? Clin Orthop Relat Res. 2014;472(11):3570-3575.
22. Pugely AJ, Gao Y, Martin CT, Callagh JJ, Weinstein SL, Marsh JL. The effect of resident participation on short-term outcomes after orthopaedic surgery. Clin Orthop Relat Res. 2014;472(7):2290-2300.
23. Easterlin MC, Chang DG, Talamini M, Chang DC. Older age increases short-term surgical complications after primary knee arthroplasty. Clin Orthop Relat Res. 2013;471(8):2611-2620.
24. Morimoto T, Fukui T. Utilities measured by rating scale, time trade-off, and standard gamble: review and reference for health care professionals. J Epidemiology. 2002;12(2):160-178.
25. Salomon JA, Vos T, Hogan DR, et al. Common values in assessing health outcomes from disease and injury: disability weights measurement study for the Global Burden of Disease Study 2010. Lancet. 2012;380(9859):2129-2143.
26. American College of Surgeons National Surgical Quality Improvement Program. User Guide for the 2011 Participant Use Data File. https://www.facs.org/~/media/files/quality%20programs/nsqip/ug11.ashx. Published October 2012. Accessed December 1, 2013.
27. Molina CS, Thakore RV, Blumer A, Obremskey WT, Sethi MK. Use of the National Surgical Quality Improvement Program in orthopaedic surgery. Clin Orthop Relat Res. 2015;473(5):1574-1581.
28. Strasberg SM, Hall BL. Postoperative Morbidity Index: a quantitative measure of severity of postoperative complications. J Am Coll Surg. 2011;213(5):616-626.
29. Beilan J, Strakosha R, Palacios DA, Rosser CJ. The Postoperative Morbidity Index: a quantitative weighing of postoperative complications applied to urological procedures. BMC Urol. 2014;14:1.
30. Porembka MR, Hall BL, Hirbe M, Strasberg SM. Quantitative weighting of postoperative complications based on the Accordion Severity Grading System: demonstration of potential impact using the American College of Surgeons National Surgical Quality Improvement Program. J Am Coll Surg. 2010;210(3):286-298.
31. Golinvaux NS, Bohl DD, Basques BA, Fu MC, Gardner EC, Grauer JN. Limitations of administrative databases in spine research: a study in obesity. Spine J. 2014;14(12):2923-2928.
32. Golinvaux NS, Bohl DD, Basques BA, Grauer JN. Administrative database concerns: accuracy of International Classification of Diseases, Ninth Revision coding is poor for preoperative anemia in patients undergoing spinal fusion. Spine. 2014;39(24):2019-2023.
33. Bekkers S, Bot AG, Makarawung D, Neuhaus V, Ring D. The National Hospital Discharge Survey and Nationwide Inpatient Sample: the databases used affect results in THA research. Clin Orthop Relat Res. 2014;472(11):3441-3449.
Take-Home Points
- Studies of AEs after orthopedic surgery commonly use composite AE outcomes.
- These types of outcomes treat AEs with different clinical significance similarly.
- This study created a single severity-weighted outcome that can be used to characterize the overall severity of a given patient’s postoperative course.
- Future studies may benefit from using this new severity-weighted outcome score.
Recently there has been an increase in the use of national databases for orthopedic surgery research.1-4 Studies commonly compare rates of postoperative adverse events (AEs) across different demographic, comorbidity, and procedural characteristics.5-23 Their conclusions often highlight different modifiable and/or nonmodifiable risk factors associated with the occurrence of postoperative events.
The several dozen AEs that have been investigated range from very severe (eg, death, myocardial infarction, coma) to less severe (eg, urinary tract infection [UTI], anemia requiring blood transfusion). A common approach for these studies is to consider many AEs together in the same analysis, asking a question such as, “What are risk factors for the occurrence of ‘adverse events’ after spine surgery?” Such studies test for associations with the occurrence of “any adverse event,” the occurrence of any “serious adverse event,” or similar composite outcomes. How common this type of study has become is indicated by the fact that in 2013 and 2014, at least 12 such studies were published in Clinical Orthopaedics and Related Research and the Journal of Bone and Joint Surgery,5-14,21-23 and many more in other orthopedic journals.15-20 However, there is a problem in using this type of composite outcome to perform such analyses: AEs with highly varying degrees of severity have identical impacts on the outcome variable, changing it from negative (“no adverse event”) to positive (“at least one adverse event”). As a result, the system may treat a very severe AE such as death and a very minor AE such as UTI similarly. Even in studies that use the slightly more specific composite outcome of “serious adverse events,” death and a nonlethal thromboembolic event would be treated similarly. Failure to differentiate these AEs in terms of their clinical significance detracts from the clinical applicability of conclusions drawn from studies using these types of composite AE outcomes.
In one of many examples that can be considered, a retrospective cohort study compared general and spinal anesthesia used in total knee arthroplasty.10 The rate of any AEs was higher with general anesthesia than with spinal anesthesia (12.34% vs 10.72%; P = .003). However, the only 2 specific AEs that had statistically significant differences were anemia requiring blood transfusion (6.07% vs 5.02%; P = .009) and superficial surgical-site infection (SSI; 0.92% vs 0.68%; P < .001). These 2 AEs are of relatively low severity; nevertheless, because these AEs are common, their differences constituted the majority of the difference in the rate of any AEs. In contrast, differences in the more severe AEs, such as death (0.11% vs 0.22%; P > .05), septic shock (0.14% vs 0.12%; P > .05), and myocardial infarction (0.20% vs 0.20%; P > .05), were small and not statistically significant. Had more weight been given to these more severe events, the outcome of the study likely would have been “no difference.”
To address this shortcoming in orthopedic research methodology, we created a severity-weighted outcome score that can be used to determine the overall “severity” of any given patient’s postoperative course. We also tested this novel outcome score for correlation with procedure type and patient characteristics using orthopedic patients from the American College of Surgeons (ACS) National Surgical Quality Improvement Program (NSQIP). Our intention is for database investigators to be able to use this outcome score in place of the composite outcomes that are dominating this type of research.
Methods
Generation of Severity Weights
Our method is described generally as utility weighting, assigning value weights reflective of overall impact to differing outcome states.24 Parallel methods have been used to generate the disability weights used to determine disability-adjusted life years for the Global Burden of Disease project25 and many other areas of health, economic, and policy research.
All orthopedic faculty members at 2 geographically disparate, large US academic institutions were invited to participate in a severity-weighting exercise. Each surgeon who agreed to participate performed the exercise independently.
- STEP 1: Please reorder the AE cards by your perception of “severity” for a patient experiencing that event after an orthopedic procedure.
- STEP 2: Once your cards are in order, please determine how many postoperative occurrences of each event you would “trade” for 1 patient experiencing postoperative death. Place this number of occurrences in the box in the upper right corner of each card.
- NOTES: As you consider each AE:
- Please consider an “average” occurrence of that AE, but note that in no case does the AE result in perioperative death.
- Please consider only the “severity” for the patient. (Do not consider the extent to which the event may be related to surgical error.)
- Please consider that the numbers you assign are relative to each other. Hence, if you would trade 20 of “event A” for 1 death, and if you would trade 40 of “event B” for 1 death, the implication is that you would trade 20 of “event A” for 40 of “event B.”
- You may readjust the order of your cards at any point.
Participants’ responses were recorded. For each number provided by each participant, the inverse (reciprocal) was taken and multiplied by 100%. This new number was taken to be the percentage severity of death that the given participant considered the given AE to embody. For example, as a hypothetical on one end of the spectrum, if a participant reported 1 (he/she would trade 1 AE X for 1 death), then the severity would be 1/1 × 100% = 100% of death, a very severe AE. Conversely, if a participant reported a very large number like 100,000 (he/she would trade 100,000 AEs X for 1 death), then the severity would be 1/100,000 × 100% = 0.001% of death, a very minor AE. More commonly, a participant will report a number like 25, which would translate to 4% of death (1/25 × 100% = 4%). For each AE, weights were then averaged across participants to derive a mean severity weight to be used to generate a novel composite outcome score.
Definition of Novel Composite Outcome Score
The novel composite outcome score would be expressed as a percentage to be interpreted as percentage severity of death, which we termed severity-weighted outcome relative to death (SWORD). For each patient, SWORD was defined as no AE (0%) or postoperative death (100%), with other AEs assigned mean severity weights based on faculty members’ survey responses. A patient with multiple AEs would be assigned the weight for the more severe AE. This method was chosen over summing the AE weights because in many cases the AEs were thought to overlap; hence, summing would be inappropriate. For example, generally a deep SSI would result in a return to the operating room, and one would not want to double-count this AE. Similarly, it would not make sense for a patient who died of a complication to have a SWORD of >100%, which would be the summing result.
Application to ACS-NSQIP Patients
ACS-NSQIP is a surgical registry that prospectively identifies patients undergoing major surgery at any of >500 institutions nationwide.26,27 Patients are characterized at baseline and are followed for AEs over the first 30 postoperative days.
First, mean SWORD was calculated and reported for patients undergoing each of the 8 procedures. Analysis of variance (ANOVA) was used to test for associations of mean SWORD with type of procedure both before and after multivariate adjustment for demographics (sex; age in years, <40, 40-49, 50-59, 60-69, 70-79, 80-89, ≥90) and comorbidities (diabetes, hypertension, chronic obstructive pulmonary disease, exertional dyspnea, end-stage renal disease, congestive heart failure).
Second, patients undergoing the procedure with the highest mean SWORD (hip fracture surgery) were examined in depth. Among only these patients, multivariate ANOVA was used to test for associations of mean SWORD with the same demographics and comorbidities.
All statistical tests were 2-tailed. Significance was set at α = 0.05 (P < .05).
All 23 institution A faculty members (100%) and 24 (89%) of the 27 institution B faculty members completed the exercise.
In the ACS-NSQIP database, 85,109 patients were identified on the basis of the initial inclusion criteria.
Results
Figure 1 shows mean severity weights and standard errors generated from faculty responses. Mean (standard error) severity weight for UTI was 0.23% (0.08%); blood transfusion, 0.28% (0.09%); pneumonia, 0.55% (0.15%); hospital readmission, 0.59% (0.23%); wound dehiscence, 0.64% (0.17%); deep vein thrombosis, 0.64% (0.19%); superficial SSI, 0.68% (0.23%); return to operating room, 0.91% (0.29%); progressive renal insufficiency, 0.93% (0.27%); graft/prosthesis/flap failure, 1.20% (0.34%); unplanned intubation, 1.38% (0.53%); deep SSI, 1.45% (0.38%); failure to wean from ventilator, 1.45% (0.48%); organ/space SSI, 1.76% (0.46%); sepsis without shock, 1.77% (0.42%); peripheral nerve injury, 1.83% (0.47%); pulmonary embolism, 2.99% (0.76%); acute renal failure, 3.95% (0.85%); myocardial infarction, 4.16% (0.98%); septic shock, 7.17% (1.36%); stroke, 8.73% (1.74%); cardiac arrest requiring cardiopulmonary resuscitation, 9.97% (2.46%); and coma, 15.14% (3.04%).
Among ACS-NSQIP patients, mean SWORD ranged from 0.2% (elective anterior cervical decompression and fusion) to 6.0% (hip fracture surgery) (Figure 2).
Discussion
The use of national databases in studies has become increasingly common in orthopedic surgery.1-4
The academic orthopedic surgeons who participated in our severity-weighting exercise thought the various AEs have markedly different severities. The least severe AE (UTI) was considered 0.23% as severe as postoperative death, with other events spanning the range up to 15.14% as severe as death. This wide range of severities demonstrates the problem with composite outcomes that implicitly consider all AEs similarly severe. Use of these markedly disparate weights in the development of SWORD enables this outcome to be more clinically applicable than outcomes such as “any adverse events.”
SWORD was highly associated with procedure type both before and after adjustment for demographics and comorbidities. Among patients undergoing the highest SWORD procedure (hip fracture surgery), SWORD was also associated with age, sex, and 4 of 6 tested comorbidities. Together, our findings show how SWORD is intended to be used in studies: to identify demographic, comorbidity, and procedural risk factors for an adverse postoperative course. We propose that researchers use our weighted outcome as their primary outcome—it is more meaningful than the simpler composite outcomes commonly used.
Outside orthopedic surgery, a small series of studies has addressed severity weighting of postoperative AEs.25,28-30 However, their approach was very different, as they were not designed to generate weights that could be transferred to future studies; rather, they simply compared severities of postoperative courses for patients within each individual study. In each study, a review of each original patient record was required, as the severity of each patient’s postoperative course was characterized according to the degree of any postoperative intervention—from no intervention to minor interventions such as placement of an intravenous catheter and major interventions such as endoscopic, radiologic, and surgical procedures. Only after the degree of intervention was defined could an outcome score be assigned to a given patient. However, databases do not depict the degree of intervention with nearly enough detail for this type of approach; they typically identify only occurrence or nonoccurrence of each event. Our work, which arose independently from this body of literature, enables an entirely different type of analysis. SWORD, which is not based on degree of intervention but on perceived severity of an “average” event, enables direct application of severity weights to large databases that store simple information on occurrence and nonoccurrence of specific AEs.
This study had several limitations. Most significantly, the generated severity weights were based on the surgeons’ subjective perceptions of severity, not on definitive assessments of the impacts of specific AEs on actual patients. We did not query the specialists who treat the complications or who present data on the costs and disabilities that may arise from these AEs. In addition, to develop our severity weighting scale, we queried faculty at only 2 institutions. A survey of surgeons throughout the United States would be more representative and would minimize selection bias. This is a potential research area. Another limitation is that scoring was subjective, based on surgeons’ perceptions of patients—in contrast to the Global Burden of Disease project, in which severity was based more objectively on epidemiologic data from >150 countries.
Orthopedic database research itself has often-noted limitations, including inability to sufficiently control for confounders, potential inaccuracies in data coding, limited follow-up, and lack of orthopedic-specific outcomes.1-4,31-33 However, this research also has much to offer, has increased tremendously over the past several years, and is expected to continue to expand. Many of the limitations of database studies cannot be entirely reversed. In providing a system for weighting postoperative AEs, our study fills a methodologic void. Future studies in orthopedics may benefit from using the severity-weighted outcome score presented here. Other fields with growth in database research may consider using similar methods to create severity-weighting systems of their own.
Am J Orthop. 2017;46(4):E235-E243. Copyright Frontline Medical Communications Inc. 2017. All rights reserved.
1. Bohl DD, Basques BA, Golinvaux NS, Baumgaertner MR, Grauer JN. Nationwide Inpatient Sample and National Surgical Quality Improvement Program give different results in hip fracture studies. Clin Orthop Relat Res. 2014;472(6):1672-1680.
2. Bohl DD, Russo GS, Basques BA, et al. Variations in data collection methods between national databases affect study results: a comparison of the Nationwide Inpatient Sample and National Surgical Quality Improvement Program databases for lumbar spine fusion procedures. J Bone Joint Surg Am. 2014;96(23):e193.
3. Bohl DD, Grauer JN, Leopold SS. Editor’s spotlight/Take 5: Nationwide Inpatient Sample and National Surgical Quality Improvement Program give different results in hip fracture studies. Clin Orthop Relat Res. 2014;472(6):1667-1671.
4. Levin PE. Apples, oranges, and national databases: commentary on an article by Daniel D. Bohl, MPH, et al.: “Variations in data collection methods between national databases affect study results: a comparison of the Nationwide Inpatient Sample and National Surgical Quality Improvement Program databases for lumbar spine fusion procedures.” J Bone Joint Surg Am. 2014;96(23):e198.
5. Duchman KR, Gao Y, Pugely AJ, Martin CT, Callaghan JJ. Differences in short-term complications between unicompartmental and total knee arthroplasty: a propensity score matched analysis. J Bone Joint Surg Am. 2014;96(16):1387-1394.
6. Edelstein AI, Lovecchio FC, Saha S, Hsu WK, Kim JY. Impact of resident involvement on orthopaedic surgery outcomes: an analysis of 30,628 patients from the American College of Surgeons National Surgical Quality Improvement Program database. J Bone Joint Surg Am. 2014;96(15):e131.
7. Belmont PJ Jr, Goodman GP, Waterman BR, Bader JO, Schoenfeld AJ. Thirty-day postoperative complications and mortality following total knee arthroplasty: incidence and risk factors among a national sample of 15,321 patients. J Bone Joint Surg Am. 2014;96(1):20-26.
8. Martin CT, Pugely AJ, Gao Y, Mendoza-Lattes S. Thirty-day morbidity after single-level anterior cervical discectomy and fusion: identification of risk factors and emphasis on the safety of outpatient procedures. J Bone Joint Surg Am. 2014;96(15):1288-1294.
9. Martin CT, Pugely AJ, Gao Y, Wolf BR. Risk factors for thirty-day morbidity and mortality following knee arthroscopy: a review of 12,271 patients from the National Surgical Quality Improvement Program database. J Bone Joint Surg Am. 2013;95(14):e98 1-10.
10. Pugely AJ, Martin CT, Gao Y, Mendoza-Lattes S, Callaghan JJ. Differences in short-term complications between spinal and general anesthesia for primary total knee arthroplasty. J Bone Joint Surg Am. 2013;95(3):193-199.
11. Odum SM, Springer BD. In-hospital complication rates and associated factors after simultaneous bilateral versus unilateral total knee arthroplasty. J Bone Joint Surg Am. 2014;96(13):1058-1065.
12. Yoshihara H, Yoneoka D. Trends in the incidence and in-hospital outcomes of elective major orthopaedic surgery in patients eighty years of age and older in the United States from 2000 to 2009. J Bone Joint Surg Am. 2014;96(14):1185-1191.
13. Lin CA, Kuo AC, Takemoto S. Comorbidities and perioperative complications in HIV-positive patients undergoing primary total hip and knee arthroplasty. J Bone Joint Surg Am. 2013;95(11):1028-1036.
14. Mednick RE, Alvi HM, Krishnan V, Lovecchio F, Manning DW. Factors affecting readmission rates following primary total hip arthroplasty. J Bone Joint Surg Am. 2014;96(14):1201-1209.
15. Pugely AJ, Martin CT, Gao Y, Ilgenfritz R, Weinstein SL. The incidence and risk factors for short-term morbidity and mortality in pediatric deformity spinal surgery: an analysis of the NSQIP pediatric database. Spine. 2014;39(15):1225-1234.
16. Haughom BD, Schairer WW, Hellman MD, Yi PH, Levine BR. Resident involvement does not influence complication after total hip arthroplasty: an analysis of 13,109 cases. J Arthroplasty. 2014;29(10):1919-1924.
17. Belmont PJ Jr, Goodman GP, Hamilton W, Waterman BR, Bader JO, Schoenfeld AJ. Morbidity and mortality in the thirty-day period following total hip arthroplasty: risk factors and incidence. J Arthroplasty. 2014;29(10):2025-2030.
18. Bohl DD, Fu MC, Golinvaux NS, Basques BA, Gruskay JA, Grauer JN. The “July effect” in primary total hip and knee arthroplasty: analysis of 21,434 cases from the ACS-NSQIP database. J Arthroplasty. 2014;29(7):1332-1338.
19. Bohl DD, Fu MC, Gruskay JA, Basques BA, Golinvaux NS, Grauer JN. “July effect” in elective spine surgery: analysis of the American College of Surgeons National Surgical Quality Improvement Program database. Spine. 2014;39(7):603-611.
20. Babu R, Thomas S, Hazzard MA, et al. Morbidity, mortality, and health care costs for patients undergoing spine surgery following the ACGME resident duty-hour reform: clinical article. J Neurosurg Spine. 2014;21(4):502-515.
21. Lovecchio F, Beal M, Kwasny M, Manning D. Do patients with insulin-dependent and noninsulin-dependent diabetes have different risks for complications after arthroplasty? Clin Orthop Relat Res. 2014;472(11):3570-3575.
22. Pugely AJ, Gao Y, Martin CT, Callagh JJ, Weinstein SL, Marsh JL. The effect of resident participation on short-term outcomes after orthopaedic surgery. Clin Orthop Relat Res. 2014;472(7):2290-2300.
23. Easterlin MC, Chang DG, Talamini M, Chang DC. Older age increases short-term surgical complications after primary knee arthroplasty. Clin Orthop Relat Res. 2013;471(8):2611-2620.
24. Morimoto T, Fukui T. Utilities measured by rating scale, time trade-off, and standard gamble: review and reference for health care professionals. J Epidemiology. 2002;12(2):160-178.
25. Salomon JA, Vos T, Hogan DR, et al. Common values in assessing health outcomes from disease and injury: disability weights measurement study for the Global Burden of Disease Study 2010. Lancet. 2012;380(9859):2129-2143.
26. American College of Surgeons National Surgical Quality Improvement Program. User Guide for the 2011 Participant Use Data File. https://www.facs.org/~/media/files/quality%20programs/nsqip/ug11.ashx. Published October 2012. Accessed December 1, 2013.
27. Molina CS, Thakore RV, Blumer A, Obremskey WT, Sethi MK. Use of the National Surgical Quality Improvement Program in orthopaedic surgery. Clin Orthop Relat Res. 2015;473(5):1574-1581.
28. Strasberg SM, Hall BL. Postoperative Morbidity Index: a quantitative measure of severity of postoperative complications. J Am Coll Surg. 2011;213(5):616-626.
29. Beilan J, Strakosha R, Palacios DA, Rosser CJ. The Postoperative Morbidity Index: a quantitative weighing of postoperative complications applied to urological procedures. BMC Urol. 2014;14:1.
30. Porembka MR, Hall BL, Hirbe M, Strasberg SM. Quantitative weighting of postoperative complications based on the Accordion Severity Grading System: demonstration of potential impact using the American College of Surgeons National Surgical Quality Improvement Program. J Am Coll Surg. 2010;210(3):286-298.
31. Golinvaux NS, Bohl DD, Basques BA, Fu MC, Gardner EC, Grauer JN. Limitations of administrative databases in spine research: a study in obesity. Spine J. 2014;14(12):2923-2928.
32. Golinvaux NS, Bohl DD, Basques BA, Grauer JN. Administrative database concerns: accuracy of International Classification of Diseases, Ninth Revision coding is poor for preoperative anemia in patients undergoing spinal fusion. Spine. 2014;39(24):2019-2023.
33. Bekkers S, Bot AG, Makarawung D, Neuhaus V, Ring D. The National Hospital Discharge Survey and Nationwide Inpatient Sample: the databases used affect results in THA research. Clin Orthop Relat Res. 2014;472(11):3441-3449.
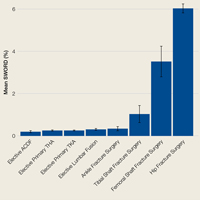
Concussion: Evaluation and management
Concussion, also known as mild traumatic brain injury, affects more than 600 adults per 100,000 each year and is commonly treated by nonneurologists.1 Public attention to concussion has been increasing, particularly to concussion sustained during sports. Coincident with this increased attention, the diagnosis of concussion continues to increase in the outpatient setting. Thus, a review of the topic is timely.
ACCELERATION OF THE BRAIN DUE TO TRAUMA
The definition of concussion has changed considerably over the years. It is currently defined as a pathophysiologic process that results from an acceleration or deceleration of the brain induced by trauma.2 It is largely a temporary, functional problem, as opposed to a gross structural injury.2–5
The acceleration of the brain that results in a concussion is usually initiated by a direct blow to the head, although direct impact is not required.6 As the brain rotates, different areas accelerate at different rates, resulting in a shear strain imparted to the parenchyma.
This shear strain causes deformation of axonal membranes and opening of membrane-associated sodium-potassium channels. This in turn leads to release of excitatory neurotransmitters, ultimately culminating in a wave of neuronal depolarization and a spreading depression-like phenomenon that may mediate the loss of consciousness, posttraumatic amnesia, confusion, and many of the other immediate signs and symptoms associated with concussion.
The sudden metabolic demand created by the massive excitatory phenomena triggers an increased utilization of glucose to restore cellular homeostasis. At the same time, cerebral blood flow decreases after concussion, which, in the setting of increased glucose demand, leads to an “energy crisis”: an increased need for adenosine triphosphate with a concomitant decreased delivery of glucose.7 This mismatch between energy demand and supply is thought to underlie the most common signs and symptoms of concussion.
ASSESSMENT
History
The history of present illness is essential to a diagnosis of concussion. In the classic scenario, an otherwise asymptomatic person sustains some trauma to the head that is followed immediately by the signs and symptoms of concussion.

Many of these signs and symptoms are nonspecific and may occur without concussion or other trauma.8,9 Thus, the diagnosis of concussion cannot be made on the basis of symptoms alone, but only in the overall context of history, physical examination, and, at times, additional clinical assessments.
The symptoms of concussion should gradually improve. While they may be exacerbated by certain activities or stimuli, the overall trend should be one of symptom improvement. If symptoms are worsening over time, alternative explanations for the patient’s symptoms should be considered.
Physical examination
A thorough neurologic examination should be conducted in all patients with suspected concussion and include the following.
A mental status examination should include assessment of attention, memory, and recall. Orientation is normal except in the most acute examinations.
Cranial nerve examination must include careful assessment of eye-movement control, including smooth pursuit and saccades. However, even in patients with prominent subjective dizziness, considerable experience may be needed to actually demonstrate abnormalities.
Balance testing. Balance demands careful assessment and, especially for young athletes, this testing should be more difficult than the tandem gait and eyes-closed, feet-together tests.
Standard strength, sensory, reflex, and coordination testing is usually normal.
Any focal neurologic findings should prompt consideration of other causes or of a more serious injury and should lead to further evaluation, including brain imaging.
Diagnostic tests
Current clinical brain imaging cannot diagnose a concussion. The purpose of neuroimaging is to assess for other etiologies or injuries, such as hemorrhage or contusion, that may cause similar symptoms but require different management.
Several guidelines are available to assess the need for imaging in the setting of recent trauma, of which 2 are typically used10–12:
The Canadian CT Head Rule10 states that computed tomography (CT) is indicated in any of the following situations:
- The patient fails to reach a Glasgow Coma Scale score of 15—on a scale of 3 (worst) to 15 (best)—within 2 hours
- There is a suspected open skull fracture
- There is any sign of basal skull fracture
- The patient has 2 or more episodes of vomiting
- The patient is 65 or older
- The patient has retrograde amnesia (ie, cannot remember events that occurred before the injury) for 30 minutes or more
- The mechanism of injury was dangerous (eg, a pedestrian was struck by a motor vehicle, or the patient fell from > 3 feet or > 5 stairs).
The New Orleans Criteria11 state that a patient warrants CT of the head if any of the following is present:
- Severe headache
- Vomiting
- Age over 60
- Drug or alcohol intoxication
- Deficit in short-term memory
- Physical evidence of trauma above the clavicles
- Seizure.
Caveats: these imaging guidelines apply to adults; those for pediatric patients differ.12 Also, because they were designed for use in an emergency department, their utility in clinical practice outside the emergency department is unclear.
Electroencephalography is not necessary in the evaluation of concussion unless a seizure disorder is believed to be the cause of the injury.
Concussion in athletes
Athletes who participate in contact and collision sports are at higher risk of concussion than the nonathletic population. Therefore, specific assessments of symptoms, balance, oculomotor function, cognitive function, and reaction time have been developed for athletes.
Ideally, these measures are taken at preseason baseline, so that they are available for comparison with postinjury assessments after a known or suspected concussion. These assessments can be used to help make the diagnosis of concussion in cases that are unclear and to help monitor recovery. Objective measures of injury are especially useful for athletes who may be reluctant to report symptoms in order to return to play.
Like most medical tests, these assessments need to be properly interpreted in the overall context of the medical history and physical examination by those who know how to administer them. It is important to remember that the natural history of concussion recovery differs between sport-related concussion and concussion that occurs outside of sports.8
MANAGEMENT
The symptoms and signs after concussion are so variable and multidimensional that they make a generally applicable treatment hard to define.
Rest: Physical and cognitive
Treatment depends on the specifics of the injury, but there are common recommendations for the acute days after injury. Lacking hard data, the consensus among experts is that patients should undergo a period of physical and cognitive rest.13,14 Exactly what “rest” means and how long it should last are unknown, leading to a wide variation in its application.
Rest aids recovery but also may have adverse effects: fatigue, diurnal sleep disruption, reactive depression, anxiety, and physiologic deconditioning.15,16 Many guidelines recommend physical and cognitive rest until symptoms resolve,14 but this is likely too cautious. Even without a concussion, inactivity is associated with many of the nonspecific symptoms also associated with concussion. As recovery progresses, the somatic symptoms of concussion improve, while emotional symptoms worsen, likely in part due to prolonged rest.17
We recommend a period of rest lasting 3 to 5 days after injury, followed by a gradual resumption of both physical and cognitive activities as tolerated, remaining below the level at which symptoms are exacerbated.
Not surprisingly, many guidelines for returning to physical activity are focused on athletes. Yet the same principles apply to management of concussion in the general population who exercise: light physical activity (typically walking or stationary bicycling), followed by more vigorous aerobic activity, followed by some resistance activities. Mild aerobic exercise (to below the threshold of symptoms) may speed recovery from refractive postconcussion syndrome, even in those who did not exercise before the injury.18
Athletes require specific and strict instructions to avoid increased trauma to the head during the gradual increase of physical activities. The National Collegiate Athletic Association has published an algorithm for a gradual return to sport-specific training that is echoed in recent consensus statements on concussion.19 Once aerobic reconditioning produces no symptoms, then noncontact, sport-specific activities are begun, followed by contact activities. We have patients return to the clinic once they are symptom-free for repeat evaluation before clearing them for high-risk activities (eg, skiing, bicycling) or contact sports (eg, basketball, soccer, football, ice hockey).
Cognitive rest
While physical rest is fairly straightforward, cognitive rest is more challenging. The concept of cognitive rest is hard to define and even harder to enforce. Patients are often told to minimize any activities that require attention or concentration. This often includes, but is not limited to, avoiding reading, texting, playing video games, and using computers.13
In the modern world, full avoidance of these activities is difficult and can be profoundly socially isolating. Further, complete cognitive rest may be associated with symptoms of its own.15,16,20 Still, some reasonable limitation of cognitive activities, at least initially, is likely beneficial.21 For patients engaged in school or academic work, often the daily schedule needs to be adjusted and accommodations made to help them return to a full academic schedule and level of activity. It is reasonable to have patients return gradually to work or school rather than attempt to immediately return to their preinjury level.
With these interventions, most patients have full resolution of their symptoms and return to preinjury levels of performance.
TREATING SOMATIC SYMPTOMS
Posttraumatic headache
Posttraumatic headache is the most common sequela of concussion.22 Surprisingly, it is more common after concussion than after moderate or severe traumatic brain injury.23 A prior history of headache, particularly migraine, is a known risk factor for development of posttraumatic headache.24
Posttraumatic headache is usually further defined by headache type using the International Classification of Headache Disorders criteria (www.ichd-3.org). Migraine or probable migraine is the most common type of posttraumatic headache; tension headache is less common.25
Analgesics such as nonsteroidal anti-inflammatory drugs (NSAIDs) are often used initially by patients to treat posttraumatic headache. One study found that 70% of patients used acetaminophen or an NSAID.26
Treating early with effective therapy is the most important tenet of posttraumatic headache treatment, since 80% of those who self-treat have incomplete relief, and almost all of them are using over-the-counter products.27 Overuse of over-the-counter abortive medications can lead to medication overuse headache, also known as rebound headache, thus complicating the treatment of posttraumatic headache.26
Earlier treatment with a preventive medication can often limit the need for and overuse of over-the-counter analgesics and can minimize the occurrence of subsequent medication overuse headache. However, in pediatric populations, nonpharmacologic interventions such as rest and sleep hygiene are typically used first, then medications after 4 to 6 weeks if this is ineffective.
A number of medications have been studied for prophylactic treatment of posttraumatic headache, including topiramate, amitriptyline, and divalproex sodium,28–30 but there is little compelling evidence for use of one over the other. If posttraumatic headache is migrainous, beta-blockers, calcium-channel blockers, selective serotonin reuptake inhibitors, serotonin-norepinephrine reuptake inhibtors, and gabapentin are other prophylactic medication options under the appropriate circumstances.27,31,32 In adults, we have clinically had success with nortriptyline 20 mg or gabapentin 300 mg at night as an initial prophylactic headache medication, increasing as tolerated or until pain is controlled, though there are no high-quality data to guide this decision.
The ideal prophylactic medication depends on headache type, patient tolerance, comorbidities, allergies, and medication sensitivities. Gabapentin, amitriptyline, and nortriptyline can produce sedation, which can help those suffering from sleep disturbance.
If a provider is not comfortable prescribing these medications or doesn’t prescribe them regularly, the patient should be referred to a concussion or headache specialist more familiar with their use.
In some patients, even some athletes, headache may be related to a cervical strain injury—whiplash—that should be treated with an NSAID (or acetaminophen), perhaps with a short course of a muscle relaxant in adults, and with physical therapy.32
Some patients have chronic headache despite oral medications.26 Therefore, alternatives to oral medications and complementary therapies should be considered. Especially for protracted cases requiring more complicated headache management or injectable treatments, patients should be referred to a pain clinic, headache specialist, or concussion specialist.
Dizziness
Dizziness is also common after concussion. But what the patient means by dizziness requires a little probing. Some have paroxysms of vertigo. This typically represents a peripheral vestibular injury, usually benign paroxysmal positional vertigo. The latter can be elicited with a Hallpike maneuver and treated in the office with the Epley maneuver.33
Usually, dizziness is a subjective sense of poor coordination, gait instability, or dysequilibrium. Patients may also complain of associated nausea and motion sensitivity. This may all be secondary to a mechanism in the middle or inner ear or the brain. Patients should be encouraged to begin movement—gradually and safely—to help the vestibular system accommodate, which it will do with gradual stimulation. It usually resolves spontaneously.
Specific treatment is unfortunately limited. There is no established benefit from vestibular suppressants such as meclizine. Vestibular rehabilitation may accelerate improvement and decrease symptoms.33 Referral for a comprehensive balance assessment or to vestibular therapy (a subset of physical therapy) should be considered and is something we typically undertake in our clinic if there is no recovery from dizziness 4 to 6 weeks after the concussion.
Visual symptoms can contribute to dizziness. Convergence spasm or convergence insufficiency (both related to muscle spasm of the eye) can occur after concussion, with some studies estimating that up to 69% of patients have these symptoms.34 This can interfere with visual tracking and contribute to a feeling of dysequilibrium.34 Referral to a concussion specialist or vestibular rehabilitation physical therapist can be helpful in treating this issue if it does not resolve spontaneously.
Orthostasis and lightheadedness also contribute to dizziness and are associated with cerebrovascular autoregulation. Available data suggest that dysregulation of neurovascular coupling, cerebral vasoreactivity, and cerebral autoregulation contribute to some of the chronic symptoms of concussion, including dizziness. A gradual return to exercise may help regulate cerebral blood flow and improve this type of dizziness.35
Sleep disturbance
Sleep disturbance is common after concussion, but the form is variable: insomnia, excessive daytime somnolence, and alteration of the sleep-wake cycle are all seen and may themselves affect recovery.36
Sleep hygiene education should be the first intervention for postconcussive sleep issues. For example, the patient should be encouraged to do the following:
- Minimize “screen time” an hour before going to bed: cell phone, tablet, and computer screens emit a wavelength of light that suppresses endogenous melatonin release37,38
- Go to bed and wake up at the same time each day
- Minimize or avoid caffeine, nicotine, and alcohol
- Avoid naps.39
Melatonin is a safe and effective treatment that could be added.40 In addition, some studies suggest that melatonin may improve recovery from traumatic brain injury.41,42
Mild exercise (to below the threshold of causing or exacerbating symptoms) may also improve sleep quality.
Amitriptyline or nortriptyline may reduce headache frequency and intensity and also help treat insomnia.
Trazodone is recommended by some as a first-line agent,39 but we usually reserve it for protracted insomnia refractory to the above treatments.
Benzodiazepines should be avoided, as they reduce arousal, impair cognition, and exacerbate motor impairments.43
Emotional symptoms
Acute-onset anxiety or depression often occurs after concussion.44,45 There is abundant evidence that emotional effects of injury may be the most significant factor in recovery.46 A preinjury history of anxiety may be a prognostic factor.9 Patients with a history of anxiety or depression are more likely to develop emotional symptoms after a concussion, but emotional problems may develop in any patient after a concussion.47,48
The circumstances under which an injury is sustained may be traumatic (eg, car accident, assault), leading to an acute stress reaction or disorder and, if untreated, may result in a more chronic condition—posttraumatic stress disorder. Moreover, the injury and subsequent symptoms may have repercussions in many aspects of the patient’s life, leading to further psychologic stress (eg, loss of wages or the inability to handle normal work, school, and family responsibilities).
Referral to a therapist trained in skills-based psychotherapy (eg, cognitive-behavioral therapy, exposure-based treatment) is often helpful.
Pharmacologic treatment can be a useful adjunct. Several studies have shown that selective serotonin reuptake inhibitors, serotonin-norepinephrine reuptake inhibitors, and tricyclic antidepressants may improve depression after concussion.49 The prescription of antidepressants, however, is best left to providers with experience in treating anxiety and depression.
As with sleep disorders after concussion, benzodiazepines should be avoided, as they can impair cognition.43
Cognitive problems
Cognitive problems are also common after concussion. Patients complain about everyday experiences of forgetfulness, distractibility, loss of concentration, and mental fatigue. Although patients often subjectively perceive these symptoms as quite limiting, the impairments can be difficult to demonstrate in office testing.
A program of gradual increase in mental activity, parallel to recovery of physical capacity, should be undertaken. Most patients make a gradual recovery within a few weeks.50
When cognitive symptoms cause significant school or vocational problems or become persistent, patients should be referred to a specialty clinic. As with most of the consequences of concussion, there are few established treatments. When cognitive difficulties persist, it is important to consider the complications of concussion mentioned above: headache, pain, sleep disturbance, and anxiety, all of which may cause subjective cognitive problems and are treatable.
If cognitive symptoms are prolonged despite improvement of other issues like headache and sleep disturbance, a low-dose stimulant medication such as amphetamine salts or methylphenidate may be useful for symptoms of poor attention.49 They should be only a temporary measure after concussion to carry the patient through a cognitively challenging period, unless there was a history of attention-deficit disorder before the injury. A variety of other agents, including amantadine,51 have been proposed based on limited studies; all are off-label uses. Before considering these types of interventions, referral to a specialist or a specialty program would be appropriate.
IF SYMPTOMS PERSIST
With the interventions suggested above, most patients with concussion have a resolution of symptoms and can return to preinjury levels of performance. But some have prolonged symptoms and sequelae. Approximately 10% of athletes have persistent signs and symptoms of concussion beyond 2 weeks. If concussion is not sport-related, most patients recover completely within the first 3 months, but up to 33% may have symptoms beyond that.52
Four types of patients have persistent symptoms:
Patients who sustained a high-force mechanism of injury. These patients simply need more time and accommodation.
Patients who sustained multiple concussions. These patients may also need more time and accommodation.
Patients with an underlying neurologic condition, recognized prior to injury or not, may have delayed or incomplete recovery. Even aging may be an “underlying condition” in concussion.
Patients whose symptoms from an apparently single mild concussion do not resolve despite appropriate treatments may have identifiable factors, but intractable pain (usually headache) or significant emotional disturbance or both are common. Once established and persistent, this is difficult to treat. Referral to a specialty practice is appropriate, but even in that setting effective treatment may be elusive.
PATIENT EDUCATION
Most important for patient education is reassurance. Ultimately, concussion is a self-limited phenomenon, and reinforcing this is helpful for patients. If concussion is not sport-related, most patients recover completely within 3 months.
The next important tenet in patient education is that they should rest for 3 to 5 days, then resume gradual physical and cognitive activities. If resuming activities too soon results in symptoms, then they should rest for a day and gradually resume activity. If their recovery is prolonged (ie, longer than 6 weeks), they likely need to be referred to a concussion specialist.
- Cassidy JD, Carroll LJ, Peloso PM, et al; WHO Collaborating Centre Task Force on Mild Traumatic Brain Injury. Incidence, risk factors and prevention of mild traumatic brain injury: results of the WHO Collaborating Centre Task Force on Mild Traumatic Brain Injury. J Rehabil Med 2004; (suppl):28–60.
- Shaw NA. The neurophysiology of concussion. Prog Neurobiol 2002; 67:281–344.
- Denny-Brown DE, Russell WR. Experimental concussion: (section of neurology). Proc R Soc Med 1941; 34:691–692.
- Ommaya AK, Gennarelli TA. Cerebral concussion and traumatic unconsciousness. Correlation of experimental and clinical observations of blunt head injuries. Brain 1974; 97:633–654.
- Houlburn AHS, Edin MA. Mechanics of head injuries. Lancet 1943; 242:438–441.
- Gennarelli TA, Adams JH, Graham DI. Acceleration induced head injury in the monkey. I. The model, its mechanical and physiological correlates. Acta Neuropathol Suppl 1981; 7:23–25.
- Giza CC, Hovda DA. The neurometabolic cascade of concussion. J Athl Train 2001; 36:228–235.
- Meehan WP 3rd, Bachur RG. Sport-related concussion. Pediatrics 2009; 123:114–123.
- Iverson GL, Silverberg ND, Mannix R, et al. Factors associated with concussion-like symptom reporting in high school athletes. JAMA Pediatr 2015; 169:1132–1140.
- Stiell IG, Wells GA, Vandemheen K. et al. The Canadian CT head rule for patients with minor head injury. Lancet 2001; 357:1391–1396.
- Haydel MJ, Preston CA, Mills TJ, Luber S, Blaudeau E, DeBlieux PMC. Indications for computed tomography in patients with minor head injury. N Engl J Med 2000; 343:100–105.
- Kuppermann N, Holmes JF, Dayan PS, et al; Pediatric Emergency Care Applied Research Network (PECARN). Identification of children at very low risk of clinically important brain injuries after head trauma: a prospective cohort study. Lancet 2009; 374:1160–1170.
- McCrory P, Meeuwisse W, Johnston K, et al. Consensus Statement on Concussion in Sport: the 3rd International Conference on Concussion in Sport held in Zurich, November 2008. Br J Sports Med 2009; 43(suppl 1):i76–i90.
- DeMatteo C, Stazyk K, Singh SK, et al; Ontario Neurotrauma Foundation. Development of a conservative protocol to return children and youth to activity following concussive injury. Clin Pediatr (Phila) 2015; 54:152–163.
- Willer B, Leddy JJ. Management of concussion and post-concussion syndrome. Curr Treat Options Neurol 2006; 8:415–426.
- DiFazio M, Silverberg ND, Kirkwood MW, Bernier R, Iverson GL. Prolonged activity restriction after concussion: are we worsening outcomes? Clin Pediatr (Phila) 2016; 55:443–451.
- Thomas DG, Apps JN, Hoffmann RG, McCrea M, Hammeke T. Benefits of strict rest after acute concussion: a randomized controlled trial. Pediatrics 2015; 135:213–223.
- Leddy JJ, Kozlowski K, Donnelly JP, Pendergast DR, Epstein LH, Willer B. A preliminary study of subsymptom threshold exercise training for refractory post-concussion syndrome. Clin J Sport Med 2010; 20:21–27.
- McCrory P, Meeuwisse WH, Aubry M, et al. Consensus statement on concussion in sport: the 4th International Conference on Concussion in Sport held in Zurich, November 2012. Br J Sports Med 2013; 47:250–258.
- Buckley TA, Munkasy BA, Clouse BP. Acute cognitive and physical rest may not improve concussion recovery time. J Head Trauma Rehabil 2016; 31:233–241.
- Brown NJ, Mannix RC, O'Brien MJ, Gostine D, Collins MW, Meehan WP 3rd. Effect of cognitive activity level on duration of post-concussion symptoms. Pediatrics 2014; 133:e299–e304.
- Packard RC. Epidemiology and pathogenesis of posttraumatic headache. J Head Trauma Rehabil 1999; 14:9–21.
- Couch JR, Bearss C. Chronic daily headache in the posttrauma syndrome: relation to extent of head injury. Headache 2001; 41:559–564.
- Lucas S, Hoffman JM, Bell KR, Dikmen S. A prospective study of prevalence and characterization of headache following mild traumatic brain injury. Cephalalgia 2014; 34:93–102.
- Lucas S, Hoffman JM, Bell KR, Walker W, Dikmen S. Characterization of headache after traumatic brain injury. Cephalalgia 2012; 32:600–606.
- DiTommaso C, Hoffman JM, Lucas S, Dikmen S, Temkin N, Bell KR. Medication usage patterns for headache treatment after mild traumatic brain injury. Headache 2014; 54:511–519.
- Lucas S. Characterization and management of headache after mild traumatic brain injury. In: Kobeissy FH, ed. Brain Neurotrauma: Molecular, Neuropsychological, and Rehabilitation Aspects. Boca Raton, FL: CRC Press/Taylor & Franis Group; 2015:145–154.
- Erickson JC. Treatment outcomes of chronic post-traumatic headaches after mild head trauma in US soldiers: an observational study. Headache 2011; 51:932–944.
- Tyler GS, McNeely HE, Dick ML. Treatment of post-traumatic headache with amitriptyline. Headache 1980; 20:213–216.
- Packard RC. Treatment of chronic daily posttraumatic headache with divalproex sodium. Headache 2000; 40:736–739.
- Kacperski J, Arthur T. Management of post-traumatic headaches in children and adolescents. Headache 2016; 56:36–48.
- Lenaerts ME, Couch JR, Couch JR. Posttraumatic headache. Curr Treat Options Neurol 2004; 6:507–517.
- Valovich McLeod TC, Hale TD. Vestibular and balance issues following sport-related concussion. Brain Inj 2015; 29:175–184.
- Master CL, Cheiman M, Gallaway M, et al. Vision diagnoses are common after concussion in adolescents. Clin Pediatr (Phila) 2016; 55:260–267.
- Tan CO, Meehan WP 3rd, Iverson GL, Taylor JA. Cerebrovascular regulation, exercise and mild traumatic brain injury. Neurology 2014; 83:1665–1672.
- Mahmood O, Rapport LJ, Hanks RA, Fichtenberg NL. Neuropsychological performance and sleep disturbance following traumatic brain injury. J Head Trauma Rehabil 2004; 19:378–390.
- Lewy AJ, Wehr TA, Goodwin FK, Newsome DA, Markey SP. Light suppresses melatonin secretion in humans. Science 1980; 210:1267–1269.
- Figueiro MG, Wood B, Plitnick B, Rea MS. The impact of light from computer monitors on melatonin levels in college students. Neuro Endocrinol Lett 2011; 32:158–163.
- Rao V, Rollings P. Sleep disturbances following traumatic brain injury. Curr Treat Options Neurol 2002; 4:77–87.
- Samantaray S, Das A, Thakore NP, et al. Therapeutic potential of melatonin in traumatic central nervous system injury. J Pineal Res 2009; 47:134–142.
- Ding K, Xu J, Wang H, Zhang L, Wu Y, Li T. Melatonin protects the brain from apoptosis by enhancement of autophagy after traumatic brain injury in mice. Neurochem Int 2015; 91:46–54.
- Babaee A, Eftekhar-Vaghefi SH, Asadi-Shekaari M, et al. Melatonin treatment reduces astrogliosis and apoptosis in rats with traumatic brain injury. Iran J Basic Med Sci 2015; 18:867–872.
- Arciniegas DB, Anderson CA, Topkoff J, McAllister TW. Mild traumatic brain injury: a neuropsychiatric approach to diagnosis, evaluation, and treatment. Neuropsychiatr Dis Treat 2005; 1:311–327.
- O’Donnell ML, Creamer M, Pattison P, Atkin C. Psychiatric morbidity following injury. Am J Psychiatry 2004; 161:507–514.
- Dikmen SS, Bombardier CH, Machamer JE, Fann JR, Temkin NR. Natural history of depression in traumatic brain injury. Arch Phys Med Rehabil 2004; 85:1457–1464.
- Massey JS, Meares S, Batchelor J, Bryant RA. An exploratory study of the association of acute posttraumatic stress, depression, and pain to cognitive functioning in mild traumatic brain injury. Neuropsychology 2015; 29:530–542.
- Meares S, Shores EA, Taylor AJ, et al. The prospective course of postconcussion syndrome: the role of mild traumatic brain injury. Neuropsychology 2011; 25:454–465.
- Solomon GS, Kuhn AW, Zuckerman SL. Depression as a modifying factor in sport-related concussion: a critical review of the literature. Phys Sportsmed 2016; 44:14–19.
- Neurobehavioral Guidelines Working Group; Warden DL, Gordon B, McAllister TW, et al. Guidelines for the pharmacologic treatment of neurobehavioral sequelae of traumatic brain injury. J Neurotrauma 2006; 23:1468–1501.
- Dikmen S, McLean A, Temkin N. Neuropsychological and psychosocial consequences of minor head injury. J Neurol Neurosurg Psychiatry 1986; 49:1227–1232.
- Reddy CC, Collins M, Lovell M, Kontos AP. Efficacy of amantadine treatment on symptoms and neurocognitive performance among adolescents following sports-related concussion. J Head Trauma Rehabil 2013; 28:260–265.
- Leddy JJ, Sandhu H, Sodhi V, Baker JG, Willer B. Rehabilitation of concussion and post-concussion syndrome. Sports Health 2012; 4:147–154.
Concussion, also known as mild traumatic brain injury, affects more than 600 adults per 100,000 each year and is commonly treated by nonneurologists.1 Public attention to concussion has been increasing, particularly to concussion sustained during sports. Coincident with this increased attention, the diagnosis of concussion continues to increase in the outpatient setting. Thus, a review of the topic is timely.
ACCELERATION OF THE BRAIN DUE TO TRAUMA
The definition of concussion has changed considerably over the years. It is currently defined as a pathophysiologic process that results from an acceleration or deceleration of the brain induced by trauma.2 It is largely a temporary, functional problem, as opposed to a gross structural injury.2–5
The acceleration of the brain that results in a concussion is usually initiated by a direct blow to the head, although direct impact is not required.6 As the brain rotates, different areas accelerate at different rates, resulting in a shear strain imparted to the parenchyma.
This shear strain causes deformation of axonal membranes and opening of membrane-associated sodium-potassium channels. This in turn leads to release of excitatory neurotransmitters, ultimately culminating in a wave of neuronal depolarization and a spreading depression-like phenomenon that may mediate the loss of consciousness, posttraumatic amnesia, confusion, and many of the other immediate signs and symptoms associated with concussion.
The sudden metabolic demand created by the massive excitatory phenomena triggers an increased utilization of glucose to restore cellular homeostasis. At the same time, cerebral blood flow decreases after concussion, which, in the setting of increased glucose demand, leads to an “energy crisis”: an increased need for adenosine triphosphate with a concomitant decreased delivery of glucose.7 This mismatch between energy demand and supply is thought to underlie the most common signs and symptoms of concussion.
ASSESSMENT
History
The history of present illness is essential to a diagnosis of concussion. In the classic scenario, an otherwise asymptomatic person sustains some trauma to the head that is followed immediately by the signs and symptoms of concussion.
Many of these signs and symptoms are nonspecific and may occur without concussion or other trauma.8,9 Thus, the diagnosis of concussion cannot be made on the basis of symptoms alone, but only in the overall context of history, physical examination, and, at times, additional clinical assessments.
The symptoms of concussion should gradually improve. While they may be exacerbated by certain activities or stimuli, the overall trend should be one of symptom improvement. If symptoms are worsening over time, alternative explanations for the patient’s symptoms should be considered.
Physical examination
A thorough neurologic examination should be conducted in all patients with suspected concussion and include the following.
A mental status examination should include assessment of attention, memory, and recall. Orientation is normal except in the most acute examinations.
Cranial nerve examination must include careful assessment of eye-movement control, including smooth pursuit and saccades. However, even in patients with prominent subjective dizziness, considerable experience may be needed to actually demonstrate abnormalities.
Balance testing. Balance demands careful assessment and, especially for young athletes, this testing should be more difficult than the tandem gait and eyes-closed, feet-together tests.
Standard strength, sensory, reflex, and coordination testing is usually normal.
Any focal neurologic findings should prompt consideration of other causes or of a more serious injury and should lead to further evaluation, including brain imaging.
Diagnostic tests
Current clinical brain imaging cannot diagnose a concussion. The purpose of neuroimaging is to assess for other etiologies or injuries, such as hemorrhage or contusion, that may cause similar symptoms but require different management.
Several guidelines are available to assess the need for imaging in the setting of recent trauma, of which 2 are typically used10–12:
The Canadian CT Head Rule10 states that computed tomography (CT) is indicated in any of the following situations:
- The patient fails to reach a Glasgow Coma Scale score of 15—on a scale of 3 (worst) to 15 (best)—within 2 hours
- There is a suspected open skull fracture
- There is any sign of basal skull fracture
- The patient has 2 or more episodes of vomiting
- The patient is 65 or older
- The patient has retrograde amnesia (ie, cannot remember events that occurred before the injury) for 30 minutes or more
- The mechanism of injury was dangerous (eg, a pedestrian was struck by a motor vehicle, or the patient fell from > 3 feet or > 5 stairs).
The New Orleans Criteria11 state that a patient warrants CT of the head if any of the following is present:
- Severe headache
- Vomiting
- Age over 60
- Drug or alcohol intoxication
- Deficit in short-term memory
- Physical evidence of trauma above the clavicles
- Seizure.
Caveats: these imaging guidelines apply to adults; those for pediatric patients differ.12 Also, because they were designed for use in an emergency department, their utility in clinical practice outside the emergency department is unclear.
Electroencephalography is not necessary in the evaluation of concussion unless a seizure disorder is believed to be the cause of the injury.
Concussion in athletes
Athletes who participate in contact and collision sports are at higher risk of concussion than the nonathletic population. Therefore, specific assessments of symptoms, balance, oculomotor function, cognitive function, and reaction time have been developed for athletes.
Ideally, these measures are taken at preseason baseline, so that they are available for comparison with postinjury assessments after a known or suspected concussion. These assessments can be used to help make the diagnosis of concussion in cases that are unclear and to help monitor recovery. Objective measures of injury are especially useful for athletes who may be reluctant to report symptoms in order to return to play.
Like most medical tests, these assessments need to be properly interpreted in the overall context of the medical history and physical examination by those who know how to administer them. It is important to remember that the natural history of concussion recovery differs between sport-related concussion and concussion that occurs outside of sports.8
MANAGEMENT
The symptoms and signs after concussion are so variable and multidimensional that they make a generally applicable treatment hard to define.
Rest: Physical and cognitive
Treatment depends on the specifics of the injury, but there are common recommendations for the acute days after injury. Lacking hard data, the consensus among experts is that patients should undergo a period of physical and cognitive rest.13,14 Exactly what “rest” means and how long it should last are unknown, leading to a wide variation in its application.
Rest aids recovery but also may have adverse effects: fatigue, diurnal sleep disruption, reactive depression, anxiety, and physiologic deconditioning.15,16 Many guidelines recommend physical and cognitive rest until symptoms resolve,14 but this is likely too cautious. Even without a concussion, inactivity is associated with many of the nonspecific symptoms also associated with concussion. As recovery progresses, the somatic symptoms of concussion improve, while emotional symptoms worsen, likely in part due to prolonged rest.17
We recommend a period of rest lasting 3 to 5 days after injury, followed by a gradual resumption of both physical and cognitive activities as tolerated, remaining below the level at which symptoms are exacerbated.
Not surprisingly, many guidelines for returning to physical activity are focused on athletes. Yet the same principles apply to management of concussion in the general population who exercise: light physical activity (typically walking or stationary bicycling), followed by more vigorous aerobic activity, followed by some resistance activities. Mild aerobic exercise (to below the threshold of symptoms) may speed recovery from refractive postconcussion syndrome, even in those who did not exercise before the injury.18
Athletes require specific and strict instructions to avoid increased trauma to the head during the gradual increase of physical activities. The National Collegiate Athletic Association has published an algorithm for a gradual return to sport-specific training that is echoed in recent consensus statements on concussion.19 Once aerobic reconditioning produces no symptoms, then noncontact, sport-specific activities are begun, followed by contact activities. We have patients return to the clinic once they are symptom-free for repeat evaluation before clearing them for high-risk activities (eg, skiing, bicycling) or contact sports (eg, basketball, soccer, football, ice hockey).
Cognitive rest
While physical rest is fairly straightforward, cognitive rest is more challenging. The concept of cognitive rest is hard to define and even harder to enforce. Patients are often told to minimize any activities that require attention or concentration. This often includes, but is not limited to, avoiding reading, texting, playing video games, and using computers.13
In the modern world, full avoidance of these activities is difficult and can be profoundly socially isolating. Further, complete cognitive rest may be associated with symptoms of its own.15,16,20 Still, some reasonable limitation of cognitive activities, at least initially, is likely beneficial.21 For patients engaged in school or academic work, often the daily schedule needs to be adjusted and accommodations made to help them return to a full academic schedule and level of activity. It is reasonable to have patients return gradually to work or school rather than attempt to immediately return to their preinjury level.
With these interventions, most patients have full resolution of their symptoms and return to preinjury levels of performance.
TREATING SOMATIC SYMPTOMS
Posttraumatic headache
Posttraumatic headache is the most common sequela of concussion.22 Surprisingly, it is more common after concussion than after moderate or severe traumatic brain injury.23 A prior history of headache, particularly migraine, is a known risk factor for development of posttraumatic headache.24
Posttraumatic headache is usually further defined by headache type using the International Classification of Headache Disorders criteria (www.ichd-3.org). Migraine or probable migraine is the most common type of posttraumatic headache; tension headache is less common.25
Analgesics such as nonsteroidal anti-inflammatory drugs (NSAIDs) are often used initially by patients to treat posttraumatic headache. One study found that 70% of patients used acetaminophen or an NSAID.26
Treating early with effective therapy is the most important tenet of posttraumatic headache treatment, since 80% of those who self-treat have incomplete relief, and almost all of them are using over-the-counter products.27 Overuse of over-the-counter abortive medications can lead to medication overuse headache, also known as rebound headache, thus complicating the treatment of posttraumatic headache.26
Earlier treatment with a preventive medication can often limit the need for and overuse of over-the-counter analgesics and can minimize the occurrence of subsequent medication overuse headache. However, in pediatric populations, nonpharmacologic interventions such as rest and sleep hygiene are typically used first, then medications after 4 to 6 weeks if this is ineffective.
A number of medications have been studied for prophylactic treatment of posttraumatic headache, including topiramate, amitriptyline, and divalproex sodium,28–30 but there is little compelling evidence for use of one over the other. If posttraumatic headache is migrainous, beta-blockers, calcium-channel blockers, selective serotonin reuptake inhibitors, serotonin-norepinephrine reuptake inhibtors, and gabapentin are other prophylactic medication options under the appropriate circumstances.27,31,32 In adults, we have clinically had success with nortriptyline 20 mg or gabapentin 300 mg at night as an initial prophylactic headache medication, increasing as tolerated or until pain is controlled, though there are no high-quality data to guide this decision.
The ideal prophylactic medication depends on headache type, patient tolerance, comorbidities, allergies, and medication sensitivities. Gabapentin, amitriptyline, and nortriptyline can produce sedation, which can help those suffering from sleep disturbance.
If a provider is not comfortable prescribing these medications or doesn’t prescribe them regularly, the patient should be referred to a concussion or headache specialist more familiar with their use.
In some patients, even some athletes, headache may be related to a cervical strain injury—whiplash—that should be treated with an NSAID (or acetaminophen), perhaps with a short course of a muscle relaxant in adults, and with physical therapy.32
Some patients have chronic headache despite oral medications.26 Therefore, alternatives to oral medications and complementary therapies should be considered. Especially for protracted cases requiring more complicated headache management or injectable treatments, patients should be referred to a pain clinic, headache specialist, or concussion specialist.
Dizziness
Dizziness is also common after concussion. But what the patient means by dizziness requires a little probing. Some have paroxysms of vertigo. This typically represents a peripheral vestibular injury, usually benign paroxysmal positional vertigo. The latter can be elicited with a Hallpike maneuver and treated in the office with the Epley maneuver.33
Usually, dizziness is a subjective sense of poor coordination, gait instability, or dysequilibrium. Patients may also complain of associated nausea and motion sensitivity. This may all be secondary to a mechanism in the middle or inner ear or the brain. Patients should be encouraged to begin movement—gradually and safely—to help the vestibular system accommodate, which it will do with gradual stimulation. It usually resolves spontaneously.
Specific treatment is unfortunately limited. There is no established benefit from vestibular suppressants such as meclizine. Vestibular rehabilitation may accelerate improvement and decrease symptoms.33 Referral for a comprehensive balance assessment or to vestibular therapy (a subset of physical therapy) should be considered and is something we typically undertake in our clinic if there is no recovery from dizziness 4 to 6 weeks after the concussion.
Visual symptoms can contribute to dizziness. Convergence spasm or convergence insufficiency (both related to muscle spasm of the eye) can occur after concussion, with some studies estimating that up to 69% of patients have these symptoms.34 This can interfere with visual tracking and contribute to a feeling of dysequilibrium.34 Referral to a concussion specialist or vestibular rehabilitation physical therapist can be helpful in treating this issue if it does not resolve spontaneously.
Orthostasis and lightheadedness also contribute to dizziness and are associated with cerebrovascular autoregulation. Available data suggest that dysregulation of neurovascular coupling, cerebral vasoreactivity, and cerebral autoregulation contribute to some of the chronic symptoms of concussion, including dizziness. A gradual return to exercise may help regulate cerebral blood flow and improve this type of dizziness.35
Sleep disturbance
Sleep disturbance is common after concussion, but the form is variable: insomnia, excessive daytime somnolence, and alteration of the sleep-wake cycle are all seen and may themselves affect recovery.36
Sleep hygiene education should be the first intervention for postconcussive sleep issues. For example, the patient should be encouraged to do the following:
- Minimize “screen time” an hour before going to bed: cell phone, tablet, and computer screens emit a wavelength of light that suppresses endogenous melatonin release37,38
- Go to bed and wake up at the same time each day
- Minimize or avoid caffeine, nicotine, and alcohol
- Avoid naps.39
Melatonin is a safe and effective treatment that could be added.40 In addition, some studies suggest that melatonin may improve recovery from traumatic brain injury.41,42
Mild exercise (to below the threshold of causing or exacerbating symptoms) may also improve sleep quality.
Amitriptyline or nortriptyline may reduce headache frequency and intensity and also help treat insomnia.
Trazodone is recommended by some as a first-line agent,39 but we usually reserve it for protracted insomnia refractory to the above treatments.
Benzodiazepines should be avoided, as they reduce arousal, impair cognition, and exacerbate motor impairments.43
Emotional symptoms
Acute-onset anxiety or depression often occurs after concussion.44,45 There is abundant evidence that emotional effects of injury may be the most significant factor in recovery.46 A preinjury history of anxiety may be a prognostic factor.9 Patients with a history of anxiety or depression are more likely to develop emotional symptoms after a concussion, but emotional problems may develop in any patient after a concussion.47,48
The circumstances under which an injury is sustained may be traumatic (eg, car accident, assault), leading to an acute stress reaction or disorder and, if untreated, may result in a more chronic condition—posttraumatic stress disorder. Moreover, the injury and subsequent symptoms may have repercussions in many aspects of the patient’s life, leading to further psychologic stress (eg, loss of wages or the inability to handle normal work, school, and family responsibilities).
Referral to a therapist trained in skills-based psychotherapy (eg, cognitive-behavioral therapy, exposure-based treatment) is often helpful.
Pharmacologic treatment can be a useful adjunct. Several studies have shown that selective serotonin reuptake inhibitors, serotonin-norepinephrine reuptake inhibitors, and tricyclic antidepressants may improve depression after concussion.49 The prescription of antidepressants, however, is best left to providers with experience in treating anxiety and depression.
As with sleep disorders after concussion, benzodiazepines should be avoided, as they can impair cognition.43
Cognitive problems
Cognitive problems are also common after concussion. Patients complain about everyday experiences of forgetfulness, distractibility, loss of concentration, and mental fatigue. Although patients often subjectively perceive these symptoms as quite limiting, the impairments can be difficult to demonstrate in office testing.
A program of gradual increase in mental activity, parallel to recovery of physical capacity, should be undertaken. Most patients make a gradual recovery within a few weeks.50
When cognitive symptoms cause significant school or vocational problems or become persistent, patients should be referred to a specialty clinic. As with most of the consequences of concussion, there are few established treatments. When cognitive difficulties persist, it is important to consider the complications of concussion mentioned above: headache, pain, sleep disturbance, and anxiety, all of which may cause subjective cognitive problems and are treatable.
If cognitive symptoms are prolonged despite improvement of other issues like headache and sleep disturbance, a low-dose stimulant medication such as amphetamine salts or methylphenidate may be useful for symptoms of poor attention.49 They should be only a temporary measure after concussion to carry the patient through a cognitively challenging period, unless there was a history of attention-deficit disorder before the injury. A variety of other agents, including amantadine,51 have been proposed based on limited studies; all are off-label uses. Before considering these types of interventions, referral to a specialist or a specialty program would be appropriate.
IF SYMPTOMS PERSIST
With the interventions suggested above, most patients with concussion have a resolution of symptoms and can return to preinjury levels of performance. But some have prolonged symptoms and sequelae. Approximately 10% of athletes have persistent signs and symptoms of concussion beyond 2 weeks. If concussion is not sport-related, most patients recover completely within the first 3 months, but up to 33% may have symptoms beyond that.52
Four types of patients have persistent symptoms:
Patients who sustained a high-force mechanism of injury. These patients simply need more time and accommodation.
Patients who sustained multiple concussions. These patients may also need more time and accommodation.
Patients with an underlying neurologic condition, recognized prior to injury or not, may have delayed or incomplete recovery. Even aging may be an “underlying condition” in concussion.
Patients whose symptoms from an apparently single mild concussion do not resolve despite appropriate treatments may have identifiable factors, but intractable pain (usually headache) or significant emotional disturbance or both are common. Once established and persistent, this is difficult to treat. Referral to a specialty practice is appropriate, but even in that setting effective treatment may be elusive.
PATIENT EDUCATION
Most important for patient education is reassurance. Ultimately, concussion is a self-limited phenomenon, and reinforcing this is helpful for patients. If concussion is not sport-related, most patients recover completely within 3 months.
The next important tenet in patient education is that they should rest for 3 to 5 days, then resume gradual physical and cognitive activities. If resuming activities too soon results in symptoms, then they should rest for a day and gradually resume activity. If their recovery is prolonged (ie, longer than 6 weeks), they likely need to be referred to a concussion specialist.
- Cassidy JD, Carroll LJ, Peloso PM, et al; WHO Collaborating Centre Task Force on Mild Traumatic Brain Injury. Incidence, risk factors and prevention of mild traumatic brain injury: results of the WHO Collaborating Centre Task Force on Mild Traumatic Brain Injury. J Rehabil Med 2004; (suppl):28–60.
- Shaw NA. The neurophysiology of concussion. Prog Neurobiol 2002; 67:281–344.
- Denny-Brown DE, Russell WR. Experimental concussion: (section of neurology). Proc R Soc Med 1941; 34:691–692.
- Ommaya AK, Gennarelli TA. Cerebral concussion and traumatic unconsciousness. Correlation of experimental and clinical observations of blunt head injuries. Brain 1974; 97:633–654.
- Houlburn AHS, Edin MA. Mechanics of head injuries. Lancet 1943; 242:438–441.
- Gennarelli TA, Adams JH, Graham DI. Acceleration induced head injury in the monkey. I. The model, its mechanical and physiological correlates. Acta Neuropathol Suppl 1981; 7:23–25.
- Giza CC, Hovda DA. The neurometabolic cascade of concussion. J Athl Train 2001; 36:228–235.
- Meehan WP 3rd, Bachur RG. Sport-related concussion. Pediatrics 2009; 123:114–123.
- Iverson GL, Silverberg ND, Mannix R, et al. Factors associated with concussion-like symptom reporting in high school athletes. JAMA Pediatr 2015; 169:1132–1140.
- Stiell IG, Wells GA, Vandemheen K. et al. The Canadian CT head rule for patients with minor head injury. Lancet 2001; 357:1391–1396.
- Haydel MJ, Preston CA, Mills TJ, Luber S, Blaudeau E, DeBlieux PMC. Indications for computed tomography in patients with minor head injury. N Engl J Med 2000; 343:100–105.
- Kuppermann N, Holmes JF, Dayan PS, et al; Pediatric Emergency Care Applied Research Network (PECARN). Identification of children at very low risk of clinically important brain injuries after head trauma: a prospective cohort study. Lancet 2009; 374:1160–1170.
- McCrory P, Meeuwisse W, Johnston K, et al. Consensus Statement on Concussion in Sport: the 3rd International Conference on Concussion in Sport held in Zurich, November 2008. Br J Sports Med 2009; 43(suppl 1):i76–i90.
- DeMatteo C, Stazyk K, Singh SK, et al; Ontario Neurotrauma Foundation. Development of a conservative protocol to return children and youth to activity following concussive injury. Clin Pediatr (Phila) 2015; 54:152–163.
- Willer B, Leddy JJ. Management of concussion and post-concussion syndrome. Curr Treat Options Neurol 2006; 8:415–426.
- DiFazio M, Silverberg ND, Kirkwood MW, Bernier R, Iverson GL. Prolonged activity restriction after concussion: are we worsening outcomes? Clin Pediatr (Phila) 2016; 55:443–451.
- Thomas DG, Apps JN, Hoffmann RG, McCrea M, Hammeke T. Benefits of strict rest after acute concussion: a randomized controlled trial. Pediatrics 2015; 135:213–223.
- Leddy JJ, Kozlowski K, Donnelly JP, Pendergast DR, Epstein LH, Willer B. A preliminary study of subsymptom threshold exercise training for refractory post-concussion syndrome. Clin J Sport Med 2010; 20:21–27.
- McCrory P, Meeuwisse WH, Aubry M, et al. Consensus statement on concussion in sport: the 4th International Conference on Concussion in Sport held in Zurich, November 2012. Br J Sports Med 2013; 47:250–258.
- Buckley TA, Munkasy BA, Clouse BP. Acute cognitive and physical rest may not improve concussion recovery time. J Head Trauma Rehabil 2016; 31:233–241.
- Brown NJ, Mannix RC, O'Brien MJ, Gostine D, Collins MW, Meehan WP 3rd. Effect of cognitive activity level on duration of post-concussion symptoms. Pediatrics 2014; 133:e299–e304.
- Packard RC. Epidemiology and pathogenesis of posttraumatic headache. J Head Trauma Rehabil 1999; 14:9–21.
- Couch JR, Bearss C. Chronic daily headache in the posttrauma syndrome: relation to extent of head injury. Headache 2001; 41:559–564.
- Lucas S, Hoffman JM, Bell KR, Dikmen S. A prospective study of prevalence and characterization of headache following mild traumatic brain injury. Cephalalgia 2014; 34:93–102.
- Lucas S, Hoffman JM, Bell KR, Walker W, Dikmen S. Characterization of headache after traumatic brain injury. Cephalalgia 2012; 32:600–606.
- DiTommaso C, Hoffman JM, Lucas S, Dikmen S, Temkin N, Bell KR. Medication usage patterns for headache treatment after mild traumatic brain injury. Headache 2014; 54:511–519.
- Lucas S. Characterization and management of headache after mild traumatic brain injury. In: Kobeissy FH, ed. Brain Neurotrauma: Molecular, Neuropsychological, and Rehabilitation Aspects. Boca Raton, FL: CRC Press/Taylor & Franis Group; 2015:145–154.
- Erickson JC. Treatment outcomes of chronic post-traumatic headaches after mild head trauma in US soldiers: an observational study. Headache 2011; 51:932–944.
- Tyler GS, McNeely HE, Dick ML. Treatment of post-traumatic headache with amitriptyline. Headache 1980; 20:213–216.
- Packard RC. Treatment of chronic daily posttraumatic headache with divalproex sodium. Headache 2000; 40:736–739.
- Kacperski J, Arthur T. Management of post-traumatic headaches in children and adolescents. Headache 2016; 56:36–48.
- Lenaerts ME, Couch JR, Couch JR. Posttraumatic headache. Curr Treat Options Neurol 2004; 6:507–517.
- Valovich McLeod TC, Hale TD. Vestibular and balance issues following sport-related concussion. Brain Inj 2015; 29:175–184.
- Master CL, Cheiman M, Gallaway M, et al. Vision diagnoses are common after concussion in adolescents. Clin Pediatr (Phila) 2016; 55:260–267.
- Tan CO, Meehan WP 3rd, Iverson GL, Taylor JA. Cerebrovascular regulation, exercise and mild traumatic brain injury. Neurology 2014; 83:1665–1672.
- Mahmood O, Rapport LJ, Hanks RA, Fichtenberg NL. Neuropsychological performance and sleep disturbance following traumatic brain injury. J Head Trauma Rehabil 2004; 19:378–390.
- Lewy AJ, Wehr TA, Goodwin FK, Newsome DA, Markey SP. Light suppresses melatonin secretion in humans. Science 1980; 210:1267–1269.
- Figueiro MG, Wood B, Plitnick B, Rea MS. The impact of light from computer monitors on melatonin levels in college students. Neuro Endocrinol Lett 2011; 32:158–163.
- Rao V, Rollings P. Sleep disturbances following traumatic brain injury. Curr Treat Options Neurol 2002; 4:77–87.
- Samantaray S, Das A, Thakore NP, et al. Therapeutic potential of melatonin in traumatic central nervous system injury. J Pineal Res 2009; 47:134–142.
- Ding K, Xu J, Wang H, Zhang L, Wu Y, Li T. Melatonin protects the brain from apoptosis by enhancement of autophagy after traumatic brain injury in mice. Neurochem Int 2015; 91:46–54.
- Babaee A, Eftekhar-Vaghefi SH, Asadi-Shekaari M, et al. Melatonin treatment reduces astrogliosis and apoptosis in rats with traumatic brain injury. Iran J Basic Med Sci 2015; 18:867–872.
- Arciniegas DB, Anderson CA, Topkoff J, McAllister TW. Mild traumatic brain injury: a neuropsychiatric approach to diagnosis, evaluation, and treatment. Neuropsychiatr Dis Treat 2005; 1:311–327.
- O’Donnell ML, Creamer M, Pattison P, Atkin C. Psychiatric morbidity following injury. Am J Psychiatry 2004; 161:507–514.
- Dikmen SS, Bombardier CH, Machamer JE, Fann JR, Temkin NR. Natural history of depression in traumatic brain injury. Arch Phys Med Rehabil 2004; 85:1457–1464.
- Massey JS, Meares S, Batchelor J, Bryant RA. An exploratory study of the association of acute posttraumatic stress, depression, and pain to cognitive functioning in mild traumatic brain injury. Neuropsychology 2015; 29:530–542.
- Meares S, Shores EA, Taylor AJ, et al. The prospective course of postconcussion syndrome: the role of mild traumatic brain injury. Neuropsychology 2011; 25:454–465.
- Solomon GS, Kuhn AW, Zuckerman SL. Depression as a modifying factor in sport-related concussion: a critical review of the literature. Phys Sportsmed 2016; 44:14–19.
- Neurobehavioral Guidelines Working Group; Warden DL, Gordon B, McAllister TW, et al. Guidelines for the pharmacologic treatment of neurobehavioral sequelae of traumatic brain injury. J Neurotrauma 2006; 23:1468–1501.
- Dikmen S, McLean A, Temkin N. Neuropsychological and psychosocial consequences of minor head injury. J Neurol Neurosurg Psychiatry 1986; 49:1227–1232.
- Reddy CC, Collins M, Lovell M, Kontos AP. Efficacy of amantadine treatment on symptoms and neurocognitive performance among adolescents following sports-related concussion. J Head Trauma Rehabil 2013; 28:260–265.
- Leddy JJ, Sandhu H, Sodhi V, Baker JG, Willer B. Rehabilitation of concussion and post-concussion syndrome. Sports Health 2012; 4:147–154.
KEY POINTS
- Concussion results from a traumatic acceleration of the brain that leads to a metabolic mismatch, with an increased demand for adenosine triphosphate but decreased blood flow to the brain. This “energy crisis” results in variable signs and symptoms, most commonly headache, dizziness, sleep disturbance, cognitive problems, and emotional difficulties.
- Initial therapy involves several days of cognitive and physical rest, followed by a gradual return to physical and cognitive activities.
- There is no direct treatment for the physiology of concussion, but early treatment of symptoms and education about recovery and accommodations aids functional recovery.
Improving Veteran Engagement With Mental Health Care
The VA is intent on reducing and preventing veteran deaths by suicide. Most veteran who die by suicide, however, did not get treatment from the VHA, emphasizing the need for improved outreach to those veterans who are not part of the VA health care system.
I will begin by reviewing some reasons why veterans do not go to the VHA or to other mental health treatment centers and how we can change that. I am well aware that the health care providers at the DoD and VHA—including myself—feel overwhelmed by the influx of patients already at their doorstep. Thus, many providers are ambivalent about bringing in more patients when timely access remains a challenge. However, it is critical to engage patients in care to try to improve their lives and, hopefully, bring down the suicide rate.
Another critical issue then is hiring additional clinical providers and administrative staff. More providers are essential for timely patient care. If phones are not answered and patients cannot make appointments, they become frustrated and give up, especially if they already are ambivalent about seeking treatment.
Mental Health Service Experiences
Active-duty service members’ experience of the mental health service ranges from helpful to humiliating. Why is this? The helpful part is easy. The military has hundreds of finely trained professional mental health care providers who try their best to help the soldiers, marines, airmen, and sailors recover from the stress of combat or from providing humanitarian assistance. They use up-to-date therapeutic techniques and medication.
At the humiliating end of the spectrum, many service members are sent to behavioral health for “clearance” before they are administratively separated, ie, discharged without benefits. The separation may be for a variety of administrative discharges, such as a personality disorder; other mental health or medical disorders; or less than honorable discharges. The labels of the discharge vary in the different services, but the disappointment remains.
If the service member is enrolled in a drug and alcohol program (eg, the Army Substance Alcohol Program), the standard is total abstinence. If a service member fails to achieve abstinence, he or she may be discharged without benefits. The denial of benefits is controversial but is still the standard. I recommend a harm reduction model, eg, less drinking or drug use, which may be more achievable in many cases.
The waiting room of a military mental health or behavioral health clinic usually is occupied with service members who are facing a variety of discharges from the military (considered “losers”). Sitting in a crowded waiting room, sometimes for hours, can be humiliating.
To be clear, the clinic experience is not always humiliating. At many Wounded Warrior clinics, the environment is more welcoming. For example, at the National Intrepid Center of Excellence and other specialty clinics, the atmosphere is much more therapeutic.
Significantly, the negative feelings from the routine military clinics often translate into reluctance to go to a mental health clinic at the VHA or elsewhere. To reduce the stigma, the military has switched from using the term mental health to behavioral health, but a name change does not really change the stigma.
Ending the Stigma
To reduce the stigma, DoD has deployed many public service announcements (PSAs). These often have positive messages, such as: It is a sign of strength to accept help; Being mentally injured is like having a broken leg; I am a 3-star general, I have PTSD, and I got help—you can too. Unfortunately, these messages do not resonate with many service members: They have seen many of their friends discharged after seeking mental health services (although that may not have been the actual reason for their discharge). Hoping for a promotion may lead to avoidance of care out of fear that treatment will lead to being passed over for promotion.
Reluctance
When service members come to the VA, it is often with a defeatist attitude. “My wife said I need to come, or she will divorce me.” “I cannot concentrate in school, and I am failing classes.” “My girlfriend threw me out, and I have no place to live.” There is an initial interview with a mental health provider—often after a long waiting period. Often the veteran does not return for a follow-up.
Unquestionably, psychiatric and psychological treatments benefit service members—but the treatments also have drawbacks. Psychiatric medications, although potentially helpful often cause weight gain and sexual adverse effects. Trauma-based therapies deliberately force service members to reexperience the trauma. Reliving the traumatic experience is inherently painful. Additionally, there may be practical concerns, such as getting to the clinic, traffic, and parking.
Solutions
So how do we engage the veteran? There are several well-established practices. I am a big supporter of all veteran outreach. The veteran service organizations (VSOs) are well established but traditionally appeal to older veterans. However, VSOs are working to reach younger veterans in the context of outreach or sporting activities. Peer outreach also works well with veterans in or out of the VA system connecting with their fellow veterans. I favor engaging veterans through baseball games, kayaking, picnics, and other athletic/social activities. These are nonthreatening ways to engage the veteran and his or her family. Using animals, especially dogs and horses, also is a good way to connect.
Clinical Strategies
When I treat veterans who are ambivalent—which the younger ones usually are—I ask where they live, then when or where did they serve, and what was their military occupational specialty. In other words, I ask them about their strengths.
Besides the standard depression and PTSD symptoms, I ask about sexual health, knowing that it often is a major concern. I describe the wide range of PTSD treatments, using the “3 buckets” model to describe them. The 3 buckets are psychiatric medication, talking therapies, and everything else. The last bucket includes exercise, yoga, meditation, animal-assisted therapies, and others, such as transcranial magnetic stimulation and stellate ganglion block.
Veterans often are more comfortable with the last bucket, as it allows them more options. With this knowledge the service members have more tools, so they feel less helpless and more in charge of their health care.
Conclusion
There are many reasons why service members do not seek mental health care. Stigma is one that is often cited. Also, they often associate mental health treatment with humiliation. We have a duty to change that paradigm.

Understanding the bell-ringing of concussion

We well recall, back in the day, getting our “bell rung” from some form of sports-related head contact. If we could count the coach’s fingers clearly, run fast and straight, and know the plays, we could happily go back into the game. There was little additional thought given to short-term or lasting effects. I recall hearing tales from my grandfather, a boxing enthusiast, of retired punch-drunk fighters working as bouncers and greeters at sports-focused restaurants and clubs. I certainly didn’t draw any link to a few episodes of personally feeling spacey or dizzy after playing football.
But now, as parents, we are all highly tuned in to the issue of wrongly minimized “minor” head contact and concussion in our children playing sports. There is a growing research-based understanding of the mechanisms of concussion, which remains a clinical syndrome diagnosed on the basis of symptoms and sometimes subtle objective findings that occur in the appropriate environmental context. Intracranial brain impact sets the stage for locally spreading firing of neurons outside their usual pattern. This can result in a diffuse jamming of some normal electrochemical pathways of cognitive function, as well as create additional mismatch between neuronal metabolic needs and the local blood flow providing oxygen and nutrients. This disruption in autoregulation of blood flow sets the stage for enhanced brain sensitivity to any second injurious event, even a minimal one. Hence the aggressive implementation of enforced rest and recovery time for athletes and others with concussion.
It is critical to realize that the patient may not have had a loss of consciousness. Equally important is to consider the need for imaging and protection of patients who are not recovering as expected in 7 to 10 days, as well as for initial imaging of those with severe head impact or baseline neurologic disease, the aged, and those on anticoagulation.

Pseudo-Wellens syndrome after heavy marijuana use
A 22-year old man with no cardiac history presented to our emergency department after 5 days of dyspnea, cough, vomiting, and sharp intermittent epigastric pain. He used marijuana chronically and had inhaled it in unusually high amounts for several days before the onset of his symptoms.
The physical examination was unremarkable. Diagnostic tests including a complete blood cell count, complete metabolic panel, lipase level, urinalysis, and chest radiography showed no notable abnormalities. A urine drug screen revealed marijuana use.
, normal precordial R-wave progression, and absent Q waves.")
Given this clinical picture, the question was whether cardiac catheterization was needed. Our young, previously healthy patient lacked risk factors for coronary artery disease and did not present with chest pain. Though dyspnea and epigastric pain are angina equivalents, he did not have the profile of patients commonly presenting with angina. Further, acute marijuana intoxication has been reported to be associated with reversible changes affecting the P and T waves and ST segments.1,2 The likelihood of critical occlusion of the left anterior descending artery in this patient was deemed low.

PSEUDO-WELLENS SYNDROME
Wellens syndrome is characterized by biphasic or deeply inverted T waves in leads V2 and V3, normal precordial R-wave progression, and the absence of pathologic Q waves, in addition to a history of angina and minimal or no elevation of cardiac enzymes in a patient with or without ongoing chest pain.3,4 This ominous syndrome is associated with critical occlusion of the proximal left anterior descending artery whose natural history is anterior myocardial infarction in the next few days. Stress testing is contraindicated, and urgent catheterization is warranted to prevent progression to myocardial infarction, even in patients without known heart disease or multiple cardiac risk factors.5
This case shows that acute marijuana intoxication may present with symptoms typical of Wellens syndrome. Because Wellens syndrome is considered highly specific for impending anterior myocardial infarction, urgent cardiac catheterization typically would be recommended. In this age of increasing use and legalization of marijuana, knowledge of the electrocardiographic findings associated with heavy marijuana use may prevent unnecessary cardiac catheterization procedures, especially in patients at low risk.
- Ghuran A, Nolan J. Recreational drug misuse: issues for the cardiologist. Heart 2000; 83:627–633.
- Bachs L, Morland H. Acute cardiovascular fatalities following cannabis use. Forensic Sci Int 2001; 124:200–203.
- de Zwaan C, Bar FW, Wellens HJ. Characteristic electrocardiographic pattern indicating a critical stenosis high in left anterior descending coronary artery in patients admitted because of impending myocardial infarction. Am Heart J 1982; 103:730–736.
- Rhinehardt J, Brady WJ, Perron AD, Mattu A. Electrocardiographic manifestations of Wellens’ syndrome. Am J Emerg Med 2002; 20:638–643.
- Mead NE, O’Keefe KP. Wellen’s syndrome: an ominous EKG pattern. J Emerg Trauma Shock 2009; 2:206–208.
A 22-year old man with no cardiac history presented to our emergency department after 5 days of dyspnea, cough, vomiting, and sharp intermittent epigastric pain. He used marijuana chronically and had inhaled it in unusually high amounts for several days before the onset of his symptoms.
The physical examination was unremarkable. Diagnostic tests including a complete blood cell count, complete metabolic panel, lipase level, urinalysis, and chest radiography showed no notable abnormalities. A urine drug screen revealed marijuana use.
Given this clinical picture, the question was whether cardiac catheterization was needed. Our young, previously healthy patient lacked risk factors for coronary artery disease and did not present with chest pain. Though dyspnea and epigastric pain are angina equivalents, he did not have the profile of patients commonly presenting with angina. Further, acute marijuana intoxication has been reported to be associated with reversible changes affecting the P and T waves and ST segments.1,2 The likelihood of critical occlusion of the left anterior descending artery in this patient was deemed low.
PSEUDO-WELLENS SYNDROME
Wellens syndrome is characterized by biphasic or deeply inverted T waves in leads V2 and V3, normal precordial R-wave progression, and the absence of pathologic Q waves, in addition to a history of angina and minimal or no elevation of cardiac enzymes in a patient with or without ongoing chest pain.3,4 This ominous syndrome is associated with critical occlusion of the proximal left anterior descending artery whose natural history is anterior myocardial infarction in the next few days. Stress testing is contraindicated, and urgent catheterization is warranted to prevent progression to myocardial infarction, even in patients without known heart disease or multiple cardiac risk factors.5
This case shows that acute marijuana intoxication may present with symptoms typical of Wellens syndrome. Because Wellens syndrome is considered highly specific for impending anterior myocardial infarction, urgent cardiac catheterization typically would be recommended. In this age of increasing use and legalization of marijuana, knowledge of the electrocardiographic findings associated with heavy marijuana use may prevent unnecessary cardiac catheterization procedures, especially in patients at low risk.
- Ghuran A, Nolan J. Recreational drug misuse: issues for the cardiologist. Heart 2000; 83:627–633.
- Bachs L, Morland H. Acute cardiovascular fatalities following cannabis use. Forensic Sci Int 2001; 124:200–203.
- de Zwaan C, Bar FW, Wellens HJ. Characteristic electrocardiographic pattern indicating a critical stenosis high in left anterior descending coronary artery in patients admitted because of impending myocardial infarction. Am Heart J 1982; 103:730–736.
- Rhinehardt J, Brady WJ, Perron AD, Mattu A. Electrocardiographic manifestations of Wellens’ syndrome. Am J Emerg Med 2002; 20:638–643.
- Mead NE, O’Keefe KP. Wellen’s syndrome: an ominous EKG pattern. J Emerg Trauma Shock 2009; 2:206–208.
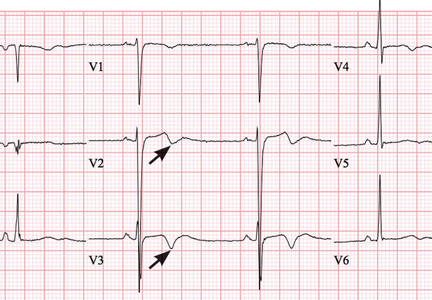
Weight loss, fatigue, and renal failure
A black 37-year-old man has gradually lost 100 lb (45 kg) over the past 2 years, and reports progressive fatigue and malaise as well. He has not noted swollen lymph nodes, fever, or night sweats. He denies dyspnea, cough, or chest pain. He has no skin rashes, and no dry or red eyes or visual changes. He reports no flank pain, dysuria, frank hematuria, foamy urine, decline in urine output, or difficulty voiding.
He has no history of significant medical conditions. He does not drink, smoke, or use recreational drugs. He is not taking any prescription medications and has not been using nonsteroidal anti-inflammatory drugs (NSAIDs) or combination analgesics. He does not have a family history of kidney disease.
Physical examination. He appears relaxed and comfortable. He does not have nasal polyps or signs of pharyngeal inflammation. He has no apparent lymphadenopathy. His breath sounds are normal without rales or wheezes. Cardiac examination reveals a regular rhythm, with no rub or murmurs. The abdomen is soft and nontender with no flank pain or groin tenderness. The skin is intact with no rash or nodules.
- Temperature 98.4ºF (36.9ºC)
- Blood pressure 125/70 mm Hg
- Heart rate 102 beats per minute
- Respiratory rate 19 per minute
- Oxygen saturation 99% while breathing room air
- Weight 194 lb (88 kg)
- Body mass index 28 kg/m2.

Laboratory testing (Table 1) reveals severe renal insufficiency with anemia:
- Serum creatinine 9 mg/dL (reference range 0.5–1.2)
- Estimated glomerular filtration rate (eGFR) 8 mL/min/1.73m2 (using the Modification of Diet in Renal Disease Study equation).
His serum calcium level is normal, but his serum phosphorus is 5.3 mg/dL (reference range 2.5–4.6), and his parathyroid hormone level is 317 pg/mL (12–88), consistent with hyperparathyroidism secondary to chronic kidney disease. His 25-hydroxyvitamin D level is less than 13 ng/mL (30–80), and angiotensin-converting enzyme (ACE) is 129 U/L (9–67 U/L). His urinary calcium level is less than 3.0 mg/dL.
Urinalysis:
- Urine protein 100 mg/dL (0–20)
- No urine crystals
- 3 to 5 coarse granular urine casts per high-power field
- No hematuria or pyuria.

Renal ultrasonography shows normal kidneys with no hydronephrosis.
Renal biopsy study demonstrates noncaseating granulomatous interstitial nephritis (Figure 1).
GRANULOMATOUS INTERSTITIAL NEPHRITIS
1. Based on the information above, what is the most likely cause of this patient’s kidney disease?
- Medication
- Granulomatosis with polyangiitis
- Sarcoidosis
- Infection
Granulomatous interstitial nephritis is a histologic diagnosis that is present in up to 1% of renal biopsies. It has been associated with medications, infections, sarcoidosis, crystal deposits, paraproteinemia, and granulomatosis with polyangiitis and also is seen in an idiopathic form.
Medicines implicated include anticonvulsants, antibiotics, NSAIDs, allopurinol, and diuretics.
Mycobacteria and fungi are the main infective causes and seem to be the main causative factor in cases of renal transplant.1 Granulomas are usually not found on kidney biopsy in granulomatosis with polyangiitis, and that diagnosis is usually made by the presence of antiproteinase 3 antibodies.2
Sarcoidosis is the most likely diagnosis in this patient after excluding implicated medications, infection, and vasculitis and confirming the presence of granulomatous interstitial nephritis on renal biopsy.
SARCOIDOSIS: A MULTISYSTEM DISEASE
Sarcoidosis is a multisystem inflammatory disease of unknown cause, characterized by noncaseating epithelioid granulomas. It can involve any organ but most commonly the thoracic and peripheral lymph nodes.3,4 Involvement of the eyes and skin is also relatively common.
Extrapulmonary involvement occurs in more than 30% of cases of sarcoidosis, almost always with concomitant thoracic involvement.5,6 Isolated extrathoracic sarcoidosis is unusual, found in only 2% of patients in a sarcoidosis case-control study.5
Current theory suggests that sarcoidosis develops from a cell-mediated immune response triggered by one or more unidentified antigens in people with a genetic predisposition.7
Sarcoidosis affects men and women of all ages, most often adults ages 20 to 40; but more recently, it has increased in US adults over age 55.8 The condition is more prevalent in Northern Europe and Japan, and in blacks in the United States.7
HOW COMMON IS RENAL INVOLVEMENT IN SARCOIDOSIS?
2. What is the likelihood of finding clinically apparent renal involvement in a patient with sarcoidosis?
- Greater than 70%
- Greater than 50%
- Up to 50%
- Less than 10%
The prevalence of renal involvement in sarcoidosis is hard to determine due to differences in study design and patient populations included in the available reports, and because renal involvement may be silent for many years. Recent studies have reported impaired renal function in 0.7% to 9.7% of cases: eg, a case-control study of 736 patients reported clinically apparent renal involvement in 0.7% of patients,5 and in a series of 818 patients, the incidence was 1%.9 In earlier studies, depending on the diagnostic criteria, the incidence ranged from 1.1% to 9.7%.10
The prevalence of renal involvement may also be underestimated because it can be asymptomatic, and the number of granulomas may be so few that they are absent in a small biopsy specimen. A higher prevalence of renal involvement in sarcoidosis is reported from autopsy studies, although many cases remained clinically silent. These studies have reported renal noncaseating granulomas in 7% to 23% of sarcoidosis patients.11–13
PRESENTATION OF RENAL SARCOIDOSIS
3. What is the most common presentation in isolated renal sarcoidosis?
- Sterile pyuria
- Elevated urine eosinophils
- Renal insufficiency
- Painless hematuria
Renal manifestations of sarcoidosis include hypercalcemia, hypercalciuria, nephrocalcinosis, nephrolithiasis, and impaired renal function.14 Renal involvement can occur during the course of existing sarcoidosis, at the time of first presentation, or even as the sole presentation of the disease.1,11,15 In patients with isolated renal sarcoidosis, the most common presentation is renal insufficiency.15,16
Two main pathways for nephron insult that have been validated are granulomatous infiltration of the renal interstitium and disordered calcium homeostasis.11,17 Though extremely rare, various types of glomerular disease, renal tubular defects, and renal vascular involvement such as renal artery granulomatous angiitis have been documented.18
Hypercalcemia in sarcoidosis
Sarcoidosis is known to cause hypercalcemia by increasing calcium absorption secondary to 1,25-dihydroxyvitamin D production from granulomas. Our patient’s case is unusual, as renal failure was the sole extrapulmonary manifestation of sarcoidosis without hypercalcemia.
In sarcoidosis, extrarenal production of 1-alpha-hydroxylase by activated macrophages inappropriately increases levels of 1,25-dihydroxyvitamin D (calcitriol). Subsequently, serum calcium levels are increased. Unlike its renal equivalent, granulomatous 1-alpha-hydroxylase evades the normal negative feedback of hypercalcemia, so that increased calcitriol levels are sustained, leading to hypercalcemia, often accompanied by hypercalciuria.19
Disruption of calcium homeostasis affects renal function through several mechanisms. Hypercalcemia promotes vasoconstriction of the afferent arteriole, leading to a reduction in the GFR. Intracellular calcium overload can contribute to acute tubular necrosis and intratubular precipitation of calcium, leading to tubular obstruction. Hypercalciuria predisposes to nephrolithiasis and obstructive uropathy. Chronic hypercalcemia and hypercalciuria, if untreated, cause progressive interstitial inflammation and deposition of calcium in the kidney parenchyma and tubules, resulting in nephrocalcinosis. In some cases, nephrocalcinosis leads to chronic kidney injury and renal dysfunction.
HISTOLOGIC FEATURES
4. What is the characteristic histologic feature of renal sarcoidosis?
- Membranous glomerulonephritis
- Mesangioproliferative glomerulonephritis
- Minimal change disease
- Granulomatous interstitial nephritis
- Immunoglobulin (Ig) A nephropathy
Granulomatous interstitial nephritis is the most typical histologic feature of renal sarcoidosis.4,20–22 However, interstitial nephritis without granulomas is found in up to one-third of patients with sarcoid interstitial nephritis.15,23
Patients with sarcoid granulomatous interstitial nephritis usually present with elevated serum creatinine with or without mild proteinuria (< 1 g/24 hours).1,15,16 Advanced renal failure (stage 4 or 5 chronic kidney disease) is relatively common at the time of presentation.1,15,16 In the 2 largest case series of renal sarcoidosis to date, the mean presenting serum creatinine levels were 3.0 and 4.8 mg/dL.11,15 The most common clinical syndrome associated with sarcoidosis and granulomatous interstitial nephritis is chronic kidney disease with a decline in renal function, which if untreated can occur over weeks to months.21 Acute renal failure as an initial presentation is also well documented.15,24
Even though glomerular involvement in sarcoidosis is rare, different kinds of glomerulonephritis have been reported, including membranous glomerulonephritis, mesangioproliferative glomerulonephritis, IgA nephropathy, minimal change disease, focal segmental sclerosis, and crescentic glomerulonephritis.25
DIAGNOSIS OF RENAL SARCOIDOSIS
5. How is renal sarcoidosis diagnosed?
- By exclusion
- Complete urine analysis and renal function assessment
- Renal biopsy
- Computed tomography
- Renal ultrasonography
The diagnosis of renal sarcoidosis is one of exclusion. Sarcoidosis must be considered in the differential diagnosis of renal failure of unknown origin, especially if disordered calcium homeostasis is also present. If clinically suspected, diagnosis usually requires pathohistologic demonstration of typical granulomatous lesions in the kidneys or in one or more organ systems.26
In cases of sarcoidosis with granulomatous interstitial nephritis with isolated renal failure as a presenting feature, other causes of granulomatous interstitial nephritis must be ruled out. A number of drug reactions are associated with interstitial nephritis, most commonly with antibiotics, NSAIDs, and diuretics. Although granulomatous interstitial nephritis may develop as a reaction to some drugs, most cases of drug-induced interstitial nephritis do not involve granulomatous interstitial nephritis.
Other causes of granulomatous interstitial infiltrates include granulomatous infection by mycobacteria, fungi, or Brucella; foreign-body reaction such as cholesterol atheroemboli; heroin; lymphoma; or autoimmune disease such as tubulointerstitial nephritis with uveitis syndrome, granulomatosis with polyangiitis, or Crohn disease.27,28 The absence of characteristic kidney biopsy findings does not exclude the diagnosis because renal sarcoidosis can be focal and easily missed on biopsy.29
Urinary manifestations of renal sarcoidosis are usually not specific. In renal sarcoidosis with interstitial nephritis with or without granulomas, proteinuria is mild or absent, usually less than 1.0 g/day.11,15,16 Urine studies may show a “bland” sediment (ie, without red or white blood cells) or may show sterile pyuria or microscopic hematuria. In glomerular disease, more overt proteinuria or the presence of red blood cell casts is more typical.
Hypercalciuria, nephrocalcinosis, and nephrolithiasis are nonspecific abnormalities that may be present in patients with sarcoidosis. In this regard, an elevated urine calcium level may support the diagnosis of renal sarcoidosis.
Computed tomography and renal ultrasonography may aid in diagnosis by detecting nephrocalcinosis or nephrolithiasis.
The serum ACE level is elevated in 55% to 60% of patients with sarcoidosis, but it may also be elevated in other granulomatous diseases or in chronic kidney disease from various causes.5 Therefore, considering its nonspecificity, the serum ACE level has a limited role in the diagnosis of sarcoidosis.30 Using the ACE level as a marker for disease activity and response to treatment remains controversial because levels do not correlate with disease activity.5,11
TREATMENT OF RENAL SARCOIDOSIS
6. Which is a first-line therapy for renal sarcoidosis?
- Corticosteroids
- Azathioprine
- Mycophenolate mofetil
- Infliximab
- Adalimumab
Treatment of impaired calcium homeostasis in sarcoidosis includes hydration; reducing intake of calcium, vitamin D, and oxalate; and limiting sun exposure.11,31 For more significant hypercalcemia (eg, serum calcium levels > 11 mg/dL) or nephrolithiasis, corticosteroid therapy is the first choice and should be implemented at the first sign of renal involvement. Corticosteroids inhibit the activity of 1-alpha-hydroxylase in macrophages, thereby reducing the production of 1,25-dihydroxyvitamin D.
Chloroquine and hydroxychloroquine have been mentioned in the literature as alternatives to corticosteroids.32 But the effect of these agents is less predictable and is slower than treatment with corticosteroids. Ketoconazole has no effect on granuloma formation but corrects hypercalcemia by inhibiting calcitriol production, and can be used as an adjunct for treating hypercalcemia and hypercalciuria.
Corticosteroids are the mainstay of treatment for renal sarcoidosis, including granulomatous interstitial nephritis and interstitial nephritis without granulomas. Most patients experience significant improvement in renal function. However, full recovery is rare, likely as a result of long-standing disease with some degree of already established irreversible renal injury.16
Corticosteroid dosage
There is no standard dosing protocol, but patients with impaired renal function due to biopsy-proven renal sarcoidosis should receive prednisone 0.5 to 1 mg/kg/day, depending on the severity of the disease, in a single dose every morning.
The optimal dosing and duration of maintenance therapy are unknown. Based on studies to date, the initial dosing should be maintained for 4 weeks, after which it can be tapered by 5 mg each week down to a maintenance dosage of 5 to 10 mg/day.4
Patients with a poor response after 4 weeks tend to have a worse renal outcome and are more susceptible to relapse.15 Fortunately, relapse often responds to increased corticosteroid doses.11,15 In the case of relapse, the dose should be increased to the lowest effective dose and continued for 4 weeks, then tapered more gradually.
A total of 24 months of treatment seems necessary to be effective and to prevent relapse.15 Some authors have proposed a lifelong maintenance dose for patients with frequent relapses, and some propose it for all patients.4
Other agents
Tumor necrosis factor (TNF)-blocking agents. Considering the critical role TNF plays in granuloma formation, anti-TNF-alpha agents are useful in steroid-resistant sarcoidosis.33 A thorough workup is necessary before starting these agents because of the increased risk of serious infection, including reactivation of latent tuberculosis. Of the current TNF-blocking agents, infliximab is most often used in renal sarcoidosis.34 Experience with adalimumab is more limited, though promising results indicate it could be an alternative for patients who do not tolerate infliximab.35
Azathioprine, mycophenolate mofetil, or methotrexate may also be used as a second-line agent if treatment with corticosteroids is not tolerated or does not control the disease. The evidence in support of these agents is limited. In small series, they have allowed sustainable control of renal function while reducing the steroid dose. Currently, these agents are used for patients resistant to corticosteroid therapy, who would otherwise need prolonged high-dose corticosteroid treatment, or who have corticosteroid intolerance; they allow a more effective steroid taper and maintenance of stable renal function.15,36
The data supporting a standardized treatment of renal sarcoidosis are limited. For steroid intolerance or resistance, cytotoxic drugs and selected anti-TNF-alpha agents, as mentioned above, have shown promise in improving or stabilizing serum creatinine levels. Further exploration is required as to which agent or combination is better at limiting the disease process with fewer adverse effects.
Our patient was initially treated with corticosteroids and was ultimately weaned to a maintenance dose of 5 mg/day. He was followed as an outpatient and was started on mycophenolate mofetil in place of higher steroid doses. His renal function stabilized, but he was lost to follow-up after 2 years.
KEY POINTS
- Sarcoidosis is a multisystem granulomatous disease that most commonly involves the lungs, skin, and reticuloendothelial system.
- Renal involvement in sarcoidosis is likely underestimated due to its often clinically silent nature and the possibility of missing typical granulomatous lesions in a small or less-than-optimal biopsy sample.
- Manifestations of renal sarcoidosis include disrupted calcium homeostasis, nephrocalcinosis, nephrolithiasis, and renal failure.
- Because the clinical and histopathologic manifestations of renal sarcoidosis are nonspecific, the diagnosis is one of exclusion. In patients with renal failure or with hypercalcemia or hypercalciuria of unknown cause, renal sarcoidosis should be included in the differential diagnosis. Patients with chronic sarcoidosis should also be screened for renal impairment.
- Granulomatous interstitial nephritis is the classic histologic finding of renal sarcoidosis. Nonetheless, up to one-third of patients have interstitial nephritis without granulomas.
- Corticosteroids are the mainstay of treatment for renal sarcoidosis. An initial dose of oral prednisone 0.5 to 1 mg/kg/day should be maintained for 4 weeks and then gradually tapered to 5 to 10 mg/day for a total of 24 months. Some patients require lifelong therapy.
- Several immunosuppressive and cytotoxic agents may be used in cases of corticosteroid intolerance or to aid in effective taper of corticosteroids.
- Joss N, Morris S, Young B, Geddes C. Granulomatous interstitial nephritis. Clin J Am Soc Nephrol 2007; 2:222–230.
- Lutalo PM, D'Cruz DP. Diagnosis and classification of granulomatosis with polyangiitis (aka Wegener's granulomatosis). J Autoimmun 2014; 48–49:94–98.
- Newman LS, Rose CS, Maier LA. Sarcoidosis. N Engl J Med 1997; 336:1224–1234.
- Rajakariar R, Sharples EJ, Raftery MJ, Sheaff M, Yaqoob MM. Sarcoid tubulo-interstitial nephritis: long-term outcome and response to corticosteroid therapy. Kidney Int 2006; 70:165–169.
- Baughman RP, Teirstein AS, Judson MA, et al; Case Control Etiologic Study of Sarcoidosis (ACCESS) research group. Clinical characteristics of patients in a case control study of sarcoidosis. Am J Respir Crit Care Med 2001; 164:1885–1889.
- Rizzato G, Palmieri G, Agrati AM, Zanussi C. The organ-specific extrapulmonary presentation of sarcoidosis: a frequent occurrence but a challenge to an early diagnosis. A 3-year-long prospective observational study. Sarcoidosis Vasc Diffuse Lung Dis 2004; 21:119–126.
- Iannuzzi MC, Rybicki BA, Teirstein AS. Sarcoidosis. N Engl J Med 2007; 357:2153–2165.
- Baughman RP, Field S, Costabel U, et al. Sarcoidosis in America. Analysis based on health care use. Ann Am Thorac Soc 2016; 13:1244–1252.
- Neville E, Walker AN, James DG. Prognostic factors predicting the outcome of sarcoidosis: an analysis of 818 patients. Q J Med 1983; 52:525–533.
- Mayock RL, Bertrand P, Morrison CE, Scott JH. Manifestations of sarcoidosis. Analysis of 145 patients, with a review of nine series selected from the literature. Am J Med 1963; 35:67–89.
- Berliner AR, Haas M, Choi MJ. Sarcoidosis: the nephrologist's perspective. Am J Kidney Dis 2006; 48:856–870.
- Longcope WT, Freiman DG. A study of sarcoidosis; based on a combined investigation of 160 cases including 30 autopsies from The Johns Hopkins Hospital and Massachusetts General Hospital. Medicine (Baltimore) 1952; 31:1–132.
- Branson JH, Park JH. Sarcoidosis hepatic involvement: presentation of a case with fatal liver involvement; including autopsy findings and review of the evidence for sarcoid involvement of the liver as found in the literature. Ann Intern Med 1954; 40:111–145.
- Muther RS, McCarron DA, Bennett WM. Renal manifestations of sarcoidosis. Arch Intern Med 1981; 141:643–645.
- Mahevas M, Lescure FX, Boffa JJ, et al. Renal sarcoidosis: clinical, laboratory, and histologic presentation and outcome in 47 patients. Medicine (Baltimore) 2009; 88:98–106.
- Robson MG, Banerjee D, Hopster D, Cairns HS. Seven cases of granulomatous interstitial nephritis in the absence of extrarenal sarcoid. Nephrol Dial Transplant 2003; 18:280–284.
- Casella FJ, Allon M. The kidney in sarcoidosis. J Am Soc Nephrol 1993; 3:1555–1562.
- Rafat C, Bobrie G, Chedid A, Nochy D, Hernigou A, Plouin PF. Sarcoidosis presenting as severe renin-dependent hypertension due to kidney vascular injury. Clin Kidney J 2014; 7:383–386.
- Reichel H, Koeffler HP, Barbers R, Norman AW. Regulation of 1,25-dihydroxyvitamin D3 production by cultured alveolar macrophages from normal human donors and from patients with pulmonary sarcoidosis. J Clin Endocrinol Metab 1987; 65:1201–1209.
- Brause M, Magnusson K, Degenhardt S, Helmchen U, Grabensee B. Renal involvement in sarcoidosis—a report of 6 cases. Clin Nephrol 2002; 57:142–148.
- Hannedouche T, Grateau G, Noel LH, et al. Renal granulomatous sarcoidosis: report of six cases. Nephrol Dial Transplant 1990; 5:18–24.
- Kettritz R, Goebel U, Fiebeler A, Schneider W, Luft F. The protean face of sarcoidosis revisited. Nephrol Dial Transplant 2006; 21:2690–2694.
- Bergner R, Hoffmann M, Waldherr R, Uppenkamp M. Frequency of kidney disease in chronic sarcoidosis. Sarcoidosis Vasc Diffuse Lung Dis 2003; 20:126–132.
- O’Riordan E, Willert RP, Reeve R, et al. Isolated sarcoid granulomatous interstitial nephritis: review of five cases at one center. Clin Nephrol 2001; 55:297–302.
- Gobel U, Kettritz R, Schneider W, Luft F. The protean face of renal sarcoidosis. J Am Soc Nephrol 2001; 12:616–623.
- Statement on sarcoidosis. Joint statement of the American Thoracic Society (ATS), the European Respiratory Society (ERS) and the World Association of Sarcoidosis and Other Granulomatous Disorders (WASOG) adopted by the ATS Board of Directors and by the ERS Executive Committee, February 1999. Am J Respir Crit Care Med 1999; 160:736–755.
- Bijol V, Mendez GP, Nose V, Rennke HG. Granulomatous interstitial nephritis: a clinicopathologic study of 46 cases from a single institution. Int J Surg Pathol 2006; 14:57–63.
- Mignon F, Mery JP, Mougenot B, Ronco P, Roland J, Morel-Maroger L. Granulomatous interstitial nephritis. Adv Nephrol Necker Hosp 1984; 13:219–245.
- Shah R, Shidham G, Agarwal A, Albawardi A, Nadasdy T. Diagnostic utility of kidney biopsy in patients with sarcoidosis and acute kidney injury. Int J Nephrol Renovasc Dis 2011; 4:131–136.
- Studdy PR, Bird R. Serum angiotensin converting enzyme in sarcoidosis—its value in present clinical practice. Ann Clin Biochem 1989; 26:13–18.
- Demetriou ET, Pietras SM, Holick MF. Hypercalcemia and soft tissue calcification owing to sarcoidosis: the sunlight-cola connection. J Bone Miner Res 2010; 25:1695–1699.
- Beegle SH, Barba K, Gobunsuy R, Judson MA. Current and emerging pharmacological treatments for sarcoidosis: a review. Drug Des Devel Ther 2013; 7:325–338.
- Roberts SD, Wilkes DS, Burgett RA, Knox KS. Refractory sarcoidosis responding to infliximab. Chest 2003; 124:2028–2031.
- Ahmed MM, Mubashir E, Dossabhoy NR. Isolated renal sarcoidosis: a rare presentation of a rare disease treated with infliximab. Clin Rheumatol 2007; 26:1346–1349.
- Gupta R, Beaudet L, Moore J, Mehta T. Treatment of sarcoid granulomatous interstitial nephritis with adalimumab. NDT Plus 2009; 2:139–142.
- Moudgil A, Przygodzki RM, Kher KK. Successful steroid-sparing treatment of renal limited sarcoidosis with mycophenolate mofetil. Pediatr Nephrol 2006; 21:281–285.
A black 37-year-old man has gradually lost 100 lb (45 kg) over the past 2 years, and reports progressive fatigue and malaise as well. He has not noted swollen lymph nodes, fever, or night sweats. He denies dyspnea, cough, or chest pain. He has no skin rashes, and no dry or red eyes or visual changes. He reports no flank pain, dysuria, frank hematuria, foamy urine, decline in urine output, or difficulty voiding.
He has no history of significant medical conditions. He does not drink, smoke, or use recreational drugs. He is not taking any prescription medications and has not been using nonsteroidal anti-inflammatory drugs (NSAIDs) or combination analgesics. He does not have a family history of kidney disease.
Physical examination. He appears relaxed and comfortable. He does not have nasal polyps or signs of pharyngeal inflammation. He has no apparent lymphadenopathy. His breath sounds are normal without rales or wheezes. Cardiac examination reveals a regular rhythm, with no rub or murmurs. The abdomen is soft and nontender with no flank pain or groin tenderness. The skin is intact with no rash or nodules.
- Temperature 98.4ºF (36.9ºC)
- Blood pressure 125/70 mm Hg
- Heart rate 102 beats per minute
- Respiratory rate 19 per minute
- Oxygen saturation 99% while breathing room air
- Weight 194 lb (88 kg)
- Body mass index 28 kg/m2.
Laboratory testing (Table 1) reveals severe renal insufficiency with anemia:
- Serum creatinine 9 mg/dL (reference range 0.5–1.2)
- Estimated glomerular filtration rate (eGFR) 8 mL/min/1.73m2 (using the Modification of Diet in Renal Disease Study equation).
His serum calcium level is normal, but his serum phosphorus is 5.3 mg/dL (reference range 2.5–4.6), and his parathyroid hormone level is 317 pg/mL (12–88), consistent with hyperparathyroidism secondary to chronic kidney disease. His 25-hydroxyvitamin D level is less than 13 ng/mL (30–80), and angiotensin-converting enzyme (ACE) is 129 U/L (9–67 U/L). His urinary calcium level is less than 3.0 mg/dL.
Urinalysis:
- Urine protein 100 mg/dL (0–20)
- No urine crystals
- 3 to 5 coarse granular urine casts per high-power field
- No hematuria or pyuria.
Renal ultrasonography shows normal kidneys with no hydronephrosis.
Renal biopsy study demonstrates noncaseating granulomatous interstitial nephritis (Figure 1).
GRANULOMATOUS INTERSTITIAL NEPHRITIS
1. Based on the information above, what is the most likely cause of this patient’s kidney disease?
- Medication
- Granulomatosis with polyangiitis
- Sarcoidosis
- Infection
Granulomatous interstitial nephritis is a histologic diagnosis that is present in up to 1% of renal biopsies. It has been associated with medications, infections, sarcoidosis, crystal deposits, paraproteinemia, and granulomatosis with polyangiitis and also is seen in an idiopathic form.
Medicines implicated include anticonvulsants, antibiotics, NSAIDs, allopurinol, and diuretics.
Mycobacteria and fungi are the main infective causes and seem to be the main causative factor in cases of renal transplant.1 Granulomas are usually not found on kidney biopsy in granulomatosis with polyangiitis, and that diagnosis is usually made by the presence of antiproteinase 3 antibodies.2
Sarcoidosis is the most likely diagnosis in this patient after excluding implicated medications, infection, and vasculitis and confirming the presence of granulomatous interstitial nephritis on renal biopsy.
SARCOIDOSIS: A MULTISYSTEM DISEASE
Sarcoidosis is a multisystem inflammatory disease of unknown cause, characterized by noncaseating epithelioid granulomas. It can involve any organ but most commonly the thoracic and peripheral lymph nodes.3,4 Involvement of the eyes and skin is also relatively common.
Extrapulmonary involvement occurs in more than 30% of cases of sarcoidosis, almost always with concomitant thoracic involvement.5,6 Isolated extrathoracic sarcoidosis is unusual, found in only 2% of patients in a sarcoidosis case-control study.5
Current theory suggests that sarcoidosis develops from a cell-mediated immune response triggered by one or more unidentified antigens in people with a genetic predisposition.7
Sarcoidosis affects men and women of all ages, most often adults ages 20 to 40; but more recently, it has increased in US adults over age 55.8 The condition is more prevalent in Northern Europe and Japan, and in blacks in the United States.7
HOW COMMON IS RENAL INVOLVEMENT IN SARCOIDOSIS?
2. What is the likelihood of finding clinically apparent renal involvement in a patient with sarcoidosis?
- Greater than 70%
- Greater than 50%
- Up to 50%
- Less than 10%
The prevalence of renal involvement in sarcoidosis is hard to determine due to differences in study design and patient populations included in the available reports, and because renal involvement may be silent for many years. Recent studies have reported impaired renal function in 0.7% to 9.7% of cases: eg, a case-control study of 736 patients reported clinically apparent renal involvement in 0.7% of patients,5 and in a series of 818 patients, the incidence was 1%.9 In earlier studies, depending on the diagnostic criteria, the incidence ranged from 1.1% to 9.7%.10
The prevalence of renal involvement may also be underestimated because it can be asymptomatic, and the number of granulomas may be so few that they are absent in a small biopsy specimen. A higher prevalence of renal involvement in sarcoidosis is reported from autopsy studies, although many cases remained clinically silent. These studies have reported renal noncaseating granulomas in 7% to 23% of sarcoidosis patients.11–13
PRESENTATION OF RENAL SARCOIDOSIS
3. What is the most common presentation in isolated renal sarcoidosis?
- Sterile pyuria
- Elevated urine eosinophils
- Renal insufficiency
- Painless hematuria
Renal manifestations of sarcoidosis include hypercalcemia, hypercalciuria, nephrocalcinosis, nephrolithiasis, and impaired renal function.14 Renal involvement can occur during the course of existing sarcoidosis, at the time of first presentation, or even as the sole presentation of the disease.1,11,15 In patients with isolated renal sarcoidosis, the most common presentation is renal insufficiency.15,16
Two main pathways for nephron insult that have been validated are granulomatous infiltration of the renal interstitium and disordered calcium homeostasis.11,17 Though extremely rare, various types of glomerular disease, renal tubular defects, and renal vascular involvement such as renal artery granulomatous angiitis have been documented.18
Hypercalcemia in sarcoidosis
Sarcoidosis is known to cause hypercalcemia by increasing calcium absorption secondary to 1,25-dihydroxyvitamin D production from granulomas. Our patient’s case is unusual, as renal failure was the sole extrapulmonary manifestation of sarcoidosis without hypercalcemia.
In sarcoidosis, extrarenal production of 1-alpha-hydroxylase by activated macrophages inappropriately increases levels of 1,25-dihydroxyvitamin D (calcitriol). Subsequently, serum calcium levels are increased. Unlike its renal equivalent, granulomatous 1-alpha-hydroxylase evades the normal negative feedback of hypercalcemia, so that increased calcitriol levels are sustained, leading to hypercalcemia, often accompanied by hypercalciuria.19
Disruption of calcium homeostasis affects renal function through several mechanisms. Hypercalcemia promotes vasoconstriction of the afferent arteriole, leading to a reduction in the GFR. Intracellular calcium overload can contribute to acute tubular necrosis and intratubular precipitation of calcium, leading to tubular obstruction. Hypercalciuria predisposes to nephrolithiasis and obstructive uropathy. Chronic hypercalcemia and hypercalciuria, if untreated, cause progressive interstitial inflammation and deposition of calcium in the kidney parenchyma and tubules, resulting in nephrocalcinosis. In some cases, nephrocalcinosis leads to chronic kidney injury and renal dysfunction.
HISTOLOGIC FEATURES
4. What is the characteristic histologic feature of renal sarcoidosis?
- Membranous glomerulonephritis
- Mesangioproliferative glomerulonephritis
- Minimal change disease
- Granulomatous interstitial nephritis
- Immunoglobulin (Ig) A nephropathy
Granulomatous interstitial nephritis is the most typical histologic feature of renal sarcoidosis.4,20–22 However, interstitial nephritis without granulomas is found in up to one-third of patients with sarcoid interstitial nephritis.15,23
Patients with sarcoid granulomatous interstitial nephritis usually present with elevated serum creatinine with or without mild proteinuria (< 1 g/24 hours).1,15,16 Advanced renal failure (stage 4 or 5 chronic kidney disease) is relatively common at the time of presentation.1,15,16 In the 2 largest case series of renal sarcoidosis to date, the mean presenting serum creatinine levels were 3.0 and 4.8 mg/dL.11,15 The most common clinical syndrome associated with sarcoidosis and granulomatous interstitial nephritis is chronic kidney disease with a decline in renal function, which if untreated can occur over weeks to months.21 Acute renal failure as an initial presentation is also well documented.15,24
Even though glomerular involvement in sarcoidosis is rare, different kinds of glomerulonephritis have been reported, including membranous glomerulonephritis, mesangioproliferative glomerulonephritis, IgA nephropathy, minimal change disease, focal segmental sclerosis, and crescentic glomerulonephritis.25
DIAGNOSIS OF RENAL SARCOIDOSIS
5. How is renal sarcoidosis diagnosed?
- By exclusion
- Complete urine analysis and renal function assessment
- Renal biopsy
- Computed tomography
- Renal ultrasonography
The diagnosis of renal sarcoidosis is one of exclusion. Sarcoidosis must be considered in the differential diagnosis of renal failure of unknown origin, especially if disordered calcium homeostasis is also present. If clinically suspected, diagnosis usually requires pathohistologic demonstration of typical granulomatous lesions in the kidneys or in one or more organ systems.26
In cases of sarcoidosis with granulomatous interstitial nephritis with isolated renal failure as a presenting feature, other causes of granulomatous interstitial nephritis must be ruled out. A number of drug reactions are associated with interstitial nephritis, most commonly with antibiotics, NSAIDs, and diuretics. Although granulomatous interstitial nephritis may develop as a reaction to some drugs, most cases of drug-induced interstitial nephritis do not involve granulomatous interstitial nephritis.
Other causes of granulomatous interstitial infiltrates include granulomatous infection by mycobacteria, fungi, or Brucella; foreign-body reaction such as cholesterol atheroemboli; heroin; lymphoma; or autoimmune disease such as tubulointerstitial nephritis with uveitis syndrome, granulomatosis with polyangiitis, or Crohn disease.27,28 The absence of characteristic kidney biopsy findings does not exclude the diagnosis because renal sarcoidosis can be focal and easily missed on biopsy.29
Urinary manifestations of renal sarcoidosis are usually not specific. In renal sarcoidosis with interstitial nephritis with or without granulomas, proteinuria is mild or absent, usually less than 1.0 g/day.11,15,16 Urine studies may show a “bland” sediment (ie, without red or white blood cells) or may show sterile pyuria or microscopic hematuria. In glomerular disease, more overt proteinuria or the presence of red blood cell casts is more typical.
Hypercalciuria, nephrocalcinosis, and nephrolithiasis are nonspecific abnormalities that may be present in patients with sarcoidosis. In this regard, an elevated urine calcium level may support the diagnosis of renal sarcoidosis.
Computed tomography and renal ultrasonography may aid in diagnosis by detecting nephrocalcinosis or nephrolithiasis.
The serum ACE level is elevated in 55% to 60% of patients with sarcoidosis, but it may also be elevated in other granulomatous diseases or in chronic kidney disease from various causes.5 Therefore, considering its nonspecificity, the serum ACE level has a limited role in the diagnosis of sarcoidosis.30 Using the ACE level as a marker for disease activity and response to treatment remains controversial because levels do not correlate with disease activity.5,11
TREATMENT OF RENAL SARCOIDOSIS
6. Which is a first-line therapy for renal sarcoidosis?
- Corticosteroids
- Azathioprine
- Mycophenolate mofetil
- Infliximab
- Adalimumab
Treatment of impaired calcium homeostasis in sarcoidosis includes hydration; reducing intake of calcium, vitamin D, and oxalate; and limiting sun exposure.11,31 For more significant hypercalcemia (eg, serum calcium levels > 11 mg/dL) or nephrolithiasis, corticosteroid therapy is the first choice and should be implemented at the first sign of renal involvement. Corticosteroids inhibit the activity of 1-alpha-hydroxylase in macrophages, thereby reducing the production of 1,25-dihydroxyvitamin D.
Chloroquine and hydroxychloroquine have been mentioned in the literature as alternatives to corticosteroids.32 But the effect of these agents is less predictable and is slower than treatment with corticosteroids. Ketoconazole has no effect on granuloma formation but corrects hypercalcemia by inhibiting calcitriol production, and can be used as an adjunct for treating hypercalcemia and hypercalciuria.
Corticosteroids are the mainstay of treatment for renal sarcoidosis, including granulomatous interstitial nephritis and interstitial nephritis without granulomas. Most patients experience significant improvement in renal function. However, full recovery is rare, likely as a result of long-standing disease with some degree of already established irreversible renal injury.16
Corticosteroid dosage
There is no standard dosing protocol, but patients with impaired renal function due to biopsy-proven renal sarcoidosis should receive prednisone 0.5 to 1 mg/kg/day, depending on the severity of the disease, in a single dose every morning.
The optimal dosing and duration of maintenance therapy are unknown. Based on studies to date, the initial dosing should be maintained for 4 weeks, after which it can be tapered by 5 mg each week down to a maintenance dosage of 5 to 10 mg/day.4
Patients with a poor response after 4 weeks tend to have a worse renal outcome and are more susceptible to relapse.15 Fortunately, relapse often responds to increased corticosteroid doses.11,15 In the case of relapse, the dose should be increased to the lowest effective dose and continued for 4 weeks, then tapered more gradually.
A total of 24 months of treatment seems necessary to be effective and to prevent relapse.15 Some authors have proposed a lifelong maintenance dose for patients with frequent relapses, and some propose it for all patients.4
Other agents
Tumor necrosis factor (TNF)-blocking agents. Considering the critical role TNF plays in granuloma formation, anti-TNF-alpha agents are useful in steroid-resistant sarcoidosis.33 A thorough workup is necessary before starting these agents because of the increased risk of serious infection, including reactivation of latent tuberculosis. Of the current TNF-blocking agents, infliximab is most often used in renal sarcoidosis.34 Experience with adalimumab is more limited, though promising results indicate it could be an alternative for patients who do not tolerate infliximab.35
Azathioprine, mycophenolate mofetil, or methotrexate may also be used as a second-line agent if treatment with corticosteroids is not tolerated or does not control the disease. The evidence in support of these agents is limited. In small series, they have allowed sustainable control of renal function while reducing the steroid dose. Currently, these agents are used for patients resistant to corticosteroid therapy, who would otherwise need prolonged high-dose corticosteroid treatment, or who have corticosteroid intolerance; they allow a more effective steroid taper and maintenance of stable renal function.15,36
The data supporting a standardized treatment of renal sarcoidosis are limited. For steroid intolerance or resistance, cytotoxic drugs and selected anti-TNF-alpha agents, as mentioned above, have shown promise in improving or stabilizing serum creatinine levels. Further exploration is required as to which agent or combination is better at limiting the disease process with fewer adverse effects.
Our patient was initially treated with corticosteroids and was ultimately weaned to a maintenance dose of 5 mg/day. He was followed as an outpatient and was started on mycophenolate mofetil in place of higher steroid doses. His renal function stabilized, but he was lost to follow-up after 2 years.
KEY POINTS
- Sarcoidosis is a multisystem granulomatous disease that most commonly involves the lungs, skin, and reticuloendothelial system.
- Renal involvement in sarcoidosis is likely underestimated due to its often clinically silent nature and the possibility of missing typical granulomatous lesions in a small or less-than-optimal biopsy sample.
- Manifestations of renal sarcoidosis include disrupted calcium homeostasis, nephrocalcinosis, nephrolithiasis, and renal failure.
- Because the clinical and histopathologic manifestations of renal sarcoidosis are nonspecific, the diagnosis is one of exclusion. In patients with renal failure or with hypercalcemia or hypercalciuria of unknown cause, renal sarcoidosis should be included in the differential diagnosis. Patients with chronic sarcoidosis should also be screened for renal impairment.
- Granulomatous interstitial nephritis is the classic histologic finding of renal sarcoidosis. Nonetheless, up to one-third of patients have interstitial nephritis without granulomas.
- Corticosteroids are the mainstay of treatment for renal sarcoidosis. An initial dose of oral prednisone 0.5 to 1 mg/kg/day should be maintained for 4 weeks and then gradually tapered to 5 to 10 mg/day for a total of 24 months. Some patients require lifelong therapy.
- Several immunosuppressive and cytotoxic agents may be used in cases of corticosteroid intolerance or to aid in effective taper of corticosteroids.
- Joss N, Morris S, Young B, Geddes C. Granulomatous interstitial nephritis. Clin J Am Soc Nephrol 2007; 2:222–230.
- Lutalo PM, D'Cruz DP. Diagnosis and classification of granulomatosis with polyangiitis (aka Wegener's granulomatosis). J Autoimmun 2014; 48–49:94–98.
- Newman LS, Rose CS, Maier LA. Sarcoidosis. N Engl J Med 1997; 336:1224–1234.
- Rajakariar R, Sharples EJ, Raftery MJ, Sheaff M, Yaqoob MM. Sarcoid tubulo-interstitial nephritis: long-term outcome and response to corticosteroid therapy. Kidney Int 2006; 70:165–169.
- Baughman RP, Teirstein AS, Judson MA, et al; Case Control Etiologic Study of Sarcoidosis (ACCESS) research group. Clinical characteristics of patients in a case control study of sarcoidosis. Am J Respir Crit Care Med 2001; 164:1885–1889.
- Rizzato G, Palmieri G, Agrati AM, Zanussi C. The organ-specific extrapulmonary presentation of sarcoidosis: a frequent occurrence but a challenge to an early diagnosis. A 3-year-long prospective observational study. Sarcoidosis Vasc Diffuse Lung Dis 2004; 21:119–126.
- Iannuzzi MC, Rybicki BA, Teirstein AS. Sarcoidosis. N Engl J Med 2007; 357:2153–2165.
- Baughman RP, Field S, Costabel U, et al. Sarcoidosis in America. Analysis based on health care use. Ann Am Thorac Soc 2016; 13:1244–1252.
- Neville E, Walker AN, James DG. Prognostic factors predicting the outcome of sarcoidosis: an analysis of 818 patients. Q J Med 1983; 52:525–533.
- Mayock RL, Bertrand P, Morrison CE, Scott JH. Manifestations of sarcoidosis. Analysis of 145 patients, with a review of nine series selected from the literature. Am J Med 1963; 35:67–89.
- Berliner AR, Haas M, Choi MJ. Sarcoidosis: the nephrologist's perspective. Am J Kidney Dis 2006; 48:856–870.
- Longcope WT, Freiman DG. A study of sarcoidosis; based on a combined investigation of 160 cases including 30 autopsies from The Johns Hopkins Hospital and Massachusetts General Hospital. Medicine (Baltimore) 1952; 31:1–132.
- Branson JH, Park JH. Sarcoidosis hepatic involvement: presentation of a case with fatal liver involvement; including autopsy findings and review of the evidence for sarcoid involvement of the liver as found in the literature. Ann Intern Med 1954; 40:111–145.
- Muther RS, McCarron DA, Bennett WM. Renal manifestations of sarcoidosis. Arch Intern Med 1981; 141:643–645.
- Mahevas M, Lescure FX, Boffa JJ, et al. Renal sarcoidosis: clinical, laboratory, and histologic presentation and outcome in 47 patients. Medicine (Baltimore) 2009; 88:98–106.
- Robson MG, Banerjee D, Hopster D, Cairns HS. Seven cases of granulomatous interstitial nephritis in the absence of extrarenal sarcoid. Nephrol Dial Transplant 2003; 18:280–284.
- Casella FJ, Allon M. The kidney in sarcoidosis. J Am Soc Nephrol 1993; 3:1555–1562.
- Rafat C, Bobrie G, Chedid A, Nochy D, Hernigou A, Plouin PF. Sarcoidosis presenting as severe renin-dependent hypertension due to kidney vascular injury. Clin Kidney J 2014; 7:383–386.
- Reichel H, Koeffler HP, Barbers R, Norman AW. Regulation of 1,25-dihydroxyvitamin D3 production by cultured alveolar macrophages from normal human donors and from patients with pulmonary sarcoidosis. J Clin Endocrinol Metab 1987; 65:1201–1209.
- Brause M, Magnusson K, Degenhardt S, Helmchen U, Grabensee B. Renal involvement in sarcoidosis—a report of 6 cases. Clin Nephrol 2002; 57:142–148.
- Hannedouche T, Grateau G, Noel LH, et al. Renal granulomatous sarcoidosis: report of six cases. Nephrol Dial Transplant 1990; 5:18–24.
- Kettritz R, Goebel U, Fiebeler A, Schneider W, Luft F. The protean face of sarcoidosis revisited. Nephrol Dial Transplant 2006; 21:2690–2694.
- Bergner R, Hoffmann M, Waldherr R, Uppenkamp M. Frequency of kidney disease in chronic sarcoidosis. Sarcoidosis Vasc Diffuse Lung Dis 2003; 20:126–132.
- O’Riordan E, Willert RP, Reeve R, et al. Isolated sarcoid granulomatous interstitial nephritis: review of five cases at one center. Clin Nephrol 2001; 55:297–302.
- Gobel U, Kettritz R, Schneider W, Luft F. The protean face of renal sarcoidosis. J Am Soc Nephrol 2001; 12:616–623.
- Statement on sarcoidosis. Joint statement of the American Thoracic Society (ATS), the European Respiratory Society (ERS) and the World Association of Sarcoidosis and Other Granulomatous Disorders (WASOG) adopted by the ATS Board of Directors and by the ERS Executive Committee, February 1999. Am J Respir Crit Care Med 1999; 160:736–755.
- Bijol V, Mendez GP, Nose V, Rennke HG. Granulomatous interstitial nephritis: a clinicopathologic study of 46 cases from a single institution. Int J Surg Pathol 2006; 14:57–63.
- Mignon F, Mery JP, Mougenot B, Ronco P, Roland J, Morel-Maroger L. Granulomatous interstitial nephritis. Adv Nephrol Necker Hosp 1984; 13:219–245.
- Shah R, Shidham G, Agarwal A, Albawardi A, Nadasdy T. Diagnostic utility of kidney biopsy in patients with sarcoidosis and acute kidney injury. Int J Nephrol Renovasc Dis 2011; 4:131–136.
- Studdy PR, Bird R. Serum angiotensin converting enzyme in sarcoidosis—its value in present clinical practice. Ann Clin Biochem 1989; 26:13–18.
- Demetriou ET, Pietras SM, Holick MF. Hypercalcemia and soft tissue calcification owing to sarcoidosis: the sunlight-cola connection. J Bone Miner Res 2010; 25:1695–1699.
- Beegle SH, Barba K, Gobunsuy R, Judson MA. Current and emerging pharmacological treatments for sarcoidosis: a review. Drug Des Devel Ther 2013; 7:325–338.
- Roberts SD, Wilkes DS, Burgett RA, Knox KS. Refractory sarcoidosis responding to infliximab. Chest 2003; 124:2028–2031.
- Ahmed MM, Mubashir E, Dossabhoy NR. Isolated renal sarcoidosis: a rare presentation of a rare disease treated with infliximab. Clin Rheumatol 2007; 26:1346–1349.
- Gupta R, Beaudet L, Moore J, Mehta T. Treatment of sarcoid granulomatous interstitial nephritis with adalimumab. NDT Plus 2009; 2:139–142.
- Moudgil A, Przygodzki RM, Kher KK. Successful steroid-sparing treatment of renal limited sarcoidosis with mycophenolate mofetil. Pediatr Nephrol 2006; 21:281–285.
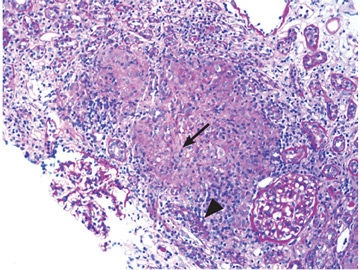
A lump on the hip
A 42-year-old man presented with a lump on the side of his left hip, which had developed after he fell on his hip while playing basketball about 2 weeks earlier. He was able to continue playing and finished the game. After the game he noticed a lump, which rapidly increased in size. Significant bruising developed afterwards, and the area was mildly painful. The lump did not interfere with his daily activities, but it was annoying.

 at the greater trochanter.")
THE DIFFERENTIAL DIAGNOSIS

Morel-Lavallée lesion is an uncommon condition resulting from shearing trauma and collection of fluid in the space between deep fatty tissue and superficial fascia.6 It is usually the result of severe trauma, as in a motor vehicle accident, but it can also result from sports-related trauma, as in our patient.6–8 Lateral hip, gluteal, and sacral regions are the most common locations for Morel-Lavallée lesions and are often associated with an underlying fracture.6,9
Morel-Lavallée lesions usually develop hours or days after trauma, although they may develop weeks or even months later.2 Symptoms include bulging, pain, and loss of cutaneous sensation over the affected area. Although ultrasonography can be used, magnetic resonance imaging (MRI) is the gold standard for diagnosis and staging.6,10 If there is concern for fracture, plain radiography should be performed.
Mellado and Bencardino classified Morel-Lavallée lesions into 6 types based on their morphology, presence or absence of a capsule, signal behavior on MRI, and enhancement pattern.10 The exact rate of infection in patients with Morel-Lavallée lesions is unknown; however, the risk of infection seems to be highest after surgical intervention or aspiration.5,6
Another potential complication is fluid reaccumulation, which most often occurs with large lesions (> 50 mL) and lesions with a fibrous capsule or pseudocapsule.5 Large lesions can compromise adjacent neurovascular structures, particularly in the extremities.5 Potential consequences include dermal necrosis, compartment syndrome, and tissue necrosis.5
MANAGEMENT APPROACH
Aspiration of a fluid-filled mass is useful in both diagnosis and management of Morel-Lavallée lesions. Treatment includes watchful waiting; compression and pressure wraps; injection of a sclerosing agent (eg, doxycyline, alcohol); needle aspiration; percutaneous drainage with debridement, irrigation, and suction; and incision and evacuation.6
The approach to treatment depends on the stage of the lesion and whether an underlying fracture is present. Depending on the amount of blood and lymphatic products and the acuity of the collected fluid (hours to days post-trauma), aspiration with a large-bore needle (eg, 14 to 22 gauge) may or may not be successful.7 In general, traumatic serosanguinous fluid collections are less painful and resolve faster than well-formed coagulated hematomas.
Patients who have a large lesion, significant pain, or decreased range of motion should be referred to an orthopedic surgeon.
Our patient was managed conservatively, and his symptoms completely resolved in 2 months.
- Ahmad Z, Tibrewal S, Waters G, Nolan J. Solitary amyloidoma related to THA. Orthopedics 2013; 36:e971–e973.
- Harris-Spinks C, Nabhan D, Khodaee M. Noniatrogenic septic olecranon bursitis: report of two cases and review of the literature. Curr Sports Med Rep 2016; 15:33–37.
- Price MD, Busconi BD, McMillan S. Proximal femur fractures. In: Miller MD, Sanders TG, eds. Presentation, Imaging and Treatment of Common Musculoskeletal Conditions. Philadelphia, PA: Saunders; 2011:365–376.
- Stanton MC, Maloney MD, Dehaven KE, Giordano BD. Acute traumatic tear of gluteus medius and minimus tendons in a patient without antecedant peritrochanteric hip pain. Geriatr Orthop Surg Rehabil 2012; 3:84–88.
- Khodaee M, Deu RS, Mathern S, Bravman JT. Morel-Lavallée lesion in sports. Curr Sports Med Rep 2016; 15:417–422.
- Bonilla-Yoon I, Masih S, Patel DB, et al. The Morel-Lavallée lesion: pathophysiology, clinical presentation, imaging features, and treatment options. Emerg Radiol 2014; 21:35–43.
- Khodaee M, Deu RS. Ankle Morel-Lavallée lesion in a recreational racquetball player. J Sports Med Phys Fitness 2016. Epub ahead of print.
- Shmerling A, Bravman JT, Khodaee M. Morel-Lavallée lesion of the knee in a recreational frisbee player. Case Rep Orthop 2016; 2016:8723489.
- Miller J, Daggett J, Ambay R, Payne WG. Morel-Lavallée lesion. Eplasty 2014; 14:ic12.
- Mellado JM, Bencardino JT. Morel-Lavallée lesion: review with emphasis on MR imaging. Magn Reson Imaging Clin N Am 2005; 13:775–782.
A 42-year-old man presented with a lump on the side of his left hip, which had developed after he fell on his hip while playing basketball about 2 weeks earlier. He was able to continue playing and finished the game. After the game he noticed a lump, which rapidly increased in size. Significant bruising developed afterwards, and the area was mildly painful. The lump did not interfere with his daily activities, but it was annoying.
THE DIFFERENTIAL DIAGNOSIS
Morel-Lavallée lesion is an uncommon condition resulting from shearing trauma and collection of fluid in the space between deep fatty tissue and superficial fascia.6 It is usually the result of severe trauma, as in a motor vehicle accident, but it can also result from sports-related trauma, as in our patient.6–8 Lateral hip, gluteal, and sacral regions are the most common locations for Morel-Lavallée lesions and are often associated with an underlying fracture.6,9
Morel-Lavallée lesions usually develop hours or days after trauma, although they may develop weeks or even months later.2 Symptoms include bulging, pain, and loss of cutaneous sensation over the affected area. Although ultrasonography can be used, magnetic resonance imaging (MRI) is the gold standard for diagnosis and staging.6,10 If there is concern for fracture, plain radiography should be performed.
Mellado and Bencardino classified Morel-Lavallée lesions into 6 types based on their morphology, presence or absence of a capsule, signal behavior on MRI, and enhancement pattern.10 The exact rate of infection in patients with Morel-Lavallée lesions is unknown; however, the risk of infection seems to be highest after surgical intervention or aspiration.5,6
Another potential complication is fluid reaccumulation, which most often occurs with large lesions (> 50 mL) and lesions with a fibrous capsule or pseudocapsule.5 Large lesions can compromise adjacent neurovascular structures, particularly in the extremities.5 Potential consequences include dermal necrosis, compartment syndrome, and tissue necrosis.5
MANAGEMENT APPROACH
Aspiration of a fluid-filled mass is useful in both diagnosis and management of Morel-Lavallée lesions. Treatment includes watchful waiting; compression and pressure wraps; injection of a sclerosing agent (eg, doxycyline, alcohol); needle aspiration; percutaneous drainage with debridement, irrigation, and suction; and incision and evacuation.6
The approach to treatment depends on the stage of the lesion and whether an underlying fracture is present. Depending on the amount of blood and lymphatic products and the acuity of the collected fluid (hours to days post-trauma), aspiration with a large-bore needle (eg, 14 to 22 gauge) may or may not be successful.7 In general, traumatic serosanguinous fluid collections are less painful and resolve faster than well-formed coagulated hematomas.
Patients who have a large lesion, significant pain, or decreased range of motion should be referred to an orthopedic surgeon.
Our patient was managed conservatively, and his symptoms completely resolved in 2 months.
- Ahmad Z, Tibrewal S, Waters G, Nolan J. Solitary amyloidoma related to THA. Orthopedics 2013; 36:e971–e973.
- Harris-Spinks C, Nabhan D, Khodaee M. Noniatrogenic septic olecranon bursitis: report of two cases and review of the literature. Curr Sports Med Rep 2016; 15:33–37.
- Price MD, Busconi BD, McMillan S. Proximal femur fractures. In: Miller MD, Sanders TG, eds. Presentation, Imaging and Treatment of Common Musculoskeletal Conditions. Philadelphia, PA: Saunders; 2011:365–376.
- Stanton MC, Maloney MD, Dehaven KE, Giordano BD. Acute traumatic tear of gluteus medius and minimus tendons in a patient without antecedant peritrochanteric hip pain. Geriatr Orthop Surg Rehabil 2012; 3:84–88.
- Khodaee M, Deu RS, Mathern S, Bravman JT. Morel-Lavallée lesion in sports. Curr Sports Med Rep 2016; 15:417–422.
- Bonilla-Yoon I, Masih S, Patel DB, et al. The Morel-Lavallée lesion: pathophysiology, clinical presentation, imaging features, and treatment options. Emerg Radiol 2014; 21:35–43.
- Khodaee M, Deu RS. Ankle Morel-Lavallée lesion in a recreational racquetball player. J Sports Med Phys Fitness 2016. Epub ahead of print.
- Shmerling A, Bravman JT, Khodaee M. Morel-Lavallée lesion of the knee in a recreational frisbee player. Case Rep Orthop 2016; 2016:8723489.
- Miller J, Daggett J, Ambay R, Payne WG. Morel-Lavallée lesion. Eplasty 2014; 14:ic12.
- Mellado JM, Bencardino JT. Morel-Lavallée lesion: review with emphasis on MR imaging. Magn Reson Imaging Clin N Am 2005; 13:775–782.
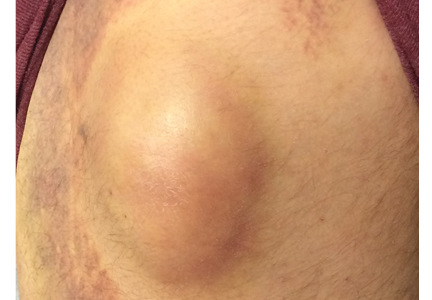
Combined hormonal contraceptives and migraine: An update on the evidence
Combined hormonal contraceptives are contraindicated in women who have migraine with aura because they pose a risk of stroke. But how great is the risk, and how strong is the evidence, particularly with today’s low-dose contraceptives? Can we view migraine with aura as a relative contraindication rather than an absolute one?
This article reviews migraine diagnosis, the effects of estrogen and the menstrual cycle on migraine, the evidence of stroke risk with combined hormonal contraceptive use, and how the frequency of aura may affect risk. It offers practical advice on choosing contraceptive formulations and counseling patients on risks and benefits.
WHAT THE GUIDELINES SAY
Current guidelines restrict the use of combined hormonal contraceptives in the setting of migraine with aura, but not in migraine without aura.
A practice bulletin from the American College of Obstetrics and Gynecology in 2010 noted that extended-cycle or continuous hormonal contraceptives, including oral and parenteral products, might provide relief of migraines by eliminating the drops in estrogen levels that precipitate them.1 However, the bulletin also cautioned that though cerebrovascular accidents in women are rare, the impact of a stroke is so devastating that clinicians should consider intrauterine devices, progestin-only options, and other nonestrogen methods in women who have migraine with focal neurologic signs, women who smoke, and women age 35 or older.1
In 2016, the US Centers for Disease Control and Prevention published updates to its medical eligibility criteria for contraceptive use in various medical conditions. In the case of migraine without aura, the guidelines note no limitation to the use of combined hormonal contraceptives, regardless of the patient’s age. In the case of migraine with aura, the consensus was that the risk associated with combined hormonal contraception typically outweighs its benefits, noting “an unacceptable health risk if the contraceptive method is used.”2
We believe a fresh look at the data is warranted.
EARLY ORAL CONTRACEPTIVES WERE ALL HIGH-DOSE
This issue first surfaced in the decade and a half after the initial launch of oral contraceptives in 1960. The products then were all high-dose pills, containing up to 150 µg of mestranol. In subsequent decades, the dose of estrogen was successively reduced, so that now some pills contain only 10 µg of ethinyl estradiol. High-dose pills—which today contain 50 µg of ethinyl estradiol—account for less than 1% of pills currently sold in the United States and have been eliminated in many countries.
DIAGNOSTIC CRITERIA FOR MIGRAINE
According to the International Classification of Headache Disorders (ICHD),3 the diagnosis of migraine requires 2 of the 4 following criteria:
- Unilateral location
- Pulsating or throbbing pain
- Pain of at least moderate intensity
- Pain aggravated by activity, or causing a preference to avoid activity.
An additional criterion is either nausea or a combination of photophobia and phonophobia with the episode. This criterion can be met if the patient prefers to avoid bright lights and loud noises during an attack.
Headache experts have suggested that patients with a stable pattern of episodic, disabling headache and normal findings on physical examination should be considered to have migraine if there is no contradictory evidence.4,5
Migraine with aura requires at least 2 of the following 4 characteristics3:
- 1 aura symptom, spreading gradually over 5 minutes, or 2 or more aura symptoms occurring in succession, or both
- Each aura symptom lasting 5 to 60 minutes (not “a few seconds,” not “hours”)
- The aura followed by the onset of headache within 60 minutes
- At least 1 aura symptom is unilateral.
Visual blurring, floaters, or split-second flashes before or during a migraine headache do not meet the criteria for aura.
MIGRAINE IS COMMON AND UNDERRECOGNIZED
In a study of 1,203 patients seeking care from a primary care provider for headache,6 94% of the 377 who turned in a diary with enough data to make a diagnosis were diagnosed with a migraine or probable migraine by an expert panel. A quarter of patients who likely had migraine based on an expert review of symptoms did not receive a migraine diagnosis at the time of their office visit.
Similarly, in a large epidemiologic study,7 30,758 adults were asked if they had headaches and, if so, how they named them. Headaches were reported by 23,564 of the participants and were subsequently diagnosed by formal ICHD criteria. Of the 3,074 individuals who met the criteria for migraine, only 53.4% correctly recognized their headaches as migraine. The most common erroneous labels were “sinus headache” and “stress headache.”7
HOW ESTROGEN AFFECTS MIGRAINE

Of note, migraine can be exacerbated during times of cycle irregularity, such as adolescence and perimenopause, the 2 times during a woman’s life associated with the highest risk of unintended pregnancy.10,11
STROKE RISK: ESTROGEN DOSE MATTERS
Shortly after the first combined oral contraceptives were released, reports of adverse events began to appear, although serious events were relatively rare. In response, prescribing guidelines advised against giving oral contraceptives to women with a history of deep vein thrombosis, myocardial infarction, stroke, or hypertension. Also, over the years, the hormonal content of the formulations was successively reduced, and with each reduction in estrogen, a decrease was observed in venous thrombosis and pulmonary embolism.12,13 Current low-dose formulations are considerably safer than high-dose options but are not entirely without risk.14
Stroke risk with combined oral contraceptives was first highlighted in a landmark article in 1975.15 However, the authors were unable to correlate the risk with the estrogen concentration of the pill, since 23 of the 25 women who suffered thrombotic stroke while taking the mestranol-containing formulation took 100-μg pills, and all 20 women who had strokes while taking the ethinyl estradiol formulation took 50-μg pills. Thus, by today’s standards, they were all taking high-dose pills. The risk of thrombotic stroke was 4 to 5 times higher in users than in nonusers.
In 1996, a study from the World Health Organization16 reported an increased risk of stroke with high-dose combined oral contraceptives (odds ratio [OR] 5.30, 95% confidence interval [CI] 2.56–11.0). With preparations containing less than 50 μg of ethinyl estradiol, the risk was not statistically significant (OR 1.53, 95% CI 0.71–3.31). These numbers were for Europe only; in developing countries, the risk was elevated regardless of dose, presumably due to additional risk factors in combined oral contraceptive users. The majority of strokes were in smokers taking 50-μg pills, with an average age greater than 35.
In 2002, a 5-year case-control study in Denmark found that the risk of stroke with combined oral contraceptives correlated directly with the estrogen content, from no increased risk with the newest and lowest-dose formulation (containing ethinyl estradiol 20 µg) to an OR of 4.5 with the older high-dose (50 µg) formulations.17
Reassuringly, a 2012 retrospective review of the Danish national registry13 revealed a low absolute risk of arterial events in users of combined oral contraceptives: 21.4 per 100,000 person-years for thrombotic stroke, and 10.1 per 100,000 person-years for myocardial infarction. Further, these risks were substantially lower with 20-μg ethinyl estradiol products than with those containing 30 to 40 μg.13 An important limitation of this large database review is that it did not control for important stroke risk factors such as obesity and smoking.
Although international studies14,16 continue to show a small but increased risk, more than 30 years have passed since a US study found an increased risk of stroke with combined oral contraceptives.
The discrepancy between US and international studies is possibly explained by the strong relative contraindication in the United States to the use of combined oral contraceptives in smokers over the age of 35 and the more prevalent use of high-dose pills in international studies. High-dose pills had been used in most of the stroke cases in the 1996 World Health Organization study16 but were used by only 0.7% of the women in the case and control groups in 2 pooled US studies from the same time period.18 Similarly, in these US studies, only 17% of the women were smokers on combined oral contraceptives, whereas in the international study, 51% of the women who had strokes and 38% of those in the control groups were smokers.
A large US study19 reviewing 3.6 million woman-years of use found no increased stroke risk (OR 0.96) in current users of low-dose combined oral contraceptives, results similar to those of a pooled analysis of US studies.18 Though this pooled analysis showed an adjusted increased risk of ischemic stroke in women reporting a history of migraine (OR 2.08, 95% CI 1.19–3.65), these conclusions were based on only 4 cases. The prevalence of migraine was identical in women who did or did not have strokes, 7.8% vs 7.7%, respectively, but the risk was judged to be increased after adjusting for other factors. But one important factor was not adjusted for: only 11 of the 1,017 women in the case and control groups were using 50-μg ethinyl estradiol pills, and 4 of the strokes were in this group of 11 women.
STROKE RISK INCREASES WITH FREQUENCY OF MIGRAINE AURA
Use of combined hormonal contraceptives in women who have migraine with aura remains controversial, based on good evidence that aura increases stroke risk20 and good evidence that high-dose oral contraceptives increase stroke risk.15
A cohort study encompassing more than 470,000 person-years with a median follow-up of 26 years found that while migraine without aura conferred no increase in risk of all-cause mortality, migraine with aura did.21
The longitudinal Women’s Health Study analyzed data from 27,798 women over age 45 and found that migraine with aura conferred an increased risk of cardiovascular disease (including stroke) that varied directly with aura frequency.22 Aura frequency less than once a month conferred a risk 2 times higher than in women without migraine, and the risk was more than 4 times higher when aura frequency exceeded once a week.
Similarly, an analysis of the World Health Organization study of stroke in young women found that the adjusted risk of ischemic stroke was significantly and directly associated with aura frequency.20
Potential explanations for this increased risk with greater aura frequency include changes induced during spreading cortical depression, shared genetic predispositions, and common underlying comorbidities such as patent foramen ovale.23–26
Though studies have shown that combined oral contraceptives in continuous regimens27 or in regimens that minimize drops in estrogen levels28 can help improve general headache and menstrual-related migraine, these studies have excluded patients who have migraine with aura.
In a pilot study,29 28 women referred to a tertiary headache clinic who had migraine with aura and intractable menstrual-related migraine were offered combined hormonal contraception in the form of a vaginal ring that releases only 15 μg ethinyl estradiol per 24 hours, thereby reducing peak estrogen exposure to a level lower than those encountered with the native menstrual cycle (with the suppression of ovulation). The women used this continuous ultra-low-dose hormonal contraception without placebo days. After a mean follow-up of 8 months, this regimen reduced aura frequency from a baseline average of 3.2 per month to only 0.2 per month. No woman had an increase in aura frequency, and menstrual-related migraine was eliminated in 21 (91.3%) of the 23 evaluable patients.
CHOOSING THE OPTIMAL CONTRACEPTIVE FORMULATION
Today, ultra-low-dose combined oral contraceptives (containing 10–15 µg of ethinyl estradiol) inhibit ovulation with doses of estrogen that are in a midphysiologic range. Consequently, they expose women to lower peak concentrations of estrogen than they would experience in their natural menstrual cycle (Figure 1). If a combined oral contraceptive is used in women with migraine with aura, lower estrogen doses (≤ 20 µg ethinyl estradiol) are preferred to decrease aura frequency and minimize the risk of stroke associated with high-dose ethinyl estradiol formulations.
Does the progestin matter?
Though there has been debate about whether different types of progestins alter the risk of venous thromboembolism,30,31 the chosen progestin does not seem to affect arterial risks such as stroke and myocardial infarction.14
All current guidelines note that progestin-only pills can be safely offered to women with migraine with aura. However, progestin-only pills have a shorter half-life than combined hormonal contraceptives and must be taken consistently and on time to ensure contraceptive efficacy and minimize abnormal bleeding. Patients who cannot adhere to a strict daily pill regimen may increase their risk of unintended pregnancy. In addition, progestin-only pills do not help with reducing episodes of migraine because they prevent ovulation only about half of the time.2 In contrast, a progestin-only arm implant is not only considered safe to use in women with migraine with aura, it may also prevent ovulation more reliably. Though progestin arm implants have the potential to reduce menstrual migraine and aura, this requires further study to confirm.
For menstrual-related migraine
In clinical practice, providers may offer certain combined hormonal contraceptives to women with debilitating menstrual-related migraine to prevent attacks. Although menstrual-related migraine rarely if ever is accompanied by aura, these patients may still have migraine with aura at other times of the month.
In women with menstrual-related migraine, any decrease in estrogen level greater than 10 µg of ethinyl estradiol may trigger an estrogen-withdrawal migraine. All currently available regimens of combined hormonal contraceptives that follow a 21-days-on, 7-days-off plan entail a drop in ethinyl estradiol of more than 10 µg (Figure 1).
Continuous regimens: Who needs a menstrual cycle anyway?
Of note: ultra-low-estrogen combined hormonal contraceptives that have placebo intervals may not inhibit ovulation consistently in all women.32 Contraceptive efficacy is still maintained, as contraception does not require inhibition of ovulation. Other mechanisms such as thickening of cervical mucus help with pregnancy prevention.
However, if ovulation is not inhibited, the consequent postovulatory decline in estrogen will continue to contribute to estrogen-withdrawal migraine.33,34 Reducing the number of placebo days may help inhibit ovulation. Adding back adequate estrogen during the placebo break (eg, either 0.9 mg conjugated equine estrogen with a 20-µg ethinyl estradiol combined oral contraceptive, or 0.075 mg transdermal 17B estradiol with a 15-µg combined hormonal contraceptive) can prevent these migraines.33,34

Some extended-cycle regimens, which give 4 withdrawal bleeds per year, will likewise prevent estrogen-withdrawal migraine if the decline in estrogen is limited to 10 µg (Table 1). Unfortunately, most extended regimens (Seasonale, Seasonique, and their generics) entail a 20- or 30-µg drop.
Continuous or extended-cycle regimens can be prescribed using any generic 20-µg combined hormonal contraceptive that the patient tolerates, along with specific instructions on the prescription to take the pills in a continuous fashion, eg, “Do not take the placebo pills; start the next pill pack immediately after 21 days.”
Postmenopausal hormone therapy
Neither smoking nor migraine is a contraindication to the use of postmenopausal hormone therapy, which is substantially lower in dosage than combined hormonal contraceptives.
ADVISING PATIENTS ON RISKS VS BENEFITS
It is important to remember that the risks of unintended pregnancy are always greater than the risks of any contraceptive, especially in women with chronic medical conditions, including those who have migraine with aura. Other benefits include the following:
Lower mortality risk. A 2010 analysis demonstrated that in nearly 46,000 women followed since 1968, those taking combined oral contraceptives had statistically significantly lower death rates from any cause and a lower risk of death from cancer and cardiovascular diseases than women who had never taken combined oral contraceptives.36
Stroke. Though the absolute risk of stroke to an individual woman taking a low-dose or ultra-low-dose combined hormonal contraceptive has been shown to be similar to that in women who are not taking combined hormonal contraception, its impact on an otherwise healthy woman could be devastating. Clinicians must remember that current guidelines still caution against prescribing combined hormonal contraceptives in women with migraine with aura and thus should counsel their patients accordingly and document the discussion in the medical record.
Noncontraceptive benefits. Women may be prescribed a combined hormonal contraceptive for benefits beyond contraception. The obvious reasons include beneficial effects on endometriosis, anemia, acne, hirsutism, dysmenorrhea, and prevention of ovarian cysts. But other important major benefits2 include substantial reductions in the risk of ovarian cancer (> 50% decrease after 10 years)37 and endometrial cancer (additional 24% reduction for each 5 years of use),38 and a modest decrease in the risk of colon cancer (37% less risk in ever-users).39 Further, combined oral contraceptive use has been associated with a decrease in mortality rates,40,41 with no increased risk of nonreproductive cancers.41
Ultra-low-dose, continuous formulations may benefit women by decreasing the frequency of migraine with aura and menstrual-related migraine. There is no evidence that reducing aura frequency also reduces stroke risk, but this represents an important area for future research.
WHAT WOULD WE DO?
For a patient who has a history of migraine with aura, if the goal is only to prevent pregnancy, we would recommend another contraceptive option that does not involve estrogen. However, we would consider prescribing a combined hormonal contraceptive in a low-dose regimen if the patient prefers this regimen for other health benefits (eg, acne control), if she has no other risk factors for stroke, and if she gives her informed consent after a discussion of the risks and benefits. Women who have menstrual-related migraine refractory to or who cannot tolerate other migraine therapies are often willing to try a low-dose estrogen-containing contraceptive for control of their migraine, especially if they have tried it in the past and believe that it helped prevent migraine. Patients should have follow-up within 3 months to discuss whether they have benefited from the regimen in terms of headache frequency or severity.
- ACOG Practice Bulletin No. 110: noncontraceptive uses of hormonal contraceptives. Obstet Gynecol 2010; 115:206–218.
- Centers for Disease Control and Prevention. US Medical Eligibility Criteria for Contraceptive Use, 2016. MMWR Recommendations and reports: Morbidity and mortality weekly report Recommendations and reports/Centers for Disease Control 2016; 65:1–104.
- Headache Classification Committee of the International Headache Society (IHS). The international classification of headache disorders, 3rd edition (beta version). Cephalalgia 2013; 33:629–808.
- Lipton RB, Cady RK, Stewart WF, Wilks K, Hall C. Diagnostic lessons from the Spectrum study. Neurology 2002; 58(suppl 6):S27–S31.
- Lipton RB, Stewart WF, Cady R, et al. 2000 Wolfe Award. Sumatriptan for the range of headaches in migraine sufferers: results of the Spectrum Study. Headache 2000; 40:783–791.
- Tepper SJ, Dahlof CG, Dowson A, et al. Prevalence and diagnosis of migraine in patients consulting their physician with a complaint of headache: data from the Landmark Study. Headache 2004; 44:856–864.
- Lipton RB, Stewart WF, Liberman JN. Self-awareness of migraine: interpreting the labels that headache sufferers apply to their headaches. Neurology 2002; 58(suppl 6):S21–S26.
- Chai NC, Peterlin BL, Calhoun AH. Migraine and estrogen. Curr Opin Neurol 2014; 27:315–324.
- Calhoun AH. Menstrual migraine: update on pathophysiology and approach to therapy and management. Curr Treat Options Neurol 2012; 14:1–14.
- McNamara M, Batur P, DeSapri KT. In the clinic. Perimenopause. Ann Intern Med 2015; 162:ITC1–ITC15.
- O’Brien HL, Cohen JM. Young adults with headaches: the transition from adolescents to adults. Headache 2015; 55:1404–1409.
- Vessey M, Mant D, Smith A, Yeates D. Oral contraceptives and venous thromboembolism: findings in a large prospective study. Br Med J (Clin Res Ed) 1986; 292:526.
- Lidegaard O, Lokkegaard E, Jensen A, Skovlund CW, Keiding N. Thrombotic stroke and myocardial infarction with hormonal contraception. N Engl J Med 2012; 366:2257–2266.
- MacGregor EA. Contraception and headache. Headache 2013; 53:247–276.
- Oral contraceptives and stroke in young women. Associated risk factors. JAMA 1975; 231:718–722.
- Ischaemic stroke and combined oral contraceptives: results of an international, multicentre, case-control study. WHO Collaborative Study of Cardiovascular Disease and Steroid Hormone Contraception. Lancet 1996; 348:498–505.
- Lidegaard O, Kreiner S. Contraceptives and cerebral thrombosis: a five-year national case-control study. Contraception 2002; 65:197–205.
- Schwartz SM, Petitti DB, Siscovick DS, et al. Stroke and use of low-dose oral contraceptives in young women: a pooled analysis of two US studies. Stroke 1998; 29:2277–2284.
- Petitti DB, Sidney S, Bernstein A, Wolf S, Quesenberry C, Ziel HK. Stroke in users of low-dose oral contraceptives. N Engl J Med 1996; 335:8–15.
- Donaghy M, Chang CL, Poulter N; European Collaborators of the World Health Organisation Collaborative Study of Cardiovascular Disease and Steroid Hormone Contraception. Duration, frequency, recency, and type of migraine and the risk of ischaemic stroke in women of childbearing age. J Neurol Neurosurg Psychiatry 2002; 73:747–750.
- Gudmundsson LS, Scher AI, Aspelund T, et al. Migraine with aura and risk of cardiovascular and all cause mortality in men and women: prospective cohort study. BMJ 2010; 341:c3966.
- Kurth T, Slomke MA, Kase CS, et al. Migraine, headache, and the risk of stroke in women: a prospective study. Neurology 2005; 64:1020–1026.
- Lee ST, Chu K, Jung KH, et al. Decreased number and function of endothelial progenitor cells in patients with migraine. Neurology 2008; 70:1510–1517.
- Kunz GA, Liang G, Cuculi F, et al. Circulating endothelial progenitor cells predict coronary artery disease severity. Am Heart J 2006; 152:190–195.
- Kurth T, Gaziano JM, Cook NR, Logroscino G, Diener HC, Buring JE. Migraine and risk of cardiovascular disease in women. JAMA 2006; 296:283–291.
- Pezzini A, Del Zotto E, Giossi A, Volonghi I, Grassi M, Padovani A. The migraine-ischemic stroke connection: potential pathogenic mechanisms. Curr Mol Med 2009; 9:215–226.
- Sulak P, Willis S, Kuehl T, Coffee A, Clark J. Headaches and oral contraceptives: impact of eliminating the standard 7-day placebo interval. Headache 2007; 47:27–37.
- Nappi RE, Terreno E, Sances G, et al. Effect of a contraceptive pill containing estradiol valerate and dienogest (E2V/DNG) in women with menstrually-related migraine (MRM). Contraception 2013; 88:369–375.
- Calhoun A, Ford S, Pruitt A. The impact of extended-cycle vaginal ring contraception on migraine aura: a retrospective case series. Headache 2012; 52:1246–1253.
- Wu CQ, Grandi SM, Filion KB, Abenhaim HA, Joseph L, Eisenberg MJ. Drospirenone-containing oral contraceptive pills and the risk of venous and arterial thrombosis: a systematic review. BJOG 2013; 120:801–810.
- Dinger J, Bardenheuer K, Heinemann K. Cardiovascular and general safety of a 24-day regimen of drospirenone-containing combined oral contraceptives: final results from the International Active Surveillance Study of Women Taking Oral Contraceptives. Contraception 2014; 89:253–263.
- Benson LS, Micks EA. Why stop now? Extended and continuous regimens of combined hormonal contraceptive methods. Obstet Gynecol Clin North Am 2015; 42:669–681.
- Mannix LK, Calhoun AH. Menstrual migraine. Curr Treat Options Neurol 2004; 6:489–498.
- Calhoun AH. A novel specific prophylaxis for menstrual-associated migraine. South Med J 2004; 97:819–822.
- Calhoun AH. Current topics and controversies in menstrual migraine. Headache 2012; 52(suppl 1):8–11.
- Hannaford PC, Iversen L, Macfarlane TV, Elliott AM, Angus V, Lee AJ. Mortality among contraceptive pill users: cohort evidence from Royal College of General Practitioners’ Oral Contraception Study. BMJ 2010; 340:c927.
- Havrilesky LJ, Moorman PG, Lowery WJ, et al. Oral contraceptive pills as primary prevention for ovarian cancer: a systematic review and meta-analysis. Obstet Gynecol 2013; 122:139 -147.
- Collaborative Group on Epidemiological Studies on Endometrial Cancer. Endometrial cancer and oral contraceptives: an individual participant meta-analysis of 27,276 women with endometrial cancer from 36 epidemiological studies. Lancet Oncol 2015; 16:1061–1070.
- Fernandez E, La Vecchia C, Franceschi S, et al. Oral contraceptive use and risk of colorectal cancer. Epidemiology 1998; 9:295–300.
- Merritt MA, Riboli E, Murphy N, et al. Reproductive factors and risk of mortality in the European Prospective Investigation into Cancer and Nutrition; a cohort study. BMC Med 2015; 13:252.
- Vessey M, Yeates D. Oral contraceptive use and cancer: final report from the Oxford-Family Planning Association Contraceptive Study. Contraception 2013; 88:678–683.
Combined hormonal contraceptives are contraindicated in women who have migraine with aura because they pose a risk of stroke. But how great is the risk, and how strong is the evidence, particularly with today’s low-dose contraceptives? Can we view migraine with aura as a relative contraindication rather than an absolute one?
This article reviews migraine diagnosis, the effects of estrogen and the menstrual cycle on migraine, the evidence of stroke risk with combined hormonal contraceptive use, and how the frequency of aura may affect risk. It offers practical advice on choosing contraceptive formulations and counseling patients on risks and benefits.
WHAT THE GUIDELINES SAY
Current guidelines restrict the use of combined hormonal contraceptives in the setting of migraine with aura, but not in migraine without aura.
A practice bulletin from the American College of Obstetrics and Gynecology in 2010 noted that extended-cycle or continuous hormonal contraceptives, including oral and parenteral products, might provide relief of migraines by eliminating the drops in estrogen levels that precipitate them.1 However, the bulletin also cautioned that though cerebrovascular accidents in women are rare, the impact of a stroke is so devastating that clinicians should consider intrauterine devices, progestin-only options, and other nonestrogen methods in women who have migraine with focal neurologic signs, women who smoke, and women age 35 or older.1
In 2016, the US Centers for Disease Control and Prevention published updates to its medical eligibility criteria for contraceptive use in various medical conditions. In the case of migraine without aura, the guidelines note no limitation to the use of combined hormonal contraceptives, regardless of the patient’s age. In the case of migraine with aura, the consensus was that the risk associated with combined hormonal contraception typically outweighs its benefits, noting “an unacceptable health risk if the contraceptive method is used.”2
We believe a fresh look at the data is warranted.
EARLY ORAL CONTRACEPTIVES WERE ALL HIGH-DOSE
This issue first surfaced in the decade and a half after the initial launch of oral contraceptives in 1960. The products then were all high-dose pills, containing up to 150 µg of mestranol. In subsequent decades, the dose of estrogen was successively reduced, so that now some pills contain only 10 µg of ethinyl estradiol. High-dose pills—which today contain 50 µg of ethinyl estradiol—account for less than 1% of pills currently sold in the United States and have been eliminated in many countries.
DIAGNOSTIC CRITERIA FOR MIGRAINE
According to the International Classification of Headache Disorders (ICHD),3 the diagnosis of migraine requires 2 of the 4 following criteria:
- Unilateral location
- Pulsating or throbbing pain
- Pain of at least moderate intensity
- Pain aggravated by activity, or causing a preference to avoid activity.
An additional criterion is either nausea or a combination of photophobia and phonophobia with the episode. This criterion can be met if the patient prefers to avoid bright lights and loud noises during an attack.
Headache experts have suggested that patients with a stable pattern of episodic, disabling headache and normal findings on physical examination should be considered to have migraine if there is no contradictory evidence.4,5
Migraine with aura requires at least 2 of the following 4 characteristics3:
- 1 aura symptom, spreading gradually over 5 minutes, or 2 or more aura symptoms occurring in succession, or both
- Each aura symptom lasting 5 to 60 minutes (not “a few seconds,” not “hours”)
- The aura followed by the onset of headache within 60 minutes
- At least 1 aura symptom is unilateral.
Visual blurring, floaters, or split-second flashes before or during a migraine headache do not meet the criteria for aura.
MIGRAINE IS COMMON AND UNDERRECOGNIZED
In a study of 1,203 patients seeking care from a primary care provider for headache,6 94% of the 377 who turned in a diary with enough data to make a diagnosis were diagnosed with a migraine or probable migraine by an expert panel. A quarter of patients who likely had migraine based on an expert review of symptoms did not receive a migraine diagnosis at the time of their office visit.
Similarly, in a large epidemiologic study,7 30,758 adults were asked if they had headaches and, if so, how they named them. Headaches were reported by 23,564 of the participants and were subsequently diagnosed by formal ICHD criteria. Of the 3,074 individuals who met the criteria for migraine, only 53.4% correctly recognized their headaches as migraine. The most common erroneous labels were “sinus headache” and “stress headache.”7
HOW ESTROGEN AFFECTS MIGRAINE
Of note, migraine can be exacerbated during times of cycle irregularity, such as adolescence and perimenopause, the 2 times during a woman’s life associated with the highest risk of unintended pregnancy.10,11
STROKE RISK: ESTROGEN DOSE MATTERS
Shortly after the first combined oral contraceptives were released, reports of adverse events began to appear, although serious events were relatively rare. In response, prescribing guidelines advised against giving oral contraceptives to women with a history of deep vein thrombosis, myocardial infarction, stroke, or hypertension. Also, over the years, the hormonal content of the formulations was successively reduced, and with each reduction in estrogen, a decrease was observed in venous thrombosis and pulmonary embolism.12,13 Current low-dose formulations are considerably safer than high-dose options but are not entirely without risk.14
Stroke risk with combined oral contraceptives was first highlighted in a landmark article in 1975.15 However, the authors were unable to correlate the risk with the estrogen concentration of the pill, since 23 of the 25 women who suffered thrombotic stroke while taking the mestranol-containing formulation took 100-μg pills, and all 20 women who had strokes while taking the ethinyl estradiol formulation took 50-μg pills. Thus, by today’s standards, they were all taking high-dose pills. The risk of thrombotic stroke was 4 to 5 times higher in users than in nonusers.
In 1996, a study from the World Health Organization16 reported an increased risk of stroke with high-dose combined oral contraceptives (odds ratio [OR] 5.30, 95% confidence interval [CI] 2.56–11.0). With preparations containing less than 50 μg of ethinyl estradiol, the risk was not statistically significant (OR 1.53, 95% CI 0.71–3.31). These numbers were for Europe only; in developing countries, the risk was elevated regardless of dose, presumably due to additional risk factors in combined oral contraceptive users. The majority of strokes were in smokers taking 50-μg pills, with an average age greater than 35.
In 2002, a 5-year case-control study in Denmark found that the risk of stroke with combined oral contraceptives correlated directly with the estrogen content, from no increased risk with the newest and lowest-dose formulation (containing ethinyl estradiol 20 µg) to an OR of 4.5 with the older high-dose (50 µg) formulations.17
Reassuringly, a 2012 retrospective review of the Danish national registry13 revealed a low absolute risk of arterial events in users of combined oral contraceptives: 21.4 per 100,000 person-years for thrombotic stroke, and 10.1 per 100,000 person-years for myocardial infarction. Further, these risks were substantially lower with 20-μg ethinyl estradiol products than with those containing 30 to 40 μg.13 An important limitation of this large database review is that it did not control for important stroke risk factors such as obesity and smoking.
Although international studies14,16 continue to show a small but increased risk, more than 30 years have passed since a US study found an increased risk of stroke with combined oral contraceptives.
The discrepancy between US and international studies is possibly explained by the strong relative contraindication in the United States to the use of combined oral contraceptives in smokers over the age of 35 and the more prevalent use of high-dose pills in international studies. High-dose pills had been used in most of the stroke cases in the 1996 World Health Organization study16 but were used by only 0.7% of the women in the case and control groups in 2 pooled US studies from the same time period.18 Similarly, in these US studies, only 17% of the women were smokers on combined oral contraceptives, whereas in the international study, 51% of the women who had strokes and 38% of those in the control groups were smokers.
A large US study19 reviewing 3.6 million woman-years of use found no increased stroke risk (OR 0.96) in current users of low-dose combined oral contraceptives, results similar to those of a pooled analysis of US studies.18 Though this pooled analysis showed an adjusted increased risk of ischemic stroke in women reporting a history of migraine (OR 2.08, 95% CI 1.19–3.65), these conclusions were based on only 4 cases. The prevalence of migraine was identical in women who did or did not have strokes, 7.8% vs 7.7%, respectively, but the risk was judged to be increased after adjusting for other factors. But one important factor was not adjusted for: only 11 of the 1,017 women in the case and control groups were using 50-μg ethinyl estradiol pills, and 4 of the strokes were in this group of 11 women.
STROKE RISK INCREASES WITH FREQUENCY OF MIGRAINE AURA
Use of combined hormonal contraceptives in women who have migraine with aura remains controversial, based on good evidence that aura increases stroke risk20 and good evidence that high-dose oral contraceptives increase stroke risk.15
A cohort study encompassing more than 470,000 person-years with a median follow-up of 26 years found that while migraine without aura conferred no increase in risk of all-cause mortality, migraine with aura did.21
The longitudinal Women’s Health Study analyzed data from 27,798 women over age 45 and found that migraine with aura conferred an increased risk of cardiovascular disease (including stroke) that varied directly with aura frequency.22 Aura frequency less than once a month conferred a risk 2 times higher than in women without migraine, and the risk was more than 4 times higher when aura frequency exceeded once a week.
Similarly, an analysis of the World Health Organization study of stroke in young women found that the adjusted risk of ischemic stroke was significantly and directly associated with aura frequency.20
Potential explanations for this increased risk with greater aura frequency include changes induced during spreading cortical depression, shared genetic predispositions, and common underlying comorbidities such as patent foramen ovale.23–26
Though studies have shown that combined oral contraceptives in continuous regimens27 or in regimens that minimize drops in estrogen levels28 can help improve general headache and menstrual-related migraine, these studies have excluded patients who have migraine with aura.
In a pilot study,29 28 women referred to a tertiary headache clinic who had migraine with aura and intractable menstrual-related migraine were offered combined hormonal contraception in the form of a vaginal ring that releases only 15 μg ethinyl estradiol per 24 hours, thereby reducing peak estrogen exposure to a level lower than those encountered with the native menstrual cycle (with the suppression of ovulation). The women used this continuous ultra-low-dose hormonal contraception without placebo days. After a mean follow-up of 8 months, this regimen reduced aura frequency from a baseline average of 3.2 per month to only 0.2 per month. No woman had an increase in aura frequency, and menstrual-related migraine was eliminated in 21 (91.3%) of the 23 evaluable patients.
CHOOSING THE OPTIMAL CONTRACEPTIVE FORMULATION
Today, ultra-low-dose combined oral contraceptives (containing 10–15 µg of ethinyl estradiol) inhibit ovulation with doses of estrogen that are in a midphysiologic range. Consequently, they expose women to lower peak concentrations of estrogen than they would experience in their natural menstrual cycle (Figure 1). If a combined oral contraceptive is used in women with migraine with aura, lower estrogen doses (≤ 20 µg ethinyl estradiol) are preferred to decrease aura frequency and minimize the risk of stroke associated with high-dose ethinyl estradiol formulations.
Does the progestin matter?
Though there has been debate about whether different types of progestins alter the risk of venous thromboembolism,30,31 the chosen progestin does not seem to affect arterial risks such as stroke and myocardial infarction.14
All current guidelines note that progestin-only pills can be safely offered to women with migraine with aura. However, progestin-only pills have a shorter half-life than combined hormonal contraceptives and must be taken consistently and on time to ensure contraceptive efficacy and minimize abnormal bleeding. Patients who cannot adhere to a strict daily pill regimen may increase their risk of unintended pregnancy. In addition, progestin-only pills do not help with reducing episodes of migraine because they prevent ovulation only about half of the time.2 In contrast, a progestin-only arm implant is not only considered safe to use in women with migraine with aura, it may also prevent ovulation more reliably. Though progestin arm implants have the potential to reduce menstrual migraine and aura, this requires further study to confirm.
For menstrual-related migraine
In clinical practice, providers may offer certain combined hormonal contraceptives to women with debilitating menstrual-related migraine to prevent attacks. Although menstrual-related migraine rarely if ever is accompanied by aura, these patients may still have migraine with aura at other times of the month.
In women with menstrual-related migraine, any decrease in estrogen level greater than 10 µg of ethinyl estradiol may trigger an estrogen-withdrawal migraine. All currently available regimens of combined hormonal contraceptives that follow a 21-days-on, 7-days-off plan entail a drop in ethinyl estradiol of more than 10 µg (Figure 1).
Continuous regimens: Who needs a menstrual cycle anyway?
Of note: ultra-low-estrogen combined hormonal contraceptives that have placebo intervals may not inhibit ovulation consistently in all women.32 Contraceptive efficacy is still maintained, as contraception does not require inhibition of ovulation. Other mechanisms such as thickening of cervical mucus help with pregnancy prevention.
However, if ovulation is not inhibited, the consequent postovulatory decline in estrogen will continue to contribute to estrogen-withdrawal migraine.33,34 Reducing the number of placebo days may help inhibit ovulation. Adding back adequate estrogen during the placebo break (eg, either 0.9 mg conjugated equine estrogen with a 20-µg ethinyl estradiol combined oral contraceptive, or 0.075 mg transdermal 17B estradiol with a 15-µg combined hormonal contraceptive) can prevent these migraines.33,34
Some extended-cycle regimens, which give 4 withdrawal bleeds per year, will likewise prevent estrogen-withdrawal migraine if the decline in estrogen is limited to 10 µg (Table 1). Unfortunately, most extended regimens (Seasonale, Seasonique, and their generics) entail a 20- or 30-µg drop.
Continuous or extended-cycle regimens can be prescribed using any generic 20-µg combined hormonal contraceptive that the patient tolerates, along with specific instructions on the prescription to take the pills in a continuous fashion, eg, “Do not take the placebo pills; start the next pill pack immediately after 21 days.”
Postmenopausal hormone therapy
Neither smoking nor migraine is a contraindication to the use of postmenopausal hormone therapy, which is substantially lower in dosage than combined hormonal contraceptives.
ADVISING PATIENTS ON RISKS VS BENEFITS
It is important to remember that the risks of unintended pregnancy are always greater than the risks of any contraceptive, especially in women with chronic medical conditions, including those who have migraine with aura. Other benefits include the following:
Lower mortality risk. A 2010 analysis demonstrated that in nearly 46,000 women followed since 1968, those taking combined oral contraceptives had statistically significantly lower death rates from any cause and a lower risk of death from cancer and cardiovascular diseases than women who had never taken combined oral contraceptives.36
Stroke. Though the absolute risk of stroke to an individual woman taking a low-dose or ultra-low-dose combined hormonal contraceptive has been shown to be similar to that in women who are not taking combined hormonal contraception, its impact on an otherwise healthy woman could be devastating. Clinicians must remember that current guidelines still caution against prescribing combined hormonal contraceptives in women with migraine with aura and thus should counsel their patients accordingly and document the discussion in the medical record.
Noncontraceptive benefits. Women may be prescribed a combined hormonal contraceptive for benefits beyond contraception. The obvious reasons include beneficial effects on endometriosis, anemia, acne, hirsutism, dysmenorrhea, and prevention of ovarian cysts. But other important major benefits2 include substantial reductions in the risk of ovarian cancer (> 50% decrease after 10 years)37 and endometrial cancer (additional 24% reduction for each 5 years of use),38 and a modest decrease in the risk of colon cancer (37% less risk in ever-users).39 Further, combined oral contraceptive use has been associated with a decrease in mortality rates,40,41 with no increased risk of nonreproductive cancers.41
Ultra-low-dose, continuous formulations may benefit women by decreasing the frequency of migraine with aura and menstrual-related migraine. There is no evidence that reducing aura frequency also reduces stroke risk, but this represents an important area for future research.
WHAT WOULD WE DO?
For a patient who has a history of migraine with aura, if the goal is only to prevent pregnancy, we would recommend another contraceptive option that does not involve estrogen. However, we would consider prescribing a combined hormonal contraceptive in a low-dose regimen if the patient prefers this regimen for other health benefits (eg, acne control), if she has no other risk factors for stroke, and if she gives her informed consent after a discussion of the risks and benefits. Women who have menstrual-related migraine refractory to or who cannot tolerate other migraine therapies are often willing to try a low-dose estrogen-containing contraceptive for control of their migraine, especially if they have tried it in the past and believe that it helped prevent migraine. Patients should have follow-up within 3 months to discuss whether they have benefited from the regimen in terms of headache frequency or severity.
- ACOG Practice Bulletin No. 110: noncontraceptive uses of hormonal contraceptives. Obstet Gynecol 2010; 115:206–218.
- Centers for Disease Control and Prevention. US Medical Eligibility Criteria for Contraceptive Use, 2016. MMWR Recommendations and reports: Morbidity and mortality weekly report Recommendations and reports/Centers for Disease Control 2016; 65:1–104.
- Headache Classification Committee of the International Headache Society (IHS). The international classification of headache disorders, 3rd edition (beta version). Cephalalgia 2013; 33:629–808.
- Lipton RB, Cady RK, Stewart WF, Wilks K, Hall C. Diagnostic lessons from the Spectrum study. Neurology 2002; 58(suppl 6):S27–S31.
- Lipton RB, Stewart WF, Cady R, et al. 2000 Wolfe Award. Sumatriptan for the range of headaches in migraine sufferers: results of the Spectrum Study. Headache 2000; 40:783–791.
- Tepper SJ, Dahlof CG, Dowson A, et al. Prevalence and diagnosis of migraine in patients consulting their physician with a complaint of headache: data from the Landmark Study. Headache 2004; 44:856–864.
- Lipton RB, Stewart WF, Liberman JN. Self-awareness of migraine: interpreting the labels that headache sufferers apply to their headaches. Neurology 2002; 58(suppl 6):S21–S26.
- Chai NC, Peterlin BL, Calhoun AH. Migraine and estrogen. Curr Opin Neurol 2014; 27:315–324.
- Calhoun AH. Menstrual migraine: update on pathophysiology and approach to therapy and management. Curr Treat Options Neurol 2012; 14:1–14.
- McNamara M, Batur P, DeSapri KT. In the clinic. Perimenopause. Ann Intern Med 2015; 162:ITC1–ITC15.
- O’Brien HL, Cohen JM. Young adults with headaches: the transition from adolescents to adults. Headache 2015; 55:1404–1409.
- Vessey M, Mant D, Smith A, Yeates D. Oral contraceptives and venous thromboembolism: findings in a large prospective study. Br Med J (Clin Res Ed) 1986; 292:526.
- Lidegaard O, Lokkegaard E, Jensen A, Skovlund CW, Keiding N. Thrombotic stroke and myocardial infarction with hormonal contraception. N Engl J Med 2012; 366:2257–2266.
- MacGregor EA. Contraception and headache. Headache 2013; 53:247–276.
- Oral contraceptives and stroke in young women. Associated risk factors. JAMA 1975; 231:718–722.
- Ischaemic stroke and combined oral contraceptives: results of an international, multicentre, case-control study. WHO Collaborative Study of Cardiovascular Disease and Steroid Hormone Contraception. Lancet 1996; 348:498–505.
- Lidegaard O, Kreiner S. Contraceptives and cerebral thrombosis: a five-year national case-control study. Contraception 2002; 65:197–205.
- Schwartz SM, Petitti DB, Siscovick DS, et al. Stroke and use of low-dose oral contraceptives in young women: a pooled analysis of two US studies. Stroke 1998; 29:2277–2284.
- Petitti DB, Sidney S, Bernstein A, Wolf S, Quesenberry C, Ziel HK. Stroke in users of low-dose oral contraceptives. N Engl J Med 1996; 335:8–15.
- Donaghy M, Chang CL, Poulter N; European Collaborators of the World Health Organisation Collaborative Study of Cardiovascular Disease and Steroid Hormone Contraception. Duration, frequency, recency, and type of migraine and the risk of ischaemic stroke in women of childbearing age. J Neurol Neurosurg Psychiatry 2002; 73:747–750.
- Gudmundsson LS, Scher AI, Aspelund T, et al. Migraine with aura and risk of cardiovascular and all cause mortality in men and women: prospective cohort study. BMJ 2010; 341:c3966.
- Kurth T, Slomke MA, Kase CS, et al. Migraine, headache, and the risk of stroke in women: a prospective study. Neurology 2005; 64:1020–1026.
- Lee ST, Chu K, Jung KH, et al. Decreased number and function of endothelial progenitor cells in patients with migraine. Neurology 2008; 70:1510–1517.
- Kunz GA, Liang G, Cuculi F, et al. Circulating endothelial progenitor cells predict coronary artery disease severity. Am Heart J 2006; 152:190–195.
- Kurth T, Gaziano JM, Cook NR, Logroscino G, Diener HC, Buring JE. Migraine and risk of cardiovascular disease in women. JAMA 2006; 296:283–291.
- Pezzini A, Del Zotto E, Giossi A, Volonghi I, Grassi M, Padovani A. The migraine-ischemic stroke connection: potential pathogenic mechanisms. Curr Mol Med 2009; 9:215–226.
- Sulak P, Willis S, Kuehl T, Coffee A, Clark J. Headaches and oral contraceptives: impact of eliminating the standard 7-day placebo interval. Headache 2007; 47:27–37.
- Nappi RE, Terreno E, Sances G, et al. Effect of a contraceptive pill containing estradiol valerate and dienogest (E2V/DNG) in women with menstrually-related migraine (MRM). Contraception 2013; 88:369–375.
- Calhoun A, Ford S, Pruitt A. The impact of extended-cycle vaginal ring contraception on migraine aura: a retrospective case series. Headache 2012; 52:1246–1253.
- Wu CQ, Grandi SM, Filion KB, Abenhaim HA, Joseph L, Eisenberg MJ. Drospirenone-containing oral contraceptive pills and the risk of venous and arterial thrombosis: a systematic review. BJOG 2013; 120:801–810.
- Dinger J, Bardenheuer K, Heinemann K. Cardiovascular and general safety of a 24-day regimen of drospirenone-containing combined oral contraceptives: final results from the International Active Surveillance Study of Women Taking Oral Contraceptives. Contraception 2014; 89:253–263.
- Benson LS, Micks EA. Why stop now? Extended and continuous regimens of combined hormonal contraceptive methods. Obstet Gynecol Clin North Am 2015; 42:669–681.
- Mannix LK, Calhoun AH. Menstrual migraine. Curr Treat Options Neurol 2004; 6:489–498.
- Calhoun AH. A novel specific prophylaxis for menstrual-associated migraine. South Med J 2004; 97:819–822.
- Calhoun AH. Current topics and controversies in menstrual migraine. Headache 2012; 52(suppl 1):8–11.
- Hannaford PC, Iversen L, Macfarlane TV, Elliott AM, Angus V, Lee AJ. Mortality among contraceptive pill users: cohort evidence from Royal College of General Practitioners’ Oral Contraception Study. BMJ 2010; 340:c927.
- Havrilesky LJ, Moorman PG, Lowery WJ, et al. Oral contraceptive pills as primary prevention for ovarian cancer: a systematic review and meta-analysis. Obstet Gynecol 2013; 122:139 -147.
- Collaborative Group on Epidemiological Studies on Endometrial Cancer. Endometrial cancer and oral contraceptives: an individual participant meta-analysis of 27,276 women with endometrial cancer from 36 epidemiological studies. Lancet Oncol 2015; 16:1061–1070.
- Fernandez E, La Vecchia C, Franceschi S, et al. Oral contraceptive use and risk of colorectal cancer. Epidemiology 1998; 9:295–300.
- Merritt MA, Riboli E, Murphy N, et al. Reproductive factors and risk of mortality in the European Prospective Investigation into Cancer and Nutrition; a cohort study. BMC Med 2015; 13:252.
- Vessey M, Yeates D. Oral contraceptive use and cancer: final report from the Oxford-Family Planning Association Contraceptive Study. Contraception 2013; 88:678–683.
KEY POINTS
- There is no restriction on the use of combined hormonal contraceptives by women with migraine without aura, and the risk vs benefit for women with aura is debatable.
- Migraine with aura—but not migraine without aura—is associated with a twofold increased risk of ischemic stroke, although the absolute risk is small in healthy women who do not smoke.
- Combined hormonal contraceptives are associated with ischemic stroke, but the risk is dose-dependent. Ultra-low-dose formulations (containing ≤ 20 μg of ethinyl estradiol) do not pose an increased risk of stroke in healthy nonsmokers.