User login
Amoeba could help fight cancers

Experiments in a soil-dwelling amoeba have provided insight that could help us treat cancers characterized by PTEN mutations, researchers have reported in PLOS ONE.
The team discovered that this amoeba has two genes that function like the human tumor suppressor PTEN.
And increasing expression of one of these genes compensated for a mutation in the other gene.
If the same method works in humans with mutated PTEN, this finding could have implications for a range of cancers.
PTEN mutations are thought to be involved in nearly half of all leukemia cases, 40% of breast cancer cases, and up to 70% of prostate cancer cases.
“If you look at tumors across the board . . . , you find that PTEN is the most generally mutated gene, and, when you mutate PTEN in mice, you cause tumors,” said study author David Soll, PhD, of the University of Iowa in Iowa City.
He and his colleagues found that the amoeba Dictyostelium discoideum has the gene ptenA, which mutates similarly to the human PTEN gene and causes behavioral defects in the cell.
They also found a close relative of ptenA in the amoeba, called lpten, that performs the same functions of ptenA but to a lesser degree.
The researchers hypothesized that ramping up the presence of lpten could compensate for the mutated ptenA.
They tested this theory by placing lpten in a plasmid behind a powerful promoter designed to overexpress the gene. They then introduced the super-charged lpten into a cell with the mutated ptenA gene.
The team found that the overexpressed lpten gene fully compensated for all of the defects in the ptenA mutant.
If this method works in human cells, it could lead to a new way to treat cancers, the researchers said. They are now aiming to identify a drug that would activate the promoter for one of PTEN’s close relatives.
Once a patient is diagnosed with cancer caused by a PTEN mutation, the patient could take the drug, overexpress the PTEN replacement gene, and potentially stop cancer in its tracks, Dr Soll said.
This research has also led Dr Soll and his colleagues to study other human genes that may be able to step in for the mutated PTEN gene and perform the same tumor-suppressing role. The team is currently studying 2 close relatives of PTEN.
“And nature might have put them there just for that; that’s the curious thing,” Dr Soll said. “Somewhere, there may be a backup system, what we call ‘redundancy,’ that might be the basis for better identifying tumors and possibly creating cancer-fighting drugs. You have another gene which might be able to step in for the broken gene to keep things normal, and that’s what we’re playing with here. It’s very sophisticated.” ![]()
Malpractice reform may not reduce ‘defensive medicine’

Credit: CDC
Making it more difficult for patients to sue physicians for medical malpractice may not reduce the amount of “defensive medicine” physicians
practice, new research suggests.
Investigators studied patient records in 3 states that raised the standard for malpractice in the emergency room to gross negligence.
And they found that strong new legal protections did not significantly reduce the use of common defensive medicine practices or the cost of care.
The team detailed these findings in NEJM.
“Our findings suggest that malpractice reform may have less effect on costs than has been projected by conventional wisdom,” said lead study author Daniel A. Waxman, MD, PhD, of RAND Health in Santa Monica, California.
“Physicians say they order unnecessary tests strictly out of fear of being sued, but our results suggest the story is more complicated.”
The investigators evaluated the results of malpractice reform in 3 states—Georgia, Texas, and South Carolina.
About a decade ago, these states changed the legal malpractice standard for emergency care to gross negligence. The higher standard means plaintiffs must prove that doctors consciously disregarded the need to use reasonable care, knowing full well that their actions were likely to cause serious injury.
“These malpractice reforms have been said to provide virtual immunity against lawsuits,” Dr Waxman noted.
He and his colleagues examined 3.8 million Medicare patient records from 1166 hospital emergency departments spanning the period from 1997 to 2011. They compared care in the 3 reform states, before and after the statutes took effect, to care in neighboring states that did not pass malpractice reform.
The team assessed whether physicians ordered an advanced imaging study (CT or MRI scan), whether the patient was hospitalized after the emergency visit, and total charges for the visit.
Advanced imaging and hospitalization are among the most costly consequences of an emergency room visit, and physicians have identified them as common defensive medicine practices.
The malpractice reform laws had no effect on the use of imaging or the rate of hospitalization following emergency visits.
For 2 of the states, Texas and South Carolina, the law did not appear to cause any reduction in charges. Relative to neighboring states, Georgia saw a drop of 3.6% in average emergency room charges following its 2005 reform.
“This study suggests that, even when the risk of being sued for malpractice decreases, the path of least resistance still may favor resource-intensive care, at least in hospital emergency departments,” Dr Waxman said. ![]()
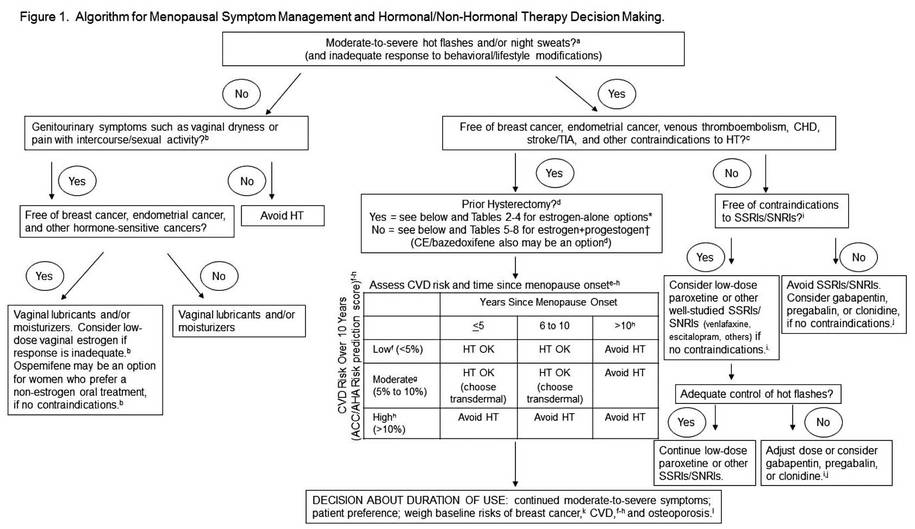
New mobile app assists clinicians in assessing menopausal patients
A new mobile app for iPhone and iPad enables both clinicians and patients to make decisions about menopausal therapies for moderate to severe hot flashes, night sweats, and/or genitourinary symptoms. The app also aids in assessing the patient’s risk of cardiovascular disease, breast cancer, and fracture.

|

|

|
The MenoPro app, developed in association with the North American Menopause Society (NAMS), is available free of charge from Apple. The app is designed to aid in the assessment and management of bothersome menopausal symptoms in women aged 45 and older.
Designed for both clinician and patient
A novel feature of the app is its two modes—one for the clinician and another for the patient. The clinician mode enables risk assessment and decision-making to determine whether hormonal therapy might be indicated and to determine the formulation and dosage of the therapy selected. It also features assessment of the patient’s 10-year risk of cardiovascular disease, her risk of breast cancer using the Gail model, and her fracture risk using the FRAX tool. When hormonal therapies are not appropriate, the app steers the clinician to nonhormonal options.
The patient can make use of the app to learn about her different treatment options, including lifestyle modifications. The app guides her through a self-assessment to gauge how far along she is in the menopausal transition, the severity of her symptoms, and her interest in hormonal or nonhormonal therapy. The app begins by recommending lifestyle changes and behavioral factors that can reduce menopausal symptoms. After a 3-month trial of these modifications, the patient is prompted to visit her health-care provider if further relief is needed.
Only FDA-approved drugs are recommended
“The app is completely up to date in terms of information about the newest medications that have been approved by the US Food and Drug Administration,” says JoAnn E. Manson, MD, DrPH, current chair of the NAMS Scientific Program and a past president of NAMS. Dr. Manson is Chief of the Division of Preventive Medicine at Brigham and Women’s Hospital in Boston. She also is Professor of Medicine and the Michael and Lee Bell Professor of Women’s Health at Harvard Medical School.
“The app focuses on FDA-approved medications, including off-label use of medications that may be commonly prescribed in practice to treat hot flashes, such as selective serotonin reuptake inhibitors (SSRIs) and serotonin-norepinephrine reuptake inhibitors (SNRIs),” she says.
“I think another big advantage is that very often clinicians who are managing patients during the menopausal transition or in early menopause may not be thinking that much about cardiovascular risk or even know how to evaluate it or make use of a 10-year risk score. So the app really helps them to become very familiar with the evaluation of cardiovascular risk, breast cancer risk, and fracture risk, and provides them with the resources to make use of the information.”
An algorithm is available within the app
The app is based on an algorithm that can be accessed within the app by choosing the “About” button. Another feature: the clinician can email a summary of the patient’s assessment directly to her, along with links to resources on a variety of relevant topics.
“In the future, there is a plan to have the app available for other mobile phones and tablet devices in addition to the iPhone and iPad,” says Dr. Manson. “We also hope to have it incorporated into electronic health records, where it could be used for clinical decision-making within the record.”
The app is not intended to replace clinical judgment, she adds. “I think clinicians are really familiar with the concept that, when you’re using an app, clinical judgment remains paramount. The app is not going to replace the clinician’s own discernment of what is going on with the patient.”
For detailed information, see an article on the app in the journal Menopause, available at http://www.menopause.org/docs/default-source/professional/our-new-paper.pdf
Share your thoughts on this article! Send your Letter to the Editor to [email protected]. Please include your name and the city and state in which you practice.
A new mobile app for iPhone and iPad enables both clinicians and patients to make decisions about menopausal therapies for moderate to severe hot flashes, night sweats, and/or genitourinary symptoms. The app also aids in assessing the patient’s risk of cardiovascular disease, breast cancer, and fracture.
|
|
|
|
|
|
The MenoPro app, developed in association with the North American Menopause Society (NAMS), is available free of charge from Apple. The app is designed to aid in the assessment and management of bothersome menopausal symptoms in women aged 45 and older.
Designed for both clinician and patient
A novel feature of the app is its two modes—one for the clinician and another for the patient. The clinician mode enables risk assessment and decision-making to determine whether hormonal therapy might be indicated and to determine the formulation and dosage of the therapy selected. It also features assessment of the patient’s 10-year risk of cardiovascular disease, her risk of breast cancer using the Gail model, and her fracture risk using the FRAX tool. When hormonal therapies are not appropriate, the app steers the clinician to nonhormonal options.
The patient can make use of the app to learn about her different treatment options, including lifestyle modifications. The app guides her through a self-assessment to gauge how far along she is in the menopausal transition, the severity of her symptoms, and her interest in hormonal or nonhormonal therapy. The app begins by recommending lifestyle changes and behavioral factors that can reduce menopausal symptoms. After a 3-month trial of these modifications, the patient is prompted to visit her health-care provider if further relief is needed.
Only FDA-approved drugs are recommended
“The app is completely up to date in terms of information about the newest medications that have been approved by the US Food and Drug Administration,” says JoAnn E. Manson, MD, DrPH, current chair of the NAMS Scientific Program and a past president of NAMS. Dr. Manson is Chief of the Division of Preventive Medicine at Brigham and Women’s Hospital in Boston. She also is Professor of Medicine and the Michael and Lee Bell Professor of Women’s Health at Harvard Medical School.
“The app focuses on FDA-approved medications, including off-label use of medications that may be commonly prescribed in practice to treat hot flashes, such as selective serotonin reuptake inhibitors (SSRIs) and serotonin-norepinephrine reuptake inhibitors (SNRIs),” she says.
“I think another big advantage is that very often clinicians who are managing patients during the menopausal transition or in early menopause may not be thinking that much about cardiovascular risk or even know how to evaluate it or make use of a 10-year risk score. So the app really helps them to become very familiar with the evaluation of cardiovascular risk, breast cancer risk, and fracture risk, and provides them with the resources to make use of the information.”
An algorithm is available within the app
The app is based on an algorithm that can be accessed within the app by choosing the “About” button. Another feature: the clinician can email a summary of the patient’s assessment directly to her, along with links to resources on a variety of relevant topics.
“In the future, there is a plan to have the app available for other mobile phones and tablet devices in addition to the iPhone and iPad,” says Dr. Manson. “We also hope to have it incorporated into electronic health records, where it could be used for clinical decision-making within the record.”
The app is not intended to replace clinical judgment, she adds. “I think clinicians are really familiar with the concept that, when you’re using an app, clinical judgment remains paramount. The app is not going to replace the clinician’s own discernment of what is going on with the patient.”
For detailed information, see an article on the app in the journal Menopause, available at http://www.menopause.org/docs/default-source/professional/our-new-paper.pdf
Share your thoughts on this article! Send your Letter to the Editor to [email protected]. Please include your name and the city and state in which you practice.
Positive CvLPRIT results lead ACC to change guidelines
BARCELONA – Heart attack patients who had complete revascularization of all blocked arteries had better outcomes than those who had only the “culprit” artery unblocked, according to results from the CvLPRIT (Complete Versus Lesion-Only Primary PCI Trial) study.
The open label, randomized trial showed that among patients with acute ST-segment elevation myocardial infarction (STEMI), those who had stenting of significant coronary stenoses not responsible for the infarction as well as the infarct-producing lesion had a 55% reduction in major adverse cardiac events (MACE) at 1 year, compared with the group that had only the infarct-related artery treated. The results were presented at the annual congress of the European Society of Cardiology.

The positive results mirror the results of the PRAMI trial presented at last year’s ESC annual congress, and seem to be the tipping point for the American College of Cardiology to withdraw one of its Choosing Wisely recommendations, which had questioned any intervention beyond unblocking just the artery responsible for the heart attack.
“The newest findings regarding coronary revascularization are great examples of science on the move, and we are responding accordingly,” wrote ACC President Patrick T. O’Gara in a statement issued on Sept. 22, not too long after the results of CvLPRIT were presented.
Dr. Anthony Gershlick, who presented the results of CvLPRIT at ESC, also concluded that “this strategy may be needed to be considered for future STEMI guidelines committees.”
But the topic remains controversial, and not all experts agree that it’s time for a change in clinical practice.
Dr. Shamir R. Mehta of McMaster University in Hamilton, Ont., said that both the CvLPRIT and PRAMI trials are still relatively small to measure up to the results of large meta-analyses, which show that revascularization of nonculprit arteries at the time of primary percutaneous coronary intervention (PCI) could be associated with higher mortality rates.
“The important question is, was there a significant hazard with doing revascularization at a later time point, and unfortunately this trial was too small to answer that question,” Dr. Mehta said at ESC. Dr. Gershlick, of University Hospitals of Leicester NHS Trust in England, disagreed.
“One question for me was, if a clinician is presented with angiographically significant stenoses in a non–infarct-related artery, should these be treated on that admission?” said Dr. Gershlick in a press conference. He said although retrospective registry data suggest otherwise, the results of PRAMI showed a 65% reduction in MACE with total revascularization at the time of primary PCI.
For CvLPRIT, he and his colleagues randomized 296 heart attack patients to receive either revascularization of only the infarct-related artery (146 patients), or have complete revascularization at the time of primary PCI.
The primary endpoint was MACE, which is a composite of total mortality, recurrent myocardial infarction (MI), heart failure, and ischemia-driven revascularization at 12 months.
Patients were on average 65 years old and mostly male. More than 80% had stenoses of a non–infarct-related artery, and more than 70% were treated via the radial approach.
In the complete revascularization group, the non–infarct-related arteries were treated after the infarct-related artery during the same sitting or during the same hospital admission.
At 12 months, there was a 55% reduction in MACE among patients who had complete revascularization. All components of the composite endpoint also showed a decrease, although they didn’t reach significance, compared with the group that received stenting of only the infarct-related artery.
There also was a reduction in all-cause mortality, recurrent MI, heart failure, and repeat revascularization in the complete revascularization group.
In addition, there were no safety signals, Dr. Gershlick said.
The study had several limitations, including its small size, combined endpoint, and loss to follow-up.
Experts agreed that there’s a need for larger randomized trials, such as the COMPLETE trial, which is currently enrolling patients.
Dr. Gershlick and Dr. Mehta had no disclosures.
On Twitter @naseemmiller
BARCELONA – Heart attack patients who had complete revascularization of all blocked arteries had better outcomes than those who had only the “culprit” artery unblocked, according to results from the CvLPRIT (Complete Versus Lesion-Only Primary PCI Trial) study.
The open label, randomized trial showed that among patients with acute ST-segment elevation myocardial infarction (STEMI), those who had stenting of significant coronary stenoses not responsible for the infarction as well as the infarct-producing lesion had a 55% reduction in major adverse cardiac events (MACE) at 1 year, compared with the group that had only the infarct-related artery treated. The results were presented at the annual congress of the European Society of Cardiology.
The positive results mirror the results of the PRAMI trial presented at last year’s ESC annual congress, and seem to be the tipping point for the American College of Cardiology to withdraw one of its Choosing Wisely recommendations, which had questioned any intervention beyond unblocking just the artery responsible for the heart attack.
“The newest findings regarding coronary revascularization are great examples of science on the move, and we are responding accordingly,” wrote ACC President Patrick T. O’Gara in a statement issued on Sept. 22, not too long after the results of CvLPRIT were presented.
Dr. Anthony Gershlick, who presented the results of CvLPRIT at ESC, also concluded that “this strategy may be needed to be considered for future STEMI guidelines committees.”
But the topic remains controversial, and not all experts agree that it’s time for a change in clinical practice.
Dr. Shamir R. Mehta of McMaster University in Hamilton, Ont., said that both the CvLPRIT and PRAMI trials are still relatively small to measure up to the results of large meta-analyses, which show that revascularization of nonculprit arteries at the time of primary percutaneous coronary intervention (PCI) could be associated with higher mortality rates.
“The important question is, was there a significant hazard with doing revascularization at a later time point, and unfortunately this trial was too small to answer that question,” Dr. Mehta said at ESC. Dr. Gershlick, of University Hospitals of Leicester NHS Trust in England, disagreed.
“One question for me was, if a clinician is presented with angiographically significant stenoses in a non–infarct-related artery, should these be treated on that admission?” said Dr. Gershlick in a press conference. He said although retrospective registry data suggest otherwise, the results of PRAMI showed a 65% reduction in MACE with total revascularization at the time of primary PCI.
For CvLPRIT, he and his colleagues randomized 296 heart attack patients to receive either revascularization of only the infarct-related artery (146 patients), or have complete revascularization at the time of primary PCI.
The primary endpoint was MACE, which is a composite of total mortality, recurrent myocardial infarction (MI), heart failure, and ischemia-driven revascularization at 12 months.
Patients were on average 65 years old and mostly male. More than 80% had stenoses of a non–infarct-related artery, and more than 70% were treated via the radial approach.
In the complete revascularization group, the non–infarct-related arteries were treated after the infarct-related artery during the same sitting or during the same hospital admission.
At 12 months, there was a 55% reduction in MACE among patients who had complete revascularization. All components of the composite endpoint also showed a decrease, although they didn’t reach significance, compared with the group that received stenting of only the infarct-related artery.
There also was a reduction in all-cause mortality, recurrent MI, heart failure, and repeat revascularization in the complete revascularization group.
In addition, there were no safety signals, Dr. Gershlick said.
The study had several limitations, including its small size, combined endpoint, and loss to follow-up.
Experts agreed that there’s a need for larger randomized trials, such as the COMPLETE trial, which is currently enrolling patients.
Dr. Gershlick and Dr. Mehta had no disclosures.
On Twitter @naseemmiller
AT THE ESC CONGRESS 2014
Key clinical point: Complete revascularization at the time of primary PCI may be considered by future STEMI guidelines committees.
Major finding: There was a 55% reduction in MACE among heart attack patients who received complete revascularization at the time of primary PCI.
Data source: An open-label, randomized trial of 296 heart attack patients.
Disclosures: Dr. Gershlick and Dr. Mehta had no disclosures.

Selling your practice
A generation ago, the sale of a medical practice was much like the sale of any other business: A retiring physician would sell his or her practice to a young doctor, and the practice would continue on as before. Occasionally that still happens, but changes in the business of medicine – most significantly the growth of managed care – have had a big impact on the way medical practices are bought and sold.
For one thing, there are far fewer solo practitioners these days, and polls indicate that most young physicians intend to continue that trend. The buyer of a medical practice today is more likely to be an institution, such as a hospital, an HMO, or a large practice group, rather than an individual physician.
Also, because the rules governing such sales have become so numbingly complex, the services of expert (and expensive) third parties are essential.
While these issues may complicate matters, there is still a market for the sale of medical practices. However, you must do everything possible to ensure you identify the best possible buyer and structure the best deal.
The first hurdle is the accurate valuation of your practice, which was covered in some detail last month. For the protection of both parties, it is important that the appraisal be done by an experienced and neutral financial consultant, that all techniques used in the valuation be divulged and explained, and that documentation be supplied to support the conclusions reached.
Keep in mind that the valuation will not necessarily equal the purchase price; other factors may need to be considered before a final price can be agreed upon. Keep in mind, too, that there may be legal constraints on the purchase price. For example, if the buyer is a nonprofit corporation, such as a hospital or HMO, by law it cannot pay in excess of fair market value for the practice – which may rule out any valuation of “good will.” In some states, such as mine (New Jersey), the purchase of private practices by hospitals is prohibited altogether – so you might need to consider a long-term lease rather than a sale.
Once a value has been agreed upon, you must consider how the transaction will be structured. The most popular structures include purchase of assets, purchase of corporate stock, or merger.
Buyers, especially institutional buyers, prefer to purchase assets, because it allows them to pick and choose only those items that have value to them. This can leave the seller with a bunch of “odd lots” to dispose of. But depending on the circumstances, an asset sale may be to the advantage of both parties.
Sellers typically prefer to sell stock because it allows them to sell their entire practice, which is often worth more than the sum of its parts, and often provides tax advantages.
The third option, merger, continues to grow in popularity. I’ll cover some of the more common merger variants in a future column.
Tax issues must always be considered. Most private practices are corporations, and the sale of corporate stock will result in a long-term capital gain which will be taxed (under current law) at 28%. As the saying goes, it’s not what you earn, it’s what you keep; so it may benefit the seller to accept a slightly lower price if the sale can be structured to provide significantly lower tax treatment. However, any gain that does not qualify as a long-term capital gain will be taxed as regular income – currently around 40% – plus a social security tax of about 15%.
Payment in installments is a popular way to defer taxes, since they are incurred on each installment as it is paid. However, such payments may be mistaken by the Internal Revenue Service for payments for referrals, which is illegal. And there is always the problem of making certain all the payments are made.
The seller may wish to continue working at the practice as an employee, and this is often to the buyer’s advantage as well. Transitioning to new ownership in stages often maximizes the value of the business by improving patient retention, and allows patients to become accustomed to the transition. However, care must be taken, with the aid of good legal advice, to structure such an arrangement in a way that minimizes concerns of fraud and abuse.
Dr. Eastern practices dermatology and dermatologic surgery in Belleville, N.J. He is the author of numerous articles and textbook chapters, and is a longtime monthly columnist for Skin & Allergy News. Additional columns are available online at edermatologynews.com.

Mitral valve guidelines stress early intervention at experienced centers
CHICAGO – Early repair and greater reliance on experienced surgical centers are key to the new guidelines on the management of mitral valve disease.
It’s been 8 years since the last American Heart Association/American College of Cardiology guideline on valvular heart disease in 2006, with little change in the 2008 update.
The 2014 guidelines, however, have substantiative changes, including the decision to begin talking about valvular disease and at-risk patients much as we do for heart failure, guideline committee member Robert Bonow said at the Heart Valve Summit 2014.

The 2014 guidelines, published earlier this year, include four stages of valvular heart disease:
Stage A, for people at risk of valvular disease such as those with bicuspid valves, a history of rheumatic heart disease, or mitral valve prolapse without regurgitation.
Stage B, for mild to moderate, asymptomatic disease.
Stage C, for severe, asymptomatic disease, including those with normal left ventricular function (stage C1) or depressed LV function (stage C2).
Stage D, for severe, symptomatic valve disease.
The new guidelines also drive home the point that primary and secondary mitral regurgitation (MR), while they can be difficult to distinguish, are separate diseases with different pathophysiologies, natural histories, management strategies, and outcomes, said Dr. Bonow, director of the Center for Cardiovascular Innovation, Northwestern University, Chicago.
Class 1 surgical indications for primary MR, or diseases of the valve, are symptomatic patients and asymptomatic patients with LV systolic dysfunction. This continues to be defined as an ejection fraction of < 60% or an end-systolic dimension > 40 mm, although new data have suggested that even smaller systolic dimensions may have prognostic importance, he noted.
Pulmonary hypertension and atrial fibrillation are class IIa indications for surgery in asymptomatic, primary MR.
Critics would argue that patients shouldn’t be allowed to develop these indications because they may be irreversible, but the reality is that many patients arrive in your office with one or more indications already in place, Dr. Bonow said. The real issue is whether mitral valve repair is feasible and can improve survival in patients who have normal LV function and none of these indications, with the guidelines clearly tipping in favor of early surgery for asymptomatic MR patients.

Dr. Bonow highlighted recent long-term outcomes data from Dr. Tirone David’s group (Circulation 2013;127:1485-92) showing that overall survival among patients undergoing mitral valve repair for degenerative diseases is 75% at 20 years for those with functional class (FC) I disease, 66% with FC II, 52% with FC III, and only 32% for those with FC IV.
“I think these data, along with many other series, are quite important in identifying the risks we have for our patients for waiting too long, and if we can refer our patients to an expert surgical team for these valves to be repaired, their outcomes will be much better,” Dr. Bonow said.
The guidelines include the class I indication that repair is better than mitral valve replacement for primary MR and that patients should be referred to “centers experienced in repair.” Instead of stating that there should be a 90% or greater likelihood of a durable repair without residual MR for a patient undergoing elective surgery at that center, the 2014 threshold is now set at more than 95%.
“We really want to make sure patients are going to an experienced center,” he said.
Despite the emphasis on a heart team approach and referral to experienced centers, the term “experienced” has not been fully defined, Dr. Bonow acknowledged.
“Our medical and surgical societies need to be working together to start defining what we mean by ‘experienced,’ what we mean by ‘centers of excellence,’ and that process is already underway,” he added.
Dr. David H. Adams, chair of cardiovascular surgery at Mount Sinai Hospital, New York City, said that there’s no question asymptomatic patients need to be treated in experienced repair centers, but questioned whether the 95% threshold is realistic. Although repair rates are increasing worldwide, Society of Thoracic Surgery published data show a wide disparity in mitral repair that would be troublesome in an asymptomatic population. Mandatory reporting data from New York State, home to several experienced heart programs, also show that 45% of the latest 4,325 mitral valves with interventions were replaced, rather than repaired. Dr. Adams added that data are similar across the world.
He also urged caution about an “asymptomatic surgery for all” attitude, emphasizing judgment is necessary, particularly in elderly patients or in those who are very early in the course of severe regurgitation with no evidence of ventricular dilation or declining systolic function.
Finally, the new guidelines include recommendations for using transcatheter valves and the mitral clip to treat patients with secondary MR with LV dysfunction. This is not yet an approved indication from the Food and Drug Administration, pending the results of three ongoing trials, but in Europe, more than 70% of patients getting a mitral clip do so for secondary MR rather than primary mitral valve prolapse, Dr. Bonow said. The European guidelines came out 2 years ahead of the new AHA/ACC guidelines because writing was delayed until these devices were approved in the United States.
Secondary MR, or disease of the heart muscle, remains “problematic” because of a lack of outcomes data indicating that surgery leads to a better outcome than medical management in patients with LV dysfunction and because of questions raised by the Cardiothoracic Surgical Network about whether these valves should be repaired rather than replaced, he said.
What remains is a solid class 1 recommendation for guideline-directed medical therapy for heart failure including cardiac resynchronization therapy (CRT).
The surgical indications in secondary MR are class IIa for patients with severe MR undergoing coronary artery bypass grafting or aortic valve replacement and class IIb for those not undergoing such surgeries, but with severe MR and persistent symptoms, despite medical therapy, including CRT.
“There’s no data we’re going to improve survival ... but clearly some patients will have a dramatic improvement in symptoms,” Dr. Bonow said.
Dr. Bonow disclosed reviewing grant applications for the Gilead (Sciences) Scholars Program. Dr. Adams disclosed royalties as an inventor for Edwards Lifesciences and Medtronic, and serving as a Medtronic national coprimary investigator for the CoreValve Trial.
CHICAGO – Early repair and greater reliance on experienced surgical centers are key to the new guidelines on the management of mitral valve disease.
It’s been 8 years since the last American Heart Association/American College of Cardiology guideline on valvular heart disease in 2006, with little change in the 2008 update.
The 2014 guidelines, however, have substantiative changes, including the decision to begin talking about valvular disease and at-risk patients much as we do for heart failure, guideline committee member Robert Bonow said at the Heart Valve Summit 2014.
The 2014 guidelines, published earlier this year, include four stages of valvular heart disease:
Stage A, for people at risk of valvular disease such as those with bicuspid valves, a history of rheumatic heart disease, or mitral valve prolapse without regurgitation.
Stage B, for mild to moderate, asymptomatic disease.
Stage C, for severe, asymptomatic disease, including those with normal left ventricular function (stage C1) or depressed LV function (stage C2).
Stage D, for severe, symptomatic valve disease.
The new guidelines also drive home the point that primary and secondary mitral regurgitation (MR), while they can be difficult to distinguish, are separate diseases with different pathophysiologies, natural histories, management strategies, and outcomes, said Dr. Bonow, director of the Center for Cardiovascular Innovation, Northwestern University, Chicago.
Class 1 surgical indications for primary MR, or diseases of the valve, are symptomatic patients and asymptomatic patients with LV systolic dysfunction. This continues to be defined as an ejection fraction of < 60% or an end-systolic dimension > 40 mm, although new data have suggested that even smaller systolic dimensions may have prognostic importance, he noted.
Pulmonary hypertension and atrial fibrillation are class IIa indications for surgery in asymptomatic, primary MR.
Critics would argue that patients shouldn’t be allowed to develop these indications because they may be irreversible, but the reality is that many patients arrive in your office with one or more indications already in place, Dr. Bonow said. The real issue is whether mitral valve repair is feasible and can improve survival in patients who have normal LV function and none of these indications, with the guidelines clearly tipping in favor of early surgery for asymptomatic MR patients.
Dr. Bonow highlighted recent long-term outcomes data from Dr. Tirone David’s group (Circulation 2013;127:1485-92) showing that overall survival among patients undergoing mitral valve repair for degenerative diseases is 75% at 20 years for those with functional class (FC) I disease, 66% with FC II, 52% with FC III, and only 32% for those with FC IV.
“I think these data, along with many other series, are quite important in identifying the risks we have for our patients for waiting too long, and if we can refer our patients to an expert surgical team for these valves to be repaired, their outcomes will be much better,” Dr. Bonow said.
The guidelines include the class I indication that repair is better than mitral valve replacement for primary MR and that patients should be referred to “centers experienced in repair.” Instead of stating that there should be a 90% or greater likelihood of a durable repair without residual MR for a patient undergoing elective surgery at that center, the 2014 threshold is now set at more than 95%.
“We really want to make sure patients are going to an experienced center,” he said.
Despite the emphasis on a heart team approach and referral to experienced centers, the term “experienced” has not been fully defined, Dr. Bonow acknowledged.
“Our medical and surgical societies need to be working together to start defining what we mean by ‘experienced,’ what we mean by ‘centers of excellence,’ and that process is already underway,” he added.
Dr. David H. Adams, chair of cardiovascular surgery at Mount Sinai Hospital, New York City, said that there’s no question asymptomatic patients need to be treated in experienced repair centers, but questioned whether the 95% threshold is realistic. Although repair rates are increasing worldwide, Society of Thoracic Surgery published data show a wide disparity in mitral repair that would be troublesome in an asymptomatic population. Mandatory reporting data from New York State, home to several experienced heart programs, also show that 45% of the latest 4,325 mitral valves with interventions were replaced, rather than repaired. Dr. Adams added that data are similar across the world.
He also urged caution about an “asymptomatic surgery for all” attitude, emphasizing judgment is necessary, particularly in elderly patients or in those who are very early in the course of severe regurgitation with no evidence of ventricular dilation or declining systolic function.
Finally, the new guidelines include recommendations for using transcatheter valves and the mitral clip to treat patients with secondary MR with LV dysfunction. This is not yet an approved indication from the Food and Drug Administration, pending the results of three ongoing trials, but in Europe, more than 70% of patients getting a mitral clip do so for secondary MR rather than primary mitral valve prolapse, Dr. Bonow said. The European guidelines came out 2 years ahead of the new AHA/ACC guidelines because writing was delayed until these devices were approved in the United States.
Secondary MR, or disease of the heart muscle, remains “problematic” because of a lack of outcomes data indicating that surgery leads to a better outcome than medical management in patients with LV dysfunction and because of questions raised by the Cardiothoracic Surgical Network about whether these valves should be repaired rather than replaced, he said.
What remains is a solid class 1 recommendation for guideline-directed medical therapy for heart failure including cardiac resynchronization therapy (CRT).
The surgical indications in secondary MR are class IIa for patients with severe MR undergoing coronary artery bypass grafting or aortic valve replacement and class IIb for those not undergoing such surgeries, but with severe MR and persistent symptoms, despite medical therapy, including CRT.
“There’s no data we’re going to improve survival ... but clearly some patients will have a dramatic improvement in symptoms,” Dr. Bonow said.
Dr. Bonow disclosed reviewing grant applications for the Gilead (Sciences) Scholars Program. Dr. Adams disclosed royalties as an inventor for Edwards Lifesciences and Medtronic, and serving as a Medtronic national coprimary investigator for the CoreValve Trial.
AT THE HEART VALVE SUMMIT 2014

Drug can safely target NF-κB pathway in MM

Credit: Rhoda Baer
A new drug can safely target the NF-κB pathway in multiple myeloma (MM), according to research published in Cancer Cell.
The investigators identified an interaction between the NF-κB-regulated antiapoptotic factor GADD45β and the JNK kinase MKK7 as a therapeutic target in MM.
They then developed a drug known as DTP3, which disrupts the GADD45β/MKK7 complex, thereby killing MM cells in vitro and in vivo, without harming normal cells.
“Lab studies suggest that DTP3 could have therapeutic benefit for patients with multiple myeloma and potentially several other types of cancer, but we will need to confirm this in our clinical trials, the first of which will start next year,” said study author Guido Franzoso, MD, PhD, of Imperial College London in the UK.
Dr Franzoso and his colleagues knew that NF-κB is overactive in MM and other malignancies, but targeting NF-κB can have detrimental effects on healthy cells. So they looked for target genes downstream of NF-kB that might be responsible for its role in cancers.
By studying cells from MM patients, the investigators identified the protein complex GADD45β/MKK7, which appeared to play a critical role in allowing MM cells to survive.
Searching for a safe way to target the NF-kB pathway, the team screened more than 20,000 molecules and found 2 that disrupted GADD45β/MKK7. Further refinements led to the development of DTP3.
In human MM cells, DTP3 had a similar anticancer potency to that of bortezomib, but with a more than 100-fold higher cancer-cell specificity. DTP3 also retained full therapeutic efficacy in cell lines that were resistant to standard MM treatments.
In mice, DTP3 eradicated MM, with no apparent side effects at the effective doses.
In an orthotopic xenograft model of MM, control mice had a median overall survival of 26 days. But mice treated with DTP3 had a median overall survival that extended past the experimental endpoint on day 161.
“We had known for many years that NF-kB is very important for cancer cells, but because it is also needed by healthy cells, we did not know how to block it specifically,” Dr Franzoso said.
“The discovery that blocking the GADD45β/MKK7 segment of the NF-kB pathway with our DTP3 peptide therapeutic selectively kills myeloma cells could offer a completely new approach to treating patients with certain cancers, such as multiple myeloma.”
A spinout company, Kesios Therapeutics, was formed to commercialize DTP3 and other drug candidates based on Dr Franzoso’s research, with support from Imperial Innovations, a technology commercialization company focused on developing academic research in the UK. ![]()
VTE is ‘major contributor’ to global disease burden

Credit: Andre E.X. Brown
Results of a systematic review suggest venous thromboembolism (VTE) has a high disease burden throughout the world, regardless of a country’s income.
Researchers reviewed the literature to quantify the global disease burden of VTE.
And they found that VTE associated with hospitalization was the leading cause of disability-adjusted life-years (DALYs) lost in low- and middle-income countries. It was the second most common cause of DALYs lost in high-income countries.
“Venous thromboembolism in hospitalized patients was responsible for more years lost due to ill-health than hospital-acquired pneumonia, catheter-related blood stream infections, and side effects from drugs,” said study author Gary Raskob, PhD, of the University of Oklahoma Health Sciences Center in Oklahoma City.
Dr Raskob and his colleagues reported these results in the Journal of Thrombosis & Haemostasis.
The team reviewed 8702 studies on VTE and found that studies from western Europe, North America, Australia, and southern Latin America (Argentina) yielded consistent results.
The annual incidence of VTE ranged from 0.75 to 2.69 per 1000 individuals in the population. The incidence increased to between 2 and 7 VTEs per 1000 people among those 70 years of age or older.
Only two studies were designed to evaluate the prevalence of VTE, and both were conducted using US data. In one study, researchers investigated the prevalence of VTE from 2002 to 2006 using a health insurance claims database of 12.7 million individuals.
VTE occurred in 3.2 enrollees per 1000 in 2002 and 4.2 per 1000 in 2006. In 2006, the prevalence of VTE was 13.8 per 1000 in enrollees age 65 and older and 2.3 per 1000 in those younger than 65 years of age.
The other study designed to assess VTE prevalence in the US showed that prevalence was highest in African American males, followed by Caucasian males, Caucasian females, and African American females. Hispanic individuals of both sexes had the lowest prevalence rates.
Two studies were designed to evaluate VTE disease burden in terms of DALYs. The strongest of these included data from a literature review and epidemiologic studies commissioned by the WHO.
The study showed that VTE occurred in 3.3 of 100 hospitalizations in high-income countries and 3.0 of 100 hospitalizations in low-income and middle-income countries. The estimated annual cases of VTE were 3.9 million and 6.0 million, respectively.
VTE was the leading cause of hospital-related DALYs lost overall. It was responsible for a third (7681) of the 22,644 DALYs.
The researchers concluded that VTE causes a major burden of disease across low-income, middle-income, and high-income countries. However, more detailed data on the global burden of VTE is needed. ![]()
Study reveals potential strategy for treating leukemia

The protein kinases Cdk4 and Cdk6 may determine the incidence and aggressiveness of leukemia, according to preclinical research.
The study showed that Cdk4 and Cdk6 cooperate to promote hematopoietic tumor development in mice.
And inhibiting Cdk4 and Cdk6 simultaneously proved a more effective method of fighting leukemia than inhibiting either protein alone.
The researchers recounted these findings in Blood.
“Cdk4/6 inhibitors used in cancer treatment don’t differentiate between the two molecules,” said study author Marcos Malumbres, PhD, of the Spanish National Cancer Research Centre (CNIO).
“The effectiveness of blocking both proteins at once has not been demonstrated to date.”
To get a wider perspective on this issue, Dr Malumbres and his colleagues designed genetically modified mice carrying active Cdk4, active Cdk6, or both versions of the active proteins.
The researchers found that simultaneous activation of both proteins promoted tumor growth in the mice, leading to more aggressive tumors and an increased risk of developing leukemia.
The team also found an explanation for why the simultaneous activation of Cdk4 and Cdk6 leads to such aggressive tumors.
Under normal conditions, Cdk4 and Cdk6 are inhibited by p16INK4A proteins. But when both Cdk4 and Cdk6 are present at high levels, p16INK4A proteins are unable to act as a retaining wall, leading to uncontrolled tumor growth.
“The assumption to date has been that these molecules act independently of each other,” Dr Malumbres said. “However, our recent findings now suggest that the combined inhibitors could be a more effective cancer treatment.”
“The clinical success of these compounds depends on the appropriate selection of patients. Our findings could help us to understand the molecular basis underpinning the success of these inhibitors, thereby contributing to the development of novel and more effective drugs.” ![]()
How being a parent affects advanced cancer patients

Credit: Vera Kratochvil
BOSTON—Having dependent children may motivate advanced cancer patients to pursue more aggressive treatment, a pilot study indicates.
Parental status was an important factor in treatment decision-making for most of the 42 patients studied.
A majority of patients said being a parent motivated them to pursue life-extending treatments, although some patients mentioned the importance of staying close to their families to receive treatment and retaining the ability to function as a parent.
This research was released in a presscast in advance of ASCO’s 2014 Quality Care Symposium, which is scheduled to take place October 17-18 at the Boston Marriott Copley Place. The research is set to be presented as abstract 65.*
Researchers interviewed 42 patients with metastatic cancer who have children younger than 18 years of age. The patients had an average age of 44.
When asked how having children influenced their treatment decisions, 64% of patients said being a parent motivated them to pursue life-extending treatments, largely out of a desire to have more time with their children. However, 24% of patients said being a parent did not influence their treatment decisions.
Twenty-four percent of respondents identified preserving parental functioning as a treatment priority. They didn’t want side effects interfering with their or their children’s daily lives.
And 12% of patients mentioned the importance of receiving treatment close to their families, rather than traveling for a second opinion or pursuing treatment that might require long hospital stays.
Fifty-two percent of patients indicated an interest in using hospice services. Others were specifically interested in institutional rather than home hospice care, due to a desire to protect their children from the dying experience.
Fifty-nine percent of patients reported an interest in receiving palliative care concurrent with their cancer treatment, although several patients seemed to conflate palliative care with end-of-life care.
“Numerous psychosocial factors influence patients’ decisions about cancer treatment,” said lead study author Devon Check, a PhD student at the University of North Carolina at Chapel Hill.
“It’s important for patients with dependent children to discuss their treatment priorities with their oncologist, who may not know, for example, how important it is for a patient with children to preserve their functioning at home.”
“We hope that our study can help oncologists engage patients with children in shared decision-making and promote alignment of the treatment plan with the patients’ priorities, including family responsibilities.”
Although this study included patients with a range of physical functioning and a variety of cancer types, the findings may not generalize to other patient groups.
The researchers are planning a larger study to explore the associations between parental status, parenting concerns, and decision-making about treatment for advanced cancer. ![]()
*Some of the data presented differ from data in the abstract.