User login
Consider small-fiber neuropathies in systemic lupus erythematosus
Small-fiber neuropathy is one of the most common types of peripheral neuropathy affecting patients with systemic lupus erythematosus, but it isn’t even mentioned in the American College of Rheumatology neuropsychiatric case definitions of manifestations of the disorder, according to a retrospective analysis of cohort of 2,097 patients with SLE.
Other types of peripheral neuropathy, such as acute inflammatory demyelinating neuropathies (for example, Guillain-Barré syndrome), plexopathies, and mononeuritis multiplex, are well described in the ACR-NPSLE case definitions but occur much less frequently. This, combined with the fact that small-fiber neuropathies often present as "unorthodox" pain patterns, indicates that they are underdiagnosed, said Dr. Amin Oomatia of the University of Cambridge, England, and his coinvestigators at John Hopkins University, Baltimore.
Small-fiber neuropathies arise through mechanisms that are distinct from those of other neuropathies and require different diagnostic strategies to be properly identified. In particular, small-fiber neuropathies do not always conform to the "stocking-and-glove" pattern of pain that is typical of other neuropathies in SLE, so it is likely that many affected patients "may be regarded in routine clinical care as having a ‘nonorganic’ pain disorder.
"Our findings suggest that rheumatologists and other clinicians who confront SLE patients with seemingly improbable pain patterns should consider the diagnosis of a small-fiber neuropathy," the investigators wrote, especially since it may occur in the face of normal electrodiagnostic studies.
Dr. Oomatia and his colleagues based these conclusions on their retrospective study of one medical center’s 25-year experience treating 2,097 SLE patients – the Johns Hopkins Lupus Cohort. Using details in a database of patients’ electronic medical records, they identified 82 patients who had peripheral neuropathies related to SLE.
Only one patient had peripheral neuropathy attributable to Guillain-Barré syndrome, only one patient had a plexopathy, and only six patients had mononeuritis multiplex, demonstrating that these are very infrequent complications of SLE even though they are included in ACR case definitions.
In contrast, 14 patients (17% of those with peripheral neuropathy) had biopsy-proven small-fiber neuropathies, and most of them presented with "an entirely different and unorthodox pain distribution" characterized as patchy, asymmetric, or proximal.
In particular, nine patients had pain affecting the face, torso, and/or proximal extremities. Three had burning pain over their entire bodies, the investigators said (Arthritis Rheum. 2013 Dec. 10 [doi:10.1002/art.38302]).
In these cases, punch skin biopsy showed abnormalities that disproportionately affected the proximal thigh, "which is considered a surrogate indicator of proximal-most dorsal root ganglia neuronal cell loss," they wrote. In contrast, other patients who had the typical distal pattern of neuropathic pain showed decreased intraepidermal nerve-fiber densities in the distal leg, a surrogate indicator of distal-most axonal degeneration.
Another distinguishing feature of small-fiber neuropathy was its association with a history of herpes zoster virus, opportunistic infections, and osteoporotic fractures, all unrelated to corticosteroid dose, Dr. Oomatia and his associates said.
This study was supported in part by the National Institutes of Health and the National Center for Research Resources. No potential financial conflicts of interest were reported.
FROM ARTHRITIS AND RHEUMATISM
Major finding: A total of 14 patients, or 17% of 82 with peripheral neuropathies, had biopsy-proven small-fiber neuropathies and often presented with unorthodox patterns of pain.
Data source: A retrospective analysis of data regarding 2,097 consecutive patients with SLE registered in the Johns Hopkins Lupus Cohort during a 25-year period, including 82 who developed peripheral neuropathies related to the disease.
Disclosures: This study was supported in part by the National Institutes of Health and the National Center for Research Resources. No potential financial conflicts of interest were reported.
Electronic Consult Experience: Making Health Care More Accessible and Convenient for Veterans
Focusing on statins
I have been thinking about the recent cholesterol management guidelines offered by the American Heart Association and American College of Cardiology experts (J. Am. Coll. Cardiol. 2013;doi:10.1016/j.jacc.2013.11.002) and how they affect my approach to my patients. I am quick to agree to the first three points and the end of LDL targeted therapy in the guidelines, which focus now on the intensity of statins therapy in patients who have already expressed the complications of atherosclerotic cardiovascular disease (ASCVD).
However, I do question a cardiovascular prevention program that, for low-risk individuals with an LDL cholesterol level above 190 mg/dL, is largely driven by statin therapy based on a risk prediction model using age, sex, hypertension, smoking, HDL, and LDL cholesterol elevation. Of all risk factors, smoking and LDL are the only ones that we can modify. Although we have made a major attack on smoking, it would seem that the key to survival is that all of us should take a statin.
There is an abundant source of data on the benefit of statin therapy in patients who have already expressed ASCVD. Although data are limited in regard to very-low-risk groups without evidence of ASCVD, a meta-analysis by the Cholesterol Treatment Trialist Collaborators indicates that the lowering of LDL cholesterol by 40 mg/dL results in an approximate 12% decrease in vascular mortality and 20% decrease in cardiac deaths, regardless of regardless of risk category (Lancet 2012;380;581-90). This benefit was observed even in low-risk individuals despite the slight excess risk of hemorrhagic strokes and diabetes.
The prediction model appears to be the major point of controversy. Along with thousands other Americans, I went to the AHA website to see what my risk score was. I found that by modifying a few factors I could move from less than a 7.5% risk of a stroke or a heart attack in the next 10 years to a risk of well over that. I was not reassured that I was in the company of more than 45 million fellow Americans. Critics of the risk model suggest that based on a number of epidemiologic surveys, the risk model may double the number of individuals to whom the prevention guidelines apply (Lancet 2013;382:1762-5). If we expand the population so broadly, are we going to be a society of statin pill poppers?
Our attempts in the last half-century to develop prevention therapy for hypertension and diabetes have only been marginally successful. The cardiorenal scourge of hypertension remains, despite a plethora of effective drugs that have had little effect on chronic renal disease. Although therapy for diabetes has been supremely effective in treating the acute and chronic metabolic aspects of diabetes, insulin therapy has not been successful in preventing the long-term expression of the cardiovascular, ophthalmic, and renal events. And now we are trying to assess the role of statins for the prevention of cardiovascular events.
In comparison to hypertension and diabetes, statin therapy has the potential to be a sea change in the prevention of ASCVD by lowering serum cholesterol and thereby limiting the growth of the atherosclerotic plaque. A number of clinical trials support the cardiovascular benefit of statin therapy and its effect on lowering serum cholesterol. Although it is clear that we need to reflect on the reliability of the current risk factor model, the current guidelines are an important step forward in the integration of statin therapy into the prevention of cardiovascular disease.
However, talking to patients and telling them that they have greater than a 7.5% risk of having a stroke or a heart attack in the next 10 years remains an abstract concept. The guideline committee now urges me to sit down with my patients and have a heart-to-heart talk about risk and how to decrease it by changing their dangerous lifestyles rather than taking statins for the rest of their lives. When it comes down to it, lifestyle change loses and statins win.
Dr. Goldstein, medical editor of Cardiology News, is professor of medicine at Wayne State University and division head emeritus of cardiovascular medicine at Henry Ford Hospital, both in Detroit. He is on data safety monitoring committees for the National Institutes of Health and several pharmaceutical companies.

The National Center for Telehealth and Technology
in Hospitalized Children
Clostridium difficile is the single most common cause of nosocomial diarrhea in both adults and children.[1, 2] C difficile infections (CDIs) can range from self‐limited diarrhea to severe pseudomembranous colitis. Though widely distributed in the environment, hospitals and child care facilities are major reservoirs for C difficile. Traditionally, hospitalization and antibiotic use have been the 2 major risk factors for acquiring CDI.
Recent studies suggest C difficile epidemiology is shifting. In 2005, the Centers for Disease Control and Prevention (CDC) reported CDIs in 33 otherwise low‐risk patients, 6 of whom were children.[3] Other studies have noted increasing incidence of pediatric CDIs,[4, 5, 6, 7] 1 identifying 43% with no prior antibiotic use.[4] This emerging data led to the recent American Academy of Pediatrics policy statement on pediatric CDIs.[8] Data regarding associated clinical risk factors of CDIs in pediatric patients in light of the changing epidemiology are limited. Only 1 recent study looked at 6 clinical factors and found that antibiotic use, history of solid organ transplantation, gastrointestinal (GI) devices, and acid suppressing medications increased risk for CDIs.[9]
Data regarding the source of these infections are also limited. Three pediatric studies evaluating source found a significant amount of community‐acquired disease (59%, 25%, and 19% of the study population, respectively).[4, 9, 10] However, only 1 of these studies provided clinical comparisons between community and hospital‐acquired cases.[10] To date, no study has examined a comprehensive list of potential risk factors that might differentiate hospitalized pediatric patients with CDIs from those with acute gastroenteritis (AGE).
PATIENTS AND METHODS
We conducted an investigator‐initiated, retrospective, case‐control study examining risk factors associated with CDIs in a hospitalized pediatric population at Rady Children's Hospital San Diego (RCHSD). Rady Children's is a tertiary‐care pediatric healthcare system and the sole pediatric referral center for San Diego, with a catchment of 850,000 children. RCHSD posts over 71,000 emergency department (ED) and 30,000 urgent care (UC) visits at 4 sites and over 15,000 admissions yearly. All system information is archived in 1 electronic database. We reviewed patient records for a 2‐year period from June 1, 2008 through May 31, 2010. The study protocol was reviewed and approved by the institutional review board at the University of California San Diego.
Cases of C difficile (CDs) included pediatric patients 18 years of age with all of the following: International Classification of Diseases, 9th Revision (ICD‐9) code for C difficile infection (08.45), a positive C difficile toxin A or B by enzyme immunoassay (EIA) (Meridian Bioscience, Inc., Cincinnati, OH), and the presence of diarrhea and/or abdominal pain. Randomly selected age‐matched controls from the same time period with a discharge diagnosis of AGE (APR‐DRG 249) and the presence of diarrhea served as controls (CTLs). In the 1 year age group, any patient with a positive C difficile toxin assay but no diagnosis of CDI was excluded from the CTL group to avoid potential confounding.
Records were reviewed for multiple potential risk factors based on limited past studies and other factors associated with CDI pathogenesis including age, race, ethnicity, antibiotic use within the previous 90 days (type, route, and duration), diarrhea type, abdominal pain, fever, proton pump inhibitor (PPI) use, sick contacts (diarrheal illness), recent travel, and hospitalization within the last 6 months. Diarrhea was defined as increase in stool frequency or volume. Past medical/surgical history abstracted included GI disease, past CDIs, abdominal surgery, immunodeficiency, renal disease, cardiac disease, nutritional deficiencies, and number of past hospitalizations (all cause). In addition, multiple factors during the hospital course were reviewed: length of stay (LOS), antibiotic therapy, diarrhea type, abdominal pain, fever, electrolyte levels, need for stool replacement fluid, and altered diet recommendations. Thirty‐day return to ED/UC or readmission and cause for the return were also retrieved on all patients. An objective data collection form was used, and all records were reviewed by 1 researcher (W.S.) with a second reviewer (E.F.) reviewing 20% of the charts, with 90% initial concordance. Consensus was reached on all elements abstracted.
Three additional subanalyses were completed. The first subanalysis compared antibiotic prophylaxis (defined as daily use of an antibiotic for >28 days) in CDs versus CTLs. We reviewed charts to ensure extended antibiotic use was for prophylaxis and not treatment. The second subanalysis compared CDs to those CTLs with a negative C difficile toxin assay. This was done to evaluate whether using this control group would highlight a different set of risk factors. The third subanalysis separated CDs into community‐acquired CD (CA‐CD) and hospital‐acquired CD (HA‐CD). We defined CA‐CD as any patient with symptoms either prior to or within the first 48 hours of the index admission and no past hospitalizations or with the last hospitalization >4 weeks prior to the index admission. Patients who developed symptoms at home or within 48 hours of the index admission, but had been hospitalized within the past 4 weeks, were defined as community‐onset HA‐CD. Patients who developed CDIs after 48 hours of the index admission were defined as hospital‐onset HA‐CD. These groupings are consistent with the CDI surveillance recommendations.[11]
All statistical analyses were performed with SPSS statistical software version 21.0 (SPSS Inc., Chicago, IL). Initial comparisons between CDs and CTLs were conducted using t tests for continuous variables and [2] tests for categorical variables. As CDI in infants is controversial, we analyzed our data with and without this cohort to eliminate extraneous, age‐related differences. After confirming that there were no issues with tolerance among possibly related factors, a saturated multiple logistic regression model was used to determine which of the independent variables identified in the initial comparison were predictors of having C difficile when controlling for factors associated with chronic disease.
RESULTS
Descriptive characteristics of the 134 CDs and the 274 CTLs are provided in Table 1. CDs and CTLs were similar in gender and race. More CDs had recent hospitalization and antibiotic exposure, with 24% of CDs versus 3% of CTLs treated with 2 or more antibiotics. Watery stools were the most common type of diarrhea in both CDs and CTLs, and bloody stools did not differ significantly between the 2 groups. However, abdominal pain on admission was more common in CTLs. CDs were more likely to have a history of GI disease, abdominal surgery, and specifically GI surgery. Immunodeficiency and PPI use were far more frequent in CDs, whereas exposure to sick contacts was more common in CTLs. Although CDs had an overall higher rate of ED/UC return visits and readmissions, the rate of return due to GI symptoms was similar in both groups. Reanalysis of the data with the <1‐year cohort removed showed persistent statistically significant findings in these variables. Hospital course, including electrolyte levels, need for intravenous fluids, or modified diets, did not significantly differ between CDs and CTLs (data not shown).
| Characteristics | Cases, N=134 (%) | Controls, N=274 (%) | P Value |
|---|---|---|---|
| |||
| Age, y | |||
| <1 | 28 (21) | 58 (21) | |
| 14 | 50 (37) | 100 (37) | |
| 59 | 21 (17) | 44 (16) | |
| 10 | 35 (26) | 72 (26) | |
| Sex, male | 68 (51) | 141 (52) | |
| Race | |||
| White | 63 (46) | 110 (40) | |
| Black | 6 (4) | 18 (7) | |
| Asian | 11 (8) | 15(6) | |
| Other | 50 (37) | 123 (45) | |
| Ethnicity, Hispanic | 70 (52) | 85 (31) | <0.001 |
| Diarrheaa | |||
| Admission | 50 (37) | 229 (83) | <0.001 |
| Bloody | 13/50 (26) | 29/229 (13) | |
| Watery | 37/50 (74) | 200/229 (87) | |
| Hospitalization | 128 (95) | 185 (68) | <0.001 |
| Bloody | 16/128 (13) | 10/185 (5) | |
| Watery | 112/128 (88) | 175/185 (95) | |
| Abdominal pain, admission | 30 (23) | 111 (41) | <0.001 |
| PPI use | 29 (22) | 18 (7) | <0.001 |
| Antibiotic use | |||
| Past 90 days | 88 (66) | 55 (20) | <0.001 |
| >2 antibiotics | 32 (24) | 9 (3) | <0.001 |
| Antibiotic type | |||
| Penicillin | 10 (11) | 19 (7) | 0.84 |
| Cephalosporins | 29 (21) | 19 (7) | <0.001 |
| Sulfa | 50 (37) | 12 (4) | <0.001 |
| Prophylaxis | 51 (37) | 10 (4) | <0.001 |
| Sick contacts | 4 (3) | 52 (19) | <0.001 |
| Hospitalization past 6 months | 88 (66) | 52 (19) | <0.001 |
| Past CDI | 12 (9) | 8 (4) | 0.013 |
| GI diseaseb | 41 (31) | 50 (18) | 0.005 |
| Immunodeficiencyc | 61 (46) | 17 (6) | <0.001 |
| Abdominal surgeryd | 41 (31) | 43 (16) | 0.001 |
| GI surgeryd | 32 (24) | 36 (13) | 0.01 |
| Returne | 41 (31) | 37 (14) | <0.001 |
| Due to GI symptoms | 12 (9) | 22 (8) | 0.85 |
Analysis of CDs without traditional risk factors was performed. To identify patients, we first selected the 46 (34%) without prior antibiotic exposure, then eliminated 19 who had been hospitalized within the past 6 months. Of the remaining 27 patients, 16 had a prolonged hospitalization (>5 days) at the time of CDI diagnosis. This left us with 11 patients (8% of CDs) without any common risk factors of antibiotic use, recent hospitalization, or prolonged hospitalization. None of these patients had a history of CDIs; 6 had significant medical histories. A detailed description of these 11 patients if provided in Table 2.
| Case No. | Age, y | Sex | Symptom Developmenta | Bloody Diarrhea | Past Medical History |
|---|---|---|---|---|---|
| |||||
| 37 | 10 | Female | 0 | Present | None |
| 49 | 14 | Female | 0 | None | History of bowel perforation, prior bowel resection, GT |
| 63 | 10 | Female | 0 | None | Status post‐renal transplant on antivirals only |
| 97 | 14 | Male | 0 | None | Polycystic kidney disease, on nasogastric feeds |
| 98 | <1 | Male | 25 days | None | Congenital heart disease |
| 101 | <1 | Male | 25 days | None | None |
| 102 | 10 | Male | 25 days | None | Neurofibromatosis type 2, GT |
| 107 | 59 | Female | 0 | Present | None |
| 108 | 10 | Male | 0 | None | Cerebral palsy, GT |
| 116 | 14 | Female | 25 days | None | None |
| 126 | 10 | Female | 12 days | None | None |
The first subanalysis evaluated antibiotic prophylaxis and found 51 (37%) in CDs versus 10 (4%) in CTLs. However, after controlling for immunodeficiency found in 40 of these CDs, we found no statistically significant difference. There were insufficient numbers of those on prophylaxis for other reasons (eg, vesicoureteral reflux) to analyze prophylaxis independently.
The second subanalysis compared controls with a negative C difficile toxin assay (21% of CTLs) to CDs on a number of clinical factors. Results were compared to the primary analysis. Many factors remained significant: antibiotic use in the past 90 days was still more frequent in CDs (66% vs 35%, P<0.001) as was immunodeficiency in CDs (46% vs 14%, P<0.001). However, immunodeficiency in this subset of the controls was represented over twice as often as that of the baseline CTLs (14% vs 6%), whereas GI disease was similar between the 2 groups (37% vs 31%, P<0.40). PPI use demonstrated a suggestive relationship (22% vs 11%, P<0.07).
Data for the third subanalysis between CA‐CD and HA‐CD are shown on Table 3. We initially compared CA‐CD, community‐onset HA‐CD, and hospital‐onset HA‐CD. However, when stratification was found to not be significant, we combined both categories of HA‐CD into 1 group. CA‐CD and HA‐CD did not demonstrate significant difference in antibiotic use, type, prophylaxis, history of abdominal surgery, immunodeficiency, or GI disease. Bloody stools were more common in CA‐CD.
| Characteristics | Community‐Acquired Cases, N=40, No. (%) | Hospital‐Acquired Cases, N=94, No. (%) | P Value |
|---|---|---|---|
| |||
| Age, y | |||
| <1 | 4 (10) | 24 (26) | |
| 14 | 17 (43) | 33 (35) | |
| 59 | 4 (10) | 18 (19) | |
| 10 | 15 (38) | 20 (21) | |
| Sex, male | 19 (48) | 49 (52) | 0.71 |
| Race, white | 19 (48) | 44 (47) | 0.99 |
| Ethnicity, Hispanic | 21 (53) | 49 (52) | 0.99 |
| Bloody diarrhea | 11 (28) | 4 (4) | <0.001 |
| Abdominal pain | 17 (43) | 24 (26) | 0.07 |
| PPI use | 12 (30) | 17 (18) | 0.17 |
| Antibiotic use | 27 (68) | 61 (65) | 0.84 |
| 2 antibiotics | 9 (23) | 23 (24) | 0.99 |
| Antibiotic type | |||
| Penicillin | 4 (10) | 6 (6) | 0.49 |
| Cephalosporin | 8 (20) | 21 (22) | 0.82 |
| Sulfa | 12 (30) | 38 (40) | 0.33 |
| Prophylaxis | 12 (30) | 39 (41) | 0.14 |
| Hospitalization, past 6 months | 17(43) | 71 (76) | <0.001 |
| Past CDI | 5 (13) | 7 (7) | 0.34 |
| GI diseasea | 16 (40) | 25 (26) | 0.15 |
| Immunodeficiencyb | 14 (35) | 47 (51) | 0.13 |
| Past abdominal surgery | 15 (38) | 26 (27) | 0.31 |
Odds ratio (OR) was calculated for association of individual risk factors for disease between CDs and CTLs (Table 4). Our model controlled for antibiotics use in the past 90 days, PPI use, treatment with 2 or more antibiotics, recent hospitalization, past history of CDIs, history of GI disease, history of abdominal surgery, and being immunodeficient. Antibiotic use within the past 90 days (OR: 2.80, P=0.001), recent hospitalization (OR: 2.33, P=0.007), and immunodeficiency (OR: 6.02, P<0.001) were associated with having C difficile. A similar logistic regression was conducted using a model comparing community‐ and hospital‐acquired cases, but no difference was found among risk factors.
| Odds Ratio | P Value | |
|---|---|---|
| ||
| Variable | ||
| Antibiotic use (90 days) | 7.69 | <0.001 |
| Proton pump inhibitors | 4.17 | <0.001 |
| >2 antibiotics | 9.26 | <0.001 |
| Hospitalization, past 6 months | 8.20 | <0.001 |
| History CDI | 3.27 | 0.012 |
| Gastrointestinal diseasea | 1.98 | 0.005 |
| Immunodeficiencyb | 12.66 | <0.001 |
| History abdominal surgery | 2.37 | 0.001 |
| Saturated logistic regression model | ||
| Antibiotics (90 days) | 2.80 | 0.001 |
| Proton pump inhibitors | 2.06 | 0.068 |
| >2 antibiotics | 2.23 | 0.092 |
| Hospitalization, past 6 months | 2.33 | 0.007 |
| History CDI | 1.03 | 0.956 |
| Gastrointestinal diseasea | 1.31 | 0.432 |
| Immunodeficiencyb | 6.02 | <0.001 |
| History abdominal surgery | 1.16 | 0.675 |
DISCUSSION/CONCLUSION
Our study shows that in addition to traditional risk factors of antibiotic use and recent hospitalization, immunodeficiency is a significant key factor associated with the diagnosis of CD. We found that traditional risk factors are not present in all hospitalized pediatric patients with CD. Our study does not support routine testing for C difficile in patients with diarrhea; however, it does suggest testing children with persistent or severe diarrheal symptoms even if traditional risk factors are absent, especially in the presence of immunodeficiency. The intervals we used for antibiotic exposure (past 90 days) and recent hospitalization (past 6 months) were longer compared to other studies,[9, 12] making our findings even more meaningful. Although some of the 11 patients without traditional risk factors had the presence of clinical factors shown in previous studies to be more common in patients with CDIs (GI disease, GI surgery, gastric tube/nasogastric feeding),[12, 13] we still find 4 patients >1 year of age with CDIs and no risk factors. This echoes the CDCs concerns of CDIs in low‐risk patients.[3]
Unlike clinical history, we found clinical symptoms and basic electrolyte testing may not help to distinguish CD from AGE patients. Although abdominal pain and diarrhea on admission were significantly more common in CTLs, when including abdominal pain and diarrhea during hospitalization, this finding was no longer valid. Additionally, although overall return rate was higher for CDs, the return rate for GI symptoms specifically was not different. The former was instead most often due to complications associated with comorbid conditions (GI disease, immunodeficiency). We did assess LOS for both CDs and CTLs; however, due to the high percentage of CDs with malignancy and other severe illnesses, it was difficult to ascertain the effect of CDIs on LOS. Severe CD is described as admission to the intensive care unit due to C difficile complications, colectomy, and death secondary to C difficile.[11] Although our study did not look at severe CDI as a direct outcome, we did not have any cases of colectomy or death secondary to CDI.
Two recent studies[9, 14] showed a high percentage of acid suppression medication use in patients with CDIs, with 1 study reporting 60% using PPIs and 21% using histamine blockers. Our study initially found similar high levels of PPI use among patients with CDIs; however, no significance was found when controlling for chronic disease. Prescriptions of PPIs for pediatric patients have risen dramatically recently,[15] as have reported all‐cause complications.[16] Further studies are needed to evaluate the independent risks of PPI use and CDIs in children. We were unable to analyze the influence of antibiotic use at prophylactic levels on CD rates, as the majority our CDs were on prophylaxis due to immunodeficiency.
Our study is unique in many ways. It is the first study to evaluate hospitalized pediatric patients with a comprehensive list of potential risk factors for CDIs, looking at clinical data on admission and during hospitalization. Additionally, as our site archives all clinical information in 1 database, we were able to identify ED/UC return and hospital readmissions. Although it is possible patients may have been evaluated outside of our healthcare system, this would be uncommon due to our referral patterns and UC sites. Our study used age‐matched patients with diarrheal symptoms and AGE discharge diagnosis as the control group. This differs from the 1 previous study looking at risk factors for CDIs in children.[9] In that study, researchers used patients with negative C difficile toxin testing as controls. Our subanalysis of CTLs with a negative toxin assay found much higher rates of underlying GI disease and immunodeficiency. Whereas previous studies compared patients already at high risk for CDI and assessed the differences between those with and without the infection, our study looked at what clinical factors distinguish CDI from AGE in a hospitalized population.
Similar to other pediatric studies, our study found a significant number of CA‐CD. However our study is 1 of the first to compare pediatric CA‐CD with HA‐CD based on clinical factors. Of the 9 demographic and clinical variables assessed, the only significant difference found was presence of bloody diarrhea. It may be that bloody diarrhea prompted the patients to be admitted as opposed to evaluated in the ambulatory setting.
Our study had some limitations. We used ICD‐9 discharge diagnosis codes to identify our patients; however, thorough chart review found clinical indices (diarrhea and abdominal pain) that correlated well with CDI diagnosis in addition to positive laboratory test. The EIA C difficile toxin assay was the standard of care during our study period. However, a recent study has shown false positives using EIA testing in pediatric populations.[17] In our primary analysis, we did not exclude patients with a past history of CDIs. Recurrent CDI is defined as having symptoms within 8 weeks after the primary infection. Of our patients with a history of CDIs, only 2 met this definition. Due to the small number, excluding these patients would not have changed our results significantly. Last, as with any retrospective study, we relied on caregiver reports regarding clinical history, especially in the CA‐CD cohort.
Based on our comprehensive analysis of pediatric patients, there should be increased suspicion for CDI in children with baseline immunodeficiency. Our study also supports testing children with persistent or severe GI symptoms even in the absence of traditional risk factors. These elements, coupled with history of antibiotic use, recent hospitalization, GI disease, and abdominal surgery could be used to create an assessment tool to assist clinicians in the diagnosis of CDIs in pediatric patients. A significant percentage of CDIs continues to be CA‐CD. HA‐CD and CA‐CD patients have similar clinical features. Further studies are needed to determine the effect of PPI use and prophylactic antibiotics on CDIs in children.
Disclosure
Nothing to report.
- , , , et al. Strategies to prevent clostridium difficile infections in acute care hospitals. Infect Control Hosp Epidemiol. 2008;29(suppl 1):S81–S92.
- , , , . The role of Clostridium difficile and viruses as causes of nosocomial diarrhea in children. Infect Control Hosp Epidemiol. 2002;23(11):660–664.
- Centers for Disease Control and Prevention. Severe Clostridium difficile‐associated disease in populations previously at low risk—four states, 2005. MMWR Morb Mortal Wkly Rep. 2005;54(47):1201–1205.
- , , , . Changing epidemiology of Clostridium difficile‐associated disease in children. Infect Control Hosp Epidemiol. 2007;28(11):1233–1235.
- , , . Clostridium difficile infections among hospitalized children, United States, 1997–2006. Emerg Infect Dis. 2010;16(4):604–609.
- , , , , , . Epidemiological features of Clostridium difficile‐associated disease among inpatients at children's hospitals in the United States, 2001–2006. Pediatrics. 2008;122(6):1266–1270.
- , , . Clostridium difficile infection in children. JAMA Pediatr. 2013;167(6):567–573.
- , ; Committee on Infectious Diseases; American Academy of Pediatrics. Clostridium difficile infection in infants and children. Pediatrics. 2013;131(1):196–200.
- , , , et al. Epidemiology and risk factors for Clostridium difficile infection in children. Pediatr Infect Dis J. 2011;30(7):580–584.
- , , , , , . Distinguishing community‐associated from hospital‐associated Clostridium difficile infections in children: implications for public health surveillance. Clin Infect Dis. 2013;57(12):1665–1672.
- , , , et al. Recommendations for surveillance of Clostridium difficile‐associated disease. Infect Control Hosp Epidemiol. 2007;28(2):140–145.
- , , , et al. Risk factors and outcomes associated with severe clostridium difficile infection in children. Pediatr Infect Dis J. 2012;31(2):134–138.
- , , , et al. Recurrence rate of clostridium difficile infection in hospitalized pediatric patients with inflammatory bowel disease. Inflamm Bowel Dis. 2011;17(1):50–55.
- , , . Proton pump inhibitor use and recurrent Clostridium difficile‐associated disease: a case‐control analysis matched by propensity score. J Clin Gastroenterol. 2012;46(5):397–400.
- , , , , . Proton pump inhibitor utilization patterns in infants. J Pediatr Gastroenterol Nutr. 2007;45(4):421–427.
- , . Long‐term proton pump inhibitor use in children: a retrospective review of safety. Dig Dis Sci. 2008;53(2):385–393.
- , , , et al. High proportion of false‐positive Clostridium difficile enzyme immunoassays for toxin A and B in pediatric patients. Infect Control Hosp Epidemiol. 2012;33(2):175–179.
Clostridium difficile is the single most common cause of nosocomial diarrhea in both adults and children.[1, 2] C difficile infections (CDIs) can range from self‐limited diarrhea to severe pseudomembranous colitis. Though widely distributed in the environment, hospitals and child care facilities are major reservoirs for C difficile. Traditionally, hospitalization and antibiotic use have been the 2 major risk factors for acquiring CDI.
Recent studies suggest C difficile epidemiology is shifting. In 2005, the Centers for Disease Control and Prevention (CDC) reported CDIs in 33 otherwise low‐risk patients, 6 of whom were children.[3] Other studies have noted increasing incidence of pediatric CDIs,[4, 5, 6, 7] 1 identifying 43% with no prior antibiotic use.[4] This emerging data led to the recent American Academy of Pediatrics policy statement on pediatric CDIs.[8] Data regarding associated clinical risk factors of CDIs in pediatric patients in light of the changing epidemiology are limited. Only 1 recent study looked at 6 clinical factors and found that antibiotic use, history of solid organ transplantation, gastrointestinal (GI) devices, and acid suppressing medications increased risk for CDIs.[9]
Data regarding the source of these infections are also limited. Three pediatric studies evaluating source found a significant amount of community‐acquired disease (59%, 25%, and 19% of the study population, respectively).[4, 9, 10] However, only 1 of these studies provided clinical comparisons between community and hospital‐acquired cases.[10] To date, no study has examined a comprehensive list of potential risk factors that might differentiate hospitalized pediatric patients with CDIs from those with acute gastroenteritis (AGE).
PATIENTS AND METHODS
We conducted an investigator‐initiated, retrospective, case‐control study examining risk factors associated with CDIs in a hospitalized pediatric population at Rady Children's Hospital San Diego (RCHSD). Rady Children's is a tertiary‐care pediatric healthcare system and the sole pediatric referral center for San Diego, with a catchment of 850,000 children. RCHSD posts over 71,000 emergency department (ED) and 30,000 urgent care (UC) visits at 4 sites and over 15,000 admissions yearly. All system information is archived in 1 electronic database. We reviewed patient records for a 2‐year period from June 1, 2008 through May 31, 2010. The study protocol was reviewed and approved by the institutional review board at the University of California San Diego.
Cases of C difficile (CDs) included pediatric patients 18 years of age with all of the following: International Classification of Diseases, 9th Revision (ICD‐9) code for C difficile infection (08.45), a positive C difficile toxin A or B by enzyme immunoassay (EIA) (Meridian Bioscience, Inc., Cincinnati, OH), and the presence of diarrhea and/or abdominal pain. Randomly selected age‐matched controls from the same time period with a discharge diagnosis of AGE (APR‐DRG 249) and the presence of diarrhea served as controls (CTLs). In the 1 year age group, any patient with a positive C difficile toxin assay but no diagnosis of CDI was excluded from the CTL group to avoid potential confounding.
Records were reviewed for multiple potential risk factors based on limited past studies and other factors associated with CDI pathogenesis including age, race, ethnicity, antibiotic use within the previous 90 days (type, route, and duration), diarrhea type, abdominal pain, fever, proton pump inhibitor (PPI) use, sick contacts (diarrheal illness), recent travel, and hospitalization within the last 6 months. Diarrhea was defined as increase in stool frequency or volume. Past medical/surgical history abstracted included GI disease, past CDIs, abdominal surgery, immunodeficiency, renal disease, cardiac disease, nutritional deficiencies, and number of past hospitalizations (all cause). In addition, multiple factors during the hospital course were reviewed: length of stay (LOS), antibiotic therapy, diarrhea type, abdominal pain, fever, electrolyte levels, need for stool replacement fluid, and altered diet recommendations. Thirty‐day return to ED/UC or readmission and cause for the return were also retrieved on all patients. An objective data collection form was used, and all records were reviewed by 1 researcher (W.S.) with a second reviewer (E.F.) reviewing 20% of the charts, with 90% initial concordance. Consensus was reached on all elements abstracted.
Three additional subanalyses were completed. The first subanalysis compared antibiotic prophylaxis (defined as daily use of an antibiotic for >28 days) in CDs versus CTLs. We reviewed charts to ensure extended antibiotic use was for prophylaxis and not treatment. The second subanalysis compared CDs to those CTLs with a negative C difficile toxin assay. This was done to evaluate whether using this control group would highlight a different set of risk factors. The third subanalysis separated CDs into community‐acquired CD (CA‐CD) and hospital‐acquired CD (HA‐CD). We defined CA‐CD as any patient with symptoms either prior to or within the first 48 hours of the index admission and no past hospitalizations or with the last hospitalization >4 weeks prior to the index admission. Patients who developed symptoms at home or within 48 hours of the index admission, but had been hospitalized within the past 4 weeks, were defined as community‐onset HA‐CD. Patients who developed CDIs after 48 hours of the index admission were defined as hospital‐onset HA‐CD. These groupings are consistent with the CDI surveillance recommendations.[11]
All statistical analyses were performed with SPSS statistical software version 21.0 (SPSS Inc., Chicago, IL). Initial comparisons between CDs and CTLs were conducted using t tests for continuous variables and [2] tests for categorical variables. As CDI in infants is controversial, we analyzed our data with and without this cohort to eliminate extraneous, age‐related differences. After confirming that there were no issues with tolerance among possibly related factors, a saturated multiple logistic regression model was used to determine which of the independent variables identified in the initial comparison were predictors of having C difficile when controlling for factors associated with chronic disease.
RESULTS
Descriptive characteristics of the 134 CDs and the 274 CTLs are provided in Table 1. CDs and CTLs were similar in gender and race. More CDs had recent hospitalization and antibiotic exposure, with 24% of CDs versus 3% of CTLs treated with 2 or more antibiotics. Watery stools were the most common type of diarrhea in both CDs and CTLs, and bloody stools did not differ significantly between the 2 groups. However, abdominal pain on admission was more common in CTLs. CDs were more likely to have a history of GI disease, abdominal surgery, and specifically GI surgery. Immunodeficiency and PPI use were far more frequent in CDs, whereas exposure to sick contacts was more common in CTLs. Although CDs had an overall higher rate of ED/UC return visits and readmissions, the rate of return due to GI symptoms was similar in both groups. Reanalysis of the data with the <1‐year cohort removed showed persistent statistically significant findings in these variables. Hospital course, including electrolyte levels, need for intravenous fluids, or modified diets, did not significantly differ between CDs and CTLs (data not shown).
| Characteristics | Cases, N=134 (%) | Controls, N=274 (%) | P Value |
|---|---|---|---|
| |||
| Age, y | |||
| <1 | 28 (21) | 58 (21) | |
| 14 | 50 (37) | 100 (37) | |
| 59 | 21 (17) | 44 (16) | |
| 10 | 35 (26) | 72 (26) | |
| Sex, male | 68 (51) | 141 (52) | |
| Race | |||
| White | 63 (46) | 110 (40) | |
| Black | 6 (4) | 18 (7) | |
| Asian | 11 (8) | 15(6) | |
| Other | 50 (37) | 123 (45) | |
| Ethnicity, Hispanic | 70 (52) | 85 (31) | <0.001 |
| Diarrheaa | |||
| Admission | 50 (37) | 229 (83) | <0.001 |
| Bloody | 13/50 (26) | 29/229 (13) | |
| Watery | 37/50 (74) | 200/229 (87) | |
| Hospitalization | 128 (95) | 185 (68) | <0.001 |
| Bloody | 16/128 (13) | 10/185 (5) | |
| Watery | 112/128 (88) | 175/185 (95) | |
| Abdominal pain, admission | 30 (23) | 111 (41) | <0.001 |
| PPI use | 29 (22) | 18 (7) | <0.001 |
| Antibiotic use | |||
| Past 90 days | 88 (66) | 55 (20) | <0.001 |
| >2 antibiotics | 32 (24) | 9 (3) | <0.001 |
| Antibiotic type | |||
| Penicillin | 10 (11) | 19 (7) | 0.84 |
| Cephalosporins | 29 (21) | 19 (7) | <0.001 |
| Sulfa | 50 (37) | 12 (4) | <0.001 |
| Prophylaxis | 51 (37) | 10 (4) | <0.001 |
| Sick contacts | 4 (3) | 52 (19) | <0.001 |
| Hospitalization past 6 months | 88 (66) | 52 (19) | <0.001 |
| Past CDI | 12 (9) | 8 (4) | 0.013 |
| GI diseaseb | 41 (31) | 50 (18) | 0.005 |
| Immunodeficiencyc | 61 (46) | 17 (6) | <0.001 |
| Abdominal surgeryd | 41 (31) | 43 (16) | 0.001 |
| GI surgeryd | 32 (24) | 36 (13) | 0.01 |
| Returne | 41 (31) | 37 (14) | <0.001 |
| Due to GI symptoms | 12 (9) | 22 (8) | 0.85 |
Analysis of CDs without traditional risk factors was performed. To identify patients, we first selected the 46 (34%) without prior antibiotic exposure, then eliminated 19 who had been hospitalized within the past 6 months. Of the remaining 27 patients, 16 had a prolonged hospitalization (>5 days) at the time of CDI diagnosis. This left us with 11 patients (8% of CDs) without any common risk factors of antibiotic use, recent hospitalization, or prolonged hospitalization. None of these patients had a history of CDIs; 6 had significant medical histories. A detailed description of these 11 patients if provided in Table 2.
| Case No. | Age, y | Sex | Symptom Developmenta | Bloody Diarrhea | Past Medical History |
|---|---|---|---|---|---|
| |||||
| 37 | 10 | Female | 0 | Present | None |
| 49 | 14 | Female | 0 | None | History of bowel perforation, prior bowel resection, GT |
| 63 | 10 | Female | 0 | None | Status post‐renal transplant on antivirals only |
| 97 | 14 | Male | 0 | None | Polycystic kidney disease, on nasogastric feeds |
| 98 | <1 | Male | 25 days | None | Congenital heart disease |
| 101 | <1 | Male | 25 days | None | None |
| 102 | 10 | Male | 25 days | None | Neurofibromatosis type 2, GT |
| 107 | 59 | Female | 0 | Present | None |
| 108 | 10 | Male | 0 | None | Cerebral palsy, GT |
| 116 | 14 | Female | 25 days | None | None |
| 126 | 10 | Female | 12 days | None | None |
The first subanalysis evaluated antibiotic prophylaxis and found 51 (37%) in CDs versus 10 (4%) in CTLs. However, after controlling for immunodeficiency found in 40 of these CDs, we found no statistically significant difference. There were insufficient numbers of those on prophylaxis for other reasons (eg, vesicoureteral reflux) to analyze prophylaxis independently.
The second subanalysis compared controls with a negative C difficile toxin assay (21% of CTLs) to CDs on a number of clinical factors. Results were compared to the primary analysis. Many factors remained significant: antibiotic use in the past 90 days was still more frequent in CDs (66% vs 35%, P<0.001) as was immunodeficiency in CDs (46% vs 14%, P<0.001). However, immunodeficiency in this subset of the controls was represented over twice as often as that of the baseline CTLs (14% vs 6%), whereas GI disease was similar between the 2 groups (37% vs 31%, P<0.40). PPI use demonstrated a suggestive relationship (22% vs 11%, P<0.07).
Data for the third subanalysis between CA‐CD and HA‐CD are shown on Table 3. We initially compared CA‐CD, community‐onset HA‐CD, and hospital‐onset HA‐CD. However, when stratification was found to not be significant, we combined both categories of HA‐CD into 1 group. CA‐CD and HA‐CD did not demonstrate significant difference in antibiotic use, type, prophylaxis, history of abdominal surgery, immunodeficiency, or GI disease. Bloody stools were more common in CA‐CD.
| Characteristics | Community‐Acquired Cases, N=40, No. (%) | Hospital‐Acquired Cases, N=94, No. (%) | P Value |
|---|---|---|---|
| |||
| Age, y | |||
| <1 | 4 (10) | 24 (26) | |
| 14 | 17 (43) | 33 (35) | |
| 59 | 4 (10) | 18 (19) | |
| 10 | 15 (38) | 20 (21) | |
| Sex, male | 19 (48) | 49 (52) | 0.71 |
| Race, white | 19 (48) | 44 (47) | 0.99 |
| Ethnicity, Hispanic | 21 (53) | 49 (52) | 0.99 |
| Bloody diarrhea | 11 (28) | 4 (4) | <0.001 |
| Abdominal pain | 17 (43) | 24 (26) | 0.07 |
| PPI use | 12 (30) | 17 (18) | 0.17 |
| Antibiotic use | 27 (68) | 61 (65) | 0.84 |
| 2 antibiotics | 9 (23) | 23 (24) | 0.99 |
| Antibiotic type | |||
| Penicillin | 4 (10) | 6 (6) | 0.49 |
| Cephalosporin | 8 (20) | 21 (22) | 0.82 |
| Sulfa | 12 (30) | 38 (40) | 0.33 |
| Prophylaxis | 12 (30) | 39 (41) | 0.14 |
| Hospitalization, past 6 months | 17(43) | 71 (76) | <0.001 |
| Past CDI | 5 (13) | 7 (7) | 0.34 |
| GI diseasea | 16 (40) | 25 (26) | 0.15 |
| Immunodeficiencyb | 14 (35) | 47 (51) | 0.13 |
| Past abdominal surgery | 15 (38) | 26 (27) | 0.31 |
Odds ratio (OR) was calculated for association of individual risk factors for disease between CDs and CTLs (Table 4). Our model controlled for antibiotics use in the past 90 days, PPI use, treatment with 2 or more antibiotics, recent hospitalization, past history of CDIs, history of GI disease, history of abdominal surgery, and being immunodeficient. Antibiotic use within the past 90 days (OR: 2.80, P=0.001), recent hospitalization (OR: 2.33, P=0.007), and immunodeficiency (OR: 6.02, P<0.001) were associated with having C difficile. A similar logistic regression was conducted using a model comparing community‐ and hospital‐acquired cases, but no difference was found among risk factors.
| Odds Ratio | P Value | |
|---|---|---|
| ||
| Variable | ||
| Antibiotic use (90 days) | 7.69 | <0.001 |
| Proton pump inhibitors | 4.17 | <0.001 |
| >2 antibiotics | 9.26 | <0.001 |
| Hospitalization, past 6 months | 8.20 | <0.001 |
| History CDI | 3.27 | 0.012 |
| Gastrointestinal diseasea | 1.98 | 0.005 |
| Immunodeficiencyb | 12.66 | <0.001 |
| History abdominal surgery | 2.37 | 0.001 |
| Saturated logistic regression model | ||
| Antibiotics (90 days) | 2.80 | 0.001 |
| Proton pump inhibitors | 2.06 | 0.068 |
| >2 antibiotics | 2.23 | 0.092 |
| Hospitalization, past 6 months | 2.33 | 0.007 |
| History CDI | 1.03 | 0.956 |
| Gastrointestinal diseasea | 1.31 | 0.432 |
| Immunodeficiencyb | 6.02 | <0.001 |
| History abdominal surgery | 1.16 | 0.675 |
DISCUSSION/CONCLUSION
Our study shows that in addition to traditional risk factors of antibiotic use and recent hospitalization, immunodeficiency is a significant key factor associated with the diagnosis of CD. We found that traditional risk factors are not present in all hospitalized pediatric patients with CD. Our study does not support routine testing for C difficile in patients with diarrhea; however, it does suggest testing children with persistent or severe diarrheal symptoms even if traditional risk factors are absent, especially in the presence of immunodeficiency. The intervals we used for antibiotic exposure (past 90 days) and recent hospitalization (past 6 months) were longer compared to other studies,[9, 12] making our findings even more meaningful. Although some of the 11 patients without traditional risk factors had the presence of clinical factors shown in previous studies to be more common in patients with CDIs (GI disease, GI surgery, gastric tube/nasogastric feeding),[12, 13] we still find 4 patients >1 year of age with CDIs and no risk factors. This echoes the CDCs concerns of CDIs in low‐risk patients.[3]
Unlike clinical history, we found clinical symptoms and basic electrolyte testing may not help to distinguish CD from AGE patients. Although abdominal pain and diarrhea on admission were significantly more common in CTLs, when including abdominal pain and diarrhea during hospitalization, this finding was no longer valid. Additionally, although overall return rate was higher for CDs, the return rate for GI symptoms specifically was not different. The former was instead most often due to complications associated with comorbid conditions (GI disease, immunodeficiency). We did assess LOS for both CDs and CTLs; however, due to the high percentage of CDs with malignancy and other severe illnesses, it was difficult to ascertain the effect of CDIs on LOS. Severe CD is described as admission to the intensive care unit due to C difficile complications, colectomy, and death secondary to C difficile.[11] Although our study did not look at severe CDI as a direct outcome, we did not have any cases of colectomy or death secondary to CDI.
Two recent studies[9, 14] showed a high percentage of acid suppression medication use in patients with CDIs, with 1 study reporting 60% using PPIs and 21% using histamine blockers. Our study initially found similar high levels of PPI use among patients with CDIs; however, no significance was found when controlling for chronic disease. Prescriptions of PPIs for pediatric patients have risen dramatically recently,[15] as have reported all‐cause complications.[16] Further studies are needed to evaluate the independent risks of PPI use and CDIs in children. We were unable to analyze the influence of antibiotic use at prophylactic levels on CD rates, as the majority our CDs were on prophylaxis due to immunodeficiency.
Our study is unique in many ways. It is the first study to evaluate hospitalized pediatric patients with a comprehensive list of potential risk factors for CDIs, looking at clinical data on admission and during hospitalization. Additionally, as our site archives all clinical information in 1 database, we were able to identify ED/UC return and hospital readmissions. Although it is possible patients may have been evaluated outside of our healthcare system, this would be uncommon due to our referral patterns and UC sites. Our study used age‐matched patients with diarrheal symptoms and AGE discharge diagnosis as the control group. This differs from the 1 previous study looking at risk factors for CDIs in children.[9] In that study, researchers used patients with negative C difficile toxin testing as controls. Our subanalysis of CTLs with a negative toxin assay found much higher rates of underlying GI disease and immunodeficiency. Whereas previous studies compared patients already at high risk for CDI and assessed the differences between those with and without the infection, our study looked at what clinical factors distinguish CDI from AGE in a hospitalized population.
Similar to other pediatric studies, our study found a significant number of CA‐CD. However our study is 1 of the first to compare pediatric CA‐CD with HA‐CD based on clinical factors. Of the 9 demographic and clinical variables assessed, the only significant difference found was presence of bloody diarrhea. It may be that bloody diarrhea prompted the patients to be admitted as opposed to evaluated in the ambulatory setting.
Our study had some limitations. We used ICD‐9 discharge diagnosis codes to identify our patients; however, thorough chart review found clinical indices (diarrhea and abdominal pain) that correlated well with CDI diagnosis in addition to positive laboratory test. The EIA C difficile toxin assay was the standard of care during our study period. However, a recent study has shown false positives using EIA testing in pediatric populations.[17] In our primary analysis, we did not exclude patients with a past history of CDIs. Recurrent CDI is defined as having symptoms within 8 weeks after the primary infection. Of our patients with a history of CDIs, only 2 met this definition. Due to the small number, excluding these patients would not have changed our results significantly. Last, as with any retrospective study, we relied on caregiver reports regarding clinical history, especially in the CA‐CD cohort.
Based on our comprehensive analysis of pediatric patients, there should be increased suspicion for CDI in children with baseline immunodeficiency. Our study also supports testing children with persistent or severe GI symptoms even in the absence of traditional risk factors. These elements, coupled with history of antibiotic use, recent hospitalization, GI disease, and abdominal surgery could be used to create an assessment tool to assist clinicians in the diagnosis of CDIs in pediatric patients. A significant percentage of CDIs continues to be CA‐CD. HA‐CD and CA‐CD patients have similar clinical features. Further studies are needed to determine the effect of PPI use and prophylactic antibiotics on CDIs in children.
Disclosure
Nothing to report.
- , , , et al. Strategies to prevent clostridium difficile infections in acute care hospitals. Infect Control Hosp Epidemiol. 2008;29(suppl 1):S81–S92.
- , , , . The role of Clostridium difficile and viruses as causes of nosocomial diarrhea in children. Infect Control Hosp Epidemiol. 2002;23(11):660–664.
- Centers for Disease Control and Prevention. Severe Clostridium difficile‐associated disease in populations previously at low risk—four states, 2005. MMWR Morb Mortal Wkly Rep. 2005;54(47):1201–1205.
- , , , . Changing epidemiology of Clostridium difficile‐associated disease in children. Infect Control Hosp Epidemiol. 2007;28(11):1233–1235.
- , , . Clostridium difficile infections among hospitalized children, United States, 1997–2006. Emerg Infect Dis. 2010;16(4):604–609.
- , , , , , . Epidemiological features of Clostridium difficile‐associated disease among inpatients at children's hospitals in the United States, 2001–2006. Pediatrics. 2008;122(6):1266–1270.
- , , . Clostridium difficile infection in children. JAMA Pediatr. 2013;167(6):567–573.
- , ; Committee on Infectious Diseases; American Academy of Pediatrics. Clostridium difficile infection in infants and children. Pediatrics. 2013;131(1):196–200.
- , , , et al. Epidemiology and risk factors for Clostridium difficile infection in children. Pediatr Infect Dis J. 2011;30(7):580–584.
- , , , , , . Distinguishing community‐associated from hospital‐associated Clostridium difficile infections in children: implications for public health surveillance. Clin Infect Dis. 2013;57(12):1665–1672.
- , , , et al. Recommendations for surveillance of Clostridium difficile‐associated disease. Infect Control Hosp Epidemiol. 2007;28(2):140–145.
- , , , et al. Risk factors and outcomes associated with severe clostridium difficile infection in children. Pediatr Infect Dis J. 2012;31(2):134–138.
- , , , et al. Recurrence rate of clostridium difficile infection in hospitalized pediatric patients with inflammatory bowel disease. Inflamm Bowel Dis. 2011;17(1):50–55.
- , , . Proton pump inhibitor use and recurrent Clostridium difficile‐associated disease: a case‐control analysis matched by propensity score. J Clin Gastroenterol. 2012;46(5):397–400.
- , , , , . Proton pump inhibitor utilization patterns in infants. J Pediatr Gastroenterol Nutr. 2007;45(4):421–427.
- , . Long‐term proton pump inhibitor use in children: a retrospective review of safety. Dig Dis Sci. 2008;53(2):385–393.
- , , , et al. High proportion of false‐positive Clostridium difficile enzyme immunoassays for toxin A and B in pediatric patients. Infect Control Hosp Epidemiol. 2012;33(2):175–179.
© 2013 Society of Hospital Medicine
Following Patient Safety Practices
Healthcare delivery organizations are under increasing pressure to improve patient safety. The fundamental underpinning of efforts to improve safety has been the establishment of a no‐blame culture, one that focuses less on individual transgressions and more on system improvement.[1, 2] As evidence‐based practices to improve care have emerged, and the pressures to deliver tangible improvements in safety and quality have grown, providers, healthcare system leaders, and policymakers are struggling with how best to balance the need for accountability with this no‐blame paradigm.
In dealing with areas such as hand hygiene, where there is strong evidence for the value of the practice yet relatively poor adherence in many institutions, Wachter and Pronovost have argued that the scales need to tip more in the direction of accountability, including the imposition of penalties for clinicians who habitually fail to follow certain safety practices.[3] Although not obviating the critical importance of systems improvement, they argue that a failure to enforce such measures undermines trust in the system and invites external regulation. Chassin and colleagues made a similar point in arguing for the identification of certain accountability measures that could be used in public reporting and pay‐for‐performance programs.[4]
Few organizations have enacted robust systems to hold providers responsible for adhering to accountability measures.[4] Although many hospitals have policies to suspend clinical privileges for failing to sign discharge summaries or obtain a yearly purified protein derivative test, few have formal programs to identify and deal with clinicians whose behavior is persistently problematic.[3] Furthermore, existing modes of physician accountability, such as state licensing boards, only discipline physicians retroactively (and rarely) when healthcare organizations report poor performance. State boards typically do not consider prevention of injury, such as adherence to safety practices, to be part of their responsibility.[5] Similarly, credentialing boards (eg, the American Board of Internal Medicine) do not assess adherence to such practices in coming to their decisions.
It is estimated that strict adherence to infection control practices, such as hand hygiene, could prevent over 100,000 hospital deaths every year; adherence to other evidence‐based safety practices such as the use of a preoperative time‐out would likely prevent many more deaths and cases of medical injury.[3, 6] Although there are practical issues, such as how to audit individual clinician adherence in ways that are feasible and fair, that make enforcing individual provider accountability challenging, there seems little doubt that attitudes regarding the appropriateness of enacting penalties for safety transgressions will be key determinants of whether such measures are considered. Yet no study to date has assessed the opinions of different stakeholders (physicians, nurses, trainees, patients) regarding various strategies, including public reporting and penalties, to improve adherence to safety practices. We aimed to assess these attitudes across a variety of such stakeholders.
METHODS
Survey Development and Characteristics
To understand the perceptions of measures designed to improve patient safety, we designed a survey of patients, nurses, medical students, resident physicians, and attending physicians to be administered at hospitals associated with the University of California, San Francisco (UCSF). Institutional review board approval was obtained from the UCSF Committee on Human Research, and all respondents provided informed consent.
The survey was developed by the authors and pilot tested with 2 populations. First, the survey was administered to a group of 12 UCSF Division of Hospital Medicine research faculty; their feedback was used to revise the survey. Second, the survey was administered to a convenience sample of 2 UCSF medical students, and their feedback was used to further refine the survey.
The questionnaire presented 3 scenarios in which a healthcare provider committed a patient‐safety protocol lapse; participants were asked their opinions about the appropriate responses to each of the violations. The 3 scenarios were: (1) a healthcare provider not properly conducting hand hygiene before a patient encounter, (2) a healthcare provider not properly conducting a fall risk assessment on a hospitalized patient, and (3) a healthcare provider not properly conducting a preoperative timeout prior to surgery. For each scenario, a series of questions was asked about a variety of institutional responses toward a provider who did not adhere to each safety protocol. Potential responses included feedback (email feedback, verbal feedback, meeting with a supervisor, a quarterly performance review meeting, and a quarterly report card seen only by the provider), public reporting (posting the provider's infractions on a public website), and penalties (fines, suspension without pay, and firing).
We chose the 3 practices because they are backed by strong evidence, are relatively easy to perform, are inexpensive, are linked to important and common harms, and are generally supported within the patient‐safety community. Improved adherence to hand hygiene significantly reduces infection transmission in healthcare settings.[7, 8, 9, 10, 11] Performing fall risk assessments has been shown to reduce falls in hospitalized patients,[12] and using preoperative checklists, including a surgical time‐out, can reduce mortality and complication risks by approximately 40%.[13]
Respondents were asked how many cases of documented nonadherence would be necessary for the penalties to be appropriate (1 time, 25 times, 610 times, 1115 times, 16+ times, or would never be appropriate). Finally, respondents were asked to rate the potential harm to patients of each protocol lapse (nonelow, medium, or high).
Demographic information collected from the healthcare providers and medical students included age, gender, position, department, and years' experience in their current position. Demographic information collected from the patients included age, gender, insurance status, race, education level, household income level, and relationship status.
Survey Administration
Surveys were administered to convenience samples of 5 groups of individuals: attending physicians in the UCSF Department of Internal Medicine based at UCSF Medical Center and the San Francisco Veterans Affairs Medical Center, nurses at UCSF Medical Center, residents in the UCSF internal medicine residency program, medical students at UCSF, and inpatients in the internal medicine service at UCSF Medical Center's Moffitt‐Long Hospital. Attending physicians and nurses were surveyed at their respective departmental meetings. For resident physicians and medical students, surveys were distributed at the beginning of lectures and collected at the end.
Patients were eligible to participate if they spoke English and were noted to be alert and oriented to person, time, and place. A survey administrator located eligible patients in the internal medicine service via the electronic medical record system, determined if they were alert and oriented, and approached each patient in his or her room. If the patients verbally consented to consider participation, the surveys were given to them and retrieved after approximately 30 minutes.
Healthcare professionals were offered the opportunity to enter their e‐mail addresses at the end of the survey to become eligible for a drawing for a $100 gift card, but were informed that their e‐mail addresses would not be included in the analytic dataset. Inpatients were not offered any incentives to participate. All surveys were administered by a survey monitor in paper form between May 2011 and July 2012.
Data Analysis
Data analysis was conducted using the Statistical Analysis Software (SAS) package (SAS Institute Inc., Cary, NC) and Stata (StataCorp, College Station, TX). Descriptive analysis and frequency distributions were tallied for all responses. Responses to protocol lapses were grouped into 3 categories: feedback, public reporting, and penalty as described above. As all surveyed groups endorsed feedback as an appropriate response to all of the scenarios, we did not examine feedback, concentrating our analysis instead on public reporting and penalties.
Appropriateness ratings for each response to each protocol lapse were aggregated in 2 ways: ever appropriate (ie, the response would be appropriate after some number of documented lapses) versus never appropriate, and the threshold for the response. Whereas public reporting was only asked about as a single option, 3 separate responses were collapsed into the single response, penalties: fine, suspension, or firing. Individuals were classified as endorsing a penalty if they rated any 1 of these responses as ever appropriate. The threshold for penalty was the smallest number of occurrences at which 1 of the penalty responses was endorsed.
Differences among the 5 groups in the perceived harm of each protocol lapse were tested with 2 analyses. Group differences in ratings of whether public reporting and penalties were ever appropriate were tested with logistic regression analyses for each scenario separately, controlling for age, sex, and perceived harm of the protocol lapse. To determine if the 5 groups differed in their tendency to support public reporting or penalties regardless of the type of protocol lapse, we conducted logistic regression analyses across all 3 scenarios, accounting for multiple observations per individual through use of cluster‐correlated robust variance.[14] Differences among groups in the number of transgressions at which public reporting and penalties were supported were examined with log‐rank tests.
RESULTS
A total of 287 individuals were given surveys, and 183 completed them: 22 attending physicians, 33 resident physicians, 61 nurses, 47 medical students, and 20 patients (overall response rate 64%). Response rate for attending and resident physicians was 73%, for nurses 59%, and for medical students 54%. Among patients who were approached and agreed to accept a survey, 87% returned completed surveys (Table 1). The average age of attending physicians was 35.8 years (standard deviation [SD]: 5.3), residents was 28.3 years (SD: 1.7), nurses was 43.6 years (SD: 11.1), medical students was 26.6 years (SD: 2.9), and inpatients was 48.2 years (SD: 15.9). Thirty‐two percent of attending physicians were female, 67% of resident physicians were female, 88% of nurses were female, 66% of medical students were female, and 47% of inpatients were female.
| Attending Physician | Resident Physician | Nurse | Medical Student | Patient | |
|---|---|---|---|---|---|
| |||||
| No. | 22 | 33 | 61 | 47 | 20 |
| Response rate* | 73% | 73% | 59% | 54% | 87% |
| Age, y, meanSD | 365 | 282 | 4411 | 273 | 4816 |
| Sex, female, % (n) | 32% (7) | 67% (22) | 88% (53) | 66% (31) | 47% (9) |
Perceived Harm
Out of the 3 scenarios presented in in the survey, participants believed that not conducting preoperative time‐outs in surgery presented the highest risk to patient safety, with 57% (residents) to 86% (nurses) rating the potential harm as high (Figure 1). Not conducting fall risk assessments was perceived as second most potentially harmful, and not properly practicing hand hygiene was perceived as least potentially harmful to patient safety. There were significant differences among groups in perceptions of potential harm for all 3 scenarios (P<0.001 for all).

Appropriateness of Public Reporting and Penalties
Public reporting was viewed as ever appropriate by 34% of all respondents for hand‐hygiene protocol lapses, 58% for surgical time‐out lapses, and 43% for fall risk assessment lapses. There were no significant differences among groups in endorsement of public reporting for individual scenarios (Figure 2). Penalties were endorsed more frequently than public reporting for all groups and all scenarios. The proportion of attending physicians and patients who rated penalties as ever appropriate were similar for each scenario. Residents, medical students, and nurses were less likely than patients and attending physicians to support penalties (P<0.05 for all differences).
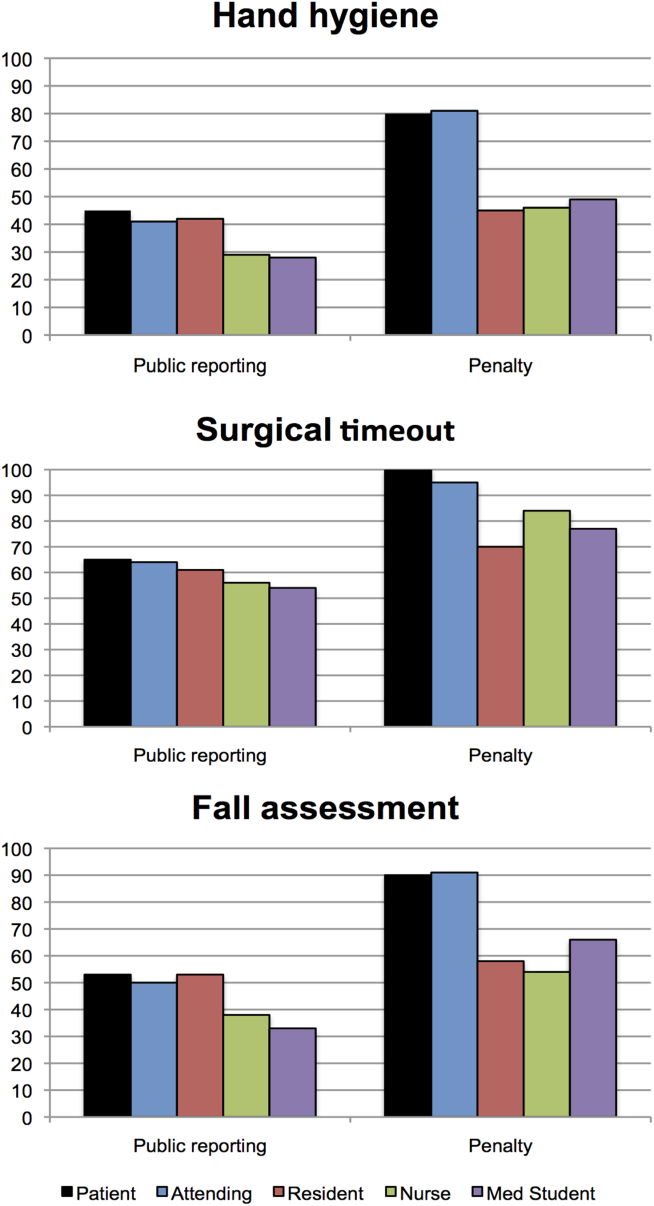
The aggregated analysis revealed that nurses and medical students were significantly less likely than patients to endorse public reporting across scenarios. In terms of endorsement of penalties, we found no significant differences between attending physicians and patients, but residents (odds ratio [OR]: 0.09, 95% confidence interval [CI]: 0.03‐0.32), students (OR: 0.12, 95% CI: 0.04‐0.34), and nurses (OR: 0.17, 95% CI: 0.03‐0.41) had significantly lower odds of favoring penalties than did patients (Table 2).
| Odds Ratio (95% CI) | ||
|---|---|---|
| Public Reporting | Penalty | |
| ||
| Group, across all scenarios | ||
| Patients | Reference | Reference |
| Attending physicians | 0.58 (0.172.01) | 0.88 (0.203.84) |
| Resident physicians | 0.42 (0.121.52) | 0.09 (0.020.32) |
| Nurses | 0.32 (0.120.88) | 0.17 (0.030.41) |
| Medical students | 0.22 (0.060.80) | 0.12 (0.040.34) |
| Scenario, across all groups | ||
| Hand hygiene | Reference | Reference |
| Surgical time‐out | 2.82 (2.033.91) | 4.29 (2.976.20) |
| Fall assessment | 1.47 (1.091.98) | 1.74 (1.272.37) |
Across all surveyed groups, public reporting was more often supported for lapses of surgical timeout (OR: 2.82, 95% CI: 2.03‐3.91) and fall risk assessment protocols (OR: 1.47, 95% CI: 1.09‐1.98) than for the referent, hand‐hygiene lapses. Across all groups, penalties were more likely to be supported for surgical timeout (OR: 4.29, 95% CI: 2.97‐6.20) and fall risk assessment protocol lapses (OR: 1.74, 95% CI: 1.27‐2.37) than for hand‐hygiene lapses.
Thresholds for Public Reporting and Penalties
The log‐rank test showed no significant differences among the surveyed groups in the number of transgressions at which public reporting was deemed appropriate in any of the 3 scenarios (P=0.37, P=0.71, and P=0.32 for hand hygiene, surgical time‐out, and fall risk assessment, respectively) (Figure 3). However, patients endorsed penalties after significantly fewer occurrences than residents, medical students, and nurses for all 3 scenarios (P<0.001 for all differences), and at a significantly lower threshold than attending physicians for surgical timeout and fall risk assessment (P<0.001 and P=0.03, respectively).
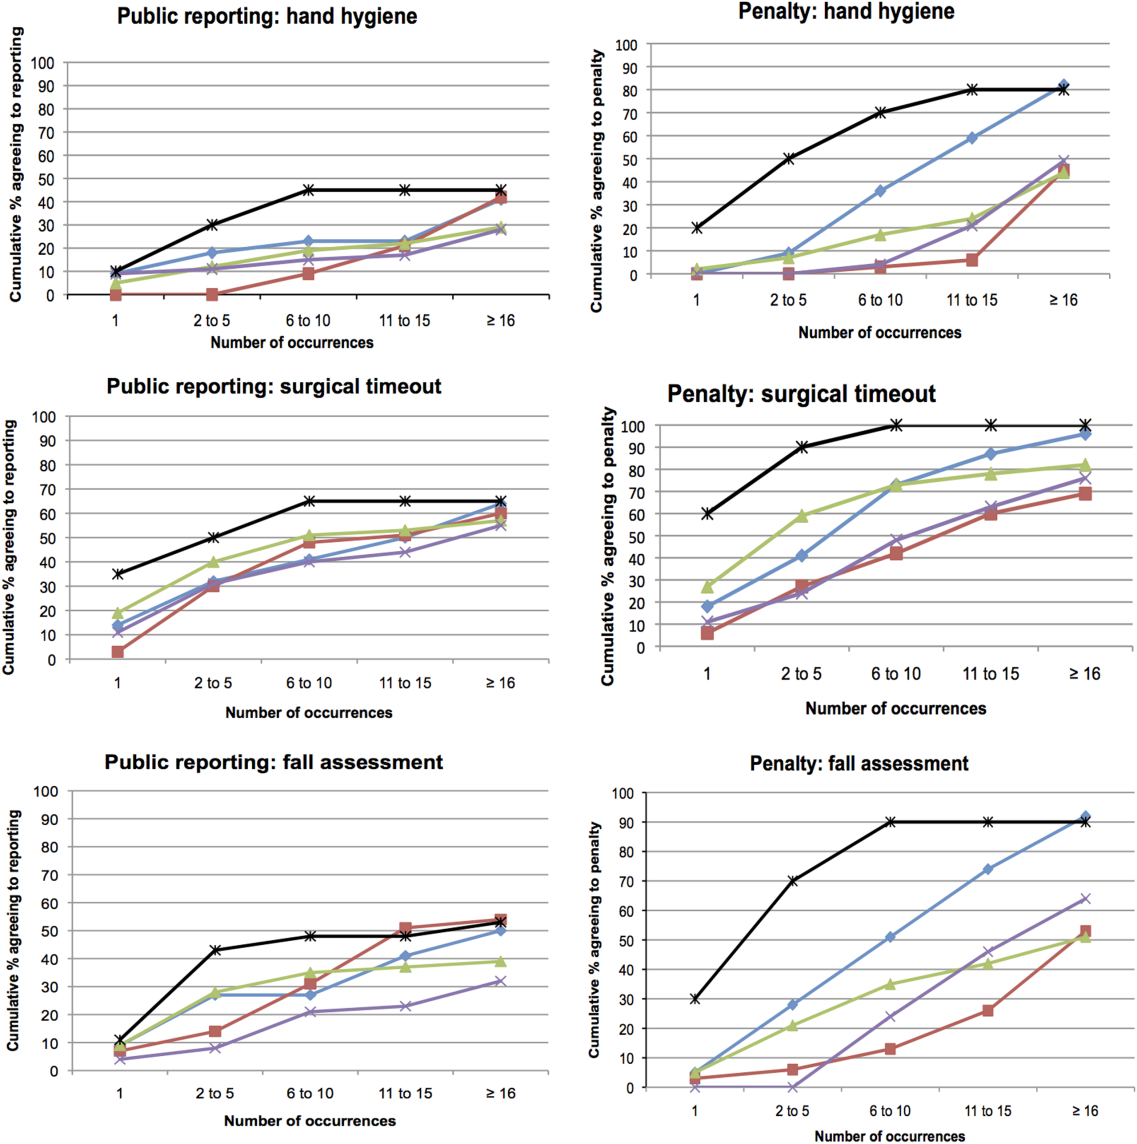
DISCUSSION
This survey assessed attitudes of healthcare professionals, trainees, and inpatients toward public reporting and penalties when clinicians do not follow basic safety protocols. Respondents tended to favor more aggressive measures when they deemed the safety risk from protocol violations to be higher. Almost all participants favored providing feedback after safety protocol lapses. Healthcare professionals tended to favor punitive measures, such as fines, suspension, and firing, more than public reporting of transgressions. Patients had a lower threshold than both providers and trainees for public reporting and punitive measures. In aggregate, our study suggests that after a decade of emphasis on a no‐blame response to patient safety hazards, both healthcare providers and patients now believe clinicians should be held accountable for following basic safety protocols, though their thresholds and triggers vary.
A surprising finding was that providers were more likely to favor penalties (such as fines, suspension, or firing) than public reporting of safety transgressions. Multiple studies have suggested that public reporting of hospital quality data has improved adherence to care processes and may improve patient outcomes.[15, 16, 17] Although our data do not tell us why clinicians appear to be more worried about public reporting than penalties, they do help explain why transparency has been a relatively powerful strategy to motivate changes in practice, even when it is unaccompanied by significant shifts in consumer choices.[18] It would be natural to consider public reporting to be a softer strategy than fines, suspension, or firing; however, our results indicate that many clinicians do not see it that way. Alternatively, the results could also suggest that clinicians prefer measures that provide more immediate feedback than public reporting generally provides. These attitudes should be considered when enacting public reporting strategies.
Another interesting finding was that patients and attending physicians tended to track together regarding their attitudes toward penalties for safety lapses. Although patients had a lower threshold for favoring penalties than attendings, similar proportions of patients and attending physicians believed that penalties should be enacted for safety transgressions, and both groups were more penal than physician trainees and nurses. We speculate that attendings and patients may have the most skin in the game, patients as the ones directly harmed by a preventable adverse event, and attending physicians as the most responsible clinicians, at least in the eyes of the malpractice system, licensing boards, and credentials committees.
Even though our study illustrates relatively high levels of endorsement for aggressive measures to deal with clinicians who fail to follow evidence‐based safety practices, a shift in this direction has risks and benefits. The no‐blame paradigm in patient safety grew out of a need to encourage open discussion about medical mistakes.[2] Whereas shifting away from a purely no‐ blame approach may lead to greater adherence with safety practices, and one hopes fewer cases of preventable harm, it also risks stifling the open discussions about medical errors that characterize learning organizations.[13, 19] Because of this, a movement in this direction should be undertaken carefully, starting first with a small number of well‐established safety practices, and ensuring that robust education and system improvements precede and accompany the imposition of penalties for nonadherence.
Our study has limitations. The survey was developed using convenience samples of UCSF faculty and medical students, so broader inclusion of physicians, nurses, trainees, and patients may have yielded a different survey instrument. As a survey, we cannot be certain that any of the groups' responses in real life (eg, in a vote of the medical staff on a given policy) would mirror their survey response. Additionally, the responses to protocol lapses did not include all possible administrative responses, such as mandatory training/remediation or rewards for positive behaviors. The responses could have also been different if participants were presented with different patient safety scenarios. The study population was limited in several ways. Attending and resident physicians were drawn from an academic department of internal medicine; it is possible that other specialties would have different attitudes. Patients were relatively young (likely due to the inclusion criteria), as were attending physicians (due to oversampling of hospitalist physicians). The relatively small number of participants could also limit statistical power to detect differences among groups. Additionally, the study population was limited to patients and healthcare professionals in academic medical centers in San Francisco. It is possible that attitudes would be different in other regions and practice settings.
The no‐blame approach to patient safety has been crucial in refocusing the lens on systems failures and in encouraging the active engagement by clinicians, particularly physicians.[2, 3] On the other hand, there are legitimate concerns that a unidimensional no‐blame approach has permitted, perhaps even promoted, nonadherence to evidence‐based safety practices that could prevent many cases of harm. Although it may not be surprising that patients favor harsher consequences for providers who do not follow basic safety protocols, our study demonstrates relatively widespread support for such consequences even among clinicians and trainees. However, all groups appear to recognize the nuances underlying this set of issues, with varying levels of enthusiasm for punitive responses based on perceived risk and number of transgressions. Future studies are needed to investigate how best to implement public reporting and penalties in ways that can maximize the patient safety benefits.
Acknowledgements
The authors are grateful to the clinicians, trainees, and patients who participated in the survey.
- . Understanding Patient Safety. 2nd ed. New York, NY: McGraw Hill Medical; 2012.
- . Error in medicine. JAMA. 1994;272(23):1851–1857.
- , . Balancing "no blame" with accountability in patient safety. N Engl J Med. 2009;361(14):1401–1406.
- , , , . Accountability measures—using measurement to promote quality improvement. N Engl J Med. 2010;363(7):683–688.
- , . Problem doctors: is there a system‐level solution? Ann Intern Med. 2006;144(2):107–115.
- , , , et al. A surgical safety checklist to reduce morbidity and mortality in a global population. N Engl J Med. 2009;360(5):491–499.
- , , , , . Effectiveness of a comprehensive hand hygiene program for reduction of infection rates in a long‐term care facility. Am J Infect Control. 2013;41(1):39–44.
- , . Impact of a hospital‐wide hand hygiene promotion strategy on healthcare‐associated infections. Antimicrob Resist Infect Control. 2012;1(1):13.
- , , , et al. Determinants of hand hygiene noncompliance in intensive care units. Am J Infect Control. 2013;41(2):131–135.
- , , , , , . Impact of a hospital‐wide hand hygiene initiative on healthcare‐associated infections: results of an interrupted time series. BMJ Qual Saf. 2012;21(12):1019–1026.
- , , , . Effectiveness of multifaceted hand hygiene interventions in long‐term care facilities in Hong Kong: a cluster‐randomized controlled trial. Infect Control Hosp Epidemiol. 2012;33(8):761–767.
- , , , , . Development, implementation, and evaluation of a comprehensive fall risk program. J Spec Pediatr Nurs 2011;16(2):130–139.
- , , , . A systematic review of the effectiveness, compliance, and critical factors for implementation of safety checklists in surgery. Ann Surg. 2012;256(6):925–933.
- . A note on robust variance estimation for cluster‐correlated data. Biometrics. 2000;56(2):645–646.
- , , , et al. Public reporting and pay for performance in hospital quality improvement. N Engl J Med. 2007;356(5):486–496.
- , , , , . Improving the outcomes of coronary artery bypass surgery in New York State. JAMA. 1994;271(10):761–766.
- , , . Declines in hospital mortality associated with a regional initiative to measure hospital performance. Am J Med Qual. 1997;12(2):103–112.
- , , , . The public release of performance data: what do we expect to gain? A review of the evidence. JAMA. 2000;283(14):1866–1874.
- . Continuing education meets the learning organization: the challenge of a systems approach to patient safety. J Contin Educ Health Prof. 2000;20(4):197–207.
Healthcare delivery organizations are under increasing pressure to improve patient safety. The fundamental underpinning of efforts to improve safety has been the establishment of a no‐blame culture, one that focuses less on individual transgressions and more on system improvement.[1, 2] As evidence‐based practices to improve care have emerged, and the pressures to deliver tangible improvements in safety and quality have grown, providers, healthcare system leaders, and policymakers are struggling with how best to balance the need for accountability with this no‐blame paradigm.
In dealing with areas such as hand hygiene, where there is strong evidence for the value of the practice yet relatively poor adherence in many institutions, Wachter and Pronovost have argued that the scales need to tip more in the direction of accountability, including the imposition of penalties for clinicians who habitually fail to follow certain safety practices.[3] Although not obviating the critical importance of systems improvement, they argue that a failure to enforce such measures undermines trust in the system and invites external regulation. Chassin and colleagues made a similar point in arguing for the identification of certain accountability measures that could be used in public reporting and pay‐for‐performance programs.[4]
Few organizations have enacted robust systems to hold providers responsible for adhering to accountability measures.[4] Although many hospitals have policies to suspend clinical privileges for failing to sign discharge summaries or obtain a yearly purified protein derivative test, few have formal programs to identify and deal with clinicians whose behavior is persistently problematic.[3] Furthermore, existing modes of physician accountability, such as state licensing boards, only discipline physicians retroactively (and rarely) when healthcare organizations report poor performance. State boards typically do not consider prevention of injury, such as adherence to safety practices, to be part of their responsibility.[5] Similarly, credentialing boards (eg, the American Board of Internal Medicine) do not assess adherence to such practices in coming to their decisions.
It is estimated that strict adherence to infection control practices, such as hand hygiene, could prevent over 100,000 hospital deaths every year; adherence to other evidence‐based safety practices such as the use of a preoperative time‐out would likely prevent many more deaths and cases of medical injury.[3, 6] Although there are practical issues, such as how to audit individual clinician adherence in ways that are feasible and fair, that make enforcing individual provider accountability challenging, there seems little doubt that attitudes regarding the appropriateness of enacting penalties for safety transgressions will be key determinants of whether such measures are considered. Yet no study to date has assessed the opinions of different stakeholders (physicians, nurses, trainees, patients) regarding various strategies, including public reporting and penalties, to improve adherence to safety practices. We aimed to assess these attitudes across a variety of such stakeholders.
METHODS
Survey Development and Characteristics
To understand the perceptions of measures designed to improve patient safety, we designed a survey of patients, nurses, medical students, resident physicians, and attending physicians to be administered at hospitals associated with the University of California, San Francisco (UCSF). Institutional review board approval was obtained from the UCSF Committee on Human Research, and all respondents provided informed consent.
The survey was developed by the authors and pilot tested with 2 populations. First, the survey was administered to a group of 12 UCSF Division of Hospital Medicine research faculty; their feedback was used to revise the survey. Second, the survey was administered to a convenience sample of 2 UCSF medical students, and their feedback was used to further refine the survey.
The questionnaire presented 3 scenarios in which a healthcare provider committed a patient‐safety protocol lapse; participants were asked their opinions about the appropriate responses to each of the violations. The 3 scenarios were: (1) a healthcare provider not properly conducting hand hygiene before a patient encounter, (2) a healthcare provider not properly conducting a fall risk assessment on a hospitalized patient, and (3) a healthcare provider not properly conducting a preoperative timeout prior to surgery. For each scenario, a series of questions was asked about a variety of institutional responses toward a provider who did not adhere to each safety protocol. Potential responses included feedback (email feedback, verbal feedback, meeting with a supervisor, a quarterly performance review meeting, and a quarterly report card seen only by the provider), public reporting (posting the provider's infractions on a public website), and penalties (fines, suspension without pay, and firing).
We chose the 3 practices because they are backed by strong evidence, are relatively easy to perform, are inexpensive, are linked to important and common harms, and are generally supported within the patient‐safety community. Improved adherence to hand hygiene significantly reduces infection transmission in healthcare settings.[7, 8, 9, 10, 11] Performing fall risk assessments has been shown to reduce falls in hospitalized patients,[12] and using preoperative checklists, including a surgical time‐out, can reduce mortality and complication risks by approximately 40%.[13]
Respondents were asked how many cases of documented nonadherence would be necessary for the penalties to be appropriate (1 time, 25 times, 610 times, 1115 times, 16+ times, or would never be appropriate). Finally, respondents were asked to rate the potential harm to patients of each protocol lapse (nonelow, medium, or high).
Demographic information collected from the healthcare providers and medical students included age, gender, position, department, and years' experience in their current position. Demographic information collected from the patients included age, gender, insurance status, race, education level, household income level, and relationship status.
Survey Administration
Surveys were administered to convenience samples of 5 groups of individuals: attending physicians in the UCSF Department of Internal Medicine based at UCSF Medical Center and the San Francisco Veterans Affairs Medical Center, nurses at UCSF Medical Center, residents in the UCSF internal medicine residency program, medical students at UCSF, and inpatients in the internal medicine service at UCSF Medical Center's Moffitt‐Long Hospital. Attending physicians and nurses were surveyed at their respective departmental meetings. For resident physicians and medical students, surveys were distributed at the beginning of lectures and collected at the end.
Patients were eligible to participate if they spoke English and were noted to be alert and oriented to person, time, and place. A survey administrator located eligible patients in the internal medicine service via the electronic medical record system, determined if they were alert and oriented, and approached each patient in his or her room. If the patients verbally consented to consider participation, the surveys were given to them and retrieved after approximately 30 minutes.
Healthcare professionals were offered the opportunity to enter their e‐mail addresses at the end of the survey to become eligible for a drawing for a $100 gift card, but were informed that their e‐mail addresses would not be included in the analytic dataset. Inpatients were not offered any incentives to participate. All surveys were administered by a survey monitor in paper form between May 2011 and July 2012.
Data Analysis
Data analysis was conducted using the Statistical Analysis Software (SAS) package (SAS Institute Inc., Cary, NC) and Stata (StataCorp, College Station, TX). Descriptive analysis and frequency distributions were tallied for all responses. Responses to protocol lapses were grouped into 3 categories: feedback, public reporting, and penalty as described above. As all surveyed groups endorsed feedback as an appropriate response to all of the scenarios, we did not examine feedback, concentrating our analysis instead on public reporting and penalties.
Appropriateness ratings for each response to each protocol lapse were aggregated in 2 ways: ever appropriate (ie, the response would be appropriate after some number of documented lapses) versus never appropriate, and the threshold for the response. Whereas public reporting was only asked about as a single option, 3 separate responses were collapsed into the single response, penalties: fine, suspension, or firing. Individuals were classified as endorsing a penalty if they rated any 1 of these responses as ever appropriate. The threshold for penalty was the smallest number of occurrences at which 1 of the penalty responses was endorsed.
Differences among the 5 groups in the perceived harm of each protocol lapse were tested with 2 analyses. Group differences in ratings of whether public reporting and penalties were ever appropriate were tested with logistic regression analyses for each scenario separately, controlling for age, sex, and perceived harm of the protocol lapse. To determine if the 5 groups differed in their tendency to support public reporting or penalties regardless of the type of protocol lapse, we conducted logistic regression analyses across all 3 scenarios, accounting for multiple observations per individual through use of cluster‐correlated robust variance.[14] Differences among groups in the number of transgressions at which public reporting and penalties were supported were examined with log‐rank tests.
RESULTS
A total of 287 individuals were given surveys, and 183 completed them: 22 attending physicians, 33 resident physicians, 61 nurses, 47 medical students, and 20 patients (overall response rate 64%). Response rate for attending and resident physicians was 73%, for nurses 59%, and for medical students 54%. Among patients who were approached and agreed to accept a survey, 87% returned completed surveys (Table 1). The average age of attending physicians was 35.8 years (standard deviation [SD]: 5.3), residents was 28.3 years (SD: 1.7), nurses was 43.6 years (SD: 11.1), medical students was 26.6 years (SD: 2.9), and inpatients was 48.2 years (SD: 15.9). Thirty‐two percent of attending physicians were female, 67% of resident physicians were female, 88% of nurses were female, 66% of medical students were female, and 47% of inpatients were female.
| Attending Physician | Resident Physician | Nurse | Medical Student | Patient | |
|---|---|---|---|---|---|
| |||||
| No. | 22 | 33 | 61 | 47 | 20 |
| Response rate* | 73% | 73% | 59% | 54% | 87% |
| Age, y, meanSD | 365 | 282 | 4411 | 273 | 4816 |
| Sex, female, % (n) | 32% (7) | 67% (22) | 88% (53) | 66% (31) | 47% (9) |
Perceived Harm
Out of the 3 scenarios presented in in the survey, participants believed that not conducting preoperative time‐outs in surgery presented the highest risk to patient safety, with 57% (residents) to 86% (nurses) rating the potential harm as high (Figure 1). Not conducting fall risk assessments was perceived as second most potentially harmful, and not properly practicing hand hygiene was perceived as least potentially harmful to patient safety. There were significant differences among groups in perceptions of potential harm for all 3 scenarios (P<0.001 for all).
Appropriateness of Public Reporting and Penalties
Public reporting was viewed as ever appropriate by 34% of all respondents for hand‐hygiene protocol lapses, 58% for surgical time‐out lapses, and 43% for fall risk assessment lapses. There were no significant differences among groups in endorsement of public reporting for individual scenarios (Figure 2). Penalties were endorsed more frequently than public reporting for all groups and all scenarios. The proportion of attending physicians and patients who rated penalties as ever appropriate were similar for each scenario. Residents, medical students, and nurses were less likely than patients and attending physicians to support penalties (P<0.05 for all differences).
The aggregated analysis revealed that nurses and medical students were significantly less likely than patients to endorse public reporting across scenarios. In terms of endorsement of penalties, we found no significant differences between attending physicians and patients, but residents (odds ratio [OR]: 0.09, 95% confidence interval [CI]: 0.03‐0.32), students (OR: 0.12, 95% CI: 0.04‐0.34), and nurses (OR: 0.17, 95% CI: 0.03‐0.41) had significantly lower odds of favoring penalties than did patients (Table 2).
| Odds Ratio (95% CI) | ||
|---|---|---|
| Public Reporting | Penalty | |
| ||
| Group, across all scenarios | ||
| Patients | Reference | Reference |
| Attending physicians | 0.58 (0.172.01) | 0.88 (0.203.84) |
| Resident physicians | 0.42 (0.121.52) | 0.09 (0.020.32) |
| Nurses | 0.32 (0.120.88) | 0.17 (0.030.41) |
| Medical students | 0.22 (0.060.80) | 0.12 (0.040.34) |
| Scenario, across all groups | ||
| Hand hygiene | Reference | Reference |
| Surgical time‐out | 2.82 (2.033.91) | 4.29 (2.976.20) |
| Fall assessment | 1.47 (1.091.98) | 1.74 (1.272.37) |
Across all surveyed groups, public reporting was more often supported for lapses of surgical timeout (OR: 2.82, 95% CI: 2.03‐3.91) and fall risk assessment protocols (OR: 1.47, 95% CI: 1.09‐1.98) than for the referent, hand‐hygiene lapses. Across all groups, penalties were more likely to be supported for surgical timeout (OR: 4.29, 95% CI: 2.97‐6.20) and fall risk assessment protocol lapses (OR: 1.74, 95% CI: 1.27‐2.37) than for hand‐hygiene lapses.
Thresholds for Public Reporting and Penalties
The log‐rank test showed no significant differences among the surveyed groups in the number of transgressions at which public reporting was deemed appropriate in any of the 3 scenarios (P=0.37, P=0.71, and P=0.32 for hand hygiene, surgical time‐out, and fall risk assessment, respectively) (Figure 3). However, patients endorsed penalties after significantly fewer occurrences than residents, medical students, and nurses for all 3 scenarios (P<0.001 for all differences), and at a significantly lower threshold than attending physicians for surgical timeout and fall risk assessment (P<0.001 and P=0.03, respectively).
DISCUSSION
This survey assessed attitudes of healthcare professionals, trainees, and inpatients toward public reporting and penalties when clinicians do not follow basic safety protocols. Respondents tended to favor more aggressive measures when they deemed the safety risk from protocol violations to be higher. Almost all participants favored providing feedback after safety protocol lapses. Healthcare professionals tended to favor punitive measures, such as fines, suspension, and firing, more than public reporting of transgressions. Patients had a lower threshold than both providers and trainees for public reporting and punitive measures. In aggregate, our study suggests that after a decade of emphasis on a no‐blame response to patient safety hazards, both healthcare providers and patients now believe clinicians should be held accountable for following basic safety protocols, though their thresholds and triggers vary.
A surprising finding was that providers were more likely to favor penalties (such as fines, suspension, or firing) than public reporting of safety transgressions. Multiple studies have suggested that public reporting of hospital quality data has improved adherence to care processes and may improve patient outcomes.[15, 16, 17] Although our data do not tell us why clinicians appear to be more worried about public reporting than penalties, they do help explain why transparency has been a relatively powerful strategy to motivate changes in practice, even when it is unaccompanied by significant shifts in consumer choices.[18] It would be natural to consider public reporting to be a softer strategy than fines, suspension, or firing; however, our results indicate that many clinicians do not see it that way. Alternatively, the results could also suggest that clinicians prefer measures that provide more immediate feedback than public reporting generally provides. These attitudes should be considered when enacting public reporting strategies.
Another interesting finding was that patients and attending physicians tended to track together regarding their attitudes toward penalties for safety lapses. Although patients had a lower threshold for favoring penalties than attendings, similar proportions of patients and attending physicians believed that penalties should be enacted for safety transgressions, and both groups were more penal than physician trainees and nurses. We speculate that attendings and patients may have the most skin in the game, patients as the ones directly harmed by a preventable adverse event, and attending physicians as the most responsible clinicians, at least in the eyes of the malpractice system, licensing boards, and credentials committees.
Even though our study illustrates relatively high levels of endorsement for aggressive measures to deal with clinicians who fail to follow evidence‐based safety practices, a shift in this direction has risks and benefits. The no‐blame paradigm in patient safety grew out of a need to encourage open discussion about medical mistakes.[2] Whereas shifting away from a purely no‐ blame approach may lead to greater adherence with safety practices, and one hopes fewer cases of preventable harm, it also risks stifling the open discussions about medical errors that characterize learning organizations.[13, 19] Because of this, a movement in this direction should be undertaken carefully, starting first with a small number of well‐established safety practices, and ensuring that robust education and system improvements precede and accompany the imposition of penalties for nonadherence.
Our study has limitations. The survey was developed using convenience samples of UCSF faculty and medical students, so broader inclusion of physicians, nurses, trainees, and patients may have yielded a different survey instrument. As a survey, we cannot be certain that any of the groups' responses in real life (eg, in a vote of the medical staff on a given policy) would mirror their survey response. Additionally, the responses to protocol lapses did not include all possible administrative responses, such as mandatory training/remediation or rewards for positive behaviors. The responses could have also been different if participants were presented with different patient safety scenarios. The study population was limited in several ways. Attending and resident physicians were drawn from an academic department of internal medicine; it is possible that other specialties would have different attitudes. Patients were relatively young (likely due to the inclusion criteria), as were attending physicians (due to oversampling of hospitalist physicians). The relatively small number of participants could also limit statistical power to detect differences among groups. Additionally, the study population was limited to patients and healthcare professionals in academic medical centers in San Francisco. It is possible that attitudes would be different in other regions and practice settings.
The no‐blame approach to patient safety has been crucial in refocusing the lens on systems failures and in encouraging the active engagement by clinicians, particularly physicians.[2, 3] On the other hand, there are legitimate concerns that a unidimensional no‐blame approach has permitted, perhaps even promoted, nonadherence to evidence‐based safety practices that could prevent many cases of harm. Although it may not be surprising that patients favor harsher consequences for providers who do not follow basic safety protocols, our study demonstrates relatively widespread support for such consequences even among clinicians and trainees. However, all groups appear to recognize the nuances underlying this set of issues, with varying levels of enthusiasm for punitive responses based on perceived risk and number of transgressions. Future studies are needed to investigate how best to implement public reporting and penalties in ways that can maximize the patient safety benefits.
Acknowledgements
The authors are grateful to the clinicians, trainees, and patients who participated in the survey.
- . Understanding Patient Safety. 2nd ed. New York, NY: McGraw Hill Medical; 2012.
- . Error in medicine. JAMA. 1994;272(23):1851–1857.
- , . Balancing "no blame" with accountability in patient safety. N Engl J Med. 2009;361(14):1401–1406.
- , , , . Accountability measures—using measurement to promote quality improvement. N Engl J Med. 2010;363(7):683–688.
- , . Problem doctors: is there a system‐level solution? Ann Intern Med. 2006;144(2):107–115.
- , , , et al. A surgical safety checklist to reduce morbidity and mortality in a global population. N Engl J Med. 2009;360(5):491–499.
- , , , , . Effectiveness of a comprehensive hand hygiene program for reduction of infection rates in a long‐term care facility. Am J Infect Control. 2013;41(1):39–44.
- , . Impact of a hospital‐wide hand hygiene promotion strategy on healthcare‐associated infections. Antimicrob Resist Infect Control. 2012;1(1):13.
- , , , et al. Determinants of hand hygiene noncompliance in intensive care units. Am J Infect Control. 2013;41(2):131–135.
- , , , , , . Impact of a hospital‐wide hand hygiene initiative on healthcare‐associated infections: results of an interrupted time series. BMJ Qual Saf. 2012;21(12):1019–1026.
- , , , . Effectiveness of multifaceted hand hygiene interventions in long‐term care facilities in Hong Kong: a cluster‐randomized controlled trial. Infect Control Hosp Epidemiol. 2012;33(8):761–767.
- , , , , . Development, implementation, and evaluation of a comprehensive fall risk program. J Spec Pediatr Nurs 2011;16(2):130–139.
- , , , . A systematic review of the effectiveness, compliance, and critical factors for implementation of safety checklists in surgery. Ann Surg. 2012;256(6):925–933.
- . A note on robust variance estimation for cluster‐correlated data. Biometrics. 2000;56(2):645–646.
- , , , et al. Public reporting and pay for performance in hospital quality improvement. N Engl J Med. 2007;356(5):486–496.
- , , , , . Improving the outcomes of coronary artery bypass surgery in New York State. JAMA. 1994;271(10):761–766.
- , , . Declines in hospital mortality associated with a regional initiative to measure hospital performance. Am J Med Qual. 1997;12(2):103–112.
- , , , . The public release of performance data: what do we expect to gain? A review of the evidence. JAMA. 2000;283(14):1866–1874.
- . Continuing education meets the learning organization: the challenge of a systems approach to patient safety. J Contin Educ Health Prof. 2000;20(4):197–207.
© 2013 Society of Hospital Medicine
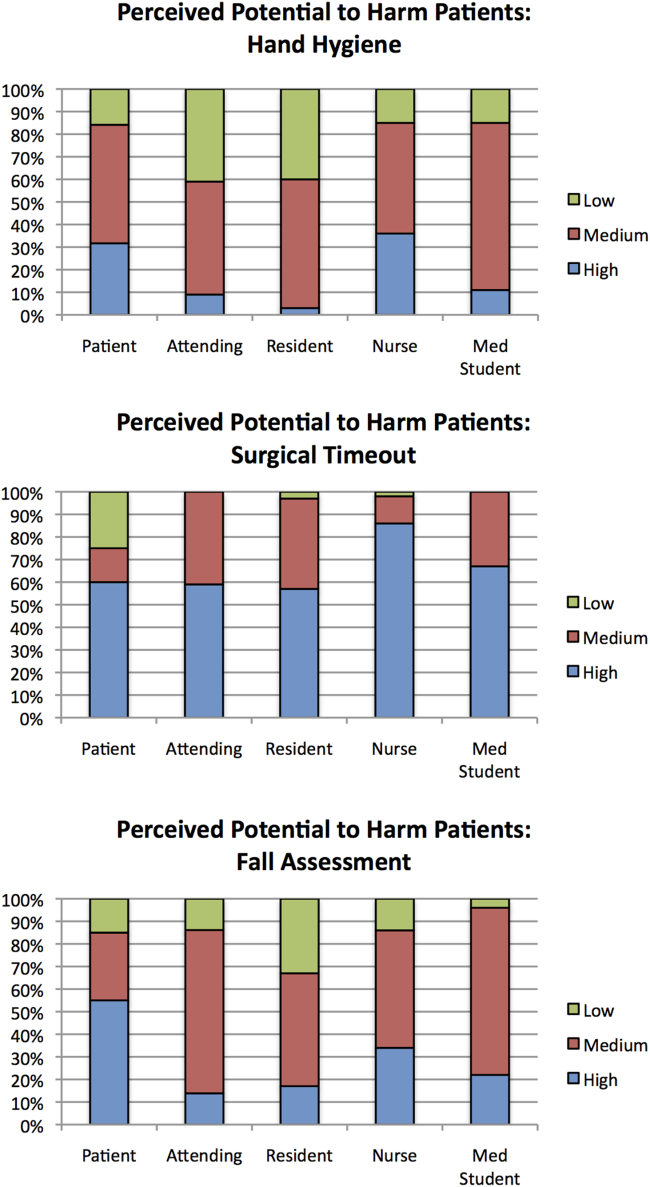
In reference to “Discharge against medical advice: How often do we intervene?”
In their study of against medical advice (AMA) discharges, Edwards et al.[1] express surprise that prescriptions were given and follow‐up arranged at a much lower rate than the frequency of warning of impending AMA discharge. The authors assume that when doctors know a patient wants to leave AMA, they will and should, as a matter of course, write prescriptions and arrange follow‐up. Not considered is the possibility that doctors may decide for selected patients that the better response is not to prescribe and not to arrange follow‐up. Prescribing medications to a patient who has already shown disinterest in heeding doctors' advice may be considered dangerous. Similarly, making an appointment for a patient who has already demonstrated a lack of adherence, thereby depriving another patient of that appointment, may be considered an imprudent use of resources. The authors do not provide data on how many AMA discharges may have been averted by this approach. Attempts to minimize the negative impact of capable patients' decisions neglect that some patients do not categorically prioritize health, and that true autonomy entails not just decision making but bearing responsibility for those decisions' consequences. Medical risk reduction is not the only value at play in these complex situations.
- , , . Discharge against medical advice: how often do we intervene? J Hosp Med. 2013;8(10):574–577.
In their study of against medical advice (AMA) discharges, Edwards et al.[1] express surprise that prescriptions were given and follow‐up arranged at a much lower rate than the frequency of warning of impending AMA discharge. The authors assume that when doctors know a patient wants to leave AMA, they will and should, as a matter of course, write prescriptions and arrange follow‐up. Not considered is the possibility that doctors may decide for selected patients that the better response is not to prescribe and not to arrange follow‐up. Prescribing medications to a patient who has already shown disinterest in heeding doctors' advice may be considered dangerous. Similarly, making an appointment for a patient who has already demonstrated a lack of adherence, thereby depriving another patient of that appointment, may be considered an imprudent use of resources. The authors do not provide data on how many AMA discharges may have been averted by this approach. Attempts to minimize the negative impact of capable patients' decisions neglect that some patients do not categorically prioritize health, and that true autonomy entails not just decision making but bearing responsibility for those decisions' consequences. Medical risk reduction is not the only value at play in these complex situations.
In their study of against medical advice (AMA) discharges, Edwards et al.[1] express surprise that prescriptions were given and follow‐up arranged at a much lower rate than the frequency of warning of impending AMA discharge. The authors assume that when doctors know a patient wants to leave AMA, they will and should, as a matter of course, write prescriptions and arrange follow‐up. Not considered is the possibility that doctors may decide for selected patients that the better response is not to prescribe and not to arrange follow‐up. Prescribing medications to a patient who has already shown disinterest in heeding doctors' advice may be considered dangerous. Similarly, making an appointment for a patient who has already demonstrated a lack of adherence, thereby depriving another patient of that appointment, may be considered an imprudent use of resources. The authors do not provide data on how many AMA discharges may have been averted by this approach. Attempts to minimize the negative impact of capable patients' decisions neglect that some patients do not categorically prioritize health, and that true autonomy entails not just decision making but bearing responsibility for those decisions' consequences. Medical risk reduction is not the only value at play in these complex situations.
- , , . Discharge against medical advice: how often do we intervene? J Hosp Med. 2013;8(10):574–577.
- , , . Discharge against medical advice: how often do we intervene? J Hosp Med. 2013;8(10):574–577.
Letters to the Editor
We believe medications can safely be prescribed to most patients who leave against medical advice (AMA), and that follow‐up should be offered to most if not all such patients. Why should we do this? Consider a wheezing asthma patient who leaves AMA. She or he is probably more likely to return to the emergency department (somewhere) or be readmitted (somewhere) and cost more money (to the system) than if given an inhaler and steroid taper.
Dr. Querques et al. suggest that doctors should potentially not prescribe and should not offer follow‐up to certain patients who want to leave AMA, particularly those who show disinterest in heeding the doctor's advice and have already demonstrated a lack of adherence. How should doctors make those judgments? Patients leave AMA for a variety of reasons: for example to avoid cost, because they feel better, or poor communication. Certainly, not all patients who want to leave AMA are categorically nonadherent. Conversely, up to 50% of all continuity patients are not fully adherent to the lifestyle changes and medications their physicians prescribe,[1] yet they would rarely if ever threaten AMA. Is withholding treatments that are likely to be effective and have minimal risk worth the potential benefit of increasing a patient's priority on their own healthcare? As emphasized by Berger (2008),[2] interventions with low risk and high potential for efficacy (assistance with establishing a follow‐up) should be pursued, and those with potential risks (starting new long‐term medications) should be avoided. At minimum, considering these options is an ethical requirement in the care of patients. We maintain that this reasoning should be explained and documented, which often is not being done in healthcare today.
How many AMAs are avoided by truly collaborative relationships with patients (nonevents), and how many are fueled by a more paternalistic relationship? For example, if a patient truly has a sick family member or child to take care of or has financial problems or no insurance, then it seems reasonable, perhaps even responsible, to leave the hospital even if maximal benefits of care have not been reached. In a collaborative relationship, providers may then tailor treatment to the patient's circumstances, even if this means the patient is not getting the best possible care.
- , . Medication adherence: WHO cares? Mayo Clin Proc. 2011;86(4):304–314.
- . Discharge against medical advice: ethical considerations and professional obligations. J Hosp Med. 2008;3(5):403–408.
We believe medications can safely be prescribed to most patients who leave against medical advice (AMA), and that follow‐up should be offered to most if not all such patients. Why should we do this? Consider a wheezing asthma patient who leaves AMA. She or he is probably more likely to return to the emergency department (somewhere) or be readmitted (somewhere) and cost more money (to the system) than if given an inhaler and steroid taper.
Dr. Querques et al. suggest that doctors should potentially not prescribe and should not offer follow‐up to certain patients who want to leave AMA, particularly those who show disinterest in heeding the doctor's advice and have already demonstrated a lack of adherence. How should doctors make those judgments? Patients leave AMA for a variety of reasons: for example to avoid cost, because they feel better, or poor communication. Certainly, not all patients who want to leave AMA are categorically nonadherent. Conversely, up to 50% of all continuity patients are not fully adherent to the lifestyle changes and medications their physicians prescribe,[1] yet they would rarely if ever threaten AMA. Is withholding treatments that are likely to be effective and have minimal risk worth the potential benefit of increasing a patient's priority on their own healthcare? As emphasized by Berger (2008),[2] interventions with low risk and high potential for efficacy (assistance with establishing a follow‐up) should be pursued, and those with potential risks (starting new long‐term medications) should be avoided. At minimum, considering these options is an ethical requirement in the care of patients. We maintain that this reasoning should be explained and documented, which often is not being done in healthcare today.
How many AMAs are avoided by truly collaborative relationships with patients (nonevents), and how many are fueled by a more paternalistic relationship? For example, if a patient truly has a sick family member or child to take care of or has financial problems or no insurance, then it seems reasonable, perhaps even responsible, to leave the hospital even if maximal benefits of care have not been reached. In a collaborative relationship, providers may then tailor treatment to the patient's circumstances, even if this means the patient is not getting the best possible care.
- , . Medication adherence: WHO cares? Mayo Clin Proc. 2011;86(4):304–314.
- . Discharge against medical advice: ethical considerations and professional obligations. J Hosp Med. 2008;3(5):403–408.
- , . Medication adherence: WHO cares? Mayo Clin Proc. 2011;86(4):304–314.
- . Discharge against medical advice: ethical considerations and professional obligations. J Hosp Med. 2008;3(5):403–408.
Why social media are here to stay
A new year holds so much potential. It’s often when we’re at our most ambitious and optimistic. A time when we’re more likely to try something new – learn a language, take up CrossFit, or, even, dive into the social media ocean.
In this column over the last year, I have written about many different social media platforms including Facebook, YouTube, and Pinterest. Many physicians have e-mailed me asking, "Do I really need to be doing social media? Is it more than just a fad?" My answer was and still is, Yes!
The medical landscape is continually evolving, and social media continue to disrupt the traditional roles of doctor and patient. We now have "e-patients," "digital doctors," and doctor-rating sites; hospitals have Facebook pages, and surgeons are tweeting live surgery. Never has the field of medicine been so transparent.
Although I don’t have a crystal ball, I can assure you that social media are here to stay for a long time. So, if you’ve only dipped your toe in the social media waters so far, keep reading; you might find some inspiration to take the plunge in 2014:
• 90% of adults aged 18-24 said they would trust medical information shared by others in their social media networks. Social media communications are simply word of mouth enhanced by technology. Instead of telling their immediate family about you at the dinner table, your patients now have the ability to tell hundreds or thousands of people about you on social media. Create compelling content, make it shareable, and you’ll help build positive word of mouth.
• Social media users are more likely to trust health-related content written by physicians than by any other group. There is a tremendous amount of health care information online, much of it inaccurate. That means content produced by you (for example, through Facebook updates, YouTube videos, and blog posts) is likely to be shared more frequently and to help build your brand as a trusted physician.
• 47% of patients share their medical information online with doctors, and 43% do so with hospitals.
• 77% of patients used search engines prior to booking their medical appointment. If you’re not online, patients won’t find you.
• 41% of patients said social media would affect their choice of a specific doctor, hospital, or medical facility. Online word of mouth has an impact on you and your practice.
• 58% of health care marketers use blogs vs. 74% of all marketers. Maintaining a blog helps you build brand loyalty and gives you a competitive edge against physicians who aren’t online.
• YouTube traffic to hospital websites has increased 119% year to year. Because they’re visual, videos tend to be more memorable for social media users. Whether videos are used to share poignant patient stories, educate patients about specific diseases and treatments, or show how a clinical procedure is performed, they allow you to connect more intimately with patients and prospective patients, and put a human face on your practice.
• Parents are more likely to seek medical information online. Data show that 22% of parents use Facebook vs. 14% of nonparents, and 20% of parents use YouTube vs. 12% of nonparents. Parents want online information they can trust; that means information created by you.
• 51% of patients said they would feel more valued if their health care provider communicated with them digitally. This means exploring other modes of communication such as e-mail, newsletters, blog posts, and Facebook updates.
• 60% of physicians surveyed said social media improve the quality of care delivered to their patients. From physician online communities to Google hangouts, physicians are learning from one another, and often from patients, making them better clinicians.
Sources include DC Interactive Group, Demi and Cooper Advertising, Media Bistro, PWC Health Research Institute, and TeleVox.
Dr. Benabio is a practicing dermatologist and physician director of health care transformation at Kaiser Permanente in San Diego. Connect with him on Twitter @Dermdoc or drop him a line at [email protected].

Promises, promises
For many, the making and breaking of New Year’s resolutions have become a humorless cliché. Still, the beginning of a new year is as good a time as any for reflection and inspiration; and if you restrict your fix-it list to a few realistic promises that can actually be kept, resolution time does not have to remain an exercise in futility.
I can’t presume to know what needs improving in your practice, but I do know the issues I get the most questions about. Perhaps the following Top Ten list will inspire you to create a realistic list of your own.
1. Do a HIPAA risk assessment. The new HIPAA rules are now in effect, as I discussed a few months ago. Is your office up to speed? Review every procedure that involves confidential information; make sure there are no violations. Penalties for carelessness are much stiffer now.
2. Encrypt your mobile devices. This is a subset of item 1. The biggest HIPAA vulnerability in many practices is laptops and tablets that carry confidential patient information; losing one could be a disaster. Encryption software is cheap and readily available, and a lost or stolen mobile device will probably not be treated as a HIPAA breach if it is properly encrypted.
3. Reduce your accounts receivable by keeping a credit card number on file for each patient, and charging patient-owed balances as they come in. A series of my past columns in the archives at edermatologynews.com explains exactly how to do it. Every hotel in the world does this, and you should too.
4. Review your coding habits. For example, are you billing for 99213 each and every time your evaluation and treatment meet the criteria for that code? If not, you’re leaving money on the table; and that will become a more and more significant issue if reimbursements tighten up in the next few years – as they almost surely will.
5. Clear your "horizontal file cabinet." That’s the mess on your desk, all the paperwork you never seem to get to (probably because you’re tweeting or answering e-mail). Set aside an hour or two and get it all done. You’ll find some interesting stuff in there. Then, for every piece of paper that arrives on your desk from now on, follow the DDD Rule: Do it, Delegate it, or Destroy it. Don’t start a new mess.
6. Keep a closer eye on your office finances. Most physicians delegate the bookkeeping, and that’s fine. But ignoring the financial side creates an atmosphere that facilitates embezzlement. Set aside a few hours each month to review the books personally. And make sure your employees know you’re doing it.
7. Make sure your long-range financial planning is on track. This is another task physicians tend to "set and forget," but the Great Recession was an eye-opener for many of us. Once a year, sit down with your accountant and planner and make sure your investments are well diversified and all other aspects of your finances – budgets, credit ratings, insurance coverage, tax situations, college savings, estate plans, and retirement accounts – are in the best shape possible. Now would be a good time.
8. Back up your data. Now is also an excellent time to verify that the information on your office and personal computers is being backed up – locally and online – on a regular schedule. Don’t wait until something crashes.
9. Take more vacations. Remember Eastern’s First Law: Your last words will not be, "I wish I had spent more time in the office." This is the year to start spending more time enjoying your life, your friends and family, and the world. As John Lennon said, "Life is what happens to you while you’re busy making other plans."
10. Look at yourself. A private practice lives or dies on the personalities of its physicians, and your staff copies your personality and style. Take a hard, honest look at yourself. Identify your negative personality traits and work to eliminate them. If you have any difficulty finding the things that need changing ... ask your spouse. He or she will be happy to outline them for you in great detail.
Dr. Eastern practices dermatology and dermatologic surgery in Belleville, N.J. He is a clinical associate professor of dermatology at Seton Hall University School of Graduate Medical Education in South Orange, N.J. Dr. Eastern is a two-time past president of the Dermatological Society of New Jersey, and currently serves on its executive board. He holds teaching positions at several hospitals and has delivered more than 500 academic speaking presentations. He is the author of numerous articles and textbook chapters, and is a long-time monthly columnist for Skin & Allergy News.