User login
Vitamin D deficiency in ethnic populations
Many clinicians are unaware that ethnic populations in North America do not achieve optimal serum 25-hydroxyvitamin D (abbreviated 25[OH]D) because of the increased pigmentation in their skin, which reduces vitamin D production. Vitamin D insufficiency is more prevalent among individuals with darker skin, compared with those with lighter skin at any time of year, even during the winter months. Contributing to the deficiency, the dietary intake of vitamin D intake among African Americans in particular is often below the recommended intakes in every age group after puberty. However, data have shown vitamin D protects against Sjögren’s syndrome, psoriasis, type 1 and type 2 diabetes, multiple sclerosis, and rheumatoid arthritis.
Vitamin D also may protect against cardiovascular disease through its anti-inflammatory effects and may reduce the risk for colorectal cancer, breast cancer, and prostate cancer by promoting cell differentiation and down-regulating hyperproliferative cell growth. Most of these conditions have been shown to be as prevalent, if not more prevalent, among blacks than whites.
While vitamin D can be obtained from sun exposure, this is not always a viable option. UV exposure is linked to skin cancer, which leads clinicians to encourage sun avoidance, but they may disregard the need for vitamin D. In addition, darker pigmentation of the skin reduces vitamin D synthesis in the skin.
How can you help your skin of color patients get enough vitamin D, especially in the winter? Nutritional sources of vitamin D include salmon, sardines, and cows’ milk; however, many individuals do not achieve optimal vitamin D status from food intake alone.
Since UV exposure and diet are not sufficient sources of vitamin D, supplementation has become crucial to our patients, particularly those with darker skin. Dietary reference intakes for vitamin D have been under considerable scrutiny, and many experts now believe that intakes of 25 mcg/d (1,000 IU) or more may be needed for most people to achieve optimal blood levels of 25(OH)D. The two forms of vitamin D used in dietary supplements are ergocalciferol (vitamin D2) and cholecalciferol (vitamin D3). Cholecalciferol, the D3 form of the vitamin, is the form of choice when supplementing with vitamin D. Types of D3 supplements include gel caps, liquid, powders, and tablets. Vitamin D is often measured in International Units (IU) or mcg. One mcg of cholecalciferol is equal to 40 IU of vitamin D.
The debate continues over the most effective forms of vitamin D acquisition; however, many health professionals agree that vitamin D supplementation, particularly in winter months, should be an integral part of our armamentarium of therapeutics for ethnic patients, and especially those who suffer from psoriasis and other autoimmune and inflammatory skin conditions.
Dr. Talakoub is in private practice in McLean, Va.
Do you have questions about treating patients with dark skin? If so, send them to [email protected].

Cost and response criteria are the new challenges
Although the concept of using immunotherapy to target an immune response against tumors is not new, this treatment modality is only now beginning to realize its full potential. Here, we take a look at the role of immunotherapy in cancer and some of the most exciting areas of clinical development.
*Click on the link to the left for a PDF of the full article.
Key issues in the management of gastrointestinal immune-related adverse events associated with ipilimumab administration
Ipilimumab is an anticytotoxic T lymphocyte antigen-4 (CTLA-4) monoclonal antibody that attenuates negative signaling from CTLA-4 and potentiates T-cell activation and proliferation. Two phase 3 randomized trials in advanced melanoma demonstrated a significant improvement in overall survival, the first of which led to regulatory approval in the United States and Europe for treatment of unresectable or metastatic melanoma. Ipilimumab administration is associated with immune-related adverse events (irAEs). Gastrointestinal (GI) irAEs are among the most common and although they are typically mild to moderate in severity, if they are left unrecognized or untreated, they can become life-threatening. These toxicities can be managed effectively in almost all patients by using established guidelines that stress vigilance and the use of corticosteroids and other immunosuppressive agents when necessary. The goal of this review is to educate physicians on the recognition and challenges associated with management of GI irAEs.
*Click on the link to the left for a PDF of the full article.
Multimodality therapy for uterine serous carcinoma and the association with overall and relapse-free survival
Objective To identify prognostic factors for overall survival (OS) and relapse-free survival (RFS) for patients with uterine serous carcinoma.
Methods From January 1, 2000 to January 1, 2010, 44 patients with uterine serous carcinoma were analyzed to determine prognostic and predictive factors for OS and RFS using the Kaplan-Meier product-limit method and log-rank tests.
Results Median follow-up was 4.1 years, median OS was 4.2 years, 2-year OS was 83% and decreased to 48% at 5 years. Two-year RFS was 82% and decreased to 75% at 5 years. Age, stage, tumor size, tumor not arising from a polyp, parametrial involvement, lymphovascular invasion, and no adjuvant treatment were prognostic factors associated with shorter OS. Higher stage and parametrial involvement were prognostic factors associated with shorter RFS. Combined adjuvant chemotherapy and radiation therapy was significantly associated with longer OS rates.
Conclusions Adjuvant chemotherapy and radiation therapy as well as tumors arising from a polyp are associated with increased overall survival in patients with uterine serous carcinoma. Early-stage disease is associated with increased relapse-free and overall survival. Adjuvant chemotherapy with a platinum and paclitaxol-based regimen and radiation therapy should be attempted in patients with uterine serous carcinoma.
*To read the full article, click on the PDF icon at the top of this introduction.
Enzastaurin no better than placebo in DLBCL

Convention Center, site of the
2013 ASH Annual Meeting
NEW ORLEANS—In a phase 3 study, patients with diffuse large B-cell lymphoma (DLBCL) who received post-induction therapy with enzastaurin saw no improvements in survival over patients who received placebo.
All patients were in their first remission after treatment with R-CHOP, but they were thought to have a high risk of relapse.
The patients who received 3 years of treatment with enzastaurin had similar rates of event-free survival (EFS), disease-free survival (DFS), and overall survival (OS) as patients who received placebo.
Michael Crump, MD, of Princess Margaret Cancer Centre in Toronto, Canada, reported these results at the 2013 ASH Annual Meeting as abstract 371.
Dr Crump noted that enzastaurin is a potent and selective inhibitor of PKCβ, the major isoform expressed in normal and malignant B cells. The kinase is required for signaling through the B-cell receptor, is necessary for activation of NF-κB, and is involved in VEGF-mediated angiogenesis.
“It was a little more than 10 years ago that Margaret Shipp and her colleagues demonstrated that overexpression of PKCβ mRNA and protein was associated with relapsed and fatal diffuse large B-cell lymphoma,” Dr Crump said.
“Since that time, other investigators have also shown that overexpression of either protein or mRNA is associated with a worse outcome in patients receiving CHOP chemotherapy as well as R-CHOP. So [PKCβ] seems to be a rational therapeutic target.”
With this in mind, Dr Crump and his colleagues conducted the phase 3 PRELUDE trial, comparing enzastaurin to placebo in DLBCL patients.
Patient population
The researchers enrolled 866 patients who had a complete response, unconfirmed complete response, or negative FDG-PET scan following treatment with R-CHOP14 or R-CHOP21.
The team randomized 758 of the patients to receive placebo or oral enzastaurin at 500 mg once daily, with a 1125 mg loading dose on day 1. A total of 263 patients in the enzastaurin arm and 129 patients in the placebo arm completed 3 years of treatment.
The rates of discontinuation were similar between the arms—46.7% (n=230) in the enzastaurin arm and 48.2% (n=120) in the placebo arm. In both groups, the most common reason for discontinuation was disease progression (n=103 and 60, respectively). Adverse events were the second most common reason (n=72 and 28, respectively).
Baseline characteristics were similar between the 2 groups. The median age was 64, most patients were Caucasian, most had an ECOG performance status of 0, most had stage IV disease, and more than half of the patients in each arm were PET-negative (although about 40% of patients in each arm did not have a PET scan).
Survival outcomes
The 2-year OS rate was 87% in the enzastaurin arm and 89% in the placebo arm. The 4-year OS rates were 81% and 82%, respectively. And the hazard ratio was 1.04 (P=0.807).
The 2-year EFS rate was 78% in the enzastaurin arm and 73% in the placebo arm. The 4-year EFS rates were 69% and 70%, respectively. And the hazard ratio was 0.90 (P=0.460).
The 2-year DFS rate was 79% in the enzastaurin arm and 75% in the placebo arm. The 4-year DFS rates were 70% and 71%, respectively. And the hazard ratio was 0.92 (P=0.541).
The researchers also assessed DFS according to cell of origin. And they found no difference between patients who had germinal center B-cell (GCB) DLBCL and patients who did not.
Overall, the hazard ratio for GCB vs non-GCB DLBCL was 0.92 (P=0.74). In the enzastaurin arm, the hazard ratio was 0.77 (P=0.40). And in the placebo arm, the hazard ratio was 1.31 (P=0.54).
“One would anticipate a drug that interferes with B-cell receptor signaling might have benefitted patients with tumors that are not of germinal center origin,” Dr Crump said. “Altogether, however . . ., there was actually no difference in GCB vs non-GCB, in terms of outcome.”
“Perhaps [the patients] being in a complete response is one of the reasons why we don’t actually see a difference in outcomes,” he added. “These are all patients who’ve had very good responses to their primary treatment.”
Adverse events
Dr Crump said there were a number of adverse events that could be related to enzastaurin treatment.
Chromaturia occurred in 18.5% of patients in the enzastaurin arm and 0.4% of patients in the placebo arm (P<0.001). Prolonged QT interval was an issue in 10.8% and 3.6%, respectively; diarrhea occurred in 10.3% and 2.8%, respectively; and discolored feces arose in 7.7% and 0%, respectively (P<0.001 for all).
Other adverse events (occurring in 5% of patients or greater) included neutropenia, rash, fatigue, and nausea. But the rates of these events were similar between the treatment arms.
Dr Crump noted that these results are consistent with the established safety profile of enzastaurin when it’s used as a single agent in lymphoma and other cancers. ![]()
Letters to the Editor
Mohamed‐Kalib et al. illustrate 2 important caveats to penicillin skin testing (PST): (1) there is an exceptionally rare potential for resensitization, a phenomenon in which a previously reactive patient is proven tolerant, then develops sensitivity and has a positive PST; (2) consider repeating PST prior to a parenteral ‐lactam prescription in patients who previously reported severe anaphylactic reactions.
Our negative predictive value of 100% does not abate the tentative concern for resensitization.[1] Similar to the likelihood of becoming allergic initially, 0% to 3.2% of PST‐negative patients can become allergic again, more commonly with parenteral therapy and among children.[2, 3, 4]
The author describes a seemingly resensitized patient who reacted in an outpatient setting. Theoretically, anyone could resensitize, regardless of their setting or whether a single dose or full course was given after the PST. Individuals with a proven tolerance by PST and repeated courses are at a very low risk of future immunoglobulin E‐mediated reactions, a risk similar to that of the general population.
Whether previously reactive or not, patients receiving medicinal therapies should always be monitored for allergic reactions. Although PST may not be prudent in the minority of patients who report recent or severe reactions, a repeat PST prior to prescribing parenteral ‐lactam may potentially avoid instances described by Mohamed‐Kalib et al.
- , , , et al. The impact of penicillin skin testing on clinical practice and antimicrobial stewardship. J Hosp Med. 2013;8(6):342–345.
- , , . Lack of penicillin resensitization in patients with a history of penicillin allergy after receiving repeated penicillin courses. Arch Intern Med. 2002;162(7):822–826.
- . Elective penicillin skin testing and amoxicillin challenge: effect on outpatient antibiotic use, cost, and clinical outcomes. J Allergy Clin Immunol. 1998;102(2):281–285.
- , . Drug allergy: an updated practice parameter. Ann Allergy Asthma Immunol. 2010;105(4):259–273.
Mohamed‐Kalib et al. illustrate 2 important caveats to penicillin skin testing (PST): (1) there is an exceptionally rare potential for resensitization, a phenomenon in which a previously reactive patient is proven tolerant, then develops sensitivity and has a positive PST; (2) consider repeating PST prior to a parenteral ‐lactam prescription in patients who previously reported severe anaphylactic reactions.
Our negative predictive value of 100% does not abate the tentative concern for resensitization.[1] Similar to the likelihood of becoming allergic initially, 0% to 3.2% of PST‐negative patients can become allergic again, more commonly with parenteral therapy and among children.[2, 3, 4]
The author describes a seemingly resensitized patient who reacted in an outpatient setting. Theoretically, anyone could resensitize, regardless of their setting or whether a single dose or full course was given after the PST. Individuals with a proven tolerance by PST and repeated courses are at a very low risk of future immunoglobulin E‐mediated reactions, a risk similar to that of the general population.
Whether previously reactive or not, patients receiving medicinal therapies should always be monitored for allergic reactions. Although PST may not be prudent in the minority of patients who report recent or severe reactions, a repeat PST prior to prescribing parenteral ‐lactam may potentially avoid instances described by Mohamed‐Kalib et al.
- , , , et al. The impact of penicillin skin testing on clinical practice and antimicrobial stewardship. J Hosp Med. 2013;8(6):342–345.
- , , . Lack of penicillin resensitization in patients with a history of penicillin allergy after receiving repeated penicillin courses. Arch Intern Med. 2002;162(7):822–826.
- . Elective penicillin skin testing and amoxicillin challenge: effect on outpatient antibiotic use, cost, and clinical outcomes. J Allergy Clin Immunol. 1998;102(2):281–285.
- , . Drug allergy: an updated practice parameter. Ann Allergy Asthma Immunol. 2010;105(4):259–273.
Treatment and Outcomes of SPFD
Over the past decade, the use of chest computed tomography scans with pulmonary angiography (CTPA) for diagnosis of pulmonary embolism (PE) has soared due to the ease of acquisition, the desire for the additional information that CT scanning may provide, and heightened sensitivity to medical liability.[1, 2, 3, 4, 5, 6] In parallel with this shift, the incidence of PE has nearly doubled, despite no recorded increase in the pretest probability of the disease, increasing from 62 per 100,000 to 112 per 100,000 during the period of 1993 to 2006.6 One major explanation for this increase is that the improvement in CTPA resolution has enabled radiologists to identify more small peripheral (ie, segmental and subsegmental) filling defects. When confronted with the finding of a small peripheral filling defect on CTPA, clinicians often face a management quandary. Case series and retrospective series on outcomes of these patients do not support treatment, but they are limited by having small numbers of patients; the largest examined 93 patients and provided no insight into the treatment decision.[7] Uncertainty exists, furthermore, about the pathologic meaning of small peripheral filling defects.[8] Clinicians must weigh these arguments and the risk of anticoagulation against concerns about the consequences of untreated pulmonary thromboemboli. More information is needed, therefore, on the outcomes of patients with peripheral filling defects, and on variables impacting the treatment decision, in order to help clinicians manage these patients.[9]
In this study, we analyzed cases of patients with a single peripheral filling defect (SPFD). We choose to look at patients with a SPFD because they represent the starkest decision‐making treatment dilemma and are not infrequent. We assessed the 90‐day mortality and rate of postdischarge venous thromboembolism (VTE) of treated and untreated patients and identified characteristics of treated and untreated patients with a SPFD. We wished to determine the incidence of SPFD among patients evaluated with CTPA and to determine how often the defect is called a PE by the radiologist. We also aimed to determine what role secondary studies play in helping to clarify the diagnosis and management of SPFD and to identify other factors that may influence the decision to treat patients with this finding.
METHODS
Site
This retrospective cohort study was conducted at a community hospital in Norwalk, CT. The hospital is a 328‐bed, not‐for‐profit, acute‐care community teaching hospital that serves a population of 250,000 in lower Fairfield County, Connecticut, and is affiliated with the Yale School of Medicine.
Subjects
The reports of all CTPAs done over a 66‐month period from 2006 to 2010 were individually reviewed. Any study that had a filling defect reported in the body of the radiology report was selected for initial consideration. A second round of review was conducted, extracting only CTPAs with a SPFD for study inclusion. We then excluded from the primary analysis those studies in which the patient had a concurrently positive lower‐extremity ultrasound, the medical records could not be located, and the patient age was <18 years. The study was approved by the investigational review board of the hospital.
Radiographic Methods
The CTPAs were performed using the SOMATOM Definition scanner, a 128‐slice CT scanner with 0.5‐cm collimation (Siemens, Erlangen, Germany). The CT‐scanner technology did not change over the 66 months of the study period.
Data Collection
Clinical data were abstracted from the physical charts and from the computerized practitioner order‐entry system (PowerChart electronic medical record system; Cerner Corp, Kansas City, MO). Three abstractors were trained in the process of chart abstraction using training sets of 10 records. The Fleiss was used to assess concordance. The Fleiss was 0.6 at the initial training set, and after 3 training sets it improved to 0.9. In‐hospital all‐cause mortality was determined using the hospital death records, and out‐of‐hospital mortality data were obtained from the online statewide death records.[10] Postdischarge VTE was assessed by interrogating the hospital radiology database for repeat ventilation perfusion scan, conventional pulmonary angiography, lower‐limb compression ultrasound (CUS) or CTPA studies that were positive within 90 days of the index event. Treatment was defined as either anticoagulation, ascertained from medication list at discharge, or inferior vena cava (IVC) filter placement, documented at the index visit.
To better understand the variation in interpretation of SPFD, all CTPA studies that showed a SPFD were also over‐read by 2 radiologists who reached a consensus opinion regarding whether the finding was a PE. The radiologists who over‐read the studies were blinded to the final impression of the initial radiologist. Our study group comprised 3 radiologists; 1 read <20% of the initial studies and the other 2 had no input in the initial readings. One of the radiologists was an attending and the other 2 were fourth‐year radiology residents.
Baseline Variables and Outcome Measures
A peripheral filling defect was defined as a single filling defect located in either the segmental or subsegmental pulmonary artery. The primary variables of interest were patient demographics (age, sex, and race), insurance status, the presence of pulmonary input in the management of the patient, history of comorbid conditions (prior VTE, congestive heart failure, chronic lung disease, pulmonary hypertension, coronary artery disease, surgery within the last 6 months, active malignancy, and acute pulmonary edema or syncope at presentation) and risk class as assessed by the Pulmonary Embolism Severity Index (PESI) score.[11] The PESI scoring system is a risk‐stratification tool for patients with acute PE. It uses 11 prognostic variables to predict in‐hospital and all‐cause mortality: age, sex, heart rate 110 bpm, systolic blood pressure <90 mm Hg, congestive heart failure, presence of malignancy, chronic lung disease, respiratory rate <30/minute, temperature <36C, altered mental status, and oxygen saturation <90%. Additional variables of interest were the proportion of patients in the treated and untreated arms who had a pulmonary consultation at the index visit and the role, if any, of a second test for VTE at the index visit. The primary outcomes investigated were all‐cause 90‐day mortality and 90‐day incidence of postdischarge VTE from the index visit in the treated and untreated groups. Those patients whose studies had a SPFD that was concluded by the initial radiologist to be a PE on the final impression of the report were analyzed as a subgroup.
Statistical Analysis
Bivariate analysis was conducted to compare patient baseline characteristics between treated and untreated groups. The 2 test was used for comparing binary or categorical variables and the Student t test was used for comparing continuous variables. A logistic regression model utilizing the Markov chain Monte Carlo (MCMC) method was employed for assessing the differences in 90‐day mortality and 90‐day postdischarge VTE between the treated group and untreated group, adjusting for patient baseline characteristics. This model was also used for identifying factors associated with the decision to treat. We reported the odds ratio (OR) and its corresponding 95% confidence interval (CI) for each estimate identified from the model. All analyses were conducted using SAS version 9.3 64‐bit software (SAS Institute Inc, Cary, NC).
RESULTS
A total of 4906 CTPAs were screened during the 66 months reviewed, identifying 518 (10.6%) with any filling defect and 153 (3.1%) with a SPFD. Thirteen patients were excluded from the primary analysis because their records could not be located, and another 6 were excluded because they had a concurrently positive CUS. The primary analysis was performed, therefore, with 134 patients. The inpatient service ordered 78% of the CTPAs. The initial radiologist stated in the impression section of the report that a PE was present in 99 of 134 (73.9%) studies. On over‐read of the 134 studies, 100 of these were considered to be positive for a PE. There was modest agreement between the initial impression and the consensus impression at over‐read (=0.69).
Association of Treatment With Mortality and Recurrence
In the primary‐analysis group, 61 (45.5%) patients were treated: 50 patients had warfarin alone, 10 patients had an IVC filter alone, and 1 patient had both warfarin and an IVC filter. No patient was treated solely with low‐molecular‐weight heparin long‐term. Whenever low‐molecular‐weight heparin was used, it was as a bridge to warfarin. The characteristics of the patients in the treatment groups were similar (Table 1). Four of the treated patients had a CTPA with SPFD that was not called a PE in the initial reading. Ten patients died, 5 each in the treated and untreated groups, yielding an overall mortality rate at 90 days of 7.4% (Table 2). Analysis of the 134 patients showed no difference in adjusted 90‐day mortality between treated and untreated groups (OR: 1.0, 95% CI: 0.25‐3.98). The number of patients with postdischarge VTE within 90 days was 5 of 134 (3.7%) patients, 3 treated and 2 untreated, and too few to show a treatment effect. Among the 99 cases considered by the initial radiologist to be definite for a PE, 59 (59.6%) were treated and 40 (40.4%) untreated. In this subgroup, no mortality benefit was observed with treatment (OR: 1.42, 95% CI: 0.28‐8.05).
| Characteristic | Treated, n=61 | Untreated, n=73 | P Value |
|---|---|---|---|
| |||
| Age, y, mean (SD) | 67 (20) | 62 (21) | 0.056 |
| Sex, M | 29 (48) | 34 (47) | 0.831 |
| Race/ethnicity | 0.426 | ||
| White | 43 (70) | 57 (78) | |
| Black | 12 (20) | 8 (11) | |
| Hispanic | 6 (10) | 7 (10) | |
| Other | 0 | 1 (2) | |
| Primary insurance | 0.231 | ||
| Medicare | 30 (50) | 29 (40) | |
| Medicaid | 2 (3) | 8 (11) | |
| Commercial | 27 (44) | 30 (41) | |
| Self‐pay | 2 (3) | 6 (8) | |
| Pulmonary consultation | 29 (48) | 28 (38) | 0.482 |
| Comorbid illnesses | 0.119 | ||
| Cancera | 13 (21) | 17 (23) | |
| Surgery/traumab | 16 (26) | 2 (3) | |
| Chronic lung disease | 17 (28) | 15 (21) | |
| CHF | 12 (20) | 9 (12) | |
| Ischemic heart disease | 12 (20) | 7 (10) | |
| Pulmonary hypertension | 0 | 1 (1) | |
| Collagen vascular disease | 1 (2) | 2 (3) | |
| PESI classc | 0.840 | ||
| I | 15 (25) | 24 (33) | |
| II | 13 (21) | 16 (22) | |
| III | 12 (20) | 13 (18) | |
| IV | 9 (15) | 8 (11) | |
| V | 12 (20) | 12 (16) | |
| Treatment | Combined Outcome | 90‐Day All‐Cause Mortality | 90‐Day All‐Cause Recurrence | |||
|---|---|---|---|---|---|---|
| Death or Recurrent VTE, n (% All Patients) | Adjusted OR for Combined Outcome (95% CI)a | Mortality, n (% All Patients) | Adjusted OR (95% CI)a | Recurrence, n (% All Patients) | Adjusted OR (95% CI)a | |
| ||||||
| Any treatment, n=61 | 8 (6.0) | 1.50 (0.435.20) | 5 (3.7) | 1.00 (0.253.98) | 3 (2.2) | 1.10 (0.129.92) |
| Warfarin, n=51 | 5 (3.7) | 0.75 (0.202.85) | 2 (1.5) | 0.26 (0.041.51) | 3 (2.2) | 2.04 (0.2318.04) |
| IVC filter, n=10 | 3 (2.2) | 5.77 (1.2227.36) | 3 (2.2) | 10.60 (2.1053.56) | 0 | NA |
| None, n=73 | 7 (5.2) | Referent | 5 (3.7) | Referent | 2 (1.5%) | Referent |
Use of Secondary Diagnostic Tests
A CUS was performed on 42 of the 153 patients (27%) with studies noting a SPFD. Six CUSs were positive, with 5 of the patients receiving anticoagulation and the sixth an IVC filter. A second lung‐imaging study was done in 10 (7%) of the 134 patients in the primary‐analysis group: 1 conventional pulmonary angiogram that was normal and 9 ventilation‐perfusion scans, among which 4 were normal, 2 were intermediate probability for PE, 2 were low probability for PE, and 1 was very low probability for PE. The 2 patients whose scans were read as intermediate probability and 1 patient whose scan was read as low probability was treated, and none of the patients with normal scans received treatment. None of these 10 patients died or had a postdischarge VTE during the 90‐day follow‐up period.
Factors Associated With Treatment
In the risk‐adjusted model, patient characteristics associated with treatment were immobility, previous VTE, and acute mental‐status change (Table 3). When the radiologist concluded that the SPFD was a PE, there was a highly increased likelihood of being treated. These factors were selected based on the MCMC simulation and the final model had a goodness‐of‐fit P value of 0.69, indicating it was fitted well. Vital‐sign abnormalities, comorbid illnesses, history of cancer, ethnicity, insurance status, and the presence of pulmonary consultation were not associated with the decision to treat. The 3 patient factorsimmobility, previous VTE, and absence of mental‐status changecombined with the initial impression of the radiologist, were strongly predictive of the decision to treat (C statistic: 0.87). None of the subset of patients who had a negative CUS and normal or very low probability ventilation‐perfusion scan received treatment. Eighty of the 134 (60%) patients had an active malignancy, chronic lung disease, heart failure, or evidence of ischemic heart disease; all 10 patients who died were from this subset of patients.
| Factors | Adjusted OR | 95% CI | Probability of Being Statistically Associated With the Decision to Treat |
|---|---|---|---|
| |||
| Immobility | 3.9 | 1.4510.6 | 0.78 |
| Acute mental‐status change | 0.14 | 0.020.84 | 0.64 |
| Initial impression of radiologist | 24.68 | 5.4112.89 | 0.86 |
| Prior VTE | 3.72 | 1.1811.67 | 0.70 |
DISCUSSION
This very large retrospective study examines treatment and outcomes in patients with a SPFD. We found that SPFDs were common, showing up in approximately 3% of all the CTPAs performed. Among the studies that were deemed positive for PE, SPFD comprised nearly one‐third. Treatment of SPFD, whether concluded as PE or not, was not associated with a mortality benefit or difference in postdischarge VTE within 90 days. Our results add to the weight of smaller case‐control and retrospective series that also found no benefit from treating small PE.[7, 12, 13, 14, 15]
Given this data, why might physicians choose to treat? Physicians may feel compelled to anticoagulate due to extrapolation of data from the early studies showing a fatality rate of up to 30% in untreated PE.[2] Also, physicians may harbor the concern that, though small emboli may pose no immediate danger, they serve as a marker of hypercoagulability and as such are a harbinger of subsequent large clots. A reflexive treatment response to the radiologist's conclusion that the filling defect is a PE may also play a part. Balancing this concern is the recognition that the treatment for acute PE is not benign. The age‐adjusted incidence of major bleeding (eg, gastrointestinal or intracranial) with warfarin has increased by 71%, from 3.1 to 5.3 per 100,000, since the introduction of CTPA.[6] Also, as seen in this study, a substantial percentage of patients will incur the morbidity and cost of IVC‐filter placement.
When physicians face management uncertainty, they consider risk factors for the condition investigated, consult experts, employ additional studies, and weigh patient preference. In this study, history of immobility and VTE were, indeed, positively associated with treatment, but change in mental status was negatively so. Given that the PESI score is higher with change in mental status, this finding is superficially paradoxical but unsurprising. Mental‐status change could not likely stem from a SPFD and its presence heightens the risks of anticoagulation, hence dissuading treatment. Pulmonary consultations were documented in less than half of the cases and did not clearly sway the treatment decision. Determining whether more patients would have been treated if pulmonologists were not involved would require a prospective study.
The most important association with treatment was how the radiologist interpreted the SPFD. Even then, the influence of the radiologist's interpretation was far from complete: 40% of the cases in which PE was called went untreated, and 4 cases received treatment despite PE not being called. The value of the radiologist's interpretation is further undercut by the modest interobserver agreement found on over‐read, which is line with previous reports and reflective of lack of a gold standard for diagnosing isolated peripheral PE.[3, 12, 16]
Even if radiologists could agree upon what they are seeing, the question remains about the pathological importance. Unrecognized PE incidental to the cause of death are commonly found at autopsy. Autopsy studies reveal that up to 52% to 64% of patients have PE; and, if multiple blocks of lung tissue are studied, the prevalence increases up to 90%.[17, 18] In the series by Freiman et al., 59% of the identified thrombi were small enough not to be recognized on routine gross examination.[17] Furthermore, an unknown percentage of small clots, especially in the upper lobes, are in situ thrombi rather than emboli.[18] In the case of small dot‐like clots, Suh and colleagues have speculated that they represent normal embolic activity from the lower limbs, which are cleared routinely by the lung serving in its role as a filter.[19] Although our study only examined SPFD, the accumulation of small emboli could have pathologic consequences. In their review, Gali and Kim reported that 12% of patients with chronic thromboembolic pulmonary hypertension who underwent pulmonary endarterectomy had disease confined to the distal segmental and subsegmental arteries.[13]
Use of secondary studies could mitigate some of the diagnostic and management uncertainty, but they were obtained in only about a quarter of the cases. The use of a second lung‐imaging study following CTPA is not recommended in guidelines or diagnostic algorithms, but in our institution a significant minority of physicians were employing these tests to clarify the nature of the filling defects.[20] Tapson, speaking to the treatment dilemma that small PEs present, has suggested that prospective trials on this topic employ tests that investigate risk for poor outcome if untreated including cardiopulmonary reserve, D‐dimer, and presence of lower‐limb thrombus.[21] Indeed, a study is ongoing examining the outcome at 90 days of patients with single or multiple subsegmental embolism with negative CUS.[22]
Ten of the 134 patients (7.4%) with peripheral filling defects died within 90 days. It is difficult to establish whether these deaths were PE‐specific mortalities because there was a high degree of comorbid illness in this cohort. Five of the 134 (3.7%) had recurrent VTE, which is comparable to the outcomes in other studies.[23]
There are limitations to this study. This study is the first to limit analysis of the filling defects to single defects in the segmental or subsegmental pulmonary arteries. This subset of patients includes those with the least clot burden, therefore representing the starkest decision‐making treatment dilemma, and the incidence of these clots is not insignificant. As a retrospective study, we could not fully capture all of the considerations that may have factored into the clinicians' decision‐making regarding treatment, including patient preference. Because of inadequate documentation, especially in the emergency department notes, we were unable to calculate pretest probability. Also, we cannot exclude that subclinical VTEs were occurring that would later harm the patients. We did not analyze the role of D‐dimer testing because that test is validated to guide the decision to obtain lung‐imaging studies and not to inform the treatment decision. In our cohort, 89 of 134 (66%) of our patients were already hospitalized for other diagnoses prior to PE being queried. Moreover, many of these patients had active malignancy or were being treated for pneumonia, which would decrease the positive predictive value of the D‐dimer test. D‐dimer performs poorly when used for prognosis.[24] This is a single‐center study, therefore the comparability of our findings to other centers may be an issue, although our findings generally accord with those from other single‐center studies.[7, 12, 24, 25] We determined the recurrence rate from the hospital records and could have missed cases diagnosed elsewhere. However, our hospital is the only one in the city and serves the vast majority of patients in the area, and 88% of our cohort had a repeat visit to our hospital subsequently. In addition, the radiology service is the only one in the area that provides outpatient CUS, CTPA, and ventilation‐perfusion scan studies. Our study is the largest to date on this issue. However, our sample size is somewhat modest, and consequently the factors associated with treatment have large confidence intervals. We are therefore constrained in recommending empiric application of our findings. Nonetheless, our results in terms of no difference in mortality and recurrence between treated and untreated patients are in keeping with other studies on this topic. Also, our simulation analysis did reveal factors that were highly associated with the decision to treat. These findings as a whole strongly point to the need for a larger study on this issue, because, as we and other authors have argued, the consequences of treatment are not benign.[6]
In conclusion, this study shows that SPFDs are common and that there was no difference in 90‐day mortality between treated and untreated patients, regardless of whether the defects were interpreted as PE or not. Physicians appear to rely heavily on the radiologist's interpretation for their treatment decision, but they will also treat when the interpretation is not PE and not infrequently abstain when it is. Treatment remains common despite the modest agreement among radiologists whether the peripheral filling defect even represents PE. When secondary imaging studies are obtained and negative, physicians forgo treatment. Larger studies are needed to help clarify our findings and should include decision‐making algorithms that include secondary imaging studies, because these studies may provide enough reassurance when negative to sway physicians against treatment.
Disclosure
Nothing to report.
- , , . The mortality of untreated pulmonary embolism in emergency department patients. Ann Emerg Med. 2005;45:302–310.
- . Pulmonary embolism: what have we learned since Virchow? Natural history, pathophysiology, and diagnosis. Chest. 2002;122:1400–1456.
- , , , et al. Subsegmental pulmonary emboli: improved detection with thin‐collimation multi‐detector row spiral CT. Radiology. 2002;222:483–490.
- , , . Trends in the use of diagnostic imaging in patients hospitalized with acute pulmonary embolism. Am J Cardiol. 2004;93:1316–1317.
- , , , , . The effect of helical computed tomography on diagnostic and treatment strategies in patients with suspected pulmonary embolism. Am J Med. 2004;116:84–90.
- , , . Time trends in pulmonary embolism in the United States: evidence of overdiagnosis. Arch Intern Med. 2011;171:831–837.
- , , , . Clinical outcomes in patients with isolated subsegmental pulmonary emboli diagnosed by multidetector CT pulmonary angiography. Thromb Res. 2010;126:e266–e270.
- , , , et al. Guidelines on the diagnosis and management of acute pulmonary embolism: the Task Force for the Diagnosis and Management of Acute Pulmonary Embolism of the European Society of Cardiology (ESC). Eur Heart J. 2008;29:2276–2315.
- , , , , . Diagnosis and management of isolated subsegmental pulmonary embolism: review and assessment of the options. Clin Appl Thromb Hemost. 2012;18:20–26.
- Intelius. Available at: http://www.intelius.com. Accessed September 30, 2010.
- , , . The validation and reproducibility of the pulmonary embolism severity index. J Thromb Haemost. 2010;8:1509–1514.
- , , . Clinicians' response to radiologists' reports of isolated subsegmental pulmonary embolism or inconclusive interpretation of pulmonary embolism using MDCT. AJR Am J Roentgenol. 2005;184:623–628.
- , . Pulmonary microvascular disease in chronic thromboembolic pulmonary hypertension. Proc Am Thorac Soc. 2006;3:571–576.
- . Small pulmonary emboli: what do we know? Radiology. 2005;234:654–658.
- , , . Reassessment of pulmonary angiography for the diagnosis of pulmonary embolism: relation of interpreter agreement to the order of the involved pulmonary arterial branch. Radiology. 1999;210:689–691.
- , . Helical CT for the evaluation of acute pulmonary embolism. AJR Am J Roentgenol. 2005;185:135–149.
- , , . Frequency of pulmonary thromboembolism in man. N Engl J Med. 1965;272:1278–1280.
- . Pathology of pulmonary thromboembolism. Chest. 1995;107(1 suppl):10S–17S.
- , , . Dots are not clots: the over‐diagnosis and over‐treatment of PE. Emerg Radiol. 2010;17:347–352.
- , , . Current approach to the diagnosis of acute nonmassive pulmonary embolism. Chest. 2011;140:509–518.
- . Acute pulmonary embolism: comment on “time trends in pulmonary embolism in the United States.” Arch Intern Med. 2011;171:837–839.
- National Institutes of Health, ClinicalTrials.gov; Carrier M. A study to evaluate the safety of withholding anticoagulation in patients with subsegmental PE who have a negative serial bilateral lower extremity ultrasound (SSPE). ClinicalTrials.gov identifier: NCT01455818.
- , , . Untreated patients with pulmonary embolism: outcome, clinical, and laboratory assessment. Chest. 1995;107:931–935.
- , , , , , . Prognostic value of D‐dimer in stable patients with pulmonary embolism. Clin Appl Thromb Hemost. 2011;17:E183–E185.
- , , , , . Diagnosis and management of subsegmental pulmonary embolism. J Thromb Hemost. 2006;4:724–731.
Over the past decade, the use of chest computed tomography scans with pulmonary angiography (CTPA) for diagnosis of pulmonary embolism (PE) has soared due to the ease of acquisition, the desire for the additional information that CT scanning may provide, and heightened sensitivity to medical liability.[1, 2, 3, 4, 5, 6] In parallel with this shift, the incidence of PE has nearly doubled, despite no recorded increase in the pretest probability of the disease, increasing from 62 per 100,000 to 112 per 100,000 during the period of 1993 to 2006.6 One major explanation for this increase is that the improvement in CTPA resolution has enabled radiologists to identify more small peripheral (ie, segmental and subsegmental) filling defects. When confronted with the finding of a small peripheral filling defect on CTPA, clinicians often face a management quandary. Case series and retrospective series on outcomes of these patients do not support treatment, but they are limited by having small numbers of patients; the largest examined 93 patients and provided no insight into the treatment decision.[7] Uncertainty exists, furthermore, about the pathologic meaning of small peripheral filling defects.[8] Clinicians must weigh these arguments and the risk of anticoagulation against concerns about the consequences of untreated pulmonary thromboemboli. More information is needed, therefore, on the outcomes of patients with peripheral filling defects, and on variables impacting the treatment decision, in order to help clinicians manage these patients.[9]
In this study, we analyzed cases of patients with a single peripheral filling defect (SPFD). We choose to look at patients with a SPFD because they represent the starkest decision‐making treatment dilemma and are not infrequent. We assessed the 90‐day mortality and rate of postdischarge venous thromboembolism (VTE) of treated and untreated patients and identified characteristics of treated and untreated patients with a SPFD. We wished to determine the incidence of SPFD among patients evaluated with CTPA and to determine how often the defect is called a PE by the radiologist. We also aimed to determine what role secondary studies play in helping to clarify the diagnosis and management of SPFD and to identify other factors that may influence the decision to treat patients with this finding.
METHODS
Site
This retrospective cohort study was conducted at a community hospital in Norwalk, CT. The hospital is a 328‐bed, not‐for‐profit, acute‐care community teaching hospital that serves a population of 250,000 in lower Fairfield County, Connecticut, and is affiliated with the Yale School of Medicine.
Subjects
The reports of all CTPAs done over a 66‐month period from 2006 to 2010 were individually reviewed. Any study that had a filling defect reported in the body of the radiology report was selected for initial consideration. A second round of review was conducted, extracting only CTPAs with a SPFD for study inclusion. We then excluded from the primary analysis those studies in which the patient had a concurrently positive lower‐extremity ultrasound, the medical records could not be located, and the patient age was <18 years. The study was approved by the investigational review board of the hospital.
Radiographic Methods
The CTPAs were performed using the SOMATOM Definition scanner, a 128‐slice CT scanner with 0.5‐cm collimation (Siemens, Erlangen, Germany). The CT‐scanner technology did not change over the 66 months of the study period.
Data Collection
Clinical data were abstracted from the physical charts and from the computerized practitioner order‐entry system (PowerChart electronic medical record system; Cerner Corp, Kansas City, MO). Three abstractors were trained in the process of chart abstraction using training sets of 10 records. The Fleiss was used to assess concordance. The Fleiss was 0.6 at the initial training set, and after 3 training sets it improved to 0.9. In‐hospital all‐cause mortality was determined using the hospital death records, and out‐of‐hospital mortality data were obtained from the online statewide death records.[10] Postdischarge VTE was assessed by interrogating the hospital radiology database for repeat ventilation perfusion scan, conventional pulmonary angiography, lower‐limb compression ultrasound (CUS) or CTPA studies that were positive within 90 days of the index event. Treatment was defined as either anticoagulation, ascertained from medication list at discharge, or inferior vena cava (IVC) filter placement, documented at the index visit.
To better understand the variation in interpretation of SPFD, all CTPA studies that showed a SPFD were also over‐read by 2 radiologists who reached a consensus opinion regarding whether the finding was a PE. The radiologists who over‐read the studies were blinded to the final impression of the initial radiologist. Our study group comprised 3 radiologists; 1 read <20% of the initial studies and the other 2 had no input in the initial readings. One of the radiologists was an attending and the other 2 were fourth‐year radiology residents.
Baseline Variables and Outcome Measures
A peripheral filling defect was defined as a single filling defect located in either the segmental or subsegmental pulmonary artery. The primary variables of interest were patient demographics (age, sex, and race), insurance status, the presence of pulmonary input in the management of the patient, history of comorbid conditions (prior VTE, congestive heart failure, chronic lung disease, pulmonary hypertension, coronary artery disease, surgery within the last 6 months, active malignancy, and acute pulmonary edema or syncope at presentation) and risk class as assessed by the Pulmonary Embolism Severity Index (PESI) score.[11] The PESI scoring system is a risk‐stratification tool for patients with acute PE. It uses 11 prognostic variables to predict in‐hospital and all‐cause mortality: age, sex, heart rate 110 bpm, systolic blood pressure <90 mm Hg, congestive heart failure, presence of malignancy, chronic lung disease, respiratory rate <30/minute, temperature <36C, altered mental status, and oxygen saturation <90%. Additional variables of interest were the proportion of patients in the treated and untreated arms who had a pulmonary consultation at the index visit and the role, if any, of a second test for VTE at the index visit. The primary outcomes investigated were all‐cause 90‐day mortality and 90‐day incidence of postdischarge VTE from the index visit in the treated and untreated groups. Those patients whose studies had a SPFD that was concluded by the initial radiologist to be a PE on the final impression of the report were analyzed as a subgroup.
Statistical Analysis
Bivariate analysis was conducted to compare patient baseline characteristics between treated and untreated groups. The 2 test was used for comparing binary or categorical variables and the Student t test was used for comparing continuous variables. A logistic regression model utilizing the Markov chain Monte Carlo (MCMC) method was employed for assessing the differences in 90‐day mortality and 90‐day postdischarge VTE between the treated group and untreated group, adjusting for patient baseline characteristics. This model was also used for identifying factors associated with the decision to treat. We reported the odds ratio (OR) and its corresponding 95% confidence interval (CI) for each estimate identified from the model. All analyses were conducted using SAS version 9.3 64‐bit software (SAS Institute Inc, Cary, NC).
RESULTS
A total of 4906 CTPAs were screened during the 66 months reviewed, identifying 518 (10.6%) with any filling defect and 153 (3.1%) with a SPFD. Thirteen patients were excluded from the primary analysis because their records could not be located, and another 6 were excluded because they had a concurrently positive CUS. The primary analysis was performed, therefore, with 134 patients. The inpatient service ordered 78% of the CTPAs. The initial radiologist stated in the impression section of the report that a PE was present in 99 of 134 (73.9%) studies. On over‐read of the 134 studies, 100 of these were considered to be positive for a PE. There was modest agreement between the initial impression and the consensus impression at over‐read (=0.69).
Association of Treatment With Mortality and Recurrence
In the primary‐analysis group, 61 (45.5%) patients were treated: 50 patients had warfarin alone, 10 patients had an IVC filter alone, and 1 patient had both warfarin and an IVC filter. No patient was treated solely with low‐molecular‐weight heparin long‐term. Whenever low‐molecular‐weight heparin was used, it was as a bridge to warfarin. The characteristics of the patients in the treatment groups were similar (Table 1). Four of the treated patients had a CTPA with SPFD that was not called a PE in the initial reading. Ten patients died, 5 each in the treated and untreated groups, yielding an overall mortality rate at 90 days of 7.4% (Table 2). Analysis of the 134 patients showed no difference in adjusted 90‐day mortality between treated and untreated groups (OR: 1.0, 95% CI: 0.25‐3.98). The number of patients with postdischarge VTE within 90 days was 5 of 134 (3.7%) patients, 3 treated and 2 untreated, and too few to show a treatment effect. Among the 99 cases considered by the initial radiologist to be definite for a PE, 59 (59.6%) were treated and 40 (40.4%) untreated. In this subgroup, no mortality benefit was observed with treatment (OR: 1.42, 95% CI: 0.28‐8.05).
| Characteristic | Treated, n=61 | Untreated, n=73 | P Value |
|---|---|---|---|
| |||
| Age, y, mean (SD) | 67 (20) | 62 (21) | 0.056 |
| Sex, M | 29 (48) | 34 (47) | 0.831 |
| Race/ethnicity | 0.426 | ||
| White | 43 (70) | 57 (78) | |
| Black | 12 (20) | 8 (11) | |
| Hispanic | 6 (10) | 7 (10) | |
| Other | 0 | 1 (2) | |
| Primary insurance | 0.231 | ||
| Medicare | 30 (50) | 29 (40) | |
| Medicaid | 2 (3) | 8 (11) | |
| Commercial | 27 (44) | 30 (41) | |
| Self‐pay | 2 (3) | 6 (8) | |
| Pulmonary consultation | 29 (48) | 28 (38) | 0.482 |
| Comorbid illnesses | 0.119 | ||
| Cancera | 13 (21) | 17 (23) | |
| Surgery/traumab | 16 (26) | 2 (3) | |
| Chronic lung disease | 17 (28) | 15 (21) | |
| CHF | 12 (20) | 9 (12) | |
| Ischemic heart disease | 12 (20) | 7 (10) | |
| Pulmonary hypertension | 0 | 1 (1) | |
| Collagen vascular disease | 1 (2) | 2 (3) | |
| PESI classc | 0.840 | ||
| I | 15 (25) | 24 (33) | |
| II | 13 (21) | 16 (22) | |
| III | 12 (20) | 13 (18) | |
| IV | 9 (15) | 8 (11) | |
| V | 12 (20) | 12 (16) | |
| Treatment | Combined Outcome | 90‐Day All‐Cause Mortality | 90‐Day All‐Cause Recurrence | |||
|---|---|---|---|---|---|---|
| Death or Recurrent VTE, n (% All Patients) | Adjusted OR for Combined Outcome (95% CI)a | Mortality, n (% All Patients) | Adjusted OR (95% CI)a | Recurrence, n (% All Patients) | Adjusted OR (95% CI)a | |
| ||||||
| Any treatment, n=61 | 8 (6.0) | 1.50 (0.435.20) | 5 (3.7) | 1.00 (0.253.98) | 3 (2.2) | 1.10 (0.129.92) |
| Warfarin, n=51 | 5 (3.7) | 0.75 (0.202.85) | 2 (1.5) | 0.26 (0.041.51) | 3 (2.2) | 2.04 (0.2318.04) |
| IVC filter, n=10 | 3 (2.2) | 5.77 (1.2227.36) | 3 (2.2) | 10.60 (2.1053.56) | 0 | NA |
| None, n=73 | 7 (5.2) | Referent | 5 (3.7) | Referent | 2 (1.5%) | Referent |
Use of Secondary Diagnostic Tests
A CUS was performed on 42 of the 153 patients (27%) with studies noting a SPFD. Six CUSs were positive, with 5 of the patients receiving anticoagulation and the sixth an IVC filter. A second lung‐imaging study was done in 10 (7%) of the 134 patients in the primary‐analysis group: 1 conventional pulmonary angiogram that was normal and 9 ventilation‐perfusion scans, among which 4 were normal, 2 were intermediate probability for PE, 2 were low probability for PE, and 1 was very low probability for PE. The 2 patients whose scans were read as intermediate probability and 1 patient whose scan was read as low probability was treated, and none of the patients with normal scans received treatment. None of these 10 patients died or had a postdischarge VTE during the 90‐day follow‐up period.
Factors Associated With Treatment
In the risk‐adjusted model, patient characteristics associated with treatment were immobility, previous VTE, and acute mental‐status change (Table 3). When the radiologist concluded that the SPFD was a PE, there was a highly increased likelihood of being treated. These factors were selected based on the MCMC simulation and the final model had a goodness‐of‐fit P value of 0.69, indicating it was fitted well. Vital‐sign abnormalities, comorbid illnesses, history of cancer, ethnicity, insurance status, and the presence of pulmonary consultation were not associated with the decision to treat. The 3 patient factorsimmobility, previous VTE, and absence of mental‐status changecombined with the initial impression of the radiologist, were strongly predictive of the decision to treat (C statistic: 0.87). None of the subset of patients who had a negative CUS and normal or very low probability ventilation‐perfusion scan received treatment. Eighty of the 134 (60%) patients had an active malignancy, chronic lung disease, heart failure, or evidence of ischemic heart disease; all 10 patients who died were from this subset of patients.
| Factors | Adjusted OR | 95% CI | Probability of Being Statistically Associated With the Decision to Treat |
|---|---|---|---|
| |||
| Immobility | 3.9 | 1.4510.6 | 0.78 |
| Acute mental‐status change | 0.14 | 0.020.84 | 0.64 |
| Initial impression of radiologist | 24.68 | 5.4112.89 | 0.86 |
| Prior VTE | 3.72 | 1.1811.67 | 0.70 |
DISCUSSION
This very large retrospective study examines treatment and outcomes in patients with a SPFD. We found that SPFDs were common, showing up in approximately 3% of all the CTPAs performed. Among the studies that were deemed positive for PE, SPFD comprised nearly one‐third. Treatment of SPFD, whether concluded as PE or not, was not associated with a mortality benefit or difference in postdischarge VTE within 90 days. Our results add to the weight of smaller case‐control and retrospective series that also found no benefit from treating small PE.[7, 12, 13, 14, 15]
Given this data, why might physicians choose to treat? Physicians may feel compelled to anticoagulate due to extrapolation of data from the early studies showing a fatality rate of up to 30% in untreated PE.[2] Also, physicians may harbor the concern that, though small emboli may pose no immediate danger, they serve as a marker of hypercoagulability and as such are a harbinger of subsequent large clots. A reflexive treatment response to the radiologist's conclusion that the filling defect is a PE may also play a part. Balancing this concern is the recognition that the treatment for acute PE is not benign. The age‐adjusted incidence of major bleeding (eg, gastrointestinal or intracranial) with warfarin has increased by 71%, from 3.1 to 5.3 per 100,000, since the introduction of CTPA.[6] Also, as seen in this study, a substantial percentage of patients will incur the morbidity and cost of IVC‐filter placement.
When physicians face management uncertainty, they consider risk factors for the condition investigated, consult experts, employ additional studies, and weigh patient preference. In this study, history of immobility and VTE were, indeed, positively associated with treatment, but change in mental status was negatively so. Given that the PESI score is higher with change in mental status, this finding is superficially paradoxical but unsurprising. Mental‐status change could not likely stem from a SPFD and its presence heightens the risks of anticoagulation, hence dissuading treatment. Pulmonary consultations were documented in less than half of the cases and did not clearly sway the treatment decision. Determining whether more patients would have been treated if pulmonologists were not involved would require a prospective study.
The most important association with treatment was how the radiologist interpreted the SPFD. Even then, the influence of the radiologist's interpretation was far from complete: 40% of the cases in which PE was called went untreated, and 4 cases received treatment despite PE not being called. The value of the radiologist's interpretation is further undercut by the modest interobserver agreement found on over‐read, which is line with previous reports and reflective of lack of a gold standard for diagnosing isolated peripheral PE.[3, 12, 16]
Even if radiologists could agree upon what they are seeing, the question remains about the pathological importance. Unrecognized PE incidental to the cause of death are commonly found at autopsy. Autopsy studies reveal that up to 52% to 64% of patients have PE; and, if multiple blocks of lung tissue are studied, the prevalence increases up to 90%.[17, 18] In the series by Freiman et al., 59% of the identified thrombi were small enough not to be recognized on routine gross examination.[17] Furthermore, an unknown percentage of small clots, especially in the upper lobes, are in situ thrombi rather than emboli.[18] In the case of small dot‐like clots, Suh and colleagues have speculated that they represent normal embolic activity from the lower limbs, which are cleared routinely by the lung serving in its role as a filter.[19] Although our study only examined SPFD, the accumulation of small emboli could have pathologic consequences. In their review, Gali and Kim reported that 12% of patients with chronic thromboembolic pulmonary hypertension who underwent pulmonary endarterectomy had disease confined to the distal segmental and subsegmental arteries.[13]
Use of secondary studies could mitigate some of the diagnostic and management uncertainty, but they were obtained in only about a quarter of the cases. The use of a second lung‐imaging study following CTPA is not recommended in guidelines or diagnostic algorithms, but in our institution a significant minority of physicians were employing these tests to clarify the nature of the filling defects.[20] Tapson, speaking to the treatment dilemma that small PEs present, has suggested that prospective trials on this topic employ tests that investigate risk for poor outcome if untreated including cardiopulmonary reserve, D‐dimer, and presence of lower‐limb thrombus.[21] Indeed, a study is ongoing examining the outcome at 90 days of patients with single or multiple subsegmental embolism with negative CUS.[22]
Ten of the 134 patients (7.4%) with peripheral filling defects died within 90 days. It is difficult to establish whether these deaths were PE‐specific mortalities because there was a high degree of comorbid illness in this cohort. Five of the 134 (3.7%) had recurrent VTE, which is comparable to the outcomes in other studies.[23]
There are limitations to this study. This study is the first to limit analysis of the filling defects to single defects in the segmental or subsegmental pulmonary arteries. This subset of patients includes those with the least clot burden, therefore representing the starkest decision‐making treatment dilemma, and the incidence of these clots is not insignificant. As a retrospective study, we could not fully capture all of the considerations that may have factored into the clinicians' decision‐making regarding treatment, including patient preference. Because of inadequate documentation, especially in the emergency department notes, we were unable to calculate pretest probability. Also, we cannot exclude that subclinical VTEs were occurring that would later harm the patients. We did not analyze the role of D‐dimer testing because that test is validated to guide the decision to obtain lung‐imaging studies and not to inform the treatment decision. In our cohort, 89 of 134 (66%) of our patients were already hospitalized for other diagnoses prior to PE being queried. Moreover, many of these patients had active malignancy or were being treated for pneumonia, which would decrease the positive predictive value of the D‐dimer test. D‐dimer performs poorly when used for prognosis.[24] This is a single‐center study, therefore the comparability of our findings to other centers may be an issue, although our findings generally accord with those from other single‐center studies.[7, 12, 24, 25] We determined the recurrence rate from the hospital records and could have missed cases diagnosed elsewhere. However, our hospital is the only one in the city and serves the vast majority of patients in the area, and 88% of our cohort had a repeat visit to our hospital subsequently. In addition, the radiology service is the only one in the area that provides outpatient CUS, CTPA, and ventilation‐perfusion scan studies. Our study is the largest to date on this issue. However, our sample size is somewhat modest, and consequently the factors associated with treatment have large confidence intervals. We are therefore constrained in recommending empiric application of our findings. Nonetheless, our results in terms of no difference in mortality and recurrence between treated and untreated patients are in keeping with other studies on this topic. Also, our simulation analysis did reveal factors that were highly associated with the decision to treat. These findings as a whole strongly point to the need for a larger study on this issue, because, as we and other authors have argued, the consequences of treatment are not benign.[6]
In conclusion, this study shows that SPFDs are common and that there was no difference in 90‐day mortality between treated and untreated patients, regardless of whether the defects were interpreted as PE or not. Physicians appear to rely heavily on the radiologist's interpretation for their treatment decision, but they will also treat when the interpretation is not PE and not infrequently abstain when it is. Treatment remains common despite the modest agreement among radiologists whether the peripheral filling defect even represents PE. When secondary imaging studies are obtained and negative, physicians forgo treatment. Larger studies are needed to help clarify our findings and should include decision‐making algorithms that include secondary imaging studies, because these studies may provide enough reassurance when negative to sway physicians against treatment.
Disclosure
Nothing to report.
- , , . The mortality of untreated pulmonary embolism in emergency department patients. Ann Emerg Med. 2005;45:302–310.
- . Pulmonary embolism: what have we learned since Virchow? Natural history, pathophysiology, and diagnosis. Chest. 2002;122:1400–1456.
- , , , et al. Subsegmental pulmonary emboli: improved detection with thin‐collimation multi‐detector row spiral CT. Radiology. 2002;222:483–490.
- , , . Trends in the use of diagnostic imaging in patients hospitalized with acute pulmonary embolism. Am J Cardiol. 2004;93:1316–1317.
- , , , , . The effect of helical computed tomography on diagnostic and treatment strategies in patients with suspected pulmonary embolism. Am J Med. 2004;116:84–90.
- , , . Time trends in pulmonary embolism in the United States: evidence of overdiagnosis. Arch Intern Med. 2011;171:831–837.
- , , , . Clinical outcomes in patients with isolated subsegmental pulmonary emboli diagnosed by multidetector CT pulmonary angiography. Thromb Res. 2010;126:e266–e270.
- , , , et al. Guidelines on the diagnosis and management of acute pulmonary embolism: the Task Force for the Diagnosis and Management of Acute Pulmonary Embolism of the European Society of Cardiology (ESC). Eur Heart J. 2008;29:2276–2315.
- , , , , . Diagnosis and management of isolated subsegmental pulmonary embolism: review and assessment of the options. Clin Appl Thromb Hemost. 2012;18:20–26.
- Intelius. Available at: http://www.intelius.com. Accessed September 30, 2010.
- , , . The validation and reproducibility of the pulmonary embolism severity index. J Thromb Haemost. 2010;8:1509–1514.
- , , . Clinicians' response to radiologists' reports of isolated subsegmental pulmonary embolism or inconclusive interpretation of pulmonary embolism using MDCT. AJR Am J Roentgenol. 2005;184:623–628.
- , . Pulmonary microvascular disease in chronic thromboembolic pulmonary hypertension. Proc Am Thorac Soc. 2006;3:571–576.
- . Small pulmonary emboli: what do we know? Radiology. 2005;234:654–658.
- , , . Reassessment of pulmonary angiography for the diagnosis of pulmonary embolism: relation of interpreter agreement to the order of the involved pulmonary arterial branch. Radiology. 1999;210:689–691.
- , . Helical CT for the evaluation of acute pulmonary embolism. AJR Am J Roentgenol. 2005;185:135–149.
- , , . Frequency of pulmonary thromboembolism in man. N Engl J Med. 1965;272:1278–1280.
- . Pathology of pulmonary thromboembolism. Chest. 1995;107(1 suppl):10S–17S.
- , , . Dots are not clots: the over‐diagnosis and over‐treatment of PE. Emerg Radiol. 2010;17:347–352.
- , , . Current approach to the diagnosis of acute nonmassive pulmonary embolism. Chest. 2011;140:509–518.
- . Acute pulmonary embolism: comment on “time trends in pulmonary embolism in the United States.” Arch Intern Med. 2011;171:837–839.
- National Institutes of Health, ClinicalTrials.gov; Carrier M. A study to evaluate the safety of withholding anticoagulation in patients with subsegmental PE who have a negative serial bilateral lower extremity ultrasound (SSPE). ClinicalTrials.gov identifier: NCT01455818.
- , , . Untreated patients with pulmonary embolism: outcome, clinical, and laboratory assessment. Chest. 1995;107:931–935.
- , , , , , . Prognostic value of D‐dimer in stable patients with pulmonary embolism. Clin Appl Thromb Hemost. 2011;17:E183–E185.
- , , , , . Diagnosis and management of subsegmental pulmonary embolism. J Thromb Hemost. 2006;4:724–731.
© 2013 Society of Hospital Medicine
Stat Laboratory Order Feedback
Overuse of inpatient stat laboratory orders (stat is an abbreviation of the Latin word statim, meaning immediately, without delay; alternatively, some consider it an acronym for short turnaround time) is a major problem in the modern healthcare system.[1, 2, 3, 4, 5] Ordering laboratory tests stat is a common way to expedite processing, with expectation of results being reported within 1 hour from the time ordered, according to the College of American Pathologists.[6] However, stat orders are also requested for convenience,[2] to expedite discharge,[7] or to meet expectation of turnaround times.[8, 9, 10] Overuse of stat orders increases cost and may reduce the effectiveness of a system. Reduction of excessive stat order requests helps support safe and efficient patient care[11, 12] and may reduce laboratory costs.[13, 14]
Several studies have examined interventions to optimize stat laboratory utilization.[14, 15] Potentially effective interventions include establishment of stat ordering guidelines, utilization of point‐of‐care testing, and prompt feedback via computerized physician order entry (CPOE) systems.[16, 17, 18] However, limited evidence is available regarding the effectiveness of audit and feedback in reducing stat ordering frequency.
Our institution shared the challenge of a high frequency of stat laboratory test orders. An interdisciplinary working group comprising leadership in the medicine, surgery, informatics, laboratory medicine, and quality and patient safety departments was formed to approach this problem and identify potential interventions. The objectives of this study are to describe the patterns of stat orders at our institution as well as to assess the effectiveness of the targeted individual feedback intervention in reducing utilization of stat laboratory test orders.
METHODS
Design
This study is a retrospective analysis of administrative data for a quality‐improvement project. The study was deemed exempt from review by the Beth Israel Medical Center Institutional Review Board.
Setting
Beth Israel Medical Center is an 856‐bed, urban, tertiary‐care teaching hospital with a capacity of 504 medical and surgical beds. In October 2009, 47.8% of inpatient laboratory tests (excluding the emergency department) were ordered as stat, according to an electronic audit of our institution's CPOE system, GE Centricity Enterprise (GE Medical Systems Information Technologies, Milwaukee, WI). Another audit using the same data query for the period of December 2009 revealed that 50 of 488 providers (attending physicians, nurse practitioners, physician assistants, fellows, and residents) accounted for 51% of total stat laboratory orders, and that Medicine and General Surgery residents accounted for 43 of these 50 providers. These findings prompted us to develop interventions that targeted high utilizers of stat laboratory orders, especially Medicine and General Surgery residents.
Teaching Session
Medicine and General Surgery residents were given a 1‐hour educational session at a teaching conference in January 2010. At this session, residents were instructed that ordering stat laboratory tests was appropriate when the results were needed urgently to make clinical decisions as quickly as possible. This session also explained the potential consequences associated with excessive stat laboratory orders and provided department‐specific data on current stat laboratory utilization.
Individual Feedback
From January to May 2010, a list of stat laboratory orders by provider was generated each month by the laboratory department's database. The top 10 providers who most frequently placed stat orders were identified and given individual feedback by their direct supervisors based on data from the prior month (feedback provided from February to June 2010). Medicine and General Surgery residents were counseled by their residency program directors, and nontrainee providers by their immediate supervising physicians. Feedback and counseling were given via brief individual meetings, phone calls, or e‐mail. Supervisors chose the method that ensured the most timely delivery of feedback. Feedback and counseling consisted of explaining the effort to reduce stat laboratory ordering and the rationale behind this, alerting providers that they were outliers, and encouraging them to change their behavior. No punitive consequences were discussed; the feedback sessions were purely informative in nature. When an individual was ranked again in the top 10 after receiving feedback, he or she received repeated feedback.
Data Collection and Measured Outcomes
We retrospectively collected data on monthly laboratory test orders by providers from September 2009 to June 2010. The data were extracted from the electronic medical record (EMR) system and included any inpatient laboratory orders at the institution. Laboratory orders placed in the emergency department were excluded. Providers were divided into nontrainees (attending physicians, nurse practitioners, and physician assistants) and trainee providers (residents and fellows). Trainee providers were further categorized by educational levels (postgraduate year [PGY]‐1 vs PGY‐2 or higher) and specialty (Medicine vs General Surgery vs other). Fellows in medical and surgical subspecialties were categorized as other.
The primary outcome measure was the proportion of stat orders out of total laboratory orders for individuals. The proportion of stat orders out of total orders was selected to assess individuals' tendency to utilize stat laboratory orders.
Statistical Analysis
In the first analysis, stat and total laboratory orders were aggregated for each provider. Providers who ordered <10 laboratory tests during the study period were excluded. We calculated the proportion of stat out of total laboratory orders for each provider, and compared it by specialty, by educational level, and by feedback status. Median and interquartile range (IQR) were reported due to non‐normal distribution, and the Wilcoxon rank‐sum test was used for comparisons.
In the second analysis, we determined pre‐feedback and post‐feedback periods for providers who received feedback. The feedback month was defined as the month immediately after a provider was ranked in the top 10 for the first time during the intervention period. For each provider, stat orders and total laboratory orders during months before and after the feedback month, excluding the feedback month, were calculated. The change in the proportion of stat laboratory orders out of all orders from pre‐ to post‐feedback was then calculated for each provider for whom both pre‐ and post‐feedback data were available. Because providers may have utilized an unusually high proportion of stat orders during the months in which they were ranked in the top 10 (for example, due to being on rotations in which many orders are placed stat, such as the intensive care units), we conducted a sensitivity analysis excluding those months. Further, for comparison, we conducted the same analysis for providers who did not receive feedback and were ranked 11 to 30 in any month during the intervention period. In those providers, we considered the month immediately after a provider was ranked in the 11 to 30 range for the first time as the hypothetical feedback month. The proportional change in the stat laboratory ordering was analyzed using the paired Student t test.
In the third analysis, we calculated the proportion of stat laboratory orders each month for each provider. Individual provider data were excluded if total laboratory orders for the month were <10. We then calculated the average proportion of stat orders for each specialty and educational level among trainee providers every month, and plotted and compared the trends.
All analyses were performed with JMP software version 9.0 (SAS Institute, Inc., Cary, NC). All statistical tests were 2‐sided, and P < 0.05 was considered significant.
RESULTS
We identified 1045 providers who ordered 1 laboratory test from September 2009 to June 2010. Of those, 716 were nontrainee providers and 329 were trainee providers. Among the trainee providers, 126 were Medicine residents, 33 were General Surgery residents, and 103 were PGY‐1. A total of 772,734 laboratory tests were ordered during the study period, and 349,658 (45.2%) tests were ordered as stat. Of all stat orders, 179,901 (51.5%) were ordered by Medicine residents and 52,225 (14.9%) were ordered by General Surgery residents.
Thirty‐seven providers received individual feedback during the intervention period. This group consisted of 8 nontrainee providers (nurse practitioners and physician assistants), 21 Medicine residents (5 were PGY‐1), and 8 General Surgery residents (all PGY‐1). This group ordered a total of 84,435 stat laboratory tests from September 2009 to June 2010 and was responsible for 24.2% of all stat laboratory test orders at the institution.
Provider Analysis
After exclusion of providers who ordered <10 laboratory tests from September 2009 to June 2010, a total of 807 providers remained. The median proportion of stat orders out of total orders was 40% among all providers and 41.6% for nontrainee providers (N = 500), 38.7% for Medicine residents (N = 125), 80.2% for General Surgery residents (N = 32), and 24.2% for other trainee providers (N = 150). The proportion of stat orders differed significantly by specialty and educational level, but also even among providers in the same specialty at the same educational level. Among PGY‐1 residents, the stat‐ordering proportion ranged from 6.9% to 49.1% for Medicine (N = 54) and 69.0% to 97.1% for General Surgery (N = 16). The proportion of stat orders was significantly higher among providers who received feedback compared with those who did not (median, 72.4% [IQR, 55.0%89.5%] vs 39.0% [IQR, 14.9%65.7%], P < 0.001). When stratified by specialty and educational level, the statistical significance remained in nontrainee providers and trainee providers with higher educational level, but not in PGY‐1 residents (Table 1).
| All Providers | Feedback Given | Feedback Not Given | |||||
|---|---|---|---|---|---|---|---|
| N | Stat % | N | Stat % | N | Stat % | P Valuea | |
| |||||||
| Total | 807 | 40 (15.869.0) | 37 | 72.4 (55.089.5) | 770 | 39.0 (14.965.7) | <0.001 |
| Nontrainee providersb | 500 | 41.6 (13.571.5) | 8 | 91.7 (64.097.5) | 492 | 40.2 (13.270.9) | <0.001 |
| Trainee providersc | 307 | 37.8 (19.162.7) | 29 | 69.3 (44.380.9) | 278 | 35.1 (17.655.6) | <0.001 |
| Medicine | 125 | 38.7 (26.850.4) | 21 | 58.8 (36.872.6) | 104 | 36.1 (25.945.6) | <0.001 |
| PGY‐1 | 54 | 28.1 (23.935.2) | 5 | 32.0 (25.536.8) | 49 | 27.9 (23.534.6) | 0.52 |
| PGY‐2 and higher | 71 | 46.5 (39.160.4) | 16 | 63.9 (54.575.7) | 55 | 45.1 (36.554.9) | <0.001 |
| General surgery | 32 | 80.2 (69.690.1) | 8 | 89.5 (79.392.7) | 24 | 78.7 (67.987.4) | <0.05 |
| PGY‐1 | 16 | 86.4 (79.191.1) | 8 | 89.5 (79.392.7) | 8 | 84.0 (73.289.1) | 0.25 |
| PGY‐2 and higher | 16 | 74.4 (65.485.3) | |||||
| Other | 150 | 24.2 (9.055.0) | |||||
| PGY‐1 | 31 | 28.2 (18.478.3) | |||||
| PGY‐2 or higher | 119 | 20.9 (5.651.3) | |||||
Stat Ordering Pattern Change by Individual Feedback
Among 37 providers who received individual feedback, 8 providers were ranked in the top 10 more than once and received repeated feedback. Twenty‐seven of 37 providers had both pre‐feedback and post‐feedback data and were included in the analysis. Of those, 7 were nontrainee providers, 16 were Medicine residents (5 were PGY‐1), and 4 were General Surgery residents (all PGY‐1). The proportion of stat laboratory orders per provider decreased by 15.7% (95% confidence interval [CI]: 5.6% to 25.9%, P = 0.004) after feedback (Table 2). The decrease remained significant after excluding the months in which providers were ranked in the top 10 (11.4%; 95% CI: 0.7% to 22.1%, P = 0.04).
| Top 10 Providers (Received Feedback) | Providers Ranked in 1130 (No Feedback) | |||||||||
|---|---|---|---|---|---|---|---|---|---|---|
| N | Mean Stat % | Mean Difference (95% CI) | P Value | N | Mean Stat % | Mean Difference (95% CI) | P Value | |||
| Pre | Post | Pre | Post | |||||||
| ||||||||||
| Total | 27 | 71.2 | 55.5 | 15.7 (25.9 to 5.6) | 0.004 | 39 | 64.6 | 60.2 | 4.5 (11.0 to 2.1) | 0.18 |
| Nontrainee providers | 7 | 94.6 | 73.2 | 21.4 (46.9 to 4.1) | 0.09 | 12 | 84.4 | 80.6 | 3.8 (11.9 to 4.3) | 0.32 |
| Trainee providers | 20 | 63.0 | 49.3 | 13.7 (25.6 to 1.9) | 0.03 | 27 | 55.8 | 51.1 | 4.7 (13.9 to 4.4) | 0.30 |
| Medicine | 16 | 55.8 | 45.0 | 10.8 (23.3 to 1.6) | 0.08 | 21 | 46.2 | 41.3 | 4.8 (16.3 to 6.7) | 0.39 |
| General Surgery | 4 | 91.9 | 66.4 | 25.4 (78.9 to 28.0) | 0.23 | 6 | 89.6 | 85.2 | 4.4 (20.5 to 11.6) | 0.51 |
| PGY‐1 | 9 | 58.9 | 47.7 | 11.2 (32.0 to 9.5) | 0.25 | 15 | 55.2 | 49.2 | 6.0 (18.9 to 6.9) | 0.33 |
| PGY‐2 or Higher | 11 | 66.4 | 50.6 | 15.8 (32.7 to 1.1) | 0.06 | 12 | 56.6 | 53.5 | 3.1 (18.3 to 12.1) | 0.66 |
In comparison, a total of 57 providers who did not receive feedback were in the 11 to 30 range during the intervention period. Three Obstetrics and Gynecology residents and 3 Family Medicine residents were excluded from the analysis to match specialty with providers who received feedback. Thirty‐nine of 51 providers had adequate data and were included in the analysis, comprising 12 nontrainee providers, 21 Medicine residents (10 were PGY‐1), and 6 General Surgery residents (5 were PGY‐1). Among them, the proportion of stat laboratory orders per provider did not change significantly, with a 4.5% decrease (95% CI: 2.1% to 11.0%, P = 0.18; Table 2).
Stat Ordering Trends Among Trainee Providers
After exclusion of data for the month with <10 total laboratory tests per provider, a total of 303 trainee providers remained, providing 2322 data points for analysis. Of the 303, 125 were Medicine residents (54 were PGY‐1), 32 were General Surgery residents (16 were PGY‐1), and 146 were others (31 were PGY‐1). The monthly trends for the average proportion of stat orders among those providers are shown in Figure 1. The decrease in the proportion of stat orders was observed after January 2010 in Medicine and General Surgery residents both in PGY‐1 and PGY‐2 or higher, but no change was observed in other trainee providers.

DISCUSSION
We describe a series of interventions implemented at our institution to decrease the utilization of stat laboratory orders. Based on an audit of laboratory‐ordering data, we decided to target high utilizers of stat laboratory tests, especially Medicine and General Surgery residents. After presenting an educational session to those residents, we gave individual feedback to the highest utilizers of stat laboratory orders. Providers who received feedback decreased their utilization of stat laboratory orders, but the stat ordering pattern did not change among those who did not receive feedback.
The individual feedback intervention involved key stakeholders for resident and nontrainee provider education (directors of the Medicine and General Surgery residency programs and other direct clinical supervisors). The targeted feedback was delivered via direct supervisors and was provided more than once as needed, which are key factors for effective feedback in modifying behavior in professional practice.[19] Allowing the supervisors to choose the most appropriate form of feedback for each individual (meetings, phone calls, or e‐mail) enabled timely and individually tailored feedback and contributed to successful implementation. We feel intervention had high educational value for residents, as it promoted residents' engagement in proper systems‐based practice, one of the 6 core competencies of the Accreditation Council for Graduate Medical Education (ACGME).
We utilized the EMR to obtain provider‐specific data for feedback and analysis. As previously suggested, the use of the EMR for audit and feedback was effective in providing timely, actionable, and individualized feedback with peer benchmarking.[20, 21] We used the raw number of stat laboratory orders for audit and the proportion of stat orders out of total orders to assess the individual behavioral patterns. Although the proportional use of stat orders is affected by patient acuity and workplace or rotation site, it also seems largely affected by provider's preference or practice patterns, as we saw the variance among providers of the same specialty and educational level. The changes in the stat ordering trends only seen among Medicine and General Surgery residents suggests that our interventions successfully decreased the overall utilization of stat laboratory orders among targeted providers, and it seems less likely that those decreases are due to changes in patient acuity, changes in rotation sites, or learning curve among trainee providers. When averaged over the 10‐month study period, as shown in Table 1, the providers who received feedback ordered a higher proportion of stat tests than those who did not receive feedback, except for PGY‐1 residents. This suggests that although auditing based on the number of stat laboratory orders identified providers who tended to order more stat tests than others, it may not be a reliable indicator for PGY‐1 residents, whose number of laboratory orders highly fluctuates by rotation.
There are certain limitations to our study. First, we assumed that the top utilizers were inappropriately ordering stat laboratory tests. Because there is no clear consensus as to what constitutes appropriate stat testing,[7] it was difficult, if not impossible, to determine which specific orders were inappropriate. However, high variability of the stat ordering pattern in the analysis provides some evidence that high stat utilizers customarily order more stat testing as compared with others. A recent study also revealed that the median stat ordering percentage was 35.9% among 52 US institutions.[13] At our institution, 47.8% of laboratory tests were ordered stat prior to the intervention, higher than the benchmark, providing the rationale for our intervention.
Second, the intervention was conducted in a time‐series fashion and no randomization was employed. The comparison of providers who received feedback with those who did not is subject to selection bias, and the difference in the change in stat ordering pattern between these 2 groups may be partially due to variability of work location, rotation type, or acuity of patients. However, we performed a sensitivity analysis excluding the months when the providers were ranked in the top 10, assuming that they may have ordered an unusually high proportion of stat tests due to high acuity of patients (eg, rotation in the intensive care units) during those months. Robust results in this analysis support our contention that individual feedback was effective. In addition, we cannot completely rule out the possibility that the changes in stat ordering practice may be solely due to natural maturation effects within an academic year among trainee providers, especially PGY‐1 residents. However, relatively acute changes in the stat ordering trends only among targeted provider groups around January 2010, corresponding to the timing of interventions, suggest otherwise.
Third, we were not able to test if the intervention or decrease in stat orders adversely affected patient care. For example, if, after receiving feedback, providers did not order some tests stat that should have been ordered that way, this could have negatively affected patient care. Additionally, we did not evaluate whether reduction in stat laboratory orders improved timeliness of the reporting of stat laboratory results.
Lastly, the sustained effect and feasibility of this intervention were not tested. Past studies suggest educational interventions in laboratory ordering behavior would most likely need to be continued to maintain its effectiveness.[22, 23] Although we acknowledge that sustainability of this type of intervention may be difficult, we feel we have demonstrated that there is still value associated with giving personalized feedback.
This study has implications for future interventions and research. Use of automated, EMR‐based feedback on laboratory ordering performance may be effective in reducing excessive stat ordering and may obviate the need for time‐consuming efforts by supervisors. Development of quality indicators that more accurately assess stat ordering patterns, potentially adjusted for working sites and patient acuity, may be necessary. Studies that measure the impact of decreasing stat laboratory orders on turnaround times and cost may be of value.
CONCLUSION
At our urban, tertiary‐care teaching institution, stat ordering frequency was highly variable among providers. Targeted individual feedback to providers who ordered a large number of stat laboratory tests decreased their stat laboratory order utilization.
- . Turnaround time, part 2: stats too high, yet labs cope. MLO Med Lab Obs. 1993;25(9):33–38.
- . Laboratory turnaround time. Am J Clin Pathol. 1996;105(6):676–688.
- . No more STAT testing. MLO Med Lab Obs. 2005;37(8):22, 24, 26.
- , , . Phlebotomy, stat testing and laboratory organization: an intriguing relationship. Clin Chem Lab Med. 2012;50(12):2065–2068.
- , , , et al. Laboratory request appropriateness in emergency: impact on hospital organization. Clin Chem Lab Med. 2006;44(6):760–764.
- College of American Pathologists.Definitions used in past Q‐PROBES studies (1991–2011). Available at: http://www.cap.org/apps/docs/q_probes/q‐probes_definitions.pdf. Updated September 29, 2011. Accessed July 31, 2013.
- , , . Practice Parameter. STAT testing? A guideline for meeting clinician turnaround time requirements. Am J Clin Pathol. 1996;105(6):671–675.
- , . Intralaboratory performance and laboratorians' expectations for stat turnaround times: a College of American Pathologists Q‐Probes study of four cerebrospinal fluid determinations. Arch Pathol Lab Med. 1991;115(10):977–983.
- , , , . How fast is fast enough for clinical laboratory turnaround time? Measurement of the interval between result entry and inquiries for reports. Am J Clin Pathol. 1997;108(4):400–405.
- , . Strategies of organization and service for the critical‐care laboratory. Clin Chem. 1990;36(8):1557–1561.
- , , , , . Evaluation of stat and routine turnaround times as a component of laboratory quality. Am J Clin Pathol. 1989;91(3):331–335.
- , . Laboratory results: Timeliness as a quality attribute and strategy. Am J Clin Pathol. 2001;116(3):311–315.
- , , , . Utilization of stat test priority in the clinical laboratory: a College of American Pathologists Q‐Probes study of 52 institutions. Arch Pathol Lab Med. 2013;137(2):220–227.
- . Controlling the use of stat testing. Pathologist. 1984;38(8):474–477.
- , , . Optimizing the availability of ‘stat' laboratory tests using Shewhart ‘C' control charts. Ann Clin Biochem. 2002;39(part 2):140–144.
- , , . Evaluating stat testing options in an academic health center: therapeutic turnaround time and staff satisfaction. Clin Chem. 1998;44(8):1597–1603.
- , , . Impact of a physician's order entry (POE) system on physicians' ordering patterns and patient length of stay. Int J Med Inform. 2002;65(3):213–223.
- , . Instrumentation for STAT analyses. Clin Lab Med. 1988;8(4):689–697.
- , , , et al. Audit and feedback: effects on professional practice and healthcare outcomes. Cochrane Database Syst Rev. 2012;6:CD000259.
- , , , , , . The feasibility of automating audit and feedback for ART guideline adherence in Malawi. J Am Med Inform Assoc. 2011;18(6):868–874.
- , , , et al. Effect of an outpatient antimicrobial stewardship intervention on broad‐spectrum antibiotic prescribing by primary care pediatricians: a randomized trial. JAMA. 2013;309(22):2345–2352.
- . An educational program to modify laboratory use by house staff. J Med Educ. 1977;52(7):578–581.
- , , . Ordering of laboratory tests in a teaching hospital: can it be improved? JAMA. 1983;249(22):3076–3080.
Overuse of inpatient stat laboratory orders (stat is an abbreviation of the Latin word statim, meaning immediately, without delay; alternatively, some consider it an acronym for short turnaround time) is a major problem in the modern healthcare system.[1, 2, 3, 4, 5] Ordering laboratory tests stat is a common way to expedite processing, with expectation of results being reported within 1 hour from the time ordered, according to the College of American Pathologists.[6] However, stat orders are also requested for convenience,[2] to expedite discharge,[7] or to meet expectation of turnaround times.[8, 9, 10] Overuse of stat orders increases cost and may reduce the effectiveness of a system. Reduction of excessive stat order requests helps support safe and efficient patient care[11, 12] and may reduce laboratory costs.[13, 14]
Several studies have examined interventions to optimize stat laboratory utilization.[14, 15] Potentially effective interventions include establishment of stat ordering guidelines, utilization of point‐of‐care testing, and prompt feedback via computerized physician order entry (CPOE) systems.[16, 17, 18] However, limited evidence is available regarding the effectiveness of audit and feedback in reducing stat ordering frequency.
Our institution shared the challenge of a high frequency of stat laboratory test orders. An interdisciplinary working group comprising leadership in the medicine, surgery, informatics, laboratory medicine, and quality and patient safety departments was formed to approach this problem and identify potential interventions. The objectives of this study are to describe the patterns of stat orders at our institution as well as to assess the effectiveness of the targeted individual feedback intervention in reducing utilization of stat laboratory test orders.
METHODS
Design
This study is a retrospective analysis of administrative data for a quality‐improvement project. The study was deemed exempt from review by the Beth Israel Medical Center Institutional Review Board.
Setting
Beth Israel Medical Center is an 856‐bed, urban, tertiary‐care teaching hospital with a capacity of 504 medical and surgical beds. In October 2009, 47.8% of inpatient laboratory tests (excluding the emergency department) were ordered as stat, according to an electronic audit of our institution's CPOE system, GE Centricity Enterprise (GE Medical Systems Information Technologies, Milwaukee, WI). Another audit using the same data query for the period of December 2009 revealed that 50 of 488 providers (attending physicians, nurse practitioners, physician assistants, fellows, and residents) accounted for 51% of total stat laboratory orders, and that Medicine and General Surgery residents accounted for 43 of these 50 providers. These findings prompted us to develop interventions that targeted high utilizers of stat laboratory orders, especially Medicine and General Surgery residents.
Teaching Session
Medicine and General Surgery residents were given a 1‐hour educational session at a teaching conference in January 2010. At this session, residents were instructed that ordering stat laboratory tests was appropriate when the results were needed urgently to make clinical decisions as quickly as possible. This session also explained the potential consequences associated with excessive stat laboratory orders and provided department‐specific data on current stat laboratory utilization.
Individual Feedback
From January to May 2010, a list of stat laboratory orders by provider was generated each month by the laboratory department's database. The top 10 providers who most frequently placed stat orders were identified and given individual feedback by their direct supervisors based on data from the prior month (feedback provided from February to June 2010). Medicine and General Surgery residents were counseled by their residency program directors, and nontrainee providers by their immediate supervising physicians. Feedback and counseling were given via brief individual meetings, phone calls, or e‐mail. Supervisors chose the method that ensured the most timely delivery of feedback. Feedback and counseling consisted of explaining the effort to reduce stat laboratory ordering and the rationale behind this, alerting providers that they were outliers, and encouraging them to change their behavior. No punitive consequences were discussed; the feedback sessions were purely informative in nature. When an individual was ranked again in the top 10 after receiving feedback, he or she received repeated feedback.
Data Collection and Measured Outcomes
We retrospectively collected data on monthly laboratory test orders by providers from September 2009 to June 2010. The data were extracted from the electronic medical record (EMR) system and included any inpatient laboratory orders at the institution. Laboratory orders placed in the emergency department were excluded. Providers were divided into nontrainees (attending physicians, nurse practitioners, and physician assistants) and trainee providers (residents and fellows). Trainee providers were further categorized by educational levels (postgraduate year [PGY]‐1 vs PGY‐2 or higher) and specialty (Medicine vs General Surgery vs other). Fellows in medical and surgical subspecialties were categorized as other.
The primary outcome measure was the proportion of stat orders out of total laboratory orders for individuals. The proportion of stat orders out of total orders was selected to assess individuals' tendency to utilize stat laboratory orders.
Statistical Analysis
In the first analysis, stat and total laboratory orders were aggregated for each provider. Providers who ordered <10 laboratory tests during the study period were excluded. We calculated the proportion of stat out of total laboratory orders for each provider, and compared it by specialty, by educational level, and by feedback status. Median and interquartile range (IQR) were reported due to non‐normal distribution, and the Wilcoxon rank‐sum test was used for comparisons.
In the second analysis, we determined pre‐feedback and post‐feedback periods for providers who received feedback. The feedback month was defined as the month immediately after a provider was ranked in the top 10 for the first time during the intervention period. For each provider, stat orders and total laboratory orders during months before and after the feedback month, excluding the feedback month, were calculated. The change in the proportion of stat laboratory orders out of all orders from pre‐ to post‐feedback was then calculated for each provider for whom both pre‐ and post‐feedback data were available. Because providers may have utilized an unusually high proportion of stat orders during the months in which they were ranked in the top 10 (for example, due to being on rotations in which many orders are placed stat, such as the intensive care units), we conducted a sensitivity analysis excluding those months. Further, for comparison, we conducted the same analysis for providers who did not receive feedback and were ranked 11 to 30 in any month during the intervention period. In those providers, we considered the month immediately after a provider was ranked in the 11 to 30 range for the first time as the hypothetical feedback month. The proportional change in the stat laboratory ordering was analyzed using the paired Student t test.
In the third analysis, we calculated the proportion of stat laboratory orders each month for each provider. Individual provider data were excluded if total laboratory orders for the month were <10. We then calculated the average proportion of stat orders for each specialty and educational level among trainee providers every month, and plotted and compared the trends.
All analyses were performed with JMP software version 9.0 (SAS Institute, Inc., Cary, NC). All statistical tests were 2‐sided, and P < 0.05 was considered significant.
RESULTS
We identified 1045 providers who ordered 1 laboratory test from September 2009 to June 2010. Of those, 716 were nontrainee providers and 329 were trainee providers. Among the trainee providers, 126 were Medicine residents, 33 were General Surgery residents, and 103 were PGY‐1. A total of 772,734 laboratory tests were ordered during the study period, and 349,658 (45.2%) tests were ordered as stat. Of all stat orders, 179,901 (51.5%) were ordered by Medicine residents and 52,225 (14.9%) were ordered by General Surgery residents.
Thirty‐seven providers received individual feedback during the intervention period. This group consisted of 8 nontrainee providers (nurse practitioners and physician assistants), 21 Medicine residents (5 were PGY‐1), and 8 General Surgery residents (all PGY‐1). This group ordered a total of 84,435 stat laboratory tests from September 2009 to June 2010 and was responsible for 24.2% of all stat laboratory test orders at the institution.
Provider Analysis
After exclusion of providers who ordered <10 laboratory tests from September 2009 to June 2010, a total of 807 providers remained. The median proportion of stat orders out of total orders was 40% among all providers and 41.6% for nontrainee providers (N = 500), 38.7% for Medicine residents (N = 125), 80.2% for General Surgery residents (N = 32), and 24.2% for other trainee providers (N = 150). The proportion of stat orders differed significantly by specialty and educational level, but also even among providers in the same specialty at the same educational level. Among PGY‐1 residents, the stat‐ordering proportion ranged from 6.9% to 49.1% for Medicine (N = 54) and 69.0% to 97.1% for General Surgery (N = 16). The proportion of stat orders was significantly higher among providers who received feedback compared with those who did not (median, 72.4% [IQR, 55.0%89.5%] vs 39.0% [IQR, 14.9%65.7%], P < 0.001). When stratified by specialty and educational level, the statistical significance remained in nontrainee providers and trainee providers with higher educational level, but not in PGY‐1 residents (Table 1).
| All Providers | Feedback Given | Feedback Not Given | |||||
|---|---|---|---|---|---|---|---|
| N | Stat % | N | Stat % | N | Stat % | P Valuea | |
| |||||||
| Total | 807 | 40 (15.869.0) | 37 | 72.4 (55.089.5) | 770 | 39.0 (14.965.7) | <0.001 |
| Nontrainee providersb | 500 | 41.6 (13.571.5) | 8 | 91.7 (64.097.5) | 492 | 40.2 (13.270.9) | <0.001 |
| Trainee providersc | 307 | 37.8 (19.162.7) | 29 | 69.3 (44.380.9) | 278 | 35.1 (17.655.6) | <0.001 |
| Medicine | 125 | 38.7 (26.850.4) | 21 | 58.8 (36.872.6) | 104 | 36.1 (25.945.6) | <0.001 |
| PGY‐1 | 54 | 28.1 (23.935.2) | 5 | 32.0 (25.536.8) | 49 | 27.9 (23.534.6) | 0.52 |
| PGY‐2 and higher | 71 | 46.5 (39.160.4) | 16 | 63.9 (54.575.7) | 55 | 45.1 (36.554.9) | <0.001 |
| General surgery | 32 | 80.2 (69.690.1) | 8 | 89.5 (79.392.7) | 24 | 78.7 (67.987.4) | <0.05 |
| PGY‐1 | 16 | 86.4 (79.191.1) | 8 | 89.5 (79.392.7) | 8 | 84.0 (73.289.1) | 0.25 |
| PGY‐2 and higher | 16 | 74.4 (65.485.3) | |||||
| Other | 150 | 24.2 (9.055.0) | |||||
| PGY‐1 | 31 | 28.2 (18.478.3) | |||||
| PGY‐2 or higher | 119 | 20.9 (5.651.3) | |||||
Stat Ordering Pattern Change by Individual Feedback
Among 37 providers who received individual feedback, 8 providers were ranked in the top 10 more than once and received repeated feedback. Twenty‐seven of 37 providers had both pre‐feedback and post‐feedback data and were included in the analysis. Of those, 7 were nontrainee providers, 16 were Medicine residents (5 were PGY‐1), and 4 were General Surgery residents (all PGY‐1). The proportion of stat laboratory orders per provider decreased by 15.7% (95% confidence interval [CI]: 5.6% to 25.9%, P = 0.004) after feedback (Table 2). The decrease remained significant after excluding the months in which providers were ranked in the top 10 (11.4%; 95% CI: 0.7% to 22.1%, P = 0.04).
| Top 10 Providers (Received Feedback) | Providers Ranked in 1130 (No Feedback) | |||||||||
|---|---|---|---|---|---|---|---|---|---|---|
| N | Mean Stat % | Mean Difference (95% CI) | P Value | N | Mean Stat % | Mean Difference (95% CI) | P Value | |||
| Pre | Post | Pre | Post | |||||||
| ||||||||||
| Total | 27 | 71.2 | 55.5 | 15.7 (25.9 to 5.6) | 0.004 | 39 | 64.6 | 60.2 | 4.5 (11.0 to 2.1) | 0.18 |
| Nontrainee providers | 7 | 94.6 | 73.2 | 21.4 (46.9 to 4.1) | 0.09 | 12 | 84.4 | 80.6 | 3.8 (11.9 to 4.3) | 0.32 |
| Trainee providers | 20 | 63.0 | 49.3 | 13.7 (25.6 to 1.9) | 0.03 | 27 | 55.8 | 51.1 | 4.7 (13.9 to 4.4) | 0.30 |
| Medicine | 16 | 55.8 | 45.0 | 10.8 (23.3 to 1.6) | 0.08 | 21 | 46.2 | 41.3 | 4.8 (16.3 to 6.7) | 0.39 |
| General Surgery | 4 | 91.9 | 66.4 | 25.4 (78.9 to 28.0) | 0.23 | 6 | 89.6 | 85.2 | 4.4 (20.5 to 11.6) | 0.51 |
| PGY‐1 | 9 | 58.9 | 47.7 | 11.2 (32.0 to 9.5) | 0.25 | 15 | 55.2 | 49.2 | 6.0 (18.9 to 6.9) | 0.33 |
| PGY‐2 or Higher | 11 | 66.4 | 50.6 | 15.8 (32.7 to 1.1) | 0.06 | 12 | 56.6 | 53.5 | 3.1 (18.3 to 12.1) | 0.66 |
In comparison, a total of 57 providers who did not receive feedback were in the 11 to 30 range during the intervention period. Three Obstetrics and Gynecology residents and 3 Family Medicine residents were excluded from the analysis to match specialty with providers who received feedback. Thirty‐nine of 51 providers had adequate data and were included in the analysis, comprising 12 nontrainee providers, 21 Medicine residents (10 were PGY‐1), and 6 General Surgery residents (5 were PGY‐1). Among them, the proportion of stat laboratory orders per provider did not change significantly, with a 4.5% decrease (95% CI: 2.1% to 11.0%, P = 0.18; Table 2).
Stat Ordering Trends Among Trainee Providers
After exclusion of data for the month with <10 total laboratory tests per provider, a total of 303 trainee providers remained, providing 2322 data points for analysis. Of the 303, 125 were Medicine residents (54 were PGY‐1), 32 were General Surgery residents (16 were PGY‐1), and 146 were others (31 were PGY‐1). The monthly trends for the average proportion of stat orders among those providers are shown in Figure 1. The decrease in the proportion of stat orders was observed after January 2010 in Medicine and General Surgery residents both in PGY‐1 and PGY‐2 or higher, but no change was observed in other trainee providers.
DISCUSSION
We describe a series of interventions implemented at our institution to decrease the utilization of stat laboratory orders. Based on an audit of laboratory‐ordering data, we decided to target high utilizers of stat laboratory tests, especially Medicine and General Surgery residents. After presenting an educational session to those residents, we gave individual feedback to the highest utilizers of stat laboratory orders. Providers who received feedback decreased their utilization of stat laboratory orders, but the stat ordering pattern did not change among those who did not receive feedback.
The individual feedback intervention involved key stakeholders for resident and nontrainee provider education (directors of the Medicine and General Surgery residency programs and other direct clinical supervisors). The targeted feedback was delivered via direct supervisors and was provided more than once as needed, which are key factors for effective feedback in modifying behavior in professional practice.[19] Allowing the supervisors to choose the most appropriate form of feedback for each individual (meetings, phone calls, or e‐mail) enabled timely and individually tailored feedback and contributed to successful implementation. We feel intervention had high educational value for residents, as it promoted residents' engagement in proper systems‐based practice, one of the 6 core competencies of the Accreditation Council for Graduate Medical Education (ACGME).
We utilized the EMR to obtain provider‐specific data for feedback and analysis. As previously suggested, the use of the EMR for audit and feedback was effective in providing timely, actionable, and individualized feedback with peer benchmarking.[20, 21] We used the raw number of stat laboratory orders for audit and the proportion of stat orders out of total orders to assess the individual behavioral patterns. Although the proportional use of stat orders is affected by patient acuity and workplace or rotation site, it also seems largely affected by provider's preference or practice patterns, as we saw the variance among providers of the same specialty and educational level. The changes in the stat ordering trends only seen among Medicine and General Surgery residents suggests that our interventions successfully decreased the overall utilization of stat laboratory orders among targeted providers, and it seems less likely that those decreases are due to changes in patient acuity, changes in rotation sites, or learning curve among trainee providers. When averaged over the 10‐month study period, as shown in Table 1, the providers who received feedback ordered a higher proportion of stat tests than those who did not receive feedback, except for PGY‐1 residents. This suggests that although auditing based on the number of stat laboratory orders identified providers who tended to order more stat tests than others, it may not be a reliable indicator for PGY‐1 residents, whose number of laboratory orders highly fluctuates by rotation.
There are certain limitations to our study. First, we assumed that the top utilizers were inappropriately ordering stat laboratory tests. Because there is no clear consensus as to what constitutes appropriate stat testing,[7] it was difficult, if not impossible, to determine which specific orders were inappropriate. However, high variability of the stat ordering pattern in the analysis provides some evidence that high stat utilizers customarily order more stat testing as compared with others. A recent study also revealed that the median stat ordering percentage was 35.9% among 52 US institutions.[13] At our institution, 47.8% of laboratory tests were ordered stat prior to the intervention, higher than the benchmark, providing the rationale for our intervention.
Second, the intervention was conducted in a time‐series fashion and no randomization was employed. The comparison of providers who received feedback with those who did not is subject to selection bias, and the difference in the change in stat ordering pattern between these 2 groups may be partially due to variability of work location, rotation type, or acuity of patients. However, we performed a sensitivity analysis excluding the months when the providers were ranked in the top 10, assuming that they may have ordered an unusually high proportion of stat tests due to high acuity of patients (eg, rotation in the intensive care units) during those months. Robust results in this analysis support our contention that individual feedback was effective. In addition, we cannot completely rule out the possibility that the changes in stat ordering practice may be solely due to natural maturation effects within an academic year among trainee providers, especially PGY‐1 residents. However, relatively acute changes in the stat ordering trends only among targeted provider groups around January 2010, corresponding to the timing of interventions, suggest otherwise.
Third, we were not able to test if the intervention or decrease in stat orders adversely affected patient care. For example, if, after receiving feedback, providers did not order some tests stat that should have been ordered that way, this could have negatively affected patient care. Additionally, we did not evaluate whether reduction in stat laboratory orders improved timeliness of the reporting of stat laboratory results.
Lastly, the sustained effect and feasibility of this intervention were not tested. Past studies suggest educational interventions in laboratory ordering behavior would most likely need to be continued to maintain its effectiveness.[22, 23] Although we acknowledge that sustainability of this type of intervention may be difficult, we feel we have demonstrated that there is still value associated with giving personalized feedback.
This study has implications for future interventions and research. Use of automated, EMR‐based feedback on laboratory ordering performance may be effective in reducing excessive stat ordering and may obviate the need for time‐consuming efforts by supervisors. Development of quality indicators that more accurately assess stat ordering patterns, potentially adjusted for working sites and patient acuity, may be necessary. Studies that measure the impact of decreasing stat laboratory orders on turnaround times and cost may be of value.
CONCLUSION
At our urban, tertiary‐care teaching institution, stat ordering frequency was highly variable among providers. Targeted individual feedback to providers who ordered a large number of stat laboratory tests decreased their stat laboratory order utilization.
- . Turnaround time, part 2: stats too high, yet labs cope. MLO Med Lab Obs. 1993;25(9):33–38.
- . Laboratory turnaround time. Am J Clin Pathol. 1996;105(6):676–688.
- . No more STAT testing. MLO Med Lab Obs. 2005;37(8):22, 24, 26.
- , , . Phlebotomy, stat testing and laboratory organization: an intriguing relationship. Clin Chem Lab Med. 2012;50(12):2065–2068.
- , , , et al. Laboratory request appropriateness in emergency: impact on hospital organization. Clin Chem Lab Med. 2006;44(6):760–764.
- College of American Pathologists.Definitions used in past Q‐PROBES studies (1991–2011). Available at: http://www.cap.org/apps/docs/q_probes/q‐probes_definitions.pdf. Updated September 29, 2011. Accessed July 31, 2013.
- , , . Practice Parameter. STAT testing? A guideline for meeting clinician turnaround time requirements. Am J Clin Pathol. 1996;105(6):671–675.
- , . Intralaboratory performance and laboratorians' expectations for stat turnaround times: a College of American Pathologists Q‐Probes study of four cerebrospinal fluid determinations. Arch Pathol Lab Med. 1991;115(10):977–983.
- , , , . How fast is fast enough for clinical laboratory turnaround time? Measurement of the interval between result entry and inquiries for reports. Am J Clin Pathol. 1997;108(4):400–405.
- , . Strategies of organization and service for the critical‐care laboratory. Clin Chem. 1990;36(8):1557–1561.
- , , , , . Evaluation of stat and routine turnaround times as a component of laboratory quality. Am J Clin Pathol. 1989;91(3):331–335.
- , . Laboratory results: Timeliness as a quality attribute and strategy. Am J Clin Pathol. 2001;116(3):311–315.
- , , , . Utilization of stat test priority in the clinical laboratory: a College of American Pathologists Q‐Probes study of 52 institutions. Arch Pathol Lab Med. 2013;137(2):220–227.
- . Controlling the use of stat testing. Pathologist. 1984;38(8):474–477.
- , , . Optimizing the availability of ‘stat' laboratory tests using Shewhart ‘C' control charts. Ann Clin Biochem. 2002;39(part 2):140–144.
- , , . Evaluating stat testing options in an academic health center: therapeutic turnaround time and staff satisfaction. Clin Chem. 1998;44(8):1597–1603.
- , , . Impact of a physician's order entry (POE) system on physicians' ordering patterns and patient length of stay. Int J Med Inform. 2002;65(3):213–223.
- , . Instrumentation for STAT analyses. Clin Lab Med. 1988;8(4):689–697.
- , , , et al. Audit and feedback: effects on professional practice and healthcare outcomes. Cochrane Database Syst Rev. 2012;6:CD000259.
- , , , , , . The feasibility of automating audit and feedback for ART guideline adherence in Malawi. J Am Med Inform Assoc. 2011;18(6):868–874.
- , , , et al. Effect of an outpatient antimicrobial stewardship intervention on broad‐spectrum antibiotic prescribing by primary care pediatricians: a randomized trial. JAMA. 2013;309(22):2345–2352.
- . An educational program to modify laboratory use by house staff. J Med Educ. 1977;52(7):578–581.
- , , . Ordering of laboratory tests in a teaching hospital: can it be improved? JAMA. 1983;249(22):3076–3080.
© 2013 Society of Hospital Medicine
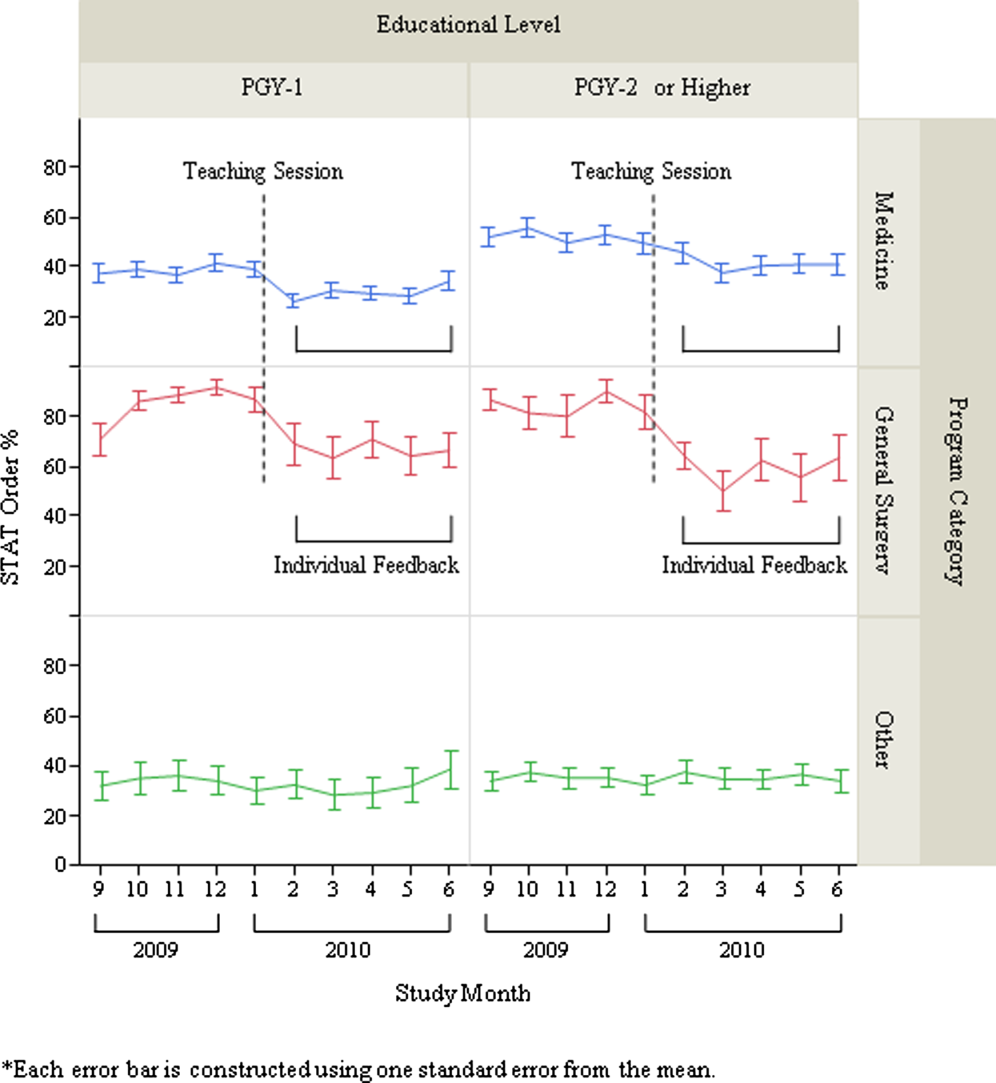
Comment on “The impact of penicillin skin testing on clinical practice and antimicrobial stewardship”
We read with interest the report by Rimawi et al.[1] They showed convincing evidence that with a negative penicillin skin test, a course of ‐lactam is safe 2 hours after a negative challenge. However, we advise caution in generalizing these data to the outpatient setting where resensitization is a possibility. One study showed that 4.9% of patients who had negative skin tests and drug challenges reacted on rechallenges 3 weeks later.[2]
In our center, ‐lactam allergy assessment is carried out according to European Academy of Allergy and Clinical Immunology guidelines.[3] We encountered a patient who had life‐threatening anaphylaxis with co‐amoxiclav 1 month after negative allergy investigations.
A 43‐year‐old woman was referred with a history of non‐drug related urticarial episodes and urticaria and angioedema of face, neck, and arms 30 minutes after a first dose of oral co‐amoxiclav 2 years previously. Specific immunoglobulin E tests to penicillin and amoxicillin, skin tests, and oral co‐amoxiclav challenge were negative. A month later, she developed anaphylaxis (intraoral angioedema, wheeze, hypotension [70/30 mm Hg], oxygen desaturation to 60% on room air, becoming unresponsive) within minutes of an intravenous dose of co‐amoxiclav for acute cholecystitis.
Our case illustrates that despite a detailed negative allergy assessment, severe anaphylaxis can occur requiring prompt identification and appropriate treatment.
- , , , et al. The impact of penicillin skin testing on clinical practice and antimicrobial stewardship. J Hosp Med. 2013;8(6):342–345.
- , , , et al. J Investig Allergol Clin Immunol. 2012;22(1):41–47.
- , , , et al. Diagnosis of immediate allergic reactions to beta‐lactam antibiotics. Allergy. 2003;58:961–972.
We read with interest the report by Rimawi et al.[1] They showed convincing evidence that with a negative penicillin skin test, a course of ‐lactam is safe 2 hours after a negative challenge. However, we advise caution in generalizing these data to the outpatient setting where resensitization is a possibility. One study showed that 4.9% of patients who had negative skin tests and drug challenges reacted on rechallenges 3 weeks later.[2]
In our center, ‐lactam allergy assessment is carried out according to European Academy of Allergy and Clinical Immunology guidelines.[3] We encountered a patient who had life‐threatening anaphylaxis with co‐amoxiclav 1 month after negative allergy investigations.
A 43‐year‐old woman was referred with a history of non‐drug related urticarial episodes and urticaria and angioedema of face, neck, and arms 30 minutes after a first dose of oral co‐amoxiclav 2 years previously. Specific immunoglobulin E tests to penicillin and amoxicillin, skin tests, and oral co‐amoxiclav challenge were negative. A month later, she developed anaphylaxis (intraoral angioedema, wheeze, hypotension [70/30 mm Hg], oxygen desaturation to 60% on room air, becoming unresponsive) within minutes of an intravenous dose of co‐amoxiclav for acute cholecystitis.
Our case illustrates that despite a detailed negative allergy assessment, severe anaphylaxis can occur requiring prompt identification and appropriate treatment.
- , , , et al. The impact of penicillin skin testing on clinical practice and antimicrobial stewardship. J Hosp Med. 2013;8(6):342–345.
- , , , et al. J Investig Allergol Clin Immunol. 2012;22(1):41–47.
- , , , et al. Diagnosis of immediate allergic reactions to beta‐lactam antibiotics. Allergy. 2003;58:961–972.
JC Compliance in NJ Stroke Centers
Stroke is the fourth leading cause of death in the United States.[1] Though actual stroke‐related death has declined nationally by 19.4%, stroke‐related morbidity is still a significant burden.[2, 3] Hospital certification programs have been developed to improve the quality of stroke care on state and national levels. The Brain Attack Coalition (BAC) proposed 2 levels of stroke hospitals: primary stroke centers (PSCs) and comprehensive stroke centers (CSCs).[3, 4] Although most stroke patients can be cared for at PSCs, CSCs are able to care for more complex stroke patients.[4, 5] Using BAC recommendations the Joint Commission (JC) and American Heart Association/American Stroke Association created a certification program for PSCs. Eight evidence‐based performance measures are currently required for JC PSC certification.[6]
At the state level, New Jersey and Florida began designating PSCs and CSCs.[7, 8] New Jersey PSC and CSC designation criteria incorporate the elements of JC PSC certification, despite preceding them by several years.[6, 9] New Jersey CSC certification consists of more comprehensive requirements (Table 1). All New Jersey‐designated stroke centers submit data in the New Jersey Acute Stroke Registry (NJASR),[7] which closely matches the Centers for Disease Control and Prevention's Paul Coverdell National Acute Stroke Registry and includes the JC‐required core measures.
| Primary Stroke Center (N=53) | Comprehensive Stroke Center (N=12) |
|---|---|
| |
| Must have acute stroke teams in place at all times that can respond to the bedside within 15 minutes of patient arrival or identification | Must meet all criteria for primary stroke centers |
| Must maintain neurology and emergency department personnel trained in the treatment of acute stroke | Must maintain a neurosurgical team capable of assessing and treating complex stroke |
| Must maintain telemetry or critical care beds staffed by physicians and nurses trained in caring for acute stroke patients | Must maintain on staff a neuroradiologist (boarded) and a neurointerventionalist |
| Must provide for neurosurgical services within 2 hours either at the hospital or under agreement with a comprehensive stroke center | Must provide comprehensive rehabilitation services either on site or by transfer agreement |
| Must provide acute care rehabilitation services | Must provide MRI, CTA, and digital subtraction angiography |
| Must enter into a written transfer agreement with a comprehensive stroke center | Must develop and maintain sophisticated outcomes assessment and performance improvement capability |
| Must provide graduate medical education in stroke and carry out research in stroke | |
There is a paucity of data comparing state‐designated CSCs and PSCs, largely because few states have state designation programs. Although a recent observational study from Finland showed better outcomes in patients treated at CSCs, measures in that study were limited to mortality and institutionalization at 1 year.[10] In this study, we examined adherence of all New Jersey state‐designated stroke centers to the JC PSC measures and compared CSCs to PSCs in this regard. We posited that better compliance with these evidence‐based measures might translate into better quality of stroke care in the state and may lend support to future, larger studies that may be conducted because of the recent certification of CSCs by the JC.
METHODS
Components of the NJASR, key components of PSCs and CSCs in the BAC report, and the 8 JC's core stroke measures for PSC certification were assessed.[3, 4, 6]
First responders in New Jersey are required to bring suspected stroke patients to the nearest stroke‐designated hospital, regardless of whether it is a PSC or CSC, unless the patient is too medically unstable and needs to be taken to the nearest hospital. From there, decisions can be made to transfer a patient to a higher level hospital (CSC) depending on the complexity of the patient's condition.
New Jersey state‐designated PSCs and CSCs are required to abstract patient‐level data, evaluate outcomes, and initiate quality improvement activities on all patients evaluated for ischemic stroke, hemorrhagic stroke, transient ischemic attack (TIA), and those who undergo acute interventional therapy. Data are submitted quarterly to the New Jersey Department of Health and Senior Services (NJDHSS).[7] Hospital data are imported into the Acute Stroke Registry Database. The NJASR statewide dataset used for this analysis included all stroke admissions for the calendar years 2010 and 2011 and contains patient demographic information, health history, clinical investigations performed, treatments provided, and outcome measures that allow for risk‐adjusted assessment of outcomes.
The JC core stroke measures (STK‐1 thru 10 [except STK‐7 and 9]: venous thromboembolism [VTE] prophylaxis, discharged on antithrombotic therapy, anticoagulation therapy for atrial fibrillation/flutter, thrombolytic therapy, antithrombotic therapy by the end of hospital day 2, discharged on statin medication, stroke education, and assessment for rehabilitation) (except STK‐7 [dysphagia screening] and STK‐9 [smoking cessation/advice counseling]) apply only to acute ischemic and/or hemorrhagic stroke patients.
In our analysis, transferred patients and patients with a diagnosis of TIA, stroke not otherwise specified, and nonstroke‐related diagnoses were excluded. Hospital identity was kept anonymous through assignment of random numeric codes by the NJDHSS. Hospitals were categorized as CSC or PSC based on NJDHSS designation. Stroke severity on admission was assessed by categorizing National Institutes of Health Stroke Scale (NIHSS) scores into: no stroke when NIHSS=0, mild stroke when NIHSS=14, and moderate to severe stroke when NIHSS>5. Median door‐to‐thrombolytic drug times were assessed for both patients who arrived to the hospital within 2 hours of stroke symptom onset and received thrombolytic therapy within 3 hours, as well as patients who arrived within 3.5 hours (210 minutes) and received treatment within 4.5 hours (270 minutes).
Inclusion and Exclusion Criteria for JC Performance Measures
Excluded from all measures are patients who were discharged to hospice, left against medical advice (AMA), expired, were transferred to another short‐term care facility, had an unknown discharge location, comfort measures only (CMO), or enrolled in clinical trials. Other exclusions are listed below each measure. VTE prophylaxis included nonambulatory ischemic and hemorrhagic stroke patients who received VTE prophylaxis by end of hospital day 2 and excluded patients discharged prior to hospital day 2 and with length of stay >120 days. Antithrombotics at discharge included ischemic stroke patients discharged on antithrombotics and excluded those with documented reason for not receiving antithrombotics. Anticoagulation for atrial fibrillation included ischemic stroke patients with documented atrial fibrillation/flutter who received anticoagulation therapy and excluded those with documented reason for not receiving anticoagulation. Thrombolytic therapy included acute ischemic stroke patients who arrived at the hospital within 2 hours from time last known well and for whom intravenous (IV) tissue plasminogen activator (tPA) was initiated at that hospital within 1hour of hospital arrival. Excluded were patients with valid reason for not getting tPA, length of stay >120 days, and time last known well >2 hours. We also looked at thrombolytic therapy for patients who arrived by 3.5 hours from time last known well and received IV‐tPA within 1 hour.
Antithrombotics by the end of hospital day 2 included ischemic stroke patients who received antithrombotic medication by the end of hospital day 2 and excluded patients who were discharged before hospital day 2, had a documented reason for not receiving antithrombotic medication, had a length of stay greater >120 days, were CMO by day 2, and patients who received IV or intra‐arterial tPA. Statin therapy included ischemic stroke patients with low‐density lipoprotein exceeding 100 mg/dL or not measured, or on cholesterol‐reducing medication prior to admission. Excluded were those with length of stay >120 days and a documented reason for not receiving medication. Stroke education on discharge included all stroke patients being discharged home who received education during the hospitalization addressing the following: patient's stroke‐specific risk factors, warning signs and symptoms, emergency medical services activation, follow‐up, and discharge medications. Those with length of stay >120 days were excluded. Assessment for rehabilitation included ischemic and hemorrhagic patients assessed for rehabilitation services.
Statistical Analysis
Patient characteristics were summarized using frequencies and percentages for categorical variables as well as median and interquartile range for continuous variables. 2 tests and median 2‐sample tests were used to compare patient characteristics between the 2 hospital levels. The likelihood that a patient received a particular JC core measure service in relation to hospital level (PSC vs CSC) was estimated using a multiple logistic regression analysis for both the crude/unadjusted and adjusted odds ratios, and their 95% confidence intervals were estimated. Gender, age, race, stroke type, medical history (hypertension, atrial fibrillation, diabetes mellitus, and history of smoking), and severity of stroke as measured by NIHSS were included in the model. Institutional review board approval to evaluate the data for this analysis was obtained from John F. Kennedy Medical Center in Edison, New Jersey. All analyses were performed using SAS software package version 9.3 (SAS Institute, Cary, NC).
RESULTS
There were 36,892 acute stroke cases treated at the 53 New Jersey PSCs and 12 CSCs in the calendar year 2010 and 2011 (Table 2). Sixty percent were treated at PSCs and 40% at CSCs. There were significant differences in the distribution of patients' characteristics (race, age, and gender) between the 2 hospital levels. At both PSCs and CSCs, the majority of patients were white, distantly followed by blacks. Patients at PSCs were statistically significantly older than CSCs. The most prevalent comorbid conditions in both PSCs and CSCs were hypertension, diabetes mellitus, and dyslipidemia. Based on our categorization, we found that 45% of patients admitted to CSCs had moderate‐to‐severe stroke (NIHSS>5). The median door‐to‐thrombolytic drug times were significantly shorter at CSCs than PSCs for both the 3‐hour (65 vs 74 minutes, P<0.0001) and 4.5 hour (65 vs 76 minutes, P<0.0001) IV tPA time windows.
| Variables | PSCs, N=22,305 | CSCs, N=14,587 | P Valuea |
|---|---|---|---|
| |||
| Race, n (%) | <0.0001 | ||
| White | 16,586 (74.4) | 10,419 (71.4) | |
| Black | 3,930 (17.6) | 2,875 (19.7) | |
| Asian | 511 (2.3) | 519 (3.6) | |
| All othersb | 1,278 (5.7) | 774 (5.3) | |
| Age, y, median (IQR) | 75.0 (22.0) | 73.0 (23.0) | <0.0001c |
| Gender, female, n (%) | 12,552 (56.3) | 7,757 (53.2) | <0.0001 |
| Comorbidities | |||
| Hypertension, n (%) | 17,405 (78.1) | 10,535 (72.2) | <0.0001 |
| Atrial fibrillation/flutter, n (%) | 3,762 (16.9) | 2,237 (15.3) | 0.0001 |
| Diabetes mellitus, n (%) | 7,219 (32.4) | 4,220 (28.9) | <0.0001 |
| History of smoking, n (%) | 2,924 (13.1) | 1,706 (11.7) | <0.0001 |
| Heart failure, n (%) | 1,733 (7.8) | 749 (5.1) | <0.0001 |
| Myocardial infarction, n (%) | 6,138 (27.5) | 2,945 (20.3) | <0.0001 |
| Dyslipidemia, n (%) | 10,106 (45.6) | 5,161 (35.4) | <0.0001 |
| Prior stroke/TIA/VBI, n (%) | 7,085 (31.8) | 3,874 (26.6) | <0.0001 |
| NIHSS on admission, n (%) | <0.0001 | ||
| No stroke (NIHSS=0) | 2,747 (27.4) | 913 (18.3) | |
| Mild stroke (NIHSS=14) | 4,010 (40.0) | 1,811 (33.3) | |
| Moderatesevere (NIHSS >5) | 3,272 (32.6) | 2,271 (45.4) | |
| Door‐to‐tPA time, min, median (IQR) | |||
| Arrived within 120 minutes | 74.0 (35.0) | 65.0 (33.0) | <0.0001c |
| Arrived within 210 minutes | 76.0 (37.0) | 65.0 (34.0) | <0.0001c |
| Stroke diagnosis, distribution | <0.0001 | ||
| Ischemic | 11,145 (50.0) | 8,235 (56.5) | |
| Hemorrhagic | 1,587 (7.1) | 3,270 (13.3) | |
| Subarachnoid | 219 (13.8) | 397 (20.4) | |
| Intracerebral | 1,368 (86.2) | 1,545 (79.6) | |
| Transient ischemic attack | 8,116 (36.4) | 4,162 (28.5) | |
| Stroke not otherwise specified | 1,145 (5.1) | 130 (0.9) | |
| No stroke‐related diagnosis | 293 (1.3) | 118 (0.8) | |
The incidences of stroke diagnosis types are also detailed in Table 2. Seventy percent of patients at CSCs had either an ischemic or hemorrhagic stroke diagnosis versus 57.1% of patients admitted at PSCs. Hemorrhagic stroke patients were twice as likely to be admitted at CSCs compared to PSCs.
After excluding 13,964 patients with a diagnosis of TIA, stroke not otherwise specified, and those with nonstroke‐related diagnosis, the likelihood of stroke patients' receiving the JC's performance measure services at either of these hospital levels was assessed (Table 3). In general, the adjusted odds ratio estimates of patients receiving a JC core performance measure at PSCs were lower than CSCs, indicating better compliance with the measures at CSCs. For example, 19.5% of eligible patients received thrombolytic therapy at CSCs compared to 9.6% at PSCs. CSCs also were more likely to provide VTE prophylaxis, anticoagulation for atrial fibrillation, and assessment for rehabilitation. Stroke education and antithrombotic therapy by the end of hospital day 2 were more likely to be provided at PSCs, but the results were not statistically significant.
| Variables | Hospital Levelsa | Odds Ratio (95% CI) | ||
|---|---|---|---|---|
| PSCs, N (%) | CSCs, N (%) | Unadjusted | Adjustedb | |
| ||||
| VTE prophylaxis | 4,745 (92.1) | 5,455 (94.2) | 0.72 (0.610.83) | 0.47 (0.330.67) |
| Discharged on antithrombotic therapy | 8,835 (98.1) | 6,873 (99.2) | 0.42 (0.310.56) | 0.46 (0.270.78) |
| Anticoagulation therapy for atrial fibrillation/flutter | 1,464 (95.1) | 1,144 (97.6) | 0.48 (0.310.74) | 0.38 (0.170.86) |
| Thrombolytic therapy | ||||
| Time window=3.0 hours | 484 (9.6) | 666 (19.5) | 0.44 (0.390.50) | 0.28 (0.240.34) |
| Time window=4.5 hours | 564 (11.0) | 792 (22.4) | 0.43 (0.380.48) | 0.28 (0.230.33) |
| Antithrombotic therapy by end of hospital day 2 | 7,575 (97.4) | 5,396 (98.2) | 0.69 (0.540.88) | 1.01 (0.601.68) |
| Discharged on statin medication | 6,035 (97.9) | 4,261 (98.7) | 0.59 (0.430.80) | 0.69 (0.421.13) |
| Stroke education, for home discharge (overall) | 3,823 (97.7) | 3,072 (95.7) | 1.93 (1.472.53) | 1.78 (0.923.45) |
| Risk factors for stroke | 3,480 (88.9) | 3,026 (94.4) | 0.49 (0.410.59) | 0.43 (0.280.66) |
| Warning sign and symptoms | 3,514 (89.8) | 3,019 (94.1) | 0.56 (0.460.67) | 0.52 (0.340.79) |
| Activation of EMS | 3,539 (90.5) | 3,023 (94.2) | 0.59 (0.490.70) | 0.44 (0.280.69) |
| Followup after discharge | 3,807 (97.3) | 3,064 (95.5) | 1.73 (1.342.23) | 1.18 (0.652.20) |
| Medications prescribed at discharge | 3,788 (96.8) | 3,067 (95.5) | 1.42 (1.111.82) | 0.44 (0.280.70) |
| Assessed for rehabilitation | 9,725 (95.2) | 8,199 (97.5) | 0.51 (0.430.61) | 0.37 (0.260.53) |
DISCUSSION
In New Jersey, CSCs were more likely to adhere better to JC core performance measures than PSCs. Median door‐to‐thrombolytic drug times were also significantly lower at CSCs. Such differences may be due to several factors including the fact that CSCs have generally been state designated for a longer period of time than PSCs. CSCs are likely to have higher volumes of stroke admissions, are more likely to be JC certified, provide more staff education, and have more staff and resources. The New Jersey stroke designation program began in 2006, and 11 of the 12 CSCs were designated by the end of 2007. However, the PSC designation process has been more gradual, with several of them designated in 2010 and 2011 as the data for this study were being collected.
The New York State Stroke Center Designation Project prospectively showed that stroke center designation improved the quality of acute stroke patient care and administration of thrombolytic therapy; however, differing levels of hospital designation were not present in New York at that time.[11] Participation in a data measurement program such as Get With The Guidelines has also been examined. It is evident that the amount of time in a program is predictive of process measure compliance.[12] JC certification as a PSC is also associated with increased thrombolytic rates for acute stroke over time.[13] New Jersey does not require that stroke‐designated hospitals have JC stroke certification. Although 11 New Jersey CSCs have been certified as JC PSCs since 2009, only 21 of the 53 state‐designated PSCs are JC certified. It may be that the highest performing sites pursue state CSC designation and JC PSC certification/recertification repeatedly. CSCs in New Jersey may also have a greater focus on quality measures by virtue of having been in quality programs such as Get With The Guidelines or by having been state designated and JC certified for a longer period of time.
The New Jersey requirements for CSCs, like those of the JC, include a large number of highly trained stroke experts, which ensures more continuous coverage. Although a disparity in mortality on weekends versus weekdays has been reported,[14] such a difference in mortality has not been seen at CSCs in New Jersey.[15] This lack of a weekend effect is felt to be related to the 24/7 availability of stroke specialists, advanced neuroimaging, ongoing training, and surveillance of specialized nursing care available at CSCs.[4, 16]
In our study, New Jersey CSCs overall had significantly higher rates of thrombolysis compared to PSCs (19.5% vs 9.6%) when looking at the 3‐hour window. This is higher overall than the national rate of 3.4% to 5.2%.[17] The number of patients treated in the expanded thrombolytic window were also significantly higher at CSCs, increasing thrombolysis rates to 22.4% at CSCs versus the 11% at PSCs. Door‐to‐drug times were also shorter at CSCs than PSCs in the 3‐ and 4.5‐hour windows (65 vs 74 minutes and 65 minutes vs 76 minutes, respectively). After we excluded transferred patients and those with a diagnosis of TIA, stroke not otherwise specified, and those with nonstroke‐related diagnoses, the total number of ischemic and hemorrhagic stroke patients seen at each of the 12 CSCs (n=11,505) was on average 4 times higher than the number seen at each of the 53 PSCs (n=12,732). High annual hospital stroke volume has been shown to be associated with higher rates of thrombolysis and lower stroke mortality.[14] A study of US academic centers found that although the same percentage of patients presented within 2 hours of stroke symptom onset in 2001 and 2004, the use of IV tPA more than doubled over this time period.[18] Improved system organization at the prehospital and hospital levels as well as greater comfort and experience with use of thrombolytic therapy likely contribute to all of these findings.[11]
CSCs did not outperform PSCs with regard to stroke education and antithrombotics by end of hospital day 2, but these results were not statistically significant. The former measure includes only stroke patients who are discharged home and is considered complete when all 5 of the following are addressed: risk factors for stroke, warning signs and symptoms for stroke, activation of emergency medical systems, follow‐up after discharge, and medications prescribed at discharge. CSCs were more likely to provide education for the first 3 and last component but less likely for the fourth element. These findings should be considered in the context of CSCs having higher volumes of more ill and complex patients who are more likely to be discharged to a rehabilitation hospital, nursing home, or other facility than to home. In our registry, CSCs discharged 46% of patients' to home versus 54% at PSCs. We speculate that CSCs may be less likely to habitually address follow‐up care and discharge medications as compared to PSCs. As far as provision of antithrombotics by hospital day 2, it is possible again that because CSCs have a higher number of complicated stroke patients, many may have had contraindications to use of antithrombotics in that time period.
Limitations of this study include the fact that this was a retrospective analysis of a database. Although the 2010 and 2011 NJASR dataset was sizeable, it was not possible to capture all potentially confounding variables that may have affected our point estimates. We were not able to perform a hierarchical analysis to account for clustering at the hospital level because of limited data available in the registry. Errors in recording data, coding, and documentation cannot be excluded. The fact that not all PSCs were necessarily JC certified may have contributed to the observed differences. Also, because pursuing PSC or CSC status is voluntary, it is not clear if the hospitals that chose CSC status were different in other unmeasured factors than those that chose PSC status, and the difference may have existed even in the absence of the designation program. Over the years, there have been changes in the criteria required by the state and the JC for PSC designation, although the larger differences between hospital levels remained intact. This may have limited our findings as well. The goal for hospitals is to continue strict adherence to policies and measures and thus improve quality of care for stroke patients. Future prospective studies should be conducted to ascertain validity and generalizability of our findings. Association of stroke measure adherence and functional outcomes would also be of interest. We were not able to measure this consistently in our study because not all patients at PSCs had admission and/or discharge NIHSS or modified Rankin Score. Although some studies have not shown an association between improved outcomes and higher performance on quality measures, we would like to look at this more closely in the stroke population.[19] As our database gets larger, we would like to reexamine our findings after correcting for more specific characteristics of each hospital. In the future, if additional states designate centers by level of stroke care, it will be important to compare how such designations compare to nonprofit organization certifications in terms of impacting performance on a larger scale.
CONCLUSION
This study shows better compliance of New Jersey state‐designated CSCs with the JC PSC core stroke measures and better mean door‐to‐thrombolytic drug times. Because these measures are evidence based, these results may translate into better stroke care and outcomes for patients treated at state‐designated CSCs.
ACKNOWLEDGEMENTS
Disclosures: Jawad Kirmani, MD: Consultant to Joint Commission on Performance Measure Development (modest). Martin Gizzi, MD, PhD: Consultant to Joint Commission on Performance Measure Development (modest), New Jersey Department of Health and Senior Services as chair of the Stroke Advisory Panel (significant). No other potential conflicts to report.
- Centers for Disease Control and Prevention. Interactive atlas of heart disease and stroke. Available at: http://apps.Nccd.Cdc.Gov/dhdspatlas/reports.Aspx. Accessed May 5, 2012.
- , , , et al.; American Heart Association Statistics Committee and Stroke Statistics Subcommittee. Heart disease and stroke statistics—2012 update: a report from the American Heart Association. Circulation. 2012;125:e2–e220.
- , , , et al. Recommendations for the establishment of primary stroke centers. JAMA. 2000;283:3102–3109.
- , , , et al.; Brain Attack Coalition. Recommendations for comprehensive stroke centers: a consensus statement from the Brain Attack Coalition. Stroke. 2005;36:1597–1616.
- , , , et al. Recommendations for the establishment of stroke systems of care. Stroke. 2005;36:690–703.
- The Joint Commission. Advanced Certification Comprehensive Stroke Centers. Available at: http://www.jointcommission.org/certification/advanced_certification_comprehensive_stroke_centers.aspx. Accessed July 25, 2012.
- New Jersey Department of Health and Senior Services: The New Jersey Acute Stroke Registry. Available at: http://www.state.nj.us/health/healthcarequality/stroke/documents/njacute_stroke_data_dictionary.pdf. Accessed July 8, 2012.
- Florida Agency for Health Care Administration. Primary stroke center and comprehensive stroke center designation. Available at: http://ahca.myflorida.com/mchq/Health_Facility_Regulation/Hospital_Outpatient/forms/59A3_2085_FAC_Rule_text.pdf. Accessed July 25, 2012.
- New Jersey Department of Health and Senior Services. Stroke Center Act (2004). Available at: http://www.njleg.state.nj.us/2004/bills/pl04/136_.pdf. Accessed September 25, 2013.
- , , , et al. Effectiveness of primary and comprehensive stroke centers. Stroke. 2010;41:1102–1107.
- , , , et al.; NYSDOH Stroke Center Designation Project Workgroup. Quality improvement in acute stroke: The New York State Stroke Center Designation Project. Neurology. 2006;67(1):88–93.
- , , , et al. Characteristics, performance measures, and in‐hospital outcomes of the first one million stroke and transient ischemic attack admissions in get with the guidelines‐stroke. Circ Cardiovasc Qual Outcomes. 2010;3(3):291–302.
- , , , et al. Intravenous thrombolysis for stroke increases over time at primary stroke centers. Stroke. 2012;43:875–877.
- , , , et al. Weekends: a dangerous time for having a stroke? Stroke. 2007;38:1211–1215.
- , , , et al.; Myocardial Infarction Data Acquisition System (MIDAS 15) Study Group. Comprehensive stroke centers overcome the weekend versus weekday gap in stroke treatment and mortality. Stroke. 2011;42:2403–2409.
- , , , et al. Can comprehensive stroke centers erase the “weekend effect”? Cerebrovasc Dis. 2009;27:107–113.
- , , , et al. Recombinant tissue‐type plasminogen activator use for ischemic stroke in the United States. Stroke. 2011;42:1952–1955.
- , , , et al. Hospital arrival time and intravenous t‐PA use in US academic medical centers, 2001–2004. Stroke. 2009;40:3845–3850.
- , , , et al. Association of surgical care improvement project infection‐related process measure compliance with risk‐adjusted outcomes: implications for quality measurement. J Am Coll Surg. 2010;211(6):705–714.
Stroke is the fourth leading cause of death in the United States.[1] Though actual stroke‐related death has declined nationally by 19.4%, stroke‐related morbidity is still a significant burden.[2, 3] Hospital certification programs have been developed to improve the quality of stroke care on state and national levels. The Brain Attack Coalition (BAC) proposed 2 levels of stroke hospitals: primary stroke centers (PSCs) and comprehensive stroke centers (CSCs).[3, 4] Although most stroke patients can be cared for at PSCs, CSCs are able to care for more complex stroke patients.[4, 5] Using BAC recommendations the Joint Commission (JC) and American Heart Association/American Stroke Association created a certification program for PSCs. Eight evidence‐based performance measures are currently required for JC PSC certification.[6]
At the state level, New Jersey and Florida began designating PSCs and CSCs.[7, 8] New Jersey PSC and CSC designation criteria incorporate the elements of JC PSC certification, despite preceding them by several years.[6, 9] New Jersey CSC certification consists of more comprehensive requirements (Table 1). All New Jersey‐designated stroke centers submit data in the New Jersey Acute Stroke Registry (NJASR),[7] which closely matches the Centers for Disease Control and Prevention's Paul Coverdell National Acute Stroke Registry and includes the JC‐required core measures.
| Primary Stroke Center (N=53) | Comprehensive Stroke Center (N=12) |
|---|---|
| |
| Must have acute stroke teams in place at all times that can respond to the bedside within 15 minutes of patient arrival or identification | Must meet all criteria for primary stroke centers |
| Must maintain neurology and emergency department personnel trained in the treatment of acute stroke | Must maintain a neurosurgical team capable of assessing and treating complex stroke |
| Must maintain telemetry or critical care beds staffed by physicians and nurses trained in caring for acute stroke patients | Must maintain on staff a neuroradiologist (boarded) and a neurointerventionalist |
| Must provide for neurosurgical services within 2 hours either at the hospital or under agreement with a comprehensive stroke center | Must provide comprehensive rehabilitation services either on site or by transfer agreement |
| Must provide acute care rehabilitation services | Must provide MRI, CTA, and digital subtraction angiography |
| Must enter into a written transfer agreement with a comprehensive stroke center | Must develop and maintain sophisticated outcomes assessment and performance improvement capability |
| Must provide graduate medical education in stroke and carry out research in stroke | |
There is a paucity of data comparing state‐designated CSCs and PSCs, largely because few states have state designation programs. Although a recent observational study from Finland showed better outcomes in patients treated at CSCs, measures in that study were limited to mortality and institutionalization at 1 year.[10] In this study, we examined adherence of all New Jersey state‐designated stroke centers to the JC PSC measures and compared CSCs to PSCs in this regard. We posited that better compliance with these evidence‐based measures might translate into better quality of stroke care in the state and may lend support to future, larger studies that may be conducted because of the recent certification of CSCs by the JC.
METHODS
Components of the NJASR, key components of PSCs and CSCs in the BAC report, and the 8 JC's core stroke measures for PSC certification were assessed.[3, 4, 6]
First responders in New Jersey are required to bring suspected stroke patients to the nearest stroke‐designated hospital, regardless of whether it is a PSC or CSC, unless the patient is too medically unstable and needs to be taken to the nearest hospital. From there, decisions can be made to transfer a patient to a higher level hospital (CSC) depending on the complexity of the patient's condition.
New Jersey state‐designated PSCs and CSCs are required to abstract patient‐level data, evaluate outcomes, and initiate quality improvement activities on all patients evaluated for ischemic stroke, hemorrhagic stroke, transient ischemic attack (TIA), and those who undergo acute interventional therapy. Data are submitted quarterly to the New Jersey Department of Health and Senior Services (NJDHSS).[7] Hospital data are imported into the Acute Stroke Registry Database. The NJASR statewide dataset used for this analysis included all stroke admissions for the calendar years 2010 and 2011 and contains patient demographic information, health history, clinical investigations performed, treatments provided, and outcome measures that allow for risk‐adjusted assessment of outcomes.
The JC core stroke measures (STK‐1 thru 10 [except STK‐7 and 9]: venous thromboembolism [VTE] prophylaxis, discharged on antithrombotic therapy, anticoagulation therapy for atrial fibrillation/flutter, thrombolytic therapy, antithrombotic therapy by the end of hospital day 2, discharged on statin medication, stroke education, and assessment for rehabilitation) (except STK‐7 [dysphagia screening] and STK‐9 [smoking cessation/advice counseling]) apply only to acute ischemic and/or hemorrhagic stroke patients.
In our analysis, transferred patients and patients with a diagnosis of TIA, stroke not otherwise specified, and nonstroke‐related diagnoses were excluded. Hospital identity was kept anonymous through assignment of random numeric codes by the NJDHSS. Hospitals were categorized as CSC or PSC based on NJDHSS designation. Stroke severity on admission was assessed by categorizing National Institutes of Health Stroke Scale (NIHSS) scores into: no stroke when NIHSS=0, mild stroke when NIHSS=14, and moderate to severe stroke when NIHSS>5. Median door‐to‐thrombolytic drug times were assessed for both patients who arrived to the hospital within 2 hours of stroke symptom onset and received thrombolytic therapy within 3 hours, as well as patients who arrived within 3.5 hours (210 minutes) and received treatment within 4.5 hours (270 minutes).
Inclusion and Exclusion Criteria for JC Performance Measures
Excluded from all measures are patients who were discharged to hospice, left against medical advice (AMA), expired, were transferred to another short‐term care facility, had an unknown discharge location, comfort measures only (CMO), or enrolled in clinical trials. Other exclusions are listed below each measure. VTE prophylaxis included nonambulatory ischemic and hemorrhagic stroke patients who received VTE prophylaxis by end of hospital day 2 and excluded patients discharged prior to hospital day 2 and with length of stay >120 days. Antithrombotics at discharge included ischemic stroke patients discharged on antithrombotics and excluded those with documented reason for not receiving antithrombotics. Anticoagulation for atrial fibrillation included ischemic stroke patients with documented atrial fibrillation/flutter who received anticoagulation therapy and excluded those with documented reason for not receiving anticoagulation. Thrombolytic therapy included acute ischemic stroke patients who arrived at the hospital within 2 hours from time last known well and for whom intravenous (IV) tissue plasminogen activator (tPA) was initiated at that hospital within 1hour of hospital arrival. Excluded were patients with valid reason for not getting tPA, length of stay >120 days, and time last known well >2 hours. We also looked at thrombolytic therapy for patients who arrived by 3.5 hours from time last known well and received IV‐tPA within 1 hour.
Antithrombotics by the end of hospital day 2 included ischemic stroke patients who received antithrombotic medication by the end of hospital day 2 and excluded patients who were discharged before hospital day 2, had a documented reason for not receiving antithrombotic medication, had a length of stay greater >120 days, were CMO by day 2, and patients who received IV or intra‐arterial tPA. Statin therapy included ischemic stroke patients with low‐density lipoprotein exceeding 100 mg/dL or not measured, or on cholesterol‐reducing medication prior to admission. Excluded were those with length of stay >120 days and a documented reason for not receiving medication. Stroke education on discharge included all stroke patients being discharged home who received education during the hospitalization addressing the following: patient's stroke‐specific risk factors, warning signs and symptoms, emergency medical services activation, follow‐up, and discharge medications. Those with length of stay >120 days were excluded. Assessment for rehabilitation included ischemic and hemorrhagic patients assessed for rehabilitation services.
Statistical Analysis
Patient characteristics were summarized using frequencies and percentages for categorical variables as well as median and interquartile range for continuous variables. 2 tests and median 2‐sample tests were used to compare patient characteristics between the 2 hospital levels. The likelihood that a patient received a particular JC core measure service in relation to hospital level (PSC vs CSC) was estimated using a multiple logistic regression analysis for both the crude/unadjusted and adjusted odds ratios, and their 95% confidence intervals were estimated. Gender, age, race, stroke type, medical history (hypertension, atrial fibrillation, diabetes mellitus, and history of smoking), and severity of stroke as measured by NIHSS were included in the model. Institutional review board approval to evaluate the data for this analysis was obtained from John F. Kennedy Medical Center in Edison, New Jersey. All analyses were performed using SAS software package version 9.3 (SAS Institute, Cary, NC).
RESULTS
There were 36,892 acute stroke cases treated at the 53 New Jersey PSCs and 12 CSCs in the calendar year 2010 and 2011 (Table 2). Sixty percent were treated at PSCs and 40% at CSCs. There were significant differences in the distribution of patients' characteristics (race, age, and gender) between the 2 hospital levels. At both PSCs and CSCs, the majority of patients were white, distantly followed by blacks. Patients at PSCs were statistically significantly older than CSCs. The most prevalent comorbid conditions in both PSCs and CSCs were hypertension, diabetes mellitus, and dyslipidemia. Based on our categorization, we found that 45% of patients admitted to CSCs had moderate‐to‐severe stroke (NIHSS>5). The median door‐to‐thrombolytic drug times were significantly shorter at CSCs than PSCs for both the 3‐hour (65 vs 74 minutes, P<0.0001) and 4.5 hour (65 vs 76 minutes, P<0.0001) IV tPA time windows.
| Variables | PSCs, N=22,305 | CSCs, N=14,587 | P Valuea |
|---|---|---|---|
| |||
| Race, n (%) | <0.0001 | ||
| White | 16,586 (74.4) | 10,419 (71.4) | |
| Black | 3,930 (17.6) | 2,875 (19.7) | |
| Asian | 511 (2.3) | 519 (3.6) | |
| All othersb | 1,278 (5.7) | 774 (5.3) | |
| Age, y, median (IQR) | 75.0 (22.0) | 73.0 (23.0) | <0.0001c |
| Gender, female, n (%) | 12,552 (56.3) | 7,757 (53.2) | <0.0001 |
| Comorbidities | |||
| Hypertension, n (%) | 17,405 (78.1) | 10,535 (72.2) | <0.0001 |
| Atrial fibrillation/flutter, n (%) | 3,762 (16.9) | 2,237 (15.3) | 0.0001 |
| Diabetes mellitus, n (%) | 7,219 (32.4) | 4,220 (28.9) | <0.0001 |
| History of smoking, n (%) | 2,924 (13.1) | 1,706 (11.7) | <0.0001 |
| Heart failure, n (%) | 1,733 (7.8) | 749 (5.1) | <0.0001 |
| Myocardial infarction, n (%) | 6,138 (27.5) | 2,945 (20.3) | <0.0001 |
| Dyslipidemia, n (%) | 10,106 (45.6) | 5,161 (35.4) | <0.0001 |
| Prior stroke/TIA/VBI, n (%) | 7,085 (31.8) | 3,874 (26.6) | <0.0001 |
| NIHSS on admission, n (%) | <0.0001 | ||
| No stroke (NIHSS=0) | 2,747 (27.4) | 913 (18.3) | |
| Mild stroke (NIHSS=14) | 4,010 (40.0) | 1,811 (33.3) | |
| Moderatesevere (NIHSS >5) | 3,272 (32.6) | 2,271 (45.4) | |
| Door‐to‐tPA time, min, median (IQR) | |||
| Arrived within 120 minutes | 74.0 (35.0) | 65.0 (33.0) | <0.0001c |
| Arrived within 210 minutes | 76.0 (37.0) | 65.0 (34.0) | <0.0001c |
| Stroke diagnosis, distribution | <0.0001 | ||
| Ischemic | 11,145 (50.0) | 8,235 (56.5) | |
| Hemorrhagic | 1,587 (7.1) | 3,270 (13.3) | |
| Subarachnoid | 219 (13.8) | 397 (20.4) | |
| Intracerebral | 1,368 (86.2) | 1,545 (79.6) | |
| Transient ischemic attack | 8,116 (36.4) | 4,162 (28.5) | |
| Stroke not otherwise specified | 1,145 (5.1) | 130 (0.9) | |
| No stroke‐related diagnosis | 293 (1.3) | 118 (0.8) | |
The incidences of stroke diagnosis types are also detailed in Table 2. Seventy percent of patients at CSCs had either an ischemic or hemorrhagic stroke diagnosis versus 57.1% of patients admitted at PSCs. Hemorrhagic stroke patients were twice as likely to be admitted at CSCs compared to PSCs.
After excluding 13,964 patients with a diagnosis of TIA, stroke not otherwise specified, and those with nonstroke‐related diagnosis, the likelihood of stroke patients' receiving the JC's performance measure services at either of these hospital levels was assessed (Table 3). In general, the adjusted odds ratio estimates of patients receiving a JC core performance measure at PSCs were lower than CSCs, indicating better compliance with the measures at CSCs. For example, 19.5% of eligible patients received thrombolytic therapy at CSCs compared to 9.6% at PSCs. CSCs also were more likely to provide VTE prophylaxis, anticoagulation for atrial fibrillation, and assessment for rehabilitation. Stroke education and antithrombotic therapy by the end of hospital day 2 were more likely to be provided at PSCs, but the results were not statistically significant.
| Variables | Hospital Levelsa | Odds Ratio (95% CI) | ||
|---|---|---|---|---|
| PSCs, N (%) | CSCs, N (%) | Unadjusted | Adjustedb | |
| ||||
| VTE prophylaxis | 4,745 (92.1) | 5,455 (94.2) | 0.72 (0.610.83) | 0.47 (0.330.67) |
| Discharged on antithrombotic therapy | 8,835 (98.1) | 6,873 (99.2) | 0.42 (0.310.56) | 0.46 (0.270.78) |
| Anticoagulation therapy for atrial fibrillation/flutter | 1,464 (95.1) | 1,144 (97.6) | 0.48 (0.310.74) | 0.38 (0.170.86) |
| Thrombolytic therapy | ||||
| Time window=3.0 hours | 484 (9.6) | 666 (19.5) | 0.44 (0.390.50) | 0.28 (0.240.34) |
| Time window=4.5 hours | 564 (11.0) | 792 (22.4) | 0.43 (0.380.48) | 0.28 (0.230.33) |
| Antithrombotic therapy by end of hospital day 2 | 7,575 (97.4) | 5,396 (98.2) | 0.69 (0.540.88) | 1.01 (0.601.68) |
| Discharged on statin medication | 6,035 (97.9) | 4,261 (98.7) | 0.59 (0.430.80) | 0.69 (0.421.13) |
| Stroke education, for home discharge (overall) | 3,823 (97.7) | 3,072 (95.7) | 1.93 (1.472.53) | 1.78 (0.923.45) |
| Risk factors for stroke | 3,480 (88.9) | 3,026 (94.4) | 0.49 (0.410.59) | 0.43 (0.280.66) |
| Warning sign and symptoms | 3,514 (89.8) | 3,019 (94.1) | 0.56 (0.460.67) | 0.52 (0.340.79) |
| Activation of EMS | 3,539 (90.5) | 3,023 (94.2) | 0.59 (0.490.70) | 0.44 (0.280.69) |
| Followup after discharge | 3,807 (97.3) | 3,064 (95.5) | 1.73 (1.342.23) | 1.18 (0.652.20) |
| Medications prescribed at discharge | 3,788 (96.8) | 3,067 (95.5) | 1.42 (1.111.82) | 0.44 (0.280.70) |
| Assessed for rehabilitation | 9,725 (95.2) | 8,199 (97.5) | 0.51 (0.430.61) | 0.37 (0.260.53) |
DISCUSSION
In New Jersey, CSCs were more likely to adhere better to JC core performance measures than PSCs. Median door‐to‐thrombolytic drug times were also significantly lower at CSCs. Such differences may be due to several factors including the fact that CSCs have generally been state designated for a longer period of time than PSCs. CSCs are likely to have higher volumes of stroke admissions, are more likely to be JC certified, provide more staff education, and have more staff and resources. The New Jersey stroke designation program began in 2006, and 11 of the 12 CSCs were designated by the end of 2007. However, the PSC designation process has been more gradual, with several of them designated in 2010 and 2011 as the data for this study were being collected.
The New York State Stroke Center Designation Project prospectively showed that stroke center designation improved the quality of acute stroke patient care and administration of thrombolytic therapy; however, differing levels of hospital designation were not present in New York at that time.[11] Participation in a data measurement program such as Get With The Guidelines has also been examined. It is evident that the amount of time in a program is predictive of process measure compliance.[12] JC certification as a PSC is also associated with increased thrombolytic rates for acute stroke over time.[13] New Jersey does not require that stroke‐designated hospitals have JC stroke certification. Although 11 New Jersey CSCs have been certified as JC PSCs since 2009, only 21 of the 53 state‐designated PSCs are JC certified. It may be that the highest performing sites pursue state CSC designation and JC PSC certification/recertification repeatedly. CSCs in New Jersey may also have a greater focus on quality measures by virtue of having been in quality programs such as Get With The Guidelines or by having been state designated and JC certified for a longer period of time.
The New Jersey requirements for CSCs, like those of the JC, include a large number of highly trained stroke experts, which ensures more continuous coverage. Although a disparity in mortality on weekends versus weekdays has been reported,[14] such a difference in mortality has not been seen at CSCs in New Jersey.[15] This lack of a weekend effect is felt to be related to the 24/7 availability of stroke specialists, advanced neuroimaging, ongoing training, and surveillance of specialized nursing care available at CSCs.[4, 16]
In our study, New Jersey CSCs overall had significantly higher rates of thrombolysis compared to PSCs (19.5% vs 9.6%) when looking at the 3‐hour window. This is higher overall than the national rate of 3.4% to 5.2%.[17] The number of patients treated in the expanded thrombolytic window were also significantly higher at CSCs, increasing thrombolysis rates to 22.4% at CSCs versus the 11% at PSCs. Door‐to‐drug times were also shorter at CSCs than PSCs in the 3‐ and 4.5‐hour windows (65 vs 74 minutes and 65 minutes vs 76 minutes, respectively). After we excluded transferred patients and those with a diagnosis of TIA, stroke not otherwise specified, and those with nonstroke‐related diagnoses, the total number of ischemic and hemorrhagic stroke patients seen at each of the 12 CSCs (n=11,505) was on average 4 times higher than the number seen at each of the 53 PSCs (n=12,732). High annual hospital stroke volume has been shown to be associated with higher rates of thrombolysis and lower stroke mortality.[14] A study of US academic centers found that although the same percentage of patients presented within 2 hours of stroke symptom onset in 2001 and 2004, the use of IV tPA more than doubled over this time period.[18] Improved system organization at the prehospital and hospital levels as well as greater comfort and experience with use of thrombolytic therapy likely contribute to all of these findings.[11]
CSCs did not outperform PSCs with regard to stroke education and antithrombotics by end of hospital day 2, but these results were not statistically significant. The former measure includes only stroke patients who are discharged home and is considered complete when all 5 of the following are addressed: risk factors for stroke, warning signs and symptoms for stroke, activation of emergency medical systems, follow‐up after discharge, and medications prescribed at discharge. CSCs were more likely to provide education for the first 3 and last component but less likely for the fourth element. These findings should be considered in the context of CSCs having higher volumes of more ill and complex patients who are more likely to be discharged to a rehabilitation hospital, nursing home, or other facility than to home. In our registry, CSCs discharged 46% of patients' to home versus 54% at PSCs. We speculate that CSCs may be less likely to habitually address follow‐up care and discharge medications as compared to PSCs. As far as provision of antithrombotics by hospital day 2, it is possible again that because CSCs have a higher number of complicated stroke patients, many may have had contraindications to use of antithrombotics in that time period.
Limitations of this study include the fact that this was a retrospective analysis of a database. Although the 2010 and 2011 NJASR dataset was sizeable, it was not possible to capture all potentially confounding variables that may have affected our point estimates. We were not able to perform a hierarchical analysis to account for clustering at the hospital level because of limited data available in the registry. Errors in recording data, coding, and documentation cannot be excluded. The fact that not all PSCs were necessarily JC certified may have contributed to the observed differences. Also, because pursuing PSC or CSC status is voluntary, it is not clear if the hospitals that chose CSC status were different in other unmeasured factors than those that chose PSC status, and the difference may have existed even in the absence of the designation program. Over the years, there have been changes in the criteria required by the state and the JC for PSC designation, although the larger differences between hospital levels remained intact. This may have limited our findings as well. The goal for hospitals is to continue strict adherence to policies and measures and thus improve quality of care for stroke patients. Future prospective studies should be conducted to ascertain validity and generalizability of our findings. Association of stroke measure adherence and functional outcomes would also be of interest. We were not able to measure this consistently in our study because not all patients at PSCs had admission and/or discharge NIHSS or modified Rankin Score. Although some studies have not shown an association between improved outcomes and higher performance on quality measures, we would like to look at this more closely in the stroke population.[19] As our database gets larger, we would like to reexamine our findings after correcting for more specific characteristics of each hospital. In the future, if additional states designate centers by level of stroke care, it will be important to compare how such designations compare to nonprofit organization certifications in terms of impacting performance on a larger scale.
CONCLUSION
This study shows better compliance of New Jersey state‐designated CSCs with the JC PSC core stroke measures and better mean door‐to‐thrombolytic drug times. Because these measures are evidence based, these results may translate into better stroke care and outcomes for patients treated at state‐designated CSCs.
ACKNOWLEDGEMENTS
Disclosures: Jawad Kirmani, MD: Consultant to Joint Commission on Performance Measure Development (modest). Martin Gizzi, MD, PhD: Consultant to Joint Commission on Performance Measure Development (modest), New Jersey Department of Health and Senior Services as chair of the Stroke Advisory Panel (significant). No other potential conflicts to report.
- Centers for Disease Control and Prevention. Interactive atlas of heart disease and stroke. Available at: http://apps.Nccd.Cdc.Gov/dhdspatlas/reports.Aspx. Accessed May 5, 2012.
- , , , et al.; American Heart Association Statistics Committee and Stroke Statistics Subcommittee. Heart disease and stroke statistics—2012 update: a report from the American Heart Association. Circulation. 2012;125:e2–e220.
- , , , et al. Recommendations for the establishment of primary stroke centers. JAMA. 2000;283:3102–3109.
- , , , et al.; Brain Attack Coalition. Recommendations for comprehensive stroke centers: a consensus statement from the Brain Attack Coalition. Stroke. 2005;36:1597–1616.
- , , , et al. Recommendations for the establishment of stroke systems of care. Stroke. 2005;36:690–703.
- The Joint Commission. Advanced Certification Comprehensive Stroke Centers. Available at: http://www.jointcommission.org/certification/advanced_certification_comprehensive_stroke_centers.aspx. Accessed July 25, 2012.
- New Jersey Department of Health and Senior Services: The New Jersey Acute Stroke Registry. Available at: http://www.state.nj.us/health/healthcarequality/stroke/documents/njacute_stroke_data_dictionary.pdf. Accessed July 8, 2012.
- Florida Agency for Health Care Administration. Primary stroke center and comprehensive stroke center designation. Available at: http://ahca.myflorida.com/mchq/Health_Facility_Regulation/Hospital_Outpatient/forms/59A3_2085_FAC_Rule_text.pdf. Accessed July 25, 2012.
- New Jersey Department of Health and Senior Services. Stroke Center Act (2004). Available at: http://www.njleg.state.nj.us/2004/bills/pl04/136_.pdf. Accessed September 25, 2013.
- , , , et al. Effectiveness of primary and comprehensive stroke centers. Stroke. 2010;41:1102–1107.
- , , , et al.; NYSDOH Stroke Center Designation Project Workgroup. Quality improvement in acute stroke: The New York State Stroke Center Designation Project. Neurology. 2006;67(1):88–93.
- , , , et al. Characteristics, performance measures, and in‐hospital outcomes of the first one million stroke and transient ischemic attack admissions in get with the guidelines‐stroke. Circ Cardiovasc Qual Outcomes. 2010;3(3):291–302.
- , , , et al. Intravenous thrombolysis for stroke increases over time at primary stroke centers. Stroke. 2012;43:875–877.
- , , , et al. Weekends: a dangerous time for having a stroke? Stroke. 2007;38:1211–1215.
- , , , et al.; Myocardial Infarction Data Acquisition System (MIDAS 15) Study Group. Comprehensive stroke centers overcome the weekend versus weekday gap in stroke treatment and mortality. Stroke. 2011;42:2403–2409.
- , , , et al. Can comprehensive stroke centers erase the “weekend effect”? Cerebrovasc Dis. 2009;27:107–113.
- , , , et al. Recombinant tissue‐type plasminogen activator use for ischemic stroke in the United States. Stroke. 2011;42:1952–1955.
- , , , et al. Hospital arrival time and intravenous t‐PA use in US academic medical centers, 2001–2004. Stroke. 2009;40:3845–3850.
- , , , et al. Association of surgical care improvement project infection‐related process measure compliance with risk‐adjusted outcomes: implications for quality measurement. J Am Coll Surg. 2010;211(6):705–714.
© 2013 Society of Hospital Medicine