User login
The Five-Day Blues: A New Delineation for Late-Onset Central-Line Infections
When James Davis, BSN, RN, CCRN, CIC, first began his nursing career, central venous catheters were widely considered a welcome convenience. “And then we found out that if patients don’t need that line to save their lives, it could kill them, and we need to get them out,” says Davis, now a senior infection prevention analyst with the Pennsylvania Patient Safety Authority in Harrisburg.
Many facilities have dramatically lowered their rates of central-line-associated bloodstream infections (CLABSIs) through a bundled approach focused on proper insertion protocols. But as Davis and other researchers have found, that’s not nearly enough. “If you listen to the infection prevention specialists out there, they’re saying, ‘Well, we’ve done all this, we’ve gotten good results, but there has to be something else because we’re seeing reductions but we still have these infections,’” he says.
That something else, as he discovered in a recent study, may very well be the breakdown of central-line maintenance that causes a late-onset CLABSI, especially after five days post-insertion. From analyzing reports submitted to the National Healthcare Safety Network by 104 acute-care facilities in Pennsylvania, Davis found that nearly 72% of the reported CLABSIs in 2010 were late in onset, occurring after the fifth day.1
CLABSI expert Marcia Ryder, PhD, MS, RN, research scientist at Ryder Science in San Marcos, Calif., says the study is the first to obtain a clear picture of the average time to event from a large hospital-based data set. Dr. Ryder says the results also strongly suggest that most CLABSIs are caused by maintenance failures and bacterial biofilm formation in the catheter’s internal lumen rather than insertion problems and the presence of an extraluminal biofilm.
—Sheri Chernetsky Tejedor, MD, SFHM, assistant professor, division of hospital medicine, Emory University School of Medicine, Atlanta
The study may help reinforce a message that many CLABSI experts are already sharing with their colleagues. “I like to say that the most important risk factor for a CLABSI is the presence of a central line,” says Sheri Chernetsky Tejedor, MD, SFHM, assistant professor in the division of hospital medicine at Emory University School of Medicine in Atlanta. “If a CVC is not needed, it needs to be removed. The longer they stay in, the higher the cumulative risk of CLABSI.
Current Practices Not Enough
Dr. Ryder says the new research highlights the absurdity of efforts that focus primarily on ICUs. “We’ve always been doing surveillance and monitoring in critical-care units, which is not where the major problem is,” she says. In the U.S., the average length of stay in a critical-care unit is roughly four days. “If most infections are happening after that, they’re never even being picked up, and they’re saying, ‘Well, we have zero infections,’ when indeed they don’t,” she says.
Davis says infection-prevention specialists—hospitalists included—should be regularly reviewing their facility’s central-line-maintenance practices. Perhaps the most important first step is to begin recording both the catheter insertion date and the infection date—line items that are still voluntary in many states like Pennsylvania. With that critical data, studies by Davis and other researchers can provide a better sense of CLABSI origins. “Can we put a fulcrum between insertion and maintenance and show facilities how to look to see which way their scale is tipping?” he asks. If so, those facilities will know how to reallocate their resources accordingly.
Bryn Nelson, PhD, is a freelance writer based in Seattle.
Reference
- Davis J. Central-line associated bloodstream infection: comprehensive, data-driven prevention. Pa Patient Saf Advis. 2011;8:100-105.
Communication Needs an Upgrade
Research that shows 1 in 3 adult patients does not see a physician within 30 days of discharge is the latest sign that more communication is needed between hospital physicians their community colleagues, a researcher says.
A report from the National Institute for Health Care Reform (NIHCR) found that after 90 days, 17.6% of adults still have not seen a physician, nurse practitioner, or physician assistant, says Anna Sommers, PhD, senior health researcher at the Center for Studying Health System Change, which conducts research for NIHCR. She adds that better communication between hospitalists and PCPs or specialists can be encouraged by important health information technology (HIT), but the process isn't a simple fix.
"That's not just about getting a shared medical record in place," she adds. "A medical record, even for just one inpatient stay, can be large. How does the doctor sift through all that? ... [Technology] can be part of the solution, but I think everyone is still learning how to use the technology and developing interfaces that are useful to the users. It's an evolving process.”
Hospitalists have helped address transitional-care issues with initiatives including post-discharge clinics, but more work needs to be done, Dr. Sommers says. She adds that the depth of the readmission issue is particularly striking as the research found that non-elderly adults with public coverage, a population that historically has higher rates of chronic conditions, were no more likely to see a doctor with 30 days of discharge than a person with private insurance.
"This problem is occurring all over the place," Dr. Sommers says. "It's a systematic problem, not a problem of one population in the health system."
A Multidisciplinary Example
Improving discharge processes calls for hospitalists to be the voice of change within their facilities, Michelle Mourad, MD, hospitalist and director of quality at the University of California at San Francisco Medical Center, said at UCSF's 19th annual Management of the Hospitalized Patient conference in San Francisco.
"Be the role model. Be the one who always does discharges right," she said in a breakout session focused on discharge improvement.
Dr. Mourad and co-presenter Ryan Greyson, MD, MHS, MA, both sit on UCSF's multidisciplinary Discharge Improvement Team, an approach they recommend to other hospitals. They also say fixing hospital discharges won't be easy, and it requires an individualized approach tailored to each facility and its unique culture.
"Think about the little things you can do. Figure out which steps are needed for safe discharges," she added.
UCSF has implemented a post-discharge hotline for patients to call with follow-up medical problems, and also makes outgoing follow-up calls. A discharge pharmacist performs medication reconciliation for patients with high-risk medications or multiple prescriptions.
A folder called "Your Discharge Information," which encapsulates the patient's medications, discharge plans, follow-up appointments, and the like, goes home with each patient. Unless the patient is known to be reliable, hospital staff also schedule the initial post-discharge medical appointment.
UCSF has developed relationships with local home health agencies, encouraging them to qualify patients with complex needs, including multiple prescriptions, for home health coverage. The home-care nurse then revisits medication reconciliation once the patient is settled back into the home setting. The medical center is developing an agreement with the pharmacy across the street to share the costs of uncovered prescriptions for patients who can't afford to buy them, and often sends patients home with prescription supplies ranging from seven to 30 days, depending on diagnosis.
UCSF's discharge improvements have made an impact on internal-medicine readmission rates. The rate of readmission for patients under age 65 was 16.5% in calendar year 2008, 15.5% in 2009, and 13.2% in 2010.
"Discharge has to be an institutional priority," Dr. Mourad concluded. It requires support from the top down and from the bottom up. It will be hard to succeed, "unless the whole institution believes that it is important."
ONLINE EXCLUSIVE: The Case Against a Common Denominator for Urinary Tract Infections
The recent surge in attention to catheter-associated urinary tract infections (CAUTIs) has increased the focus on both preventing and removing inappropriate catheterizations. Ironically, one outcome rate currently reported by hospitals—the number of infections per 1,000 catheter days—could unfairly punish those facilities that are doing the most to address the problem.

—Sanjay Saint, MD, MPH, FHM, professor of internal medicine, University of Michigan, Ann Arbor VA Medical Center
“If your focus is on not putting in the catheter or removing a catheter as soon as possible, you now reduce that denominator of catheter days,” explains Sanjay Saint, MD, MPH, FHM, professor of internal medicine at the University of Michigan and the Ann Arbor VA Medical Center. “The only people who now get a catheter in your hospital are those who are pretty sick; therefore, they need a catheter. These people, because of their underlying sickness, are more likely to have an infection, so you may end up having a paradoxical increased rate of CAUTI after your successful initiative has reduced catheter use.”
Using the wrong denominator, in other words, could defeat the whole point: reducing infections by reducing catheter use.
“If we’re going to publicly report data, we have to make sure that the data we’re reporting and the metrics that we’re using are actually the best metrics for the intended purpose,” Dr. Saint says.
For quality-improvement (QI) efforts, his recommendation is to use 10,000 patient days as a more appropriate denominator.
The recent surge in attention to catheter-associated urinary tract infections (CAUTIs) has increased the focus on both preventing and removing inappropriate catheterizations. Ironically, one outcome rate currently reported by hospitals—the number of infections per 1,000 catheter days—could unfairly punish those facilities that are doing the most to address the problem.
—Sanjay Saint, MD, MPH, FHM, professor of internal medicine, University of Michigan, Ann Arbor VA Medical Center
“If your focus is on not putting in the catheter or removing a catheter as soon as possible, you now reduce that denominator of catheter days,” explains Sanjay Saint, MD, MPH, FHM, professor of internal medicine at the University of Michigan and the Ann Arbor VA Medical Center. “The only people who now get a catheter in your hospital are those who are pretty sick; therefore, they need a catheter. These people, because of their underlying sickness, are more likely to have an infection, so you may end up having a paradoxical increased rate of CAUTI after your successful initiative has reduced catheter use.”
Using the wrong denominator, in other words, could defeat the whole point: reducing infections by reducing catheter use.
“If we’re going to publicly report data, we have to make sure that the data we’re reporting and the metrics that we’re using are actually the best metrics for the intended purpose,” Dr. Saint says.
For quality-improvement (QI) efforts, his recommendation is to use 10,000 patient days as a more appropriate denominator.
ONLINE EXCLUSIVE: Patient Engagement Critical
Because “med rec” is a responsibility shared by providers, patients, and families, it’s important to engage everyone in the process.
Although the patient is—and should be, if capable—the ultimate owner of the correct healthcare record, “We have a responsibility as healthcare providers to help them be successful,” says Blake Lesselroth, MD, assistant professor of medicine at Oregon Health Sciences University and director of the Portland Patient Safety Center of Inquiry at the Portland VA Medical Center. “We haven’t done that.”
Hospitals and healthcare systems use varied strategies for including and empowering patients in the med-rec process:
- The Joint Commission launched its “Speak Up” program (PDF), which gives patients tools to help avoid mistakes with their medications.
- Last year, Southern California Kaiser Permanente rolled out its “medicine in a bag” initiative, according to hospitalist David Wong, MD. Patients are instructed to bring all of their medications (in their respective containers) to the hospital when they are admitted. Then, as the med-rec process is completed, medications are placed in green (take these meds), red (stop these meds), and yellow bags (which may include herbal supplements or other questionable items). In addition, orders are written and explained in simple language: i.e., “twice per day” instead of b.i.d. When patients visit their PCP after discharge, they are instructed to bring the color-coded bags so that the PCPs can verify the coherence of the orders. Clarity reports are filed for each physician, allowing a feedback mechanism to make sure that med rec is taking place.
- Open charting at Griffin Hospital in Derby, Conn., in affiliation with the principles of the nonprofit, patient-centered Planetree organization, supplies another means of double-checking the veracity of patients’ medication lists. It also allows for meaningful patient education and dialogue about treatment and discharge plans, says Dorothea Wild, MD, Griffin Hospital’s chief hospitalist.
Gretchen Henkel is a freelance writer based in California.
ONLINE EXCLUSIVE: The Culture of Medicine Must Change, Watchdog Group Says
ONLINE EXCLUSIVE: Med-Rec Experts Discuss Prevention Strategies
Click here to listen to Dr. Tsomides
Click here to listen to Dr. Lesselroth
Click here to listen to Dr. Tsomides
Click here to listen to Dr. Lesselroth
Click here to listen to Dr. Tsomides
Click here to listen to Dr. Lesselroth
Family and Caregiver Needs Over the Course of the Cancer Trajectory
When a patient is diagnosed with cancer, family members often assume responsibility for providing care. They are typically involved not only with the diagnostic and treatment phases of care but also across the care trajectory and into survivorship. These caregivers are a primary source of support to individuals with cancer. The purpose of this article is to present an overview of the challenges, needs, and roles of family caregivers over the course of the cancer treatment trajectory and to discuss what support the professionals can provide.
Click of the PDF icon at the top of this introduction to read the full article.
'Best Results' Yet for Poor-Prognosis Elderly With DLBCL
SAN DIEGO – Stretching out the delivery of rituximab significantly improved overall and event-free survival among older patients with poor-prognosis diffuse large B-cell lymphoma, German investigators reported.
Patients older than 60 years who had diffuse large B-cell lymphoma (DLBCL) were treated with the CHOP regimen and rituximab (Rituxan) on days 4 and 1 before CHOP and at increasing intervals thereafter, in the SMARTE-R-CHOP-14 trial.
Those with poor-prognosis disease had an overall survival rate of 80% at 37 months, compared with 67% for similar patients treated with CHOP and biweekly rituximab in an earlier trial (P = .034), reported Dr. Michael Pfreundschuh on behalf of his colleagues in the German High-Grade Non-Hodgkin's Lymphoma Study Group.
Event-free survival rates among poor-prognosis patients (defined as those with an International Prognostic Index [IPI] score higher than 2) were also significantly higher with the extended rituximab–dosing schedule, dubbed SMARTE-R-CHOP-14, at 67% vs. 54% for patients who received biweekly rituximab in the previous RICOVER-60 trial (P = .030).
"SMARTE-R-CHOP 14 has achieved by far the best results reported to date for elderly patients with poor prognosis," said Dr. Pfreundschuh of Saarland University in Homburg, Germany, at the annual meeting of the American Society of Hematology (ASH).
Giving rituximab every 3 weeks after 2 pre-CHOP doses maintains serum levels of rituximab over a longer period than when it is given every other week, he said.
Patients with good- or moderate-prognosis disease (defined as an IPI of 1 or 2) also had numerically better event-free and overall survival rates, compared with patients treated with biweekly rituximab, he noted, but the differences were not significant.
Although CHOP (cyclophosphamide, doxorubicin, vincristine, and prednisone) given every 14 days (CHOP-14) had been shown to be superior to CHOP given every 21 days (CHOP-21), the same could not be said when rituximab was added (R-CHOP-14 vs. R-CHOP-21). Presentations at ASH in 2009 and at the American Society of Clinical Oncology annual meeting in 2011 suggested that biweekly rituximab dosing was suboptimal, Dr. Freundschuh said.
In the SMARTE-R-CHOP-14 study, Dr. Pfreundschuh and colleagues treated 190 patients with DLBCL with six cycles of CHOP-14. combined with eight cycles of rituximab 375 mg/m2. The first three rituximab cycles were given in a dose-dense fashion on days 1 and 4 before CHOP, followed by infusions on days 10, 29, 57, 99, 155, and 239. Patients also received prophylaxis against infections with levofloxacin, acyclovir, and cotrimoxazole. One patient did not give informed consent for the trial, and was not included in the final analysis.
In the RICOVER-60 trial that was used for comparison, patients received six cycles of CHOP plus rituximab given on days 1, 15, 29, 43, 57, 71, 85, and 99. The baseline characteristics of patients were similar between the trials, except that significantly more patients in SMARTE-R-CHOP-14 had high-risk disease (P = .015).
Complete response rates overall were not significantly different (85% in SMARTE-R and 78% in RICOVER-60). Among patients with IPI scores less than 2, the respective rates were 90% and 84%, also not significantly different. Among patients with an IPI greater than 2, however, the complete response rate in SMARTE-R-CHOP-14 was 81%, compared with 68% in RICOVER-60 (P = .035).
Overall survival did not differ significantly between the trials, at 84% in SMARTE-R and 78% in RICOVER. When patients stratified by risk were considered, there were no between-trial differences for low-risk patients.
Overall event-free survival was 71% at 37 months’ median follow-up in SMARTE-R, and 66% at 34 months in RICOVER; this difference was not significant, nor was the difference between the trials among patients with low-risk disease.
"The pharmacokinetics of eight biweekly applications of rituximab are adequate for elderly patients with good prognosis, meaning patients with IP1 1 or 2, or low tumor burden diffuse large B-cell lymphoma, but not for higher tumor loads," Dr. Pfreundschuh said.
The investigators are exploring the SMARTE-R treatment strategy in a prospective trial, labeled "OPTIMAL Greater Than 60."
The trial was supported by Deutsche Krebshilfe and Roche. Dr. Pfreundschuh disclosed serving on a Roche board of directors or advisory committee, and receiving research funding from that company and from Amgen.
FROM THE ANNUAL MEETING OF THE AMERICAN SOCIETY OF HEMATOLOGY
Major Finding: Among elderly poor-prognosis patients, treatment with the CHOP regimen and extended rituximab yielded an overall survival rate of 80% at 37 months, compared with 67% for a historical control group treated with a standard rituximab schedule (P = .034).
Data Source: Comparison of two prospective trials in patients older than 60 years with diffuse large B-cell lymphoma.
Disclosures: The trial was supported by Deutsche Krebshilfe and Roche. Dr. Pfreundschuh disclosed serving on a Roche board of directors or advisory committee, and receiving research funding from that company and from Amgen.
Hospitalists' Role in Stewardship
Healthcare‐associated infections (HAIs) are important causes of morbidity and mortality in the United States and other countries.13 Moreover, treatment of HAIs is frequently complicated by involvement of bacterial pathogens resistant to 1 or more antibiotics or antibiotic classes,4 and sometimes bacteria resistant to all or nearly all currently available agents.57 The rapid emergence of resistant bacteria both in and out of the hospital setting can affect empiric antimicrobial choices across all patients. The effort to avoid undertreating or not covering resistant bacteria can lead to overuse of wide‐spectrum antimicrobials. Antimicrobial useand especially antimicrobial overuse or misusehas been linked with increased antimicrobial resistance,817 leading to worsened clinical outcomes with increased length of hospital stay and healthcare costs. Table 1 defines the various lines of evidence supporting a causal relationship between antibiotic use and emergence of antimicrobial resistance.18, 19
|
| Changes in antimicrobial use are paralleled by changes in the prevalence of resistance |
| Antimicrobial resistance is more prevalent in healthcare‐associated bacterial infections vs community‐acquired infections |
| Patients with healthcare‐associated infections caused by resistant strains are more likely than control patients to have received prior antimicrobials |
| Areas within hospitals that have the highest rates of antimicrobial resistance also have the highest rates of antimicrobial use |
| Increasing duration of patient exposure to antimicrobials increases the likelihood of colonization with resistant organisms |
Optimal management of patients with bacterial infections, both HAIs and those that originate in the community, involves a focus on treatment that maximizes clinical outcomes for the individual patient, while also inhibiting or slowing the development of antimicrobial resistance and its spread to other patients. Antimicrobial stewardship is a term describing the various clinical strategies that have been devised to maximize the benefits and minimize the costs of antimicrobial therapy through judicious use of these agents.18, 20, 21 This article examines the developing patterns of resistance among key bacterial pathogens in the hospital and associated healthcare settings, the costs associated with HAIs (specifically, those caused by resistant pathogens), and the various strategies or programs that have been developed by governmental agencies, individual healthcare institutions, and other organizations to optimize the use of antibiotics to improve patient outcomes and minimize healthcare costs. The value that the hospitalist can bring to the development and/or implementation of institutional antimicrobial stewardship programs is explored.
ANTIMICROBIAL RESISTANCE AND HAI TRENDS FOR KEY BACTERIAL PATHOGENS
Bacterial pathogens including Enterobacteriaceae (Klebsiella pneumoniae, Enterobacter spp, Escherichia coli, and Proteus spp, among others), Acinetobacter baumannii, Pseudomonas aeruginosa, Staphylococcus aureus, and Enterococcus faecium22, 23 are increasingly prevalent in healthcare settings, and particularly troublesome to manage due to increasing resistance. Data from the Centers for Disease Control and Prevention's (CDC) National Healthcare Safety Network (NHSN) have shown that, in intensive care units (ICUs), 16% of HAIs are due to multidrug‐resistant (MDR) pathogens.4 These 16% have the highest mortality and length of hospital stay, and are associated with the highest healthcare costs.24, 25 Infections caused by MDR pathogens are more important than their actual numbers, because treatment decisions are driven by the intent to cover these MDR pathogens, even if that means providing excessively broad coverage for most patients. Moreover, the 16% mentioned above are only the tip of the iceberg, as many more HAIs will occur outside of the ICU, particularly catheter‐associated urinary tract infections (CAUTI) and surgical site infections, as these patients are often not sick enough to require ICU care. There is little information on the prevalence of HAIs outside of the ICU setting, the role of MDR bacteria in these infections, and the associated costs, mortality, and effects on length of stay.
K pneumoniae Carbapenemases and Community‐Acquired Methicillin‐Resistant Staphylococcus aureus
K pneumoniae carbapenemase (KPC) is a prime example of the emergence and rapid spread of a new resistance pattern that affects prescribing patterns. Emergence of KPC as the primary source of carbapenem resistance in Enterobacteriaceae26 is critically significant, as carbapenems are recommended first‐line therapy for serious infections caused by extended‐spectrum ‐lactamase (ESBL)‐producing K pneumoniae or other Enterobacteriaceae. One particularly remarkable fact about KPC‐producing bacteria is the speed at which they have spread since first emerging. Figure 1 from the CDC illustrates the rapid spread of KPC‐producing bacteria within the United States, from winter 2008 to May 2010. International spread has also been rapid and extensive. The first case of a KPC‐producing bacteria outside the United States was reported in France in February 2005, in an 80‐year‐old man who was admitted to a Parisian hospital 2 to 3 months after having a medical procedure performed in a New York City hospital, suggesting intercontinental transfer from the United States.27 Since then, KPC‐producing pathogenic bacteria have been identified in the Caribbean, South America, Europe, Israel, and China.2830 It is clear that once resistant bacteria emerge, they have the potential to spread very rapidly within and between countries, challenging currently available antimicrobial agents and complicating the treatment of serious infections.

Consideration of S aureus skin and skin‐structure infections highlights the fact that the barrier between hospital and community is now beginning to be crossed, further complicating prescribing decisions. The classic risk factors for resistance may no longer be reliable in determining best empiric treatment. In a landmark study, Moran et al. demonstrated the large percentages of outpatients in the United States with skin or soft‐tissue infections (SSTIs) involving community‐acquired methicillin‐resistant Staphylococcus aureus (CA‐MRSA).31 S aureus was isolated from 76% (320/422) of adults presenting to 11 university‐affiliated emergency departments with acute, purulent SSTIs in August 2004, 59% of whom were infected with MRSA. More than half the patients in the study (57%) were initially treated with antibiotics to which MRSA isolates were not susceptible.31 In the hospital, it has been shown that most invasive MRSA infections now actually have their onset outside of the healthcare setting,32 and that increasing numbers of hospitalized patients are now developing infections associated with CA‐MRSA strains >72 hours after admission.3338 Thus, it is becoming increasingly difficult to determine whether an invasive S aureus infection encountered in either a healthcare facility or community setting involves a sensitive organism, healthcare‐associated MRSA, or a CA‐MRSA pathogen, directly impacting treatment choices across all patients we care for with skin and skin‐structure infections.
Clostridium difficile‐Associated Disease
Indiscriminate and unnecessary use of antibiotics offer our patients no benefit, while exposing them to adverse effects of antibiotics, including allergies, rashes, and diarrhea among many potential other unintended consequences. C difficile‐associated disease is an increasingly problematic pathogen in the hospital setting that has been linked to unintended antibiotic effects.22, 39, 40 C difficile infection is not only costly in dollars, it is also a potentially fatal condition and has been linked to prolonged hospital stays and increased healthcare costs.4144 Improved infection control measures4549 and better use of antibiotics through antibiotic stewardship programs5055 have been shown to reduce the incidence of C difficile infection.
COSTS OF HAIs AND ANTIMICROBIAL RESISTANCE
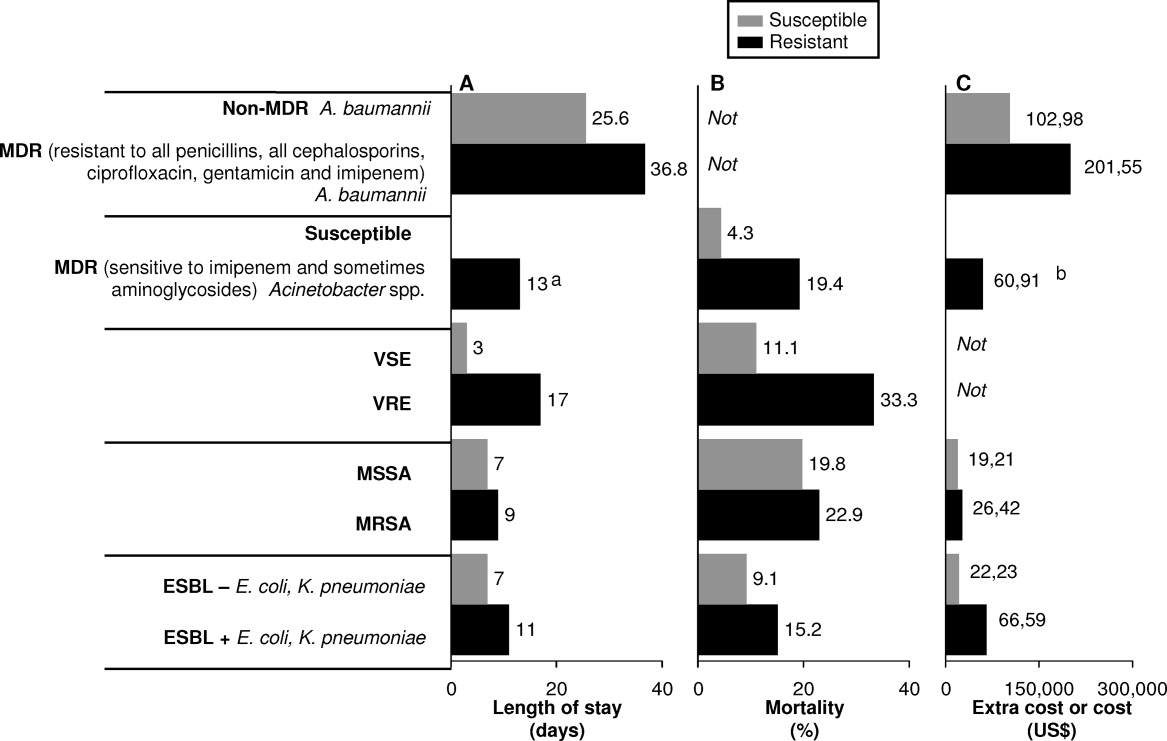
HAIs are an important and growing problem in the United States.56 Klevens et al. estimated that approximately 1.7 million individuals hospitalized in the United States in 2002 had HAI, leading to 98,987 deaths.1 Estimates of annual hospital costs in the United States related to HAIs range from $28 to $48 billion.57 Antimicrobial resistance is a major driver of mortality, increased length of hospital stay, and hospital costs associated with HAIs.24, 25 A recent review by Sipahi25 summarizes recent studies examining the impact of resistant and MDR bacterial infections (Figure 2).5866 It is dramatically clear that infections due to resistant and MDR bacteria more often result in death, are associated with longer hospital stays, and are considerably more expensive to treat.
A number of factors can lead to the increased hospital costs associated with infection with a resistant or MDR bacteria. These include the need to use more expensive antibiotics, increased length of hospital stay, delayed appropriate antibiotic therapy, increased treatment toxicity (and costs associated with managing these toxicities), and increased frequency of surgical interventions required to control infection.25, 67
The savings that could be realized through reduction in antimicrobial resistance was evaluated recently by Roberts et al.68 Using a sensitivity analysis for a sample of high‐risk adult patients hospitalized in an urban public teaching hospital in 2000, the authors determined that reducing the antimicrobial‐resistant infection rate by 3.5% (from 13.5% to 10.0%) would have saved the study hospital $910,812 (in 2008 US$), when using lowest cost and length of stay figures. The calculated societal savings, for reduced mortality and lost productivity associated with the reduced antimicrobial‐resistant rate, was $1.8 million. Hence, the analysis showed a minimum overall medical (hospital) and societal savings of $2.7 million for this single hospital with a cohort of 1391 patients. The projected savings would be dramatically higher if the reduced antimicrobial‐resistant rate was generalized to all hospitals throughout the United States.
ORGANIZATIONAL AND GOVERNMENTAL EFFORTS ADDRESSING ANTIMICROBIAL RESISTANCE AND HAIs
Given the relationships between antimicrobial use and resistance, and between antimicrobial resistance and morbidity, mortality, length of hospital stay, and healthcare costs, it is not surprising that we have seen a variety of programs and initiatives begun by either government agencies or healthcare organizations aimed at reducing antimicrobial resistance and HAIs.
The Joint Commission
The Joint Commission is an independent, not‐for‐profit organization that accredits and certifies >18,000 healthcare organizations/programs in the United States.69 The Joint Commission issues annual National Patient Safety Goals (NPSG). Hospital compliance with these goals is a critical component of the accreditation process.70
The seventh goal of The Joint Commission's NPSG is to reduce the risk of HAIs,70 the key features of which are listed in Table 2. The methodology recommended to achieve compliance includes infection control programs and implementation of evidence‐based practices to prevent HAIs due to MDR microorganisms in acute‐care hospitals. This presumably could include development and implementation of an institutional antimicrobial stewardship, or components of a program, to reduce antimicrobial resistance within the hospital.
| Goal 7: Reduce the Risk of Healthcare‐Associated Infections |
|---|
|
| NPSG.07.03.01 |
| Implement evidence‐based practices to prevent healthcare‐associated infections due to multidrug‐resistant organisms in acute‐care hospitals |
| Note: This requirement applies to, but is not limited to, epidemiologically important organisms such as methicillin‐resistant Staphylococcus aureus, Clostridium difficile, vancomycin‐resistant enterococci (VRE), and multidrug‐resistant Gram‐negative bacteria |
| NPSG.07.04.01 |
| Implement evidence‐based practices to prevent central line‐associated bloodstream infection |
| Note: This requirement covers short‐ and long‐term central venous catheters and peripherally inserted central catheter (PICC) lines |
Centers for Medicare and Medicaid Services
The Deficit Reduction Act of 2005, Section 5001(c), requires the Secretary of Health and Human Services to identify conditions that are: (1) high cost or high volume, or both; (2) result in assignment of a case to a diagnosis‐related group that has higher payment when the code is present as a secondary diagnosis; and (3) could reasonably have been prevented through application of evidence‐based guidelines.71 The Centers for Medicare and Medicaid Services (CMS), which develops and administers Medicare and Medicaid payment and coverage policies, encourages hospitals to reduce the occurrence of these preventable problems through reduced payments when these events occur. Among the Hospital Acquired Conditions (HAC) that CMS considers reasonably preventable are a number of HAIs, particularly CAUTI, vascular catheter‐associated infections, and various surgery‐related SSTIs. Importantly, the CMS policy is still in effect as of April 2011, and there are no signs of its being repealed or modified in the foreseeable future.
The CDC Get Smart and Get Smart for Healthcare Programs
The Get Smart campaign, initiated by the CDC in 1995, focused on providing information to parents about the appropriate and inappropriate use of antibiotics to treat common childhood infections, as well as about the dangers of antibiotic resistance.72 The goal of Get Smart is to reduce unnecessary antibiotic use and the spread of antibiotic resistance in the community by reducing the pressure exerted by parents on physicians to overuse or misuse antibiotics. Hence, the primary focus in this setting is on patient/parent education. The Get Smart campaign has been highly successful, with a significant reduction in antibiotic prescriptions after initiation of the campaign, across a range of infections for which antibiotics are generally or often not warranted.73 The success of Get Smart is also largely responsible for the improvement in antibiotic prescribing for childhood middle ear infections observed in the CDC Healthy People 2010 program.74 The actual performance achieved in 2007 (the latest year reported) exceeded the Healthy People 2010 target.75
Building on the success of Get Smart for community‐acquired infections, a similar CDC campaign (Get Smart for Healthcare) has been undertaken to improve antibiotic usage and reduce antibiotic resistance in inpatient healthcare facilities.76 The specific goals of Get Smart for Healthcare are to improve patient safety through better treatment of infections, reduce emergence of antimicrobial‐resistant pathogens and C difficile, and heighten awareness of the challenges posed by antimicrobial resistance in healthcare settings. To help accomplish these ends, the CDC has partnered with the Institute for Healthcare Improvement (IHI), an independent, not‐for‐profit organization dedicated to closing the gap between the healthcare that currently exists and the healthcare that should exist.77 Together, they have identified a number of primary drivers to improve antibiotic use: timely and appropriate initiation of antibiotics; appropriate administration and de‐escalation; data monitoring and transparency; and improving knowledge of, and engagement in, antimicrobial stewardship efforts, which are the focus of the next section. With respect to data monitoring, many in the healthcare community hope that, through the Get Smart program, we will soon have better sources of data, not just for the ICU, but across the entire hospital setting. This would help providers get a better sense of where resistance is located, thereby enabling better development of action plans to deal with the problem.
The CDC has recently expanded its Web site on antimicrobial stewardship, now providing extensive support and resources for program development and implementation at:
All Clinicians Should:
Dose, Duration, Indication
Too often antibiotics in hospitals are continued unnecessarily simply because clinicians caring for the patient do not have information indicating why the antibiotics were started initially or for how long they were to be continued. This challenge is compounded in today's healthcare system where primary responsibility for patient care is frequently transitioned from one clinician to another. Ensuring that all antibiotic orders are always accompanied by a dose, duration, and indication will help clinicians change or stop therapy when appropriate.
Get Cultures
Antibiotic therapy can be best optimized when it can be tailored to specific culture results. Knowing the susceptibility of the infecting organisms can lead to narrowing of broad‐spectrum therapy, changing therapy to better treat resistant pathogens and to stopping antibiotics when cultures suggest an infection is unlikely.
A number of other government initiatives have been developed to address the issues of HAIs, antimicrobial resistance, and improved antimicrobial stewardship. These are beyond the scope of the present article, but include the United States Department of Health and Human Services (HHS) action plan to prevent HAIs,79 and the CDC campaign and action plan to prevent and combat antimicrobial resistance,80, 81 among others.
ANTIMICROBIAL STEWARDSHIP IN HOSPITALS AND THE HOSPITALIST'S ROLE
As recently defined, antimicrobial stewardship is a system of personnel, informatics, data collection, and policy/procedures that promote the optimal selection, dosing, and duration of therapy for antimicrobial agents throughout the course of their use.20 In simple words, the right antibiotic, at the right dose, at the right time, and for the right duration. The primary goals of antimicrobial stewardship are to reduce patient morbidity and mortality, prevent or slow the emergence of antimicrobial resistance, and reduce adverse drug effects, including secondary infections, such as C difficile‐associated diarrhea.18, 20 Secondary goals include a reduction in hospital length of stay and healthcare expenditures, without adversely impacting quality of care. These goals are entirely in line with those of the hospitalist, who can play a critical role in the prevention and successful management of these infections. Optimal effects are expected when antimicrobial stewardship is combined with implementation of effective infection control measures within the hospital setting.
Antimicrobial Stewardship Strategies
Table 3 provides an overview of various general strategies/procedures employed as components of antimicrobial stewardship programs.82 The 2 most common are: (1) formulary restriction and preauthorization for specific agents; and (2) prospective audit with intervention and feedback.18, 20 Both approaches can and have been used to improve antimicrobial stewardship and to achieve at least some of its goals, and each is associated with advantages and disadvantages, as outlined in Table 3 and reviewed elsewhere.18, 20, 21, 83 Other strategies, such as education and use of guidelines and clinical pathways, tend to be used to supplement or complement either a general formulary restriction/preauthorization, or prospective audit/review and feedback approach to antimicrobial stewardship. It is important to note that, as in other areas such as venous thromboembolism prophylaxis, education alone is insufficient to drive changes in prescribing patterns and thereby reduce resistance. Healthcare informatics are increasingly being utilized to improve the management of infectious diseases. These can be simple programs that better assemble information about hospital‐pathogen epidemiology. They can also be sophisticated systems, designed to standardize the antimicrobial order sets and medical logic modules, that guide treatment options by connecting patient‐specific information with guideline recommendations and local resistance patterns.18, 20, 84, 85
| Strategy | Procedure | Personnel | Advantages | Disadvantages |
|---|---|---|---|---|
| ||||
| Education/ guidelines | Creation of guidelines for antimicrobial use | Antimicrobial committee to create guidelines | May alter behavior patterns | Passive education likely ineffective |
| Group or individual education of clinicians by educators | Educators (physicians, pharmacists) | Avoids loss of prescriber autonomy | ||
| Formulary restriction | Restrict dispensing of targeted antimicrobials to approved indications | Antimicrobial committee to create guidelines Approval personnel (physician, infectious diseases fellow, clinical pharmacist) | Most direct control over antimicrobial use Individual educational opportunities | Perceived loss of autonomy for prescribers Need for all‐hours consultant availability |
| Review and feedback | Daily review of targeted antimicrobials for appropriateness Contact prescribers with recommendations for alternative therapy | Antimicrobial committee to create guidelines Review personnel (usually clinical pharmacist) | Avoids loss of autonomy for prescribers Individual educational opportunities | Compliance with recommendations |
| Computer assistance | Use of information technology to implement previous strategies | Antimicrobial committee to create rules for computer systems | Provides patient‐specific data where most likely to impact care (point of care) | Significant time and resource investment to implement sophisticated systems |
| Expert systems provide patient‐specific recommendations at point of entry (order entry) | Personnel for approval or review (physicians, pharmacists) Computer programmers | Facilitates other strategies | ||
Two early, randomized, prospective studies illustrate the potential benefits and general receptiveness of clinicians to use of an audit/review and feedback approach to institutional antimicrobial stewardship. The first study randomized adult inpatients receiving 1 parenteral antibiotic for 3 days to an intervention (n = 141) or control group (n = 111).86 In the intervention group, a clinical pharmacist and infectious diseases fellow reviewed the initial therapy prescribed by the primary care physician and the patient's progress 3 days after therapy initiation, and at that point offered suggestions for subsequent antibiotic therapy. The feedback or suggestions were communicated via nonpermanent chart note. In total, 85% of the physicians implemented the suggestions, and there were no significant differences between the intervention and control group for clinical or microbiologic endpoints. However, per‐patient antibiotic charges were significantly lower in the intervention versus control group ($1287.17 vs $1673.97; P = 0.05), which yields an estimated $390,000 in annualized savings for the 600‐bed tertiary‐care hospital.
Similarly, a randomized, prospective study by Gums et al. showed that therapeutic intervention by a multidisciplinary antimicrobial team for inpatients receiving suboptimal intravenous antibiotic therapy was associated with a median hospital cost savings of $2642 per intervention, compared with costs for similar inpatients who did not receive such intervention.87 The multidisciplinary team in the study consisted of pharmacists, a clinical microbiologist, and an infectious diseases specialist, who provided the treating physician with recommendations of possible optimal antibiotics, dosages, and rationales based on timely, detailed reviews of relevant microbiologic and clinical data. In total, 89% of physicians in the study implemented the suggestions from the multidisciplinary antimicrobial team. In addition to reduced costs, the intervention versus control group was also associated with significant reductions in the overall length of stay (10.1 vs 14.5 days; P = 0.0001), and total non‐ICU length of stay (5.7 vs 9.0; P = 0.0001). There was no significant difference between the 2 groups for mortality rate.
The results from these studies86, 87 demonstrate how a prospective audit/review and feedback approach to antimicrobial stewardship can be associated with high physician participation and significant cost reductions for participating hospitals,88 and potentially improve patient outcomes. Antimicrobial stewardship programs overall have a long track record in improving patient outcomes and reducing antimicrobial resistance at the patient level.8991
The Hospitalist's Role in Antimicrobial Stewardship
Hospitalists can participate in antimicrobial stewardship at a number of levels. On the direct patient care level, they can consistently apply the principles of appropriate empiric therapy, de‐escalation, and duration of therapy as presented by Drs Snydman, Kaye, and File in this supplement. As hospitalists assume a continually increasing role in the care of hospitalized patients throughout the United States,92 they can directly influence the way medicine is practiced on a daily basis, patient by patient. A 2007 survey conducted by the American Hospital Association (AHA) showed that 58% of the 4897 community hospitals surveyed had hospital medicine programs, and that 83% of hospitals with 200 or more beds had such a program.93, 94 Estimates from the Society of Hospital Medicine (SHM) in July 2010 indicated that currently there were more than 30,000 hospitalists, practicing in 3300 large hospitals.95 This affords hospitalists the opportunity to improve care across a huge segment of hospitalized patients.
On a departmental or institutional level, hospitalists appear to be especially well positioned to contribute to, and in some cases direct, a hospital's antimicrobial stewardship program. Unique to hospital medicine, and incorporated into the definition of the profession, is the commitment to quality and process improvement, efficient use of hospital and healthcare resources, and an interdisciplinary approach to care.96 In line with this, hospitalists frequently serve on hospital committees and task forces, are experienced in developing and implementing clinical guidelines, and lead multidisciplinary teams to optimize patient care. For example, as reported in a recent review, a 2007 Pediatric Research in the Inpatient Setting survey of 208 pediatric hospitalists in the United States and Canada indicated that 92% spend at least some time in administration, 85% serve on hospital committees, and 61% and 52% lead initiatives in practice guidelines and quality improvement, respectively.97 Hospitalists are therefore especially well positioned to participate, and provide leadership, in hospital antimicrobial stewardship programs.
In 2007, the Infectious Diseases Society of America (IDSA)/Society for Healthcare Epidemiology of America (SHEA) released guidelines for developing institutional programs to enhance antimicrobial stewardship.18 According to these guidelines, the ideal institutional antimicrobial stewardship program contains an infectious diseases physician and clinical pharmacist with infectious diseases training as core members, along with a clinical microbiologist, an information system specialist, infection control professional, and a hospital epidemiologist. The infectious diseases physician and clinical pharmacist with infectious diseases training are expected to serve as leaders of the team and should be appropriately compensated for time dedicated to the program. Clearly, this is an extensive team requiring a lot of staff. Although optimal, many institutions do not have an infectious diseases physician on staff or an attending who is interested and willing to participate. For many institutions, an even bigger issue is identifying an infectious diseases pharmacist with sufficient skill to manage an antimicrobial stewardship program. As a consequence, many institutions wanting to develop an antimicrobial stewardship program to improve clinical outcomes, reduce antimicrobial resistance, and lower costs will need to think outside the box and look for nontraditional leaders to champion and lead their programs. Potential nontraditional leaders include general clinical pharmacists, intensivists, and hospitalists.98
Although hospitalists are not explicitly mentioned in the IDSA/SHEA guidelines, they seem to be implicitly included. The guidelines state that the development, maintenance, and ultimate success of such programs fundamentally depends on the support and collaboration of hospital administration, medical staff leadership, and local providers.18 Furthermore, they indicate the desirability for antimicrobial stewardship programs to function under the auspices of quality assurance and patient safety. As defined above, these are characteristics that are inherent to hospital medicine. Hence, there appears to be a good match between the activities performed by hospitalists and what the 2007 guidelines indicate is important for an effective antimicrobial stewardship program.
Now is the time for individuals to begin thinking about how best to prepare hospitalists for leadership roles in hospital antimicrobial stewardship programs. We need a well‐defined process for either training hospitalists for independent establishment of stewardship programs or establishing partnership with infectious disease specialists for the development of these programs. We need high‐level training programs in focused areas of infectious diseases that hospitalists encounter frequently (skin and skin‐structure infections, pneumonia, catheter‐associated infections, among others). Detailed understanding of the pathogens and their optimal treatment could form the core of such training. Additional education in infection control and the antimicrobial stewardship processes would round out the knowledge needed for a hospitalist to best implement and provide leadership for an antimicrobial stewardship program at his/her own institution. These training programs could be developed and delivered locally, or preferably they could be provided at national training sessions developed and supported through SHM, infectious disease societies, or the CDC.
Partnering with infectious diseases specialists is essential for protocol development and clinical support. This could allow the hospitalist to start a stewardship program on a small scale. It begins with identifying a single important problematic infection area, based on available local data (antibiotic usage, resistance levels, length of stay, C difficile rates, mortality, etc). The hospitalist would then work with the infectious disease department/staff to establish a protocol focusing on several of the key areas: diagnosis, optimal empiric therapy, de‐escalation (based on cultures and clinical response), transitioning intravenous antibiotics to oral, optimal duration of therapy, and transitioning therapy to the posthospital setting. The protocol would establish best treatment practices and the strategies to implement them (education, standardized order sets, computer decision support, monitoring and feedback, etc). The level of complexity and targeted outcomes need to be tailored to the resources available for implementation. Successful implementation and goal achievement in a small area could then be used to justify additional resources to expand the program. If hospitalists can be engaged in antimicrobial stewardship, both through individual patient care as well as program development, the large and growing number of hospitalists throughout the United States should allow for widespread implementation of antimicrobial stewardship programs.
CONCLUSIONS
Healthcare‐associated infections are increasingly a cause of morbidity and mortality in the United States and other countries, and the management of HAIs is increasingly complicated by involvement of MDR pathogens. Antimicrobial‐resistant pathogens are also increasingly involved in infections occurring outside the hospital setting. Infections caused by resistant or MDR pathogens are associated with increased mortality, longer length of hospital stay, and higher healthcare costs. The prevalence of these dangerous bacteria affects antimicrobial choices across a wider range of patients, particularly when choosing empiric therapy. Together with infection control, antimicrobial stewardship is an attractive solution to the challenges posed by antimicrobial resistance. Development and implementation of an effective institutional antimicrobial stewardship program can improve clinical outcome, reduce antimicrobial resistance and other unintended consequences of antimicrobial overuse/misuse, and lower healthcare costs.
At the forefront of inpatient care, hospitalists are positioned as excellent champions of the principles and practices of antimicrobial stewardship. By adhering to the principles of optimal antimicrobial therapy in their clinical practice, hospitalists can improve care and help reduce resistance on a patient‐by‐patient basis. At the same time, they may achieve other key hospitalist goals by reducing length of stay and decreasing costs and utilization. Moreover, they are well positioned to participate in, and at times lead, hospital‐based antimicrobial stewardship programs. As such, hospitalists are expected to play a critical role in helping to solve the problems of antimicrobial resistance and suboptimal inpatient care, as we move further into the 21st century.
- ,,, et al.Estimating health care‐associated infections and deaths in U.S. hospitals, 2002.Public Health Rep.2007;122:160–166.
- .Historical and changing epidemiology of healthcare‐associated infections.J Hosp Infect.2009;73:296–304.
- ,,, et al.Four country healthcare associated infection prevalence survey 2006: overview of the results.J Hosp Infect.2008;69:230–248.
- ,,, et al.NHSN annual update: antimicrobial‐resistant pathogens associated with healthcare‐associated infections: annual summary of data reported to the National Healthcare Safety Network at the Centers for Disease Control and Prevention, 2006‐2007.Infect Control Hosp Epidemiol.2008;29:996–1011.
- ,,, et al.Detection and characterization of class A extended‐spectrum‐beta‐lactamase‐producing Pseudomonas aeruginosa isolates in Belgian hospitals.J Antimicrob Chemother.2010;65:866–871.
- ,,, et al.Multidrug‐resistant Acinetobacter baumannii in New York City—10 years into the epidemic.Infect Control Hosp Epidemiol.2009;30:196–197.
- ,,. Emergence of extensively drug‐resistant and pandrug‐resistant Gram‐negative bacilli in Europe. Euro Surveill. 2008;13(47):pii=19045. Available at: http://www.eurosurveillance.org/viewarticle.aspx?articleid=19045. Accessed on March 29, 2011.
- ,,,,.Effect of antibiotic prescribing in primary care on antimicrobial resistance in individual patients: systematic review and meta‐analysis.BMJ.2010;340:c2096.
- ,,,,,.Fluoroquinolone‐resistant Pseudomonas aeruginosa: assessment of risk factors and clinical impact.Am J Med.2006;119:526.e519–526.e525.
- ,,,,,.Imipenem resistance among Pseudomonas aeruginosa isolates: risk factors for infection and impact of resistance on clinical and economic outcomes.Infect Control Hosp Epidemiol.2006;27:893–900.
- ,,,,.Hospital and community fluoroquinolone use and resistance in Staphylococcus aureus and Escherichia coli in 17 US hospitals.Clin Infect Dis.2005;41:435–440.
- ,,,,,.Antibiotic resistance among Gram‐negative bacilli in US intensive care units: implications for fluoroquinolone use.JAMA.2003;289:885–888.
- ,,.Relationship of carbapenem restriction in 22 university teaching hospitals to carbapenem use and carbapenem‐resistant Pseudomonas aeruginosa.Antimicrob Agents Chemother.2009;53:1983–1986.
- ,,,,.Predicting hospital rates of fluoroquinolone‐resistant Pseudomonas aeruginosa from fluoroquinolone use in US hospitals and their surrounding communities.Clin Infect Dis.2004;39:497–503.
- ,,.The effect of an antimicrobial restriction program on Pseudomonas aeruginosa resistance to beta‐lactams in a large teaching hospital.Pharmacotherapy.2003;23:618–624.
- ,,, et al.Relationship between rates of antimicrobial consumption and the incidence of antimicrobial resistance in Staphylococcus aureus and Pseudomonas aeruginosa isolates from 47 French hospitals.Infect Control Hosp Epidemiol.2007;28:1389–1395.
- ,,, et al.The effect of changes in the consumption of macrolide antibiotics on erythromycin resistance in group A streptococci in Finland. Finnish Study Group for Antimicrobial Resistance.N Engl J Med.1997;337:441–446.
- ,,, et al.Infectious Diseases Society of America and the Society for Healthcare Epidemiology of America guidelines for developing an institutional program to enhance antimicrobial stewardship.Clin Infect Dis.2007;44:159–177.
- ,,, et al.Society for Healthcare Epidemiology of America and Infectious Diseases Society of America Joint Committee on the Prevention of Antimicrobial Resistance: guidelines for the prevention of antimicrobial resistance in hospitals.Clin Infect Dis.1997;25:584–599.
- ,.Antimicrobial stewardship for inpatient facilities.J Hosp Med.2011;6(suppl 1):S4–S15.
- ,.Antimicrobial stewardship.Infect Dis Clin North Am.2011;25:245–260.
- .Bad bugs, no drugs: no ESCAPE revisited.Clin Infect Dis.2009;49:992–993.
- .Federal funding for the study of antimicrobial resistance in nosocomial pathogens: no ESKAPE.J Infect Dis.2008;197:1079–1081.
- ,,.Clinical and economic burden of antimicrobial resistance.Expert Rev Anti Infect Ther.2008;6:751–763.
- .Economics of antibiotic resistance.Expert Rev Anti Infect Ther.2008;6:523–539.
- ,,,,.Antimicrobial activities of tigecycline and other broad‐spectrum antimicrobials tested against serine carbapenemase‐ and metallo‐beta‐lactamase‐producing Enterobacteriaceae: report from the SENTRY Antimicrobial Surveillance Program.Antimicrob Agents Chemother.2008;52:570–573.
- ,,,.Plasmid‐mediated carbapenem‐hydrolyzing beta‐lactamase KPC in a Klebsiella pneumoniae isolate from France.Antimicrob Agents Chemother.2005;49:4423–4424.
- ,,, et al.Emergence of KPC‐producing Pseudomonas aeruginosa in Trinidad and Tobago.J Clin Microbiol.2009;47:2670–2671.
- ,,, et al.First report on a hyperepidemic clone of KPC‐3‐producing Klebsiella pneumoniae in Israel genetically related to a strain causing outbreaks in the United States.Antimicrob Agents Chemother.2009;53:818–820.
- ,,.The real threat of Klebsiella pneumoniae carbapenemase‐producing bacteria.Lancet Infect Dis.2009;9:228–236.
- ,,, et al.Methicillin‐resistant S. aureus infections among patients in the emergency department.N Engl J Med.2006;355:666–674.
- ,,, et al.Invasive methicillin‐resistant Staphylococcus aureus infections in the United States.JAMA.2007;298:1763–1771.
- ,,, et al.Epidemiology of healthcare‐associated bloodstream infection caused by USA300 strains of methicillin‐resistant Staphylococcus aureus in 3 affiliated hospitals.Infect Control Hosp Epidemiol.2009;30:233–241.
- ,,.Community‐associated methicillin‐resistant Staphylococcus aureus in outpatients, United States, 1999‐2006.Emerg Infect Dis.2009;15:1925–1930.
- ,,,,.Community‐associated methicillin‐resistant Staphylococcus aureus isolates causing healthcare‐associated infections.Emerg Infect Dis.2007;13:236–242.
- ,,, et al.Emergence of community‐associated methicillin‐resistant Staphylococcus aureus strains as a cause of healthcare‐associated bloodstream infections in Korea.Infect Control Hosp Epidemiol.2009;30:146–155.
- ,,.Are community‐associated methicillin‐resistant Staphylococcus aureus (MRSA) strains replacing traditional nosocomial MRSA strains?Clin Infect Dis.2008;46:787–794.
- ,,, et al.Emergence of community‐associated methicillin‐resistant Staphylococcus aureus USA300 genotype as a major cause of health care‐associated bloodstream infections.Clin Infect Dis.2006;42:647–656.
- ,.Clostridium difficile infection in the intensive care unit.Infect Dis Clin North Am.2009;23:727–743.
- .Established and potential risk factors for Clostridum difficile infection.Indian J Med Microbiol.2009;27:289–300.
- ,,,.Increasing prevalence and severity of Clostridium difficile colitis in hospitalized patients in the United States.Arch Surg.2007;142:624–631.
- ,,.Increase in adult Clostridium difficile‐related hospitalizations and case‐fatality rate, United States, 2000‐2005.Emerg Infect Dis.2008;14:929–931.
- ,,.Increase in Clostridium difficile‐related hospitalizations among infants in the United States, 2000‐2005.Pediatr Infect Dis J.2008;27:1111–1113.
- ,,,.Health care costs and mortality associated with nosocomial diarrhea due to Clostridium difficile.Clin Infect Dis.2002;34:346–353.
- ,,, et al.Clinical practice guidelines for Clostridium difficile infection in adults: 2010 update by the Society for Healthcare Epidemiology of America (SHEA) and the Infectious Diseases Society of America (IDSA).Infect Control Hosp Epidemiol.2010;31:431–455.
- ,,,.Prevention of endemic healthcare‐associated Clostridium difficile infection: reviewing the evidence.Am J Gastroenterol.2010;105:2327–2340.
- ,,, et al.A predominantly clonal multi‐institutional outbreak of Clostridium difficile‐associated diarrhea with high morbidity and mortality.N Engl J Med.2005;353:2442–2449.
- ,,,.Analysis of an outbreak of Clostridium difficile infection controlled with enhanced infection control measures.Am J Infect Control.2009;37:458–464.
- ,,, et al.Multipronged intervention strategy to control an outbreak of Clostridium difficile infection (CDI) and its impact on the rates of CDI from 2002 to 2007.Infect Control Hosp Epidemiol.2009;30:156–162.
- ,,,,,.Hospital‐wide restriction of clindamycin: effect on the incidence of Clostridium difficile‐associated diarrhea and cost.Ann Intern Med.1998;128:989–995.
- ,,, et al.Successful use of feedback to improve antibiotic prescribing and reduce Clostridium difficile infection: a controlled interrupted time series.J Antimicrob Chemother.2007;59:990–995.
- ,.Impact of changes in antibiotic policy on Clostridium difficile‐associated diarrhoea (CDAD) over a five‐year period in a district general hospital.J Hosp Infect.2003;54:104–108.
- ,,,,,.An antibiotic policy associated with reduced risk of Clostridium difficile‐associated diarrhoea.Age Ageing.1999;28:578–580.
- ,,,,,.Antibiotic prescribing policy and Clostridium difficile diarrhoea.Q J Med.2004;97:423–429.
- ,,,,.Impact of a reduction in the use of high‐risk antibiotics on the course of an epidemic of Clostridium difficile‐associated disease caused by the hypervirulent NAP1/027 strain.Clin Infect Dis.2007;45(suppl 2):S112–S121.
- .Economic burden of healthcare‐associated infections: an American perspective.Expert Rev Pharmacoecon Outcomes Res.2009;9:417–422.
- .The Direct Medical Costs of Healthcare‐Associated Infections in US Hospitals and the Benefits of Prevention. Division of Healthcare Quality Promotion, National Center for Preparedness, Detection, and Control of Infectious Diseases, Coordinating Center for Infectious Diseases, Centers for Disease Control and Prevention. Polock DA, Stone PW, eds.London, UK:Economist;2009.
- ,,,,.Multidrug‐resistant Pseudomonas aeruginosa: risk factors and clinical impact.Antimicrob Agents Chemother.2006;50:43–48.
- ,,,,,.The impact of methicillin resistance in Staphylococcus aureus bacteremia on patient outcomes: mortality, length of stay, and hospital charges.Infect Control Hosp Epidemiol.2005;26:166–174.
- ,,, et al.Impact of imipenem resistance on mortality in patients with Acinetobacter bacteraemia.J Antimicrob Chemother.2007;59:525–530.
- ,,,,.Extended‐spectrum beta‐lactamase‐producing Escherichia coli and Klebsiella pneumoniae: risk factors for infection and impact of resistance on outcomes.Clin Infect Dis.2001;32:1162–1171.
- ,.Clinical and economic impact of methicillin resistance in patients with Staphylococcus aureus bacteremia.Diagn Microbiol Infect Dis.2005;52:113–122.
- ,,,,,.Clinical and economic impact of bacteremia with extended‐spectrum‐beta‐lactamase‐producing Enterobacteriaceae.Antimicrob Agents Chemother.2006;50:1257–1262.
- ,,, et al.Determinants of vancomycin resistance and mortality rates in enterococcal bacteremia: a prospective multicenter study.Ann Intern Med.2001;135:484–492.
- ,,, et al.Direct costs of multidrug‐resistant Acinetobacter baumannii in the burn unit of a public teaching hospital.Am J Infect Control.2004;32:342–344.
- ,,.Epidemiologic, clinical, and economic evaluation of an outbreak of clonal multidrug‐resistant Acinetobacter baumannii infection in a surgical intensive care unit.Infect Control Hosp Epidemiol.2007;28:1247–1254.
- .The relationship between antimicrobial resistance and patient outcomes: mortality, length of hospital stay, and health care costs.Clin Infect Dis.2006;42(suppl 2):S82–S89.
- ,,, et al.Hospital and societal costs of antimicrobial‐resistant infections in a Chicago teaching hospital: implications for antibiotic stewardship.Clin Infect Dis.2009;49:1175–1184.
- The Joint Commission. About The Joint Commission. Available at: http://www.jointcommission.org/facts_about_the_joint_commission/. Accessed March 29,2011.
- The Joint Commission. Accreditation Program: Hospital. National Patient Safety Goals. Effective January 1, 2011. Available at: http://www.jointcommission.org/assets/1/6/2011_NPSGs_HAP.pdf. Accessed January 24,2011.
- Deficit Reduction Act. Sec. 5001. Hospital Quality Improvement. Available at: http://www.cms.gov/HospitalAcqCond/Downloads/DeficitReductionAct2005. pdf. Accessed March 29,2011.
- Centers for Disease Control and Prevention (CDC). Get Smart: Know When Antibiotics Work. Available at: http://www.cdc.gov/getsmart/. Accessed March 30,2011.
- Centers for Disease Control and Prevention (CDC). National Ambulatory Medical Care Survey. Available at: http://www.cdc.gov/nchs/ahcd. Accessed March 30,2011.
- Centers for Disease Control and Prevention (CDC). About Healthy People 2010. Available at: http://www.cdc.gov/nchs/healthy_people/hp2010.htm. Accessed March 30,2011.
- Centers for Disease Control and Prevention (CDC). DATA2010…the Healthy People 2010 Database. Available at: http://wonder.cdc.gov/DATA2010/ by searching for antibiotic. Accessed March 30,2011.
- Centers for Disease Control and Prevention (CDC). Get Smart for Healthcare. Available at: http://www.cdc.gov/getsmart/healthcare/. Accessed March 29,2011.
- The Institute for Healthcare Improvement (IHI). About IHI. Available at: http://www.ihi.org/ihi/about. Accessed March 29,2011.
- Centers for Disease Control and Prevention (CDC). Get Smart for Healthcare: All Clinicians Should…. Available at: http://www. cdc.gov/getsmart/healthcare/improve‐efforts/clinicians.html. Accessed May 3,2011.
- United States Department of Health 18:638–656.
- .Antimicrobial stewardship: application in the intensive care unit.Infect Dis Clin North Am.2009;23:683–702.
- ,,.Information technology for optimizing the management of infectious diseases.Am J Health Syst Pharm.2006;63:957–965.
- ,.Informatics and epidemiology in infection control.Infect Dis Clin North Am.2011;25:261–270.
- ,,,,,.Antibiotic optimization. An evaluation of patient safety and economic outcomes.Arch Intern Med.1997;157:1689–1694.
- ,,,.A randomized, prospective study measuring outcomes after antibiotic therapy intervention by a multidisciplinary consult team.Pharmacotherapy.1999;19:1369–1377.
- Centers for Disease Control and Prevention (CDC). Get Smart for Healthcare: Impact of Antibiotic Stewardship Program Interventions on Costs. Available at: http://www.cdc.gov/getsmart/healthcare/support‐efforts/asp‐int‐costs.html. Accessed May 3,2011.
- ,,,,.Favorable impact of a multidisciplinary antibiotic management program conducted during 7 years.Infect Control Hosp Epidemiol.2003;24:699–706.
- ,,,,.Short‐course empiric antibiotic therapy for patients with pulmonary infiltrates in the intensive care unit. A proposed solution for indiscriminate antibiotic prescription.Am J Respir Crit Care Med.2000;162:505–511.
- ,,,,,.Effects of requiring prior authorization for selected antimicrobials: expenditures, susceptibilities, and clinical outcomes.Clin Infect Dis.1997;25:230–239.
- ,,,.Growth in the care of older patients by hospitalists in the United States.N Engl J Med.2009;360:1102–1112.
- Society of Hospital Medicine (SHM). Information About SHM and Hospitalists. Available at: http://www.hospitalmedicine.org/. Accessed April 1,2011.
- Society of Hospital Medicine (SHM). New Study Finds Over Half of US Hospitals Utilize Hospitalists. Available at: http://www.hospital medicine.org/AM/Template.cfm?Section=Press_Releases56:893–904.
- .Engaging hospitalists in antimicrobial stewardship: the CDC perspective.J Hosp Med.2011;6(suppl 1):S31–S33.
Healthcare‐associated infections (HAIs) are important causes of morbidity and mortality in the United States and other countries.13 Moreover, treatment of HAIs is frequently complicated by involvement of bacterial pathogens resistant to 1 or more antibiotics or antibiotic classes,4 and sometimes bacteria resistant to all or nearly all currently available agents.57 The rapid emergence of resistant bacteria both in and out of the hospital setting can affect empiric antimicrobial choices across all patients. The effort to avoid undertreating or not covering resistant bacteria can lead to overuse of wide‐spectrum antimicrobials. Antimicrobial useand especially antimicrobial overuse or misusehas been linked with increased antimicrobial resistance,817 leading to worsened clinical outcomes with increased length of hospital stay and healthcare costs. Table 1 defines the various lines of evidence supporting a causal relationship between antibiotic use and emergence of antimicrobial resistance.18, 19
|
| Changes in antimicrobial use are paralleled by changes in the prevalence of resistance |
| Antimicrobial resistance is more prevalent in healthcare‐associated bacterial infections vs community‐acquired infections |
| Patients with healthcare‐associated infections caused by resistant strains are more likely than control patients to have received prior antimicrobials |
| Areas within hospitals that have the highest rates of antimicrobial resistance also have the highest rates of antimicrobial use |
| Increasing duration of patient exposure to antimicrobials increases the likelihood of colonization with resistant organisms |
Optimal management of patients with bacterial infections, both HAIs and those that originate in the community, involves a focus on treatment that maximizes clinical outcomes for the individual patient, while also inhibiting or slowing the development of antimicrobial resistance and its spread to other patients. Antimicrobial stewardship is a term describing the various clinical strategies that have been devised to maximize the benefits and minimize the costs of antimicrobial therapy through judicious use of these agents.18, 20, 21 This article examines the developing patterns of resistance among key bacterial pathogens in the hospital and associated healthcare settings, the costs associated with HAIs (specifically, those caused by resistant pathogens), and the various strategies or programs that have been developed by governmental agencies, individual healthcare institutions, and other organizations to optimize the use of antibiotics to improve patient outcomes and minimize healthcare costs. The value that the hospitalist can bring to the development and/or implementation of institutional antimicrobial stewardship programs is explored.
ANTIMICROBIAL RESISTANCE AND HAI TRENDS FOR KEY BACTERIAL PATHOGENS
Bacterial pathogens including Enterobacteriaceae (Klebsiella pneumoniae, Enterobacter spp, Escherichia coli, and Proteus spp, among others), Acinetobacter baumannii, Pseudomonas aeruginosa, Staphylococcus aureus, and Enterococcus faecium22, 23 are increasingly prevalent in healthcare settings, and particularly troublesome to manage due to increasing resistance. Data from the Centers for Disease Control and Prevention's (CDC) National Healthcare Safety Network (NHSN) have shown that, in intensive care units (ICUs), 16% of HAIs are due to multidrug‐resistant (MDR) pathogens.4 These 16% have the highest mortality and length of hospital stay, and are associated with the highest healthcare costs.24, 25 Infections caused by MDR pathogens are more important than their actual numbers, because treatment decisions are driven by the intent to cover these MDR pathogens, even if that means providing excessively broad coverage for most patients. Moreover, the 16% mentioned above are only the tip of the iceberg, as many more HAIs will occur outside of the ICU, particularly catheter‐associated urinary tract infections (CAUTI) and surgical site infections, as these patients are often not sick enough to require ICU care. There is little information on the prevalence of HAIs outside of the ICU setting, the role of MDR bacteria in these infections, and the associated costs, mortality, and effects on length of stay.
K pneumoniae Carbapenemases and Community‐Acquired Methicillin‐Resistant Staphylococcus aureus
K pneumoniae carbapenemase (KPC) is a prime example of the emergence and rapid spread of a new resistance pattern that affects prescribing patterns. Emergence of KPC as the primary source of carbapenem resistance in Enterobacteriaceae26 is critically significant, as carbapenems are recommended first‐line therapy for serious infections caused by extended‐spectrum ‐lactamase (ESBL)‐producing K pneumoniae or other Enterobacteriaceae. One particularly remarkable fact about KPC‐producing bacteria is the speed at which they have spread since first emerging. Figure 1 from the CDC illustrates the rapid spread of KPC‐producing bacteria within the United States, from winter 2008 to May 2010. International spread has also been rapid and extensive. The first case of a KPC‐producing bacteria outside the United States was reported in France in February 2005, in an 80‐year‐old man who was admitted to a Parisian hospital 2 to 3 months after having a medical procedure performed in a New York City hospital, suggesting intercontinental transfer from the United States.27 Since then, KPC‐producing pathogenic bacteria have been identified in the Caribbean, South America, Europe, Israel, and China.2830 It is clear that once resistant bacteria emerge, they have the potential to spread very rapidly within and between countries, challenging currently available antimicrobial agents and complicating the treatment of serious infections.
Consideration of S aureus skin and skin‐structure infections highlights the fact that the barrier between hospital and community is now beginning to be crossed, further complicating prescribing decisions. The classic risk factors for resistance may no longer be reliable in determining best empiric treatment. In a landmark study, Moran et al. demonstrated the large percentages of outpatients in the United States with skin or soft‐tissue infections (SSTIs) involving community‐acquired methicillin‐resistant Staphylococcus aureus (CA‐MRSA).31 S aureus was isolated from 76% (320/422) of adults presenting to 11 university‐affiliated emergency departments with acute, purulent SSTIs in August 2004, 59% of whom were infected with MRSA. More than half the patients in the study (57%) were initially treated with antibiotics to which MRSA isolates were not susceptible.31 In the hospital, it has been shown that most invasive MRSA infections now actually have their onset outside of the healthcare setting,32 and that increasing numbers of hospitalized patients are now developing infections associated with CA‐MRSA strains >72 hours after admission.3338 Thus, it is becoming increasingly difficult to determine whether an invasive S aureus infection encountered in either a healthcare facility or community setting involves a sensitive organism, healthcare‐associated MRSA, or a CA‐MRSA pathogen, directly impacting treatment choices across all patients we care for with skin and skin‐structure infections.
Clostridium difficile‐Associated Disease
Indiscriminate and unnecessary use of antibiotics offer our patients no benefit, while exposing them to adverse effects of antibiotics, including allergies, rashes, and diarrhea among many potential other unintended consequences. C difficile‐associated disease is an increasingly problematic pathogen in the hospital setting that has been linked to unintended antibiotic effects.22, 39, 40 C difficile infection is not only costly in dollars, it is also a potentially fatal condition and has been linked to prolonged hospital stays and increased healthcare costs.4144 Improved infection control measures4549 and better use of antibiotics through antibiotic stewardship programs5055 have been shown to reduce the incidence of C difficile infection.
COSTS OF HAIs AND ANTIMICROBIAL RESISTANCE
HAIs are an important and growing problem in the United States.56 Klevens et al. estimated that approximately 1.7 million individuals hospitalized in the United States in 2002 had HAI, leading to 98,987 deaths.1 Estimates of annual hospital costs in the United States related to HAIs range from $28 to $48 billion.57 Antimicrobial resistance is a major driver of mortality, increased length of hospital stay, and hospital costs associated with HAIs.24, 25 A recent review by Sipahi25 summarizes recent studies examining the impact of resistant and MDR bacterial infections (Figure 2).5866 It is dramatically clear that infections due to resistant and MDR bacteria more often result in death, are associated with longer hospital stays, and are considerably more expensive to treat.
A number of factors can lead to the increased hospital costs associated with infection with a resistant or MDR bacteria. These include the need to use more expensive antibiotics, increased length of hospital stay, delayed appropriate antibiotic therapy, increased treatment toxicity (and costs associated with managing these toxicities), and increased frequency of surgical interventions required to control infection.25, 67
The savings that could be realized through reduction in antimicrobial resistance was evaluated recently by Roberts et al.68 Using a sensitivity analysis for a sample of high‐risk adult patients hospitalized in an urban public teaching hospital in 2000, the authors determined that reducing the antimicrobial‐resistant infection rate by 3.5% (from 13.5% to 10.0%) would have saved the study hospital $910,812 (in 2008 US$), when using lowest cost and length of stay figures. The calculated societal savings, for reduced mortality and lost productivity associated with the reduced antimicrobial‐resistant rate, was $1.8 million. Hence, the analysis showed a minimum overall medical (hospital) and societal savings of $2.7 million for this single hospital with a cohort of 1391 patients. The projected savings would be dramatically higher if the reduced antimicrobial‐resistant rate was generalized to all hospitals throughout the United States.
ORGANIZATIONAL AND GOVERNMENTAL EFFORTS ADDRESSING ANTIMICROBIAL RESISTANCE AND HAIs
Given the relationships between antimicrobial use and resistance, and between antimicrobial resistance and morbidity, mortality, length of hospital stay, and healthcare costs, it is not surprising that we have seen a variety of programs and initiatives begun by either government agencies or healthcare organizations aimed at reducing antimicrobial resistance and HAIs.
The Joint Commission
The Joint Commission is an independent, not‐for‐profit organization that accredits and certifies >18,000 healthcare organizations/programs in the United States.69 The Joint Commission issues annual National Patient Safety Goals (NPSG). Hospital compliance with these goals is a critical component of the accreditation process.70
The seventh goal of The Joint Commission's NPSG is to reduce the risk of HAIs,70 the key features of which are listed in Table 2. The methodology recommended to achieve compliance includes infection control programs and implementation of evidence‐based practices to prevent HAIs due to MDR microorganisms in acute‐care hospitals. This presumably could include development and implementation of an institutional antimicrobial stewardship, or components of a program, to reduce antimicrobial resistance within the hospital.
| Goal 7: Reduce the Risk of Healthcare‐Associated Infections |
|---|
|
| NPSG.07.03.01 |
| Implement evidence‐based practices to prevent healthcare‐associated infections due to multidrug‐resistant organisms in acute‐care hospitals |
| Note: This requirement applies to, but is not limited to, epidemiologically important organisms such as methicillin‐resistant Staphylococcus aureus, Clostridium difficile, vancomycin‐resistant enterococci (VRE), and multidrug‐resistant Gram‐negative bacteria |
| NPSG.07.04.01 |
| Implement evidence‐based practices to prevent central line‐associated bloodstream infection |
| Note: This requirement covers short‐ and long‐term central venous catheters and peripherally inserted central catheter (PICC) lines |
Centers for Medicare and Medicaid Services
The Deficit Reduction Act of 2005, Section 5001(c), requires the Secretary of Health and Human Services to identify conditions that are: (1) high cost or high volume, or both; (2) result in assignment of a case to a diagnosis‐related group that has higher payment when the code is present as a secondary diagnosis; and (3) could reasonably have been prevented through application of evidence‐based guidelines.71 The Centers for Medicare and Medicaid Services (CMS), which develops and administers Medicare and Medicaid payment and coverage policies, encourages hospitals to reduce the occurrence of these preventable problems through reduced payments when these events occur. Among the Hospital Acquired Conditions (HAC) that CMS considers reasonably preventable are a number of HAIs, particularly CAUTI, vascular catheter‐associated infections, and various surgery‐related SSTIs. Importantly, the CMS policy is still in effect as of April 2011, and there are no signs of its being repealed or modified in the foreseeable future.
The CDC Get Smart and Get Smart for Healthcare Programs
The Get Smart campaign, initiated by the CDC in 1995, focused on providing information to parents about the appropriate and inappropriate use of antibiotics to treat common childhood infections, as well as about the dangers of antibiotic resistance.72 The goal of Get Smart is to reduce unnecessary antibiotic use and the spread of antibiotic resistance in the community by reducing the pressure exerted by parents on physicians to overuse or misuse antibiotics. Hence, the primary focus in this setting is on patient/parent education. The Get Smart campaign has been highly successful, with a significant reduction in antibiotic prescriptions after initiation of the campaign, across a range of infections for which antibiotics are generally or often not warranted.73 The success of Get Smart is also largely responsible for the improvement in antibiotic prescribing for childhood middle ear infections observed in the CDC Healthy People 2010 program.74 The actual performance achieved in 2007 (the latest year reported) exceeded the Healthy People 2010 target.75
Building on the success of Get Smart for community‐acquired infections, a similar CDC campaign (Get Smart for Healthcare) has been undertaken to improve antibiotic usage and reduce antibiotic resistance in inpatient healthcare facilities.76 The specific goals of Get Smart for Healthcare are to improve patient safety through better treatment of infections, reduce emergence of antimicrobial‐resistant pathogens and C difficile, and heighten awareness of the challenges posed by antimicrobial resistance in healthcare settings. To help accomplish these ends, the CDC has partnered with the Institute for Healthcare Improvement (IHI), an independent, not‐for‐profit organization dedicated to closing the gap between the healthcare that currently exists and the healthcare that should exist.77 Together, they have identified a number of primary drivers to improve antibiotic use: timely and appropriate initiation of antibiotics; appropriate administration and de‐escalation; data monitoring and transparency; and improving knowledge of, and engagement in, antimicrobial stewardship efforts, which are the focus of the next section. With respect to data monitoring, many in the healthcare community hope that, through the Get Smart program, we will soon have better sources of data, not just for the ICU, but across the entire hospital setting. This would help providers get a better sense of where resistance is located, thereby enabling better development of action plans to deal with the problem.
The CDC has recently expanded its Web site on antimicrobial stewardship, now providing extensive support and resources for program development and implementation at:
All Clinicians Should:
Dose, Duration, Indication
Too often antibiotics in hospitals are continued unnecessarily simply because clinicians caring for the patient do not have information indicating why the antibiotics were started initially or for how long they were to be continued. This challenge is compounded in today's healthcare system where primary responsibility for patient care is frequently transitioned from one clinician to another. Ensuring that all antibiotic orders are always accompanied by a dose, duration, and indication will help clinicians change or stop therapy when appropriate.
Get Cultures
Antibiotic therapy can be best optimized when it can be tailored to specific culture results. Knowing the susceptibility of the infecting organisms can lead to narrowing of broad‐spectrum therapy, changing therapy to better treat resistant pathogens and to stopping antibiotics when cultures suggest an infection is unlikely.
A number of other government initiatives have been developed to address the issues of HAIs, antimicrobial resistance, and improved antimicrobial stewardship. These are beyond the scope of the present article, but include the United States Department of Health and Human Services (HHS) action plan to prevent HAIs,79 and the CDC campaign and action plan to prevent and combat antimicrobial resistance,80, 81 among others.
ANTIMICROBIAL STEWARDSHIP IN HOSPITALS AND THE HOSPITALIST'S ROLE
As recently defined, antimicrobial stewardship is a system of personnel, informatics, data collection, and policy/procedures that promote the optimal selection, dosing, and duration of therapy for antimicrobial agents throughout the course of their use.20 In simple words, the right antibiotic, at the right dose, at the right time, and for the right duration. The primary goals of antimicrobial stewardship are to reduce patient morbidity and mortality, prevent or slow the emergence of antimicrobial resistance, and reduce adverse drug effects, including secondary infections, such as C difficile‐associated diarrhea.18, 20 Secondary goals include a reduction in hospital length of stay and healthcare expenditures, without adversely impacting quality of care. These goals are entirely in line with those of the hospitalist, who can play a critical role in the prevention and successful management of these infections. Optimal effects are expected when antimicrobial stewardship is combined with implementation of effective infection control measures within the hospital setting.
Antimicrobial Stewardship Strategies
Table 3 provides an overview of various general strategies/procedures employed as components of antimicrobial stewardship programs.82 The 2 most common are: (1) formulary restriction and preauthorization for specific agents; and (2) prospective audit with intervention and feedback.18, 20 Both approaches can and have been used to improve antimicrobial stewardship and to achieve at least some of its goals, and each is associated with advantages and disadvantages, as outlined in Table 3 and reviewed elsewhere.18, 20, 21, 83 Other strategies, such as education and use of guidelines and clinical pathways, tend to be used to supplement or complement either a general formulary restriction/preauthorization, or prospective audit/review and feedback approach to antimicrobial stewardship. It is important to note that, as in other areas such as venous thromboembolism prophylaxis, education alone is insufficient to drive changes in prescribing patterns and thereby reduce resistance. Healthcare informatics are increasingly being utilized to improve the management of infectious diseases. These can be simple programs that better assemble information about hospital‐pathogen epidemiology. They can also be sophisticated systems, designed to standardize the antimicrobial order sets and medical logic modules, that guide treatment options by connecting patient‐specific information with guideline recommendations and local resistance patterns.18, 20, 84, 85
| Strategy | Procedure | Personnel | Advantages | Disadvantages |
|---|---|---|---|---|
| ||||
| Education/ guidelines | Creation of guidelines for antimicrobial use | Antimicrobial committee to create guidelines | May alter behavior patterns | Passive education likely ineffective |
| Group or individual education of clinicians by educators | Educators (physicians, pharmacists) | Avoids loss of prescriber autonomy | ||
| Formulary restriction | Restrict dispensing of targeted antimicrobials to approved indications | Antimicrobial committee to create guidelines Approval personnel (physician, infectious diseases fellow, clinical pharmacist) | Most direct control over antimicrobial use Individual educational opportunities | Perceived loss of autonomy for prescribers Need for all‐hours consultant availability |
| Review and feedback | Daily review of targeted antimicrobials for appropriateness Contact prescribers with recommendations for alternative therapy | Antimicrobial committee to create guidelines Review personnel (usually clinical pharmacist) | Avoids loss of autonomy for prescribers Individual educational opportunities | Compliance with recommendations |
| Computer assistance | Use of information technology to implement previous strategies | Antimicrobial committee to create rules for computer systems | Provides patient‐specific data where most likely to impact care (point of care) | Significant time and resource investment to implement sophisticated systems |
| Expert systems provide patient‐specific recommendations at point of entry (order entry) | Personnel for approval or review (physicians, pharmacists) Computer programmers | Facilitates other strategies | ||
Two early, randomized, prospective studies illustrate the potential benefits and general receptiveness of clinicians to use of an audit/review and feedback approach to institutional antimicrobial stewardship. The first study randomized adult inpatients receiving 1 parenteral antibiotic for 3 days to an intervention (n = 141) or control group (n = 111).86 In the intervention group, a clinical pharmacist and infectious diseases fellow reviewed the initial therapy prescribed by the primary care physician and the patient's progress 3 days after therapy initiation, and at that point offered suggestions for subsequent antibiotic therapy. The feedback or suggestions were communicated via nonpermanent chart note. In total, 85% of the physicians implemented the suggestions, and there were no significant differences between the intervention and control group for clinical or microbiologic endpoints. However, per‐patient antibiotic charges were significantly lower in the intervention versus control group ($1287.17 vs $1673.97; P = 0.05), which yields an estimated $390,000 in annualized savings for the 600‐bed tertiary‐care hospital.
Similarly, a randomized, prospective study by Gums et al. showed that therapeutic intervention by a multidisciplinary antimicrobial team for inpatients receiving suboptimal intravenous antibiotic therapy was associated with a median hospital cost savings of $2642 per intervention, compared with costs for similar inpatients who did not receive such intervention.87 The multidisciplinary team in the study consisted of pharmacists, a clinical microbiologist, and an infectious diseases specialist, who provided the treating physician with recommendations of possible optimal antibiotics, dosages, and rationales based on timely, detailed reviews of relevant microbiologic and clinical data. In total, 89% of physicians in the study implemented the suggestions from the multidisciplinary antimicrobial team. In addition to reduced costs, the intervention versus control group was also associated with significant reductions in the overall length of stay (10.1 vs 14.5 days; P = 0.0001), and total non‐ICU length of stay (5.7 vs 9.0; P = 0.0001). There was no significant difference between the 2 groups for mortality rate.
The results from these studies86, 87 demonstrate how a prospective audit/review and feedback approach to antimicrobial stewardship can be associated with high physician participation and significant cost reductions for participating hospitals,88 and potentially improve patient outcomes. Antimicrobial stewardship programs overall have a long track record in improving patient outcomes and reducing antimicrobial resistance at the patient level.8991
The Hospitalist's Role in Antimicrobial Stewardship
Hospitalists can participate in antimicrobial stewardship at a number of levels. On the direct patient care level, they can consistently apply the principles of appropriate empiric therapy, de‐escalation, and duration of therapy as presented by Drs Snydman, Kaye, and File in this supplement. As hospitalists assume a continually increasing role in the care of hospitalized patients throughout the United States,92 they can directly influence the way medicine is practiced on a daily basis, patient by patient. A 2007 survey conducted by the American Hospital Association (AHA) showed that 58% of the 4897 community hospitals surveyed had hospital medicine programs, and that 83% of hospitals with 200 or more beds had such a program.93, 94 Estimates from the Society of Hospital Medicine (SHM) in July 2010 indicated that currently there were more than 30,000 hospitalists, practicing in 3300 large hospitals.95 This affords hospitalists the opportunity to improve care across a huge segment of hospitalized patients.
On a departmental or institutional level, hospitalists appear to be especially well positioned to contribute to, and in some cases direct, a hospital's antimicrobial stewardship program. Unique to hospital medicine, and incorporated into the definition of the profession, is the commitment to quality and process improvement, efficient use of hospital and healthcare resources, and an interdisciplinary approach to care.96 In line with this, hospitalists frequently serve on hospital committees and task forces, are experienced in developing and implementing clinical guidelines, and lead multidisciplinary teams to optimize patient care. For example, as reported in a recent review, a 2007 Pediatric Research in the Inpatient Setting survey of 208 pediatric hospitalists in the United States and Canada indicated that 92% spend at least some time in administration, 85% serve on hospital committees, and 61% and 52% lead initiatives in practice guidelines and quality improvement, respectively.97 Hospitalists are therefore especially well positioned to participate, and provide leadership, in hospital antimicrobial stewardship programs.
In 2007, the Infectious Diseases Society of America (IDSA)/Society for Healthcare Epidemiology of America (SHEA) released guidelines for developing institutional programs to enhance antimicrobial stewardship.18 According to these guidelines, the ideal institutional antimicrobial stewardship program contains an infectious diseases physician and clinical pharmacist with infectious diseases training as core members, along with a clinical microbiologist, an information system specialist, infection control professional, and a hospital epidemiologist. The infectious diseases physician and clinical pharmacist with infectious diseases training are expected to serve as leaders of the team and should be appropriately compensated for time dedicated to the program. Clearly, this is an extensive team requiring a lot of staff. Although optimal, many institutions do not have an infectious diseases physician on staff or an attending who is interested and willing to participate. For many institutions, an even bigger issue is identifying an infectious diseases pharmacist with sufficient skill to manage an antimicrobial stewardship program. As a consequence, many institutions wanting to develop an antimicrobial stewardship program to improve clinical outcomes, reduce antimicrobial resistance, and lower costs will need to think outside the box and look for nontraditional leaders to champion and lead their programs. Potential nontraditional leaders include general clinical pharmacists, intensivists, and hospitalists.98
Although hospitalists are not explicitly mentioned in the IDSA/SHEA guidelines, they seem to be implicitly included. The guidelines state that the development, maintenance, and ultimate success of such programs fundamentally depends on the support and collaboration of hospital administration, medical staff leadership, and local providers.18 Furthermore, they indicate the desirability for antimicrobial stewardship programs to function under the auspices of quality assurance and patient safety. As defined above, these are characteristics that are inherent to hospital medicine. Hence, there appears to be a good match between the activities performed by hospitalists and what the 2007 guidelines indicate is important for an effective antimicrobial stewardship program.
Now is the time for individuals to begin thinking about how best to prepare hospitalists for leadership roles in hospital antimicrobial stewardship programs. We need a well‐defined process for either training hospitalists for independent establishment of stewardship programs or establishing partnership with infectious disease specialists for the development of these programs. We need high‐level training programs in focused areas of infectious diseases that hospitalists encounter frequently (skin and skin‐structure infections, pneumonia, catheter‐associated infections, among others). Detailed understanding of the pathogens and their optimal treatment could form the core of such training. Additional education in infection control and the antimicrobial stewardship processes would round out the knowledge needed for a hospitalist to best implement and provide leadership for an antimicrobial stewardship program at his/her own institution. These training programs could be developed and delivered locally, or preferably they could be provided at national training sessions developed and supported through SHM, infectious disease societies, or the CDC.
Partnering with infectious diseases specialists is essential for protocol development and clinical support. This could allow the hospitalist to start a stewardship program on a small scale. It begins with identifying a single important problematic infection area, based on available local data (antibiotic usage, resistance levels, length of stay, C difficile rates, mortality, etc). The hospitalist would then work with the infectious disease department/staff to establish a protocol focusing on several of the key areas: diagnosis, optimal empiric therapy, de‐escalation (based on cultures and clinical response), transitioning intravenous antibiotics to oral, optimal duration of therapy, and transitioning therapy to the posthospital setting. The protocol would establish best treatment practices and the strategies to implement them (education, standardized order sets, computer decision support, monitoring and feedback, etc). The level of complexity and targeted outcomes need to be tailored to the resources available for implementation. Successful implementation and goal achievement in a small area could then be used to justify additional resources to expand the program. If hospitalists can be engaged in antimicrobial stewardship, both through individual patient care as well as program development, the large and growing number of hospitalists throughout the United States should allow for widespread implementation of antimicrobial stewardship programs.
CONCLUSIONS
Healthcare‐associated infections are increasingly a cause of morbidity and mortality in the United States and other countries, and the management of HAIs is increasingly complicated by involvement of MDR pathogens. Antimicrobial‐resistant pathogens are also increasingly involved in infections occurring outside the hospital setting. Infections caused by resistant or MDR pathogens are associated with increased mortality, longer length of hospital stay, and higher healthcare costs. The prevalence of these dangerous bacteria affects antimicrobial choices across a wider range of patients, particularly when choosing empiric therapy. Together with infection control, antimicrobial stewardship is an attractive solution to the challenges posed by antimicrobial resistance. Development and implementation of an effective institutional antimicrobial stewardship program can improve clinical outcome, reduce antimicrobial resistance and other unintended consequences of antimicrobial overuse/misuse, and lower healthcare costs.
At the forefront of inpatient care, hospitalists are positioned as excellent champions of the principles and practices of antimicrobial stewardship. By adhering to the principles of optimal antimicrobial therapy in their clinical practice, hospitalists can improve care and help reduce resistance on a patient‐by‐patient basis. At the same time, they may achieve other key hospitalist goals by reducing length of stay and decreasing costs and utilization. Moreover, they are well positioned to participate in, and at times lead, hospital‐based antimicrobial stewardship programs. As such, hospitalists are expected to play a critical role in helping to solve the problems of antimicrobial resistance and suboptimal inpatient care, as we move further into the 21st century.
- ,,, et al.Estimating health care‐associated infections and deaths in U.S. hospitals, 2002.Public Health Rep.2007;122:160–166.
- .Historical and changing epidemiology of healthcare‐associated infections.J Hosp Infect.2009;73:296–304.
- ,,, et al.Four country healthcare associated infection prevalence survey 2006: overview of the results.J Hosp Infect.2008;69:230–248.
- ,,, et al.NHSN annual update: antimicrobial‐resistant pathogens associated with healthcare‐associated infections: annual summary of data reported to the National Healthcare Safety Network at the Centers for Disease Control and Prevention, 2006‐2007.Infect Control Hosp Epidemiol.2008;29:996–1011.
- ,,, et al.Detection and characterization of class A extended‐spectrum‐beta‐lactamase‐producing Pseudomonas aeruginosa isolates in Belgian hospitals.J Antimicrob Chemother.2010;65:866–871.
- ,,, et al.Multidrug‐resistant Acinetobacter baumannii in New York City—10 years into the epidemic.Infect Control Hosp Epidemiol.2009;30:196–197.
- ,,. Emergence of extensively drug‐resistant and pandrug‐resistant Gram‐negative bacilli in Europe. Euro Surveill. 2008;13(47):pii=19045. Available at: http://www.eurosurveillance.org/viewarticle.aspx?articleid=19045. Accessed on March 29, 2011.
- ,,,,.Effect of antibiotic prescribing in primary care on antimicrobial resistance in individual patients: systematic review and meta‐analysis.BMJ.2010;340:c2096.
- ,,,,,.Fluoroquinolone‐resistant Pseudomonas aeruginosa: assessment of risk factors and clinical impact.Am J Med.2006;119:526.e519–526.e525.
- ,,,,,.Imipenem resistance among Pseudomonas aeruginosa isolates: risk factors for infection and impact of resistance on clinical and economic outcomes.Infect Control Hosp Epidemiol.2006;27:893–900.
- ,,,,.Hospital and community fluoroquinolone use and resistance in Staphylococcus aureus and Escherichia coli in 17 US hospitals.Clin Infect Dis.2005;41:435–440.
- ,,,,,.Antibiotic resistance among Gram‐negative bacilli in US intensive care units: implications for fluoroquinolone use.JAMA.2003;289:885–888.
- ,,.Relationship of carbapenem restriction in 22 university teaching hospitals to carbapenem use and carbapenem‐resistant Pseudomonas aeruginosa.Antimicrob Agents Chemother.2009;53:1983–1986.
- ,,,,.Predicting hospital rates of fluoroquinolone‐resistant Pseudomonas aeruginosa from fluoroquinolone use in US hospitals and their surrounding communities.Clin Infect Dis.2004;39:497–503.
- ,,.The effect of an antimicrobial restriction program on Pseudomonas aeruginosa resistance to beta‐lactams in a large teaching hospital.Pharmacotherapy.2003;23:618–624.
- ,,, et al.Relationship between rates of antimicrobial consumption and the incidence of antimicrobial resistance in Staphylococcus aureus and Pseudomonas aeruginosa isolates from 47 French hospitals.Infect Control Hosp Epidemiol.2007;28:1389–1395.
- ,,, et al.The effect of changes in the consumption of macrolide antibiotics on erythromycin resistance in group A streptococci in Finland. Finnish Study Group for Antimicrobial Resistance.N Engl J Med.1997;337:441–446.
- ,,, et al.Infectious Diseases Society of America and the Society for Healthcare Epidemiology of America guidelines for developing an institutional program to enhance antimicrobial stewardship.Clin Infect Dis.2007;44:159–177.
- ,,, et al.Society for Healthcare Epidemiology of America and Infectious Diseases Society of America Joint Committee on the Prevention of Antimicrobial Resistance: guidelines for the prevention of antimicrobial resistance in hospitals.Clin Infect Dis.1997;25:584–599.
- ,.Antimicrobial stewardship for inpatient facilities.J Hosp Med.2011;6(suppl 1):S4–S15.
- ,.Antimicrobial stewardship.Infect Dis Clin North Am.2011;25:245–260.
- .Bad bugs, no drugs: no ESCAPE revisited.Clin Infect Dis.2009;49:992–993.
- .Federal funding for the study of antimicrobial resistance in nosocomial pathogens: no ESKAPE.J Infect Dis.2008;197:1079–1081.
- ,,.Clinical and economic burden of antimicrobial resistance.Expert Rev Anti Infect Ther.2008;6:751–763.
- .Economics of antibiotic resistance.Expert Rev Anti Infect Ther.2008;6:523–539.
- ,,,,.Antimicrobial activities of tigecycline and other broad‐spectrum antimicrobials tested against serine carbapenemase‐ and metallo‐beta‐lactamase‐producing Enterobacteriaceae: report from the SENTRY Antimicrobial Surveillance Program.Antimicrob Agents Chemother.2008;52:570–573.
- ,,,.Plasmid‐mediated carbapenem‐hydrolyzing beta‐lactamase KPC in a Klebsiella pneumoniae isolate from France.Antimicrob Agents Chemother.2005;49:4423–4424.
- ,,, et al.Emergence of KPC‐producing Pseudomonas aeruginosa in Trinidad and Tobago.J Clin Microbiol.2009;47:2670–2671.
- ,,, et al.First report on a hyperepidemic clone of KPC‐3‐producing Klebsiella pneumoniae in Israel genetically related to a strain causing outbreaks in the United States.Antimicrob Agents Chemother.2009;53:818–820.
- ,,.The real threat of Klebsiella pneumoniae carbapenemase‐producing bacteria.Lancet Infect Dis.2009;9:228–236.
- ,,, et al.Methicillin‐resistant S. aureus infections among patients in the emergency department.N Engl J Med.2006;355:666–674.
- ,,, et al.Invasive methicillin‐resistant Staphylococcus aureus infections in the United States.JAMA.2007;298:1763–1771.
- ,,, et al.Epidemiology of healthcare‐associated bloodstream infection caused by USA300 strains of methicillin‐resistant Staphylococcus aureus in 3 affiliated hospitals.Infect Control Hosp Epidemiol.2009;30:233–241.
- ,,.Community‐associated methicillin‐resistant Staphylococcus aureus in outpatients, United States, 1999‐2006.Emerg Infect Dis.2009;15:1925–1930.
- ,,,,.Community‐associated methicillin‐resistant Staphylococcus aureus isolates causing healthcare‐associated infections.Emerg Infect Dis.2007;13:236–242.
- ,,, et al.Emergence of community‐associated methicillin‐resistant Staphylococcus aureus strains as a cause of healthcare‐associated bloodstream infections in Korea.Infect Control Hosp Epidemiol.2009;30:146–155.
- ,,.Are community‐associated methicillin‐resistant Staphylococcus aureus (MRSA) strains replacing traditional nosocomial MRSA strains?Clin Infect Dis.2008;46:787–794.
- ,,, et al.Emergence of community‐associated methicillin‐resistant Staphylococcus aureus USA300 genotype as a major cause of health care‐associated bloodstream infections.Clin Infect Dis.2006;42:647–656.
- ,.Clostridium difficile infection in the intensive care unit.Infect Dis Clin North Am.2009;23:727–743.
- .Established and potential risk factors for Clostridum difficile infection.Indian J Med Microbiol.2009;27:289–300.
- ,,,.Increasing prevalence and severity of Clostridium difficile colitis in hospitalized patients in the United States.Arch Surg.2007;142:624–631.
- ,,.Increase in adult Clostridium difficile‐related hospitalizations and case‐fatality rate, United States, 2000‐2005.Emerg Infect Dis.2008;14:929–931.
- ,,.Increase in Clostridium difficile‐related hospitalizations among infants in the United States, 2000‐2005.Pediatr Infect Dis J.2008;27:1111–1113.
- ,,,.Health care costs and mortality associated with nosocomial diarrhea due to Clostridium difficile.Clin Infect Dis.2002;34:346–353.
- ,,, et al.Clinical practice guidelines for Clostridium difficile infection in adults: 2010 update by the Society for Healthcare Epidemiology of America (SHEA) and the Infectious Diseases Society of America (IDSA).Infect Control Hosp Epidemiol.2010;31:431–455.
- ,,,.Prevention of endemic healthcare‐associated Clostridium difficile infection: reviewing the evidence.Am J Gastroenterol.2010;105:2327–2340.
- ,,, et al.A predominantly clonal multi‐institutional outbreak of Clostridium difficile‐associated diarrhea with high morbidity and mortality.N Engl J Med.2005;353:2442–2449.
- ,,,.Analysis of an outbreak of Clostridium difficile infection controlled with enhanced infection control measures.Am J Infect Control.2009;37:458–464.
- ,,, et al.Multipronged intervention strategy to control an outbreak of Clostridium difficile infection (CDI) and its impact on the rates of CDI from 2002 to 2007.Infect Control Hosp Epidemiol.2009;30:156–162.
- ,,,,,.Hospital‐wide restriction of clindamycin: effect on the incidence of Clostridium difficile‐associated diarrhea and cost.Ann Intern Med.1998;128:989–995.
- ,,, et al.Successful use of feedback to improve antibiotic prescribing and reduce Clostridium difficile infection: a controlled interrupted time series.J Antimicrob Chemother.2007;59:990–995.
- ,.Impact of changes in antibiotic policy on Clostridium difficile‐associated diarrhoea (CDAD) over a five‐year period in a district general hospital.J Hosp Infect.2003;54:104–108.
- ,,,,,.An antibiotic policy associated with reduced risk of Clostridium difficile‐associated diarrhoea.Age Ageing.1999;28:578–580.
- ,,,,,.Antibiotic prescribing policy and Clostridium difficile diarrhoea.Q J Med.2004;97:423–429.
- ,,,,.Impact of a reduction in the use of high‐risk antibiotics on the course of an epidemic of Clostridium difficile‐associated disease caused by the hypervirulent NAP1/027 strain.Clin Infect Dis.2007;45(suppl 2):S112–S121.
- .Economic burden of healthcare‐associated infections: an American perspective.Expert Rev Pharmacoecon Outcomes Res.2009;9:417–422.
- .The Direct Medical Costs of Healthcare‐Associated Infections in US Hospitals and the Benefits of Prevention. Division of Healthcare Quality Promotion, National Center for Preparedness, Detection, and Control of Infectious Diseases, Coordinating Center for Infectious Diseases, Centers for Disease Control and Prevention. Polock DA, Stone PW, eds.London, UK:Economist;2009.
- ,,,,.Multidrug‐resistant Pseudomonas aeruginosa: risk factors and clinical impact.Antimicrob Agents Chemother.2006;50:43–48.
- ,,,,,.The impact of methicillin resistance in Staphylococcus aureus bacteremia on patient outcomes: mortality, length of stay, and hospital charges.Infect Control Hosp Epidemiol.2005;26:166–174.
- ,,, et al.Impact of imipenem resistance on mortality in patients with Acinetobacter bacteraemia.J Antimicrob Chemother.2007;59:525–530.
- ,,,,.Extended‐spectrum beta‐lactamase‐producing Escherichia coli and Klebsiella pneumoniae: risk factors for infection and impact of resistance on outcomes.Clin Infect Dis.2001;32:1162–1171.
- ,.Clinical and economic impact of methicillin resistance in patients with Staphylococcus aureus bacteremia.Diagn Microbiol Infect Dis.2005;52:113–122.
- ,,,,,.Clinical and economic impact of bacteremia with extended‐spectrum‐beta‐lactamase‐producing Enterobacteriaceae.Antimicrob Agents Chemother.2006;50:1257–1262.
- ,,, et al.Determinants of vancomycin resistance and mortality rates in enterococcal bacteremia: a prospective multicenter study.Ann Intern Med.2001;135:484–492.
- ,,, et al.Direct costs of multidrug‐resistant Acinetobacter baumannii in the burn unit of a public teaching hospital.Am J Infect Control.2004;32:342–344.
- ,,.Epidemiologic, clinical, and economic evaluation of an outbreak of clonal multidrug‐resistant Acinetobacter baumannii infection in a surgical intensive care unit.Infect Control Hosp Epidemiol.2007;28:1247–1254.
- .The relationship between antimicrobial resistance and patient outcomes: mortality, length of hospital stay, and health care costs.Clin Infect Dis.2006;42(suppl 2):S82–S89.
- ,,, et al.Hospital and societal costs of antimicrobial‐resistant infections in a Chicago teaching hospital: implications for antibiotic stewardship.Clin Infect Dis.2009;49:1175–1184.
- The Joint Commission. About The Joint Commission. Available at: http://www.jointcommission.org/facts_about_the_joint_commission/. Accessed March 29,2011.
- The Joint Commission. Accreditation Program: Hospital. National Patient Safety Goals. Effective January 1, 2011. Available at: http://www.jointcommission.org/assets/1/6/2011_NPSGs_HAP.pdf. Accessed January 24,2011.
- Deficit Reduction Act. Sec. 5001. Hospital Quality Improvement. Available at: http://www.cms.gov/HospitalAcqCond/Downloads/DeficitReductionAct2005. pdf. Accessed March 29,2011.
- Centers for Disease Control and Prevention (CDC). Get Smart: Know When Antibiotics Work. Available at: http://www.cdc.gov/getsmart/. Accessed March 30,2011.
- Centers for Disease Control and Prevention (CDC). National Ambulatory Medical Care Survey. Available at: http://www.cdc.gov/nchs/ahcd. Accessed March 30,2011.
- Centers for Disease Control and Prevention (CDC). About Healthy People 2010. Available at: http://www.cdc.gov/nchs/healthy_people/hp2010.htm. Accessed March 30,2011.
- Centers for Disease Control and Prevention (CDC). DATA2010…the Healthy People 2010 Database. Available at: http://wonder.cdc.gov/DATA2010/ by searching for antibiotic. Accessed March 30,2011.
- Centers for Disease Control and Prevention (CDC). Get Smart for Healthcare. Available at: http://www.cdc.gov/getsmart/healthcare/. Accessed March 29,2011.
- The Institute for Healthcare Improvement (IHI). About IHI. Available at: http://www.ihi.org/ihi/about. Accessed March 29,2011.
- Centers for Disease Control and Prevention (CDC). Get Smart for Healthcare: All Clinicians Should…. Available at: http://www. cdc.gov/getsmart/healthcare/improve‐efforts/clinicians.html. Accessed May 3,2011.
- United States Department of Health 18:638–656.
- .Antimicrobial stewardship: application in the intensive care unit.Infect Dis Clin North Am.2009;23:683–702.
- ,,.Information technology for optimizing the management of infectious diseases.Am J Health Syst Pharm.2006;63:957–965.
- ,.Informatics and epidemiology in infection control.Infect Dis Clin North Am.2011;25:261–270.
- ,,,,,.Antibiotic optimization. An evaluation of patient safety and economic outcomes.Arch Intern Med.1997;157:1689–1694.
- ,,,.A randomized, prospective study measuring outcomes after antibiotic therapy intervention by a multidisciplinary consult team.Pharmacotherapy.1999;19:1369–1377.
- Centers for Disease Control and Prevention (CDC). Get Smart for Healthcare: Impact of Antibiotic Stewardship Program Interventions on Costs. Available at: http://www.cdc.gov/getsmart/healthcare/support‐efforts/asp‐int‐costs.html. Accessed May 3,2011.
- ,,,,.Favorable impact of a multidisciplinary antibiotic management program conducted during 7 years.Infect Control Hosp Epidemiol.2003;24:699–706.
- ,,,,.Short‐course empiric antibiotic therapy for patients with pulmonary infiltrates in the intensive care unit. A proposed solution for indiscriminate antibiotic prescription.Am J Respir Crit Care Med.2000;162:505–511.
- ,,,,,.Effects of requiring prior authorization for selected antimicrobials: expenditures, susceptibilities, and clinical outcomes.Clin Infect Dis.1997;25:230–239.
- ,,,.Growth in the care of older patients by hospitalists in the United States.N Engl J Med.2009;360:1102–1112.
- Society of Hospital Medicine (SHM). Information About SHM and Hospitalists. Available at: http://www.hospitalmedicine.org/. Accessed April 1,2011.
- Society of Hospital Medicine (SHM). New Study Finds Over Half of US Hospitals Utilize Hospitalists. Available at: http://www.hospital medicine.org/AM/Template.cfm?Section=Press_Releases56:893–904.
- .Engaging hospitalists in antimicrobial stewardship: the CDC perspective.J Hosp Med.2011;6(suppl 1):S31–S33.
