User login
Hospitalists and Intensivists in the ICU
Observational studies suggest intensive care unit (ICU) patients have decreased mortality and length of stay (LOS) when cared for by intensivists.111 This prior literature relies on many small, single‐center studies with retrospective designs or historical controls, and compares intensivists to non‐intensivists with concurrent inpatient and outpatient responsibilities.113 These findings are the foundation for patient safety initiatives advocating intensivist involvement with all critically ill patients in urban ICUs.14
Critical care workforce evaluations predict a widening disparity between the United States supply and demand for intensivists,1516 raising concern that national ICU staffing with these specialists is not feasible. The most current data suggests that intensivists care for only one‐third of ICU patients due to a nationwide shortage.15 As a result, other specialists and generalistsincluding 75% of hospitalistsprovide critical care management.17
Despite prevalent hospitalist practice in ICUs,17 no studies evaluate their adult ICU patient outcomes, with or without intensivist consultation. Our primary aim was to compare the mortality and LOS of medical ICU patients cared for by a hospitalist team with those of an intensivist‐led team. While baseline differences were expected between each teams' patients, we hypothesized that the adjusted patient outcomes would not be different.
METHODS AND PATIENTS
Design Overview
We used a prospective observational design to measure patient mortality and LOS within 2 medical ICU staffing paradigms. This was a collaborative study between the Division of Hospital Medicine and the Division of Pulmonary and Critical Care Medicine, with approval from Emory University's Institutional Review Board.
The hospitalist ICU model was staffed by a board certified internal medicine attending, with clinical responsibilities limited to the ICU. An intensivist‐led consult team (members distinct from the intensivist‐led ICU team) was staffed by a board certified pulmonary critical care attending and non‐physician providers. This consult team comanaged mechanically ventilated patients and was available for additional critical care consultation at the hospitalists' discretion. The intensivist‐led ICU model was staffed by a board certified pulmonary critical care attending, a pulmonary critical care fellow (postgraduate years 46) and 4 internal medicine residents (postgraduate years 23).
For their respective patients, the hospitalist and intensivist‐led teams participated in similar multidisciplinary ICU rounds with the charge nurse, respiratory therapist, and pharmacist. Both teams used the same evidence‐based ICU protocols and order sets. The hospitalists and intensivists were aware of the ongoing study.
Setting and Participants
Our study was conducted in an urban, community teaching hospital that is affiliated with a major regional academic university and has 400 medical‐surgical beds, including 56 ICU beds. All medical ICU patients receiving primary medical care from the hospitalist or intensivist‐led team were assessed for inclusion between October 2007 and September 2008. Predetermined exclusion criteria included surgery under general anesthesia, outside hospital transfers, pregnancy, and age under 18.
Selection of the admitting ICU team followed existing institutional referral patterns. For emergency department (ED) patients, the ED physicians made the decision to admit to the ICU and contacted an ICU team based on the respiratory support needs of the patient, not the admitting diagnosis. ED patients with respiratory failure who required invasive ventilatory support were admitted to the intensivist‐led ICU team. Those without invasive ventilatory support were admitted to the hospitalist ICU team, including ones with respiratory failure requiring noninvasive ventilation. Patients transferred from a hospital floor bed to the ICU by non‐hospitalist physicians were assigned to the intensivist‐led ICU team, while those transferred by hospitalist floor teams were assigned to the hospitalist ICU team, regardless of diagnosis or respiratory support needs. Patient assignments deviated from these patterns, however, based on ICU teams' census. The intensivist‐led ICU team had a strict limit of 20 patients, established by the residency program, and the hospitalist ICU team had a preferred limit of 12 patients.
Measurement of Outcomes and Follow‐Up
Study endpoints were in‐hospital and ICU mortality, as well as hospital and ICU LOS. Patient characteristics and outcome data were collected prospectively from medical records and hospital databases by 2 trained research nurses according to study protocol. For data collection training, 1 investigator (K.R.W.) reviewed sample data from 108 patients to ensure consistency and accuracy of data abstraction. Patients with several ICU admissions during 1 hospitalization had ICU data collected only from the first ICU entry, consistent with other trials' methodology.1, 4, 10, 1820 Additional ICU entries did not change ICU LOS derived only from the initial entry, but did contribute to hospital LOS. Data from patients with multiple ICU entries was analyzed with the original team assignment. All patients were followed until death or hospital discharge.
Statistical Analysis
Sample size was determined a priori using an expected inpatient mortality of 10% from historical data, power of 80%, and 2‐sided alpha of 0.05 to demonstrate no difference in outcomes, defined as a mortality difference of <5% between teams. This mortality difference used for the power calculation is consistent with other trial designs.2125 The required sample size was 1306 patients calculated using PASS software (version 2008, NCSS, Kaysville, UT), accounting for an expected 3:2 admission rate to the hospitalists. The statistician was blinded to team assignments.
Clinical characteristics of the groups were compared with the Student t test. The outcome and predictor variable distributions were examined with univariate analyses. Bivariate analyses were calculated for each predictor and endpoint. Multiple logistic and linear regression analyses were performed. Propensity scores were used and defined as the conditional probability of admission to the hospitalist versus intensivist‐led ICU team given a patient's covariates. It included all predictors in Table 1 and was calculated using logistic regression. Outcome measures were excluded from the regression.
| Hospitalist No. Patients (%) | Intensivist No. Patients (%) | P Value | |
|---|---|---|---|
| |||
| Gendermale | 399 (48.2) | 256 (48.5) | 0.92 |
| Agemean (SD) | 61.3 (17.9) | 60.5 (16.3) | 0.40 |
| Race* | 0.70 | ||
| Black | 678 (81.9) | 426 (80.7) | |
| White | 141 (17.0) | 94 (17.8) | |
| Cardiovascular disease | 660 (79.7) | 432 (81.8) | 0.34 |
| Diabetes mellitus | 318 (38.4) | 212 (40.2) | 0.52 |
| Renal disease | 288 (34.8) | 189 (35.8) | 0.70 |
| Pulmonary disease | 232 (28.0) | 179 (33.9) | 0.02 |
| Neurological disorders | 219 (26.5) | 137 (26.0) | 0.84 |
| GI disease | 138 (16.7) | 90 (17.1) | 0.86 |
| Cancer | 72 (8.7) | 63 (11.9) | 0.05 |
| Morbid obesity (BMI 40) | 72 (8.7) | 28 (5.3) | 0.02 |
| HIV/AIDS | 55 (6.6) | 33 (6.3) | 0.78 |
| Immunological disorders | 26 (3.1) | 31 (5.9) | 0.01 |
| SAPS IImean (SD) | 37.4 (14.5) | 45.1 (16.9) | <0.001 |
| Noninvasive ventilation | 148 (17.9) | 136 (25.8) | <0.001 |
| Mechanical ventilation | 91 (11.0) | 274 (51.9) | <0.001 |
| Central venous catheters | 241 (29.1) | 268 (50.8) | <0.001 |
A generalized linear model (GENMOD), using a binomial distribution and an identity link function,26 assessed the in‐hospital and ICU mortality rate differences between teams while controlling for major risk factors identified. GENMOD, however, does not accommodate several covariates, as it often fails for lack of convergence. Hence, logistic regression models with adjusted odds ratios (aOR) are reported as well.
The initial logistic regression model for in‐hospital and ICU mortality included all 20 independent variables from patient demographics, comorbidities, simplified acute physiology score (SAPS) II,27 respiratory support, central venous catheter (CVC) utilization, which included peripherally placed central catheters, and all terms for 2‐way interactions with team assignment. To determine the best model, a hierarchical backward elimination was executed while assessing for interactions, confounding, and estimate precision. Before removing a regression term, a likelihood ratio test was applied to each coefficient followed by Wald's chi square test.28 Collinearity diagnostic for nonlinear models was applied to look for multicollinearity. To exclude variables or regression terms, a condition index of 30 and variance decomposition proportion of 0.5 were used. The final model was evaluated for goodness‐of‐fit using the Hosmer and Lemeshow test.
LOS was analyzed with linear regression using the same covariates and backward elimination as the logistic model. Goodness‐of‐fit was evaluated using coefficient of determination (r2). A variance inflation factor of 10 was used to assess for collinearity. Two‐sided P values 0.05 were considered statistically significant. All analyses were performed with SAS software (version 9.1, SAS Institute, Cary, NC).
RESULTS
Patients
A total of 1747 patients received critical care from the hospitalist or intensivist‐led teams (Figure 1). Of the 1367 patients who met inclusion criteria, complete data was available for 1356 patients. The ED was the ICU admission source for 68.8% of hospitalist and 69.9% of intensivist patients. Baseline patient demographics were similar (Table 1). Among preexisting comorbidities, morbid obesity was more prevalent in hospitalist patients, whereas cancer and pulmonary and immunological diseases were more prevalent in intensivist patients (Table 1).
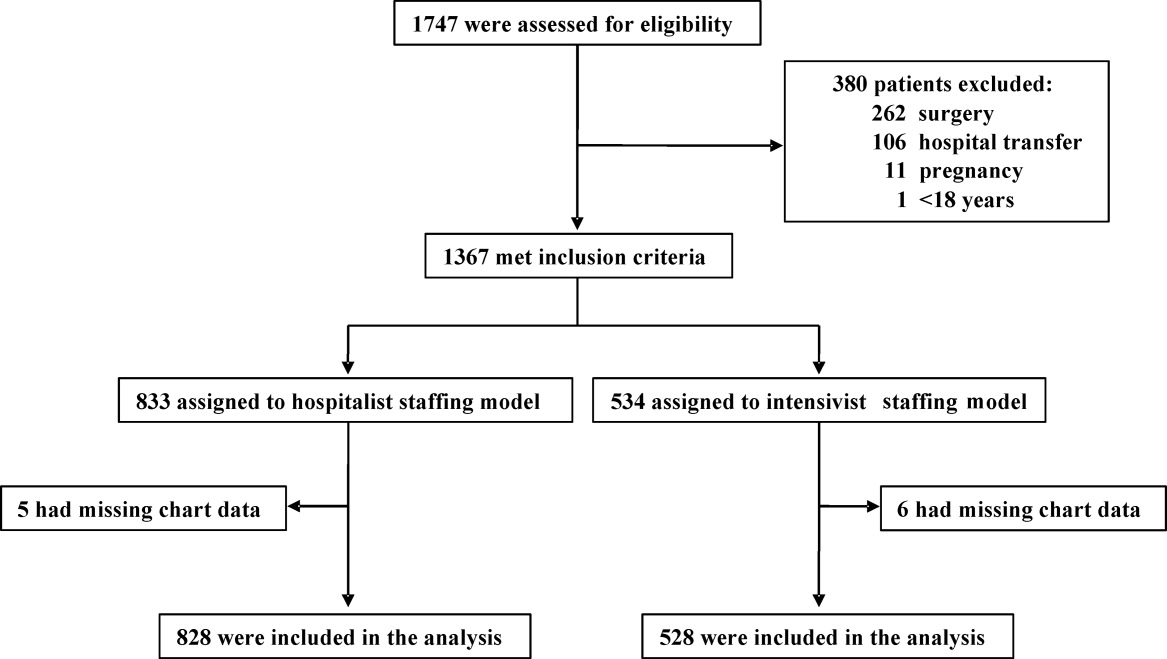
Hospitalist patients, compared to intensivist patients, had a lower mean SAPS II (37.4 vs 45.1, P < 0.001), less noninvasive (17.9% vs 25.8%, P < 0.001) and mechanical (11.0% vs 51.9%, P < 0.001) ventilation utilization, and fewer CVCs (29.1% vs 50.8%, P < 0.001) (Table 1). The intensivist‐led consult team comanaged 18.4% of the hospitalist patients. These 152 patients had a mean SAPS II of 41, and 19.7% required noninvasive ventilation while 44.1% required mechanical ventilation. For mechanically ventilated hospitalist patients, 80.2% were comanaged by the intensivist‐led consult team, 5.5% had palliative care for end‐of‐life management, 6.6% died imminently, and 7.7% received short‐term ventilation managed by the hospitalist. Hospitalist and intensivist‐led teams' ICU readmission rates were similar (7.0% vs 5.9%, P = 0.41).
Outcomes
Of the 1356 patients, there were 168 (12.4%) deaths and 135 (10.0%) occurred in the ICU. The overall mean ICU LOS was 4.0 days (SD 5.9), and mean hospital LOS was 9.1 days (SD 9.0). The mean hospital LOS for survivors was 9.0 days (SD 8.8).
Bivariate Outcomes
Patients were stratified for bivariate analysis into 3 tiers based on SAPS II to reflect low (33), intermediate (34‐51), and high (52) disease acuity corresponding to a predicted mortality of <15%, between 15 and 50%, and >50% (Table 2). Those with intermediate severity only showed an ICU LOS difference that was shorter for hospitalist patients. All remaining strata demonstrated lower mortality and LOS among the hospitalist patients (Table 2).
| Hospitalist % (No. Died) | Intensivist% (No. Died) | Mortality Rate Difference* 95% CI | P Value | |
|---|---|---|---|---|
| Hospitalist Days (No. Patients) | Intensivist Days (No. Patients) | LOS Difference 95% CI | P Value | |
| ||||
| In‐hospital mortality | ||||
| SAPS 33 | 1.4 (5) | 4.4 (6) | 3.0 (0.09, 5.80) | 0.04 |
| SAPS 34‐51 | 7.9 (16) | 10.7 (24) | 2.8 (2.10, 7.70) | 0.26 |
| SAPS 52 | 29.6 (40) | 40.6 (67) | 11.0 (0.07, 21.88) | 0.05 |
| ICU mortality | ||||
| SAPS 33 | 0.6 (2) | 3.6 (5) | 3.1 (0.80, 5.40) | 0.01 |
| SAPS 34‐51 | 6.1 (20) | 9.3 (21) | 3.3 (1.17, 7.70) | 0.15 |
| SAPS 52 | 22.2 (30) | 34.6 (57) | 12.3 (2.02, 22.63) | 0.02 |
| Hospital LOS | ||||
| SAPS 33 | 6.0 (363) | 8.2 (138) | 2.2 (0.81, 3.60) | 0.002 |
| SAPS 34‐51 | 9.8 (330) | 9.2 (225) | 0.6 (2.01, 0.77) | 0.38 |
| SAPS 52 | 10.9 (135) | 13.4 (165) | 2.5 (0.15, 5.15) | 0.06 |
| ICU LOS | ||||
| SAPS 33 | 2.2 (363) | 3.8 (138) | 1.6 (0.89, 2.27) | <0.001 |
| SAPS 34‐51 | 3.5 (330) | 4.9 (225) | 1.4 (0.44, 2.31) | 0.004 |
| SAPS 52 | 4.7 (135) | 7.4 (165) | 2.7 (0.84, 5.60) | 0.005 |
Adjusted Outcomes
The logistic and linear regression models include covariates detailed in the Table 3 legend and are referent to the hospitalist team. Logistic regression models demonstrated no difference in adjusted in‐hospital mortality (aOR 0.8 [95% confidence interval (CI): 0.49, 1.18], P = 0.23) and adjusted ICU mortality (aOR 0.8 [95% CI: 0.51, 1.32], P = 0.41) between the 2 ICU staffing models (Table 3). Linear regression models also demonstrated no difference in adjusted hospital LOS difference (0.9 days [95% CI: 1.88, 0.12], P = 0.98) and adjusted ICU LOS (0.3 days [95% CI: 0.92, 0.30], P = 0.32) (Table 3). Outcomes were re‐analyzed using propensity scores within the regression models, yielding similar results that did not change the estimate or improve precision. The overall results also remained comparable when calculations were repeated, excluding patient outliers (SAPS II >75 or hospital LOS >30days).
| Adjusted Mortality Difference [%] (95% CI) | P Value | Adjusted Mortality OR (95% CI) | P Value | Mean LOS Difference [days] (95% CI) | P Value | |
|---|---|---|---|---|---|---|
| ||||||
| All patients* (n = 1356) | ||||||
| In‐hospital | 0.3 (1.83, 1.19) | 0.68 | 0.8 (0.49, 1.18) | 0.22 | 0.9 (1.88, 0.12) | 0.98 |
| ICU | 0.2 (1.19, 1.57) | 0.79 | 0.8 (0.51, 1.32) | 0.41 | 0.3 (0.92, 0.30) | 0.32 |
| Without MV (n = 991) | ||||||
| In‐hospital | 0.2 (1.97, 1.57) | 0.82 | 0.8 (0.38, 1.56) | 0.47 | 0.2 (1.12, 0.78) | 0.72 |
| ICU | 0.4 (1.29, 2.12) | 0.63 | 1.0 (0.44, 2.27) | 0.99 | 0.03 (0.39, 0.34) | 0.89 |
| With MV (n = 365) | ||||||
| In‐hospital | 2.7 (13.69, 8.22) | 0.62 | 0.8 (0.45, 1.45) | 0.48 | 2.0 (4.74, 0.66) | 0.14 |
| ICU | 5.2 (16.10, 5.69) | 0.35 | 0.7 (0.38, 1.25) | 0.26 | 0.2 (2.18, 1.74) | 0.82 |
Subgroup Analysis
Since each team's respiratory support utilization differed greatly and was a significant variable in the logistic and linear regression models, we performed subgroup analysis of mechanically ventilated patients (Table 4). Without mechanical ventilation, no significant outcome differences were detected between the intensivist and hospitalist groups when stratified by disease severity (Table 4).
| Without Mechanical Ventilation | With Mechanical Ventilation | |||||
|---|---|---|---|---|---|---|
| Hospitalist % (No. Died) | Intensivist % (No. Died) | P Value | Hospitalist % (No. Died) | Intensivist % (No. Died) | P Value | |
| Hospitalist Days (Patients) | Intensivist Days (Patients) | P Value | Hospitalist Days (Patients) | Intensivist Days (Patients) | P Value | |
| ||||||
| In‐hospital mortality | ||||||
| SAPS 33 | 1.4 (5) | 2.2 (2) | 0.63 | 0.0 (0) | 8.9 (4) | 0.22 |
| SAPS 3451 | 5.2 (15) | 4.3 (5) | 0.72 | 27.5 (11) | 17.4 (19) | 0.18 |
| SAPS 52 | 20.0 (20) | 15.6 (7) | 0.53 | 57.1 (20) | 50.0 (60) | 0.46 |
| ICU mortality | ||||||
| SAPS 33 | 0.6 (2) | 1.1 (1) | 0.60 | 0.0 (0) | 8.9 (4) | 0.22 |
| SAPS 3451 | 3.1 (9) | 3.5 (4) | 0.86 | 27.5 (11) | 15.6 (17) | 0.10 |
| SAPS 52 | 11.0 (11) | 11.1 (5) | 0.98 | 54.3 (19) | 43.3 (52) | 0.26 |
| Hospital LOS | ||||||
| SAPS 33 | 5.6 (347) | 6.5 (93) | 0.25 | 13.8 (16) | 11.8 (45) | 0.50 |
| SAPS 3451 | 8.7 (290) | 7.9 (116) | 0.28 | 17.8 (40) | 10.6 (109) | <0.001 |
| SAPS 52 | 10.2 (100) | 11.0 (45) | 0.62 | 12.7 (35) | 14.3 (120) | 0.56 |
| ICU LOS (days) | ||||||
| SAPS 33 | 1.9 (347) | 2.2 (93) | 0.30 | 8.0 (16) | 7.0 (45) | 0.67 |
| SAPS 3451 | 2.6 (290) | 2.8 (116) | 0.52 | 10.6 (40) | 7.2 (109) | 0.02 |
| SAPS 52 | 3.5 (100) | 2.8 (45) | 0.17 | 8.1 (35) | 9.2 (120) | 0.61 |
With mechanical ventilation, patients with intermediate illness severity had a significantly shorter hospital LOS (10.6 vs 17.8 days, P < 0.001) and ICU LOS (7.2 vs 10.6 days, P = 0.02) when managed by the intensivist‐led team (Table 4). When the calculations were repeated for only the patients who survived hospitalization, the shorter ICU LOS (6.5 vs 10.9 days, P = 0.01) remained significant but not the hospital LOS (10.3 vs 19.3 days, P = 0.10). The patients with intermediate acuity also showed a trend toward a decreased ICU mortality (15.6% vs 27.5%, P = 0.10) when managed by the intensivist‐led team (Table 4).
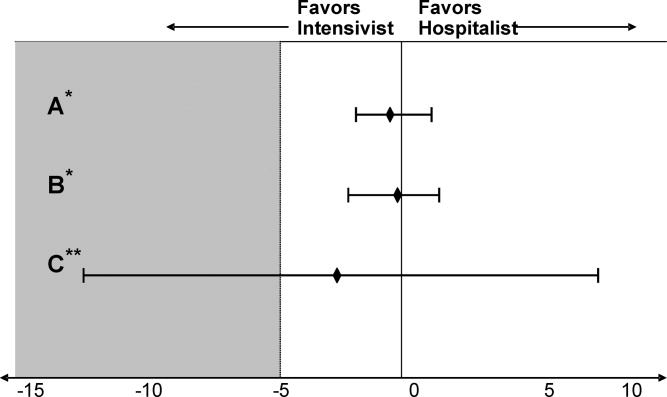
Adjusting for relevant risk factors, no statistically significant mortality rate difference was demonstrated between the hospitalist and intensivist‐led teams when evaluating all patients or patients without mechanical ventilation. The result, however, was inconclusive for patients with mechanical ventilation and did not allow refutation of the null hypothesis because the confidence interval for the mortality rate difference crossed the prespecified mortality difference threshold for clinical significance (Figure 2).
DISCUSSION
We present the first prospective evaluation of adult patient outcomes comparing intensivist‐led and hospitalist ICU staffing models. This study was powered to demonstrate no difference in hospital and ICU mortality between these ICU staffing models at a single university‐affiliated community hospital, though subgroups were not accounted for in these calculations. Consistent with our observational design, we did not influence or change established triage systems. This led to expected significant differences in baseline patient severity of illness and mechanical ventilation use. We adjusted for these and other potential confounders by stratifying patients with SAPS II, examining mechanically ventilated patients separately, and using logistic and linear regression models and propensity scores, recognizing that unmeasured differences in illness severity may remain.29
Our initial adjustment for baseline patient disparities between teams used bivariate analysis with SAPS II to stratify patients into 3 tiers to reflect low (33), intermediate (34‐51), and high (52) disease acuity. Hospitalist patients with intermediate acuity comprised the only tier without decreased in‐hospital and ICU mortality when compared to the intensivist intermediate patients (Table 2). We suspect these mortality differences are related to the intensivist patients' increased mechanical ventilation utilization seen at all acuity levels. Hospitalist patients had a significantly shorter hospital LOS for low‐acuity patients and significantly shorter ICU LOS for all severity groups (Table 2). This lower LOS may stem from greater efficiency of hospitalist ICU attendings managing transitions from the ICU in conjunction with other hospitalist colleagues. It also may reflect other unmeasured factors that affected illness severity in the intensivist patients.
When patients were stratified by both SAPS II and mechanical ventilation status, the lower mortality and LOS findings previously seen with hospitalist patients were no longer apparent (Table 4). Interestingly, patients with intermediate or high SAPS II requiring mechanical ventilation had lower mortality (10% absolute difference) in the intensivist‐led teamalbeit none reached statistical significance, probably due to small subgroup sizes (Table 4). Intensivist patients requiring mechanical ventilation also had a statistically significant shorter hospital LOS in the intermediate acuity patients (Table 4). These results contradict the controversial findings by Levy et al. which suggested that ICU patients with intermediate disease acuity have increased hospital mortality when cared for by intensivists versus non‐intensivists.18 We postulate these demonstrated differences likely reflect intensivist training and experience in caring for mechanically ventilated, higher acuity patients. Surprisingly, the presence of an intensivist‐led consult team did not mitigate the mortality and LOS differences seen for mechanically ventilated patients on the hospitalist team. Perhaps intensivist expertise was underutilized when they served in the consultant role.
The adjusted outcomes using multivariable analysis with logistic and linear regression models did not find a statistically significant difference in mortality or LOS, regardless of mechanical ventilation status (Table 3). These statistical models used 20 patient variables and identified key variables with the greatest impactSAPS II, mechanical ventilation, and CVC presence. We next examined mortality differences adjusting only for these 3 variables and were unable to detect a statistically significant mortality difference between the teams (Figure 2). We suspect that a CVC is not an independent risk factor but instead a surrogate marker of illness severity and likely of vasopressor use.
Study Limitations
Our study has several obvious limitations. It uses an observational design within a single hospital. However, this is seen in prior comparisons of intensivists to non‐intensivists.15, 810 Our study is unique with its prospective design and sample‐size calculation to demonstrate no difference in outcomes. Because our data is from a single center, it eliminates practice differences encountered when comparing multiple institutions, but it may also limit its generalizability.
Another major limitation in our comparison of an intensivist‐led ICU team to a hospitalist ICU team is their composition. Instead of 2 multidisciplinary teams, we compared a hospitalist's performance to that of a group of physicians at various levels of training. Similar comparisons have been seen in prior studies. For example, in the large study by Levy et al., half of the intensivists studied were in academic centers affiliated with teaching teams.18 Housestaff involvement, however, may have confounded the intensivist‐led team's patient outcomes. Tenner et al. demonstrated improved survival and decreased LOS in a pediatric ICU when hospitalists provided after‐hours coverage instead of residents.30 Furthermore, the patient census varied between the ICU teams, potentially impacting outcomes. While each service had only 1 attending, the hospitalist team had 1 clinician caring for patients whereas the intensivist‐led team had 5 to 6 clinicians. This study's implications may be more relevant to academic centers. A similar study of hospitalists and intensivists conducted in a nonteaching institution may yield different results.
Our 2 patient groups had substantial differences in illness severity and mechanical ventilation. Despite statistical techniques to address potential confounders in observational trials including stratification, multivariable adjustment, and propensity scores,29 residual confounders may still remain that influence the results and thus our conclusions. SAPS II is a validated method to objectively quantify disease severity and provide predictive mortality,27 however, it has known deficiencies. The use of propensity scores may not fully account for selection biases in team assignments introduced by the ED physicians. Biases may stem from the ICU teams' awareness of the ongoing study, and each team may have tried to maintain improved outcomes.
Additionally, the mortality outcomes represent in‐hospital mortality, not 30‐day mortality. This may be a less‐useful indicator of ICU performance because of post‐ICU transitions to extended care facilities and emphasis on end‐of‐life care. The majority of patients from both ICU models, however, did transfer to inpatient medical units under the care of non‐ICU hospitalist teams. Furthermore, this study did not capture important outcomes reported in other investigations, such as discharge disposition or quality of life after discharge.3132 Finally, the adjusted odds ratio for the intensivist‐led team's in‐hospital mortality (aOR 0.8, P = 0.23), referent to the hospitalist, does not eliminate the possibility that an intensivist‐led model may reduce mortality risk.
Our study suggests that intermediate‐ and high‐acuity, mechanically ventilated patients may benefit from care by intensivists rather than hospitalists. The results from this initial study could be used to design and estimate sample size for future studies of hospitalists and intensivists to elucidate risk reduction. Randomized and multicenter trials are needed to provide more robust data, because our subgroups were small and not accounted for in the sample size calculation. Considering the severe intensivist shortage, 1 strategy to provide effective and efficient coverage of the growing American ICU population may be to ask hospitalists to care independently for lower acuity ICU patientsespecially nonventilated patientswhile encouraging or requiring intensivist care for higher acuity patients, especially once mechanically ventilated.
Conclusion
We anticipate this initial study of hospitalist and intensivist‐led ICU teams will validate a hospitalist ICU staffing model for further investigation. We propose that hospitalists can provide quality care for lower acuity critical care patients. This may improve intensivist availability to higher acuity critically ill patients and allow for judicious utilization of the limited intensivist supply. Future studies may better delineate specific subgroups of critically ill patients who benefit most from intensivist primary involvement. Additional research may also help generate evidence‐based triage standards to appropriate critical care teams and foster guideline development. Hospitalists may be instrumental in the critical care staffing shortage, however, identification of their ideal role requires further study.
Acknowledgements
The authors thank Ralph Bailey, RN; Daniel S. Budnitz, MD, MPH; Kirk Easley, MPH; Michael Heisler, MD, MPH; Joan Lopez, RN; Jason Stein, MD; and David Tong MD, MPH for their support and contributions.
- ,,,,,.On‐site physician staffing in a community hospital intensivist care unit.JAMA.1984;252(15):2023–2027.
- ,,,.Impact of critical care physician staffing on patients with septic shock in a university hospital medical intensive care unit.JAMA.1988;260(23):3446–3450.
- ,.Effect on ICU mortality of a full‐time critical care specialist.Chest.1989;96(1):127–129.
- ,,, et al.Effects of organizational change in the medical intensive care unit of a teaching hospital.JAMA.1996;276(4):322–328.
- ,,, et al.Effects of a medical intensivist on patient care in a community teaching hospital.Mayo Clin Proc.1997;72(5):391–399.
- ,,, et al.A ‘closed’ medical intensive care unit (MICU) improves resource utilization when compared with an ‘open’ MICU.Am J Respir Crit Care Med.1998;157(5):1468–1473.
- ,,, et al.Organizational characteristics of intensive care units related to outcomes of abdominal aortic surgery.JAMA.1999;281(14):1310–1312.
- ,,, et al.Effects of an organized critical care service on outcomes and resource utilization: a cohort study.Crit Care Med.1999;27(2):270–274.
- ,.Out‐of‐hours consultant cover and case‐mix adjusted mortality in intensive care.Lancet.2000;356:735–736.
- ,,.The impact of organizational changes on outcomes in an intensive care unit in the United Kingdom.Intensive Care Med.2001;27:865–872.
- ,,.Do intensivists in ICU improve outcome?Best Pract Res Clin Anaesthesiol.2005;19(1):125–135.
- ,,, et al.Physician staffing patterns and clinical outcomes in critically ill patients: a systemic review.JAMA.2002;288(17):2151–2162.
- ,.Potential reduction in mortality rates using an intensivist model to manage intensive care units.Eff Clin Pract.2000;3(6):284–289.
- The Leapfrog Group Fact Sheet. ICU Physician Staffing Fact Sheet. Available at: http://www.leapfroggroup.org/media/file/Leapfrog _ICU_Physician_Staffing_Fact_Sheet.pdf and http://www.leapfroggroup.org/media/file/Fact_Sheet_Leapfrog_Group.pdf. Accessed November 8,2009.
- ,,,,.Committee on Manpower for Pulmonary and Critical Care Societies (COMPACCS). Current and projected workforce requirements for care of the critically ill and patients with pulmonary disease: can we meet the requirements of an aging population?JAMA.2000;284(21):2762–2770.
- US Department of Health and Human Services, Health Resources and Services Administration (HRSA).Report to Congress: the critical care workforce; a study of the supply and demand for critical care physicians. Senate Report 108–181.Rockville, MD:HRSA; May2006.
- ,.2007–2008 Survey: The Authoritative Source on the State of the Hospital Medicine Movement.Philadelphia, PA:Society of Hospital Medicine;2008.
- ,,,,,.Association between critical care physician management and patient mortality in the intensive care unit.Ann Intern Med.2008;148(11):801–809.
- ,,,.Variations in mortality and length of stay in intensive care units.Ann Intern Med.1993;118(10):753–761.
- ,,,.Hospital mortality in relation to staff workload: a 4‐year study in an adult intensive‐care unit.Lancet.2000;356:185–189.
- ,,, et al.A comparison of albumin and saline for fluid resuscitation in the intensive care unit.N Engl J Med.2004;350(22):2247–2256.
- ,,, et al.A multicenter, randomized controlled clinical trial of transfusion requirements in critical care.N Engl J Med.1999;340(6):409–417.
- ,,, et al.Early goal‐directed therapy in the treatment of severe sepsis and septic shock.N Engl J Med.2001;345(19):1368–1377.
- ,,, et al.Intensive insulin therapy in critically ill patients.N Engl J Med.2001;345(19):1359–1367.
- ,,, et al.Pulmonary‐artery versus central venous catheter to guide treatment of acute lung injury.N Engl J Med.2006;354(21):2213–2224.
- ,.Easy SAS calculations for risk or prevalence ratios and differences.Am J Epidemiol.2005;162(3):199–200.
- ,,.A new simplified acute physiology score (SAPS II) based on a European/North American multicenter study.JAMA.1993;270(24):2957–2963.
- .Epidemiologic methods: the “art” in the state of the art.J Clin Epidemiol.2002;55(12):1196–1200.
- ,,.Methods to adjust for bias and confounding in critical care health services research involving observational data.J Crit Care.2006;21:1–7.
- ,,.Improved survival with hospitalists in a pediatric intensive care unit.Crit Care Med.2003;31(3):847–852.
- ,.ABC of intensive care: outcome data and scoring systems.BMJ.1999;319:241–244.
- ,,.Survival, morbidity, and quality of life after discharge from intensive care.Crit Care Med.2000;28(7):2293–2299.
Observational studies suggest intensive care unit (ICU) patients have decreased mortality and length of stay (LOS) when cared for by intensivists.111 This prior literature relies on many small, single‐center studies with retrospective designs or historical controls, and compares intensivists to non‐intensivists with concurrent inpatient and outpatient responsibilities.113 These findings are the foundation for patient safety initiatives advocating intensivist involvement with all critically ill patients in urban ICUs.14
Critical care workforce evaluations predict a widening disparity between the United States supply and demand for intensivists,1516 raising concern that national ICU staffing with these specialists is not feasible. The most current data suggests that intensivists care for only one‐third of ICU patients due to a nationwide shortage.15 As a result, other specialists and generalistsincluding 75% of hospitalistsprovide critical care management.17
Despite prevalent hospitalist practice in ICUs,17 no studies evaluate their adult ICU patient outcomes, with or without intensivist consultation. Our primary aim was to compare the mortality and LOS of medical ICU patients cared for by a hospitalist team with those of an intensivist‐led team. While baseline differences were expected between each teams' patients, we hypothesized that the adjusted patient outcomes would not be different.
METHODS AND PATIENTS
Design Overview
We used a prospective observational design to measure patient mortality and LOS within 2 medical ICU staffing paradigms. This was a collaborative study between the Division of Hospital Medicine and the Division of Pulmonary and Critical Care Medicine, with approval from Emory University's Institutional Review Board.
The hospitalist ICU model was staffed by a board certified internal medicine attending, with clinical responsibilities limited to the ICU. An intensivist‐led consult team (members distinct from the intensivist‐led ICU team) was staffed by a board certified pulmonary critical care attending and non‐physician providers. This consult team comanaged mechanically ventilated patients and was available for additional critical care consultation at the hospitalists' discretion. The intensivist‐led ICU model was staffed by a board certified pulmonary critical care attending, a pulmonary critical care fellow (postgraduate years 46) and 4 internal medicine residents (postgraduate years 23).
For their respective patients, the hospitalist and intensivist‐led teams participated in similar multidisciplinary ICU rounds with the charge nurse, respiratory therapist, and pharmacist. Both teams used the same evidence‐based ICU protocols and order sets. The hospitalists and intensivists were aware of the ongoing study.
Setting and Participants
Our study was conducted in an urban, community teaching hospital that is affiliated with a major regional academic university and has 400 medical‐surgical beds, including 56 ICU beds. All medical ICU patients receiving primary medical care from the hospitalist or intensivist‐led team were assessed for inclusion between October 2007 and September 2008. Predetermined exclusion criteria included surgery under general anesthesia, outside hospital transfers, pregnancy, and age under 18.
Selection of the admitting ICU team followed existing institutional referral patterns. For emergency department (ED) patients, the ED physicians made the decision to admit to the ICU and contacted an ICU team based on the respiratory support needs of the patient, not the admitting diagnosis. ED patients with respiratory failure who required invasive ventilatory support were admitted to the intensivist‐led ICU team. Those without invasive ventilatory support were admitted to the hospitalist ICU team, including ones with respiratory failure requiring noninvasive ventilation. Patients transferred from a hospital floor bed to the ICU by non‐hospitalist physicians were assigned to the intensivist‐led ICU team, while those transferred by hospitalist floor teams were assigned to the hospitalist ICU team, regardless of diagnosis or respiratory support needs. Patient assignments deviated from these patterns, however, based on ICU teams' census. The intensivist‐led ICU team had a strict limit of 20 patients, established by the residency program, and the hospitalist ICU team had a preferred limit of 12 patients.
Measurement of Outcomes and Follow‐Up
Study endpoints were in‐hospital and ICU mortality, as well as hospital and ICU LOS. Patient characteristics and outcome data were collected prospectively from medical records and hospital databases by 2 trained research nurses according to study protocol. For data collection training, 1 investigator (K.R.W.) reviewed sample data from 108 patients to ensure consistency and accuracy of data abstraction. Patients with several ICU admissions during 1 hospitalization had ICU data collected only from the first ICU entry, consistent with other trials' methodology.1, 4, 10, 1820 Additional ICU entries did not change ICU LOS derived only from the initial entry, but did contribute to hospital LOS. Data from patients with multiple ICU entries was analyzed with the original team assignment. All patients were followed until death or hospital discharge.
Statistical Analysis
Sample size was determined a priori using an expected inpatient mortality of 10% from historical data, power of 80%, and 2‐sided alpha of 0.05 to demonstrate no difference in outcomes, defined as a mortality difference of <5% between teams. This mortality difference used for the power calculation is consistent with other trial designs.2125 The required sample size was 1306 patients calculated using PASS software (version 2008, NCSS, Kaysville, UT), accounting for an expected 3:2 admission rate to the hospitalists. The statistician was blinded to team assignments.
Clinical characteristics of the groups were compared with the Student t test. The outcome and predictor variable distributions were examined with univariate analyses. Bivariate analyses were calculated for each predictor and endpoint. Multiple logistic and linear regression analyses were performed. Propensity scores were used and defined as the conditional probability of admission to the hospitalist versus intensivist‐led ICU team given a patient's covariates. It included all predictors in Table 1 and was calculated using logistic regression. Outcome measures were excluded from the regression.
| Hospitalist No. Patients (%) | Intensivist No. Patients (%) | P Value | |
|---|---|---|---|
| |||
| Gendermale | 399 (48.2) | 256 (48.5) | 0.92 |
| Agemean (SD) | 61.3 (17.9) | 60.5 (16.3) | 0.40 |
| Race* | 0.70 | ||
| Black | 678 (81.9) | 426 (80.7) | |
| White | 141 (17.0) | 94 (17.8) | |
| Cardiovascular disease | 660 (79.7) | 432 (81.8) | 0.34 |
| Diabetes mellitus | 318 (38.4) | 212 (40.2) | 0.52 |
| Renal disease | 288 (34.8) | 189 (35.8) | 0.70 |
| Pulmonary disease | 232 (28.0) | 179 (33.9) | 0.02 |
| Neurological disorders | 219 (26.5) | 137 (26.0) | 0.84 |
| GI disease | 138 (16.7) | 90 (17.1) | 0.86 |
| Cancer | 72 (8.7) | 63 (11.9) | 0.05 |
| Morbid obesity (BMI 40) | 72 (8.7) | 28 (5.3) | 0.02 |
| HIV/AIDS | 55 (6.6) | 33 (6.3) | 0.78 |
| Immunological disorders | 26 (3.1) | 31 (5.9) | 0.01 |
| SAPS IImean (SD) | 37.4 (14.5) | 45.1 (16.9) | <0.001 |
| Noninvasive ventilation | 148 (17.9) | 136 (25.8) | <0.001 |
| Mechanical ventilation | 91 (11.0) | 274 (51.9) | <0.001 |
| Central venous catheters | 241 (29.1) | 268 (50.8) | <0.001 |
A generalized linear model (GENMOD), using a binomial distribution and an identity link function,26 assessed the in‐hospital and ICU mortality rate differences between teams while controlling for major risk factors identified. GENMOD, however, does not accommodate several covariates, as it often fails for lack of convergence. Hence, logistic regression models with adjusted odds ratios (aOR) are reported as well.
The initial logistic regression model for in‐hospital and ICU mortality included all 20 independent variables from patient demographics, comorbidities, simplified acute physiology score (SAPS) II,27 respiratory support, central venous catheter (CVC) utilization, which included peripherally placed central catheters, and all terms for 2‐way interactions with team assignment. To determine the best model, a hierarchical backward elimination was executed while assessing for interactions, confounding, and estimate precision. Before removing a regression term, a likelihood ratio test was applied to each coefficient followed by Wald's chi square test.28 Collinearity diagnostic for nonlinear models was applied to look for multicollinearity. To exclude variables or regression terms, a condition index of 30 and variance decomposition proportion of 0.5 were used. The final model was evaluated for goodness‐of‐fit using the Hosmer and Lemeshow test.
LOS was analyzed with linear regression using the same covariates and backward elimination as the logistic model. Goodness‐of‐fit was evaluated using coefficient of determination (r2). A variance inflation factor of 10 was used to assess for collinearity. Two‐sided P values 0.05 were considered statistically significant. All analyses were performed with SAS software (version 9.1, SAS Institute, Cary, NC).
RESULTS
Patients
A total of 1747 patients received critical care from the hospitalist or intensivist‐led teams (Figure 1). Of the 1367 patients who met inclusion criteria, complete data was available for 1356 patients. The ED was the ICU admission source for 68.8% of hospitalist and 69.9% of intensivist patients. Baseline patient demographics were similar (Table 1). Among preexisting comorbidities, morbid obesity was more prevalent in hospitalist patients, whereas cancer and pulmonary and immunological diseases were more prevalent in intensivist patients (Table 1).
Hospitalist patients, compared to intensivist patients, had a lower mean SAPS II (37.4 vs 45.1, P < 0.001), less noninvasive (17.9% vs 25.8%, P < 0.001) and mechanical (11.0% vs 51.9%, P < 0.001) ventilation utilization, and fewer CVCs (29.1% vs 50.8%, P < 0.001) (Table 1). The intensivist‐led consult team comanaged 18.4% of the hospitalist patients. These 152 patients had a mean SAPS II of 41, and 19.7% required noninvasive ventilation while 44.1% required mechanical ventilation. For mechanically ventilated hospitalist patients, 80.2% were comanaged by the intensivist‐led consult team, 5.5% had palliative care for end‐of‐life management, 6.6% died imminently, and 7.7% received short‐term ventilation managed by the hospitalist. Hospitalist and intensivist‐led teams' ICU readmission rates were similar (7.0% vs 5.9%, P = 0.41).
Outcomes
Of the 1356 patients, there were 168 (12.4%) deaths and 135 (10.0%) occurred in the ICU. The overall mean ICU LOS was 4.0 days (SD 5.9), and mean hospital LOS was 9.1 days (SD 9.0). The mean hospital LOS for survivors was 9.0 days (SD 8.8).
Bivariate Outcomes
Patients were stratified for bivariate analysis into 3 tiers based on SAPS II to reflect low (33), intermediate (34‐51), and high (52) disease acuity corresponding to a predicted mortality of <15%, between 15 and 50%, and >50% (Table 2). Those with intermediate severity only showed an ICU LOS difference that was shorter for hospitalist patients. All remaining strata demonstrated lower mortality and LOS among the hospitalist patients (Table 2).
| Hospitalist % (No. Died) | Intensivist% (No. Died) | Mortality Rate Difference* 95% CI | P Value | |
|---|---|---|---|---|
| Hospitalist Days (No. Patients) | Intensivist Days (No. Patients) | LOS Difference 95% CI | P Value | |
| ||||
| In‐hospital mortality | ||||
| SAPS 33 | 1.4 (5) | 4.4 (6) | 3.0 (0.09, 5.80) | 0.04 |
| SAPS 34‐51 | 7.9 (16) | 10.7 (24) | 2.8 (2.10, 7.70) | 0.26 |
| SAPS 52 | 29.6 (40) | 40.6 (67) | 11.0 (0.07, 21.88) | 0.05 |
| ICU mortality | ||||
| SAPS 33 | 0.6 (2) | 3.6 (5) | 3.1 (0.80, 5.40) | 0.01 |
| SAPS 34‐51 | 6.1 (20) | 9.3 (21) | 3.3 (1.17, 7.70) | 0.15 |
| SAPS 52 | 22.2 (30) | 34.6 (57) | 12.3 (2.02, 22.63) | 0.02 |
| Hospital LOS | ||||
| SAPS 33 | 6.0 (363) | 8.2 (138) | 2.2 (0.81, 3.60) | 0.002 |
| SAPS 34‐51 | 9.8 (330) | 9.2 (225) | 0.6 (2.01, 0.77) | 0.38 |
| SAPS 52 | 10.9 (135) | 13.4 (165) | 2.5 (0.15, 5.15) | 0.06 |
| ICU LOS | ||||
| SAPS 33 | 2.2 (363) | 3.8 (138) | 1.6 (0.89, 2.27) | <0.001 |
| SAPS 34‐51 | 3.5 (330) | 4.9 (225) | 1.4 (0.44, 2.31) | 0.004 |
| SAPS 52 | 4.7 (135) | 7.4 (165) | 2.7 (0.84, 5.60) | 0.005 |
Adjusted Outcomes
The logistic and linear regression models include covariates detailed in the Table 3 legend and are referent to the hospitalist team. Logistic regression models demonstrated no difference in adjusted in‐hospital mortality (aOR 0.8 [95% confidence interval (CI): 0.49, 1.18], P = 0.23) and adjusted ICU mortality (aOR 0.8 [95% CI: 0.51, 1.32], P = 0.41) between the 2 ICU staffing models (Table 3). Linear regression models also demonstrated no difference in adjusted hospital LOS difference (0.9 days [95% CI: 1.88, 0.12], P = 0.98) and adjusted ICU LOS (0.3 days [95% CI: 0.92, 0.30], P = 0.32) (Table 3). Outcomes were re‐analyzed using propensity scores within the regression models, yielding similar results that did not change the estimate or improve precision. The overall results also remained comparable when calculations were repeated, excluding patient outliers (SAPS II >75 or hospital LOS >30days).
| Adjusted Mortality Difference [%] (95% CI) | P Value | Adjusted Mortality OR (95% CI) | P Value | Mean LOS Difference [days] (95% CI) | P Value | |
|---|---|---|---|---|---|---|
| ||||||
| All patients* (n = 1356) | ||||||
| In‐hospital | 0.3 (1.83, 1.19) | 0.68 | 0.8 (0.49, 1.18) | 0.22 | 0.9 (1.88, 0.12) | 0.98 |
| ICU | 0.2 (1.19, 1.57) | 0.79 | 0.8 (0.51, 1.32) | 0.41 | 0.3 (0.92, 0.30) | 0.32 |
| Without MV (n = 991) | ||||||
| In‐hospital | 0.2 (1.97, 1.57) | 0.82 | 0.8 (0.38, 1.56) | 0.47 | 0.2 (1.12, 0.78) | 0.72 |
| ICU | 0.4 (1.29, 2.12) | 0.63 | 1.0 (0.44, 2.27) | 0.99 | 0.03 (0.39, 0.34) | 0.89 |
| With MV (n = 365) | ||||||
| In‐hospital | 2.7 (13.69, 8.22) | 0.62 | 0.8 (0.45, 1.45) | 0.48 | 2.0 (4.74, 0.66) | 0.14 |
| ICU | 5.2 (16.10, 5.69) | 0.35 | 0.7 (0.38, 1.25) | 0.26 | 0.2 (2.18, 1.74) | 0.82 |
Subgroup Analysis
Since each team's respiratory support utilization differed greatly and was a significant variable in the logistic and linear regression models, we performed subgroup analysis of mechanically ventilated patients (Table 4). Without mechanical ventilation, no significant outcome differences were detected between the intensivist and hospitalist groups when stratified by disease severity (Table 4).
| Without Mechanical Ventilation | With Mechanical Ventilation | |||||
|---|---|---|---|---|---|---|
| Hospitalist % (No. Died) | Intensivist % (No. Died) | P Value | Hospitalist % (No. Died) | Intensivist % (No. Died) | P Value | |
| Hospitalist Days (Patients) | Intensivist Days (Patients) | P Value | Hospitalist Days (Patients) | Intensivist Days (Patients) | P Value | |
| ||||||
| In‐hospital mortality | ||||||
| SAPS 33 | 1.4 (5) | 2.2 (2) | 0.63 | 0.0 (0) | 8.9 (4) | 0.22 |
| SAPS 3451 | 5.2 (15) | 4.3 (5) | 0.72 | 27.5 (11) | 17.4 (19) | 0.18 |
| SAPS 52 | 20.0 (20) | 15.6 (7) | 0.53 | 57.1 (20) | 50.0 (60) | 0.46 |
| ICU mortality | ||||||
| SAPS 33 | 0.6 (2) | 1.1 (1) | 0.60 | 0.0 (0) | 8.9 (4) | 0.22 |
| SAPS 3451 | 3.1 (9) | 3.5 (4) | 0.86 | 27.5 (11) | 15.6 (17) | 0.10 |
| SAPS 52 | 11.0 (11) | 11.1 (5) | 0.98 | 54.3 (19) | 43.3 (52) | 0.26 |
| Hospital LOS | ||||||
| SAPS 33 | 5.6 (347) | 6.5 (93) | 0.25 | 13.8 (16) | 11.8 (45) | 0.50 |
| SAPS 3451 | 8.7 (290) | 7.9 (116) | 0.28 | 17.8 (40) | 10.6 (109) | <0.001 |
| SAPS 52 | 10.2 (100) | 11.0 (45) | 0.62 | 12.7 (35) | 14.3 (120) | 0.56 |
| ICU LOS (days) | ||||||
| SAPS 33 | 1.9 (347) | 2.2 (93) | 0.30 | 8.0 (16) | 7.0 (45) | 0.67 |
| SAPS 3451 | 2.6 (290) | 2.8 (116) | 0.52 | 10.6 (40) | 7.2 (109) | 0.02 |
| SAPS 52 | 3.5 (100) | 2.8 (45) | 0.17 | 8.1 (35) | 9.2 (120) | 0.61 |
With mechanical ventilation, patients with intermediate illness severity had a significantly shorter hospital LOS (10.6 vs 17.8 days, P < 0.001) and ICU LOS (7.2 vs 10.6 days, P = 0.02) when managed by the intensivist‐led team (Table 4). When the calculations were repeated for only the patients who survived hospitalization, the shorter ICU LOS (6.5 vs 10.9 days, P = 0.01) remained significant but not the hospital LOS (10.3 vs 19.3 days, P = 0.10). The patients with intermediate acuity also showed a trend toward a decreased ICU mortality (15.6% vs 27.5%, P = 0.10) when managed by the intensivist‐led team (Table 4).
Adjusting for relevant risk factors, no statistically significant mortality rate difference was demonstrated between the hospitalist and intensivist‐led teams when evaluating all patients or patients without mechanical ventilation. The result, however, was inconclusive for patients with mechanical ventilation and did not allow refutation of the null hypothesis because the confidence interval for the mortality rate difference crossed the prespecified mortality difference threshold for clinical significance (Figure 2).
DISCUSSION
We present the first prospective evaluation of adult patient outcomes comparing intensivist‐led and hospitalist ICU staffing models. This study was powered to demonstrate no difference in hospital and ICU mortality between these ICU staffing models at a single university‐affiliated community hospital, though subgroups were not accounted for in these calculations. Consistent with our observational design, we did not influence or change established triage systems. This led to expected significant differences in baseline patient severity of illness and mechanical ventilation use. We adjusted for these and other potential confounders by stratifying patients with SAPS II, examining mechanically ventilated patients separately, and using logistic and linear regression models and propensity scores, recognizing that unmeasured differences in illness severity may remain.29
Our initial adjustment for baseline patient disparities between teams used bivariate analysis with SAPS II to stratify patients into 3 tiers to reflect low (33), intermediate (34‐51), and high (52) disease acuity. Hospitalist patients with intermediate acuity comprised the only tier without decreased in‐hospital and ICU mortality when compared to the intensivist intermediate patients (Table 2). We suspect these mortality differences are related to the intensivist patients' increased mechanical ventilation utilization seen at all acuity levels. Hospitalist patients had a significantly shorter hospital LOS for low‐acuity patients and significantly shorter ICU LOS for all severity groups (Table 2). This lower LOS may stem from greater efficiency of hospitalist ICU attendings managing transitions from the ICU in conjunction with other hospitalist colleagues. It also may reflect other unmeasured factors that affected illness severity in the intensivist patients.
When patients were stratified by both SAPS II and mechanical ventilation status, the lower mortality and LOS findings previously seen with hospitalist patients were no longer apparent (Table 4). Interestingly, patients with intermediate or high SAPS II requiring mechanical ventilation had lower mortality (10% absolute difference) in the intensivist‐led teamalbeit none reached statistical significance, probably due to small subgroup sizes (Table 4). Intensivist patients requiring mechanical ventilation also had a statistically significant shorter hospital LOS in the intermediate acuity patients (Table 4). These results contradict the controversial findings by Levy et al. which suggested that ICU patients with intermediate disease acuity have increased hospital mortality when cared for by intensivists versus non‐intensivists.18 We postulate these demonstrated differences likely reflect intensivist training and experience in caring for mechanically ventilated, higher acuity patients. Surprisingly, the presence of an intensivist‐led consult team did not mitigate the mortality and LOS differences seen for mechanically ventilated patients on the hospitalist team. Perhaps intensivist expertise was underutilized when they served in the consultant role.
The adjusted outcomes using multivariable analysis with logistic and linear regression models did not find a statistically significant difference in mortality or LOS, regardless of mechanical ventilation status (Table 3). These statistical models used 20 patient variables and identified key variables with the greatest impactSAPS II, mechanical ventilation, and CVC presence. We next examined mortality differences adjusting only for these 3 variables and were unable to detect a statistically significant mortality difference between the teams (Figure 2). We suspect that a CVC is not an independent risk factor but instead a surrogate marker of illness severity and likely of vasopressor use.
Study Limitations
Our study has several obvious limitations. It uses an observational design within a single hospital. However, this is seen in prior comparisons of intensivists to non‐intensivists.15, 810 Our study is unique with its prospective design and sample‐size calculation to demonstrate no difference in outcomes. Because our data is from a single center, it eliminates practice differences encountered when comparing multiple institutions, but it may also limit its generalizability.
Another major limitation in our comparison of an intensivist‐led ICU team to a hospitalist ICU team is their composition. Instead of 2 multidisciplinary teams, we compared a hospitalist's performance to that of a group of physicians at various levels of training. Similar comparisons have been seen in prior studies. For example, in the large study by Levy et al., half of the intensivists studied were in academic centers affiliated with teaching teams.18 Housestaff involvement, however, may have confounded the intensivist‐led team's patient outcomes. Tenner et al. demonstrated improved survival and decreased LOS in a pediatric ICU when hospitalists provided after‐hours coverage instead of residents.30 Furthermore, the patient census varied between the ICU teams, potentially impacting outcomes. While each service had only 1 attending, the hospitalist team had 1 clinician caring for patients whereas the intensivist‐led team had 5 to 6 clinicians. This study's implications may be more relevant to academic centers. A similar study of hospitalists and intensivists conducted in a nonteaching institution may yield different results.
Our 2 patient groups had substantial differences in illness severity and mechanical ventilation. Despite statistical techniques to address potential confounders in observational trials including stratification, multivariable adjustment, and propensity scores,29 residual confounders may still remain that influence the results and thus our conclusions. SAPS II is a validated method to objectively quantify disease severity and provide predictive mortality,27 however, it has known deficiencies. The use of propensity scores may not fully account for selection biases in team assignments introduced by the ED physicians. Biases may stem from the ICU teams' awareness of the ongoing study, and each team may have tried to maintain improved outcomes.
Additionally, the mortality outcomes represent in‐hospital mortality, not 30‐day mortality. This may be a less‐useful indicator of ICU performance because of post‐ICU transitions to extended care facilities and emphasis on end‐of‐life care. The majority of patients from both ICU models, however, did transfer to inpatient medical units under the care of non‐ICU hospitalist teams. Furthermore, this study did not capture important outcomes reported in other investigations, such as discharge disposition or quality of life after discharge.3132 Finally, the adjusted odds ratio for the intensivist‐led team's in‐hospital mortality (aOR 0.8, P = 0.23), referent to the hospitalist, does not eliminate the possibility that an intensivist‐led model may reduce mortality risk.
Our study suggests that intermediate‐ and high‐acuity, mechanically ventilated patients may benefit from care by intensivists rather than hospitalists. The results from this initial study could be used to design and estimate sample size for future studies of hospitalists and intensivists to elucidate risk reduction. Randomized and multicenter trials are needed to provide more robust data, because our subgroups were small and not accounted for in the sample size calculation. Considering the severe intensivist shortage, 1 strategy to provide effective and efficient coverage of the growing American ICU population may be to ask hospitalists to care independently for lower acuity ICU patientsespecially nonventilated patientswhile encouraging or requiring intensivist care for higher acuity patients, especially once mechanically ventilated.
Conclusion
We anticipate this initial study of hospitalist and intensivist‐led ICU teams will validate a hospitalist ICU staffing model for further investigation. We propose that hospitalists can provide quality care for lower acuity critical care patients. This may improve intensivist availability to higher acuity critically ill patients and allow for judicious utilization of the limited intensivist supply. Future studies may better delineate specific subgroups of critically ill patients who benefit most from intensivist primary involvement. Additional research may also help generate evidence‐based triage standards to appropriate critical care teams and foster guideline development. Hospitalists may be instrumental in the critical care staffing shortage, however, identification of their ideal role requires further study.
Acknowledgements
The authors thank Ralph Bailey, RN; Daniel S. Budnitz, MD, MPH; Kirk Easley, MPH; Michael Heisler, MD, MPH; Joan Lopez, RN; Jason Stein, MD; and David Tong MD, MPH for their support and contributions.
- ,,,,,.On‐site physician staffing in a community hospital intensivist care unit.JAMA.1984;252(15):2023–2027.
- ,,,.Impact of critical care physician staffing on patients with septic shock in a university hospital medical intensive care unit.JAMA.1988;260(23):3446–3450.
- ,.Effect on ICU mortality of a full‐time critical care specialist.Chest.1989;96(1):127–129.
- ,,, et al.Effects of organizational change in the medical intensive care unit of a teaching hospital.JAMA.1996;276(4):322–328.
- ,,, et al.Effects of a medical intensivist on patient care in a community teaching hospital.Mayo Clin Proc.1997;72(5):391–399.
- ,,, et al.A ‘closed’ medical intensive care unit (MICU) improves resource utilization when compared with an ‘open’ MICU.Am J Respir Crit Care Med.1998;157(5):1468–1473.
- ,,, et al.Organizational characteristics of intensive care units related to outcomes of abdominal aortic surgery.JAMA.1999;281(14):1310–1312.
- ,,, et al.Effects of an organized critical care service on outcomes and resource utilization: a cohort study.Crit Care Med.1999;27(2):270–274.
- ,.Out‐of‐hours consultant cover and case‐mix adjusted mortality in intensive care.Lancet.2000;356:735–736.
- ,,.The impact of organizational changes on outcomes in an intensive care unit in the United Kingdom.Intensive Care Med.2001;27:865–872.
- ,,.Do intensivists in ICU improve outcome?Best Pract Res Clin Anaesthesiol.2005;19(1):125–135.
- ,,, et al.Physician staffing patterns and clinical outcomes in critically ill patients: a systemic review.JAMA.2002;288(17):2151–2162.
- ,.Potential reduction in mortality rates using an intensivist model to manage intensive care units.Eff Clin Pract.2000;3(6):284–289.
- The Leapfrog Group Fact Sheet. ICU Physician Staffing Fact Sheet. Available at: http://www.leapfroggroup.org/media/file/Leapfrog _ICU_Physician_Staffing_Fact_Sheet.pdf and http://www.leapfroggroup.org/media/file/Fact_Sheet_Leapfrog_Group.pdf. Accessed November 8,2009.
- ,,,,.Committee on Manpower for Pulmonary and Critical Care Societies (COMPACCS). Current and projected workforce requirements for care of the critically ill and patients with pulmonary disease: can we meet the requirements of an aging population?JAMA.2000;284(21):2762–2770.
- US Department of Health and Human Services, Health Resources and Services Administration (HRSA).Report to Congress: the critical care workforce; a study of the supply and demand for critical care physicians. Senate Report 108–181.Rockville, MD:HRSA; May2006.
- ,.2007–2008 Survey: The Authoritative Source on the State of the Hospital Medicine Movement.Philadelphia, PA:Society of Hospital Medicine;2008.
- ,,,,,.Association between critical care physician management and patient mortality in the intensive care unit.Ann Intern Med.2008;148(11):801–809.
- ,,,.Variations in mortality and length of stay in intensive care units.Ann Intern Med.1993;118(10):753–761.
- ,,,.Hospital mortality in relation to staff workload: a 4‐year study in an adult intensive‐care unit.Lancet.2000;356:185–189.
- ,,, et al.A comparison of albumin and saline for fluid resuscitation in the intensive care unit.N Engl J Med.2004;350(22):2247–2256.
- ,,, et al.A multicenter, randomized controlled clinical trial of transfusion requirements in critical care.N Engl J Med.1999;340(6):409–417.
- ,,, et al.Early goal‐directed therapy in the treatment of severe sepsis and septic shock.N Engl J Med.2001;345(19):1368–1377.
- ,,, et al.Intensive insulin therapy in critically ill patients.N Engl J Med.2001;345(19):1359–1367.
- ,,, et al.Pulmonary‐artery versus central venous catheter to guide treatment of acute lung injury.N Engl J Med.2006;354(21):2213–2224.
- ,.Easy SAS calculations for risk or prevalence ratios and differences.Am J Epidemiol.2005;162(3):199–200.
- ,,.A new simplified acute physiology score (SAPS II) based on a European/North American multicenter study.JAMA.1993;270(24):2957–2963.
- .Epidemiologic methods: the “art” in the state of the art.J Clin Epidemiol.2002;55(12):1196–1200.
- ,,.Methods to adjust for bias and confounding in critical care health services research involving observational data.J Crit Care.2006;21:1–7.
- ,,.Improved survival with hospitalists in a pediatric intensive care unit.Crit Care Med.2003;31(3):847–852.
- ,.ABC of intensive care: outcome data and scoring systems.BMJ.1999;319:241–244.
- ,,.Survival, morbidity, and quality of life after discharge from intensive care.Crit Care Med.2000;28(7):2293–2299.
Copyright © 2011 Society of Hospital Medicine

Seven-Day Schedule Could Improve Hospital Quality, Capacity
A new study evaluating outcomes for hospitals participating in the American Heart Association’s Get with the Guidelines program found no correlation between high performance on adhering to measures and care standards for acute myocardial infarction and for heart failure despite overlap between the sets of care processes (J Am Coll Cardio. 2011;58:637-644).
A total of 400,000 heart patients were studied, and 283 participating hospitals were stratified into thirds based on their adherence to core quality measures for each disease, with the upper third labeled superior in performance. Lead author Tracy Wang, MD, MHS, MSc, of the Duke Clinical Research Institute in Durham, N.C., and colleagues found that superior performance for only one of the two diseases led to such end-result outcomes as in-hospital mortality that were no better than for hospitals that were not high performers for either condition. But hospitals with superior performance for both conditions had lower in-hospital mortality rates.
“Perhaps quality is more than just following checklists,” Dr. Wang says. “There’s something special about these high-performing hospitals across the board, with better QI, perhaps a little more investment in infrastructure for quality.”
This result, Dr. Wang says, should give ammunition for hospitalists and other physicians to go to their hospital administrators to request more investment in quality improvement overall, not just for specific conditions.
Intermountain Risk Score Could Help Heart Failure Cases
A risk measurement model created by the Heart Institute at Intermountain Medical Center in Murray, Utah, may one day be a familiar tool to HM groups.
Known as the Intermountain Risk Score (http://intermountainhealthcare.org/IMRS/), the tool uses 15 parameters culled from complete blood counts (CBC) and the basic metabolic profile (BMP) to determine risk. The model, which is free, was used to stratify mortality risk in heart failure patients receiving an internal cardioverter defibrillator (ICD) in a paper presented in September at the 15th annual scientific meeting of the Heart Failure Society of America.
The report found that mortality at one-year post-ICD was 2.4%, 11.8%, and 28.2% for the low-, moderate-, and high-risk groups, respectively. And while the study was narrow in its topic, Benjamin Horne, PhD, director of cardiovascular and genetic epidemiology at the institute, says its application to a multitude of inpatient settings is a natural evolution for the tool.
“One of the things about the innovation of this risk score is the lab tests are so common already,” Dr. Horne says. “They are so familiar to physicians. They’ve been around for decades. What no one had realized before is they had additional risk information contained within them.”
Pediatric HM Literature

Clinical question: What is the efficacy of dexamethasone in mechanically ventilated children younger than two years of age with respiratory syncytial virus (RSV) lower respiratory tract infections?
Background: Although RSV typically causes self-limited respiratory tract disease with stable and low mortality rates, a small proportion of infants will have severe lower respiratory tract disease requiring mechanical ventilation. The authors previously found no evidence of a benefit of corticosteroids in these infants, but post-hoc analysis suggested a benefit in infants with mild oxygenation abnormalities.
Study design: International, multicenter, randomized, double-blind, placebo-controlled trial.
Setting: Twelve ICUs in Europe.
Synopsis: All patients <2 years of age with RSV-positive bronchiolitis requiring mechanical ventilation were eligible if they had not received corticosteroids in the previous two weeks. Patients were categorized as having either mild or severe oxygenation abnormalities based on their arterial partial pressure of oxygen/fractional inspired oxygen concentration and/or mean airway pressure. The primary outcome measure was duration of mechanical ventilation, and the trial was stopped after interim analysis of 89 patients in the mild oxygenation abnormalities arm revealed insufficient power to detect a >20% difference between the groups if the planned number of 128 patients were ultimately enrolled.
Fifty-six patients were enrolled in the severe oxygenation abnormalities arm. For both groups, there were no differences in either the duration of mechanical ventilation or secondary outcomes, such as length of stay or duration of supplemental oxygen, between intervention and control patients.
This well-designed study adds to an established body of literature painting a clear picture of the inefficacy of corticosteroids in infants with bronchiolitis, with or without severe disease. Although enrollment was slow and ultimately the trial was prematurely terminated, the randomization resulted in almost perfectly matched groups, which likely strengthens the findings despite the small sample size.
Bottom line: Corticosteroids should not be administered to critically ill children with bronchiolitis.
Citation: Van Woensel JB, Vyas H, et al. Dexamethasone in children mechanically ventilated for lower respiratory tract infection caused by respiratory syncytial virus: a randomized controlled trial. Crit Care Med. 2011;39(7):1779-1783.
Reviewed by Pediatric Editor Mark Shen, MD, FHM, medical director of hospital medicine at Dell Children’s Medical Center, Austin, Texas.
Workplace Violence at Hospitals
Patients and their relatives exposed to mental stress caused by hospitalization or illness might use violence against healthcare staff. Previous surveys reported that healthcare staff experience more workplace violence than other industry workers.13 Workplace violence by patients or their relatives may cause psychological problems or somatic effects on healthcare staff, such as losing self‐respect, depression, post‐traumatic stress disorder, stomachache, headache, or insomnia. Because those effects might lead to higher than usual turnovers of healthcare staff at a hospital, and interfere with high‐quality healthcare services, workplace violence at healthcare settings became a global concern; a lot of studies investigating those circumstances mainly were conducted in developed countries.415 Those studies revealed that the psychiatric ward, the emergency room, or the long‐term care facilities were the high‐risk areas of workplace violence; the incidence rate of physical aggression in the past year ranged from 3% to 35%; and the incidence rate of verbal abuse in the past year ranged from 26% to 64%. But the overall circumstances are still unclear, because most of the subjects in those studies were limited to nurses or some departments, such as the psychiatric ward or the emergency room. There might be other professions or departments with higher risk of workplace violence.
The aim of this study was to investigate the incidence of workplace violence and the attributes of healthcare staff, such as profession, age, gender, departments, and so on, who are at high risk of experiencing workplace violence.
METHODS
A questionnaire‐based, anonymous, and self‐administered cross‐sectional survey was conducted at 19 hospitals in Japan from January to December 2009. Among the 19 hospitals, 8 hospitals had less than 200 beds, 7 hospitals had 200 to 500 beds for acute care, and 4 hospitals had more than 500 beds for acute care. Thirteen of 19 hospitals were teaching hospitals. Eight out of 19 hospitals were located in urban areas. The characteristics of the 19 hospitals are shown in Table 4 of Supporting Appendix (in the online version of this article). The questionnaires were distributed to all 11,095 healthcare staff with a sealed reply envelope, and were collected anonymously using a collection box at each hospital.
The questionnaire contained questions about workplace violence, the work environment, and other topics. This study classifies workplace violence into physical aggression, verbal abuse, and sexual harassment. The respondents were requested to reply in regard to their experiences with each of these 3 types of workplace violence by patients or their relatives, over the past year. In this article, only those 3 questions and some background information of respondents were used for analysis. The race of patients and medical staff was not investigated because Japan is a racially homogeneous nation, and more than 99% of the population is Asian.
Logistic regression analysis with forced entry of all variables to examine the effect of attributes of healthcare staff to workplace violence was used. In this analysis, random effects of each hospital or area were not taken into account. All analyses were performed using SPSS 18.0 (SPSS, Inc, Chicago, IL), and P < 0.05 was used to determine significance.
In this study, workplace violence was defined as an event that was subjectively recognized by healthcare staff as violence caused by patients or their relatives. The violence among healthcare staff was excluded.
RESULTS
The response rate was 79.1% (8711/11,095). Among the 8771 respondents, 36.4% experienced workplace violence by patients or their relatives over the past year; 15.9% experienced physical aggressions, 29.8% experienced verbal abuse, and 9.9% experienced sexual harassment. Table 1 provides characteristics of the respondents; Table 2 shows the proportion of victims for workplace violence.
| No. of Respondents | |||
|---|---|---|---|
| n | (%)* | ||
| |||
| No. of beds in their hospital | <200 beds | 1298 | (14.8) |
| 200‐500 beds | 3041 | (34.7) | |
| 500 beds or more | 4432 | (50.5) | |
| Section | General ward | 2377 | (27.1) |
| Administration department | 989 | (11.3) | |
| Outpatient department | 675 | (7.7) | |
| Physicians' department | 610 | (7.0) | |
| Dietary department | 435 | (5.0) | |
| Long‐term care ward | 331 | (3.8) | |
| Rehabilitation department | 318 | (3.6) | |
| Critical care center, ICU, or CCU | 306 | (3.5) | |
| Obstetrics and gynecology ward, perinatal ward, or NICU | 287 | (3.3) | |
| Clinical laboratory or physiology department | 266 | (3.0) | |
| Operation department | 264 | (3.0) | |
| Pharmaceutical department | 209 | (2.4) | |
| Pediatric ward | 203 | (2.3) | |
| Radiology department | 197 | (2.2) | |
| Dialysis department | 104 | (1.2) | |
| Psychiatric ward | 56 | (0.6) | |
| Others | 1144 | (13.0) | |
| Profession | Nurse | 4298 | (49.0) |
| Clerk | 1208 | (13.8) | |
| Doctor | 610 | (7.0) | |
| Nursing aide or care worker | 585 | (6.7) | |
| Technician | 547 | (6.2) | |
| Dietician or cook | 435 | (5.0) | |
| Therapist | 313 | (3.6) | |
| Pharmacist | 183 | (2.1) | |
| Others | 592 | (6.7) | |
| Years of experience in their own specialty or profession | <5 yr | 3497 | (39.9) |
| 6‐10 yr | 1618 | (18.4) | |
| 11‐15 yr | 1041 | (11.9) | |
| 16‐20 yr | 761 | (8.7) | |
| 21 yr or more | 1218 | (13.9) | |
| Not reported | 636 | (7.3) | |
| Working hours per week | <20 hr | 640 | (7.3) |
| 20‐40 hr | 1720 | (19.6) | |
| 40‐60 hr | 4638 | (52.9) | |
| 60 hr or more | 655 | (7.5) | |
| Not reported | 1118 | (12.7) | |
| Gender | Male | 1941 | (22.1) |
| Female | 6272 | (71.5) | |
| Not reported | 558 | (6.4) | |
| Direct interaction or contact with patients | Having those contacts | 7227 | (82.4) |
| Not having those contacts | 1001 | (11.4) | |
| Not reported | 543 | (6.2) | |
| Total | 8771 | (100.0) | |
| No. of Respondents | Physical Aggression Experience | Verbal Abuse Experience | Sexual Harassment Experience | Experience of at Least 1 of the 3 Kinds of Violence | ||||||
|---|---|---|---|---|---|---|---|---|---|---|
| n | n | (%)* | n | (%)* | n | (%)* | n | (%)* | ||
| No. of beds in their hospital | <200 beds | 1298 | 244 | (18.8) | 306 | (23.6) | 109 | (8.4) | 413 | (31.8) |
| 200‐500 beds | 3041 | 503 | (16.5) | 971 | (31.9) | 354 | (11.6) | 1173 | (38.6) | |
| 500 beds or more | 4432 | 645 | (14.6) | 1338 | (30.2) | 406 | (9.2) | 1606 | (36.2) | |
| Section | Psychiatric ward | 56 | 33 | (58.9) | 37 | (66.1) | 8 | (14.3) | 42 | (75.0) |
| General ward | 2377 | 852 | (35.8) | 1057 | (44.5) | 536 | (22.5) | 1371 | (57.7) | |
| Dialysis department | 104 | 5 | (4.8) | 44 | (42.3) | 24 | (23.1) | 55 | (52.9) | |
| Critical care center, ICU, or CCU | 306 | 90 | (29.4) | 108 | (35.3) | 41 | (13.4) | 151 | (49.3) | |
| Long‐term care ward | 331 | 108 | (32.6) | 109 | (32.9) | 38 | (11.5) | 157 | (47.4) | |
| Outpatient department | 675 | 47 | (7.0) | 268 | (39.7) | 44 | (6.5) | 292 | (43.3) | |
| Physicians' department | 610 | 33 | (5.4) | 193 | (31.6) | 6 | (1.0) | 203 | (33.3) | |
| Pediatric ward | 203 | 23 | (11.3) | 50 | (24.6) | 13 | (6.4) | 62 | (30.5) | |
| Rehabilitation department | 318 | 53 | (16.7) | 70 | (22.0) | 31 | (9.7) | 96 | (30.2) | |
| Administration department | 989 | 10 | (1.0) | 247 | (25.0) | 16 | (1.6) | 251 | (25.4) | |
| Clinical radiology department | 197 | 11 | (5.6) | 40 | (20.3) | 2 | (1.0) | 48 | (24.4) | |
| Operation department | 264 | 11 | (4.2) | 38 | (14.4) | 9 | (3.4) | 43 | (16.3) | |
| Clinical laboratory or physiology department | 266 | 4 | (1.5) | 37 | (13.9) | 9 | (3.4) | 43 | (16.2) | |
| Obstetrics and gynecology ward, perinatal ward, or NICU | 287 | 3 | (1.0) | 26 | (9.1) | 2 | (0.7) | 28 | (9.8) | |
| Dietary department | 435 | 7 | (1.6) | 39 | (9.0) | 8 | (1.8) | 42 | (9.7) | |
| Pharmaceutical department | 209 | 1 | (0.5) | 15 | (7.2) | 5 | (2.4) | 19 | (9.1) | |
| Others | 1144 | 101 | (8.8) | 237 | (20.7) | 77 | (6.7) | 289 | (25.3) | |
| Profession | Nurse | 4298 | 1150 | (26.8) | 1694 | (39.4) | 729 | (17.0) | 2155 | (50.1) |
| Doctor | 610 | 33 | (5.4) | 193 | (31.6) | 6 | (1.0) | 203 | (33.3) | |
| Nursing aide or care worker | 585 | 104 | (17.8) | 151 | (25.8) | 39 | (6.7) | 191 | (32.6) | |
| Therapist | 313 | 53 | (16.9) | 71 | (22.7) | 31 | (9.9) | 96 | (30.7) | |
| Clerk | 1208 | 15 | (1.2) | 311 | (25.7) | 23 | (1.9) | 314 | (26.0) | |
| Technician | 547 | 15 | (2.7) | 79 | (14.4) | 19 | (3.5) | 97 | (17.7) | |
| Dietician or cook | 435 | 7 | (1.6) | 38 | (8.7) | 8 | (1.8) | 41 | (9.4) | |
| Pharmacist | 183 | 0 | (0.0) | 13 | (7.1) | 5 | (2.7) | 17 | (9.3) | |
| Others | 592 | 15 | (2.5) | 65 | (11.0) | 9 | (1.5) | 78 | (13.2) | |
| Years of experience in their own specialty or profession | <5 yr | 3497 | 527 | (15.1) | 919 | (26.3) | 384 | (11.0) | 1183 | (33.8) |
| 6‐10 yr | 1618 | 316 | (19.5) | 510 | (31.5) | 183 | (11.3) | 636 | (39.3) | |
| 11‐15 yr | 1041 | 210 | (20.2) | 350 | (33.6) | 125 | (12.0) | 421 | (40.4) | |
| 16‐20 yr | 761 | 111 | (14.6) | 253 | (33.2) | 58 | (7.6) | 294 | (38.6) | |
| 21 yr or more | 1218 | 160 | (13.1) | 422 | (34.6) | 85 | (7.0) | 475 | (39.0) | |
| Not reported | 636 | 68 | (10.7) | 161 | (25.3) | 34 | (5.3) | 183 | (28.8) | |
| Working hours per week | <20 hr | 640 | 50 | (7.8) | 148 | (23.1) | 39 | (6.1) | 173 | (27.0) |
| 20‐40 hr | 1720 | 234 | (13.6) | 473 | (27.5) | 157 | (9.1) | 583 | (33.9) | |
| 40‐60 hr | 4638 | 798 | (17.2) | 1424 | (30.7) | 498 | (10.7) | 1726 | (37.2) | |
| 60 hr or more | 655 | 103 | (15.7) | 242 | (36.9) | 50 | (7.6) | 279 | (42.6) | |
| Not reported | 1118 | 207 | (18.5) | 328 | (29.3) | 125 | (11.2) | 431 | (38.6) | |
| Gender | Male | 1941 | 185 | (9.5) | 471 | (24.3) | 77 | (4.0) | 529 | (27.3) |
| Female | 6272 | 1137 | (18.1) | 2004 | (32.0) | 752 | (12.0) | 2494 | (39.8) | |
| Not reported | 558 | 70 | (12.5) | 140 | (25.1) | 40 | (7.2) | 169 | (30.3) | |
| Direct interaction or contact with patients | Having those contacts | 7227 | 1325 | (18.3) | 2395 | (33.1) | 834 | (11.5) | 2945 | (40.7) |
| Not having those contacts | 1001 | 17 | (1.7) | 100 | (10.0) | 7 | (0.7) | 107 | (10.7) | |
| Not reported | 543 | 50 | (9.2) | 120 | (22.1) | 28 | (5.2) | 140 | (25.8) | |
| Total | 8771 | 1392 | (15.9) | 2615 | (29.8) | 869 | (9.9) | 3192 | (36.4) | |
Because of missing values, 6654 out of 8771 (75.9%) replies were used for the logistic regression analysis. Nagelkerke R2 for physical aggression was 0.33, for verbal abuse was 0.16, for sexual harassment was 0.23, and for at least one of the above types of violence was 0.23. The proportions of respondents, who had experienced each type of workplace violence, were not significantly different among the replies with missing data and with the effective data actually used.
Factors Associated With Higher Risk of Violence
Adjusted odds ratios of physical aggression were significantly high in general wards, psychiatric wards, critical care centers/emntensive care units (ICU)/cardiac care units (CCU), and long‐term care wards; and for nurses, nursing aides/care workers; for longer working hours; and for direct interaction with patients (Table 3).
| Physical Aggression | Verbal Abuse | Sexual Harassment | At Least 1 of the 3 Kinds of Violence | ||||||||||
|---|---|---|---|---|---|---|---|---|---|---|---|---|---|
| P | Odds Ratio (95%Cl) | P | Odds Ratio (95%Cl) | P | Odds Ratio (95%Cl) | P | Odds Ratio (95%Cl) | ||||||
| |||||||||||||
| No. of beds in their hospital | <200 beds | 1.00 | 1.00 | 1.00 | 1.00 | ||||||||
| 200‐500 beds | 0.51 | 0.90 | (0.67‐1.22) | <0.01* | 1.64 | (1.30‐2.07) | 0.19 | 1.27 | (0.89‐1.80) | <0.01* | 1.45 | (1.16‐1.81) | |
| 500 beds or more | 0.02* | 0.69 | (0.51‐0.94) | <0.01* | 1.57 | (1.24‐1.98) | 0.49 | 0.88 | (0.62‐1.26) | 0.01* | 1.32 | (1.06‐1.65) | |
| Section | Physicians' department | 1.00 | 1.00 | 1.00 | 1.00 | ||||||||
| Psychiatric ward | <0.01* | 9.28 | (4.39‐19.62) | <0.01* | 3.33 | (1.65‐6.70) | 0.69 | 0.80 | (0.27‐2.40) | <0.01* | 4.55 | (2.07‐1.02) | |
| Long‐term care ward | <0.01* | 2.48 | (1.55‐3.96) | <0.01* | 1.90 | (1.27‐2.86) | 0.65 | 1.15 | (0.63‐2.09) | <0.01* | 2.20 | (1.50‐3.24) | |
| General ward | <0.01* | 3.00 | (2.18‐4.13) | <0.01* | 1.73 | (1.36‐2.21) | <0.01* | 1.89 | (1.32‐2.69) | <0.01* | 1.98 | (1.57‐2.51) | |
| Dialysis department | 0.02* | 0.32 | (0.12‐0.83) | 0.04* | 1.65 | (1.02‐2.66) | 0.01* | 2.21 | (1.23‐3.97) | 0.02* | 1.81 | (1.12‐2.92) | |
| Critical care center, ICU, or CCU | <0.01* | 2.44 | (1.60‐3.74) | 0.49 | 1.13 | (0.79‐1.61) | 0.56 | 1.17 | (0.70‐1.94) | 0.04* | 1.43 | (1.01‐2.01) | |
| Administration department | 0.22 | 0.55 | (0.21‐1.44) | 0.07 | 1.38 | (0.98‐1.93) | 0.29 | 0.64 | (0.27‐1.48) | 0.07 | 1.37 | (0.98‐1.91) | |
| Clinical radiology department | 0.53 | 1.42 | (0.48‐4.21) | 0.51 | 1.21 | (0.69‐2.12) | 0.02* | 0.17 | (0.04‐0.78) | 0.57 | 1.17 | (0.69‐1.98) | |
| Rehabilitation department | 0.93 | 0.93 | (0.18‐4.77) | 0.88 | 1.08 | (0.42‐2.80) | 0.82 | 1.22 | (0.22‐6.79) | 0.77 | 1.14 | (0.46‐2.85) | |
| Outpatient department | <0.01* | 0.41 | (0.26‐0.65) | 0.03* | 1.35 | (1.02‐1.78) | 0.02* | 0.56 | (0.35‐0.90) | 0.40 | 1.12 | (0.86‐1.47) | |
| Dietary department | 0.33 | 1.94 | (0.51‐7.35) | 0.66 | 1.13 | (0.65‐1.99) | 0.85 | 1.13 | (0.30‐4.26) | 0.84 | 1.06 | (0.61‐1.82) | |
| Clinical laboratory or physiology department | 0.40 | 0.53 | (0.12‐2.34) | 0.85 | 1.06 | (0.59‐1.89) | 0.21 | 0.52 | (0.18‐1.45) | 0.87 | 0.96 | (0.55‐1.65) | |
| Pediatric ward | 0.27 | 0.72 | (0.41‐1.29) | 0.08 | 0.69 | (0.45‐1.05) | 0.02* | 0.43 | (0.21‐0.90) | 0.03* | 0.65 | (0.43‐0.97) | |
| Pharmaceutical department | 0.05 | 0.52 | (0.26‐1.01) | 0.71 | 1.26 | (0.36‐4.38) | 0.14 | 0.63 | (0.34‐1.17) | ||||
| Operation department | <0.01* | 0.24 | (0.12‐0.48) | <0.01* | 0.36 | (0.23‐0.55) | <0.01* | 0.21 | (0.09‐0.48) | <0.01* | 0.27 | (0.18‐0.41) | |
| Obstetrics and gynecology ward, perinatal ward, or NICU | <0.01* | 0.04 | (0.01‐0.18) | <0.01* | 0.19 | (0.12‐0.32) | <0.01* | 0.02 | (0.00‐0.18) | <0.01* | 0.14 | (0.08‐0.22) | |
| Profession | Doctor | 1.00 | 1.00 | 1.00 | <0.01* | 1.00 | |||||||
| Nurse | <0.01* | 4.09 | (2.41‐6.95) | 0.16 | 1.27 | (0.91‐1.76) | <0.01* | 11.64 | (4.38‐30.90) | 1.64 | (1.19‐2.26) | ||
| Therapist | 0.10 | 4.03 | (0.76‐21.28) | 0.83 | 0.90 | (0.34‐2.39) | 0.05* | 7.11 | (1.02‐49.3) | 0.83 | 1.11 | (0.43‐2.83) | |
| Nursing aide or care worker | 0.03* | 1.95 | (1.07‐3.55) | 0.09 | 0.71 | (0.47‐1.05) | <0.01* | 4.66 | (1.63‐13.31) | 0.19 | 0.77 | (0.53‐1.14) | |
| Clerk | 0.03* | 0.36 | (0.14‐0.90) | 0.27 | 0.80 | (0.54‐1.19) | 0.17 | 2.26 | (0.70‐7.27) | 0.09 | 0.72 | (0.49‐1.06) | |
| Technician | 0.27 | 0.55 | (0.19‐1.60) | <0.01* | 0.37 | (0.22‐0.61) | <0.01* | 6.92 | (2.20‐21.76) | <0.01* | 0.46 | (0.28‐0.74) | |
| Others | <0.01* | 0.21 | (0.08‐0.57) | <0.01* | 0.39 | (0.25‐0.60) | 0.24 | 2.14 | (0.60‐7.63) | <0.01* | 0.39 | (0.25‐0.59) | |
| Years of experience in their own specialty or profession | <5 yr | 1.00 | 1.00 | 1.00 | 1.00 | ||||||||
| 6‐10 yr | <0.01* | 1.42 | (1.17‐1.72) | 0.01* | 1.22 | (1.05‐1.42) | 0.84 | 0.98 | (0.78‐1.22) | 0.01* | 1.22 | (1.05‐1.42) | |
| 11‐15 yr | <0.01* | 1.64 | (1.31‐2.05) | <0.01* | 1.45 | (1.22‐1.73) | 0.30 | 1.14 | (0.89‐1.47) | <0.01* | 1.35 | (1.13‐1.60) | |
| 16‐20 yr | 0.30 | 1.16 | (0.88‐1.52) | <0.01* | 1.47 | (1.21‐1.79) | 0.09 | 0.75 | (0.54‐1.04) | <0.01* | 1.34 | (1.10‐1.63) | |
| 21 yr or more | 0.58 | 1.07 | (0.84‐1.37) | <0.01* | 1.65 | (1.39‐1.96) | <0.01* | 0.63 | (0.47‐0.85) | <0.01* | 1.38 | (1.16‐1.64) | |
| Working hours per week | <20 hr | 1.00 | 1.00 | 1.00 | 1.00 | ||||||||
| 20‐40 hr | 0.04* | 1.49 | (1.01‐2.19) | 0.52 | 1.08 | (0.85‐1.39) | 0.12 | 1.40 | (0.91‐2.15) | 0.10 | 1.23 | (0.96‐1.56) | |
| 40‐60 hr | <0.01* | 1.80 | (1.25‐2.58) | 0.03* | 1.28 | (1.02‐1.60) | 0.05* | 1.50 | (1.00‐2.24) | <0.01* | 1.39 | (1.11‐1.74) | |
| 60 hr or more | <0.01* | 2.14 | (1.37‐3.34) | <0.01* | 1.62 | (1.21‐2.17) | 0.14 | 1.49 | (0.88‐2.50) | <0.01* | 1.90 | (1.43‐2.54) | |
| Gender | (Female vs male) | 0.69 | 0.95 | (0.76‐1.20) | 0.16 | 1.12 | (0.95‐1.32) | <0.01* | 1.59 | (1.18‐2.12) | 0.01* | 1.22 | (1.05‐1.43) |
| Direct interaction or contact with patients | (Constant and direct interaction with patients vs no interaction) | 0.02* | 2.17 | (1.11‐4.22) | <0.01* | 2.46 | (1.87‐3.24) | <0.01* | 6.80 | (2.43‐19.03) | <0.01* | 2.58 | (1.97‐3.37) |
Adjusted odds ratios of verbal abuse were significantly high in hospital with 200 beds or more, in general wards, psychiatric wards, long‐term care wards, outpatient departments, and dialysis departments; and for longer years of experience in their own specialty; for longer working hours; and for direct interaction with patients.
Adjusted odds ratios of sexual harassment were significantly high in general wards, and dialysis departments; for nurses, nursing aides/care workers, technicians, therapists; for females; and for direct interaction with patients.
Adjusted odds ratios for at least 1 of the 3 kinds of workplace violence were significantly high in hospitals with 200 beds or more, in general wards, psychiatric wards, critical care centers/ICU/CCU, long‐term care wards, and dialysis departments; for nurses; for longer years of experience in their own specialty; for longer working hours; for females; and for direct interaction with patients.
Factors Associated With Lower Risk of Violence
Adjusted odds ratios of physical aggression were significantly low in dialysis departments; outpatient departments; operation departments; obstetrics and gynecology wards, perinatal wards, or neonatal intensive care units (NICU); and for clerks.
Adjusted odds ratios of verbal abuse were significantly low in operation departments; obstetrics and gynecology wards, perinatal wards, or NICU; and for technicians.
Adjusted odds ratios of sexual harassment were significantly low in clinical radiology departments; outpatient departments; pediatric wards; operation departments; obstetrics and gynecology wards, perinatal wards, or NICU; and for longer years of experience in their own specialty.
Adjusted odds ratios for at least 1 of the 3 kinds of workplace violence were significantly low in pediatric wards; operation departments; obstetrics and gynecology wards, perinatal wards, or NICU; and for technicians.
DISCUSSION
Among the healthcare staff, 36.4% experienced workplace violence by patients or their relatives over the past year; 15.9% experienced physical aggressions, 29.8% verbal abuse, and 9.9% sexual harassment. The risk factors of workplace violence identified in the present study were similar to those studies conducted not only in Japan, but also in Western countries. Though the target population was limited to Asians, our results can be applicable to other races, countries, and cultures.
Incidence of Workplace Violence
Most previous studies covered only specific professions at hospitals, such as nurses or critical care center staff, and there are only few multicenter studies covering entire sections and professions like this study.510, 1214 A Spanish study including about 8000 healthcare workers reported that 11% had experienced physical aggression, 64% had experienced threatening behavior, intimidation, or insults in the past year.11 The incidence of physical aggression was similar in both studies, but the incidence of verbal abuse was about twice as high as that of this study. The low response rate in the Spanish study (24%) might have contributed to a higher number of verbal abuse incidents, because those with experience of workplace violence would likely have answered the questionnaire. It is difficult to compare the incidence of workplace violence among different studies because the definitions of workplace violence differ widely. Ethnic culture might also affect the acknowledgement of workplace violence. The European NEXT study including about 30,000 nurses in 8 European countries reported a range of 10.4% incidence of workplace violence in the Netherlands, and 39.1% in France.10
Risk Factors of Physical Aggression
Previous studies reported that the prevalence of physical aggression is high in psychiatric wards, critical care centers, or long‐term care wards.1015 In these departments, patients with mental illness, postoperative delirium, or dementia are likely to be admitted.
Nurses and nursing aides are reported to be likely to experience physical aggression.3, 11, 15 Nurses and nursing aides have longer work hours with direct interaction with patients than other professions, and are considered to be at high risk of physical aggression.
Some studies, which did not examine influences by profession or department, reported that male was a risk factor for physical aggression and verbal abuse.6, 10, 11, 13 In this study though, the male gender was not associated with physical aggression or verbal abuse. Male nurses and nursing aides are likely to be assigned to high‐risk departments or to care for high‐risk patients. Gender may be confounded with variables such as profession or department.15
Longer work hours mean more frequent interaction with patients, and the risk for physical aggression might increase. Constant and direct interaction with patients is a risk factor, not only for physical aggression, but also for verbal abuse and sexual harassment.10
Risk Factors of Verbal Abuse
Previous studies reported that incidents of verbal abuse are high for nurses and nursing aides.15 Although in this study the proportion of verbal abuse was the highest in nurses (39.4%), adjusted odds ratio was not significant. Factors other than nurse profession, such as department and direct interaction with patients relating to the nurse profession, might be the higher risk factors for verbal abuse.
As reported in previous studies, psychiatric wards and long‐term care wards are risk factors of verbal abuse also in this study.10, 13, 15 Long waiting time at outpatient departments might increase the risk of verbal abuse.
Dialysis departments are at high risk of verbal abuse and sexual harassment. Compared to other outpatients, dialysis patients are forced to stay a long time in hospitals and there is, therefore, more interaction with nurses and technicians. The characteristic personality of dialysis patients, such as neuroticism or psychoticism, might also affect verbal abuse or sexual harassment.16
Because longer working hours mean more frequent interaction with patients, the risk of verbal abuse might increase.17 Managers with longer work experience might be at high risk for verbal abuse, because they often assume responsibility and take on the task of dealing with patients and their relevant complaints.11
Risk Factors of Sexual Harassment
Nurses are likely to experience sexual harassment because their public image seems to combine sexuality and maternalism.18 Nursing aides, technicians, and therapists also experience sexual harassment. The common risk factor among those professions is the direct contact with the patient's body during the patient's transfer. A lot of studies reported that female gender is a risk factor of sexual harassment.17, 19
Safety Factors of Workplace Violence
Adjusted odds ratios of operation departments, and obstetrics and gynecology wards, perinatal wards, or NICU were common safety factors for each type of workplace violence. Usually, the patients in operation rooms cannot talk or move a finger carelessly during the surgery. The fact that there are no adult male patients in obstetrics and gynecology wards, perinatal wards, or NICU, might have an influence on lower occurrence of workplace violence in these areas.
Limitations
This study used a questionnaire survey asking about subjective experiences of workplace violence over the 1 year before the study. There is the possibility of recall bias, and the same incident recognized as workplace violence by one person might not have been recognized as such by another person, because sensitivity differs among respondents.
In some categories with fewer respondents, such as the pharmaceutical department, it might be difficult to examine the exact confidence intervals of odds ratio. Further study with increased respondents of those categories is needed to confirm the odds ratios and the confidence intervals.
The rates of victims or risk for workplace violence were considered to vary with the character of the residents of each area or policy of each hospital. Therefore, a further analysis with adjustment for those factors is needed.
CONCLUSIONS
This study reveals that a significant proportion of healthcare staff (36.4%) has experienced workplace violence over the 1 year before the study was conducted and suggests that workplace violence is a serious problem. The attributes of healthcare staff who are at risk of workplace violence could be identified for each type of workplace violence. The mechanisms and the countermeasures for each type of workplace violence at those high‐risk areas should be further investigated. Further studies are necessary to confirm whether these findings are applicable to different races and different countries with different cultures.
- Home Office. Violence at Work: Findings From the 2002/2003 British Crime Survey. Available at: http://www.homeoffice.gov.uk/rds/pdfs2/rdsolr0404.pdf. Accessed November 10,2010.
- ,.Workplace violence in Finland: high‐risk groups and preventive strategies.Am J Ind Med Suppl.1999;1:80–81.
- .Violence in the Workplace 1993–99, National Crime Victimization Survey,Washington, DC:Bureau of Justice Statistics;2001:1–12.
- .International perspectives on workplace bullying among nurses: a review.Int Nurs Rev.2009;56(1):34–40.
- ,,.Scoping workplace aggression in nursing: findings from an Australian study.J Adv Nurs.2006;55(6):778–787.
- ,,, et al.Violence against nurses working in US emergency departments.J Nurs Adm.2009;39(7–8):340–349.
- ,,.Hospital staff responses to workplace violence in a psychiatric hospital in Taiwan.Int J Occup Environ Health.2009;15(2):173–179.
- All Japan Hospital Association. Research on actual conditions of risk management system and workplace violence at hospitals (Japanese). Available at: http://www.ajha.or.jp/voice/pdf/other/080422.pdf. Accessed November 10, 2010.
- ,,, et al.The present situation and the countermeasure for verbal abuse and physical aggression of patients (Japanese).Japan Medical Journal.2007;4354:81–84.
- ,,, et al.Work‐related factors and violence among nursing staff in the European NEXT study: a longitudinal cohort study.Int J Nurs Stud.2008;45(1):35–50.
- ,,, et al.Aggression towards health care workers in Spain: a multi‐facility study to evaluate the distribution of growing violence among professionals, health facilities and departments.Int J Occup Environ Health.2009;15(1):29–35.
- Office of Policy Planning, Japanese Nursing Association.Research on actual conditions of workplace violence at healthcare sector 2003 (Japanese).Survey Report of Japanese Nursing Association.2004;71:7–16.
- ,.Factors related to on‐the‐job abuse of nurses by patients.Health Rep.2009;20(2):7–19.
- ,,, et al.Risk factors for work‐related assaults on nurses.Epidemiology.2005;16(5):704–709.
- ,,, et al.Characterizing violence in health care in British Columbia.J Adv Nurs.2009;65(8):1655–1663.
- ,,, et al.Personality dimensions of haemodialysis patients related to initial renal disease.EDTNA ERCA J.2002;28(1):21–24.
- ,,.Factors associated with workplace violence in paramedics.Prehosp Disaster Med.2009;24(5):417–421.
- .Sexuality. An uninvited guest.Nurs Times.1989;85(5):25–28.
- ,,, et al.Universal problems during residency: abuse and harassment.Med Educ.2009;43(7):628–636.
Patients and their relatives exposed to mental stress caused by hospitalization or illness might use violence against healthcare staff. Previous surveys reported that healthcare staff experience more workplace violence than other industry workers.13 Workplace violence by patients or their relatives may cause psychological problems or somatic effects on healthcare staff, such as losing self‐respect, depression, post‐traumatic stress disorder, stomachache, headache, or insomnia. Because those effects might lead to higher than usual turnovers of healthcare staff at a hospital, and interfere with high‐quality healthcare services, workplace violence at healthcare settings became a global concern; a lot of studies investigating those circumstances mainly were conducted in developed countries.415 Those studies revealed that the psychiatric ward, the emergency room, or the long‐term care facilities were the high‐risk areas of workplace violence; the incidence rate of physical aggression in the past year ranged from 3% to 35%; and the incidence rate of verbal abuse in the past year ranged from 26% to 64%. But the overall circumstances are still unclear, because most of the subjects in those studies were limited to nurses or some departments, such as the psychiatric ward or the emergency room. There might be other professions or departments with higher risk of workplace violence.
The aim of this study was to investigate the incidence of workplace violence and the attributes of healthcare staff, such as profession, age, gender, departments, and so on, who are at high risk of experiencing workplace violence.
METHODS
A questionnaire‐based, anonymous, and self‐administered cross‐sectional survey was conducted at 19 hospitals in Japan from January to December 2009. Among the 19 hospitals, 8 hospitals had less than 200 beds, 7 hospitals had 200 to 500 beds for acute care, and 4 hospitals had more than 500 beds for acute care. Thirteen of 19 hospitals were teaching hospitals. Eight out of 19 hospitals were located in urban areas. The characteristics of the 19 hospitals are shown in Table 4 of Supporting Appendix (in the online version of this article). The questionnaires were distributed to all 11,095 healthcare staff with a sealed reply envelope, and were collected anonymously using a collection box at each hospital.
The questionnaire contained questions about workplace violence, the work environment, and other topics. This study classifies workplace violence into physical aggression, verbal abuse, and sexual harassment. The respondents were requested to reply in regard to their experiences with each of these 3 types of workplace violence by patients or their relatives, over the past year. In this article, only those 3 questions and some background information of respondents were used for analysis. The race of patients and medical staff was not investigated because Japan is a racially homogeneous nation, and more than 99% of the population is Asian.
Logistic regression analysis with forced entry of all variables to examine the effect of attributes of healthcare staff to workplace violence was used. In this analysis, random effects of each hospital or area were not taken into account. All analyses were performed using SPSS 18.0 (SPSS, Inc, Chicago, IL), and P < 0.05 was used to determine significance.
In this study, workplace violence was defined as an event that was subjectively recognized by healthcare staff as violence caused by patients or their relatives. The violence among healthcare staff was excluded.
RESULTS
The response rate was 79.1% (8711/11,095). Among the 8771 respondents, 36.4% experienced workplace violence by patients or their relatives over the past year; 15.9% experienced physical aggressions, 29.8% experienced verbal abuse, and 9.9% experienced sexual harassment. Table 1 provides characteristics of the respondents; Table 2 shows the proportion of victims for workplace violence.
| No. of Respondents | |||
|---|---|---|---|
| n | (%)* | ||
| |||
| No. of beds in their hospital | <200 beds | 1298 | (14.8) |
| 200‐500 beds | 3041 | (34.7) | |
| 500 beds or more | 4432 | (50.5) | |
| Section | General ward | 2377 | (27.1) |
| Administration department | 989 | (11.3) | |
| Outpatient department | 675 | (7.7) | |
| Physicians' department | 610 | (7.0) | |
| Dietary department | 435 | (5.0) | |
| Long‐term care ward | 331 | (3.8) | |
| Rehabilitation department | 318 | (3.6) | |
| Critical care center, ICU, or CCU | 306 | (3.5) | |
| Obstetrics and gynecology ward, perinatal ward, or NICU | 287 | (3.3) | |
| Clinical laboratory or physiology department | 266 | (3.0) | |
| Operation department | 264 | (3.0) | |
| Pharmaceutical department | 209 | (2.4) | |
| Pediatric ward | 203 | (2.3) | |
| Radiology department | 197 | (2.2) | |
| Dialysis department | 104 | (1.2) | |
| Psychiatric ward | 56 | (0.6) | |
| Others | 1144 | (13.0) | |
| Profession | Nurse | 4298 | (49.0) |
| Clerk | 1208 | (13.8) | |
| Doctor | 610 | (7.0) | |
| Nursing aide or care worker | 585 | (6.7) | |
| Technician | 547 | (6.2) | |
| Dietician or cook | 435 | (5.0) | |
| Therapist | 313 | (3.6) | |
| Pharmacist | 183 | (2.1) | |
| Others | 592 | (6.7) | |
| Years of experience in their own specialty or profession | <5 yr | 3497 | (39.9) |
| 6‐10 yr | 1618 | (18.4) | |
| 11‐15 yr | 1041 | (11.9) | |
| 16‐20 yr | 761 | (8.7) | |
| 21 yr or more | 1218 | (13.9) | |
| Not reported | 636 | (7.3) | |
| Working hours per week | <20 hr | 640 | (7.3) |
| 20‐40 hr | 1720 | (19.6) | |
| 40‐60 hr | 4638 | (52.9) | |
| 60 hr or more | 655 | (7.5) | |
| Not reported | 1118 | (12.7) | |
| Gender | Male | 1941 | (22.1) |
| Female | 6272 | (71.5) | |
| Not reported | 558 | (6.4) | |
| Direct interaction or contact with patients | Having those contacts | 7227 | (82.4) |
| Not having those contacts | 1001 | (11.4) | |
| Not reported | 543 | (6.2) | |
| Total | 8771 | (100.0) | |
| No. of Respondents | Physical Aggression Experience | Verbal Abuse Experience | Sexual Harassment Experience | Experience of at Least 1 of the 3 Kinds of Violence | ||||||
|---|---|---|---|---|---|---|---|---|---|---|
| n | n | (%)* | n | (%)* | n | (%)* | n | (%)* | ||
| No. of beds in their hospital | <200 beds | 1298 | 244 | (18.8) | 306 | (23.6) | 109 | (8.4) | 413 | (31.8) |
| 200‐500 beds | 3041 | 503 | (16.5) | 971 | (31.9) | 354 | (11.6) | 1173 | (38.6) | |
| 500 beds or more | 4432 | 645 | (14.6) | 1338 | (30.2) | 406 | (9.2) | 1606 | (36.2) | |
| Section | Psychiatric ward | 56 | 33 | (58.9) | 37 | (66.1) | 8 | (14.3) | 42 | (75.0) |
| General ward | 2377 | 852 | (35.8) | 1057 | (44.5) | 536 | (22.5) | 1371 | (57.7) | |
| Dialysis department | 104 | 5 | (4.8) | 44 | (42.3) | 24 | (23.1) | 55 | (52.9) | |
| Critical care center, ICU, or CCU | 306 | 90 | (29.4) | 108 | (35.3) | 41 | (13.4) | 151 | (49.3) | |
| Long‐term care ward | 331 | 108 | (32.6) | 109 | (32.9) | 38 | (11.5) | 157 | (47.4) | |
| Outpatient department | 675 | 47 | (7.0) | 268 | (39.7) | 44 | (6.5) | 292 | (43.3) | |
| Physicians' department | 610 | 33 | (5.4) | 193 | (31.6) | 6 | (1.0) | 203 | (33.3) | |
| Pediatric ward | 203 | 23 | (11.3) | 50 | (24.6) | 13 | (6.4) | 62 | (30.5) | |
| Rehabilitation department | 318 | 53 | (16.7) | 70 | (22.0) | 31 | (9.7) | 96 | (30.2) | |
| Administration department | 989 | 10 | (1.0) | 247 | (25.0) | 16 | (1.6) | 251 | (25.4) | |
| Clinical radiology department | 197 | 11 | (5.6) | 40 | (20.3) | 2 | (1.0) | 48 | (24.4) | |
| Operation department | 264 | 11 | (4.2) | 38 | (14.4) | 9 | (3.4) | 43 | (16.3) | |
| Clinical laboratory or physiology department | 266 | 4 | (1.5) | 37 | (13.9) | 9 | (3.4) | 43 | (16.2) | |
| Obstetrics and gynecology ward, perinatal ward, or NICU | 287 | 3 | (1.0) | 26 | (9.1) | 2 | (0.7) | 28 | (9.8) | |
| Dietary department | 435 | 7 | (1.6) | 39 | (9.0) | 8 | (1.8) | 42 | (9.7) | |
| Pharmaceutical department | 209 | 1 | (0.5) | 15 | (7.2) | 5 | (2.4) | 19 | (9.1) | |
| Others | 1144 | 101 | (8.8) | 237 | (20.7) | 77 | (6.7) | 289 | (25.3) | |
| Profession | Nurse | 4298 | 1150 | (26.8) | 1694 | (39.4) | 729 | (17.0) | 2155 | (50.1) |
| Doctor | 610 | 33 | (5.4) | 193 | (31.6) | 6 | (1.0) | 203 | (33.3) | |
| Nursing aide or care worker | 585 | 104 | (17.8) | 151 | (25.8) | 39 | (6.7) | 191 | (32.6) | |
| Therapist | 313 | 53 | (16.9) | 71 | (22.7) | 31 | (9.9) | 96 | (30.7) | |
| Clerk | 1208 | 15 | (1.2) | 311 | (25.7) | 23 | (1.9) | 314 | (26.0) | |
| Technician | 547 | 15 | (2.7) | 79 | (14.4) | 19 | (3.5) | 97 | (17.7) | |
| Dietician or cook | 435 | 7 | (1.6) | 38 | (8.7) | 8 | (1.8) | 41 | (9.4) | |
| Pharmacist | 183 | 0 | (0.0) | 13 | (7.1) | 5 | (2.7) | 17 | (9.3) | |
| Others | 592 | 15 | (2.5) | 65 | (11.0) | 9 | (1.5) | 78 | (13.2) | |
| Years of experience in their own specialty or profession | <5 yr | 3497 | 527 | (15.1) | 919 | (26.3) | 384 | (11.0) | 1183 | (33.8) |
| 6‐10 yr | 1618 | 316 | (19.5) | 510 | (31.5) | 183 | (11.3) | 636 | (39.3) | |
| 11‐15 yr | 1041 | 210 | (20.2) | 350 | (33.6) | 125 | (12.0) | 421 | (40.4) | |
| 16‐20 yr | 761 | 111 | (14.6) | 253 | (33.2) | 58 | (7.6) | 294 | (38.6) | |
| 21 yr or more | 1218 | 160 | (13.1) | 422 | (34.6) | 85 | (7.0) | 475 | (39.0) | |
| Not reported | 636 | 68 | (10.7) | 161 | (25.3) | 34 | (5.3) | 183 | (28.8) | |
| Working hours per week | <20 hr | 640 | 50 | (7.8) | 148 | (23.1) | 39 | (6.1) | 173 | (27.0) |
| 20‐40 hr | 1720 | 234 | (13.6) | 473 | (27.5) | 157 | (9.1) | 583 | (33.9) | |
| 40‐60 hr | 4638 | 798 | (17.2) | 1424 | (30.7) | 498 | (10.7) | 1726 | (37.2) | |
| 60 hr or more | 655 | 103 | (15.7) | 242 | (36.9) | 50 | (7.6) | 279 | (42.6) | |
| Not reported | 1118 | 207 | (18.5) | 328 | (29.3) | 125 | (11.2) | 431 | (38.6) | |
| Gender | Male | 1941 | 185 | (9.5) | 471 | (24.3) | 77 | (4.0) | 529 | (27.3) |
| Female | 6272 | 1137 | (18.1) | 2004 | (32.0) | 752 | (12.0) | 2494 | (39.8) | |
| Not reported | 558 | 70 | (12.5) | 140 | (25.1) | 40 | (7.2) | 169 | (30.3) | |
| Direct interaction or contact with patients | Having those contacts | 7227 | 1325 | (18.3) | 2395 | (33.1) | 834 | (11.5) | 2945 | (40.7) |
| Not having those contacts | 1001 | 17 | (1.7) | 100 | (10.0) | 7 | (0.7) | 107 | (10.7) | |
| Not reported | 543 | 50 | (9.2) | 120 | (22.1) | 28 | (5.2) | 140 | (25.8) | |
| Total | 8771 | 1392 | (15.9) | 2615 | (29.8) | 869 | (9.9) | 3192 | (36.4) | |
Because of missing values, 6654 out of 8771 (75.9%) replies were used for the logistic regression analysis. Nagelkerke R2 for physical aggression was 0.33, for verbal abuse was 0.16, for sexual harassment was 0.23, and for at least one of the above types of violence was 0.23. The proportions of respondents, who had experienced each type of workplace violence, were not significantly different among the replies with missing data and with the effective data actually used.
Factors Associated With Higher Risk of Violence
Adjusted odds ratios of physical aggression were significantly high in general wards, psychiatric wards, critical care centers/emntensive care units (ICU)/cardiac care units (CCU), and long‐term care wards; and for nurses, nursing aides/care workers; for longer working hours; and for direct interaction with patients (Table 3).
| Physical Aggression | Verbal Abuse | Sexual Harassment | At Least 1 of the 3 Kinds of Violence | ||||||||||
|---|---|---|---|---|---|---|---|---|---|---|---|---|---|
| P | Odds Ratio (95%Cl) | P | Odds Ratio (95%Cl) | P | Odds Ratio (95%Cl) | P | Odds Ratio (95%Cl) | ||||||
| |||||||||||||
| No. of beds in their hospital | <200 beds | 1.00 | 1.00 | 1.00 | 1.00 | ||||||||
| 200‐500 beds | 0.51 | 0.90 | (0.67‐1.22) | <0.01* | 1.64 | (1.30‐2.07) | 0.19 | 1.27 | (0.89‐1.80) | <0.01* | 1.45 | (1.16‐1.81) | |
| 500 beds or more | 0.02* | 0.69 | (0.51‐0.94) | <0.01* | 1.57 | (1.24‐1.98) | 0.49 | 0.88 | (0.62‐1.26) | 0.01* | 1.32 | (1.06‐1.65) | |
| Section | Physicians' department | 1.00 | 1.00 | 1.00 | 1.00 | ||||||||
| Psychiatric ward | <0.01* | 9.28 | (4.39‐19.62) | <0.01* | 3.33 | (1.65‐6.70) | 0.69 | 0.80 | (0.27‐2.40) | <0.01* | 4.55 | (2.07‐1.02) | |
| Long‐term care ward | <0.01* | 2.48 | (1.55‐3.96) | <0.01* | 1.90 | (1.27‐2.86) | 0.65 | 1.15 | (0.63‐2.09) | <0.01* | 2.20 | (1.50‐3.24) | |
| General ward | <0.01* | 3.00 | (2.18‐4.13) | <0.01* | 1.73 | (1.36‐2.21) | <0.01* | 1.89 | (1.32‐2.69) | <0.01* | 1.98 | (1.57‐2.51) | |
| Dialysis department | 0.02* | 0.32 | (0.12‐0.83) | 0.04* | 1.65 | (1.02‐2.66) | 0.01* | 2.21 | (1.23‐3.97) | 0.02* | 1.81 | (1.12‐2.92) | |
| Critical care center, ICU, or CCU | <0.01* | 2.44 | (1.60‐3.74) | 0.49 | 1.13 | (0.79‐1.61) | 0.56 | 1.17 | (0.70‐1.94) | 0.04* | 1.43 | (1.01‐2.01) | |
| Administration department | 0.22 | 0.55 | (0.21‐1.44) | 0.07 | 1.38 | (0.98‐1.93) | 0.29 | 0.64 | (0.27‐1.48) | 0.07 | 1.37 | (0.98‐1.91) | |
| Clinical radiology department | 0.53 | 1.42 | (0.48‐4.21) | 0.51 | 1.21 | (0.69‐2.12) | 0.02* | 0.17 | (0.04‐0.78) | 0.57 | 1.17 | (0.69‐1.98) | |
| Rehabilitation department | 0.93 | 0.93 | (0.18‐4.77) | 0.88 | 1.08 | (0.42‐2.80) | 0.82 | 1.22 | (0.22‐6.79) | 0.77 | 1.14 | (0.46‐2.85) | |
| Outpatient department | <0.01* | 0.41 | (0.26‐0.65) | 0.03* | 1.35 | (1.02‐1.78) | 0.02* | 0.56 | (0.35‐0.90) | 0.40 | 1.12 | (0.86‐1.47) | |
| Dietary department | 0.33 | 1.94 | (0.51‐7.35) | 0.66 | 1.13 | (0.65‐1.99) | 0.85 | 1.13 | (0.30‐4.26) | 0.84 | 1.06 | (0.61‐1.82) | |
| Clinical laboratory or physiology department | 0.40 | 0.53 | (0.12‐2.34) | 0.85 | 1.06 | (0.59‐1.89) | 0.21 | 0.52 | (0.18‐1.45) | 0.87 | 0.96 | (0.55‐1.65) | |
| Pediatric ward | 0.27 | 0.72 | (0.41‐1.29) | 0.08 | 0.69 | (0.45‐1.05) | 0.02* | 0.43 | (0.21‐0.90) | 0.03* | 0.65 | (0.43‐0.97) | |
| Pharmaceutical department | 0.05 | 0.52 | (0.26‐1.01) | 0.71 | 1.26 | (0.36‐4.38) | 0.14 | 0.63 | (0.34‐1.17) | ||||
| Operation department | <0.01* | 0.24 | (0.12‐0.48) | <0.01* | 0.36 | (0.23‐0.55) | <0.01* | 0.21 | (0.09‐0.48) | <0.01* | 0.27 | (0.18‐0.41) | |
| Obstetrics and gynecology ward, perinatal ward, or NICU | <0.01* | 0.04 | (0.01‐0.18) | <0.01* | 0.19 | (0.12‐0.32) | <0.01* | 0.02 | (0.00‐0.18) | <0.01* | 0.14 | (0.08‐0.22) | |
| Profession | Doctor | 1.00 | 1.00 | 1.00 | <0.01* | 1.00 | |||||||
| Nurse | <0.01* | 4.09 | (2.41‐6.95) | 0.16 | 1.27 | (0.91‐1.76) | <0.01* | 11.64 | (4.38‐30.90) | 1.64 | (1.19‐2.26) | ||
| Therapist | 0.10 | 4.03 | (0.76‐21.28) | 0.83 | 0.90 | (0.34‐2.39) | 0.05* | 7.11 | (1.02‐49.3) | 0.83 | 1.11 | (0.43‐2.83) | |
| Nursing aide or care worker | 0.03* | 1.95 | (1.07‐3.55) | 0.09 | 0.71 | (0.47‐1.05) | <0.01* | 4.66 | (1.63‐13.31) | 0.19 | 0.77 | (0.53‐1.14) | |
| Clerk | 0.03* | 0.36 | (0.14‐0.90) | 0.27 | 0.80 | (0.54‐1.19) | 0.17 | 2.26 | (0.70‐7.27) | 0.09 | 0.72 | (0.49‐1.06) | |
| Technician | 0.27 | 0.55 | (0.19‐1.60) | <0.01* | 0.37 | (0.22‐0.61) | <0.01* | 6.92 | (2.20‐21.76) | <0.01* | 0.46 | (0.28‐0.74) | |
| Others | <0.01* | 0.21 | (0.08‐0.57) | <0.01* | 0.39 | (0.25‐0.60) | 0.24 | 2.14 | (0.60‐7.63) | <0.01* | 0.39 | (0.25‐0.59) | |
| Years of experience in their own specialty or profession | <5 yr | 1.00 | 1.00 | 1.00 | 1.00 | ||||||||
| 6‐10 yr | <0.01* | 1.42 | (1.17‐1.72) | 0.01* | 1.22 | (1.05‐1.42) | 0.84 | 0.98 | (0.78‐1.22) | 0.01* | 1.22 | (1.05‐1.42) | |
| 11‐15 yr | <0.01* | 1.64 | (1.31‐2.05) | <0.01* | 1.45 | (1.22‐1.73) | 0.30 | 1.14 | (0.89‐1.47) | <0.01* | 1.35 | (1.13‐1.60) | |
| 16‐20 yr | 0.30 | 1.16 | (0.88‐1.52) | <0.01* | 1.47 | (1.21‐1.79) | 0.09 | 0.75 | (0.54‐1.04) | <0.01* | 1.34 | (1.10‐1.63) | |
| 21 yr or more | 0.58 | 1.07 | (0.84‐1.37) | <0.01* | 1.65 | (1.39‐1.96) | <0.01* | 0.63 | (0.47‐0.85) | <0.01* | 1.38 | (1.16‐1.64) | |
| Working hours per week | <20 hr | 1.00 | 1.00 | 1.00 | 1.00 | ||||||||
| 20‐40 hr | 0.04* | 1.49 | (1.01‐2.19) | 0.52 | 1.08 | (0.85‐1.39) | 0.12 | 1.40 | (0.91‐2.15) | 0.10 | 1.23 | (0.96‐1.56) | |
| 40‐60 hr | <0.01* | 1.80 | (1.25‐2.58) | 0.03* | 1.28 | (1.02‐1.60) | 0.05* | 1.50 | (1.00‐2.24) | <0.01* | 1.39 | (1.11‐1.74) | |
| 60 hr or more | <0.01* | 2.14 | (1.37‐3.34) | <0.01* | 1.62 | (1.21‐2.17) | 0.14 | 1.49 | (0.88‐2.50) | <0.01* | 1.90 | (1.43‐2.54) | |
| Gender | (Female vs male) | 0.69 | 0.95 | (0.76‐1.20) | 0.16 | 1.12 | (0.95‐1.32) | <0.01* | 1.59 | (1.18‐2.12) | 0.01* | 1.22 | (1.05‐1.43) |
| Direct interaction or contact with patients | (Constant and direct interaction with patients vs no interaction) | 0.02* | 2.17 | (1.11‐4.22) | <0.01* | 2.46 | (1.87‐3.24) | <0.01* | 6.80 | (2.43‐19.03) | <0.01* | 2.58 | (1.97‐3.37) |
Adjusted odds ratios of verbal abuse were significantly high in hospital with 200 beds or more, in general wards, psychiatric wards, long‐term care wards, outpatient departments, and dialysis departments; and for longer years of experience in their own specialty; for longer working hours; and for direct interaction with patients.
Adjusted odds ratios of sexual harassment were significantly high in general wards, and dialysis departments; for nurses, nursing aides/care workers, technicians, therapists; for females; and for direct interaction with patients.
Adjusted odds ratios for at least 1 of the 3 kinds of workplace violence were significantly high in hospitals with 200 beds or more, in general wards, psychiatric wards, critical care centers/ICU/CCU, long‐term care wards, and dialysis departments; for nurses; for longer years of experience in their own specialty; for longer working hours; for females; and for direct interaction with patients.
Factors Associated With Lower Risk of Violence
Adjusted odds ratios of physical aggression were significantly low in dialysis departments; outpatient departments; operation departments; obstetrics and gynecology wards, perinatal wards, or neonatal intensive care units (NICU); and for clerks.
Adjusted odds ratios of verbal abuse were significantly low in operation departments; obstetrics and gynecology wards, perinatal wards, or NICU; and for technicians.
Adjusted odds ratios of sexual harassment were significantly low in clinical radiology departments; outpatient departments; pediatric wards; operation departments; obstetrics and gynecology wards, perinatal wards, or NICU; and for longer years of experience in their own specialty.
Adjusted odds ratios for at least 1 of the 3 kinds of workplace violence were significantly low in pediatric wards; operation departments; obstetrics and gynecology wards, perinatal wards, or NICU; and for technicians.
DISCUSSION
Among the healthcare staff, 36.4% experienced workplace violence by patients or their relatives over the past year; 15.9% experienced physical aggressions, 29.8% verbal abuse, and 9.9% sexual harassment. The risk factors of workplace violence identified in the present study were similar to those studies conducted not only in Japan, but also in Western countries. Though the target population was limited to Asians, our results can be applicable to other races, countries, and cultures.
Incidence of Workplace Violence
Most previous studies covered only specific professions at hospitals, such as nurses or critical care center staff, and there are only few multicenter studies covering entire sections and professions like this study.510, 1214 A Spanish study including about 8000 healthcare workers reported that 11% had experienced physical aggression, 64% had experienced threatening behavior, intimidation, or insults in the past year.11 The incidence of physical aggression was similar in both studies, but the incidence of verbal abuse was about twice as high as that of this study. The low response rate in the Spanish study (24%) might have contributed to a higher number of verbal abuse incidents, because those with experience of workplace violence would likely have answered the questionnaire. It is difficult to compare the incidence of workplace violence among different studies because the definitions of workplace violence differ widely. Ethnic culture might also affect the acknowledgement of workplace violence. The European NEXT study including about 30,000 nurses in 8 European countries reported a range of 10.4% incidence of workplace violence in the Netherlands, and 39.1% in France.10
Risk Factors of Physical Aggression
Previous studies reported that the prevalence of physical aggression is high in psychiatric wards, critical care centers, or long‐term care wards.1015 In these departments, patients with mental illness, postoperative delirium, or dementia are likely to be admitted.
Nurses and nursing aides are reported to be likely to experience physical aggression.3, 11, 15 Nurses and nursing aides have longer work hours with direct interaction with patients than other professions, and are considered to be at high risk of physical aggression.
Some studies, which did not examine influences by profession or department, reported that male was a risk factor for physical aggression and verbal abuse.6, 10, 11, 13 In this study though, the male gender was not associated with physical aggression or verbal abuse. Male nurses and nursing aides are likely to be assigned to high‐risk departments or to care for high‐risk patients. Gender may be confounded with variables such as profession or department.15
Longer work hours mean more frequent interaction with patients, and the risk for physical aggression might increase. Constant and direct interaction with patients is a risk factor, not only for physical aggression, but also for verbal abuse and sexual harassment.10
Risk Factors of Verbal Abuse
Previous studies reported that incidents of verbal abuse are high for nurses and nursing aides.15 Although in this study the proportion of verbal abuse was the highest in nurses (39.4%), adjusted odds ratio was not significant. Factors other than nurse profession, such as department and direct interaction with patients relating to the nurse profession, might be the higher risk factors for verbal abuse.
As reported in previous studies, psychiatric wards and long‐term care wards are risk factors of verbal abuse also in this study.10, 13, 15 Long waiting time at outpatient departments might increase the risk of verbal abuse.
Dialysis departments are at high risk of verbal abuse and sexual harassment. Compared to other outpatients, dialysis patients are forced to stay a long time in hospitals and there is, therefore, more interaction with nurses and technicians. The characteristic personality of dialysis patients, such as neuroticism or psychoticism, might also affect verbal abuse or sexual harassment.16
Because longer working hours mean more frequent interaction with patients, the risk of verbal abuse might increase.17 Managers with longer work experience might be at high risk for verbal abuse, because they often assume responsibility and take on the task of dealing with patients and their relevant complaints.11
Risk Factors of Sexual Harassment
Nurses are likely to experience sexual harassment because their public image seems to combine sexuality and maternalism.18 Nursing aides, technicians, and therapists also experience sexual harassment. The common risk factor among those professions is the direct contact with the patient's body during the patient's transfer. A lot of studies reported that female gender is a risk factor of sexual harassment.17, 19
Safety Factors of Workplace Violence
Adjusted odds ratios of operation departments, and obstetrics and gynecology wards, perinatal wards, or NICU were common safety factors for each type of workplace violence. Usually, the patients in operation rooms cannot talk or move a finger carelessly during the surgery. The fact that there are no adult male patients in obstetrics and gynecology wards, perinatal wards, or NICU, might have an influence on lower occurrence of workplace violence in these areas.
Limitations
This study used a questionnaire survey asking about subjective experiences of workplace violence over the 1 year before the study. There is the possibility of recall bias, and the same incident recognized as workplace violence by one person might not have been recognized as such by another person, because sensitivity differs among respondents.
In some categories with fewer respondents, such as the pharmaceutical department, it might be difficult to examine the exact confidence intervals of odds ratio. Further study with increased respondents of those categories is needed to confirm the odds ratios and the confidence intervals.
The rates of victims or risk for workplace violence were considered to vary with the character of the residents of each area or policy of each hospital. Therefore, a further analysis with adjustment for those factors is needed.
CONCLUSIONS
This study reveals that a significant proportion of healthcare staff (36.4%) has experienced workplace violence over the 1 year before the study was conducted and suggests that workplace violence is a serious problem. The attributes of healthcare staff who are at risk of workplace violence could be identified for each type of workplace violence. The mechanisms and the countermeasures for each type of workplace violence at those high‐risk areas should be further investigated. Further studies are necessary to confirm whether these findings are applicable to different races and different countries with different cultures.
- Home Office. Violence at Work: Findings From the 2002/2003 British Crime Survey. Available at: http://www.homeoffice.gov.uk/rds/pdfs2/rdsolr0404.pdf. Accessed November 10,2010.
- ,.Workplace violence in Finland: high‐risk groups and preventive strategies.Am J Ind Med Suppl.1999;1:80–81.
- .Violence in the Workplace 1993–99, National Crime Victimization Survey,Washington, DC:Bureau of Justice Statistics;2001:1–12.
- .International perspectives on workplace bullying among nurses: a review.Int Nurs Rev.2009;56(1):34–40.
- ,,.Scoping workplace aggression in nursing: findings from an Australian study.J Adv Nurs.2006;55(6):778–787.
- ,,, et al.Violence against nurses working in US emergency departments.J Nurs Adm.2009;39(7–8):340–349.
- ,,.Hospital staff responses to workplace violence in a psychiatric hospital in Taiwan.Int J Occup Environ Health.2009;15(2):173–179.
- All Japan Hospital Association. Research on actual conditions of risk management system and workplace violence at hospitals (Japanese). Available at: http://www.ajha.or.jp/voice/pdf/other/080422.pdf. Accessed November 10, 2010.
- ,,, et al.The present situation and the countermeasure for verbal abuse and physical aggression of patients (Japanese).Japan Medical Journal.2007;4354:81–84.
- ,,, et al.Work‐related factors and violence among nursing staff in the European NEXT study: a longitudinal cohort study.Int J Nurs Stud.2008;45(1):35–50.
- ,,, et al.Aggression towards health care workers in Spain: a multi‐facility study to evaluate the distribution of growing violence among professionals, health facilities and departments.Int J Occup Environ Health.2009;15(1):29–35.
- Office of Policy Planning, Japanese Nursing Association.Research on actual conditions of workplace violence at healthcare sector 2003 (Japanese).Survey Report of Japanese Nursing Association.2004;71:7–16.
- ,.Factors related to on‐the‐job abuse of nurses by patients.Health Rep.2009;20(2):7–19.
- ,,, et al.Risk factors for work‐related assaults on nurses.Epidemiology.2005;16(5):704–709.
- ,,, et al.Characterizing violence in health care in British Columbia.J Adv Nurs.2009;65(8):1655–1663.
- ,,, et al.Personality dimensions of haemodialysis patients related to initial renal disease.EDTNA ERCA J.2002;28(1):21–24.
- ,,.Factors associated with workplace violence in paramedics.Prehosp Disaster Med.2009;24(5):417–421.
- .Sexuality. An uninvited guest.Nurs Times.1989;85(5):25–28.
- ,,, et al.Universal problems during residency: abuse and harassment.Med Educ.2009;43(7):628–636.
Copyright © 2011 Society of Hospital Medicine
Economic Impact of Enoxaparin in Stroke
Venous thromboembolism (VTE), which encompasses both deep‐vein thrombosis (DVT) and pulmonary embolism (PE), is a major health problem in the United States and worldwide. It represents one of the most significant causes of morbidity and mortality with an estimated 300,000 VTE‐related deaths,1 and 300,000‐600,000 hospitalizations in the United States annually.2 Hospitalization for medical illness is associated with a similar proportion of VTE cases as hospitalization for surgery.3 Several groups of medical patients have been shown to be at an increased risk of VTE, including those with cancer, severe respiratory disease, acute infectious illness, heart failure, myocardial infarction, and acute ischemic stroke.47 Ischemic stroke patients represent approximately 4.6% of medical patients at high risk of VTE in US hospitals.8 The incidence of DVT in such patients has been reported to be as high as 75%9 and PE has been reported to be responsible for up to 25% of early deaths after stroke.10
Several studies have demonstrated the efficacy of unfractionated heparin (UFH) or a low‐molecular‐weight heparin (LMWH) in the prevention of VTE in stroke patients, and have demonstrated that LMWHs are at least as effective as UFH.1114 The open‐label, randomized Prevention of VTE after acute ischemic stroke with LMWH and UFH (PREVAIL) trial demonstrated that in patients with acute ischemic stroke, prophylaxis for 10 days with the LMWH enoxaparin reduces the risk of VTE by 43% compared with UFH (10.2% vs 18.1%, respectively; relative risk = 0.57; 95% confidence interval [CI] = 0.44‐0.76; P = 0.0001) without increasing the incidence of overall bleeding events (7.9% vs 8.1%, respectively; P = 0.83), or the composite of symptomatic intracranial and major extracranial hemorrhage (1% in each group; P = 0.23). There was, however, a slight but significant increase in major extracranial hemorrhage alone with enoxaparin (1% vs 0%; P = 0.015).14 Evidence‐based guidelines from the American College of Chest Physicians (ACCP) provide recommendations for appropriate thromboprophylaxis regimens for patients at risk of VTE.15 Thromboprophylaxis with UFH, LMWH, and, more recently, fondaparinux is recommended for medical patients admitted to hospital with congestive heart failure or severe respiratory disease, or those who are confined to bed and have one or more additional risk factors, including active cancer, previous VTE, or acute neurologic disease.15 Similarly, in the Eighth ACCP Clinical Practice Guidelines, low‐dose UFH or LMWH are recommended for VTE prevention in patients with ischemic stroke who have restricted mobility.16
VTE is also associated with a substantial economic burden on the healthcare system, costing an estimated $1.5 billion annually in the United States.17 Thromboprophylaxis has been shown to be a cost‐effective strategy in hospitalized medical patients. Prophylaxis with a LMWH has been shown to be more cost‐effective than UFH in these patients.1821
However, despite the clinical and economic benefits, prophylaxis is still commonly underused in medical patients.22, 23 In surgical patients, the Surgical Care Improvement Project (SCIP) focuses on reducing surgical complications, and has endorsed 2 measures: VTE‐1, relating to the proportion of patients for whom VTE prophylaxis is ordered; and VTE‐2, relating to those who receive the recommended regimen (
The objective of the current study was to determine the economic impact, in terms of hospital costs, of enoxaparin compared with UFH for VTE prophylaxis after acute ischemic stroke. A decision‐analytic model was constructed using data from the PREVAIL study and historical inpatient data from a multi‐hospital database.
METHODS
In this study, the cost implications, from the hospital perspective, of VTE prophylaxis with enoxaparin or UFH in patients with acute ischemic stroke, were determined using a decision‐analytic model in TreeAge Pro Suite (TreeAge Software, Inc., Williamstown, MA, USA). The decision‐tree was based on 3 stages: (a) whether patients received enoxaparin or UFH; (b) how patients were classified according to their National Institutes of Health Stroke Scale (NIHSS) classification scores (<14 or 14); and (c) which clinical event each patient experienced, as defined per the PREVAIL trial (DVT, PE, intracranial hemorrhage, major extracranial hemorrhage, and minor extracranial hemorrhage) (Figure 1). The time horizon for the model was established at 90 days to mirror the length of follow‐up in the PREVAIL trial.

Total hospital costs were calculated based on clinical event rates (from the PREVAIL trial) and the costs of each clinical event, which were calculated separately according to the descriptions below, and then inserted into the decision‐analytic model. The clinical event rates were calculated from the efficacy and safety endpoints collected in the PREVAIL trial, and included VTE events (DVT and PE) and bleeding events (intracranial hemorrhage, major extracranial hemorrhage, and minor extracranial hemorrhage). Details of the patient population, eligibility criteria, and treatment regimen have previously been published in full elsewhere.14, 27
The costs of clinical events during hospitalization were estimated using a multivariate cost‐evaluation model, based on mean hospital costs for the events in the (Premier Inc., Charlotte, NC, USA) multi‐hospital database, one of the largest US hospital clinical and economic databases. The data are received from over 600 hospitals, representing all geographical areas of the United States, a broad range of bed sizes, teaching and non‐teaching, and urban and rural facilities. This database contains detailed US inpatient care records of principal and secondary diagnoses, inpatient procedures, administered laboratory tests, dispensed drugs, and demographic information. The evaluation of hospital cost for each type of clinical event was conducted by i3 Innovus (Ingenix, Inc., Eden Prairie, MN, USA). Total hospital costs were cumulative from all events, so if patients experienced multiple clinical events, the costs of the events were additive. The cost for stroke treatment and management was not included because it is an inclusion criterion of the PREVAIL trial and, thus, all patients in the trial have such costs.
Default drug costs were taken from the 2008 US wholesalers' acquisition cost data. The default dosing schedule is based on information extracted from the PREVAIL trial: enoxaparin 40 mg (once‐daily) and UFH 5000 U (twice‐daily) for 10 days each ($25.97 and $2.97, respectively). A drug‐administration fee was added for each dose of either enoxaparin or UFH ($10 for each).19
The estimated hospital cost of clinical events, along with drug costs, were inserted into the decision‐analytic model in TreeAge Pro Suite to estimate the cost per discharge from the hospital perspective in patients with ischemic stroke receiving VTE prophylaxis with enoxaparin or UFH. An additional analysis was performed to investigate the costs and cost differences in patients with less severe stroke (NIHSS scores <14) and more severe stroke (NIHSS scores 14).
Sensitivity analyses were performed to examine the impact of varying the cost inputs on the total hospital cost of each treatment arm by 5%, 10%, 15%, 20%, 30%, and 40%, and the robustness in the difference in costs between the enoxaparin and UFH groups. Univariate (via tornado diagram in TreeAge Pro Suite) and multivariate (via Monte Carlo simulation in TreeAge Pro Suite) analyses were performed. For the univariate analysis, each clinical event cost was adjusted individually, increasing or decreasing by 5%, 10%, 15%, 20%, 30% and 40% while other parameters remained unchanged. For the Monte Carlo simulation (TreeAge Pro Suite), all the parameters were simultaneously varied in a random fashion, within a range of 5%, 10%, 15%, 20%, 30%, and 40% over 10,000 trials. The simulation adopted a gamma distribution assumption for input sampling for cost parameters and a beta distribution for the event probability parameters. The confidence intervals for the probability parameters were obtained from the PREVAIL trial. The differences between the enoxaparin and UFH treatment groups were plotted in a graph against the variation in costs of each clinical event.
RESULTS
The clinical VTE and bleeding event rates as collected from the PREVAIL trial are shown in Table 1. The hospital costs per clinical event are shown in Table 2. The most costly clinical event from the hospital perspective was intracranial hemorrhage at $4001, followed by major extracranial hemorrhage at $3534. The costs of DVT and PE were $3003 and $2143, respectively.
| Event Rate | 95% CI | |
|---|---|---|
| ||
| Enoxaparin (NIHSS <14) | ||
| Deep‐vein thrombosis | 0.081 | 0.05730.1048 |
| Pulmonary embolism | 0.002 | 0.000050.011 |
| Intracranial hemorrhage | 0.0031 | 00.0074 |
| Major extracranial hemorrhage | 0.0047 | 00.0099 |
| Minor hemorrhage | 0.0372 | 0.0240.0549 |
| Enoxaparin (NIHSS 14) | ||
| Deep‐vein thrombosis | 0.1625 | 0.10530.2197 |
| Pulmonary embolism | 0 | 00 |
| Intracranial hemorrhage | 0.0086 | 00.0205 |
| Major extracranial hemorrhage | 0.0172 | 0.04660.1198 |
| Minor hemorrhage | 0.0776 | 0.04660.1198 |
| UFH (NIHSS <14) | ||
| Deep‐vein thrombosis | 0.1356 | 0.10540.1658 |
| Pulmonary embolism | 0.004 | 0.00050.0145 |
| Intracranial hemorrhage | 0.0032 | 00.0077 |
| Major extracranial hemorrhage | 0 | 00 |
| Minor hemorrhage | 0.0514 | 0.03550.0719 |
| UFH (NIHSS 14) | ||
| Deep‐vein thrombosis | 0.2914 | 0.22410.3588 |
| Pulmonary embolism | 0.0229 | 0.00630.0575 |
| Intracranial hemorrhage | 0.016 | 0.00040.0316 |
| Major extracranial hemorrhage | 0 | 00 |
| Minor hemorrhage | 0.064 | 0.0370.1019 |
| Event | Cost per Event ($)* | ||
|---|---|---|---|
| Likeliest | Minimum | Maximum | |
| |||
| Deep‐vein thrombosis | 3,003 | 2,402 | 3,604 |
| Pulmonary embolism | 2,143 | 1,714 | 2,572 |
| Intracranial hemorrhage | 4,001 | 3,201 | 4,801 |
| Major extracranial hemorrhage | 3,534 | 2,827 | 4,241 |
| Minor hemorrhage | 1,322 | 1,058 | 1,586 |
| Enoxaparin cost per dose | 26 | 21 | 31 |
| Unfractionated heparin cost per dose | 3 | 2 | 4 |
The average hospital cost with enoxaparin, when taking into account the costs of VTE and bleeding, was lower than with UFH ($422 vs $662, respectively), with a net savings of $240 per patient if enoxaparin was used. The average drug costs, including drug‐administration costs, were higher in the enoxaparin group ($360) compared with the UFH group ($259; difference $101). Nevertheless, the total hospital cost when clinical events and drug costs were considered together, was lower with enoxaparin than UFH. The total hospital costs per patient were $782 in patients receiving prophylaxis with enoxaparin and $922 in patients receiving UFH. Thus, enoxaparin was associated with a total cost‐savings of $140 per patient (Figure 2).
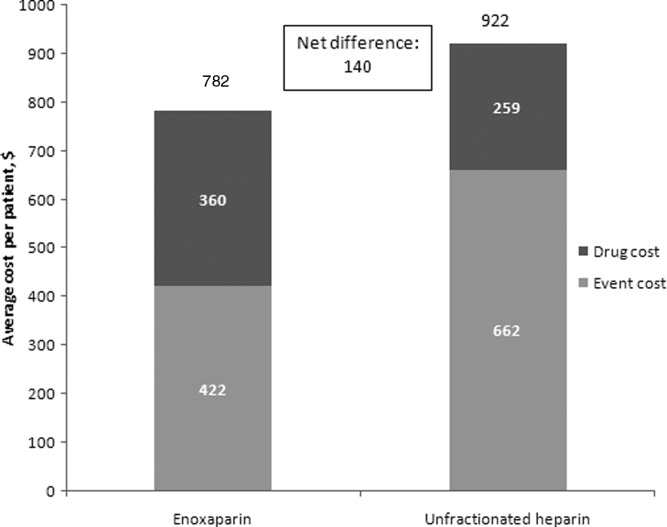
The cost estimates according to the stroke severity score (NIHSS scores <14 vs 14) are described in Table 3. The drug costs were consistent, regardless of stroke severity, for enoxaparin ($360) and for UFH ($259). However, in both treatment groups, the event costs were higher in patients with more severe stroke, compared with less severe stroke. For example, in the enoxaparin group, the event costs were $686 in patients with NIHSS scores 14 and $326 in patients with NIHSS scores <14. Nevertheless, the overall costs (event costs plus drug costs) were lower with enoxaparin compared with UFH, both in patients with less severe and more severe stroke. In fact, the total hospital cost‐savings were greater when enoxaparin was used instead of UFH in patients with more severe stroke (cost‐saving $287 if NIHSS score 14 vs $71 if NIHSS score <14) (Table 3).
| Enoxaparin ($) | UFH ($) | Difference ($ [UFHEnoxaparin]) | |
|---|---|---|---|
| |||
| NIHSS score <14 | |||
| Mean event costs per patient | 326 | 497 | 171 |
| Mean drug costs per patient* | 360 | 259 | 101 |
| Total costs | 685 | 756 | 71 |
| NIHSS score 14 | |||
| Mean event costs per patient | 686 | 1,073 | 387 |
| Mean drug costs per patient* | 360 | 259 | 101 |
| Total costs | 1,046 | 1,332 | 287 |
Multiple sensitivity analyses were performed. In the base case univariate sensitivity analysis, individual costs were adjusted by 20% (Table 4). If the cost of DVT increased by 20% (from $3003 to $3604) the difference between the enoxaparin and UFH groups was $187. When the cost of DVT was decreased by 20% to $2402, enoxaparin was still cost‐saving, with a difference of $94. For each of the individual cost parameters that were varied (DVT, PE, intracranial hemorrhage, major extracranial hemorrhage, and minor hemorrhage), enoxaparin was always less costly than UFH. Subsequent sensitivity analyses were performed (not shown) where cost parameters were varied by 5%, 10%, 15%, 30%, and 40%. Enoxaparin remained less costly than UFH in all cases.
| Event | Baseline Cost Input ($) | +20% Cost Input ($) | +20% Difference ($ [UFH Enoxaparin]) (% Change) | 20% Cost Input ($) | 20% Difference ($ [UFH Enoxaparin]) (% Change) |
|---|---|---|---|---|---|
| |||||
| Deep‐vein thrombosis | 3,003 | 3,604 | 187 (33) | 2,402 | 94 (33) |
| Pulmonary embolism | 2,143 | 2,572 | 144 (2.5) | 1,714 | 137 (2.5) |
| Intracranial hemorrhage | 4,001 | 4,801 | 142 (1.3) | 3,201 | 138 (1.3) |
| Major extracranial hemorrhage | 3,534 | 4,241 | 134 (4.0) | 2,827 | 146 (4.0) |
| Minor hemorrhage | 1,322 | 1,586 | 142 (1.3) | 1,058 | 138 (1.3) |
A multivariate analysis was performed using a Monte Carlo simulation in TreeAge Pro (Figure 3). When all parameters were varied simultaneously (by 5%, 10%, 15%, 20%, 30%, and 40%) and the differences in costs between the enoxaparin and UFH groups were measured and plotted, the mean (standard deviation) difference between enoxaparin and UFH prophylaxis was $140 ($79) (Figure 3). Figure 4 shows a graphical presentation of the sensitivity analysis results for event probabilities and costs. Differences in enoxaparin drug costs, hospital costs for DVT, and probability of DVT for patients on enoxaparin are the factors that have the greatest effect on the overall cost.
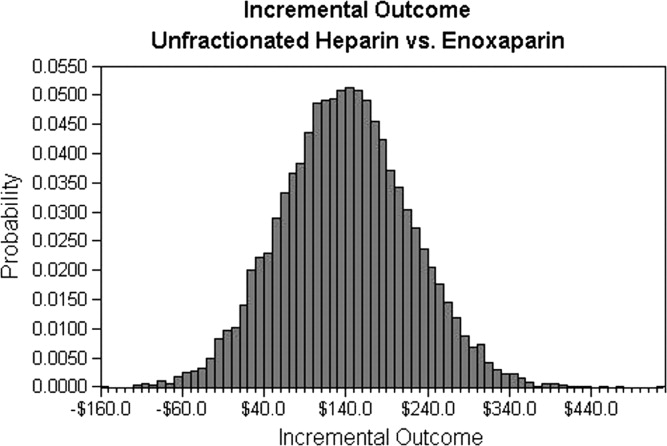
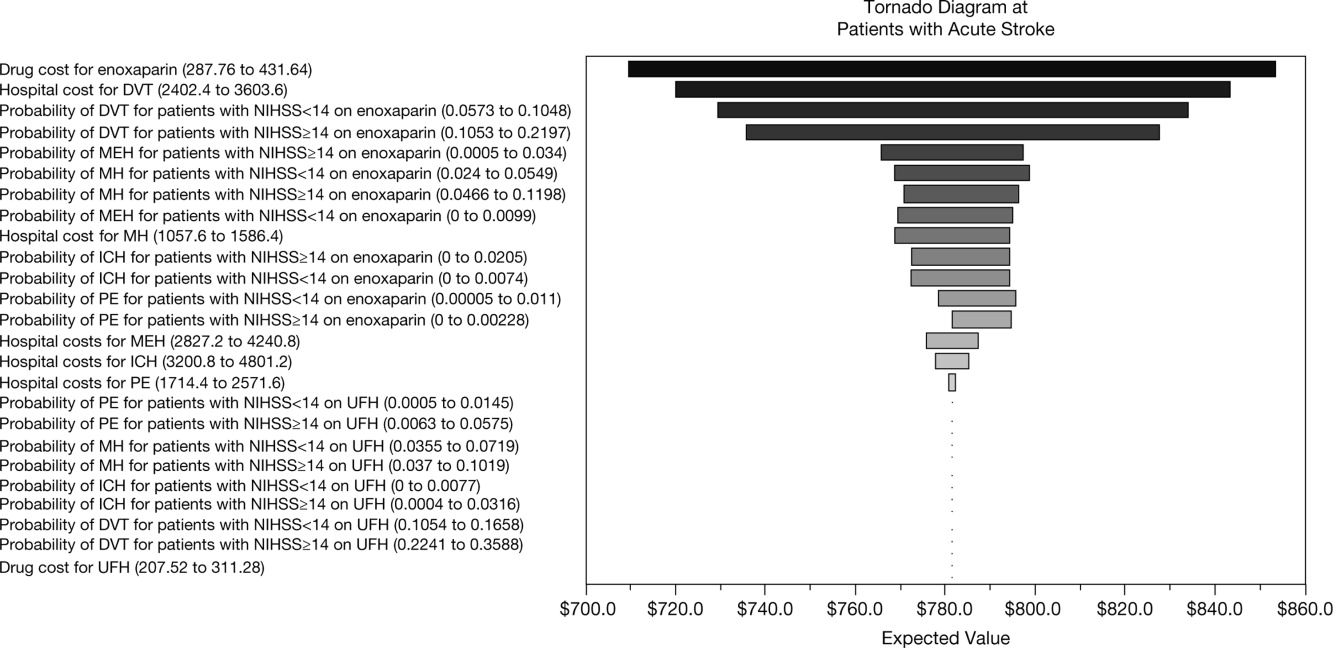
Finally, an additional scenario was performed using a published ratio of asymptomatic DVT to symptomatic VTE, due to the fact that not all VTE events in the real‐world present with symptoms prompting treatment. Quinlan et al. determined a ratio of asymptomatic DVT to symptomatic VTE of 5 for total hip replacement patients and of 21 for total knee replacement patients.28 Although derived from different patient populations who received different anticoagulants, we utilized the symptomatic event rates from the pooled studies to recalculate cost differences between enoxaparin and UFH in acute ischemic stroke. Using only symptomatic event rates, based on the 21:1 ratio in patients undergoing total knee replacement, the total cost for enoxaparin was $485 compared to $386 for UFH. Similar results were found based on the 5:1 ratio in patients with total hip replacement (enoxaparin $532 vs $472 for UFH). This was the only scenario where the higher drug cost of prophylaxis with enoxaparin was not completely offset by the reduction in events compared to UFH, likely due to the smaller difference in event rates once examining only symptomatic VTE.
DISCUSSION
This analysis demonstrates that, from the hospital perspective, enoxaparin 40 mg subcutaneously once‐daily is associated with lower total hospital costs and is more cost‐effective than twice‐daily UFH 5000 U subcutaneously for the prevention of VTE in patients with acute ischemic stroke. Despite higher drug‐acquisition costs, enoxaparin was associated with total cost‐savings of $140 per patient. This is due to the lower event rates with enoxaparin compared with UFH.
Previous studies, using hospital or payer information, have shown that VTE prophylaxis is more cost‐effective compared with no prophylaxis. In terms of the different VTE prophylaxis regimens, enoxaparin represents a more cost‐effective option in comparison with UFH19, 21, 2932 and also when compared with fondaparinux.21, 33 When comparing the results between different trials, it should be noted that previous analyses were mainly modeled on the Prophylaxis in Medical Patients with Enoxaparin (MEDENOX) study, which was performed in general medical patients and reported a VTE rate of 5.5%.6 However, patients with acute ischemic stroke are at a higher risk of VTE, with a 10% incidence of VTE reported in the PREVAIL study.14 Furthermore, twice‐daily rather than three‐timesdaily administration of UFH was used in the PREVAIL study, based on the current practice patterns seen during the PREVAIL trial design.
A recent retrospective analysis of transactional billing records demonstrated that, despite higher mean costs of anticoagulation therapy, the mean, total, adjusted direct hospital costs were lower with LMWH thromboprophylaxis compared with UFH ($7358 vs $8680, respectively; difference $1322; P < 0.001).21 A previous study by Burleigh and colleagues based on hospital discharge information extracted from both medical and surgical patients, has a sub‐analysis in patients with stroke. In these patients also, the total costs were lower for enoxaparin compared with UFH ($8608 vs $8911, respectively; difference $303).29 In the Burleigh study, drug costs and total discharge costs (eg, room and board, laboratory, and diagnostic imaging) were derived from drug charges and total charges, and were converted to estimated costs using cost‐to‐charge methods, so the absolute figures are not directly comparable with the current analysis.
This study adds to current literature by using data from a prospective study to analyze the hospital costs of VTE prophylaxis in stroke patients. The current study also provides a valuable cost‐analysis regarding a specific subgroup of medical patients at particularly high risk of VTE, and provides an economic comparison among stroke patients with NIHSS scores of <14 versus 14. In the PREVAIL study, despite a 2‐fold higher incidence of VTE in patients with more severe stroke (16.3% vs 8.3%), a similar reduction in VTE risk was observed with enoxaparin versus UFH in patients with NIHSS scores of 14 (odds ratio = 0.56; 95% CI = 0.37‐0.84; P = 0.0036) and <14 (odds ratio = 0.46; 95% CI = 0.27‐0.78; P = 0.0043).14 Enoxaparin was shown to be cost‐saving relative to UFH in both patient groups and, in particular, in patients with more severe stroke.
Potential limitations of the current analysis include the applicability of the figures obtained from the highly selected clinical trial population to real‐world clinical practice, and the fact that it is difficult to match cost estimates to trial data definitions. For example, this analysis was conducted with a comparator of twice‐daily UFH (as opposed to three‐timesdaily) which may be used in the real‐world setting and may have resulted in the increased number of events in the UFH group seen in the PREVAIL study. Due to a variety of differences between real‐world practice patterns and the PREVAIL clinical trial, we can only speculate as to the true cost‐consequences of utilizing enoxaparin versus UFH.
Furthermore, the original model did not include a sub‐analysis regarding the rates and, therefore, costs of proximal/symptomatic VTE. In the primary study of PREVAIL, the rates of symptomatic DVT were 1 in 666 patients (<1%) for enoxaparin and 4 in 669 patients (1%) for UFH, whereas the rates of proximal DVT were 30 in 666 patients (5%) and 64 in 669 patients (10%), respectively. Sensitivity analyses were performed to investigate the impact of lower rates of both DVT and PE (up to 40%), and the differences between groups were found to be robust. However, it is important to note that overall costs for both groups may have been increased through the inclusion of asymptomatic costs, with a more distinct separation of these costs making for a good follow‐up study. In a similar cost‐analysis we performed based on the PREVAIL study, which assessed the cost to the payer, we included an analysis of costs according to 3 different VTE definitions: the PREVAIL VTE definition (as in the current study); a definition of major VTE (PE, symptomatic DVT, and asymptomatic proximal DVT); and primary endpoints recommended by the European Medicines Agency Committee for Medicinal Products for Human Use for studies on VTE (proximal DVT, nonfatal PE, and all‐cause mortality). We found similar results irrespective of clinical event definitions.34 In an additional model scenario using a published ratio of asymptomatic DVT to symptomatic VTE,28 the higher drug cost of prophylaxis with enoxaparin was not completely offset by the reduction in events compared to UFH. This was likely due to the smaller difference in event rates once examining only symptomatic VTE. This scenario was limited by the fact that the ratio was derived from different patient populations receiving different anticoagulants than stroke patients.
In conclusion, data from this analysis adds to the evidence that, from the hospital perspective, the higher drug cost of enoxaparin is offset by the economic consequences of the events avoided as compared with UFH for the prevention of VTE following acute ischemic stroke, particularly in patients with severe stroke.
Acknowledgements
The authors thank Aylin Lee from I3 Innovus for her contribution to this study. The authors also acknowledge Min Chen for her assistance in statistical analysis, and Essy Mozaffari for his contribution to this study.
- .Venous thromboembolism: disease burden, outcomes and risk factors.J Thromb Haemost.2005;3:1611–1617.
- .The epidemiology of venous thromboembolism in the community: implications for prevention and management.J Thromb Thrombolysis.2006;21:23–29.
- ,,, et al.Relative impact of risk factors for deep vein thrombosis and pulmonary embolism: a population‐based study.Arch Intern Med.2002;162:1245–1248.
- ,,,,,.Risk factors for deep vein thrombosis and pulmonary embolism: a population‐based case‐control study.Arch Intern Med.2000;160:809–815.
- ,.A safety analysis of thromboprophylaxis in acute medical illness.Thromb Haemost.2003;89:590–591.
- ,,,,.Quantification of risk factors for venous thromboembolism: a preliminary study for the development of a risk assessment tool.Haematologica.2003;88:1410–1421.
- ,.Prevalence of venous thromboembolism in acute hemorrhagic and thromboembolic stroke.Am J Phys Med Rehabil.2003;82:364–369.
- ,,,.Thromboprophylaxis rates in US medical centers: success or failure?J Thromb Haemost.2007;5:1610–1616.
- ,,,.Complications after acute stroke.Stroke.1996;27:415–420.
- ,,,.Venous thromboembolism after acute stroke.Stroke.2001;32:262–267.
- ,,,,,.Enoxaparin vs heparin for prevention of deep‐vein thrombosis in acute ischaemic stroke: a randomized, double‐blind study.Acta Neurol Scand.2002;106:84–92.
- ,,.Low‐molecular‐weight heparins or heparinoids versus standard unfractionated heparin for acute ischaemic stroke.Cochrane Database Syst Rev.2008;(3):CD000119.
- ,,, et al;for the PROTECT Trial Group.Prophylaxis of thrombotic and embolic events in acute ischemic stroke with the low‐molecular‐weight heparin certoparin: results of the PROTECT Trial.Stroke.2006;37:139–144.
- ,,, et al;for the PREVAIL Investigators.The efficacy and safety of enoxaparin versus unfractionated heparin for the prevention of venous thromboembolism after acute ischaemic stroke (PREVAIL study): an open‐label randomised comparison.Lancet.2007;369:1347–1355.
- ,,, et al;for the American College of Chest Physicians.Prevention of venous thromboembolism: American College of Chest Physicians Evidence‐Based Clinical Practice Guidelines (8th ed).Chest.2008;133(6 suppl):381S–453S.
- ,,,,;for the American College of Chest Physicians.Antithrombotic and thrombolytic therapy for ischemic stroke: American College of Chest Physicians Evidence‐Based Clinical Practice Guidelines (8th ed).Chest.2008;133(6 suppl):630S–669S.
- ,,,.Management of acute proximal deep vein thrombosis: pharmacoeconomic evaluation of outpatient treatment with enoxaparin vs inpatient treatment with unfractionated heparin.Chest.2002;122:108–114.
- ,.Economic evaluation of enoxaparin as prophylaxis against venous thromboembolism in seriously ill medical patients: a US perspective.Am J Manag Care.2002;8:1082–1088.
- ,,,.Cost effectiveness of thromboprophylaxis with a low‐molecular‐weight heparin versus unfractionated heparin in acutely ill medical inpatients.Am J Manag Care.2004;10:632–642.
- ,,, et al.Cost effectiveness of enoxaparin as prophylaxis against venous thromboembolic complications in acutely ill medical inpatients: modelling study from the hospital perspective in Germany.Pharmacoeconomics.2006;24:571–591.
- ,,,,.Hospital‐based costs associated with venous thromboembolism prophylaxis regimens.J Thromb Thrombolysis.2010;29:449–458.
- ,,, et al;for the ENDORSE Investigators.Venous thromboembolism risk and prophylaxis in the acute hospital care setting (ENDORSE study): a multinational cross‐sectional study.Lancet.2008;371:387–394.
- ,,, et al;for the IMPROVE Investigators.Venous thromboembolism prophylaxis in acutely ill hospitalized medical patients: findings from the International Medical Prevention Registry on Venous Thromboembolism.Chest.2007;132:936–945.
- United States Department of Health August 2008. Available at: http://www.ahrq.gov/qual/vtguide/. Accessed August 18,2010.
- ,,,.Enoxaparin versus unfractionated heparin in the prevention of venous thromboembolism after acute ischemic stroke: rationale, design, and methods of an open‐label, randomized, parallel‐group multicenter trial.J Stroke Cerebrovasc Dis.2005;14:95–100.
- ,,,,,.Association between asymptomatic deep vein thrombosis detected by venography and symptomatic venous thromboembolism in patients undergoing elective hip or knee surgery.J Thromb Haemost.2007;5:1438–1443.
- ,,, et al.Thromboprophylaxis in medically ill patients at risk for venous thromboembolism.Am J Health Syst Pharm.2006;63(20 suppl 6):S23–S29.
- ,,,.Comparison of the two‐year outcomes and costs of prophylaxis in medical patients at risk of venous thromboembolism.Thromb Haemost.2008;100:810–820.
- ,,,,,.Cost for inpatient care of venous thrombosis: a trial of enoxaparin vs standard heparin.Arch Intern Med.2000;160:3160–3165.
- ,,,.Economic evaluation of enoxaparin for the prevention of venous thromboembolism in acutely ill medical patients.Pharm World Sci.2004;26:214–220.
- ,,,,.Total hospital‐based costs of enoxaparin or fondaparinux prophylaxis in patients at risk of venous thromboembolism [abstract]. Presented at the Chest 2008 Annual Meeting; October 25–30,2008; Philadelphia, PA.
- ,,,,.Economic impact of enoxaparin after acute ischemic stroke based on PREVAIL.Clin Appl Thromb Hemost.2011;17:150–157.
Venous thromboembolism (VTE), which encompasses both deep‐vein thrombosis (DVT) and pulmonary embolism (PE), is a major health problem in the United States and worldwide. It represents one of the most significant causes of morbidity and mortality with an estimated 300,000 VTE‐related deaths,1 and 300,000‐600,000 hospitalizations in the United States annually.2 Hospitalization for medical illness is associated with a similar proportion of VTE cases as hospitalization for surgery.3 Several groups of medical patients have been shown to be at an increased risk of VTE, including those with cancer, severe respiratory disease, acute infectious illness, heart failure, myocardial infarction, and acute ischemic stroke.47 Ischemic stroke patients represent approximately 4.6% of medical patients at high risk of VTE in US hospitals.8 The incidence of DVT in such patients has been reported to be as high as 75%9 and PE has been reported to be responsible for up to 25% of early deaths after stroke.10
Several studies have demonstrated the efficacy of unfractionated heparin (UFH) or a low‐molecular‐weight heparin (LMWH) in the prevention of VTE in stroke patients, and have demonstrated that LMWHs are at least as effective as UFH.1114 The open‐label, randomized Prevention of VTE after acute ischemic stroke with LMWH and UFH (PREVAIL) trial demonstrated that in patients with acute ischemic stroke, prophylaxis for 10 days with the LMWH enoxaparin reduces the risk of VTE by 43% compared with UFH (10.2% vs 18.1%, respectively; relative risk = 0.57; 95% confidence interval [CI] = 0.44‐0.76; P = 0.0001) without increasing the incidence of overall bleeding events (7.9% vs 8.1%, respectively; P = 0.83), or the composite of symptomatic intracranial and major extracranial hemorrhage (1% in each group; P = 0.23). There was, however, a slight but significant increase in major extracranial hemorrhage alone with enoxaparin (1% vs 0%; P = 0.015).14 Evidence‐based guidelines from the American College of Chest Physicians (ACCP) provide recommendations for appropriate thromboprophylaxis regimens for patients at risk of VTE.15 Thromboprophylaxis with UFH, LMWH, and, more recently, fondaparinux is recommended for medical patients admitted to hospital with congestive heart failure or severe respiratory disease, or those who are confined to bed and have one or more additional risk factors, including active cancer, previous VTE, or acute neurologic disease.15 Similarly, in the Eighth ACCP Clinical Practice Guidelines, low‐dose UFH or LMWH are recommended for VTE prevention in patients with ischemic stroke who have restricted mobility.16
VTE is also associated with a substantial economic burden on the healthcare system, costing an estimated $1.5 billion annually in the United States.17 Thromboprophylaxis has been shown to be a cost‐effective strategy in hospitalized medical patients. Prophylaxis with a LMWH has been shown to be more cost‐effective than UFH in these patients.1821
However, despite the clinical and economic benefits, prophylaxis is still commonly underused in medical patients.22, 23 In surgical patients, the Surgical Care Improvement Project (SCIP) focuses on reducing surgical complications, and has endorsed 2 measures: VTE‐1, relating to the proportion of patients for whom VTE prophylaxis is ordered; and VTE‐2, relating to those who receive the recommended regimen (
The objective of the current study was to determine the economic impact, in terms of hospital costs, of enoxaparin compared with UFH for VTE prophylaxis after acute ischemic stroke. A decision‐analytic model was constructed using data from the PREVAIL study and historical inpatient data from a multi‐hospital database.
METHODS
In this study, the cost implications, from the hospital perspective, of VTE prophylaxis with enoxaparin or UFH in patients with acute ischemic stroke, were determined using a decision‐analytic model in TreeAge Pro Suite (TreeAge Software, Inc., Williamstown, MA, USA). The decision‐tree was based on 3 stages: (a) whether patients received enoxaparin or UFH; (b) how patients were classified according to their National Institutes of Health Stroke Scale (NIHSS) classification scores (<14 or 14); and (c) which clinical event each patient experienced, as defined per the PREVAIL trial (DVT, PE, intracranial hemorrhage, major extracranial hemorrhage, and minor extracranial hemorrhage) (Figure 1). The time horizon for the model was established at 90 days to mirror the length of follow‐up in the PREVAIL trial.
Total hospital costs were calculated based on clinical event rates (from the PREVAIL trial) and the costs of each clinical event, which were calculated separately according to the descriptions below, and then inserted into the decision‐analytic model. The clinical event rates were calculated from the efficacy and safety endpoints collected in the PREVAIL trial, and included VTE events (DVT and PE) and bleeding events (intracranial hemorrhage, major extracranial hemorrhage, and minor extracranial hemorrhage). Details of the patient population, eligibility criteria, and treatment regimen have previously been published in full elsewhere.14, 27
The costs of clinical events during hospitalization were estimated using a multivariate cost‐evaluation model, based on mean hospital costs for the events in the (Premier Inc., Charlotte, NC, USA) multi‐hospital database, one of the largest US hospital clinical and economic databases. The data are received from over 600 hospitals, representing all geographical areas of the United States, a broad range of bed sizes, teaching and non‐teaching, and urban and rural facilities. This database contains detailed US inpatient care records of principal and secondary diagnoses, inpatient procedures, administered laboratory tests, dispensed drugs, and demographic information. The evaluation of hospital cost for each type of clinical event was conducted by i3 Innovus (Ingenix, Inc., Eden Prairie, MN, USA). Total hospital costs were cumulative from all events, so if patients experienced multiple clinical events, the costs of the events were additive. The cost for stroke treatment and management was not included because it is an inclusion criterion of the PREVAIL trial and, thus, all patients in the trial have such costs.
Default drug costs were taken from the 2008 US wholesalers' acquisition cost data. The default dosing schedule is based on information extracted from the PREVAIL trial: enoxaparin 40 mg (once‐daily) and UFH 5000 U (twice‐daily) for 10 days each ($25.97 and $2.97, respectively). A drug‐administration fee was added for each dose of either enoxaparin or UFH ($10 for each).19
The estimated hospital cost of clinical events, along with drug costs, were inserted into the decision‐analytic model in TreeAge Pro Suite to estimate the cost per discharge from the hospital perspective in patients with ischemic stroke receiving VTE prophylaxis with enoxaparin or UFH. An additional analysis was performed to investigate the costs and cost differences in patients with less severe stroke (NIHSS scores <14) and more severe stroke (NIHSS scores 14).
Sensitivity analyses were performed to examine the impact of varying the cost inputs on the total hospital cost of each treatment arm by 5%, 10%, 15%, 20%, 30%, and 40%, and the robustness in the difference in costs between the enoxaparin and UFH groups. Univariate (via tornado diagram in TreeAge Pro Suite) and multivariate (via Monte Carlo simulation in TreeAge Pro Suite) analyses were performed. For the univariate analysis, each clinical event cost was adjusted individually, increasing or decreasing by 5%, 10%, 15%, 20%, 30% and 40% while other parameters remained unchanged. For the Monte Carlo simulation (TreeAge Pro Suite), all the parameters were simultaneously varied in a random fashion, within a range of 5%, 10%, 15%, 20%, 30%, and 40% over 10,000 trials. The simulation adopted a gamma distribution assumption for input sampling for cost parameters and a beta distribution for the event probability parameters. The confidence intervals for the probability parameters were obtained from the PREVAIL trial. The differences between the enoxaparin and UFH treatment groups were plotted in a graph against the variation in costs of each clinical event.
RESULTS
The clinical VTE and bleeding event rates as collected from the PREVAIL trial are shown in Table 1. The hospital costs per clinical event are shown in Table 2. The most costly clinical event from the hospital perspective was intracranial hemorrhage at $4001, followed by major extracranial hemorrhage at $3534. The costs of DVT and PE were $3003 and $2143, respectively.
| Event Rate | 95% CI | |
|---|---|---|
| ||
| Enoxaparin (NIHSS <14) | ||
| Deep‐vein thrombosis | 0.081 | 0.05730.1048 |
| Pulmonary embolism | 0.002 | 0.000050.011 |
| Intracranial hemorrhage | 0.0031 | 00.0074 |
| Major extracranial hemorrhage | 0.0047 | 00.0099 |
| Minor hemorrhage | 0.0372 | 0.0240.0549 |
| Enoxaparin (NIHSS 14) | ||
| Deep‐vein thrombosis | 0.1625 | 0.10530.2197 |
| Pulmonary embolism | 0 | 00 |
| Intracranial hemorrhage | 0.0086 | 00.0205 |
| Major extracranial hemorrhage | 0.0172 | 0.04660.1198 |
| Minor hemorrhage | 0.0776 | 0.04660.1198 |
| UFH (NIHSS <14) | ||
| Deep‐vein thrombosis | 0.1356 | 0.10540.1658 |
| Pulmonary embolism | 0.004 | 0.00050.0145 |
| Intracranial hemorrhage | 0.0032 | 00.0077 |
| Major extracranial hemorrhage | 0 | 00 |
| Minor hemorrhage | 0.0514 | 0.03550.0719 |
| UFH (NIHSS 14) | ||
| Deep‐vein thrombosis | 0.2914 | 0.22410.3588 |
| Pulmonary embolism | 0.0229 | 0.00630.0575 |
| Intracranial hemorrhage | 0.016 | 0.00040.0316 |
| Major extracranial hemorrhage | 0 | 00 |
| Minor hemorrhage | 0.064 | 0.0370.1019 |
| Event | Cost per Event ($)* | ||
|---|---|---|---|
| Likeliest | Minimum | Maximum | |
| |||
| Deep‐vein thrombosis | 3,003 | 2,402 | 3,604 |
| Pulmonary embolism | 2,143 | 1,714 | 2,572 |
| Intracranial hemorrhage | 4,001 | 3,201 | 4,801 |
| Major extracranial hemorrhage | 3,534 | 2,827 | 4,241 |
| Minor hemorrhage | 1,322 | 1,058 | 1,586 |
| Enoxaparin cost per dose | 26 | 21 | 31 |
| Unfractionated heparin cost per dose | 3 | 2 | 4 |
The average hospital cost with enoxaparin, when taking into account the costs of VTE and bleeding, was lower than with UFH ($422 vs $662, respectively), with a net savings of $240 per patient if enoxaparin was used. The average drug costs, including drug‐administration costs, were higher in the enoxaparin group ($360) compared with the UFH group ($259; difference $101). Nevertheless, the total hospital cost when clinical events and drug costs were considered together, was lower with enoxaparin than UFH. The total hospital costs per patient were $782 in patients receiving prophylaxis with enoxaparin and $922 in patients receiving UFH. Thus, enoxaparin was associated with a total cost‐savings of $140 per patient (Figure 2).
The cost estimates according to the stroke severity score (NIHSS scores <14 vs 14) are described in Table 3. The drug costs were consistent, regardless of stroke severity, for enoxaparin ($360) and for UFH ($259). However, in both treatment groups, the event costs were higher in patients with more severe stroke, compared with less severe stroke. For example, in the enoxaparin group, the event costs were $686 in patients with NIHSS scores 14 and $326 in patients with NIHSS scores <14. Nevertheless, the overall costs (event costs plus drug costs) were lower with enoxaparin compared with UFH, both in patients with less severe and more severe stroke. In fact, the total hospital cost‐savings were greater when enoxaparin was used instead of UFH in patients with more severe stroke (cost‐saving $287 if NIHSS score 14 vs $71 if NIHSS score <14) (Table 3).
| Enoxaparin ($) | UFH ($) | Difference ($ [UFHEnoxaparin]) | |
|---|---|---|---|
| |||
| NIHSS score <14 | |||
| Mean event costs per patient | 326 | 497 | 171 |
| Mean drug costs per patient* | 360 | 259 | 101 |
| Total costs | 685 | 756 | 71 |
| NIHSS score 14 | |||
| Mean event costs per patient | 686 | 1,073 | 387 |
| Mean drug costs per patient* | 360 | 259 | 101 |
| Total costs | 1,046 | 1,332 | 287 |
Multiple sensitivity analyses were performed. In the base case univariate sensitivity analysis, individual costs were adjusted by 20% (Table 4). If the cost of DVT increased by 20% (from $3003 to $3604) the difference between the enoxaparin and UFH groups was $187. When the cost of DVT was decreased by 20% to $2402, enoxaparin was still cost‐saving, with a difference of $94. For each of the individual cost parameters that were varied (DVT, PE, intracranial hemorrhage, major extracranial hemorrhage, and minor hemorrhage), enoxaparin was always less costly than UFH. Subsequent sensitivity analyses were performed (not shown) where cost parameters were varied by 5%, 10%, 15%, 30%, and 40%. Enoxaparin remained less costly than UFH in all cases.
| Event | Baseline Cost Input ($) | +20% Cost Input ($) | +20% Difference ($ [UFH Enoxaparin]) (% Change) | 20% Cost Input ($) | 20% Difference ($ [UFH Enoxaparin]) (% Change) |
|---|---|---|---|---|---|
| |||||
| Deep‐vein thrombosis | 3,003 | 3,604 | 187 (33) | 2,402 | 94 (33) |
| Pulmonary embolism | 2,143 | 2,572 | 144 (2.5) | 1,714 | 137 (2.5) |
| Intracranial hemorrhage | 4,001 | 4,801 | 142 (1.3) | 3,201 | 138 (1.3) |
| Major extracranial hemorrhage | 3,534 | 4,241 | 134 (4.0) | 2,827 | 146 (4.0) |
| Minor hemorrhage | 1,322 | 1,586 | 142 (1.3) | 1,058 | 138 (1.3) |
A multivariate analysis was performed using a Monte Carlo simulation in TreeAge Pro (Figure 3). When all parameters were varied simultaneously (by 5%, 10%, 15%, 20%, 30%, and 40%) and the differences in costs between the enoxaparin and UFH groups were measured and plotted, the mean (standard deviation) difference between enoxaparin and UFH prophylaxis was $140 ($79) (Figure 3). Figure 4 shows a graphical presentation of the sensitivity analysis results for event probabilities and costs. Differences in enoxaparin drug costs, hospital costs for DVT, and probability of DVT for patients on enoxaparin are the factors that have the greatest effect on the overall cost.
Finally, an additional scenario was performed using a published ratio of asymptomatic DVT to symptomatic VTE, due to the fact that not all VTE events in the real‐world present with symptoms prompting treatment. Quinlan et al. determined a ratio of asymptomatic DVT to symptomatic VTE of 5 for total hip replacement patients and of 21 for total knee replacement patients.28 Although derived from different patient populations who received different anticoagulants, we utilized the symptomatic event rates from the pooled studies to recalculate cost differences between enoxaparin and UFH in acute ischemic stroke. Using only symptomatic event rates, based on the 21:1 ratio in patients undergoing total knee replacement, the total cost for enoxaparin was $485 compared to $386 for UFH. Similar results were found based on the 5:1 ratio in patients with total hip replacement (enoxaparin $532 vs $472 for UFH). This was the only scenario where the higher drug cost of prophylaxis with enoxaparin was not completely offset by the reduction in events compared to UFH, likely due to the smaller difference in event rates once examining only symptomatic VTE.
DISCUSSION
This analysis demonstrates that, from the hospital perspective, enoxaparin 40 mg subcutaneously once‐daily is associated with lower total hospital costs and is more cost‐effective than twice‐daily UFH 5000 U subcutaneously for the prevention of VTE in patients with acute ischemic stroke. Despite higher drug‐acquisition costs, enoxaparin was associated with total cost‐savings of $140 per patient. This is due to the lower event rates with enoxaparin compared with UFH.
Previous studies, using hospital or payer information, have shown that VTE prophylaxis is more cost‐effective compared with no prophylaxis. In terms of the different VTE prophylaxis regimens, enoxaparin represents a more cost‐effective option in comparison with UFH19, 21, 2932 and also when compared with fondaparinux.21, 33 When comparing the results between different trials, it should be noted that previous analyses were mainly modeled on the Prophylaxis in Medical Patients with Enoxaparin (MEDENOX) study, which was performed in general medical patients and reported a VTE rate of 5.5%.6 However, patients with acute ischemic stroke are at a higher risk of VTE, with a 10% incidence of VTE reported in the PREVAIL study.14 Furthermore, twice‐daily rather than three‐timesdaily administration of UFH was used in the PREVAIL study, based on the current practice patterns seen during the PREVAIL trial design.
A recent retrospective analysis of transactional billing records demonstrated that, despite higher mean costs of anticoagulation therapy, the mean, total, adjusted direct hospital costs were lower with LMWH thromboprophylaxis compared with UFH ($7358 vs $8680, respectively; difference $1322; P < 0.001).21 A previous study by Burleigh and colleagues based on hospital discharge information extracted from both medical and surgical patients, has a sub‐analysis in patients with stroke. In these patients also, the total costs were lower for enoxaparin compared with UFH ($8608 vs $8911, respectively; difference $303).29 In the Burleigh study, drug costs and total discharge costs (eg, room and board, laboratory, and diagnostic imaging) were derived from drug charges and total charges, and were converted to estimated costs using cost‐to‐charge methods, so the absolute figures are not directly comparable with the current analysis.
This study adds to current literature by using data from a prospective study to analyze the hospital costs of VTE prophylaxis in stroke patients. The current study also provides a valuable cost‐analysis regarding a specific subgroup of medical patients at particularly high risk of VTE, and provides an economic comparison among stroke patients with NIHSS scores of <14 versus 14. In the PREVAIL study, despite a 2‐fold higher incidence of VTE in patients with more severe stroke (16.3% vs 8.3%), a similar reduction in VTE risk was observed with enoxaparin versus UFH in patients with NIHSS scores of 14 (odds ratio = 0.56; 95% CI = 0.37‐0.84; P = 0.0036) and <14 (odds ratio = 0.46; 95% CI = 0.27‐0.78; P = 0.0043).14 Enoxaparin was shown to be cost‐saving relative to UFH in both patient groups and, in particular, in patients with more severe stroke.
Potential limitations of the current analysis include the applicability of the figures obtained from the highly selected clinical trial population to real‐world clinical practice, and the fact that it is difficult to match cost estimates to trial data definitions. For example, this analysis was conducted with a comparator of twice‐daily UFH (as opposed to three‐timesdaily) which may be used in the real‐world setting and may have resulted in the increased number of events in the UFH group seen in the PREVAIL study. Due to a variety of differences between real‐world practice patterns and the PREVAIL clinical trial, we can only speculate as to the true cost‐consequences of utilizing enoxaparin versus UFH.
Furthermore, the original model did not include a sub‐analysis regarding the rates and, therefore, costs of proximal/symptomatic VTE. In the primary study of PREVAIL, the rates of symptomatic DVT were 1 in 666 patients (<1%) for enoxaparin and 4 in 669 patients (1%) for UFH, whereas the rates of proximal DVT were 30 in 666 patients (5%) and 64 in 669 patients (10%), respectively. Sensitivity analyses were performed to investigate the impact of lower rates of both DVT and PE (up to 40%), and the differences between groups were found to be robust. However, it is important to note that overall costs for both groups may have been increased through the inclusion of asymptomatic costs, with a more distinct separation of these costs making for a good follow‐up study. In a similar cost‐analysis we performed based on the PREVAIL study, which assessed the cost to the payer, we included an analysis of costs according to 3 different VTE definitions: the PREVAIL VTE definition (as in the current study); a definition of major VTE (PE, symptomatic DVT, and asymptomatic proximal DVT); and primary endpoints recommended by the European Medicines Agency Committee for Medicinal Products for Human Use for studies on VTE (proximal DVT, nonfatal PE, and all‐cause mortality). We found similar results irrespective of clinical event definitions.34 In an additional model scenario using a published ratio of asymptomatic DVT to symptomatic VTE,28 the higher drug cost of prophylaxis with enoxaparin was not completely offset by the reduction in events compared to UFH. This was likely due to the smaller difference in event rates once examining only symptomatic VTE. This scenario was limited by the fact that the ratio was derived from different patient populations receiving different anticoagulants than stroke patients.
In conclusion, data from this analysis adds to the evidence that, from the hospital perspective, the higher drug cost of enoxaparin is offset by the economic consequences of the events avoided as compared with UFH for the prevention of VTE following acute ischemic stroke, particularly in patients with severe stroke.
Acknowledgements
The authors thank Aylin Lee from I3 Innovus for her contribution to this study. The authors also acknowledge Min Chen for her assistance in statistical analysis, and Essy Mozaffari for his contribution to this study.
- .Venous thromboembolism: disease burden, outcomes and risk factors.J Thromb Haemost.2005;3:1611–1617.
- .The epidemiology of venous thromboembolism in the community: implications for prevention and management.J Thromb Thrombolysis.2006;21:23–29.
- ,,, et al.Relative impact of risk factors for deep vein thrombosis and pulmonary embolism: a population‐based study.Arch Intern Med.2002;162:1245–1248.
- ,,,,,.Risk factors for deep vein thrombosis and pulmonary embolism: a population‐based case‐control study.Arch Intern Med.2000;160:809–815.
- ,.A safety analysis of thromboprophylaxis in acute medical illness.Thromb Haemost.2003;89:590–591.
- ,,,,.Quantification of risk factors for venous thromboembolism: a preliminary study for the development of a risk assessment tool.Haematologica.2003;88:1410–1421.
- ,.Prevalence of venous thromboembolism in acute hemorrhagic and thromboembolic stroke.Am J Phys Med Rehabil.2003;82:364–369.
- ,,,.Thromboprophylaxis rates in US medical centers: success or failure?J Thromb Haemost.2007;5:1610–1616.
- ,,,.Complications after acute stroke.Stroke.1996;27:415–420.
- ,,,.Venous thromboembolism after acute stroke.Stroke.2001;32:262–267.
- ,,,,,.Enoxaparin vs heparin for prevention of deep‐vein thrombosis in acute ischaemic stroke: a randomized, double‐blind study.Acta Neurol Scand.2002;106:84–92.
- ,,.Low‐molecular‐weight heparins or heparinoids versus standard unfractionated heparin for acute ischaemic stroke.Cochrane Database Syst Rev.2008;(3):CD000119.
- ,,, et al;for the PROTECT Trial Group.Prophylaxis of thrombotic and embolic events in acute ischemic stroke with the low‐molecular‐weight heparin certoparin: results of the PROTECT Trial.Stroke.2006;37:139–144.
- ,,, et al;for the PREVAIL Investigators.The efficacy and safety of enoxaparin versus unfractionated heparin for the prevention of venous thromboembolism after acute ischaemic stroke (PREVAIL study): an open‐label randomised comparison.Lancet.2007;369:1347–1355.
- ,,, et al;for the American College of Chest Physicians.Prevention of venous thromboembolism: American College of Chest Physicians Evidence‐Based Clinical Practice Guidelines (8th ed).Chest.2008;133(6 suppl):381S–453S.
- ,,,,;for the American College of Chest Physicians.Antithrombotic and thrombolytic therapy for ischemic stroke: American College of Chest Physicians Evidence‐Based Clinical Practice Guidelines (8th ed).Chest.2008;133(6 suppl):630S–669S.
- ,,,.Management of acute proximal deep vein thrombosis: pharmacoeconomic evaluation of outpatient treatment with enoxaparin vs inpatient treatment with unfractionated heparin.Chest.2002;122:108–114.
- ,.Economic evaluation of enoxaparin as prophylaxis against venous thromboembolism in seriously ill medical patients: a US perspective.Am J Manag Care.2002;8:1082–1088.
- ,,,.Cost effectiveness of thromboprophylaxis with a low‐molecular‐weight heparin versus unfractionated heparin in acutely ill medical inpatients.Am J Manag Care.2004;10:632–642.
- ,,, et al.Cost effectiveness of enoxaparin as prophylaxis against venous thromboembolic complications in acutely ill medical inpatients: modelling study from the hospital perspective in Germany.Pharmacoeconomics.2006;24:571–591.
- ,,,,.Hospital‐based costs associated with venous thromboembolism prophylaxis regimens.J Thromb Thrombolysis.2010;29:449–458.
- ,,, et al;for the ENDORSE Investigators.Venous thromboembolism risk and prophylaxis in the acute hospital care setting (ENDORSE study): a multinational cross‐sectional study.Lancet.2008;371:387–394.
- ,,, et al;for the IMPROVE Investigators.Venous thromboembolism prophylaxis in acutely ill hospitalized medical patients: findings from the International Medical Prevention Registry on Venous Thromboembolism.Chest.2007;132:936–945.
- United States Department of Health August 2008. Available at: http://www.ahrq.gov/qual/vtguide/. Accessed August 18,2010.
- ,,,.Enoxaparin versus unfractionated heparin in the prevention of venous thromboembolism after acute ischemic stroke: rationale, design, and methods of an open‐label, randomized, parallel‐group multicenter trial.J Stroke Cerebrovasc Dis.2005;14:95–100.
- ,,,,,.Association between asymptomatic deep vein thrombosis detected by venography and symptomatic venous thromboembolism in patients undergoing elective hip or knee surgery.J Thromb Haemost.2007;5:1438–1443.
- ,,, et al.Thromboprophylaxis in medically ill patients at risk for venous thromboembolism.Am J Health Syst Pharm.2006;63(20 suppl 6):S23–S29.
- ,,,.Comparison of the two‐year outcomes and costs of prophylaxis in medical patients at risk of venous thromboembolism.Thromb Haemost.2008;100:810–820.
- ,,,,,.Cost for inpatient care of venous thrombosis: a trial of enoxaparin vs standard heparin.Arch Intern Med.2000;160:3160–3165.
- ,,,.Economic evaluation of enoxaparin for the prevention of venous thromboembolism in acutely ill medical patients.Pharm World Sci.2004;26:214–220.
- ,,,,.Total hospital‐based costs of enoxaparin or fondaparinux prophylaxis in patients at risk of venous thromboembolism [abstract]. Presented at the Chest 2008 Annual Meeting; October 25–30,2008; Philadelphia, PA.
- ,,,,.Economic impact of enoxaparin after acute ischemic stroke based on PREVAIL.Clin Appl Thromb Hemost.2011;17:150–157.
Copyright © 2011 Society of Hospital Medicine
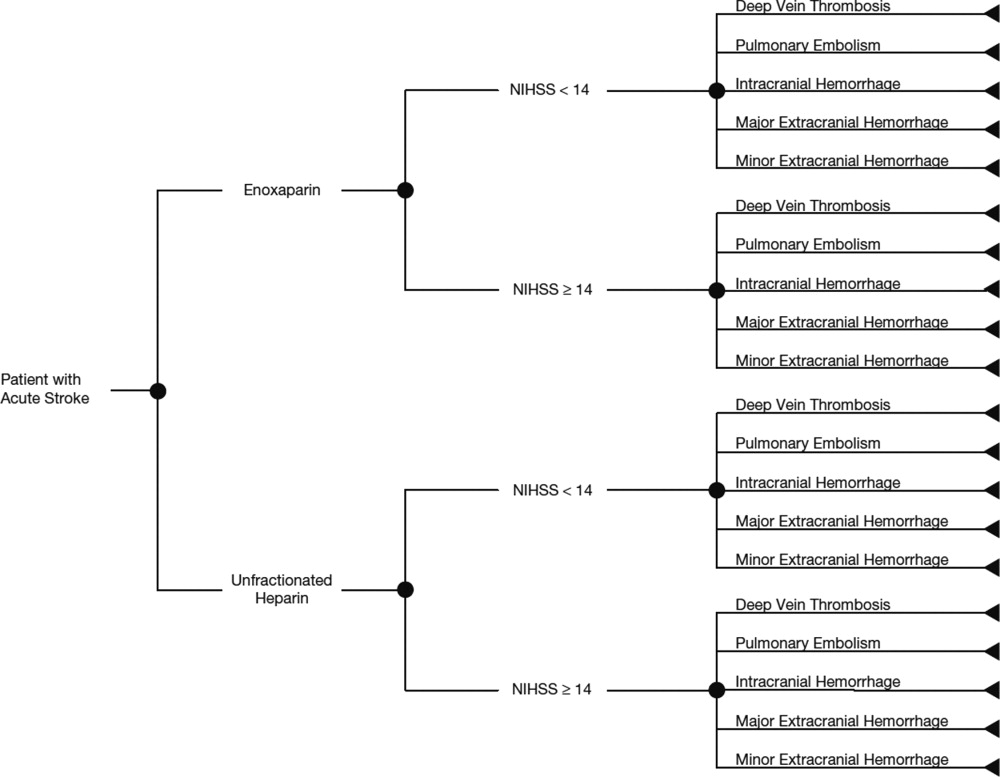
Chief Resident Year
Academic hospitalists have multiple duties including direct patient care, hospital management, teaching, and scholarly productivity. We are frequently pulled in divergent directions, while attending to these responsibilities. Without a framework to manage these assorted tasks, we are at risk of subpar performance and career dissatisfaction. Alternatively, we often thrive in our roles as utility players when armed with a developed skill set. Our profession could benefit greatly from encouraging future academic hospitalists to obtain further training prior to starting as an attending. Although hospital medicine fellowship training exists, there are still relatively few programs available. A well‐crafted year spent as a chief medical resident (CMR) may be a viable alternative.
My year as CMR allowed me to develop the skills necessary for success as an academic hospitalist in a supportive setting, and has given me an advantage in accelerating my career. This experience provided me with important tools that my initial 3 years of internal medicine residency did not. Even during my final year of residency, I was focused mostly on obtaining medical knowledge, learning its clinical applications, and honing team leadership skills. My mind rarely trespassed into the broader concerns of quality improvement initiatives, educational enhancements, or hospital management issues. Although the American College of Graduate Medical Education (ACGME) core competencies are helping to better focus residents' attention to these more diverse aspects of healthcare, residents still spend the majority of their time providing direct patient care.1 Now in my fourth year as an attending academic hospitalist, I continue to appreciate how my chief experience provided the foundation for much of the work I perform today.
My motivations for becoming a CMR included a desire to spend more time teaching and learning medicine, and an interest in helping to improve the residency program itself. I did not appreciate how much of the job would be spent managing people, and evaluating systems of care within the hospital, while working closely with nurses and hospital administrators. However, the skills I learned while addressing those unexpected tasks are what continue to help me in my position as a multifaceted hospitalist today. CMRs have been described as middle managers, being pushed and pulled by the demands and requirements of the groups above, below and around them.2 Academic hospitalists who frequently wear administrative and educational hats are not dissimilar. Retrospectively, I realize how fortunate I was to be exposed to those aspects as a CMR, with many of the same responsibilities but without the full expectations of a more seasoned attending.
The most memorable interaction during my first day as junior ward attending was with a revered internist, himself a former CMR, who dryly commented, So, you're pretending now. It took me a moment to catch his play on words until he clarified, you are now a pre‐attending. The true meaning of this was elucidated over the next several weeks as I was expected to perform many of the same duties of a seasoned attending, but often had the sense that I was only pretending to be an attending and still had much to learn.
CMR positions vary in terms of clinical, educational, and administrative responsibilities. Moreover, many institutions mix inpatient and outpatient roles. My position was focused almost entirely on inpatient duties at a single hospital, which gave me an in‐depth and longitudinal view of how a hospital is managed. Like many other CMRs, much of my time was spent on educational activities, such as running morning report, preparing for chief of medicine rounds, coordinating noon teaching conferences, and spending time with the medical students. Administrative tasks included various institutional‐based meetings for student grading, educational review committees, and program scheduling. In addition, I spent 1 month as junior attending on a ward team. Many other programs' CMRs spend more time as junior attending; however, by offloading some of this ward service requirement, I feel fortunate to have had that time to use for my own scholarly activity and teaching/administrative opportunities. Perhaps unique to my CMR position, I also was involved with the daily running of the hospital by working with administrators to evaluate patient transfer requests and addressing provider work flow issues. These additional tasks provided an invaluable learning experience.
Organizing morning report, running physical diagnosis rounds, and preparing cases and speakers for Chair's Rounds allowed me to hone and expand my teaching skills in ways that 3 years of residency did not. Moreover, it put me in direct contact with an energetic, inspiring group of learners that challenged me to solidify my own medical knowledge. (Try explaining the delta‐delta equation to figure out if there are 2 metabolic processes going on, in front of a group of 20 residents, and you'll discover what I mean.) I quickly learned that the one doing the talking is the one doing the learning and changed my teaching style to better facilitate student learning. My bedside learning was further augmented by attending Masters' Rounds to which I owe my ongoing interests in physical diagnosis. Masters Rounds were given once a week by 2 master clinicians. It was only for chief residents and was directed at teaching us how to teach others the art of bedside physical diagnosis. The majority of physical exam teaching points I focus on today come from those sessions.
As chief, I felt like I had the pulse of the hospital at all times. Most of my mornings were spent on the wards floating between teams. I owe thanks to my predecessor who told me that the true sign of a good CMR was to never sit long enough in your chair to let it get warm. My office was located on the wards, between a team room and a double patient room. Aside from times when I was having confidential conversations with residents, the door was open. Nurses looking to vent, phlebotomists wanting to sit down, and attendings needing a break from their teams to get work done were common visitors. Administrative personnel were also frequent visitors, usually requesting me to disseminate new policies to the residents. Because of this, I learned to understand and better interact with the diverse group of people responsible for making a teaching hospital function. These are the same constituencies that I now sit down with on various committees to attempt to make my present hospital operate more smoothly.
Despite running morning report, attending rounds with teams, and developing plans for better patient flow, I had time for scholarly work and found easy mentorship. I was able to revive 2 projects I had started as a resident and bring them close to conclusion under the continued mentorship of my coinvestigators. Offers for career skill development were also abound, and I benefited greatly from one associate director's tutorials on preparing effective PowerPoint presentations. Another attending mentored me in student feedback skills, which have allowed me to become a much more effective educator. I was also able to model that mentorship and begin to build my own mentor relationships with my students. In fact, this mentorship has become one of the most fulfilling aspects of my job. I was fortunate to have that mentorship early on in my career, as similar mentorship becomes difficult to obtain once in an attending hospitalist position.3
In conclusion, although current internal medicine residency training provides intensive direct patient care experiences, it only allows glimpses into the other aspects of an academic hospitalist's job. Unfortunately, it does not adequately prepare one to begin this type of position with a full complement of skills. Only a minority of hospitalists pursue additional structured training directly after residency; the majority jump into hospitalist positions and opt for on‐the‐job training. While there is an early economic advantage to starting an attending position without delay, I believe that the skills learned during an additional year of dedicated training allow for a more meaningful work experience and, ultimately, a faster rise within the track of an academic hospitalist.
The tasks that residency programs and hospitals may give to CMRs provide fertile material for developing the skills necessary to become a productive academic hospitalist. I thrived on the multifaceted work of caring for a diverse group of patients, teaching different levels of learners, helping to manage various hospital systems, and better understanding the hospital as the sum of its parts. As noted above, this pre‐attending league gave me the exposure to more fully develop my academic hospitalist game in a supportive environment. A CMR year may be beneficial for residents entering any career in internal medicine; however, I believe it is most aptly suited as a stepping stone for future academic hospitalists. I strongly recommend that current residents interested in academic hospital medicine consider a CMR position, and encourage program directors to consider molding their inpatient CMR experiences to facilitate this. Moreover, unless fellowship training in hospital medicine becomes the norm, I propose that current academic hospitalists do more to closely court and usher these pretenders into our ranks.
- ,,,,.A systems approach for implementing practice‐based learning and improvement and systems‐based practice in graduate medical education.Acad Med.2009;84(3):335–339.
- ,.Middle manager role of the chief medical resident: an organizational psychologist's perspective.J Gen Intern Med.2007;22(12):1771–1774.
- ,,,.Survey of US academic hospitalist leaders about mentorship and academic activities in hospitalist groups.J Hosp Med.2011;6:5–9.
Academic hospitalists have multiple duties including direct patient care, hospital management, teaching, and scholarly productivity. We are frequently pulled in divergent directions, while attending to these responsibilities. Without a framework to manage these assorted tasks, we are at risk of subpar performance and career dissatisfaction. Alternatively, we often thrive in our roles as utility players when armed with a developed skill set. Our profession could benefit greatly from encouraging future academic hospitalists to obtain further training prior to starting as an attending. Although hospital medicine fellowship training exists, there are still relatively few programs available. A well‐crafted year spent as a chief medical resident (CMR) may be a viable alternative.
My year as CMR allowed me to develop the skills necessary for success as an academic hospitalist in a supportive setting, and has given me an advantage in accelerating my career. This experience provided me with important tools that my initial 3 years of internal medicine residency did not. Even during my final year of residency, I was focused mostly on obtaining medical knowledge, learning its clinical applications, and honing team leadership skills. My mind rarely trespassed into the broader concerns of quality improvement initiatives, educational enhancements, or hospital management issues. Although the American College of Graduate Medical Education (ACGME) core competencies are helping to better focus residents' attention to these more diverse aspects of healthcare, residents still spend the majority of their time providing direct patient care.1 Now in my fourth year as an attending academic hospitalist, I continue to appreciate how my chief experience provided the foundation for much of the work I perform today.
My motivations for becoming a CMR included a desire to spend more time teaching and learning medicine, and an interest in helping to improve the residency program itself. I did not appreciate how much of the job would be spent managing people, and evaluating systems of care within the hospital, while working closely with nurses and hospital administrators. However, the skills I learned while addressing those unexpected tasks are what continue to help me in my position as a multifaceted hospitalist today. CMRs have been described as middle managers, being pushed and pulled by the demands and requirements of the groups above, below and around them.2 Academic hospitalists who frequently wear administrative and educational hats are not dissimilar. Retrospectively, I realize how fortunate I was to be exposed to those aspects as a CMR, with many of the same responsibilities but without the full expectations of a more seasoned attending.
The most memorable interaction during my first day as junior ward attending was with a revered internist, himself a former CMR, who dryly commented, So, you're pretending now. It took me a moment to catch his play on words until he clarified, you are now a pre‐attending. The true meaning of this was elucidated over the next several weeks as I was expected to perform many of the same duties of a seasoned attending, but often had the sense that I was only pretending to be an attending and still had much to learn.
CMR positions vary in terms of clinical, educational, and administrative responsibilities. Moreover, many institutions mix inpatient and outpatient roles. My position was focused almost entirely on inpatient duties at a single hospital, which gave me an in‐depth and longitudinal view of how a hospital is managed. Like many other CMRs, much of my time was spent on educational activities, such as running morning report, preparing for chief of medicine rounds, coordinating noon teaching conferences, and spending time with the medical students. Administrative tasks included various institutional‐based meetings for student grading, educational review committees, and program scheduling. In addition, I spent 1 month as junior attending on a ward team. Many other programs' CMRs spend more time as junior attending; however, by offloading some of this ward service requirement, I feel fortunate to have had that time to use for my own scholarly activity and teaching/administrative opportunities. Perhaps unique to my CMR position, I also was involved with the daily running of the hospital by working with administrators to evaluate patient transfer requests and addressing provider work flow issues. These additional tasks provided an invaluable learning experience.
Organizing morning report, running physical diagnosis rounds, and preparing cases and speakers for Chair's Rounds allowed me to hone and expand my teaching skills in ways that 3 years of residency did not. Moreover, it put me in direct contact with an energetic, inspiring group of learners that challenged me to solidify my own medical knowledge. (Try explaining the delta‐delta equation to figure out if there are 2 metabolic processes going on, in front of a group of 20 residents, and you'll discover what I mean.) I quickly learned that the one doing the talking is the one doing the learning and changed my teaching style to better facilitate student learning. My bedside learning was further augmented by attending Masters' Rounds to which I owe my ongoing interests in physical diagnosis. Masters Rounds were given once a week by 2 master clinicians. It was only for chief residents and was directed at teaching us how to teach others the art of bedside physical diagnosis. The majority of physical exam teaching points I focus on today come from those sessions.
As chief, I felt like I had the pulse of the hospital at all times. Most of my mornings were spent on the wards floating between teams. I owe thanks to my predecessor who told me that the true sign of a good CMR was to never sit long enough in your chair to let it get warm. My office was located on the wards, between a team room and a double patient room. Aside from times when I was having confidential conversations with residents, the door was open. Nurses looking to vent, phlebotomists wanting to sit down, and attendings needing a break from their teams to get work done were common visitors. Administrative personnel were also frequent visitors, usually requesting me to disseminate new policies to the residents. Because of this, I learned to understand and better interact with the diverse group of people responsible for making a teaching hospital function. These are the same constituencies that I now sit down with on various committees to attempt to make my present hospital operate more smoothly.
Despite running morning report, attending rounds with teams, and developing plans for better patient flow, I had time for scholarly work and found easy mentorship. I was able to revive 2 projects I had started as a resident and bring them close to conclusion under the continued mentorship of my coinvestigators. Offers for career skill development were also abound, and I benefited greatly from one associate director's tutorials on preparing effective PowerPoint presentations. Another attending mentored me in student feedback skills, which have allowed me to become a much more effective educator. I was also able to model that mentorship and begin to build my own mentor relationships with my students. In fact, this mentorship has become one of the most fulfilling aspects of my job. I was fortunate to have that mentorship early on in my career, as similar mentorship becomes difficult to obtain once in an attending hospitalist position.3
In conclusion, although current internal medicine residency training provides intensive direct patient care experiences, it only allows glimpses into the other aspects of an academic hospitalist's job. Unfortunately, it does not adequately prepare one to begin this type of position with a full complement of skills. Only a minority of hospitalists pursue additional structured training directly after residency; the majority jump into hospitalist positions and opt for on‐the‐job training. While there is an early economic advantage to starting an attending position without delay, I believe that the skills learned during an additional year of dedicated training allow for a more meaningful work experience and, ultimately, a faster rise within the track of an academic hospitalist.
The tasks that residency programs and hospitals may give to CMRs provide fertile material for developing the skills necessary to become a productive academic hospitalist. I thrived on the multifaceted work of caring for a diverse group of patients, teaching different levels of learners, helping to manage various hospital systems, and better understanding the hospital as the sum of its parts. As noted above, this pre‐attending league gave me the exposure to more fully develop my academic hospitalist game in a supportive environment. A CMR year may be beneficial for residents entering any career in internal medicine; however, I believe it is most aptly suited as a stepping stone for future academic hospitalists. I strongly recommend that current residents interested in academic hospital medicine consider a CMR position, and encourage program directors to consider molding their inpatient CMR experiences to facilitate this. Moreover, unless fellowship training in hospital medicine becomes the norm, I propose that current academic hospitalists do more to closely court and usher these pretenders into our ranks.
- ,,,,.A systems approach for implementing practice‐based learning and improvement and systems‐based practice in graduate medical education.Acad Med.2009;84(3):335–339.
- ,.Middle manager role of the chief medical resident: an organizational psychologist's perspective.J Gen Intern Med.2007;22(12):1771–1774.
- ,,,.Survey of US academic hospitalist leaders about mentorship and academic activities in hospitalist groups.J Hosp Med.2011;6:5–9.
New Jersey Hospital Funds Care-Transitions “Coach”
Robert Wood Johnson University Hospital in Hamilton, N.J., has partnered with Jewish Family and Children’s Services of Greater Mercer County to support care transitions for 350 chronically ill older patients. Patients will receive a transitions coach following hospital discharge for education, support, and encouragement to keep appointments with their physicians. This “coach” will develop a plan of care for the patient, making one hospital visit, one home visit, and three phone calls, says Joyce Schwarz, the hospital’s vice president of quality and the project’s director.
The hospital received a $300,000 grant under the New Jersey Health Initiative from the Robert Wood Johnson Foundation to use an evidence-based intervention to improve care transitions and reduce readmissions, acting as a bridge between hospital personnel and community physicians.
‘Smoothing’ Strategies in Children’s Hospitals Reduce Overcrowding
A report published online May 24 in the Journal of Hospital Medicine found that smoothing inpatient occupancy and scheduled admissions in 39 children’s hospitals helped reduce midweek overcrowding. Evan S. Fieldston, MD, MBA, MSHP, of the University of Pennsylvania School of Medicine in Philadelphia and colleagues previously demonstrated occupancy variability and midweek crowding weekends (J Hosp Med. 2011;6:81-87). Strategies the team studied included controlling admissions when possible to achieve more level occupancy, with a mean of 2.6% of admissions moved to a different day of the week.
A report published online May 24 in the Journal of Hospital Medicine found that smoothing inpatient occupancy and scheduled admissions in 39 children’s hospitals helped reduce midweek overcrowding. Evan S. Fieldston, MD, MBA, MSHP, of the University of Pennsylvania School of Medicine in Philadelphia and colleagues previously demonstrated occupancy variability and midweek crowding weekends (J Hosp Med. 2011;6:81-87). Strategies the team studied included controlling admissions when possible to achieve more level occupancy, with a mean of 2.6% of admissions moved to a different day of the week.
A report published online May 24 in the Journal of Hospital Medicine found that smoothing inpatient occupancy and scheduled admissions in 39 children’s hospitals helped reduce midweek overcrowding. Evan S. Fieldston, MD, MBA, MSHP, of the University of Pennsylvania School of Medicine in Philadelphia and colleagues previously demonstrated occupancy variability and midweek crowding weekends (J Hosp Med. 2011;6:81-87). Strategies the team studied included controlling admissions when possible to achieve more level occupancy, with a mean of 2.6% of admissions moved to a different day of the week.
By the numbers - 0.5%
The reduction President Obama has proposed to a formula used by the Independent Payment Advisory Board (IPAB), created last year by the Affordable Care Act to cut Medicare costs without affecting quality. The formula IPAB currently uses as a baseline for growth estimates is GDP per capita, plus 1%. The president has proposed to reduce that figure to GDP plus 0.5%. The lower threshold means IPAB will have deeper cuts to make. Accordingly, hospitalists are watching the proposal, as it could lower federal reimbursements as IPAB looks for ways to cut Medicare spending
The reduction President Obama has proposed to a formula used by the Independent Payment Advisory Board (IPAB), created last year by the Affordable Care Act to cut Medicare costs without affecting quality. The formula IPAB currently uses as a baseline for growth estimates is GDP per capita, plus 1%. The president has proposed to reduce that figure to GDP plus 0.5%. The lower threshold means IPAB will have deeper cuts to make. Accordingly, hospitalists are watching the proposal, as it could lower federal reimbursements as IPAB looks for ways to cut Medicare spending
The reduction President Obama has proposed to a formula used by the Independent Payment Advisory Board (IPAB), created last year by the Affordable Care Act to cut Medicare costs without affecting quality. The formula IPAB currently uses as a baseline for growth estimates is GDP per capita, plus 1%. The president has proposed to reduce that figure to GDP plus 0.5%. The lower threshold means IPAB will have deeper cuts to make. Accordingly, hospitalists are watching the proposal, as it could lower federal reimbursements as IPAB looks for ways to cut Medicare spending