User login
What Is the Best Approach for the Evaluation and Management of Endocrine Incidentalomas?
Case
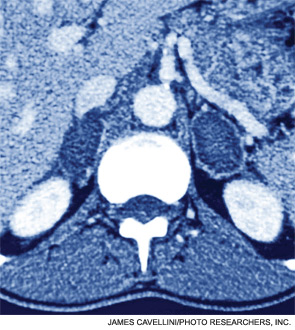
A 54-year-old man with a history of hypertension treated with hydrocholorothiazide and Type 2 diabetes mellitus is admitted with abdominal pain and found to have an incidental 2.1-cm left adrenal mass on CT scan of the abdomen. He denies symptoms of headache, palpitations, weight gain, or muscle weakness. His exam is significant for mildly elevated blood pressure. What is the best approach for evaluation and management of this incidental finding?
Overview
Incidentalomas are mass lesions that are inadvertently discovered during radiolographic diagnostic testing or treatment for other clinical conditions that are unrelated to the incidental mass. In recent decades, improvements in radiographic diagnostic techniques and sensitivity have led to increasing discovery of incidental lesions that are often in the absence of clinical signs or symptoms.1 Three commonly discovered lesions by hospitalists are pituitary, thyroid, and adrenal incidentalomas.2 The concerns associated with these findings relate to the potential for dysfunctional hormone secretion or malignancy.
Patients found with pituitary incidentalomas can be susceptible to several types of adverse outcomes: hormonal hypersecretion, hypopituitarism, neurologic morbidity due to tumor size, and malignancy in rare cases. Thyroid incidentalomas are impalpable nodules discovered in the setting of ultrasound or cross-sectional neck scans, such as positron emission tomography (PET) scans. Discovery of a thyroid incidentaloma raises concern for thyroid malignancy.3 The increased use of abdominal ultrasound, CT scans, and MRI has fueled the growing incidence of adrenal incidentalomas (AIs).
The discovery of an endocrine incidentaloma in the inpatient setting warrants a systematic approach that includes both diagnostic and potentially therapeutic management. A hospitalist should consider an approach that includes (see Table 1):
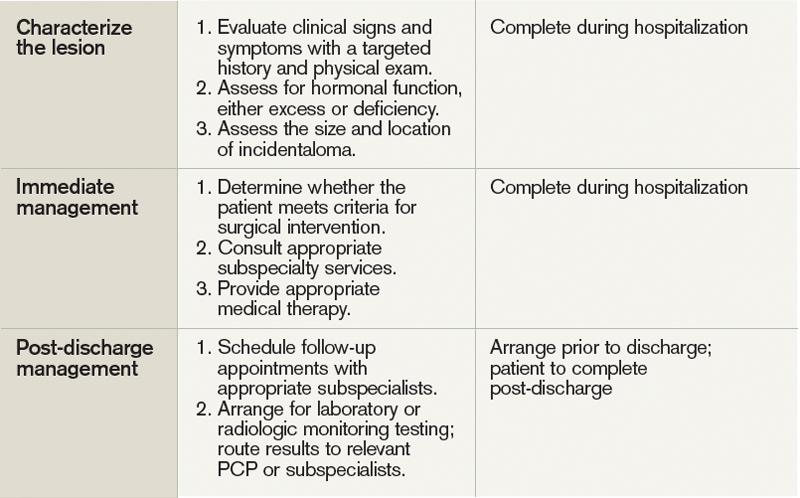
- Characterization of the incidentaloma, including clinical signs and symptoms, size, hormonal function, and malignant potential;
- Immediate management, including medical versus surgical treatment; and
- Post-discharge management, including monitoring.
Review of the Data
Pituitary incidentalomas. The prevalence of pituitary incidentalomas found by CT ranges from 3.7% to 20%, while the prevalence found by MRI approximates 10%. Autopsy studies have revealed a prevalence ranging from 1.5% to 26.7% for adenomas less than 10 mm, considered to be microadenomas. Broad categories of etiologies should be considered: pituitary adenoma, nonpituitary tumors, vascular lesions, infiltrative disorders, and others (see Table 2). The majority of pituitary adenomas secrete prolactin (30% to 40%) or are nonsecreting (30% to 40%). Adenomas secreting adrenocorticotropin hormone (ACTH, 2% to 10%), growth hormone (GH, 2% to 10%), thyroid-stimulating hormone (TSH, <1%), follicle-stimulating hormone (FSH), and luteinizing hormone (LH) are much less common.2 Significant morbidity and premature mortality are associated with hyperprolactinemia, acromegaly (growth hormone excess), Cushing’s syndrome, and hyperthyroidism. Additionally, up to 41% of patients with macroadenomas were found to have varying degrees of hypopituitarism due to compression of the hypothalamus, the hypothalamic-pituitary stalk, or the pituitary itself.4
Recently, the Endocrine Society released consensus recommendations to guide the evaluation and treatment of pituitary incidentalomas, which are included in the approach outlined below.5 A detailed history and physical examination should be obtained with specific inquiry as to signs and symptoms of hormonal excess and mass effect from the tumor. Examples of symptoms of hormone excess can include:
- Prolactin: menstrual irregularity, anovulation, infertility, decreased libido, impotence, osteoporosis;
- Growth hormone: high frequency of colonic polyps and colon cancer (chronic excess);
- TSH: thyrotoxicosis, atrial fibrillation; and
- ACTH: hypertension, osteoporosis, accelerated vascular disease.
Symptoms related to the mass effect of the tumor include visual field defects and hypopituitarism related to the deficient hormone, including:
- FSH/LH: oligomenorrhea, decreased libido, infertility;
- TSH: hypothyroidism (weight gain, constipation, cold intolerance);
- ACTH: adrenal insufficiency (hypotension, hypoglycemia, weight loss); and
- ADH: polyuria, polydypsia.
The size and location of the pituitary lesion must be assessed. Lesions greater than 10 mm are considered macroademonas, and their size will affect their management. If the lesion was initially identified by CT scan, an MRI is recommended to better evaluate it.5 If the MRI locates the incidentaloma abutting the optic nerve or chiasm, then the patient should undergo a formal visual field examination.
Indications for an inpatient surgical referral for treatment include: a lesion larger than 2 cm, evidence of mass effect such as visual field defects, neurologic compromise, opthalmoplegia, hypopituitarism, a tumor abutting the optic nerve or chiasm, pituitary apoplexy, and hypersecretion of hormones other than prolactin. Patients with prolactinomas warrant an inpatient endo-crinology consult and may need medical management with a dopamine agonist. Hormone replacement therapy can also be provided for patients with hypopituitarism.2,5
For patients who do not meet the criteria for inpatient surgical therapy, follow-up management must be arranged at the time of discharge. Clinical, laboratory assessment, and an MRI should be scheduled six months after the initial finding of the incidentaloma with the patient’s PCP or with an endocrinologist.5
Thyroid incidentalomas. The prevalence of thyroid nodules based on ultrasound studies ranges from 19% to 46%, with autopsy studies estimating an incidence of approximately 50%.2,6 Incidence of thyroid nodules also increases with age, as almost 60% of people over the age of 60 harbor a thyroid incidentaloma. The rate of malignancy in the general population has ranged between 8% and 24%; however, in the last decade, the rates have increased by 2.4 times as more sophisticated ultrasound techniques and liberal use of fine-needle aspiration (FNA) biopsies have detected subclinical disease.7,8
Etiologies for incidental thyroid nodules can be divided into benign and malignant causes. Benign etiologies include thyroid cyst (simple or complex), multinodular goiter, and Hashimoto’s thryoiditis, while malignant causes include papillary, medullary, follicular, Hurthle cell, and anaplastic carcinomas, thyroid lymphomas, and rare instances of metastatic cancers.2,3
Targeted history and physical examination helps to characterize the thyroid incidentaloma. Historical features, such as palpitations, weight loss, anxiety, new onset atrial fibrillation, or menstrual irregularities, coupled with tachycardia, tremors, proximal muscle weakness, and a palpable nodule aid in the diagnosis of hyperthyroidism. Findings such as a family history of thyroid cancer, symptoms of hoarseness or dysphagia, rapid growth of the nodule, environmental or history of head or neck irradiation along with physical findings of a hard, fixed nodule, or cervical lymphadenopathy increase the suspicion for malignancy.2,7
The functionality of the nodule can be assessed by checking TSH, free T3, and free T4 levels. Suppression of TSH (< 0.1 mU/L) with elevated levels of free T3 and T4 indicates nodule production of excess thyroid hormone and warrants thyroid scintography. Thyroid scintography will identify the nodule as “hot” (hyperfunctioning) or “cold” (nonfunctioning).2
Regardless of the radiographic modality that initially identified the thyroid incidentaloma, a dedicated thyroid high-resolution ultrasound should be ordered to assess the size, multiplicity (single or multinodular), location, and character (solid, cystic, or mixed).7
Recommendations for proceeding to FNA to evaluate for malignancy differ among subspecialty societies. Generally, nodules larger than 1 cm or nodules smaller than 1 cm with risk factors for malignancy should be referred for FNA.2,7
If diagnostic workup identifies a patient with hyperthyroidism due to an autonomously functional nodule or a nodule that may be at high risk for malignancy, it is appropriate to involve an endocrinologist and possibly a surgical subspecialist prior to discharge. Management of hyperthyroidism can include starting antithyroid agents (methimazole or propylthiouracil), radioactive iodine ablation, or referral for surgery.
Preparation for discharge of the patient whose incidentaloma is nonfunctional or does not appear to be malignant should include appointments to recheck thyroid hormone levels, including TSH as well as a thyroid ultrasound within one year of the initial discovery.
Adrenal incidentaloma. The prevalence of AIs found by CT of the abdomen ranges from 0.4% to 4%, while autopsy studies have found a prevalence of 1.4% to 9% with increasing prevalence with age.2,9,10 The majority of AIs are benign and nonfunctioning adenomas, in the absence of known malignancy. Other differential diagnoses include Cushing’s syndrome, pheochromocytoma, adrenocortical adenoma, aldosteronoma, and metastatic lesions.
Because functioning adrenal incidentalomas may be clinically silent, any patient found with an AI must undergo biochemical workup as part of their evaluation to assess for pheochromocytoma, Cushing’s syndrome, and if he or she has a history of hypertension or hyperaldosteronism (Conn’s syndrome). Table 3 outlines the approach for characterizing adrenal incidentalomas.2,11,12 An important point is that imaging studies are not useful in distinguishing a functioning versus nonfunctioning tumor but rather can help to discriminate malignant lesions.11
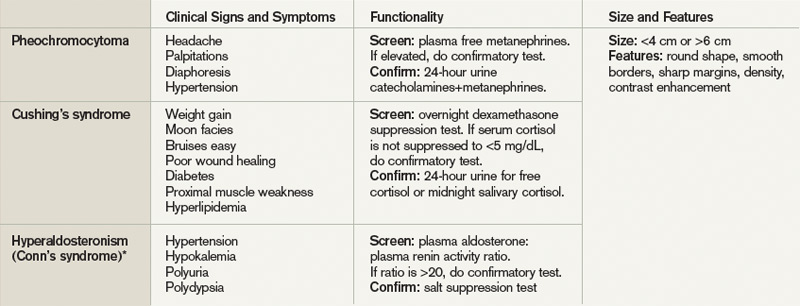
Inpatient surgical consult for resection is indicated if the patient is found to have pheochromocytoma, clinically apparent functioning adrenocortical adenoma, or a tumor size greater than 4 cm. Consultation with an endocrinologist is also recommended if biochemical tests are positive. If the diagnostic workup leads to suspicion for infection or metastatic disease, the patient should be referred for FNA.2,12
For patients whose lesions do not require surgical resection, repeat CT scan of the abdomen is recommended six months from the initial finding. Hospitalists should also arrange for the patient to repeat biochemical testing, including an overnight dexamethasone test.12,13
Back to the Case
The patient underwent biochemical testing and was found to have normal levels of plasma-free metanephrines, a plasma aldosterone, plasma renin activity ratio less than 20, and a serum cortisol level of 7 mg/dL after his overnight dexamethasone suppression test. The 24-hour urine collection for free cortisol revealed elevated levels of cortisol in the urine, and the ACTH level was low.
Endocrinology and endocrine surgery teams were consulted, and recommended surgical resection. After surgical resection of his tumor, the patient was started on glucocorticoid replacement and was discharged with a follow-up appointment with endocrinology.
Bottom Line
An inpatient approach to endocrine incidentalomas should include characterization of the clinical signs and symptoms, size, function, and malignant potential of the lesion. Based on this, inpatient surgical or medical management can be determined. Post-discharge management should include arrangements for surveillance testing and follow-up with appropriate subspecialists.
Dr. Tad-y is assistant professor of medicine and a hospitalist at the University of Colorado Denver.
References
- Aron DC, Howlett TA. Pituitary incidentalomas. Endocrinol Metab Clin North Am. 2000;29:205-221.
- Shirodkar M, Jabbour SA. Endocrine incidentalomas. Int J Clin Pract. 2008;62:1423-1431.
- Burguera B, Gharib H. Thyroid incidentalomas. Prevalence, diagnosis, significance, and management. Endocrinol Metab Clin North Am. 2000;29:187-203.
- Molitch ME. Nonfunctioning pituitary tumors and pituitary incidentalomas. Endocrinol Metab Clin North Am. 2008;37:151-171, xi.
- Freda PU, Beckers AM, Katznelson L, et al. Pituitary incidentaloma: an endocrine society clinical practice guideline. J Clin Endocrinol Metab. 2011;96:894-904.
- Gough J, Scott-Coombes D, Fausto Palazzo F. Thyroid incidentaloma: an evidence-based assessment of management strategy. World J Surg. 2008;32:1264-1268.
- Iyer NG, Shaha AR, Silver CE, et al. Thyroid incidentalomas: to treat or not to treat. Eur Arch Otorhinolaryngol. 2010;267:1019-1026.
- Jin J, Wilhelm SM, McHenry CR. Incidental thyroid nodule: patterns of diagnosis and rate of malignancy. Am J Surg. 2009;197:320-324.
- Davenport C, Liew L, Doherty B, et al. The prevalence of adrenal incidentaloma in routine clinical practice. Endocrine. 2011;40:80-83.
- Zeiger MA, Siegelman SS, Hamrahian AH. Medical and surgical evaluation and treatment of adrenal incidentalomas. J Clin Endocrinol Metab. 2011;96: 2004-2015.
- Zeiger MA, Thompson GB, Duh QY, et al. American Association of Clinical Endocrinologists and American Association of Endocrine Surgeons Medical Guidelines for the Management of Adrenal Incidentalomas: executive summary of recommendations. Endocr Pract. 2009;15:450-453.
- NIH state-of-the-science statement on management of the clinically inapparent adrenal mass (“incidentaloma”). NIH Consens State Sci Statements. 2002;19:1-25.
- Young WF. Clinical practice. The incidentally discovered adrenal mass. N Engl J Med. 2007;356:601-610.
- Chidiac RM, Aron DC. Incidentalomas. A disease of modern technology. Endocrinol Metab Clin North Am. 1997;26:233-253.
Case
A 54-year-old man with a history of hypertension treated with hydrocholorothiazide and Type 2 diabetes mellitus is admitted with abdominal pain and found to have an incidental 2.1-cm left adrenal mass on CT scan of the abdomen. He denies symptoms of headache, palpitations, weight gain, or muscle weakness. His exam is significant for mildly elevated blood pressure. What is the best approach for evaluation and management of this incidental finding?
Overview
Incidentalomas are mass lesions that are inadvertently discovered during radiolographic diagnostic testing or treatment for other clinical conditions that are unrelated to the incidental mass. In recent decades, improvements in radiographic diagnostic techniques and sensitivity have led to increasing discovery of incidental lesions that are often in the absence of clinical signs or symptoms.1 Three commonly discovered lesions by hospitalists are pituitary, thyroid, and adrenal incidentalomas.2 The concerns associated with these findings relate to the potential for dysfunctional hormone secretion or malignancy.
Patients found with pituitary incidentalomas can be susceptible to several types of adverse outcomes: hormonal hypersecretion, hypopituitarism, neurologic morbidity due to tumor size, and malignancy in rare cases. Thyroid incidentalomas are impalpable nodules discovered in the setting of ultrasound or cross-sectional neck scans, such as positron emission tomography (PET) scans. Discovery of a thyroid incidentaloma raises concern for thyroid malignancy.3 The increased use of abdominal ultrasound, CT scans, and MRI has fueled the growing incidence of adrenal incidentalomas (AIs).
The discovery of an endocrine incidentaloma in the inpatient setting warrants a systematic approach that includes both diagnostic and potentially therapeutic management. A hospitalist should consider an approach that includes (see Table 1):
- Characterization of the incidentaloma, including clinical signs and symptoms, size, hormonal function, and malignant potential;
- Immediate management, including medical versus surgical treatment; and
- Post-discharge management, including monitoring.
Review of the Data
Pituitary incidentalomas. The prevalence of pituitary incidentalomas found by CT ranges from 3.7% to 20%, while the prevalence found by MRI approximates 10%. Autopsy studies have revealed a prevalence ranging from 1.5% to 26.7% for adenomas less than 10 mm, considered to be microadenomas. Broad categories of etiologies should be considered: pituitary adenoma, nonpituitary tumors, vascular lesions, infiltrative disorders, and others (see Table 2). The majority of pituitary adenomas secrete prolactin (30% to 40%) or are nonsecreting (30% to 40%). Adenomas secreting adrenocorticotropin hormone (ACTH, 2% to 10%), growth hormone (GH, 2% to 10%), thyroid-stimulating hormone (TSH, <1%), follicle-stimulating hormone (FSH), and luteinizing hormone (LH) are much less common.2 Significant morbidity and premature mortality are associated with hyperprolactinemia, acromegaly (growth hormone excess), Cushing’s syndrome, and hyperthyroidism. Additionally, up to 41% of patients with macroadenomas were found to have varying degrees of hypopituitarism due to compression of the hypothalamus, the hypothalamic-pituitary stalk, or the pituitary itself.4
Recently, the Endocrine Society released consensus recommendations to guide the evaluation and treatment of pituitary incidentalomas, which are included in the approach outlined below.5 A detailed history and physical examination should be obtained with specific inquiry as to signs and symptoms of hormonal excess and mass effect from the tumor. Examples of symptoms of hormone excess can include:
- Prolactin: menstrual irregularity, anovulation, infertility, decreased libido, impotence, osteoporosis;
- Growth hormone: high frequency of colonic polyps and colon cancer (chronic excess);
- TSH: thyrotoxicosis, atrial fibrillation; and
- ACTH: hypertension, osteoporosis, accelerated vascular disease.
Symptoms related to the mass effect of the tumor include visual field defects and hypopituitarism related to the deficient hormone, including:
- FSH/LH: oligomenorrhea, decreased libido, infertility;
- TSH: hypothyroidism (weight gain, constipation, cold intolerance);
- ACTH: adrenal insufficiency (hypotension, hypoglycemia, weight loss); and
- ADH: polyuria, polydypsia.
The size and location of the pituitary lesion must be assessed. Lesions greater than 10 mm are considered macroademonas, and their size will affect their management. If the lesion was initially identified by CT scan, an MRI is recommended to better evaluate it.5 If the MRI locates the incidentaloma abutting the optic nerve or chiasm, then the patient should undergo a formal visual field examination.
Indications for an inpatient surgical referral for treatment include: a lesion larger than 2 cm, evidence of mass effect such as visual field defects, neurologic compromise, opthalmoplegia, hypopituitarism, a tumor abutting the optic nerve or chiasm, pituitary apoplexy, and hypersecretion of hormones other than prolactin. Patients with prolactinomas warrant an inpatient endo-crinology consult and may need medical management with a dopamine agonist. Hormone replacement therapy can also be provided for patients with hypopituitarism.2,5
For patients who do not meet the criteria for inpatient surgical therapy, follow-up management must be arranged at the time of discharge. Clinical, laboratory assessment, and an MRI should be scheduled six months after the initial finding of the incidentaloma with the patient’s PCP or with an endocrinologist.5
Thyroid incidentalomas. The prevalence of thyroid nodules based on ultrasound studies ranges from 19% to 46%, with autopsy studies estimating an incidence of approximately 50%.2,6 Incidence of thyroid nodules also increases with age, as almost 60% of people over the age of 60 harbor a thyroid incidentaloma. The rate of malignancy in the general population has ranged between 8% and 24%; however, in the last decade, the rates have increased by 2.4 times as more sophisticated ultrasound techniques and liberal use of fine-needle aspiration (FNA) biopsies have detected subclinical disease.7,8
Etiologies for incidental thyroid nodules can be divided into benign and malignant causes. Benign etiologies include thyroid cyst (simple or complex), multinodular goiter, and Hashimoto’s thryoiditis, while malignant causes include papillary, medullary, follicular, Hurthle cell, and anaplastic carcinomas, thyroid lymphomas, and rare instances of metastatic cancers.2,3
Targeted history and physical examination helps to characterize the thyroid incidentaloma. Historical features, such as palpitations, weight loss, anxiety, new onset atrial fibrillation, or menstrual irregularities, coupled with tachycardia, tremors, proximal muscle weakness, and a palpable nodule aid in the diagnosis of hyperthyroidism. Findings such as a family history of thyroid cancer, symptoms of hoarseness or dysphagia, rapid growth of the nodule, environmental or history of head or neck irradiation along with physical findings of a hard, fixed nodule, or cervical lymphadenopathy increase the suspicion for malignancy.2,7
The functionality of the nodule can be assessed by checking TSH, free T3, and free T4 levels. Suppression of TSH (< 0.1 mU/L) with elevated levels of free T3 and T4 indicates nodule production of excess thyroid hormone and warrants thyroid scintography. Thyroid scintography will identify the nodule as “hot” (hyperfunctioning) or “cold” (nonfunctioning).2
Regardless of the radiographic modality that initially identified the thyroid incidentaloma, a dedicated thyroid high-resolution ultrasound should be ordered to assess the size, multiplicity (single or multinodular), location, and character (solid, cystic, or mixed).7
Recommendations for proceeding to FNA to evaluate for malignancy differ among subspecialty societies. Generally, nodules larger than 1 cm or nodules smaller than 1 cm with risk factors for malignancy should be referred for FNA.2,7
If diagnostic workup identifies a patient with hyperthyroidism due to an autonomously functional nodule or a nodule that may be at high risk for malignancy, it is appropriate to involve an endocrinologist and possibly a surgical subspecialist prior to discharge. Management of hyperthyroidism can include starting antithyroid agents (methimazole or propylthiouracil), radioactive iodine ablation, or referral for surgery.
Preparation for discharge of the patient whose incidentaloma is nonfunctional or does not appear to be malignant should include appointments to recheck thyroid hormone levels, including TSH as well as a thyroid ultrasound within one year of the initial discovery.
Adrenal incidentaloma. The prevalence of AIs found by CT of the abdomen ranges from 0.4% to 4%, while autopsy studies have found a prevalence of 1.4% to 9% with increasing prevalence with age.2,9,10 The majority of AIs are benign and nonfunctioning adenomas, in the absence of known malignancy. Other differential diagnoses include Cushing’s syndrome, pheochromocytoma, adrenocortical adenoma, aldosteronoma, and metastatic lesions.
Because functioning adrenal incidentalomas may be clinically silent, any patient found with an AI must undergo biochemical workup as part of their evaluation to assess for pheochromocytoma, Cushing’s syndrome, and if he or she has a history of hypertension or hyperaldosteronism (Conn’s syndrome). Table 3 outlines the approach for characterizing adrenal incidentalomas.2,11,12 An important point is that imaging studies are not useful in distinguishing a functioning versus nonfunctioning tumor but rather can help to discriminate malignant lesions.11
Inpatient surgical consult for resection is indicated if the patient is found to have pheochromocytoma, clinically apparent functioning adrenocortical adenoma, or a tumor size greater than 4 cm. Consultation with an endocrinologist is also recommended if biochemical tests are positive. If the diagnostic workup leads to suspicion for infection or metastatic disease, the patient should be referred for FNA.2,12
For patients whose lesions do not require surgical resection, repeat CT scan of the abdomen is recommended six months from the initial finding. Hospitalists should also arrange for the patient to repeat biochemical testing, including an overnight dexamethasone test.12,13
Back to the Case
The patient underwent biochemical testing and was found to have normal levels of plasma-free metanephrines, a plasma aldosterone, plasma renin activity ratio less than 20, and a serum cortisol level of 7 mg/dL after his overnight dexamethasone suppression test. The 24-hour urine collection for free cortisol revealed elevated levels of cortisol in the urine, and the ACTH level was low.
Endocrinology and endocrine surgery teams were consulted, and recommended surgical resection. After surgical resection of his tumor, the patient was started on glucocorticoid replacement and was discharged with a follow-up appointment with endocrinology.
Bottom Line
An inpatient approach to endocrine incidentalomas should include characterization of the clinical signs and symptoms, size, function, and malignant potential of the lesion. Based on this, inpatient surgical or medical management can be determined. Post-discharge management should include arrangements for surveillance testing and follow-up with appropriate subspecialists.
Dr. Tad-y is assistant professor of medicine and a hospitalist at the University of Colorado Denver.
References
- Aron DC, Howlett TA. Pituitary incidentalomas. Endocrinol Metab Clin North Am. 2000;29:205-221.
- Shirodkar M, Jabbour SA. Endocrine incidentalomas. Int J Clin Pract. 2008;62:1423-1431.
- Burguera B, Gharib H. Thyroid incidentalomas. Prevalence, diagnosis, significance, and management. Endocrinol Metab Clin North Am. 2000;29:187-203.
- Molitch ME. Nonfunctioning pituitary tumors and pituitary incidentalomas. Endocrinol Metab Clin North Am. 2008;37:151-171, xi.
- Freda PU, Beckers AM, Katznelson L, et al. Pituitary incidentaloma: an endocrine society clinical practice guideline. J Clin Endocrinol Metab. 2011;96:894-904.
- Gough J, Scott-Coombes D, Fausto Palazzo F. Thyroid incidentaloma: an evidence-based assessment of management strategy. World J Surg. 2008;32:1264-1268.
- Iyer NG, Shaha AR, Silver CE, et al. Thyroid incidentalomas: to treat or not to treat. Eur Arch Otorhinolaryngol. 2010;267:1019-1026.
- Jin J, Wilhelm SM, McHenry CR. Incidental thyroid nodule: patterns of diagnosis and rate of malignancy. Am J Surg. 2009;197:320-324.
- Davenport C, Liew L, Doherty B, et al. The prevalence of adrenal incidentaloma in routine clinical practice. Endocrine. 2011;40:80-83.
- Zeiger MA, Siegelman SS, Hamrahian AH. Medical and surgical evaluation and treatment of adrenal incidentalomas. J Clin Endocrinol Metab. 2011;96: 2004-2015.
- Zeiger MA, Thompson GB, Duh QY, et al. American Association of Clinical Endocrinologists and American Association of Endocrine Surgeons Medical Guidelines for the Management of Adrenal Incidentalomas: executive summary of recommendations. Endocr Pract. 2009;15:450-453.
- NIH state-of-the-science statement on management of the clinically inapparent adrenal mass (“incidentaloma”). NIH Consens State Sci Statements. 2002;19:1-25.
- Young WF. Clinical practice. The incidentally discovered adrenal mass. N Engl J Med. 2007;356:601-610.
- Chidiac RM, Aron DC. Incidentalomas. A disease of modern technology. Endocrinol Metab Clin North Am. 1997;26:233-253.
Does Hospital Medicine Reinforce the Pillars of Career Satisfaction?
Gregory Misky, MD, describes it as a “deer in the headlights” moment. About four years ago, Dr. Misky, assistant professor of medicine at the University of Colorado Denver, and Mark Reid, MD, assistant professor at Denver Health Medical Center, were trying to figure out what being an academic hospitalist was all about. What were the expectations of them, and how could they combine their clinical duties with scholarly work, especially given the significant lack of mentorship?
The duo wondered if other young hospitalists were feeling the same uncertainty about their chosen career, and whether there were any variables that might help predict success or burnout among their fellow doctors.
They haven’t been alone. Regardless of the practice model and location, physicians within the fastest-spreading medical specialty in the U.S. have noted both the promise and unsettled nature of HM. “We are still a relatively young profession, and I think over the past five to 10 years, we’ve been seeing the growing pains of the profession,” says Tosha Wetterneck, MD, MS, FACP, associate professor of medicine at the University of Wisconsin School of Medicine and Public Health in Madison.
In response to mounting concerns over multiple career-satisfaction-related issues, SHM assembled a Career Satisfaction Task Force that produced a detailed white paper at the end of 2006 (available from the “White Papers” tab under the “Publications” heading at www.hospitalmedicine.org).
One tangible outcome of the paper was the establishment of “Four Pillars of Career Satisfaction” for hospitalists:
- Reward and recognition;
- Workload and schedule;
- Autonomy and control; and
- Community and environment.
The paper included definitions for each pillar, and assembled scorecards, action steps, tools, and recommendations for both HM leaders and individual hospitalists to help shore up perceived weak spots.
So how strong are those pillars in practice? If hospitalists are the future of healthcare, as SHM and other medical groups assert, what do current studies suggest about the prospects of HM solidifying into a satisfying and sustainable career choice?
The Evidence
One outgrowth of Dr. Misky and Dr. Reid’s frustration was a study in which they and their collaborators emailed a 61-question survey to hospitalists at 20 academic medical centers. Among the results, the researchers found that 75% of respondents reported either “high” or “somewhat high” satisfaction with their current job. At the same time, though, 67% felt “high” or “somewhat high” stress levels at work, and nearly 1 in 4 (24%) reported some degree of burnout, based on their own definition of the word.1
As one of the first hospitalists in his group, Dr. Misky recalls the stress he felt over whether the hospital, division, and department would all buy into the idea of an academic hospitalist, and what his role would be. “I think we spent a lot of our early years trying to carve out our niche and proving ourselves and trying to balance the clinical needs that people had for us with other expectations of being an academic,” he says. Dr. Misky likens the experience to the adrenaline rush of mountain-biking straight down a hill. The feeling that too many things are going on at once, though, might also partially explain the apparent dichotomy of high overall satisfaction but a worrisome degree of burnout.
The profession hasn’t been around long enough for good longitudinal studies, and surveys have worded questions on satisfaction and burnout in different ways, complicating attempts at direct comparisons over time. A 2001 study, for example, reported that 12.9% of community and academic hospitalists were burned out, with another 25% at risk, but the survey was limited to dues-paying members of the National Association of Inpatient Physicians, the precursor to SHM.2
Nor has it been easy to compare hospitalist satisfaction and burnout levels to those of other specialists. “We haven’t really defined what a sustained, long-term career in hospital medicine is going to be,” Dr. Wetterneck says. “And in that way, it’s hard to say, ‘Compared to other professions, are we happier or not?’”
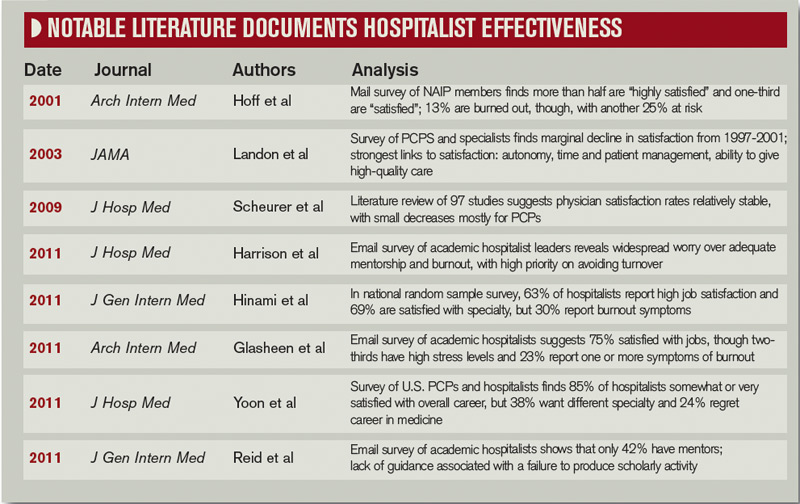
One of her recent studies, however, generally agrees with the handful of surveys addressing satisfaction and burnout among hospitalists. Overall, 63% of respondents reported high satisfaction with their job, while 69% were highly satisfied with their specialty. Roughly 30%, however, also reported feeling symptom of job burnout.3
Kelki Hinami, MD, MS, assistant of professor of medicine at Northwestern University Feinberg School of Medicine in Chicago and a coauthor of the study, says one take-home message is that hospitalists do fairly well in finding jobs that match their individual needs. “To further illustrate this, we found that hospitalists working in various practice models have different ideas about what is most important to their job,” he says.
Autonomy, for example, is considered most important by more local group hospitalists than by those of any other model, while recognition by leaders and having a variety of tasks at work are particularly important to academic hospitalists. Unlike other hospitalists, however, fewer academics consider pay to be the most important job characteristic.
A third study, led by John Yoon, MD, assistant professor in the section of hospital medicine at the University of Chicago, has examined career satisfaction, burnout, and morale among primary-care physicians (PCPs) and hospitalists. So far, the results he reported at HM11 largely agree with the other recent surveys: Combined, 85% of hospitalists report being either somewhat or very satisfied with their overall career. Conversely, 24% of hospitalists regretted choosing medicine as a career and 38% say they would have chosen a different medical specialty if they had to do it over again.4
Dr. Yoon says his data, compiled from two survey samples of about 1,000 generalists each, have revealed few differences between hospitalists and PCPs. “I thought hospitalists would be more satisfied than primary-care physicians, given the declining satisfaction rates of PCPs that we know about, and that students and trainees are less likely to go into primary care,” he says. Even burnout rates are similar, however; Dr. Yoon says he’s noticed a trend toward hospitalists reporting less burnout than PCPs, but the difference is not yet statistically significant.
Choice of a New Generation?
HM’s attractiveness to medical residents offers other clues about its ability to provide a sustainable and satisfying career choice. Salary, part of the “reward and recognition” pillar, has long been one perceived weakness. Anecdotally, however, Dr. Yoon says many general medicine residents see HM as a better financial option than primary care. “Some of the residents I work with, when I asked them, ‘Will you be a primary-care physician or a hospitalist?’ a lot of them say, ‘Probably hospitalist,’” he says. “And generally the reason is because they have to pay off their debt.”
It’s true that hospitalists’ salaries lag behind that of most of other specialists. Nevertheless, researchers like Colin West, MD, PhD, associate professor of medicine and biostatistics at the Mayo Clinic in Rochester, Minn., say many medical residents are prioritizing financial considerations as relatively low on the scale of general preferences.

—John Yoon, MD, assistant professor, section of hospital medicine, University of Chicago
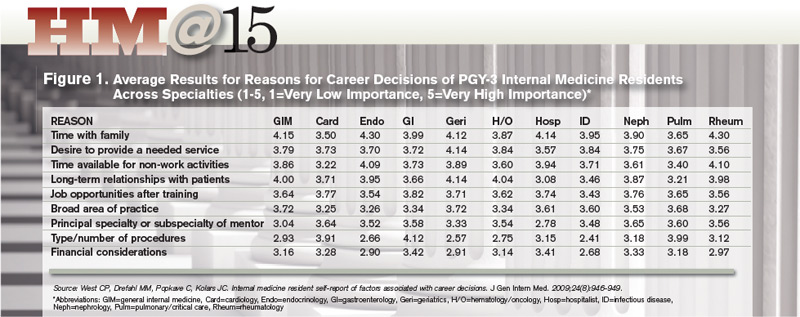
Dr. West, an associate program director for the internal-medicine residency program at Mayo, sees a generational sea change in the career considerations deemed most important. Based on a career decision survey filled out by nearly 15,000 internal-medical residents, he found that roughly 70% of respondents said time with family was of “high” or “very high” importance to their career decisions.5 The category, which relates to SHM’s “workload and schedule” pillar, beat out eight others as the most important factor overall, while global financial considerations scored relatively low.
Residents who placed high value on time with family were more likely to choose careers in more predictable, outpatient-based specialties, such as endocrinology or rheumatology. HM also fared well in this category. Dr. West says the results suggest that residents considering a hospitalist career are attracted to the specialty’s flexibility and predictability of the largely shift-based scheduling.
William Cors, MD, chief medical quality officer at Pocono Health System in East Stroudsburg, Pa., says more physicians are looking for job security, predictable shifts, and a better work-life balance. As HM matures and demonstrates that it can address those needs, Dr. Cors sees it becoming more attractive for medical students and residents.
In practice, though, other research suggests a career in HM doesn’t always meet expectations. Dr. Wetterneck and Dr. Hinami, for example, highlighted both compensation and work-life balance as points of concern in their study: For both factors, only about 30% of hospitalists were optimally satisfied.
Separately, Dr. Misky and his colleagues reported that roughly half of academic hospitalists were satisfied with the ability to control their schedule, and with their amount of personal and family time. Those who were unsatisfied with either of these categories, the survey found, were at higher risk for burnout. Similarly, Dr. Yoon found that physicians who reported having no control over their work hours or their call schedule, part of SHM’s “autonomy and control” pillar, were more likely to report burnout.
So why is HM stumbling on perceived selling points like family friendliness and autonomy? Dr. Wetterneck believes too many unfilled jobs and rapid turnover could be putting more pressure on existing hospitalists and interfering with their ability to balance home and work life. “There’s a huge need for hospitalists everywhere,” she says, and reliance on them has been especially acute at academic centers and large community hospitals contending with the recently imposed limits on residents’ work hours.
The Hospitalist: A People Person
Another shift may be occurring in the types of relationships necessary for a satisfying work environment, a big part of the “community and environment” pillar. Although Dr. Yoon says long-term connections with students and trainees have added meaning to his job, he is mourning the absence of other bonds. “One loss I’m starting to feel keenly as an academic hospitalist, having spent my early training years as a primary-care doc, really is the loss of having long-term relationships with patients,” he says. “My clinical encounters with patients these days as a hospitalist are very intense, but also very brief.”
Dr. Yoon has pondered whether the HM field can rearrange practice settings to promote more satisfying relationships. Such a change, he says, might occur through innovative models that aid coordination with medical homes, or provide more chronic care for high-risk patients. “In my view, the trajectory of hospital medicine is pretty wide open for creativity and new models of care,” he says. “I think it will be partly driven by the need to want to have more meaningful interactions with patients.”
Those relationships need not be long-term, however. One recent study found high satisfaction among hospitalists and laborists working within the fast-growing OBGYN hospitalist field.6
Dr. Hinami says collaborative care that involves close working relationships with specialists and other care providers might help propel the hospitalist movement forward. In his survey with Dr. Wetterneck, hospitalists ranked relationships with staff and colleagues among the most satisfying of any of the domains; hospitalists also indicated high levels of satisfaction with their patient relationships. “Clearly, relationships are critical to overall job satisfaction, and hospitalists, I think, are doing a fairly good job at maintaining those relationships,” Dr. Hinami says.

—Keiki Hinami, MD, assistant professor of medicine, Northwestern University Feinberg School of Medicine, Chicago
A 2002 survey-based study reinforces the importance of such bonds. Job burnout and intent to remain in the hospitalist career, its authors concluded, were more highly influenced by “favorable social relations” involving colleagues, coworkers, and patients than by such factors as reduced autonomy and the use of financial incentives.7
The focus on maintaining multiple relationships fits well with the collaborative approach to care that many hospitalists say they value highly. One big satisfier for hospitalists, Dr. Cors says, will be “a sense that they’re really part of a healthcare team and not just punching the clock and doing their shifts.”
The Verdict
Despite the difficulty in discerning long-term trends, studies suggest that overall satisfaction with the specialty of hospital medicine remains high, a promising sign for the maturing field. Career hospitalists also seem adept at relationships with peers and other providers, a skill that will serve them well as collaborative-care models gain steam.
Nonetheless, surveys also suggest a worrisome rate of burnout and less-than-optimal satisfaction with elements that should be the strong suits of HM, such as work-life balance and autonomy. Academics are searching for their own clinical-research balance. And Dr. West says the jury’s still out on the future pitfalls that might get in the way of a sustainable career path for older practitioners, such as overnight shifts.
Hospitalist-led efforts, however, may be starting to pay dividends. At the University of California at San Francisco, a faculty development program for first-year hospitalists has included a coaching relationship with a senior faculty member, a teaching course, newly established divisional grand rounds, and a framework for meeting scholarly expectations. Upon its implementation, the program has led to higher job satisfaction, skill-set comfort, and academic production among participants.8
Given the expanding range of HM duties and practice models, hospitals, division chiefs, and team leaders cannot rely on a single recipe for happy and productive hospitalists. “I don’t know if there is a cookbook; I think it’s highly variable depending on your institution and the needs of the academic facility where you are,” Dr. Misky says.
SHM’s 2006 white paper stated that the best career satisfaction strategy is to find a job that fits an individual’s preferences and attitudes. “People who are unhappy with their job don’t tend to stay in it, and from what we know about hospital medicine right now, you can find pretty much any type of job anywhere you want, so the job market is very open,” Dr. Wetterneck says.
Ensuring the right fit for doctors within HM, though, will require institutional support. “It’s going to be up to hospitals and hospitalist programs to create jobs that are sustainable that people like,” she says, “so that hospitalists will stay long in their job and in the profession.”
Bryn Nelson is a freelance medical writer based in Seattle.
More Mentorship in Hospital Medicine? It’s Academic

Within the 2011 State of Hospital Medicine report, one statistic in particular points to the youth of the medical specialty: Just over 10% of surveyed hospitalists had reached the rank of associate professor or higher.
How might the potential lack of mentorship within this immature field affect the ability of hospitalists to successfully navigate academia? So asked Gregory Misky, MD, assistant professor of medicine at the University of Colorado Denver, and his colleagues in a survey-based study. The results agree with other recent assessments that mentors are in short supply. “Academic hospital medicine groups have an acute need for mentoring and career development programs,” one study concludes.
The research of Dr. Misky and his collaborators found that only 42% of academic hospitalists could identify a mentor, while only 31% reported that they were mentoring another academic hospitalist.1 Based on sheer numbers and experience, the pool of mentors may significantly expand as the field matures. But Dr. Misky also urges some flexibility, noting that his own mentor is a non-hospitalist.
In his own research, Colin West, MD, PhD, associate professor of medicine and biostatistics at the Mayo Clinic in Rochester, Minn., found that residents considering a career in HM placed less emphasis on the specialty or subspecialty of their mentor.5 Why? Very likely, he says, there just weren’t enough hospitalist mentors around to get a sense of what the career was all about.
Dr. West hopes the numbers suggest otherwise in the near future. “You want to recruit bright people into your specialty, but at the same time, you also want to recruit the right people,” he says. “And that means that you need to be able to expose people to a full breadth of what a decision to pursue a certain specialty really means.”
References
- Glasheen JJ, Misky GJ, Reid MB, Harrison RA, Sharpe B, Auerbach A. Career satisfaction and burnout in academic hospital medicine. Arch Intern Med. 2011;171(8) 782-785.
- Hoff TH, Whitcomb WF, Williams K, Nelson JR, Cheesman RA. Characteristics and work experiences of hospitalists in the United States. Arch Intern Med. 2001;161(6):851-858.
- Hinami K, Whelan CT, Wolosin RJ, Miller JA, Wetterneck TB. Worklife and satisfaction of hospitalists: toward flourishing careers [published online ahead of print July 20, 2011]. J Gen Intern Med. doi:10.1007/s116060-011-1780-z.
- Yoon J, Miller A, Rasinski K, Curlin F. Burnout, sense of calling, and career resilience among hospitalists and primary care physicians: a national survey. J Hosp Med. 2011;6(4):S90-S91.
- West CP, Drefahl MM, Popkave C, Kolars JC. Internal medicine resident self-report of factors associated with career decisions. J Gen Intern Med. 2009;24(8):946-949.
- Funk C, Anderson BL, Schulkin J, Weinstein L. Survey of obstetric and gynecologic hospitalists and laborists. Am J Obstet Gynecol. 2010;203(2):177.e1-177.e4.
- Hoff T, Whitcomb WF, Nelson JR. Thriving and surviving in a new medical career: the case of hospitalist physicians. J Health Soc Behav. 2002;43(1):72-91.
- Sehgal NL, Sharpe BA, Auerbach AA, Wachter RM. Investing in the future: Building an academic hospitalist faculty development program. J Hosp Med. 2011;6(3):161-166.
Gregory Misky, MD, describes it as a “deer in the headlights” moment. About four years ago, Dr. Misky, assistant professor of medicine at the University of Colorado Denver, and Mark Reid, MD, assistant professor at Denver Health Medical Center, were trying to figure out what being an academic hospitalist was all about. What were the expectations of them, and how could they combine their clinical duties with scholarly work, especially given the significant lack of mentorship?
The duo wondered if other young hospitalists were feeling the same uncertainty about their chosen career, and whether there were any variables that might help predict success or burnout among their fellow doctors.
They haven’t been alone. Regardless of the practice model and location, physicians within the fastest-spreading medical specialty in the U.S. have noted both the promise and unsettled nature of HM. “We are still a relatively young profession, and I think over the past five to 10 years, we’ve been seeing the growing pains of the profession,” says Tosha Wetterneck, MD, MS, FACP, associate professor of medicine at the University of Wisconsin School of Medicine and Public Health in Madison.
In response to mounting concerns over multiple career-satisfaction-related issues, SHM assembled a Career Satisfaction Task Force that produced a detailed white paper at the end of 2006 (available from the “White Papers” tab under the “Publications” heading at www.hospitalmedicine.org).
One tangible outcome of the paper was the establishment of “Four Pillars of Career Satisfaction” for hospitalists:
- Reward and recognition;
- Workload and schedule;
- Autonomy and control; and
- Community and environment.
The paper included definitions for each pillar, and assembled scorecards, action steps, tools, and recommendations for both HM leaders and individual hospitalists to help shore up perceived weak spots.
So how strong are those pillars in practice? If hospitalists are the future of healthcare, as SHM and other medical groups assert, what do current studies suggest about the prospects of HM solidifying into a satisfying and sustainable career choice?
The Evidence
One outgrowth of Dr. Misky and Dr. Reid’s frustration was a study in which they and their collaborators emailed a 61-question survey to hospitalists at 20 academic medical centers. Among the results, the researchers found that 75% of respondents reported either “high” or “somewhat high” satisfaction with their current job. At the same time, though, 67% felt “high” or “somewhat high” stress levels at work, and nearly 1 in 4 (24%) reported some degree of burnout, based on their own definition of the word.1
As one of the first hospitalists in his group, Dr. Misky recalls the stress he felt over whether the hospital, division, and department would all buy into the idea of an academic hospitalist, and what his role would be. “I think we spent a lot of our early years trying to carve out our niche and proving ourselves and trying to balance the clinical needs that people had for us with other expectations of being an academic,” he says. Dr. Misky likens the experience to the adrenaline rush of mountain-biking straight down a hill. The feeling that too many things are going on at once, though, might also partially explain the apparent dichotomy of high overall satisfaction but a worrisome degree of burnout.
The profession hasn’t been around long enough for good longitudinal studies, and surveys have worded questions on satisfaction and burnout in different ways, complicating attempts at direct comparisons over time. A 2001 study, for example, reported that 12.9% of community and academic hospitalists were burned out, with another 25% at risk, but the survey was limited to dues-paying members of the National Association of Inpatient Physicians, the precursor to SHM.2
Nor has it been easy to compare hospitalist satisfaction and burnout levels to those of other specialists. “We haven’t really defined what a sustained, long-term career in hospital medicine is going to be,” Dr. Wetterneck says. “And in that way, it’s hard to say, ‘Compared to other professions, are we happier or not?’”
One of her recent studies, however, generally agrees with the handful of surveys addressing satisfaction and burnout among hospitalists. Overall, 63% of respondents reported high satisfaction with their job, while 69% were highly satisfied with their specialty. Roughly 30%, however, also reported feeling symptom of job burnout.3
Kelki Hinami, MD, MS, assistant of professor of medicine at Northwestern University Feinberg School of Medicine in Chicago and a coauthor of the study, says one take-home message is that hospitalists do fairly well in finding jobs that match their individual needs. “To further illustrate this, we found that hospitalists working in various practice models have different ideas about what is most important to their job,” he says.
Autonomy, for example, is considered most important by more local group hospitalists than by those of any other model, while recognition by leaders and having a variety of tasks at work are particularly important to academic hospitalists. Unlike other hospitalists, however, fewer academics consider pay to be the most important job characteristic.
A third study, led by John Yoon, MD, assistant professor in the section of hospital medicine at the University of Chicago, has examined career satisfaction, burnout, and morale among primary-care physicians (PCPs) and hospitalists. So far, the results he reported at HM11 largely agree with the other recent surveys: Combined, 85% of hospitalists report being either somewhat or very satisfied with their overall career. Conversely, 24% of hospitalists regretted choosing medicine as a career and 38% say they would have chosen a different medical specialty if they had to do it over again.4
Dr. Yoon says his data, compiled from two survey samples of about 1,000 generalists each, have revealed few differences between hospitalists and PCPs. “I thought hospitalists would be more satisfied than primary-care physicians, given the declining satisfaction rates of PCPs that we know about, and that students and trainees are less likely to go into primary care,” he says. Even burnout rates are similar, however; Dr. Yoon says he’s noticed a trend toward hospitalists reporting less burnout than PCPs, but the difference is not yet statistically significant.
Choice of a New Generation?
HM’s attractiveness to medical residents offers other clues about its ability to provide a sustainable and satisfying career choice. Salary, part of the “reward and recognition” pillar, has long been one perceived weakness. Anecdotally, however, Dr. Yoon says many general medicine residents see HM as a better financial option than primary care. “Some of the residents I work with, when I asked them, ‘Will you be a primary-care physician or a hospitalist?’ a lot of them say, ‘Probably hospitalist,’” he says. “And generally the reason is because they have to pay off their debt.”
It’s true that hospitalists’ salaries lag behind that of most of other specialists. Nevertheless, researchers like Colin West, MD, PhD, associate professor of medicine and biostatistics at the Mayo Clinic in Rochester, Minn., say many medical residents are prioritizing financial considerations as relatively low on the scale of general preferences.
—John Yoon, MD, assistant professor, section of hospital medicine, University of Chicago
Dr. West, an associate program director for the internal-medicine residency program at Mayo, sees a generational sea change in the career considerations deemed most important. Based on a career decision survey filled out by nearly 15,000 internal-medical residents, he found that roughly 70% of respondents said time with family was of “high” or “very high” importance to their career decisions.5 The category, which relates to SHM’s “workload and schedule” pillar, beat out eight others as the most important factor overall, while global financial considerations scored relatively low.
Residents who placed high value on time with family were more likely to choose careers in more predictable, outpatient-based specialties, such as endocrinology or rheumatology. HM also fared well in this category. Dr. West says the results suggest that residents considering a hospitalist career are attracted to the specialty’s flexibility and predictability of the largely shift-based scheduling.
William Cors, MD, chief medical quality officer at Pocono Health System in East Stroudsburg, Pa., says more physicians are looking for job security, predictable shifts, and a better work-life balance. As HM matures and demonstrates that it can address those needs, Dr. Cors sees it becoming more attractive for medical students and residents.
In practice, though, other research suggests a career in HM doesn’t always meet expectations. Dr. Wetterneck and Dr. Hinami, for example, highlighted both compensation and work-life balance as points of concern in their study: For both factors, only about 30% of hospitalists were optimally satisfied.
Separately, Dr. Misky and his colleagues reported that roughly half of academic hospitalists were satisfied with the ability to control their schedule, and with their amount of personal and family time. Those who were unsatisfied with either of these categories, the survey found, were at higher risk for burnout. Similarly, Dr. Yoon found that physicians who reported having no control over their work hours or their call schedule, part of SHM’s “autonomy and control” pillar, were more likely to report burnout.
So why is HM stumbling on perceived selling points like family friendliness and autonomy? Dr. Wetterneck believes too many unfilled jobs and rapid turnover could be putting more pressure on existing hospitalists and interfering with their ability to balance home and work life. “There’s a huge need for hospitalists everywhere,” she says, and reliance on them has been especially acute at academic centers and large community hospitals contending with the recently imposed limits on residents’ work hours.
The Hospitalist: A People Person
Another shift may be occurring in the types of relationships necessary for a satisfying work environment, a big part of the “community and environment” pillar. Although Dr. Yoon says long-term connections with students and trainees have added meaning to his job, he is mourning the absence of other bonds. “One loss I’m starting to feel keenly as an academic hospitalist, having spent my early training years as a primary-care doc, really is the loss of having long-term relationships with patients,” he says. “My clinical encounters with patients these days as a hospitalist are very intense, but also very brief.”
Dr. Yoon has pondered whether the HM field can rearrange practice settings to promote more satisfying relationships. Such a change, he says, might occur through innovative models that aid coordination with medical homes, or provide more chronic care for high-risk patients. “In my view, the trajectory of hospital medicine is pretty wide open for creativity and new models of care,” he says. “I think it will be partly driven by the need to want to have more meaningful interactions with patients.”
Those relationships need not be long-term, however. One recent study found high satisfaction among hospitalists and laborists working within the fast-growing OBGYN hospitalist field.6
Dr. Hinami says collaborative care that involves close working relationships with specialists and other care providers might help propel the hospitalist movement forward. In his survey with Dr. Wetterneck, hospitalists ranked relationships with staff and colleagues among the most satisfying of any of the domains; hospitalists also indicated high levels of satisfaction with their patient relationships. “Clearly, relationships are critical to overall job satisfaction, and hospitalists, I think, are doing a fairly good job at maintaining those relationships,” Dr. Hinami says.
—Keiki Hinami, MD, assistant professor of medicine, Northwestern University Feinberg School of Medicine, Chicago
A 2002 survey-based study reinforces the importance of such bonds. Job burnout and intent to remain in the hospitalist career, its authors concluded, were more highly influenced by “favorable social relations” involving colleagues, coworkers, and patients than by such factors as reduced autonomy and the use of financial incentives.7
The focus on maintaining multiple relationships fits well with the collaborative approach to care that many hospitalists say they value highly. One big satisfier for hospitalists, Dr. Cors says, will be “a sense that they’re really part of a healthcare team and not just punching the clock and doing their shifts.”
The Verdict
Despite the difficulty in discerning long-term trends, studies suggest that overall satisfaction with the specialty of hospital medicine remains high, a promising sign for the maturing field. Career hospitalists also seem adept at relationships with peers and other providers, a skill that will serve them well as collaborative-care models gain steam.
Nonetheless, surveys also suggest a worrisome rate of burnout and less-than-optimal satisfaction with elements that should be the strong suits of HM, such as work-life balance and autonomy. Academics are searching for their own clinical-research balance. And Dr. West says the jury’s still out on the future pitfalls that might get in the way of a sustainable career path for older practitioners, such as overnight shifts.
Hospitalist-led efforts, however, may be starting to pay dividends. At the University of California at San Francisco, a faculty development program for first-year hospitalists has included a coaching relationship with a senior faculty member, a teaching course, newly established divisional grand rounds, and a framework for meeting scholarly expectations. Upon its implementation, the program has led to higher job satisfaction, skill-set comfort, and academic production among participants.8
Given the expanding range of HM duties and practice models, hospitals, division chiefs, and team leaders cannot rely on a single recipe for happy and productive hospitalists. “I don’t know if there is a cookbook; I think it’s highly variable depending on your institution and the needs of the academic facility where you are,” Dr. Misky says.
SHM’s 2006 white paper stated that the best career satisfaction strategy is to find a job that fits an individual’s preferences and attitudes. “People who are unhappy with their job don’t tend to stay in it, and from what we know about hospital medicine right now, you can find pretty much any type of job anywhere you want, so the job market is very open,” Dr. Wetterneck says.
Ensuring the right fit for doctors within HM, though, will require institutional support. “It’s going to be up to hospitals and hospitalist programs to create jobs that are sustainable that people like,” she says, “so that hospitalists will stay long in their job and in the profession.”
Bryn Nelson is a freelance medical writer based in Seattle.
More Mentorship in Hospital Medicine? It’s Academic
Within the 2011 State of Hospital Medicine report, one statistic in particular points to the youth of the medical specialty: Just over 10% of surveyed hospitalists had reached the rank of associate professor or higher.
How might the potential lack of mentorship within this immature field affect the ability of hospitalists to successfully navigate academia? So asked Gregory Misky, MD, assistant professor of medicine at the University of Colorado Denver, and his colleagues in a survey-based study. The results agree with other recent assessments that mentors are in short supply. “Academic hospital medicine groups have an acute need for mentoring and career development programs,” one study concludes.
The research of Dr. Misky and his collaborators found that only 42% of academic hospitalists could identify a mentor, while only 31% reported that they were mentoring another academic hospitalist.1 Based on sheer numbers and experience, the pool of mentors may significantly expand as the field matures. But Dr. Misky also urges some flexibility, noting that his own mentor is a non-hospitalist.
In his own research, Colin West, MD, PhD, associate professor of medicine and biostatistics at the Mayo Clinic in Rochester, Minn., found that residents considering a career in HM placed less emphasis on the specialty or subspecialty of their mentor.5 Why? Very likely, he says, there just weren’t enough hospitalist mentors around to get a sense of what the career was all about.
Dr. West hopes the numbers suggest otherwise in the near future. “You want to recruit bright people into your specialty, but at the same time, you also want to recruit the right people,” he says. “And that means that you need to be able to expose people to a full breadth of what a decision to pursue a certain specialty really means.”
References
- Glasheen JJ, Misky GJ, Reid MB, Harrison RA, Sharpe B, Auerbach A. Career satisfaction and burnout in academic hospital medicine. Arch Intern Med. 2011;171(8) 782-785.
- Hoff TH, Whitcomb WF, Williams K, Nelson JR, Cheesman RA. Characteristics and work experiences of hospitalists in the United States. Arch Intern Med. 2001;161(6):851-858.
- Hinami K, Whelan CT, Wolosin RJ, Miller JA, Wetterneck TB. Worklife and satisfaction of hospitalists: toward flourishing careers [published online ahead of print July 20, 2011]. J Gen Intern Med. doi:10.1007/s116060-011-1780-z.
- Yoon J, Miller A, Rasinski K, Curlin F. Burnout, sense of calling, and career resilience among hospitalists and primary care physicians: a national survey. J Hosp Med. 2011;6(4):S90-S91.
- West CP, Drefahl MM, Popkave C, Kolars JC. Internal medicine resident self-report of factors associated with career decisions. J Gen Intern Med. 2009;24(8):946-949.
- Funk C, Anderson BL, Schulkin J, Weinstein L. Survey of obstetric and gynecologic hospitalists and laborists. Am J Obstet Gynecol. 2010;203(2):177.e1-177.e4.
- Hoff T, Whitcomb WF, Nelson JR. Thriving and surviving in a new medical career: the case of hospitalist physicians. J Health Soc Behav. 2002;43(1):72-91.
- Sehgal NL, Sharpe BA, Auerbach AA, Wachter RM. Investing in the future: Building an academic hospitalist faculty development program. J Hosp Med. 2011;6(3):161-166.
Good Citizenship

Hospital medicine is fortunate to have many very dedicated and professionally centered doctors who work enthusiastically to both provide excellent care to their patients and work to make their own practice and their hospital a better place. I am lucky to practice with many of them in our practice in Bellevue, Wash.
Yet a significant portion of hospitalists have chosen this work because they’re looking for relatively-low-commitment work. In essence, they see themselves as dating their practice rather than marrying it. Some of them might even say, “I thought I wanted a career. It turns out all I wanted was a paycheck.”
Most are skilled clinicians who find the energy to do a good job for the patients under their care but don’t have a mindset of owning their practice and investing time in making it perform better.
This gives rise to a dilemma: How can a practice turn these perfectly capable physicians into meaningfully engaged participants in the hospitalist practice itself and the hospital as a whole? What about a salary bonus based on good citizenship? Would that cause them to become more engaged and committed?
There is voluminous research and a whole row of books at your local Barnes & Noble that address these questions more completely that I can, so I’ll just share some real-world experience and insights from one book.
What Might a Citizenship Bonus Look Like?
There are a number of ways to consider designing a citizenship bonus. At a previous SHM practice-management course, Win Whitcomb, MD, MHM, presented one example from Mercy Medical Center in Springfield, Mass. (see Figure 1).
The following kinds of activities might be appropriate for a hospitalist to earn a citizenship bonus:
- Active participation on approved hospital committees (e.g. the pharmacy and therapeutic committees) and regular input from and feedback to the hospitalist group (e.g. via e-mail) about relevant activities of the committee;
- A project to improve clinical care (e.g. improved glycemic control, fall prevention, med reconciliation, discharge processes, readmission rates, ensuring follow-up of tests resulted after discharge, etc.);
- A project to improve business operations—for example, improve our billing/coding accuracy. Such a project could be to develop a new progress note template and collect data regarding its use and effectiveness;
- Work to improve communication and interaction with other hospital staff—for example, joint rounding with nurses, improve throughput, etc.; and
- Project(s) to increase the group’s social cohesion and engagement with hospital initiatives and goals.
Does a Citizenship Bonus Help or Hinder a Practice?
From the experience Mercy Hospital had with the citizenship bonus, Win concluded that many, but not all, hospitalists who don’t seem interested in quality improvement (QI) will become engaged if there is a reward/recognition structure. A relatively small dollar bonus is OK, as long as non-monetary rewards exist (e.g. improvement demonstrable, sense of teamwork, recognition). And hospitalists who were engaged prior to establishing the salary incentive are not likely to change their behavior, but their effort is now recognized—allowing for sustained engagement.
I’m sure many institutions would find a similar desirable outcome from putting into place a citizenship bonus. But it isn’t a guarantee. All performance bonus programs, whether based on “hard” outcomes like patient satisfaction scores or “soft” things like citizenship, are tricky to set up and operate effectively.
I have seen well-intentioned efforts to create a citizenship bonus lead to an increase in hospitalists working on projects outside of direct patient care, but at a cost of leading them to focus more intently on just how much they’re being paid for any work outside of direct patient care. It seems that the bonus might have ignited more frustration and concern about compensation, and any benefit to the practice might have been offset by harm to group culture. And if the bonus goes away, some doctors might be even less engaged than they were before it was turned on.
In “Drive: The Surprising Truth About What Motivates Us,” Daniel Pink makes a pretty convincing case that “the more prominent salary, perks, and benefits are in someone’s work life, the more they can inhibit creativity and unravel performance.” He makes the case that organizations are most demotivating “when they use rewards like money to motivate staff.”
“Effective organizations compensate people in amounts and ways that allow individuals to mostly forget about compensation and instead focus on the work itself,” Pink writes.
How do you allow individuals to forget about compensation? He says ensure internal and external fairness in compensation; pay more than average; and if you use performance metrics, make them wide-ranging, relevant, and hard to game.
So maybe financial compensation for citizenship, whether paid through a bonus, hourly, or some other separate salary element, isn’t such a good idea for a hospitalist practice (or any physician practice?). I don’t have a definitive answer, so you’ll have to decide this for yourself. But my hunch is that groups with a thriving culture might in some cases benefit from a well-designed citizenship bonus. That said, those groups also could be the ones less in need of it.
Groups that already have a weak or unhealthy culture, or are frustrated by what they see is inadequate compensation for clinical work, might find such a bonus leads to problems that offset its benefit.
Training in leadership, quality improvement, and other non-clinical areas that are critical for the success of a hospitalist practice is always worthwhile and might capture many of the benefits of a citizenship bonus without its drawbacks.
Dr. Nelson has been a practicing hospitalist since 1988 and is co-founder and past president of SHM. He is a principal in Nelson Flores Hospital Medicine Consultants, a national hospitalist practice management consulting firm (www.nelsonflores.com). He is also course co-director and faculty for SHM’s “Best Practices in Managing a Hospital Medicine Program” course. This column represents his views and is not intended to reflect an official position of SHM.
ONLINE EXCLUSIVE: Listen to JHM's first editor-in-chief talk about HM's only peer-reviewed journal
Click here to listen to Dr. Williams
Click here to listen to Dr. Williams
Click here to listen to Dr. Williams
Business Drivers
MIAMI BEACH, Fla.—Muralidharan Reddy, MD, had just finished a five-hour class on the business concepts behind running a hospital and how a hospital CEO thinks—part of the entry-level curriculum at SHM’s Leadership Academy. As he stood up from the round table in a room still buzzing with conversation, he was glad he had signed up—in fact, he had been one of the first to arrive for the 7:30 a.m. session at the Fontainebleau resort.
“It improves my CV, number one,” says Dr. Reddy, a hospitalist at New England Baptist Hospital in Boston. “And it’s not just the CV, but I need the experience to guide me to work as a leader in a hospital group, or even plan on starting a group, or things like that. If I’m going to be a hospitalist, I have to work on trying to get those skills.”
A big plus, he adds, is “you get to learn from experts.”
The four-day academy provides hospitalists an intense learning experience. “Some of these skills, people learn it on the job or you get it through Academy,” Dr. Reddy says. “So I do both.”
Hospitalists who participate in the session repeatedly express concerns that if they don’t hone their understanding of the business aspects of the hospital and refine their skills in interacting with colleagues, they could be left behind in a fast-moving environment.
“I think it’s important,” said Mana Goshtasbi, MD, a hospitalist with Cogent HMG who has worked for two years at St. Joseph’s Hospital in Tampa, Fla. “I think that’s the direction. I think you have to know this stuff because of all the changes.”
Leadership Academy courses come in three levels, which build on one another: Foundations for Effective Leadership, Personal Leadership Excellence, and Strengthening Your Organization. Those who have completed the three levels can apply for certification, which requires completion of a pre-approved leadership project.
Know Your Value, Know Your Customers

In his first-level session, instructor Michael Guthrie, MD, MBA, executive in residence and adjunct professor at the University of Colorado Denver School of Business’ program in health administration, spent most of his presentation on his feet, wending his way among the tables, challenging the physician-students to think differently from the ways they’ve been trained to think about healthcare. That starts with stepping outside of themselves and taking a look at how they are viewed in terms of the hospital they’re working with as hospitalists, says Dr. Guthrie, former CEO of the Good Samaritan Health System in San Jose, Calif., and former COO for the Penrose-St. Francis Healthcare System in Colorado.
“What’s affecting the organization that you operate in, and what does that mean about the kinds of demands that are being made of you and requests that are being made of you?” he asks the attendees. “What does it mean about the value that’s received from the work that you do in that organization?”
A hospitalists’ value is a common theme. “What is it that you offer as hospitalists that has created a group of enthusiasts?” he asks. “What is it that you offer to any customer that’s of value to them that they would give up their hard-earned money in exchange for it? Who are your customers?”
A key “customer” group is primary-care physicians (PCPs) whose patients end up under a hospitalist’s care, he explains. They get value from the hospitalist in a variety of ways.
“That’s a more effective way for them to spend their life [at their own clinic],” he says. “They get to manage their schedule differently, they don’t have to drive. They are all exchange values. … There’s a very definite exchange going on here. If you fail in that exchange, we all know what would happen, right? They’d stop sending you patients.”
A physician chimes in: “If you’re the only hospitalist there, they don’t have a choice.”
Dr. Guthrie, quick to seize upon what he sees as a teaching moment, tells the group to “be careful.”
“In the short term, that’s absolutely true,” he says. “In the long term, there are a lot of other alternatives. And if there aren’t, someone will invent one. You see that’s the thing about our society—if there’s an opportunity with a whole, big, dissatisfied customer segment, somebody will notice and invent the way to satisfy their needs. That’s called capitalism.”
It’s what happened with the late Steve Jobs and the iPod, when he realized customers needed a way to easily access their music collections, Dr. Guthrie points out.
“He understood the dissatisfactions of the market,” he continues. “Before that, they didn’t have any choices.
“Healthcare is the same. But it’s a little more difficult to develop those choices. It’s hard to build a new hospital right in the middle of someplace where there’s only one hospital. So they invent other ways to do it, ways to get their patients taken care of: They travel.”
About 700,000 people flew to Southeast Asia last year for medical procedures, he says, making the point that American patients have options.
“Somewhat difficult, but they do have alternatives,” he says. “Customers will, when pushed hard enough, if dissatisfied enough, leave you, even when you think you have them trapped.”
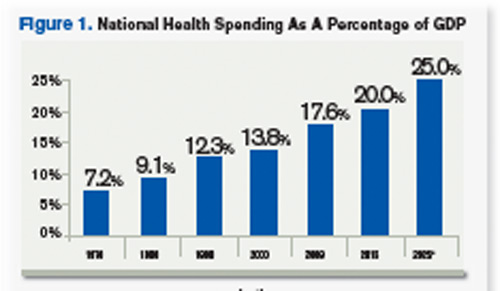
Source: Hartman, M: Martin, A; McDonnell, P et al. (2009). National Helath Spending In 2007: Slower Drug Spending Contributes To Lowest Rate Of Overall Growth Since 1998. Health Affairs, Jan/Feb., p 247. www.healthaffairs.org). See also, Orzag, Peter; Congressional Budget Office (2008). Growth in Health Care Costs, testimony before the Sentae Budget Committee, Jan. 31, p.1. (www.cbo.gov/doc.cfm?index-8948). Center for Medicare & Medicaid Services, January 2011.
Think Tanks
A key part of the session is time set aside for group work, in which Dr. Guthrie gives the class an assignment and attendees tackle it at their tables as a unit. The first task is to identify business drivers at hospitals, what the objectives of the hospital should be in response to those things, and how those objectives affect the work of hospitalists.
Then the groups go to work. A few minutes later, though, Dr. Guthrie speaks up through the chatter.
“Let’s stop for a minute. I want to tell you that most of you are on completely the wrong track,” he says, drawing chuckles. “But this is part of the reason we do it this way. The idea here is to get outside of your head.”
One group lists “profit” as a business driver.
“Profit is not a business driver,” he says. “I know you’re sort of raised to think that way. It isn’t. It’s a measurement. It’s like blood pressure. So it is not a business driver. We use it as a measurement of the success with which we’re synthesizing the business drivers and the environment and meeting the objectives of those drivers, or those trends.”
Business drivers are more along the lines of government mandates and an aging population, which some of the groups had mentioned. “That’s the level of abstraction I want you get to,” he says. “Think out in the marketplace.”
When it comes down to it, Dr. Guthrie explains, the hospitalist plays a role in just about every measurement used to determine excellence at a hospital—from quality to customer loyalty, from retention of patients to productivity.
He also emphasizes the difference between how a doctor has been trained essentially to be an individual expert—patient presents a problem, doctor presents a solution—and how those trained to be managers and leaders operate through other people.
Leaders of the Future
Daniel Duzan, MD, a hospitalist for TeamHealth at Fort Loudoun Medical Center in Lenoir City, Tenn., southwest of Knoxville, says doctors he knows recommended the academy. He says it made sense to him because he’s “migrating toward a leadership role in my own hospital.”
“My goal for coming was to kind of lay some foundation for skills and requirements that it takes to kind of migrate from just being a regular hospitalist to being one that’s got some extra responsibility,” Dr. Duzan says.
He was happy to learn more about “some of the jargon, lingo, that’s getting pushed our direction in terms of business drivers and the objectives” as well as “what would it be like to be the CEO, etc., and kind of putting us in their shoes, hearing things, seeing things and how they think about things, then developing plans.”
Jeet Gujral, MD, a hospitalist at Southside Hospital on Long Island, N.Y., says her motivation to learn about practice management is due in part to the new demands she is feeling because of the business considerations of the hospital. Talking with other hospitalists about their experiences was a big help, she says. In fact, she adds, that was probably even more helpful than the actual content of the session.
“I think what I’m getting more out of it [is that] there are several who are feeling the same heat,” she says. “It’s nice not feeling alone.”
Tom Collins is a freelance writer based in Florida.
MIAMI BEACH, Fla.—Muralidharan Reddy, MD, had just finished a five-hour class on the business concepts behind running a hospital and how a hospital CEO thinks—part of the entry-level curriculum at SHM’s Leadership Academy. As he stood up from the round table in a room still buzzing with conversation, he was glad he had signed up—in fact, he had been one of the first to arrive for the 7:30 a.m. session at the Fontainebleau resort.
“It improves my CV, number one,” says Dr. Reddy, a hospitalist at New England Baptist Hospital in Boston. “And it’s not just the CV, but I need the experience to guide me to work as a leader in a hospital group, or even plan on starting a group, or things like that. If I’m going to be a hospitalist, I have to work on trying to get those skills.”
A big plus, he adds, is “you get to learn from experts.”
The four-day academy provides hospitalists an intense learning experience. “Some of these skills, people learn it on the job or you get it through Academy,” Dr. Reddy says. “So I do both.”
Hospitalists who participate in the session repeatedly express concerns that if they don’t hone their understanding of the business aspects of the hospital and refine their skills in interacting with colleagues, they could be left behind in a fast-moving environment.
“I think it’s important,” said Mana Goshtasbi, MD, a hospitalist with Cogent HMG who has worked for two years at St. Joseph’s Hospital in Tampa, Fla. “I think that’s the direction. I think you have to know this stuff because of all the changes.”
Leadership Academy courses come in three levels, which build on one another: Foundations for Effective Leadership, Personal Leadership Excellence, and Strengthening Your Organization. Those who have completed the three levels can apply for certification, which requires completion of a pre-approved leadership project.
Know Your Value, Know Your Customers
In his first-level session, instructor Michael Guthrie, MD, MBA, executive in residence and adjunct professor at the University of Colorado Denver School of Business’ program in health administration, spent most of his presentation on his feet, wending his way among the tables, challenging the physician-students to think differently from the ways they’ve been trained to think about healthcare. That starts with stepping outside of themselves and taking a look at how they are viewed in terms of the hospital they’re working with as hospitalists, says Dr. Guthrie, former CEO of the Good Samaritan Health System in San Jose, Calif., and former COO for the Penrose-St. Francis Healthcare System in Colorado.
“What’s affecting the organization that you operate in, and what does that mean about the kinds of demands that are being made of you and requests that are being made of you?” he asks the attendees. “What does it mean about the value that’s received from the work that you do in that organization?”
A hospitalists’ value is a common theme. “What is it that you offer as hospitalists that has created a group of enthusiasts?” he asks. “What is it that you offer to any customer that’s of value to them that they would give up their hard-earned money in exchange for it? Who are your customers?”
A key “customer” group is primary-care physicians (PCPs) whose patients end up under a hospitalist’s care, he explains. They get value from the hospitalist in a variety of ways.
“That’s a more effective way for them to spend their life [at their own clinic],” he says. “They get to manage their schedule differently, they don’t have to drive. They are all exchange values. … There’s a very definite exchange going on here. If you fail in that exchange, we all know what would happen, right? They’d stop sending you patients.”
A physician chimes in: “If you’re the only hospitalist there, they don’t have a choice.”
Dr. Guthrie, quick to seize upon what he sees as a teaching moment, tells the group to “be careful.”
“In the short term, that’s absolutely true,” he says. “In the long term, there are a lot of other alternatives. And if there aren’t, someone will invent one. You see that’s the thing about our society—if there’s an opportunity with a whole, big, dissatisfied customer segment, somebody will notice and invent the way to satisfy their needs. That’s called capitalism.”
It’s what happened with the late Steve Jobs and the iPod, when he realized customers needed a way to easily access their music collections, Dr. Guthrie points out.
“He understood the dissatisfactions of the market,” he continues. “Before that, they didn’t have any choices.
“Healthcare is the same. But it’s a little more difficult to develop those choices. It’s hard to build a new hospital right in the middle of someplace where there’s only one hospital. So they invent other ways to do it, ways to get their patients taken care of: They travel.”
About 700,000 people flew to Southeast Asia last year for medical procedures, he says, making the point that American patients have options.
“Somewhat difficult, but they do have alternatives,” he says. “Customers will, when pushed hard enough, if dissatisfied enough, leave you, even when you think you have them trapped.”
Source: Hartman, M: Martin, A; McDonnell, P et al. (2009). National Helath Spending In 2007: Slower Drug Spending Contributes To Lowest Rate Of Overall Growth Since 1998. Health Affairs, Jan/Feb., p 247. www.healthaffairs.org). See also, Orzag, Peter; Congressional Budget Office (2008). Growth in Health Care Costs, testimony before the Sentae Budget Committee, Jan. 31, p.1. (www.cbo.gov/doc.cfm?index-8948). Center for Medicare & Medicaid Services, January 2011.
Think Tanks
A key part of the session is time set aside for group work, in which Dr. Guthrie gives the class an assignment and attendees tackle it at their tables as a unit. The first task is to identify business drivers at hospitals, what the objectives of the hospital should be in response to those things, and how those objectives affect the work of hospitalists.
Then the groups go to work. A few minutes later, though, Dr. Guthrie speaks up through the chatter.
“Let’s stop for a minute. I want to tell you that most of you are on completely the wrong track,” he says, drawing chuckles. “But this is part of the reason we do it this way. The idea here is to get outside of your head.”
One group lists “profit” as a business driver.
“Profit is not a business driver,” he says. “I know you’re sort of raised to think that way. It isn’t. It’s a measurement. It’s like blood pressure. So it is not a business driver. We use it as a measurement of the success with which we’re synthesizing the business drivers and the environment and meeting the objectives of those drivers, or those trends.”
Business drivers are more along the lines of government mandates and an aging population, which some of the groups had mentioned. “That’s the level of abstraction I want you get to,” he says. “Think out in the marketplace.”
When it comes down to it, Dr. Guthrie explains, the hospitalist plays a role in just about every measurement used to determine excellence at a hospital—from quality to customer loyalty, from retention of patients to productivity.
He also emphasizes the difference between how a doctor has been trained essentially to be an individual expert—patient presents a problem, doctor presents a solution—and how those trained to be managers and leaders operate through other people.
Leaders of the Future
Daniel Duzan, MD, a hospitalist for TeamHealth at Fort Loudoun Medical Center in Lenoir City, Tenn., southwest of Knoxville, says doctors he knows recommended the academy. He says it made sense to him because he’s “migrating toward a leadership role in my own hospital.”
“My goal for coming was to kind of lay some foundation for skills and requirements that it takes to kind of migrate from just being a regular hospitalist to being one that’s got some extra responsibility,” Dr. Duzan says.
He was happy to learn more about “some of the jargon, lingo, that’s getting pushed our direction in terms of business drivers and the objectives” as well as “what would it be like to be the CEO, etc., and kind of putting us in their shoes, hearing things, seeing things and how they think about things, then developing plans.”
Jeet Gujral, MD, a hospitalist at Southside Hospital on Long Island, N.Y., says her motivation to learn about practice management is due in part to the new demands she is feeling because of the business considerations of the hospital. Talking with other hospitalists about their experiences was a big help, she says. In fact, she adds, that was probably even more helpful than the actual content of the session.
“I think what I’m getting more out of it [is that] there are several who are feeling the same heat,” she says. “It’s nice not feeling alone.”
Tom Collins is a freelance writer based in Florida.
Survey Insights
SHM and the Medical Group Management Association (MGMA) have enjoyed a successful survey collaboration for the past two years. Working together under a survey collaboration agreement to jointly conduct comprehensive annual surveys of HM groups, the two entities have been able to provide an unprecedented amount of high-quality information for members—not only data about hospitalist compensation and productivity, but also about many other aspects of the ways hospitalists and HM groups function.
And while SHM’s relationship with MGMA remains strong, all good things must come to an end—or at least change considerably.
MGMA is headed in new strategic directions that require a reallocation of its existing survey operations department resources. As a result, SHM and MGMA have agreed to change the way they work together, and this will have some important implications for the types of compensation and productivity data that will be available to hospitalists in the future.
MGMA will continue to conduct its regular surveys, including capturing compensation and productivity data for hospitalists. But instead of incorporating a hospital medicine supplement as it has for the last two years, SHM will instead conduct a separate survey each year to collect additional information about the characteristics of HM practices.
The SHM survey will be launched in January to coincide with the launch of MGMA’s Physician Compensation and Production Survey; in fact, academic groups that participated in MGMA’s Academic Practice Compensation and Production Survey for Faculty and Management this fall might already have noticed that the survey no longer included a hospital medicine supplement. SHM is encouraging hospitalists to participate in both the applicable MGMA survey and the companion SHM survey.
SHM will then license MGMA’s compensation and productivity data for both academic and nonacademic hospitalists, then will combine it with the results of its separate SHM survey to create the 2012 State of Hospital Medicine report.
The good news is that this approach will enable SHM to have greater flexibility to design surveys and analyze results in ways that best meet the needs of its constituents, and SHM will also be able to continue to provide survey information annually, rather than going back to the old biannual format.
However, some of the more detailed looks at compensation and productivity data will be lost; those data glimpses only were possible when the supplemental survey was integrated with MGMA’s survey instruments. Such data for 2012 will only be available for national, hospital-employed vs. not-hospital-employed, and geographic region cohorts.
Like the hospitalists it surveys, this report has changed every time it has been conducted. And SHM depends on its members to make sure it is delivering the kind of information that effectively, efficiently, and profitably guides hospitalists’ decisions.
Together, SHM and MGMA have been working to find the right balance that enables MGMA to pursue new strategies and still gives hospitalists the data they need. Ultimately, hospitalists will be the judges of whether the right balance has been struck.
Please send your thoughts and feedback to [email protected].
Bayes Theorem? There's an App for That
A hospitalist at Beth Israel Deaconess Medical Center in Boston has created an iPhone application to help give academic HM groups fingertip access to Bayesian nomograms and real-time research.
Hospitalist Elizabeth Farrell, MD, says an app dubbed Medicine Toolkit (www.medicinetoolkit.com) should be available for download in a matter of weeks. The app has two components. The first is Bayes at the Bedside, a database of likelihood ratios (LRs) for more than 150 commonly used physical exam findings, labs, and imaging studies paired with an automated Bayesian nomogram to visually display the theorem and its application to clinical decision-making. The second piece of the program is Pocket Evidence, a compilation of more than 300 review articles, consensus guidelines, meta-analyses, and new and notable articles. Both components will be updated monthly.
“I really am envisioning it as a teaching tool and one that could be used by attendings to teach residents, interns, and medical students alike to facilitate critical thinking and evidence-based medicine,” Dr. Farrell says. “It can be used on rounds, in the clinic, or in the classroom.”
Dr. Farrell, a hospitalist for two years, had the idea to develop the application after printing out nomograms on index cards to use on rounds. She gave cards to team members and printed LRs on the back.
“It was a lot of fun, the team loved it, it worked great,” Dr. Farrell says. “But a lot of times I’d find that I ran out of the index cards, or someone on the team left theirs back in the workroom, or we didn’t have the LR for the test we were talking about. It resulted in a lot of missed teaching opportunities.”
ONLINE EXCLUSIVE: New Journal Chief Faces Myriad Challenges
Enter text here
Enter text here
Enter text here
ONLINE EXCLUSIVE: A Loss of Meaning Vs. a Sense of Calling
Enter text here
Enter text here
Enter text here
Policy Corner
Payment bundling may create new opportunities for hospitalists to start an important discussion with hospital executives. And forward-looking hospitalist leaders will use the new model to shape their own financial destinies.
The concept of payment bundling broadly means paying for healthcare with a single, comprehensive payment, which is intended to cover all services received by a patient. Due to the promise bundling holds when it comes to both cost containment and quality, the Affordable Care Act (ACA) includes a provision requiring the establishment of a voluntary national pilot program on payment bundling. This provision calls for bundled payments for 10 unnamed conditions by Jan. 1, 2013, and states that payment for each bundle will surround an episode of care consisting of three days prior to admission and 30 days post-hospital discharge. There is some flexibility built in because the ACA also allows for different episodes of care to be defined by the secretary of Health and Human Services.
Due to this flexibility, the discussion at SHM is probably similar to that of other forward-thinking organizations: What conditions would benefit from a hospitalist-led bundle and what is the appropriate episode of care?
In late August, the Centers for Medicare & Medicaid Services (CMS) and the Center for Medicare and Medicaid Innovation (CMMI) answered these questions with the introduction of the Bundled Payments for Care Improvement initiative. This initiative outlines four models as options for the bundling pilot while maintaining a degree of flexibility in the details for participating providers to define:
- The first model will cover all Medicare DRGs for inpatient hospital services.
- Model two will include hospital and physician inpatient and post-discharge services.
- Model three will be for post-discharge services only.
- Under the fourth model, CMS would make a single, prospective bundled payment that would encompass all services furnished during an inpatient stay by the hospital, physicians, and other practitioners.
With the exception of the first model, providers wishing to participate may propose the condition (or conditions) their bundle will cover, the episode of care, and even the measures they will use for quality purposes.
CMMI clearly is aiming for a high level of provider involvement in developing bundling models that will work, and the inpatient focus for three out of four bundling models means that hospitalists should be prepared to play a part. For example, at press time, a tight application deadline and an unclear return on investment posed potential barriers.
Nevertheless, the inpatient focus for three out of four bundling models means that hospitalists should be prepared to play a part. At a minimum, hospitalists should be prepared to negotiate their level of involvement and how they will get paid for their work, should their institutions participate. But there is nothing preventing hospitalists from taking the lead in bringing bundled payments to their institutions by approaching hospital administrators with their own bundle for a condition they will manage.
If your group or institution is planning to participate in the bundled payments initiative, please let us know by emailing [email protected].