User login
“Teachback” Reduces Readmissions for CHF Patients
A sking “teachback” questions to hospitalized chronic heart failure (CHF) patients at Lehigh Valley Health Network in Allentown, Pa., helps them better understand their condition, treatment, and post-discharge care—thereby impacting readmissions. In an abstract presented at HM11 in Dallas in May, CHF patients who received teachback had a 7.3% readmission rate in the first three months of 2011, compared with 9.7% for those who did not.
Teachback, according to hospitalist and lead author Michael Pistoria, DO, FACP, SFHM, represents “humble inquiry—the simple need and ability to ask patients: ‘Can you tell me what I said to you?’” The provider then needs to listen to the reply and confirm the understanding, he adds.
Lehigh Valley convened a multidisciplinary quality team to study transitions of care, with a subgroup focused on patient-caregiver education, Dr. Pistoria explains. “The first thing the patient-family caregiver education team looked at was how to identify the key learner,” he says. “We had assumed it was the patient, but that’s not always the person who needs to learn about managing the patient’s condition.”
The subgroup then developed a curriculum of questions to be asked sequentially over three days to test patients and their caregivers’ understanding of heart failure and need for reinforcement. These questions, drawing upon educational resources already used within the system, assess the key learner’s knowledge, attitudes about healthy behaviors, and how to incorporate those behaviors into effective self-care.
The teachback system was tested on a few patients, then disseminated to 1,400 nurses through Lehigh Valley’s professional e-learning network using a brief training video. “We learned that doing a good job of staff teaching is not enough, unless we go back and periodically revisit the issues and audit their performance,” Dr. Pistoria says. “In our system, starting with our nurses was the right approach. It’s important for everybody to take ownership of the initiative. It’s also important, from unit to unit, to ask the questions the same way.”
Subsequent analysis shows continued reductions in readmissions, Dr. Pistoria says. Lehigh Valley’s next targets for teachback are community-acquired pneumonia, myocardial infarction, hypoglycemia, COPD, and anti-coagulant treatment.
Documenting the Symptom Experience of Cancer Patients
Volume 9, Issue 6, November-December 2011, Pages 216-223
| doi:10.1016/j.suponc.2011.06.003 | How to Cite or Link Using DOI |
| Permissions & Reprints |
Original research
Teresa L. Deshields PhD ![]()
![]()
Received 11 January 2011; Accepted 9 June 2011. Available online 3 November 2011.
Abstract
Background
Cancer patients experience symptoms associated with their disease, treatment, and comorbidities. Symptom experience is complicated, reflecting symptom prevalence, frequency, and severity. Symptom burden is associated with treatment tolerance as well as patients' quality of life (QOL).
Objectives
The purpose of this study was to document the symptom experience and QOL of patients with commonly diagnosed cancers. The relationship between symptoms and QOL was also explored.
Methods
A convenience sample of patients with the five most common cancers at a comprehensive cancer center completed surveys assessing symptom experience (Memorial Symptom Assessment Survey) and QOL (Functional Assessment of Cancer Therapy). Patients completed surveys at baseline and at 3, 6, 9, and 12 months thereafter. This article describes the study's baseline findings.
Results
Surveys were completed by 558 cancer patients with breast, colorectal, gynecologic, lung, or prostate cancer. Patients reported an average of 9.1 symptoms, with symptom experience varying by cancer type. The mean overall QOL for the total sample was 85.1, with results differing by cancer type. Prostate cancer patients reported the lowest symptom burden and the highest QOL.
Limitations
The sample was limited in terms of racial diversity. Because of the method of recruitment, baseline data were collected 6–8 months after diagnosis, meaning that participants were at various stages of treatment.
Conclusions
The symptom experience of cancer patients varies widely depending on cancer type. Nevertheless, most patients report symptoms, regardless of whether or not they are currently receiving treatment. Patients' QOL is inversely related to their symptom burden.
Volume 9, Issue 6, November-December 2011, Pages 216-223
Volume 9, Issue 6, November-December 2011, Pages 216-223
| doi:10.1016/j.suponc.2011.06.003 | How to Cite or Link Using DOI |
| Permissions & Reprints |
Original research
Teresa L. Deshields PhD ![]()
![]()
Received 11 January 2011; Accepted 9 June 2011. Available online 3 November 2011.
Abstract
Background
Cancer patients experience symptoms associated with their disease, treatment, and comorbidities. Symptom experience is complicated, reflecting symptom prevalence, frequency, and severity. Symptom burden is associated with treatment tolerance as well as patients' quality of life (QOL).
Objectives
The purpose of this study was to document the symptom experience and QOL of patients with commonly diagnosed cancers. The relationship between symptoms and QOL was also explored.
Methods
A convenience sample of patients with the five most common cancers at a comprehensive cancer center completed surveys assessing symptom experience (Memorial Symptom Assessment Survey) and QOL (Functional Assessment of Cancer Therapy). Patients completed surveys at baseline and at 3, 6, 9, and 12 months thereafter. This article describes the study's baseline findings.
Results
Surveys were completed by 558 cancer patients with breast, colorectal, gynecologic, lung, or prostate cancer. Patients reported an average of 9.1 symptoms, with symptom experience varying by cancer type. The mean overall QOL for the total sample was 85.1, with results differing by cancer type. Prostate cancer patients reported the lowest symptom burden and the highest QOL.
Limitations
The sample was limited in terms of racial diversity. Because of the method of recruitment, baseline data were collected 6–8 months after diagnosis, meaning that participants were at various stages of treatment.
Conclusions
The symptom experience of cancer patients varies widely depending on cancer type. Nevertheless, most patients report symptoms, regardless of whether or not they are currently receiving treatment. Patients' QOL is inversely related to their symptom burden.
Volume 9, Issue 6, November-December 2011, Pages 216-223
Efficacy and Safety of Fentanyl Pectin Nasal Spray Compared with Immediate-Release Morphine Sulfate Tablets in the Treatment of Breakthrough Cancer Pain: A Multicenter, Randomized, Controlled, Double-Blind, Double-Dummy Multiple-Crossover Study
Volume 9, Issue 6, November-December 2011, Pages 224-231
| doi:10.1016/j.suponc.2011.07.004 | How to Cite or Link Using DOI |
| Permissions & Reprints |
Original research
Marie Fallon MB, ChB, MD, FRCP ![]()
![]()
Received 10 February 2011; Accepted 18 July 2011. Available online 3 November 2011.
Background
Immediate-release morphine sulfate (IRMS) remains the standard treatment for breakthrough cancer pain (BTCP), but its onset of effect does not match the rapid onset and short duration of most BTCP episodes.
Objective
This study will evaluate the efficacy/tolerability of fentanyl pectin nasal spray (FPNS) compared with IRMS for BTCP.
Methods
Patients (n = 110) experiencing one to four BTCP episodes/day while taking ≥60 mg/day oral morphine (or equivalent) for background cancer pain entered a double-blind, double-dummy (DB/DD), multiple-crossover study. Patients completing a titration phase (n = 84) continued to a DB/DD phase: 10 episodes of BTCP were randomly treated with FPNS and oral capsule placebo (five episodes) or IRMS and nasal spray placebo (5 episodes). The primary end point was pain intensity (P < .05 FPNS vs. IRMS) difference from baseline at 15 minutes (PID15). Secondary end points were onset of pain intensity (PI) decrease (≥1-point) and time to clinically meaningful pain relief (CMPR, ≥2-point PI decrease). Safety and tolerability were evaluated by adverse events (AEs) and nasal assessments. By-patient and by-episode analyses were completed.
Results
Compared with IRMS, FPNS significantly improved mean PID15 scores. 57.5% of FPNS-treated episodes significantly demonstrated onset of PI improvement by 5 minutes and 95.7% by 30 minutes. CMPR (≥2-point PI decrease) was seen in 52.4% of episodes by 10 minutes. Only 4.7% of patients withdrew from titration (2.4% in DB/DD phase) because of AEs; no significant nasal effects were reported.
Conclusion
FPNS was efficacious and well tolerated in the treatment of BTCP and provided faster onset of analgesia and attainment of CMPR than IRMS.
The authors acknowledge i3Research, which conducted the study; the technical and editorial support provided by Anita Chadha-Patel at ApotheCom; and the Fentanyl Nasal Spray Study 044 Investigators. This study was sponsored by Archimedes Development, Ltd.
Conflicts of interest Disclosure: All authors have completed and submitted the ICMJE Form for Disclosure of Potential Conflicts of Interest. Dr. Davies has served as a consultant for Archimedes and received support from Archimedes to travel to meetings to present trial data. No other conflicts of interest were reported.
![]()
Coordination of Care in Breast Cancer Survivors: An Overview
Volume 9, Issue 6, November-December 2011, Pages 210-215
| doi:10.1016/j.suponc.2011.06.008 | How to Cite or Link Using DOI |
| Permissions & Reprints |
How We Do It

TO READ THE ENTIRE ARTICLE, CLICK ON THE ADJACENT LINK TO THE PDF FILE
Abstract
The number of breast cancer survivors in the United States is increasing. With longer survival, there has been an increase in the complexity and duration of posttreatment care. Multidisciplinary care teams are needed to participate across the broad spectrum of issues that breast cancer survivors face. In this setting, the need for well-established patterns of communication between care providers is increasingly apparent. We have created a multidisciplinary approach to the management of breast cancer survivors to improve communication and education between providers and patients. This approach could be extended to the care and management of survivors of other types of cancer.
Case
Vitae
Dr. Peairs is from the Johns Hopkins School of Medicine, Baltimore, Maryland. |
Dr. Wolff is from the Johns Hopkins School of Medicine, Johns Hopkins Sidney Kimmel Comprehensive Cancer Center, Baltimore, Maryland. |
Dr. Olsenis from the Johns Hopkins School of Nursing, Baltimore, Maryland. |
Dr. Bantugis from the Johns Hopkins School of Medicine, Baltimore, Maryland. |
Dr. Shockney is from the Johns Hopkins School of Medicine, Johns Hopkins Sidney Kimmel Comprehensive Cancer Center, Baltimore, Maryland. |
Dr. Kantsiper is from the Johns Hopkins School of Medicine, Baltimore, Maryland. |
Dr. Carrino-Tamasi is from the Johns Hopkins Sidney Kimmel Comprehensive Cancer Center, Baltimore, Maryland. |
Dr. Snyder is from the Johns Hopkins School of Medicine, Baltimore, Maryland. |
Volume 9, Issue 6, November-December 2011, Pages 210-215
Volume 9, Issue 6, November-December 2011, Pages 210-215
| doi:10.1016/j.suponc.2011.06.008 | How to Cite or Link Using DOI |
| Permissions & Reprints |
How We Do It
TO READ THE ENTIRE ARTICLE, CLICK ON THE ADJACENT LINK TO THE PDF FILE
Abstract
The number of breast cancer survivors in the United States is increasing. With longer survival, there has been an increase in the complexity and duration of posttreatment care. Multidisciplinary care teams are needed to participate across the broad spectrum of issues that breast cancer survivors face. In this setting, the need for well-established patterns of communication between care providers is increasingly apparent. We have created a multidisciplinary approach to the management of breast cancer survivors to improve communication and education between providers and patients. This approach could be extended to the care and management of survivors of other types of cancer.
Case
Vitae
Dr. Peairs is from the Johns Hopkins School of Medicine, Baltimore, Maryland. |
Dr. Wolff is from the Johns Hopkins School of Medicine, Johns Hopkins Sidney Kimmel Comprehensive Cancer Center, Baltimore, Maryland. |
Dr. Olsenis from the Johns Hopkins School of Nursing, Baltimore, Maryland. |
Dr. Bantugis from the Johns Hopkins School of Medicine, Baltimore, Maryland. |
Dr. Shockney is from the Johns Hopkins School of Medicine, Johns Hopkins Sidney Kimmel Comprehensive Cancer Center, Baltimore, Maryland. |
Dr. Kantsiper is from the Johns Hopkins School of Medicine, Baltimore, Maryland. |
Dr. Carrino-Tamasi is from the Johns Hopkins Sidney Kimmel Comprehensive Cancer Center, Baltimore, Maryland. |
Dr. Snyder is from the Johns Hopkins School of Medicine, Baltimore, Maryland. |
Volume 9, Issue 6, November-December 2011, Pages 210-215
UPDATED: Vytorin Gets FDA Panel Nod for Some CKD Patients
[UPDATED]SILVER SPRING, MD. – Vytorin should be approved for preventing major vascular events in patients who have chronic kidney disease but are not on dialysis, according to a unanimous vote by a Food and Drug Administration advisory panel.
The panel also voted 10-6, however, that the safety and effectiveness data did not support approval of the combination of 10 mg of ezetimibe with 20 mg of simvastatin for the same indication in patients with end-stage renal disease who are on dialysis.
Their votes at the Nov. 2 meeting were based on the results of the Study of Heart and Renal Protection (SHARP), which evaluated the effects of reducing LDL cholesterol on the risk of coronary vascular disease in patients with chronic kidney disease who are at an increased risk of cardiovascular morbidity and mortality. About two-thirds of the patients in the trial were not on dialysis at baseline, and in these patients, there was a 23% reduction in the primary end point – the risk of a major vascular event (nonfatal MI or cardiac death, stroke, or a revascularization procedure that excluded dialysis access-related procedures) – compared with those on placebo over a mean of 5 years (Lancet 2011;377:2181-92).
But in the patients who were on dialysis at baseline, the risk was reduced by about 6% over placebo. Panelists who did not support approval in this group cited the lower degree of effectiveness, and the fact that end stage renal disease patients on dialysis are very different from predialysis patients – and that patients with ESRD in the United States are different than those elsewhere. They noted that only 4% of the patients in SHARP were in the United States, and management and outcomes of patients with ESRD are different in the United States than in other parts of the world.

Dr. Lamont Weide, chief of diabetes and endocrinology, at the University of Missouri, Kansas City, backed approval for predialysis patients, but not for those on dialysis. Like several other panelists, he also considered the results of two previous large studies of about 4,000 CKD patients on dialysis, which found no significant beneficial effects of treatment with other statins on cardiovascular outcomes. While these were three different studies with different agents and different entry criteria, he said that the results go in the same direction as SHARP, in a large group of patients "without any clear indication of benefit." Those studies were the 4D study (N. Engl. J. Med. 2005;353:238-48) and the AURORA study (N. Engl J. Med. 2009;360:1395-407).
Also splitting her votes, Dr. Julia Lewis, professor of medicine in the department of nephrology, Vanderbilt University, Nashville, referred to those two trials and added that she considers her dialysis patients considerably different than her clinic patients who are not on dialysis. She commended the SHARP study and investigators for "providing what I think is going to be a wonderful addition to the care of CKD patients. It is going to change care of CKD patients and prevent the bad [cardiovascular] outcomes that affect them," she said.
In the study overall, the risk of major vascular events was reduced by 16% among those treated with the combination as compared to those on placebo, which was primarily driven by a reduction in the revascularization component. Cancers and all-cause mortality were similar in treated patients and those on placebo, and the panel agreed there were no new safety concerns at the dose studied. (About one-quarter of those enrolled died during the study.)
Merck, the manufacturer of ezetimibe (Zetia) and Vytorin, filed for approval of the claim that 10 mg of ezetimibe plus 20 mg of simvastatin (in the fixed-dose combination pill or taken separately) reduces the risk of major cardiovascular events in patients with chronic kidney disease on the basis of the SHARP results. SHARP was funded by Merck and Schering-Plough, but was independently conducted by the Oxford (England) University Clinical Trials Service Unit. Ezetimibe was used to make it possible to use a lower dose of simvastatin in the CKD patients, who are at a greater risk of myopathy and other adverse effects of statins.
Panelists emphasized that the 10 mg of ezetimibe with the 20-mg dose of simvastatin was the dose combination studied and was shown to be safe, and that doses should not be increased in this population of patients.
The two drugs are only approved for lipid-lowering indications: Ezetimibe, a selective inhibitor of the absorption of intestinal cholesterol and related phytosterol marketed as Zetia, was approved by the FDA in 2002; Vytorin, a combination of ezetimibe and the HMG-CoA reductase inhibitor simvastatin was approved in 2004; simvastatin was approved in 1991.
The mean age of the patients in the SHARP trial was 61 years; they did not have a history of MI or coronary revascularization.
The six panelists who voted in favor of approval for patient not yet on dialysis and those on dialysis included Dr. William Hiatt, professor of medicine, division of cardiology, at the University of Colorado, Denver, voted in favor of approval for both populations, based on the overall trial results. The differences between the two populations could be explained in the Vytorin label, and "the consistency between the vascular and atherosclerotic events led me to believe that the overall trial had integrity and the various components of the primary outcome were relatively consistent," he said. "To deny an indication to extend to patients who are on chronic hemodialysis ... would not respect the totality of the data," he added.
Dr. Lawrence Hunsicker, professor of medicine in the nephrology division, and emeritus medical director of organ transplantation, University of Iowa, Iowa City, also voted in favor of approval for both groups, but added that the FDA should ensure that advertising and detailing of the product should reflect that "the data are far more clear for patients not on dialysis."
The FDA usually follows the recommendations of its advisory panels. Panel members have been cleared of disclosures, although in some cases, they are given a waiver-but not at this meeting.
[UPDATED]SILVER SPRING, MD. – Vytorin should be approved for preventing major vascular events in patients who have chronic kidney disease but are not on dialysis, according to a unanimous vote by a Food and Drug Administration advisory panel.
The panel also voted 10-6, however, that the safety and effectiveness data did not support approval of the combination of 10 mg of ezetimibe with 20 mg of simvastatin for the same indication in patients with end-stage renal disease who are on dialysis.
Their votes at the Nov. 2 meeting were based on the results of the Study of Heart and Renal Protection (SHARP), which evaluated the effects of reducing LDL cholesterol on the risk of coronary vascular disease in patients with chronic kidney disease who are at an increased risk of cardiovascular morbidity and mortality. About two-thirds of the patients in the trial were not on dialysis at baseline, and in these patients, there was a 23% reduction in the primary end point – the risk of a major vascular event (nonfatal MI or cardiac death, stroke, or a revascularization procedure that excluded dialysis access-related procedures) – compared with those on placebo over a mean of 5 years (Lancet 2011;377:2181-92).
But in the patients who were on dialysis at baseline, the risk was reduced by about 6% over placebo. Panelists who did not support approval in this group cited the lower degree of effectiveness, and the fact that end stage renal disease patients on dialysis are very different from predialysis patients – and that patients with ESRD in the United States are different than those elsewhere. They noted that only 4% of the patients in SHARP were in the United States, and management and outcomes of patients with ESRD are different in the United States than in other parts of the world.
Dr. Lamont Weide, chief of diabetes and endocrinology, at the University of Missouri, Kansas City, backed approval for predialysis patients, but not for those on dialysis. Like several other panelists, he also considered the results of two previous large studies of about 4,000 CKD patients on dialysis, which found no significant beneficial effects of treatment with other statins on cardiovascular outcomes. While these were three different studies with different agents and different entry criteria, he said that the results go in the same direction as SHARP, in a large group of patients "without any clear indication of benefit." Those studies were the 4D study (N. Engl. J. Med. 2005;353:238-48) and the AURORA study (N. Engl J. Med. 2009;360:1395-407).
Also splitting her votes, Dr. Julia Lewis, professor of medicine in the department of nephrology, Vanderbilt University, Nashville, referred to those two trials and added that she considers her dialysis patients considerably different than her clinic patients who are not on dialysis. She commended the SHARP study and investigators for "providing what I think is going to be a wonderful addition to the care of CKD patients. It is going to change care of CKD patients and prevent the bad [cardiovascular] outcomes that affect them," she said.
In the study overall, the risk of major vascular events was reduced by 16% among those treated with the combination as compared to those on placebo, which was primarily driven by a reduction in the revascularization component. Cancers and all-cause mortality were similar in treated patients and those on placebo, and the panel agreed there were no new safety concerns at the dose studied. (About one-quarter of those enrolled died during the study.)
Merck, the manufacturer of ezetimibe (Zetia) and Vytorin, filed for approval of the claim that 10 mg of ezetimibe plus 20 mg of simvastatin (in the fixed-dose combination pill or taken separately) reduces the risk of major cardiovascular events in patients with chronic kidney disease on the basis of the SHARP results. SHARP was funded by Merck and Schering-Plough, but was independently conducted by the Oxford (England) University Clinical Trials Service Unit. Ezetimibe was used to make it possible to use a lower dose of simvastatin in the CKD patients, who are at a greater risk of myopathy and other adverse effects of statins.
Panelists emphasized that the 10 mg of ezetimibe with the 20-mg dose of simvastatin was the dose combination studied and was shown to be safe, and that doses should not be increased in this population of patients.
The two drugs are only approved for lipid-lowering indications: Ezetimibe, a selective inhibitor of the absorption of intestinal cholesterol and related phytosterol marketed as Zetia, was approved by the FDA in 2002; Vytorin, a combination of ezetimibe and the HMG-CoA reductase inhibitor simvastatin was approved in 2004; simvastatin was approved in 1991.
The mean age of the patients in the SHARP trial was 61 years; they did not have a history of MI or coronary revascularization.
The six panelists who voted in favor of approval for patient not yet on dialysis and those on dialysis included Dr. William Hiatt, professor of medicine, division of cardiology, at the University of Colorado, Denver, voted in favor of approval for both populations, based on the overall trial results. The differences between the two populations could be explained in the Vytorin label, and "the consistency between the vascular and atherosclerotic events led me to believe that the overall trial had integrity and the various components of the primary outcome were relatively consistent," he said. "To deny an indication to extend to patients who are on chronic hemodialysis ... would not respect the totality of the data," he added.
Dr. Lawrence Hunsicker, professor of medicine in the nephrology division, and emeritus medical director of organ transplantation, University of Iowa, Iowa City, also voted in favor of approval for both groups, but added that the FDA should ensure that advertising and detailing of the product should reflect that "the data are far more clear for patients not on dialysis."
The FDA usually follows the recommendations of its advisory panels. Panel members have been cleared of disclosures, although in some cases, they are given a waiver-but not at this meeting.
FROM A MEETING OF THE FDA’S ENDOCRINOLOGIC AND METABOLIC DRUGS ADVISORY PANEL
Wasted Effort?
A research team reports in the Annals of Internal Medicine (2011;155:520-528) that of the 43 recent English-language studies of care-transition strategies they reviewed, none was associated with a reduced risk for 30-day rehospitalization.
The team, from Northwestern Feinberg School of Medicine in Chicago, defined 12 distinct activities done before, after, and during hospital discharge to reduce readmissions. The activities might be familiar to hospitalists who follow this subject, such as medication reconciliation, scheduling of follow-up appointments before discharge, placing follow-up phone calls, and the use of transitions coaches.
As with many such reviews, the Annals article leaves open the question of whether this negative finding reflects limitations in the research literature, "or does it reflect an absolute truth about care-transitions strategies?" says lead author Luke Hansen, MD, MHS. "So you have to make inferences. But we clearly don't have a strong research base."
The study is timely, as many HM groups are preparing for a Medicare policy to start in October 2012 that would penalize hospitals with higher-than-expected readmission rates.
"Hospitals have to change, but unfortunately they'll have to do it without a lot of evidence," Dr. Hansen says. "You probably will have to bundle several strategies together, and the more components you include, the more likely you are to achieve the needed cultural change."
In the Literature: Research You Need to Know
Clinical question: When do venous thromboembolism (VTE) events occur after cancer surgery?
Background: Cancer is a known risk factor for VTE. Prophylaxis for VTE after cancer surgery is commonly stopped at the time of hospital discharge despite evidence for extended-duration treatment.
Study design: Retrospective cohort.
Setting: Patients reported to the American College of Surgeons National Surgical Quality Improvement Program (ACS NSQIP) database.
Synopsis: The authors examined the records of 46,656 patients who underwent surgery for one of nine specified cancers. Overall VTE rate was 1.6% (1.0% deep venous thrombosis and 0.6% pulmonary embolism), with 33.4% of VTE events occurring after hospital discharge. VTE risk was highest after esophagogastric and hepatopancreaticobiliary surgery, followed by lung, rectum, ovary/uterus, colon, and prostate. Breast and thyroid/parathyroid surgeries had the lowest incidence of VTE. VTE was associated with increased 30-day mortality. Use of VTE prophylaxis during or after hospitalization was not recorded.
Bottom line: Elevated VTE risk persists following hospital discharge after cancer surgery and consideration should be given to extended-duration thromboprophylaxis. Optimal duration of prophylaxis and its risks and benefits remain poorly defined.
Citation: Merkow RP, Bilimoria KY, McCarter MD, et al. Post-discharge venous thromboembolism after cancer surgery: extending the case for extended prophylaxis. Ann Surg. 2011;254:131-137.
For more physician reviews of HM-related literature, visit our website.
Expectations Exceeded
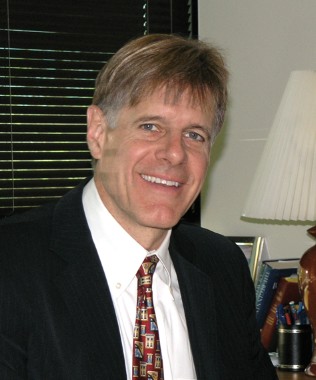
When HM pioneers identified potential candidates to become editor-in-chief of a new peer-reviewed journal dedicated to their specialty, they found themselves working from a short list. The term “hospitalist” had been part of the American healthcare lexicon for less than a decade, and only a select few in the young field possessed the leadership, management experience, and research credibility to fill the role.
Mark Williams, MD, FACP, FHM, then a professor and director of the hospital medicine unit at Emory University School of Medicine in Atlanta, met the criteria. He also demonstrated two attributes that distinguished him from other finalists. First, he understood the Journal of Hospital Medicine’s mission, having led an SHM task force that created a development plan for the publication. More importantly, he had the personality to sell JHM as a valuable tool for researchers and frontline hospitalists long before the first issue rolled off the press, says Robert Wachter, MD, MHM, professor and associate chairman of the Department of Medicine at the University of California at San Francisco (UCSF), chief of the division of hospital medicine and chief of medical service at UCSF Medical Center, and one of the HM leaders who advocated for the journal’s launch.
“The early phase is particularly tricky in that you are trying to get an entire specialty interested in something that is conceptual,” Dr. Wachter says. “If you can’t, you don’t ever develop the momentum to build the thing you’re talking about. If you can, you get people excited and jazzed about it before it’s real, so when it becomes real, you have accomplished, talented people truly engaged. The latter was the experience with Mark.”
Dr. Williams did more than generate excitement. He assembled a diverse editorial team and developed a comprehensive content plan that, over the next six years, helped JHM evolve into a frequently cited, well-respected publication.
“It has exceeded my expectations,” Dr. Wachter says, “and my expectations were pretty high.”
Getting Off the Ground
By the turn of the century, HM achieved many of the milestones its leaders believed were necessary to solidify itself as a specialty—it had formed a society, published textbooks, and held regular conferences. The next step, they believed, was the launch of a peer-reviewed journal.
Discussions continued for a few years until proponents believed a sizable readership base existed, and that HM had enough established researchers and authors to sustain a journal. In March 2005, SHM appointed Dr. Williams, who had reviewed and written journal articles but never served as an editor, as JHM ’s editor-in-chief and scheduled a February 2006 launch.
“Off we went, with me not really having any clear idea what I was getting myself into,” says Dr. Williams, a former SHM president who now is a professor and chief of the Division of Hospital Medicine at Northwestern University’s Feinberg School of Medicine in Chicago.
He immediately immersed himself in other top-tier journals he hoped to emulate. He also began formulating strategies to tackle two significant challenges. The first—promoting the publication—meshed perfectly with his persona, says Vineet Arora, MD, FHM, assistant dean for scholarship and discovery at the University of Chicago’s Pritzker School of Medicine.
During HM05 in Chicago, Dr. Williams handed out business cards to annual meeting attendees and encouraged every presenter to submit his or her research to the journal.
“Everyone was so excited to meet him and to find out there was a home for their work,” Dr. Arora recalls. “Mark was really successful, right from the start, at building those bridges and making sure everybody felt part of the team.”
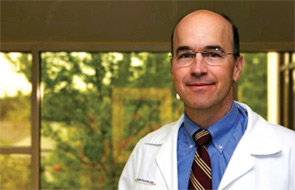
—Brian Harte, MD, SFHM, chief operating officer, Hillcrest Hospital, chairman of hospital medicine, Cleveland Clinic, JHM deputy editor
The second challenge—lining up content for the inaugural issue—proved easier than anticipated. Diane Meier, MD, FACP, an internationally recognized expert on palliative care, and C. Seth Landefeld, MD, FACP, chief of the Division of Geriatrics at UCSF, submitted review articles. Christine Cassel, MD, FACP, president and CEO of the American Board of Internal Medicine, wrote an editorial. Diane Payne, publications director for the Board of Regents for the University System of Georgia, submitted what remains Dr. Williams’ favorite JHM article, a patient commentary titled “Hospitals Foreign Soil for Those Who Don’t Work There.”
The first issue also included The Core Competencies in Hospital Medicine: A Framework for Curriculum Development, a blueprint created by SHM to help medical schools and post-graduate programs develop standardized curricula for teaching HM. The supplement remains the most-cited article in JHM history.
“We were told over and over the biggest problem we’d face would be getting enough content,” Dr. Williams says. “We were flooded with content from day one. That tells me we probably could have started this journal a year or two earlier, but this ensured our success.”
Success from the Start
JHM ’s success continued beyond the inaugural issue. Less than a year after the launch, it was selected for indexing and inclusion in MEDLINE, a U.S. National Library of Medicine bibliographic database that contains more than 18 million references to journal articles in medicine and other life sciences.
In summer 2009, it received a debut 3.163 Impact Factor, an industry metric that calculates average citations received by peer-reviewed journals. The score ranked JHM in the top 20% of its cohort, a stronger-than-expected showing for a journal in its fourth year of publication.
An increasing amount of original research helped JHM become a valuable educational tool, and nearly 10,000 journal articles have been downloaded since its inception, Dr. Williams says.
The journal’s clinical vignettes and articles that explain how political developments affect HM are especially beneficial, says James Neviackas, MD, a hospitalist at Decatur Memorial Hospital in Illinois. The format also serves hospitalists well.
“The articles are short and hard-hitting, so they enable me to get as much information as I can in as little time as possible,” Dr. Neviackas says.
Dr. Williams deserves credit for making the journal a viable and valuable publication, says Dana P. Edelson, MD, FHM, assistant professor at The University of Chicago’s Department of Medicine and a JHM assistant editor.
“To build it from nothing into a well-regarded academic journal in a matter of few years is pretty amazing,” Dr. Edelson says. “From a success standpoint, it’s truly remarkable.”
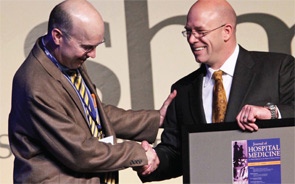
—Mark Williams, MD, SFHM, professor, chief, division of hospital medicine, Feinberg School of Medicine, Northwestern University, Chicago, former SHM president, JHM editor-in-chief, 2006-2011
Dr. Williams inspires members of his editorial staff “to bring their A game” by giving them considerable authority, valuing their opinions, and demonstrating a willingness to support their decisions, even when they risk angering authors whose articles are rejected, Dr. Edelson says.
“Mark has shown a combination of operational capabilities, organizational skills, and servant leadership that is really inspirational,” adds deputy editor Brian Harte, MD, SFHM, chief operating officer of Hillcrest Hospital in Ohio and chairman of hospital medicine at The Cleveland Clinic. “He sets the strategic vision and empowers his team to execute. He is always open, and he encourages ideas. He’s a facilitator, which is what a great leader is.”
Dr. Williams, in turn, credits the support of JHM ’s publisher, John Wiley & Sons Inc., which also publishes The Hospitalist, and his editorial team for the journal’s achievements. He also praises his team for ensuring his greatest fear—constant complaints from authors whose papers were rejected—never came to fruition.
“I thought I’d get nasty emails saying, ‘Why are you rejecting my article? Clearly you don’t understand what I’m doing,’” Dr. Williams says. “Invariably, I get emails along the lines of, ‘Thank you so much for carefully reviewing the article. I deeply appreciate the insightful comments from the reviewers.’
“That has been very rewarding,” he adds. “It demonstrates we have done a terrific job of candidly and fairly reviewing articles … and that the amount of effort we put into providing those reviews is recognized and welcomed and appreciated.”
The Transition
Dr. Williams will serve as the journal’s editor-in-chief through the end of the year. Andrew Auerbach, MD, MPH, SFHM, associate professor of medicine at UCSF and director of research for the Division of Hospital Medicine, will take over in January.
Dr. Auerbach, who will serve a five-year term, says Dr. Williams has “done a remarkable job” developing HM’s only peer-reviewed journal. “He raised the visibility of the journal inside the field of hospital medicine and outside,” Dr. Auerbach says. “He built a publication that is really aligned with what hospitalists are doing and what they want to do.”
Dr. Williams is helping Dr. Auerbach develop a strategic plan for the first 18 months of his term, but he looks forward to having more time to mentor junior faculty at Northwestern. He’ll leave the editor’s chair with two pieces of unfinished business: The economic downturn thwarted his effort to increase JHM ’s publishing frequency from nine to 12 times a year, a move he hopes is made next year; he also fell short of his goal to feature regular patient commentaries, such as Diane Payne’s editorial in the inaugural issue.
Although he takes pride in the journal’s cover design, which includes three photos that he says convey HM is about caring for people, he hopes patients’ voices are better represented in future issues.
“We’re all about taking care of patients. That’s our purpose,” he says. “Too often, health care providers get busy and they forget that. They don’t realize how difficult it is for patients to go through the struggles of obtaining healthcare and being in a hospital when they are incredibly sick.”
‘A Big Tent’
Despite the challenges associated with starting a journal from scratch, Dr. Williams says his six years at the helm went more smoothly than he could have imagined. The effort has paid off.
JHM’s Impact Factor, although down from its debut figure, rose to 1.951 last year from 1.496 in 2009, ranking it 40th out of 151 journals in its cohort.
The success, Dr. Wachter says, shows Dr. Williams was the right choice to lead JHM from birth through toddlerhood.
More importantly, Dr. Williams embraced the vision of HM leaders who believed the journal needed to be a big tent in order to succeed. “We wanted to try to somehow hit the sweet spot of being relevant and interesting to folks who practice hospital medicine in a wide array of circumstances,” Dr. Wachter says, “while also being a go-to place for researchers to submit their research. That was ambitious, and that could have failed in all sorts of directions. It could have been quite relevant to clinicians, but not rigorous enough for researchers. It could have been perfect for researchers, but the clinicians could have felt it wasn’t relative to their day-to-day life. I think the journal has done a masterful job negotiating that tight wire.”
Mark Leiser is a freelance writer based in New Jersey.
When HM pioneers identified potential candidates to become editor-in-chief of a new peer-reviewed journal dedicated to their specialty, they found themselves working from a short list. The term “hospitalist” had been part of the American healthcare lexicon for less than a decade, and only a select few in the young field possessed the leadership, management experience, and research credibility to fill the role.
Mark Williams, MD, FACP, FHM, then a professor and director of the hospital medicine unit at Emory University School of Medicine in Atlanta, met the criteria. He also demonstrated two attributes that distinguished him from other finalists. First, he understood the Journal of Hospital Medicine’s mission, having led an SHM task force that created a development plan for the publication. More importantly, he had the personality to sell JHM as a valuable tool for researchers and frontline hospitalists long before the first issue rolled off the press, says Robert Wachter, MD, MHM, professor and associate chairman of the Department of Medicine at the University of California at San Francisco (UCSF), chief of the division of hospital medicine and chief of medical service at UCSF Medical Center, and one of the HM leaders who advocated for the journal’s launch.
“The early phase is particularly tricky in that you are trying to get an entire specialty interested in something that is conceptual,” Dr. Wachter says. “If you can’t, you don’t ever develop the momentum to build the thing you’re talking about. If you can, you get people excited and jazzed about it before it’s real, so when it becomes real, you have accomplished, talented people truly engaged. The latter was the experience with Mark.”
Dr. Williams did more than generate excitement. He assembled a diverse editorial team and developed a comprehensive content plan that, over the next six years, helped JHM evolve into a frequently cited, well-respected publication.
“It has exceeded my expectations,” Dr. Wachter says, “and my expectations were pretty high.”
Getting Off the Ground
By the turn of the century, HM achieved many of the milestones its leaders believed were necessary to solidify itself as a specialty—it had formed a society, published textbooks, and held regular conferences. The next step, they believed, was the launch of a peer-reviewed journal.
Discussions continued for a few years until proponents believed a sizable readership base existed, and that HM had enough established researchers and authors to sustain a journal. In March 2005, SHM appointed Dr. Williams, who had reviewed and written journal articles but never served as an editor, as JHM ’s editor-in-chief and scheduled a February 2006 launch.
“Off we went, with me not really having any clear idea what I was getting myself into,” says Dr. Williams, a former SHM president who now is a professor and chief of the Division of Hospital Medicine at Northwestern University’s Feinberg School of Medicine in Chicago.
He immediately immersed himself in other top-tier journals he hoped to emulate. He also began formulating strategies to tackle two significant challenges. The first—promoting the publication—meshed perfectly with his persona, says Vineet Arora, MD, FHM, assistant dean for scholarship and discovery at the University of Chicago’s Pritzker School of Medicine.
During HM05 in Chicago, Dr. Williams handed out business cards to annual meeting attendees and encouraged every presenter to submit his or her research to the journal.
“Everyone was so excited to meet him and to find out there was a home for their work,” Dr. Arora recalls. “Mark was really successful, right from the start, at building those bridges and making sure everybody felt part of the team.”
—Brian Harte, MD, SFHM, chief operating officer, Hillcrest Hospital, chairman of hospital medicine, Cleveland Clinic, JHM deputy editor
The second challenge—lining up content for the inaugural issue—proved easier than anticipated. Diane Meier, MD, FACP, an internationally recognized expert on palliative care, and C. Seth Landefeld, MD, FACP, chief of the Division of Geriatrics at UCSF, submitted review articles. Christine Cassel, MD, FACP, president and CEO of the American Board of Internal Medicine, wrote an editorial. Diane Payne, publications director for the Board of Regents for the University System of Georgia, submitted what remains Dr. Williams’ favorite JHM article, a patient commentary titled “Hospitals Foreign Soil for Those Who Don’t Work There.”
The first issue also included The Core Competencies in Hospital Medicine: A Framework for Curriculum Development, a blueprint created by SHM to help medical schools and post-graduate programs develop standardized curricula for teaching HM. The supplement remains the most-cited article in JHM history.
“We were told over and over the biggest problem we’d face would be getting enough content,” Dr. Williams says. “We were flooded with content from day one. That tells me we probably could have started this journal a year or two earlier, but this ensured our success.”
Success from the Start
JHM ’s success continued beyond the inaugural issue. Less than a year after the launch, it was selected for indexing and inclusion in MEDLINE, a U.S. National Library of Medicine bibliographic database that contains more than 18 million references to journal articles in medicine and other life sciences.
In summer 2009, it received a debut 3.163 Impact Factor, an industry metric that calculates average citations received by peer-reviewed journals. The score ranked JHM in the top 20% of its cohort, a stronger-than-expected showing for a journal in its fourth year of publication.
An increasing amount of original research helped JHM become a valuable educational tool, and nearly 10,000 journal articles have been downloaded since its inception, Dr. Williams says.
The journal’s clinical vignettes and articles that explain how political developments affect HM are especially beneficial, says James Neviackas, MD, a hospitalist at Decatur Memorial Hospital in Illinois. The format also serves hospitalists well.
“The articles are short and hard-hitting, so they enable me to get as much information as I can in as little time as possible,” Dr. Neviackas says.
Dr. Williams deserves credit for making the journal a viable and valuable publication, says Dana P. Edelson, MD, FHM, assistant professor at The University of Chicago’s Department of Medicine and a JHM assistant editor.
“To build it from nothing into a well-regarded academic journal in a matter of few years is pretty amazing,” Dr. Edelson says. “From a success standpoint, it’s truly remarkable.”
—Mark Williams, MD, SFHM, professor, chief, division of hospital medicine, Feinberg School of Medicine, Northwestern University, Chicago, former SHM president, JHM editor-in-chief, 2006-2011
Dr. Williams inspires members of his editorial staff “to bring their A game” by giving them considerable authority, valuing their opinions, and demonstrating a willingness to support their decisions, even when they risk angering authors whose articles are rejected, Dr. Edelson says.
“Mark has shown a combination of operational capabilities, organizational skills, and servant leadership that is really inspirational,” adds deputy editor Brian Harte, MD, SFHM, chief operating officer of Hillcrest Hospital in Ohio and chairman of hospital medicine at The Cleveland Clinic. “He sets the strategic vision and empowers his team to execute. He is always open, and he encourages ideas. He’s a facilitator, which is what a great leader is.”
Dr. Williams, in turn, credits the support of JHM ’s publisher, John Wiley & Sons Inc., which also publishes The Hospitalist, and his editorial team for the journal’s achievements. He also praises his team for ensuring his greatest fear—constant complaints from authors whose papers were rejected—never came to fruition.
“I thought I’d get nasty emails saying, ‘Why are you rejecting my article? Clearly you don’t understand what I’m doing,’” Dr. Williams says. “Invariably, I get emails along the lines of, ‘Thank you so much for carefully reviewing the article. I deeply appreciate the insightful comments from the reviewers.’
“That has been very rewarding,” he adds. “It demonstrates we have done a terrific job of candidly and fairly reviewing articles … and that the amount of effort we put into providing those reviews is recognized and welcomed and appreciated.”
The Transition
Dr. Williams will serve as the journal’s editor-in-chief through the end of the year. Andrew Auerbach, MD, MPH, SFHM, associate professor of medicine at UCSF and director of research for the Division of Hospital Medicine, will take over in January.
Dr. Auerbach, who will serve a five-year term, says Dr. Williams has “done a remarkable job” developing HM’s only peer-reviewed journal. “He raised the visibility of the journal inside the field of hospital medicine and outside,” Dr. Auerbach says. “He built a publication that is really aligned with what hospitalists are doing and what they want to do.”
Dr. Williams is helping Dr. Auerbach develop a strategic plan for the first 18 months of his term, but he looks forward to having more time to mentor junior faculty at Northwestern. He’ll leave the editor’s chair with two pieces of unfinished business: The economic downturn thwarted his effort to increase JHM ’s publishing frequency from nine to 12 times a year, a move he hopes is made next year; he also fell short of his goal to feature regular patient commentaries, such as Diane Payne’s editorial in the inaugural issue.
Although he takes pride in the journal’s cover design, which includes three photos that he says convey HM is about caring for people, he hopes patients’ voices are better represented in future issues.
“We’re all about taking care of patients. That’s our purpose,” he says. “Too often, health care providers get busy and they forget that. They don’t realize how difficult it is for patients to go through the struggles of obtaining healthcare and being in a hospital when they are incredibly sick.”
‘A Big Tent’
Despite the challenges associated with starting a journal from scratch, Dr. Williams says his six years at the helm went more smoothly than he could have imagined. The effort has paid off.
JHM’s Impact Factor, although down from its debut figure, rose to 1.951 last year from 1.496 in 2009, ranking it 40th out of 151 journals in its cohort.
The success, Dr. Wachter says, shows Dr. Williams was the right choice to lead JHM from birth through toddlerhood.
More importantly, Dr. Williams embraced the vision of HM leaders who believed the journal needed to be a big tent in order to succeed. “We wanted to try to somehow hit the sweet spot of being relevant and interesting to folks who practice hospital medicine in a wide array of circumstances,” Dr. Wachter says, “while also being a go-to place for researchers to submit their research. That was ambitious, and that could have failed in all sorts of directions. It could have been quite relevant to clinicians, but not rigorous enough for researchers. It could have been perfect for researchers, but the clinicians could have felt it wasn’t relative to their day-to-day life. I think the journal has done a masterful job negotiating that tight wire.”
Mark Leiser is a freelance writer based in New Jersey.
A New Direction
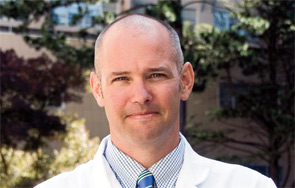
Andrew Auerbach, MD, MPH, SFHM, is an associate professor at one of the most highly regarded academic medical centers in the country, and he is a nationally respected researcher whose work has been published in prominent scientific publications.
His peers believe both roles prepared him well for his newest endeavor: editor-in-chief of the Journal of Hospital Medicine. His five-year term begins in January.
Dr. Auerbach’s affiliation with the University of California at San Francisco (UCSF), where he also serves as director of research for the division of hospital medicine and associate director of the General Medicine Research Fellowship, lends instant legitimacy to the journal, editorial team members say. His research has focused on evaluation of care-delivery models and methods for improving the measurement of quality of care.
That background, medical publishing experts believe, gives Dr. Auerbach a foundation in scientific accuracy and reporting transparency that is integral to a new editor’s effort to expand a journal’s reach and increase the quality of work it publishes.
Dr. Auerbach intends to do both, continuing JHM’s growth and solidifying it as the go-to resource for hospitalists. “It is an incredibly good platform for hospitalists to publish their work,” he adds. “I want people to look back at the journal in five years and say it’s even better than it is now.”
As Dr. Auerbach prepares to take over as editor-in-chief, he is focusing his efforts on how to best build on the success the journal has enjoyed since its 2006 launch.
“JHM’s core values are to reflect the field of hospital medicine broadly, to provide a venue where the field’s current scholarly work can be published, and to provide a point of reference for where future scholarly work might be directed and published,” he says. “JHM has been very successful at the first two. I think there is an opportunity to be somewhat more strategic in providing the reference point for future research directions, largely through the input of the editorial team and by paying close attention to JHM readers.”
The Right Choice
An eight-person committee embarked on a five-month search to identify the ideal candidate to replace JHM ’s founding editor-in-chief, Mark Williams, MD, FACP, FHM. The intense process reflected the search committee’s goal that the new editor strengthen the journal and the society it represents, says committee member Harold C. Sox, MD, MACP, a noted internist and author who served as editor of Annals of Internal Medicine from 2001 to 2009.
“A journal published by a professional organization is far and away the most visible manifestation of the organization and its values and ambitions,” Dr. Sox says. “The appointment was anything but pro forma. It had to be the right choice.”
Committee members wanted to select a physician who had a strong scientific background, the judgment required to be a leader, and a desire to better position the journal as a source for first-rate articles in the competitive landscape of medical publishing, Dr. Sox says. They also searched for a candidate who had considerable experience writing for publication.
Dr. Auerbach, who served as deputy editor of the Journal of General Internal Medicine from 2004 to 2007 and as a JHM reviewer, has been published in the New England Journal of Medicine, the Journal of the American Medical Association, Annals of Internal Medicine, and the Archives of Internal Medicine.
As editor of Annals, Dr. Sox shared responsibility for publishing two of Dr. Auerbach’s articles.
“I know something about how Dr. Auerbach thinks about science and about his own personal scientific standards—wanting to get it right, writing it in a way that people know exactly what happened, and interpreting the results in a way that will stand up over time, rather than trying to read too much into the results,” Dr. Sox says. “We also talked with some of the candidates about their strategy for trying to make the journal better, and I thought he showed himself to be very analytic and strategic in his thinking. I’m confident he’s going to move the journal forward.”
Dr. Auerbach believes his experience as a deputy editor and his mentoring role at UCSF, which requires him to provide constructive feedback on investigators’ papers, has prepared him for his new role.
“I have a good sense for how to approach the review process with the goal of getting a paper to the point where it can be accepted into a journal and, if not, have it leave the review process much better than it was when it arrived,” he says.
His research background also complements his new role, he says.
“Research is a way to take care of patients I never see and to disseminate things that are broadly applicable … that other people can look at and use to improve their healthcare delivery,” he says. “I see the journal as doing many of the same things.”
Strategies for Success
Dr. Auerbach, who has worked closely with Dr. Williams in recent months to ensure a smooth transition, says he does not intend to make substantial changes to the journal’s focus. But he is formulating strategies to make it more valuable and relevant to the hospitalists it serves.
Increasing the journal’s Impact Factor—currently 1.951, ranking it 40th out of 151 publications in its cohort—is one way to increase JHM ’s value, making it a destination for the highest-quality research, Dr. Auerbach says.
He also intends to solicit as many scholarly works as possible, employing “a marketing strategy and recruitment strategy all in one” to make sure JHM is on researchers’ short list of publications in which they consider submitting their work.

—Robert Wachter, MD, MHM, professor, associate chair, Department of Medicine, University of California at San Francisco, chief, division of hospital medicine, chief, medical service, UCSF Medical Center, former SHM president
He wants to take advantage of the growing number of hospitalists who are doing research and expand the journal’s reach beyond its traditional peer groups. “Are there intensive-care doctors, pulmonologists, cardiologists, or infectious-disease doctors who are doing work with hospitalists—or work that would align with hospital medicine—that could be published in JHM?” Dr. Auerbach asks, rhetorically.
He intends to empower members of his editorial team to serve as JHM ambassadors who promote the journal at professional meetings and encourage investigators who are pursuing interesting projects to submit their findings.
Dr. Auerbach expects to devise other content strategies in consultation with members of his editorial team. Certain aspects of content, such as case reports and scholarly reviews of conundrums in HM cases, could be enhanced, he says. Specific sections of the journal could be developed for effectiveness research or implementation research.
He also says he wants the journal to explore new content areas so that it appeals to readers who aren’t interested in randomized controlled trials.
He hopes to put the journal in the position to publish work supported by such new initiatives as the Patient-Centered Outcomes Research Institute and the Centers for Medicare & Medicaid Services’ Center for Medicare and Medicaid Innovation.
That might mean providing editorials or inviting papers that outline the importance of hospitalists’ involvement in those initiatives, then making sure the journal is opportunistic in reviewing and publishing high-quality work, he explains.
Andrew Auerbach, MD, MPH, SFHM
Age: 44
Academic rank: Associate professor of medicine, University of California at San Francisco’s Division of Hospital Medicine
Administrative titles at UCSF: Attending physician, Department of Medicine; director of research for division of hospital medicine; associate director of the General Medicine Research Fellowship; chair of the Clinical Content Governance Committee at UCSF Medical Center
Education: Bachelor’s degree in biochemistry from Bowdoin College, Brunswick, Maine (1988); medical degree from Dartmouth Medical School, Hanover, N.H. (1992); master’s of public health in clinical effectiveness from Harvard School of Public Health, Boston (1998)
Clinical training: Internship in internal medicine, Yale-New Haven Hospital, New Haven, Conn. (1992-1993); residency in internal medicine, Yale-New Haven Hospital, New Haven, Conn. (1993-1995); fellowship in general internal medicine, Beth Israel-Deaconess Medical Center, Boston (1996-1998)
Principal positions held: Attending physician at Moffitt-Long Hospitals in San Francisco (1998-present); clinical fellow at Beth Israel Deaconess Medical Center, Boston (1996-1998); emergency room physician at Milton Hospital, Milton, Mass. (1996-1998); physician and co-director of student health services at University of New Haven, New Haven, Conn. (1995-1996); hospitalist at Hospital of Saint Raphael, New Haven, Conn. (1995-1996); admitting officer at West Haven Veterans Administration Hospital, West Haven, Conn. (1994-1996)
Awards and honors: Western Society for Clinical Investigation, Investigator of the Year Award (2010); Orthopaedic Research Society Harris Award for Outstanding Research (2010); fellow, American College of Physicians (2009); James Rand Award for Outstanding Research Project (2008); Society of Hospital Medicine Young Investigator Award (2004)
Professional memberships: Association of Chiefs of General Internal Medicine, Society of Hospital Medicine, American Medical Association, American College of Physicians, Society of General Internal Medicine
Most Significant Co-Authored Publications
- Rothberg M, Maselli J, Pekow P, Lindenauer P, Auerbach AD. Cost-effectiveness of changes in care at U.S. hospitals from 2000-2004. In press, Health Affairs.
- Auerbach AD, Wachter RM, Cheng H, et al. Effects of a neurosurgery-hospitalist comanagement model on outcomes of patients with neurosurgical illnesses. In press, Arch Int Med.
- Auerbach AD, Hilton JF, Maselli JM, Pekow P, Rothberg M, Lindenauer PK. Follow the crowd or shop for the best: How volume and care quality influence outcomes of cardiac surgery. Annals Int Med. 2009;150(10):696-704.
- Auerbach AD, Landefeld CS, Shojania KS. The tension between needing to improve care and knowing how to do it. N Engl J Med. 2007;357(6):608-613.
- Lindenauer PK, Pekow P, Rothberg M, Benjamin E, Auerbach AD. Outcomes of patients treated by hospitalists, general internists, and family physicians. N Engl J Med. 2007;357(25):2589-2600.
Bold New Direction
The JHM team, which partners SHM leaders and the journal’s publisher, Wiley-Blackwell Inc., is revisiting the journal’s press relations and editorial strategy (Wiley-Blackwell also publishes The Hospitalist). Discussions also are under way about whether to increase the journal’s publishing frequency, as well as how the journal can increase its digital footprint and take advantage of social media outlets to increase the usability and visibility of its offerings, Dr. Auerbach says.
“One side effect of JHM ’s growth has been growing constraints on space to publish excellent work,” he says. “Our team will focus a great deal on strategies to increase JHM ’s ability to review and publish the many outstanding papers submitted each year.”
Dr. Williams characterizes Dr. Auerbach’s appointment as “a software upgrade to JHM 2.0.”
Dr. Auerbach’s connection to the top-ranked division of hospital medicine in the country provides instant credibility to the journal, and his diverse contacts should help his efforts to solicit an increasing volume of high-quality submissions, Dr. Williams says.
His appointment also can reinvigorate members of the editorial team, motivating them to step out of their comfort zone and embrace the challenge of adapting to the rapidly changing world of hospital medicine.
“He’ll bring renewed enthusiasm,” says Dr. Williams, a former SHM president who is a professor and chief of the Division of Hospital Medicine at Northwestern University’s Feinberg School of Medicine in Chicago. “I firmly believe that’s essential for any growing enterprise. You need an infusion of new energy and fresh thinking.”
With Dr. Auerbach at the helm, JHM is well-positioned to attract well-done, systematic reviews while appealing to authors who are writing about such relevant topics as change management, collaboration, models of care, and transitional care, says deputy editor Brian Harte, MD, SFHM, chief operating officer of Hillcrest Hospital in Mayfield Heights, Ohio, and chairman of hospital medicine at The Cleveland Clinic.
“I hope people say under Dr. Auerbach’s tenure we continued to innovate and do things as an editorial group that other journals hadn’t thought of doing, were not nimble enough to do, or were not creative enough to do,” Dr. Harte says. “And that it was an incubator of novel and innovative and, ultimately, very effective ideas that took the journal into strategic directions that other journals weren’t bold enough to go in.”
Dr. Auerbach is more than capable of steering JHM in those new directions, according to his mentor, Robert Wachter, MD, MHM, professor and associate chairman of the Department of Medicine at the University of California at San Francisco, and chief of the division of hospital medicine and chief of medical service at UCSF Medical Center, former SHM president, and author of the blog Wachter’s World (www.wachtersworld.com).
Dr. Auerbach is a broad thinker who is capable of recognizing what issues are important to his field before they become obvious to others, a trait that will help him to use the journal to help chart the course for HM, Dr. Wachter says.
He also has the perfect personality for the job. “He is the most doggedly persistent person I’ve ever met,” Dr. Wachter says. “I’ve seen him go through setbacks that would have caused lesser mortals to give up their ideas.…He’s like a prizefighter. He sits in the corner for a little bit, has someone dab the wounds, and then comes back out again for the next round and swings a little bit harder.
“I’ve learned never to underestimate him. It’s an amazing characteristic, and it’s one that is very useful doing something like running a journal.”
Mark Leiser is a freelance writer based in New Jersey.
Andrew Auerbach, MD, MPH, SFHM, is an associate professor at one of the most highly regarded academic medical centers in the country, and he is a nationally respected researcher whose work has been published in prominent scientific publications.
His peers believe both roles prepared him well for his newest endeavor: editor-in-chief of the Journal of Hospital Medicine. His five-year term begins in January.
Dr. Auerbach’s affiliation with the University of California at San Francisco (UCSF), where he also serves as director of research for the division of hospital medicine and associate director of the General Medicine Research Fellowship, lends instant legitimacy to the journal, editorial team members say. His research has focused on evaluation of care-delivery models and methods for improving the measurement of quality of care.
That background, medical publishing experts believe, gives Dr. Auerbach a foundation in scientific accuracy and reporting transparency that is integral to a new editor’s effort to expand a journal’s reach and increase the quality of work it publishes.
Dr. Auerbach intends to do both, continuing JHM’s growth and solidifying it as the go-to resource for hospitalists. “It is an incredibly good platform for hospitalists to publish their work,” he adds. “I want people to look back at the journal in five years and say it’s even better than it is now.”
As Dr. Auerbach prepares to take over as editor-in-chief, he is focusing his efforts on how to best build on the success the journal has enjoyed since its 2006 launch.
“JHM’s core values are to reflect the field of hospital medicine broadly, to provide a venue where the field’s current scholarly work can be published, and to provide a point of reference for where future scholarly work might be directed and published,” he says. “JHM has been very successful at the first two. I think there is an opportunity to be somewhat more strategic in providing the reference point for future research directions, largely through the input of the editorial team and by paying close attention to JHM readers.”
The Right Choice
An eight-person committee embarked on a five-month search to identify the ideal candidate to replace JHM ’s founding editor-in-chief, Mark Williams, MD, FACP, FHM. The intense process reflected the search committee’s goal that the new editor strengthen the journal and the society it represents, says committee member Harold C. Sox, MD, MACP, a noted internist and author who served as editor of Annals of Internal Medicine from 2001 to 2009.
“A journal published by a professional organization is far and away the most visible manifestation of the organization and its values and ambitions,” Dr. Sox says. “The appointment was anything but pro forma. It had to be the right choice.”
Committee members wanted to select a physician who had a strong scientific background, the judgment required to be a leader, and a desire to better position the journal as a source for first-rate articles in the competitive landscape of medical publishing, Dr. Sox says. They also searched for a candidate who had considerable experience writing for publication.
Dr. Auerbach, who served as deputy editor of the Journal of General Internal Medicine from 2004 to 2007 and as a JHM reviewer, has been published in the New England Journal of Medicine, the Journal of the American Medical Association, Annals of Internal Medicine, and the Archives of Internal Medicine.
As editor of Annals, Dr. Sox shared responsibility for publishing two of Dr. Auerbach’s articles.
“I know something about how Dr. Auerbach thinks about science and about his own personal scientific standards—wanting to get it right, writing it in a way that people know exactly what happened, and interpreting the results in a way that will stand up over time, rather than trying to read too much into the results,” Dr. Sox says. “We also talked with some of the candidates about their strategy for trying to make the journal better, and I thought he showed himself to be very analytic and strategic in his thinking. I’m confident he’s going to move the journal forward.”
Dr. Auerbach believes his experience as a deputy editor and his mentoring role at UCSF, which requires him to provide constructive feedback on investigators’ papers, has prepared him for his new role.
“I have a good sense for how to approach the review process with the goal of getting a paper to the point where it can be accepted into a journal and, if not, have it leave the review process much better than it was when it arrived,” he says.
His research background also complements his new role, he says.
“Research is a way to take care of patients I never see and to disseminate things that are broadly applicable … that other people can look at and use to improve their healthcare delivery,” he says. “I see the journal as doing many of the same things.”
Strategies for Success
Dr. Auerbach, who has worked closely with Dr. Williams in recent months to ensure a smooth transition, says he does not intend to make substantial changes to the journal’s focus. But he is formulating strategies to make it more valuable and relevant to the hospitalists it serves.
Increasing the journal’s Impact Factor—currently 1.951, ranking it 40th out of 151 publications in its cohort—is one way to increase JHM ’s value, making it a destination for the highest-quality research, Dr. Auerbach says.
He also intends to solicit as many scholarly works as possible, employing “a marketing strategy and recruitment strategy all in one” to make sure JHM is on researchers’ short list of publications in which they consider submitting their work.
—Robert Wachter, MD, MHM, professor, associate chair, Department of Medicine, University of California at San Francisco, chief, division of hospital medicine, chief, medical service, UCSF Medical Center, former SHM president
He wants to take advantage of the growing number of hospitalists who are doing research and expand the journal’s reach beyond its traditional peer groups. “Are there intensive-care doctors, pulmonologists, cardiologists, or infectious-disease doctors who are doing work with hospitalists—or work that would align with hospital medicine—that could be published in JHM?” Dr. Auerbach asks, rhetorically.
He intends to empower members of his editorial team to serve as JHM ambassadors who promote the journal at professional meetings and encourage investigators who are pursuing interesting projects to submit their findings.
Dr. Auerbach expects to devise other content strategies in consultation with members of his editorial team. Certain aspects of content, such as case reports and scholarly reviews of conundrums in HM cases, could be enhanced, he says. Specific sections of the journal could be developed for effectiveness research or implementation research.
He also says he wants the journal to explore new content areas so that it appeals to readers who aren’t interested in randomized controlled trials.
He hopes to put the journal in the position to publish work supported by such new initiatives as the Patient-Centered Outcomes Research Institute and the Centers for Medicare & Medicaid Services’ Center for Medicare and Medicaid Innovation.
That might mean providing editorials or inviting papers that outline the importance of hospitalists’ involvement in those initiatives, then making sure the journal is opportunistic in reviewing and publishing high-quality work, he explains.
Andrew Auerbach, MD, MPH, SFHM
Age: 44
Academic rank: Associate professor of medicine, University of California at San Francisco’s Division of Hospital Medicine
Administrative titles at UCSF: Attending physician, Department of Medicine; director of research for division of hospital medicine; associate director of the General Medicine Research Fellowship; chair of the Clinical Content Governance Committee at UCSF Medical Center
Education: Bachelor’s degree in biochemistry from Bowdoin College, Brunswick, Maine (1988); medical degree from Dartmouth Medical School, Hanover, N.H. (1992); master’s of public health in clinical effectiveness from Harvard School of Public Health, Boston (1998)
Clinical training: Internship in internal medicine, Yale-New Haven Hospital, New Haven, Conn. (1992-1993); residency in internal medicine, Yale-New Haven Hospital, New Haven, Conn. (1993-1995); fellowship in general internal medicine, Beth Israel-Deaconess Medical Center, Boston (1996-1998)
Principal positions held: Attending physician at Moffitt-Long Hospitals in San Francisco (1998-present); clinical fellow at Beth Israel Deaconess Medical Center, Boston (1996-1998); emergency room physician at Milton Hospital, Milton, Mass. (1996-1998); physician and co-director of student health services at University of New Haven, New Haven, Conn. (1995-1996); hospitalist at Hospital of Saint Raphael, New Haven, Conn. (1995-1996); admitting officer at West Haven Veterans Administration Hospital, West Haven, Conn. (1994-1996)
Awards and honors: Western Society for Clinical Investigation, Investigator of the Year Award (2010); Orthopaedic Research Society Harris Award for Outstanding Research (2010); fellow, American College of Physicians (2009); James Rand Award for Outstanding Research Project (2008); Society of Hospital Medicine Young Investigator Award (2004)
Professional memberships: Association of Chiefs of General Internal Medicine, Society of Hospital Medicine, American Medical Association, American College of Physicians, Society of General Internal Medicine
Most Significant Co-Authored Publications
- Rothberg M, Maselli J, Pekow P, Lindenauer P, Auerbach AD. Cost-effectiveness of changes in care at U.S. hospitals from 2000-2004. In press, Health Affairs.
- Auerbach AD, Wachter RM, Cheng H, et al. Effects of a neurosurgery-hospitalist comanagement model on outcomes of patients with neurosurgical illnesses. In press, Arch Int Med.
- Auerbach AD, Hilton JF, Maselli JM, Pekow P, Rothberg M, Lindenauer PK. Follow the crowd or shop for the best: How volume and care quality influence outcomes of cardiac surgery. Annals Int Med. 2009;150(10):696-704.
- Auerbach AD, Landefeld CS, Shojania KS. The tension between needing to improve care and knowing how to do it. N Engl J Med. 2007;357(6):608-613.
- Lindenauer PK, Pekow P, Rothberg M, Benjamin E, Auerbach AD. Outcomes of patients treated by hospitalists, general internists, and family physicians. N Engl J Med. 2007;357(25):2589-2600.
Bold New Direction
The JHM team, which partners SHM leaders and the journal’s publisher, Wiley-Blackwell Inc., is revisiting the journal’s press relations and editorial strategy (Wiley-Blackwell also publishes The Hospitalist). Discussions also are under way about whether to increase the journal’s publishing frequency, as well as how the journal can increase its digital footprint and take advantage of social media outlets to increase the usability and visibility of its offerings, Dr. Auerbach says.
“One side effect of JHM ’s growth has been growing constraints on space to publish excellent work,” he says. “Our team will focus a great deal on strategies to increase JHM ’s ability to review and publish the many outstanding papers submitted each year.”
Dr. Williams characterizes Dr. Auerbach’s appointment as “a software upgrade to JHM 2.0.”
Dr. Auerbach’s connection to the top-ranked division of hospital medicine in the country provides instant credibility to the journal, and his diverse contacts should help his efforts to solicit an increasing volume of high-quality submissions, Dr. Williams says.
His appointment also can reinvigorate members of the editorial team, motivating them to step out of their comfort zone and embrace the challenge of adapting to the rapidly changing world of hospital medicine.
“He’ll bring renewed enthusiasm,” says Dr. Williams, a former SHM president who is a professor and chief of the Division of Hospital Medicine at Northwestern University’s Feinberg School of Medicine in Chicago. “I firmly believe that’s essential for any growing enterprise. You need an infusion of new energy and fresh thinking.”
With Dr. Auerbach at the helm, JHM is well-positioned to attract well-done, systematic reviews while appealing to authors who are writing about such relevant topics as change management, collaboration, models of care, and transitional care, says deputy editor Brian Harte, MD, SFHM, chief operating officer of Hillcrest Hospital in Mayfield Heights, Ohio, and chairman of hospital medicine at The Cleveland Clinic.
“I hope people say under Dr. Auerbach’s tenure we continued to innovate and do things as an editorial group that other journals hadn’t thought of doing, were not nimble enough to do, or were not creative enough to do,” Dr. Harte says. “And that it was an incubator of novel and innovative and, ultimately, very effective ideas that took the journal into strategic directions that other journals weren’t bold enough to go in.”
Dr. Auerbach is more than capable of steering JHM in those new directions, according to his mentor, Robert Wachter, MD, MHM, professor and associate chairman of the Department of Medicine at the University of California at San Francisco, and chief of the division of hospital medicine and chief of medical service at UCSF Medical Center, former SHM president, and author of the blog Wachter’s World (www.wachtersworld.com).
Dr. Auerbach is a broad thinker who is capable of recognizing what issues are important to his field before they become obvious to others, a trait that will help him to use the journal to help chart the course for HM, Dr. Wachter says.
He also has the perfect personality for the job. “He is the most doggedly persistent person I’ve ever met,” Dr. Wachter says. “I’ve seen him go through setbacks that would have caused lesser mortals to give up their ideas.…He’s like a prizefighter. He sits in the corner for a little bit, has someone dab the wounds, and then comes back out again for the next round and swings a little bit harder.
“I’ve learned never to underestimate him. It’s an amazing characteristic, and it’s one that is very useful doing something like running a journal.”
Mark Leiser is a freelance writer based in New Jersey.
ONLINE EXCLUSIVE: Physician leaders discuss JHM's new editor-in-chief
Click here to listen to Dr. Wachter.
Click here to listen to Dr. Sox.
Click here to listen to Dr. Wachter.
Click here to listen to Dr. Sox.
Click here to listen to Dr. Wachter.
Click here to listen to Dr. Sox.