User login
Academic Opportunity
Academic hospitalists will find new opportunities to learn, network, and showcase their own insights at HM12, SHM’s annual meeting April 1-4 in San Diego.
This year, poster presenters will have even more time to present cutting-edge topics in hospital medicine. The popular Research, Innovation, and Clinical Vignettes (RIV) poster sessions will be split into two days.
The Research and Innovations poster reception will be held 5 to 7 p.m. April 2, while the Vignettes poster session will be held during lunch the next day. However, some things about the receptions won’t change: Sessions will be held in the exhibit hall.
The move to two poster receptions was in response to previous attendee feedback. As the numbers of attendees and poster presenters has grown, visiting all the posters and having meaningful conversations with the presenters became increasingly difficult. Now attendees—both academic and community-based hospitalist—can take their time and soak in more of the best thinking in the specialty.
If you’re thinking about submitting a poster for any of the three categories, now is the time to act: The submission deadline for abstracts is Dec. 2.
Poster sessions aren’t the only new chances for academic hospitalists to find valuable face time at HM12, either. This year’s program includes new opportunities to collaborate and connect with other academic hospitalists—and hospitalists from other backgrounds as well.
And the HM12 schedule will feature valuable courses specifically chosen for the unique needs and challenges of the academic hospitalist’s career.
Brendon Shank is SHM’s associate vice president of communications.
In the Literature: The latest research you need to know
In This Edition
Literature At A Glance
A guide to this month’s studies
- Use of a Care-Transitions Intervention Reduces 30-Day Hospital Readmissions
- Routine Chest Radiographs after Pneumonia to Rule Out Lung Cancer Have Low Diagnostic Yield
- Hospitalist Care Shifts Costs to the Outpatient Environment
- Stopping Smoking at Any Time before Surgery Is Safe
- Hospitalization for Infection Increases Risk of Stroke
- Longer Duration of Perioperative Antibiotics May Be Beneficial after Cardiac Surgery
- Stroke Unit Care Combined with Early Supported Discharge Improves Outcomes
- Criteria May Help Identify Patients at Risk for Infective Endocarditis
Use of a Care-Transitions Intervention Reduces 30-Day Hospital Readmissions
Clinical question: Does use of a specific care-transitions intervention (CTI) reduce 30-day hospital readmissions in a nonintegrated healthcare system?
Background: Previous interventions addressing improved communication between members of the healthcare team, patients, and families at time of discharge show promise for reducing hospital readmissions. Although these interventions revealed positive results, no research has been completed within a system where healthcare is integrated across settings.
Study design: Quasi-experimental prospective cohort study.
Setting: Six Rhode Island acute-care hospitals, including two community hospitals, three teaching hospitals, and a tertiary-care center and teaching hospital. Facilities ranged from 129 beds to 719 beds.
Synopsis: The CTI is a patient-centered intervention occurring across 30 days. The intervention includes a home visit by a coach within three days of hospital discharge, a telephone call within seven to 10 days of discharge, and a final telephone call no later than 30 days after admission. During these contacts, coaches encourage patient and family participation in care, and active communication with their primary-care provider regarding their disease state. A convenience sample of fee-for-service Medicare beneficiaries was identified by admission diagnoses of acute myocardial infarction, congestive heart failure, or specific pulmonary conditions. Overall, 74% participants completed the entire intervention. The odds of a hospital readmission were significantly lower in the intervention population compared with those who did not receive the intervention (OR 0.61; 95% CI, 0.42-0.88).
Study design: Study design was limited by ability to provide coaching (only 8% of total population was approached), and therefore may not be representative of a typical integrated healthcare setting. In addition, the sample consisted of a convenience sample, which may limit generalizability.
Bottom line: The CTI appears to decrease the rate of 30-day hospital readmissions in Medicare patients with certain cardiac and pulmonary diagnoses.
Citation: Voss R, Gardner R, Baier R, Butterfield K, Lehrman S, Gravenstein S. The care transitions intervention: translating from efficacy to effectiveness. Arch Intern Med. 2011;171:1232-1237.
Routine Chest Radiographs after Pneumonia to Rule Out Lung Cancer Have Low Diagnostic Yield
Clinical question: What is the incidence of new lung cancer detected on routine post-pneumonia chest radiographs?
Background: Routine chest radiographs have been recommended four to eight weeks after resolution of pneumonia to exclude underlying lung cancer. The diagnostic yield of this practice is uncertain.
Study design: Population-based cohort.
Setting: Seven emergency departments and six hospitals in Edmonton, Alberta, Canada.
Synopsis: Authors enrolled 3,398 patients with clinical and radiographic evidence of pneumonia. Of these, 59% were aged 50 and older, 52% were male, 17% were current smokers, 18% had COPD, and 49% were treated as inpatients. At 90-day follow-up, 1.1% of patients received a new diagnosis of lung cancer, with incidence steadily increasing to 2.2% at three-year follow-up. In multivariate analysis, age 50 and older, male sex, and current smoking were independent predictors of post-pneumonia new lung cancer diagnosis. Limiting follow-up chest radiographs to patients aged 50 and older would have detected 98% of new lung cancers and improved diagnostic yield to 2.8%.
Bottom line: Routine post-pneumonia chest radiographs for lung cancer screening have low diagnostic yield that is only marginally improved by selecting high-risk populations.
Citation: Tang KL, Eurich DT, Minhas-Sandhu JK, Marrie TJ, Majumdar SR. Incidence, correlates, and chest radiographic yield of new lung cancer diagnosis in 3398 patients with pneumonia. Arch Intern Med. 2011;171:1193-1198.
Hospitalist Care Shifts Costs to the Outpatient Environment
Clinical question: How does hospitalist care affect medical utilization costs after hospital discharge?
Background: The number of patients cared for by hospitalists is growing rapidly. Some studies have shown hospitalists to decrease length of stay and inpatient costs. The impact of shorter hospitalization on outpatient medical utilization and costs is not known.
Study design: Population-based national cohort.
Setting: Hospitalized Medicare patients.
Synopsis: In this study of 58,125 Medicare admissions at 454 hospitals, hospitalist care was associated with a 0.64-day shorter adjusted length of stay and $282 lower hospital charges compared with patients cared for by their primary-care physicians (PCPs). This was offset by $332 higher Medicare spending in the 30 days following hospitalization. Patients cared for by hospitalists were less likely to be discharged home (OR 0.82, 95% CI, 0.78-0.86), and were more likely to require emergency department visits (OR 1.18, 95% CI, 1.12-1.24) and readmissions (OR 1.08, 95% CI, 1.02-1.14). The authors postulate that shorter length of stay associated with hospitalist care is achieved at the expense of shifting costs to the outpatient environment. The discharged patients are sicker and, as a result, require more skilled care and repeat hospital visits.
Bottom line: Hospitalist care may be associated with higher overall costs and more medical utilization.
Citation: Kuo YF, Goodwin JS. Association of hospitalist care with medical utilization after discharge: evidence of cost shift from a cohort study. Ann Intern Med. 2011;155:152-159.
Stopping Smoking at Any Time before Surgery Is Safe
Clinical question: Is smoking cessation within eight weeks of surgery safe?
Background: Smoking cessation before surgery can decrease the risk of surgical complications. However, several studies found increased risk for perioperative complications when smoking was stopped within eight weeks of surgery. These findings created uncertainty about general safety of tobacco cessation counseling before surgery.
Study design: Systematic review and meta-analysis.
Setting: Smokers undergoing any type of surgery.
Synopsis: The authors identified nine studies involving 889 patients that compared smokers who quit within eight weeks of surgery with those who continued to smoke. There was considerable heterogeneity in the studies but no overall difference in perioperative complications between those who quit smoking and those who continued to smoke (OR 0.78, 95% CI, 0.57-1.07). The subset of studies examining pulmonary complications also found no difference (OR 1.18, 95% CI, 0.95-1.46).
Bottom line: Smoking cessation at any time before surgery appears to be safe.
Citation: Myers K, Hajek P, Hinds C, McRobbie H. Stopping smoking shortly before surgery and postoperative complications: a systematic review and meta-analysis. Arch Intern Med. 2011;171:983-989.
Hospitalization for Infection Increases Risk of Stroke
Clinical question: Can infection act as a precipitant for acute ischemic stroke?
Background: Little is known about precipitants of acute ischemic stroke. Severe infections have been shown to promote hypercoagulability and platelet activation, and to induce endothelial dysfunction. Authors postulated that infections severe enough to warrant hospitalization might transiently increase the risk for stroke.
Study design: Case-crossover analysis of data from a multicenter prospective cohort (Cardiovascular Health Study).
Setting: Medicare patients in four communities.
Synopsis: During a median follow-up of 12.2 years, 669 strokes occurred in 5,639 study participants. Hospitalization for infection within 14 days was associated with increased risk of stroke (OR 8.0, 95% CI, 1.6-77.3), and the risk remained elevated for hospitalizations within 90 days (OR 3.4, 95% CI, 1.8-6.5). The findings remained significant after adjusting for comorbidities, including age, sex, race, smoking, and diabetes. The number of patients hospitalized for infection before stroke was small—eight within 14 days, and 29 within 90 days.
Bottom line: Infection severe enough to require hospitalization may act as a trigger for acute ischemic stroke.
Citation: Elkind MS, Carty CL, O’Meara ES, et al. Hospitalization for infection and risk of acute ischemic stroke: the Cardiovascular Health Study. Stroke. 2011;42:1851-1856.
Longer Duration of Perioperative Antibiotics May Be Beneficial after Cardiac Surgery
Clinical question: Is antibiotic prophylaxis for 24 or more hours better than shorter duration of treatment after cardiac surgery?
Background: Sternal surgical site infections are a serious complication of cardiac surgery. The optimal duration of perioperative antibiotic prophylaxis is not known, with recommendations ranging from a single dose to 72 hours. The Society of Thoracic Surgeons’ recommendation for 24 to 72 hours of prophylaxis is not based on a systematic review and meta-analysis.
Study design: Systematic review and meta-analysis.
Setting: Adult patients undergoing open-heart surgery who received perioperative antibiotic prophylaxis.
Synopsis: Authors identified 12 trials encompassing 7,893 patients. Compared with prophylaxis of ≥24 hours, prophylaxis of <24 hours was associated with a higher risk of sternal surgical site infections (RR 1.38, 95% CI, 1.13-1.69) and deep infections (RR 1.68, 95% CI, 1.12-2.53). There was no difference in mortality, other infections, or adverse events. Most studies had methodological limitations with a high risk for bias.
Bottom line: Perioperative antibiotic prophylaxis of ≥24 hours reduces sternal surgical infections.
Citation: Mertz D, Johnstone J, Loeb M. Does duration of perioperative antibiotic prophylaxis matter in cardiac surgery? A systematic review and meta-analysis. Ann Surg. 2011;254:48-54.
Stroke Unit Care Combined with Early Supported Discharge Improves Outcomes
Clinical question: Does early supported discharge (ESD) improve outcomes more than conventional follow-up in stroke patients?
Background: ESD is a mobile team that coordinates follow-up and rehabilitation. Previous studies have shown it to be beneficial in patients with mild to moderate disability at one year, but long-term effects of ESD are not known.
Study design: Randomized controlled trial.
Setting: Single center in Norway.
Synopsis: Stroke-unit patients were recruited and received standard care or ESD after discharge. All 320 patients received standard acute care. The proportion of patients with modified Rankin Score (mRS) of ≤2 was not significantly different in the two groups but identified a trend toward improvement in the intervention group (38% vs. 30%, P=0.106). More patients receiving conventional follow-up died or were institutionalized (P=0.032) but mortality rates at five years were similar (ESD 46% vs. 51%). Secondary outcomes (Scandinavian Stroke Scale, Barthel Index, Frenchay Activity Index, and Mini Mental Status Examination) were not statistically different. Predictors of good outcome in the ESD group included young age, low mRS, and living with others.
This study recruited patients from 1995 to 1997 and followed the patients for five years. Limitations to the applicability include advances in stroke rehabilitation in the last 10 years. The cost of a mobile multidisciplinary team consisting of a physiotherapist, occupational therapist, nurse, and part-time physician was not discussed and may limit the availability to many patients.
Bottom line: Early supported discharge may increase the proportion of patients living at home five years after stroke.
Citation: Fjaertoft H, Rohweder G, Indredavik B. Stroke unit care combined with early supported discharge improves 5-year outcome: a randomized controlled trial. Stroke. 2011;42:1707-1711.
Criteria May Help Identify Patients at Risk for Infective Endocarditis
Clinical question: Which patients with Staphylococcus aureus bacteremia benefit the most from transesophageal echocardiography?
Background: Infective endocarditis is a serious complication of S. aureus bacteremia (SAB), occurring in 5% to 17% of patients with documented SAB. It has been recommended to perform transesophageal echocardiography (TEE) in all patients with SAB. Large variation exists in rates of TEE, and identifying patients at low risk for endocarditis may help with more appropriate utilization of this test.
Study design: Retrospective cohort analysis.
Setting: Two university-based German tertiary hospitals (INSTINCT cohort) and one North American university-based hospital from October 1994 to December 2009 (SABG cohort).
Synopsis: A total of 736 cases of nosocomial SAB were analyzed. Age, source of infection, and 30-day and 90-day case fatality rates were similar between the two cohorts. Patients were followed during the index hospitalization and for three months after discharge.
Patients with infective endocarditis were more likely to have prolonged bacteremia; a permanent intracardiac device, such as a pacemaker or a heart valve; be recipients of hemodialysis; and have osteomyelitis. Of the 83 patients who did not fulfill any of the prediction criteria, no cases of infective endocarditis were found.
Bottom line: A set of simple criteria may help identify patients with nosocomial SAB who are at risk for infective endocarditis. The subset of patients who do not meet any of these criteria may not need diagnostic evaluation with TEE.
Citation: Kaasch, AJ, Fowler VG Jr., Rieg S, et al. Use of a simple criteria set for guiding echocardiography in nosocomial Staphylococcus aureus bacteremia. Clin Infect Dis. 2011;53:1-9.
Politics of Medicare Cuts
It reads like a brainteaser from hell: Twelve members of Congress must identify at least $1.2 trillion to cut from the federal budget over the next 10 years. Social Security cuts are a virtual nonstarter with Democrats. Tax hikes on the wealthy are anathema to Republicans. Significant Medicare cuts will invoke the wrath of seniors. The Joint Select Committee on Deficit Reduction, evenly split between both political parties, must somehow reach a majority agreement on what to trim by the Nov. 23 deadline. Then the full Congress must approve the committee’s recommendations by Dec. 23.
Here’s another caveat: In a Sept. 20 letter, SHM and 117 other medical groups urged the deficit reduction “super-committee” to “include a full repeal of the fatally flawed Medicare sustainable growth rate (SGR) formula in its final legislation.” Unless Congress repeals or delays the widely despised SGR mechanism, Medicare reimbursement rates for doctors will be cut by a catastrophic 29.4% in January. A full repeal, however, could cost $300 billion or more over 10 years, according to estimates by the nonpartisan Congressional Budget Office (CBO). If the super-committee takes up the SGR challenge, it will need to find at least $1.5 trillion worth of mutually agreeable cuts.
In a final twist, President Obama has threatened to veto any deficit reduction plan that slashes Medicare benefits and fails to raise taxes on the wealthy. The punchline is that unless the divided super-committee, a polarized Congress, and the president can all agree, $1.2 trillion in domestic and military spending cuts will automatically kick in, giving both political parties a lump of coal just in time for Christmas.
If any solution is possible, it might have to rely on some old numbers regarding potential cuts to Medicare and other federal programs. “There’s no time to develop new policy,” says Joseph Antos, PhD, a health policy expert at the American Enterprise Institute, a conservative think tank. “The old ideas that have been kicking around for years are scorable [by the CBO], and because they’ve been around for so long, it’s easier to write the legislative language.”
Here’s a look at perennial Medicare proposals and the chances of their inclusion in serious deficit-reduction negotiations.
—Joseph Antos, PhD, health policy expert, American Enterprise Institute, Washington, D.C.
Reduced Payments
Obama’s proposal to the super-committee includes $248 billion in Medicare cuts and savings. Of most direct relevance to hospitalists, about $57 billion comes from reduced payments to providers over 10 years. The proposal would reduce Indirect Medical Education add-on payments to teaching hospitals by 10%, end an add-on payment for hospitals and physicians in low-population states, and reduce payments to post-acute-care facilities.
Separately, the Medicare Payment Advisory Commission (MedPAC) released a proposal that would save $233 billion over 10 years—designed in large part to offset the costs necessary for a permanent SGR fix. Among its suggestions, the MedPAC proposal would freeze reimbursements for primary-care providers (PCPs) and trim payments to specialists by 5.9% per year for three years. Despite agreement by virtually everyone that the SGR has to go, groups like the Alliance of Specialty Medicine and American College of Surgeons have expressed concerns with MedPAC’s suggested offsets.
Dr. Antos says MedPAC has adopted the view that preventing the 29.4% cut in Medicare reimbursements will require spreading the pain more generally throughout the health sector. “That makes sense until you realize that politically, when you do that, you just generate lots of resistance from lots of organizations,” he says. So what about the SGR? Dr. Antos sees a permanent fix this year as “extremely unlikely,” especially given the general pessimism over the super-committee’s ability to agree on $1.2 trillion in cuts. Instead, he predicts a two-year fix that would require tens of billions in offsets but delay (yet again) more difficult political choices until after the 2012 elections. “They definitely do not want to be arguing about this next fall,” he says.
Drug Rebates
Under the president’s proposal, Medicare would receive the same rebates as Medicaid’s discount for brand name and generic drugs given to beneficiaries under the Medicare Low-Income Subsidy. This proposal alone is estimated to net some $135 billion in savings over 10 years, an inclusion that Judith Stein, executive director of the Center for Medicare Advocacy, says her organization was “delighted” to see. “We think that’s extremely reasonable, fair, good public policy, and good economic policy,” she says. Left-leaning groups are particularly vehement on this issue, given Medicare’s prohibition against negotiating with pharmaceutical companies on drug prices, a restriction that other bulk buyers, such as the Veterans Administration, don’t face.
Dr. Antos expects some form of the president’s proposal to be taken seriously. “This is something that is easy to do, and I think politically, it’s easier to go after a supplier of products—and drugs are the biggest one—than it is to go after doctors or hospitals,” he says. “And it’s hardest to go after beneficiaries.”
Premium Surcharges
Another element of President Obama’s proposal would save $20 billion by increasing wealthier beneficiaries’ insurance premiums on prescription drugs and doctors’ services. Beginning in 2017, income-based premiums for Medicare Part B and Part D both would rise by 15% for beneficiaries earning more than $85,000 annually.
AARP opposes the idea, and Stein says she’s concerned about the overall notion of basing Medicare premiums on income. “The problem is that we want to keep higher-income people satisfied with the Medicare program, because they’re the ones that get listened to,” Stein says.
Austin Frakt, PhD, a healthcare economist at Boston University, makes a similar point in a recent Health Affairs blog post: “The wealthy are a potential source of revenue for Medicare but also possess the means to finance the most strident challenge to it,” he writes. Even so, Stein says, “it’s easier to swallow than some other things,” especially if drug companies and others are required to share in the sacrifices.
Medicare Eligibility
President Obama’s proposal excludes any discussion about raising the age of Medicare eligibility, signaling a harder line on a change that Republicans and groups like the American Hospital Association have favored and that Obama himself floated as a trial balloon earlier this year. The Democratic base and AARP, however, rebelled against the notion, and Dr. Antos says the idea has “zero” chance of being included in the super-committee’s proposal. “This is the sort of thing that you don’t really want to bring up when you’re running for president, which is why the president backed off, and which is why the Republicans won’t be eager to see it, either,” he says.
Dr. Antos expects the eligible-age proposal to re-emerge in 2013, though he cautions against taking any “extravagant claims for savings” at face value. To be publicly acceptable, Medicare’s minimum age would need to rise slowly, he says, perhaps phased in over 20 years, and in a way that likely wouldn’t save a huge sum of money.
If Medicare raised its minimum age to 67 in 2014, the federal government would save roughly $5.7 billion, according to the nonprofit Center on Budget and Policy Priorities. In an “Incidental Economist” blog post, however, Dr. Frakt points out that the savings would simply shift the cost to beneficiaries, employers, private insurers, and others, a point echoed by Stein.
“All told, the cost to the system of raising the Medicare age to 67 would be $11.4 billion in 2014,” Dr. Frakt writes, “which is a high price to pay for $5.7 billion in federal savings.”
Bryn Nelson is a freelance medical writer based in Seattle.
Hospitalist at Heart

Michelle Mourad, MD, says she’s always had “the doctor gene.” As a child, she spent countless hours playing with her Fisher-Price medical kit, and she gained an early appreciation for the scientific method thanks to family members who encouraged her to answer her own questions through discovery and experimentation. A youthful fascination evolved into a calling during high school, when she participated in a summer mentoring program at Santa Clara Valley Medical Center in San Jose, Calif. Paired with two neurosurgeons, she spent 12-hour days accompanying them on rounds, observing surgeries in the operating room, and attending case conferences.
“Right away, I was hooked,” says Dr. Mourad, assistant professor and director of quality for the division of hospital medicine at the University of California at San Francisco (UCSF) Medical Center and medical director of UCSF’s Congestive Heart Failure and Oncology hospitalist services, which comanage bone-marrow transplant and advanced-heart-failure patients in partnership with oncologists and cardiologists.
“I loved the community of medicine and I loved the hospital,” adds Dr. Mourad, one of the newest members of Team Hospitalist. “The interdisciplinary nature really resonated with me. That was when I realized this lifelong feeling of ‘I’m going to be a doctor’ actually had a lot of foundation to it.”
Question: Did you always intend to become a hospitalist?
Answer: I didn’t know hospitalists existed when I started medical school. I gravitated toward internal medicine and was pretty sure I would specialize. I went to internal-medicine residency thinking I wanted to be a gastroenterologist, but I found that a little limiting. I decided to be a pulmonary critical-care doctor, but realized, although I enjoy taking care of patients who are critically ill, I didn’t really want that to be my whole focus. When I started thinking about other options, I knew I was reaching.
Q: So how did you wind up in HM?
A: I enjoyed the community of the hospital—the fast pace, the ability to make treatment decisions and see your changes real-time, the ability to work with residents and interns, the intense time you spend with families during which you can really make or break their hospital experience and make a difference in the care they receive. When I realized I loved those things, the decision was easy.
Q: What does it mean to you to practice at one of the most highly respected HM programs in the country?
A: People want you to succeed. We are encouraged to get involved in the way the hospital works and make it about more than clinical care. The variety of things people do at our institution makes you realize hospitalists are not only clinicians; they are leaders, thinkers, role models, and advocates for patient safety. That’s incredibly motivating.
Q: Your career includes clinical, quality improvement, and administrative roles. Is there one aspect you enjoy most?
A: I need that variety. Allowing us to have that balance here has made the program great. My passion is quality improvement—the ability to affect patients on a personal level but to say, “How do I put systems in place to make hospitals safer and a better experience for every patient?” Figuring out how to navigate your own institution to engender change is challenging, but when you see that change manifest and you have providers and patients thank you for it, it’s probably the most rewarding thing I do.
Q: As director of quality, you strive to improve transitions of care around the time of discharge. What strategies have you implemented to improve that transition?
A: A hospitalist cannot do it alone. Discharge involves case managers and nurses and physical therapists and pharmacists. Our goal has been to create consensus and an urgency for change. … If you can show people their data and show how that is at odds with the vision of the care they are providing, that’s a really powerful force for change.
Q: What can other hospitalists do to improve transitions of care?
A: Form this group and take a good hard look at your data. Use that group to take small baby steps toward change, whether that’s always talking to primary-care physicians or having every patient who leaves have a follow-up appointment in two weeks, or calling every patient after discharge. I think people know what should be in their toolkit for a really safe transition. The problem is fighting the system and creating a group coalition that wants to do that with you.
Q: Have you noticed quantifiable improvements since you took over that role?
A: We put in place a program with residents to make it easier for them to do discharge summaries. They’re templated, they draw from the EMR, they’re concise, and they have what PCPs want. Nurses use them to provide targeted patient education and make sure patients understand their discharge instructions. That probably is my biggest tangible win. The biggest win overall is the culture change.
Q: How has the culture changed?
A: Faculty come up to you and say, “I had a readmission this month. I’m sorry. I really couldn’t prevent it. There’s nothing I could do.” Residents say, “I’ve been so good about communicating with PCPs this month. I can’t wait to see the audit data because I think my team has done really well.” We’re all thinking about what it takes to do a good discharge.
Q: What is the biggest advantage of UCSF’s comanagement service model?
A: The complexity of heart failure and oncology patients is incredible. That complexity means you need a subspecialist like a cardiologist or an oncologist, plus a hospitalist, because there are so many medicine issues along with cardiology or oncology issues. There are infections. There is renal failure. It takes a medicine head as well as a subspecialty head to take care of these patients.
Q: Do you believe that model will become popular for other programs?
A: I do, particularly on the surgical side. A lot of quality gains can be made by having a hospitalist partner with surgeons. The hospitalist can see a large number of patients and make sure everything has been thought about. When are they starting anticoagulation? When do those antibiotics need to come on or off? Those are quality measures that hospitalists are really good at, and I think that will make a fine partnership with surgical subspecialties.
Q: You strive to integrate QI initiatives into house staff education. Why is that important?
A: At an academic institution, you don’t provide care except going through the house staff. It’s important to make sure they understand this isn’t just one more box to be checked off or another thing their attending is asking of them. This is as fundamental as picking the right antibiotic to treat pneumonia or communicating with a PCP about a complicated discharge. That isn’t intuitively obvious. It became more apparent to me as I realized quality of care comes from clinical decisions as well as all of the extra effort we put into things like discharge and communication.
Mark Leiser is a freelance writer based in New Jersey.
Exam Guidelines
The extent of the exam should correspond to the nature of the presenting problem, the standard of care, and the physicians’ clinical judgment. Remember, medical necessity issues can arise if the physician performs and submits a claim for a comprehensive service involving a self-limiting problem. The easiest way to demonstrate the medical necessity for evaluation and management (E/M) services is through medical decision-making. It prevents a third party from making accusations that a Level 5 service was reported solely based upon a comprehensive history and examination that was not warranted by the patient’s presenting problem (e.g. the common cold).1
1995 Exam Guidelines
The 1995 guidelines differentiate 10 body areas (head and face; neck; chest, breast, and axillae; abdomen; genitalia, groin, and buttocks; back and spine; right upper extremity; left upper extremity; right lower extremity; and left lower extremity) from 12 organ systems (constitutional; eyes; ears, nose, mouth, and throat; cardiovascular; respiratory, gastrointestinal; genitourinary; musculoskeletal; integumentary; neurological; psychiatric; hematologic, lymphatic, and immunologic).2 Physicians are permitted to perform and comment without mandate, as appropriate, but with a few minor directives:
- Document relevant negative findings. Commenting that a system or area is “negative” or “normal” is acceptable when referring to unaffected areas or asymptomatic organ systems.
- Elaborate abnormal findings. Commenting that a system or area is “abnormal” is not sufficient unless additional comments describing the abnormality are documented.
1997 Documentation Guidelines
The 1997 guidelines are formatted as organ systems with corresponding, bulleted items referred to as “elements.”3 Additionally, a few elements have a numeric requirement to be achieved before satisfying the documentation of that particular element. For example, credit for the “vital signs element” (located within the constitutional system) is only awarded after documentation of three individual measurements (e.g. blood pressure, heart rate, and respiratory rate). Failure to document the specified criterion (e.g. two measurements: “blood pressure and heart rate only,” or a single nonspecific comment: “vital signs stable”) leads to failure to assign credit.
Take note that these specified criterion do not resonate within the 1995 guidelines. Numerical requirements also are indicated for the lymphatic system. The physician must examine and document findings associated with two or more lymphatic areas (e.g. “no lymphadenopathy noted in the neck or axillae”).
In the absence of numeric criterion, some elements contain multiple components, which require documentation of at least one component. For example, one listed psychiatric element designates the assessment of the patient’s “mood and affect.” The physician receives credit for a comment regarding the patient’s mood (e.g. “appears depressed”) without identification of a flat (or normal).
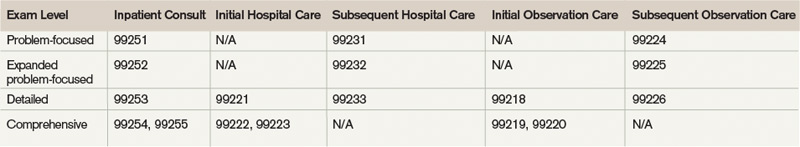
The 1997 Documentation Guide-lines comprise the following systems and elements:
Constitutional
- Measurement of any three of the following seven vital signs:
- Sitting or standing blood pressure;
- Supine blood pressure;
- Pulse rate and regularity;
- Respiration;
- Temperature;
- Height; or
- Weight (can be measured and recorded by ancillary staff).
- General appearance of patient (e.g. development, nutrition, body habitus, deformities, attention to grooming)
Eyes
- Inspection of conjunctivae and lids;
- Examination of pupils and irises (e.g. reaction to light and accommodation, size, symmetry); and
- Ophthalmoscopic examination of optic discs (e.g. size, C/D ratio, appearance) and posterior segments (e.g. vessel changes, exudates, hemorrhages).
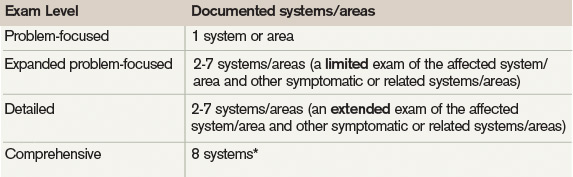
Ears, Nose, Mouth, and Throat
- External inspection of ears and nose (e.g. overall appearance, scars, lesions, masses);
- Otoscopic examination of external auditory canals and tympanic membranes;
- Assessment of hearing (e.g. whispered voice, finger rub, tuning fork);
- Inspection of nasal mucosa, septum, and turbinates;
- Inspection of lips, teeth, and gums; and
- Examination of oropharynx: oral mucosa, salivary glands, hard and soft palates, tongue, tonsils, and posterior pharynx.
Neck
- Examination of neck (e.g. masses, overall appearance, symmetry, tracheal position, crepitus); and
- Examination of thyroid (e.g. enlargement, tenderness, mass).
Respiratory
- Assessment of respiratory effort (e.g. intercostal retractions, use of accessory muscles, diaphragmatic movement);
- Percussion of chest (e.g. dullness, flatness, hyperresonance);
- Palpation of chest (e.g. tactile fremitus); and
- Auscultation of lungs (e.g. breath sounds, adventitious sounds, rubs).
Cardiovascular
- Palpation of heart (e.g. location, size, thrills);
- Auscultation of heart with notation of abnormal sounds and murmurs; and
- Examination of:
- Carotid arteries (e.g. pulse amplitude, bruits);
- Abdominal aorta (e.g. size, bruits);
- Femoral arteries (e.g. pulse amplitude, bruits);
- Pedal pulses (e.g. pulse amplitude); and
- Extremities for edema and/or varicosities.
Chest
- Inspection of breasts (e.g. symmetry, nipple discharge); and
- Palpation of breasts and axillae (e.g. masses or lumps, tenderness).
Gastrointestinal
- Examination of abdomen with notation of presence of masses or tenderness;
- Examination of liver and spleen;
- Examination for presence or absence of hernia;
- Examination (when indicated) of anus, perineum, and rectum, including sphincter tone, presence of hemorrhoids, and rectal masses; and
- Obtain stool sample for occult blood test when indicated.
Genitourinary (Male)
- Examination of the scrotal contents (e.g. hydrocele, spermatocele, tenderness of cord, testicular mass);
- Examination of the penis; and
- Digital rectal examination of prostate gland (e.g. size, symmetry, nodularity, tenderness).
Genitourinary (Female)
- Pelvic examination (with or without specimen collection for smears and cultures), including:
- Examination of external genitalia (e.g. general appearance, hair distribution, lesions) and vagina (e.g. general appearance, estrogen effect, discharge, lesions, pelvic support, cystocele, rectocele);
- Examination of urethra (e.g. masses, tenderness, scarring);
- Examination of bladder (e.g. fullness, masses, tenderness);
- Cervix (e.g. general appearance, lesions, discharge);
- Uterus (e.g. size, contour, position, mobility, tenderness, consistency, descent or support); and
- Adnexa/parametria (e.g. masses, tenderness, organomegaly, nodularity).
- Lymphatic Palpation of lymph nodes in two or more areas: Neck, axillae, groin, other.
Musculoskeletal
- Examination of gait and station;
- Inspection and/or palpation of digits and nails (e.g. clubbing, cyanosis, inflammatory conditions, petechiae, ischemia, infections, nodes);
- Examination of joints, bones and muscles of one or more of the following six areas:
- head and neck;
- spine, ribs and pelvis;
- right upper extremity;
- left upper extremity;
- right lower extremity; and
- left lower extremity.
The examination of a given area includes:
- Inspection and/or palpation with notation of presence of any misalignment, asymmetry, crepitation, defects, tenderness, masses, effusions;
- Assessment of range of motion with notation of any pain, crepitation or contracture;
- Assessment of stability with notation of any dislocation (luxation), subluxation or laxity; and
- Assessment of muscle strength and tone (e.g. flaccid, cog wheel, spastic) with notation of any atrophy or abnormal movements.
Skin
- Inspection of skin and subcutaneous tissue (e.g. rashes, lesions, ulcers); and
- Palpation of skin and subcutaneous tissue (e.g. induration, subcutaneous nodules, tightening).
Neurologic
- Test cranial nerves with notation of any deficits;
- Examination of deep tendon reflexes with notation of pathological reflexes (e.g. Babinski); and
- Examination of sensation (e.g. by touch, pin, vibration, proprioception).
Psychiatric
- Description of patient’s judgment and insight;
- Brief assessment of mental status, including:
- Orientation to time, place, and person;
- Recent and remote memory; and
- Mood and affect (e.g. depression, anxiety, agitation).
Considerations
The 1997 Documentation Guidelines often are criticized for their “specific” nature. Although this assists the auditor, it hinders the physician. The consequence is difficulty and frustration with remembering the explicit comments and number of elements associated with each level of exam. As a solution, consider documentation templates—paper or electronic—that incorporate cues and prompts for normal exam findings with adequate space for elaboration of abnormal findings.
Remember that both sets of guidelines apply to visit level selection, and physicians may utilize either set when documenting their services. Auditors will review documentation with each of the guidelines, and assign the final audited result as the highest visit level supported during the comparison. Physicians should use the set that is best for their patients, practice, and peace of mind.
Carol Pohlig is a billing and coding expert with the University of Pennsylvania Medical Center, Philadelphia. She is also on the faculty of SHM’s inpatient coding course.
References
- Pohlig, C. Documentation and Coding Evaluation and Management Services. In: Coding for Chest Medicine 2010. Northbrook, Ill.: American College of Chest Physicians; 2009:87-118.
- Centers for Medicare & Medicaid Services. 1995 Documentation Guidelines for Evaluation & Management Services. Available at: http://www.cms.gov/MLNProducts/Downloads/1995dg.pdf. Accessed Sept. 12, 2011.
- Centers for Medicare & Medicaid Services. 1997 Documentation Guidelines for Evaluation & Management Services. Available at: http://www.cms.gov/MLNProducts/Downloads/MASTER1.pdf. Accessed Sept. 12, 2011.
- Highmark Medicare Services. Frequently Asked Questions: Evaluation And Management Services (Part B). Available at: http://www.highmarkmedicareservices.com/faq/partb/pet/lpet-evaluation_management_services.html#10. Accessed Sept. 14, 2011.
- Centers for Medicare & Medicaid Services. Transmittal 2282: Clarification of Evaluation and Management Payment Policy. Available at: http://www.cms.gov/transmittals/downloads/R2282CP.pdf. Accessed Sept. 15, 2011.
- Abraham M, Ahlman J, Boudreau A, Connelly J, Evans D. Current Procedural Terminology Professional Edition. Chicago: American Medical Association Press; 2011:1-20.
The extent of the exam should correspond to the nature of the presenting problem, the standard of care, and the physicians’ clinical judgment. Remember, medical necessity issues can arise if the physician performs and submits a claim for a comprehensive service involving a self-limiting problem. The easiest way to demonstrate the medical necessity for evaluation and management (E/M) services is through medical decision-making. It prevents a third party from making accusations that a Level 5 service was reported solely based upon a comprehensive history and examination that was not warranted by the patient’s presenting problem (e.g. the common cold).1
1995 Exam Guidelines
The 1995 guidelines differentiate 10 body areas (head and face; neck; chest, breast, and axillae; abdomen; genitalia, groin, and buttocks; back and spine; right upper extremity; left upper extremity; right lower extremity; and left lower extremity) from 12 organ systems (constitutional; eyes; ears, nose, mouth, and throat; cardiovascular; respiratory, gastrointestinal; genitourinary; musculoskeletal; integumentary; neurological; psychiatric; hematologic, lymphatic, and immunologic).2 Physicians are permitted to perform and comment without mandate, as appropriate, but with a few minor directives:
- Document relevant negative findings. Commenting that a system or area is “negative” or “normal” is acceptable when referring to unaffected areas or asymptomatic organ systems.
- Elaborate abnormal findings. Commenting that a system or area is “abnormal” is not sufficient unless additional comments describing the abnormality are documented.
1997 Documentation Guidelines
The 1997 guidelines are formatted as organ systems with corresponding, bulleted items referred to as “elements.”3 Additionally, a few elements have a numeric requirement to be achieved before satisfying the documentation of that particular element. For example, credit for the “vital signs element” (located within the constitutional system) is only awarded after documentation of three individual measurements (e.g. blood pressure, heart rate, and respiratory rate). Failure to document the specified criterion (e.g. two measurements: “blood pressure and heart rate only,” or a single nonspecific comment: “vital signs stable”) leads to failure to assign credit.
Take note that these specified criterion do not resonate within the 1995 guidelines. Numerical requirements also are indicated for the lymphatic system. The physician must examine and document findings associated with two or more lymphatic areas (e.g. “no lymphadenopathy noted in the neck or axillae”).
In the absence of numeric criterion, some elements contain multiple components, which require documentation of at least one component. For example, one listed psychiatric element designates the assessment of the patient’s “mood and affect.” The physician receives credit for a comment regarding the patient’s mood (e.g. “appears depressed”) without identification of a flat (or normal).
The 1997 Documentation Guide-lines comprise the following systems and elements:
Constitutional
- Measurement of any three of the following seven vital signs:
- Sitting or standing blood pressure;
- Supine blood pressure;
- Pulse rate and regularity;
- Respiration;
- Temperature;
- Height; or
- Weight (can be measured and recorded by ancillary staff).
- General appearance of patient (e.g. development, nutrition, body habitus, deformities, attention to grooming)
Eyes
- Inspection of conjunctivae and lids;
- Examination of pupils and irises (e.g. reaction to light and accommodation, size, symmetry); and
- Ophthalmoscopic examination of optic discs (e.g. size, C/D ratio, appearance) and posterior segments (e.g. vessel changes, exudates, hemorrhages).
Ears, Nose, Mouth, and Throat
- External inspection of ears and nose (e.g. overall appearance, scars, lesions, masses);
- Otoscopic examination of external auditory canals and tympanic membranes;
- Assessment of hearing (e.g. whispered voice, finger rub, tuning fork);
- Inspection of nasal mucosa, septum, and turbinates;
- Inspection of lips, teeth, and gums; and
- Examination of oropharynx: oral mucosa, salivary glands, hard and soft palates, tongue, tonsils, and posterior pharynx.
Neck
- Examination of neck (e.g. masses, overall appearance, symmetry, tracheal position, crepitus); and
- Examination of thyroid (e.g. enlargement, tenderness, mass).
Respiratory
- Assessment of respiratory effort (e.g. intercostal retractions, use of accessory muscles, diaphragmatic movement);
- Percussion of chest (e.g. dullness, flatness, hyperresonance);
- Palpation of chest (e.g. tactile fremitus); and
- Auscultation of lungs (e.g. breath sounds, adventitious sounds, rubs).
Cardiovascular
- Palpation of heart (e.g. location, size, thrills);
- Auscultation of heart with notation of abnormal sounds and murmurs; and
- Examination of:
- Carotid arteries (e.g. pulse amplitude, bruits);
- Abdominal aorta (e.g. size, bruits);
- Femoral arteries (e.g. pulse amplitude, bruits);
- Pedal pulses (e.g. pulse amplitude); and
- Extremities for edema and/or varicosities.
Chest
- Inspection of breasts (e.g. symmetry, nipple discharge); and
- Palpation of breasts and axillae (e.g. masses or lumps, tenderness).
Gastrointestinal
- Examination of abdomen with notation of presence of masses or tenderness;
- Examination of liver and spleen;
- Examination for presence or absence of hernia;
- Examination (when indicated) of anus, perineum, and rectum, including sphincter tone, presence of hemorrhoids, and rectal masses; and
- Obtain stool sample for occult blood test when indicated.
Genitourinary (Male)
- Examination of the scrotal contents (e.g. hydrocele, spermatocele, tenderness of cord, testicular mass);
- Examination of the penis; and
- Digital rectal examination of prostate gland (e.g. size, symmetry, nodularity, tenderness).
Genitourinary (Female)
- Pelvic examination (with or without specimen collection for smears and cultures), including:
- Examination of external genitalia (e.g. general appearance, hair distribution, lesions) and vagina (e.g. general appearance, estrogen effect, discharge, lesions, pelvic support, cystocele, rectocele);
- Examination of urethra (e.g. masses, tenderness, scarring);
- Examination of bladder (e.g. fullness, masses, tenderness);
- Cervix (e.g. general appearance, lesions, discharge);
- Uterus (e.g. size, contour, position, mobility, tenderness, consistency, descent or support); and
- Adnexa/parametria (e.g. masses, tenderness, organomegaly, nodularity).
- Lymphatic Palpation of lymph nodes in two or more areas: Neck, axillae, groin, other.
Musculoskeletal
- Examination of gait and station;
- Inspection and/or palpation of digits and nails (e.g. clubbing, cyanosis, inflammatory conditions, petechiae, ischemia, infections, nodes);
- Examination of joints, bones and muscles of one or more of the following six areas:
- head and neck;
- spine, ribs and pelvis;
- right upper extremity;
- left upper extremity;
- right lower extremity; and
- left lower extremity.
The examination of a given area includes:
- Inspection and/or palpation with notation of presence of any misalignment, asymmetry, crepitation, defects, tenderness, masses, effusions;
- Assessment of range of motion with notation of any pain, crepitation or contracture;
- Assessment of stability with notation of any dislocation (luxation), subluxation or laxity; and
- Assessment of muscle strength and tone (e.g. flaccid, cog wheel, spastic) with notation of any atrophy or abnormal movements.
Skin
- Inspection of skin and subcutaneous tissue (e.g. rashes, lesions, ulcers); and
- Palpation of skin and subcutaneous tissue (e.g. induration, subcutaneous nodules, tightening).
Neurologic
- Test cranial nerves with notation of any deficits;
- Examination of deep tendon reflexes with notation of pathological reflexes (e.g. Babinski); and
- Examination of sensation (e.g. by touch, pin, vibration, proprioception).
Psychiatric
- Description of patient’s judgment and insight;
- Brief assessment of mental status, including:
- Orientation to time, place, and person;
- Recent and remote memory; and
- Mood and affect (e.g. depression, anxiety, agitation).
Considerations
The 1997 Documentation Guidelines often are criticized for their “specific” nature. Although this assists the auditor, it hinders the physician. The consequence is difficulty and frustration with remembering the explicit comments and number of elements associated with each level of exam. As a solution, consider documentation templates—paper or electronic—that incorporate cues and prompts for normal exam findings with adequate space for elaboration of abnormal findings.
Remember that both sets of guidelines apply to visit level selection, and physicians may utilize either set when documenting their services. Auditors will review documentation with each of the guidelines, and assign the final audited result as the highest visit level supported during the comparison. Physicians should use the set that is best for their patients, practice, and peace of mind.
Carol Pohlig is a billing and coding expert with the University of Pennsylvania Medical Center, Philadelphia. She is also on the faculty of SHM’s inpatient coding course.
References
- Pohlig, C. Documentation and Coding Evaluation and Management Services. In: Coding for Chest Medicine 2010. Northbrook, Ill.: American College of Chest Physicians; 2009:87-118.
- Centers for Medicare & Medicaid Services. 1995 Documentation Guidelines for Evaluation & Management Services. Available at: http://www.cms.gov/MLNProducts/Downloads/1995dg.pdf. Accessed Sept. 12, 2011.
- Centers for Medicare & Medicaid Services. 1997 Documentation Guidelines for Evaluation & Management Services. Available at: http://www.cms.gov/MLNProducts/Downloads/MASTER1.pdf. Accessed Sept. 12, 2011.
- Highmark Medicare Services. Frequently Asked Questions: Evaluation And Management Services (Part B). Available at: http://www.highmarkmedicareservices.com/faq/partb/pet/lpet-evaluation_management_services.html#10. Accessed Sept. 14, 2011.
- Centers for Medicare & Medicaid Services. Transmittal 2282: Clarification of Evaluation and Management Payment Policy. Available at: http://www.cms.gov/transmittals/downloads/R2282CP.pdf. Accessed Sept. 15, 2011.
- Abraham M, Ahlman J, Boudreau A, Connelly J, Evans D. Current Procedural Terminology Professional Edition. Chicago: American Medical Association Press; 2011:1-20.
Help Wanted
SHM’s Leadership Academies have been well received, with at least 1,200 having taken the courses so far. Some of those participants, though, craved something more—some recognition for the ways those lessons are being incorporated on the job in their hospitals.
So this year, for the first time, SHM is offering something beyond the third level of the Leadership Academies. Those who have completed all three levels in the academy can now seek Leadership Certification, based mainly on completion of a project to make a positive change at their hospitals.
Rusty Holman, MD, MHM, director of the academy program and chief clinical officer at Cogent HMG, says the impetus came from past participants.
“Those who have attended the Leadership Academies came forward and said, ‘You know, we’re doing some really important coursework, we’re investing in ourselves in both our knowledge and our skills as leaders. We are furthermore involved in a lot of change efforts within the hospital and improvement efforts—whether it’s related to quality or it’s related to some business function or it’s related to education and training. And wrapping all that together, wouldn’t it be nice if we had some certificate or something from the medical society saying that, yes, we completed this coursework and we have achieved a certain level of recognition and have that recognition come directly from the professional medical society?’”
The project for certification has to be approved, and a performance and growth evaluation has to be completed. Once a project is approved, participants will be connected with advisors to help them along. Those taking the Leadership Academy coursework will have five years to apply that coursework to the certification process. But to be fair to those who have already gone through the academy and may already be near the time limit, anyone can apply their coursework through January 2013.
SHM expects that the certification will take an average of 18 months to complete, but it can be completed in as little as one year or as many as five years.

—Rusty Holman, MD, MHM, chief clinical officer, Cogent HMG, director, Leadership Academy, former SHM president
Tina Budnitz, MPH, senior advisor to the CEO of SHM and a chief designer of the Leadership Certification program, says the main idea was to make it relevant and meaningful.
The program was crafted “with adult education principles in mind,” she says. “You get to design a project that’s going to be meaningful for you. We’re also trying to put you into small, networked groups of networked faculty and peers that can provide support for you along the way.”
When participants submit their projects, they’ll get “very detailed feedback” from experts on potential problems and will be directed to resources. If someone proposes a project on deep vein thrombosis (DVT) prevention, for example, they might be directed to webinars on the topic or other hospitals in their area where DVT prevention programs have been implemented so that the participants can contact them if they choose.
Budnitz says Leadership Certification is meant to plug a gap in leadership curriculum at business schools and in coursework in programs like the American College of Physician Executives.
“What they aren’t able to do is provide education in the context of hospital medicine,” she says.
The cost of the program is $2,500. That is in addition to the cost to participate in Leadership Academies, which range from $1,800 to $2,000 each.
One of the first to sign up for the program, Darlene Tad-y, MD, a hospitalist and assistant professor at the University of Colorado Denver, says she already has noticed that she has been able to apply concepts she has learned in the academies to work situations: supervising residents, interns, and medical students as the attending physician, serving on hospital committees, and taking a leadership role within her hospitalist group.
She says the Leadership Certification program makes sense for her because she isn’t sure she wants to pursue an MBA but still wants to refine certain skills.
She said that in her project, she will attempt to improve transitions of care, looking specifically at communication at the time of discharge. The project is one that she likely would have undertaken anyway because it’s important to her institution and patient care, but doing it as part of the certification program gives her more resources, along with the chance to earn the certificate.

—Darlene Tad-y, MD, assistant professor, University of Colorado Denver
The skills learned through certification would be helpful to anyone, regardless of their supervisory role, she notes.
“I’m not the division head, I’m not the chief, but I don’t think that leadership necessarily is bestowed by a title,” she says. “I think it’s what you’re doing. It’s the actions that you’re taking and the way that you’re approaching things. And it’s a skill set that I feel like you need to work on and develop. And I think that’s what the certification will help me [with].”
Ilan Alhadeff, MD, FHM, program medical director with Cogent HMG who works at Hackensack University Medical Center in New Jersey, says his project will involve techniques to increase patient satisfaction scores, focusing largely on the communication that drives those scores.
He is taking leadership in the field seriously, particularly because the demands of hospitalists will be heightened amid healthcare reform efforts.
The importance of quality markers and patient experience will only grow, and hospitalists are positioned to have a big impact on them, he says.
“Hospitals are at big financial risk, which could result in further consolidation of healthcare institutions,” Dr. Alhadeff says. “We’re poised to have the biggest impact on those numbers, [moreso] than any individual primary-care doctor.”
Dr. Alhadeff says it might not be easy to fit the project in, considering all the demands on his time already, but it’s something he feels compelled to do.
“I would [call it akin] to telling a patient they need to find time to exercise,” he says. “There’s no time, but we just have to make time and we have to do it.”
Dr. Holman says the important thing is the learning that takes place while participants are involved in the projects, not necessarily the projects’ results. In a project that aims to reduce 30-day readmission rates, for example, a lot can be learned even if the effort fails.
“In fact, in that scenario, we would expect that the lessons learned would be very robust, would be very rich,” says Dr. Holman, a former SHM president. “And the focus would be on both, perhaps technical reasons why readmission rates went up, but [also] a very significant focus on lessons learned about what things undermined the effort or made the effort less than successful. And it’s those lessons learned that help us grow as leaders, and tying it back to things that we learned in the Leadership Academies and applying it to a real-life scenario.”
The academy and the certification program, Dr. Holman says, will create a “self-sustaining” environment in which people may be more likely to participate in the academy if they know they can use their coursework to vault to the next step later, should they choose to do so.
It’s an important time for a new layer of leadership training, he adds, because of all of the challenges facing hospital medicine and healthcare at large. “There’s an age-old question: Are leaders born, or are they made?” he says. “And to me, the answer to that question doesn’t matter. There will never be enough natural-born leaders to get all of this done. So we have to develop people who have the interest and have the potential. We would be squandering a huge opportunity if we didn’t undertake that ourselves.”
Tom Collins is a freelance writer based in Miami.
SHM’s Leadership Academies have been well received, with at least 1,200 having taken the courses so far. Some of those participants, though, craved something more—some recognition for the ways those lessons are being incorporated on the job in their hospitals.
So this year, for the first time, SHM is offering something beyond the third level of the Leadership Academies. Those who have completed all three levels in the academy can now seek Leadership Certification, based mainly on completion of a project to make a positive change at their hospitals.
Rusty Holman, MD, MHM, director of the academy program and chief clinical officer at Cogent HMG, says the impetus came from past participants.
“Those who have attended the Leadership Academies came forward and said, ‘You know, we’re doing some really important coursework, we’re investing in ourselves in both our knowledge and our skills as leaders. We are furthermore involved in a lot of change efforts within the hospital and improvement efforts—whether it’s related to quality or it’s related to some business function or it’s related to education and training. And wrapping all that together, wouldn’t it be nice if we had some certificate or something from the medical society saying that, yes, we completed this coursework and we have achieved a certain level of recognition and have that recognition come directly from the professional medical society?’”
The project for certification has to be approved, and a performance and growth evaluation has to be completed. Once a project is approved, participants will be connected with advisors to help them along. Those taking the Leadership Academy coursework will have five years to apply that coursework to the certification process. But to be fair to those who have already gone through the academy and may already be near the time limit, anyone can apply their coursework through January 2013.
SHM expects that the certification will take an average of 18 months to complete, but it can be completed in as little as one year or as many as five years.
—Rusty Holman, MD, MHM, chief clinical officer, Cogent HMG, director, Leadership Academy, former SHM president
Tina Budnitz, MPH, senior advisor to the CEO of SHM and a chief designer of the Leadership Certification program, says the main idea was to make it relevant and meaningful.
The program was crafted “with adult education principles in mind,” she says. “You get to design a project that’s going to be meaningful for you. We’re also trying to put you into small, networked groups of networked faculty and peers that can provide support for you along the way.”
When participants submit their projects, they’ll get “very detailed feedback” from experts on potential problems and will be directed to resources. If someone proposes a project on deep vein thrombosis (DVT) prevention, for example, they might be directed to webinars on the topic or other hospitals in their area where DVT prevention programs have been implemented so that the participants can contact them if they choose.
Budnitz says Leadership Certification is meant to plug a gap in leadership curriculum at business schools and in coursework in programs like the American College of Physician Executives.
“What they aren’t able to do is provide education in the context of hospital medicine,” she says.
The cost of the program is $2,500. That is in addition to the cost to participate in Leadership Academies, which range from $1,800 to $2,000 each.
One of the first to sign up for the program, Darlene Tad-y, MD, a hospitalist and assistant professor at the University of Colorado Denver, says she already has noticed that she has been able to apply concepts she has learned in the academies to work situations: supervising residents, interns, and medical students as the attending physician, serving on hospital committees, and taking a leadership role within her hospitalist group.
She says the Leadership Certification program makes sense for her because she isn’t sure she wants to pursue an MBA but still wants to refine certain skills.
She said that in her project, she will attempt to improve transitions of care, looking specifically at communication at the time of discharge. The project is one that she likely would have undertaken anyway because it’s important to her institution and patient care, but doing it as part of the certification program gives her more resources, along with the chance to earn the certificate.
—Darlene Tad-y, MD, assistant professor, University of Colorado Denver
The skills learned through certification would be helpful to anyone, regardless of their supervisory role, she notes.
“I’m not the division head, I’m not the chief, but I don’t think that leadership necessarily is bestowed by a title,” she says. “I think it’s what you’re doing. It’s the actions that you’re taking and the way that you’re approaching things. And it’s a skill set that I feel like you need to work on and develop. And I think that’s what the certification will help me [with].”
Ilan Alhadeff, MD, FHM, program medical director with Cogent HMG who works at Hackensack University Medical Center in New Jersey, says his project will involve techniques to increase patient satisfaction scores, focusing largely on the communication that drives those scores.
He is taking leadership in the field seriously, particularly because the demands of hospitalists will be heightened amid healthcare reform efforts.
The importance of quality markers and patient experience will only grow, and hospitalists are positioned to have a big impact on them, he says.
“Hospitals are at big financial risk, which could result in further consolidation of healthcare institutions,” Dr. Alhadeff says. “We’re poised to have the biggest impact on those numbers, [moreso] than any individual primary-care doctor.”
Dr. Alhadeff says it might not be easy to fit the project in, considering all the demands on his time already, but it’s something he feels compelled to do.
“I would [call it akin] to telling a patient they need to find time to exercise,” he says. “There’s no time, but we just have to make time and we have to do it.”
Dr. Holman says the important thing is the learning that takes place while participants are involved in the projects, not necessarily the projects’ results. In a project that aims to reduce 30-day readmission rates, for example, a lot can be learned even if the effort fails.
“In fact, in that scenario, we would expect that the lessons learned would be very robust, would be very rich,” says Dr. Holman, a former SHM president. “And the focus would be on both, perhaps technical reasons why readmission rates went up, but [also] a very significant focus on lessons learned about what things undermined the effort or made the effort less than successful. And it’s those lessons learned that help us grow as leaders, and tying it back to things that we learned in the Leadership Academies and applying it to a real-life scenario.”
The academy and the certification program, Dr. Holman says, will create a “self-sustaining” environment in which people may be more likely to participate in the academy if they know they can use their coursework to vault to the next step later, should they choose to do so.
It’s an important time for a new layer of leadership training, he adds, because of all of the challenges facing hospital medicine and healthcare at large. “There’s an age-old question: Are leaders born, or are they made?” he says. “And to me, the answer to that question doesn’t matter. There will never be enough natural-born leaders to get all of this done. So we have to develop people who have the interest and have the potential. We would be squandering a huge opportunity if we didn’t undertake that ourselves.”
Tom Collins is a freelance writer based in Miami.
Should CMS Allow Access to Patient-Protected Medicare Data for Public Reporting?
PRO
Observational, database studies provide a powerful QI supplement

The proposed rules by the Centers for Medicare & Medicaid Services (CMS), which will allow access to patient-protected Medicare data, will provide for greater transparency and for data that could be utilized toward comparative-effectiveness research (CER). Thus, these rules have the potential to improve the quality of healthcare and impact patient safety.
The Institute of Medicine in December 1999 issued its now-famous article “To Err is Human,” which reported that medical errors cause up to 98,000 deaths and more than 1 million injuries each year in the U.S.6 However, the evidence shows minimal impact on improving patient safety in the past 10 years.
A retrospective study of 10 North Carolina hospitals reported in the New England Journal of Medicine by Landrigan and colleagues found that harms resulting from medical care remained extremely common, with little evidence for improvement.7 It also is estimated that it takes 17 years on average for clinical research to become incorporated into the majority of clinical practices.8 Although the randomized control trial (RCT) is unquestionably the best research tool to explore simple components of clinical care (i.e. tests, drugs, and procedures), its translation into daily clinical practice remains difficult.
Improving the process of care leading to quality remains an extremely difficult proposition based on such sociological issues as resistance to change, the need for interdisciplinary teamwork, level of support staff, economic factors, information retrieval inadequacies, and, most important, the complexity of patients with multiple comorbidities that do not fit the parameters of the RCT.
Don Berwick, MD, the lead author in the landmark IOM report and currently CMS administrator, has stated “in such complex terrain, the RCT is an impoverished way to learn.”9 Factors that cause this chasm include:10
- Too narrowly focused RCT;
- More required resources, including financial and personnel support with RCT, compared with usually clinical practices;
- Lack of collaboration between academic medical center researchers and community clinicians; and
- Lack of expertise and experience to undertake quality improvement in healthcare.
CER has received a $1.1 billion investment with the passage of the American Recovery and Reinvestment Act to provide evidence on the effectiveness, benefits, and harms of various treatment options.11 As part of this research to improve IOM’s goals to improve healthcare, better evidence is desperately needed to cross the translational gap between clinical research and the bedside.12 Observational outcome studies based on registries or databases derived primarily from clinical care can provide a powerful supplement to quality improvement.13
Thus, the ability to combine Medicare claims with other data through the Availability of Medicare Data for Performance Measurement would supply a wealth of information to potentially impact quality. As a cautionary note, safeguards such as provider review and appeal, monitoring the validity of the information, and only using the data for quality improvement are vital.
Dr. Holder is medical director of hospitalist services and chief medical information officer at Decatur (Ill.) Memorial Hospital. He is a member of Team Hospitalist.
CON
Unanswered questions, risks make CMS plan a bad idea

On June 8, the Centers for Medicare & Medicaid Services (CMS) proposed a rule to allow “qualified entities” access to patient-protected Medicare data for provider performance publication. CMS allowed 60 days for public comment and a start date of Jan. 1, 2012. But this controversial rule appeared with short notice, little discussion, and abbreviated opportunity for comment.
CMS maintains this rule will result in higher quality and more cost-effective care. Considering the present volume of data published on multiple performance parameters for both hospitals and providers, it would seem prudent to have solid data for efficacy prior to implementing more required reporting and costs to the industry.1,2,3
Physicians and hospitals will have 30 days to review and verify three years of CMS claims data before it is released. The burden and cost of review will be borne by the private practices involved.1 This process will impose added administrative costs, and it is unlikely three years of data can be carefully reviewed in just 30 days. If practitioners find the review too cumbersome and expensive, which is likely, they will forgo review, putting the accuracy of the data in question.
Quality data already is published for both physicians and hospitals. Is there evidence this process will significantly increase transparency? Adding more layers of administrative work for both CMS and caregivers—higher overhead without defined benefit—seems an ill-conceived idea. From an evidence-based-practice standpoint, where is the evidence that this rule will improve “quality” and make care “cost-effective”? Have the risks (added bureaucracy, increased overhead, questionable data) and benefits (added transparency) been evaluated?
Additionally, it is unclear who will be monitoring the quality of the data published and who will provide oversight for the “entities” to ensure these data are fairly and accurately presented. Who will pay for this oversight, and what recourse will be afforded physicians and hospitals that feel they have been wronged?4,5
The “qualified entities” will pay CMS to cover their cost of providing data, raising concerns that this practice could evolve into patient-data “purchasing.” Although it is likely the selected entities will be industry leaders (or at least initially) with the capability to protect data, is this not another opportunity for misuse or corruption in the system?
Other issues not clearly addressed include the nature of the patient-protected information and who will interpret this data in a clinical context. How will these data be adjusted for patient comorbidities and case mix, or will the data be published without regard to these important confounders?1,3
Publishing clinical data for quality assurance and feedback purposes is essential for quality care. Transparency has increased consumer confidence in the healthcare system and, indeed, has increased the healthcare system’s responsiveness to quality concerns. Granting the benefits of transparency, published data must be precise, accurate, and managed with good oversight in order to ensure the process does not target providers or skew results. Another program, especially one being fast-tracked and making once-protected patient information available to unspecified entities, raises many questions. Who will be watching these agencies for a clear interpretation? Is this yet another layer of CMS bureaucracy? In an era of evidence-based medicine, where is the evidence that this program will improve the system for the better?
Dr. Brezina is a hospitalist at Durham Regional Hospital in North Carolina.
References
- Under the magnifying glass (again): CMS proposes new access to Medicare data for public provider performance reports. Bass, Berry and Sims website. Available at: http://www.bassberry.com/communicationscenter/newsletters/. Accessed Aug. 31, 2011.
- Controversial rule to allow access to Medicare data. Modern Health website. Available at: http://www.modernHealthcare.com. Accessed Aug. 31, 2011.
- Physician report cards must give correct grades. American Medical News website. Available at: http://www.ama-assn.org/amednews/2011/09/05/edsa0905.htm. Accessed Sept. 12, 2011.
- OIG identifies huge lapses in hospital security, shifts its focus from CMS to OCR. Atlantic Information Services Inc. website. Available at: http://www.AISHealth.com. Accessed Sept. 12, 2011.
- Berry M. Insurers mishandle 1 in 5 claims, AMA finds. American Medical News website. Available at: http://www.ama-assn.org/amednews/2011/07/04/prl20704.htm. Accessed Sept. 12, 2011.
- Kohn LT, Corrigan JM, Donaldson MS, eds. To error is human: building a safer health system. Washington: National Academies Press; 1999.
- Landrigan CP, Parry GJ, Bones CB, Hackbarth AD, Goldmann DA, Sharek PJ. Temporal trends in rates of patient harm resulting from medical care. N Engl J Med. 2010;363(22):2124-2134.
- Institute of Medicine. Crossing the quality chasm: a new health system for the 21st century. Washington: National Academy Press; 2001:13.
- Berwick DM. The science of improvement. JAMA. 2008;299(10):1182-1184.
- Ting HH, Shojania KG, Montori VM, Bradley EH. Quality improvement science and action. Circulation. 2009;119:1962-1974.
- Committee on Comparative Research Prioritization. Institute of Medicine Initial National Priorities for Comparative Effectiveness Research. Washington: National Academy Press; 2009.
- Sullivan P, Goldman D. The promise of comparative effectiveness research. JAMA. 2011;305(4):400-401.
- Washington AE, Lipstein SH. The patient-centered outcomes research institute: promoting better information, decisions and health. Sept. 28, 2011; DOI: 10.10.1056/NEJMp1109407.
PRO
Observational, database studies provide a powerful QI supplement
The proposed rules by the Centers for Medicare & Medicaid Services (CMS), which will allow access to patient-protected Medicare data, will provide for greater transparency and for data that could be utilized toward comparative-effectiveness research (CER). Thus, these rules have the potential to improve the quality of healthcare and impact patient safety.
The Institute of Medicine in December 1999 issued its now-famous article “To Err is Human,” which reported that medical errors cause up to 98,000 deaths and more than 1 million injuries each year in the U.S.6 However, the evidence shows minimal impact on improving patient safety in the past 10 years.
A retrospective study of 10 North Carolina hospitals reported in the New England Journal of Medicine by Landrigan and colleagues found that harms resulting from medical care remained extremely common, with little evidence for improvement.7 It also is estimated that it takes 17 years on average for clinical research to become incorporated into the majority of clinical practices.8 Although the randomized control trial (RCT) is unquestionably the best research tool to explore simple components of clinical care (i.e. tests, drugs, and procedures), its translation into daily clinical practice remains difficult.
Improving the process of care leading to quality remains an extremely difficult proposition based on such sociological issues as resistance to change, the need for interdisciplinary teamwork, level of support staff, economic factors, information retrieval inadequacies, and, most important, the complexity of patients with multiple comorbidities that do not fit the parameters of the RCT.
Don Berwick, MD, the lead author in the landmark IOM report and currently CMS administrator, has stated “in such complex terrain, the RCT is an impoverished way to learn.”9 Factors that cause this chasm include:10
- Too narrowly focused RCT;
- More required resources, including financial and personnel support with RCT, compared with usually clinical practices;
- Lack of collaboration between academic medical center researchers and community clinicians; and
- Lack of expertise and experience to undertake quality improvement in healthcare.
CER has received a $1.1 billion investment with the passage of the American Recovery and Reinvestment Act to provide evidence on the effectiveness, benefits, and harms of various treatment options.11 As part of this research to improve IOM’s goals to improve healthcare, better evidence is desperately needed to cross the translational gap between clinical research and the bedside.12 Observational outcome studies based on registries or databases derived primarily from clinical care can provide a powerful supplement to quality improvement.13
Thus, the ability to combine Medicare claims with other data through the Availability of Medicare Data for Performance Measurement would supply a wealth of information to potentially impact quality. As a cautionary note, safeguards such as provider review and appeal, monitoring the validity of the information, and only using the data for quality improvement are vital.
Dr. Holder is medical director of hospitalist services and chief medical information officer at Decatur (Ill.) Memorial Hospital. He is a member of Team Hospitalist.
CON
Unanswered questions, risks make CMS plan a bad idea
On June 8, the Centers for Medicare & Medicaid Services (CMS) proposed a rule to allow “qualified entities” access to patient-protected Medicare data for provider performance publication. CMS allowed 60 days for public comment and a start date of Jan. 1, 2012. But this controversial rule appeared with short notice, little discussion, and abbreviated opportunity for comment.
CMS maintains this rule will result in higher quality and more cost-effective care. Considering the present volume of data published on multiple performance parameters for both hospitals and providers, it would seem prudent to have solid data for efficacy prior to implementing more required reporting and costs to the industry.1,2,3
Physicians and hospitals will have 30 days to review and verify three years of CMS claims data before it is released. The burden and cost of review will be borne by the private practices involved.1 This process will impose added administrative costs, and it is unlikely three years of data can be carefully reviewed in just 30 days. If practitioners find the review too cumbersome and expensive, which is likely, they will forgo review, putting the accuracy of the data in question.
Quality data already is published for both physicians and hospitals. Is there evidence this process will significantly increase transparency? Adding more layers of administrative work for both CMS and caregivers—higher overhead without defined benefit—seems an ill-conceived idea. From an evidence-based-practice standpoint, where is the evidence that this rule will improve “quality” and make care “cost-effective”? Have the risks (added bureaucracy, increased overhead, questionable data) and benefits (added transparency) been evaluated?
Additionally, it is unclear who will be monitoring the quality of the data published and who will provide oversight for the “entities” to ensure these data are fairly and accurately presented. Who will pay for this oversight, and what recourse will be afforded physicians and hospitals that feel they have been wronged?4,5
The “qualified entities” will pay CMS to cover their cost of providing data, raising concerns that this practice could evolve into patient-data “purchasing.” Although it is likely the selected entities will be industry leaders (or at least initially) with the capability to protect data, is this not another opportunity for misuse or corruption in the system?
Other issues not clearly addressed include the nature of the patient-protected information and who will interpret this data in a clinical context. How will these data be adjusted for patient comorbidities and case mix, or will the data be published without regard to these important confounders?1,3
Publishing clinical data for quality assurance and feedback purposes is essential for quality care. Transparency has increased consumer confidence in the healthcare system and, indeed, has increased the healthcare system’s responsiveness to quality concerns. Granting the benefits of transparency, published data must be precise, accurate, and managed with good oversight in order to ensure the process does not target providers or skew results. Another program, especially one being fast-tracked and making once-protected patient information available to unspecified entities, raises many questions. Who will be watching these agencies for a clear interpretation? Is this yet another layer of CMS bureaucracy? In an era of evidence-based medicine, where is the evidence that this program will improve the system for the better?
Dr. Brezina is a hospitalist at Durham Regional Hospital in North Carolina.
References
- Under the magnifying glass (again): CMS proposes new access to Medicare data for public provider performance reports. Bass, Berry and Sims website. Available at: http://www.bassberry.com/communicationscenter/newsletters/. Accessed Aug. 31, 2011.
- Controversial rule to allow access to Medicare data. Modern Health website. Available at: http://www.modernHealthcare.com. Accessed Aug. 31, 2011.
- Physician report cards must give correct grades. American Medical News website. Available at: http://www.ama-assn.org/amednews/2011/09/05/edsa0905.htm. Accessed Sept. 12, 2011.
- OIG identifies huge lapses in hospital security, shifts its focus from CMS to OCR. Atlantic Information Services Inc. website. Available at: http://www.AISHealth.com. Accessed Sept. 12, 2011.
- Berry M. Insurers mishandle 1 in 5 claims, AMA finds. American Medical News website. Available at: http://www.ama-assn.org/amednews/2011/07/04/prl20704.htm. Accessed Sept. 12, 2011.
- Kohn LT, Corrigan JM, Donaldson MS, eds. To error is human: building a safer health system. Washington: National Academies Press; 1999.
- Landrigan CP, Parry GJ, Bones CB, Hackbarth AD, Goldmann DA, Sharek PJ. Temporal trends in rates of patient harm resulting from medical care. N Engl J Med. 2010;363(22):2124-2134.
- Institute of Medicine. Crossing the quality chasm: a new health system for the 21st century. Washington: National Academy Press; 2001:13.
- Berwick DM. The science of improvement. JAMA. 2008;299(10):1182-1184.
- Ting HH, Shojania KG, Montori VM, Bradley EH. Quality improvement science and action. Circulation. 2009;119:1962-1974.
- Committee on Comparative Research Prioritization. Institute of Medicine Initial National Priorities for Comparative Effectiveness Research. Washington: National Academy Press; 2009.
- Sullivan P, Goldman D. The promise of comparative effectiveness research. JAMA. 2011;305(4):400-401.
- Washington AE, Lipstein SH. The patient-centered outcomes research institute: promoting better information, decisions and health. Sept. 28, 2011; DOI: 10.10.1056/NEJMp1109407.
The Apple Revolution

Steve Jobs was right. Challenges create opportunity. What are the opportunities in hospital medicine today? Take a lesson from the iPhone: Give them what they need when they need it.
I was in a restaurant in Denver the night I saw the news on the TV. “Steve Jobs dead at the age of 56.” Was I surprised? Yes…and no. Everyone knew he was seriously ill; he acknowledged as much when he stepped down as Apple CEO. While not unexpected, his death was still surprising and an emotional jolt.
I quickly finished my meal and went back to my hotel room, where I turned on CNN. I sat back and watched Anderson Cooper talk about Jobs’ life and legacy. Apple co-founder Steve Wozniak was on the telephone with Cooper. Wozniak said when he heard the news, he felt numb, much like he did when he heard about the deaths of John Lennon or President Kennedy.
I felt the same way. I never knew Steve Jobs, but Steve Jobs knew me. He influenced my life in ways unimaginable.
A Revolutionary Persona
On the flight to Denver, I passed time watching a movie produced by Pixar, the movie studio he founded. When I landed, I used an app on my iPhone to find this restaurant, which was close to my hotel and had great reviews. I am typing this month’s column on my Macintosh laptop. How did I let someone I never knew get so close to me and have so much influence on my life?
This is Steve Jobs’ legacy. He did what others couldn’t do. He didn’t invent the personal computer, but he made one that was easy to use. He didn’t create animation, but he showed Hollywood how to create more intriguing movies faster and cheaper. (The smartest thing Disney did was to buy out Pixar before Pixar grew big enough to buy them.)
He revolutionized the music industry. Remember when Napster had the music industry on its heels? Recording labels were suing people and college kids were going to jail for downloading pirated songs. Seemed crazy to send kids off to jail for lifting a few songs, but it was happening. Then came the iPod and iTunes. Not only could I pay 99 cents for a song, I could carry my entire music library in my pocket. Duh … why didn’t I think of that? And he did it all while living with pancreatic neuroendocrine cancer!
One of the things I watched on CNN that evening was a segment from the commencement speech Jobs gave to Stanford University’s graduating class several years ago. He had just recovered from his surgery (visit http://news.stanford.edu/news/2005/june15/jobs-061505.html for the complete transcript). He described how his firing from Apple spurred creativity and resulted in innovation.
“Getting fired from Apple was the best thing that could have ever happened to me,” he said. “The heaviness of being successful was replaced by the lightness of being a beginner again, less sure about everything. It freed me to enter one of the most creative periods of my life.”
This made me think back to 1994, the year I graduated from medical school and about two years before Drs. Wachter and Goldman coined the term “hospitalist” in that fateful New England Journal of Medicine article.1 In 1994, I could not have imagined the iPhone; I could not have predicted the field of hospital medicine. Don't worry if you couldn’t, either. I really think that if this is how we define innovation, we have set the bar too high. Innovation does not have to be complicated. In fact, the greatest innovations are simple. Hand your iPhone to a five-year-old and they can figure it out. Can you do that with a PC?

Challenges Ahead, Ongoing
How does this apply to hospital medicine? These are challenging times for hospitalists. American healthcare costs too much, and some people are saying hospitalists are part of the problem. Hospitalists are discharging more patients than ever from our nation’s hospitals, and more patients than ever are finding themselves readmitted within 30 days. Quality and process improvement is the mantra in healthcare today, and too many hospitalists have little understanding of what is necessary to participate in quality and process improvement.
Steve Jobs got fired from the company he created. Could hospitalists be removed from the program they started? Jobs was right. Challenges create opportunity. What are the opportunities in HM today? Take a lesson from the iPhone: Give them what they need when they need it.
For example, why do so many hospitalist programs staff in-house only during daytime hours? Patients don’t become acutely ill only during the day. Most of us will be hospitalized at some point in our lives. Will there be a hospitalist to see you when you are short of breath or having chest pain? Hospitalists need to be in house 24 hours a day, seven days a week, providing care when patients need it. I know that we don’t have enough money to pay for this and we don’t have enough hospitalists to staff 24/7, but that is the innovation part. I can assure you that while the iPhone is easy for the end-user, an incredible amount of infrastructure had to be created in order to support that easy-to-use experience for the consumer. Jobs and Apple overcame hurdles to create the iPhone. It’s our job to overcome the hurdles to provide safe, timely, and high-value care for our patients.
Steve Jobs’ legacy is Apple.
What is your legacy?
A Call for Research
Most of you are aware that Jobs died from pancreatic neuroendocrine cancer. This is a relatively rare disease, which is in dire need of additional research. Patients with rare diseases find themselves in the difficult position of trying to understand why little is being done to help them.
I, unfortunately, know something about this, as someone very close to me has this disease. Research requires funding. One way to honor Jobs’ legacy is to support pancreatic neuroendocrine cancer research. One organization I have personally supported is the Caring for Carcinoid Foundation. This foundation has contributed millions of dollars toward carcinoid and neuroendocrine tumor research.
If you want to learn more about the Caring for Carcinoid Foundation, visit www.caringforcarcinoid.org.
Dr. Li is president of SHM.
Reference
Steve Jobs was right. Challenges create opportunity. What are the opportunities in hospital medicine today? Take a lesson from the iPhone: Give them what they need when they need it.
I was in a restaurant in Denver the night I saw the news on the TV. “Steve Jobs dead at the age of 56.” Was I surprised? Yes…and no. Everyone knew he was seriously ill; he acknowledged as much when he stepped down as Apple CEO. While not unexpected, his death was still surprising and an emotional jolt.
I quickly finished my meal and went back to my hotel room, where I turned on CNN. I sat back and watched Anderson Cooper talk about Jobs’ life and legacy. Apple co-founder Steve Wozniak was on the telephone with Cooper. Wozniak said when he heard the news, he felt numb, much like he did when he heard about the deaths of John Lennon or President Kennedy.
I felt the same way. I never knew Steve Jobs, but Steve Jobs knew me. He influenced my life in ways unimaginable.
A Revolutionary Persona
On the flight to Denver, I passed time watching a movie produced by Pixar, the movie studio he founded. When I landed, I used an app on my iPhone to find this restaurant, which was close to my hotel and had great reviews. I am typing this month’s column on my Macintosh laptop. How did I let someone I never knew get so close to me and have so much influence on my life?
This is Steve Jobs’ legacy. He did what others couldn’t do. He didn’t invent the personal computer, but he made one that was easy to use. He didn’t create animation, but he showed Hollywood how to create more intriguing movies faster and cheaper. (The smartest thing Disney did was to buy out Pixar before Pixar grew big enough to buy them.)
He revolutionized the music industry. Remember when Napster had the music industry on its heels? Recording labels were suing people and college kids were going to jail for downloading pirated songs. Seemed crazy to send kids off to jail for lifting a few songs, but it was happening. Then came the iPod and iTunes. Not only could I pay 99 cents for a song, I could carry my entire music library in my pocket. Duh … why didn’t I think of that? And he did it all while living with pancreatic neuroendocrine cancer!
One of the things I watched on CNN that evening was a segment from the commencement speech Jobs gave to Stanford University’s graduating class several years ago. He had just recovered from his surgery (visit http://news.stanford.edu/news/2005/june15/jobs-061505.html for the complete transcript). He described how his firing from Apple spurred creativity and resulted in innovation.
“Getting fired from Apple was the best thing that could have ever happened to me,” he said. “The heaviness of being successful was replaced by the lightness of being a beginner again, less sure about everything. It freed me to enter one of the most creative periods of my life.”
This made me think back to 1994, the year I graduated from medical school and about two years before Drs. Wachter and Goldman coined the term “hospitalist” in that fateful New England Journal of Medicine article.1 In 1994, I could not have imagined the iPhone; I could not have predicted the field of hospital medicine. Don't worry if you couldn’t, either. I really think that if this is how we define innovation, we have set the bar too high. Innovation does not have to be complicated. In fact, the greatest innovations are simple. Hand your iPhone to a five-year-old and they can figure it out. Can you do that with a PC?
Challenges Ahead, Ongoing
How does this apply to hospital medicine? These are challenging times for hospitalists. American healthcare costs too much, and some people are saying hospitalists are part of the problem. Hospitalists are discharging more patients than ever from our nation’s hospitals, and more patients than ever are finding themselves readmitted within 30 days. Quality and process improvement is the mantra in healthcare today, and too many hospitalists have little understanding of what is necessary to participate in quality and process improvement.
Steve Jobs got fired from the company he created. Could hospitalists be removed from the program they started? Jobs was right. Challenges create opportunity. What are the opportunities in HM today? Take a lesson from the iPhone: Give them what they need when they need it.
For example, why do so many hospitalist programs staff in-house only during daytime hours? Patients don’t become acutely ill only during the day. Most of us will be hospitalized at some point in our lives. Will there be a hospitalist to see you when you are short of breath or having chest pain? Hospitalists need to be in house 24 hours a day, seven days a week, providing care when patients need it. I know that we don’t have enough money to pay for this and we don’t have enough hospitalists to staff 24/7, but that is the innovation part. I can assure you that while the iPhone is easy for the end-user, an incredible amount of infrastructure had to be created in order to support that easy-to-use experience for the consumer. Jobs and Apple overcame hurdles to create the iPhone. It’s our job to overcome the hurdles to provide safe, timely, and high-value care for our patients.
Steve Jobs’ legacy is Apple.
What is your legacy?
A Call for Research
Most of you are aware that Jobs died from pancreatic neuroendocrine cancer. This is a relatively rare disease, which is in dire need of additional research. Patients with rare diseases find themselves in the difficult position of trying to understand why little is being done to help them.
I, unfortunately, know something about this, as someone very close to me has this disease. Research requires funding. One way to honor Jobs’ legacy is to support pancreatic neuroendocrine cancer research. One organization I have personally supported is the Caring for Carcinoid Foundation. This foundation has contributed millions of dollars toward carcinoid and neuroendocrine tumor research.
If you want to learn more about the Caring for Carcinoid Foundation, visit www.caringforcarcinoid.org.
Dr. Li is president of SHM.
Reference
Academic Rehab

If today’s learners interact with grumpy, overworked, unsatisfied, marginalized intern-extenders, they will quickly up-regulate the gastroenterology gene, and the best and brightest will start to flow out of our pipeline.
Are hospitalists happy? Are we satisfied, stressed, burned out? How is this impacting our field? What can we do about it? The Hospitalist this month takes a hard look at the often overlooked issue of career satisfaction and its cousins burnout, stress, and turnover.
After a decade of taking a fly-by-the-seat-of-our-pants approach to building, managing, and remediating HM programs, we finally have some concrete data to help guide us in building our programs. In fact, no fewer than three research papers studying these issues have been published recently—two of them from my institution.1,2,3 As such, I’ve been thinking about this a lot and what this means to the field in general and, more specifically, academic hospitalists.
Now I recognize that academic hospitalists make up but a fraction of the hospitalist work force; nonetheless, I believe it is an important fraction, even for community hospitalists. As I’ve written before, HM’s pipeline is dependent upon future hospitalists (commonly referred to as residents and students) engaging with fulfilled, satisfied, and successful academic hospitalists—the kind of specialists that look and feel like other specialists. If today’s learners interact with grumpy, overworked, unsatisfied, marginalized intern-extenders, they will quickly up-regulate the gastroenterology gene, and the best and brightest will start to flow out of our pipeline.
So what do these studies show? How do we assimilate these data into our programs, and how can we use it to produce more sustainable, effective, and productive academic HM groups? Here’s my take: a seven-step prescription of sorts for what ails academic HM.
Step 1: Honor Thy Mission
I was having dinner recently with a higher-level executive with a national hospitalist management company that primarily staffs community hospitals. An uncomfortable pause, followed by gasping sounds, ensued after I told him our starting academic salary. After collecting himself, he asked how on Earth I could recruit hospitalists at such a low salary—I think hoping to discover the fount to lower personnel costs. Simply put, some people are willing to sacrifice salary for the academic mission and all its trappings.
In fact, the only differential advantage academic programs have over their community brethren is the ability to be, well, academic—that is, to teach, develop, innovate, disseminate, and create the knowledge base that fuels our specialty. The academic mission is not for everyone. But there is a pool of individuals who are willing to forego financial compensation for compensation of a different sort. Take away the academic mission, and the two jobs start to look similar, salaries equilibrate, and people with academic leanings become unsatisfied.
And burned out. I’d argue that career-fit mismatch is a main cause of academic hospitalist burnout—I come to academics to be academic but find in turn a community job in a teaching hospital. This is supported by data showing that 75% of academic hospitalists described their primary role as either teacher or investigator, yet most (52%) spent 40% or less of their time with learners, and 57% had 20% or less of their time protected for scholarly pursuits.1 This epitomizes career-fit mismatch, and likely explains why nearly a quarter of academic hospitalists are burned out.
Step 2: Man Cannot Live by wRVUs Alone
An extension of this idea is that academicians need time for scholarship. In fact, academic productivity cannot be measured in wRVUs alone. Don’t get me wrong; hospitalists need to support their salaries and see lots of patients. But teaching the next generation, developing and disseminating knowledge, and generating a promotable academic portfolio takes time—time that can’t be shoe-horned into 200-plus busy clinical shifts a year. This is supported by evidence showing that more than 20% of protected non-clinical time was one of the biggest predictors of academic productivity.2
Five thousand wRVUs? Way too much. Four thousand? Getting warmer. Three thousand? Try a little lower. I’d go out on a limb and say the right number is slightly below 3,000 wRVUs.
I suspect this will raise some eyebrows among hospital administrators who fund these programs—and I welcome the letters. But before you pick up your pen, consider this: What is the value of educating our future physicians (something most teaching hospitals are funded to do through graduate medical education dollars), discovery, scholarship, hospital quality improvement (QI), and sustainable faculty careers? Academic hospitalists have decided to value it with a pay cut. Are our administrators willing to make a similar sacrifice?
Step 3: Culture of Scholarship
Protected time comes with a responsibility to produce. Discovering, publishing, speaking, and presenting are hard work—so hard that the default of not doing it presents an all-too-often-enticing option. This in part explains why most academic hospitalists have not published a first-author, peer-reviewed paper (51% have not), given institutional medical grand rounds (74%), or presented at a national meeting (75%).1
This is where cultivating a group culture of scholarship replete with expectations (# of publications/year), opportunities to present work (hospitalist Grand Rounds), faculty development, mentorship and institutional support (financial commitment and time to teach) are paramount.
Step 4: Academic Currency
Let me emphasize that last point. The majority of academic hospitalists lack formal fellowship training and, therefore, are not going to be funded or promoted based on research outputs. In fact, more than 90% of hospitalists will be promoted (or not) through the clinician-educator pathway. That means our academic currency is teaching and curriculum development.
That’s why the majority of academic hospitalists spending the majority of their time on non-teaching services is a major problem. It’s akin to an eternally unfunded researcher trying to get promoted as a clinician-investigator. It’s not going to happen.
Duty-hour restrictions, growing hospital services, PCP exodus from our hospitals, and the growth of comanagement are driving further hospitalist expansion in teaching hospitals. This means more mouths competing for a shrinking teaching pie. I don’t have the solution, but I suspect that those clinician-educators spending less than 25% of their time with learners will find it difficult to be sated, successful, and promotable in academia.
Step 5: Mentorship
Mentorship unquestionably is tied to publications, presentations, grant funding, job satisfaction, and, ultimately, academic promotion. Yet only 42% of academic hospitalists report having a mentor.2 Of those with a mentor, the vast majority spend less than four hours a year with their mentor.2 I can identify no more obvious and urgent problem to solve in academic HM.
Step 6: Job Structure
The single most powerful predictors of burnout and low satisfaction are a lack of work/life balance, autonomy, and control over one’s work environment. In fact, control over work schedule (odds ratio 5.35) and amount of personal time (OR 2.51) were the biggest predictors of burnout for academic hospitalists. Similarly, control over work schedule (OR 4.82) and amount of personal time (OR 2.37) predicted low satisfaction.1 The bottom line is that flexibility, autonomy, and control are essential components to academic fulfillment.
Step 7: The Secret Sauce
There you have it—a prescription for success.
Well, it turns out we are still missing one thing—one final ingredient, something mysterious and all-too-often lacking. A magic potion that allows for the right people to be in the right places with the right tools to succeed. With it, our potential knows no bounds. Without it, we’ll continue to struggle. In fact, its absence is one of the single biggest predictors of low satisfaction for academic hospitalists.1
What is “it”?
Leadership.
HM needs individuals to fill this prescription. The problem is that our leaders are often young, inexperienced, and raw. They are tasked with creating positions with an academic focus, reasonable clinical productivity expectations, a culture that promotes scholarship, sufficient non-clinical time, adequate time with learners, robust mentorship, and ample autonomy, work-life balance, and a chance to grow. To do this, they need direction, mentorship, a peer network, and skills development.
At least that’s what I need.
In fact, come to think of it, I think there is an eighth step for academic success—the need to develop an external academic peer network, to grow together, to actively engage, and depend on for help. As such, I hope you’ll partake in step No. 8 with me—at HM12, Academic Hospitalist Academy, Leadership Academies, and the Academic Summit. I hope to see you soon.
Dr. Glasheen is associate professor of medicine at the University of Colorado Denver, where he serves as director of the Hospital Medicine Program and the Hospitalist Training Program, and as associate program director of the Internal Medicine Residency Program. He is physician editor of The Hospitalist and course director of the SHM’s 2012 annual meeting (www.hospitalmedicine2012.org).
References
- Glasheen JJ, Misky GJ, Reid MB, Harrison RA, Sharpe B, Auerbach A. Career satisfaction and burnout in academic hospital medicine. Arch Intern Med. 2011;171:782-785.
- Reid MB, Misky GJ, Harrison RA, Sharpe B, Auerbach A, Glasheen JJ. Mentorship, productivity, and promotion among academic hospitalists. J Gen Intern Med. Epub online: Sept. 28, 2011.
- Hinami K, Whelan CT, Wolosin RJ, Miller JA, Wetterneck T. Worklife and satisfaction of hospitalists: Toward flourishing careers. J Gen Intern Med. Epub online: July 20, 2011.
Dr. Hospitalist

I recently became chief medical officer (CMO) of our hospital. When a hospitalist’s case comes to our patient-care committee, is it appropriate to inform the patient’s primary-care physician (PCP) of the quality issues? Our hospitalists are independent. There are questions of HIPAA. However, several committee members feel that the PCP, who does not come to the hospital, should be informed. Thank you.
K.A., M.D.
Dr. Hospitalist responds:
Good question. While I’ve participated in similar scenarios, keep in mind that I’m a hospitalist like you, not a lawyer. So, with that rejoinder in mind, let’s take this discussion a few steps further and see what happens.
You state: “when a hospitalist’s case comes to our patient-care committee.” Does that mean peer review? If it does, and what you are describing is a committee that handles privileged and confidential information, then you cannot inform the PCP because you would be violating the basic tenets of peer review.
The principle behind peer review is that it allows physicians to confidentially review the cases of their peers. This is to prevent the information contained in peer review from becoming available to a lawyer by subpoena or by discovery in the courts. The Joint Commission has mandated hospital peer review committees since 1952, and the federal government included language regarding peer-review protection in the Health Care Quality Improvement Act of 1986.
Every state has a law on the books, but the specifics and effectiveness of peer review will vary from state to state (see Florida’s Amendment 7, Kentucky, and Massachusetts). The whole idea is to allow for a process to evaluate physician practice or quality concerns without the fear of discovery or subsequent lawsuit. Even the act of referring a case to peer review is considered a confidential action in my state, so just the referral itself may not be discussed. So if you are referring to peer review, the answer is no, you cannot inform the patient’s PCP. HIPAA does not come into the picture here.
On the other hand, let’s assume, for sake of discussion, that you’ve heard a complaint (or several) about a certain hospitalist, Dr. Nogood. You could, if you desired, refer these complaints to peer review.
If so, then you are immediately bound by those rules of confidentiality. If you don’t refer the case, then you could inform the PCP that you have heard a complaint involving Dr. Nogood and that PCP’s patient.
I can’t see how that would violate HIPAA, because the PCP has an established relationship with that patient, and you might be only reporting facts (the complaint), not passing judgment on the quality of care. And I would not even go that far.
Why stop there? Why not tell that PCP exactly what you think of Dr. Nogood and his clinical practice, the details of the complaints against him, and how you think maybe that PCP should send his patients to someone else for better care? Well, you’re the CMO for the hospital. If you go beyond reporting facts and start reporting opinions, then you’ve just opened yourself up to accusations of restraint of trade by Dr. Nogood.
No matter what you may think of Dr. Nogood’s patient care, unless it falls outside the boundaries of acceptable practice (which can only be determined by a peer review committee), then you should not say anything.
Unless, of course, you want to be accused of spreading rumors, hearsay, and innuendo. Remember, we are talking about an independent practitioner, not a hospital employee.
Overall, it’s a bit of a sticky wicket. If you think the complaint has merit, then it should be sent to peer review—and you may speak no more of it. If you think the complaint is baseless, then why sustain it and tell the PCP?
Peer review is an exceptional process, and the physicians who serve on such committees perform a difficult and selfless service. We should all do our best to uphold its integrity.