User login
VTE Prophylaxis in Focus
Heparin prophylaxis had no significant impact on mortality rates in medical patients, according to a new report in Annals of Internal Medicine. And one of the authors suggests that the results should push hospitalists to use a more critical eye when considering pharmacological prophylaxis.
"Venous Thromboembolism Prophylaxis in Hospitalized Medical Patients and Those With Stroke: A Background Review for an American College of Physicians Clinical Practice Guideline" showed that in medical patients, heparin prophylaxis had no "statistically significant effect on any outcome in patients with acute stroke except for an increase in major bleeding events" (OR, 1.66 [CI, 1.20 to 2.28]). The authors concluded that precautionary use of heparin might have reduced pulmonary embolisms in both medical and stroke patients, but combined with upticks in bleeding and major bleeding events, the overall outcome results "in little or no net benefit."
"Our results do not really decide the issue for a physician and a patient whether prophylaxis should be used but rather show that this is a question that is still very much up in the air," says author Frank Lederle, MD, professor of medicine at the Minneapolis VA Medical Center. "That there may be good reasons to use prophylaxis, but it certainly shouldn't be something we're mandating or trying to achieve uniformity on when we don't have the evidence to do so."
Dr. Lederle adds that while some researchers are publishing papers on how well hospitalists and other physicians adhere to prophylactic procedures, he'd like to see more evidence-based analysis of the tactic's efficacy.
"The reason that this is not universally accepted by physicians is that people are aware that the data aren't that supportive of it," he says. "And that, really, the question should go back to 'Does it work and in whom does it work?' not 'Why are physicians failing to follow a guideline?'"
Improving Stroke Alert Response Time
In‐hospital strokes account for a significant proportion of the almost 800,000 cerebrovascular accidents that occur each year in the United States.1 Although inpatient strokes are thought to be under‐recognized and under‐reported, between 4% and 17% of all stroke patients in the hospital experienced stroke onset during hospitalization.2, 3 Estimates place the number of in‐hospital strokes at 35,000‐75,000 each year in the United States.4
As a result of the exquisite sensitivity of brain tissue to ischemic events, stroke is a medical emergency and time‐to‐treatment is of the essence. With each minute of ischemia, 1.9 million neurons are destroyed.5 Evidence suggests benefit of treatment with intravenous thrombolysis up to 4.5 hours after symptom onset, with lower disability associated with more rapid initiation of therapy.6, 7 To facilitate timely thrombolytic therapy, the American Stroke Association (ASA) recommends that imaging of the brain be initiated within 25 minutes of presentation for patients with suspected stroke.8
Studies demonstrate greater delays in the evaluation of hospitalized patients suffering from stroke compared to stroke patients presenting to the Emergency Department (ED).9, 10 Performance of timely evaluation of in‐hospital stroke rarely meets ASA goals. Analysis of a Michigan stroke registry found that only 3.1% of patients with in‐hospital strokes received computed tomography (CT) scan within 25 minutes of symptom recognition, and a Colorado stroke registry found time‐to‐evaluation to be more than twice the recommended benchmark.11, 12 Data from a multicenter stroke registry in Spain showed that half of all thrombolysis‐eligible, in‐hospital stroke patients could not be treated due to delays in evaluation.13
Our prior work demonstrated that the use of an in‐hospital stroke response team significantly reduced time to evaluation for true ischemic strokes.10 Even with this rapid response mechanism, the evaluation time for in‐hospital stroke was still more than twice that observed in the ED despite using the same team to respond to both settings. Hospital rapid response systems, specifically for patients with suspected stroke, have been described in the literature and outline in‐hospital response systems capable of meeting evaluation time goals.1415 How to optimize a stroke response system has not been previously described. The aim of this quality improvement (QI) initiative was to reduce time‐to‐evaluation for strokes occurring in patients already hospitalized using systems analysis and modification. We describe key elements and tools for implementing institutional QI for in‐hospital stroke.
METHODS
The QI initiative was implemented at the University of Colorado Hospital (UCH), a tertiary care academic medical center. The Colorado Multiple Institutional Review Board determined this project to be in the exempt category. UCH uses a protocol in which all stroke alerts undergo non‐contrast CT of the brain. If no intracranial bleeding is found, and the patient is a thrombolytic candidate, advanced CT imaging including CT perfusion and CT angiogram will also be performed during the alert. Magnetic resonance imaging (MRI) with diffusion weighted imaging is done non‐emergently for subsequent stroke evaluation, but is not part of the stroke alert protocol. The primary endpoint of time from alert to initiation of CT was chosen because it represents an unambiguous interval which is present for all stroke alerts. Pre‐intervention data was gathered for 6 months, from September 2008 to February 2009. During this period, the process through which in‐hospital strokes were identified, referred for evaluation, and treated was mapped to identify inefficient or unreliable steps, and the process was redesigned to enhance efficiency. The intervention was rolled out over a 3‐month period from March 2009 to May 2009. During the intervention roll‐out period, the refined stroke alert process and a checklist containing the optimal in‐hospital stroke alert response system was implemented. An education campaign was initiated, for acute stroke team members and nursing staff, on signs of stroke and each individual's role in response to symptoms of in‐hospital stroke based on the new process. During the roll‐out period, each unit in the hospital was provided in‐hospital stroke alert posters and a packet containing specific stroke education on the in‐hospital stroke alert process. Unit educators were empowered to determine how to best deliver the education to their staff, and many chose to invite the stroke program coordinator to give an hour‐long presentation on stroke prior to shift or during lunch. Each unit educator kept record of the stroke instruction provided and submitted staff signatures to the stroke program. Nursing staff was also provided with in‐hospital stroke protocol badge cards that outlined optimal approach to stroke identification and treatment using the revised protocol. Interventions were being implemented in a progressive fashion throughout the roll‐out period. Starting during the roll‐out and continuing into the post‐intervention period, feedback on all in‐hospital stroke alerts was provided to the stroke team and front‐line providers. The impact of the intervention was followed for 6 months post‐intervention from June 2009 to November 2009. The QI tools used in this project are well described by the Institute of Healthcare Improvement, and each step in the QI process is outlined in detail below:16
Step 1: Process Map With Identification of Unreliable and Reliably Slow Steps
A detailed process map was created to outline steps in the existing stroke alert process (see Supporting Figures, Process Maps, in the online version of this article). One investigator (R.Z.) interviewed key members of the multidisciplinary stroke team, including representatives from the departments of neurology, nursing, hospital medicine, neurosurgery, radiology, and transportation. Interviews with key stakeholders and frequent participants in stroke alerts revealed evidence of episodic unreliable steps. Stakeholders were noted to have slightly different conceptions of how the process flow was intended to occur, and where responsibility lay for certain tasks. The interviews aided in identification of pitfalls, bottlenecks, misconceptions, and areas that needed clarification or change in the alert process.
Examples of unreliable and bottleneck steps include: In the pre‐intervention process, the transportation department was responsible for moving patients to radiology; this step was identified as reliably slow. Investigation revealed that the transportation department did not have a mechanism for rapid response to emergency transport requests. Analysis also revealed that 2 key steps necessary for treating in‐hospital stroke were occasionally neglected: ensuring adequate intravenous (IV) access, and ordering of the correct panel of laboratory tests. Finally, a process communication deficit was identified, with CT technicians periodically unaware of the pending arrival of an in‐hospital stroke patient, thus preventing the scan from being cleared for the emergent stroke imaging.
Direct observation of real‐time stroke alerts in both the inpatient and ED settings was also employed to outline the process and identify areas of inefficiency. Direct observation of stroke alerts in progress verified the unified picture of process flow developed from stakeholder interviews (see Supporting Figures, Process Maps, in the online version of this article). Particular note was made of differences between the stroke alert process in the ED and the inpatient setting.
Step 2: System Redesign With Input From All Stakeholders
Proposed interventions were presented to hospital governing councils, including the interdisciplinary Stroke Council and Nurse Managers Council. After verification of the shortcomings of the existing alert process and obtaining buy‐in from key participants and governing departments, a new process was designed (see Supporting Figures, Process Maps, in the online version of this article). Specific changes include the following examples: First, electrocardiogram was moved to occur after CT scan. Second, investigation revealed that the transportation department within the hospital was designed for non‐emergent transportation and not amenable to change. The mechanism of patient transportation was changed such that, rather than using the transportation department, patients were now transported by the neurology resident responding to the stroke alert, accompanied by the patient's ward nurse. This both removed a bottleneck step and assured critical staff presence during the transportation of a potentially unstable patient. Third, to ensure effective communication, CT technicians were provided with stroke alert pagers that receive text messages regarding incoming in‐hospital stroke alert patients. Fourth, a time limit was set for IV attempts prior to transportation. The new protocol, along with explicit expectations for the role of the patient's nurse in in‐hospital stroke alerts, was described in a hospital‐wide nursing stroke education initiative.
Step 3: In‐Hospital Stroke Alert Checklist
A new standardized protocol for optimal in‐hospital stroke care was detailed on a laminated pocket card. The checklist described exactly what steps were to be performed, by whom, how to make them occur, and in what order. The checklist was designed to reduce the incidence of omitted steps, such as ordering of correct laboratory evaluations. The laminated cards highlighted the benchmark time to evaluation of 25 minutes. Process checklist cards were distributed to all members of the acute stroke alert response team, and short versions designed specifically for nursing staff were distributed as badge cards and posted on clinical care units (Supporting Information Appendix I).
Step 4: Real‐Time Feedback
During the intervention roll‐out and post‐intervention periods, feedback was provided from the stroke program to the front‐line providers following each in‐hospital stroke alert. The clinicians involved were notified of the final diagnosis and patient outcome, and were provided with feedback about how the patient's evaluation times compared with benchmark goals. Feedback may serve to motivate, based on clinician professionalism, but performance in the alert was not tied to rewards or penalties for the providers involved. The feedback process was designed to be bi‐directional, with requests for input from staff on barriers to rapid evaluation experienced and suggestions for future process improvement (Supporting Information Appendix II).
Statistical Analysis
The primary outcome was the change in time from stroke alert to CT scan (alert‐to‐CT), comparing pre‐intervention and post‐intervention periods. This time interval was chosen because its calculation involved unambiguous time points, which are available for all patients for whom an in‐hospital alert is called. It is a measure of process efficiency, with minimal expected variation based on differences in patient characteristics (ie, hemorrhagic vs ischemic stroke). Non‐overlapping Kaplan‐Meier curves confirmed the proportional hazards assumption for 2 Cox proportional hazards models: unadjusted and adjusted by group characteristics with P‐value 0.10. Relative hazards and estimates for the percent of patients with alert‐to‐CT scan 25 minutes, according to intervention groups, were obtained from these models. For analyses, admit unit was re‐categorized as intensive care unit (ICU), Med/Surg, or Other. Analyses were conducted using SAS Version 9.2 (SAS Institute, Inc, Cary, NC).
RESULTS
During the study intervals, there were 82 inpatient stroke alerts. Of these alerts, 75 were included in the analysis. Seven were excluded for the following reasons: alert canceled by the stroke team (3), time of alert was not recorded (1), patient identifiers not recorded (1), or stroke alert was preceded by CT imaging (2).
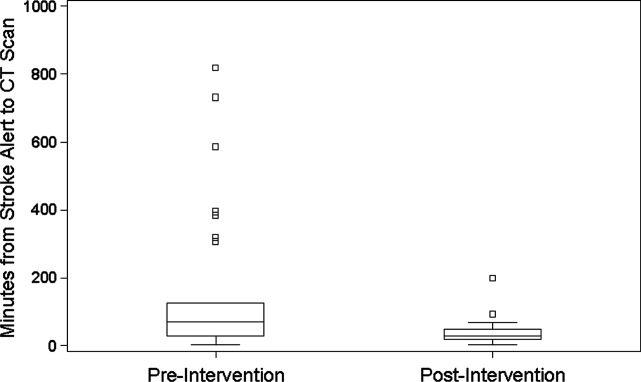
During the 6 months prior to intervention, the median inpatient stroke alert‐to‐CT time (n = 31) was 69.0 minutes (Table 1). Nineteen percent of these alerts met the goal of 25 minutes from alert‐to‐CT time. During the 6‐month post‐intervention period, the median inpatient alert‐to‐CT time (n = 44) was 29.5 minutes. Thirty‐two percent of these alerts met the 25‐minute alert‐to‐CT time benchmark. In the unadjusted model, patients during the post‐intervention period were significantly more likely to have alert‐to‐CT scan time 25 minutes compared to patients prior to the intervention (post‐intervention compared to pre‐intervention, Relative Hazard (RH): 3.03; 95% confidence interval [CI]: 1.76‐5.20; log‐rank P 0.0001). This remained significant after adjustment for hyperlipidemia, active cancer, final diagnosis of ischemic brain injury, and final diagnosis of stroke mimic (RH: 4.96; 95% CI: 2.65‐9.32; P 0.0001); data not shown. Admit unit was not included in the adjusted model since there was no indication of differences in the 3‐level variable according to intervention group (P = 0.27). In addition to reduction in median response times, the variability of response times was markedly reduced, and no patient in the 6‐month post‐intervention period had delay to CT sufficient to preclude use of IV thrombolysis (Figure 1).
| Pre‐Intervention (n = 31) | Post‐Intervention (n = 44) | P Value | |
|---|---|---|---|
| |||
| Stroke alert to CT time, median [95% CI] | 69 min [34, 103] | 29.5 min [26, 40] | P 0.0001 |
| Age, median [IQR] | 61.0 [54.0, 70.0] | 60.5 [48.5, 70.5] | 0.94 |
| Female (%) | 19 (61.3) | 23 (52.3) | 0.44 |
| Race (%) | |||
| Asian | 1 (3.2) | 1 (2.3) | 0.31 |
| Black | 4 (12.9) | 6 (13.6) | |
| Caucasian | 21 (67.7) | 27 (61.4) | |
| Hispanic | 3 (9.7) | 10 (22.7) | |
| Unknown | 2 (6.5) | 0 (0) | |
| Admit unit (%) | |||
| Intensive care | 12 (38.7) | 10 (22.7) | 0.07 |
| Medicine/surgery | 15 (48.4) | 24 (54.6) | |
| Neurology | 0 (0) | 5 (11.4) | |
| Post‐acute care | 3 (9.7) | 0 (0) | |
| Rehabilitation | 1 (3.2) | 2 (4.6) | |
| Women's and maternal care | 0 (0) | 2 (4.6) | |
| Cardiology | 0 (0) | 1 (2.3) | |
| Case mix index, median [IQR] | n = 29 2.6 [1.1, 5.0] | n = 42 2.2 [1.6, 4.5] | 0.82 |
| Prior cerebrovascular accident (%) | 5 (16.1) | 8 (18.2) | 0.82 |
| Hypertension (%) | 17 (54.8) | 24 (54.6) | 0.98 |
| Diabetes mellitus (%) | 7 (22.6) | 11 (25.0) | 0.81 |
| Hyperlipidemia (%) | 15 (48.4) | 9 (20.5) | 0.01 |
| Tobacco abuse, current (%) | 4 (12.9) | 1 (2.3) | 0.15 |
| Alcohol abuse (%) | 2 (6.5) | 0 (0) | 0.17 |
| Active cancer (%) | 8 (25.8) | 5 (11.4) | 0.10 |
| Peripheral vascular disease (%) | 2 (6.5) | 3 (6.8) | 1.0 |
| Coronary artery disease (%) | 6 (19.4) | 7 (15.9) | 0.70 |
| Congestive heart failure (%) | n = 30 5 (16.7) | 4 (9.1) | 0.47 |
| Valvulopathy (%) | 0 (0) | 1 (2.3) | 1.0 |
| Atrial fibrillation (%) | 3 (9.7) | 10 (22.7) | 0.14 |
| Anticoagulation (%) | 7 (22.6) | 7 (15.9) | 0.47 |
| Final diagnosis ischemic brain injury (%) | 15 (48.4) | 11 (25.0) | 0.04 |
| Final diagnosis hemorrhagic brain injury (%) | 3 (9.7) | 4 (9.1) | 1.0 |
| Final diagnosis stroke mimic (symptoms not due to ischemic or hemorrhagic brain injury) (%) | 13 (41.9) | 29 (65.9) | 0.04 |

CONCLUSIONS
In‐hospital strokes represent an emergency for which response time is critical. Neurologic injury progresses with every minute of ischemia, and current recommendations offer a limited time window for intravenous thrombolysis. For stroke with symptom onset in the monitored setting of the hospital, there is a compelling imperative to reduce all delays from system inefficiencies. The findings of the current QI initiative suggest that dramatic improvements are possible through systematic evaluation and redesign of hospital response processes, a checklist for in‐hospital stroke carried by front‐line responders, and ongoing real‐time feedback.
Limitations of this study include a prepost design. The necessity of implementing system change hospital‐wide precluded use of a concurrent control group. The time goals for evaluation are derived from American Stroke Association targets for patients arriving in the Emergency Department. There are differences in process between the hospital ward and the Emergency Department, but the fundamental concept of minimizing time to evaluation once patient symptoms are recognized by hospital staff remains valid.
The possibility of system improvements not due to this QI initiative cannot be excluded. In 2006, this hospital expanded the responsibility of the stroke response team to include acute neurologic deficits outside of the ED without other changes to the in‐hospital stroke alert process. This reduced time to evaluation for in‐hospital ischemic strokes compared to usual care, but even with the same acute stroke response team responding to stroke alerts in both settings, in‐hospital stroke response times remained significantly longer than response times for stroke in the ED.10 The presence of an in‐hospital stroke alert response team alone was not capable of reducing evaluation times to goal. Minimal improvement in median in‐hospital stroke alert evaluation time was seen in the intervening year, following the completion of our previously published analysis, suggesting explicit system QI was necessary.
The Hawthorne effect, in which individuals who know they are being observed modify behavior while such monitoring is in effect, is a major limitation of interpreting QI initiatives. By committing to continuous and ongoing feedback to front‐line providers, this phenomenon can be harnessed to sustain improvement.17 In effect, the study of efficient response to the in‐hospital stroke never ceases. UCH has continued to employ the post‐intervention stroke alert protocol and engage in ongoing feedback after each stroke alert. In the 12 months following the conclusion of this study, the median response time to in‐hospital strokes continues to be 30 minutes, and 7 additional in‐hospital stroke patients have been treated with thrombolysis.
This inpatient stroke alert initiative decreased median inpatient alert‐to‐CT time by 57%, and demonstrates that quality of in‐hospital stroke care can be improved. Decrease in stroke alert‐to‐CT time facilitates earlier thrombolytic therapy. Analysis of treatment and patient outcomes was outside of the scope of the current study, but earlier treatment has potential to significantly improve clinical outcomes.
The Society of Hospital Medicine defines one of the goals of QI to be the change in processes with reduction in variation, thus improving the care for all patients rather than focusing exclusively on outlier events.18 This initiative markedly reduced evaluation variability, allowing a greater percentage of patients to be eligible for treatment within the critical time window. Prior to the intervention, almost a quarter of patients had delays in evaluation sufficient to preclude IV thrombolysis, whereas in the 6 months after the intervention was initiated, not a single patient had evaluation delayed to the point that IV thrombolysis would not have been an option (Figure 1). The goal of in‐hospital stroke QI must be to improve the speed of the process for all patients, and assure that no patient is denied the potential for therapy as a result of inefficiencies in hospital systems.
Acknowledgements
The authors thank Traci Yamashita, PRA, for her work in the statistical analysis for this publication, and Dr Jeffrey Glasheen for development of the University of Colorado Hospital's Hospitalist Training Track Quality Improvement Program of which this work is a product.
- ,,, et al.Heart disease and stroke statistics—2010 update: a report from the American Heart Association.Circulation.2010;121:e46–e215.
- ,,.Characteristics of in‐hospital onset ischemic stroke.Eur Neurol.2006;55:155–159.
- ,.Inpatient and community ischemic strokes in a community hospital.Neuroepidemiology.2007;28:86–92.
- .In‐hospital stroke.Lancet Neurol.2003;2:741–746.
- .Time is brain‐quantified.Stroke.2006;37:263–266.
- ,,, et al.Ultra‐early thrombolysis in acute ischemic stroke is associated with better outcomes and lower mortality.Stroke.2010;41:712–716.
- ,,,.Expansion of the time window for treatment of acute ischemic stroke with intravenous tissue plasminogen activator: a science advisory from the American Heart Association/American Stroke Association.Stroke.2009;40:2945–2948.
- ,,, et al.Guidelines for early management of adults with ischemic stroke.Stroke.2007;38;1655–1711.
- ,,, et al.In‐hospital stroke treated with intravenous tissue plasminogen activator.Stroke.2008;39:2614–2616.
- ,,,,.Stroke alert program improves recognition and evaluation time of in‐hospital ischemic stroke.J Stroke Cerebrovasc Dis.2009;19:494–496.
- ,,,,,.In‐hospital stroke in a statewide stroke registry.Cerebrovasc Dis.2008;25:12–20.
- ,,,,.Quality of care for in‐hospital stroke: analysis of a statewide registry.Stroke.2011;42:207–210.
- ,,, et al.In‐hospital stroke: a multi‐center prospective registry.Eur J Neurol.2011;18:170–176.
- ,,.Code Gray—an organized approach to inpatient stroke.Crit Care Nurs Q.2003;26:296–302.
- ,,.ID, stat‐rapid response to in‐hospital stroke patients.Nurs Manage.2009;40:34–38.
- Institute of Healthcare Improvement. Quality Improvement Tools. Available at: http://www.ihi.org/IHI/Topics/Improvement/ImprovementMethods/Tools/. Accessed December 1,2010.
- ,,,,,.Variability in the Hawthorne effect with regard to hand hygiene performance in high‐ and low‐performing inpatient care units.Infect Control Hosp Epidemiol.2009;30:222–225.
- Society of Hospital Medicine Quality Improvement Resources. Available at: http://www.hospitalmedicine.org/ResourceRoomRedesign/html/32. Accessed December 1,2010.
In‐hospital strokes account for a significant proportion of the almost 800,000 cerebrovascular accidents that occur each year in the United States.1 Although inpatient strokes are thought to be under‐recognized and under‐reported, between 4% and 17% of all stroke patients in the hospital experienced stroke onset during hospitalization.2, 3 Estimates place the number of in‐hospital strokes at 35,000‐75,000 each year in the United States.4
As a result of the exquisite sensitivity of brain tissue to ischemic events, stroke is a medical emergency and time‐to‐treatment is of the essence. With each minute of ischemia, 1.9 million neurons are destroyed.5 Evidence suggests benefit of treatment with intravenous thrombolysis up to 4.5 hours after symptom onset, with lower disability associated with more rapid initiation of therapy.6, 7 To facilitate timely thrombolytic therapy, the American Stroke Association (ASA) recommends that imaging of the brain be initiated within 25 minutes of presentation for patients with suspected stroke.8
Studies demonstrate greater delays in the evaluation of hospitalized patients suffering from stroke compared to stroke patients presenting to the Emergency Department (ED).9, 10 Performance of timely evaluation of in‐hospital stroke rarely meets ASA goals. Analysis of a Michigan stroke registry found that only 3.1% of patients with in‐hospital strokes received computed tomography (CT) scan within 25 minutes of symptom recognition, and a Colorado stroke registry found time‐to‐evaluation to be more than twice the recommended benchmark.11, 12 Data from a multicenter stroke registry in Spain showed that half of all thrombolysis‐eligible, in‐hospital stroke patients could not be treated due to delays in evaluation.13
Our prior work demonstrated that the use of an in‐hospital stroke response team significantly reduced time to evaluation for true ischemic strokes.10 Even with this rapid response mechanism, the evaluation time for in‐hospital stroke was still more than twice that observed in the ED despite using the same team to respond to both settings. Hospital rapid response systems, specifically for patients with suspected stroke, have been described in the literature and outline in‐hospital response systems capable of meeting evaluation time goals.1415 How to optimize a stroke response system has not been previously described. The aim of this quality improvement (QI) initiative was to reduce time‐to‐evaluation for strokes occurring in patients already hospitalized using systems analysis and modification. We describe key elements and tools for implementing institutional QI for in‐hospital stroke.
METHODS
The QI initiative was implemented at the University of Colorado Hospital (UCH), a tertiary care academic medical center. The Colorado Multiple Institutional Review Board determined this project to be in the exempt category. UCH uses a protocol in which all stroke alerts undergo non‐contrast CT of the brain. If no intracranial bleeding is found, and the patient is a thrombolytic candidate, advanced CT imaging including CT perfusion and CT angiogram will also be performed during the alert. Magnetic resonance imaging (MRI) with diffusion weighted imaging is done non‐emergently for subsequent stroke evaluation, but is not part of the stroke alert protocol. The primary endpoint of time from alert to initiation of CT was chosen because it represents an unambiguous interval which is present for all stroke alerts. Pre‐intervention data was gathered for 6 months, from September 2008 to February 2009. During this period, the process through which in‐hospital strokes were identified, referred for evaluation, and treated was mapped to identify inefficient or unreliable steps, and the process was redesigned to enhance efficiency. The intervention was rolled out over a 3‐month period from March 2009 to May 2009. During the intervention roll‐out period, the refined stroke alert process and a checklist containing the optimal in‐hospital stroke alert response system was implemented. An education campaign was initiated, for acute stroke team members and nursing staff, on signs of stroke and each individual's role in response to symptoms of in‐hospital stroke based on the new process. During the roll‐out period, each unit in the hospital was provided in‐hospital stroke alert posters and a packet containing specific stroke education on the in‐hospital stroke alert process. Unit educators were empowered to determine how to best deliver the education to their staff, and many chose to invite the stroke program coordinator to give an hour‐long presentation on stroke prior to shift or during lunch. Each unit educator kept record of the stroke instruction provided and submitted staff signatures to the stroke program. Nursing staff was also provided with in‐hospital stroke protocol badge cards that outlined optimal approach to stroke identification and treatment using the revised protocol. Interventions were being implemented in a progressive fashion throughout the roll‐out period. Starting during the roll‐out and continuing into the post‐intervention period, feedback on all in‐hospital stroke alerts was provided to the stroke team and front‐line providers. The impact of the intervention was followed for 6 months post‐intervention from June 2009 to November 2009. The QI tools used in this project are well described by the Institute of Healthcare Improvement, and each step in the QI process is outlined in detail below:16
Step 1: Process Map With Identification of Unreliable and Reliably Slow Steps
A detailed process map was created to outline steps in the existing stroke alert process (see Supporting Figures, Process Maps, in the online version of this article). One investigator (R.Z.) interviewed key members of the multidisciplinary stroke team, including representatives from the departments of neurology, nursing, hospital medicine, neurosurgery, radiology, and transportation. Interviews with key stakeholders and frequent participants in stroke alerts revealed evidence of episodic unreliable steps. Stakeholders were noted to have slightly different conceptions of how the process flow was intended to occur, and where responsibility lay for certain tasks. The interviews aided in identification of pitfalls, bottlenecks, misconceptions, and areas that needed clarification or change in the alert process.
Examples of unreliable and bottleneck steps include: In the pre‐intervention process, the transportation department was responsible for moving patients to radiology; this step was identified as reliably slow. Investigation revealed that the transportation department did not have a mechanism for rapid response to emergency transport requests. Analysis also revealed that 2 key steps necessary for treating in‐hospital stroke were occasionally neglected: ensuring adequate intravenous (IV) access, and ordering of the correct panel of laboratory tests. Finally, a process communication deficit was identified, with CT technicians periodically unaware of the pending arrival of an in‐hospital stroke patient, thus preventing the scan from being cleared for the emergent stroke imaging.
Direct observation of real‐time stroke alerts in both the inpatient and ED settings was also employed to outline the process and identify areas of inefficiency. Direct observation of stroke alerts in progress verified the unified picture of process flow developed from stakeholder interviews (see Supporting Figures, Process Maps, in the online version of this article). Particular note was made of differences between the stroke alert process in the ED and the inpatient setting.
Step 2: System Redesign With Input From All Stakeholders
Proposed interventions were presented to hospital governing councils, including the interdisciplinary Stroke Council and Nurse Managers Council. After verification of the shortcomings of the existing alert process and obtaining buy‐in from key participants and governing departments, a new process was designed (see Supporting Figures, Process Maps, in the online version of this article). Specific changes include the following examples: First, electrocardiogram was moved to occur after CT scan. Second, investigation revealed that the transportation department within the hospital was designed for non‐emergent transportation and not amenable to change. The mechanism of patient transportation was changed such that, rather than using the transportation department, patients were now transported by the neurology resident responding to the stroke alert, accompanied by the patient's ward nurse. This both removed a bottleneck step and assured critical staff presence during the transportation of a potentially unstable patient. Third, to ensure effective communication, CT technicians were provided with stroke alert pagers that receive text messages regarding incoming in‐hospital stroke alert patients. Fourth, a time limit was set for IV attempts prior to transportation. The new protocol, along with explicit expectations for the role of the patient's nurse in in‐hospital stroke alerts, was described in a hospital‐wide nursing stroke education initiative.
Step 3: In‐Hospital Stroke Alert Checklist
A new standardized protocol for optimal in‐hospital stroke care was detailed on a laminated pocket card. The checklist described exactly what steps were to be performed, by whom, how to make them occur, and in what order. The checklist was designed to reduce the incidence of omitted steps, such as ordering of correct laboratory evaluations. The laminated cards highlighted the benchmark time to evaluation of 25 minutes. Process checklist cards were distributed to all members of the acute stroke alert response team, and short versions designed specifically for nursing staff were distributed as badge cards and posted on clinical care units (Supporting Information Appendix I).
Step 4: Real‐Time Feedback
During the intervention roll‐out and post‐intervention periods, feedback was provided from the stroke program to the front‐line providers following each in‐hospital stroke alert. The clinicians involved were notified of the final diagnosis and patient outcome, and were provided with feedback about how the patient's evaluation times compared with benchmark goals. Feedback may serve to motivate, based on clinician professionalism, but performance in the alert was not tied to rewards or penalties for the providers involved. The feedback process was designed to be bi‐directional, with requests for input from staff on barriers to rapid evaluation experienced and suggestions for future process improvement (Supporting Information Appendix II).
Statistical Analysis
The primary outcome was the change in time from stroke alert to CT scan (alert‐to‐CT), comparing pre‐intervention and post‐intervention periods. This time interval was chosen because its calculation involved unambiguous time points, which are available for all patients for whom an in‐hospital alert is called. It is a measure of process efficiency, with minimal expected variation based on differences in patient characteristics (ie, hemorrhagic vs ischemic stroke). Non‐overlapping Kaplan‐Meier curves confirmed the proportional hazards assumption for 2 Cox proportional hazards models: unadjusted and adjusted by group characteristics with P‐value 0.10. Relative hazards and estimates for the percent of patients with alert‐to‐CT scan 25 minutes, according to intervention groups, were obtained from these models. For analyses, admit unit was re‐categorized as intensive care unit (ICU), Med/Surg, or Other. Analyses were conducted using SAS Version 9.2 (SAS Institute, Inc, Cary, NC).
RESULTS
During the study intervals, there were 82 inpatient stroke alerts. Of these alerts, 75 were included in the analysis. Seven were excluded for the following reasons: alert canceled by the stroke team (3), time of alert was not recorded (1), patient identifiers not recorded (1), or stroke alert was preceded by CT imaging (2).
During the 6 months prior to intervention, the median inpatient stroke alert‐to‐CT time (n = 31) was 69.0 minutes (Table 1). Nineteen percent of these alerts met the goal of 25 minutes from alert‐to‐CT time. During the 6‐month post‐intervention period, the median inpatient alert‐to‐CT time (n = 44) was 29.5 minutes. Thirty‐two percent of these alerts met the 25‐minute alert‐to‐CT time benchmark. In the unadjusted model, patients during the post‐intervention period were significantly more likely to have alert‐to‐CT scan time 25 minutes compared to patients prior to the intervention (post‐intervention compared to pre‐intervention, Relative Hazard (RH): 3.03; 95% confidence interval [CI]: 1.76‐5.20; log‐rank P 0.0001). This remained significant after adjustment for hyperlipidemia, active cancer, final diagnosis of ischemic brain injury, and final diagnosis of stroke mimic (RH: 4.96; 95% CI: 2.65‐9.32; P 0.0001); data not shown. Admit unit was not included in the adjusted model since there was no indication of differences in the 3‐level variable according to intervention group (P = 0.27). In addition to reduction in median response times, the variability of response times was markedly reduced, and no patient in the 6‐month post‐intervention period had delay to CT sufficient to preclude use of IV thrombolysis (Figure 1).
| Pre‐Intervention (n = 31) | Post‐Intervention (n = 44) | P Value | |
|---|---|---|---|
| |||
| Stroke alert to CT time, median [95% CI] | 69 min [34, 103] | 29.5 min [26, 40] | P 0.0001 |
| Age, median [IQR] | 61.0 [54.0, 70.0] | 60.5 [48.5, 70.5] | 0.94 |
| Female (%) | 19 (61.3) | 23 (52.3) | 0.44 |
| Race (%) | |||
| Asian | 1 (3.2) | 1 (2.3) | 0.31 |
| Black | 4 (12.9) | 6 (13.6) | |
| Caucasian | 21 (67.7) | 27 (61.4) | |
| Hispanic | 3 (9.7) | 10 (22.7) | |
| Unknown | 2 (6.5) | 0 (0) | |
| Admit unit (%) | |||
| Intensive care | 12 (38.7) | 10 (22.7) | 0.07 |
| Medicine/surgery | 15 (48.4) | 24 (54.6) | |
| Neurology | 0 (0) | 5 (11.4) | |
| Post‐acute care | 3 (9.7) | 0 (0) | |
| Rehabilitation | 1 (3.2) | 2 (4.6) | |
| Women's and maternal care | 0 (0) | 2 (4.6) | |
| Cardiology | 0 (0) | 1 (2.3) | |
| Case mix index, median [IQR] | n = 29 2.6 [1.1, 5.0] | n = 42 2.2 [1.6, 4.5] | 0.82 |
| Prior cerebrovascular accident (%) | 5 (16.1) | 8 (18.2) | 0.82 |
| Hypertension (%) | 17 (54.8) | 24 (54.6) | 0.98 |
| Diabetes mellitus (%) | 7 (22.6) | 11 (25.0) | 0.81 |
| Hyperlipidemia (%) | 15 (48.4) | 9 (20.5) | 0.01 |
| Tobacco abuse, current (%) | 4 (12.9) | 1 (2.3) | 0.15 |
| Alcohol abuse (%) | 2 (6.5) | 0 (0) | 0.17 |
| Active cancer (%) | 8 (25.8) | 5 (11.4) | 0.10 |
| Peripheral vascular disease (%) | 2 (6.5) | 3 (6.8) | 1.0 |
| Coronary artery disease (%) | 6 (19.4) | 7 (15.9) | 0.70 |
| Congestive heart failure (%) | n = 30 5 (16.7) | 4 (9.1) | 0.47 |
| Valvulopathy (%) | 0 (0) | 1 (2.3) | 1.0 |
| Atrial fibrillation (%) | 3 (9.7) | 10 (22.7) | 0.14 |
| Anticoagulation (%) | 7 (22.6) | 7 (15.9) | 0.47 |
| Final diagnosis ischemic brain injury (%) | 15 (48.4) | 11 (25.0) | 0.04 |
| Final diagnosis hemorrhagic brain injury (%) | 3 (9.7) | 4 (9.1) | 1.0 |
| Final diagnosis stroke mimic (symptoms not due to ischemic or hemorrhagic brain injury) (%) | 13 (41.9) | 29 (65.9) | 0.04 |
CONCLUSIONS
In‐hospital strokes represent an emergency for which response time is critical. Neurologic injury progresses with every minute of ischemia, and current recommendations offer a limited time window for intravenous thrombolysis. For stroke with symptom onset in the monitored setting of the hospital, there is a compelling imperative to reduce all delays from system inefficiencies. The findings of the current QI initiative suggest that dramatic improvements are possible through systematic evaluation and redesign of hospital response processes, a checklist for in‐hospital stroke carried by front‐line responders, and ongoing real‐time feedback.
Limitations of this study include a prepost design. The necessity of implementing system change hospital‐wide precluded use of a concurrent control group. The time goals for evaluation are derived from American Stroke Association targets for patients arriving in the Emergency Department. There are differences in process between the hospital ward and the Emergency Department, but the fundamental concept of minimizing time to evaluation once patient symptoms are recognized by hospital staff remains valid.
The possibility of system improvements not due to this QI initiative cannot be excluded. In 2006, this hospital expanded the responsibility of the stroke response team to include acute neurologic deficits outside of the ED without other changes to the in‐hospital stroke alert process. This reduced time to evaluation for in‐hospital ischemic strokes compared to usual care, but even with the same acute stroke response team responding to stroke alerts in both settings, in‐hospital stroke response times remained significantly longer than response times for stroke in the ED.10 The presence of an in‐hospital stroke alert response team alone was not capable of reducing evaluation times to goal. Minimal improvement in median in‐hospital stroke alert evaluation time was seen in the intervening year, following the completion of our previously published analysis, suggesting explicit system QI was necessary.
The Hawthorne effect, in which individuals who know they are being observed modify behavior while such monitoring is in effect, is a major limitation of interpreting QI initiatives. By committing to continuous and ongoing feedback to front‐line providers, this phenomenon can be harnessed to sustain improvement.17 In effect, the study of efficient response to the in‐hospital stroke never ceases. UCH has continued to employ the post‐intervention stroke alert protocol and engage in ongoing feedback after each stroke alert. In the 12 months following the conclusion of this study, the median response time to in‐hospital strokes continues to be 30 minutes, and 7 additional in‐hospital stroke patients have been treated with thrombolysis.
This inpatient stroke alert initiative decreased median inpatient alert‐to‐CT time by 57%, and demonstrates that quality of in‐hospital stroke care can be improved. Decrease in stroke alert‐to‐CT time facilitates earlier thrombolytic therapy. Analysis of treatment and patient outcomes was outside of the scope of the current study, but earlier treatment has potential to significantly improve clinical outcomes.
The Society of Hospital Medicine defines one of the goals of QI to be the change in processes with reduction in variation, thus improving the care for all patients rather than focusing exclusively on outlier events.18 This initiative markedly reduced evaluation variability, allowing a greater percentage of patients to be eligible for treatment within the critical time window. Prior to the intervention, almost a quarter of patients had delays in evaluation sufficient to preclude IV thrombolysis, whereas in the 6 months after the intervention was initiated, not a single patient had evaluation delayed to the point that IV thrombolysis would not have been an option (Figure 1). The goal of in‐hospital stroke QI must be to improve the speed of the process for all patients, and assure that no patient is denied the potential for therapy as a result of inefficiencies in hospital systems.
Acknowledgements
The authors thank Traci Yamashita, PRA, for her work in the statistical analysis for this publication, and Dr Jeffrey Glasheen for development of the University of Colorado Hospital's Hospitalist Training Track Quality Improvement Program of which this work is a product.
- ,,, et al.Heart disease and stroke statistics—2010 update: a report from the American Heart Association.Circulation.2010;121:e46–e215.
- ,,.Characteristics of in‐hospital onset ischemic stroke.Eur Neurol.2006;55:155–159.
- ,.Inpatient and community ischemic strokes in a community hospital.Neuroepidemiology.2007;28:86–92.
- .In‐hospital stroke.Lancet Neurol.2003;2:741–746.
- .Time is brain‐quantified.Stroke.2006;37:263–266.
- ,,, et al.Ultra‐early thrombolysis in acute ischemic stroke is associated with better outcomes and lower mortality.Stroke.2010;41:712–716.
- ,,,.Expansion of the time window for treatment of acute ischemic stroke with intravenous tissue plasminogen activator: a science advisory from the American Heart Association/American Stroke Association.Stroke.2009;40:2945–2948.
- ,,, et al.Guidelines for early management of adults with ischemic stroke.Stroke.2007;38;1655–1711.
- ,,, et al.In‐hospital stroke treated with intravenous tissue plasminogen activator.Stroke.2008;39:2614–2616.
- ,,,,.Stroke alert program improves recognition and evaluation time of in‐hospital ischemic stroke.J Stroke Cerebrovasc Dis.2009;19:494–496.
- ,,,,,.In‐hospital stroke in a statewide stroke registry.Cerebrovasc Dis.2008;25:12–20.
- ,,,,.Quality of care for in‐hospital stroke: analysis of a statewide registry.Stroke.2011;42:207–210.
- ,,, et al.In‐hospital stroke: a multi‐center prospective registry.Eur J Neurol.2011;18:170–176.
- ,,.Code Gray—an organized approach to inpatient stroke.Crit Care Nurs Q.2003;26:296–302.
- ,,.ID, stat‐rapid response to in‐hospital stroke patients.Nurs Manage.2009;40:34–38.
- Institute of Healthcare Improvement. Quality Improvement Tools. Available at: http://www.ihi.org/IHI/Topics/Improvement/ImprovementMethods/Tools/. Accessed December 1,2010.
- ,,,,,.Variability in the Hawthorne effect with regard to hand hygiene performance in high‐ and low‐performing inpatient care units.Infect Control Hosp Epidemiol.2009;30:222–225.
- Society of Hospital Medicine Quality Improvement Resources. Available at: http://www.hospitalmedicine.org/ResourceRoomRedesign/html/32. Accessed December 1,2010.
Toxin Assay and ICD‐9 for Reporting
With an increased incidence of 13.1 per 1000 inpatients1, 2 and an attributable mortality of 6.1%,3 in 2006 the Canadian government added Clostridium difficileassociated disease (CDAD) to its list of reportable diseases.4 The Centers for Disease Control and Prevention and the Infectious Disease Society of America subsequently created definitions of the disease and recommended surveillance of rates of health care facilityassociated CDAD, which has been found to double a patient's length of stay and cost of hospitalization.57 While not included in the current list of hospital‐acquired conditions for which payment is declined,8 the Centers for Medicare & Medicaid Services (CMS) has noted CDAD as under consideration for addition to the list,9 which would require hospital reporting of CDAD rates. This reporting is typically a labor‐intensive, medical record review process that increases the cost of delivering health care. Health care institutions have reported spending as much as $21 million per year or $400 per discharged patient on quality improvement.10 These costs are passed on to payers such as those governed by the CMS that are projected to pay for more than half of all national health spending in 2018.11 Therefore, it is prudent to examine alternatives for determining rates of disease for public reporting and quality improvement initiatives such as infection control and antibiotic stewardship programs.
There are 3 methods that can be used for this reporting. First, medical record review has been used for determining the case rate of CDAD by published reports.1, 2 This procedure allows the CMS to define the desired data to be collected, but it is labor‐intensive. Second, the use of International Statistical Classification of Diseases and Related Health Problems, 9th Edition (ICD‐9) codes from hospital databases offers the speed of database query. However, due to diagnostic and coding errors, it may report inaccurate rates of disease. Previous reports include a university‐based hospital that found a sensitivity of 78% and specificity of 99.7%,12 whereas a Veterans Administration medical center found nearly two‐thirds of patients with CDAD did not have the ICD‐9 code for C. difficile infection noted in their database.13 Therefore, the accuracy of ICD‐9 code at a community hospital that better represents the majority of United States hospitals is needed. The third method of identifying CDAD is the presence of toxin identified in the microbiology laboratory. Although this method offers ease of obtainment, it suffers from potential inaccuracy arising from duplicate patient samples, positive samples in patients who are symptom‐free carriers, and patients with CDAD despite having a negative toxin.
The same organizations that recommend surveillance for CDAD have identified that there are inadequate data on which to base a decision regarding how to proceed with routine community and hospital surveillance.6 In the setting of public reporting and nonpayment, the method of identifying CDAD cases must be accurate to ensure fairness, while being inexpensive. To identify the potential value of these less labor‐intensive methods of reporting the incidence of CDAD, we evaluated the use of ICD‐9 codes and C. difficile toxin to accurately report the incidence of CDAD at a community hospital, as well as the labor hours required for each reporting method.
METHODS
Patients >18 years of age and potentially having CDAD were identified via database queries for ICD‐9 codes and positive C. difficile toxin assays at our institution from November 1, 2006, through August 31, 2007. Our institution is a 379‐bed university‐affiliated community teaching hospital in a socio‐economically diverse area of Baltimorewith approximately 110,000 emergency department visits, 30,000 discharges, and 110,000 inpatient days each yearthat uses a handwritten paper chart for all provider orders and patient documentation. The C. difficile toxin assay method used during the study period was an enzyme immunoassay that detects both toxins A and B (Meridan Bioscience, Cincinnati, OH). ICD‐9 codes were queried in the CareScience database(Premier, Inc; Charlotte, NC), while C. difficile toxin was queried via the hospital laboratory database. All identified patients underwent a medical record review to confirm the diagnosis of CDAD and the patient's location at the time of disease acquisition. To eliminate duplicate reporting of a single episode of disease, all duplicate patient visits with a diagnosis of CDAD within 30 days were removed.
Our diagnostic criteria (Table 1) used the recommended criteria of a combination of symptoms and positive toxin assay, visualization of pseudomembranes on colonoscopy or pathology‐proven CDAD.6 Based on the presence of CDAD in 25% of patients with a white blood cell count >30,000 and the recommendation that CDAD be considered in all patients with a white blood cell count >15,000, we included the criterion of clinical findings with severe leukocytosis to identify patients with toxin‐negative CDAD.14
| Chart Review Criteria for CDAD | Chart Review Criteria for CDAD Obtained While Patient Was Not at Our Hospital | Chart Review Criteria for CDAD Obtained While Patient Was at Our Hospital |
|---|---|---|
| ||
| Pseudomembranous colitis seen during endoscopy OR biopsy or resection with surgical pathology consistent with CDAD | One of the above symptoms or objective criteria positive within the first 3 days of hospitalization AND patient was not cared for at our insitution within the last 7 days | Patient was cared for at our institution within 7 days of presentation OR the patient's symptoms were not present upon arrival at the hospital and the symptoms began after the third day of hospitalization |
| If neither of the above are present, then Clostridium difficile toxin or WBC count >25,000 plus one of the following: | ||
| Diarrhea | ||
| Fever without other cause | ||
| Abdominal pain without other cause | ||
| Colonic ileus without other cause | ||
Patients were identified by querying the CareScience database for patients having an ICD‐9 code of 008.45. Duplicate cases for the same patient within 30 days were removed. These cases were compared with the cases of CDAD determined by the medical record review for analysis. Patients were identified via positive C. difficile toxin by querying the microbiology laboratory database. A query of all patients with a positive C. difficile toxin was performed. Duplicate samples for the same patient within 30 days were removed. Patients are considered to be outside the hospital when CDAD was acquired if their toxin was positive within the first 3 days of arrival to the hospital, and they were not hospitalized at our institution within 1 week before arrival. All other cases were considered to be acquired while in our hospital. The number of patients with a toxin‐positive stool sample was compared with the medical record review.
Recognizing that it is unrealistic to review the medical records of the 23,495 discharges during the 10‐month study period, a random sample review of 500 charts not included in our CDAD‐identified patient list was performed to identify the rate at which CDAD patients failed to be identified by our methods. From a list of discharges during the study period, as long as they were not in our study population, every thirtieth patient was selected for review up to a total of 500 patient charts. Then, the identified case rate was used to predict the prevalence of disease at our institution during the study period.
Sample selection was based on the absence of previous studies evaluating the performance of C. difficile toxin assay, and the desire to have the same assay used during the entire study. The lack of data from which to perform sample size determination would result in an inaccurate estimate. Therefore, we chose a period that offered the maximum sample size, during which a single assay was used at our institution. Compared with medical record review, the accuracy and positive predictive values of the ICD‐9 code and positive stool toxin methods to identify the cases of CDAD were compared. A true positive was when the ICD‐9 or laboratory query method identified a patient who had CDAD based on chart review; a false positive was when the ICD‐9 or laboratory query method identified a patient who did not have CDAD based on chart review. Rates of over‐ or underdiagnosis, case rates, and acquisition location were determined. Statistical analysis of the case rates and acquisition location were performed via chi‐square test. The time to perform these queries was collected with accuracy to the minute.
RESULTS
Of the 23,495 discharges during the study period, the combination of ICD‐9 and C. difficile toxin assay identified a total cohort of 496 patients, 319 of whom were identified by both the ICD‐9 method and the toxin assay, 50 of whom were identified only by the toxin assay, and 127 of whom were identified only by the ICD‐9 method. Chart review confirmed the presence of CDAD in 384 of these 496 cases, for a case rate of 16.3 per 1000 discharged patients (Table 2). The diagnostic criteria for each of these confirmed cases are listed in Table 3. Of the 384 confirmed CDAD cases, 319 were identified by both the ICD‐9 and toxin assay, 50 were identified only by the toxin assay, and 15 were identified only by the ICD‐9 query. Of the 50 cases identified by the toxin assay that were not identified via the ICD‐9 method, all 50 (100%) were confirmed to have CDAD by chart review. In contrast, of the 127 cases identified via the ICD‐9 method that were not found via the toxin assay, only 15 (11.8%) were confirmed to have CDAD by chart review (Figure 1).
| ICD‐9 | Toxin Assay | Chart Review | |
|---|---|---|---|
| |||
| No. of patients identified | 446 | 369 | 384 |
| Case rate per 1000 discharges* | 19.0 | 15.7 | 16.3 |
| 95% confidence interval | 17.320.8 | 14.117.4 | NA |
| Case rate compared with chart review, P | P = 0.001 | P = 0.440 | NA |
| CDAD rate reported compared with chart review | 116.1% | 96.1% | NA |
| Accuracy | 83.9% | 96.1% | NA |
| PPV | 74.9% | 100% | NA |
| Portion of cases acquired at our hospital, % | NA | 48.2% | 40.6% |
| Portion of cases acquired at our hospital, P | NA | P = 0.003 | NA |
| Minutes consumed for data collection | 312 | 842 | 21,899 |
| Estimated annual cost per hospital | $234.00 | $631.50 | $16,424.25 |
| Criterion | No. of Cases | Case Rate* |
|---|---|---|
| ||
| Endoscopy | 2 | 0.5% |
| Surgical pathology | 9 | 2.3% |
| Positive toxin and diarrhea | 369 | 96.1% |
| WBC >25.0 and diarrhea | 51 | 13.3% |
| WBC >25.0 and fever without other source | 9 | 2.3% |
| WBC >25.0 and unexplained abdominal pain | 17 | 4.4% |
| WBC >25.0 and colonic ileus | 2 | 0.5% |
Of these 384 cases, 369 were identified via the toxin assay for a case rate of 15.7 per 1000 patient discharges, which was not found to be different from the rate of 16.3 determined by chart review (P = 0.440; 95% confidence interval [CI], 14.117.4). Compared with chart review, the toxin assay reported 96.1% (369/384) of cases. Chart review demonstrated that every patient who had a positive toxin assay met the diagnostic criteria for CDAD for a positive predictive value (PPV) of 100%.
The ICD‐9 method identified 446 patients thought to have CDAD, 334 of whom were confirmed by chart review for a PPV of 74.9% (334/446). Compared with chart review, the ICD‐9 method reported 116.1% (446/384) of cases for a case rate of 19.0 per 1000 discharges and was significantly different than the rate of 16.3 reported by chart review (P = 0.001; 95% CI, 17.320.8).
Chart review identified 156 of 384 (40.6%) patients who acquired CDAD while at our hospital and 228 of 384 (59.4%) who acquired it elsewhere. In comparison, the toxin assay criteria identified 369 cases of CDAD, of which 48.2% (178/369) were acquired while at our hospital and 51.8% (191/369) were acquired elsewhere (P = 0.003).
The time for data extraction via these 3 methods differed greatly. The ICD‐9 method only consumed 312 minutes and the toxin assay method 842 minutes, whereas the chart review method consumed 21,899 minutes. These times reported include the database query and data analysis for the ICD‐9 and toxin assay methods, while it includes the database query and list generation along with the manual chart review and data analysis for the chart review method. The review of the random sample of patients believed not to have CDAD was not included in any of the reported times. Chart review on a random sample of 500 patients not previously identified for review found no additional cases of CDAD.
DISCUSSION
Our study demonstrates that use of positive C. difficile toxin assay data from the microbiology laboratory alone is an efficient method of identifying patients with CDAD. This method only consumed 842 minutes versus 21,899 minutes consumed by the chart review method. The C. difficile toxin method reduces the workforce required to collect and analyze this data, but more importantly, it was found to be reliable by reporting an institutional case rate that is similar to that of chart review.
In contrast, the ICD‐9 method was efficient but less reliable. It only consumed 312 minutes, but it overreported the institutional rate of CDAD by 16.1%, had a PPV of only 74.9%, and of those patients who were identified by ICD‐9 but not toxin assay, only 11.8% actually had CDAD. This finding is in conflict with the previously noted underreporting of this method.13, 15 We believe this difference to be associated with institutional differences, because previous reports originated from a veterans hospital and an academic medical center, and previous authors have failed to use predefined diagnostic criteria and a complete chart review to confirm cases of CDAD. Similar to our study, an academic medical center identified that listing of CDAD in a patient's medical history in their chart was associated with a false‐positive ICD‐9 code for CDAD.15 This observation appears to bring clarity to one of the causes of the variance of ICD‐9 code accuracy between institutions. Institutions seem to vary on the method of attaching diagnoses to the patient's final hospital record. Some institutions include only what is listed as an active problem, whereas others list diagnoses listed in the chart as previous problems and those listed as a potential diagnosis without confirmation. Another potential cause of the ICD‐9 inaccuracy is the potential of clinicians to diagnose and treat a patient for CDAD in the absence of the diagnostic criteria used for chart review. Physician practices such as these are known to vary between institutions leading to a variance in the ICD‐9 code accuracy.
In total, 15 cases of CDAD were identified in the absence of a positive toxin assay, and of these, 12 cases were identified using leukocytosis‐based criteria (Table 4). This resulted in 3.1% of our cases being toxin‐negative, based on leukocytosis criteria, and is lower than the previously identified 35% of cases.14 Because it was the only assay available at the time, this previous research used a toxin Aonly assay, which is more likely to have false‐negative results than the toxin A/B assay used at our institution during the study period. The investigators also required all toxin‐negative patients to have been recently treated with antibiotics. Based on the increasing rates of community‐acquired CDAD, including those that are antibiotic‐nave patients, we felt a history of antibiotic exposure was no longer a prerequisite for CDAD and thus excluded it from our diagnostic criteria.16, 17 Based on these differences, we feel our results are likely an accurate reflection of the number of cases identified by ICD‐9 query in the absence of toxin positivity. However, concerns should be further alleviated through the realization that nonuse of this strategy improves the accuracy of the toxin assay method, while reducing the accuracy of the ICD‐9 method and thereby strengthening the validity of our conclusions. Mathematically, this would result in 369 of 369 patients identified by toxin assay and 369 patients identified by the ICD‐9 method. This would reduce the case rate of the chart review method to the same 15.7 of the toxin assay, while the ICD‐9 method would remain at 19.0.
| Criterion | No. of Cases* |
|---|---|
| |
| Endoscopy | 0 |
| Surgical pathology | 3 |
| WBC >25.0 and diarrhea | 10 |
| WBC >25.0 and fever without other source | 1 |
| WBC >25.0 and unexplained abdominal pain | 3 |
| WBC >25.0 and colonic ileus | 1 |
We considered whether the toxin assay method may overestimate the number of cases due to a C. difficileasymptomatic carrier rate as high as 50% of hospitalized patients.6 However, we found no difference in the case rate when compared with that of chart review, and there were no false‐positive cases. We believe this is attributable to the 30‐day window that was used to identify a single episode of CDAD and the absence of toxin assays being performed on asymptomatic individuals. To avoid overrepresentation of the actual number of CDAD cases, we chose to label all repeat positive toxins and repeat hospitalizations within 30 days as a single episode of CDAD. This was based on the identification that 56% of patients remained toxin‐positive 26 weeks after adequate treatment for CDAD.18 The enzyme‐linked immunosorbent assay (ELISA) method used by our laboratory is the method used to report 94% of CDAD cases in a national point prevalence study that collected data from United States acute care hospitals with representation from 47 states1, 6, 19 (Table 5). This use of ELISA in the majority of United States hospitals suggests that our data can be extrapolated for use throughout the United States. While laboratories are increasing their use of 2‐step algorithms involving glutamate dehydrogenase antigen assay followed by cytotoxin neutralization, and more recently beginning the use of polymerase chain reaction assays, both of these methods have been found to increase the accuracy of detecting C. difficile compared with ELISA.20 Therefore, as laboratories evolve to use more accurate assays to detect CDAD, the methods described herein will be expected to increase in reliability.
| Method | Sensitivity | Specificity | Cost | Ease of Performance | Typical Results Reporting | Notes |
|---|---|---|---|---|---|---|
| ||||||
| Culture | Gold standard | NA | $$$$ | Difficult | Days | Slow turnaround time; is the standard upon which other test methods are based, but not all organisms are toxin‐producing |
| Cell cytotoxicity assay | 67%100% | Gold standard | $$$ | Intermediate | Next day | Is the standard upon which other test methods are based to identify toxin‐producing stains of Clostridium difficile |
| EIA for toxin A/B | 63%94% | 75%100% | $ | Easy | Same day | Used by >90% of laboratories in the United States |
| EIA for detection of Clostridium difficile common antigen (GDH) | 85%95% | 89%99% | $ | Easy | Same day | Provides no information regarding the toxigenicity of the isolate, typically used in combination with cell cytotoxicity assay to identify toxin‐producing strains |
| Polymerase chain reaction | 96%100% | 88%91% | $$ | Intermediate | Same day | More data are needed before recommendation for routine testing |
The toxin assay methodology used to determine the rate of CDAD cases acquired while the patient was at our hospital overreported these cases. Based on this result, identification of individual cases of CDAD that are obtained at a specific hospital would continue to require manual chart review. This expensive method may be avoided by instead choosing to use institutional case rates for reporting, monitoring, and incentivizing hospitals. However, a discussion of the methods of this approach and its confluence with our societal goal to move toward Accountable Care Organizations is beyond the scope of this discussion section.
Although it appears that we identified all cases of CDAD occurring at our institution, a limitation of this study is its inability to review all charts during the 10‐month study period. We used a combination of ICD‐9 and positive C. difficile toxin assay data to identify all possible cases of C. difficile. The current approach to case identification for reported hospital conditions is limited to an ICD‐9 database query. This query is followed by chart review to collect data for hospital performance that is published in locations such as
Increased automation is expected in the future of reporting. The Centers for Disease Control and Prevention found increased rates of disease reporting and increased accuracy when reporting is electronically automated via their software system, Electronic Support for Public Health, which is designed to communicate with and perform automated data queries on providers' electronic medical records.21 While use of this model is creeping into the health system for reporting to public health authorities,22 universal hospital electronic medical record implementation and full connectivity with such reporting systems is many years from fruition. In addition to its practical use for reporting CDAD in our current health system, our work easily transitions into automated reporting within an electronically integrated health system once achieved.
In conclusion, ICD‐9 data were found to be unreliable, and consideration must be given to cessation of their use for CDAD case rate research and reporting. Use of a positive C. difficile toxin assay accurately reports the institutional incidence of disease, can be used by individual institutions to self‐monitor case rates or by the government to determine regionally acceptable intuitional rates of CDAD on which incentives and penalties can be based, and will increase in efficiency as reporting continues to be automated. This process can be instituted at a fraction of the cost of the standard chart review that is currently used for most reporting.
- ,,,.National point prevalence of Clostridium difficile in US health care facility inpatients, 2008.Am J Infect Control.2009;37:263–270.
- ,,.Secular trends in hospital‐acquired Clostridium difficile disease in the United States, 1987–2001.J Infect Dis.2004;189:1585–1589.
- ,,, et al.Analysis of 30‐day mortality for Clostridium difficile‐associated disease in the ICU setting.Chest.2007;132:418–424.
- .Final report and recommendations from the National Notifiable Diseases Working Group.Can Commun Dis Rep.2006;32:211–225.
- ,,, et al.Recommendations for surveillance of Clostridium difficile‐associated disease.Infect Control Hosp Epidemiol.2007;28:140–145.
- ,,, et al.Clinical practice guidelines for Clostridium difficile infection in adults: 2010 update by the society for healthcare epidemiology of America (SHEA) and the infectious diseases society of America (IDSA).Infect Control Hosp Epidemiol.2010;31:431–455.
- ,.Review of current literature on the economic burden of Clostridium difficile infection.Infect Control Hosp Epidemiol.2009;30:57–66.
- Centers for Medicare 35:544–550.
- ,,, et al.Health spending projections through 2018: recession effects add uncertainty to the outlook.Health Aff (Millwood).2009;28:w346–w357.
- ,,,.ICD‐9 codes and surveillance for Clostridium difficile‐associated disease.Emerg Infect Dis.2006;12:1576–1579.
- ,,,.Fluoroquinolone use and risk factors for Clostridium difficile‐associated disease within a Veterans Administration health care system.Clin Infect Dis.2007;45:1141–1151.
- ,,.Conditions associated with leukocytosis in a tertiary care hospital, with particular attention to the role of infection caused by clostridium difficile.Clin Infect Dis.2002;34:1585–1592.
- ,,,.Accuracy of ICD‐9 coding for Clostridium difficile infections: a retrospective cohort.Epidemiol Infect.2007;135:1010–1013.
- ,,,.Implications of the changing face of Clostridium difficile disease for health care practitioners.Am J Infect Control.2007;35:237–253.
- .Clostridium difficile is no longer just a nosocomial infection or an infection of adults.Int J Antimicrob Agents.2009;33(suppl 1):S42–S45.
- ,,,,.Treatment of antibiotic‐associated Clostridium difficile colitis with oral vancomycin: comparison of two dosage regimens.Am J Med.1989;86:15–19.
- ,,, et al.Comparison of real‐time PCR techniques to cytotoxigenic culture methods for diagnosing Clostridium difficile infection.J Clin Microbiol.2011;49:227–231.
- ,,,.Comparison of BD GeneOhm Cdiff real‐time PCR assay with a two‐step algorithm and a toxin A/B enzyme‐linked immunosorbent assay for diagnosis of toxigenic Clostridium difficile infection.J Clin Microbiol.2010;48:109–114.
- Centers for Disease Control and Prevention.Automated detection and reporting of notifiable diseases using electronic medical records versus passive surveillance—Massachusetts, June 2006‐July 2007.MMWR Morb Mortal Wkly Rep.2008;57:373–376.
- ,,, et al.Development of an electronic public health case report using HL7 v2.5 to meet public health needs.J Am Med Inform Assoc.2010;17:34–41.
With an increased incidence of 13.1 per 1000 inpatients1, 2 and an attributable mortality of 6.1%,3 in 2006 the Canadian government added Clostridium difficileassociated disease (CDAD) to its list of reportable diseases.4 The Centers for Disease Control and Prevention and the Infectious Disease Society of America subsequently created definitions of the disease and recommended surveillance of rates of health care facilityassociated CDAD, which has been found to double a patient's length of stay and cost of hospitalization.57 While not included in the current list of hospital‐acquired conditions for which payment is declined,8 the Centers for Medicare & Medicaid Services (CMS) has noted CDAD as under consideration for addition to the list,9 which would require hospital reporting of CDAD rates. This reporting is typically a labor‐intensive, medical record review process that increases the cost of delivering health care. Health care institutions have reported spending as much as $21 million per year or $400 per discharged patient on quality improvement.10 These costs are passed on to payers such as those governed by the CMS that are projected to pay for more than half of all national health spending in 2018.11 Therefore, it is prudent to examine alternatives for determining rates of disease for public reporting and quality improvement initiatives such as infection control and antibiotic stewardship programs.
There are 3 methods that can be used for this reporting. First, medical record review has been used for determining the case rate of CDAD by published reports.1, 2 This procedure allows the CMS to define the desired data to be collected, but it is labor‐intensive. Second, the use of International Statistical Classification of Diseases and Related Health Problems, 9th Edition (ICD‐9) codes from hospital databases offers the speed of database query. However, due to diagnostic and coding errors, it may report inaccurate rates of disease. Previous reports include a university‐based hospital that found a sensitivity of 78% and specificity of 99.7%,12 whereas a Veterans Administration medical center found nearly two‐thirds of patients with CDAD did not have the ICD‐9 code for C. difficile infection noted in their database.13 Therefore, the accuracy of ICD‐9 code at a community hospital that better represents the majority of United States hospitals is needed. The third method of identifying CDAD is the presence of toxin identified in the microbiology laboratory. Although this method offers ease of obtainment, it suffers from potential inaccuracy arising from duplicate patient samples, positive samples in patients who are symptom‐free carriers, and patients with CDAD despite having a negative toxin.
The same organizations that recommend surveillance for CDAD have identified that there are inadequate data on which to base a decision regarding how to proceed with routine community and hospital surveillance.6 In the setting of public reporting and nonpayment, the method of identifying CDAD cases must be accurate to ensure fairness, while being inexpensive. To identify the potential value of these less labor‐intensive methods of reporting the incidence of CDAD, we evaluated the use of ICD‐9 codes and C. difficile toxin to accurately report the incidence of CDAD at a community hospital, as well as the labor hours required for each reporting method.
METHODS
Patients >18 years of age and potentially having CDAD were identified via database queries for ICD‐9 codes and positive C. difficile toxin assays at our institution from November 1, 2006, through August 31, 2007. Our institution is a 379‐bed university‐affiliated community teaching hospital in a socio‐economically diverse area of Baltimorewith approximately 110,000 emergency department visits, 30,000 discharges, and 110,000 inpatient days each yearthat uses a handwritten paper chart for all provider orders and patient documentation. The C. difficile toxin assay method used during the study period was an enzyme immunoassay that detects both toxins A and B (Meridan Bioscience, Cincinnati, OH). ICD‐9 codes were queried in the CareScience database(Premier, Inc; Charlotte, NC), while C. difficile toxin was queried via the hospital laboratory database. All identified patients underwent a medical record review to confirm the diagnosis of CDAD and the patient's location at the time of disease acquisition. To eliminate duplicate reporting of a single episode of disease, all duplicate patient visits with a diagnosis of CDAD within 30 days were removed.
Our diagnostic criteria (Table 1) used the recommended criteria of a combination of symptoms and positive toxin assay, visualization of pseudomembranes on colonoscopy or pathology‐proven CDAD.6 Based on the presence of CDAD in 25% of patients with a white blood cell count >30,000 and the recommendation that CDAD be considered in all patients with a white blood cell count >15,000, we included the criterion of clinical findings with severe leukocytosis to identify patients with toxin‐negative CDAD.14
| Chart Review Criteria for CDAD | Chart Review Criteria for CDAD Obtained While Patient Was Not at Our Hospital | Chart Review Criteria for CDAD Obtained While Patient Was at Our Hospital |
|---|---|---|
| ||
| Pseudomembranous colitis seen during endoscopy OR biopsy or resection with surgical pathology consistent with CDAD | One of the above symptoms or objective criteria positive within the first 3 days of hospitalization AND patient was not cared for at our insitution within the last 7 days | Patient was cared for at our institution within 7 days of presentation OR the patient's symptoms were not present upon arrival at the hospital and the symptoms began after the third day of hospitalization |
| If neither of the above are present, then Clostridium difficile toxin or WBC count >25,000 plus one of the following: | ||
| Diarrhea | ||
| Fever without other cause | ||
| Abdominal pain without other cause | ||
| Colonic ileus without other cause | ||
Patients were identified by querying the CareScience database for patients having an ICD‐9 code of 008.45. Duplicate cases for the same patient within 30 days were removed. These cases were compared with the cases of CDAD determined by the medical record review for analysis. Patients were identified via positive C. difficile toxin by querying the microbiology laboratory database. A query of all patients with a positive C. difficile toxin was performed. Duplicate samples for the same patient within 30 days were removed. Patients are considered to be outside the hospital when CDAD was acquired if their toxin was positive within the first 3 days of arrival to the hospital, and they were not hospitalized at our institution within 1 week before arrival. All other cases were considered to be acquired while in our hospital. The number of patients with a toxin‐positive stool sample was compared with the medical record review.
Recognizing that it is unrealistic to review the medical records of the 23,495 discharges during the 10‐month study period, a random sample review of 500 charts not included in our CDAD‐identified patient list was performed to identify the rate at which CDAD patients failed to be identified by our methods. From a list of discharges during the study period, as long as they were not in our study population, every thirtieth patient was selected for review up to a total of 500 patient charts. Then, the identified case rate was used to predict the prevalence of disease at our institution during the study period.
Sample selection was based on the absence of previous studies evaluating the performance of C. difficile toxin assay, and the desire to have the same assay used during the entire study. The lack of data from which to perform sample size determination would result in an inaccurate estimate. Therefore, we chose a period that offered the maximum sample size, during which a single assay was used at our institution. Compared with medical record review, the accuracy and positive predictive values of the ICD‐9 code and positive stool toxin methods to identify the cases of CDAD were compared. A true positive was when the ICD‐9 or laboratory query method identified a patient who had CDAD based on chart review; a false positive was when the ICD‐9 or laboratory query method identified a patient who did not have CDAD based on chart review. Rates of over‐ or underdiagnosis, case rates, and acquisition location were determined. Statistical analysis of the case rates and acquisition location were performed via chi‐square test. The time to perform these queries was collected with accuracy to the minute.
RESULTS
Of the 23,495 discharges during the study period, the combination of ICD‐9 and C. difficile toxin assay identified a total cohort of 496 patients, 319 of whom were identified by both the ICD‐9 method and the toxin assay, 50 of whom were identified only by the toxin assay, and 127 of whom were identified only by the ICD‐9 method. Chart review confirmed the presence of CDAD in 384 of these 496 cases, for a case rate of 16.3 per 1000 discharged patients (Table 2). The diagnostic criteria for each of these confirmed cases are listed in Table 3. Of the 384 confirmed CDAD cases, 319 were identified by both the ICD‐9 and toxin assay, 50 were identified only by the toxin assay, and 15 were identified only by the ICD‐9 query. Of the 50 cases identified by the toxin assay that were not identified via the ICD‐9 method, all 50 (100%) were confirmed to have CDAD by chart review. In contrast, of the 127 cases identified via the ICD‐9 method that were not found via the toxin assay, only 15 (11.8%) were confirmed to have CDAD by chart review (Figure 1).
| ICD‐9 | Toxin Assay | Chart Review | |
|---|---|---|---|
| |||
| No. of patients identified | 446 | 369 | 384 |
| Case rate per 1000 discharges* | 19.0 | 15.7 | 16.3 |
| 95% confidence interval | 17.320.8 | 14.117.4 | NA |
| Case rate compared with chart review, P | P = 0.001 | P = 0.440 | NA |
| CDAD rate reported compared with chart review | 116.1% | 96.1% | NA |
| Accuracy | 83.9% | 96.1% | NA |
| PPV | 74.9% | 100% | NA |
| Portion of cases acquired at our hospital, % | NA | 48.2% | 40.6% |
| Portion of cases acquired at our hospital, P | NA | P = 0.003 | NA |
| Minutes consumed for data collection | 312 | 842 | 21,899 |
| Estimated annual cost per hospital | $234.00 | $631.50 | $16,424.25 |
| Criterion | No. of Cases | Case Rate* |
|---|---|---|
| ||
| Endoscopy | 2 | 0.5% |
| Surgical pathology | 9 | 2.3% |
| Positive toxin and diarrhea | 369 | 96.1% |
| WBC >25.0 and diarrhea | 51 | 13.3% |
| WBC >25.0 and fever without other source | 9 | 2.3% |
| WBC >25.0 and unexplained abdominal pain | 17 | 4.4% |
| WBC >25.0 and colonic ileus | 2 | 0.5% |
Of these 384 cases, 369 were identified via the toxin assay for a case rate of 15.7 per 1000 patient discharges, which was not found to be different from the rate of 16.3 determined by chart review (P = 0.440; 95% confidence interval [CI], 14.117.4). Compared with chart review, the toxin assay reported 96.1% (369/384) of cases. Chart review demonstrated that every patient who had a positive toxin assay met the diagnostic criteria for CDAD for a positive predictive value (PPV) of 100%.
The ICD‐9 method identified 446 patients thought to have CDAD, 334 of whom were confirmed by chart review for a PPV of 74.9% (334/446). Compared with chart review, the ICD‐9 method reported 116.1% (446/384) of cases for a case rate of 19.0 per 1000 discharges and was significantly different than the rate of 16.3 reported by chart review (P = 0.001; 95% CI, 17.320.8).
Chart review identified 156 of 384 (40.6%) patients who acquired CDAD while at our hospital and 228 of 384 (59.4%) who acquired it elsewhere. In comparison, the toxin assay criteria identified 369 cases of CDAD, of which 48.2% (178/369) were acquired while at our hospital and 51.8% (191/369) were acquired elsewhere (P = 0.003).
The time for data extraction via these 3 methods differed greatly. The ICD‐9 method only consumed 312 minutes and the toxin assay method 842 minutes, whereas the chart review method consumed 21,899 minutes. These times reported include the database query and data analysis for the ICD‐9 and toxin assay methods, while it includes the database query and list generation along with the manual chart review and data analysis for the chart review method. The review of the random sample of patients believed not to have CDAD was not included in any of the reported times. Chart review on a random sample of 500 patients not previously identified for review found no additional cases of CDAD.
DISCUSSION
Our study demonstrates that use of positive C. difficile toxin assay data from the microbiology laboratory alone is an efficient method of identifying patients with CDAD. This method only consumed 842 minutes versus 21,899 minutes consumed by the chart review method. The C. difficile toxin method reduces the workforce required to collect and analyze this data, but more importantly, it was found to be reliable by reporting an institutional case rate that is similar to that of chart review.
In contrast, the ICD‐9 method was efficient but less reliable. It only consumed 312 minutes, but it overreported the institutional rate of CDAD by 16.1%, had a PPV of only 74.9%, and of those patients who were identified by ICD‐9 but not toxin assay, only 11.8% actually had CDAD. This finding is in conflict with the previously noted underreporting of this method.13, 15 We believe this difference to be associated with institutional differences, because previous reports originated from a veterans hospital and an academic medical center, and previous authors have failed to use predefined diagnostic criteria and a complete chart review to confirm cases of CDAD. Similar to our study, an academic medical center identified that listing of CDAD in a patient's medical history in their chart was associated with a false‐positive ICD‐9 code for CDAD.15 This observation appears to bring clarity to one of the causes of the variance of ICD‐9 code accuracy between institutions. Institutions seem to vary on the method of attaching diagnoses to the patient's final hospital record. Some institutions include only what is listed as an active problem, whereas others list diagnoses listed in the chart as previous problems and those listed as a potential diagnosis without confirmation. Another potential cause of the ICD‐9 inaccuracy is the potential of clinicians to diagnose and treat a patient for CDAD in the absence of the diagnostic criteria used for chart review. Physician practices such as these are known to vary between institutions leading to a variance in the ICD‐9 code accuracy.
In total, 15 cases of CDAD were identified in the absence of a positive toxin assay, and of these, 12 cases were identified using leukocytosis‐based criteria (Table 4). This resulted in 3.1% of our cases being toxin‐negative, based on leukocytosis criteria, and is lower than the previously identified 35% of cases.14 Because it was the only assay available at the time, this previous research used a toxin Aonly assay, which is more likely to have false‐negative results than the toxin A/B assay used at our institution during the study period. The investigators also required all toxin‐negative patients to have been recently treated with antibiotics. Based on the increasing rates of community‐acquired CDAD, including those that are antibiotic‐nave patients, we felt a history of antibiotic exposure was no longer a prerequisite for CDAD and thus excluded it from our diagnostic criteria.16, 17 Based on these differences, we feel our results are likely an accurate reflection of the number of cases identified by ICD‐9 query in the absence of toxin positivity. However, concerns should be further alleviated through the realization that nonuse of this strategy improves the accuracy of the toxin assay method, while reducing the accuracy of the ICD‐9 method and thereby strengthening the validity of our conclusions. Mathematically, this would result in 369 of 369 patients identified by toxin assay and 369 patients identified by the ICD‐9 method. This would reduce the case rate of the chart review method to the same 15.7 of the toxin assay, while the ICD‐9 method would remain at 19.0.
| Criterion | No. of Cases* |
|---|---|
| |
| Endoscopy | 0 |
| Surgical pathology | 3 |
| WBC >25.0 and diarrhea | 10 |
| WBC >25.0 and fever without other source | 1 |
| WBC >25.0 and unexplained abdominal pain | 3 |
| WBC >25.0 and colonic ileus | 1 |
We considered whether the toxin assay method may overestimate the number of cases due to a C. difficileasymptomatic carrier rate as high as 50% of hospitalized patients.6 However, we found no difference in the case rate when compared with that of chart review, and there were no false‐positive cases. We believe this is attributable to the 30‐day window that was used to identify a single episode of CDAD and the absence of toxin assays being performed on asymptomatic individuals. To avoid overrepresentation of the actual number of CDAD cases, we chose to label all repeat positive toxins and repeat hospitalizations within 30 days as a single episode of CDAD. This was based on the identification that 56% of patients remained toxin‐positive 26 weeks after adequate treatment for CDAD.18 The enzyme‐linked immunosorbent assay (ELISA) method used by our laboratory is the method used to report 94% of CDAD cases in a national point prevalence study that collected data from United States acute care hospitals with representation from 47 states1, 6, 19 (Table 5). This use of ELISA in the majority of United States hospitals suggests that our data can be extrapolated for use throughout the United States. While laboratories are increasing their use of 2‐step algorithms involving glutamate dehydrogenase antigen assay followed by cytotoxin neutralization, and more recently beginning the use of polymerase chain reaction assays, both of these methods have been found to increase the accuracy of detecting C. difficile compared with ELISA.20 Therefore, as laboratories evolve to use more accurate assays to detect CDAD, the methods described herein will be expected to increase in reliability.
| Method | Sensitivity | Specificity | Cost | Ease of Performance | Typical Results Reporting | Notes |
|---|---|---|---|---|---|---|
| ||||||
| Culture | Gold standard | NA | $$$$ | Difficult | Days | Slow turnaround time; is the standard upon which other test methods are based, but not all organisms are toxin‐producing |
| Cell cytotoxicity assay | 67%100% | Gold standard | $$$ | Intermediate | Next day | Is the standard upon which other test methods are based to identify toxin‐producing stains of Clostridium difficile |
| EIA for toxin A/B | 63%94% | 75%100% | $ | Easy | Same day | Used by >90% of laboratories in the United States |
| EIA for detection of Clostridium difficile common antigen (GDH) | 85%95% | 89%99% | $ | Easy | Same day | Provides no information regarding the toxigenicity of the isolate, typically used in combination with cell cytotoxicity assay to identify toxin‐producing strains |
| Polymerase chain reaction | 96%100% | 88%91% | $$ | Intermediate | Same day | More data are needed before recommendation for routine testing |
The toxin assay methodology used to determine the rate of CDAD cases acquired while the patient was at our hospital overreported these cases. Based on this result, identification of individual cases of CDAD that are obtained at a specific hospital would continue to require manual chart review. This expensive method may be avoided by instead choosing to use institutional case rates for reporting, monitoring, and incentivizing hospitals. However, a discussion of the methods of this approach and its confluence with our societal goal to move toward Accountable Care Organizations is beyond the scope of this discussion section.
Although it appears that we identified all cases of CDAD occurring at our institution, a limitation of this study is its inability to review all charts during the 10‐month study period. We used a combination of ICD‐9 and positive C. difficile toxin assay data to identify all possible cases of C. difficile. The current approach to case identification for reported hospital conditions is limited to an ICD‐9 database query. This query is followed by chart review to collect data for hospital performance that is published in locations such as
Increased automation is expected in the future of reporting. The Centers for Disease Control and Prevention found increased rates of disease reporting and increased accuracy when reporting is electronically automated via their software system, Electronic Support for Public Health, which is designed to communicate with and perform automated data queries on providers' electronic medical records.21 While use of this model is creeping into the health system for reporting to public health authorities,22 universal hospital electronic medical record implementation and full connectivity with such reporting systems is many years from fruition. In addition to its practical use for reporting CDAD in our current health system, our work easily transitions into automated reporting within an electronically integrated health system once achieved.
In conclusion, ICD‐9 data were found to be unreliable, and consideration must be given to cessation of their use for CDAD case rate research and reporting. Use of a positive C. difficile toxin assay accurately reports the institutional incidence of disease, can be used by individual institutions to self‐monitor case rates or by the government to determine regionally acceptable intuitional rates of CDAD on which incentives and penalties can be based, and will increase in efficiency as reporting continues to be automated. This process can be instituted at a fraction of the cost of the standard chart review that is currently used for most reporting.
- ,,,.National point prevalence of Clostridium difficile in US health care facility inpatients, 2008.Am J Infect Control.2009;37:263–270.
- ,,.Secular trends in hospital‐acquired Clostridium difficile disease in the United States, 1987–2001.J Infect Dis.2004;189:1585–1589.
- ,,, et al.Analysis of 30‐day mortality for Clostridium difficile‐associated disease in the ICU setting.Chest.2007;132:418–424.
- .Final report and recommendations from the National Notifiable Diseases Working Group.Can Commun Dis Rep.2006;32:211–225.
- ,,, et al.Recommendations for surveillance of Clostridium difficile‐associated disease.Infect Control Hosp Epidemiol.2007;28:140–145.
- ,,, et al.Clinical practice guidelines for Clostridium difficile infection in adults: 2010 update by the society for healthcare epidemiology of America (SHEA) and the infectious diseases society of America (IDSA).Infect Control Hosp Epidemiol.2010;31:431–455.
- ,.Review of current literature on the economic burden of Clostridium difficile infection.Infect Control Hosp Epidemiol.2009;30:57–66.
- Centers for Medicare 35:544–550.
- ,,, et al.Health spending projections through 2018: recession effects add uncertainty to the outlook.Health Aff (Millwood).2009;28:w346–w357.
- ,,,.ICD‐9 codes and surveillance for Clostridium difficile‐associated disease.Emerg Infect Dis.2006;12:1576–1579.
- ,,,.Fluoroquinolone use and risk factors for Clostridium difficile‐associated disease within a Veterans Administration health care system.Clin Infect Dis.2007;45:1141–1151.
- ,,.Conditions associated with leukocytosis in a tertiary care hospital, with particular attention to the role of infection caused by clostridium difficile.Clin Infect Dis.2002;34:1585–1592.
- ,,,.Accuracy of ICD‐9 coding for Clostridium difficile infections: a retrospective cohort.Epidemiol Infect.2007;135:1010–1013.
- ,,,.Implications of the changing face of Clostridium difficile disease for health care practitioners.Am J Infect Control.2007;35:237–253.
- .Clostridium difficile is no longer just a nosocomial infection or an infection of adults.Int J Antimicrob Agents.2009;33(suppl 1):S42–S45.
- ,,,,.Treatment of antibiotic‐associated Clostridium difficile colitis with oral vancomycin: comparison of two dosage regimens.Am J Med.1989;86:15–19.
- ,,, et al.Comparison of real‐time PCR techniques to cytotoxigenic culture methods for diagnosing Clostridium difficile infection.J Clin Microbiol.2011;49:227–231.
- ,,,.Comparison of BD GeneOhm Cdiff real‐time PCR assay with a two‐step algorithm and a toxin A/B enzyme‐linked immunosorbent assay for diagnosis of toxigenic Clostridium difficile infection.J Clin Microbiol.2010;48:109–114.
- Centers for Disease Control and Prevention.Automated detection and reporting of notifiable diseases using electronic medical records versus passive surveillance—Massachusetts, June 2006‐July 2007.MMWR Morb Mortal Wkly Rep.2008;57:373–376.
- ,,, et al.Development of an electronic public health case report using HL7 v2.5 to meet public health needs.J Am Med Inform Assoc.2010;17:34–41.
Copyright © 2011 Society of Hospital Medicine

Bed Utilization in the PICU
Patient flow refers to the management and movement of patients in health care settings and is linked to quality, safety, and cost.16 The intensive care unit (ICU) is crucial in patient flow.7, 8 The limited number of beds and the resource‐intensive services and staffing associated with them require that hospitals optimize their utilization, as is increasingly true of all hospital resources. To maximize delivery of services to patients who need them and minimize real and opportunity losses (eg, postponed surgery, diverted transports, or inability to accept patients), patients in ICU beds should receive critical care medicine/nursing services while there and be transferred or discharged when appropriate.
The time between arrival and departure from any area of the hospital, including the ICU, is considered the time when a patient is receiving needed clinical carethe value‐added portion of health care operationsand time waiting to move on to the next step.911 This period includes both necessary logistics (eg, signing out a patient or waiting a reasonable amount of time for room cleaning) and nonvalue‐added time (eg, an excessively long amount of time for room cleaning). Operations management labels nonvalue‐added time as waste, and its reduction is vital for high‐quality health care.9, 12, 13 As in other industries, one important way to understand value versus waste is through direct observation.11, 14 Although operating rooms have been the subject of several published process improvement projects to improve efficiency,1518 inpatient beds have not been the subject of such scrutiny. The objectives of this study were to generate a direct observation method and use it to describe pediatric ICU (PICU) bed utilization from a value‐added perspective.
METHODS
An interdisciplinary work group of physicians, nurses, quality improvement specialists, and 1 operations management expert developed an Excel spreadsheet to categorize hour‐by‐hour status of PICU beds. The clinicians generated a list of 27 activities. A critical care nurse trained in quality improvement piloted the list for 3 separate 4‐hour blocks over 2 weeks adding 18 activities; 2 additional activities were added during the 5 weeks of observation (Table 1). (The recording tool is provided in the Supporting Information Appendix.) Three observers with knowledge of medical terminology (2 third‐year medical students and 1 premedical student with years of experience as an emergency medical technician) were trained over 12 hours to conduct the observations. Prior to the observations, the 3 observers also spent time in the PICU, and terminology used for recordings was reviewed. Interobserver reliability was checked during 3 sets of observation circuits by all 3 observers and the principal investigator, as well as by spot checks during the study.
| Activity Description | Activity Code | Total Hours Over 5 Weeks | % Total Hours Over 5 Weeks* | Mean Hours per Week* |
|---|---|---|---|---|
| ||||
| Ventilated patient | Vent | 8996 | 45 | 1799 |
| CCSs not otherwise specified | NOS | 2982 | 15 | 596 |
| Neurosurgery patient with ICU needs | NeurosurgICU | 1534 | 8 | 307 |
| Room empty and unassigned | Empty‐unassigned | 1511 | 8 | 302 |
| Patient on continuous infusion | ContinInfus | 958 | 5 | 192 |
| Awaiting floor bed assignment | Floorbedassign | 919 | 5 | 184 |
| Patient with arterial line | ArtLine | 508 | 3 | 102 |
| Patient on high‐flow nasal cannula | HFNC | 475 | 2 | 95 |
| Room cleaning | EVS | 318 | 2 | 64 |
| Patient <12 hours after extubation | PostVent | 226 | 1 | 45 |
| Patient in OR, bed being held | OR | 210 | 1 | 42 |
| Neurosurgery patient, post‐ICU needs | NeurosurgPostICU | 164 | 0.8 | 33 |
| No clear ICU need, but no other accepting floor or service | Unclear | 163 | 0.8 | 33 |
| Patient at procedure, bed being held | Proced | 133 | 0.7 | 27 |
| Patient awaiting a rehabilitation bed | Rehab | 99 | 0.5 | 20 |
| Patient with ventriculostomy | Ventriculostomy | 82 | 0.4 | 16 |
| Patient eligible to be in NICU | NICU | 76 | 0.4 | 15 |
| Patient awaiting social work, case management, prescriptions before discharge | AwaitingOtherServ | 66 | 0.3 | 13 |
| Empty bed, assigned to ED patient | Empty‐ED | 40 | 0.2 | 8 |
| Empty bed, assigned to incoming transport patient | Empty‐Transport | 37 | 0.2 | 7 |
| Patient awaiting transport to another facility | Transport | 37 | 0.2 | 7 |
| Patient awaiting consult to determine transfer | Consult | 33 | 0.2 | 7 |
| Patient awaiting physician or NP sign‐out to floor before transfer | CallMDNP | 30 | 0.2 | 6 |
| PICU room needs a bed for next patient | Bed | 26 | 0.1 | 5 |
| Patient eligible to be in CCU | CCU | 24 | 0.1 | 5 |
| Patient eligible to be in CICU | CICU | 24 | 0.1 | 5 |
| Patient awaiting laboratory result to determine transfer or discharge | LabResult | 21 | 0.1 | 4 |
| Patient awaiting a ride home | Ride | 21 | 0.1 | 4 |
| Empty bed, assigned to floor patient | Empty‐floor | 19 | 0.1 | 4 |
| Patient awaiting nursing report to floor for transfer | Callnurse | 18 | 0.1 | 4 |
| Patient eligible to be in PCU | PCU | 18 | 0.1 | 4 |
| Patient on cardiac pressor | Pressor | 16 | 0.1 | 3 |
| Patient actively coding | Code | 15 | 0.1 | 3 |
| Patient on continuous veno‐venous hemofiltration | CVVH | 15 | 0.1 | 3 |
| Nursing work needed to enable transfer out | Nursing | 11 | 0.1 | 2 |
| Patient awaiting order for transfer to floor | Order | 11 | 0.1 | 2 |
| Patient in interventional radiology, bed being held | IR | 10 | 0.1 | 2 |
| Patient deceased in PICU room | Deceased | 9 | 0.1 | 2 |
| Awaiting radiology result to clear transfer or discharge | RadResult | 9 | 0.1 | 2 |
| Patient awaiting a floor bed to be cleaned for transfer out | Floorbedclean | 7 | <0.1 | 1 |
| Other logistical need for an empty room | Logistics | 7 | <0.1 | 1 |
| Disagreement among services for disposition | Disagreement | 4 | <0.1 | 1 |
| Family request to stay in PICU | Family | 3 | <0.1 | 1 |
| Awaiting accepting attending/fellow for transfer out | Accept | 1 | <0.1 | <1 |
| PICU room needs a crib for next patient | Crib | 1 | <0.1 | <1 |
| Patient with preventable reason for being in PICU | Prev | 0 | 0 | 0 |
| PICU room needs specialty bed for next patient | SpecialBed | 0 | 0 | 0 |
| Total | 19,887 | 100 | ||
The targeted area included 24 single‐patient rooms. The activity of each bed was recorded hourly. Real‐time recording in to the Excel spreadsheet on a dedicated laptop occurred from 8:00 AM until 11:00 PM. The most visible or critical event was recorded. Although some activities were not mutually exclusive (eg, a patient could be ventilated and on a continuous infusion simultaneously), the objective was to identify when a room was being used for any critical care service, not enumerate all of them. The observers noted overnight events that occurred from 11:00 PM to 8:00 AM in the morning by reviewing the bedside record and talking to the staff to complete each day's 24‐hour recording. The observers also recorded the hospital‐wide census and the census for the other half of the PICU every 4 hours. The observations occurred over 5 noncontiguous weeks between January 2009 and April 2009.
After all observations were complete, activities were classified as critical care services (CCS) or noncritical‐care services (NCCS). NCCSs were further divided into necessary logistics (defined for analysis purposes as the first hour of any NCCS activity) or nonvalue‐added (the second or greater hour of NCCS). A time limit of 1 hour was chosen to define necessary logistics based on a consensus that nonclinical activities optimally would not take more than 1 hour each. We also analyzed results with 2 hours as the cutoff for necessary logistics. Admission, discharge, and transfer records were reviewed to check for returns to the PICU or hospital within 48 hours of transfer or discharge from the PICU.
Analyses were conducted using Microsoft Excel (Microsoft, Redmond, WA) and Stata 10.0 (StataCorp, College Station, TX). The study was approved by the Children's Hospital of Philadelphia Institutional Review Board with waiver of consent.
RESULTS
A total of 824 hours of recordings included 19,887 bed‐hours with 219 unique patients; among them, 2 remained from the first day of recording in January to the last day in April (sample recording in Figure 1). A total of 50 patients (range, 812 per week) stayed for the entirety of each 1‐week observation period. Of the 47 possible activities, 45 of them were recorded for at least 1 hour in the 5 weeks. Overall, 14 activities accounted for 95% of the observed bed‐hours and 31 activities accounted for the remaining 5%. CCS accounted for 82% of observed bed‐hours, NCCS accounted for 10.4%, and empty unassigned accounted for 8% (Figure 2). Using the 1‐hour cutoff for necessary services, 77% of NCCS time was nonvalue‐added, whereas 23% of it was necessary logistics; using the 2‐hour cutoff, 54% was nonvalue‐added, and 46% was necessary logistics.
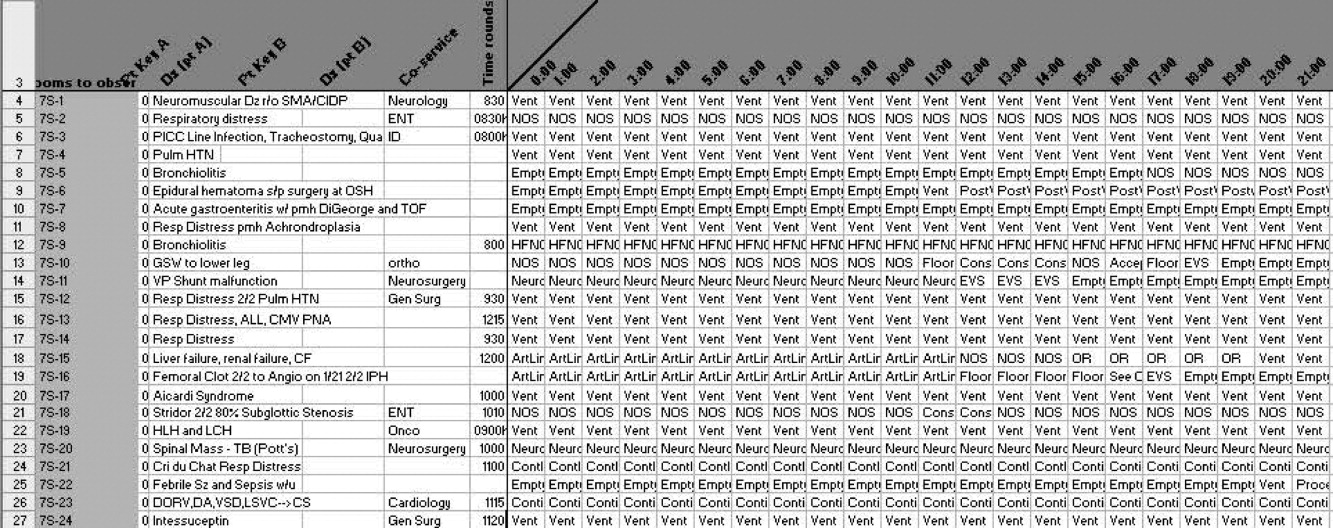
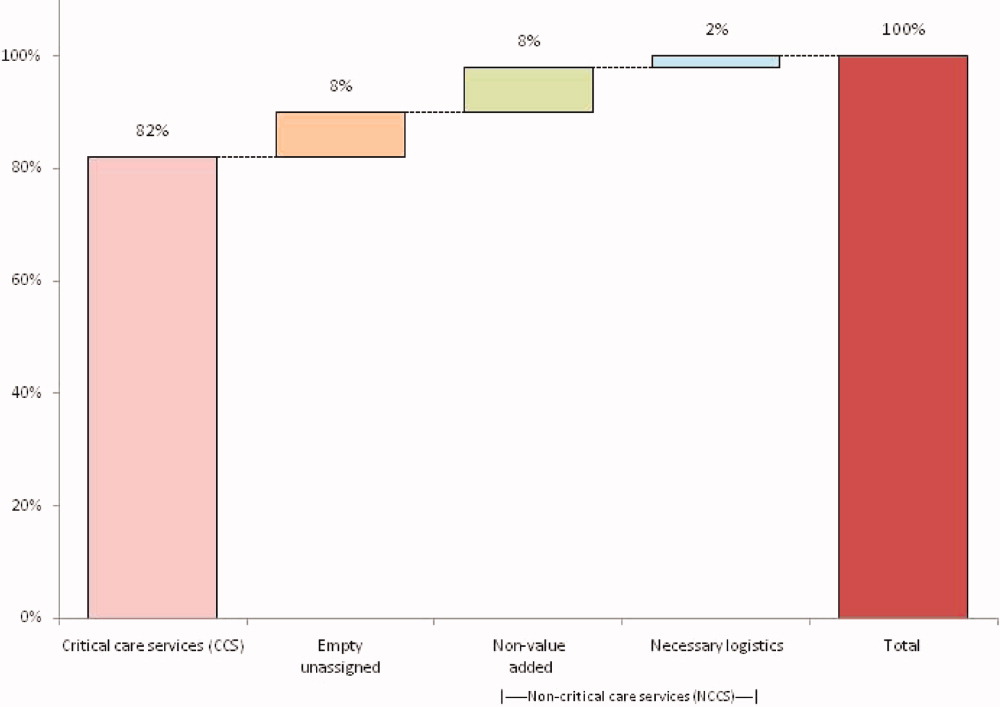
During the observation period, <1% of bed‐hours were used for CCS for overflow patients from the neonatal ICU (NICU), cardiac care unit (CCU), cardiac ICU (CICU), or progressive care unit (PCU; tracheostomy/ventilator unit). Although only 4 patients required transport to a rehabilitation facility, their wait time comprised 99 hours (<1%) of total recordings. Eight patients waited a mean of 2.6 hours for transportation home (maximum, 10 hours).
To demonstrate the cycle of room use, activities were divided into 4 categories: room preparation, critical care services, disposition pending, and postcritical care services (Figure 3). As an example of detailed data revealed by direct observation, we identified 102 instances totaling 919 hours when a patient was waiting for a bed assignment on another floor (5% of all bed‐hours). The mean wait time was 9 hours (range, 188 hours) and the median time was 5.5 hours. There were only 15 instances when floor bed assignment took 1 hour or less, and only 9 instances when it took 12 hours. Similarly, considerable time was spent on cleaning rooms between patients: only 66 of 146 instances of cleaning took 1 hour or less. The mean time for cleaning was 2.2 hours (range, 115), and the median was 2 hours. (There were 136 recorded instances of room cleaning and 10 additional episodes that were not recorded but had to be completed for the room to turnover from one patient to the next, yielding a total of 146 instances of cleaning.)
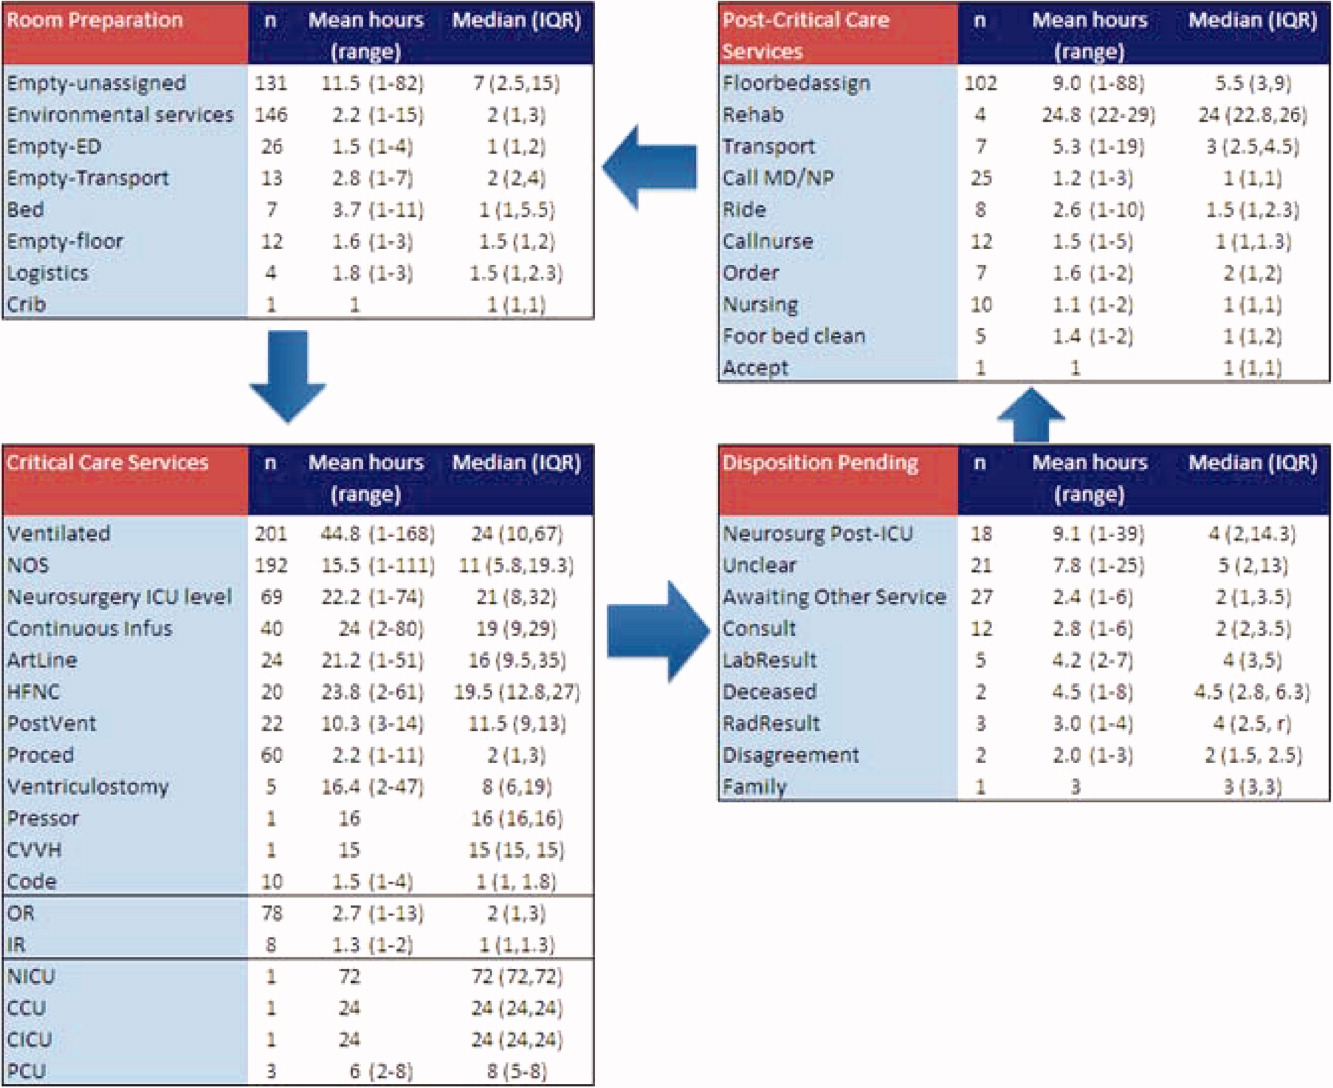
From the 824 hours of recording, we identified 200 hours (25% of time) when there were zero empty unassigned beds available in the section of the PICU being observed. Episodes of full occupancy occurred mostly on weekdays, with 23% of hours of full capacity on Thursdays, 21% on Mondays, and 21% on Wednesdays; only 8% were on Saturdays and <1% on Sundays. These 200 hours fell into 36 separate episodes of complete occupancy, each lasting 122 hours. Each patient, on average, received 3.1 hours of NCCS during each episode of full occupancy (range, 111 hours). Within these 200 hours at capacity, we identified only 15 hours (8%) when all 24 beds were used for CCS. For 72% of the time, there was at least 1 bed with NCCS, and for 37% at least 2 beds. A small portion of the time (7%), the lack of beds was affected by occupancy by patients who should have been in the NICU, CICU, CCU, or PCU.
Data collected through direct observation can be used to understand aggregated and averaged experiences, but also more specific time periods. For example, we identified 1 week with the highest consistent level of occupancy and turnover: March 915 had empty unassigned beds for only 4% of the week. Of the 168 hours in the week, 68 (40%) had full capacity. However, for 90% of the time, at least 1 bed was used for a NCCS. Other analytic options included varying the assumptions around time needed for logistics. Overall, NCCS time on necessary logistics changes from 23% to 46% using 1 hour versus 2 hours as the cutoff. For floor bed assignments, assuming that the first hour of this activity is necessary logistics and any hour thereafter is not, 817 hours were wasted. Even after assuming 2 hours of necessary logistical time (which may also include steps such as nursing and physician sign‐out to the receiving team, often not recorded in the observations), this left 715 hours of NCCS time in which patients waited to be placed elsewhere in the hospital. For room cleaning, because recordings were hourly, but room cleaning could take less time, we performed a sensitivity analysis, converting all 1‐hour recordings to half‐hour recordings to half‐hour recordings (an exaggerated shortening since industry‐standard cleaning may take longer).
Of the 219 patients directly observed, 15 were noted to be waiting for a transfer out of the PICU but experienced a change in disposition before the transfer. On average, these patients waited 8 hours for a floor bed assignment (range, 221) before reverting to a CCS, which then lasted an average of 16.5 hours (range, 149). (Included in this group are 2 patients who experienced this change in disposition twice.) In post hoc review across the 5 weeks, no patients were transferred back to the PICU within 48 hours after being transferred out. During the study period, 19 patients were discharged directly from the PICU (8 to home, 7 by transport to another facility, and 4 to rehabilitation). One patient returned to the hospital (but not the PICU) within 48 hours of being discharged home from the PICU.
During the study period, using the highest census value for recorded for each 24‐hour period and the number of beds available that day, median hospital‐wide occupancy was 93% (interquartile range, 90%96%). During the 35 days of observation, 71% of the days had occupancy >90%, 29% of days had occupancy >95%, and 3% of days had occupancy >100%.
DISCUSSION
In this direct observation of a PICU, we found high usage of beds for delivery of CCS. We identified many episodes in which the half of the PICU we observed was fully occupied (200 of 824 hours), but not necessarily delivering PICU‐level care to all patients. In fact, 75% of the full‐capacity hours had at least 1 patient receiving NCCS and 37% had at least 2. Patients waiting for a floor bed assignment represented nearly 5% of bed‐hours observed (mean 9 hours per patient). That full occupancy was not random, but rather clustered on weekdays, is consistent with other work showing that hospitals are at greater risk for midweek crowding due to the way in which scheduled admissions enter and leave.1925
Our methods provide the basis for operational analysis and improvement to patient flow, such as value stream mapping.9, 26 Process improvement work could be directed to areas of delay uncovered through this analysis and inform clinical and nonclinical management. For example, one of the key problems faced by the PICU was finding floor bed assignments for patients leaving the unit. Simply building more beds in the PICU will not solve this problemand at an estimated cost of $2 million to add a bed, it is likely not an efficient means of responding to poor flow. In these cases, the problem seems to lie downstream, and could suggest shortage of regular floor beds or inefficient bed assignment procedures within the hospital. The output also suggests that variation in nonclinical processes should be a target for improvement, such as time to clean rooms, because variation is known to be a source of nonvalue‐added time in many operations.9, 26 High occupancy on weekdays but low occupancy on weekends also emphasizes the potential for smoothing occupancy to reduce the risk of midweek crowding and to better manage bed utilization and staffing.24, 25
When seeking to reduce nonvalue‐added time, one must weigh the risks of increased efficiency against clinical outcomes. For example, if patients could be transferred out of the PICU faster, would the risk of returns to the PICU be higher? In this study, 15 patients (7%) had a change in disposition from awaiting transfer back to a CCS. The fact that transfers did not happen instantaneously may serve as a safety check to reduce rapid returns, but it is not possible for us to evaluate the reasons why patients did not actually complete the pending transfers. Specifically, we cannot determine whether the patient's clinical status objectively deteriorated, the ICU team made a judgment call to hold the patient, or the floor team refused to accept the transfer. Given this fact, although it appears in this study (and in the health care system more broadly) that there are opportunities to increase efficiency and reduce nonvalue‐added time, it is not realistic (nor advisable) that such time be reduced to zero. Along this line, one must consider separately purely nonclinical functions such as room cleaning and those that include some clinical element, such as time waiting for a patient to be transferred.
Beyond the direct findings of this study, the method should be replicable in other settings and can reveal important information about health care efficiency, capacity, and flexibility. The bottlenecks identified would have been difficult to identify through administrative record review. The exact amount of time to spend on observation may vary from place to place and would depend on the expected variation over time and the level of detail sought. In general, the more common the event and the less variation, the less time needed to observe it.
This study has several limitations that should be considered in terms of interpreting the results and in seeking to reproduce the approach. First, hourly recordings may not be discrete enough for events that took less than 1 hour. To assess the degree to which this would affect our results, we reanalyzed all NCCS by subtracting 30 minutes (0.5 hour) from all recordings, which increased total CCS from 82% to 87% and decreased NCCS by the same 5 percentage points. In a related fashion, our recordings were truncated at the start and end of each 1‐week period, so we could only observe a maximum of 168 hours for any given activity and did not record how long an activity was happening before or after the recordings started or stopped, respectively. Second, each recording could only be for 1 activity per hour. Separate from the level of granularity already noted, this also limits interpretation of critical care activities that may have been simultaneous. However, because the goal of the study was not to describe the provision of critical care services, but rather the times when they were not being delivered, this does not influence our conclusions. For movement of patients, however, we missed instances of physician and nursing calling sign‐out on patients to receiving units, as these events last less than 1 hour (and in the case of surgical patients, generally do not occur as the team provides continuous coverage). The time for such events is then included in other activities. To the extent that this may influence the results, it would increase the perceived time for nonvalue‐added services, but to a limited degree, and never by more than 59 minutes. Third, the overnight hours (11:00 PM to 8:00 AM) were not directly observed, but retrospectively recorded each morning by reviewing the records and discussing the overnight events with the clinical staff. For example, if a patient was intubated at 11:00 PM and at 8:00 AM, the observer would confirm this and record that status for the intervening hours. This is unlikely to result in a substantial impact on the findings, because the overnight hours have a relative degree of stability even for unstable patients in terms of their status of needing or not needing a CCS. Fourth, we did not evaluate the appropriateness of CCS delivered (eg, how long a patient was ventilated). Our definitions for CCS and NCSS were based on Children's Hospital of Philadelphia practices, which may not be the same as those of other facilities. The categorization of CCS was objective for activities such as ventilation or continuous infusion, but was less clear for the not otherwise specified recordings, which represented patients with a complex illness or projected organ, respiratory, cardiac, or neurological failure. These patients were not receiving a specific critical care intervention, but were deemed to need to be in the PICU as opposed to a regular floor (eg, for frequent monitoring of potential respiratory failure). It would also include patients receiving combinations of therapies more efficiently delivered in the PICU. For that, the observers relied on the judgment of clinicians (primarily nurses) to determine whether the patient needed to be in the PICU or not; if no specific reason could be provided, not otherwise specified was applied. These 192 instances accounted for 2982 aggregate bed‐hours (15% of total). It is difficult to judge the direction of bias, because overestimation of need to be in the PICU may be as likely to occur as underestimation. Fifth, the very presence of the observers may have changed behavior. Knowing that they were being observed staff may have acted with greater efficiency than otherwise. We expect that such a finding would lead to less time appearing as necessary logistics or NCCS. Finally, results may not be generalizable to other hospitals or hospital settings. There are clearly important contextual factors, not only for the location but also for the duration. For example, staffing was never an issue during the 5 weeks of observation, but there are locations where an empty bed is not necessarily usable due to lack of staffing. Nonetheless, we believe the results provide a generalizable approach and methodology for other settings (and staffing could be a reason for an empty bed).
In terms of the setting, as noted, we observed one discrete 24‐bed unit, which comprises half of the total PICU. Thus, statements that the PICU was at full capacity must be interpreted in the context that additional rooms may have been available on the other side. Patients are generally admitted alternately to each unit, so the occupancies should parallel each other. We recorded the census every 4 hours for both sides from the electronic system (Sunrise Clinical Manager [SCM]). However, this only accounts for patients physically in beds, not beds held for patients in other locations. Thus, we would expect a discrepancy between direct observation and the SCM value. Through analysis of the entire pediatric intensive care unit,* that part which observed directly, and that which we did not observe directly using census data, we think it reasonable to assert that both units of the total PICU had constrained capacity during the times we directly observed and recorded such constraint on one side.
This study demonstrates the use of direct observation for inpatient settings to learn about resource utilization and identification of value‐added services. PubMed searches for the terms efficiency, flow, process redesign, and time management bring up many more references for operating rooms than for ICUs or inpatient beds. Some examples of ICU‐directed work include videography of an ICU in Australia27 and human factor analysis in ICU nursing.5 Time‐motion studies have also been conducted on clinical staff, such as physicians.28, 29
In conclusion, we found that direct observation provided important insights into the utilization of patient rooms in an important inpatient setting. Data such as these are valuable for clinical and process improvement work, as well as understanding how best to match capacity to patient need. Finally, the methodology is reproducible for other settings and would be an additional tool to measuring and improving the efficiency and value of the health system. When appropriate, this approach can also evaluate the effectiveness of process improvement, help identify and reduce waste,13 and contribute to the growing field that merges operations management with hospital administration and clinical care: in other words, evidence‐based management.30
Acknowledgements
The authors thank Paula Agosto, Patricia Hubbs, Heidi Martin, and Annette Bollig for contributions to the study design.
In comparing direct observation to the SCM count, we found perfect concordance for 110 hours (55%) during which 0 beds were available. For the other 90 hours, SCM reported 1 bed being available in 46 hours (23%), 2 beds being available in 24 hours (12%), 3 beds being available in 17 hours (9%), and 4 beds being available in 3 hours (2%)all while we directly observed 0 beds being available. Thus, cumulatively, 90% of the hours observed with no beds had an SCM report availability of 02 beds; 99% of the time that was 03 beds. Applying this rate of mismatch to the unit that we did not observe directly, SCM reported 0 beds for 46 (23%) of the 200 hours the observation unit was full; SCM reported 1 bed available in 70 hours (35%), 2 beds open in 42 hours (21%), 3 beds open in 26 hours (13%), and 4 beds open in 16 hours (8%). Cumulatively, that is 79% of the time with 02 beds and 92% at 03 beds. From this, we conclude that the combined PICU for both sides was likely functionally full at least 158 of the 200 hours that the side we observed was full (79% 200 hours) and likely had very constrained capacity during the other 42 hours.
- ,,,,.The effect of hospital occupancy on emergency department length of stay and patient disposition.Acad Emerg Med.2003;10:127–133.
- ,,,.The effect of hospital bed occupancy on throughput in the pediatric emergency department.Ann Emerg Med.2009;53:767–776.
- ,,,.A Comparison of in‐hospital mortality risk conferred by high hospital occupancy, differences in nurse staffing levels, weekend admission, and seasonal influenza.Medical Care.2010;48:224–232.
- .Intensive care unit occupancy: making room for more patients.Crit Care Med.2009;37:1794–1795.
- ,.A human factors engineering conceptual framework of nursing workload and patient safety in intensive care units.Intensive Crit Care Nurs.2005;21:284–301.
- ,,, et al.High level of burnout in intensivists: prevalence and associated factors.Am J Respir Crit Care Med.2007;175:686–692.
- ,,.Length of stay and efficiency in pediatric intensive care units.J Pediatr.1998;133:79–85.
- ,.Variability in duration of stay in pediatric intensive care units: a multiinstitutional study.J Pediatr.1996;128:35–44.
- ,.Matching Supply with Demand: An Introduction to Operations Management.New York, NY:McGraw‐Hill;2006.
- ,.Impact of workload on service time and patient safety: an econometric analysis of hospital operations.Management Science.2009;55:1486–1498.
- .OPIM 631: Operations Management.Philadelphia, PA:Wharton School, University of Pennsylvania;2008.
- ,,.From waste to value in health care.JAMA.2008;299:568–571.
- .Eliminating “waste” in health care.JAMA.2009;302:2481–2482.
- .Toyota Production System: Beyond Large‐scale Production.London, UK:Productivity Press;1995.
- ,.Interdisciplinary work flow assessment and redesign decreases operating room turnover time and allows for additional caseload.Arch Surg.2006;141:65–69.
- ,,,.Improving operating room efficiency through process redesign.Surgery.2006;140:509–514.
- ,,,.Successful strategies for improving operating room efficiency at academic institutions.Anesth Analg.1998year="1998"1998;86:896–906.
- ,,.Efficiency of the operating room suite.Am J Surg.2003;185:244–250.
- ,,, et al.Children's hospitals do not acutely respond to high occupancy.Pediatrics.2010;125:974–981.
- Institute for Healthcare Improvement. Smoothing elective surgical admissions. Available at: http://www.ihi.org/IHI/Topics/Flow/Patient Flow/EmergingContent/SmoothingElectiveSurgicalAdmissions.htm. Accessed October 24,2008.
- Boston Hospital Sees Big Impact from Smoothing Elective Schedule.OR Manager. Volume 20, no. 12,2004.
- ,.Rethinking rapid response teams.JAMA.2010;304:1375–1376.
- Litvak E, ed.Managing Patient Flow in Hospitals: Strategies and Solutions.2nd ed.Oak Brook, IL:Joint Commission Resources;2009.
- ,,,,,.Scheduled admissions and high occupancy at a children's hospital.J Hosp Med.2011;6:81–87.
- ,,, et al.Addressing inpatient crowding by smoothing occupancy at children's hospitals.J Hosp Med.2011;6:466–473.
- ,.Learning to See: Value Stream Mapping to Add Value and Eliminate MUDA.Cambridge, MA:Lean Enterprise Institute;1999.
- ,,.Reshaping ICU ward round practices using video‐reflexive ethnography.Qual Health Res.2008;18:380–390.
- ,,.How hospitalists spend their time: insights on efficiency and safety.J Hosp Med.2006;1:88–93.
- ,,, et al.Where did the day go? A time‐motion study of hospitalists.J Hosp Med2010;5:323–238.
- ,,.Improving patient care by linking evidence‐based medicine and evidence‐based management.JAMA.2007;298:673–676.
Patient flow refers to the management and movement of patients in health care settings and is linked to quality, safety, and cost.16 The intensive care unit (ICU) is crucial in patient flow.7, 8 The limited number of beds and the resource‐intensive services and staffing associated with them require that hospitals optimize their utilization, as is increasingly true of all hospital resources. To maximize delivery of services to patients who need them and minimize real and opportunity losses (eg, postponed surgery, diverted transports, or inability to accept patients), patients in ICU beds should receive critical care medicine/nursing services while there and be transferred or discharged when appropriate.
The time between arrival and departure from any area of the hospital, including the ICU, is considered the time when a patient is receiving needed clinical carethe value‐added portion of health care operationsand time waiting to move on to the next step.911 This period includes both necessary logistics (eg, signing out a patient or waiting a reasonable amount of time for room cleaning) and nonvalue‐added time (eg, an excessively long amount of time for room cleaning). Operations management labels nonvalue‐added time as waste, and its reduction is vital for high‐quality health care.9, 12, 13 As in other industries, one important way to understand value versus waste is through direct observation.11, 14 Although operating rooms have been the subject of several published process improvement projects to improve efficiency,1518 inpatient beds have not been the subject of such scrutiny. The objectives of this study were to generate a direct observation method and use it to describe pediatric ICU (PICU) bed utilization from a value‐added perspective.
METHODS
An interdisciplinary work group of physicians, nurses, quality improvement specialists, and 1 operations management expert developed an Excel spreadsheet to categorize hour‐by‐hour status of PICU beds. The clinicians generated a list of 27 activities. A critical care nurse trained in quality improvement piloted the list for 3 separate 4‐hour blocks over 2 weeks adding 18 activities; 2 additional activities were added during the 5 weeks of observation (Table 1). (The recording tool is provided in the Supporting Information Appendix.) Three observers with knowledge of medical terminology (2 third‐year medical students and 1 premedical student with years of experience as an emergency medical technician) were trained over 12 hours to conduct the observations. Prior to the observations, the 3 observers also spent time in the PICU, and terminology used for recordings was reviewed. Interobserver reliability was checked during 3 sets of observation circuits by all 3 observers and the principal investigator, as well as by spot checks during the study.
| Activity Description | Activity Code | Total Hours Over 5 Weeks | % Total Hours Over 5 Weeks* | Mean Hours per Week* |
|---|---|---|---|---|
| ||||
| Ventilated patient | Vent | 8996 | 45 | 1799 |
| CCSs not otherwise specified | NOS | 2982 | 15 | 596 |
| Neurosurgery patient with ICU needs | NeurosurgICU | 1534 | 8 | 307 |
| Room empty and unassigned | Empty‐unassigned | 1511 | 8 | 302 |
| Patient on continuous infusion | ContinInfus | 958 | 5 | 192 |
| Awaiting floor bed assignment | Floorbedassign | 919 | 5 | 184 |
| Patient with arterial line | ArtLine | 508 | 3 | 102 |
| Patient on high‐flow nasal cannula | HFNC | 475 | 2 | 95 |
| Room cleaning | EVS | 318 | 2 | 64 |
| Patient <12 hours after extubation | PostVent | 226 | 1 | 45 |
| Patient in OR, bed being held | OR | 210 | 1 | 42 |
| Neurosurgery patient, post‐ICU needs | NeurosurgPostICU | 164 | 0.8 | 33 |
| No clear ICU need, but no other accepting floor or service | Unclear | 163 | 0.8 | 33 |
| Patient at procedure, bed being held | Proced | 133 | 0.7 | 27 |
| Patient awaiting a rehabilitation bed | Rehab | 99 | 0.5 | 20 |
| Patient with ventriculostomy | Ventriculostomy | 82 | 0.4 | 16 |
| Patient eligible to be in NICU | NICU | 76 | 0.4 | 15 |
| Patient awaiting social work, case management, prescriptions before discharge | AwaitingOtherServ | 66 | 0.3 | 13 |
| Empty bed, assigned to ED patient | Empty‐ED | 40 | 0.2 | 8 |
| Empty bed, assigned to incoming transport patient | Empty‐Transport | 37 | 0.2 | 7 |
| Patient awaiting transport to another facility | Transport | 37 | 0.2 | 7 |
| Patient awaiting consult to determine transfer | Consult | 33 | 0.2 | 7 |
| Patient awaiting physician or NP sign‐out to floor before transfer | CallMDNP | 30 | 0.2 | 6 |
| PICU room needs a bed for next patient | Bed | 26 | 0.1 | 5 |
| Patient eligible to be in CCU | CCU | 24 | 0.1 | 5 |
| Patient eligible to be in CICU | CICU | 24 | 0.1 | 5 |
| Patient awaiting laboratory result to determine transfer or discharge | LabResult | 21 | 0.1 | 4 |
| Patient awaiting a ride home | Ride | 21 | 0.1 | 4 |
| Empty bed, assigned to floor patient | Empty‐floor | 19 | 0.1 | 4 |
| Patient awaiting nursing report to floor for transfer | Callnurse | 18 | 0.1 | 4 |
| Patient eligible to be in PCU | PCU | 18 | 0.1 | 4 |
| Patient on cardiac pressor | Pressor | 16 | 0.1 | 3 |
| Patient actively coding | Code | 15 | 0.1 | 3 |
| Patient on continuous veno‐venous hemofiltration | CVVH | 15 | 0.1 | 3 |
| Nursing work needed to enable transfer out | Nursing | 11 | 0.1 | 2 |
| Patient awaiting order for transfer to floor | Order | 11 | 0.1 | 2 |
| Patient in interventional radiology, bed being held | IR | 10 | 0.1 | 2 |
| Patient deceased in PICU room | Deceased | 9 | 0.1 | 2 |
| Awaiting radiology result to clear transfer or discharge | RadResult | 9 | 0.1 | 2 |
| Patient awaiting a floor bed to be cleaned for transfer out | Floorbedclean | 7 | <0.1 | 1 |
| Other logistical need for an empty room | Logistics | 7 | <0.1 | 1 |
| Disagreement among services for disposition | Disagreement | 4 | <0.1 | 1 |
| Family request to stay in PICU | Family | 3 | <0.1 | 1 |
| Awaiting accepting attending/fellow for transfer out | Accept | 1 | <0.1 | <1 |
| PICU room needs a crib for next patient | Crib | 1 | <0.1 | <1 |
| Patient with preventable reason for being in PICU | Prev | 0 | 0 | 0 |
| PICU room needs specialty bed for next patient | SpecialBed | 0 | 0 | 0 |
| Total | 19,887 | 100 | ||
The targeted area included 24 single‐patient rooms. The activity of each bed was recorded hourly. Real‐time recording in to the Excel spreadsheet on a dedicated laptop occurred from 8:00 AM until 11:00 PM. The most visible or critical event was recorded. Although some activities were not mutually exclusive (eg, a patient could be ventilated and on a continuous infusion simultaneously), the objective was to identify when a room was being used for any critical care service, not enumerate all of them. The observers noted overnight events that occurred from 11:00 PM to 8:00 AM in the morning by reviewing the bedside record and talking to the staff to complete each day's 24‐hour recording. The observers also recorded the hospital‐wide census and the census for the other half of the PICU every 4 hours. The observations occurred over 5 noncontiguous weeks between January 2009 and April 2009.
After all observations were complete, activities were classified as critical care services (CCS) or noncritical‐care services (NCCS). NCCSs were further divided into necessary logistics (defined for analysis purposes as the first hour of any NCCS activity) or nonvalue‐added (the second or greater hour of NCCS). A time limit of 1 hour was chosen to define necessary logistics based on a consensus that nonclinical activities optimally would not take more than 1 hour each. We also analyzed results with 2 hours as the cutoff for necessary logistics. Admission, discharge, and transfer records were reviewed to check for returns to the PICU or hospital within 48 hours of transfer or discharge from the PICU.
Analyses were conducted using Microsoft Excel (Microsoft, Redmond, WA) and Stata 10.0 (StataCorp, College Station, TX). The study was approved by the Children's Hospital of Philadelphia Institutional Review Board with waiver of consent.
RESULTS
A total of 824 hours of recordings included 19,887 bed‐hours with 219 unique patients; among them, 2 remained from the first day of recording in January to the last day in April (sample recording in Figure 1). A total of 50 patients (range, 812 per week) stayed for the entirety of each 1‐week observation period. Of the 47 possible activities, 45 of them were recorded for at least 1 hour in the 5 weeks. Overall, 14 activities accounted for 95% of the observed bed‐hours and 31 activities accounted for the remaining 5%. CCS accounted for 82% of observed bed‐hours, NCCS accounted for 10.4%, and empty unassigned accounted for 8% (Figure 2). Using the 1‐hour cutoff for necessary services, 77% of NCCS time was nonvalue‐added, whereas 23% of it was necessary logistics; using the 2‐hour cutoff, 54% was nonvalue‐added, and 46% was necessary logistics.
During the observation period, <1% of bed‐hours were used for CCS for overflow patients from the neonatal ICU (NICU), cardiac care unit (CCU), cardiac ICU (CICU), or progressive care unit (PCU; tracheostomy/ventilator unit). Although only 4 patients required transport to a rehabilitation facility, their wait time comprised 99 hours (<1%) of total recordings. Eight patients waited a mean of 2.6 hours for transportation home (maximum, 10 hours).
To demonstrate the cycle of room use, activities were divided into 4 categories: room preparation, critical care services, disposition pending, and postcritical care services (Figure 3). As an example of detailed data revealed by direct observation, we identified 102 instances totaling 919 hours when a patient was waiting for a bed assignment on another floor (5% of all bed‐hours). The mean wait time was 9 hours (range, 188 hours) and the median time was 5.5 hours. There were only 15 instances when floor bed assignment took 1 hour or less, and only 9 instances when it took 12 hours. Similarly, considerable time was spent on cleaning rooms between patients: only 66 of 146 instances of cleaning took 1 hour or less. The mean time for cleaning was 2.2 hours (range, 115), and the median was 2 hours. (There were 136 recorded instances of room cleaning and 10 additional episodes that were not recorded but had to be completed for the room to turnover from one patient to the next, yielding a total of 146 instances of cleaning.)
From the 824 hours of recording, we identified 200 hours (25% of time) when there were zero empty unassigned beds available in the section of the PICU being observed. Episodes of full occupancy occurred mostly on weekdays, with 23% of hours of full capacity on Thursdays, 21% on Mondays, and 21% on Wednesdays; only 8% were on Saturdays and <1% on Sundays. These 200 hours fell into 36 separate episodes of complete occupancy, each lasting 122 hours. Each patient, on average, received 3.1 hours of NCCS during each episode of full occupancy (range, 111 hours). Within these 200 hours at capacity, we identified only 15 hours (8%) when all 24 beds were used for CCS. For 72% of the time, there was at least 1 bed with NCCS, and for 37% at least 2 beds. A small portion of the time (7%), the lack of beds was affected by occupancy by patients who should have been in the NICU, CICU, CCU, or PCU.
Data collected through direct observation can be used to understand aggregated and averaged experiences, but also more specific time periods. For example, we identified 1 week with the highest consistent level of occupancy and turnover: March 915 had empty unassigned beds for only 4% of the week. Of the 168 hours in the week, 68 (40%) had full capacity. However, for 90% of the time, at least 1 bed was used for a NCCS. Other analytic options included varying the assumptions around time needed for logistics. Overall, NCCS time on necessary logistics changes from 23% to 46% using 1 hour versus 2 hours as the cutoff. For floor bed assignments, assuming that the first hour of this activity is necessary logistics and any hour thereafter is not, 817 hours were wasted. Even after assuming 2 hours of necessary logistical time (which may also include steps such as nursing and physician sign‐out to the receiving team, often not recorded in the observations), this left 715 hours of NCCS time in which patients waited to be placed elsewhere in the hospital. For room cleaning, because recordings were hourly, but room cleaning could take less time, we performed a sensitivity analysis, converting all 1‐hour recordings to half‐hour recordings to half‐hour recordings (an exaggerated shortening since industry‐standard cleaning may take longer).
Of the 219 patients directly observed, 15 were noted to be waiting for a transfer out of the PICU but experienced a change in disposition before the transfer. On average, these patients waited 8 hours for a floor bed assignment (range, 221) before reverting to a CCS, which then lasted an average of 16.5 hours (range, 149). (Included in this group are 2 patients who experienced this change in disposition twice.) In post hoc review across the 5 weeks, no patients were transferred back to the PICU within 48 hours after being transferred out. During the study period, 19 patients were discharged directly from the PICU (8 to home, 7 by transport to another facility, and 4 to rehabilitation). One patient returned to the hospital (but not the PICU) within 48 hours of being discharged home from the PICU.
During the study period, using the highest census value for recorded for each 24‐hour period and the number of beds available that day, median hospital‐wide occupancy was 93% (interquartile range, 90%96%). During the 35 days of observation, 71% of the days had occupancy >90%, 29% of days had occupancy >95%, and 3% of days had occupancy >100%.
DISCUSSION
In this direct observation of a PICU, we found high usage of beds for delivery of CCS. We identified many episodes in which the half of the PICU we observed was fully occupied (200 of 824 hours), but not necessarily delivering PICU‐level care to all patients. In fact, 75% of the full‐capacity hours had at least 1 patient receiving NCCS and 37% had at least 2. Patients waiting for a floor bed assignment represented nearly 5% of bed‐hours observed (mean 9 hours per patient). That full occupancy was not random, but rather clustered on weekdays, is consistent with other work showing that hospitals are at greater risk for midweek crowding due to the way in which scheduled admissions enter and leave.1925
Our methods provide the basis for operational analysis and improvement to patient flow, such as value stream mapping.9, 26 Process improvement work could be directed to areas of delay uncovered through this analysis and inform clinical and nonclinical management. For example, one of the key problems faced by the PICU was finding floor bed assignments for patients leaving the unit. Simply building more beds in the PICU will not solve this problemand at an estimated cost of $2 million to add a bed, it is likely not an efficient means of responding to poor flow. In these cases, the problem seems to lie downstream, and could suggest shortage of regular floor beds or inefficient bed assignment procedures within the hospital. The output also suggests that variation in nonclinical processes should be a target for improvement, such as time to clean rooms, because variation is known to be a source of nonvalue‐added time in many operations.9, 26 High occupancy on weekdays but low occupancy on weekends also emphasizes the potential for smoothing occupancy to reduce the risk of midweek crowding and to better manage bed utilization and staffing.24, 25
When seeking to reduce nonvalue‐added time, one must weigh the risks of increased efficiency against clinical outcomes. For example, if patients could be transferred out of the PICU faster, would the risk of returns to the PICU be higher? In this study, 15 patients (7%) had a change in disposition from awaiting transfer back to a CCS. The fact that transfers did not happen instantaneously may serve as a safety check to reduce rapid returns, but it is not possible for us to evaluate the reasons why patients did not actually complete the pending transfers. Specifically, we cannot determine whether the patient's clinical status objectively deteriorated, the ICU team made a judgment call to hold the patient, or the floor team refused to accept the transfer. Given this fact, although it appears in this study (and in the health care system more broadly) that there are opportunities to increase efficiency and reduce nonvalue‐added time, it is not realistic (nor advisable) that such time be reduced to zero. Along this line, one must consider separately purely nonclinical functions such as room cleaning and those that include some clinical element, such as time waiting for a patient to be transferred.
Beyond the direct findings of this study, the method should be replicable in other settings and can reveal important information about health care efficiency, capacity, and flexibility. The bottlenecks identified would have been difficult to identify through administrative record review. The exact amount of time to spend on observation may vary from place to place and would depend on the expected variation over time and the level of detail sought. In general, the more common the event and the less variation, the less time needed to observe it.
This study has several limitations that should be considered in terms of interpreting the results and in seeking to reproduce the approach. First, hourly recordings may not be discrete enough for events that took less than 1 hour. To assess the degree to which this would affect our results, we reanalyzed all NCCS by subtracting 30 minutes (0.5 hour) from all recordings, which increased total CCS from 82% to 87% and decreased NCCS by the same 5 percentage points. In a related fashion, our recordings were truncated at the start and end of each 1‐week period, so we could only observe a maximum of 168 hours for any given activity and did not record how long an activity was happening before or after the recordings started or stopped, respectively. Second, each recording could only be for 1 activity per hour. Separate from the level of granularity already noted, this also limits interpretation of critical care activities that may have been simultaneous. However, because the goal of the study was not to describe the provision of critical care services, but rather the times when they were not being delivered, this does not influence our conclusions. For movement of patients, however, we missed instances of physician and nursing calling sign‐out on patients to receiving units, as these events last less than 1 hour (and in the case of surgical patients, generally do not occur as the team provides continuous coverage). The time for such events is then included in other activities. To the extent that this may influence the results, it would increase the perceived time for nonvalue‐added services, but to a limited degree, and never by more than 59 minutes. Third, the overnight hours (11:00 PM to 8:00 AM) were not directly observed, but retrospectively recorded each morning by reviewing the records and discussing the overnight events with the clinical staff. For example, if a patient was intubated at 11:00 PM and at 8:00 AM, the observer would confirm this and record that status for the intervening hours. This is unlikely to result in a substantial impact on the findings, because the overnight hours have a relative degree of stability even for unstable patients in terms of their status of needing or not needing a CCS. Fourth, we did not evaluate the appropriateness of CCS delivered (eg, how long a patient was ventilated). Our definitions for CCS and NCSS were based on Children's Hospital of Philadelphia practices, which may not be the same as those of other facilities. The categorization of CCS was objective for activities such as ventilation or continuous infusion, but was less clear for the not otherwise specified recordings, which represented patients with a complex illness or projected organ, respiratory, cardiac, or neurological failure. These patients were not receiving a specific critical care intervention, but were deemed to need to be in the PICU as opposed to a regular floor (eg, for frequent monitoring of potential respiratory failure). It would also include patients receiving combinations of therapies more efficiently delivered in the PICU. For that, the observers relied on the judgment of clinicians (primarily nurses) to determine whether the patient needed to be in the PICU or not; if no specific reason could be provided, not otherwise specified was applied. These 192 instances accounted for 2982 aggregate bed‐hours (15% of total). It is difficult to judge the direction of bias, because overestimation of need to be in the PICU may be as likely to occur as underestimation. Fifth, the very presence of the observers may have changed behavior. Knowing that they were being observed staff may have acted with greater efficiency than otherwise. We expect that such a finding would lead to less time appearing as necessary logistics or NCCS. Finally, results may not be generalizable to other hospitals or hospital settings. There are clearly important contextual factors, not only for the location but also for the duration. For example, staffing was never an issue during the 5 weeks of observation, but there are locations where an empty bed is not necessarily usable due to lack of staffing. Nonetheless, we believe the results provide a generalizable approach and methodology for other settings (and staffing could be a reason for an empty bed).
In terms of the setting, as noted, we observed one discrete 24‐bed unit, which comprises half of the total PICU. Thus, statements that the PICU was at full capacity must be interpreted in the context that additional rooms may have been available on the other side. Patients are generally admitted alternately to each unit, so the occupancies should parallel each other. We recorded the census every 4 hours for both sides from the electronic system (Sunrise Clinical Manager [SCM]). However, this only accounts for patients physically in beds, not beds held for patients in other locations. Thus, we would expect a discrepancy between direct observation and the SCM value. Through analysis of the entire pediatric intensive care unit,* that part which observed directly, and that which we did not observe directly using census data, we think it reasonable to assert that both units of the total PICU had constrained capacity during the times we directly observed and recorded such constraint on one side.
This study demonstrates the use of direct observation for inpatient settings to learn about resource utilization and identification of value‐added services. PubMed searches for the terms efficiency, flow, process redesign, and time management bring up many more references for operating rooms than for ICUs or inpatient beds. Some examples of ICU‐directed work include videography of an ICU in Australia27 and human factor analysis in ICU nursing.5 Time‐motion studies have also been conducted on clinical staff, such as physicians.28, 29
In conclusion, we found that direct observation provided important insights into the utilization of patient rooms in an important inpatient setting. Data such as these are valuable for clinical and process improvement work, as well as understanding how best to match capacity to patient need. Finally, the methodology is reproducible for other settings and would be an additional tool to measuring and improving the efficiency and value of the health system. When appropriate, this approach can also evaluate the effectiveness of process improvement, help identify and reduce waste,13 and contribute to the growing field that merges operations management with hospital administration and clinical care: in other words, evidence‐based management.30
Acknowledgements
The authors thank Paula Agosto, Patricia Hubbs, Heidi Martin, and Annette Bollig for contributions to the study design.
In comparing direct observation to the SCM count, we found perfect concordance for 110 hours (55%) during which 0 beds were available. For the other 90 hours, SCM reported 1 bed being available in 46 hours (23%), 2 beds being available in 24 hours (12%), 3 beds being available in 17 hours (9%), and 4 beds being available in 3 hours (2%)all while we directly observed 0 beds being available. Thus, cumulatively, 90% of the hours observed with no beds had an SCM report availability of 02 beds; 99% of the time that was 03 beds. Applying this rate of mismatch to the unit that we did not observe directly, SCM reported 0 beds for 46 (23%) of the 200 hours the observation unit was full; SCM reported 1 bed available in 70 hours (35%), 2 beds open in 42 hours (21%), 3 beds open in 26 hours (13%), and 4 beds open in 16 hours (8%). Cumulatively, that is 79% of the time with 02 beds and 92% at 03 beds. From this, we conclude that the combined PICU for both sides was likely functionally full at least 158 of the 200 hours that the side we observed was full (79% 200 hours) and likely had very constrained capacity during the other 42 hours.
- ,,,,.The effect of hospital occupancy on emergency department length of stay and patient disposition.Acad Emerg Med.2003;10:127–133.
- ,,,.The effect of hospital bed occupancy on throughput in the pediatric emergency department.Ann Emerg Med.2009;53:767–776.
- ,,,.A Comparison of in‐hospital mortality risk conferred by high hospital occupancy, differences in nurse staffing levels, weekend admission, and seasonal influenza.Medical Care.2010;48:224–232.
- .Intensive care unit occupancy: making room for more patients.Crit Care Med.2009;37:1794–1795.
- ,.A human factors engineering conceptual framework of nursing workload and patient safety in intensive care units.Intensive Crit Care Nurs.2005;21:284–301.
- ,,, et al.High level of burnout in intensivists: prevalence and associated factors.Am J Respir Crit Care Med.2007;175:686–692.
- ,,.Length of stay and efficiency in pediatric intensive care units.J Pediatr.1998;133:79–85.
- ,.Variability in duration of stay in pediatric intensive care units: a multiinstitutional study.J Pediatr.1996;128:35–44.
- ,.Matching Supply with Demand: An Introduction to Operations Management.New York, NY:McGraw‐Hill;2006.
- ,.Impact of workload on service time and patient safety: an econometric analysis of hospital operations.Management Science.2009;55:1486–1498.
- .OPIM 631: Operations Management.Philadelphia, PA:Wharton School, University of Pennsylvania;2008.
- ,,.From waste to value in health care.JAMA.2008;299:568–571.
- .Eliminating “waste” in health care.JAMA.2009;302:2481–2482.
- .Toyota Production System: Beyond Large‐scale Production.London, UK:Productivity Press;1995.
- ,.Interdisciplinary work flow assessment and redesign decreases operating room turnover time and allows for additional caseload.Arch Surg.2006;141:65–69.
- ,,,.Improving operating room efficiency through process redesign.Surgery.2006;140:509–514.
- ,,,.Successful strategies for improving operating room efficiency at academic institutions.Anesth Analg.1998year="1998"1998;86:896–906.
- ,,.Efficiency of the operating room suite.Am J Surg.2003;185:244–250.
- ,,, et al.Children's hospitals do not acutely respond to high occupancy.Pediatrics.2010;125:974–981.
- Institute for Healthcare Improvement. Smoothing elective surgical admissions. Available at: http://www.ihi.org/IHI/Topics/Flow/Patient Flow/EmergingContent/SmoothingElectiveSurgicalAdmissions.htm. Accessed October 24,2008.
- Boston Hospital Sees Big Impact from Smoothing Elective Schedule.OR Manager. Volume 20, no. 12,2004.
- ,.Rethinking rapid response teams.JAMA.2010;304:1375–1376.
- Litvak E, ed.Managing Patient Flow in Hospitals: Strategies and Solutions.2nd ed.Oak Brook, IL:Joint Commission Resources;2009.
- ,,,,,.Scheduled admissions and high occupancy at a children's hospital.J Hosp Med.2011;6:81–87.
- ,,, et al.Addressing inpatient crowding by smoothing occupancy at children's hospitals.J Hosp Med.2011;6:466–473.
- ,.Learning to See: Value Stream Mapping to Add Value and Eliminate MUDA.Cambridge, MA:Lean Enterprise Institute;1999.
- ,,.Reshaping ICU ward round practices using video‐reflexive ethnography.Qual Health Res.2008;18:380–390.
- ,,.How hospitalists spend their time: insights on efficiency and safety.J Hosp Med.2006;1:88–93.
- ,,, et al.Where did the day go? A time‐motion study of hospitalists.J Hosp Med2010;5:323–238.
- ,,.Improving patient care by linking evidence‐based medicine and evidence‐based management.JAMA.2007;298:673–676.
Copyright © 2011 Society of Hospital Medicine

2.0
Ten years ago, leaders in Hospital Medicine saw the need for a peer‐reviewed Hospital Medicine journal, a key step in the growth of the field. However, there was no small amount of uncertainty as to whether there was room for another medical publication, or whether Hospital Medicine was ready for its own journal.
It's clear now that we should not have been worried. Our specialty has grown in size and influence, and the Journal of Hospital Medicine's growth has progressed along a similar track, linked to the success of the many leaders in our field, including the founders of the Society of Hospital Medicine: John Nelson, MD, MHM, Win Whitcomb, MD, MHM, and Bob Wachter, MD, MHM. Support from them in selecting the Founding Editor, Mark V. Williams, ensured his success in assembling an outstanding editorial team, developing JHM's editorial process, and setting this journal as the bestand not just the onlyjournal for hospitalists to publish their work. JHM serves as both a beacon and a mirror for the field of Hospital Medicine, and I am honored for the opportunity to lead this dynamic journal. I also owe special thanks to the Society of Hospital Medicine and the outstanding team at Wiley‐Blackwell, who have made my transition to this role a smooth one.
After the transition, JHM will continue to be a mirror for Hospital Medicine in that it will reflect the scholarship and innovation of hospitalists' scholarly work in research, quality improvement, education, and clinical excellence. From a practical standpoint, this means JHM will continue to do what it has done so successfully to date: provide fair, insightful, and rapid evaluation and publication of articles that are scientifically rigorous and have an impact on hospitalists and their patients. Being an effective mirror also means the journal will need to be in tune with technological advances in publication and learning. Few of us read paper journals any longer, and the move from print to digital and mobile media provides an important opportunity for this journal. Expanding the means by which we disseminate JHM's findings, highlight evidence, and promote knowledge that impacts our field is a clear direction for the journal.
At the transition from JHM 1.0 to JHM 2.0, the journal is positioned to be a beacon for the field by publishing papers that address new and rapidly evolving issues that will affect hospitalists and their patients. JHM and my editorial team eagerly seek submission of manuscripts on these issues delineated below.
Even if health care reform legislation evolves or changes after the 2012 elections, the need to improve health care value across multiple phases of care is unlikely to disappear. The medical home and accountable care organizations will prompt hospitalists to work with outpatient partners to achieve improvements; focus on readmissions and high‐utilization patients may catalyze integration even without larger changes. This evolution plays to hospitalists' traditional strengths as innovators and leaders of health system innovations while erasing the boundaries between inpatient and outpatient phases of care. How the field adapts toor even better, anticipateschanges in care delivery is a momentous opportunity.
Hospitalists will continue to be leaders in quality and safety improvement, but the need to develop innovations that are effective, scalable, and widely adoptable is growing even more acute. Stated alternately, we need to develop innovations quickly and rigorously, so that neither time nor resources are wasted. Fortunately, there is likely to be financial support for projects that link improvement and evaluation from the Center for Medicare and Medicaid Innovations (CMMI). It is a fair bet that a large number of the CMMI's target issues will be ones that hospitalists also find important, and which are ripe for inquiry.
Shifting from quality to outcomes will prompt a revisiting of how we measure our success as hospitalists. Achieving success in process benchmarks will no longer be sufficient, as our practices will increasingly be measured by our patients' experience, functional status, quality of life, and clinical events (of which measures of safety are a part)both within the walls of the hospital and afterwardrather than solely relying on whether patients appropriately received a drug or procedure during their stay. The need to improve outcomes will immediately bump up against the disappointingly small proportion of measures or evidence that apply to the typical Hospital Medicine patient. Developing these new measures, and the evidence for how to improve them, will be a key challenge for the field of Hospital Medicine. Outcome development and comparisons are a clear focus of the Patient‐Centered Outcomes Research Institute. Again, studies documenting such research will find a welcome home at JHM.
The role of information technology in how hospitalists provide care to patients, decide on best practices, communicate with physicians and patients, and manage their practices is becoming central. A huge, nationwide natural experiment is underway as health systems work to meet meaningful use criteria, and oftentimes hospitalists are central to these efforts. Disseminating best practices, implementing innovative systems, and creating workflows that meet the needs of hospitalists' patients is a key short‐term need, and one our field is uniquely positioned to address.
Finally, the practice of Hospital Medicine continues to evolve. In teaching centers, hospitalists are leading educators of medical students and residents; developing training models that reflect newer thinking about how to teach a 21st‐century physician is a key need for the field. The importance of adaptations to work‐hour reductions for residents cannot be overstated, but attention must be paid to how hospitalists' work hours impact patient care as well. Comanagement systemswhether for medical subspecialties (ie, cancer or heart failure) or surgical specialtieshave yet to fulfill their promise, yet demand for comanagement grows. How might comanagement systems be adapted and targeted so that they become more effective?
Not being a futurist or even slightly omniscient, I am sure this list is neither exhaustive nor final. In my 15 or so years in Hospital Medicine, I know firsthand that the field is vigorous, innovative, and full of surprises. Fortunately, JHM is attuned to changes happening now as well as issues on the horizon, and will always strive to be an even better messenger for Hospital Medicine as a professional and academic specialty.1 In that way, JHM 2.0 will be the same as JHM 1.0. I'm excited to shepherd JHM's ongoing growth and look forward to my years at the helm.
Acknowledgements
Funding Source: Dr. Auerbach is supported by National Heart, Lung, and Blood Institute Grant K24 K24HL098372.
Disclosure: The author discloses no relevant or financial conflicts of interest.
- .Editor transition—getting up off the couch and walking out the door.J Hosp Med.2011;6:485–486.
Ten years ago, leaders in Hospital Medicine saw the need for a peer‐reviewed Hospital Medicine journal, a key step in the growth of the field. However, there was no small amount of uncertainty as to whether there was room for another medical publication, or whether Hospital Medicine was ready for its own journal.
It's clear now that we should not have been worried. Our specialty has grown in size and influence, and the Journal of Hospital Medicine's growth has progressed along a similar track, linked to the success of the many leaders in our field, including the founders of the Society of Hospital Medicine: John Nelson, MD, MHM, Win Whitcomb, MD, MHM, and Bob Wachter, MD, MHM. Support from them in selecting the Founding Editor, Mark V. Williams, ensured his success in assembling an outstanding editorial team, developing JHM's editorial process, and setting this journal as the bestand not just the onlyjournal for hospitalists to publish their work. JHM serves as both a beacon and a mirror for the field of Hospital Medicine, and I am honored for the opportunity to lead this dynamic journal. I also owe special thanks to the Society of Hospital Medicine and the outstanding team at Wiley‐Blackwell, who have made my transition to this role a smooth one.
After the transition, JHM will continue to be a mirror for Hospital Medicine in that it will reflect the scholarship and innovation of hospitalists' scholarly work in research, quality improvement, education, and clinical excellence. From a practical standpoint, this means JHM will continue to do what it has done so successfully to date: provide fair, insightful, and rapid evaluation and publication of articles that are scientifically rigorous and have an impact on hospitalists and their patients. Being an effective mirror also means the journal will need to be in tune with technological advances in publication and learning. Few of us read paper journals any longer, and the move from print to digital and mobile media provides an important opportunity for this journal. Expanding the means by which we disseminate JHM's findings, highlight evidence, and promote knowledge that impacts our field is a clear direction for the journal.
At the transition from JHM 1.0 to JHM 2.0, the journal is positioned to be a beacon for the field by publishing papers that address new and rapidly evolving issues that will affect hospitalists and their patients. JHM and my editorial team eagerly seek submission of manuscripts on these issues delineated below.
Even if health care reform legislation evolves or changes after the 2012 elections, the need to improve health care value across multiple phases of care is unlikely to disappear. The medical home and accountable care organizations will prompt hospitalists to work with outpatient partners to achieve improvements; focus on readmissions and high‐utilization patients may catalyze integration even without larger changes. This evolution plays to hospitalists' traditional strengths as innovators and leaders of health system innovations while erasing the boundaries between inpatient and outpatient phases of care. How the field adapts toor even better, anticipateschanges in care delivery is a momentous opportunity.
Hospitalists will continue to be leaders in quality and safety improvement, but the need to develop innovations that are effective, scalable, and widely adoptable is growing even more acute. Stated alternately, we need to develop innovations quickly and rigorously, so that neither time nor resources are wasted. Fortunately, there is likely to be financial support for projects that link improvement and evaluation from the Center for Medicare and Medicaid Innovations (CMMI). It is a fair bet that a large number of the CMMI's target issues will be ones that hospitalists also find important, and which are ripe for inquiry.
Shifting from quality to outcomes will prompt a revisiting of how we measure our success as hospitalists. Achieving success in process benchmarks will no longer be sufficient, as our practices will increasingly be measured by our patients' experience, functional status, quality of life, and clinical events (of which measures of safety are a part)both within the walls of the hospital and afterwardrather than solely relying on whether patients appropriately received a drug or procedure during their stay. The need to improve outcomes will immediately bump up against the disappointingly small proportion of measures or evidence that apply to the typical Hospital Medicine patient. Developing these new measures, and the evidence for how to improve them, will be a key challenge for the field of Hospital Medicine. Outcome development and comparisons are a clear focus of the Patient‐Centered Outcomes Research Institute. Again, studies documenting such research will find a welcome home at JHM.
The role of information technology in how hospitalists provide care to patients, decide on best practices, communicate with physicians and patients, and manage their practices is becoming central. A huge, nationwide natural experiment is underway as health systems work to meet meaningful use criteria, and oftentimes hospitalists are central to these efforts. Disseminating best practices, implementing innovative systems, and creating workflows that meet the needs of hospitalists' patients is a key short‐term need, and one our field is uniquely positioned to address.
Finally, the practice of Hospital Medicine continues to evolve. In teaching centers, hospitalists are leading educators of medical students and residents; developing training models that reflect newer thinking about how to teach a 21st‐century physician is a key need for the field. The importance of adaptations to work‐hour reductions for residents cannot be overstated, but attention must be paid to how hospitalists' work hours impact patient care as well. Comanagement systemswhether for medical subspecialties (ie, cancer or heart failure) or surgical specialtieshave yet to fulfill their promise, yet demand for comanagement grows. How might comanagement systems be adapted and targeted so that they become more effective?
Not being a futurist or even slightly omniscient, I am sure this list is neither exhaustive nor final. In my 15 or so years in Hospital Medicine, I know firsthand that the field is vigorous, innovative, and full of surprises. Fortunately, JHM is attuned to changes happening now as well as issues on the horizon, and will always strive to be an even better messenger for Hospital Medicine as a professional and academic specialty.1 In that way, JHM 2.0 will be the same as JHM 1.0. I'm excited to shepherd JHM's ongoing growth and look forward to my years at the helm.
Acknowledgements
Funding Source: Dr. Auerbach is supported by National Heart, Lung, and Blood Institute Grant K24 K24HL098372.
Disclosure: The author discloses no relevant or financial conflicts of interest.
- .Editor transition—getting up off the couch and walking out the door.J Hosp Med.2011;6:485–486.
- .Editor transition—getting up off the couch and walking out the door.J Hosp Med.2011;6:485–486.
For Most With Diabetes, Revascularization Can Wait
ORLANDO – Virtually no patients with type 2 diabetes and documented coronary artery disease and coronary ischemia benefit from immediate coronary revascularization, as long as they receive intensive medical management, based on the outcomes of more than 1,000 patients who were randomized to the deferred revascularization arm of the BARI 2D trial.
The only possible exception to this approach are the rare patients who initially present with severe or unstable angina and proximal left anterior descending (LAD) artery disease, a small group accounting for just 2% of these patients, Dr. Ronald J. Krone said at the annual scientific sessions of the American Heart Association. Even in this small subgroup with the worst chance of avoiding revascularization, eventual coronary bypass surgery or percutaneous coronary intervention (PCI) is not an absolute. Among the 21 patients with this initial presentation at study entry (of the total 1,192 who were randomized to the deferred revascularization arm), 50% continued to avoid revascularization 6 months later, and 29% had still not undergone revascularization 5 years after the study began, said Dr. Krone, an interventional cardiologist and professor of medicine at Washington University, St. Louis.

"What it comes down to is that there is no group you can identify up front" that unequivocally needs immediate revascularization," Dr. Krone said in an interview. "We could not identify patients who will need revascularization at a high enough rate to warrant initial revascularization, with the possible exception" of the small proximal LAD and severe angina subgroup. "Even in the worst patients, you can intervene later. We used to be afraid that if we didn’t [revascularize these patients] they would drop dead or have a big myocardial infarction, but that didn’t happen. These results give us confidence that you don’t need to intervene on every tight lesion."
Today, a physician or surgeon can’t say "’I have to revascularize, because it’s the best I can do’" for these patients. Instead, the onus is to intensively treat these patients medically, especially patients with diabetes, Dr. Krone said. This strategy includes optimal control of hypertension, lipids, glycemia, and intensive lifestyle intervention with exercise, diet, and smoking cessation.
The analysis he presented focused on patients enrolled in the BARI 2D (Bypass Angioplasty Revascularization Investigation in Type 2 Diabetes), which randomized a total of 2,368 patients with diabetes and documented coronary ischemia and stenosis suitable for an elective intervention. The researchers put all these patients on an intensive medical management regimen, and also randomized them to either immediate or deferred revascularization. The study’s primary results showed absolutely identical 5-year outcomes in the two groups, with a mortality rate of 12% in each arm of the study, and a combined rate of death, MI, or stroke of 23% in the immediate revascularization patients and 24% in those with deferred intervention (N. Engl. J. Med. 2009;360:2503-15).
Among the 1,192 patients in the deferred subgroup, 13% required PCI or bypass surgery after 6 months, and 40% needed revascularization after 5 years of follow-up. Within the group who eventually had revascularization, 47% required it for worsening angina, 23% because of an acute coronary syndrome event, 18% for worsening ischemia, 6% for progression of their coronary disease, and the remaining 6% for another reason. The current analysis aimed to determine whether "we can identify patients with such a high likelihood of needing revascularization that it need not be deferred," Dr. Krone said.
The average age of the patients in the deferred revascularization group was 62 years; 30% were women, 28% were on insulin treatment, 17% had a left ventricular ejection fraction below 50%, and 13% had proximal LAD coronary disease. Their average duration of type 2 diabetes was 11 years.
A multivariate analysis that controlled for age, sex, race, and nationality identified five factors that were linked with a significantly increased rate of revascularization after 6 months: class III or IV stable angina, unstable angina, a systolic blood pressure of 100 mm Hg or less, a blood triglyceride level of 100 mg/dL or less, and proximal LAD disease. These factors were linked with anywhere from a 3.8-fold increased rate of revascularization (in patients with systolic hypotension, compared with patients with a systolic pressure greater than 100 mm Hg) to a 75% increased rate (in patients with proximal LAD disease, compared with those without LAD disease). However, none of these increased rates appeared to justify performing routine, upfront revascularization.
The 5-year multivariate analysis produced similar results. It identified nine baseline factors that each significantly linked with a significantly increased rate of revascularization during 5-year follow-up: class I or II stable angina, class III or IV stable angina, unstable angina, systolic blood pressure of 101-120 mm Hg, a systolic pressure of 100 mm HG or less, a blood triglyceride level of 100 mg/dL or greater, proximal LAD disease, having two diseased coronary regions, or having three diseased coronary regions. The increased rates associated with these features ranged from a 90% increased revascularization rate (in patients with class III or IV stable angina, compared with patients without angina), to a 28% increased revascularization rate (in patients with class I or II stable angina at baseline). Again, none of these increased rates appeared to justify uniform, upfront revascularization, Dr. Krone said.
The sole exception to this approach might possibly be the small number of patients who initially presented with both proximal LAD disease and either class III or IV stable angina or unstable angina, because eventually over 5 years 71% of these patients underwent revascularization. But these patients constituted only 2% of the total group studied, Dr. Krone noted. In general, more severe angina or stenosis was uncommon in these patients: Some 41% had no angina and 45% had class I or II angina at baseline, and 87% were free of proximal LAD disease at baseline.
Dr. Krone said that he had no disclosures.
ORLANDO – Virtually no patients with type 2 diabetes and documented coronary artery disease and coronary ischemia benefit from immediate coronary revascularization, as long as they receive intensive medical management, based on the outcomes of more than 1,000 patients who were randomized to the deferred revascularization arm of the BARI 2D trial.
The only possible exception to this approach are the rare patients who initially present with severe or unstable angina and proximal left anterior descending (LAD) artery disease, a small group accounting for just 2% of these patients, Dr. Ronald J. Krone said at the annual scientific sessions of the American Heart Association. Even in this small subgroup with the worst chance of avoiding revascularization, eventual coronary bypass surgery or percutaneous coronary intervention (PCI) is not an absolute. Among the 21 patients with this initial presentation at study entry (of the total 1,192 who were randomized to the deferred revascularization arm), 50% continued to avoid revascularization 6 months later, and 29% had still not undergone revascularization 5 years after the study began, said Dr. Krone, an interventional cardiologist and professor of medicine at Washington University, St. Louis.
"What it comes down to is that there is no group you can identify up front" that unequivocally needs immediate revascularization," Dr. Krone said in an interview. "We could not identify patients who will need revascularization at a high enough rate to warrant initial revascularization, with the possible exception" of the small proximal LAD and severe angina subgroup. "Even in the worst patients, you can intervene later. We used to be afraid that if we didn’t [revascularize these patients] they would drop dead or have a big myocardial infarction, but that didn’t happen. These results give us confidence that you don’t need to intervene on every tight lesion."
Today, a physician or surgeon can’t say "’I have to revascularize, because it’s the best I can do’" for these patients. Instead, the onus is to intensively treat these patients medically, especially patients with diabetes, Dr. Krone said. This strategy includes optimal control of hypertension, lipids, glycemia, and intensive lifestyle intervention with exercise, diet, and smoking cessation.
The analysis he presented focused on patients enrolled in the BARI 2D (Bypass Angioplasty Revascularization Investigation in Type 2 Diabetes), which randomized a total of 2,368 patients with diabetes and documented coronary ischemia and stenosis suitable for an elective intervention. The researchers put all these patients on an intensive medical management regimen, and also randomized them to either immediate or deferred revascularization. The study’s primary results showed absolutely identical 5-year outcomes in the two groups, with a mortality rate of 12% in each arm of the study, and a combined rate of death, MI, or stroke of 23% in the immediate revascularization patients and 24% in those with deferred intervention (N. Engl. J. Med. 2009;360:2503-15).
Among the 1,192 patients in the deferred subgroup, 13% required PCI or bypass surgery after 6 months, and 40% needed revascularization after 5 years of follow-up. Within the group who eventually had revascularization, 47% required it for worsening angina, 23% because of an acute coronary syndrome event, 18% for worsening ischemia, 6% for progression of their coronary disease, and the remaining 6% for another reason. The current analysis aimed to determine whether "we can identify patients with such a high likelihood of needing revascularization that it need not be deferred," Dr. Krone said.
The average age of the patients in the deferred revascularization group was 62 years; 30% were women, 28% were on insulin treatment, 17% had a left ventricular ejection fraction below 50%, and 13% had proximal LAD coronary disease. Their average duration of type 2 diabetes was 11 years.
A multivariate analysis that controlled for age, sex, race, and nationality identified five factors that were linked with a significantly increased rate of revascularization after 6 months: class III or IV stable angina, unstable angina, a systolic blood pressure of 100 mm Hg or less, a blood triglyceride level of 100 mg/dL or less, and proximal LAD disease. These factors were linked with anywhere from a 3.8-fold increased rate of revascularization (in patients with systolic hypotension, compared with patients with a systolic pressure greater than 100 mm Hg) to a 75% increased rate (in patients with proximal LAD disease, compared with those without LAD disease). However, none of these increased rates appeared to justify performing routine, upfront revascularization.
The 5-year multivariate analysis produced similar results. It identified nine baseline factors that each significantly linked with a significantly increased rate of revascularization during 5-year follow-up: class I or II stable angina, class III or IV stable angina, unstable angina, systolic blood pressure of 101-120 mm Hg, a systolic pressure of 100 mm HG or less, a blood triglyceride level of 100 mg/dL or greater, proximal LAD disease, having two diseased coronary regions, or having three diseased coronary regions. The increased rates associated with these features ranged from a 90% increased revascularization rate (in patients with class III or IV stable angina, compared with patients without angina), to a 28% increased revascularization rate (in patients with class I or II stable angina at baseline). Again, none of these increased rates appeared to justify uniform, upfront revascularization, Dr. Krone said.
The sole exception to this approach might possibly be the small number of patients who initially presented with both proximal LAD disease and either class III or IV stable angina or unstable angina, because eventually over 5 years 71% of these patients underwent revascularization. But these patients constituted only 2% of the total group studied, Dr. Krone noted. In general, more severe angina or stenosis was uncommon in these patients: Some 41% had no angina and 45% had class I or II angina at baseline, and 87% were free of proximal LAD disease at baseline.
Dr. Krone said that he had no disclosures.
FROM THE ANNUAL SCIENTIFIC SESSIONS OF THE AMERICAN HEART ASSOCIATION
Major Finding: Few patients with diabetes and documented ischemic coronary disease suitable for elective revascularization have features that predict a high risk for eventually requiring a procedure during the subsequent 5 years. The only possible exception is the 2% of patients with both proximal LAD coronary disease and severe or unstable angina at baseline, who had a 71% revascularization rate.
Data Source: A subgroup analysis of the BARI 2D study, which randomized 2,368 patients with type 2 diabetes and documented ischemic coronary disease suitable for elective revascularization to an immediate or deferred procedure. The new analysis focused on 1,192 patients initially randomized to the delayed revascularization arm.
Disclosures: Dr. Krone said that he had no disclosures.
JAK Inhibitor Ruxolitinib Wins First FDA Approval in Myelofibrosis
In a much-anticipated double milestone, the Food and Drug Administration has approved ruxolitinib for treatment of patients with myelofibrosis.
Ruxolitinib, an orphan drug to be marketed as Jakafi by Incyte Corp., becomes the first agent to be approved for the rare blood disease. The indication covers patients with intermediate or high-risk myelofibrosis (MF), including primary MF, post-polycythemia vera MF, and post-essential thrombocythemia MF, according to a statement from Wilmington, Del.–based Incyte.
The FDA decision also makes ruxolitinib the first approved agent in a new class of drugs called JAK (Janus-associated kinase) inhibitors. Deregulation of signaling in the JAK pathway is believed to be associated with the enlarged spleen and other symptoms of myelofibrosis. Ruxolitinib inhibits the tyrosine kinases JAK1 and JAK2, which are suspected of being up-regulated in various inflammatory disorders and malignancies.
"Jakafi represents another example of an increasing trend in oncology where a detailed scientific understanding of the mechanisms of a disease allows a drug to be directed toward specific molecular pathways," Dr. Richard Pazdur, director of the Office of Hematology and Oncology Products in the FDA’s Center for Drug Evaluation and Research, said in the agency’s announcement.
"The clinical trials leading to this approval focused on problems that patients with myelofibrosis commonly encounter, including enlarged spleens and pain," he noted.
In the pivotal phase III COMFORT-I and COMFORT-II trials, ruxolitinib produced substantial symptom relief in patients who were resistant or refractory to available myelofibrosis therapy or ineligible for allogeneic bone marrow transplantation. All 528 patients in these studies had enlarged spleens (splenomegaly) and other disease-related symptoms. They were assigned to treatment with ruxolitinib, placebo, or best available therapy (usually hydroxyurea or glucocorticoids).
More patients on ruxolitinib had a greater-than-35% reduction in spleen size, compared with those given the alternatives, the FDA noted. Similarly, patients on ruxolitinib were more likely to have a more-than-50% reduction in MF-related symptoms, such as abdominal discomfort, night sweats, itching, and bone or muscle pain, compared with placebo.
The Incyte announcement noted that 41.9% of patients who were treated with ruxolitinib in the COMFORT-I trial had a 35% or greater reduction in spleen volume at 24 weeks, compared with 0.7% of patients taking placebo (P less than 0.0001). The median time to response was less than 4 weeks.
In the COMFORT-II trial, 28.5% of patients who were treated with ruxolitinib had a 35% or greater reduction in spleen volume at 48 weeks, compared with none of the patients in the best available therapy arm, Incyte said. COMFORT-II was conducted by Novartis, which is collaborating with Incyte outside the United States.
Incyte said that the ruxolitinib dosage should be adjusted based on safety and efficacy. The recommended starting dose of ruxolitinib for most patients of 15 mg or 20 mg given orally twice daily based on the patient’s platelet count. A blood cell count must be performed before initiation of therapy, the company said, and complete blood counts should be monitored every 2-4 weeks until doses are stabilized.
Thrombocytopenia, anemia, fatigue, diarrhea, dyspnea, headache, dizziness, and nausea were the most common side effects, according to the FDA.
MGMA, ACMPE Name Hospitalist "Physician Executive of the Year"
Modesty comes naturally to IPC The Hospitalist Co. executive Dave Bowman, MD. He shies from the spotlight and seeks to downplay his own accomplishments in favor of talking about the results of those he works with.
That tack got a bit more difficult last month when Dr. Bowman, based in Tucson, Ariz., received the Medical Group Management Association (MGMA) and American College of Medical Practice Executives' (ACMPE) "Physician Executive of the Year" award for 2011. It's the second year in a row the honor went to an HM leader; last year's winner was IPC chief executive Adam Singer, MD.
Dr. Bowman was praised both for his professional skills and the heroic role he played providing medical aid in the immediate aftermath of the Jan. 8 shooting in Tucson that left six people dead and injured 13 others, including U.S. Rep. Gabrielle Giffords (D-Ariz.)
Dr. Bowman tried to downplay the award until it was presented at a conference last month in Las Vegas. "When I step back and look at it from a non-physician-jaundiced view, that was a pretty neat thing. I was very humbled and grateful," he says.
He quickly adds, though, that the award means those he works with are doing their jobs just as exceptionally.
"You have to have a team to take care of people," he says. "If you're a lone wolf, you can do a good job for your 16 patients that day. But what happens when you leave? ... You have to be part of a team to ensure the good work you’re doing is continued."
Dr. Bowman, IPC's executive director in Tucson, has grown his group's practice to more than 75 physicians and non-physician providers. He notes that all of his providers with at least one year of seniority sit on at least one committee at their institution.
But his most sage advice for hospitalist leaders?
"Get involved, be out there," he says. "Take night call because you have two letters after your name that says you can do it. ... Be involved clinically, not just administratively."
Pediatric Deterioration Risk Score
Thousands of hospitals have implemented rapid response systems in recent years in attempts to reduce mortality outside the intensive care unit (ICU).1 These systems have 2 components, a response arm and an identification arm. The response arm is usually comprised of a multidisciplinary critical care team that responds to calls for urgent assistance outside the ICU; this team is often called a rapid response team or a medical emergency team. The identification arm comes in 2 forms, predictive and detective. Predictive tools estimate a patient's risk of deterioration over time based on factors that are not rapidly changing, such as elements of the patient's history. In contrast, detective tools include highly time‐varying signs of active deterioration, such as vital sign abnormalities.2 To date, most pediatric studies have focused on developing detective tools, including several early warning scores.38
In this study, we sought to identify the characteristics that increase the probability that a hospitalized child will deteriorate, and combine these characteristics into a predictive score. Tools like this may be helpful in identifying and triaging the subset of high‐risk children who should be intensively monitored for early signs of deterioration at the time of admission, as well as in identifying very low‐risk children who, in the absence of other clinical concerns, may be monitored less intensively.
METHODS
Detailed methods, including the inclusion/exclusion criteria, the matching procedures, and a full description of the statistical analysis are provided as an appendix (see Supporting Online Appendix: Supplement to Methods Section in the online version of this article). An abbreviated version follows.
Design
We performed a case‐control study among children, younger than 18 years old, hospitalized for >24 hours between January 1, 2005 and December 31, 2008. The case group consisted of children who experienced clinical deterioration, a composite outcome defined as cardiopulmonary arrest (CPA), acute respiratory compromise (ARC), or urgent ICU transfer, while on a non‐ICU unit. ICU transfers were considered urgent if they included at least one of the following outcomes in the 12 hours after transfer: death, CPA, intubation, initiation of noninvasive ventilation, or administration of a vasoactive medication infusion used for the treatment of shock. The control group consisted of a random sample of patients matched 3:1 to cases if they met the criteria of being on a non‐ICU unit at the same time as their matched case.
Variables and Measurements
We collected data on demographics, complex chronic conditions (CCCs), other patient characteristics, and laboratory studies. CCCs were specific diagnoses divided into the following 9 categories according to an established framework: neuromuscular, cardiovascular, respiratory, renal, gastrointestinal, hematologic/emmmunologic, metabolic, malignancy, and genetic/congenital defects.9 Other patient characteristics evaluated included age, weight‐for‐age, gestational age, history of transplant, time from hospital admission to event, recent ICU stays, administration of total parenteral nutrition, use of a patient‐controlled analgesia pump, and presence of medical devices including central venous lines and enteral tubes (naso‐gastric, gastrostomy, or jejunostomy).
Laboratory studies evaluated included hemoglobin value, white blood cell count, and blood culture drawn in the preceding 72 hours. We included these laboratory studies in this predictive score because we hypothesized that they represented factors that increased a child's risk of deterioration over time, as opposed to signs of acute deterioration that would be more appropriate for a detective score.
Statistical Analysis
We used conditional logistic regression for the bivariable and multivariable analyses to account for the matching. We derived the predictive score using an established method10 in which the regression coefficients for each covariate were divided by the smallest coefficient, and then rounded to the nearest integer, to establish each variable's sub‐score. We grouped the total scores into very low, low, intermediate, and high‐risk groups, calculated overall stratum‐specific likelihood ratios (SSLRs), and estimated stratum‐specific probabilities of deterioration for each group.
RESULTS
Patient Characteristics
We identified 12 CPAs, 41 ARCs, and 699 urgent ICU transfers during the study period. A total of 141 cases met our strict criteria for inclusion (see Figure in Supporting Online Appendix: Supplement to Methods Section in the online version of this article) among approximately 96,000 admissions during the study period, making the baseline incidence of events (pre‐test probability) approximately 0.15%. The case and control groups were similar in age, sex, and family‐reported race/ethnicity. Cases had been hospitalized longer than controls at the time of their event, were less likely to have been on a surgical service, and were less likely to survive to hospital discharge (Table 1). There was a high prevalence of CCCs among both cases and controls; 78% of cases and 52% of controls had at least 1 CCC.
| Cases (n = 141) | Controls (n = 423) | ||
|---|---|---|---|
| n (%) | n (%) | P Value | |
| |||
| Type of event | |||
| Cardiopulmonary arrest | 4 (3) | 0 | NA |
| Acute respiratory compromise | 29 (20) | 0 | NA |
| Urgent ICU transfer | 108 (77) | 0 | NA |
| Demographics | |||
| Age | 0.34 | ||
| 0‐6 mo | 17 (12) | 62 (15) | |
| 6‐12 mo | 22 (16) | 41 (10) | |
| 1‐4 yr | 34 (24) | 97 (23) | |
| 4‐10 yr | 26 (18) | 78 (18) | |
| 10‐18 yr | 42 (30) | 145 (34) | |
| Sex | 0.70 | ||
| Female | 60 (43) | 188 (44) | |
| Male | 81 (57) | 235 (56) | |
| Race | 0.40 | ||
| White | 69 (49) | 189 (45) | |
| Black/African‐American | 49 (35) | 163 (38) | |
| Asian/Pacific Islander | 0 (0) | 7 (2) | |
| Other | 23 (16) | 62 (15) | |
| Not reported | 0 (0) | 2 (1) | |
| Ethnicity | 0.53 | ||
| Non‐Hispanic | 127 (90) | 388 (92) | |
| Hispanic | 14 (10) | 33 (8) | |
| Unknown/not reported | 0 (0) | 2 (1) | |
| Hospitalization | |||
| Length of stay in days, median (interquartile range) | 7.8 (2.6‐18.2) | 3.9 (1.9‐11.2) | 0.001 |
| Surgical service | 4 (3) | 67 (16) | 0.001 |
| Survived to hospital discharge | 107 (76) | 421 (99.5) | 0.001 |
Unadjusted (Bivariable) Analysis
Results of bivariable analysis are shown in Table 2.
| Variable | Cases n (%) | Controls n (%) | OR* | 95% CI | P Value |
|---|---|---|---|---|---|
| |||||
| Complex chronic conditions categories | |||||
| Congenital/genetic | 19 (13) | 21 (5) | 3.0 | 1.6‐5.8 | 0.001 |
| Neuromuscular | 31 (22) | 48 (11) | 2.2 | 1.3‐3.7 | 0.002 |
| Respiratory | 18 (13) | 27 (6) | 2.0 | 1.1‐3.7 | 0.02 |
| Cardiovascular | 15 (10) | 24 (6) | 2.0 | 1.0‐3.9 | 0.05 |
| Metabolic | 5 (3) | 6 (1) | 2.5 | 0.8‐8.2 | 0.13 |
| Gastrointestinal | 10 (7) | 24 (6) | 1.3 | 0.6‐2.7 | 0.54 |
| Renal | 3 (2) | 8 (2) | 1.1 | 0.3‐4.2 | 0.86 |
| Hematology/emmmunodeficiency | 6 (4) | 19 (4) | 0.9 | 0.4‐2.4 | 0.91 |
| Specific conditions | |||||
| Mental retardation | 21 (15) | 25 (6) | 2.7 | 1.5‐4.9 | 0.001 |
| Malignancy | 49 (35) | 90 (21) | 1.9 | 1.3‐2.8 | 0.002 |
| Epilepsy | 22 (15) | 30 (7) | 2.4 | 1.3‐4.3 | 0.004 |
| Cardiac malformations | 14 (10) | 19 (4) | 2.2 | 1.1‐4.4 | 0.02 |
| Chronic respiratory disease arising in the perinatal period | 11 (8) | 15 (4) | 2.2 | 1.0‐4.8 | 0.05 |
| Cerebral palsy | 7 (5) | 13 (3) | 1.7 | 0.6‐4.2 | 0.30 |
| Cystic fibrosis | 1 (1) | 9 (2) | 0.3 | 0.1‐2.6 | 0.30 |
| Other patient characteristics | |||||
| Time from hospital admission to event 7 days | 74 (52) | 146 (35) | 2.1 | 1.4‐3.1 | 0.001 |
| History of any transplant | 27 (19) | 17 (4) | 5.7 | 2.9‐11.1 | 0.001 |
| Enteral tube | 65 (46) | 102 (24) | 2.6 | 1.8‐3.9 | 0.001 |
| Hospitalized in an intensive care unit during the same admission | 43 (31) | 77 (18) | 2.0 | 1.3‐3.1 | 0.002 |
| Administration of TPN in preceding 24 hr | 26 (18) | 36 (9) | 2.3 | 1.4‐3.9 | 0.002 |
| Administration of an opioid via a patient‐controlled analgesia pump in the preceding 24 hr | 14 (9) | 14 (3) | 3.6 | 1.6‐8.3 | 0.002 |
| Weight‐for‐age 5th percentile | 49 (35) | 94 (22) | 1.9 | 1.2‐2.9 | 0.003 |
| Central venous line | 55 (39) | 113 (27) | 1.8 | 1.2‐2.7 | 0.005 |
| Age 1 yr | 39 (28) | 103 (24) | 1.2 | 0.8‐1.9 | 0.42 |
| Gestational age 37 wk or documentation of prematurity | 21 (15) | 60 (14) | 1.1 | 0.6‐1.8 | 0.84 |
| Laboratory studies | |||||
| Hemoglobin in preceding 72 hr | |||||
| Not tested | 28 (20) | 190 (45) | 1.0 | [reference] | |
| 10 g/dL | 42 (30) | 144 (34) | 2.0 | 1.2‐3.5 | 0.01 |
| 10 g/dL | 71 (50) | 89 (21) | 5.6 | 3.3‐9.5 | 0.001 |
| White blood cell count in preceding 72 hr | |||||
| Not tested | 28 (20) | 190 (45) | 1.0 | [reference] | |
| 5000 to 15,000/l | 45 (32) | 131 (31) | 2.4 | 1.4‐4.1 | 0.001 |
| 15,000/l | 19 (13) | 25 (6) | 5.7 | 2.7‐12.0 | 0.001 |
| 5000/l | 49 (35) | 77 (18) | 4.5 | 2.6‐7.8 | 0.001 |
| Blood culture drawn in preceding 72 hr | 78 (55) | 85 (20) | 5.2 | 3.3‐8.1 | 0.001 |
Adjusted (Multivariable) Analysis
The multivariable conditional logistic regression model included 7 independent risk factors for deterioration (Table 3): age 1 year, epilepsy, congenital/genetic defects, history of transplant, enteral tubes, hemoglobin 10 g/dL, and blood culture drawn in the preceding 72 hours.
| Predictor | Adjusted OR (95% CI) | P Value | Regression Coefficient (95% CI) | Score* |
|---|---|---|---|---|
| ||||
| Age 1 yr | 1.9 (1.0‐3.4) | 0.038 | 0.6 (0.1‐1.2) | 1 |
| Epilepsy | 4.4 (1.9‐9.8) | 0.001 | 1.5 (0.7‐2.3) | 2 |
| Congenital/genetic defects | 2.1 (0.9‐4.9) | 0.075 | 0.8 (0.1‐1.6) | 1 |
| History of any transplant | 3.0 (1.3‐6.9) | 0.010 | 1.1 (0.3‐1.9) | 2 |
| Enteral tube | 2.1 (1.3‐3.6) | 0.003 | 0.8 (0.3‐1.3) | 1 |
| Hemoglobin 10 g/dL in preceding 72 hr | 3.0 (1.8‐5.1) | 0.001 | 1.1 (0.6‐1.6) | 2 |
| Blood culture drawn in preceding 72 hr | 5.8 (3.3‐10.3) | 0.001 | 1.8 (1.2‐2.3) | 3 |
Predictive Score
The range of the resulting predictive score was 0 to 12. The median score among cases was 4, and the median score among controls was 1 (P 0.001). The area under the receiver operating characteristic curve was 0.78 (95% confidence interval 0.74‐0.83).
We grouped the scores by SSLRs into 4 risk strata and calculated each group's estimated post‐test probability of deterioration based on the pre‐test probability of deterioration of 0.15% (Table 4). The very low‐risk group had a probability of deterioration of 0.06%, less than one‐half the pre‐test probability. The low‐risk group had a probability of deterioration of 0.18%, similar to the pre‐test probability. The intermediate‐risk group had a probability of deterioration of 0.39%, 2.6 times higher than the pre‐test probability. The high‐risk group had a probability of deterioration of 12.60%, 84 times higher than the pre‐test probability.
| Risk stratum | Score range | Cases in stratumn (%) | Controls in stratumn (%) | SSLR (95% CI) | Probability of deterioration (%)* |
|---|---|---|---|---|---|
| |||||
| Very low | 0‐2 | 37 (26) | 288 (68) | 0.4 (0.3‐0.5) | 0.06 |
| Low | 3‐4 | 37 (26) | 94 (22) | 1.2 (0.9‐1.6) | 0.2 |
| Intermediate | 5‐6 | 35 (25) | 40 (9) | 2.6 (1.7‐4.0) | 0.4 |
| High | 7‐12 | 32 (23) | 1 (1) | 96.0 (13.2‐696.2) | 12.6 |
DISCUSSION
Despite the widespread adoption of rapid response systems, we know little about the optimal methods to identify patients whose clinical characteristics alone put them at increased risk of deterioration, and triage the care they receive based on this risk. Pediatric case series have suggested that younger children and those with chronic illnesses are more likely to require assistance from a medical emergency team,1112 but this is the first study to measure their association with this outcome in children.
Most studies with the objective of identifying patients at risk have focused on tools designed to detect symptoms of deterioration that have already begun, using single‐parameter medical emergency team calling criteria1316 or multi‐parameter early warning scores.38 Rather than create a tool to detect deterioration that has already begun, we developed a predictive score that incorporates patient characteristics independently associated with deterioration in hospitalized children, including age 1 year, epilepsy, congenital/genetic defects, history of transplant, enteral tube, hemoglobin 10 g/dL, and blood culture drawn in the preceding 72 hours. The score has the potential to help clinicians identify the children at highest risk of deterioration who might benefit most from the use of vital sign‐based methods to detect deterioration, as well as the children at lowest risk for whom monitoring may be unnecessary. For example, this score could be performed at the time of admission, and those at very low risk of deterioration and without other clinically concerning findings might be considered for a low‐intensity schedule of vital signs and monitoring (such as vital signs every 8 hours, no continuous cardiorespiratory monitoring or pulse oximetry, and early warning score calculation daily), while patients in the intermediate and high‐risk groups might be considered for a more intensive schedule of vital signs and monitoring (such as vital signs every 4 hours, continuous cardiorespiratory monitoring and pulse oximetry, and early warning score calculation every 4 hours). It should be noted, however, that 37 cases (26%) fell into the very low‐risk category, raising the importance of external validation at the point of admission from the emergency department, before the score can be implemented for the potential clinical use described above. If the score performs well in validation studies, then its use in tailoring monitoring parameters has the potential to reduce the amount of time nurses spend responding to false monitor alarms and calculating early warning scores on patients at very low risk of deterioration.
Of note, we excluded children hospitalized for fewer than 24 hours, resulting in the exclusion of 31% of the potentially eligible events. We also excluded 40% of the potentially eligible ICU transfers because they did not meet urgent criteria. These may be limitations because: (1) the first 24 hours of hospitalization may be a high‐risk period; and (2) patients who were on trajectories toward severe deterioration and received interventions that prevented further deterioration, but did not meet urgent criteria, were excluded. It may be that the children we included as cases were at increased risk of deterioration that is either more difficult to recognize early, or more difficult to treat effectively without ICU interventions. In addition, the population of patients meeting urgent criteria may vary across hospitals, limiting generalizability of this score.
In summary, we developed a predictive score and risk stratification tool that may be useful in triaging the intensity of monitoring and surveillance for deterioration that children receive when hospitalized on non‐ICU units. External validation using the setting and frequency of score measurement that would be most valuable clinically (for example, in the emergency department at the time of admission) is needed before clinical use can be recommended.
Acknowledgements
The authors thank Annie Chung, BA, Emily Huang, and Susan Lipsett, MD, for their assistance with data collection.
- Institute for Healthcare Improvement. About IHI. Available at: http://www.ihi.org/ihi/about. Accessed July 18,2010.
- ,,, et al.“Identifying the hospitalised patient in crisis”—a consensus conference on the afferent limb of Rapid Response Systems.Resuscitation.2010;81(4):375–382.
- ,,.The Pediatric Early Warning System score: a severity of illness score to predict urgent medical need in hospitalized children.J Crit Care.2006;21(3):271–278.
- ,,.Development and initial validation of the Bedside Paediatric Early Warning System score.Crit Care.2009;13(4):R135.
- .Detecting and managing deterioration in children.Paediatr Nurs.2005;17(1):32–35.
- ,,.Promoting care for acutely ill children—development and evaluation of a Paediatric Early Warning Tool.Intensive Crit Care Nurs.2006;22(2):73–81.
- ,,,,.Prospective evaluation of a pediatric inpatient early warning scoring system.J Spec Pediatr Nurs.2009;14(2):79–85.
- ,,,.Prospective cohort study to test the predictability of the Cardiff and Vale paediatric early warning system.Arch Dis Child.2009;94(8):602–606.
- ,,,,,.Deaths attributed to pediatric complex chronic conditions: national trends and implications for supportive care services.Pediatrics.2001;107(6):e99.
- ,,,,.Early prediction of neurological sequelae or death after bacterial meningitis.Acta Paediatr.2002;91(4):391–398.
- ,,,,.Retrospective review of emergency response activations during a 13‐year period at a tertiary care children's hospital.J Hosp Med.2011;6(3):131–135.
- ,,,.Clinical profile of hospitalized children provided with urgent assistance from a medical emergency team.Pediatrics.2008;121(6):e1577–e1584.
- ,,, et al.Implementation of a medical emergency team in a large pediatric teaching hospital prevents respiratory and cardiopulmonary arrests outside the intensive care unit.Pediatr Crit Care Med.2007;8(3):236–246.
- ,,, et al.Effect of a rapid response team on hospital‐wide mortality and code rates outside the ICU in a children's hospital.JAMA.2007;298(19):2267–2274.
- ,,, et al.Transition from a traditional code team to a medical emergency team and categorization of cardiopulmonary arrests in a children's center.Arch Pediatr Adolesc Med.2008;162(2):117–122.
- ,.Reduction of hospital mortality and of preventable cardiac arrest and death on introduction of a pediatric medical emergency team.Pediatr Crit Care Med.2009;10(3):306–312.
Thousands of hospitals have implemented rapid response systems in recent years in attempts to reduce mortality outside the intensive care unit (ICU).1 These systems have 2 components, a response arm and an identification arm. The response arm is usually comprised of a multidisciplinary critical care team that responds to calls for urgent assistance outside the ICU; this team is often called a rapid response team or a medical emergency team. The identification arm comes in 2 forms, predictive and detective. Predictive tools estimate a patient's risk of deterioration over time based on factors that are not rapidly changing, such as elements of the patient's history. In contrast, detective tools include highly time‐varying signs of active deterioration, such as vital sign abnormalities.2 To date, most pediatric studies have focused on developing detective tools, including several early warning scores.38
In this study, we sought to identify the characteristics that increase the probability that a hospitalized child will deteriorate, and combine these characteristics into a predictive score. Tools like this may be helpful in identifying and triaging the subset of high‐risk children who should be intensively monitored for early signs of deterioration at the time of admission, as well as in identifying very low‐risk children who, in the absence of other clinical concerns, may be monitored less intensively.
METHODS
Detailed methods, including the inclusion/exclusion criteria, the matching procedures, and a full description of the statistical analysis are provided as an appendix (see Supporting Online Appendix: Supplement to Methods Section in the online version of this article). An abbreviated version follows.
Design
We performed a case‐control study among children, younger than 18 years old, hospitalized for >24 hours between January 1, 2005 and December 31, 2008. The case group consisted of children who experienced clinical deterioration, a composite outcome defined as cardiopulmonary arrest (CPA), acute respiratory compromise (ARC), or urgent ICU transfer, while on a non‐ICU unit. ICU transfers were considered urgent if they included at least one of the following outcomes in the 12 hours after transfer: death, CPA, intubation, initiation of noninvasive ventilation, or administration of a vasoactive medication infusion used for the treatment of shock. The control group consisted of a random sample of patients matched 3:1 to cases if they met the criteria of being on a non‐ICU unit at the same time as their matched case.
Variables and Measurements
We collected data on demographics, complex chronic conditions (CCCs), other patient characteristics, and laboratory studies. CCCs were specific diagnoses divided into the following 9 categories according to an established framework: neuromuscular, cardiovascular, respiratory, renal, gastrointestinal, hematologic/emmmunologic, metabolic, malignancy, and genetic/congenital defects.9 Other patient characteristics evaluated included age, weight‐for‐age, gestational age, history of transplant, time from hospital admission to event, recent ICU stays, administration of total parenteral nutrition, use of a patient‐controlled analgesia pump, and presence of medical devices including central venous lines and enteral tubes (naso‐gastric, gastrostomy, or jejunostomy).
Laboratory studies evaluated included hemoglobin value, white blood cell count, and blood culture drawn in the preceding 72 hours. We included these laboratory studies in this predictive score because we hypothesized that they represented factors that increased a child's risk of deterioration over time, as opposed to signs of acute deterioration that would be more appropriate for a detective score.
Statistical Analysis
We used conditional logistic regression for the bivariable and multivariable analyses to account for the matching. We derived the predictive score using an established method10 in which the regression coefficients for each covariate were divided by the smallest coefficient, and then rounded to the nearest integer, to establish each variable's sub‐score. We grouped the total scores into very low, low, intermediate, and high‐risk groups, calculated overall stratum‐specific likelihood ratios (SSLRs), and estimated stratum‐specific probabilities of deterioration for each group.
RESULTS
Patient Characteristics
We identified 12 CPAs, 41 ARCs, and 699 urgent ICU transfers during the study period. A total of 141 cases met our strict criteria for inclusion (see Figure in Supporting Online Appendix: Supplement to Methods Section in the online version of this article) among approximately 96,000 admissions during the study period, making the baseline incidence of events (pre‐test probability) approximately 0.15%. The case and control groups were similar in age, sex, and family‐reported race/ethnicity. Cases had been hospitalized longer than controls at the time of their event, were less likely to have been on a surgical service, and were less likely to survive to hospital discharge (Table 1). There was a high prevalence of CCCs among both cases and controls; 78% of cases and 52% of controls had at least 1 CCC.
| Cases (n = 141) | Controls (n = 423) | ||
|---|---|---|---|
| n (%) | n (%) | P Value | |
| |||
| Type of event | |||
| Cardiopulmonary arrest | 4 (3) | 0 | NA |
| Acute respiratory compromise | 29 (20) | 0 | NA |
| Urgent ICU transfer | 108 (77) | 0 | NA |
| Demographics | |||
| Age | 0.34 | ||
| 0‐6 mo | 17 (12) | 62 (15) | |
| 6‐12 mo | 22 (16) | 41 (10) | |
| 1‐4 yr | 34 (24) | 97 (23) | |
| 4‐10 yr | 26 (18) | 78 (18) | |
| 10‐18 yr | 42 (30) | 145 (34) | |
| Sex | 0.70 | ||
| Female | 60 (43) | 188 (44) | |
| Male | 81 (57) | 235 (56) | |
| Race | 0.40 | ||
| White | 69 (49) | 189 (45) | |
| Black/African‐American | 49 (35) | 163 (38) | |
| Asian/Pacific Islander | 0 (0) | 7 (2) | |
| Other | 23 (16) | 62 (15) | |
| Not reported | 0 (0) | 2 (1) | |
| Ethnicity | 0.53 | ||
| Non‐Hispanic | 127 (90) | 388 (92) | |
| Hispanic | 14 (10) | 33 (8) | |
| Unknown/not reported | 0 (0) | 2 (1) | |
| Hospitalization | |||
| Length of stay in days, median (interquartile range) | 7.8 (2.6‐18.2) | 3.9 (1.9‐11.2) | 0.001 |
| Surgical service | 4 (3) | 67 (16) | 0.001 |
| Survived to hospital discharge | 107 (76) | 421 (99.5) | 0.001 |
Unadjusted (Bivariable) Analysis
Results of bivariable analysis are shown in Table 2.
| Variable | Cases n (%) | Controls n (%) | OR* | 95% CI | P Value |
|---|---|---|---|---|---|
| |||||
| Complex chronic conditions categories | |||||
| Congenital/genetic | 19 (13) | 21 (5) | 3.0 | 1.6‐5.8 | 0.001 |
| Neuromuscular | 31 (22) | 48 (11) | 2.2 | 1.3‐3.7 | 0.002 |
| Respiratory | 18 (13) | 27 (6) | 2.0 | 1.1‐3.7 | 0.02 |
| Cardiovascular | 15 (10) | 24 (6) | 2.0 | 1.0‐3.9 | 0.05 |
| Metabolic | 5 (3) | 6 (1) | 2.5 | 0.8‐8.2 | 0.13 |
| Gastrointestinal | 10 (7) | 24 (6) | 1.3 | 0.6‐2.7 | 0.54 |
| Renal | 3 (2) | 8 (2) | 1.1 | 0.3‐4.2 | 0.86 |
| Hematology/emmmunodeficiency | 6 (4) | 19 (4) | 0.9 | 0.4‐2.4 | 0.91 |
| Specific conditions | |||||
| Mental retardation | 21 (15) | 25 (6) | 2.7 | 1.5‐4.9 | 0.001 |
| Malignancy | 49 (35) | 90 (21) | 1.9 | 1.3‐2.8 | 0.002 |
| Epilepsy | 22 (15) | 30 (7) | 2.4 | 1.3‐4.3 | 0.004 |
| Cardiac malformations | 14 (10) | 19 (4) | 2.2 | 1.1‐4.4 | 0.02 |
| Chronic respiratory disease arising in the perinatal period | 11 (8) | 15 (4) | 2.2 | 1.0‐4.8 | 0.05 |
| Cerebral palsy | 7 (5) | 13 (3) | 1.7 | 0.6‐4.2 | 0.30 |
| Cystic fibrosis | 1 (1) | 9 (2) | 0.3 | 0.1‐2.6 | 0.30 |
| Other patient characteristics | |||||
| Time from hospital admission to event 7 days | 74 (52) | 146 (35) | 2.1 | 1.4‐3.1 | 0.001 |
| History of any transplant | 27 (19) | 17 (4) | 5.7 | 2.9‐11.1 | 0.001 |
| Enteral tube | 65 (46) | 102 (24) | 2.6 | 1.8‐3.9 | 0.001 |
| Hospitalized in an intensive care unit during the same admission | 43 (31) | 77 (18) | 2.0 | 1.3‐3.1 | 0.002 |
| Administration of TPN in preceding 24 hr | 26 (18) | 36 (9) | 2.3 | 1.4‐3.9 | 0.002 |
| Administration of an opioid via a patient‐controlled analgesia pump in the preceding 24 hr | 14 (9) | 14 (3) | 3.6 | 1.6‐8.3 | 0.002 |
| Weight‐for‐age 5th percentile | 49 (35) | 94 (22) | 1.9 | 1.2‐2.9 | 0.003 |
| Central venous line | 55 (39) | 113 (27) | 1.8 | 1.2‐2.7 | 0.005 |
| Age 1 yr | 39 (28) | 103 (24) | 1.2 | 0.8‐1.9 | 0.42 |
| Gestational age 37 wk or documentation of prematurity | 21 (15) | 60 (14) | 1.1 | 0.6‐1.8 | 0.84 |
| Laboratory studies | |||||
| Hemoglobin in preceding 72 hr | |||||
| Not tested | 28 (20) | 190 (45) | 1.0 | [reference] | |
| 10 g/dL | 42 (30) | 144 (34) | 2.0 | 1.2‐3.5 | 0.01 |
| 10 g/dL | 71 (50) | 89 (21) | 5.6 | 3.3‐9.5 | 0.001 |
| White blood cell count in preceding 72 hr | |||||
| Not tested | 28 (20) | 190 (45) | 1.0 | [reference] | |
| 5000 to 15,000/l | 45 (32) | 131 (31) | 2.4 | 1.4‐4.1 | 0.001 |
| 15,000/l | 19 (13) | 25 (6) | 5.7 | 2.7‐12.0 | 0.001 |
| 5000/l | 49 (35) | 77 (18) | 4.5 | 2.6‐7.8 | 0.001 |
| Blood culture drawn in preceding 72 hr | 78 (55) | 85 (20) | 5.2 | 3.3‐8.1 | 0.001 |
Adjusted (Multivariable) Analysis
The multivariable conditional logistic regression model included 7 independent risk factors for deterioration (Table 3): age 1 year, epilepsy, congenital/genetic defects, history of transplant, enteral tubes, hemoglobin 10 g/dL, and blood culture drawn in the preceding 72 hours.
| Predictor | Adjusted OR (95% CI) | P Value | Regression Coefficient (95% CI) | Score* |
|---|---|---|---|---|
| ||||
| Age 1 yr | 1.9 (1.0‐3.4) | 0.038 | 0.6 (0.1‐1.2) | 1 |
| Epilepsy | 4.4 (1.9‐9.8) | 0.001 | 1.5 (0.7‐2.3) | 2 |
| Congenital/genetic defects | 2.1 (0.9‐4.9) | 0.075 | 0.8 (0.1‐1.6) | 1 |
| History of any transplant | 3.0 (1.3‐6.9) | 0.010 | 1.1 (0.3‐1.9) | 2 |
| Enteral tube | 2.1 (1.3‐3.6) | 0.003 | 0.8 (0.3‐1.3) | 1 |
| Hemoglobin 10 g/dL in preceding 72 hr | 3.0 (1.8‐5.1) | 0.001 | 1.1 (0.6‐1.6) | 2 |
| Blood culture drawn in preceding 72 hr | 5.8 (3.3‐10.3) | 0.001 | 1.8 (1.2‐2.3) | 3 |
Predictive Score
The range of the resulting predictive score was 0 to 12. The median score among cases was 4, and the median score among controls was 1 (P 0.001). The area under the receiver operating characteristic curve was 0.78 (95% confidence interval 0.74‐0.83).
We grouped the scores by SSLRs into 4 risk strata and calculated each group's estimated post‐test probability of deterioration based on the pre‐test probability of deterioration of 0.15% (Table 4). The very low‐risk group had a probability of deterioration of 0.06%, less than one‐half the pre‐test probability. The low‐risk group had a probability of deterioration of 0.18%, similar to the pre‐test probability. The intermediate‐risk group had a probability of deterioration of 0.39%, 2.6 times higher than the pre‐test probability. The high‐risk group had a probability of deterioration of 12.60%, 84 times higher than the pre‐test probability.
| Risk stratum | Score range | Cases in stratumn (%) | Controls in stratumn (%) | SSLR (95% CI) | Probability of deterioration (%)* |
|---|---|---|---|---|---|
| |||||
| Very low | 0‐2 | 37 (26) | 288 (68) | 0.4 (0.3‐0.5) | 0.06 |
| Low | 3‐4 | 37 (26) | 94 (22) | 1.2 (0.9‐1.6) | 0.2 |
| Intermediate | 5‐6 | 35 (25) | 40 (9) | 2.6 (1.7‐4.0) | 0.4 |
| High | 7‐12 | 32 (23) | 1 (1) | 96.0 (13.2‐696.2) | 12.6 |
DISCUSSION
Despite the widespread adoption of rapid response systems, we know little about the optimal methods to identify patients whose clinical characteristics alone put them at increased risk of deterioration, and triage the care they receive based on this risk. Pediatric case series have suggested that younger children and those with chronic illnesses are more likely to require assistance from a medical emergency team,1112 but this is the first study to measure their association with this outcome in children.
Most studies with the objective of identifying patients at risk have focused on tools designed to detect symptoms of deterioration that have already begun, using single‐parameter medical emergency team calling criteria1316 or multi‐parameter early warning scores.38 Rather than create a tool to detect deterioration that has already begun, we developed a predictive score that incorporates patient characteristics independently associated with deterioration in hospitalized children, including age 1 year, epilepsy, congenital/genetic defects, history of transplant, enteral tube, hemoglobin 10 g/dL, and blood culture drawn in the preceding 72 hours. The score has the potential to help clinicians identify the children at highest risk of deterioration who might benefit most from the use of vital sign‐based methods to detect deterioration, as well as the children at lowest risk for whom monitoring may be unnecessary. For example, this score could be performed at the time of admission, and those at very low risk of deterioration and without other clinically concerning findings might be considered for a low‐intensity schedule of vital signs and monitoring (such as vital signs every 8 hours, no continuous cardiorespiratory monitoring or pulse oximetry, and early warning score calculation daily), while patients in the intermediate and high‐risk groups might be considered for a more intensive schedule of vital signs and monitoring (such as vital signs every 4 hours, continuous cardiorespiratory monitoring and pulse oximetry, and early warning score calculation every 4 hours). It should be noted, however, that 37 cases (26%) fell into the very low‐risk category, raising the importance of external validation at the point of admission from the emergency department, before the score can be implemented for the potential clinical use described above. If the score performs well in validation studies, then its use in tailoring monitoring parameters has the potential to reduce the amount of time nurses spend responding to false monitor alarms and calculating early warning scores on patients at very low risk of deterioration.
Of note, we excluded children hospitalized for fewer than 24 hours, resulting in the exclusion of 31% of the potentially eligible events. We also excluded 40% of the potentially eligible ICU transfers because they did not meet urgent criteria. These may be limitations because: (1) the first 24 hours of hospitalization may be a high‐risk period; and (2) patients who were on trajectories toward severe deterioration and received interventions that prevented further deterioration, but did not meet urgent criteria, were excluded. It may be that the children we included as cases were at increased risk of deterioration that is either more difficult to recognize early, or more difficult to treat effectively without ICU interventions. In addition, the population of patients meeting urgent criteria may vary across hospitals, limiting generalizability of this score.
In summary, we developed a predictive score and risk stratification tool that may be useful in triaging the intensity of monitoring and surveillance for deterioration that children receive when hospitalized on non‐ICU units. External validation using the setting and frequency of score measurement that would be most valuable clinically (for example, in the emergency department at the time of admission) is needed before clinical use can be recommended.
Acknowledgements
The authors thank Annie Chung, BA, Emily Huang, and Susan Lipsett, MD, for their assistance with data collection.
- Institute for Healthcare Improvement. About IHI. Available at: http://www.ihi.org/ihi/about. Accessed July 18,2010.
- ,,, et al.“Identifying the hospitalised patient in crisis”—a consensus conference on the afferent limb of Rapid Response Systems.Resuscitation.2010;81(4):375–382.
- ,,.The Pediatric Early Warning System score: a severity of illness score to predict urgent medical need in hospitalized children.J Crit Care.2006;21(3):271–278.
- ,,.Development and initial validation of the Bedside Paediatric Early Warning System score.Crit Care.2009;13(4):R135.
- .Detecting and managing deterioration in children.Paediatr Nurs.2005;17(1):32–35.
- ,,.Promoting care for acutely ill children—development and evaluation of a Paediatric Early Warning Tool.Intensive Crit Care Nurs.2006;22(2):73–81.
- ,,,,.Prospective evaluation of a pediatric inpatient early warning scoring system.J Spec Pediatr Nurs.2009;14(2):79–85.
- ,,,.Prospective cohort study to test the predictability of the Cardiff and Vale paediatric early warning system.Arch Dis Child.2009;94(8):602–606.
- ,,,,,.Deaths attributed to pediatric complex chronic conditions: national trends and implications for supportive care services.Pediatrics.2001;107(6):e99.
- ,,,,.Early prediction of neurological sequelae or death after bacterial meningitis.Acta Paediatr.2002;91(4):391–398.
- ,,,,.Retrospective review of emergency response activations during a 13‐year period at a tertiary care children's hospital.J Hosp Med.2011;6(3):131–135.
- ,,,.Clinical profile of hospitalized children provided with urgent assistance from a medical emergency team.Pediatrics.2008;121(6):e1577–e1584.
- ,,, et al.Implementation of a medical emergency team in a large pediatric teaching hospital prevents respiratory and cardiopulmonary arrests outside the intensive care unit.Pediatr Crit Care Med.2007;8(3):236–246.
- ,,, et al.Effect of a rapid response team on hospital‐wide mortality and code rates outside the ICU in a children's hospital.JAMA.2007;298(19):2267–2274.
- ,,, et al.Transition from a traditional code team to a medical emergency team and categorization of cardiopulmonary arrests in a children's center.Arch Pediatr Adolesc Med.2008;162(2):117–122.
- ,.Reduction of hospital mortality and of preventable cardiac arrest and death on introduction of a pediatric medical emergency team.Pediatr Crit Care Med.2009;10(3):306–312.
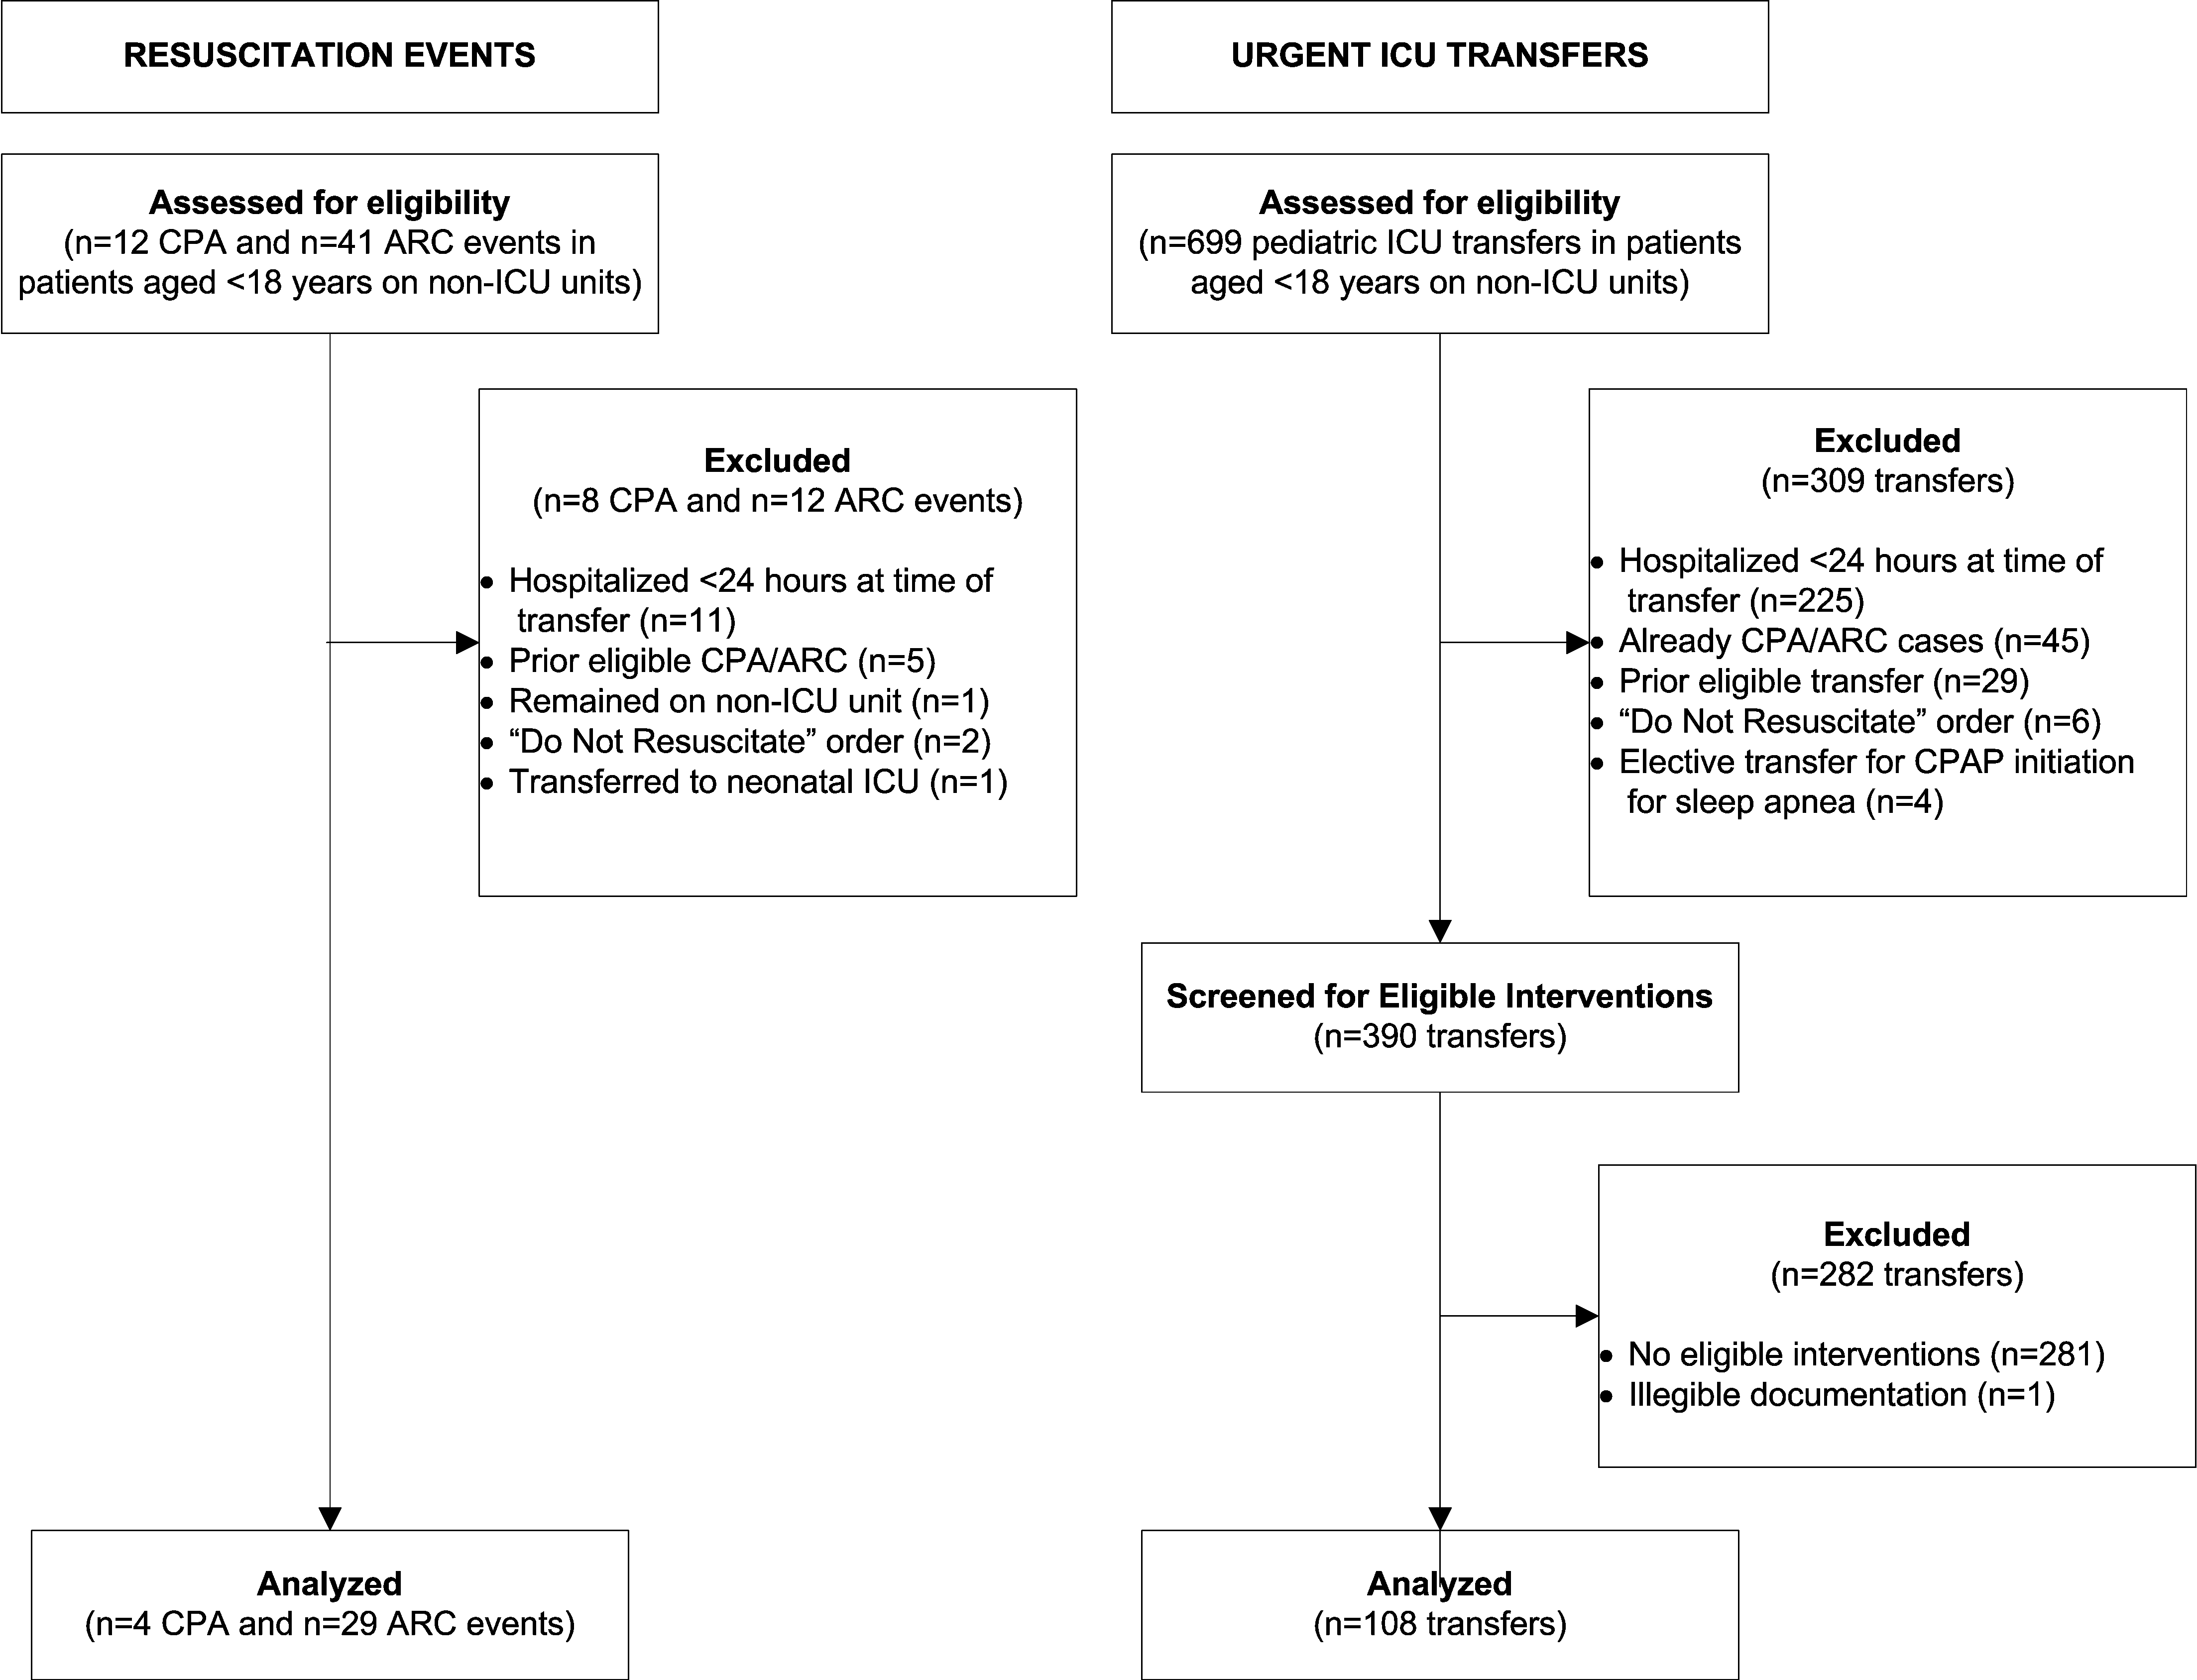
In the Literature: Research You Need to Know
Clinical question: Which clinical decision rule—Wells rule, simplified Wells rule, revised Geneva score, or simplified revised Geneva score—is the best for evaluating a patient with a possible acute pulmonary embolism?
Background: The use of standardized clinical decision rules to determine the probability of an acute pulmonary embolism (PE) has significantly improved the diagnostic evaluation of patients with suspected PE. Several clinical decision rules are available and widely used, but they have not been previously directly compared.
Study design: Prospective cohort.
Setting: Seven hospitals in the Netherlands.
Synopsis: A total of 807 patients with suspected first episode of acute PE had a sequential workup with clinical probability assessment and D-dimer testing. When PE was considered unlikely according to all four clinical decision rules and a normal D-dimer result, PE was excluded. In the remaining patients, a CT scan was used to confirm or exclude the diagnosis.
The prevalence of PE was 23%. Combined with a normal D-dimer, the decision rules excluded PE in 22% to 24% of patients. Thirty percent of patients had discordant decision rule outcomes, but PE was not detected by CT in any of these patients when combined with a normal D-dimer.
This study has practical limitations because management was based on a combination of four decision rules and D-dimer testing rather than only one rule and D-dimer testing, which is the more realistic clinical approach.
Bottom line: When used correctly and in conjunction with a D-dimer result, the Wells rule, simplified Wells rule, revised Geneva score, and simplified revised Geneva score all perform similarly in the exclusion of acute PE.
Citation: Douma RA, Mos IC, Erkens PM, et al. Performance of 4 clinical decision rules in the diagnostic management of acute pulmonary embolism: a prospective cohort study. Ann Intern Med. 2011;154:709-718.
For more of physician reviews of HM-related literature, check out this month's"In the Literature".