User login
Statins for patients with nonalcoholic fatty liver?
Treat patients with hyperlipidemia and presumed nonalcoholic fatty liver disease with atorvastatin to reduce the risk of cardiovascular events.1
STRENGTH OF RECOMMENDATION
B: Based on a single prospective randomized controlled trial (RCT).
Athyros VG, Tziomalos K, Gossios TD, et al. Safety and efficacy of long-term statin treatment for cardiovascular events in patients with coronary heart disease and abnormal liver tests in the Greek Atorvastatin and Coronary Heart Disease Evaluation (GREACE) Study: a post hoc analysis. Lancet. 2010; 376:1916-1922.
ILLUSTRATIVE CASE
An obese 58-year-old man with type 2 diabetes comes to your office for follow-up. His low-density lipoprotein cholesterol (LDL-C) is 130 mg/dL; triglycerides, 300 mg/dL; alanine transaminase (ALT), 110 units/L; and aspartate transaminase (AST), 120 units/L. The patient’s work-up for chronic hepatitis B and C, autoimmune hepatitis, hemochromatosis, and Wilson’s disease are negative, and you rule out alcohol misuse based on his medical history. An ultrasound of the patient’s liver reveals hepatic steatosis, and you diagnose nonalcoholic fatty liver disease (NAFLD). Should you start him on a statin?
Patients with central obesity, diabetes, hypertension, hyperlipidemia, and metabolic syndrome are at high risk of developing NAFLD. These conditions have increased in prevalence, and NAFLD is now the most common cause of liver disease in the United States.2 In Western industrialized countries, approximately 30% of the general population and 70% to 90% of patients with diabetes will develop NAFLD.3 Although most patients are asymptomatic, their liver enzymes are elevated. To diagnose NAFLD, it is necessary to rule out alcoholic hepatitis with a medical history, and viral hepatitis, hereditary hemochromatosis, Wilson’s disease, and autoimmune hepatitis with laboratory testing. Ultrasound reveals fat accumulation in the liver.
Treatment for NAFLD has little evidence of benefit
Patients with NAFLD have a much higher mortality rate than that of the general public, primarily because of cardiovascular disease.4-6 Increased physical activity and weight loss is the only therapy that has solid evidence of a benefit,7 although other treatments, such as insulin-sensitizing drugs (metformin or pioglitazone), may be beneficial.8 Surprisingly, atorvastatin has been found to reduce aminotransferase levels in patients with NAFLD,9,10 but clinicians are often concerned about prescribing a statin for patients with elevated liver enzymes. In one study, 50% of primary care physicians said they would not prescribe statins for patients whose liver enzymes are 1.5× the upper limit of normal (ULN).11
STUDY SUMMARY: Statins lower risk of cardiovascular morbidity and mortality
The Greek Atorvastatin and Coronary Heart Disease Evaluation (GREACE) study was a randomized, prospective open-label, intention-to-treat trial involving 1600 patients. All had established coronary heart disease (CHD), were younger than 75 years, and had triglycerides <400 mg/dL and LDL-C >100 mg/dL. The study reviewed here—evaluating the risk-to-benefit ratio of using a statin to treat hyperlipidemia in patients with NAFLD—was a post hoc analysis of the GREACE study.1
Participants were randomized to either usual care or structured care with atorvastatin, starting at 10 mg/d and adjusted to 80 mg/d to bring the LDL-C level below 100 mg/dL. In the usual care group, treatment included lifestyle changes plus necessary drug treatments (only 30% of those in the usual care group received hyperlipidemia drugs). Patients were followed after medication dose titration, then every 6 months for 3 years. Serum ALT and AST were measured at baseline, at 6 weeks, and every 6 months.
At baseline, mild-to-moderate increases (<3× ULN) in ALT/AST were noted in 437 of the 1600 patients. For these patients, alcoholic hepatitis, chronic hepatitis B and C, Wilson’s disease, and autoimmune hepatitis were excluded by history, laboratory tests, and ultrasound, and the elevated liver enzymes were attributed to NAFLD.
The primary endpoints were the first occurrence of any cardiovascular event, including nonfatal myocardial infarction, revascularization, unstable angina, heart failure, and stroke; all-cause mortality; and CHD mortality. The relative risk (RR) for such events was calculated for the 437 patients with elevated liver enzymes, compared with that of patients without abnormal liver tests. Elevated liver enzymes and liver-related adverse events were secondary endpoints.
A cardiovascular event occurred in 10% (22/227) of the patients with elevated liver enzymes who received a statin, and 30% (63/210) of patients who had elevated liver enzymes but did not receive a statin.
There were 3.2 events per 100 patient-years in the atorvastatin group, compared with 10 events per 100 patient-years in those not on atorvastatin, a 68% reduction in RR (P<.0001) and an NNT of 15 per year to prevent one cardiovascular event. The risk reduction in cardiovascular events was greater in patients with NAFLD (68%) than in patients with normal liver tests (39%).
An added benefit was the reduction in ALT/AST levels during treatment for patients with NAFLD who were taking a statin, an average decrease of 47% in AST levels and 35% in ALT levels. In addition, 89% of the patients in the statin group had normal ALT, AST, and gamma-glutamyl transferase levels by the end of the 3-year follow-up. Patients with NAFLD who did not receive statins had a 12% increase in AST and ALT by the end of the 3-year study.
Only 10 of 880 patients taking statins developed liver enzymes more than 3× ULN. In 3 of these patients, dose adjustments brought the liver enzymes back to normal. Only 7 (<1%) patients who received a statin had to discontinue therapy because of liver-related adverse effects.
WHAT’S NEW: Liver enzymes improve, with few adverse effects
Preliminary studies have shown an improvement in liver enzymes in patients with NAFLD treated with a statin.9,10 This is the first study to show survival benefits and significant reduction in major cardiovascular morbidity for such patients, as well.
This is also the first large-scale study that shows that treating NAFLD patients with a statin decreases liver enzyme levels, with minimal adverse effects.
CAVEATS: Differences in groups, few women could skew results
This study cannot be considered the final word on this topic. Patients in the “structured care” group were followed at a university clinic, while those in the “usual care” group were followed by either a family physician or a cardiologist outside the hospital, based on their choice. There may have been other differences in the care received by the 2 groups that could account for the difference in mortality and morbidity reduction.
In addition, study participants had coronary artery disease, and atorvastatin was not used for primary prevention. Moreover, nearly 80% of the study participants were male, which raises the question of generalizability. And this study was a post hoc analysis of the larger GREACE study, which also raises concerns about the validity of findings.
In the absence of a larger prospective RCT, however, this is the best available evidence to support the use of statins in this population, and suggests that treating patients with NAFLD with statins is safe and effective.
CHALLENGES TO IMPLEMENTATION: Extensive Dx tests are costly
Study participants were evaluated to rule out other causes of their abnormal liver tests, with extensive laboratory tests and an ultrasound evaluation of the liver. Such extensive testing may be cost prohibitive in some situations.
Acknowledgement
The PURLs Surveillance System is supported in part by Grant Number UL1RR024999 from the National Center for Research Resources, a Clinical Translational Science Award to the University of Chicago. The content is solely the responsibility of the authors and does not necessarily represent the official views of the National Center for Research Resources or the National Institutes of Health.
Click here to view PURL METHODOLOGY
1. Athyros VG, Tziomalos K, Gossios TD, et al. Safety and efficacy of long-term statin treatment for cardiovascular events in patients with coronary heart disease and abnormal liver tests in the Greek Atorvastatin and Coronary Heart Disease Evaluation (GREACE) Study: a post hoc analysis. Lancet. 2010;376:1916-1922.
2. Kim CH, Younossi ZM. Nonalcoholic fatty liver disease: a manifestation of the metabolic syndrome. Cleve Clin J Med. 2008;75:721-728.
3. Angulo P. Nonalcoholic fatty liver disease. N Engl J Med. 2002;346:1221-1231.
4. Adams LA, LympJ F, St Sauver J, et al. The natural history of nonalcoholic fatty liver disease: a population-based cohort study. Gastroenterology. 2005;129:113-121.
5. Soderberg C, Stal P, Askling J, et al. Decreased survival of subjects with elevated liver function tests during a 28-year follow-up. Hepatology. 2010;51:595-602.
6. Targher G, Day CP, Bonora E. Risk of cardiovascular diseases in patients with nonalcoholic fatty liver. N Engl J Med. 2010;363:1341-1350.
7. Promrat K, Kleiner DE, Niemeier HM, et al. Randomized controlled trial testing the effects of weight loss on nonalcoholic steatohepatitis. Hepatology. 2010;51:121-129.
8. Angelico F, Burattin M, Alessandri C, et al. Drugs improving insulin resistance for nonalcoholic fatty liver disease and/or non-alcoholic steatohepatitis. Cochrane Database Syst Rev. 2007;(1):CD005166.-
9. Hyogo H, Tazuma S, Arihiro K, et al. Efficacy of atorvastatin for the treatment of nonalcoholic steatohepatitis with dyslipidemia. Metabolism. 2008;57:1711-1718.
10. Georgescu EF, Georgescu M. Therapeutic options in non-alcoholic steatohepatitis (NASH). Are all agents alike? Results of a preliminary study. J Gastrointestin Liver Dis. 2007;16:39-46.
11. Rzouq FS, Volk ML, Hatoum HH, et al. Hepatotoxicity fears contribute to underutilization of statin medications by primary care physicians. Am J Med Sci. 2010;340:89-93.
Treat patients with hyperlipidemia and presumed nonalcoholic fatty liver disease with atorvastatin to reduce the risk of cardiovascular events.1
STRENGTH OF RECOMMENDATION
B: Based on a single prospective randomized controlled trial (RCT).
Athyros VG, Tziomalos K, Gossios TD, et al. Safety and efficacy of long-term statin treatment for cardiovascular events in patients with coronary heart disease and abnormal liver tests in the Greek Atorvastatin and Coronary Heart Disease Evaluation (GREACE) Study: a post hoc analysis. Lancet. 2010; 376:1916-1922.
ILLUSTRATIVE CASE
An obese 58-year-old man with type 2 diabetes comes to your office for follow-up. His low-density lipoprotein cholesterol (LDL-C) is 130 mg/dL; triglycerides, 300 mg/dL; alanine transaminase (ALT), 110 units/L; and aspartate transaminase (AST), 120 units/L. The patient’s work-up for chronic hepatitis B and C, autoimmune hepatitis, hemochromatosis, and Wilson’s disease are negative, and you rule out alcohol misuse based on his medical history. An ultrasound of the patient’s liver reveals hepatic steatosis, and you diagnose nonalcoholic fatty liver disease (NAFLD). Should you start him on a statin?
Patients with central obesity, diabetes, hypertension, hyperlipidemia, and metabolic syndrome are at high risk of developing NAFLD. These conditions have increased in prevalence, and NAFLD is now the most common cause of liver disease in the United States.2 In Western industrialized countries, approximately 30% of the general population and 70% to 90% of patients with diabetes will develop NAFLD.3 Although most patients are asymptomatic, their liver enzymes are elevated. To diagnose NAFLD, it is necessary to rule out alcoholic hepatitis with a medical history, and viral hepatitis, hereditary hemochromatosis, Wilson’s disease, and autoimmune hepatitis with laboratory testing. Ultrasound reveals fat accumulation in the liver.
Treatment for NAFLD has little evidence of benefit
Patients with NAFLD have a much higher mortality rate than that of the general public, primarily because of cardiovascular disease.4-6 Increased physical activity and weight loss is the only therapy that has solid evidence of a benefit,7 although other treatments, such as insulin-sensitizing drugs (metformin or pioglitazone), may be beneficial.8 Surprisingly, atorvastatin has been found to reduce aminotransferase levels in patients with NAFLD,9,10 but clinicians are often concerned about prescribing a statin for patients with elevated liver enzymes. In one study, 50% of primary care physicians said they would not prescribe statins for patients whose liver enzymes are 1.5× the upper limit of normal (ULN).11
STUDY SUMMARY: Statins lower risk of cardiovascular morbidity and mortality
The Greek Atorvastatin and Coronary Heart Disease Evaluation (GREACE) study was a randomized, prospective open-label, intention-to-treat trial involving 1600 patients. All had established coronary heart disease (CHD), were younger than 75 years, and had triglycerides <400 mg/dL and LDL-C >100 mg/dL. The study reviewed here—evaluating the risk-to-benefit ratio of using a statin to treat hyperlipidemia in patients with NAFLD—was a post hoc analysis of the GREACE study.1
Participants were randomized to either usual care or structured care with atorvastatin, starting at 10 mg/d and adjusted to 80 mg/d to bring the LDL-C level below 100 mg/dL. In the usual care group, treatment included lifestyle changes plus necessary drug treatments (only 30% of those in the usual care group received hyperlipidemia drugs). Patients were followed after medication dose titration, then every 6 months for 3 years. Serum ALT and AST were measured at baseline, at 6 weeks, and every 6 months.
At baseline, mild-to-moderate increases (<3× ULN) in ALT/AST were noted in 437 of the 1600 patients. For these patients, alcoholic hepatitis, chronic hepatitis B and C, Wilson’s disease, and autoimmune hepatitis were excluded by history, laboratory tests, and ultrasound, and the elevated liver enzymes were attributed to NAFLD.
The primary endpoints were the first occurrence of any cardiovascular event, including nonfatal myocardial infarction, revascularization, unstable angina, heart failure, and stroke; all-cause mortality; and CHD mortality. The relative risk (RR) for such events was calculated for the 437 patients with elevated liver enzymes, compared with that of patients without abnormal liver tests. Elevated liver enzymes and liver-related adverse events were secondary endpoints.
A cardiovascular event occurred in 10% (22/227) of the patients with elevated liver enzymes who received a statin, and 30% (63/210) of patients who had elevated liver enzymes but did not receive a statin.
There were 3.2 events per 100 patient-years in the atorvastatin group, compared with 10 events per 100 patient-years in those not on atorvastatin, a 68% reduction in RR (P<.0001) and an NNT of 15 per year to prevent one cardiovascular event. The risk reduction in cardiovascular events was greater in patients with NAFLD (68%) than in patients with normal liver tests (39%).
An added benefit was the reduction in ALT/AST levels during treatment for patients with NAFLD who were taking a statin, an average decrease of 47% in AST levels and 35% in ALT levels. In addition, 89% of the patients in the statin group had normal ALT, AST, and gamma-glutamyl transferase levels by the end of the 3-year follow-up. Patients with NAFLD who did not receive statins had a 12% increase in AST and ALT by the end of the 3-year study.
Only 10 of 880 patients taking statins developed liver enzymes more than 3× ULN. In 3 of these patients, dose adjustments brought the liver enzymes back to normal. Only 7 (<1%) patients who received a statin had to discontinue therapy because of liver-related adverse effects.
WHAT’S NEW: Liver enzymes improve, with few adverse effects
Preliminary studies have shown an improvement in liver enzymes in patients with NAFLD treated with a statin.9,10 This is the first study to show survival benefits and significant reduction in major cardiovascular morbidity for such patients, as well.
This is also the first large-scale study that shows that treating NAFLD patients with a statin decreases liver enzyme levels, with minimal adverse effects.
CAVEATS: Differences in groups, few women could skew results
This study cannot be considered the final word on this topic. Patients in the “structured care” group were followed at a university clinic, while those in the “usual care” group were followed by either a family physician or a cardiologist outside the hospital, based on their choice. There may have been other differences in the care received by the 2 groups that could account for the difference in mortality and morbidity reduction.
In addition, study participants had coronary artery disease, and atorvastatin was not used for primary prevention. Moreover, nearly 80% of the study participants were male, which raises the question of generalizability. And this study was a post hoc analysis of the larger GREACE study, which also raises concerns about the validity of findings.
In the absence of a larger prospective RCT, however, this is the best available evidence to support the use of statins in this population, and suggests that treating patients with NAFLD with statins is safe and effective.
CHALLENGES TO IMPLEMENTATION: Extensive Dx tests are costly
Study participants were evaluated to rule out other causes of their abnormal liver tests, with extensive laboratory tests and an ultrasound evaluation of the liver. Such extensive testing may be cost prohibitive in some situations.
Acknowledgement
The PURLs Surveillance System is supported in part by Grant Number UL1RR024999 from the National Center for Research Resources, a Clinical Translational Science Award to the University of Chicago. The content is solely the responsibility of the authors and does not necessarily represent the official views of the National Center for Research Resources or the National Institutes of Health.
Click here to view PURL METHODOLOGY
1. Athyros VG, Tziomalos K, Gossios TD, et al. Safety and efficacy of long-term statin treatment for cardiovascular events in patients with coronary heart disease and abnormal liver tests in the Greek Atorvastatin and Coronary Heart Disease Evaluation (GREACE) Study: a post hoc analysis. Lancet. 2010;376:1916-1922.
2. Kim CH, Younossi ZM. Nonalcoholic fatty liver disease: a manifestation of the metabolic syndrome. Cleve Clin J Med. 2008;75:721-728.
3. Angulo P. Nonalcoholic fatty liver disease. N Engl J Med. 2002;346:1221-1231.
4. Adams LA, LympJ F, St Sauver J, et al. The natural history of nonalcoholic fatty liver disease: a population-based cohort study. Gastroenterology. 2005;129:113-121.
5. Soderberg C, Stal P, Askling J, et al. Decreased survival of subjects with elevated liver function tests during a 28-year follow-up. Hepatology. 2010;51:595-602.
6. Targher G, Day CP, Bonora E. Risk of cardiovascular diseases in patients with nonalcoholic fatty liver. N Engl J Med. 2010;363:1341-1350.
7. Promrat K, Kleiner DE, Niemeier HM, et al. Randomized controlled trial testing the effects of weight loss on nonalcoholic steatohepatitis. Hepatology. 2010;51:121-129.
8. Angelico F, Burattin M, Alessandri C, et al. Drugs improving insulin resistance for nonalcoholic fatty liver disease and/or non-alcoholic steatohepatitis. Cochrane Database Syst Rev. 2007;(1):CD005166.-
9. Hyogo H, Tazuma S, Arihiro K, et al. Efficacy of atorvastatin for the treatment of nonalcoholic steatohepatitis with dyslipidemia. Metabolism. 2008;57:1711-1718.
10. Georgescu EF, Georgescu M. Therapeutic options in non-alcoholic steatohepatitis (NASH). Are all agents alike? Results of a preliminary study. J Gastrointestin Liver Dis. 2007;16:39-46.
11. Rzouq FS, Volk ML, Hatoum HH, et al. Hepatotoxicity fears contribute to underutilization of statin medications by primary care physicians. Am J Med Sci. 2010;340:89-93.
Copyright © 2011 The Family Physicians Inquiries Network.
All rights reserved.
A stroke—or something else?
A 54-year-old white woman with a history of a cerebrovascular accident (CVA) a year earlier sought care at the local emergency department for numbness and weakness in her right foot. She reported no other neurologic symptoms. She had mild weakness in her right leg and a mildly unsteady gait. Her neurologic examination was otherwise normal.
Initial testing included a complete blood count (CBC), renal profile, and thyroid-stimulating hormone measurement. All results were normal. A noncontrast computed tomography (CT) scan of the head was normal. We admitted her for further evaluation of probable acute ischemic stroke.
By the following day, the patient’s leg weakness and unsteadiness had worsened. A magnetic resonance imaging (MRI) scan of her head showed a prior left pontine infarct, but no new findings. She developed right arm weakness, and an MRI scan of her spine (FIGURE 1) showed multiple intradural lesions. A lumbar puncture showed elevated protein and oligoclonal bands. CT scans of the chest, abdomen, and pelvis were unremarkable. Two lumbar punctures for cytology and culture evaluations yielded negative results. A full-body positron-emission tomography (PET) scan showed diffuse small inguinal adenopathy bilaterally, suggestive of metastatic disease or lymphoma.
FIGURE 1
MRI of the spine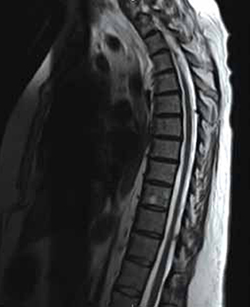
This MRI scan with contrast of the patient’s spine shows diffuse thoracic extramedullary, intradural lesions.
What is your presumptive diagnosis?
Diagnosis: Sarcoidosis
Findings from the full-body PET scan (FIGURE 2) prompted a biopsy of a right inguinal node, which showed a noncaseating granuloma—a hallmark finding of sarcoidosis.
Sarcoidosis is a multisystem disease of unknown cause. The exact prevalence in the general population is estimated at 10 to 20 cases per 100,000.1 A higher incidence occurs in blacks in the United States, with a 2.4% lifetime risk compared with 0.85% of whites.2 Sarcoidosis usually appears in patients ages 20 to 40 years, and although this systemic disease usually affects the lungs, 5% to 10% of patients will have nervous system involvement.3,4
FIGURE 2
Full-body PET scan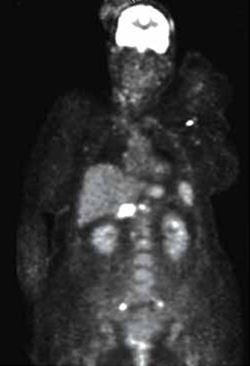
This PET scan shows diffuse hypermetabolic adenopathy with bilateral iliac adenopathy, small hypermetabolic bilateral cervical lymph nodes, a hypermetabolic left axillary node, and a large hypermetabolic portacaval node.
What you’ll see
The most common presenting symptoms of systemic sarcoidosis are chronic cough, shortness of breath, and chest pain. Fatigue, weight loss, and myalgias are also frequently part of the initial presentation.
Patients with sarcoidosis can present with neurologic symptoms suggestive of many diseases (TABLE 1), and in the absence of systemic symptoms the diagnosis of neurosarcoidosis is easily confused with CVA. Most patients with neurosarcoidosis have cranial nerve involvement (50%-75%).1 Other common presentations include seizures, meningitis, psychiatric symptoms, mass lesions, or endocrine abnormalities.
TABLE 1
Differential diagnosis of an acute neurologic event
| Infectious Encephalitis Helminthic infection HIV Lyme disease Meningitis Progressive multifocal leukoencephalopathy Syphilis Tuberculosis |
| Neoplastic CNS lymphoma Meningioma/glioma Metastatic disease |
| Neurologic CNS vasculitis Cranial nerve palsy Ischemic or hemorrhagic stroke Meningitis/encephalitis Multiple sclerosis Neurosarcoidosis Peripheral neuropathy Seizure |
| Psychiatric Depression Malingering Pseudoseizures Somatoform disorder |
| Rheumatologic Lupus erythematosus |
| CNS, central nervous system; HIV, human immunodeficiency virus |
Useful studies in the clinical evaluation
Consider a diagnosis of sarcoidosis involving the nervous system when an initial work-up for CVA is negative. In addition to asking about systemic symptoms, perform a complete neurologic exam and skin exam, search for lymphadenopathy, and conduct an ophthalmologic evaluation. After the initial evaluation, a neurology consult will likely be needed to guide further testing.
Choice of serum studies will vary depending on presenting symptoms, but they usually include tests for infection (CBC, cultures, Lyme titers, rapid plasma reagin, tuberculin skin test), rheumatologic disorders (antinuclear antibodies, erythrocyte sedimentation rate, C-reactive protein), and neoplastic diseases (lactate dehydrogenase, peripheral smear).5 Serum angiotensin-converting enzyme (ACE) may be useful in the diagnosis of systemic sarcoidosis, with positive results seen in approximately 75% of cases.3
Examination of cerebrospinal fluid often reveals an elevated total protein with oligoclonal bands, normal to low glucose, and possibly mild pleocytosis of monocytic or lymphocytic predominance.3 Spinal fluid ACE is neither sensitive nor specific for neurosarcoidosis, as it may be elevated in infectious or malignant processes.3
Imaging studies should include contrast-enhanced brain MRI, which may reveal multiple white matter lesions.6 Although the specificity of PET for neurosarcoidosis is poor—with positive results being seen also in infectious and neoplastic processes—the scan may help in identifying extraneural sites for biopsy. Histology will generally show the classic noncaseating granuloma with surrounding lymphocytes, plasma cells, and mast cells.
Treat with high-dose steroids
The mainstay of treatment, based largely on expert opinion, is high-dose steroids that are gradually tapered over weeks (TABLE 2). Other agents may be added if the condition is poorly controlled with steroids alone, or may be given if symptoms recur while tapering the steroid dose. Recurrence of sarcoidosis is common after doses of <10 to 20 mg/d. Prophylactic measures to counteract the adverse effects of long-term steroid use include weight-bearing exercise programs; administration of calcium, vitamin D, and bisphosphonates; and resorting to a stress-dose steroid regimen in times of illness.
The prognosis with sarcoidosis can vary widely. Case studies show that two-thirds of patients may have a nonrecurring illness. Among the remaining one-third, the disease course may be relapsing-remitting or progressive. When confronted with an acute neurologic event, consider recurrent sarcoidosis and coordinate care between specialists. Also, take steps to prevent complications related to prolonged steroid use.
TABLE 2
Treatment of neurosarcoidosis3
| Medication* | Side effects | Comments |
|---|---|---|
| Methylprednisolone | Hyperglycemia | |
| Prednisone | Osteoporosis, hyperglycemia, hypertension, diabetes, glaucoma, cataracts, psychosis, Cushing’s syndrome | Taper as able. Concomitant use of cytotoxic agents may facilitate taper. Monitor glucose and give calcium/vitamin D prophylaxis |
| Methotrexate | Anemia, neutropenia, liver damage | Weekly dosing well tolerated. Give folic acid 1 mg/d. Monitor liver function tests periodically |
| Cyclosporine | Renal insufficiency, hypertension | |
| Azathioprine | Anemia, neutropenia, liver damage | |
| Cyclophosphamide | Cystitis, neutropenia | Monitor urine monthly for microscopic hematuria |
| Hydroxychloroquine | Retinopathy, hypoglycemia, ototoxicity, myopathy, cardiomyopathy, neuropathy | Refer for eye exams every 3-6 months. May be useful to counteract hyperglycemic effect of steroids |
| Infliximab | Fever, headache, dizziness, flushing, abdominal pain, dyspepsia, myalgia, arthralgia, polyneuropathy | Screen for tuberculosis before starting treatment. Contraindicated in patients with congestive heart failure |
| *For dosing details, consult a neurologist or rheumatologist | ||
Improvement for our patient
Based on cerebrospinal fluid study results, a positive peripheral lymph node biopsy, and the exclusion of other diagnoses, we regarded the diagnosis of sarcoidosis as highly probable and initiated high-dose intravenous corticosteroids. Over several weeks, our patient gradually improved with physical therapy and was walking unassisted at the time of discharge from a hospital-based rehabilitation unit. Repeat MRI scans showed a reduction in the size of her intradural lesions, and we slowly tapered her steroids.
CORRESPONDENCE
Hillary R. Mount, MD, 2123 Auburn Avenue,#340, Cincinnati, OH 45219; [email protected]
1. Joseph FG, Scolding NJ. Sarcoidosis of the nervous system. Pract Neurol. 2007;7:234-244.
2. Burns TM. Neurosarcoidosis. Arch Neurol. 2003;60:1166-1168.
3. Hoitsma E, Drent M, Sharma OP. A pragmatic approach to diagnosing and treating neurosarcoidosis in the 21st century. Curr Opin Pulm Med. 2010;16:472-479.
4. Habersberger J, Manins V, Taylor AJ. Cardiac sarcoidosis. Intern Med J. 2008;38:270-277.
5. Vargas DL, Stern BJ. Neurosarcoidosis: diagnosis and management. Semin Respir Crit Care Med. 2010;31:419-427.
6. Cavazza A, Harari S, Caminati A, et al. The histology of pulmonary sarcoidosis: a review with particular emphasis on unusual and underrecognized features. Int J Surg Pathol. 2009;17:219-230.
A 54-year-old white woman with a history of a cerebrovascular accident (CVA) a year earlier sought care at the local emergency department for numbness and weakness in her right foot. She reported no other neurologic symptoms. She had mild weakness in her right leg and a mildly unsteady gait. Her neurologic examination was otherwise normal.
Initial testing included a complete blood count (CBC), renal profile, and thyroid-stimulating hormone measurement. All results were normal. A noncontrast computed tomography (CT) scan of the head was normal. We admitted her for further evaluation of probable acute ischemic stroke.
By the following day, the patient’s leg weakness and unsteadiness had worsened. A magnetic resonance imaging (MRI) scan of her head showed a prior left pontine infarct, but no new findings. She developed right arm weakness, and an MRI scan of her spine (FIGURE 1) showed multiple intradural lesions. A lumbar puncture showed elevated protein and oligoclonal bands. CT scans of the chest, abdomen, and pelvis were unremarkable. Two lumbar punctures for cytology and culture evaluations yielded negative results. A full-body positron-emission tomography (PET) scan showed diffuse small inguinal adenopathy bilaterally, suggestive of metastatic disease or lymphoma.
FIGURE 1
MRI of the spine
This MRI scan with contrast of the patient’s spine shows diffuse thoracic extramedullary, intradural lesions.
What is your presumptive diagnosis?
Diagnosis: Sarcoidosis
Findings from the full-body PET scan (FIGURE 2) prompted a biopsy of a right inguinal node, which showed a noncaseating granuloma—a hallmark finding of sarcoidosis.
Sarcoidosis is a multisystem disease of unknown cause. The exact prevalence in the general population is estimated at 10 to 20 cases per 100,000.1 A higher incidence occurs in blacks in the United States, with a 2.4% lifetime risk compared with 0.85% of whites.2 Sarcoidosis usually appears in patients ages 20 to 40 years, and although this systemic disease usually affects the lungs, 5% to 10% of patients will have nervous system involvement.3,4
FIGURE 2
Full-body PET scan
This PET scan shows diffuse hypermetabolic adenopathy with bilateral iliac adenopathy, small hypermetabolic bilateral cervical lymph nodes, a hypermetabolic left axillary node, and a large hypermetabolic portacaval node.
What you’ll see
The most common presenting symptoms of systemic sarcoidosis are chronic cough, shortness of breath, and chest pain. Fatigue, weight loss, and myalgias are also frequently part of the initial presentation.
Patients with sarcoidosis can present with neurologic symptoms suggestive of many diseases (TABLE 1), and in the absence of systemic symptoms the diagnosis of neurosarcoidosis is easily confused with CVA. Most patients with neurosarcoidosis have cranial nerve involvement (50%-75%).1 Other common presentations include seizures, meningitis, psychiatric symptoms, mass lesions, or endocrine abnormalities.
TABLE 1
Differential diagnosis of an acute neurologic event
| Infectious Encephalitis Helminthic infection HIV Lyme disease Meningitis Progressive multifocal leukoencephalopathy Syphilis Tuberculosis |
| Neoplastic CNS lymphoma Meningioma/glioma Metastatic disease |
| Neurologic CNS vasculitis Cranial nerve palsy Ischemic or hemorrhagic stroke Meningitis/encephalitis Multiple sclerosis Neurosarcoidosis Peripheral neuropathy Seizure |
| Psychiatric Depression Malingering Pseudoseizures Somatoform disorder |
| Rheumatologic Lupus erythematosus |
| CNS, central nervous system; HIV, human immunodeficiency virus |
Useful studies in the clinical evaluation
Consider a diagnosis of sarcoidosis involving the nervous system when an initial work-up for CVA is negative. In addition to asking about systemic symptoms, perform a complete neurologic exam and skin exam, search for lymphadenopathy, and conduct an ophthalmologic evaluation. After the initial evaluation, a neurology consult will likely be needed to guide further testing.
Choice of serum studies will vary depending on presenting symptoms, but they usually include tests for infection (CBC, cultures, Lyme titers, rapid plasma reagin, tuberculin skin test), rheumatologic disorders (antinuclear antibodies, erythrocyte sedimentation rate, C-reactive protein), and neoplastic diseases (lactate dehydrogenase, peripheral smear).5 Serum angiotensin-converting enzyme (ACE) may be useful in the diagnosis of systemic sarcoidosis, with positive results seen in approximately 75% of cases.3
Examination of cerebrospinal fluid often reveals an elevated total protein with oligoclonal bands, normal to low glucose, and possibly mild pleocytosis of monocytic or lymphocytic predominance.3 Spinal fluid ACE is neither sensitive nor specific for neurosarcoidosis, as it may be elevated in infectious or malignant processes.3
Imaging studies should include contrast-enhanced brain MRI, which may reveal multiple white matter lesions.6 Although the specificity of PET for neurosarcoidosis is poor—with positive results being seen also in infectious and neoplastic processes—the scan may help in identifying extraneural sites for biopsy. Histology will generally show the classic noncaseating granuloma with surrounding lymphocytes, plasma cells, and mast cells.
Treat with high-dose steroids
The mainstay of treatment, based largely on expert opinion, is high-dose steroids that are gradually tapered over weeks (TABLE 2). Other agents may be added if the condition is poorly controlled with steroids alone, or may be given if symptoms recur while tapering the steroid dose. Recurrence of sarcoidosis is common after doses of <10 to 20 mg/d. Prophylactic measures to counteract the adverse effects of long-term steroid use include weight-bearing exercise programs; administration of calcium, vitamin D, and bisphosphonates; and resorting to a stress-dose steroid regimen in times of illness.
The prognosis with sarcoidosis can vary widely. Case studies show that two-thirds of patients may have a nonrecurring illness. Among the remaining one-third, the disease course may be relapsing-remitting or progressive. When confronted with an acute neurologic event, consider recurrent sarcoidosis and coordinate care between specialists. Also, take steps to prevent complications related to prolonged steroid use.
TABLE 2
Treatment of neurosarcoidosis3
| Medication* | Side effects | Comments |
|---|---|---|
| Methylprednisolone | Hyperglycemia | |
| Prednisone | Osteoporosis, hyperglycemia, hypertension, diabetes, glaucoma, cataracts, psychosis, Cushing’s syndrome | Taper as able. Concomitant use of cytotoxic agents may facilitate taper. Monitor glucose and give calcium/vitamin D prophylaxis |
| Methotrexate | Anemia, neutropenia, liver damage | Weekly dosing well tolerated. Give folic acid 1 mg/d. Monitor liver function tests periodically |
| Cyclosporine | Renal insufficiency, hypertension | |
| Azathioprine | Anemia, neutropenia, liver damage | |
| Cyclophosphamide | Cystitis, neutropenia | Monitor urine monthly for microscopic hematuria |
| Hydroxychloroquine | Retinopathy, hypoglycemia, ototoxicity, myopathy, cardiomyopathy, neuropathy | Refer for eye exams every 3-6 months. May be useful to counteract hyperglycemic effect of steroids |
| Infliximab | Fever, headache, dizziness, flushing, abdominal pain, dyspepsia, myalgia, arthralgia, polyneuropathy | Screen for tuberculosis before starting treatment. Contraindicated in patients with congestive heart failure |
| *For dosing details, consult a neurologist or rheumatologist | ||
Improvement for our patient
Based on cerebrospinal fluid study results, a positive peripheral lymph node biopsy, and the exclusion of other diagnoses, we regarded the diagnosis of sarcoidosis as highly probable and initiated high-dose intravenous corticosteroids. Over several weeks, our patient gradually improved with physical therapy and was walking unassisted at the time of discharge from a hospital-based rehabilitation unit. Repeat MRI scans showed a reduction in the size of her intradural lesions, and we slowly tapered her steroids.
CORRESPONDENCE
Hillary R. Mount, MD, 2123 Auburn Avenue,#340, Cincinnati, OH 45219; [email protected]
1. Joseph FG, Scolding NJ. Sarcoidosis of the nervous system. Pract Neurol. 2007;7:234-244.
2. Burns TM. Neurosarcoidosis. Arch Neurol. 2003;60:1166-1168.
3. Hoitsma E, Drent M, Sharma OP. A pragmatic approach to diagnosing and treating neurosarcoidosis in the 21st century. Curr Opin Pulm Med. 2010;16:472-479.
4. Habersberger J, Manins V, Taylor AJ. Cardiac sarcoidosis. Intern Med J. 2008;38:270-277.
5. Vargas DL, Stern BJ. Neurosarcoidosis: diagnosis and management. Semin Respir Crit Care Med. 2010;31:419-427.
6. Cavazza A, Harari S, Caminati A, et al. The histology of pulmonary sarcoidosis: a review with particular emphasis on unusual and underrecognized features. Int J Surg Pathol. 2009;17:219-230.
A complex subject
Thank you for your excellent article “Pharmacologic treatment of borderline personality disorder” (Current Psychiatry, August 2011, p. 30-40). This subject is very complex and poorly understood, both in primary diagnosis and the implications it has on other axis I conditions. Your attempts to educate and suggest possible treatment options are appreciated.
Bruce Miller, PA-C
Department of Corrections
VA Medical Center
Sartell, MN
Physician impairment: When should you report?
Discuss this article at www.facebook.com/CurrentPsychiatry
Dear Dr. Mossman:
Lately, a physician colleague has been arriving late for work. He seemed drunk a couple of times, and he’s been making some careless but minor mistakes. When would I have a duty to report him for suspected impairment? He is a longtime friend, which makes me uncomfortable with the prospect of having to report him.—Submitted by “Dr. Z”
Holding ourselves to ethical guidelines and standards of conduct sometimes is hard, but when we become responsible for our colleagues’ behavior, things can get awkward. Yet the responsibilities of practicing medicine include professional self-regulation.1 Failure to monitor ourselves and each other would put the reputation and integrity of the medical profession at risk—not to mention the safety of our patients. Despite this, many physicians are understandably reluctant to report colleagues who appear impaired.
To decide whether you should report a colleague, you must:
- know what behaviors constitute impairment
- understand the duty to report impaired colleagues
- realize reporting colleagues often creates emotional conflict
- understand recovery options and resources available for impaired practitioners.
After we examine these matters, we’ll see what Dr. Z should do.
Impairment defined
Physician impairment is a public health issue that affects not just physicians but their families, colleagues, and patients. In this context, “impairment” means a physical, mental, or substance-related disorder that interferes with a physician’s ability to undertake professional activities competently and safely.2
Although many mental conditions can cause impairment, we focus here on substance abuse, a condition that often leads to functional impairment. Physicians develop addictions at rates at least as high as those in the general population.3 Physicians-in- training—including psychiatric residents—are at particularly high risk for developing stress-related problems, depression, and substance misuse.4,5
Occupational demands, self-criticism, and denial of one’s own distress are common failings among physicians,5 as is self-treatment, which may help explain the high rates of substance misuse among physicians.6 Behaviors that suggest a colleague may be abusing substances and experiencing occupational impairment appear in Table 1.7
Table 1
Signs of physician impairment
| Deteriorating personal hygiene |
| Increased absence from professional functions or duties |
| Emotional lability |
| Appearing sleep-deprived |
| Increased professional errors (eg, prescriptions, dictations, clinical judgment) |
| Not responding to pages or telephone calls |
| Decreased concern for patient well-being |
| Citing unexplained ‘personal problems’ to mask deficits in concentration or patient care |
| Increased patient complaints about quality of care and bedside manner |
| Many ‘accidental’ injuries (possibly contrived to obtain narcotic prescriptions) |
| Source: Reference 7 |
Reporting duties
Doctors and physician health programs have a duty to report impaired colleagues who continue to practice despite reasonable offers of assistance. This obligation appears in professional guidelines (Table 2)2,8 and in laws and regulations governing the practice of medicine. Laws and regulations are similar in spirit across jurisdictions, although the exact wording varies from state to state (Table 3).9-11 Physicians are responsible for being familiar with reporting requirements in states they practice and complying accordingly.
Physicians must follow state guidelines and protocols for reporting a colleague’s impairment. In many situations, an intermediate step—such as notifying a chief of service or a physician health program—might occur before a report of impairment goes to a licensing board. Options for reporting impaired physicians appear in Table 4.2,12
Table 2
Medical associations’ official positions on reporting impairment
| American Medical Association (Policy H-275.952)2 | ‘Physicians have an ethical obligation to report impaired, incompetent, and unethical colleagues.’ |
| Federation of State Medical Boards8 | Physician health programs have ‘a primary commitment to [help] state medical boards … protect the public … [These] programs [should] demonstrate an ongoing track record of ensuring safety to the public and reveal deficiencies if they occur.’ |
Table 3
State medical board rules on reporting physician impairment: 3 examples
| State | Rules |
|---|---|
| California9 | California’s Medical Practice Act contains no mandatory reporting requirement. ‘However, … the Board clearly is concerned about physicians who potentially present a danger to their patients. Reporting an impaired colleague to the Medical Board will allow the Board to ensure adequate protections are in place so a colleague who requires assistance will not harm the public. The Board keeps the sources of complaint information confidential.’ |
| Montana10 | ‘[E]ach licensed physician … shall … report to the board any information … that appears to show that a physician is’ impaired. However, ‘[i]nformation that relates to possible physical or mental impairment connected to [substance misuse or illness] may be reported to’ Montana’s physician rehabilitation program ‘in lieu of reporting directly to the board.’ |
| Ohio11 | ‘Any Board licensee having knowledge’ that a physician is impaired because of substance misuse ‘is required … to report that information to the Board. … [H]owever, … the [impaired] physician’s colleagues may be excused from reporting the physician’s impairment … if the [impaired] physician has completed treatment with a Board approved treatment provider and maintained uninterrupted sobriety, and violated no other provisions of the Ohio Medical Practice Act.’ |
Table 4
Options for reporting impaired colleagues
| Impairment in hospital-based physicians may be reported to the hospital’s in-house impairment program, the hospital’s chief of staff, or another appropriate supervisor (eg, a chief resident) |
| Impairment in physicians with office-based practices may be reported to hospitals where they have privileges or to the state’s physician health program |
| Colleagues who continue to practice despite offers of assistance and referrals for treatment or for whom the above options are not available should be reported to the state licensing board |
| Source: References 2,12 |
Overcoming emotional factors
Doctors facing the need to report an impaired colleague often experience emotional conflicts because the impaired is a mentor, supervisor, trainee, friend, or practice partner. Denial, stigmatization, concerns about practice coverage, and fear of retaliation also can contribute to non-reporting. Although we know a colleague’s substance misuse represents a threat to his patients’ welfare and safety,13 reporting a colleague forces us to overcome our allegiance to a fellow practitioner.
Medical professionals should remember, however, that it is always better to identify and treat illnesses early in their course. When early referrals are not made, doctors afflicted by illness often remain without treatment until more severe impairment causes workplace errors. Withholding information about an impaired colleague from supervisors or state medical boards does a disservice to patients and to the colleague. The colleague’s drug or alcohol problems may worsen, and recovery or acquisition of future licenses might become more difficult or impossible. Initial application for medical licensure in 47 states and the District of Columbia inquire about physicians’ recent history of mental health and substance abuse problems, as well as their functional impairment.14 Even renewal of state medical licensure examines applicants’ mental health, physical health, and substance abuse histories.15
Recovery resources
Many institutions and medical board committees have instituted written policies for dealing with workplace addiction.13 An awareness of and sensitivity to physician vulnerability and early detection and prevention of impairment are important.2
At least 39 states have “sick doctor statutes” that permit licensure suspension for physicians who cannot practice medicine safely because of illness or substance use disorders.16 Several states have forms of “immunity”—license protection and preservation—for physicians who seek treatment voluntarily, and some states have legislative provisions that require impaired physicians to get treatment and be monitored so they can keep their licenses.17 In almost every state, medical societies have established physicians’ health committees and treatment programs (Table 5).18
Table 5
Examples of state physician health programs
| State | Organization | Contact |
|---|---|---|
| Colorado | Colorado Physician Health Program | (303) 860-0122 www.cphp.org |
| Florida | Professional Resources Network | (800) 888-8776 www.flprn.org |
| Illinois | Illinois Professional Health Program | (800) 323-8622 www.advocatehealth.com/IPHP |
| Massachusetts | Physician Health Services, Inc. | (781) 434-7404 www.massmed.org |
| Minnesota | Health Professionals Services Program | (651) 643-2120 www.hpsp.state.mn.us |
| Nevada | Nevada Professionals Assistance Program | (702) 521-1398 www.medboard.nv.gov |
| New York | Committee for Physician Health, Medical Society of the State of New York | (518) 436-4723 www.cphny.org |
| Ohio | Ohio Physicians Health Program | (614) 841-9690 www.ophp.org |
| Oregon | Oregon Health Professionals Program | (503) 620-9117 www.oregon.gov/OHA/addiction/health-professionals.shtml |
| Tennessee | Physicians Health Program, Tennessee Medical Foundation | (615) 467-6411 www.e-tmf.org |
| Texas | Committee on Physician Health and Rehabilitation, Texas Medical Association | (512) 370-1342 www.texmed.org |
| Source: Reference 18 | ||
Physicians often recover
Physician treatment is unique for several reasons. First, it is rarely voluntary, and because treatment is coerced in some way, physicians are sicker when they enter treatment. They have more social dysfunction, more medical consequences, and simply are more complicated to treat. Still, most treatment programs for impaired professionals report better rates of long-term recovery than those of the general public, perhaps because physicians are monitored intensively and have the strong motivation of not wanting to lose their medical licenses. For example, in a study of 100 alcoholic U.S. doctors followed for 21 years, 73% had recovered. This study and others show a strong relationship between recovery and attending meetings of self-help groups.19
What should Dr. Z do?
Dr. Z is a member of a professional community that has an ethical obligation to police itself and to report observations that suggest impairment. His colleague’s suspected substance use disorder could interfere with his ability to function and pose a risk to patient welfare and safety.
Although reporting a colleague is unpleasant, impaired physicians often recover, and the data support optimism about returning to clinical practice for physicians who get appropriate treatment. In this case, Dr. Z’s reporting of his concerns about impairment would help uphold the integrity of the medical profession and would offer his colleague the potential benefits of treatment and recovery programs.
Related Resources
- Bright RP, Krahn L. Impaired physicians: How to recognize, when to report, and where to refer. Current Psychiatry. 2010;9(6):11-20.
- DuPont RL, McLellan AT, White WL, et al. Setting the standard for recovery: Physicians’ Health Programs. J Subst Abuse Treat. 2009;36(2):159-171.
Disclosure
The authors report no financial relationship with any company whose products are mentioned in this article or with manufacturers of competing products.
1. Ernhart CB, Scarr S, Geneson DF. On being a whistleblower: the Needleman case Ethics Behav. 1993;3(1):73-93.
2. American Medical Association. Policies related to physician health. Available at: http://www.ama-assn.org/resources/doc/physician-health/policies-physicain-health.pdf. Accessed June 19, 2011.
3. Berge KH, Seppala MD, Schipper AM. Chemical dependency and the physician. Mayo Clin Proc. 2009;84(7):625-631.
4. Broquet KE, Rockey PH. Teaching residents and program directors about physician impairment. Acad Psychiatry. 2004;28(3):221-225.
5. Meier DE, Back AL, Morrison RS. The inner life of physicians and care of the seriously ill. JAMA. 2001;286(23):3007-3014.
6. Firth-Cozens J. Improving the health of psychiatrists. Adv Psychiatr Treat. 2007;13(3):161-168.
7. McGovern MP, Angres DH, Leon S. Characteristics of physicians presenting for assessment at a behavioral health center. J Addict Dis. 2000;19(2):59-73.
8. Federation of State Medical Boards of the United States. Policy on physician impairment. Available at: http://www.csam-asam.org/pdf/misc/FSMB2011.pdf. Accessed June 8, 2011.
9. Medical Board of California. Complaint process - frequently asked questions. Available at: http://www.medbd.ca.gov/consumer/complaint_info_questions_process.html. Accessed June 8, 2011.
10. Montana Code Ann § 37-3-401 (2005)
11. State Medical Board of Ohio. Policies and positions: licensure of chemically impaired resident physicians. Available at: http://www.med.ohio.gov/positionpapers/resident.htm. Accessed June 19, 2011.
12. American Medical Association. Code of medical ethics, opinion 9.031. Reporting impaired, incompetent, or unethical colleagues. Available at: http://www.ama-assn.org/ama/pub/physician-resources/medical-ethics/code-medical-ethics/opinion9031.page. Accessed June 19, 2011.
13. Hulse G, Sim MG, Khong E. Management of the impaired doctor. Aust Fam Physician. 2004;33(9):703-707.
14. Sansone RA, Wiederman MW, Sansone LA. Physician mental health and substance abuse. What are state medical licensure applications asking? Arch Fam Med. 1999;8(5):448-451.
15. Hansen TE, Goetz RR, Bloom JD, et al. Changes in questions about psychiatric illness asked on medical licensure applications between 1993 and 1996. Psychiatr Serv. 1998;49(2):202-206.
16. Boisaubin EV, Levine RE. Identifying and assisting the impaired physician. Am J Med Sci. 2001;322(1):31-36.
17. Verghese A. Physicians and addiction. N Engl J Med. 2002;346(20):1510-1511.
18. Federation of State Physicians Health Programs. Available at: http://www.fsphp.org. Accessed June 8, 2011.
19. Lloyd G. One hundred alcoholic doctors: a 21-year follow-up. Alcohol Alcohol. 2002;37(4):370-374

Douglas Mossman, MD
Dr. Mossman is administrative director, Glenn M. Weaver Institute of Law and Psychiatry, University of Cincinnati College of Law, and Adjunct Professor of Clinical Psychiatry and Training Director for the University of Cincinnati Forensic Psychiatry Fellowship, Cincinnati, OH.
Helen M. Farrell, MD
Dr. Farrell is an instructor at Harvard Medical School and a staff psychiatrist at Beth Israel Deaconess Medical Center, Boston, MA.
Discuss this article at www.facebook.com/CurrentPsychiatry
Dear Dr. Mossman:
Lately, a physician colleague has been arriving late for work. He seemed drunk a couple of times, and he’s been making some careless but minor mistakes. When would I have a duty to report him for suspected impairment? He is a longtime friend, which makes me uncomfortable with the prospect of having to report him.—Submitted by “Dr. Z”
Holding ourselves to ethical guidelines and standards of conduct sometimes is hard, but when we become responsible for our colleagues’ behavior, things can get awkward. Yet the responsibilities of practicing medicine include professional self-regulation.1 Failure to monitor ourselves and each other would put the reputation and integrity of the medical profession at risk—not to mention the safety of our patients. Despite this, many physicians are understandably reluctant to report colleagues who appear impaired.
To decide whether you should report a colleague, you must:
- know what behaviors constitute impairment
- understand the duty to report impaired colleagues
- realize reporting colleagues often creates emotional conflict
- understand recovery options and resources available for impaired practitioners.
After we examine these matters, we’ll see what Dr. Z should do.
Impairment defined
Physician impairment is a public health issue that affects not just physicians but their families, colleagues, and patients. In this context, “impairment” means a physical, mental, or substance-related disorder that interferes with a physician’s ability to undertake professional activities competently and safely.2
Although many mental conditions can cause impairment, we focus here on substance abuse, a condition that often leads to functional impairment. Physicians develop addictions at rates at least as high as those in the general population.3 Physicians-in- training—including psychiatric residents—are at particularly high risk for developing stress-related problems, depression, and substance misuse.4,5
Occupational demands, self-criticism, and denial of one’s own distress are common failings among physicians,5 as is self-treatment, which may help explain the high rates of substance misuse among physicians.6 Behaviors that suggest a colleague may be abusing substances and experiencing occupational impairment appear in Table 1.7
Table 1
Signs of physician impairment
| Deteriorating personal hygiene |
| Increased absence from professional functions or duties |
| Emotional lability |
| Appearing sleep-deprived |
| Increased professional errors (eg, prescriptions, dictations, clinical judgment) |
| Not responding to pages or telephone calls |
| Decreased concern for patient well-being |
| Citing unexplained ‘personal problems’ to mask deficits in concentration or patient care |
| Increased patient complaints about quality of care and bedside manner |
| Many ‘accidental’ injuries (possibly contrived to obtain narcotic prescriptions) |
| Source: Reference 7 |
Reporting duties
Doctors and physician health programs have a duty to report impaired colleagues who continue to practice despite reasonable offers of assistance. This obligation appears in professional guidelines (Table 2)2,8 and in laws and regulations governing the practice of medicine. Laws and regulations are similar in spirit across jurisdictions, although the exact wording varies from state to state (Table 3).9-11 Physicians are responsible for being familiar with reporting requirements in states they practice and complying accordingly.
Physicians must follow state guidelines and protocols for reporting a colleague’s impairment. In many situations, an intermediate step—such as notifying a chief of service or a physician health program—might occur before a report of impairment goes to a licensing board. Options for reporting impaired physicians appear in Table 4.2,12
Table 2
Medical associations’ official positions on reporting impairment
| American Medical Association (Policy H-275.952)2 | ‘Physicians have an ethical obligation to report impaired, incompetent, and unethical colleagues.’ |
| Federation of State Medical Boards8 | Physician health programs have ‘a primary commitment to [help] state medical boards … protect the public … [These] programs [should] demonstrate an ongoing track record of ensuring safety to the public and reveal deficiencies if they occur.’ |
Table 3
State medical board rules on reporting physician impairment: 3 examples
| State | Rules |
|---|---|
| California9 | California’s Medical Practice Act contains no mandatory reporting requirement. ‘However, … the Board clearly is concerned about physicians who potentially present a danger to their patients. Reporting an impaired colleague to the Medical Board will allow the Board to ensure adequate protections are in place so a colleague who requires assistance will not harm the public. The Board keeps the sources of complaint information confidential.’ |
| Montana10 | ‘[E]ach licensed physician … shall … report to the board any information … that appears to show that a physician is’ impaired. However, ‘[i]nformation that relates to possible physical or mental impairment connected to [substance misuse or illness] may be reported to’ Montana’s physician rehabilitation program ‘in lieu of reporting directly to the board.’ |
| Ohio11 | ‘Any Board licensee having knowledge’ that a physician is impaired because of substance misuse ‘is required … to report that information to the Board. … [H]owever, … the [impaired] physician’s colleagues may be excused from reporting the physician’s impairment … if the [impaired] physician has completed treatment with a Board approved treatment provider and maintained uninterrupted sobriety, and violated no other provisions of the Ohio Medical Practice Act.’ |
Table 4
Options for reporting impaired colleagues
| Impairment in hospital-based physicians may be reported to the hospital’s in-house impairment program, the hospital’s chief of staff, or another appropriate supervisor (eg, a chief resident) |
| Impairment in physicians with office-based practices may be reported to hospitals where they have privileges or to the state’s physician health program |
| Colleagues who continue to practice despite offers of assistance and referrals for treatment or for whom the above options are not available should be reported to the state licensing board |
| Source: References 2,12 |
Overcoming emotional factors
Doctors facing the need to report an impaired colleague often experience emotional conflicts because the impaired is a mentor, supervisor, trainee, friend, or practice partner. Denial, stigmatization, concerns about practice coverage, and fear of retaliation also can contribute to non-reporting. Although we know a colleague’s substance misuse represents a threat to his patients’ welfare and safety,13 reporting a colleague forces us to overcome our allegiance to a fellow practitioner.
Medical professionals should remember, however, that it is always better to identify and treat illnesses early in their course. When early referrals are not made, doctors afflicted by illness often remain without treatment until more severe impairment causes workplace errors. Withholding information about an impaired colleague from supervisors or state medical boards does a disservice to patients and to the colleague. The colleague’s drug or alcohol problems may worsen, and recovery or acquisition of future licenses might become more difficult or impossible. Initial application for medical licensure in 47 states and the District of Columbia inquire about physicians’ recent history of mental health and substance abuse problems, as well as their functional impairment.14 Even renewal of state medical licensure examines applicants’ mental health, physical health, and substance abuse histories.15
Recovery resources
Many institutions and medical board committees have instituted written policies for dealing with workplace addiction.13 An awareness of and sensitivity to physician vulnerability and early detection and prevention of impairment are important.2
At least 39 states have “sick doctor statutes” that permit licensure suspension for physicians who cannot practice medicine safely because of illness or substance use disorders.16 Several states have forms of “immunity”—license protection and preservation—for physicians who seek treatment voluntarily, and some states have legislative provisions that require impaired physicians to get treatment and be monitored so they can keep their licenses.17 In almost every state, medical societies have established physicians’ health committees and treatment programs (Table 5).18
Table 5
Examples of state physician health programs
| State | Organization | Contact |
|---|---|---|
| Colorado | Colorado Physician Health Program | (303) 860-0122 www.cphp.org |
| Florida | Professional Resources Network | (800) 888-8776 www.flprn.org |
| Illinois | Illinois Professional Health Program | (800) 323-8622 www.advocatehealth.com/IPHP |
| Massachusetts | Physician Health Services, Inc. | (781) 434-7404 www.massmed.org |
| Minnesota | Health Professionals Services Program | (651) 643-2120 www.hpsp.state.mn.us |
| Nevada | Nevada Professionals Assistance Program | (702) 521-1398 www.medboard.nv.gov |
| New York | Committee for Physician Health, Medical Society of the State of New York | (518) 436-4723 www.cphny.org |
| Ohio | Ohio Physicians Health Program | (614) 841-9690 www.ophp.org |
| Oregon | Oregon Health Professionals Program | (503) 620-9117 www.oregon.gov/OHA/addiction/health-professionals.shtml |
| Tennessee | Physicians Health Program, Tennessee Medical Foundation | (615) 467-6411 www.e-tmf.org |
| Texas | Committee on Physician Health and Rehabilitation, Texas Medical Association | (512) 370-1342 www.texmed.org |
| Source: Reference 18 | ||
Physicians often recover
Physician treatment is unique for several reasons. First, it is rarely voluntary, and because treatment is coerced in some way, physicians are sicker when they enter treatment. They have more social dysfunction, more medical consequences, and simply are more complicated to treat. Still, most treatment programs for impaired professionals report better rates of long-term recovery than those of the general public, perhaps because physicians are monitored intensively and have the strong motivation of not wanting to lose their medical licenses. For example, in a study of 100 alcoholic U.S. doctors followed for 21 years, 73% had recovered. This study and others show a strong relationship between recovery and attending meetings of self-help groups.19
What should Dr. Z do?
Dr. Z is a member of a professional community that has an ethical obligation to police itself and to report observations that suggest impairment. His colleague’s suspected substance use disorder could interfere with his ability to function and pose a risk to patient welfare and safety.
Although reporting a colleague is unpleasant, impaired physicians often recover, and the data support optimism about returning to clinical practice for physicians who get appropriate treatment. In this case, Dr. Z’s reporting of his concerns about impairment would help uphold the integrity of the medical profession and would offer his colleague the potential benefits of treatment and recovery programs.
Related Resources
- Bright RP, Krahn L. Impaired physicians: How to recognize, when to report, and where to refer. Current Psychiatry. 2010;9(6):11-20.
- DuPont RL, McLellan AT, White WL, et al. Setting the standard for recovery: Physicians’ Health Programs. J Subst Abuse Treat. 2009;36(2):159-171.
Disclosure
The authors report no financial relationship with any company whose products are mentioned in this article or with manufacturers of competing products.
1. Ernhart CB, Scarr S, Geneson DF. On being a whistleblower: the Needleman case Ethics Behav. 1993;3(1):73-93.
2. American Medical Association. Policies related to physician health. Available at: http://www.ama-assn.org/resources/doc/physician-health/policies-physicain-health.pdf. Accessed June 19, 2011.
3. Berge KH, Seppala MD, Schipper AM. Chemical dependency and the physician. Mayo Clin Proc. 2009;84(7):625-631.
4. Broquet KE, Rockey PH. Teaching residents and program directors about physician impairment. Acad Psychiatry. 2004;28(3):221-225.
5. Meier DE, Back AL, Morrison RS. The inner life of physicians and care of the seriously ill. JAMA. 2001;286(23):3007-3014.
6. Firth-Cozens J. Improving the health of psychiatrists. Adv Psychiatr Treat. 2007;13(3):161-168.
7. McGovern MP, Angres DH, Leon S. Characteristics of physicians presenting for assessment at a behavioral health center. J Addict Dis. 2000;19(2):59-73.
8. Federation of State Medical Boards of the United States. Policy on physician impairment. Available at: http://www.csam-asam.org/pdf/misc/FSMB2011.pdf. Accessed June 8, 2011.
9. Medical Board of California. Complaint process - frequently asked questions. Available at: http://www.medbd.ca.gov/consumer/complaint_info_questions_process.html. Accessed June 8, 2011.
10. Montana Code Ann § 37-3-401 (2005)
11. State Medical Board of Ohio. Policies and positions: licensure of chemically impaired resident physicians. Available at: http://www.med.ohio.gov/positionpapers/resident.htm. Accessed June 19, 2011.
12. American Medical Association. Code of medical ethics, opinion 9.031. Reporting impaired, incompetent, or unethical colleagues. Available at: http://www.ama-assn.org/ama/pub/physician-resources/medical-ethics/code-medical-ethics/opinion9031.page. Accessed June 19, 2011.
13. Hulse G, Sim MG, Khong E. Management of the impaired doctor. Aust Fam Physician. 2004;33(9):703-707.
14. Sansone RA, Wiederman MW, Sansone LA. Physician mental health and substance abuse. What are state medical licensure applications asking? Arch Fam Med. 1999;8(5):448-451.
15. Hansen TE, Goetz RR, Bloom JD, et al. Changes in questions about psychiatric illness asked on medical licensure applications between 1993 and 1996. Psychiatr Serv. 1998;49(2):202-206.
16. Boisaubin EV, Levine RE. Identifying and assisting the impaired physician. Am J Med Sci. 2001;322(1):31-36.
17. Verghese A. Physicians and addiction. N Engl J Med. 2002;346(20):1510-1511.
18. Federation of State Physicians Health Programs. Available at: http://www.fsphp.org. Accessed June 8, 2011.
19. Lloyd G. One hundred alcoholic doctors: a 21-year follow-up. Alcohol Alcohol. 2002;37(4):370-374
Redefining personality disorders: Proposed revisions for DSM-5
A major update to the diagnostic manual used by mental health clinicians around the world is expected to inspire lively debate. Proposed revisions to the personality disorders (PD) section of the next edition of the Diagnostic and Statistical Manual of Mental Disorders (DSM-5), which is scheduled to be published in 2013, have generated great controversy because they would introduce a dimensional model to the categorical system and 4 PDs would be eliminated.
“The importance of personality functioning and personality traits is the major innovation here,” said Andrew Skodol, MD, the DSM-5 Personality and Personality Disorders Work Group’s chair and a Research Professor of Psychiatry at the University of Arizona College of Medicine. “In the past, we viewed personality disorders as binary. You either had one or you didn’t. But we now understand that personality pathology is a matter of degree.”1
Mark Zimmerman, MD, has written several papers—some of which are in press—about how these revisions might impact clinicians and whether the revisions are necessary. He is Director of the Rhode Island Methods to Improve Diagnostic Assessment and Services (MIDAS) project, an ongoing clinical research study involving the integration of research assessment methods into clinical practice.
Proposed revisions, rationale, and literature reviews for DSM-5 are available at www.DSM5.org and anyone, including the general public, was invited to provide feedback through the Web site. Current Psychiatry Associate Editor Donald W. Black, MD, interviewed Dr. Zimmerman on June 29, 2011, just a few days after the latest proposed revision was posted on June 21, 2011.
DR. BLACK: What is your understanding of the DSM-5 Personality Disorders Work Group proposal to revamp the PD category?
DR. ZIMMERMAN: The initial proposal, released in February 2010, was complex and generated a fair amount of critical commentary related to the marked changes in the approach toward diagnosis of PDs. That proposal replaced diagnostic criteria with a prototype description of personality types that patients would need to match. It also eliminated 5 PDs—paranoid, schizoid, histrionic, dependent, and narcissistic—retained antisocial, avoidant, borderline, obsessive-compulsive, and schizotypal, and introduced trait level ratings. The June 21 revision proposes eliminating only 4 disorders—narcissistic was retained—and the Work Group is no longer suggesting using prototypes but instead have diagnostic criteria (Table).2,3 We do not know if this is the final proposal because similar to the first proposal, it is not presented with much supporting empirical evidence that demonstrates its superiority toward diagnosing PDs compared with the DSM-IV approach.
Table
Personality disorder criteria: DSM-IV vs DSM-5
| DSM-IV | DSM-5 proposal (posted June 21, 2011) |
|---|---|
| General diagnostic criteria | |
|
|
| Personality disorders included | |
| Antisocial, avoidant, borderline, dependent, histrionic, narcissistic, obsessive-compulsive, paranoid, schizoid, schizotypal, personality disorder not otherwise specified | Antisocial, avoidant, borderline, narcissistic, obsessive-compulsive, schizotypal, personality disorder trait specified (requires a rating of significant impairment in personality functioning, combined with the presence of pathological trait domains or facets) |
| Source: References 2,3 | |
I’m not suggesting that the DSM-IV approach is without problems. My attitude is that before going forward with a change to the official diagnostic nomenclature, you need to clearly establish that the new way of doing things is better than the previous way by whatever metric you use.
DR. BLACK: Do you believe there is a need to revamp or revise the DSM-IV PD criteria?
DR. ZIMMERMAN: I think a number of the arguments put forth by the DSM-5 Work Group as justifications for revising the criteria do not hold up to empirical study.
One of the issues is the argument that there’s too much comorbidity among PDs. The theory is that disorders are not unique diagnostic entities if they are so frequently comorbid with other disorders. But how much comorbidity is too much? The DSM-5 Work Group doesn’t say. Oldham et al4 found comorbidity rates of 70% to 90%, depending on which semi-structured diagnostic interview was used; however, this was among individuals presenting for psychodynamic treatment of PDs.
I wanted to look at the comorbidity rates in nontreatment-seeking samples to find out if treatment seeking is associated with comorbidity. I reviewed the literature and identified 7 general population epidemiological studies that presented data on the number of individuals with ≥2 PD diagnoses. In these studies, the comorbidity rate is approximately 25%, which is one-half or less than the rates found in patient populations.5 This finding suggested to me that this may not be a nosology problem unless you think 25% comorbidity is too high. The DSM-5 people don’t speak to that, although quite frankly with 10 PDs I don’t think the 25% comorbidity rate is excessive. However, a comorbidity rate of 25% was much lower than that found in patient samples and suggests to me that one of the primary stated reasons of deleting 4 PDs may not be valid.
DR. BLACK: Assuming there is a need to revise the PD section, how would you have gone about that process?
DR. ZIMMERMAN: Whatever deficiencies you perceive in the criteria, the process should be that you come up with an alternative, examine the alternative empirically, and this is followed by independent replication that the new approach is superior to the prior one. My view is that it is not sufficient justification to make a change because there is a problem with the prior approach.
We can argue as to whether there really are problems with, for example, the categorical nature of classification. My research group and I wrote a paper arguing that DSM-IV can be interpreted as having a dimensional component (Box).6 DSM-IV suggests that clinicians record on axis II that a patient has some traits of a disorder even when the full criteria are not met. With that in mind, we conceptualized DSM-IV as having a 3-point dimension, where 0 means no traits of the disorder, 1 indicates subthreshold traits, and 2 indicates that the disorder is present. In a study of >2,000 patients, we found that DSM-IV’s 3-point dimensional approach was as highly associated with measures of psychosocial morbidity as more finely graded dimensional systems.6 We therefore concluded that DSM-IV already includes a dimensional system and questioned why we need to change that approach.
Zimmerman et al suggested that DSM-IV personality disorder (PD) criteria can be thought of as a dimensional system.6 They evaluated 2,150 psychiatric outpatients using semi-structured diagnostic interviews and computed dimensional PD scores in 3 ways:
- 3-point dimension, where 0 means no traits of the disorder, 1 indicates subthreshold traits, and 2 indicates that the disorder is present
- number of DSM-IV criteria met
- 5-point dimension analogous to what was being proposed for DSM-5.
Patients also were evaluated for the presence of a PD based on DSM-IV diagnostic threshold. They then correlated these assessment methods with 7 indices of psychosocial morbidity—the number of current axis I disorders, Global Assessment of Functioning scores, unemployment in the past 5 years, number of psychiatric hospitalizations, level of psychosocial functioning, suicidal ideation at the time of the evaluation, and number of lifetime suicide attempts. All methods of dimensional assessment were more highly correlated with psychosocial morbidity than categorical classification and there was no difference among the 3 dimensional methods.
One of my concerns with the dimensional system as currently proposed is the uncertain significance and possible implications of someone being given a low, non-zero rating. How might this play out in a custody evaluation of someone who is said to be “a little borderline”? What might the implications of non-zero ratings be in obtaining life insurance? The potential practical consequences of low ratings have not, to my knowledge, been discussed. Because of this concern we decided to do a study to determine if there was any clinical significance to low dimensional scores. I had hypothesized that if we compared individuals who had no criteria and only 1 BPD criterion, there would be no difference.
To be frank, I was seeking to show that there was no validity to low levels of pathology and therefore the DSM-5 group probably is getting into dangerous territory. In fact, we found that there were rather significant and robust differences between individuals with 0 criteria and 1 criterion.7 Even though this finding didn’t support my hypothesis, I thought it was significant because it supported the DSM-5 Work Group and I felt compelled to publish that data.
We now had 2 interesting pieces of information. A few years ago we published a study on borderline personality disorder (BPD) that found once you hit the diagnostic threshold it made no difference how many criteria you met.8 On the other hand, when you were below the diagnostic threshold, having 1 criterion vs 0 made a big difference. In addition, a fair number of studies show that dimensional models capture more of the variance in personality pathology than categorical variables.9-12
This lead to our next study in which we hypothesized that dimensionality was only important when the person didn’t meet criteria, not when they did meet criteria.13 So we divided patients in the MIDAS study into those with 0 to 4 BPD criteria and those with ≥5 and counted the number of criteria that were met. Then we correlated each of those 2 dimensional scores with various indicators of illness severity, such as number of suicide attempts, number of psychiatric hospitalizations, and amount of time missed from work in the past 5 years. We found that for individuals who already achieved the diagnostic threshold there were very low correlations with these psychosocial morbidity variables. But for patients with subthreshold symptomatology, there were significant correlations and those correlations were significantly higher than the correlations for the other group. We therefore suggested that dimensionality is important but only when you don’t meet the diagnostic threshold. Thus, we came to the conclusion that DSM-IV already provides for capturing the important dimensional nature of PDs.
DR. BLACK: I’ve discussed this issue with a number of people who basically say doctors tend to think categorically, they don’t think along dimensions. Would it be difficult for psychiatrists to accept this type of system because it’s so different from how physicians are trained to think?
DR. ZIMMERMAN: I think doctors do think categorically and about traits, not necessarily disorders. For example, we’ll see a patient and a clinician will say he’s overly perfectionistic, but there’s no perfectionistic disorder in DSM-IV. This patient may or may not have obsessive-compulsive personality disorder.
I think assessment and diagnosis in routine clinical practice are not nearly as comprehensive as in research. I think psychiatrists often are picking up on traits that they think are clinically significant, but even within that context, they’re thinking categorically, that the patient is perfectionistic rather than rating him a 7 on a scale from 0 to 10 in terms of perfectionism.
Eliminated disorders
DR. BLACK: The proposal will cut the number of PDs to 6 plus personality disorder trait specified and those remaining are to be called types. How did the DSM-5 Work Group select the 5 (now 4) disorders to get rid of? Did they just pick ones that were infrequently used?
DR. ZIMMERMAN: They retained the disorders that were studied in the Collaborative Longitudinal Personality Disorders Study study14 plus others with well established validity.
DR. BLACK: What do you think about that plan to reduce the number of PDs?
DR. ZIMMERMAN: The biggest problem I have is that the DSM-5 Work Group didn’t present any data on the implications of their plan. The conceptual justification was to reduce comorbidity rates. Well, you can hypothesize that comorbidity would actually increase if you retained only those disorders that are more frequently comorbid with other disorders. Would there be any individuals who only have 1 of the excluded diagnoses? Would there be false negatives? They didn’t indicate whether comorbidity would drop and by how much. And they didn’t indicate if there would be a potential impact on missing cases.
We did such an analysis because we had the data set available from the MIDAS project.15 We wanted to know if you excluded the 5 diagnoses that (at the time) were proposed for exclusion—narcissistic, paranoid, schizoid, dependent, and histrionic—what percentage of individuals would no longer be diagnosed with a PD? Second, how much would comorbidity rates change? And third, how did individuals who would no longer be diagnosed with a PD compare with individuals who never had a PD?
We found that the comorbidity rates did, in fact, drop from 30% to 21%. We found that the rate of PDs dropped only a little, but approximately 10% of individuals who previously would have been diagnosed with a PD would no longer be diagnosed. We compared individuals in the excluded group—those who had only 1 of the PDs that would no longer be considered a PD—with a group of patients who had a retained PD and also compared them to individuals with no PD. We found that the retained PD group and the excluded group did not differ on measures of psychosocial morbidity, such as Global Assessment of Functioning scores, hospitalizations, suicidality, number of current axis I disorders, etc. Also, the excluded group clearly was different than the no PD group. We questioned whether or not those in the excluded group might end up being false negative diagnoses in DSM-5. Certainly DSM-5 provides a provision to use trait ratings to still diagnose a PD, called personality disorder trait specified, which would be somewhat analogous to PD not otherwise specified (NOS).
It’s ironic insofar as another of the issues considered by the DSM-5 Work Group to be a problem with axis II is lack of coverage and that too many individuals are diagnosed with PD NOS. Their proposal to exclude PDs could result in more individuals being diagnosed with PD NOS. I know the group would disagree with that perspective, but they provided no evidence to support its view.
As I said at the beginning of this interview, I think we should be talking about this from a scientific perspective and nothing more than that.
Related Resource
- Widiger TA, Simonsen E, Sirovatka PJ, et al. Dimensional models of personality disorders: Refining the research agenda for DSM-V. Arlington, VA: American Psychiatric Publishing, Inc; 2007.
Disclosures
- Dr. Zimmerman reports no financial relationship with any company whose products are mentioned in this article or with manufacturers of competing products.
- Dr. Black receives research support from AstraZeneca and Psyadon.
1. DSM-5 revisions for personality disorders reflect major change. Public comment period for proposed diagnostic criteria extended through July 15 [news release]. Arlington, VA: American Psychiatric Association; July 7, 2011. http://www.psych.org/MainMenu/Newsroom/NewsReleases/2011-News-Releases_1/DSM-5-Revisions-for-Personality-Disorders-Reflect-Major-Change-.aspx?FT=.pdf. Accessed July 26, 2011.
2. Diagnostic and statistical manual of mental disorders, 4th ed, text rev. Washington, DC: American Psychiatric Association; 2000.
3. Personality disorders. American Psychiatric Association DSM-5 development. http://www.dsm5.org/proposedrevision/Pages/PersonalityDisorders.aspx. Updated June 21, 2011. Accessed July 26, 2011.
4. Oldham JM, Skodol AE, Kellman HD, et al. Diagnosis of DSM-III-R personality disorders by two structured interviews: patterns of comorbidity. Am J Psychiatry. 1992;149(2):213-220.
5. Zimmerman M. Is there adequate empirical justification for radically revising the personality disorders section for DSM-5? Personality Disorders: Theory, Research and Treatment. In press.
6. Zimmerman M, Chelminski I, Young D, et al. Does DSM-IV already capture the dimensional nature of personality disorders? J Clin Psychiatry. In press.
7. Zimmerman M, Chelminski I, Young D, et al. Does the presence of one feature of borderline personality disorder have clinical significance?: Implications for dimensional ratings of personality disorders. J Clin Psychiatry. In press.
8. Asnaani A, Chelminski I, Young D, et al. Heterogeneity of borderline personality disorder: do the number of criteria met make a difference? J Pers Disord. 2007;21(6):615-625.
9. Skodol AE, Oldham JM, Bender DS, et al. Dimensional representations of DSM-IV personality disorders: relationships to functional impairment. Am J Psychiatry. 2005;162:1919-1925.
10. Durbin CE, Klein DN. Ten-year stability of personality disorders among outpatients with mood disorders. J Abnorm Psychol. 2006;115:75-84.
11. Grilo CM, Sanislow CA, Gunderson JG, et al. Two-year stability and change of schizotypal, borderline, avoidant, and obsessive-compulsive personality disorders. J Consult Clin Psychol. 2004;72:767-775.
12. Morey LC, Hopwood CJ, Gunderson JG, et al. Comparison of alternative models for personality disorders. Psychol Med. 2007;37:983-994.
13. Zimmerman M, Chelminski I, Young D, et al. Is dimensional scoring of borderline personality disorder only important for subthreshold levels of severity? J Pers Disord. In press.
14. Gunderson JG, Shea MT, Skodol AE, et al. The Collaborative Longitudinal Personality Disorders Study: development, aims, design, and sample characteristics. J Pers Disord. 2000;14(4):300-315.
15. Zimmerman M, Chelminski I, Young D, et al. Impact of deleting 5 DSM-IV personality disorders on prevalence, comorbidity, and the association between personality disorder pathology and psychosocial morbidity. J Clin Psychiatry. In press.

Donald W. Black, MD
Current Psychiatry Associate Editor, is Professor of Psychiatry and Director of the Residency Training Program at the University of Iowa, Iowa City, IA.
Mark Zimmerman, MD
Associate Professor of Psychiatry and Human Behavior at Brown University and Director of Outpatient Psychiatry at Rhode Island Hospital, Providence, RI.
A major update to the diagnostic manual used by mental health clinicians around the world is expected to inspire lively debate. Proposed revisions to the personality disorders (PD) section of the next edition of the Diagnostic and Statistical Manual of Mental Disorders (DSM-5), which is scheduled to be published in 2013, have generated great controversy because they would introduce a dimensional model to the categorical system and 4 PDs would be eliminated.
“The importance of personality functioning and personality traits is the major innovation here,” said Andrew Skodol, MD, the DSM-5 Personality and Personality Disorders Work Group’s chair and a Research Professor of Psychiatry at the University of Arizona College of Medicine. “In the past, we viewed personality disorders as binary. You either had one or you didn’t. But we now understand that personality pathology is a matter of degree.”1
Mark Zimmerman, MD, has written several papers—some of which are in press—about how these revisions might impact clinicians and whether the revisions are necessary. He is Director of the Rhode Island Methods to Improve Diagnostic Assessment and Services (MIDAS) project, an ongoing clinical research study involving the integration of research assessment methods into clinical practice.
Proposed revisions, rationale, and literature reviews for DSM-5 are available at www.DSM5.org and anyone, including the general public, was invited to provide feedback through the Web site. Current Psychiatry Associate Editor Donald W. Black, MD, interviewed Dr. Zimmerman on June 29, 2011, just a few days after the latest proposed revision was posted on June 21, 2011.
DR. BLACK: What is your understanding of the DSM-5 Personality Disorders Work Group proposal to revamp the PD category?
DR. ZIMMERMAN: The initial proposal, released in February 2010, was complex and generated a fair amount of critical commentary related to the marked changes in the approach toward diagnosis of PDs. That proposal replaced diagnostic criteria with a prototype description of personality types that patients would need to match. It also eliminated 5 PDs—paranoid, schizoid, histrionic, dependent, and narcissistic—retained antisocial, avoidant, borderline, obsessive-compulsive, and schizotypal, and introduced trait level ratings. The June 21 revision proposes eliminating only 4 disorders—narcissistic was retained—and the Work Group is no longer suggesting using prototypes but instead have diagnostic criteria (Table).2,3 We do not know if this is the final proposal because similar to the first proposal, it is not presented with much supporting empirical evidence that demonstrates its superiority toward diagnosing PDs compared with the DSM-IV approach.
Table
Personality disorder criteria: DSM-IV vs DSM-5
| DSM-IV | DSM-5 proposal (posted June 21, 2011) |
|---|---|
| General diagnostic criteria | |
|
|
| Personality disorders included | |
| Antisocial, avoidant, borderline, dependent, histrionic, narcissistic, obsessive-compulsive, paranoid, schizoid, schizotypal, personality disorder not otherwise specified | Antisocial, avoidant, borderline, narcissistic, obsessive-compulsive, schizotypal, personality disorder trait specified (requires a rating of significant impairment in personality functioning, combined with the presence of pathological trait domains or facets) |
| Source: References 2,3 | |
I’m not suggesting that the DSM-IV approach is without problems. My attitude is that before going forward with a change to the official diagnostic nomenclature, you need to clearly establish that the new way of doing things is better than the previous way by whatever metric you use.
DR. BLACK: Do you believe there is a need to revamp or revise the DSM-IV PD criteria?
DR. ZIMMERMAN: I think a number of the arguments put forth by the DSM-5 Work Group as justifications for revising the criteria do not hold up to empirical study.
One of the issues is the argument that there’s too much comorbidity among PDs. The theory is that disorders are not unique diagnostic entities if they are so frequently comorbid with other disorders. But how much comorbidity is too much? The DSM-5 Work Group doesn’t say. Oldham et al4 found comorbidity rates of 70% to 90%, depending on which semi-structured diagnostic interview was used; however, this was among individuals presenting for psychodynamic treatment of PDs.
I wanted to look at the comorbidity rates in nontreatment-seeking samples to find out if treatment seeking is associated with comorbidity. I reviewed the literature and identified 7 general population epidemiological studies that presented data on the number of individuals with ≥2 PD diagnoses. In these studies, the comorbidity rate is approximately 25%, which is one-half or less than the rates found in patient populations.5 This finding suggested to me that this may not be a nosology problem unless you think 25% comorbidity is too high. The DSM-5 people don’t speak to that, although quite frankly with 10 PDs I don’t think the 25% comorbidity rate is excessive. However, a comorbidity rate of 25% was much lower than that found in patient samples and suggests to me that one of the primary stated reasons of deleting 4 PDs may not be valid.
DR. BLACK: Assuming there is a need to revise the PD section, how would you have gone about that process?
DR. ZIMMERMAN: Whatever deficiencies you perceive in the criteria, the process should be that you come up with an alternative, examine the alternative empirically, and this is followed by independent replication that the new approach is superior to the prior one. My view is that it is not sufficient justification to make a change because there is a problem with the prior approach.
We can argue as to whether there really are problems with, for example, the categorical nature of classification. My research group and I wrote a paper arguing that DSM-IV can be interpreted as having a dimensional component (Box).6 DSM-IV suggests that clinicians record on axis II that a patient has some traits of a disorder even when the full criteria are not met. With that in mind, we conceptualized DSM-IV as having a 3-point dimension, where 0 means no traits of the disorder, 1 indicates subthreshold traits, and 2 indicates that the disorder is present. In a study of >2,000 patients, we found that DSM-IV’s 3-point dimensional approach was as highly associated with measures of psychosocial morbidity as more finely graded dimensional systems.6 We therefore concluded that DSM-IV already includes a dimensional system and questioned why we need to change that approach.
Zimmerman et al suggested that DSM-IV personality disorder (PD) criteria can be thought of as a dimensional system.6 They evaluated 2,150 psychiatric outpatients using semi-structured diagnostic interviews and computed dimensional PD scores in 3 ways:
- 3-point dimension, where 0 means no traits of the disorder, 1 indicates subthreshold traits, and 2 indicates that the disorder is present
- number of DSM-IV criteria met
- 5-point dimension analogous to what was being proposed for DSM-5.
Patients also were evaluated for the presence of a PD based on DSM-IV diagnostic threshold. They then correlated these assessment methods with 7 indices of psychosocial morbidity—the number of current axis I disorders, Global Assessment of Functioning scores, unemployment in the past 5 years, number of psychiatric hospitalizations, level of psychosocial functioning, suicidal ideation at the time of the evaluation, and number of lifetime suicide attempts. All methods of dimensional assessment were more highly correlated with psychosocial morbidity than categorical classification and there was no difference among the 3 dimensional methods.
One of my concerns with the dimensional system as currently proposed is the uncertain significance and possible implications of someone being given a low, non-zero rating. How might this play out in a custody evaluation of someone who is said to be “a little borderline”? What might the implications of non-zero ratings be in obtaining life insurance? The potential practical consequences of low ratings have not, to my knowledge, been discussed. Because of this concern we decided to do a study to determine if there was any clinical significance to low dimensional scores. I had hypothesized that if we compared individuals who had no criteria and only 1 BPD criterion, there would be no difference.
To be frank, I was seeking to show that there was no validity to low levels of pathology and therefore the DSM-5 group probably is getting into dangerous territory. In fact, we found that there were rather significant and robust differences between individuals with 0 criteria and 1 criterion.7 Even though this finding didn’t support my hypothesis, I thought it was significant because it supported the DSM-5 Work Group and I felt compelled to publish that data.
We now had 2 interesting pieces of information. A few years ago we published a study on borderline personality disorder (BPD) that found once you hit the diagnostic threshold it made no difference how many criteria you met.8 On the other hand, when you were below the diagnostic threshold, having 1 criterion vs 0 made a big difference. In addition, a fair number of studies show that dimensional models capture more of the variance in personality pathology than categorical variables.9-12
This lead to our next study in which we hypothesized that dimensionality was only important when the person didn’t meet criteria, not when they did meet criteria.13 So we divided patients in the MIDAS study into those with 0 to 4 BPD criteria and those with ≥5 and counted the number of criteria that were met. Then we correlated each of those 2 dimensional scores with various indicators of illness severity, such as number of suicide attempts, number of psychiatric hospitalizations, and amount of time missed from work in the past 5 years. We found that for individuals who already achieved the diagnostic threshold there were very low correlations with these psychosocial morbidity variables. But for patients with subthreshold symptomatology, there were significant correlations and those correlations were significantly higher than the correlations for the other group. We therefore suggested that dimensionality is important but only when you don’t meet the diagnostic threshold. Thus, we came to the conclusion that DSM-IV already provides for capturing the important dimensional nature of PDs.
DR. BLACK: I’ve discussed this issue with a number of people who basically say doctors tend to think categorically, they don’t think along dimensions. Would it be difficult for psychiatrists to accept this type of system because it’s so different from how physicians are trained to think?
DR. ZIMMERMAN: I think doctors do think categorically and about traits, not necessarily disorders. For example, we’ll see a patient and a clinician will say he’s overly perfectionistic, but there’s no perfectionistic disorder in DSM-IV. This patient may or may not have obsessive-compulsive personality disorder.
I think assessment and diagnosis in routine clinical practice are not nearly as comprehensive as in research. I think psychiatrists often are picking up on traits that they think are clinically significant, but even within that context, they’re thinking categorically, that the patient is perfectionistic rather than rating him a 7 on a scale from 0 to 10 in terms of perfectionism.
Eliminated disorders
DR. BLACK: The proposal will cut the number of PDs to 6 plus personality disorder trait specified and those remaining are to be called types. How did the DSM-5 Work Group select the 5 (now 4) disorders to get rid of? Did they just pick ones that were infrequently used?
DR. ZIMMERMAN: They retained the disorders that were studied in the Collaborative Longitudinal Personality Disorders Study study14 plus others with well established validity.
DR. BLACK: What do you think about that plan to reduce the number of PDs?
DR. ZIMMERMAN: The biggest problem I have is that the DSM-5 Work Group didn’t present any data on the implications of their plan. The conceptual justification was to reduce comorbidity rates. Well, you can hypothesize that comorbidity would actually increase if you retained only those disorders that are more frequently comorbid with other disorders. Would there be any individuals who only have 1 of the excluded diagnoses? Would there be false negatives? They didn’t indicate whether comorbidity would drop and by how much. And they didn’t indicate if there would be a potential impact on missing cases.
We did such an analysis because we had the data set available from the MIDAS project.15 We wanted to know if you excluded the 5 diagnoses that (at the time) were proposed for exclusion—narcissistic, paranoid, schizoid, dependent, and histrionic—what percentage of individuals would no longer be diagnosed with a PD? Second, how much would comorbidity rates change? And third, how did individuals who would no longer be diagnosed with a PD compare with individuals who never had a PD?
We found that the comorbidity rates did, in fact, drop from 30% to 21%. We found that the rate of PDs dropped only a little, but approximately 10% of individuals who previously would have been diagnosed with a PD would no longer be diagnosed. We compared individuals in the excluded group—those who had only 1 of the PDs that would no longer be considered a PD—with a group of patients who had a retained PD and also compared them to individuals with no PD. We found that the retained PD group and the excluded group did not differ on measures of psychosocial morbidity, such as Global Assessment of Functioning scores, hospitalizations, suicidality, number of current axis I disorders, etc. Also, the excluded group clearly was different than the no PD group. We questioned whether or not those in the excluded group might end up being false negative diagnoses in DSM-5. Certainly DSM-5 provides a provision to use trait ratings to still diagnose a PD, called personality disorder trait specified, which would be somewhat analogous to PD not otherwise specified (NOS).
It’s ironic insofar as another of the issues considered by the DSM-5 Work Group to be a problem with axis II is lack of coverage and that too many individuals are diagnosed with PD NOS. Their proposal to exclude PDs could result in more individuals being diagnosed with PD NOS. I know the group would disagree with that perspective, but they provided no evidence to support its view.
As I said at the beginning of this interview, I think we should be talking about this from a scientific perspective and nothing more than that.
Related Resource
- Widiger TA, Simonsen E, Sirovatka PJ, et al. Dimensional models of personality disorders: Refining the research agenda for DSM-V. Arlington, VA: American Psychiatric Publishing, Inc; 2007.
Disclosures
- Dr. Zimmerman reports no financial relationship with any company whose products are mentioned in this article or with manufacturers of competing products.
- Dr. Black receives research support from AstraZeneca and Psyadon.
1. DSM-5 revisions for personality disorders reflect major change. Public comment period for proposed diagnostic criteria extended through July 15 [news release]. Arlington, VA: American Psychiatric Association; July 7, 2011. http://www.psych.org/MainMenu/Newsroom/NewsReleases/2011-News-Releases_1/DSM-5-Revisions-for-Personality-Disorders-Reflect-Major-Change-.aspx?FT=.pdf. Accessed July 26, 2011.
2. Diagnostic and statistical manual of mental disorders, 4th ed, text rev. Washington, DC: American Psychiatric Association; 2000.
3. Personality disorders. American Psychiatric Association DSM-5 development. http://www.dsm5.org/proposedrevision/Pages/PersonalityDisorders.aspx. Updated June 21, 2011. Accessed July 26, 2011.
4. Oldham JM, Skodol AE, Kellman HD, et al. Diagnosis of DSM-III-R personality disorders by two structured interviews: patterns of comorbidity. Am J Psychiatry. 1992;149(2):213-220.
5. Zimmerman M. Is there adequate empirical justification for radically revising the personality disorders section for DSM-5? Personality Disorders: Theory, Research and Treatment. In press.
6. Zimmerman M, Chelminski I, Young D, et al. Does DSM-IV already capture the dimensional nature of personality disorders? J Clin Psychiatry. In press.
7. Zimmerman M, Chelminski I, Young D, et al. Does the presence of one feature of borderline personality disorder have clinical significance?: Implications for dimensional ratings of personality disorders. J Clin Psychiatry. In press.
8. Asnaani A, Chelminski I, Young D, et al. Heterogeneity of borderline personality disorder: do the number of criteria met make a difference? J Pers Disord. 2007;21(6):615-625.
9. Skodol AE, Oldham JM, Bender DS, et al. Dimensional representations of DSM-IV personality disorders: relationships to functional impairment. Am J Psychiatry. 2005;162:1919-1925.
10. Durbin CE, Klein DN. Ten-year stability of personality disorders among outpatients with mood disorders. J Abnorm Psychol. 2006;115:75-84.
11. Grilo CM, Sanislow CA, Gunderson JG, et al. Two-year stability and change of schizotypal, borderline, avoidant, and obsessive-compulsive personality disorders. J Consult Clin Psychol. 2004;72:767-775.
12. Morey LC, Hopwood CJ, Gunderson JG, et al. Comparison of alternative models for personality disorders. Psychol Med. 2007;37:983-994.
13. Zimmerman M, Chelminski I, Young D, et al. Is dimensional scoring of borderline personality disorder only important for subthreshold levels of severity? J Pers Disord. In press.
14. Gunderson JG, Shea MT, Skodol AE, et al. The Collaborative Longitudinal Personality Disorders Study: development, aims, design, and sample characteristics. J Pers Disord. 2000;14(4):300-315.
15. Zimmerman M, Chelminski I, Young D, et al. Impact of deleting 5 DSM-IV personality disorders on prevalence, comorbidity, and the association between personality disorder pathology and psychosocial morbidity. J Clin Psychiatry. In press.
Personalized medicine: myth to reality
Ever since the International Human GenomeSequencing Consortium unveiled its “working draft” of the human genome sequence in 2000, the scientific community has eagerly discussed and speculated on the potential of genomic medicine. Patients, clinicians, and scientists were—and still are—excited about the possibilities of targeted therapies such as imatinib (Gleevec) for chronic myeloid leukemias and gastrointestinal stromal tumors and trastuzumab (Herceptin) for HER2/neu-positive breast cancer. There has been significant progress in the development of these and other targeted therapies, and they remain part of an intriguing and promising work in progress. However, for patients with lung cancer and melanoma, both of which are highly refractory diseases, the therapeutic choices other than chemotherapy have been limited and the commensurate outcomes discouraging.
In the early 2000s, we were excited about targeted therapies such as gefitinib (Iressa), which blocks epidermal growth factor receptor (EGFR)- tyrosine kinase activity in non-small cell lung cancer (NSCLC), but its clinical benefit was still limited. We have since gained a better understanding of lung cancer as a molecularly heterogeneous disease and have adjusted our approach to its treatment, based on new data showing that all lung cancer patients cannot be treated with the same drug regimen and achieve the same outcomes. With those insights, the implications of targeted therapies came into sharper focus in 2004 with the US Food and Drug Administration (FDA) approval of erlotinib (Tarceva) for the 10%–15% of patients with NSCLC (adenocarcinoma) who have the EGFR gene mutation. At around the same time, scientists identified BRAF gene mutations in about 40%– 60% of patients with melanoma, and the quest for therapies for that disease was redirected to the cellular level as well. ...
* For a PDF of the full article, click in the link to the left of this introduction.
Obsessing on Atrial Fib
The recent Registry on Cardiac Rhythm Disorders Assessing the Control of Atrial Fibrillation (RECORD AF) provides further data to belie our obsession with obtaining or maintaining normal sinus rhythm in patients with intermittent or paroxysmal AF (J. Am. Coll. Cardiol. 2011;58:493-501).
Registry studies fail to provide the randomized data that we demand in control trials, but can often yield data about real-world therapy. This registry, which included 5,604 patients from around the world and whose authors were either consultants or employees of Sanofi-Aventis, the makers of dronedarone, confirms much of what has already been said on the issue. There is little or no benefit associated with the rhythm control therapy compared to a heart rate strategy when examined in this community-based unselected population.
Because patients in this study were not randomized to a particular therapy, participating doctors could use either strategy. Unfortunately, patients in the rate control arm were older and more often had AF, heart failure, and valvular heart disease at baseline. Despite this imbalance, the heart rate strategy was as good as rhythm control. Both groups experienced an 18% incidence of adverse clinical events that were determined by the clinical characteristics of the patient and not the therapeutic strategy used or heart rate achieved. Success was measured by the presence of normal sinus rhythm in the rhythm-controlled patients or a heart rate of less than 80 bpm in the rate-controlled patients at 1 year follow-up, which was achieved in 60% and 47%, respectively. If the heart rate target was below 85 bpm, the success was achieved in 60% vs. 52%, respectively. These observations are consistent with previous studies comparing rhythm and rate control strategies.
This obsession with the maintenance of normal sinus rhythm in patients with AF has spawned a whole industry associated with the technology and application of catheter ablation, atrial defibrillation, left atrial occlusive devices, and the continued development of anti-arrhythmic drugs. All of these interventions have achieved some success but have been associated with significant drug and device adverse events.
The most recently approved anti-arrhythmic drug, dronedarone (Multaq), has been extensively studied in AF. Three major clinical trials have examined the drug in paroxysmal, persistent, and permanent AF. The most recent trial, Permanent Atrial Fibrillation Outcome Study Using Dronedarone (PALLAS), compared dronedarone to placebo in 3,000 patients with permanent AF and who also had a number of comorbidities, including symptomatic heart failure and a decrease in ejection fraction, but excluded New York Heart Association class III heart failure. Only an electrophysiologist is able to make the distinction between these two clinical heart failure settings. The study was prematurely stopped because of a significant increase in cardiovascular events, including mortality (
Dronedarone was approved in 2009 for patients with paroxysmal and persistent AF and atrial flutter by the Food and Drug Administration based on the ATHENA trial, which reported a decrease in recurrent AF in patients treated with the drug. In addition, dronedarone decreased the combined cardiovascular end point of mortality and rehospitalization, achieved mostly by a decrease in rehospitalization. However, its approval included a boxed warning that it is “contraindicated in patients with NYHA Class IV heart failure or NYHA Class II-III heart failure with a recent decompensation requiring hospitalization,” because of the increased risks observed in the previous Trial with Dronedarone in Moderate to Severe CHF Evaluating Morbidity Decrease (ANDROMEDA). That trial, which included mostly patients with NYHA class III-IV, was stopped prematurely because of the increase in heart failure mortality.
Dr. Stuart Connolly, the co–primary investigator of PALLAS, emphasized the difference between ATHENA, which randomized patients with nonpermanent AF, and PALLAS, which randomized patients with permanent AF. He thought that it was “reasonable” for patients with nonpermanent AF to continue with dronedarone, because “they will still benefit from it in terms of reduced CV hospitalization.”
Although there are surely some patients in whom AF causes significant symptoms that warrant aggressive therapy, the vast majority of patients, as indicated in RECORD AF, tolerate AF quite well. Much of the quest for rhythm control is related to the need to prevent systemic emboli and the requirement for anticoagulation therapy using vitamin K derivatives. The development of new antithrombotic drugs and factor Xa inhibitors now provides a safer and more effective alternative. It is time to relax our obsessive approach to atrial fibrillation therapy and become more realistic about our long-term goals for its therapy.
Antibiotic Overuse Linked to C. Diff Infections
A new study that shows cumulative antibiotic exposures appear to be associated with Clostridium difficile infections (CDI) should be seen as another reason to reduce the use of antibiotics to minimum levels, according to the paper's lead author.
"In terms of prevention, it's really important for us to start delineating [shortened antibiotic courses] in treating the primary infection," says Vanessa Stevens, PhD, a fellow at the Center for Health Outcomes, Pharmacoinformatics, and Epidemiology at the State University of New York at Buffalo. "What are the minimums that are necessary to accomplish the job?"
Dr. Stevens says CDI's growing incidence is clear; however, there is little research linking the risk to the total dose, duration, or number of antibiotics a patient receives. So her team set out to provide one of the first links. They found that compared to patients who received one antibiotic, the adjusted hazard ratios for those receiving two to five antibiotics were 2.5 (95% confidence interval [CI] 1.6-4.0), 3.3 (CI 2.2-5.2), and 9.6 (CI 6.1-15.1), respectively (Clin Infect Dis. 2011;53(1):42-48). Patients exposed to fluoroquinolones were associated with higher risk, while those given metronidazole saw reduced risk.
Dr. Stevens says she expected the research would confirm her suspicions that continued exposure to antibiotics increased risk of infection. Still, she says, the more difficult question is when to balance a minimalistic approach to antibiotic use with the need to aggressively deal with more acute primary infections.
"The risk of C. diff might be an acceptable risk in a case where you're treating a life-threatening infection," Dr. Stevens adds. "If you're treating acne or something that isn't a life-threatening condition to the patient, there has to be a balance."
Hospital Wins Award for Improving Transitions, Reducing Readmissions
Bassett Medical Center in Cooperstown, N.Y., received a Pinnacle Award for Quality and Patient Safety from the Health Care Association of New York State in June, honoring Bassett's program for improving care transitions and reducing hospital readmissions.
Bassett used an evidence-based approach that incorporated readmission screening tools and risk-reduction strategies, a patient services coordinator to make post-discharge follow-up phone calls, and a toll-free number for patients to call any time prior to their first post-discharge medical appointment. The result was a readmission rate that was reduced by 25%, from 17% in 2009 to 13% in 2010. Thirty-day readmissions for high-risk patients fell 70% for the hospital, which is a mentored site in SHM's Project BOOST (Better Outcomes for Older Adults through Safe Transitions).
Hospitalist Komron Ostovar, MD, FHM, and Lorraine Stubley, RN, MS, the hospital's senior director of care coordination, led a multidisciplinary quality group that included primary-care providers and representatives from community settings. They worked to strengthen information flow between inpatient and outpatient providers. One of the most helpful tools, Stubley says, was Project BOOST's "8 Ps" for risk assessment, which identified high-risk patients consistently.
The care-transitions initiative also lays the groundwork for implementing a "geographical care model" at Bassett, with a universal bed unit staffed by nurses who are able to provide for all of the patient's needs for the entire hospitalization, she says.
The facility's hospitalists led daily rounds, emphasized teach-back education, and helped to refine discharge instructions in patient-friendly terms. "Our group of hospitalists understands that we now 'own' the complexity of care transitions," Dr. Ostovar says. "If we, as professionals, don't make every effort to get it right, then who will?"
Research indicates apixaban is superior to warfarin
A large-scale trial showed that the anticoagulant apixaban was more effective than warfarin in preventing stroke and systemic embolism in patients with atrial fibrillation. Moreover, apixaban resulted in substantially less bleeding and lower mortality.
These results were presented at the European Society of Cardiology Congress in Paris on August 28 and published simultaneously online in The New England Journal of Medicine.
The study was funded by the makers of apixaban, Bristol-Myers Squibb, Co. and Pfizer Inc.
The trial, called ARISTOTLE, included 18,201 patients from 1034 clinical sites in 39 countries. Patients were randomized to receive either apixaban or warfarin at 5 mg twice daily for an average of 1.8 years.
“[W]hen compared to warfarin..., apixaban resulted in an additional 21% relative reduction in stroke or systemic embolism,” said lead study author Christopher B. Granger, MD, of Duke University. “It also resulted in a 31% relative reduction in major bleeding, as well as an 11% relative reduction in overall mortality.”
The improvement in stroke prevention was statistically significant (P = 0.011), as was the lower rate of major bleeding (P < 0.001) and the lower mortality (P = 0.047). Hemorrhagic stroke was reduced by about 50%.
The benefits of stroke reduction and lower rates of bleeding were consistent across all major subgroups and despite the heterogeneity that exists in the quality of warfarin use across the world, according to John Alexander, MD, a study co-author and Duke cardiologist.
The number of events prevented per 1000 people, which indicate absolute risk reduction, was also impressive, Dr Alexander said. Apixaban prevented 6 patients from having a stroke, 15 patients from having major bleeding, and 8 patients from dying.
“There is an enormous unmet need for treatment of patients at risk for stroke associated with atrial fibrillation,” Dr Granger said. “Only about half of patients who should be treated are being treated. The disparity exists because warfarin treatment has several limitations.”
These limitations include regular blood tests to monitor and adjust warfarin dose, as well as the need to avoid certain foods and medications that interfere with warfarin's efficacy. Warfarin has also been shown to increase bleeding risk, including intracranial hemorrhage.
“Our study indicates treatment with apixaban is more effective than warfarin in preventing stroke, without the need for anticoagulation monitoring,” said the study committee's co-chair Lars Wallentin, MD, of the Uppsala Clinical Research Center University Hospital in Sweden.
The study also shows apixaban is safer than warfarin, Dr Wallentin said. “Our findings show a single dose of apixaban accomplishes the same stroke prevention goal as adjusted-dose warfarin, with a substantially lower risk of all types of bleeding across different ages and with lower rates of discontinuation.”
Though these results suggest apixaban is a promising drug, it is important to note that other studies of apixaban have produced mixed results.
A study published in The New England Journal of Medicine on July 24 showed that apixaban increased major bleeding in patients with acute coronary syndrome, without reducing recurrent ischemic events.
A study presented at the American Stroke Association’s International Stroke Conference 2011 found apixaban to be “far superior” to aspirin at preventing stroke in atrial fibrillation patients who could not use vitamin K antagonists.
The ADVANCE-2 study suggested apixaban was more effective at preventing venous thromboembolism than enoxaparin in patients who had elective total knee replacement surgery. However, the earlier ADVANCE study indicated apixaban was not more effective than enoxaparin.
And a study presented at the European Society of Cardiology Conference in 2008 found that apixaban lowered the incidence of heart attack, stroke, chest pain, or death from cardiovascular problems when compared to placebo. However, the drug did not lower the incidence significantly, and it caused major bleeding when administered at high doses. ![]()