User login
Leaders of the Pack
Who is better at decreasing mortality and length of stay: intensivists or hospitalists? Neither, researchers at Emory University in Atlanta report.
The group, led by Kristin Wise, MD, assistant professor of medicine at Emory, sought to answer this question at a time when an increasing number of hospitals are turning to hospitalists to fill manpower gaps in ICUs. For its timely research, the group is being honored: The Emory team's abstract was one of three chosen as HM09's Best of Research, Innovations, and Clinical Vignettes (RIV). The presenting abstracts received the highest scores; 409 abstracts were submitted for this year's RIV competition.
Emory's prospective, cohort study of 1,084 patients showed no statistically significant difference in mortality rate between patients treated by the intensivist team and the hospitalist ICU team. "It definitely shows hospitalists can provide high-quality ICU staffing … and can help address future critical-care needs as we’re facing an intensivist shortage," Dr. Wise says.
New Communication Tool
University of Michigan (UM) hospitalists Vineet I. Chopra, MBBS, MD, FACP, and Prasanth Gogineni, MD, together with a team of engineering students at UM, won the best of innovations award for their work on a Web site and iPhone application meant to replace the pager system healthcare teams currently use to communicate.
Using the application, known as MComm, hospitalists and other members of healthcare teams can delegate tasks to other physicians, as well as acknowledge when their own tasks are completed." Medical communication is fundamental to inpatient safety, quality, and cost of care," says Dr. Chopra, clinical assistant professor of medicine at UM. "We believe MComm represents a technological breakthrough in medical communication and the process of improving workflow. The use of electronic technology that organizes patients according to team and priority is unprecedented."
Inspirational Case
Twylla Tassava, MS, MD, administrator of academic consult service at Saint Joseph Mercy Hospital in Ann Arbor, Mich., described a novel way to treat intracranial pressure in patients with diabetes insipidus.
A 17-year-old female whose car was hit by a truck traveling 50 mph presented with a Glasgow coma score of 4 and multiple traumatic injuries. The hospitalist team was consulted on day two, when the patient released 1,790 cc of urine in one hour, an indication of diabetes insipudis (DI). When DI occurs within the first three days of brain injury, research shows the mortality rate to be 86%. Dr. Tassava’s team proposed using permissive hypernatremia to control the patient’s intracranial pressure.
The result: The patient recovered and is now a healthy 18-year-old college student with superior intellectual skills, normal motor function, and only mild memory impairment.
The Future Is Here
The hospital of the future will be smaller and more focused in its clinical care, and it will compete with cutting-edge technology available to patients in their homes, their shopping haunts, and their pharmacies, Narendra Kini, MD, MHA, said today during the pediatric keynote address at HM09 in Chicago.
Dr. Kini, president and CEO of Miami Children's Hospital, says changes affecting hospitalists—such as the automation of routine chores performed by hospitalists and the growth of retail clinics—might be just "whispers" now, but they likely will force fundamental changes in how pediatricians deliver care. And while the individual technologies might not seem like a paradigm shift, new products and procedures like Google Health will create better-educated patients who demand to be partners in their clinical decisions, Dr. Kini adds.
"The technology is irrelevant. What it is is the trends," Dr. Kini says. "When the market demands it, it is here to stay."
But electronic medical records (EMR) and other IT upgrades cost money that many children's hospitals simply don't have in today's economy, says Jeff Bennett, MD, FAAP, FHM, of Kentucky Children's Hospital in Lexington, Ky. "There's a huge cost attached," Dr. Bennett says. "We're talking about massive outlays of money."
Dr. Kini says he understands limitations and doesn't expect pediatric hospitalists or their institutions to adapt immediately. But he wants pediatric HM leaders to start looking at the next 10 years of industry growth to ensure they chart a growth curve.
"You're letting others dictate the parameters of your profession," Dr. Kini says. "You can't let government and payors do that. What does hospital medicine want to be in 2015? You should be answering that now."
Pleased to Meet You
HM09's exhibit hall was abuzz today as representatives from about 200 companies stood poised and ready to greet a steady stream of hospitalists making their way into the hall following this morning's plenary sessions.
The American College of Chest Physicians' (ACCP) booth, for example, was quickly enveloped by hospitalists trying out the society’s robotic patient stimulator. "We use [it] to train physicians at the variety of courses that the college offers," explains Chad Jackson, MS, RRT, CHT, senior manager of clinical skill and simulation education for the ACCP. "This robotic stimulator is very realistic: He breathes, he bleeds, he pees. We can shock him just like you do real patients."
This is Mark Jamieson's fourth SHM annual meeting. The regional vice president of PatientKeeper, an IT company based in Newton, Mass., says the feedback his company receives at annual meetings influences product development. "A lot of times you go to these shows and you talk to administrators and IT people," he says. "This is one of the very few shows where you talk to docs who are doing the work every day."
Jamieson, who expects to talk to more than 200 hospitalists today, says he's witnessed HM's growth firsthand. "Four years ago when we were in Chicago you'd talk to people and they'd say, 'Yea, we're starting a hospital group, there are four of us now and we're looking to get more.' Then you see those same people the next year and they say, 'There are five of us and we want one more.' The next year they'd say, 'There are 12 of us and we want to get to 20.' It's interesting to see this movement, this segment grow."
Training Time
Vascular access to a chicken, coding guidelines for NPs and PAs, and a new course to earn points toward the American Board of Internal Medicine’s Maintenance of Certification (MOC) program were among the highlights as SHM kicked off its annual meeting today in Chicago.
The first of four days at HM09 started with a slate of seven pre-courses to help hospitalists earn CME credit and provide participants a chance to learn about the latest HM trends. CME sessions included best practices for HM group management, critical-care medicine, approaches to clinical teaching, and the ever-popular didactic forum with hands-on procedures training.
"It's intimidating when you feel like you've gotten behind the curve," says Mark Ault, MD, director of the division of general internal medicine and assistant chairman for clinical affairs of the Department of Medicine at Cedars-Sinai Medical Center in Los Angeles. "It’s energizing to be brought back up" to speed.
An instructor, Dr. Ault was showcasing ultrasound technology in the crowded procedures session where physicians at his station practiced central-line placement on chickens. Attendance at each of the seven pre-courses was high. In fact, the room hosting the critical care program had half a dozen physicians sitting on the floor.
One of the more popular sessions was the certification pre-course, which featured automated keypads and a daylong sampling of board-like questions. Physicians’ answers to the questions—right and wrong—were displayed and discussed between participants and instructors.
Learning Curve
Katherine Dallow, MD, is attending HM09 to interact with colleagues, take a variety of CME courses, and to prepare for American Board of Internal Medicine (ABIM) board certification.
"I already feel smarter," says Dr. Dallow, a hospitalist at Beth Israel Deaconess Medical Center in Boston.
Dr. Dallow, one of more than 2,000 hospitalists attending the annual meeting, says she enjoys how SHM condenses all of its events into four days. "There is not a single period of time when there isn't a lecture you want to go to," she says.
In fact, HM09's course offerings are what motivated Gonzalo Eymin, MD, to travel to Chicago from his hometown of Santiago, Chile. Dr. Eymin, one of six internists at Clinical Hospital of the Catholic University of Chile who work primarily with inpatients, says he wants to learn how the HM model works in the U.S. The term "hospitalist" doesn't exist in Chile, he says.
"It's changing in the medical environment, but the economic people, the people who handle the money, [are who] we have to convince," he says.
Even though he's been a practicing hospitalist since 1993, J. Kevin Shustari, MD, FHM, is as confused as ever about reimbursement issues. That's why he's focusing on HM09's coding and billing sessions.
"There are things that are still nebulous," says Dr. Shustari, director of Hospital Internists of New London, an HM group based in Farmington, Conn. "One of the things that’s really gratifying to see is that everybody is struggling with the same issues across the country on a national level: billing, how to conduct a practice effectively, scheduling. We’re still an evolving specialty, so we’re all still learning."
Continuity of Care for Older Patients Weakens
The continuity of care for older patients decreased substantially from 1996 to 2006, according to a study published last month in the Journal of the American Medical Association (2009;301(16):1671-1680). And while the study period syncs up with the birth and development of HM, the study’s authors attribute only one-third of the decrease to the growth in hospitalist activity.
“In terms of the forces behind the phenomenon, I would not think hospitalists are the fundamental force behind decreasing continuity of care,” says James S. Goodwin, MD, who serves as director of the Sealy Center on Aging at the University of Texas Medical Branch in Galveston. The decrease, Dr. Goodwin says, can be better explained by a push from hospitals for more efficient and effective care at the lowest price possible.
Dr. Goodwin and other researchers analyzed Medicare records for more than 3 million hospital admissions, and concluded that outpatient-to-inpatient continuity with outpatient physicians decreased to 39.8% in 2006 from 50.5% in 1996. Accordingly, the study also found continuity to a primary-care physician (PCP) dropped to 31.9% from 44.3%. Patients with coexisting illnesses and the oldest patients were more likely to have continuity with their outpatient physicians and with their PCPs during hospitalization because of the severity and intricacies of their conditions.
Dr. Goodwin emphasizes that the study was based on a statistical analysis of Medicare data and doesn’t address quality of care issues or how the HM movement has tried to address efficiency concerns. He also acknowledges SHM and group leaders have been pushing quality initiatives in the past several years to improve the care continuum.
“Future research should explore whether the lack of continuity contributes to suboptimal care and whether interventions might ameliorate any detrimental effects of discontinuities,” the authors report.
To learn more about SHM’s quality initiative Project BOOST (Better Outcomes for Older Adults through Safe Transitions), visit www.hospitalmedicine.org/ResourceRoomRedesign/RR_CareTransitions/CT_Home.cfm.
HM Inside the Beltway
With all the healthcare policy changes President Obama is hoping to usher in over the next few years, it might be comforting to know that a hospitalist will be leading at least one of these initiatives. Patrick Conway, MD, has been selected to serve as executive director of the Department of Health and Human Services’ (HHS) Federal Coordinating Council for Comparative Effectiveness Research. Authorized by the American Recovery and Reinvestment Act, the council is responsible for allocating $1.1 billion for research that will compare various medical interventions.
Dr. Conway, a pediatric hospitalist who also is chief medical officer in the policy division of the Office of Secretary at HHS and does weekend rounds at Children’s National Medical Center in Washington, D.C., spoke with the TH eWire about his new role.
Some physicians are concerned the Centers for Medicare & Medicaid Services (CMS) will use the council’s findings to make payment decisions. Is this a valid worry?
They specifically put in the Recovery Act that this information should not be construed as mandates or clinical guidelines for coverage or payment. Our purview now is to fund the research that provides the information.
Is there a lack of comparative effectiveness research?
Yes. The reason this is important is there are so many common clinical decisions that as a clinician or patient we don’t know the answer to. I’ll give you one concrete example from last week when I was on service. A mother’s child who is neurologically impaired and therefore [has gastroesophageal reflux disease] asked me if [her child] should have surgery or medical management for this problem. So I have to have the painful conversation with her that there’s not good evidence to inform or start to point to whether for her child or the specific circumstances of her child she should get surgery or medical treatment.
How can get hospitalists get involved in this project?
Hospitalists should try to be on the agenda for public listening sessions to share their viewpoints. There will be spots for people to publicly read their testimony. There’ll also likely be the ability to submit comments online.
For more information or to sign up for the council’s Listening Sessions, visit www.hhs.gov/recovery/programs/cer/index.html.
Problem Docs
In a survey distributed to 50 member hospitals by Allen Rosenstein, MD, and his colleagues at VHA Inc. (an alliance of 2,400 nonprofit health care organizations) more than 1,500 participants responded to questions pertaining to their colleagues’ behavior.1 Of the 965 respondents to the question Have you ever witnessed disruptive behavior from a physician at your hospital?, nearly 68% said yes. Of the 675 nurses who responded to the question, 86% said they had witnessed it; almost half of the 249 physician respondents said they had witnessed it from their peers. Most respondents estimated the number of either nurses or physicians who exhibited disruptive behavior to be 1%-3%.
Of the 1,416 respondents who answered the question How often does physician disruptive behavior occur at your hospital?, 22% answered “weekly,” 26% answered “1 to 2 times per month,” and 33% answered “1 to 5 times per year.” Interestingly, 11% of the respondents said that such behavior by physicians never occurs, but 8% said it’s a daily occurrence.
—Scott Flanders, associate professor of medicine at the University of Michigan and director of the Hospitalist Program, Ann Arbor
Disruptive Behavior Defined
Disruptive behavior includes anything that interferes with the ability of a healthcare professional to effectively perform his or her duties or any behavior that undermines confidence in the hospital or its workers.2-4 In general, “disruptive” refers to behaviors that are abusive, disrespectful, sexual, angry, critical, negative, inappropriate, or unethical.2 (See “What Is Disruptive Behavior?” p. 40.) Individuals termed “impaired” are those who have active addictions or psychiatric problems and who exhibit the disruptive, intimidating, or abusive behavior.
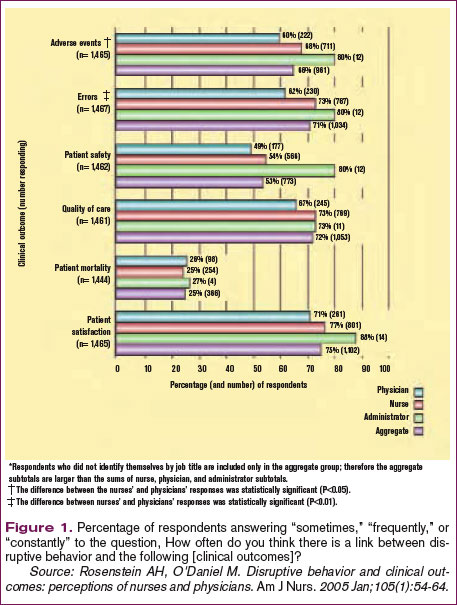
Most respondents to the above-mentioned survey reported that disruptive behavior had negative or worsening effects on stress, frustration, concentration, communication, collaboration, information transfer, and workplace relationships. (See Figure 1, p. 41.)
“Physicians whose performance persistently falters pose a substantial threat to patient safety that is often unrecognized or unsatisfactorily addressed in hospitals and other healthcare organizations,” writes Lucian Leape, MD, adjunct professor of health policy in the Department of Health Policy and Management at the Harvard School of Public Health.2
“Whoever tells you that they have not experienced any kind of disruptive behavior is either lying or … in neglect, because there are always certain types of disruptive behaviors [among healthcare workers],” says Martin Izakovic, MD, medical director, Hospitalist Program, Mercy Hospital, Iowa City, Iowa.
Effects of Disruptive Behavior
Can we go so far as to say disruptive behavior affects clinical outcomes?
“It has to,” says Scott Flanders, MD, associate professor of medicine at the University of Michigan and director of the hospitalist program, Ann Arbor, and member of SHM’s board of directors. “People clearly understand the importance of teamwork in hospital medicine. If one member of the team is dysfunctional from an emotional intelligence/behavioral standpoint, that drags down the team in its entirety and impacts patient care.”
Providing safe and effective care should be the first priority of all healthcare professionals. Excellent outcomes have been associated with procedural efficiency and the use of evidence-based standards and tools designed to reduce the likelihood of medical error. The effects of work relationships on clinical outcomes are less well documented, but attention to the matter is increasing in parallel with the focus on patient safety.3,5
Dr. Leape, one of the founders of the National Patient Safety Foundation, devotes concerted energy to making organizations aware of the need to upgrade systems to diagnose and treat this problem.2 “Physician performance failures are not rare and pose substantial threats to patient welfare and safety,” he writes. “Few hospitals respond to such failures promptly or effectively. Failure to ensure the quality and safety of the performance of colleagues is a breach of medicine’s fiduciary responsibility to the public.”6
When it comes to the issues of behavior, besides monitoring their own performance, what do hospitalists do when they come up against colleagues whose shortcomings require correction in order for the entire institution to uphold its legal obligation to each patient?
Physician, Heal Thyself
A study published by the Joint Commission on Accreditation of Healthcare Organizations (JCAHO) reported that 24% of sentinel events could be attributed to problems referred to as human factors, including communication gaps, staffing issues, and lack of teamwork.2, 5 The March 2004 issue of the Institute for Safe Medication Practice’s (ISMP) Medication Safety Alert reported that 7% of medication errors could be attributed to nurses feeling intimidated by physicians.4 And, as a response to this growing problem, the Institute of Medicine’s groundbreaking report on medical errors and patient safety, To Err is Human, shifted the focus from individual blame to that of preventing errors through efforts to “design safety into systems.”7
Dr. Flanders, who is also associate chief for the Division of General Internal Medicine for Inpatient Programs at the University of Michigan Medical Center (Ann Arbor), certainly understands the need to grapple with these types of issues. He is a member of his institution’s interdisciplinary Medical Staff Quality Committee (MSQC), which works to get a better handle on individual physician-level quality and performance.
“A lot stems from JCAHO’s increased focus on institutions doing a better job of trying to figure out, in short, who’s a good doctor and who’s a bad doctor,” he says, “And having medical staff appointments, privileging, and assessment of clinical skills be something a little more robust than just asking four of your friends if they think you’re a good doctor.”
One of the charges of the MSQC is developing a better system of tracking physicians’ clinical skills down to the individual level, which Dr. Flanders says is a difficult task. But their second charge is even more elusive to track: examining “the range of daily activities, behaviors, and actions that encompass being a physician.” As part of that, the committee deals with interpersonal relations: interactions with other staff and behavioral issues.
Make the Diagnosis, Initiate Treatment
As with most academic medical centers, when someone at MSQC observes a behavioral issue, that person’s supervisor (often a department chair) is the next place for the buck to stop. There are clearly defined lines of communication and “very robust systems” to deal with these kinds of things, says Dr. Flanders.
MSQC is assisting department chairs in dealing with a particular behavior or problem. “It is a venue to vet particular problems and solutions,” he says. Ultimately, if there are repeated transgressions and administration is not satisfied that their directives have been followed, the committee can recommend revoking a physician’s medical staff privileges and implementing a remediation plan.
Those robust systems have not differed in medical institutions for the last 50 years. “I think what has changed is people are less willing to tolerate this persistently,” says Dr. Flanders. “People used to put up with the disruptive physician, the badly behaving physician, and if he was bringing in lots of research dollars or if he was a great scientist, [they’d be more likely to] accept bad behavior.”
With the increased risk of litigation and the increasing scrutiny on patient safety, these offenses can no longer be tolerated.8
At a community hospital, the hierarchies and channels of communication for handling behavioral issues are different. Because of the different atmosphere and mood of a hospitalist department, says Dr. Izakovic, who is also adjunct clinical assistant professor, Department of Internal Medicine, University of Iowa–Carver College of Medicine, Iowa City, “plus word of mouth, it is easier to either enforce or, even more, lead by example [such that] certain behaviors are [encouraged] and certain behavior types are suppressed.”
Michael Zavarin, MD, director of the hospitalist group at Jordan Hospital in Plymouth, Mass., agrees that the environment of a community hospital may be different enough so that handling disruptive behavior also occurs differently than it does in an academic medical center.
Dr. Zavarin’s group is composed of 6.5 full-time day hospitalists and one full-time night hospitalist, as well as two nurse practitioners. Disruptive behavior in his group “really hasn’t been an issue, so I guess it is [dealt with] on an as-needed basis,” he says, and he can only speculate that the proper channel for dealing with situations involving disruptive behavior would be his institution’s medical executive committee.
When Dr. Izakovic faces situations involving disruptive behavior, he says, it is generally an instance in which a hospitalist has “a good intention, but feels pressured by overwork or patient care circumstances, or [has] difficulty communicating or handling the nursing staff … who perceive [the physician’s behavior] as being either threatening or disrespectful or just not called for.”9
He estimates that these instances occur most often when a physician’s expectations are not met regarding duties being performed in a timely manner. Formal complaints are rarely made in his group—maybe two or three times a year. In those cases, he is responsible for formal follow-up, which requires having a one-on-one conversation with the physician and reporting back to the risk management department. But he prefers doing what is necessary to avoid a situation getting to that stage. Informal behavior-related events happen at least monthly, he estimates. “I’d rather hear earlier than later, with no formal complaint, no formal channel,” says Dr. Izakovic.
Blow the Whistle
What are the political ramifications of blowing the whistle on a disruptive colleague? The University of Michigan’s MSQC was created largely to help get at that issue and to create a place where such subjects can be brought up anonymously. [It can be done] if the reporting person wishes. In most situations, there has been a concerted effort against backlash just as there is when incidents and errors are reported to improve or maintain patient safety.
“As the patient safety culture changes, and I think it is changing, it’s going to facilitate culture change on this issue, too,” says Dr. Flanders, “because I think people are beginning to recognize, appropriately so, that some of these behavioral issues are safety issues.”
Do nurses feel comfortable reporting such instances? “I think it depends on the personality,” says Dr. Izakovic. “Some do, and some feel less comfortable; there are nurses who never complain and nurses who always complain, like doctors and everybody else. But I think that the climate is changing [so] that raising your voice and pointing toward deficiency and/or imperfection is becoming, if not [socially] acceptable, then [at least] a standard of behavior.”
Behavior, Safety, and Quality
“Communication is the key to success in today’s medicine,” says Dr. Izakovic. “Specifically among hospitalists: You communicate with the family physician, the patient, the referring specialist, or specialist that you called, the family, nurses, and patients all around the hospital.” And although communication is the most important part of the hospitalist’s practice, he says, “it sometimes leads to tension, and it’s not as much the message that you want to convey as the form [you use] and how it is transferred.”
Nurses are key stakeholders in reporting these behaviors, just as they are encouraged to report errors as an expression of their professionalism. Certainly, Dr. Flanders says, reporting a behavioral incident is “a lot more personal and less tangible than reporting a wrong dose on a medication.”
He has noticed a dramatic increase in the number of messages he receives about inappropriate or dangerous behavior among physicians. Everyone has a bad day from time to time, he says, but at the end of the year, “if I have one physician who has been mentioned 15 times, that helps me assess that person overall as a professional and be able to say, ‘Listen, there may be some red flags here’ and [then we can] begin to intervene and try to change that behavior.”
Effective systems employed to adequately address performance problems should be fair, objective, and responsive, writes Dr. Leape.2,6 Strategies available to handle incidents of disruptive behavior include adopting performance standards for behavior as well as competence. All physicians should be required to acknowledge in writing that they have read and understood these standards and that persistent failure to uphold them will result in loss of clinical privileges. Adherence to standards should be monitored annually and provided confidentially to each individual. Finally, assessment and treatment programs must be available to manage all the underlying causes of sub-par performance. The long-term objective is to enable physicians to continue to practice, as opposed to attempting to “weed them out.”
Prevention
According to Balazs Zsenits, MD, director, Division of Hospital Medicine at Rochester General Hospital, Rochester, N.Y., two mechanisms should be applied when discussing the prevention of disruptive behavior.
“First, physician selection should be conducted by a thorough interview process,” he says, “including at least a full-day face-to-face interview, discussion with previous employers, assessment of team-participation experience, and communication skills.”
Also, you need to clarify your expectations by means of “written policies, leading by example, promoting this culture in meetings, etc., and proactively monitoring performance,” says Dr. Zsenits. That means talking with doctors, nurses, and families and actively looking for feedback. “This process is time-intensive and may be under-recognized during resource allocation, but I believe it is a tool that may prevent this and many other common problems from growing out of control.”
A director of a hospital medicine group may have to deal with the perception of an escalating number of complaints about physician behaviors. “The growth of a hospitalist program that goes from seeing a small fraction of patients within a hospital to seeing the majority of medical admissions creates challenges beyond just simply managing the increased number of doctors and complaints,” says Dr. Zsenits. “Our co-workers and stakeholders might develop an impression that ‘most doctor problems’ in the hospital are related to the hospitalists. Even if this is [because] the hospitalists actually take care of most patients in house, and each hospitalist takes care of many more patients than private attendings used to, avoiding the perception that this single group is associated with most complaints is a difficult task.”
Although hospitalists’ focus on teamwork and quality of care may improve the actual statistics, he adds, “some factors may create more feedback, including more complaints; for example, being new docs to patients and relatives at times of stress, and having a closer working relationship with nurses, which may [be problematic] by creating heightened expectations or [because you are working with] a young workforce … .”
Conclusion
Hospitalists can increase their capacities to observe, document, address, consult on, and refer instances of disruptive behavior appropriately. Although incidents of disruption may be relatively infrequent and may involve a few perpetrators, when they occur they should be addressed promptly and appropriately. Strategies to address the issue of disruptive behavior include conducting an organizational assessment; opening up lines of communication, including inviting nurses as well as physicians to submit anonymous notes or suggestions; and increasing staff awareness of the nature and severity of the issue.
As Dr. Flanders and colleagues have written, hospitalists should be the “fulcrum” we use to improve patient safety.10 The advantage of having just a few hospitalists influencing the healthcare of many patients can be a detriment if a colleague is a “problem doctor.” TH
Andrea Sattinger is a frequent contributor to The Hospitalist.
References
- Rosenstein AH, O'Daniel M. Impact and implications of disruptive behavior in the perioperative arena. J Am Coll Surg. 2006 Jul;203(1):96-105. Epub 2006 Jun 5.
- Leape LL, Fromson JA. Problem doctors: is there a system-level solution? Ann Intern Med. 2006 Jan 17;144(2):107-115.
- Porto G, Lauve R. Disruptive clinician behavior: a persistent threat to patient safety. Patient Safety Qual Healthcare. 2006 Jul-Aug;3:16-24.
- Institute for Safe Medication Practice. Intimidation: practitioners speak up about this unresolved problem (Part I) ISMP Medication Safety Alert. Available at: www.ismp.org/MSAarticles/intimidation.htm. Accessed on October 16, 2006.
- Rosenstein AH, O'Daniel M. Disruptive behavior and clinical outcomes: perceptions of nurses and physicians. Am J Nurs. 2005 Jan;105(1):54-64; quiz 64-55.
- Leape LL. Physician self-examination. Int J Qual Health Care. 1998;10(4):289-290.
- Kohn L, Corrigan J, Donaldson M, eds. To Err is Human: Building a Safer Health System. Committee on Quality of Health Care in America, Institute of Medicine. Washington, DC: National Academies Press; 2000.
- Linney BJ. Confronting the disruptive physician. Physician Exec. 1997 Sep-Oct;23(7):55-58.
- Localio AR, Lawthers AG, Brennan TA, et al. Relation between malpractice claims and adverse events due to negligence. Results of the Harvard Medical Practice Study III. N Engl J Med. 1991 Jul 25;325(4):245-251.
- Flanders SA, Kaufman SR, Saint S. Hospitalists as emerging leaders in patient safety: targeting a few to affect many. J Patient Safety. 2005 Jun;1(2):78-82.
In a survey distributed to 50 member hospitals by Allen Rosenstein, MD, and his colleagues at VHA Inc. (an alliance of 2,400 nonprofit health care organizations) more than 1,500 participants responded to questions pertaining to their colleagues’ behavior.1 Of the 965 respondents to the question Have you ever witnessed disruptive behavior from a physician at your hospital?, nearly 68% said yes. Of the 675 nurses who responded to the question, 86% said they had witnessed it; almost half of the 249 physician respondents said they had witnessed it from their peers. Most respondents estimated the number of either nurses or physicians who exhibited disruptive behavior to be 1%-3%.
Of the 1,416 respondents who answered the question How often does physician disruptive behavior occur at your hospital?, 22% answered “weekly,” 26% answered “1 to 2 times per month,” and 33% answered “1 to 5 times per year.” Interestingly, 11% of the respondents said that such behavior by physicians never occurs, but 8% said it’s a daily occurrence.
—Scott Flanders, associate professor of medicine at the University of Michigan and director of the Hospitalist Program, Ann Arbor
Disruptive Behavior Defined
Disruptive behavior includes anything that interferes with the ability of a healthcare professional to effectively perform his or her duties or any behavior that undermines confidence in the hospital or its workers.2-4 In general, “disruptive” refers to behaviors that are abusive, disrespectful, sexual, angry, critical, negative, inappropriate, or unethical.2 (See “What Is Disruptive Behavior?” p. 40.) Individuals termed “impaired” are those who have active addictions or psychiatric problems and who exhibit the disruptive, intimidating, or abusive behavior.
Most respondents to the above-mentioned survey reported that disruptive behavior had negative or worsening effects on stress, frustration, concentration, communication, collaboration, information transfer, and workplace relationships. (See Figure 1, p. 41.)
“Physicians whose performance persistently falters pose a substantial threat to patient safety that is often unrecognized or unsatisfactorily addressed in hospitals and other healthcare organizations,” writes Lucian Leape, MD, adjunct professor of health policy in the Department of Health Policy and Management at the Harvard School of Public Health.2
“Whoever tells you that they have not experienced any kind of disruptive behavior is either lying or … in neglect, because there are always certain types of disruptive behaviors [among healthcare workers],” says Martin Izakovic, MD, medical director, Hospitalist Program, Mercy Hospital, Iowa City, Iowa.
Effects of Disruptive Behavior
Can we go so far as to say disruptive behavior affects clinical outcomes?
“It has to,” says Scott Flanders, MD, associate professor of medicine at the University of Michigan and director of the hospitalist program, Ann Arbor, and member of SHM’s board of directors. “People clearly understand the importance of teamwork in hospital medicine. If one member of the team is dysfunctional from an emotional intelligence/behavioral standpoint, that drags down the team in its entirety and impacts patient care.”
Providing safe and effective care should be the first priority of all healthcare professionals. Excellent outcomes have been associated with procedural efficiency and the use of evidence-based standards and tools designed to reduce the likelihood of medical error. The effects of work relationships on clinical outcomes are less well documented, but attention to the matter is increasing in parallel with the focus on patient safety.3,5
Dr. Leape, one of the founders of the National Patient Safety Foundation, devotes concerted energy to making organizations aware of the need to upgrade systems to diagnose and treat this problem.2 “Physician performance failures are not rare and pose substantial threats to patient welfare and safety,” he writes. “Few hospitals respond to such failures promptly or effectively. Failure to ensure the quality and safety of the performance of colleagues is a breach of medicine’s fiduciary responsibility to the public.”6
When it comes to the issues of behavior, besides monitoring their own performance, what do hospitalists do when they come up against colleagues whose shortcomings require correction in order for the entire institution to uphold its legal obligation to each patient?
Physician, Heal Thyself
A study published by the Joint Commission on Accreditation of Healthcare Organizations (JCAHO) reported that 24% of sentinel events could be attributed to problems referred to as human factors, including communication gaps, staffing issues, and lack of teamwork.2, 5 The March 2004 issue of the Institute for Safe Medication Practice’s (ISMP) Medication Safety Alert reported that 7% of medication errors could be attributed to nurses feeling intimidated by physicians.4 And, as a response to this growing problem, the Institute of Medicine’s groundbreaking report on medical errors and patient safety, To Err is Human, shifted the focus from individual blame to that of preventing errors through efforts to “design safety into systems.”7
Dr. Flanders, who is also associate chief for the Division of General Internal Medicine for Inpatient Programs at the University of Michigan Medical Center (Ann Arbor), certainly understands the need to grapple with these types of issues. He is a member of his institution’s interdisciplinary Medical Staff Quality Committee (MSQC), which works to get a better handle on individual physician-level quality and performance.
“A lot stems from JCAHO’s increased focus on institutions doing a better job of trying to figure out, in short, who’s a good doctor and who’s a bad doctor,” he says, “And having medical staff appointments, privileging, and assessment of clinical skills be something a little more robust than just asking four of your friends if they think you’re a good doctor.”
One of the charges of the MSQC is developing a better system of tracking physicians’ clinical skills down to the individual level, which Dr. Flanders says is a difficult task. But their second charge is even more elusive to track: examining “the range of daily activities, behaviors, and actions that encompass being a physician.” As part of that, the committee deals with interpersonal relations: interactions with other staff and behavioral issues.
Make the Diagnosis, Initiate Treatment
As with most academic medical centers, when someone at MSQC observes a behavioral issue, that person’s supervisor (often a department chair) is the next place for the buck to stop. There are clearly defined lines of communication and “very robust systems” to deal with these kinds of things, says Dr. Flanders.
MSQC is assisting department chairs in dealing with a particular behavior or problem. “It is a venue to vet particular problems and solutions,” he says. Ultimately, if there are repeated transgressions and administration is not satisfied that their directives have been followed, the committee can recommend revoking a physician’s medical staff privileges and implementing a remediation plan.
Those robust systems have not differed in medical institutions for the last 50 years. “I think what has changed is people are less willing to tolerate this persistently,” says Dr. Flanders. “People used to put up with the disruptive physician, the badly behaving physician, and if he was bringing in lots of research dollars or if he was a great scientist, [they’d be more likely to] accept bad behavior.”
With the increased risk of litigation and the increasing scrutiny on patient safety, these offenses can no longer be tolerated.8
At a community hospital, the hierarchies and channels of communication for handling behavioral issues are different. Because of the different atmosphere and mood of a hospitalist department, says Dr. Izakovic, who is also adjunct clinical assistant professor, Department of Internal Medicine, University of Iowa–Carver College of Medicine, Iowa City, “plus word of mouth, it is easier to either enforce or, even more, lead by example [such that] certain behaviors are [encouraged] and certain behavior types are suppressed.”
Michael Zavarin, MD, director of the hospitalist group at Jordan Hospital in Plymouth, Mass., agrees that the environment of a community hospital may be different enough so that handling disruptive behavior also occurs differently than it does in an academic medical center.
Dr. Zavarin’s group is composed of 6.5 full-time day hospitalists and one full-time night hospitalist, as well as two nurse practitioners. Disruptive behavior in his group “really hasn’t been an issue, so I guess it is [dealt with] on an as-needed basis,” he says, and he can only speculate that the proper channel for dealing with situations involving disruptive behavior would be his institution’s medical executive committee.
When Dr. Izakovic faces situations involving disruptive behavior, he says, it is generally an instance in which a hospitalist has “a good intention, but feels pressured by overwork or patient care circumstances, or [has] difficulty communicating or handling the nursing staff … who perceive [the physician’s behavior] as being either threatening or disrespectful or just not called for.”9
He estimates that these instances occur most often when a physician’s expectations are not met regarding duties being performed in a timely manner. Formal complaints are rarely made in his group—maybe two or three times a year. In those cases, he is responsible for formal follow-up, which requires having a one-on-one conversation with the physician and reporting back to the risk management department. But he prefers doing what is necessary to avoid a situation getting to that stage. Informal behavior-related events happen at least monthly, he estimates. “I’d rather hear earlier than later, with no formal complaint, no formal channel,” says Dr. Izakovic.
Blow the Whistle
What are the political ramifications of blowing the whistle on a disruptive colleague? The University of Michigan’s MSQC was created largely to help get at that issue and to create a place where such subjects can be brought up anonymously. [It can be done] if the reporting person wishes. In most situations, there has been a concerted effort against backlash just as there is when incidents and errors are reported to improve or maintain patient safety.
“As the patient safety culture changes, and I think it is changing, it’s going to facilitate culture change on this issue, too,” says Dr. Flanders, “because I think people are beginning to recognize, appropriately so, that some of these behavioral issues are safety issues.”
Do nurses feel comfortable reporting such instances? “I think it depends on the personality,” says Dr. Izakovic. “Some do, and some feel less comfortable; there are nurses who never complain and nurses who always complain, like doctors and everybody else. But I think that the climate is changing [so] that raising your voice and pointing toward deficiency and/or imperfection is becoming, if not [socially] acceptable, then [at least] a standard of behavior.”
Behavior, Safety, and Quality
“Communication is the key to success in today’s medicine,” says Dr. Izakovic. “Specifically among hospitalists: You communicate with the family physician, the patient, the referring specialist, or specialist that you called, the family, nurses, and patients all around the hospital.” And although communication is the most important part of the hospitalist’s practice, he says, “it sometimes leads to tension, and it’s not as much the message that you want to convey as the form [you use] and how it is transferred.”
Nurses are key stakeholders in reporting these behaviors, just as they are encouraged to report errors as an expression of their professionalism. Certainly, Dr. Flanders says, reporting a behavioral incident is “a lot more personal and less tangible than reporting a wrong dose on a medication.”
He has noticed a dramatic increase in the number of messages he receives about inappropriate or dangerous behavior among physicians. Everyone has a bad day from time to time, he says, but at the end of the year, “if I have one physician who has been mentioned 15 times, that helps me assess that person overall as a professional and be able to say, ‘Listen, there may be some red flags here’ and [then we can] begin to intervene and try to change that behavior.”
Effective systems employed to adequately address performance problems should be fair, objective, and responsive, writes Dr. Leape.2,6 Strategies available to handle incidents of disruptive behavior include adopting performance standards for behavior as well as competence. All physicians should be required to acknowledge in writing that they have read and understood these standards and that persistent failure to uphold them will result in loss of clinical privileges. Adherence to standards should be monitored annually and provided confidentially to each individual. Finally, assessment and treatment programs must be available to manage all the underlying causes of sub-par performance. The long-term objective is to enable physicians to continue to practice, as opposed to attempting to “weed them out.”
Prevention
According to Balazs Zsenits, MD, director, Division of Hospital Medicine at Rochester General Hospital, Rochester, N.Y., two mechanisms should be applied when discussing the prevention of disruptive behavior.
“First, physician selection should be conducted by a thorough interview process,” he says, “including at least a full-day face-to-face interview, discussion with previous employers, assessment of team-participation experience, and communication skills.”
Also, you need to clarify your expectations by means of “written policies, leading by example, promoting this culture in meetings, etc., and proactively monitoring performance,” says Dr. Zsenits. That means talking with doctors, nurses, and families and actively looking for feedback. “This process is time-intensive and may be under-recognized during resource allocation, but I believe it is a tool that may prevent this and many other common problems from growing out of control.”
A director of a hospital medicine group may have to deal with the perception of an escalating number of complaints about physician behaviors. “The growth of a hospitalist program that goes from seeing a small fraction of patients within a hospital to seeing the majority of medical admissions creates challenges beyond just simply managing the increased number of doctors and complaints,” says Dr. Zsenits. “Our co-workers and stakeholders might develop an impression that ‘most doctor problems’ in the hospital are related to the hospitalists. Even if this is [because] the hospitalists actually take care of most patients in house, and each hospitalist takes care of many more patients than private attendings used to, avoiding the perception that this single group is associated with most complaints is a difficult task.”
Although hospitalists’ focus on teamwork and quality of care may improve the actual statistics, he adds, “some factors may create more feedback, including more complaints; for example, being new docs to patients and relatives at times of stress, and having a closer working relationship with nurses, which may [be problematic] by creating heightened expectations or [because you are working with] a young workforce … .”
Conclusion
Hospitalists can increase their capacities to observe, document, address, consult on, and refer instances of disruptive behavior appropriately. Although incidents of disruption may be relatively infrequent and may involve a few perpetrators, when they occur they should be addressed promptly and appropriately. Strategies to address the issue of disruptive behavior include conducting an organizational assessment; opening up lines of communication, including inviting nurses as well as physicians to submit anonymous notes or suggestions; and increasing staff awareness of the nature and severity of the issue.
As Dr. Flanders and colleagues have written, hospitalists should be the “fulcrum” we use to improve patient safety.10 The advantage of having just a few hospitalists influencing the healthcare of many patients can be a detriment if a colleague is a “problem doctor.” TH
Andrea Sattinger is a frequent contributor to The Hospitalist.
References
- Rosenstein AH, O'Daniel M. Impact and implications of disruptive behavior in the perioperative arena. J Am Coll Surg. 2006 Jul;203(1):96-105. Epub 2006 Jun 5.
- Leape LL, Fromson JA. Problem doctors: is there a system-level solution? Ann Intern Med. 2006 Jan 17;144(2):107-115.
- Porto G, Lauve R. Disruptive clinician behavior: a persistent threat to patient safety. Patient Safety Qual Healthcare. 2006 Jul-Aug;3:16-24.
- Institute for Safe Medication Practice. Intimidation: practitioners speak up about this unresolved problem (Part I) ISMP Medication Safety Alert. Available at: www.ismp.org/MSAarticles/intimidation.htm. Accessed on October 16, 2006.
- Rosenstein AH, O'Daniel M. Disruptive behavior and clinical outcomes: perceptions of nurses and physicians. Am J Nurs. 2005 Jan;105(1):54-64; quiz 64-55.
- Leape LL. Physician self-examination. Int J Qual Health Care. 1998;10(4):289-290.
- Kohn L, Corrigan J, Donaldson M, eds. To Err is Human: Building a Safer Health System. Committee on Quality of Health Care in America, Institute of Medicine. Washington, DC: National Academies Press; 2000.
- Linney BJ. Confronting the disruptive physician. Physician Exec. 1997 Sep-Oct;23(7):55-58.
- Localio AR, Lawthers AG, Brennan TA, et al. Relation between malpractice claims and adverse events due to negligence. Results of the Harvard Medical Practice Study III. N Engl J Med. 1991 Jul 25;325(4):245-251.
- Flanders SA, Kaufman SR, Saint S. Hospitalists as emerging leaders in patient safety: targeting a few to affect many. J Patient Safety. 2005 Jun;1(2):78-82.
HM09 Keynote Speaker: Let's Work Together
Mark Chassin, MD, isn’t quite sure what he’ll say when he steps to the podium to deliver the keynote address at sold-out HM09.
“At the pace everything is changing, it’s hard to know exactly what I’ll want to talk about,” says Chassin, president of The Joint Commission.
He is certain about one thing, however: the importance of reaching out to and connecting with hospital-based physicians. “Accreditation alone is not enough,” Dr. Chassin says. “We need active engagement of the hospital medicine practitioners in all of the quality and safety initiatives The Joint Commission has set in motion.
“It’s also important," he continues, "for us to hear from physicians on the front lines ... about how our efforts are working and where we need to fill in gaps.”
Since taking over as president of The Joint Commission in January 2008, Dr. Chassin has pushed for the organization to adopt business management strategies like Six Sigma and the Toyota Production System. The goal is to work with hospitals and health systems that also use these strategies to rectify recurring safety and quality problems, such as medication reconciliation, infection control breakdown, and wrong-site/wrong-side surgery.
His ultimate goal is to make sure the commission and organizations that deliver care work together to transform healthcare into a high-reliability industry.
“The legacy of what The Joint Commission used to be sometimes gets caricatured as a bunch of silly rules and hoops people have to jump through that have nothing to do with patient care,” Dr. Chassin says. “That caricature really is a thing of the past.”
To read an in-depth interview with Dr. Chassin, see the June issue of The Hospitalist.
HM 2009 will take place May 14-17 in Chicago. For more information, visit SHM's Web site.
Nurses Honor New Jersey Hospitalist
Sutharsanam Veerappan, MD, a pediatric hospitalist, learned while on a family vacation to India that his New Jersey hospital had chosen him as 2008's Physician of the Year. So he did what anyone 7,000 miles from work would do: He cut short the family time to receive an honor from his other family.
"Dr. Veerappan just gets it," says Jeanne Whaley, RN, manager of the Maternity and Newborn Care Center at Hunterdon Medical Center (HMC) in Raritan Township, N.J. "He understands what it means to be a team."
HMC nurses say honoring a hospitalist is a testament to how comfortable the staff is with having a full-time hospitalist to rely on, as opposed to the pre-HM model of private-practice doctors making rounds.
Dr. Veerappan, medical director for newborn and pediatric services, is a familiar face in the maternity ward, as well as the pediatrics and emergency departments. He's known for bringing in coffee cake in the mornings, pizza on busy days, and even making accommodations for nursing staff to attend conferences.
Hospitalists aren't "always dashing out to the office," says Ardath Youngblood, RN, MN, a perinatal educator at HMC. "There's a depth of relationship that develops sometimes with a hospitalist because they're around more and available more. It definitely builds teamwork."
—Sutharsanam Veerappan, MD
For his part, Dr. Veerappan shies away from the attention he's been given for receiving the award. He is proud of the accomplishment, but he still views HM as a team sport that involves nurses and physicians from other departments. Still, he acknowledges his constant presence in the hospital affords him advantages in working with both staff and patients.
"The communication is the key part here," Dr. Veerappan says. "When [nurses or patients] have questions, we just show up in the room and answer them."