User login
Viewpoints from the Executive Suite and the Bedside
Like many family medicine practices, Chris Heck, MD’s, group in Waynesboro, Va., made the tough decision two years ago to limit their practice to outpatient services. According to Dr. Heck, one partner, Tom McNamara, DO, MMM, CPE, was reluctant to give up hospital work.
So, maybe it’s not surprising Dr. McNamara now fills a unique dual role, as president and chief executive officer and a working hospitalist at Carilion Stonewall Jackson Hospital in Lexington, Va. Dr. McNamara is the first physician CEO at Stonewall Jackson, and the first doctor of osteopathic medicine CEO at one of the hospitals in the Carilion Clinic, a Virginia-based multispecialty organization with more than 400 doctors and eight hospitals.
Serving double duty as CEO and a hospitalist at a critical-access, 25-bed hospital seems to suit Dr. McNamara. “It has allowed me to quickly and thoroughly learn about our staff and our patients,” he says. “And it has given me insight into quality, cost, and feedback programs from both sides, so that I can make informed decisions.”
Both Perspectives
When Dr. McNamara first agreed to be CEO and work shifts, he feared he might have difficulty considering doctors’ requests impartially, or that physicians might feel uneasy working with their boss during patient encounters.
Neither fear has panned out. He says the physicians and recruits he works with generally feel they have an advocate in the executive suite. In addition, when they come to him with suggestions and requests, “they bring very thorough arguments because they know I know exactly where they’re coming from,” he adds.
Dr. McNamara already has put this unique perspective to use several times since taking the jobs in April. For example, when he started the staff was experiencing glitches when filing lab reports in patients’ electronic health records. “They were changing the process when I came in, but since I had broad experiences,” he says, “I was able to help make the changes smoother.”
Dr. McNamara also improved the hospital’s hand-washing practices by having dispensers placed in hallways, where their use could be more readily observed. The idea was to increase documentation of hand washing. “I had this thought because I had used the dispensers [at another hospital] myself,” he says.
Dr. McNamara’s hands-on experience also has made the hospitalist recruiting process easier, according to Howard Graman, MD, medical director of Carilion. “[Dr. McNamara] knows the profile of the job and the kind of person who would like it,” Dr. Graman says. “He’s a savvy judge of character.”
Double-Duty Accolades
Dr. McNamara’s bosses are happy with how he has handled the juggling act, so far. Dr. Graman says Dr. McNamara has helped him to better understand the institution, how to make improvements, and how to respond to staff. “It’s great for employees to see the head of the hospital working,” he says.
The man Dr. McNamara replaced, Steve Arner, now vice president of cardiac and vascular services for a larger Carilion hospital, agrees there are advantages to having the hospital’s CEO also be a working physician. “On the floor or in the emergency department, [Tom] can test the processes, especially new ones,” Arner says, “and see first hand the impact on practitioners and patients.”
Dr. McNamara peers think he’s effective in both of his roles. “As CEO, Tom may touch a dozen topics in a given day,” Arner says. “The boiler breaks, he does a community lecture, talks to unhappy cafeteria workers. It’s so many different things.” Because Dr. McNamara is a working physician, his words greatly affect the groups he lectures. “The fact that he is still treating patients builds confidence, especially in a small community, that the hospital is a high-quality institution,” Dr. Arner adds.
Even the nursing department is in Dr. McNamara’s corner. Shelia Hatmaker, Stonewall Jackson’s director of nursing for more than two years, appreciates the fact Dr. McNamara respects the role of nurses and understands how to address nurse-specific issues. “Tom values the partnership with nurses who are with the patients all day,” Hatmaker says. “He is my boss, but he respects and seeks out opinions from a nursing point of view.”
As CEO, “Tom can create an environment where the staff feels safe to practice and speak up when something is wrong,” she says. “They have to feel comfortable saying they almost made a mistake, because it’s often the system that needs changing.”
Agent of Change
Those system changes are now Dr. McNamara’s problem, but he’s well prepared, having earned a master’s degree in medical management from Carnegie Mellon University in 2006, 19 years after finishing his residency in family practice at McKeesport Hospital in Pennsylvania, and receiving certifications from the American College of Physician Executives.
Nevertheless, Dr. McNamara had serious reservations about leaving clinical medicine. “Clinical medicine is why I became a doctor in the first place,” he says.
Working as a hospitalist and serving as the hospital’s chief executive allows Dr. McNamara to provide patient care and lead at the same time, setting an example for admission-time standards, physician-to-physician communication, and relationships with specialists, nurses, and ancillary staff, says Dennis Means, MD, also a member of the Carilion management team. From a practical point of view, it also gives the regularly rotating doctors a break. Dr. McNamara works weekend shifts every few weeks.
Still, the new CEO has more than patient care to consider. “I’ve really been struck by how high costs are and how much reimbursements are being cut back,” he says. “I was always aware of cost issues, but now I have to figure out the best way to use our scarce resources. It doesn’t change what I do for patients, but I’m even more aware that money is very tight and I have to recognize that we can’t meet every need.”
It helps to be part of the larger Carilion system, as Stonewall Jackson is in the process of integrating with the other Carilion facilities. “We are a very small facility providing basic services, but we can tap into the capabilities of much larger Carilion institutions and people to serve this community,” Dr. McNamara says.
Hatmaker, the nursing director, isn’t surprised to hear that’s how Dr. McNamara the new CEO feels. “That’s Tom,” she says. “He wants to take care of this community. And the patients just might have the head of the hospital as their doctor. How cool.” TH
Eliminate Errors
Last summer, 17 infants mistakenly were given incorrect doses of the blood-thinning medication heparin during their stay at a hospital in Corpus Christi, Texas. Two of those infants died.
Thousands of medication errors, including the ordering, dispensing and monitoring of medication, occur each year in hospitals throughout the country. Several studies in recent years have shown that injuries resulting from adverse drug events (ADEs) account for up to 41 percent of all hospital admissions and more than two billion dollars annually in inpatient costs.
Whether a patient is an infant, child or adult, the potential for medication errors begins as soon as a patient reaches the hospital and continues well after discharge.
“Medication errors often start when the patient comes to the emergency room,” says Sandeep Sachdeva, MD, clinical assistant professor at University of Washington Medical Center in Seattle. “Patients usually don’t carry a detailed list of the drugs they’re taking. If they come in late at night, it may not be possible for us to get an alternative list.”
That’s why it’s important for drug reconciliation to begin at the time of arrival, Dr. Sachdeva says. “In my opinion, medication reconciliation is a dynamic process, and medication reconciliation is a daily process. When patients come into the hospital, certain medications automatically get changed to the medications that are available in hospitals, and anytime there is a change in medications, it’s an opportunity for an error.”
Opportunities for Error
Even if a patient arrives with a full medication list, once he or she transfers from one hospital unit to another or is discharged, the opportunity for errors increases exponentially, says Julia Wright, MD, director of hospital medicine at University of Wisconsin Hospital and associate professor of medicine at The University of Wisconsin School of Medicine and Public Health in Madison, Wis.
“What providers have to remember is that there are multiple stages at which mistakes can be made,” says William Basco, MD, director of general pediatrics at the Medical University of South Carolina in Charleston, S.C. The physician or nurse practitioner can make a mistake writing the order; a nurse can misread the order; a pharmacist can incorrectly prepare the order; and a floor nurse can make a mistake drawing up the medication or delivering it, Dr Basco explains.
What’s a Hospitalist To Do?
Although the opportunities for medication errors are many, Dr. Basco says hospitalists should take several steps to mitigate medication errors. First, he says, limit verbal orders for drugs. Instead, write the order out, print legibly and refrain from using abbreviations. He suggests writing out numbers and placing them inside parentheses after the corresponding numeral.
“It’s important to write out medications that could be confused with the abbreviations of another medication, and avoid shorthand notations that can be confused with a number when it’s actually a letter,” Dr. Wright says.
Second, avoid trailing zeros. “If you want to give 10 ml of something, write it as 10 and spell out ml, not 10.0,” Dr. Basco says. “Don’t use unnecessary decimal places, especially when the order is faxed. A 10.0 could be read as 100 if the decimal point doesn’t come across clearly. That’s how you get a 10-fold dosing error.”
Additionally, the patient’s weight should be checked carefully and rechecked, especially when ordering riskier drugs, such as anti-coagulants and narcotics. “Our hospital pharmacy requires a weight on every drug order, so they can do calculations on whether the dose is appropriate,” Dr. Basco says. “They are requiring us to write down the drug that we want to deliver and its dose, as well as the milligram per kilogram per dose we want to deliver, so they can double check whether we’ve done our dosage calculation properly.”
Computers to the Rescue
More and more hospitals are moving toward electronic recordkeeping, including computerized physician order entry, also known as CPOE. “Although electronic records won’t eliminate errors, they tend to reduce them, especially when they include decision support,” Dr. Sachdeva says. “Decision support means that this is a ‘smart’ program that can look at the dose you ordered and tell you if the dose is correct based on the patient’s weight. It also scans the other medications that the person is on and make sure there are no allergies or potential drug interactions. Or, it can even disallow you ordering drugs that it knows will interact or know will cause allergies. The system won’t let you.”
For those hospitalists still required to write out orders, Randy Ferrance, DC, MD, a dual boarded internal medicine and pediatrics hospitalist at Riverside Tappahannock Hospital in Tappahannock, Va., says multiple checks and balances, from the time the drug is ordered to the time the patient receives the drug, are essential for reducing errors. “We write the order for the expected dosage per kilo and then the charge nurse checks our math, and then the pharmacist checks not only the math, but the expected dosage for the patient,” Dr. Ferrance says. Understanding the proper dosing range for specific drugs, he adds, is as crucial as is taking into account renal function.
Check with the Pharmacist
More hospitals are including pharmacists in their multi-disciplinary rounds, says Brian Bossard, MD, founder and director of Inpatient Physician Associates in Lincoln, Neb.
“We have a single pharmacist who works with each of our teams and functions as a liaison with the rest of the pharmacist staff in the hospital,” Dr. Bossard says. “This pharmacist reviews the medication list of each of our patients and focuses on patient safety initiatives, drug interactions and cost. The pharmacist writes up the verbal order after he talks to us, so there is no delay in getting the order on the chart. That, I think, goes a long way, in preventing drug-drug interactions that can lead to problems. Really, every day there are circumstances that are identified by the pharmacist that we change, so every day we’re seeing the benefits of this relationship.”
Dr. Bossard says his group has a second pharmacist who provides requested educational information on a day-to-day basis, in terms of article and literature reviews. “It’s a great relationship,” he says. “They love to do that, and we love the information that they get for us.”
Work as a Team
Sondra May, PharmD, medications safety coordinator at the University of Colorado Hospital, says teamwork is the best way to avoid errors. “This would include the pharmacist who would determine appropriate in-house drug therapy, whether that would be determining dosage or specific drugs for specific patients’ needs. It would include making sure they’re providing sufficient information to the nurse at the bedside,” Dr. May says. “I think one of the biggest contributing factors to medication errors is poor communication.”
Dr. Sachdeva agrees direct communication is vital.
“I think hospitalists are in a unique position because we interact with almost everyone who cares for the patient,” Dr. Sachdeva says. “When I’m working, I’m talking continuously with the nurses. I think it’s important to have an open dialogue. I’ve learned that if I make a change, whether it’s on paper or on the computer, if I talk to the nurse, there is more chance it will happen earlier and it will happen correctly.”
When Errors Occur
Early detection of errors is imperative. “You want to make sure patient monitoring is frequent and specialized to the drugs they’re receiving,” Dr. May says.
If an overdose occurs before an error is detected, it’s important to strategize the treatment based on the error in question. Treatment depends on how much drug the patient received and what specific drug was given in error, Dr. May explains.
“Many hospitals have a rapid response team that will go to the bedside of patients who are showing signs of acute change in their condition, including overdoses,” Dr. Bossard says. ”The response team will assess that patient immediately and then contact the primary care physician or the hospitalist to address those issues. On the process management side, each sentinel event is reviewed in exceedingly fine detail, so processes can be adjusted and made safer in the future.”
In fact, more hospitals are creating an environment where it’s OK to admit that you’ve made a mistake. “We need to move away from blame and realize that these are patient safety issues about which we all need to be honest,” Dr. Basco says. “Part of that means full disclosure to the patient once you detect that an error has occurred. There’s no benefit to you or from a medical-legal standpoint of trying to keep it hush-hush. In fact, there’s a lot of evidence that disclosing [the error] early is beneficial.”
The Usual Suspects
A few classes of drugs are considered especially risky, Dr. May says, including narcotics, anticoagulants and insulin. These drugs aren’t necessarily involved in medication errors at a higher frequency, but they receive a lot of attention because, when an error does occur with these medications, the outcome tends to be more serious, she says.
Anti-epileptic agents, chemotherapeutic agents, and immuno-suppressants, especially in patients who have undergone transplants, can be risky. “What may be a therapeutic level for one patient may not be for a transplant patient,” Dr. Wright says.
Dr. Ferrance says he finds narcotics to be the riskiest class of drugs, especially in post-operative patients. “The dosing range is so wide to begin with,” he says, “Surgeons are afraid of not treating pain adequately, and they’re afraid of an overdose.”
Last but Not Least
A known-yet-underrepresented problem is medication reconciliation from inpatient to outpatient and vice versa. Studies clearly show that post-discharge telephone calls and home visits identify problems in medication dosing and compliance, according to Dr. Bossard. “Systems really need to be in place to facilitate this level of service, both when the patient comes into the hospital and after they’ve been discharged.” TH
Reference
1. The Journal of the American Medical Association. Medication errors continue even in highly computerized hospital. ScienceDaily. www.sciencedaily.com/releases/2005/05/050524101312.htm Published May 24, 2005. Accessed September 30, 2008.
The Changing Face of Quality Improvement
At Emory University School of Medicine in Atlanta, Jason M. Stein, MD, and his team are working on a quality improvement (QI) strategy they hope will transfer to any hospital, anywhere. “That is where QI research lives right now,” says Dr. Stein, co-director of Emory’s hospital medicine quality improvement research program and co-chair of the department of medicine’s quality committee.
The Emory “blueprint” lays out what ideal care looks like and how physicians can provide that care. Dr. Stein’s team already has completed three successful pilot projects: preventing hospital-acquired venous thromboembolism (VTE); reducing catheter-related bloodstream infection; and improving management of hyperglycemia. “We are a mile down the road in the QI marathon,” Dr. Stein says.
Everywhere—not just in large academic medical centers, but in community hospitals and hospital medicine groups, as well—hospitalists are responding to an increased demand from government regulators, payers, and consumers to show demonstrated quality improvements. Even hospitalists on the sidelines are watching closely the experiences of others, in the hopes of marshaling their own resources and working collaboratively.
“The patient experience needs to improve at a pace we haven’t seen before in healthcare,” says Lakshmi Halasyamani, MD, vice president of quality and systems improvement at Saint Joseph Mercy Health System in Ann Arbor, Mich. Hospitalists, she says, are uniquely qualified to meet these demands.
The New Look of QI
The existence of hospitalists has changed the dynamic of QI research, Dr. Stein explains. “Before hospitalists, almost never was a clinician in charge of improving quality hospitalwide. Now, we have hospitalists who can generate and implement quality research.”
For hospitalists, QI research is rewarding and a good career move, he says. “If you fix something that’s broken today, it won’t be broken tomorrow. It’s doing something that makes a difference on a scale that’s way beyond what you normally do every day.” Plus, he adds, the demand for hospitalists with experience in quality improvement will continue to increase as more hospitals try to demonstrate their improvement efforts.
However, the increased demand could, in some cases, be a barrier to research, says hospitalist program consultant Ken Epstein, MD, MBA, former director of medical affairs and clinical research at IPC: The Hospitalist Company in North Hollywood, Calif. “There is more clinical work for hospitalists than there is time in the day, or that there are enough hospitalists to handle,” he explains. “Many hospitalists would like to do QI research, but are too busy clinically.”
That can change, but only with the support of employers. For example, academic medical centers build in time away from clinical duties and provide staff and information systems support. That’s harder to come by in community hospitals.
Funding is an issue, too. More medical schools are competing for a rapidly decreasing pool of research dollars, Dr. Stein says. That means it will be necessary to get more help from private foundations and drug companies to adequately fund quality improvement. Some hospitals are digging into their operating budgets to fund QI research.
Hospitalists in Action
Despite the barriers, hospitalists are changing the course of QI research in a variety of settings. Dr. Stein’s team at Emory is just one example. In Michigan, Saint Joseph Mercy Health System is creating a multidisciplinary practice council with teams established to study heart failure, acute coronary syndrome, and glycemic control—taking the first steps in its research efforts. “When we think about improving care, we need to think in teams, so you don’t have folks wanting to take care of one intervention that creates issues for another member of the team,” Dr. Halasyamani says.
IPC: The Hospitalist Company is focusing on post-discharge issues. The organization’s research has revealed patients with new or worsening symptoms after discharge were no more likely to make follow-up appointments than those who felt well, and that patients given five or more prescriptions at discharge were more likely to have trouble filling them than those who received less than five. Those with insurance or HMO coverage were more likely to fill the prescriptions than those without.
Dr. Epstein also published quality improvement research showing that patients’ hospital stays increased incrementally with the number of physicians seen at the hospital. In addition, the location of hospitalists when they spoke with patients—whether they were in the hospital round the clock or took calls from home—had little effect on patient satisfaction.
HMG Experience
At Northern Colorado Hospitalists in Fort Collins, Colo., hospitalists began their QI efforts by implementing and studying the research of the SHM VTE Collaborative. “The resource room on the SHM Web site gives you a cookbook for implementing QI research,” says Christine Lum Lung, MD, medical director of the 10-hospitalist group. “It can be implemented in any hospital, of any size, and should be.”
The key is for one hospitalist to take responsibility for seeing it through. Dr. Lum Lung did just that. Using the SHM resource room and mentors, she headed a team that developed and implemented a practice protocol for prevention of VTE for Poudre Valley Hospital in Fort Collins and Medical Center of the Rockies in Loveland, Colo. The group gathered background data and built a consensus to come up with the protocol, then measured the preliminary outcomes and improved on the process.
With the backing of hospital administration, Dr. Lum Lung and her team performed their own chart audits, created spreadsheets, and went back to naysayers with data demonstrating their progress. Early results have been impressive. The initiative has increased compliance with appropriate measures, increasing VTE prevention from 58% to 85% from November 2007 through May 2008.
Dr. Lum Lung is convinced quality initiatives are the future of hospital medicine. “We need to stop being reactive to what the government is telling us we should do,” she says. “We should be leading the quality charge because we are the ones who see what works.” She’s drawing on her experience with VTE to create an infrastructure, so other hospitalists can take on their own QI initiatives. A project on glycemic control already is underway.
Dr. Lum Lung advises hospitalists to take time to educate themselves before jumping into the lion’s den. For her, it meant reading everything she could get her hands on about quality improvement and clinical developments. She also suggests understanding what must happen for behaviors to change. In the case of the VTE QI initiative, documentation was the key.
“When you’re asking physicians to change their practice standards, you have to have incredibly good documentation—and a thick skin,” she says. If you have documentation to back up your request, she explains, most healthcare providers are willing to give it a try.
For hospital care to improve, it’s essential hospitalists take the next step. “Quality improvement is an incredibly important responsibility we have as hospitalists in taking care of patients,” Dr. Lum Lung says. “If you start with that as your foundation, then the difficulties you encounter along the way are easier. You can find the time to do anything, if you’re passionate about it.”
The First Step
The future of QI research in community hospitals may depend on several things. To start, it’s essential to set up an infrastructure for support, Dr. Halasyamani says. Though this may be more difficult for community hospitals, all hospitals have some systems in place for research, she points out. And smaller hospitals also can participate in research collaboratives to get the support they need.
Saint Joseph’s funds its QI efforts from its operating budget. Researchers also are in discussions with the hospital’s development office about possible donor funding. “There may be people who are interested in leaving as their legacy improvements in care, rather than having their name on a building,” Dr. Halasyamani says.
Partnerships with academic medical centers may advance quality improvement, says David Meltzer, MD, PhD, associate professor and chief of hospital medicine at the University of Chicago Pritzker School of Medicine. He also is director of the program on outcomes research training and chair of SHM’s research committee. “Community hospitals could share their data with academic medical centers to look at quality measurers across multiple settings,” he suggests.
SHM’s research committee is working on strategies to develop networks of institutions, starting with academic medical centers and then broadening to community hospitals, Dr. Meltzer says. The goal is collaborative research. It’s a win-win for both settings. “Academics would like data on patients in community hospitals and community hospitals would like resources to do research,” says Dr. Epstein, who founded KRE Consulting, LLC.
Some institutions are receiving funding for just this purpose. The medical school at the University of Chicago Medical, for example, received a grant from the Agency for Healthcare Research and Quality to help community hospitals develop quality improvement teams. The funds will pay for hospitalists from across the country to visit the school for a summer program in outcomes research. The hospitalists will then return to their institutions to begin QI research.
Calls for Training
Initiatives, such as the summer program at the University of Chicago, are just one aspect of the education necessary to move QI forward. Some hospitalists also see a need for increased training during residency. Dr. Stein, of Emory, is working with other academics to create a core competency in QI research for hospitalists, looking at systems issues and quality tools. “Hospitalists have to feel like they have the expertise in QI research if they are to respond to the increased QI demands,” he says.
There are several programs dedicated to making that happen. The Robert Wood Johnson Clinical Scholars Program at the University of Chicago trains physicians on health policy and outcomes research, preparing them for academic careers. Dr. Meltzer thinks a similar program could be designed for community-based hospitalists who want to conduct quality improvement research.
Intermountain Healthcare in Salt Lake City, Utah, also offers training in QI research for practicing hospitalists that “jams a lot into 12- and 20-day programs,” according to Dr. Stein.
Hospitalists have to be willing to invest in themselves to get additional training in QI research, Dr. Meltzer says. Taking a job at a lower salary in exchange for time off for QI training, or paying for their own training, will lead to advancement opportunities in the future, he says.
For patients, the QI work done by hospitalists already is paying off by raising expectations about the quality of care, Dr. Epstein says. “When hospitalists are involved with a hospital to improve the system of care, it raises the bar for all patients, whether or not they are cared for by hospitalists.” TH
CME 2.0
Continuing medical education (CME) is changing rapidly. The descriptions of courses offered at HM09 reflect one of the more prevalent trends: Didactic lectures are being replaced by more innovative, interactive training sessions.
It’s a big reason why CME will continue to serve as “the hallmark method” to help medical professionals continue increasing their knowledge and improving their skills, says Sally Wang, MD, FHM, a hospitalist at Brigham and Women’s Hospital in Boston. Dr. Wang relates the shift to a famous saying from Chinese philosopher Confucius: “Tell me and I’ll forget. Show me and I may remember. Involve me and I’ll understand.”
CME, which is required of most medical professionals to maintain licenses to practice medicine, is a rapidly growing enterprise. Since 1998, the number of accredited providers increased by 10%, while the number of activities and physician participants has increased by 40%, according to the Accreditation Council for Continuing Medical Education (ACCME).
“You can’t just sit in a lecture,” Dr. Wang emphasizes. “You’re not going to absorb anything. You need to understand how you’re going to apply what you learn in practice.”
HM09 is following suit, offering an unprecedented number of hands-on training sessions. In one course, through the use of simulator models, participants will learn how to use ultrasound for safe and accurate vascular access. They’ll also have the opportunity to practice skin biopsies and lumbar punctures.
“I think that’s a reflection of our field,” says course director Joseph Ming-Wah Li, MD, FHM, SHM board member and director of the HM group at Beth Israel Deaconess Medical Center in Boston. “Hospitalists roll up their sleeves and get to work. We don’t talk about quality; we develop and implement programs to ensure quality. We don’t talk about teaching; we do it. We really hope this meeting will always be cutting-edge and set the tone for what we do as hospitalists in this country.”
Spread the Wealth of Knowledge
In a growing field such as HM, the benefits are almost limitless, says James W. Levy, PA-C, a physician assistant and hospitalist at Munson Medical Center in Traverse City, Mich. “We have the luxury of working as a team, so it’s especially helpful when we go to CME events and bring back very current material. We can share that with the rest of the team, and that can extend the ‘bang for the buck,’ ” Levy says.
Levy acknowledges CMS isn’t the only way to keep current, but it’s an “important way,” he says. “With the hospitalist movement having caught on the way it has, we have a much bigger opportunity to standardize care and our approach from one provider to another. I think CME can play a vital role in that.”
Although CME opportunities vary, Levy prefers settings like SHM functions when interaction with colleagues complements—and often enhances—the lessons learned.
Dr. Li agrees, noting meetings such as HM09 provide an opportunity to get away from the daily grind and “get the juices flowing” in terms of thinking, learning, and sharing ideas with colleagues. He’s particularly excited about the diversity of this year’s course lineup, as well as the behind-the-scenes efforts intended to ensure participants get the most out of the experience.
The annual meeting committee provided considerable guidance to each presenter, outlining objectives for each talk and reviewing presentations to make sure those objectives were met. “More than ever, the quality of the talks are going to be very good and very consistent,” Dr. Li says.
For a complete course schedule and faculty lineup, or to register for HM09, visit www.hospitalmedicine.org/source/AM09/event.cfm?Event=AM09. TH
Mark Leiser is a freelance writer based in New Jersey.
Arms Wide Open
Mark Chassin, MD, MPP, MPH, president of the Joint Commission, will deliver the keynote address at HM09 in Chicago. A board-certified internist who practiced emergency medicine for 12 years, Dr. Chassin is recognized as an expert in quality measurement and improvement.
He recently spoke to The Hospitalist about his views on the changing world of healthcare, the commission’s evolving role, and the importance of a stronger partnership between the accrediting body and hospital-based physicians.
Question: Why are you looking forward to speaking at HM09?
—Mark Chassin, MD
Answer: Hospitalists are an especially important group of physicians for [the Joint Commission] to connect with because of the close alignment between our mission and the way they practice medicine. Accreditation alone is not enough. We need active engagement of the HM practitioners in all of the quality and safety improvement initiatives the Joint Commission has set in motion. It’s also important for us to hear from the physicians on the front lines—and from those who have taken responsibility for oversight of quality programs in hospitals—about how our efforts are working and where we need to fill in gaps.
Q: Can you provide an overview of the topics you plan to talk about?
A: At the pace everything is changing, it’s hard to know exactly what I’ll want to talk about. I’ll probably say something about the major challenges we face across healthcare that are particularly magnified in hospitals. That’s where the most vulnerable patients are. That’s where the most dangerous procedures are done. That’s where the most dangerous drugs are used, and that’s where the most complicated devices are used. All these things have the potential for improving outcomes, but also increasing the potential for harm if they’re not used well.
The environment we’re in is going in one direction, and that is to demand more of all of us in healthcare with respect to the level of excellence at which care is provided and overseen. There’s a strong push on the part of public stakeholders for accountability in healthcare. I may talk about how we might respond to that demand and close the gap between what we know we could be providing in terms of safe, high-quality care, and what we are providing.
Q: You said accreditation by itself is not sufficient. What else is needed?
A: When I was exploring this job, I wanted to determine whether the Joint Commission and its board of commissioners were ready to undertake initiatives, in addition to accreditation, in order to move the delivery system more rapidly toward higher levels of safety and quality. … It became clear to me they weren’t just willing to do it, but very enthusiastic about doing it.
Q: Can you give an example of one of those new initiatives?
A: I have watched and participated in the development of applications coming out of industry in the last 10 years or so, like Six Sigma and the Toyota Production System, that are highly promising in their ability to deliver much higher levels of excellence and sustain them. We’re in the middle of a very aggressive adoption of these tools, which we’re calling our Robust Process Improvement Initiative.
Q: What are the benefits of that initiative?
A: We are doing this to enhance our capacity to do process improvement, to simplify our processes, to focus on customer service. It does not mean it’s to make these surveys easy. It means understanding where our processes are too complicated, where we have too many bells and whistles that are not related to safety and quality, and where we can reduce our costs. At the same time, we’re exploring how we can work with organizations, hospitals, and health systems who have committed to learning these tools and methods to bring them to bear on safety and quality problems—medication reconciliation, infection control breakdown, pre-op verification to get rid of wrong site/wrong side surgery—that organizations struggle with but haven’t wrestled to the ground yet.
Q: Why is it so difficult?
A: In the last year, I’ve been challenging healthcare organizations with respect to exactly that question. I believe everyone—and I put the Joint Commission side by side with organizations that deliver the care—can’t settle for anything less than aiming to transform healthcare into a high-reliability industry. That means rates of adverse events and breakdowns and quality problems that are as low as the best high-reliability organizations in the world, like commercial air travel, nuclear power, and other organizations, that deal with risk and hazards every bit as difficult and dangerous as healthcare but do it a heck of a lot better than we do.
Q: What are the barriers that keep that from happening?
A: First, there’s no role model. There’s no example in healthcare of an organization of any size that is at that level of high reliability. We’re not really in a position to hand out a playbook or a set of blueprints and say, “If you follow these step-by-step set of processes, you’ll get there.”
Another issue is the imperfect creation of a uniform safety culture. One of the hallmarks of a true safety culture is every individual who works in a healthcare organization should be alert to the smallest deviation from safe practice and safe circumstance, and they should be expected and encouraged to report those problems. Is somebody not observing safe sterile techniques in the operating room? Is somebody giving an order for medication that is ambiguous or inaccurate? Just like the junior navigator in an airplane cockpit, everyone must feel his or her obligation to point out what he or she thinks the captain is doing wrong and bring that discrepancy to the surface.
Q: What are your thoughts on the tremendous growth of HM, as well as what the future holds for the field?
A: The growth provides challenges and opportunities. The biggest challenge is the risk the movement toward the delivery of more hospital care by hospitalists provides a discontinuity between the care that’s provided in the community on the front end and hospital care, and then a discontinuity on the back end when the patient goes back into the community. It puts a much larger burden on hospitalists and organizations to make sure they work together to develop really effective ways on both the front and back ends to minimize the unintended consequences of those potential discontinuities.
That said, the opportunity of having a group of physicians who are focused primarily on what happens in hospitals gives those of us who are in quality-oversight positions a natural constituency to work with on perfecting our safety and quality programs in hospitals. That’s an important opportunity, given how complicated it has become to deliver high-quality hospital care.
Q: When hospitalists head home from Chicago, what would you like them to know about the Joint Commission and its mission?
A: The legacy of what the Joint Commission used to be sometimes gets caricatured as a bunch of silly rules and hoops people have to jump through that have nothing to do with patient care. That caricature really is a thing of the past. The current programs we have—both in accreditation and some of these newer initiatives—really have the promise of delivering the capability of helping hospitals and other health organizations achieve the high reliability I know they want. And we need to work shoulder to shoulder on problems. That comes back to how we really need unvarnished feedback about our current programs, whether they’re working well and where we should be deploying more resources. TH
Mark Leiser is a freelance writer based in New Jersey.
The More, The Merrier
Organizers of HM09 hope bigger means better.
SHM’s annual meeting—May 14-17 in Chicago—has been expanded to four days. A task force led by SHM board member and course director Joseph Ming-Wah Li, MD, FHM, recommended the change.
“The sense was, with a one-day pre-course and the annual meeting at two days, we didn’t really have enough time to put in all the content we wanted to put in,” says Dr. Li, an SHM board member and director of the hospital medicine program at Harvard Medical School, and associate chief of the division of general medicine and primary care at Beth Israel Deaconess Medical Center in Boston. “Unlike many other professional society meetings, we have several specialties. We have some physicians taking care of adults and others who take care of children. We also have nurse practitioners and physician assistants. The extra day really allows us to take a ‘big tent’ approach and make sure we have content of interest to a variety of different physicians.”
The longer meeting will allow for additional educational programming as well as two new tracks. The “second chance” track will give meeting participants an opportunity to attend sessions they missed earlier in the week. The research track is designed to give both novice and experienced researchers the chance to hone their skills.
“We’re a very young movement, and research lends credibility to any field,” Dr. Li says. “We wanted the SHM annual meeting to be a venue for HM research. In order to do that, we have to do that in a very public way.”
Also new this year is the American Board of Internal Medicine Maintenance of Certification learning session.
Continuing medical education sessions, typically offered in a block schedule, will be staggered this year. Course lengths will be tailored to specific topics, and the variations should create a better meeting experience by reducing lines in the dining area, exhibit halls, and other areas during breaks, Dr. Li says.
Based on early registration, HM09 will set attendance records this year. More than 2,000 physicians are expected to attend.
Mark Chassin, MD, MPP, MPH, president of the Joint Commission, will deliver the keynote address at 9 a.m. Friday. Dr. Chassin, whose organization accredits and certifies more than 15,000 healthcare organizations and programs, says the time has come for the commission to connect with physicians—specifically hospitalists—in a “better, more effective way.”
“The emergence of hospital medicine as a specialty is probably the most important structural change in medical practice in 20 or 25 years,” Dr. Chassin says. “Since many hospitalists are becoming more engaged in not just practicing medicine one patient at a time, but taking responsibility for oversight of quality programs in their hospitals, we certainly want to hear from them about how we can help them achieve their quality and safety goals.”
Robert Wachter, MD, FHM, professor and chief of the division of hospital medicine at the University of California at San Francisco, a former SHM president, and author of the blog Wachter’s World (www.wachtersworld.com), will speak at noon Sunday. His program is titled “Creating ‘Accountability’ in a ‘No-Blame’ Culture: The Yin and Yang of the Quality and Safety Revolutions.” TH
Mark Leiser is a freelance writer based in New Jersey.
What is the best approach to treat an upper extremity DVT?
Case
A 45-year-old female with a history of cellulitis requiring peripheral inserted central catheter (PICC) line placement for intravenous antibiotics presents two weeks after line removal with persistent, dull, aching pain in her right shoulder and difficulty removing the rings on her right hand. The pain worsens with exercise and is relieved with rest. The physical exam reveals nonpitting edema of her hand. The ultrasound shows subclavian vein thrombosis. What is the best approach to treating her upper extremity deep venous thrombosis (UEDVT)?
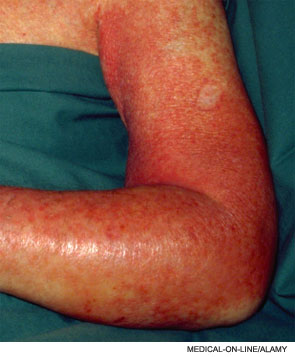
Background
DVT and pulmonary embolism (PE) have been subject to increased publicity recently, and both conditions are recognized as serious entities with life-threatening consequences. In fact, more people die annually from blood clots than breast cancer and AIDS combined.1,2 Still, the increased DVT and PE awareness is primarily focused on lower extremity DVT (LEDVT)), while UEDVT is thought of as a more benign entity. However, current data suggest that UEDVT is associated with equally significant morbidity and mortality.
UEDVT prevalence has increased in step with the increased use of central venous catheters (CVCs) and pacemakers. Although most patients present with pain, swelling, parathesias, and prominent veins throughout the arm or shoulder, many patients will not display any local DVT symptoms. For example, Kabani et al recently presented data for 1,275 patients admitted to the surgical ICU over a 12-month period. They found the incidence of UEDVT was higher than that of LEDVT (17% vs. 11%; P=0.11). They also determined that scanning all four extremities diagnosed more DVT than two-extremity scans (33% vs. 7%; P<0.001).3
While current medical literature has pushed for increased UEDVT attention, there is no consensus on its treatment. Recent American College of Chest Physicians (ACCP) guidelines addressed UEDVT treatment specifically and recommended analogous treatment to LEDVT with heparin and warfarin.4 This follows prospective studies that have shown patients with UEDVT and LEDVT have similar three-month clinical outcomes. The ACCP guidelines do not specifically recommend different treatment courses based on whether the UEDVT is catheter-related or not. Furthermore, while one might assume that removal of an associated catheter might reduce the treatment duration, there is limited data to support shorter courses in this scenario.
Review of the Data
Incidence: UEDVT is becoming more common secondary to increased interventions in the upper extremity (CVC, pacemaker), and is more easily recognized due to improvement in noninvasive ultrasound technology. UEDVT accounts for up to 10% of all DVT, with an incidence of approximately three per 100,000 persons in the general population.5-8 Because UEDVT can also be asymptomatic, it is believed that the incidence likely is higher than previously reported, but prospective data are lacking.
Risk factors: UEDVT is further categorized as either primary or secondary, depending upon the cause. First described in the late 1800s, spontaneous primary thrombosis of the upper extremity, or Paget-Schroetter syndrome, accounts for approximately 20% of UEDVT.9 Primary UEDVT includes both idiopathic and “effort-related” thrombosis. Effort-related thrombosis usually develops among young people after strenuous or repetitive exercise, such as pitching a baseball. Some hypothesize that effort-related thrombosis is related to a hypercoaguable state or anatomic abnormalities, although a specific cause, such as thoracic outlet syndrome, is found in only 5% of these cases.10,11
Secondary UEDVT characterizes thrombosis in which an endogenous or exogenous risk factor is present. Endogenous risk factors include coagulation abnormalities, such as antithrombin, protein C and protein S deficiencies; factor V Leiden gene mutation; hyperhomocysteinemia; and antiphospholipid antibody syndrome. Exogenous risk factors include CVC pacemakers, intracardiac defibrillators, malignancy, previous or concurrent LEDVT, oral contraceptives, some artificial reproductive technologies (women can develop ovarian hyperstimulation syndrome, which is associated with increased hypercoaguability), trauma, and IV drug use (especially cocaine).5,12-14
Clinical presentation and diagnosis: Swelling (80% of patients) and pain (40% of patients) are the most common UEDVT symptoms at presentation.2 Other clinical features include new, prominent veins throughout the shoulder girdle, erythema, increased warmth, functional impairment, parathesias, and non-specific feelings of arm heaviness or discomfort. Symptoms typically worsen with arm use and improve with rest and elevation.15 Patients with UEDVT related to CVC are more likely to be asymptomatic and may present only with PE.16 The differential diagnosis includes superficial phlebitis, lymphatic edema, hematoma, contusions, venous compression, and muscle tears.17
Contrast venography is the gold standard for the UEDVT diagnosis. However, it is more expensive and invasive than ultrasound, and thus serial compression ultrasound is now the standard test in UEDVT evaluation. Then again, contrast venography remains the test of choice in patients with high pre-test probability and negative ultrasound results.18,19
Prevention: Nearly 70% of secondary UEDVT is associated with a CVC.5 Further, CVC use is the most powerful predictor of UEDVT (adjusted odds ratio (OR), 9.7; 95% CI, 7.8 to 12.2).2 Despite the association between CVCs and UEDVT, anticoagulant prophylaxis is not recommended. Studies evaluating the results of 1-mg warfarin conflict and include small populations. Warfarin’s potential interaction with antibiotics and dosing variance based on nutritional intake logically prompted studies on the potential benefit of low-weight molecular heparain (LWMH); however, these studies have failed to show benefit.20,21

Treatment: Recent ACCP guidelines recommend treating UEDVT patients with unfractionated heparin (UFH) or LMWH and warfarin, with an INR goal of 2 to 3 for at least three months depending upon the overall clinical scenario. Two small studies evaluating catheter-related thrombosis (15 patients in each trial) reported no subsequent embolic phenomenon.22,23 Some authors interpreted this data to mean UEDVT was not as morbid as LEDVT and, subsequently, that catheter-related UEDVTs require only one month of therapy. Since the small studies were published, the increasing incidence and relevance of UEDVT have become more widely recognized, and most authors are recommending three months of treatment.
Still, it’s important to note that there aren’t any published data directly comparing the one-month and the three-month anticoagulation therapies. The RIETE registry, which is the largest ongoing published registry of patients with confirmed DVT or PE, reports similar three-month clinical outcomes between those with UEDVT and LEDVT.
Small, single-center trials have shown that active intervention, such as thrombolysis, surgery, or multi-staged approaches are associated with increased vein patency and decreased rates of post-thrombotic syndrome.24,25 However, ACCP has withheld general recommendations for these interventions based on a lack of sufficient data to comment on their overall safety and efficacy, as well as comparable rates of post-thrombotic syndrome (15% to 50%) in studies that directly compared surgical and medical intervention. In fact, the ACCP recommends against interventional treatments unless the patient has failed anticoagulation therapy, has severe symptoms, and expertise is available.4
Superior vena cava filters are available at some centers for patients in whom anticoagulation is contraindicated, but efficacy data is limited. While the data for filter use in UEDVT is limited, its use should be considered in patients who have a contraindication to anticoagulation and remain high risk for UEDVT (e.g., prolonged central line placement).
Complications: Post-thrombotic syndrome (PTS) is the most significant local complication of UEDVT. PTS characteristics are edema, pain, venous ulcers, and skin pigmentation changes, and it is the result of chronic venous insufficiency due to the clot. A meta-analysis of clinical studies on UEDVT noted that PTS occurs in 7% to 46% (mean 15%) of patients.26 One hypothesis for the wide range in frequency is the lack of clear diagnostic criteria for PTS.27 No clear beneficial treatment or prevention for PTS exists, but many recommend graduated compression stockings for the arm.
Residual and recurrent thrombosis are associated with increased PTS risk, which emphasizes the need for further study of interventional treatment because preliminary work has shown increased rates of vein patency in comparison to anticoagulants alone. Recurrent venous thromboembolism (VTE), another local complication, appears to occur less often than it does in patients with LEDVTs, but reaches 8% after five years of followup.28
PE is less common on presentation among patients with UEDVT when compared to patients with LEDVT, but when PE occurs, the three-month outcome is similar.3 PE appears to be more frequent in patients who have a CVC, with an incidence as high as 36% of DVT patients.4,13,21,29
Increased mortality: The mortality among UEDVT patients has been described as 10% to 50% in the 12 months after diagnosis, which is much higher than the ratio in LEDVT patients.21,30 This in part is due to sicker cohorts getting UEDVT. For example, patients with distant metastasis are more likely to develop UEDVT than those with confined malignancy (adjusted OR 11.5; 95% CI, 1.6 to 80.2).31
Occult malignancy, most commonly lung cancer or lymphoma, has been found in as many as 24% of UEDVT patients.32 The high rate of mortality associated with UEDVT appears to be related more with the patient's overall poor clinical condition rather than directly related to complications from the DVT. However, its presence should alert hospitalists to the patient's potentially poorer prognosis and prompt evaluation for occult malignancy if no risk factor is present.
Back to the Case
This patient should be started on either UFH or LMWH while simultaneously beginning warfarin. She should continue warfarin treatment for at least three months, with a goal INR of 2.0 to 3.0, similar to treatment for LEDVT. The ultimate treatment duration with warfarin follows the same guidelines as treatment with a LEDVT. Although prophylaxis is not routinely recommended, dosing 1 mg of warfarin beginning three days before subsequent CVC placement should be considered if this patient requires a future CVC. Additionally, an evaluation for occult malignancy should be considered in this patient.
Bottom Line
Upper extremity DVT is not a benign condition, and is associated with a general increase in mortality. It should be treated similarly to LEDVT in order to decrease PTS, recurrent DVT, and PE. TH
Dr. Hollberg is a clinical instructor in the section of hospital medicine at Emory University Hospital in Atlanta.
References
- Hirsh J, Hoak J. Management of deep vein thrombosis and pulmonary embolism. A statement for healthcare professionals. Council on Thrombosis, American Heart Association. Circulation. 1996;93(12):2212-2245.
- Gerotziafas GT, Samama MM. Prophylaxis of venous thromboembolism in medical patients. Curr Opin Pulm Med. 2004;10(5):356-365.
- Kabani L, et al. Upper extremity DVT as prevalent as lower extremity DVT in ICU patients. Society of Critical Care Medicine (SCCM) 38th annual Critical Care Congress: Abstract 305. Presented Feb. 2, 2009.
- Kearon C, Kahn SR, Agnelli G, Goldhaber S, Raskob GE, Comerota AJ. Therapy for venous thromboembolic disease: American College of Chest Physicians evidence-based clinical practice guidelines (8th edition). Chest. 2008;133(6Suppl):454S-545S.
- Joffe HV, Kucher N, Tapson VF, Goldhaber SZ. Upper extremity deep vein thrombosis: a prospective registry of 592 patients. Circulation. 2004;110:1605.
- Munoz FJ, Mismetti P, Poggio R, et al. Clinical outcome of patients with an upper-extremity deep vein thrombosis: results from the RIETE registry. Chest. 2008,133:143-148.
- Coon WW, Willis PW. Thrombosis of axillary and subclavian veins. Arch Surg. 1967;94(5):657-663.
- Horattas MC, Wright DJ, Fenton AH, et al. Changing concepts of deep venous thrombosis of the upper extremity—a report of a series and review of the literature. Surgery. 1988;104(3):561-567.
- Bernardi E, Piccioli A, Marchiori A, Girolami B, Prandoni P. Upper extremity deep vein thrombosis: risk factors, diagnosis, and management. Semin Vasc Med. 2001;1(1):105;110.
- Heron E, Lozinguez O, Alhenc-Gelas M, Emmerich J, Flessinger JN. Hypercoagulable states in primary upper-extremity deep vein thrombosis. Arch Intern Med. 2000;160:382-386.
- Ninet J, Demolombe-Rague S, Bureau Du Colombier P, Coppere B. Les thromboses veineuses profondes des members superieurs. Sang Thromb Vaisseaux. 1994;6:103-114.
- Painter TD, Kerpf M. Deep venous thrombosis of the upper extremity five years experience at a university hospital. Angiology. 1984;35(35):743-749.
- Chan WS, Ginsberg JS. A review of upper extremity deep vein thrombosis in pregnancy: unmasking the “ART” behind the clot. J Thromb Haemost. 2006;4(8):1673-1677.
- Hughes MJ, D’Agostino JC. Upper extremity deep vein thrombosis: a case report and review of current diagnostic/therapeutic modalities. Am J Emerg Med. 1994;12(6):631-635.
- Prandoni P, Polistena P, Bernardi E, et al. Upper extremity deep vein thrombosis. Risk factors, diagnosis, and complications. Arch Intern Med. 1997;157:57-62.
- Van Rooden CJ, Tesslar ME, Osanto S, Rosendal FR, Huisman MV. Deep vein thrombosis associated with central venous catheters—a review. J Thromb Haemost. 2005;3:2049-2419.
- Horattas MC, Wright DJ, Fenton AH, et al. Changing concepts of deep venous thrombosis of the upper extremity—report of a series and review of the literature. Surgery. 1988;104(3):561-567.
- Bernardi E, Pesavento R, Prandoni P. Upper extremity deep venous thrombosis. Semin Thromb Hemost. 2006;32(7):729-736.
- Baxter GM, McKechnie S, Duffy P. Colour Doppler ultrasound in deep venous thrombosis: a comparison with venography. Clin Radiol. 1990;42(1):32-36.
- Bern MM, Lokich JJ, Wallach SR, et al. Very low doses of warfarin can prevent thrombosis in central venous catheters. A randomized prospective trial. Ann Intern Med. 1990;112(6):423-428.
- Couban S, Goodyear M, Burnell M, et al. Randomized placebo-controlled study of low-dose warfarin for the prevention of central venous catheter-associated thrombosis in patients with cancer. J Clin Oncol. 2005;23(18):4063-4069.
- Lokich JJ, Both A, Benotti P. Complications and management of implanted central venous catheters. J Clin Oncol. 1985;3:710-717.
- Moss JF, Wagman LD, Rijhmaki DU, Terz JJ. Central venous thrombosis related to the silastic Hickman-Broviac catheter in an oncologic population. J Parenter Enteral Nutr. 1989;13:397.
- Machleder HI. Evaluation of a new treatment strategy for Paget-Schroetter syndrome: spontaneous thrombosis of the axillary-subclavian vein. J Vasc Surg. 1993;17:305-315.
- Malcynski J, O’Donnell TF, Mackey WC. Long-term results of treatment for axillary subclavian vein thrombosis. Can J Surg. 1993;36:365-371.
- Elman EE, Kahn SR. The post-thrombotic syndrome after upper extremity deep vein thrombosis in adults: a systematic review. Thromb Res. 2006;117(6):609-614.
- Baarslag HJ, Koopman MM, Hutten BA, et al. Long-term follow up of patients with suspected deep vein thrombosis of the upper extremity: survival, risk factors and post-thrombotic syndrome. Eur J Intern Med. 2004;15:503-507.
- Prandoni P, Bernardi E, Marchiori A, et al. The long term clinical consequence of acute deep venous thrombosis of the arm: prospective cohort study. BMJ. 2004;329:484-485.
- Monreal M, Raventos A, Lerma R, et al. Pulmonary embolism in patients with upper extremity DVT associated to venous central lines—a prospective study. Thromb Haemost. 1994;72(4):548-550.
- Hingorani A, Ascher E, Lorenson E, et al. Upper extremity deep venous thrombosis and its impact on morbidity and mortality rates in a hospital-based population. J Vasc Surg. 1997;26:853-860.
- Blom JW, Doggen CM, Osanto S, Rosendaal FR. Old and new risk factors for upper extremity deep vein thrombosis. J Thromb Haemost. 2005;3:2471-2478.
- Girolami A, Prandoni P, Zanon E, Bagatella P, Girolami B. Venous thromboses of upper limbs are more frequently associated with occult cancer as compared with those of lower limbs. Blood Coagul Fibrinolysis. 1999;10(8):455-457.
Case
A 45-year-old female with a history of cellulitis requiring peripheral inserted central catheter (PICC) line placement for intravenous antibiotics presents two weeks after line removal with persistent, dull, aching pain in her right shoulder and difficulty removing the rings on her right hand. The pain worsens with exercise and is relieved with rest. The physical exam reveals nonpitting edema of her hand. The ultrasound shows subclavian vein thrombosis. What is the best approach to treating her upper extremity deep venous thrombosis (UEDVT)?
Background
DVT and pulmonary embolism (PE) have been subject to increased publicity recently, and both conditions are recognized as serious entities with life-threatening consequences. In fact, more people die annually from blood clots than breast cancer and AIDS combined.1,2 Still, the increased DVT and PE awareness is primarily focused on lower extremity DVT (LEDVT)), while UEDVT is thought of as a more benign entity. However, current data suggest that UEDVT is associated with equally significant morbidity and mortality.
UEDVT prevalence has increased in step with the increased use of central venous catheters (CVCs) and pacemakers. Although most patients present with pain, swelling, parathesias, and prominent veins throughout the arm or shoulder, many patients will not display any local DVT symptoms. For example, Kabani et al recently presented data for 1,275 patients admitted to the surgical ICU over a 12-month period. They found the incidence of UEDVT was higher than that of LEDVT (17% vs. 11%; P=0.11). They also determined that scanning all four extremities diagnosed more DVT than two-extremity scans (33% vs. 7%; P<0.001).3
While current medical literature has pushed for increased UEDVT attention, there is no consensus on its treatment. Recent American College of Chest Physicians (ACCP) guidelines addressed UEDVT treatment specifically and recommended analogous treatment to LEDVT with heparin and warfarin.4 This follows prospective studies that have shown patients with UEDVT and LEDVT have similar three-month clinical outcomes. The ACCP guidelines do not specifically recommend different treatment courses based on whether the UEDVT is catheter-related or not. Furthermore, while one might assume that removal of an associated catheter might reduce the treatment duration, there is limited data to support shorter courses in this scenario.
Review of the Data
Incidence: UEDVT is becoming more common secondary to increased interventions in the upper extremity (CVC, pacemaker), and is more easily recognized due to improvement in noninvasive ultrasound technology. UEDVT accounts for up to 10% of all DVT, with an incidence of approximately three per 100,000 persons in the general population.5-8 Because UEDVT can also be asymptomatic, it is believed that the incidence likely is higher than previously reported, but prospective data are lacking.
Risk factors: UEDVT is further categorized as either primary or secondary, depending upon the cause. First described in the late 1800s, spontaneous primary thrombosis of the upper extremity, or Paget-Schroetter syndrome, accounts for approximately 20% of UEDVT.9 Primary UEDVT includes both idiopathic and “effort-related” thrombosis. Effort-related thrombosis usually develops among young people after strenuous or repetitive exercise, such as pitching a baseball. Some hypothesize that effort-related thrombosis is related to a hypercoaguable state or anatomic abnormalities, although a specific cause, such as thoracic outlet syndrome, is found in only 5% of these cases.10,11
Secondary UEDVT characterizes thrombosis in which an endogenous or exogenous risk factor is present. Endogenous risk factors include coagulation abnormalities, such as antithrombin, protein C and protein S deficiencies; factor V Leiden gene mutation; hyperhomocysteinemia; and antiphospholipid antibody syndrome. Exogenous risk factors include CVC pacemakers, intracardiac defibrillators, malignancy, previous or concurrent LEDVT, oral contraceptives, some artificial reproductive technologies (women can develop ovarian hyperstimulation syndrome, which is associated with increased hypercoaguability), trauma, and IV drug use (especially cocaine).5,12-14
Clinical presentation and diagnosis: Swelling (80% of patients) and pain (40% of patients) are the most common UEDVT symptoms at presentation.2 Other clinical features include new, prominent veins throughout the shoulder girdle, erythema, increased warmth, functional impairment, parathesias, and non-specific feelings of arm heaviness or discomfort. Symptoms typically worsen with arm use and improve with rest and elevation.15 Patients with UEDVT related to CVC are more likely to be asymptomatic and may present only with PE.16 The differential diagnosis includes superficial phlebitis, lymphatic edema, hematoma, contusions, venous compression, and muscle tears.17
Contrast venography is the gold standard for the UEDVT diagnosis. However, it is more expensive and invasive than ultrasound, and thus serial compression ultrasound is now the standard test in UEDVT evaluation. Then again, contrast venography remains the test of choice in patients with high pre-test probability and negative ultrasound results.18,19
Prevention: Nearly 70% of secondary UEDVT is associated with a CVC.5 Further, CVC use is the most powerful predictor of UEDVT (adjusted odds ratio (OR), 9.7; 95% CI, 7.8 to 12.2).2 Despite the association between CVCs and UEDVT, anticoagulant prophylaxis is not recommended. Studies evaluating the results of 1-mg warfarin conflict and include small populations. Warfarin’s potential interaction with antibiotics and dosing variance based on nutritional intake logically prompted studies on the potential benefit of low-weight molecular heparain (LWMH); however, these studies have failed to show benefit.20,21
Treatment: Recent ACCP guidelines recommend treating UEDVT patients with unfractionated heparin (UFH) or LMWH and warfarin, with an INR goal of 2 to 3 for at least three months depending upon the overall clinical scenario. Two small studies evaluating catheter-related thrombosis (15 patients in each trial) reported no subsequent embolic phenomenon.22,23 Some authors interpreted this data to mean UEDVT was not as morbid as LEDVT and, subsequently, that catheter-related UEDVTs require only one month of therapy. Since the small studies were published, the increasing incidence and relevance of UEDVT have become more widely recognized, and most authors are recommending three months of treatment.
Still, it’s important to note that there aren’t any published data directly comparing the one-month and the three-month anticoagulation therapies. The RIETE registry, which is the largest ongoing published registry of patients with confirmed DVT or PE, reports similar three-month clinical outcomes between those with UEDVT and LEDVT.
Small, single-center trials have shown that active intervention, such as thrombolysis, surgery, or multi-staged approaches are associated with increased vein patency and decreased rates of post-thrombotic syndrome.24,25 However, ACCP has withheld general recommendations for these interventions based on a lack of sufficient data to comment on their overall safety and efficacy, as well as comparable rates of post-thrombotic syndrome (15% to 50%) in studies that directly compared surgical and medical intervention. In fact, the ACCP recommends against interventional treatments unless the patient has failed anticoagulation therapy, has severe symptoms, and expertise is available.4
Superior vena cava filters are available at some centers for patients in whom anticoagulation is contraindicated, but efficacy data is limited. While the data for filter use in UEDVT is limited, its use should be considered in patients who have a contraindication to anticoagulation and remain high risk for UEDVT (e.g., prolonged central line placement).
Complications: Post-thrombotic syndrome (PTS) is the most significant local complication of UEDVT. PTS characteristics are edema, pain, venous ulcers, and skin pigmentation changes, and it is the result of chronic venous insufficiency due to the clot. A meta-analysis of clinical studies on UEDVT noted that PTS occurs in 7% to 46% (mean 15%) of patients.26 One hypothesis for the wide range in frequency is the lack of clear diagnostic criteria for PTS.27 No clear beneficial treatment or prevention for PTS exists, but many recommend graduated compression stockings for the arm.
Residual and recurrent thrombosis are associated with increased PTS risk, which emphasizes the need for further study of interventional treatment because preliminary work has shown increased rates of vein patency in comparison to anticoagulants alone. Recurrent venous thromboembolism (VTE), another local complication, appears to occur less often than it does in patients with LEDVTs, but reaches 8% after five years of followup.28
PE is less common on presentation among patients with UEDVT when compared to patients with LEDVT, but when PE occurs, the three-month outcome is similar.3 PE appears to be more frequent in patients who have a CVC, with an incidence as high as 36% of DVT patients.4,13,21,29
Increased mortality: The mortality among UEDVT patients has been described as 10% to 50% in the 12 months after diagnosis, which is much higher than the ratio in LEDVT patients.21,30 This in part is due to sicker cohorts getting UEDVT. For example, patients with distant metastasis are more likely to develop UEDVT than those with confined malignancy (adjusted OR 11.5; 95% CI, 1.6 to 80.2).31
Occult malignancy, most commonly lung cancer or lymphoma, has been found in as many as 24% of UEDVT patients.32 The high rate of mortality associated with UEDVT appears to be related more with the patient's overall poor clinical condition rather than directly related to complications from the DVT. However, its presence should alert hospitalists to the patient's potentially poorer prognosis and prompt evaluation for occult malignancy if no risk factor is present.
Back to the Case
This patient should be started on either UFH or LMWH while simultaneously beginning warfarin. She should continue warfarin treatment for at least three months, with a goal INR of 2.0 to 3.0, similar to treatment for LEDVT. The ultimate treatment duration with warfarin follows the same guidelines as treatment with a LEDVT. Although prophylaxis is not routinely recommended, dosing 1 mg of warfarin beginning three days before subsequent CVC placement should be considered if this patient requires a future CVC. Additionally, an evaluation for occult malignancy should be considered in this patient.
Bottom Line
Upper extremity DVT is not a benign condition, and is associated with a general increase in mortality. It should be treated similarly to LEDVT in order to decrease PTS, recurrent DVT, and PE. TH
Dr. Hollberg is a clinical instructor in the section of hospital medicine at Emory University Hospital in Atlanta.
References
- Hirsh J, Hoak J. Management of deep vein thrombosis and pulmonary embolism. A statement for healthcare professionals. Council on Thrombosis, American Heart Association. Circulation. 1996;93(12):2212-2245.
- Gerotziafas GT, Samama MM. Prophylaxis of venous thromboembolism in medical patients. Curr Opin Pulm Med. 2004;10(5):356-365.
- Kabani L, et al. Upper extremity DVT as prevalent as lower extremity DVT in ICU patients. Society of Critical Care Medicine (SCCM) 38th annual Critical Care Congress: Abstract 305. Presented Feb. 2, 2009.
- Kearon C, Kahn SR, Agnelli G, Goldhaber S, Raskob GE, Comerota AJ. Therapy for venous thromboembolic disease: American College of Chest Physicians evidence-based clinical practice guidelines (8th edition). Chest. 2008;133(6Suppl):454S-545S.
- Joffe HV, Kucher N, Tapson VF, Goldhaber SZ. Upper extremity deep vein thrombosis: a prospective registry of 592 patients. Circulation. 2004;110:1605.
- Munoz FJ, Mismetti P, Poggio R, et al. Clinical outcome of patients with an upper-extremity deep vein thrombosis: results from the RIETE registry. Chest. 2008,133:143-148.
- Coon WW, Willis PW. Thrombosis of axillary and subclavian veins. Arch Surg. 1967;94(5):657-663.
- Horattas MC, Wright DJ, Fenton AH, et al. Changing concepts of deep venous thrombosis of the upper extremity—a report of a series and review of the literature. Surgery. 1988;104(3):561-567.
- Bernardi E, Piccioli A, Marchiori A, Girolami B, Prandoni P. Upper extremity deep vein thrombosis: risk factors, diagnosis, and management. Semin Vasc Med. 2001;1(1):105;110.
- Heron E, Lozinguez O, Alhenc-Gelas M, Emmerich J, Flessinger JN. Hypercoagulable states in primary upper-extremity deep vein thrombosis. Arch Intern Med. 2000;160:382-386.
- Ninet J, Demolombe-Rague S, Bureau Du Colombier P, Coppere B. Les thromboses veineuses profondes des members superieurs. Sang Thromb Vaisseaux. 1994;6:103-114.
- Painter TD, Kerpf M. Deep venous thrombosis of the upper extremity five years experience at a university hospital. Angiology. 1984;35(35):743-749.
- Chan WS, Ginsberg JS. A review of upper extremity deep vein thrombosis in pregnancy: unmasking the “ART” behind the clot. J Thromb Haemost. 2006;4(8):1673-1677.
- Hughes MJ, D’Agostino JC. Upper extremity deep vein thrombosis: a case report and review of current diagnostic/therapeutic modalities. Am J Emerg Med. 1994;12(6):631-635.
- Prandoni P, Polistena P, Bernardi E, et al. Upper extremity deep vein thrombosis. Risk factors, diagnosis, and complications. Arch Intern Med. 1997;157:57-62.
- Van Rooden CJ, Tesslar ME, Osanto S, Rosendal FR, Huisman MV. Deep vein thrombosis associated with central venous catheters—a review. J Thromb Haemost. 2005;3:2049-2419.
- Horattas MC, Wright DJ, Fenton AH, et al. Changing concepts of deep venous thrombosis of the upper extremity—report of a series and review of the literature. Surgery. 1988;104(3):561-567.
- Bernardi E, Pesavento R, Prandoni P. Upper extremity deep venous thrombosis. Semin Thromb Hemost. 2006;32(7):729-736.
- Baxter GM, McKechnie S, Duffy P. Colour Doppler ultrasound in deep venous thrombosis: a comparison with venography. Clin Radiol. 1990;42(1):32-36.
- Bern MM, Lokich JJ, Wallach SR, et al. Very low doses of warfarin can prevent thrombosis in central venous catheters. A randomized prospective trial. Ann Intern Med. 1990;112(6):423-428.
- Couban S, Goodyear M, Burnell M, et al. Randomized placebo-controlled study of low-dose warfarin for the prevention of central venous catheter-associated thrombosis in patients with cancer. J Clin Oncol. 2005;23(18):4063-4069.
- Lokich JJ, Both A, Benotti P. Complications and management of implanted central venous catheters. J Clin Oncol. 1985;3:710-717.
- Moss JF, Wagman LD, Rijhmaki DU, Terz JJ. Central venous thrombosis related to the silastic Hickman-Broviac catheter in an oncologic population. J Parenter Enteral Nutr. 1989;13:397.
- Machleder HI. Evaluation of a new treatment strategy for Paget-Schroetter syndrome: spontaneous thrombosis of the axillary-subclavian vein. J Vasc Surg. 1993;17:305-315.
- Malcynski J, O’Donnell TF, Mackey WC. Long-term results of treatment for axillary subclavian vein thrombosis. Can J Surg. 1993;36:365-371.
- Elman EE, Kahn SR. The post-thrombotic syndrome after upper extremity deep vein thrombosis in adults: a systematic review. Thromb Res. 2006;117(6):609-614.
- Baarslag HJ, Koopman MM, Hutten BA, et al. Long-term follow up of patients with suspected deep vein thrombosis of the upper extremity: survival, risk factors and post-thrombotic syndrome. Eur J Intern Med. 2004;15:503-507.
- Prandoni P, Bernardi E, Marchiori A, et al. The long term clinical consequence of acute deep venous thrombosis of the arm: prospective cohort study. BMJ. 2004;329:484-485.
- Monreal M, Raventos A, Lerma R, et al. Pulmonary embolism in patients with upper extremity DVT associated to venous central lines—a prospective study. Thromb Haemost. 1994;72(4):548-550.
- Hingorani A, Ascher E, Lorenson E, et al. Upper extremity deep venous thrombosis and its impact on morbidity and mortality rates in a hospital-based population. J Vasc Surg. 1997;26:853-860.
- Blom JW, Doggen CM, Osanto S, Rosendaal FR. Old and new risk factors for upper extremity deep vein thrombosis. J Thromb Haemost. 2005;3:2471-2478.
- Girolami A, Prandoni P, Zanon E, Bagatella P, Girolami B. Venous thromboses of upper limbs are more frequently associated with occult cancer as compared with those of lower limbs. Blood Coagul Fibrinolysis. 1999;10(8):455-457.
He’s on HM’s Fast Track

William Ford, MD, FHM, was just three years removed from residency when he assumed his first HM leadership role. His qualifications were impressive, but because he was just in his early 30s, his soon-to-be bosses needed some convincing that he was right for the job.
But Dr. Ford—now medical director at Cogent Healthcare and director of the HM program at Temple University in Philadelphia—quickly proved that ability, attitude, and work ethic mean as much as, if not more than, a lengthy résumé. “I don’t think you need a title to lead or a position to lead,” Dr. Ford says. “You need the will to lead.”
Q: You spent a little more than a year in private practice before you became a hospitalist. What motivated you to make the switch?
A: I really enjoy the mix of responsibilities. There’s a lot more to HM than just treating the patient. You’re actually treating the hospital. And, ultimately, it’s more fast-paced. I like the ability to be on the cutting edge of medicine, and just being in a hospital keeps you on your toes from a medical perspective.
Q: Your first two clinical sites—Lehigh Valley Hospital in Allentown, Pa., and Union Hospital in Elkton, Md.—are more suburban settings. What made Temple the right fit?
A: I trained at Drexel University (also in Philadelphia), and I wanted to get back to the urban setting. I find that environment to be very challenging.
Q: How so?
A: The biggest challenge is the socioeconomic problems. Eighty percent of our patients are on Medicare or Medicaid. … In a nutshell, the challenge comes down to basic access to care.
Q: How frustrating is that for you?
A: It’s very frustrating, and it angers me. If I write a prescription for a patient, there’s a good chance the person won’t take it. If I tell them they need follow-up treatment, there’s a good chance they won’t get it. It’s not that they don’t want to. Maybe they can’t afford the co-pay, or maybe, if they haven’t been monitored by a primary-care physician (PCP), they can’t get an appointment for three months. I know we, as a group, can care for patients much better if they would follow up with our instructions. But because of the hoops they have to go through, whether for economic reasons or access reasons, many of them are coming back to the ED.
Q: What keeps you going in spite of those challenges?
A: The patients. They are a very grateful population. They know they are underserved, and they are appreciative of the care.
Q: Temple partnered with Cogent Healthcare in 2006 to manage its hospitalist program. Were you excited about being able to put your stamp on a program and really help it develop?
A: That was enormously appealing. If you’re a true leader, you’re never satisfied with the way your boss is running the program. If you really have the qualities to lead a group, you always think you can do better. … I was intrigued by the opportunity to start a group in a major teaching center that, for the first time, was outsourcing its hospitalist program and trying to solidify its teaching mission.
Q: How quickly has the program grown?
A: We’ve grown from four physicians to 27, and we treat about 15,000 inpatients annually.
Q: What advice would you give to the director of a program experiencing similar growth?
A: Be very stringent on the doctors you choose. For a lot of groups, retention/recruitment is the No. 1, No. 2, and No. 3 problem. We’ve been fortunate we haven’t made many bad hires. But the time and effort it takes to get rid of a bad hire can really end up bogging you down. I’d rather have everyone pull up their bootstraps and work a bit harder and take an extra few months to find the right person than go ahead with a bad hire simply to have another body.
Q: Were there other keys behind the program’s success?
A: There are several. I owe a great deal of the success of the program to the great doctors I work with. I received tremendous support from the department of internal medicine when I arrived, and that ensured a smooth transition. Another big component is good communication.
Q: What role has communication played?
A: Hospitals are very siloed. One group doesn’t speak to another. We’re taught to stick our head in the sand, fix the problem, and move on to the next problem. That gets you crucified in the world of HM. As hospitalists, we have to be the glue that brings all these silos together. In our profession, to be a good leader, you don’t have to be the smartest or best clinician. But you do have to have the attributes of communication and teambuilding. The key is to meet people and talk to them. Try to get to know every key hospital administrator. Don’t just write an order and go away; talk to the nurse. If you forge relationships and try to get the group more fully implemented, it will be more likely to reach its full potential.
Q: At 35, you are slightly younger than the average U.S. hospitalist, yet you’re nearly three years into your first true leadership role. Has your age ever been an issue?
A: Initially, it was a hindrance. It took four months for Temple to interview me. The biggest negative they gave to Cogent was, “He’s so young.” In any other field, 35 would not be considered a child. We’d be in the workforce for 13 years, and we’d be considered middle or senior management. Medicine in general is steeped in, “If you don’t have gray hair, you’re not able to sit at the table.” In our specialty, you can. … It doesn’t have to hinder you, but you have to be willing and able to do the right things. If you are, you will be noticed.
Q: You consider HM program marketing and branding one of your specialties. Why are those efforts necessary?
A: If you don’t market yourself, you’ll die, particularly in a competitive market. Whether you are at an academic center or a small community hospital or even a larger hospital, you could have two or three hospitalist groups all vying for the same patient volume. You need to give yourself a differential advantage.
Q: How do you do that?
A: You have to get out and meet people and shake some hands. You have to meet all of your customers, and you have to find out if they are happy or displeased. You have to communicate with them. You have to think about your customers, and they’re not just the patients in the bed. Your customers also are your administration, your PCPs, your subspecialists. … It’s no different than a vendor selling fax machines. We are a business, and if doctors don’t think that, they’re very naive.
Q: You’re also a big proponent of team-building within groups.
A: Definitely. That’s the foundation. Groups are going to coalesce differently. In my group at Lehigh Valley, we all had a Fourth of July party. We were never so close as after that one experience when we shared dinner together. It may be as simple as that. At Temple, I had all 25 of us meet and go over a teambuilding exercise to understand what values people have and why they come to work. I asked them to tell me something I didn’t know about them. I heard everything from “I changed my name when I was 5” to “I played basketball in college.”
You’re more willing to cover for a colleague if he or she is sick if you get to know them on a personal level. And if that happens, you’re less likely to leave, and that decreases turnover. On top of everything else, you become a group. You see group buy-in and goal recognition, and you start to see those goals attained.
Q: On top of your administrative duties and teaching responsibilities, you’re still doing 10 clinical shifts per month. Why?
A: It’s hugely important for two reasons. No. 1 is respect among members of your team. No. 2 is knowledge of your service. It’s not until you get your hands dirty that you can really understand what physicians in your group are going through and figure out ways to make life better. And at the end of the day, we’re all still physicians. TH
Mark Leiser is a freelance writer in New Jersey.
Should Patients Be Informed of Better Care Elsewhere?
Editors’ note: Hospitalists face difficult decisions every day, including situations that don’t always have clear-cut answers. Beginning with this month’s “HM Debate,” The Hospitalist stares down the tough questions and presents all sides of the issues. This month’s question: You are discharging a patient after treatment for a non-ST segment myocardial infarction (NSTEMI). The cardiology team recommends nonemergent coronary artery bypass grafting (CABG) for the patient’s three-vessel disease. You set up a referral for surgery, but you know the CABG morbidity and mortality rates are higher at your hospital than at a hospital 30 miles away. Should you disclose this information to your patient?
PRO
If you would tell your relative, you should tell your patient

If a patient at your hospital needs surgery or another invasive intervention, are you obligated to inform them of your hospital’s record with that procedure—particularly if the record is not as good as the one of the hospital down the street? Should loyalty to your hospital trump the risk to the patient?
In our scenario, the patient is being referred for elective surgery, and it is known that the cardiovascular team at a neighboring hospital has a better record for this procedure. It is the hospitalist’s job to present this information to the patient so that an intelligent and informed decision can be made. If the hospitalist believes the outcomes data, then an obligation exists to share that information with the patient.
If the data are subtle, one might argue that confusing the patient with more levels of decision-making is unnecessary. On the other hand, if data on performance outcomes between two institutions are clear, it presents an ethical position.
Let us assume the hospitalist is aware of poor outcomes in coronary bypass surgery at their hospital. Perhaps the mortality rates were unusually high and the hospitalist knew external consultants were brought in to identify the problems. Would you refer your patient for bypass surgery in that situation? A better question might be: Would you let a family member undergo coronary artery bypass grafting (CABG) in your hospital? Probably not. So if you would inform a family member, shouldn’t you tell your patient?
A situation like this occurred in September 2005 at the University of Massachusetts Medical Center in Worcester. Media coverage was intense, and statistics showed that thoracic surgery mortality at UMass was the highest in the state two years running. The service at the hospital was closed temporarily.1 Extensive reorganization, adoption of QI protocols, and development of oversight committees resulted in much-improved patient outcomes when the program reopened a few weeks later.
The higher-than-expected complication rate had persisted at UMass for four years before the closure and reorganization. One wonders if hospitalists and cardiologists suspected a problem with surgical outcomes before the hospital was thrust into the national spotlight. Is it our job to know our hospital’s track record in surgery and invasive procedures? Yes, it probably is. This is why a hospital’s quality-assurance committee is so important. As keeper of the outcomes data, the committee is charged with sounding an alarm when a problem is brewing.
Tech-savvy patients have access to detailed reporting on performance measures for hospitals and physicians. Interpretation of the data can be complex. High surgical complication rates might be the result of a higher-than-expected patient acuity mix—patients who were older and sicker than usual—and may not represent a system or surgeon problem. Hospitalists need to guide patients through the interpretation of this data.
Patients trust their physicians. They trust that hospitalists will provide the best advice and make recommendations with their interests at heart. To not do so violates the public trust in physicians as patient advocates. Required by law, transparency of hospital quality data is the basis of a truthful relationship between the healthcare system and the public.
HM’s reputation will be tarnished if patients perceive that the physicians are more interested in the well-being of the hospital than the well-being of the patients.
Reference
- Kowalczyk L, Smith S. Hospital halts heart surgeries due to deaths. Boston Globe Web site. Available at: www.boston.com/news/local/articles/2005/09/22/hospital_halts_heart_surgeries_due_to_deaths. Accessed March 31, 2009.
CON
Outcome disclosure is impractical, unnecessary

At first glance, disclosing information about better outcomes at another hospital seems reasonable—even ethically obligatory. However, there are several competing interests, and in the end, the existing precedent for requiring reasonable disclosure in informed consent makes more sense.
The first issue is practicality. How much is a hospitalist obligated to know, and what degree of difference must be disclosed? In the case example, the hospitalist knows better outcomes are available at a nearby facility. However, if a duty to disclose this information exists, it can’t be limited to the information that an individual hospitalist has available to them. If such a duty exists, there is a corresponding burden on providers to have consistent and accurate information to disclose. If disclosure of differing outcomes is the ethical standard, then the reasonable disclosure needs to meet some uniform criteria for when a differing outcome rises to the level that the disclosure is compelled.
Data exist for pneumonia outcomes, readmission rates, and medication errors, as well as data for physicians relative to their colleagues. The fact that a hospitalist might have incidental knowledge of differing outcomes is not sufficient to create an ethical obligation, but there must be some uniformity to a disclosure requirement.
It is easy to envision a hospitalist spending as much time disclosing outcomes data as disclosing medical information and prognosis in the process of obtaining informed consent. Hospitalists can’t be expected to manage all of that information, much less make a meaningful disclosure. Physicians’ information-management skills should focus on medical knowledge—not outcomes data.
The test case has more implications for the professionalism of the hospitalist. Ultimately, they should act in the best interest of the patient. The recommended course of treatment should maximize benefit and minimize harm. Enough information should be provided that the patient can participate in weighing risks and benefits. The hospitalist needs to decide if it is unsafe to perform the procedure at their institution, and if so, the patient should be referred out. If there is a small but real benefit to having the procedure done elsewhere, the hospitalist cannot be responsible for determining what threshold of incremental benefit warrants disclosure. Existing ethical responsibilities to protect the patient and act in their best interests already addresses the issues of disparate outcomes more effectively than a blanket disclosure policy. Patients need to trust their hospitalists, and we need to be worthy of that trust.
Mandating disclosure of better outcomes would create a conflict of interest for physicians and hospitals. This conflict would be difficult to manage. Large referral centers exist because physicians recognize their own limits and act in patients’ best interests. Requiring a new level of disclosure would mean that many hospitals (save for an elite few) would recommend patients go elsewhere a substantial part of the time.
Conflicts of interest usually are managed more than eliminated, and the current management of the tension between caring for a patient personally and referring them out based on a perception of the patient’s need for a higher level of care achieves a reasonable and balanced result. Disrupting this result with a mandated level of disclosure will result in disruption of a functional process.
Measured disclosure of relevant information is a good thing. A high level of communication and shared decision-making between physicians and patients is a good thing. Discussion of disparate outcomes may be an ethically important part of a treatment plan, but saying it is advisable in all cases is unnecessary, unmanageable, and inadvisable.
The opinions expressed herein are those of the authors and do not represent those of the Society of Hospital Medicine or The Hospitalist.
Editors’ note: Hospitalists face difficult decisions every day, including situations that don’t always have clear-cut answers. Beginning with this month’s “HM Debate,” The Hospitalist stares down the tough questions and presents all sides of the issues. This month’s question: You are discharging a patient after treatment for a non-ST segment myocardial infarction (NSTEMI). The cardiology team recommends nonemergent coronary artery bypass grafting (CABG) for the patient’s three-vessel disease. You set up a referral for surgery, but you know the CABG morbidity and mortality rates are higher at your hospital than at a hospital 30 miles away. Should you disclose this information to your patient?
PRO
If you would tell your relative, you should tell your patient
If a patient at your hospital needs surgery or another invasive intervention, are you obligated to inform them of your hospital’s record with that procedure—particularly if the record is not as good as the one of the hospital down the street? Should loyalty to your hospital trump the risk to the patient?
In our scenario, the patient is being referred for elective surgery, and it is known that the cardiovascular team at a neighboring hospital has a better record for this procedure. It is the hospitalist’s job to present this information to the patient so that an intelligent and informed decision can be made. If the hospitalist believes the outcomes data, then an obligation exists to share that information with the patient.
If the data are subtle, one might argue that confusing the patient with more levels of decision-making is unnecessary. On the other hand, if data on performance outcomes between two institutions are clear, it presents an ethical position.
Let us assume the hospitalist is aware of poor outcomes in coronary bypass surgery at their hospital. Perhaps the mortality rates were unusually high and the hospitalist knew external consultants were brought in to identify the problems. Would you refer your patient for bypass surgery in that situation? A better question might be: Would you let a family member undergo coronary artery bypass grafting (CABG) in your hospital? Probably not. So if you would inform a family member, shouldn’t you tell your patient?
A situation like this occurred in September 2005 at the University of Massachusetts Medical Center in Worcester. Media coverage was intense, and statistics showed that thoracic surgery mortality at UMass was the highest in the state two years running. The service at the hospital was closed temporarily.1 Extensive reorganization, adoption of QI protocols, and development of oversight committees resulted in much-improved patient outcomes when the program reopened a few weeks later.
The higher-than-expected complication rate had persisted at UMass for four years before the closure and reorganization. One wonders if hospitalists and cardiologists suspected a problem with surgical outcomes before the hospital was thrust into the national spotlight. Is it our job to know our hospital’s track record in surgery and invasive procedures? Yes, it probably is. This is why a hospital’s quality-assurance committee is so important. As keeper of the outcomes data, the committee is charged with sounding an alarm when a problem is brewing.
Tech-savvy patients have access to detailed reporting on performance measures for hospitals and physicians. Interpretation of the data can be complex. High surgical complication rates might be the result of a higher-than-expected patient acuity mix—patients who were older and sicker than usual—and may not represent a system or surgeon problem. Hospitalists need to guide patients through the interpretation of this data.
Patients trust their physicians. They trust that hospitalists will provide the best advice and make recommendations with their interests at heart. To not do so violates the public trust in physicians as patient advocates. Required by law, transparency of hospital quality data is the basis of a truthful relationship between the healthcare system and the public.
HM’s reputation will be tarnished if patients perceive that the physicians are more interested in the well-being of the hospital than the well-being of the patients.
Reference
- Kowalczyk L, Smith S. Hospital halts heart surgeries due to deaths. Boston Globe Web site. Available at: www.boston.com/news/local/articles/2005/09/22/hospital_halts_heart_surgeries_due_to_deaths. Accessed March 31, 2009.
CON
Outcome disclosure is impractical, unnecessary
At first glance, disclosing information about better outcomes at another hospital seems reasonable—even ethically obligatory. However, there are several competing interests, and in the end, the existing precedent for requiring reasonable disclosure in informed consent makes more sense.
The first issue is practicality. How much is a hospitalist obligated to know, and what degree of difference must be disclosed? In the case example, the hospitalist knows better outcomes are available at a nearby facility. However, if a duty to disclose this information exists, it can’t be limited to the information that an individual hospitalist has available to them. If such a duty exists, there is a corresponding burden on providers to have consistent and accurate information to disclose. If disclosure of differing outcomes is the ethical standard, then the reasonable disclosure needs to meet some uniform criteria for when a differing outcome rises to the level that the disclosure is compelled.
Data exist for pneumonia outcomes, readmission rates, and medication errors, as well as data for physicians relative to their colleagues. The fact that a hospitalist might have incidental knowledge of differing outcomes is not sufficient to create an ethical obligation, but there must be some uniformity to a disclosure requirement.
It is easy to envision a hospitalist spending as much time disclosing outcomes data as disclosing medical information and prognosis in the process of obtaining informed consent. Hospitalists can’t be expected to manage all of that information, much less make a meaningful disclosure. Physicians’ information-management skills should focus on medical knowledge—not outcomes data.
The test case has more implications for the professionalism of the hospitalist. Ultimately, they should act in the best interest of the patient. The recommended course of treatment should maximize benefit and minimize harm. Enough information should be provided that the patient can participate in weighing risks and benefits. The hospitalist needs to decide if it is unsafe to perform the procedure at their institution, and if so, the patient should be referred out. If there is a small but real benefit to having the procedure done elsewhere, the hospitalist cannot be responsible for determining what threshold of incremental benefit warrants disclosure. Existing ethical responsibilities to protect the patient and act in their best interests already addresses the issues of disparate outcomes more effectively than a blanket disclosure policy. Patients need to trust their hospitalists, and we need to be worthy of that trust.
Mandating disclosure of better outcomes would create a conflict of interest for physicians and hospitals. This conflict would be difficult to manage. Large referral centers exist because physicians recognize their own limits and act in patients’ best interests. Requiring a new level of disclosure would mean that many hospitals (save for an elite few) would recommend patients go elsewhere a substantial part of the time.
Conflicts of interest usually are managed more than eliminated, and the current management of the tension between caring for a patient personally and referring them out based on a perception of the patient’s need for a higher level of care achieves a reasonable and balanced result. Disrupting this result with a mandated level of disclosure will result in disruption of a functional process.
Measured disclosure of relevant information is a good thing. A high level of communication and shared decision-making between physicians and patients is a good thing. Discussion of disparate outcomes may be an ethically important part of a treatment plan, but saying it is advisable in all cases is unnecessary, unmanageable, and inadvisable.
The opinions expressed herein are those of the authors and do not represent those of the Society of Hospital Medicine or The Hospitalist.
Medicine’s Change Agent
Sen. Max Baucus (D-Mont.) might be the most devoted champion of healthcare reform on Capitol Hill today. He chairs the Senate Finance Committee, which has jurisdiction over Medicare, Medicaid, the State Children’s Health Insurance Program (SCHIP), and other healthcare entitlement programs. He has worked for healthcare reform in large and small measures, and recently put forth a comprehensive—and controversial—plan for changing the U.S. healthcare system.
Sen. Baucus penned a white paper, “Call to Action: Health Care Reform 2009,” which was published after the November election and outlines his proposals for universal healthcare coverage. Although he hopes to introduce some form of his white paper as a Senate bill, as of press time, he had not done so.
A Stanford Law graduate, Sen. Baucus was the executive director of the 1972 Montana Constitutional Convention, which rewrote that state’s constitution. He has served in public office since 1973, including six consecutive terms in the U.S. Senate.
The Hospitalist caught up with Sen. Baucus to discuss national healthcare reform and how hospitalists can—and will—factor into the changes.
Question: You are pushing for action on healthcare reform in 2009. What’s the status of your first piece of healthcare legislation this year?
Answer: My goal is to craft consensus legislation and move it through the Congress and into law. Now that Congress has passed the American Recovery and Reinvestment Act, I intend to return the attention of the Finance Committee to health reform.
Q: Where will funding come from for some of the immediate healthcare initiatives you’d like to see?
A: Healthcare reform will require an upfront investment in order to achieve the savings we all know are possible. It is my intention that after 10 years, the U.S. will spend no more on healthcare than is currently projected, but we will spend those resources more efficiently and will provide better-quality coverage to all Americans. One of the reasons healthcare reform is so important is that if we ignore the problems in the system and fail to act, healthcare costs will only grow. Acting now is a cost-saving proposition.
Q: As coverage is provided for more Americans, what steps should be taken to ensure an adequate number of physicians, hospital beds, clinics, etc.?
A: With more people in the healthcare system, we will need more physicians and resources. My plan increases the number of primary-care doctors by strengthening the role of primary care. Today, America’s system undervalues primary care relative to specialty care. This has caused fewer medical students to choose careers in primary care. My plan will increase the supply of primary-care practitioners by using federal reimbursement systems and other means to improve the value placed on their work.
My plan also builds on existing resources that have been successful in delivering primary-care services, like community health centers. The proposal I’ve put forward increases funding for low-income and rural clinics designated by Medicare as Federally Qualified Health Centers. [It would provide] more funding for Rural Health Clinics. By strengthening community and rural providers, we can improve access to primary care and better manage conditions before they become serious. That will keep people healthier and save money in the long run.
Q: You call for refocusing payment incentives from quantity of care to quality of care. Do you have CMS’ Physician Quality Reporting Initiative (PQRI) in mind to help move the focus of compensation?
A: My plan builds on a number of programs that are already in place to improve the quality of care, including PQRI, which provides incentives for physicians who track and report data on the quality of care they provide. My plan would expand this initiative using cutting-edge technology to collect and analyze data on quality, and improve it by increasing outreach, information, and assistance to doctors who participate in the program. ... My plan would expand gain-sharing programs, which allow providers to share savings from improved efficiency and quality.
Q: SHM has identified improvements in care coordination, particularly as patients transition from the hospital to the home, as an important element of health reform. You, too, have identified this as priority. Can you elaborate on the types of proposals to improve care transitions that we might see in your healthcare reform bill?
—Sen. Max Baucus
A: Today’s healthcare system doesn’t do enough to encourage healthcare providers to work together, which can be particularly detrimental for patients who are transitioning from hospital to home. According to some estimates, 18% of Medicare hospital admissions result in a rehospitalization within 30 days. This is simply unacceptable, and it is avoidable. Providers can work better together to ensure that patients receive proper follow-up care post-discharge.
In my blueprint for reform, I laid out a series of proposals to encourage greater collaboration among providers. These proposals include a plan to reduce hospital readmissions through increasing public disclosure around readmission rates and, in later years, reducing payment rates for hospitals with readmissions above a certain benchmark. My plan also identifies “bundling” hospital and physician payments under Medicare as a way to encourage greater provider collaboration across a patient’s episode of care, and other concepts like the development of accountable care organizations. My hope is that these proposals will encourage and reward health providers who work together to provide patients the best possible care.
Q: Regarding value-based purchasing, your paper states, “Every effort must be made to align hospital and physician quality goals.” Would this alignment apply to bonus payments, and if so, will it necessitate loosening current restrictions on gain-sharing?
A: Successful implementation of new payment and delivery system models may require changes to the regulatory structure governing provider collaboration. ... It is critical that we strike an appropriate balance between offering providers incentives to work together while also protecting against financial conflicts of interest that could negatively impact quality of care. Regarding value-based purchasing, we are continuing to explore ways to encourage hospitals and doctors to work together to improve quality and are evaluating the best way to align payment incentives to meet this goal.
Q: How can hospitalists help with healthcare reform efforts?
A: As is true with all members of the healthcare community, I encourage hospitalists to work with me and my colleagues throughout the reform process. It is certain to take significant cooperation to create a more accessible, lower-cost, higher-quality system, but I’m confident that working together, we will succeed. I’m asking everyone in the healthcare community to help me create a “can-do” environment for healthcare reform. All stakeholders have a particular focus, and I am willing to listen to every issue. But our collective focus should be on [making] the health system better for everyone.
As always, I appreciate all questions, comments, and concerns, and I look forward to working with all stakeholders throughout this process. TH
Jane Jerrard is a medical writer based in Chicago.