User login
Flu records most active December since 2003
The 2019-2020 flu season took a big jump in severity during the last full week of 2019, according to the Centers for Disease Control and Prevention.
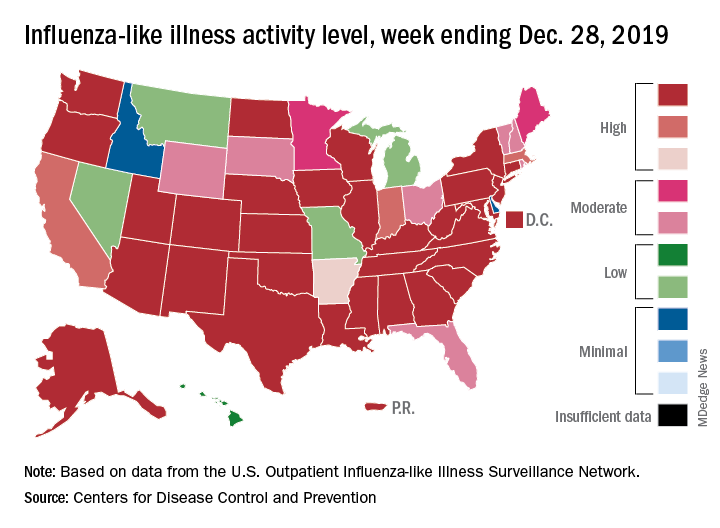
For the week ending Dec. 28, 6.9% of all outpatient visits to health care providers were for influenza-like illness (ILI), the CDC’s influenza division reported Jan. 3. That is up from 5.1% the previous week and is the highest rate recorded in December since 2003. During the flu pandemic season of 2009-2010, the rate peaked in October and dropped to relatively normal levels by the end of November, CDC data show.
This marks the eighth consecutive week that the outpatient visit rate has been at or above the nation’s baseline level of 2.4%, but the data for this week “may in part be influenced by changes in healthcare-seeking behavior that can occur during the holidays,” the CDC suggested.
All those outpatient visits mean that the ILI activity map is getting quite red. Thirty states, as well as the District of Columbia and Puerto Rico, were at the highest level on the CDC’s 1-10 activity scale during the week ending Dec. 28, compared with 20 the week before. Four states were categorized in the “high” range with activity levels of 8 and 9.
There have been approximately 6.4 million flu illnesses so far this season, the CDC estimated, along with 55,000 hospitalizations, although the ILI admission rate of 9.2 per 100,000 population is fairly typical for this time of year.
The week of Dec. 28 also brought reports of five more ILI-related pediatric deaths, which all occurred in the two previous weeks. A total of 27 children have died from the flu so far during the 2019-2020 season, the CDC said.
The 2019-2020 flu season took a big jump in severity during the last full week of 2019, according to the Centers for Disease Control and Prevention.
For the week ending Dec. 28, 6.9% of all outpatient visits to health care providers were for influenza-like illness (ILI), the CDC’s influenza division reported Jan. 3. That is up from 5.1% the previous week and is the highest rate recorded in December since 2003. During the flu pandemic season of 2009-2010, the rate peaked in October and dropped to relatively normal levels by the end of November, CDC data show.
This marks the eighth consecutive week that the outpatient visit rate has been at or above the nation’s baseline level of 2.4%, but the data for this week “may in part be influenced by changes in healthcare-seeking behavior that can occur during the holidays,” the CDC suggested.
All those outpatient visits mean that the ILI activity map is getting quite red. Thirty states, as well as the District of Columbia and Puerto Rico, were at the highest level on the CDC’s 1-10 activity scale during the week ending Dec. 28, compared with 20 the week before. Four states were categorized in the “high” range with activity levels of 8 and 9.
There have been approximately 6.4 million flu illnesses so far this season, the CDC estimated, along with 55,000 hospitalizations, although the ILI admission rate of 9.2 per 100,000 population is fairly typical for this time of year.
The week of Dec. 28 also brought reports of five more ILI-related pediatric deaths, which all occurred in the two previous weeks. A total of 27 children have died from the flu so far during the 2019-2020 season, the CDC said.
Cultivating patient activation through technology
Tech alone is not enough
Patient activation refers to an individual’s knowledge, skill, and confidence in managing their health and health care, according to a recent BMJ editorial. It’s recognized as a critical aspect of high-quality, patient-centered health care – patient activation has the potential to improve patient outcomes while reducing costs.

Total knee replacement offers a great opportunity to study patient activation, said editorial lead author Jesse I. Wolfstadt, MD, MS, FRCSC, of the University of Toronto. “It may help address the one in five patients who are unsatisfied with their knee replacement despite an otherwise technically sound procedure.”
The authors considered some patient activation studies that have shown positive results for cultivating activation through technology. In one, patients engaging with a bedside multimedia intervention on a tablet after undergoing knee replacement reported better pain scores, length of stay, knee function, and satisfaction with care. Another study showed patients who received automated text messages after joint replacement improved time spent on home exercises, decreased their use of narcotics, and had fewer calls to the surgeon’s office.
But “negative mobile app studies seem to suggest that when technologies are used as a passive educational intervention, patient activation may suffer,” according to the editorial. “One possible key ingredient to successful patient activation is the engagement of the health care team that is facilitated through mobile technology. ... Mobile apps and other technological interventions also must have clear goals if they are to be used successfully; and these goals are likely to differ for different patient populations and disease processes.”
Technology alone is not enough to affect patient activation, Dr. Wolfstadt said. “The key to success will likely involve tailoring interventions to individual patients and facilitating increased engagement with the health care team. You can’t just give a patient an app or other form of technology and expect it to replace the function of patient-clinician communication/interaction.”
Reference
1. Wolfstadt JI et ak. Improving patient outcomes following total joint arthroplasty: Is there an app for that? BMJ Qual Saf. 2019 May 2019. doi: 10.1136/bmjqs-2019-009571.
Tech alone is not enough
Tech alone is not enough
Patient activation refers to an individual’s knowledge, skill, and confidence in managing their health and health care, according to a recent BMJ editorial. It’s recognized as a critical aspect of high-quality, patient-centered health care – patient activation has the potential to improve patient outcomes while reducing costs.
Total knee replacement offers a great opportunity to study patient activation, said editorial lead author Jesse I. Wolfstadt, MD, MS, FRCSC, of the University of Toronto. “It may help address the one in five patients who are unsatisfied with their knee replacement despite an otherwise technically sound procedure.”
The authors considered some patient activation studies that have shown positive results for cultivating activation through technology. In one, patients engaging with a bedside multimedia intervention on a tablet after undergoing knee replacement reported better pain scores, length of stay, knee function, and satisfaction with care. Another study showed patients who received automated text messages after joint replacement improved time spent on home exercises, decreased their use of narcotics, and had fewer calls to the surgeon’s office.
But “negative mobile app studies seem to suggest that when technologies are used as a passive educational intervention, patient activation may suffer,” according to the editorial. “One possible key ingredient to successful patient activation is the engagement of the health care team that is facilitated through mobile technology. ... Mobile apps and other technological interventions also must have clear goals if they are to be used successfully; and these goals are likely to differ for different patient populations and disease processes.”
Technology alone is not enough to affect patient activation, Dr. Wolfstadt said. “The key to success will likely involve tailoring interventions to individual patients and facilitating increased engagement with the health care team. You can’t just give a patient an app or other form of technology and expect it to replace the function of patient-clinician communication/interaction.”
Reference
1. Wolfstadt JI et ak. Improving patient outcomes following total joint arthroplasty: Is there an app for that? BMJ Qual Saf. 2019 May 2019. doi: 10.1136/bmjqs-2019-009571.
Experts call to revise the Uniform Determination of Death Act
, according to an editorial published online Dec. 24, 2019, in Annals of Internal Medicine. Proposed revisions would identify the standards for determining death by neurologic criteria and address the question of whether consent is required to make this determination. If accepted, the revisions would enhance public trust in the determination of death by neurologic criteria, the authors said.

“There is a disconnect between the medical and legal standards for brain death,” said Ariane K. Lewis, MD, associate professor of neurology and neurosurgery at New York University and lead author of the editorial. The discrepancy must be remedied because it has led to lawsuits and has proved to be problematic from a societal standpoint, she added.
“We defend changing the law to match medical practice, rather than changing medical practice to match the law,” said Thaddeus Mason Pope, JD, PhD, director of the Health Law Institute at Mitchell Hamline School of Law in Saint Paul, Minnesota, and an author of the editorial.
Accepted medical standards are unclear
The UDDA was drafted in 1981 to establish a uniform legal standard for death by neurologic criteria. A person with “irreversible cessation of all functions of the entire brain, including the brainstem,” is dead, according to the statute. A determination of death, it adds, “must be made in accordance with accepted medical standards.”
But the medical standards used to determine death by neurologic cause have not been uniform. In 2015, the Supreme Court of Nevada ruled that it was not clear that the standard published by the American Academy of Neurology (AAN), which had been used in the case at issue, was the “accepted medical standard.” An AAN summit later affirmed that the accepted medical standards for determination of death by neurologic cause are the 2010 AAN standard for determination of brain death in adults and the 2011 Society of Critical Care Medicine (SCCM), American Academy of Pediatrics (AAP), and Child Neurology Society (CNS) standard for determination of brain death in children. The Nevada legislature amended the state UDDA to identify these standards as the accepted standards. A revised UDDA also should identify these standards and grant an administrative agency (i.e., the board of medicine) the power to review and update the accepted medical standards as needed, according to the editorial.
To the extent that hospitals are not following the AAN or SCCM/AAP/CNS standards for determining death by neurologic cause, “enshrining” these standards in a revised UDDA “should increase uniformity and consistency” in hospitals’ policies on brain death, Dr. Pope said.
The question of hormonal function
Lawsuits in California and Nevada raised the question of whether the pituitary gland and hypothalamus are parts of the brain. If so, then the accepted medical standards for death by neurologic cause are not consistent with the statutory requirements for the determination of death, since the former do not test for cessation of hormonal function.

The current edition of the adult standards for determining death by neurologic cause were published in 2010. “Whenever we measure brain death, we’re not measuring the cessation of all functions of the entire brain,” Dr. Pope said. “That’s not a new thing; that’s been the case for a long time.”
To address the discrepancy between medical practice and the legal statute, Dr. Lewis and colleagues proposed that the UDDA’s reference to “irreversible cessation of functions of the entire brain” be followed by the following clause: “including the brainstem, leading to unresponsive coma with loss of capacity for consciousness, brainstem areflexia, and the inability to breathe spontaneously.” An alternative revision would be to add the briefer phrase “... with the exception of hormonal function.”
Authors say consent is not required for testing
Other complications have arisen from the UDDA’s failure to specify whether consent is required for a determination of death by neurologic cause. Court rulings on this question have not been consistent. Dr. Lewis and colleagues propose adding the following text to the UDDA: “Reasonable efforts should be made to notify a patient’s legally authorized decision-maker before performing a determination of death by neurologic criteria, but consent is not required to initiate such an evaluation.”
The proposed revisions to the UDDA “might give [clinicians] more confidence to proceed with brain death testing, because it would clarify that they don’t need the parents’ [or the patient’s legally authorized decision-maker] consent to do the tests,” said Dr. Pope. “If anything, they might even have a duty to do the tests.”
The final problem with the UDDA that Dr. Lewis and colleagues cited is that it does not provide clear guidance about how to respond to religious objections to discontinuation of organ support after a determination of death by neurologic cause. “Because the issue is rather complicated, we have not advocated for a singular position related to this [question] in our revised UDDA,” Dr. Lewis said. “Rather, we recommended the need for a multidisciplinary group to come together to determine what is the best approach. In an ideal world, this [approach] would be universal throughout the country.”
Although a revised UDDA would provide greater clarity to physicians and promote uniformity of practice, it would not resolve ongoing theological and philosophical debates about whether brain death is biological death, Dr. Pope said. “The key thing is that it would give clinicians a green light or certainty and clarity that they may proceed to do the test in the first place. If the tests are positive and the patient really is dead, then they could proceed to organ procurement or to move to the morgue.”
Dr. Lewis is a member of various AAN committees and working groups but receives no compensation for her role. A coauthor received personal fees from the AAN that were unrelated to the editorial.
SOURCE: Lewis A et al. Ann Intern Med. 2019 Dec 24. doi: 10.7326/M19-2731.
, according to an editorial published online Dec. 24, 2019, in Annals of Internal Medicine. Proposed revisions would identify the standards for determining death by neurologic criteria and address the question of whether consent is required to make this determination. If accepted, the revisions would enhance public trust in the determination of death by neurologic criteria, the authors said.
“There is a disconnect between the medical and legal standards for brain death,” said Ariane K. Lewis, MD, associate professor of neurology and neurosurgery at New York University and lead author of the editorial. The discrepancy must be remedied because it has led to lawsuits and has proved to be problematic from a societal standpoint, she added.
“We defend changing the law to match medical practice, rather than changing medical practice to match the law,” said Thaddeus Mason Pope, JD, PhD, director of the Health Law Institute at Mitchell Hamline School of Law in Saint Paul, Minnesota, and an author of the editorial.
Accepted medical standards are unclear
The UDDA was drafted in 1981 to establish a uniform legal standard for death by neurologic criteria. A person with “irreversible cessation of all functions of the entire brain, including the brainstem,” is dead, according to the statute. A determination of death, it adds, “must be made in accordance with accepted medical standards.”
But the medical standards used to determine death by neurologic cause have not been uniform. In 2015, the Supreme Court of Nevada ruled that it was not clear that the standard published by the American Academy of Neurology (AAN), which had been used in the case at issue, was the “accepted medical standard.” An AAN summit later affirmed that the accepted medical standards for determination of death by neurologic cause are the 2010 AAN standard for determination of brain death in adults and the 2011 Society of Critical Care Medicine (SCCM), American Academy of Pediatrics (AAP), and Child Neurology Society (CNS) standard for determination of brain death in children. The Nevada legislature amended the state UDDA to identify these standards as the accepted standards. A revised UDDA also should identify these standards and grant an administrative agency (i.e., the board of medicine) the power to review and update the accepted medical standards as needed, according to the editorial.
To the extent that hospitals are not following the AAN or SCCM/AAP/CNS standards for determining death by neurologic cause, “enshrining” these standards in a revised UDDA “should increase uniformity and consistency” in hospitals’ policies on brain death, Dr. Pope said.
The question of hormonal function
Lawsuits in California and Nevada raised the question of whether the pituitary gland and hypothalamus are parts of the brain. If so, then the accepted medical standards for death by neurologic cause are not consistent with the statutory requirements for the determination of death, since the former do not test for cessation of hormonal function.
The current edition of the adult standards for determining death by neurologic cause were published in 2010. “Whenever we measure brain death, we’re not measuring the cessation of all functions of the entire brain,” Dr. Pope said. “That’s not a new thing; that’s been the case for a long time.”
To address the discrepancy between medical practice and the legal statute, Dr. Lewis and colleagues proposed that the UDDA’s reference to “irreversible cessation of functions of the entire brain” be followed by the following clause: “including the brainstem, leading to unresponsive coma with loss of capacity for consciousness, brainstem areflexia, and the inability to breathe spontaneously.” An alternative revision would be to add the briefer phrase “... with the exception of hormonal function.”
Authors say consent is not required for testing
Other complications have arisen from the UDDA’s failure to specify whether consent is required for a determination of death by neurologic cause. Court rulings on this question have not been consistent. Dr. Lewis and colleagues propose adding the following text to the UDDA: “Reasonable efforts should be made to notify a patient’s legally authorized decision-maker before performing a determination of death by neurologic criteria, but consent is not required to initiate such an evaluation.”
The proposed revisions to the UDDA “might give [clinicians] more confidence to proceed with brain death testing, because it would clarify that they don’t need the parents’ [or the patient’s legally authorized decision-maker] consent to do the tests,” said Dr. Pope. “If anything, they might even have a duty to do the tests.”
The final problem with the UDDA that Dr. Lewis and colleagues cited is that it does not provide clear guidance about how to respond to religious objections to discontinuation of organ support after a determination of death by neurologic cause. “Because the issue is rather complicated, we have not advocated for a singular position related to this [question] in our revised UDDA,” Dr. Lewis said. “Rather, we recommended the need for a multidisciplinary group to come together to determine what is the best approach. In an ideal world, this [approach] would be universal throughout the country.”
Although a revised UDDA would provide greater clarity to physicians and promote uniformity of practice, it would not resolve ongoing theological and philosophical debates about whether brain death is biological death, Dr. Pope said. “The key thing is that it would give clinicians a green light or certainty and clarity that they may proceed to do the test in the first place. If the tests are positive and the patient really is dead, then they could proceed to organ procurement or to move to the morgue.”
Dr. Lewis is a member of various AAN committees and working groups but receives no compensation for her role. A coauthor received personal fees from the AAN that were unrelated to the editorial.
SOURCE: Lewis A et al. Ann Intern Med. 2019 Dec 24. doi: 10.7326/M19-2731.
FROM ANNALS OF INTERNAL MEDICINE
Aligning scheduling and satisfaction
Research reveals counterintuitive results
Hospitalist work schedules have been the subject of much reporting – and recent research. Studies have shown that control over work hours and schedule flexibility are predictors of clinicians’ career satisfaction and burnout, factors linked to quality of patient care and retention.

Starting in January 2017, an academic hospital medicine group at the University of Colorado at Denver, Aurora, undertook a scheduling redesign using improvement methodology, combined with purchased scheduling software. Tyler Anstett, DO, a hospitalist and assistant professor at the university, and colleagues presented the results in an abstract published during the SHM 2019 annual conference last March.
“We wrote this abstract as a report of the work that we did over several years in our hospital medicine group to improve hospitalist satisfaction with their schedules,” said Dr. Anstett. “We identified that, despite not following the traditional seven-on, seven-off model and 100% fulfillment of individual schedule requests, the majority of clinicians were dissatisfied with the scheduling process and their overall clinical schedules. Further, building these complex, individualized schedules resulted in a heavy administrative burden. We strove to provide better alignment of schedule satisfaction and the administrative burden of incorporating individualized schedule requests.”
Prior to January 2017, service stretches had ranged from 5 to 9 days, and there were few limits on time-off requests.
“Through sequential interventions, we standardized service stretches to 7 days (Tuesday-Monday), introduced a limited number of guaranteed 7-day time-off requests (Tuesday-Monday), and added a limited number of nonguaranteed 3-day flexible time-off requests,” according to the authors. “This simplification improved the automation of the scheduling software, which increased the schedule release lead time to an average of 16 weeks. Further, despite standardizing service stretches to 7 days and limiting time-off requests, physicians surveyed reported improved satisfaction with both their scheduling process (34% of participants ‘satisfied’ in 2017 to 67% in 2018) and their overall clinical schedules (50% of participants ‘satisfied’ in 2017 to 75% in 2018).”So counterintuitively, creating individualized schedules may not result in improved satisfaction and likely results in heavy administrative burden, Dr. Anstett said. “Standardization of schedule creation with allowance of a ‘free-market’ system, allowing clinicians to self-individualize their schedules may also result in less administrative burden and improved satisfaction.”
Reference
1. Anstett T et al. K.I.S.S. (Keep It Simple … Schedules): How Standardization and Simplification Can Improve Scheduling and Physician Satisfaction. SHM 2019, Abstract 112. Accessed June 4, 2019.
Research reveals counterintuitive results
Research reveals counterintuitive results
Hospitalist work schedules have been the subject of much reporting – and recent research. Studies have shown that control over work hours and schedule flexibility are predictors of clinicians’ career satisfaction and burnout, factors linked to quality of patient care and retention.
Starting in January 2017, an academic hospital medicine group at the University of Colorado at Denver, Aurora, undertook a scheduling redesign using improvement methodology, combined with purchased scheduling software. Tyler Anstett, DO, a hospitalist and assistant professor at the university, and colleagues presented the results in an abstract published during the SHM 2019 annual conference last March.
“We wrote this abstract as a report of the work that we did over several years in our hospital medicine group to improve hospitalist satisfaction with their schedules,” said Dr. Anstett. “We identified that, despite not following the traditional seven-on, seven-off model and 100% fulfillment of individual schedule requests, the majority of clinicians were dissatisfied with the scheduling process and their overall clinical schedules. Further, building these complex, individualized schedules resulted in a heavy administrative burden. We strove to provide better alignment of schedule satisfaction and the administrative burden of incorporating individualized schedule requests.”
Prior to January 2017, service stretches had ranged from 5 to 9 days, and there were few limits on time-off requests.
“Through sequential interventions, we standardized service stretches to 7 days (Tuesday-Monday), introduced a limited number of guaranteed 7-day time-off requests (Tuesday-Monday), and added a limited number of nonguaranteed 3-day flexible time-off requests,” according to the authors. “This simplification improved the automation of the scheduling software, which increased the schedule release lead time to an average of 16 weeks. Further, despite standardizing service stretches to 7 days and limiting time-off requests, physicians surveyed reported improved satisfaction with both their scheduling process (34% of participants ‘satisfied’ in 2017 to 67% in 2018) and their overall clinical schedules (50% of participants ‘satisfied’ in 2017 to 75% in 2018).”So counterintuitively, creating individualized schedules may not result in improved satisfaction and likely results in heavy administrative burden, Dr. Anstett said. “Standardization of schedule creation with allowance of a ‘free-market’ system, allowing clinicians to self-individualize their schedules may also result in less administrative burden and improved satisfaction.”
Reference
1. Anstett T et al. K.I.S.S. (Keep It Simple … Schedules): How Standardization and Simplification Can Improve Scheduling and Physician Satisfaction. SHM 2019, Abstract 112. Accessed June 4, 2019.
Early increase in flu activity shows no signs of slowing
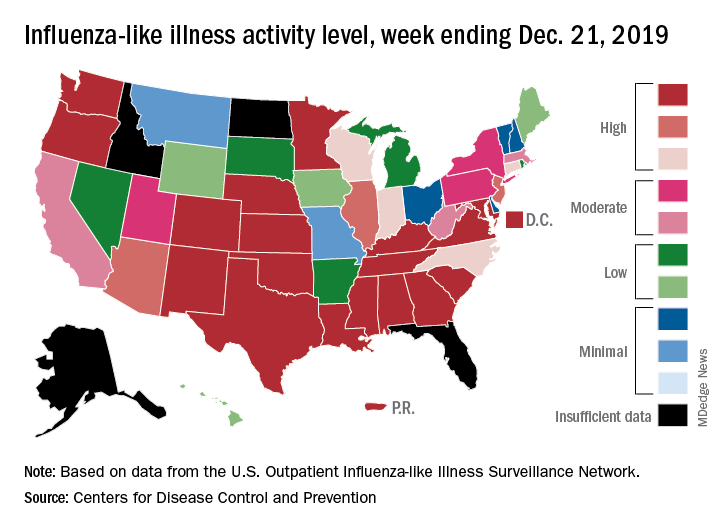
An important measure of U.S. flu activity for the 2019-2020 season has already surpassed last season’s high, and more than half the states are experiencing high levels of activity, according to the Centers for Disease Control and Prevention.
reported Dec. 27.
The last time the outpatient visit rate was higher than that was in February of the 2017-2018 season, when it peaked at 7.5%. The peak month of flu activity occurs most often – about once every 3 years – in February, and the odds of a December peak are about one in five, the CDC has said.
Outpatient illness activity also increased at the state level during the week ending Dec. 21. There were 20 jurisdictions – 18 states, the District of Columbia, and Puerto Rico – at level 10 on the CDC’s 1-10 scale of activity, compared with 13 the previous week, and the number of jurisdictions in the “high” range (levels 8-10) jumped from 21 to 28, the CDC data show.
The influenza division estimated that there have been 4.6 million flu illnesses so far this season, nearly a million more than the total after last week, along with 39,000 hospitalizations. The overall hospitalization rate for the season is up to 6.6 per 100,000 population, which is about average at this point. The proportion of deaths attributed to pneumonia and influenza increased to 5.7%, which is below the epidemic threshold, the CDC said.
Three pediatric deaths related to influenza-like illness were reported during the week ending Dec. 21, two of which occurred in an earlier week. For the 2019-2020 season so far, a total of 22 pediatric deaths have been reported to the CDC.
The measles comeback of 2019
Measles made a comeback in 2019.
The Centers for Disease Control and Prevention reported that, as of Dec. 5, 2019, 1,276 individual cases of measles of measles were confirmed in 31 states, the largest number since 1992. This number is a major uptick in cases, compared with previous years since 2000 when the CDC declared measles eliminated from the United States. No deaths have been reported for 2019.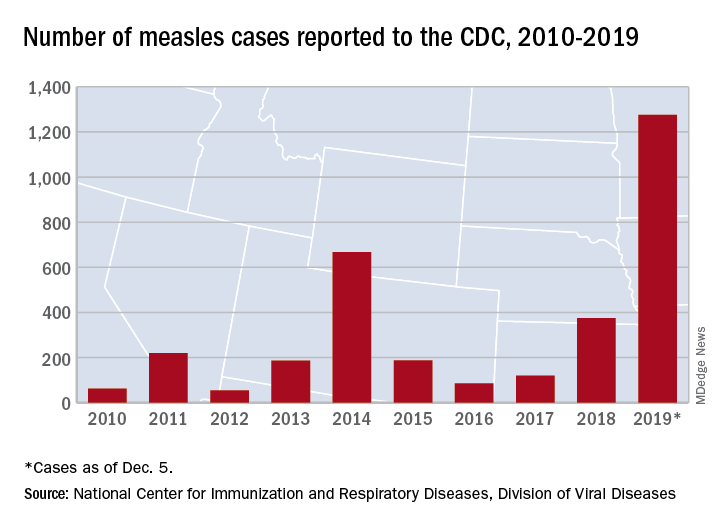
Three-quarters of these cases in 2019 were linked to recent outbreaks in New York and occurred in primarily in underimmunized, close-knit communities and in patients with links to international travel. A total of 124 of the people who got measles this year were hospitalized, and 61 reported having complications, including pneumonia and encephalitis. The overall median patient age was 6 years (31% aged 1-4 years, 27% aged 5-17 years, and 29% aged at least 18 years).
The good news is that most of these cases occurred in unvaccinated patients. The national vaccination rate for the almost 4 million kindergartners reported as enrolled in 2018-2019 was 94.7% for two doses of the MMR vaccine, falling just short of the CDC recommended 95% vaccination rate threshold. The CDC reported an approximate 2.5% rate of vaccination exemptions among school-age children.
The bad news is that, despite the high rate of MMR vaccination rates among U.S. children, there are gaps in measles protection in the U.S. population because of factors leaving patients immunocompromised and antivaccination sentiment that has led some parents to defer or refuse the MMR.
In addition, adults who were vaccinated prior to 1968 with either inactivated measles vaccine or measles vaccine of unknown type may have limited immunity. The inactivated measles vaccine, which was available in 1963-1967, did not achieve effective measles protection.
A global measles surge
While antivaccination sentiment contributed to the 2019 measles cases, a more significant factor may be the global surge of measles. More than 140,000 people worldwide died from measles in 2018, according to the World Health Organization and the CDC.
“[Recent data on measles] indicates that during the first 6 months of the year there have been more measles cases reported worldwide than in any year since 2006. From Jan. 1 to July 31, 2019, 182 countries reported 364,808 measles cases to the WHO. This surpasses the 129,239 reported during the same time period in 2018. WHO regions with the biggest increases in cases include the African region (900%), the Western Pacific region (230%), and the European region (150%),” according to a CDC report.
Studies on hospitalization and complications linked to measles in the United States are scarce, but two outbreaks in Minnesota (2011 and 2017) provided some data on what to expect if the measles surge continues into 2020. The investigators found that poor feeding was a primary reason for admission (97%); additional complications included otitis media (42%), pneumonia (30%), and tracheitis (6%). Three-quarters received antibiotics, 30% required oxygen, and 21% received vitamin A. Median length of stay was 3.7 days (range, 1.1-26.2 days) (Pediatr Infect Dis J. 2019 Jun;38[6]:547-52. doi: 10.1097/INF.0000000000002221).
‘Immunological amnesia’
Infection with the measles virus appears to reduce immunity to other pathogens, according to a paper published in Science (2019 Nov 1;366[6465]599-606).

The hypothesis that the measles virus could cause “immunological amnesia” by impairing immune memory is supported by early research showing children with measles had negative cutaneous tuberculin reactions after having previously tested positive.
“Subsequent studies have shown decreased interferon signaling, skewed cytokine responses, lymphopenia, and suppression of lymphocyte proliferation shortly after infection,” wrote Michael Mina, MD, from Brigham and Women’s Hospital in Boston, and coauthors.
“Given the variation in the degree of immune repertoire modulation we observed, we anticipate that future risk of morbidity and mortality after measles would not be homogeneous but would be skewed toward individuals with the most severe elimination of immunological memory,” they wrote. “These findings underscore the crucial need for continued widespread vaccination.”
In this study, researchers compared the levels of around 400 pathogen-specific antibodies in blood samples from 77 unvaccinated children, taken before and 2 months after natural measles infection, with 5 unvaccinated children who did not contract measles. A total of 34 children experienced mild measles, and 43 had severe measles.
They found that the samples taken after measles infection showed “substantial” reductions in the number of pathogen epitopes, compared with the samples from children who did not get infected with measles.
This amounted to approximately a 20% mean reduction in overall diversity or size of the antibody repertoire. However, in children who experienced severe measles, there was a median loss of 40% (range, 11%-62%) of antibody repertoire, compared with a median of 33% (range, 12%-73%) range in children who experienced mild infection. Meanwhile, the control subjects retained approximately 90% of their antibody repertoire over a similar or longer time period. Some children lost up to 70% of antibodies for specific pathogens.
Maternal-acquired immunity fades
In another study of measles immunity, maternal antibodies were found to be insufficient to provide immunity to infants after 6 months.
The study of 196 infants showed that maternal measles antibodies had dropped below the protective threshold by 3 months of age – well before the recommended age of 12-15 months for the first dose of MMR vaccine.
The odds of inadequate protection doubled for each additional month of age, Michelle Science, MD, of the University of Toronto and associates reported in Pediatrics (2019 Dec 1. doi 10.1542/peds.2019-0630).
“The widening gap between loss of maternal antibodies and measles vaccination described in our study leaves infants vulnerable to measles for much of their infancy and highlights the need for further research to support public health policy,” Dr. Science and colleagues wrote.
The researchers randomly selected 25 samples for each of eight different age groups: up to 30 days old; 1 month (31-60 days), 2 months (61-89 days), 3 months (90-119 days), 4 months, 5 months, 6-9 months, and 9-11 months.
Just over half the babies (56%) were male, and 35% had an underlying condition, but none had conditions that might affect antibody levels. The conditions were primarily a developmental delay or otherwise affecting the central nervous system, liver, or gastrointestinal function. Mean maternal age was 32 years.
To ensure high test sensitivity, the researchers used the plaque-reduction neutralization test to test for measles-neutralizing antibodies instead of using enzyme-linked immunosorbent assay, because “ELISA sensitivity decreases as antibody titers decrease,” Dr. Science and colleagues wrote. They used a neutralization titer of less than 192 mIU/mL as the threshold for protection against measles.
When the researchers calculated the predicted standardized mean antibody titer for infants with a mother aged 32 years, they determined their mean to be 541 mIU/mL at 1 month, 142 mIU/mL at 3 months (below the measles threshold of susceptibility of 192 mIU/mL), and 64 mIU/mL at 6 months. None of the infants had measles antibodies above the protective threshold at 6 months old, the authors noted.
Children’s odds of susceptibility to measles doubled for each additional month of age, after adjustment for infant sex and maternal age (odds ratio, 2.13). Children’s likelihood of susceptibility to measles modestly increased as maternal age increased in 5-year increments from 25 to 40 years.
Children with an underlying conditions had greater susceptibility to measles (83%), compared with those without a comorbidity (68%, P = .03). No difference in susceptibility existed between males and females or based on gestational age at birth (ranging from 37 to 41 weeks).
The Advisory Committee on Immunization Practices permits measles vaccination “as early as 6 months for infants who plan to travel internationally, infants with ongoing risk for exposure during measles outbreaks and as postexposure prophylaxis,” Huong Q. McLean, PhD, of Marshfield (Wisc.) Clinic Research Institute, and Walter A. Orenstein, MD, of Emory University, Atlanta, noted in an editorial.
The research was funded by the Public Health Ontario Project Initiation Fund. The authors had no relevant financial disclosures.
Bianca Nogrady and Tara Haelle contributed to this story.
Measles made a comeback in 2019.
The Centers for Disease Control and Prevention reported that, as of Dec. 5, 2019, 1,276 individual cases of measles of measles were confirmed in 31 states, the largest number since 1992. This number is a major uptick in cases, compared with previous years since 2000 when the CDC declared measles eliminated from the United States. No deaths have been reported for 2019.
Three-quarters of these cases in 2019 were linked to recent outbreaks in New York and occurred in primarily in underimmunized, close-knit communities and in patients with links to international travel. A total of 124 of the people who got measles this year were hospitalized, and 61 reported having complications, including pneumonia and encephalitis. The overall median patient age was 6 years (31% aged 1-4 years, 27% aged 5-17 years, and 29% aged at least 18 years).
The good news is that most of these cases occurred in unvaccinated patients. The national vaccination rate for the almost 4 million kindergartners reported as enrolled in 2018-2019 was 94.7% for two doses of the MMR vaccine, falling just short of the CDC recommended 95% vaccination rate threshold. The CDC reported an approximate 2.5% rate of vaccination exemptions among school-age children.
The bad news is that, despite the high rate of MMR vaccination rates among U.S. children, there are gaps in measles protection in the U.S. population because of factors leaving patients immunocompromised and antivaccination sentiment that has led some parents to defer or refuse the MMR.
In addition, adults who were vaccinated prior to 1968 with either inactivated measles vaccine or measles vaccine of unknown type may have limited immunity. The inactivated measles vaccine, which was available in 1963-1967, did not achieve effective measles protection.
A global measles surge
While antivaccination sentiment contributed to the 2019 measles cases, a more significant factor may be the global surge of measles. More than 140,000 people worldwide died from measles in 2018, according to the World Health Organization and the CDC.
“[Recent data on measles] indicates that during the first 6 months of the year there have been more measles cases reported worldwide than in any year since 2006. From Jan. 1 to July 31, 2019, 182 countries reported 364,808 measles cases to the WHO. This surpasses the 129,239 reported during the same time period in 2018. WHO regions with the biggest increases in cases include the African region (900%), the Western Pacific region (230%), and the European region (150%),” according to a CDC report.
Studies on hospitalization and complications linked to measles in the United States are scarce, but two outbreaks in Minnesota (2011 and 2017) provided some data on what to expect if the measles surge continues into 2020. The investigators found that poor feeding was a primary reason for admission (97%); additional complications included otitis media (42%), pneumonia (30%), and tracheitis (6%). Three-quarters received antibiotics, 30% required oxygen, and 21% received vitamin A. Median length of stay was 3.7 days (range, 1.1-26.2 days) (Pediatr Infect Dis J. 2019 Jun;38[6]:547-52. doi: 10.1097/INF.0000000000002221).
‘Immunological amnesia’
Infection with the measles virus appears to reduce immunity to other pathogens, according to a paper published in Science (2019 Nov 1;366[6465]599-606).
The hypothesis that the measles virus could cause “immunological amnesia” by impairing immune memory is supported by early research showing children with measles had negative cutaneous tuberculin reactions after having previously tested positive.
“Subsequent studies have shown decreased interferon signaling, skewed cytokine responses, lymphopenia, and suppression of lymphocyte proliferation shortly after infection,” wrote Michael Mina, MD, from Brigham and Women’s Hospital in Boston, and coauthors.
“Given the variation in the degree of immune repertoire modulation we observed, we anticipate that future risk of morbidity and mortality after measles would not be homogeneous but would be skewed toward individuals with the most severe elimination of immunological memory,” they wrote. “These findings underscore the crucial need for continued widespread vaccination.”
In this study, researchers compared the levels of around 400 pathogen-specific antibodies in blood samples from 77 unvaccinated children, taken before and 2 months after natural measles infection, with 5 unvaccinated children who did not contract measles. A total of 34 children experienced mild measles, and 43 had severe measles.
They found that the samples taken after measles infection showed “substantial” reductions in the number of pathogen epitopes, compared with the samples from children who did not get infected with measles.
This amounted to approximately a 20% mean reduction in overall diversity or size of the antibody repertoire. However, in children who experienced severe measles, there was a median loss of 40% (range, 11%-62%) of antibody repertoire, compared with a median of 33% (range, 12%-73%) range in children who experienced mild infection. Meanwhile, the control subjects retained approximately 90% of their antibody repertoire over a similar or longer time period. Some children lost up to 70% of antibodies for specific pathogens.
Maternal-acquired immunity fades
In another study of measles immunity, maternal antibodies were found to be insufficient to provide immunity to infants after 6 months.
The study of 196 infants showed that maternal measles antibodies had dropped below the protective threshold by 3 months of age – well before the recommended age of 12-15 months for the first dose of MMR vaccine.
The odds of inadequate protection doubled for each additional month of age, Michelle Science, MD, of the University of Toronto and associates reported in Pediatrics (2019 Dec 1. doi 10.1542/peds.2019-0630).
“The widening gap between loss of maternal antibodies and measles vaccination described in our study leaves infants vulnerable to measles for much of their infancy and highlights the need for further research to support public health policy,” Dr. Science and colleagues wrote.
The researchers randomly selected 25 samples for each of eight different age groups: up to 30 days old; 1 month (31-60 days), 2 months (61-89 days), 3 months (90-119 days), 4 months, 5 months, 6-9 months, and 9-11 months.
Just over half the babies (56%) were male, and 35% had an underlying condition, but none had conditions that might affect antibody levels. The conditions were primarily a developmental delay or otherwise affecting the central nervous system, liver, or gastrointestinal function. Mean maternal age was 32 years.
To ensure high test sensitivity, the researchers used the plaque-reduction neutralization test to test for measles-neutralizing antibodies instead of using enzyme-linked immunosorbent assay, because “ELISA sensitivity decreases as antibody titers decrease,” Dr. Science and colleagues wrote. They used a neutralization titer of less than 192 mIU/mL as the threshold for protection against measles.
When the researchers calculated the predicted standardized mean antibody titer for infants with a mother aged 32 years, they determined their mean to be 541 mIU/mL at 1 month, 142 mIU/mL at 3 months (below the measles threshold of susceptibility of 192 mIU/mL), and 64 mIU/mL at 6 months. None of the infants had measles antibodies above the protective threshold at 6 months old, the authors noted.
Children’s odds of susceptibility to measles doubled for each additional month of age, after adjustment for infant sex and maternal age (odds ratio, 2.13). Children’s likelihood of susceptibility to measles modestly increased as maternal age increased in 5-year increments from 25 to 40 years.
Children with an underlying conditions had greater susceptibility to measles (83%), compared with those without a comorbidity (68%, P = .03). No difference in susceptibility existed between males and females or based on gestational age at birth (ranging from 37 to 41 weeks).
The Advisory Committee on Immunization Practices permits measles vaccination “as early as 6 months for infants who plan to travel internationally, infants with ongoing risk for exposure during measles outbreaks and as postexposure prophylaxis,” Huong Q. McLean, PhD, of Marshfield (Wisc.) Clinic Research Institute, and Walter A. Orenstein, MD, of Emory University, Atlanta, noted in an editorial.
The research was funded by the Public Health Ontario Project Initiation Fund. The authors had no relevant financial disclosures.
Bianca Nogrady and Tara Haelle contributed to this story.
EVALI readmissions and deaths prompt guideline change
Those who required rehospitalization for e-cigarette or vaping product use–associated lung injury (EVALI) and those who died after discharge were more likely to have one or more chronic conditions than were other EVALI patients, and those “who died also were more likely to have been admitted to an intensive care unit, experienced respiratory failure necessitating intubation and mechanical ventilation, and were significantly older,” Christina A. Mikosz, MD, and associates wrote in the Morbidity and Mortality Weekly Report.
Their analysis included the 1,139 EVALI patients who were discharged on or after Oct. 31, 2019. Of that group, 31 (2.7%) patients were rehospitalized and subsequently discharged and another 7 died after the initial discharge. The median age was 54 years for those who died, 27 years for those who were rehospitalized, and 23 for those who survived without rehospitalization, said Dr. Mikosz of the CDC National Center for Injury Prevention and Control, Atlanta, and associates.
Those findings, along with the rates of one or more comorbidities – 83% for those who died, 71% for those who were rehospitalized, and 26% for those who did not die or get readmitted – prompted the CDC to update its guidance for postdischarge follow-up of EVALI patients.
That update involves six specific recommendations to determine readiness for discharge, which include “confirming no clinically significant fluctuations in vital signs for at least 24-48 hours before discharge [and] preparation for hospital discharge and postdischarge care coordination to reduce risk of rehospitalization and death,” Mary E. Evans, MD, and associates said in a separate CDC communication (MMWR. 2019 Dec. 20. 68[early release]:1-6).
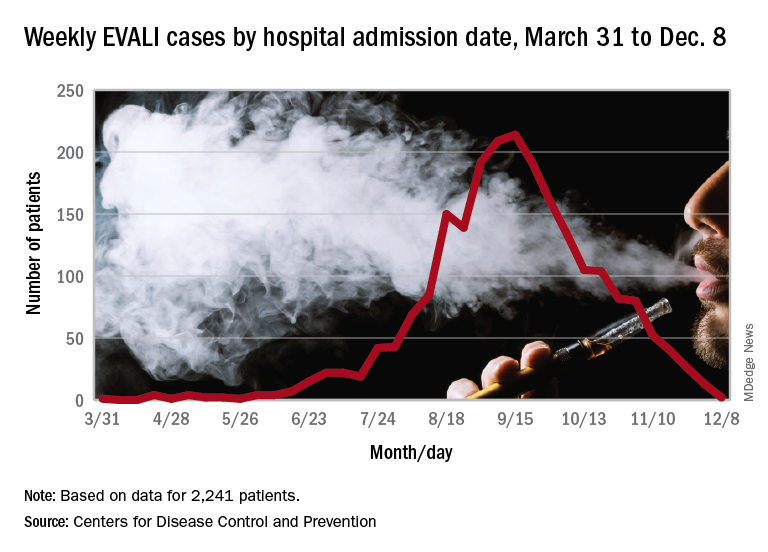
As of Dec. 17, the CDC reports that 2,506 patients have been hospitalized with EVALI since March 31, 2019, and 54 deaths have been confirmed in 27 states and the District of Columbia. The outbreak appears to have peaked in September, but cases are still being reported: 13 during the week of Dec. 1-7 and one case for the week of Dec. 8-14.
SOURCE: Mikosz CA et al. MMWR. 2019 Dec. 20. 68[early release]:1-7.
Those who required rehospitalization for e-cigarette or vaping product use–associated lung injury (EVALI) and those who died after discharge were more likely to have one or more chronic conditions than were other EVALI patients, and those “who died also were more likely to have been admitted to an intensive care unit, experienced respiratory failure necessitating intubation and mechanical ventilation, and were significantly older,” Christina A. Mikosz, MD, and associates wrote in the Morbidity and Mortality Weekly Report.
Their analysis included the 1,139 EVALI patients who were discharged on or after Oct. 31, 2019. Of that group, 31 (2.7%) patients were rehospitalized and subsequently discharged and another 7 died after the initial discharge. The median age was 54 years for those who died, 27 years for those who were rehospitalized, and 23 for those who survived without rehospitalization, said Dr. Mikosz of the CDC National Center for Injury Prevention and Control, Atlanta, and associates.
Those findings, along with the rates of one or more comorbidities – 83% for those who died, 71% for those who were rehospitalized, and 26% for those who did not die or get readmitted – prompted the CDC to update its guidance for postdischarge follow-up of EVALI patients.
That update involves six specific recommendations to determine readiness for discharge, which include “confirming no clinically significant fluctuations in vital signs for at least 24-48 hours before discharge [and] preparation for hospital discharge and postdischarge care coordination to reduce risk of rehospitalization and death,” Mary E. Evans, MD, and associates said in a separate CDC communication (MMWR. 2019 Dec. 20. 68[early release]:1-6).
As of Dec. 17, the CDC reports that 2,506 patients have been hospitalized with EVALI since March 31, 2019, and 54 deaths have been confirmed in 27 states and the District of Columbia. The outbreak appears to have peaked in September, but cases are still being reported: 13 during the week of Dec. 1-7 and one case for the week of Dec. 8-14.
SOURCE: Mikosz CA et al. MMWR. 2019 Dec. 20. 68[early release]:1-7.
FROM MMWR
Vitamin E acetate confirmed as likely source of EVALI
Vitamin E acetate was found in fluid from the lungs of 94% of patients with electronic cigarette, or vaping, product use–associated lung injury, data from a convenience sample of 51 patients indicate. The findings were published in the New England Journal of Medicine.
Cases of electronic cigarette, or vaping, product use–associated lung injury (EVALI) were reported to the Centers for Disease Control and Prevention starting in early 2019, and numbers rose throughout the year, “which suggests new or increased exposure to one or more toxicants from the use of e-cigarette products,” wrote Benjamin C. Blount, PhD, of the National Center for Environmental Health at the CDC, and colleagues.
To further investigate potential toxins in patients with EVALI, the researchers examined bronchoalveolar-lavage (BAL) fluid from 51 EVALI patients and 99 healthy controls.
After the researchers used isotope dilution mass spectrometry on the samples, 48 of the 51 patients (94%) showed vitamin E acetate in their BAL samples. No other potential toxins – including plant oils, medium-chain triglyceride oil, petroleum distillates, and diluent terpenes – were identified. The samples of one patient each showed coconut oil and limonene.
A total of 47 of 51 patients for whom complete laboratory data were available either reported vaping tetrahydrocannabinol products within 90 days of becoming ill, or showed tetrahydrocannabinol or its metabolites in their BAL fluid. In addition, 30 of 47 patients showed nicotine or nicotine metabolites in their BAL fluid.
The average age of the patients was 23 years, 69% were male. Overall, 25 were confirmed EVALI cases and 26 were probable cases, and probable cases included the three patients who showed no vitamin E acetate.
The safety of inhaling vitamin E acetate, which is a common ingredient in dietary supplements and skin care creams, has not been well studied. It could contribute to lung injury when heated in e-cigarette products by splitting the acetate to create the reactive compound and potential lung irritant ketene, the researchers said.
The study findings were limited by several factors including the possibility that vitamin E acetate is a marker for exposure to other toxicants, a lack of data on the impact of heating vitamin e acetate, and the inability to assess the timing of the vitamin E acetate exposure compared to BAL sample collection, the researchers noted.
However, the results suggest that vitamin E acetate may play a role in EVALI because of the high detection rate in patients from across the United States, the biologically possible potential for lung injury from vitamin e acetate, and the timing of the rise of EVALI and the use of vitamin E acetate in vaping products, they concluded.
The research was supported by the National Cancer Institute, the FDA Center for Tobacco Products, and The Ohio State University Pelotonia intramural research program. The authors had no financial conflicts to disclose.
SOURCE: Blount BC et al. N Engl J Med. 2019 Dec 20. doi: 10.1056/NEJMoa1916433.
FROM NEW ENGLAND JOURNAL OF MEDICINE
A novel communication framework for inpatient pain management
Introducing the VIEW Framework
Case
A 55-year-old male with a history of diabetes mellitus, lumbar degenerative disc disease, and chronic low back pain was admitted overnight with right lower extremity cellulitis. He reported taking oral hydromorphone for chronic pain, but review of the Prescription Drug Monitoring Program (PDMP) revealed multiple short-term prescriptions from various ED providers, as well as monthly prescriptions from a variety of primary care providers.

Throughout the EHR, he is described as manipulative and narcotic-seeking with notation of multiple ED visits for pain. Multiple discharges against medical advice were noted. He was given two doses of IV hydromorphone in the ED and requested that this be continued. He was admitted for IV antibiotics for severe leg pain that he rated 15/10.
Background
The Society of Hospital Medicine published a consensus statement in the Journal of Hospital Medicine in 2018 that included 16 clinical recommendations on the safe use of opioids for the treatment of acute pain in hospitalized adults.1 In regard to communication about pain, clinicians are encouraged to set realistic goals and expectations of opioid therapy, closely monitor response to opioid therapy, and provide education about the side effects and potential risks of opioid therapy for patients and their families.
However, even when these strategies are employed, the social and behavioral complexities of individual patients can contribute to unsatisfactory interactions with health care staff. Because difficult encounters have been linked to provider burnout, enhanced communication strategies can benefit both the patient and physician.2
SHM’s Patient Experience Committee saw an opportunity to provide complementary evidence-based best-practice tips for communication about pain. Specifically, the committee worked collectively to develop a framework that can be applied to more challenging encounters.
The VIEW Framework
VISIT the patient’s chart and your own mental state.
First, visit the patient’s chart to review information relevant to the patient’s pain history. The EHR can be leveraged through filters and search functions to identify encounters, consultations, and notes relevant to pain management.
Look at the prior to admission medication list and active medication list and see if there are discrepancies. The medication administration record (MAR) can help identify adjunctive medications that the patient may be refusing. PDMP data should be screened for signs of aberrant use, including multiple pharmacies, multiple prescribers, short intervals between prescriptions, and serially prescribed, multiple, low-quantity prescriptions.
While documented pain scores can be a marker of patient distress, objective aspects of the patient’s functional status can shed light on how much his/her discomfort impairs day-to-day living. Examples of these measures include nutritional intake, sleep cycle, out of bed activity, and participation with therapy. Lastly, assess for opioid-related side-effects including constipation, decreased respiratory rate, and any notation of over sedation in narrative documentation from ancillary services.
Once this information has been accrued, it is important to take a moment of mindfulness before meeting with the patient. Take steps to minimize interruptions with electronic devices by silencing your pager/cell phone and disengaging from computers/tablets. Some examples of mindfulness-based practices include taking cycles of deep breathing, going for a short walk to appreciate hospital artwork or view points, or focusing on the sensory aspects of washing your hands prior to seeing the patient. Self-reflection on prior meaningful encounters can also help reset your state of mind. These activities can help clear prior subconscious thoughts and frustrations and prepare for the task ahead of you.3
Intense focus and awareness can enhance your recognition of patient distress, increase your ability to engage in active listening, and enable you to be more receptive to verbal and nonverbal cues.2 Additionally, mindful behaviors have been shown to contribute to decreased burnout and improved empathy.4,5
INTERVIEW the patient.
Once you enter the room, introduce yourself to the patient and others who are present. Interview the patient by eliciting subjective information. Use open-ended and nonjudgmental language, and take moments to summarize the patient’s perspective.
Inquire about the patient’s home baseline pain scores and past levels of acceptable function. Further explore the patient’s performance goals related to activities of daily living and quality of life. Ask about any prior history of addiction to any substance, and if needed, discuss your specific concerns related to substance misuse and abuse.
EMPATHIZE with the patient.
Integrate empathy into your interview by validating any frustrations and experience of pain. Identifying with loss of function and quality of life can help you connect with the patient and initiate a therapeutic relationship. Observe both verbal and nonverbal behaviors that reveal signs of emotional discomfort.6 Use open-ended questions to create space and trust for patients to share their feelings.
Pause to summarize the patient’s perspective while acknowledging and validating emotions that he or she may be experiencing such as anxiety, fear, frustration and anger.6 Statements such as “ I know it is frustrating to ... ” or “I can’t imagine what it must feel like to ... ” can help convey empathy. Multiple studies have suggested that enhanced provider empathy and positive messaging can also reduce patient pain and anxiety and increase quality of life.7,8 Empathic responses to negative emotional expressions from patients have also been associated with higher ratings of communication.9
WRAP UP.
Finally, wrap up by aligning expectations with the patient for pain control and summarize your management recommendations. Educate the patient and his/her family on the risks and benefits of recommended therapy as well as the expected course of recovery. Setting shared goals for functionality relevant to the patient’s personal values and quality of life can build connection between you and your patient.
While handing over the patient to the next provider, refrain from using stereotypical language such as “narcotic-seeking patient.” Clearly communicate the management plan and milestones to other team members, such as nurses, physical therapists, and oncoming hospitalists, to maintain consistency. This will help align patients and their care team and may stave off maladaptive patient behaviors such as splitting.
Applying the VIEW framework to the case
Visit
Upon visiting the medical chart, the physician realized that the patient’s opioid use began in his 20s when he injured his back in a traumatic motor vehicle accident. His successful athletic career came to a halt after this injury and opioid dependence ensued.
While reviewing past notes and prescription data via the PDMP, the physician noted that the patient had been visiting many different providers in order to get more pain medications. The most recent prescription was for oral hydromorphone 4 mg every 4 hours as needed, filled 1 week prior to this presentation.
She reviewed his vital signs and found that he had been persistently hypertensive and tachycardic. His nurse mentioned that he appeared to be in severe pain because of facial grimacing with standing and walking.
Prior to entering the patient’s room, the physician took a moment of mindfulness to become aware of her emotional state because she recognized that she was worried this could be a difficult encounter. She considered how hard his life has been and how much emotional and physical pain he might be experiencing. She took a deep breath, silenced her phone, and entered the room.
Interview
The physician sat at the bedside and interviewed the patient using a calm and nonjudgmental tone. It was quickly obvious to her that he was experiencing real pain. His cellulitis appeared severe and was tender to even minimal palpation. She learned that the pain in his leg had been worsening over the past week to the point that it was becoming difficult to ambulate, sleep and perform his daily hygiene routine. He was taking 4 mg tablets of hydromorphone every 2 hours, and he had run out a few days ago. He added that his mood was increasingly depressed, and he had even admitted to occasional suicidal thoughts because the pain was so unbearable.
When asked directly, he admitted that he was worried he was addicted to hydromorphone. He had first received it for low back pain after the motor vehicle accident, and it been refilled multiple times for ongoing pain over the course of a year. Importantly, she also learned that he felt he was often treated as an addict by medical professionals and felt that doctors no longer listened to him or believed him.
Empathize
As the conversation went on, the physician offered empathetic statements, recognizing the way it might feel to have your pain ignored or minimized by doctors. She expressed how frustrating it is to not be able to perform basic functions and how difficult it must be to constantly live in pain.
She said, “I don’t want you to suffer in pain. I care about you and my goal is to treat your pain so that you can return to doing the things in life that you find meaningful.” She also recognized the severity of his depression and discussed with him the role and importance of psychiatric consultation.
Wrap Up
The physician wrapped up the encounter by summarizing her plan to treat the infection and work together with him to treat his pain with the goal that he could ambulate and perform activities of daily living.
She reviewed the side effects of both acute and long-term use of opioids and discussed the risks and benefits. Given the fact that patient was on chronic baseline opioids and also had objective signs of acute pain, she started an initial regimen of hydromorphone 6 mg tablets every 4 hours as needed (a 50% increase over his home dose) and added acetaminophen 1000 mg every 6 hours and ibuprofen 600 mg every 8 hours.
She informed him that she would check on him in the afternoon and that the ultimate plan would be to taper down on his hydromorphone dose each day as his cellulitis improved. She also communicated that bidirectional respect between the patient and care team members was critical to a successful pain management.
Finally, she explained that there was going to be a different doctor covering at night and major changes to the prescription regimen would be deferred to daytime hours.
When she left the room, she summarized the plan with the patient’s nurse and shared a few details about the patient’s difficult past. At the end of the shift, the physician signed out to the overnight team that the patient had objective signs of pain and recommended a visit to the bedside if the patient’s symptoms were reported as worsening.
During his hospital stay, she monitored the patient’s nonverbal responses to movement, participation in physical therapy, and ability to sleep. She tapered the hydromorphone down each day as the patient’s cellulitis improved. At discharge, he was prescribed a 3-day supply of his home dose of hydromorphone and the same acetaminophen and ibuprofen regimen he had been on in the hospital with instructions for tapering. Finally, after coming to an agreement with the patient, she arranged for follow-up in the opioid taper clinic and communicated the plan with the patient’s primary care provider.
Dr. Horman is a hospitalist and assistant professor of medicine at UC San Diego Health. Dr. Richards is a hospitalist and assistant professor of medicine at the University of Nebraska Medical Center in Omaha. Dr. Horman and Dr. Richards note that they wrote this article in collaboration with the Society of Hospital Medicine Patient Experience Committee.
Key points
- Spend adequate time to fully visit patients’ history as it relates to their current pain complaints.
- Review notes and prescription data to better understand past and current pain regimen.
- Be vigilant about taking a mindful moment to visit your thoughts and potential biases.
- Interview patients using a calm tone and nonjudgmental, reassuring words.
- Empathize with patients and validate any frustrations and experience of pain.
- Wrap-up by summarizing your recommendations with patients, their families, the care team, and subsequent providers.
References
1. Herzig SJ et al. Safe opioid prescribing for acute noncancer pain in hospitalized adults: A Systematic Review of Existing Guidelines. J Hosp Med. 2018;13(4):256-62.
2. An PG et al. (MEM Investigators). Burden of difficult encounters in primary care: data from the minimizing error, maximizing outcomes study. Arch Intern Med. 2009;169(4):410-4.
3. Sanyer O, Fortenberry K. Using Mindfulness Techniques to improve difficult clinical encounters. Am Fam Physician. 2013;87(6):402.
4. Beckman HB et al. The impact of a program in mindful communication on primary care physicians. Acad Med. 2012;87(6):815-8.
5. Krasner MS et al. Association of an educational program in mindful communication with burnout, empathy, and attitudes among primary care physicians. JAMA. 2009;302(12):1284-93.
6. Dean M, Street R. A 3-Stage model of patient centered communication for addressing cancer patients’ emotional distress. Patient Educ Couns. 2014;94(2):143-8.
7. Howick J et al. Effects of empathic and positive communication in healthcare consultations: A systematic review and meta-analysis. J R Soc Med. 2018;111(7):240-52.
8. Mistiaen P et al. The effect of patient-practitioner communication on pain: A systematic review. Eur J Pain. 2016;20:675-88.
9. Weiss R et al. Associations of physician empathy with patient anxiety and ratings of communication in hospital admission encounters. J Hosp Med. 2017;12(10):805-10.
Introducing the VIEW Framework
Introducing the VIEW Framework
Case
A 55-year-old male with a history of diabetes mellitus, lumbar degenerative disc disease, and chronic low back pain was admitted overnight with right lower extremity cellulitis. He reported taking oral hydromorphone for chronic pain, but review of the Prescription Drug Monitoring Program (PDMP) revealed multiple short-term prescriptions from various ED providers, as well as monthly prescriptions from a variety of primary care providers.
Throughout the EHR, he is described as manipulative and narcotic-seeking with notation of multiple ED visits for pain. Multiple discharges against medical advice were noted. He was given two doses of IV hydromorphone in the ED and requested that this be continued. He was admitted for IV antibiotics for severe leg pain that he rated 15/10.
Background
The Society of Hospital Medicine published a consensus statement in the Journal of Hospital Medicine in 2018 that included 16 clinical recommendations on the safe use of opioids for the treatment of acute pain in hospitalized adults.1 In regard to communication about pain, clinicians are encouraged to set realistic goals and expectations of opioid therapy, closely monitor response to opioid therapy, and provide education about the side effects and potential risks of opioid therapy for patients and their families.
However, even when these strategies are employed, the social and behavioral complexities of individual patients can contribute to unsatisfactory interactions with health care staff. Because difficult encounters have been linked to provider burnout, enhanced communication strategies can benefit both the patient and physician.2
SHM’s Patient Experience Committee saw an opportunity to provide complementary evidence-based best-practice tips for communication about pain. Specifically, the committee worked collectively to develop a framework that can be applied to more challenging encounters.
The VIEW Framework
VISIT the patient’s chart and your own mental state.
First, visit the patient’s chart to review information relevant to the patient’s pain history. The EHR can be leveraged through filters and search functions to identify encounters, consultations, and notes relevant to pain management.
Look at the prior to admission medication list and active medication list and see if there are discrepancies. The medication administration record (MAR) can help identify adjunctive medications that the patient may be refusing. PDMP data should be screened for signs of aberrant use, including multiple pharmacies, multiple prescribers, short intervals between prescriptions, and serially prescribed, multiple, low-quantity prescriptions.
While documented pain scores can be a marker of patient distress, objective aspects of the patient’s functional status can shed light on how much his/her discomfort impairs day-to-day living. Examples of these measures include nutritional intake, sleep cycle, out of bed activity, and participation with therapy. Lastly, assess for opioid-related side-effects including constipation, decreased respiratory rate, and any notation of over sedation in narrative documentation from ancillary services.
Once this information has been accrued, it is important to take a moment of mindfulness before meeting with the patient. Take steps to minimize interruptions with electronic devices by silencing your pager/cell phone and disengaging from computers/tablets. Some examples of mindfulness-based practices include taking cycles of deep breathing, going for a short walk to appreciate hospital artwork or view points, or focusing on the sensory aspects of washing your hands prior to seeing the patient. Self-reflection on prior meaningful encounters can also help reset your state of mind. These activities can help clear prior subconscious thoughts and frustrations and prepare for the task ahead of you.3
Intense focus and awareness can enhance your recognition of patient distress, increase your ability to engage in active listening, and enable you to be more receptive to verbal and nonverbal cues.2 Additionally, mindful behaviors have been shown to contribute to decreased burnout and improved empathy.4,5
INTERVIEW the patient.
Once you enter the room, introduce yourself to the patient and others who are present. Interview the patient by eliciting subjective information. Use open-ended and nonjudgmental language, and take moments to summarize the patient’s perspective.
Inquire about the patient’s home baseline pain scores and past levels of acceptable function. Further explore the patient’s performance goals related to activities of daily living and quality of life. Ask about any prior history of addiction to any substance, and if needed, discuss your specific concerns related to substance misuse and abuse.
EMPATHIZE with the patient.
Integrate empathy into your interview by validating any frustrations and experience of pain. Identifying with loss of function and quality of life can help you connect with the patient and initiate a therapeutic relationship. Observe both verbal and nonverbal behaviors that reveal signs of emotional discomfort.6 Use open-ended questions to create space and trust for patients to share their feelings.
Pause to summarize the patient’s perspective while acknowledging and validating emotions that he or she may be experiencing such as anxiety, fear, frustration and anger.6 Statements such as “ I know it is frustrating to ... ” or “I can’t imagine what it must feel like to ... ” can help convey empathy. Multiple studies have suggested that enhanced provider empathy and positive messaging can also reduce patient pain and anxiety and increase quality of life.7,8 Empathic responses to negative emotional expressions from patients have also been associated with higher ratings of communication.9
WRAP UP.
Finally, wrap up by aligning expectations with the patient for pain control and summarize your management recommendations. Educate the patient and his/her family on the risks and benefits of recommended therapy as well as the expected course of recovery. Setting shared goals for functionality relevant to the patient’s personal values and quality of life can build connection between you and your patient.
While handing over the patient to the next provider, refrain from using stereotypical language such as “narcotic-seeking patient.” Clearly communicate the management plan and milestones to other team members, such as nurses, physical therapists, and oncoming hospitalists, to maintain consistency. This will help align patients and their care team and may stave off maladaptive patient behaviors such as splitting.
Applying the VIEW framework to the case
Visit
Upon visiting the medical chart, the physician realized that the patient’s opioid use began in his 20s when he injured his back in a traumatic motor vehicle accident. His successful athletic career came to a halt after this injury and opioid dependence ensued.
While reviewing past notes and prescription data via the PDMP, the physician noted that the patient had been visiting many different providers in order to get more pain medications. The most recent prescription was for oral hydromorphone 4 mg every 4 hours as needed, filled 1 week prior to this presentation.
She reviewed his vital signs and found that he had been persistently hypertensive and tachycardic. His nurse mentioned that he appeared to be in severe pain because of facial grimacing with standing and walking.
Prior to entering the patient’s room, the physician took a moment of mindfulness to become aware of her emotional state because she recognized that she was worried this could be a difficult encounter. She considered how hard his life has been and how much emotional and physical pain he might be experiencing. She took a deep breath, silenced her phone, and entered the room.
Interview
The physician sat at the bedside and interviewed the patient using a calm and nonjudgmental tone. It was quickly obvious to her that he was experiencing real pain. His cellulitis appeared severe and was tender to even minimal palpation. She learned that the pain in his leg had been worsening over the past week to the point that it was becoming difficult to ambulate, sleep and perform his daily hygiene routine. He was taking 4 mg tablets of hydromorphone every 2 hours, and he had run out a few days ago. He added that his mood was increasingly depressed, and he had even admitted to occasional suicidal thoughts because the pain was so unbearable.
When asked directly, he admitted that he was worried he was addicted to hydromorphone. He had first received it for low back pain after the motor vehicle accident, and it been refilled multiple times for ongoing pain over the course of a year. Importantly, she also learned that he felt he was often treated as an addict by medical professionals and felt that doctors no longer listened to him or believed him.
Empathize
As the conversation went on, the physician offered empathetic statements, recognizing the way it might feel to have your pain ignored or minimized by doctors. She expressed how frustrating it is to not be able to perform basic functions and how difficult it must be to constantly live in pain.
She said, “I don’t want you to suffer in pain. I care about you and my goal is to treat your pain so that you can return to doing the things in life that you find meaningful.” She also recognized the severity of his depression and discussed with him the role and importance of psychiatric consultation.
Wrap Up
The physician wrapped up the encounter by summarizing her plan to treat the infection and work together with him to treat his pain with the goal that he could ambulate and perform activities of daily living.
She reviewed the side effects of both acute and long-term use of opioids and discussed the risks and benefits. Given the fact that patient was on chronic baseline opioids and also had objective signs of acute pain, she started an initial regimen of hydromorphone 6 mg tablets every 4 hours as needed (a 50% increase over his home dose) and added acetaminophen 1000 mg every 6 hours and ibuprofen 600 mg every 8 hours.
She informed him that she would check on him in the afternoon and that the ultimate plan would be to taper down on his hydromorphone dose each day as his cellulitis improved. She also communicated that bidirectional respect between the patient and care team members was critical to a successful pain management.
Finally, she explained that there was going to be a different doctor covering at night and major changes to the prescription regimen would be deferred to daytime hours.
When she left the room, she summarized the plan with the patient’s nurse and shared a few details about the patient’s difficult past. At the end of the shift, the physician signed out to the overnight team that the patient had objective signs of pain and recommended a visit to the bedside if the patient’s symptoms were reported as worsening.
During his hospital stay, she monitored the patient’s nonverbal responses to movement, participation in physical therapy, and ability to sleep. She tapered the hydromorphone down each day as the patient’s cellulitis improved. At discharge, he was prescribed a 3-day supply of his home dose of hydromorphone and the same acetaminophen and ibuprofen regimen he had been on in the hospital with instructions for tapering. Finally, after coming to an agreement with the patient, she arranged for follow-up in the opioid taper clinic and communicated the plan with the patient’s primary care provider.
Dr. Horman is a hospitalist and assistant professor of medicine at UC San Diego Health. Dr. Richards is a hospitalist and assistant professor of medicine at the University of Nebraska Medical Center in Omaha. Dr. Horman and Dr. Richards note that they wrote this article in collaboration with the Society of Hospital Medicine Patient Experience Committee.
Key points
- Spend adequate time to fully visit patients’ history as it relates to their current pain complaints.
- Review notes and prescription data to better understand past and current pain regimen.
- Be vigilant about taking a mindful moment to visit your thoughts and potential biases.
- Interview patients using a calm tone and nonjudgmental, reassuring words.
- Empathize with patients and validate any frustrations and experience of pain.
- Wrap-up by summarizing your recommendations with patients, their families, the care team, and subsequent providers.
References
1. Herzig SJ et al. Safe opioid prescribing for acute noncancer pain in hospitalized adults: A Systematic Review of Existing Guidelines. J Hosp Med. 2018;13(4):256-62.
2. An PG et al. (MEM Investigators). Burden of difficult encounters in primary care: data from the minimizing error, maximizing outcomes study. Arch Intern Med. 2009;169(4):410-4.
3. Sanyer O, Fortenberry K. Using Mindfulness Techniques to improve difficult clinical encounters. Am Fam Physician. 2013;87(6):402.
4. Beckman HB et al. The impact of a program in mindful communication on primary care physicians. Acad Med. 2012;87(6):815-8.
5. Krasner MS et al. Association of an educational program in mindful communication with burnout, empathy, and attitudes among primary care physicians. JAMA. 2009;302(12):1284-93.
6. Dean M, Street R. A 3-Stage model of patient centered communication for addressing cancer patients’ emotional distress. Patient Educ Couns. 2014;94(2):143-8.
7. Howick J et al. Effects of empathic and positive communication in healthcare consultations: A systematic review and meta-analysis. J R Soc Med. 2018;111(7):240-52.
8. Mistiaen P et al. The effect of patient-practitioner communication on pain: A systematic review. Eur J Pain. 2016;20:675-88.
9. Weiss R et al. Associations of physician empathy with patient anxiety and ratings of communication in hospital admission encounters. J Hosp Med. 2017;12(10):805-10.
FDA warns gabapentin, pregabalin may cause serious breathing problems
Elderly patients who take these drugs also are at increased risk of breathing problems, the announcement said.
Gabapentin (marketed as Neurontin, Gralise, and Horizant) and pregabalin (Lyrica and Lyrica CR) are used to treat seizures, nerve pain, and restless legs syndrome. Physicians increasingly are prescribing these medications, and people are misusing and abusing these drugs more frequently, the agency said. Gabapentin and pregabalin often are combined with central nervous system depressants such as opioids, antianxiety medicines, antidepressants, and antihistamines, which increases the risk of respiratory depression.
Conditions that reduce lung function, including chronic obstructive pulmonary disease (COPD), also increase the likelihood of breathing problems when taking gabapentin and pregabalin.
“There is less evidence supporting the risk of serious breathing difficulties in healthy individuals taking gabapentinoids alone. We will continue to monitor these medicines as part of our routine monitoring of all FDA-approved drugs,” the announcement said.
The FDA is requiring new warnings about the risk of respiratory depression in the prescribing information of gabapentinoids. In addition, drug manufacturers must further assess the abuse potential of these drugs, particularly in combination with opioids.
Patients and caregivers should seek immediate medical attention for respiratory problems, which can be life threatening. Symptoms include confusion or disorientation; unusual dizziness or lightheadedness; extreme sleepiness or lethargy; slowed, shallow, or difficult breathing; unresponsiveness; and bluish-colored or tinted skin, especially on the lips, fingers, and toes.
Physicians should start gabapentinoids at the lowest dose and monitor patients for symptoms of respiratory depression and sedation when coprescribing these drugs with an opioid or other central nervous system depressant such as a benzodiazepine, according to the FDA.
The agency reviewed 49 case reports that were submitted between 2012 and 2017. Among these cases, 12 people died from respiratory depression with gabapentinoids. All of the patients who died had at least one risk factor.
Gabapentin first was approved in 1993, and pregabalin was approved in 2004. Drug adverse events and side effects can be reported online, the agency noted.