User login
Measles infection linked to impaired ‘immune memory’
Infection with the measles virus appears to reduce immunity to other pathogens, according to a paper published in Science.

The hypothesis that the measles virus could cause “immunological amnesia” by impairing immune memory is supported by early research showing children with measles had negative cutaneous tuberculin reactions after having previously tested positive.
“Subsequent studies have shown decreased interferon signaling, skewed cytokine responses, lymphopenia, and suppression of lymphocyte proliferation shortly after infection,” wrote Michael Mina, MD, from Brigham and Women’s Hospital in Boston, and coauthors.
“Given the variation in the degree of immune repertoire modulation we observed, we anticipate that future risk of morbidity and mortality after measles would not be homogeneous but would be skewed toward individuals with the most severe elimination of immunological memory,” they wrote. “These findings underscore the crucial need for continued widespread vaccination.”
In this study, researchers compared the levels of around 400 pathogen-specific antibodies in blood samples from 77 unvaccinated children, taken before and 2 months after natural measles infection, with 5 unvaccinated children who did not contract measles. A total of 34 the children experienced mild measles, and 43 had severe measles.
They found that the samples taken after measles infection showed “substantial” reductions in the number of pathogen epitopes, compared with the samples from children who did not get infected with measles.
This amounted to approximately a 20% mean reduction in overall diversity or size of the antibody repertoire. However, in children who experienced severe measles, there was a median loss of 40% (range, 11%-62%) of antibody repertoire, compared with a median of 33% (range, 12%-73%) range in children who experienced mild infection. Meanwhile, the control subjects retained approximately 90% of their antibody repertoire over a similar or longer time period. Some children lost up to 70% of antibodies for specific pathogens.
The study did find increases in measles virus–specific antigens in children both after measles infection and MMR vaccination. However the authors did not detect any changes in total IgG, IgA, or IgM levels.
Dr. Mina and associates wrote.
They also noted that controls who received the MMR vaccine showed a marked increase in overall antibody repertoire.
In a separate investigation reported in Science Immunology, Velislava N. Petrova, PhD, of the Wellcome Sanger Institute in Cambridge, England, and coauthors investigated genetic changes in 26 unvaccinated children from the Netherlands who previously had measles to determine if B-cell impairment can lead to measles-associated immunosuppression. Their antibody genes were sequenced before any symptoms of measles developed and roughly 40 days after rash. Two control groups also were sequenced accordingly: vaccinated adults and three unvaccinated children from the same community who were not infected with measles.
Naive B cells from individuals in the vaccinated and uninfected control groups showed high correlation of immunoglobulin heavy chain (IgVH-J) gene frequencies across time periods (R2 = 0.96 and 0.92, respectively) but no significant differences in gene expression (P greater than .05). At the same time, although B-cell frequencies in measles patients recovered to levels before infection, they had significant changes in IgVH-J gene frequencies (P = .01) and decreased correlation in gene expression (R2 = 0.78).
In addition, individuals in the control groups had “a stable genetic composition of B memory cells” but no significant changes in the third complementarity-determining region (CDR3) lengths or mutational frequency of IgVH-J genes (P greater than .05). B memory cells in measles patients, however, showed increases in mutational frequency (P = .0008) and a reduction in CDR3 length (P = .017) of IgVH genes, Dr. Petrova and associates reported.
The study by Mina et al. was supported by grants from various U.S., European, and Finnish foundations and national organizations. Some of the coauthors had relationships with biotechnology and pharmaceutical companies, and three reported a patent holding related to technology used in the study. The study by Petrova et al. was funded by grants to the investigators from various Indonesian and German organizations and the Wellcome Trust. The authors reported no conflicts of interest.
SOURCES: Mina M et al. Science. 2019 Nov 1;366:599-606; Petrova VN et al. Sci Immunol. 2019 Nov 1. doi: 10.1126/sciimmunol.aay6125.
As a result of reduced vaccination, after decades of decline, the number of worldwide cases of measles has increased by nearly 300% since 2018. Epidemiologic evidence has associated measles infections with increases in morbidity and mortality for as long as 5 years after the infection and suggests that, in the prevaccine era, measles virus may have been associated with up to 50% of all childhood deaths, mostly because of nonmeasles infections. Measles replication in immune cells has been hypothesized to impair immune memory, potentially causing what some scientists call “immunological amnesia.”A measles virus receptor, called CD150/ SLAMF1, is highly expressed on memory T, B, and plasma cells. Measles virus gains entry to these immune memory cells using that receptor and kills the cells.

The scientists stated that it could take months or years to return the immune repertoire back to baseline. During the rebuilding process, children would be at increased risk for infectious diseases they had previously experienced.
In a second outstanding paper, Petrova et al. in Science Immunology studied B cells before and after measles infection, and identified two immunologic consequences: The naive B-cell pool was depleted, leading to a return to immunologic immaturity, and the memory B-cell pool was depleted, resulting in compromised immune memory to previously encountered pathogens.
Thus, the link between measles infections and increased susceptibility to other infections and increased deaths from nonmeasles infectious diseases in the aftermath of measles has been revealed. This information adds new data to share with parents who consider refusing measles vaccination. The risks are far greater than getting measles.
Michael E. Pichichero, MD, is a specialist in pediatric infectious diseases and director of the Research Institute at Rochester (N.Y.) General Hospital. He was asked to comment on the articles. Dr. Pichichero has no conflicts to declare.
As a result of reduced vaccination, after decades of decline, the number of worldwide cases of measles has increased by nearly 300% since 2018. Epidemiologic evidence has associated measles infections with increases in morbidity and mortality for as long as 5 years after the infection and suggests that, in the prevaccine era, measles virus may have been associated with up to 50% of all childhood deaths, mostly because of nonmeasles infections. Measles replication in immune cells has been hypothesized to impair immune memory, potentially causing what some scientists call “immunological amnesia.”A measles virus receptor, called CD150/ SLAMF1, is highly expressed on memory T, B, and plasma cells. Measles virus gains entry to these immune memory cells using that receptor and kills the cells.
The scientists stated that it could take months or years to return the immune repertoire back to baseline. During the rebuilding process, children would be at increased risk for infectious diseases they had previously experienced.
In a second outstanding paper, Petrova et al. in Science Immunology studied B cells before and after measles infection, and identified two immunologic consequences: The naive B-cell pool was depleted, leading to a return to immunologic immaturity, and the memory B-cell pool was depleted, resulting in compromised immune memory to previously encountered pathogens.
Thus, the link between measles infections and increased susceptibility to other infections and increased deaths from nonmeasles infectious diseases in the aftermath of measles has been revealed. This information adds new data to share with parents who consider refusing measles vaccination. The risks are far greater than getting measles.
Michael E. Pichichero, MD, is a specialist in pediatric infectious diseases and director of the Research Institute at Rochester (N.Y.) General Hospital. He was asked to comment on the articles. Dr. Pichichero has no conflicts to declare.
Infection with the measles virus appears to reduce immunity to other pathogens, according to a paper published in Science.
The hypothesis that the measles virus could cause “immunological amnesia” by impairing immune memory is supported by early research showing children with measles had negative cutaneous tuberculin reactions after having previously tested positive.
“Subsequent studies have shown decreased interferon signaling, skewed cytokine responses, lymphopenia, and suppression of lymphocyte proliferation shortly after infection,” wrote Michael Mina, MD, from Brigham and Women’s Hospital in Boston, and coauthors.
“Given the variation in the degree of immune repertoire modulation we observed, we anticipate that future risk of morbidity and mortality after measles would not be homogeneous but would be skewed toward individuals with the most severe elimination of immunological memory,” they wrote. “These findings underscore the crucial need for continued widespread vaccination.”
In this study, researchers compared the levels of around 400 pathogen-specific antibodies in blood samples from 77 unvaccinated children, taken before and 2 months after natural measles infection, with 5 unvaccinated children who did not contract measles. A total of 34 the children experienced mild measles, and 43 had severe measles.
They found that the samples taken after measles infection showed “substantial” reductions in the number of pathogen epitopes, compared with the samples from children who did not get infected with measles.
This amounted to approximately a 20% mean reduction in overall diversity or size of the antibody repertoire. However, in children who experienced severe measles, there was a median loss of 40% (range, 11%-62%) of antibody repertoire, compared with a median of 33% (range, 12%-73%) range in children who experienced mild infection. Meanwhile, the control subjects retained approximately 90% of their antibody repertoire over a similar or longer time period. Some children lost up to 70% of antibodies for specific pathogens.
The study did find increases in measles virus–specific antigens in children both after measles infection and MMR vaccination. However the authors did not detect any changes in total IgG, IgA, or IgM levels.
Dr. Mina and associates wrote.
They also noted that controls who received the MMR vaccine showed a marked increase in overall antibody repertoire.
In a separate investigation reported in Science Immunology, Velislava N. Petrova, PhD, of the Wellcome Sanger Institute in Cambridge, England, and coauthors investigated genetic changes in 26 unvaccinated children from the Netherlands who previously had measles to determine if B-cell impairment can lead to measles-associated immunosuppression. Their antibody genes were sequenced before any symptoms of measles developed and roughly 40 days after rash. Two control groups also were sequenced accordingly: vaccinated adults and three unvaccinated children from the same community who were not infected with measles.
Naive B cells from individuals in the vaccinated and uninfected control groups showed high correlation of immunoglobulin heavy chain (IgVH-J) gene frequencies across time periods (R2 = 0.96 and 0.92, respectively) but no significant differences in gene expression (P greater than .05). At the same time, although B-cell frequencies in measles patients recovered to levels before infection, they had significant changes in IgVH-J gene frequencies (P = .01) and decreased correlation in gene expression (R2 = 0.78).
In addition, individuals in the control groups had “a stable genetic composition of B memory cells” but no significant changes in the third complementarity-determining region (CDR3) lengths or mutational frequency of IgVH-J genes (P greater than .05). B memory cells in measles patients, however, showed increases in mutational frequency (P = .0008) and a reduction in CDR3 length (P = .017) of IgVH genes, Dr. Petrova and associates reported.
The study by Mina et al. was supported by grants from various U.S., European, and Finnish foundations and national organizations. Some of the coauthors had relationships with biotechnology and pharmaceutical companies, and three reported a patent holding related to technology used in the study. The study by Petrova et al. was funded by grants to the investigators from various Indonesian and German organizations and the Wellcome Trust. The authors reported no conflicts of interest.
SOURCES: Mina M et al. Science. 2019 Nov 1;366:599-606; Petrova VN et al. Sci Immunol. 2019 Nov 1. doi: 10.1126/sciimmunol.aay6125.
FROM SCIENCE
Oral antibiotics as effective as IV for stable endocarditis patients
Background: Patients with left-sided infective endocarditis often are treated with prolonged courses of intravenous (IV) antibiotics. The safety of switching from IV to oral antibiotics is unknown.

Study design: Randomized, multicenter, noninferiority study.
Setting: Cardiac centers in Denmark during July 2011–August 2017.
Synopsis: The study enrolled 400 patients with left-sided infective endocarditis and positive blood cultures from Streptococcus, Enterococcus, Staphylococcus aureus, or coagulase-negative staph (non–methicillin-resistant Staphylococcus aureus), without evidence of valvular abscess. Following at least 7 days (for those who required surgical intervention) or 10 days (for those who did not require surgical intervention) of IV antibiotics, patients with ongoing fever, leukocytosis, elevated C-reactive protein, or concurrent infections were excluded from the study. Patients were randomized to receive continued IV antibiotic treatment or switch to oral antibiotic treatment. The IV treatment group received a median of 19 additional days of therapy, compared with 17 days in the oral group. The primary composite outcome of death, unplanned cardiac surgery, embolic event, and relapse of bacteremia occurred in 12.1% in the IV therapy group and 9% in the oral therapy group (difference of 3.1%; 95% confidence interval, –3.4 to 9.6; P = .40), meeting the studies prespecified noninferiority criteria. Poor representation of women, obese patients, and patients who use IV drugs may limit the study’s generalizability. An accompanying editorial advocated for additional research before widespread change to current treatment recommendations are made.
Bottom line: For patients with left-sided infective endocarditis who have been stabilized on IV antibiotic treatment, transitioning to an oral antibiotic regimen may be a noninferior approach.
Citation: Iverson K et al. Partial oral versus intravenous antibiotic treatment of endocarditis. N Eng J Med. 2019 Jan 31;380(5):415-24.
Dr. Phillips is a hospitalist at Beth Israel Deaconess Medical Center and instructor in medicine at Harvard Medical School.
Background: Patients with left-sided infective endocarditis often are treated with prolonged courses of intravenous (IV) antibiotics. The safety of switching from IV to oral antibiotics is unknown.
Study design: Randomized, multicenter, noninferiority study.
Setting: Cardiac centers in Denmark during July 2011–August 2017.
Synopsis: The study enrolled 400 patients with left-sided infective endocarditis and positive blood cultures from Streptococcus, Enterococcus, Staphylococcus aureus, or coagulase-negative staph (non–methicillin-resistant Staphylococcus aureus), without evidence of valvular abscess. Following at least 7 days (for those who required surgical intervention) or 10 days (for those who did not require surgical intervention) of IV antibiotics, patients with ongoing fever, leukocytosis, elevated C-reactive protein, or concurrent infections were excluded from the study. Patients were randomized to receive continued IV antibiotic treatment or switch to oral antibiotic treatment. The IV treatment group received a median of 19 additional days of therapy, compared with 17 days in the oral group. The primary composite outcome of death, unplanned cardiac surgery, embolic event, and relapse of bacteremia occurred in 12.1% in the IV therapy group and 9% in the oral therapy group (difference of 3.1%; 95% confidence interval, –3.4 to 9.6; P = .40), meeting the studies prespecified noninferiority criteria. Poor representation of women, obese patients, and patients who use IV drugs may limit the study’s generalizability. An accompanying editorial advocated for additional research before widespread change to current treatment recommendations are made.
Bottom line: For patients with left-sided infective endocarditis who have been stabilized on IV antibiotic treatment, transitioning to an oral antibiotic regimen may be a noninferior approach.
Citation: Iverson K et al. Partial oral versus intravenous antibiotic treatment of endocarditis. N Eng J Med. 2019 Jan 31;380(5):415-24.
Dr. Phillips is a hospitalist at Beth Israel Deaconess Medical Center and instructor in medicine at Harvard Medical School.
Previously healthy patients hospitalized for sepsis show increased mortality
WASHINGTON – Although severe, community-acquired sepsis in previously healthy U.S. adults is relatively uncommon, it occurs often enough to strike about 40,000 people annually, and when previously healthy people are hospitalized for severe sepsis, their rate of in-hospital mortality was double the rate in people with one or more comorbidities who have severe, community-acquired sepsis, based on a review of almost 7 million Americans hospitalized for sepsis.
The findings “underscore the importance of improving public awareness of sepsis and emphasizing early sepsis recognition and treatment in all patients,” including those without comorbidities, Chanu Rhee, MD, said at an annual scientific meeting on infectious diseases. He hypothesized that the increased sepsis mortality among previously healthy patients may have stemmed from factors such as delayed sepsis recognition resulting in hospitalization at a more advanced stage and less aggressive management.
In addition, “the findings provide context for high-profile reports about sepsis death in previously healthy people,” said Dr. Rhee, an infectious diseases and critical care physician at Brigham and Women’s Hospital in Boston. Dr. Rhee and associates found that, among patients hospitalized with what the researchers defined as “community-acquired” sepsis, 3% were judged previously healthy by having no identified major or minor comorbidity or pregnancy at the time of hospitalization, a percentage that – while small – still translates into roughly 40,000 such cases annually in the United States. That helps explain why every so often a headline appears about a famous person who died suddenly and unexpectedly from sepsis, he noted.
The study used data collected on hospitalized U.S. patients in the Cerner Health Facts, HCA Healthcare, and Institute for Health Metrics and Evaluation databases, which included about 6.7 million people total including 337,983 identified as having community-acquired sepsis, defined as patients who met the criteria for adult sepsis advanced by the Centers for Disease Control and Prevention within 2 days of their hospital admission. The researchers looked further into the hospital records of these patients and divided them into patients with one or more major comorbidities (96% of the cohort), patients who were pregnant or had a “minor” comorbidity such as a lipid disorder, benign neoplasm, or obesity (1% of the study group), or those with no chronic comorbidity (3%; the subgroup the researchers deemed previously healthy).
In a multivariate analysis that adjusted for patients’ age, sex, race, infection site, and illness severity at the time of hospital admission the researchers found that the rate of in-hospital death among the previously healthy patients was exactly twice the rate of those who had at least one major chronic comorbidity, Dr. Rhee reported. Differences in the treatment received by the previously-healthy patients or in their medical status compared with patients with a major comorbidity suggested that the previously health patients were sicker. They had a higher rate of mechanical ventilation, 30%, compared with about 18% for those with a comorbidity; a higher rate of acute kidney injury, about 43% in those previously healthy and 28% in those with a comorbidity; and a higher percentage had an elevated lactate level, about 41% among the previously healthy patients and about 22% among those with a comorbidity.
SOURCE: Alrawashdeh M et al. Open Forum Infect Dis. 2019 Oct 23;6. Abstract 891.
REPORTING FROM ID WEEK 2019

New score predicts benefits of prolonged cardiac monitoring for TIA, stroke patients
Background: Identifying paroxysmal atrial fibrillation (AFib) as the etiology of a transient ischemic attack (TIA) or stroke has implications for treatment as well as secondary prevention. Currently, there is not a universal, practical way to help determine which patients would benefit from prolonged cardiac monitoring to establish the diagnosis of AFib.

Study design: Logistic regression analysis of three prospective multicenter trials examining TIA and stroke patients who received Holter-ECG monitoring.
Setting: Patients who presented with TIA or stroke in Central Europe.
Synopsis: Using data from 1,556 patients, the authors identified age and NIH stroke scale score as being predictive of which patients were at highest risk for AFib detection within 72 hours of Holter-ECG monitor initiation. The authors developed a formula, titled AS5F; this formula scores each year of age as 0.76 points and then an NIH stroke scale score of 5 or less as 9 points or greater than 5 as 21 points. The authors found that the high-risk group (defined as those with AS5F scores of 67.5 or higher) had a predicted risk of 5.2%-40.8%, with a number needed to screen of 3. Given that a majority of the European patients included in the study were white, generalizability to other populations is unclear.
Bottom line: AS5F score may be able to predict those TIA and stroke patients who are most likely to be diagnosed with AFib with 72-hour cardiac monitoring.
Citation: Uphaus T et al. Development and validation of a score to detect paroxysmal atrial fibrillation after stroke. Neurology. 2019 Jan 8. doi. 10.1212/WNL.0000000000006727.
Dr. Phillips is a hospitalist at Beth Israel Deaconess Medical Center and instructor in medicine at Harvard Medical School.
Background: Identifying paroxysmal atrial fibrillation (AFib) as the etiology of a transient ischemic attack (TIA) or stroke has implications for treatment as well as secondary prevention. Currently, there is not a universal, practical way to help determine which patients would benefit from prolonged cardiac monitoring to establish the diagnosis of AFib.
Study design: Logistic regression analysis of three prospective multicenter trials examining TIA and stroke patients who received Holter-ECG monitoring.
Setting: Patients who presented with TIA or stroke in Central Europe.
Synopsis: Using data from 1,556 patients, the authors identified age and NIH stroke scale score as being predictive of which patients were at highest risk for AFib detection within 72 hours of Holter-ECG monitor initiation. The authors developed a formula, titled AS5F; this formula scores each year of age as 0.76 points and then an NIH stroke scale score of 5 or less as 9 points or greater than 5 as 21 points. The authors found that the high-risk group (defined as those with AS5F scores of 67.5 or higher) had a predicted risk of 5.2%-40.8%, with a number needed to screen of 3. Given that a majority of the European patients included in the study were white, generalizability to other populations is unclear.
Bottom line: AS5F score may be able to predict those TIA and stroke patients who are most likely to be diagnosed with AFib with 72-hour cardiac monitoring.
Citation: Uphaus T et al. Development and validation of a score to detect paroxysmal atrial fibrillation after stroke. Neurology. 2019 Jan 8. doi. 10.1212/WNL.0000000000006727.
Dr. Phillips is a hospitalist at Beth Israel Deaconess Medical Center and instructor in medicine at Harvard Medical School.
Fewer bloodstream infections with FMT for C. difficile
Treating Clostridioides difficile infection with fecal microbiota transplantation is associated with a lower risk of bloodstream infection and recurrence than treatment with antibiotics, new research has found.
A paper published in Annals of Internal Medicine presents outcomes of a prospective cohort study in 290 inpatients with recurrent C. difficile infection, 109 of whom were treated with fecal microbiota transplantation (FMT); the remainder were treated with antibiotics including metronidazole, vancomycin, and fidaxomicin.
While the FMT group had a higher mean number of previous C. difficile infections than the antibiotics group (2.82 vs. 1.23, respectively), a sustained cure was achieved in 97% of the FMT group, compared with 38% in the antibiotics group.
Blood cultures were done if patients developed a temperature above 30° C or showed symptoms that might be attributable to sepsis. Bloodstream infections were diagnosed in 5% (5 patients) of those treated with FMT, and 22% (40 patients) in the antibiotics group.
The patients in the FMT group with bloodstream infections all had bacterial infections – one of which was polymicrobial – and there were no cases of fungal bloodstream infections. In the antibiotics group, 28 patients (15%) had bacterial bloodstream infections – 11 of which were polymicrobial – and 12 (7%) had fungal bloodstream infections.
Bloodstream infections were particularly evident among the 11 patients whose C. difficile infection was treated with fidaxomicin, 4 of whom developed a bloodstream infection.
Overall, 27% of patients died during the 90-day follow-up, with 7% dying because of bloodstream infections, all of whom were in the antibiotic-treated cohort. Three patients in the FMT group died because of overwhelming C. difficile infection, compared with 12 in the antibiotic cohort.
Nearly three-quarters of deaths occurred within 30 days of the end of treatment; 5 of these deaths were in the FMT group, and 53 were in the antibiotics group.
“These findings suggest that the longer 90-day [overall survival] of patients in the FMT group is attributable to cure of [C. difficile infection] leading to an improvement in clinical condition,” wrote Gianluca Ianiro, MD, from the Catholic University of the Sacred Heart in Rome, and coauthors.
The 90-day overall survival rate was 92% in the FMT group and 61% in the antibiotic group. Patients treated with FMT also showed significantly shorter mean duration of hospital stay at 13.3 days, compared with 29.7 days in patients treated with antibiotics.
The authors noted the results should be interpreted with caution because of baseline differences between the two groups that were not entirely accounted for by using propensity matching. However, even in the propensity-matched cohort of 57 patients from each group, there was still a significantly higher overall survival at 90 days among patients treated with FMT.
One author declared grants from the pharmaceutical sector outside the submitted work. No funding or other conflicts of interest were reported.
SOURCE: Ianiro G et al. Ann Intern Med. 2019 Nov 4. doi: 10.7326/M18-3635.
FROM ANNALS OF INTERNAL MEDICINE
Patient-reported complications regarding PICC lines after inpatient discharge
Background: Despite the rise in utilization of PICC lines, few studies have addressed complications experienced by patients following PICC placement, especially subsequent to discharge from the inpatient setting.

Study design: Prospective longitudinal study.
Setting: Medical inpatient wards at four U.S. hospitals in Michigan and Texas.
Synopsis: Standardized questionnaires were completed by 438 patients who underwent PICC line placement during inpatient hospitalization within 3 days of placement and at 14, 30, and 70 days. The authors found that 61.4% of patients reported at least one possible PICC-related complication or complaint. A total of 17.6% reported signs and symptoms associated with a possible bloodstream infection; however, a central line–associated bloodstream infection was documented in only 1.6% of patients in the medical record. Furthermore, 30.6% of patients reported possible symptoms associated with deep venous thrombosis (DVT), which was documented in the medical record in 7.1% of patients. These data highlight that the frequency of PICC-related complications may be underestimated when relying solely on the medical record, especially when patients receive follow-up care at different facilities. Functionally, 26% of patients reported restrictions in activities of daily living and 19.2% reported difficulty with flushing and operating the PICC.
Bottom line: More than 60% of patients with PICC lines report signs or symptoms of a PICC-related complication or an adverse impact on physical or social function.
Citation: Krein SL et al. Patient-reported complications related to peripherally inserted central catheters: A multicenter prospective cohort study. BMJ Qual Saf. 2019 Jan 25. doi: 10.1136/bmjqs-2018-008726.
Dr. Cooke is a hospitalist at Beth Israel Deaconess Medical Center.
Background: Despite the rise in utilization of PICC lines, few studies have addressed complications experienced by patients following PICC placement, especially subsequent to discharge from the inpatient setting.
Study design: Prospective longitudinal study.
Setting: Medical inpatient wards at four U.S. hospitals in Michigan and Texas.
Synopsis: Standardized questionnaires were completed by 438 patients who underwent PICC line placement during inpatient hospitalization within 3 days of placement and at 14, 30, and 70 days. The authors found that 61.4% of patients reported at least one possible PICC-related complication or complaint. A total of 17.6% reported signs and symptoms associated with a possible bloodstream infection; however, a central line–associated bloodstream infection was documented in only 1.6% of patients in the medical record. Furthermore, 30.6% of patients reported possible symptoms associated with deep venous thrombosis (DVT), which was documented in the medical record in 7.1% of patients. These data highlight that the frequency of PICC-related complications may be underestimated when relying solely on the medical record, especially when patients receive follow-up care at different facilities. Functionally, 26% of patients reported restrictions in activities of daily living and 19.2% reported difficulty with flushing and operating the PICC.
Bottom line: More than 60% of patients with PICC lines report signs or symptoms of a PICC-related complication or an adverse impact on physical or social function.
Citation: Krein SL et al. Patient-reported complications related to peripherally inserted central catheters: A multicenter prospective cohort study. BMJ Qual Saf. 2019 Jan 25. doi: 10.1136/bmjqs-2018-008726.
Dr. Cooke is a hospitalist at Beth Israel Deaconess Medical Center.
Hospitalists finding their role in hospital quality ratings
CMS considers how to assess socioeconomic factors
Since 2005 the government website Hospital Compare has publicly reported quality data on hospitals, with periodic updates of their performance, including specific measures of quality. But how accurately do the ratings reflect a hospital’s actual quality of care, and what do the ratings mean for hospitalists?

Hospital Compare provides searchable, comparable information to consumers on reported quality of care data submitted by more than 4,000 Medicare-certified hospitals, along with Veterans Administration and military health system hospitals. It is designed to allow consumers to select hospitals and directly compare their mortality, complication, infection, and other performance measures on conditions such as heart attacks, heart failure, pneumonia, and surgical outcomes.
The Overall Hospital Quality Star Ratings, which began in 2016, combine data from more than 50 quality measures publicly reported on Hospital Compare into an overall rating of one to five stars for each hospital. These ratings are designed to enhance and supplement existing quality measures with a more “customer-centric” measure that makes it easier for consumers to act on the information. Obviously, this would be helpful to consumers who feel overwhelmed by the volume of data on the Hospital Compare website, and by the complexity of some of the measures.
A posted call in spring 2019 by CMS for public comment on possible methodological changes to the Overall Hospital Quality Star Ratings received more than 800 comments from 150 different organizations. And this past summer, the Centers for Medicare & Medicaid Services decided to delay posting the refreshed Star Ratings in its Hospital Compare data preview reports for July 2019. The agency says it intends to release the updated information in early 2020. Meanwhile, the reported data – particularly the overall star ratings – continue to generate controversy for the hospital field.
Hospitalists’ critical role
Hospitalists are not rated individually on Hospital Compare, but they play important roles in the quality of care their hospital provides – and thus ultimately the hospital’s publicly reported rankings. Hospitalists typically are not specifically incentivized or penalized for their hospital’s performance, but this does happen in some cases.
“Hospital administrators absolutely take note of their hospital’s star ratings. These are the people hospitalists work for, and this is definitely top of their minds,” said Kate Goodrich, MD, MHS, director of the Center for Clinical Standards and Quality at CMS. “I recently spoke at an SHM annual conference and every question I was asked was about hospital ratings and the star system,” noted Dr. Goodrich, herself a practicing hospitalist at George Washington University Medical Center in Washington.
The government’s aim for Hospital Compare is to give consumers easy-to-understand indicators of the quality of care provided by hospitals, especially where they might have a choice of hospitals, such as for an elective surgery. Making that information public is also viewed as a motivator to help drive improvements in hospital performance, Dr. Goodrich said.
“In terms of what we measure, we try to make sure it’s important to patients and to clinicians. We have frontline practicing physicians, patients, and families advising us, along with methodologists and PhD researchers. These stakeholders tell us what is important to measure and why,” she said. “Hospitals and all health providers need more actionable and timely data to improve their quality of care, especially if they want to participate in accountable care organizations. And we need to make the information easy to understand.”
Dr. Goodrich sees two main themes in the public response to its request for comment. “People say the methodology we use to calculate star ratings is frustrating for hospitals, which have found it difficult to model their performance, predict their star ratings, or explain the discrepancies.” Hospitals taking care of sicker patients with lower socioeconomic status also say the ratings unfairly penalize them. “I work in a large urban hospital, and I understand this. They say we don’t take that sufficiently into account in the ratings,” she said.
“While our modeling shows that current ratings highly correlate with performance on individual measures, we have asked for comment on if and how we could adjust for socioeconomic factors. We are actively considering how to make changes to address these concerns,” Dr. Goodrich said.
In August 2019, CMS acknowledged that it plans to change the methodology used to calculate hospital star ratings in early 2021, but has not yet revealed specific details about the nature of the changes. The agency intends to propose the changes through the public rule-making process sometime in 2020.
Continuing controversy
The American Hospital Association – which has had strong concerns about the methodology and the usefulness of hospital star ratings – is pushing back on some of the changes to the system being considered by CMS. In its submitted comments, AHA supported only three of the 14 potential star ratings methodology changes being considered. AHA and the American Association of Medical Colleges, among others, have urged taking down the star ratings until major changes can be made.
“When the star ratings were first implemented, a lot of challenges became apparent right away,” said Akin Demehin, MPH, AHA’s director of quality policy. “We began to see that those hospitals that treat more complicated patients and poorer patients tended to perform more poorly on the ratings. So there was something wrong with the methodology. Then, starting in 2018, hospitals began seeing real shifts in their performance ratings when the underlying data hadn’t really changed.”
CMS uses a statistical approach called latent variable modeling. Its underlying assumption is that you can say something about a hospital’s underlying quality based on the data you already have, Mr. Demehin said, but noted “that can be a questionable assumption.” He also emphasized the need for ratings that compare hospitals that are similar in size and model to each other.

Suparna Dutta, MD, division chief, hospital medicine, Rush University, Chicago, said analyses done at Rush showed that the statistical model CMS used in calculating the star ratings was dynamically changing the weighting of certain measures in every release. “That meant one specific performance measure could play an outsized role in determining a final rating,” she said. In particular the methodology inadvertently penalized large hospitals, academic medical centers, and institutions that provide heroic care.
“We fundamentally believe that consumers should have meaningful information about hospital quality,” said Nancy Foster, AHA’s vice president for quality and patient safety policy at AHA. “We understand the complexities of Hospital Compare and the challenges of getting simple information for consumers. To its credit, CMS is thinking about how to do that, and we support them in that effort.”
Getting a handle on quality
Hospitalists are responsible for ensuring that their hospitals excel in the care of patients, said Julius Yang, MD, hospitalist and director of quality at Beth Israel Deaconess Medical Center in Boston. That also requires keeping up on the primary public ways these issues are addressed through reporting of quality data and through reimbursement policy. “That should be part of our core competencies as hospitalists.”
Some of the measures on Hospital Compare don’t overlap much with the work of hospitalists, he noted. But for others, such as for pneumonia, COPD, and care of patients with stroke, or for mortality and 30-day readmissions rates, “we are involved, even if not directly, and certainly responsible for contributing to the outcomes and the opportunity to add value,” he said.
“When it comes to 30-day readmission rates, do we really understand the risk factors for readmissions and the barriers to patients remaining in the community after their hospital stay? Are our patients stable enough to be discharged, and have we worked with the care coordination team to make sure they have the resources they need? And have we communicated adequately with the outpatient doctor? All of these things are within the wheelhouse of the hospitalist,” Dr. Yang said. “Let’s accept that the readmissions rate, for example, is not a perfect measure of quality. But as an imperfect measure, it can point us in the right direction.”

Jose Figueroa, MD, MPH, hospitalist and assistant professor at Harvard Medical School, has been studying for his health system the impact of hospital penalties such as the Hospital Readmissions Reduction Program on health equity. In general, hospitalists play an important role in dictating processes of care and serving on quality-oriented committees across multiple realms of the hospital, he said.
“What’s hard from the hospitalist’s perspective is that there don’t seem to be simple solutions to move the dial on many of these measures,” Dr. Figueroa said. “If the hospital is at three stars, can we say, okay, if we do X, Y, and Z, then our hospital will move from three to five stars? Some of these measures are so broad and not in our purview. Which ones apply to me as a hospitalist and my care processes?”
Dr. Dutta sits on the SHM Policy Committee, which has been working to bring these issues to the attention of frontline hospitalists. “Hospitalists are always going to be aligned with their hospital’s priorities. We’re in it to provide high-quality care, but there’s no magic way to do that,” she said.
Hospital Compare measures sometimes end up in hospitalist incentives plans – for example, the readmission penalty rates – even though that is a fairly arbitrary measure and hard to pin to one doctor, Dr. Dutta explained. “If you look at the evidence regarding these metrics, there are not a lot of data to show that the metrics lead to what we really want, which is better care for patients.”
A recent study in the British Medical Journal, for example, examined the association between the penalties on hospitals in the Hospital Acquired Condition Reduction Program and clinical outcome.1 The researchers concluded that the penalties were not associated with significant change or found to drive meaningful clinical improvement.
How can hospitalists engage with Compare?
Dr. Goodrich refers hospitalists seeking quality resources to their local quality improvement organizations (QIO) and to Hospital Improvement Innovation Networks at the regional, state, national, or hospital system level.
One helpful thing that any group of hospitalists could do, added Dr. Figueroa, is to examine the measures closely and determine which ones they think they can influence. “Then look for the hospitals that resemble ours and care for similar patients, based on the demographics. We can then say: ‘Okay, that’s a fair comparison. This can be a benchmark with our peers,’” he said. Then it’s important to ask how your hospital is doing over time on these measures, and use that to prioritize.
“You also have to appreciate that these are broad quality measures, and to impact them you have to do broad quality improvement efforts. Another piece of this is getting good at collecting and analyzing data internally in a timely fashion. You don’t want to wait 2-3 years to find out in Hospital Compare that you’re not performing well. You care about the care you provided today, not 2 or 3 years ago. Without this internal check, it’s impossible to know what to invest in – and to see if things you do are having an impact,” Dr. Figueroa said.
“As physician leaders, this is a real opportunity for us to trigger a conversation with our hospital’s administration around what we went into medicine for in the first place – to improve our patients’ care,” said Dr. Goodrich. She said Hospital Compare is one tool for sparking systemic quality improvement across the hospital – which is an important part of the hospitalist’s job. “If you want to be a bigger star within your hospital, show that level of commitment. It likely would be welcomed by your hospital.”
Reference
1. Sankaran R et al. Changes in hospital safety following penalties in the US Hospital Acquired Condition Reduction Program: retrospective cohort study. BMJ. 2019 Jul 3 doi: 10.1136/bmj.l4109.
CMS considers how to assess socioeconomic factors
CMS considers how to assess socioeconomic factors
Since 2005 the government website Hospital Compare has publicly reported quality data on hospitals, with periodic updates of their performance, including specific measures of quality. But how accurately do the ratings reflect a hospital’s actual quality of care, and what do the ratings mean for hospitalists?
Hospital Compare provides searchable, comparable information to consumers on reported quality of care data submitted by more than 4,000 Medicare-certified hospitals, along with Veterans Administration and military health system hospitals. It is designed to allow consumers to select hospitals and directly compare their mortality, complication, infection, and other performance measures on conditions such as heart attacks, heart failure, pneumonia, and surgical outcomes.
The Overall Hospital Quality Star Ratings, which began in 2016, combine data from more than 50 quality measures publicly reported on Hospital Compare into an overall rating of one to five stars for each hospital. These ratings are designed to enhance and supplement existing quality measures with a more “customer-centric” measure that makes it easier for consumers to act on the information. Obviously, this would be helpful to consumers who feel overwhelmed by the volume of data on the Hospital Compare website, and by the complexity of some of the measures.
A posted call in spring 2019 by CMS for public comment on possible methodological changes to the Overall Hospital Quality Star Ratings received more than 800 comments from 150 different organizations. And this past summer, the Centers for Medicare & Medicaid Services decided to delay posting the refreshed Star Ratings in its Hospital Compare data preview reports for July 2019. The agency says it intends to release the updated information in early 2020. Meanwhile, the reported data – particularly the overall star ratings – continue to generate controversy for the hospital field.
Hospitalists’ critical role
Hospitalists are not rated individually on Hospital Compare, but they play important roles in the quality of care their hospital provides – and thus ultimately the hospital’s publicly reported rankings. Hospitalists typically are not specifically incentivized or penalized for their hospital’s performance, but this does happen in some cases.
“Hospital administrators absolutely take note of their hospital’s star ratings. These are the people hospitalists work for, and this is definitely top of their minds,” said Kate Goodrich, MD, MHS, director of the Center for Clinical Standards and Quality at CMS. “I recently spoke at an SHM annual conference and every question I was asked was about hospital ratings and the star system,” noted Dr. Goodrich, herself a practicing hospitalist at George Washington University Medical Center in Washington.
The government’s aim for Hospital Compare is to give consumers easy-to-understand indicators of the quality of care provided by hospitals, especially where they might have a choice of hospitals, such as for an elective surgery. Making that information public is also viewed as a motivator to help drive improvements in hospital performance, Dr. Goodrich said.
“In terms of what we measure, we try to make sure it’s important to patients and to clinicians. We have frontline practicing physicians, patients, and families advising us, along with methodologists and PhD researchers. These stakeholders tell us what is important to measure and why,” she said. “Hospitals and all health providers need more actionable and timely data to improve their quality of care, especially if they want to participate in accountable care organizations. And we need to make the information easy to understand.”
Dr. Goodrich sees two main themes in the public response to its request for comment. “People say the methodology we use to calculate star ratings is frustrating for hospitals, which have found it difficult to model their performance, predict their star ratings, or explain the discrepancies.” Hospitals taking care of sicker patients with lower socioeconomic status also say the ratings unfairly penalize them. “I work in a large urban hospital, and I understand this. They say we don’t take that sufficiently into account in the ratings,” she said.
“While our modeling shows that current ratings highly correlate with performance on individual measures, we have asked for comment on if and how we could adjust for socioeconomic factors. We are actively considering how to make changes to address these concerns,” Dr. Goodrich said.
In August 2019, CMS acknowledged that it plans to change the methodology used to calculate hospital star ratings in early 2021, but has not yet revealed specific details about the nature of the changes. The agency intends to propose the changes through the public rule-making process sometime in 2020.
Continuing controversy
The American Hospital Association – which has had strong concerns about the methodology and the usefulness of hospital star ratings – is pushing back on some of the changes to the system being considered by CMS. In its submitted comments, AHA supported only three of the 14 potential star ratings methodology changes being considered. AHA and the American Association of Medical Colleges, among others, have urged taking down the star ratings until major changes can be made.
“When the star ratings were first implemented, a lot of challenges became apparent right away,” said Akin Demehin, MPH, AHA’s director of quality policy. “We began to see that those hospitals that treat more complicated patients and poorer patients tended to perform more poorly on the ratings. So there was something wrong with the methodology. Then, starting in 2018, hospitals began seeing real shifts in their performance ratings when the underlying data hadn’t really changed.”
CMS uses a statistical approach called latent variable modeling. Its underlying assumption is that you can say something about a hospital’s underlying quality based on the data you already have, Mr. Demehin said, but noted “that can be a questionable assumption.” He also emphasized the need for ratings that compare hospitals that are similar in size and model to each other.
Suparna Dutta, MD, division chief, hospital medicine, Rush University, Chicago, said analyses done at Rush showed that the statistical model CMS used in calculating the star ratings was dynamically changing the weighting of certain measures in every release. “That meant one specific performance measure could play an outsized role in determining a final rating,” she said. In particular the methodology inadvertently penalized large hospitals, academic medical centers, and institutions that provide heroic care.
“We fundamentally believe that consumers should have meaningful information about hospital quality,” said Nancy Foster, AHA’s vice president for quality and patient safety policy at AHA. “We understand the complexities of Hospital Compare and the challenges of getting simple information for consumers. To its credit, CMS is thinking about how to do that, and we support them in that effort.”
Getting a handle on quality
Hospitalists are responsible for ensuring that their hospitals excel in the care of patients, said Julius Yang, MD, hospitalist and director of quality at Beth Israel Deaconess Medical Center in Boston. That also requires keeping up on the primary public ways these issues are addressed through reporting of quality data and through reimbursement policy. “That should be part of our core competencies as hospitalists.”
Some of the measures on Hospital Compare don’t overlap much with the work of hospitalists, he noted. But for others, such as for pneumonia, COPD, and care of patients with stroke, or for mortality and 30-day readmissions rates, “we are involved, even if not directly, and certainly responsible for contributing to the outcomes and the opportunity to add value,” he said.
“When it comes to 30-day readmission rates, do we really understand the risk factors for readmissions and the barriers to patients remaining in the community after their hospital stay? Are our patients stable enough to be discharged, and have we worked with the care coordination team to make sure they have the resources they need? And have we communicated adequately with the outpatient doctor? All of these things are within the wheelhouse of the hospitalist,” Dr. Yang said. “Let’s accept that the readmissions rate, for example, is not a perfect measure of quality. But as an imperfect measure, it can point us in the right direction.”
Jose Figueroa, MD, MPH, hospitalist and assistant professor at Harvard Medical School, has been studying for his health system the impact of hospital penalties such as the Hospital Readmissions Reduction Program on health equity. In general, hospitalists play an important role in dictating processes of care and serving on quality-oriented committees across multiple realms of the hospital, he said.
“What’s hard from the hospitalist’s perspective is that there don’t seem to be simple solutions to move the dial on many of these measures,” Dr. Figueroa said. “If the hospital is at three stars, can we say, okay, if we do X, Y, and Z, then our hospital will move from three to five stars? Some of these measures are so broad and not in our purview. Which ones apply to me as a hospitalist and my care processes?”
Dr. Dutta sits on the SHM Policy Committee, which has been working to bring these issues to the attention of frontline hospitalists. “Hospitalists are always going to be aligned with their hospital’s priorities. We’re in it to provide high-quality care, but there’s no magic way to do that,” she said.
Hospital Compare measures sometimes end up in hospitalist incentives plans – for example, the readmission penalty rates – even though that is a fairly arbitrary measure and hard to pin to one doctor, Dr. Dutta explained. “If you look at the evidence regarding these metrics, there are not a lot of data to show that the metrics lead to what we really want, which is better care for patients.”
A recent study in the British Medical Journal, for example, examined the association between the penalties on hospitals in the Hospital Acquired Condition Reduction Program and clinical outcome.1 The researchers concluded that the penalties were not associated with significant change or found to drive meaningful clinical improvement.
How can hospitalists engage with Compare?
Dr. Goodrich refers hospitalists seeking quality resources to their local quality improvement organizations (QIO) and to Hospital Improvement Innovation Networks at the regional, state, national, or hospital system level.
One helpful thing that any group of hospitalists could do, added Dr. Figueroa, is to examine the measures closely and determine which ones they think they can influence. “Then look for the hospitals that resemble ours and care for similar patients, based on the demographics. We can then say: ‘Okay, that’s a fair comparison. This can be a benchmark with our peers,’” he said. Then it’s important to ask how your hospital is doing over time on these measures, and use that to prioritize.
“You also have to appreciate that these are broad quality measures, and to impact them you have to do broad quality improvement efforts. Another piece of this is getting good at collecting and analyzing data internally in a timely fashion. You don’t want to wait 2-3 years to find out in Hospital Compare that you’re not performing well. You care about the care you provided today, not 2 or 3 years ago. Without this internal check, it’s impossible to know what to invest in – and to see if things you do are having an impact,” Dr. Figueroa said.
“As physician leaders, this is a real opportunity for us to trigger a conversation with our hospital’s administration around what we went into medicine for in the first place – to improve our patients’ care,” said Dr. Goodrich. She said Hospital Compare is one tool for sparking systemic quality improvement across the hospital – which is an important part of the hospitalist’s job. “If you want to be a bigger star within your hospital, show that level of commitment. It likely would be welcomed by your hospital.”
Reference
1. Sankaran R et al. Changes in hospital safety following penalties in the US Hospital Acquired Condition Reduction Program: retrospective cohort study. BMJ. 2019 Jul 3 doi: 10.1136/bmj.l4109.
How P-wave indices can improve AFib-related ischemic stroke prediction
Background: Current AFib management guidelines recommend ischemic stroke risk stratification with CHA2DS2-VASc score; however, emerging studies have highlighted limitations of this score.
Study design: Retrospective review of previously obtained prospective cohort study data.
Setting: Fourteen U.S. communities.
Synopsis: For the 2,929 individuals with new incident AFib without anticoagulant use in the prior year, study authors computed P-wave indices (including P-wave axis, P-wave duration, advanced interatrial block, and P-wave terminal force in lead V1) from the most recent sinus rhythm EKG prior to the diagnosis of AFib. Cox proportional hazard models estimated the hazard ratio between PWIs and ischemic stroke. Of the PWIs tested above, abnormal P-wave axis (hazard ratio, 1.88; 95% confidence interval, 1.36-2.61) and advanced interatrial block (HR, 2.93; 95% CI 1.78-4.81) were associated with increased risk of stroke after adjustment for individual CHA2DS2-VASc variables. A P2-CHA2DS2-VASc score that incorporated abnormal P-wave axis measurements demonstrated superior discrimination, compared with the CHA2DS2-VASc score alone, and resulted in improvement in ischemic stroke risk classification.
Bottom line: Abnormal P-wave axis and advanced interatrial block measured during periods of sinus rhythm may be associated with increased risk of ischemic stroke in patients with atrial fibrillation; the P2-CHA2DS2-VASc score incorporating abnormal P-wave axis may be superior to CHA2DS2-VASc in ischemic stroke risk classification.
Citation: Maheshwari A et al. Refining prediction of atrial fibrillation–related stroke using the P2-CHA2DS2-VASc score. Circulation. 2019 Jan 8;139:180-91.
Dr. Cooke is a hospitalist at Beth Israel Deaconess Medical Center.
Vaping-linked lung injury cases near 1,900
according to the latest update provided by the Centers for Disease Control and Prevention. Thirty-seven deaths have been confirmed.
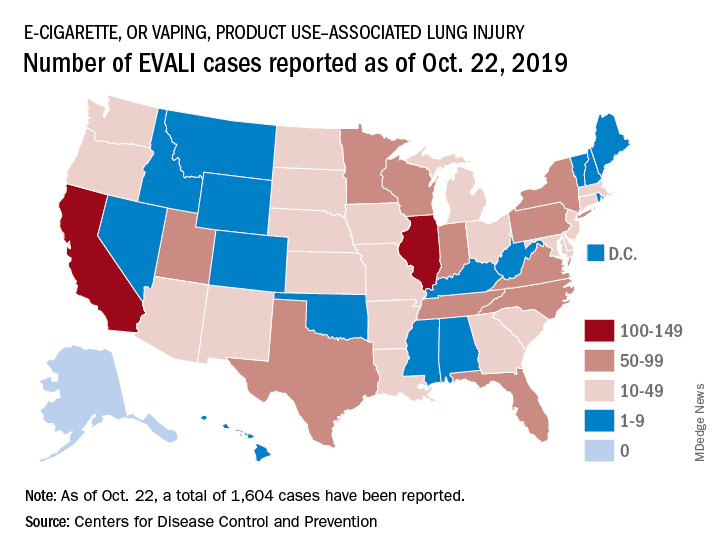
Deaths have occurred in 24 states and the District of Columbia: Alabama, California (3), Connecticut, Delaware, Florida, Georgia (3), Illinois (2), Indiana (3), Kansas (2), Massachusetts, Michigan, Minnesota (3), Mississippi, Missouri, Montana, Nebraska, New Jersey, New York, Oregon (2), Pennsylvania, Tennessee (2), Texas, Utah, and Virginia. As on Oct. 28, the median age of deceased patients was 49 years and ranged from 17 to 75 years.
The CDC is now doing additional testing on available samples for chemical in the bronchoalveolar lavage fluid, blood, or urine, as well as lung biopsy or autopsy specimens. It also is validating methods for aerosol emission testing of case-associated product samples from vaping products and e-liquids.
For more information and resources visit For the Public, For Healthcare Providers, and For State and Local Health Departments pages, as well as the CDC’s Publications and Resources page.
according to the latest update provided by the Centers for Disease Control and Prevention. Thirty-seven deaths have been confirmed.
Deaths have occurred in 24 states and the District of Columbia: Alabama, California (3), Connecticut, Delaware, Florida, Georgia (3), Illinois (2), Indiana (3), Kansas (2), Massachusetts, Michigan, Minnesota (3), Mississippi, Missouri, Montana, Nebraska, New Jersey, New York, Oregon (2), Pennsylvania, Tennessee (2), Texas, Utah, and Virginia. As on Oct. 28, the median age of deceased patients was 49 years and ranged from 17 to 75 years.
The CDC is now doing additional testing on available samples for chemical in the bronchoalveolar lavage fluid, blood, or urine, as well as lung biopsy or autopsy specimens. It also is validating methods for aerosol emission testing of case-associated product samples from vaping products and e-liquids.
For more information and resources visit For the Public, For Healthcare Providers, and For State and Local Health Departments pages, as well as the CDC’s Publications and Resources page.
Dose-reduced NOACs may be safer than warfarin in some AFib patients
Background: Prior studies have suggested that NOACs have a favorable risk-benefit profile when compared with warfarin, but it is unclear if this advantage also is present for those high-risk patients for whom NOAC dose reduction is recommended.
Study design: A meta-analysis.
Setting: Three phase 3 randomized, control trials.
Synopsis: From the three randomized, control trials, the authors identified 7,351 of the 46,426 patients as being eligible for dose-reduced NOACs. Of these patients, 3,702 were randomized to take a NOAC and 3,649 were randomized to take warfarin. For the primary outcomes of stroke or systemic embolism, there was no significant difference between patients randomized to receive dose-reduced NOAC versus warfarin. For outcomes of major bleeding, hemorrhagic stroke, intracranial hemorrhage, and fatal bleeding, dose-reduced NOACs had a significantly lower risk, compared with warfarin.
Bottom line: In patients eligible for dose-reduced NOACs, the use of dose-reduced NOACs may have a better safety profile without significant difference in the rate of ischemic stroke or systemic embolism.
Citation: Wang KL et al. Efficacy and safety of reduced-dose non–vitamin K antagonist oral anticoagulants in patients with atrial fibrillation: A meta-analysis of randomized controlled trials. Eur Heart J. 2018 Dec 22. doi: 10.1093/eurheartj/ehy802.
Dr. Biddick is a hospitalist at Beth Israel Deaconess Medical Center and instructor in medicine Harvard Medical School.