User login
Do probiotics reduce adult lactose intolerance? A systematic review
Methods: We searched randomized controlled trials published between 1966 and December 2002. Databases in the search strategy included Medline and AMED. We reviewed references of clinical trials and contacted authors of major articles and manufacturers of probiotic commercial products. Quality assessment was based on the McMaster guides and was performed by 5 independent reviewers. Data extraction was performed by 2 reviewers.
Results: A master list of 90 articles was compiled. Ten articles met inclusion and exclusion criteria and were consistent with our clinical question. Of the 9 studies that measured breath hydrogen, 3 were positive, 3 were negative, and 3 had both positive and negative results. Of the 7 studies that measured symptoms, 1 yielded positive results, 5 were negative, and 1 had both positive and negative outcomes.
Conclusions: Probiotic supplementation in general did not alleviate the symptoms and signs of lactose intolerance in adults in this review. Some evidence suggests that specific strains, concentrations, and preparations are effective. Further clinical trials of specific strains and concentrations are necessary to delineate this potential therapeutic relationship.
- Become familiar with the strains, concentrations, and preparations of probiotics most likely to be effective.
- Because a given individual may respond well to probiotics, suggest a trial of a probiotic supplement—perhaps conducting an n-of-1 trial for an objective assessment.
- If a trial of probiotic does not achieve desired results, advise the patient of the many other options to treat lactose intolerance.
Judging from our systematic review of the literature, probiotic supplementation is not effective universally for lactose intolerance in adults. However, some evidence suggests that specific strains, concentrations, and preparations of probiotics can be effective.
Discuss probiotic supplementation with lactose-intolerant patients. “Try it” is a reasonable suggestion, given additional evidence that there are individuals whose symptoms of lactose intolerance will, for unknown reasons, respond to probiotics.
For those who find no benefit in probiotics, several other therapeutic options can be recommended.
Prevailing wisdom about lactose intolerance
Lactose intolerant persons suffer such symptoms as abdominal cramping, bloating, and diarrhea after ingesting lactose-containing foods, including nonfermented dairy products.1 This intolerance to dairy products may result in a person receiving less than the recommended intake of calcium and protein, especially in developing countries.
Primary lactase deficiency is the most common form of lactose intolerance.1 In the US, 15% of Caucasians, over 50% of Mexican Americans, and over 80% of African Americans have lactose intolerance.2
Treatment options for lactase deficiency
Lactose-intolerant persons digest yogurt, which is fermented, more easily than milk.2 Nonfermented lactose-containing foods can be consumed in small quantities or with proteins and fats to delay gastric emptying. Nonfermented dairy products are generally tolerated if they are prehydrolyzed to reduce levels of lactose (such as reduced-lactose or lactose-free milk). Finally, synthetic enzyme (lactase) tablets can be taken with lactose-containing dairy foods in an attempt to alleviate symptoms.2
What are probiotics?
Probiotics are live microorganisms that, when ingested, have beneficial effects on the prevention or treatment of disease.3 Some probiotics, such as Lactobacillus, contain β-galactosidase or lactase intracellularly so that ingestion of lactase-containing probiotics might be beneficial for lactose-intolerant individuals, either consumed with food or taken separately as a supplement.
Theoretically, probiotics ingested as supplements would adhere to the intestinal lining and digest dietary lactose, thereby alleviating malabsorptive symptoms from excessive lactose. Probiotics have other positive effects: treating and preventing diarrhea (infectious and antibiotic induced), relieving symptoms of irritable bowel syndrome, alleviating inflammatory bowel disease, and decreasing atopic disease.4,5 The Food and Agriculture Organization of the United Nations and the World Health Organization have reported that there is adequate scientific evidence of the potential for probiotic foods to provide health benefits, and that specific strains are safe for human use.6
Purported advantages of probiotics. Probiotic supplementation may be preferred over lactose-free products due to the inability to monitor and control all dairy products consumed. The varied efficacy of lactase enzymes in different individuals may render probiotics the favored supplement. Also, the option of a natural treatment may appeal to many people.
Testing for lactose intolerance
The hydrogen breath test is the gold standard for diagnosing lactose intolerance. Intestinal bacteria metabolize carbohydrate to generate hydrogen that is rapidly absorbed into the blood perfusing the gut and cleared during a single passage through the lungs.
A lactose dose of 25 to 50 g is given after an overnight fast. A rise in the hydrogen level of more than 20 parts per million (ppm) over baseline suggests hypolactasia.7 At a cutoff of 20 ppm, the test has a specificity of 90%. False positives may occur secondary to severe bacterial overgrowth of the small bowel, smoking, and aspirin use. False negative results are seen in persons receiving oral antibiotics or high colonic enemas, suffering severe diarrhea, or lacking bacterial flora.8
Another use of the breath hydrogen test is to measure the quantity of lactose malabsorbed. This theory was based on a study of lactulose in which ingested doses of 5, 10, or 20 g resulted in a linear increase in breath hydrogen along with the similar malabsorption patterns of lactulose and lactose.9
The purpose of our systematic review was to determine if probiotics have a positive effect in patients with lactose intolerance. We found no systematic reviews or meta-analyses in the Cochrane Database of Systematic Reviews or the Database of Reviews of Effectiveness (DARE).
Methods
Inclusion criteria
The clinical question researched was “Does the addition of probiotics to nonfermented dairy products decrease lactose intolerance at a single meal?” Inclusion criteria for review were studies that were randomized placebo-controlled clinical trials, that involved adults diagnosed with lactose intolerance via breath hydrogen >20 ppm above baseline after lactose consumption, that used probiotic supplementation in any form as the intervention, and that included the outcomes of symptoms or breath hydrogen test results.
Search strategy and assessment
Four authors (MD, KK, KL, JM) independently searched Medline and Allied and Complementary Medicine Database (AMED) for studies published between 1966 and December 2002. Four authors performed individual searches using the Medical Subject Heading (MeSH) terms 1) “lactose intolerance” and “Lactobacillus”; 2) “lactose intolerance” and “probiotics”; 3) “lactose intolerance” and “yogurt”; and 4) “diarrhea, bloating, abdominal pain” and “yogurt.” The search strategies for each member were documented, and the resulting published listings were combined.
The initial set of articles was pulled and references from those studies were searched. In addition, manufacturers of Lactobacillus supplements and authors identified with expertise in lactose intolerance were contacted by phone or e-mail in an effort to look for any unpublished or ongoing trials possibly missed in the initial search.
Each author independently assessed each of the selected articles for validity using the recommendations made by the Evidence-Based Medicine Working Group at McMaster University.10 These validity criteria included patient similarity, evidence of controls, randomization, allocation concealment, blinding, completion of follow-up, use of intention-to-treat, and similarity of intervention and control groups. The authors then met to discuss their assessment and clarify any article concerns. General agreement was reached, and there were no dissenting views.
Data extraction
A standardized data extraction form was developed by 1 author (FD) and each paper’s information was extracted by 1 of the other authors (KL) and verified by the final author (FD). The following data were extracted: number of treatment arms, types of treatment arms (including forms of probiotics), number of subjects per treatment arm, study design, data presentation, and results obtained.
No formal statistical procedures or tests were performed. Authors hoped that appropriate data could be collected from each paper so that a meta-analysis could be performed. However, the lack of standardized data presentation for breath hydrogen and symptom results made data pooling impossible.
Results
Medline and AMED searches yielded 75 clinical trials. The reference search from these studies gave an additional 15 trials. No studies were identified through manufacturer or expert author inquiries. From the master list of 90 studies, 22 met inclusion and exclusion criteria. Of the 22, 10 were consistent with our clinical question. Of these 10 articles used in the study, 8 were obtained from the Medline and AMED searches, and 2 were obtained from the references.
Of the 10 randomized placebo-controlled trials, sample sizes for probiotic treatment arms ranged from 5 (Dehkordi) to 20 (Lin & Yen). Probiotic arms varied in subtype, strain, and concentration. Most of the studies (9) used the Lactobacillus acidophilus subtype as the intervention. Four trials examined probiotics other than, or in addition to, L acidophilus (Dehkordi, Jiang, Lin & Yen, Lin & Savaiano). Dehkordi performed 2 experiments. The first experiment examined the additive of effect of Lactobacillus and Bifidobacterium longum. The second compared only Lactobacillus strains with control milk.
Lin & Savaiano in 1990 compared 3 Lactobacillus strains, each with 2 different concentrations, as well as the combination probiotic subtypes of Streptococcus thermophilus/Lactobacillus bulgaricus at 2 concentrations with the control milk.
In 1998, Lin & Yen compared 2 concentrations of an L acidophilus strain and 2 concentrations of an L bulgaricus strain with placebo. McDonough examined the effects of sonicated (intracellular lactase release) acidophilus milk in addition to acidophilus milk on breath hydrogen results.
Four of the 10 randomized controlled trials were performed in a crossover design (Newcomer, Lin & Savaiano, Lin & Yen, and Savaiano) while the remaining 6 varied in randomized designs.
TABLE 1 shows the validity characteristics for the 10 clinical trials published between 1981 and 1998 that met inclusion and exclusion criteria. While all were randomized controlled trials with similar patients, interventions, and controls, none of the 10 concealed the allocation of the interventions. Lin & Yen’s 1998 study failed to mention the percentage of subjects followed-up and, thus, intention-to-treat did not figure into the analysis. Three of the 10 (Dehkordi, Onwulata, McDonough) did not specify if their studies involved double-blinding.
Descriptors of each trial’s treatment arms, subjects, design, data presentation, and results are shown in TABLE W1. Of the 9 studies that measured the disease-oriented outcome of breath hydrogen, 3 were positive, 3 were negative, and 3 had both positive and negative (mixed) results. Of the 7 studies that measured the patient-oriented outcome of symptoms, 1 yielded positive results, 5 were negative, and 1 had mixed outcomes (TABLE 2).
TABLE 1
Validity characteristics of randomized controlled trials studying the effects of probiotics on lactose intolerance
| LEAD AUTHOR | PATIENTS SIMILAR | RCT | ASSIGNMENT CONCEALED | DOUBLE-BLINDING | 100% FOLLOW-UP | INTENTION TO-TREAT | INTERVENT./CONTROLS SIMILAR |
|---|---|---|---|---|---|---|---|
| Dehkordi (1995)11 | Yes | Yes | No | Not specified | Yes | N/A | Yes |
| Jiang (1996)12 | Yes | Yes | No | Yes | Yes | N/A | Yes |
| Mustapha (1997)13 | Yes | Yes | No | Yes | Yes | N/A | Yes |
| Newcomer (1983)14 | Yes | Yes | No | Yes | Yes | N/A | Yes |
| Onwulata (1989)15 | Yes | Yes | No | Not specified | Yes | N/A | Yes |
| Lin, Savaiano (1991)16 | Yes | Yes | No | Yes | Yes | N/A | Yes |
| Lin, Yen (1998)17 | Yes | Yes | No | Yes | Not mentioned | Not mentioned | Yes |
| Savaiano (1984)18 | Yes | Yes | No | Yes* | Yes | N/A | Yes |
| McDonough (1987)19 | Yes | Yes | No | Not specified | Yes | N/A | Yes |
| Kim (1983)20 | Yes | Yes | No | Yes | Yes | N/A | Yes |
| RCT, randomized controlled trial; N/A, not applicable secondary to 100% follow-up and subject analysis consistent with group assignment. | |||||||
| * Described as “blinded” but “no attempt to mask flavor or texture.” | |||||||
TABLE 2
Does the addition of probiotics to non-fermented dairy products decrease lactose intolerance at a single meal?
| LEAD AUTHOR | BREATH HYDROGEN RESULTS* | SYMPTOM RESULTS | COMMENTS |
|---|---|---|---|
| Dehkordi (1995) | Negative (1 of 1 Expt 1; 2 of 2 Expt 2) | Not measured | Non-probiotic treatment arm of whole milk with corn flakes “alleviated lactose malabsorption significantly” (P<.01).11 |
| Jiang (1996) | Positive (2 of 3) | Negative (2 of 3 flatulence, 3 of 3 abdom. pain, 3 of 3 meteorism, 3 of 3 borborygmi, 3 of 3 diarrhea) | |
| Mustapha (1997) | Positive (3 of 4) | Mixed | 1 of 4 probiotic treatment arms w/ significantly less flatulence; 1 w/ sig. less bloating; 2 w/ sig. less diarrhea. No difference in rumbling symptom. |
| Newcomer (1983) | Not measured | Negative (1 of 1) | |
| Onwulata (1989) | Negative (1 of 1) | Negative (1 of 1) | |
| Lin, Savaiano (1991) | Mixed | Negative (7 of 8) | 3 of 8 probiotic treatment arms w/ sig. difference in mean breath hydrogen. 1 of 8 probiotic treatment arms eliminated intolerance symptoms “in all subjects.” |
| Lin, Yen (1998) | Mixed | Positive (3 of 4) | 2 of 4 probiotic treatment arms w/ sig. difference in mean breath hydrogen. |
| Savaiano (1984) | Negative (1 of 1) | Negative (1 of 1) | |
| McDonough (1987) | Mixed | Not measured | 1 of 2 probiotic treatment arms w/ sig. difference in mean breath hydrogen. |
| Kim (1983) | Positive (2 of 3) | Not measured | |
| Summary (10 studies): Breath hydrogen = 3 positive studies, 3 negative, 3 mixed, 1 not measured. *Expressed as number of probiotic treatment arm results per number of probiotic treatment arms in study. Examples: negative (2 of 3) = 2 negative treatment arms of 3 probiotic treatment arms; Positive 1 of 1 = 1 positive treatment arm of 1 treatment arm. | |||
Discussion
This review of controlled clinical trials produced a negative answer to the question: “Do probiotics decrease lactose intolerance at a single meal including nonfermented dairy products?” We reviewed articles that involved the simultaneous combination of probiotics and non-fermented dairy products in objectively identified lactose-intolerant individuals.
Strengths of this review
All review studies selected patients who had both gastrointestinal symptoms and positive breath hydrogen test results. All studies used appropriate methodology of randomized design (LOE: 1b). All studies involved a control group or a crossover design in which intervention patients served as their own controls. Further strengths of this review are an adequate number of studies with strong methodology, most (7 of 10) measured the patient-oriented outcome of symptoms, and reports of no adverse effects of probiotic treatments.
Weaknesses of the review
The variations in probiotic subtype, strain, and concentration are weaknesses in this review. Probiotic subtypes and strains vary with regard to β-galactosidase activity, intestinal adherence, cell wall thickness, and other characteristics that may affect clinical efficacy. Jiang showed significant breath hydrogen results with B longum B6 grown in lactose-containing media, while the same strain grown in glucose- and lactose-containing media was not effective. He also found the former strain significantly reduced the symptom of flatulence but not pain, meteorism, borborygmi, or diarrhea.
Only 2 of the 9 L acidophilus studies reported use of similar strains of L acidophilus B (Mustapha, Lin and Yen). Six of the 9 L acidophilus studies accounted for the probiotic subtype and concentration but not its strain. Instead the L acidophilus intervention was expressed as L acidophilus milk or sweet acidophilus milk (Dehkordi, Newcomer, Onwulata, Savaiano, McDonough, Kim). A potential strain outcome association may exist with L acidophilus B. Both Mustapha and Lin and Yen showed positive outcomes with this treatment arm in breath hydrogen and symptom results (TABLE W1).
Trials using L bulgaricus (Lin, Savaiano, and Lin and Yen) may have isolated a therapeutic subtype other than acidophilus. Lin, Savaiano found that 1 of 2 L bulgaricus/S thermophilus combinations significantly reduced symptoms. Whether this difference may be attributed to 1 of the 2 subtypes or their combination can only be speculated.
Additionally, Lin and Yen found that both strains of L bulgaricus 449 at concentrations of 108 and 109 significantly improved breath hydrogen and symptom scores. This positive association may be related to any or all of its subtype, strain, or concentration. Also in that study, both probiotic subtypes of L acidophilus and L bulgaricus at concentrations of 109 significantly reduce symptoms. Unfortunately, there was not enough specific information on strain characteristics to draw any firm conclusions. In future studies, careful attention to bacterial characteristics may provide a definitive answer to our questions.
The lack of standardized data presentation for breath hydrogen and symptoms in these 10 trials was a limitation. Some papers had only graphs of mean breath hydrogen, some showed differences from baseline, and some showed various summary statistics of breath hydrogen over different time periods. There was no standard objective measure of symptoms such as a Likert scale. Instead, symptoms were expressed in various ways (number of instances, scoring systems, or sole mention in text format). For these reasons, a meta-analysis could not be performed. This review could be further criticized because authors were not directly contacted for raw data for a potential meta-analysis.
Recommendations from this review
Several recommendations can be extracted from the results of this review.
First, probiotics in general do not reduce lactose intolerance (SOR: A). However, some evidence suggests that specific strains and concentrations are effective (SOR: B).
Second, there were enough positive treatment arms to suggest that some individuals will, for unknown reasons, have their symptoms eliminated or reduced with probiotics (SOR: B). It is reasonable, therefore, for clinicians to simply tell patients to “try it.” For a more objective analysis, an n-of-1 trial could be used.21 Clinicians will have to keep in mind that many people presumed to have lactose intolerance do not meet standard diagnostic criteria when objectively assessed.
Third, several strategies are available to lactose-intolerant persons (SOR: C). Yogurt, lactase enzymes, lactose-free or lactose-reduced products, specific foods, and probiotics selective for strain, concentration, and preparation are all supported by evidence. Onwulata compared results of probiotic milk, lactase tablets plus milk, hydrolyzed lactose milk, and yogurt with that of whole milk. Only yogurt and hydrolyzed lactose milk yielded significantly lower breath hydrogen results. Six of 10 patients reported symptoms with probiotic milk, 3 of 10 with lactase tablets, 1 of 10 with hydrolyzed milk, and no symptoms were reported with yogurt.
Dehkordi showed that probiotic milk had no effect on breath hydrogen results, but his treatment arm of cornflakes with whole milk did significantly affect results. McDonough found that when sweet acidophilus milk was sonicated to release intracellular lactase from the bacterial cells, a significant change in breath hydrogen resulted. Unfortunately, neither Dehkordi nor McDonough measured symptoms in their studies to specify patient-oriented outcomes.
Fourth, many individuals with symptoms of lactose intolerance do not meet the definition of diagnosis as measured by breath hydrogen testing (SOR: B). All clinical trials in this review declined subject enrollment if lactose intolerance symptoms were unconfirmed by breath hydrogen testing, thereby accepting only true positives.
There are several reasons why probiotic supplementation may be superior to commercial lactase supplementation. Patients have varied responses to lactase supplementation with meals, and different preparations may be more or less effective for the same quantity of lactose ingested.22 Also, as mentioned earlier, other research supports the role of probiotics in preventing diarrheal illness, treating irritable bowel syndrome and inflammatory bowel disease, and possibly benefiting persons with atopic disease. Finally, if lactase-producing probiotics are clinically effective and can also adhere to the intestinal lining, patients may experience prolonged reduction or remission of symptoms without the need to ingest any tablets with meals.
Two of the 10 studies (Newcomer, Kim) examined long-term probiotic use for 1 and 2 weeks, respectively. Newcomer measured only symptoms, showing no significant difference between L acidophilus milk and unaltered milk. Kim found that 2 of 3 L acidophilus concentrations significantly decreased breath hydrogen results, but the study did not measure symptoms. We can infer a negative patient-oriented outcome of long-term probiotic intervention based on these 2 trials. However, this domain of chronic probiotic use to reduce lactose intolerance would benefit from additional studies for comparison.
In conclusion, probiotic supplementation in general was not effective at reducing lactose intolerance of adults. Some evidence suggests that certain strains, concentrations, and preparations are effective. Clinicians could discuss probiotic supplementation with patients as an alternative treatment. There were enough positive treatment arms to suggest there may be individuals who respond to probiotics. Further studies are needed to determine specific probiotic relationships. The best studies would be those using crossover randomized double-blind design of selected probiotic strains and concentrations and objectively measuring breath hydrogen and symptoms with a long enough wash-out period to eliminate the chance of gut colonization.
Acknowledgments
Material in this article has been previously presented at the following: “Probiotic Supplementation as Treatment for Lactose Intolerance: a Systematic Review,” Fellows works-in-progress poster presentation at the STFM 36th Annual Conference, Atlanta, GA, September 2003, Kara M. Levri, Kari Ketvertis, Mark Deramo, Joel H. Merenstein, Frank D’Amico; “Probiotic Supplementation as Treatment for Lactose Intolerance: A Systematic Review,” Grand Professor Rounds, UPMC St. Margaret, Pittsburgh, Pa, June 2003, Kara M. Levri, Kari Ketvertis, Mark Deramo; “Probiotic Supplementation as Treatment for Lactose Intolerance: a Systematic Review,” Pennsylvania Academy of Family Physicians Research Day, Philadelphia, Pa, April 2003, Kara M. Levri.
CORRESPONDING AUTHOR
Kara M. Levri, MD, MPH, UPMC St. Margaret, 3937 Butler Street, Pittsburgh, PA 15201. E-mail: [email protected].
1. Haubrich WS, Schaffner F, Berk JE. Gastroenterology. Philadelphia, Pa: W.B. Saunders; 1995.
2. Vesa TH, Marteau P, Korpeia R. Lactose intolerance. J Am Col Nutr 2000;19:165S-175S.
3. McFarland LV, Elmer GW. Biotherapeutic agents: past, present and future. Microecol Ther 1995;23:46-73.
4. Kopp-Hoolihan L. Prophylactic and therapeutic uses of probiotics: a review. J Am Diet Assoc 2001;101:229-241.
5. Drisko J, Giles C, Bischoff B. Probiotics in health maintenance and disease prevention. Alt Med Rev 2003;8:143-155.
6. Food and Agriculture Organization of the United Nations and World Health Organization. Regulatory and clinical aspects of dairy probiotics. Food and Agriculture Organization of the United Nations and World Health Organization Expert Consultation Report. Food and Agriculture Organization of the United Nations and World Health Organization Working Group Report; 2001. Available at: www.isapp.net/probio_report.pdf.
7. Newcomer AD, McGill DB, Thomas PJ, Hofman AF. Prospective comparison of indirect methods for detecting lactase deficiency. N Engl J Med 1975;293:1232.-
8. Kerlin P, Wong L. Breath hydrogen testing in bacterial overgrowth of the small intestine. Gastroenterology 1988;95:982.-
9. Florent C, Flourie B, Leblond A, Rautureau M, Bernier JJ, Rambaud JC. Influence of chronic lactulose ingestion on the colonic metabolism of lactulose in man (an in vivo study). J Clin Invest 1985;75:608-613.
10. Slawson DC, Shaughnessy AF. Teaching information mastery: Creating informed consumers of medical information. JABFP 1999;12:444-449.
11. Dehkordi N, Rao DR, Warren AP, Chawan CB. Lactose malabsorption as influenced by chocolate milk, skim milk, sucrose, whole milk, and lactic cultures. J Am Dietetic Assoc 1995;95:484-486.
12. Jiang T, Mustapha A, Savaiano D. Improvement of lactose digestion in humans by ingestion of unfermented milk containing bifidobacterium longum. J Dairy Sci 1996;79:750-757.
13. Mustapha A, Jiang T, Savaiano DA. Improvement of lactose digestion by humans following ingestion of unfermented acidophilus milk: influence of bile sensitivity, lactose transport, and acid tolerance of lacto-bacillus acidophilus. J Dairy Sci 1997;80:1537-1545.
14. Newcomer AD, Park HS, O’Brien PC, McGill DB. Response of patients with irritable bowel syndrome and lactase deficiency using unfermented acidophilus milk. Am J Clin Nutrition 1983;38:257-263.
15. Onwulata CI, Rao DR, Vankineni. Relative efficiency of yogurt, sweet acidophilus milk, hydrolyzed-lactose milk, and a commercial lactase tablet in alleviating lac-tose maldigestion. Am J Clin Nutrition 1989;49:1233-1237.
16. Lin MY, Savaiano D, Harlander S. Influence of nonfermented dairy products containing bacterial starter cultures on lactose maldigestion in humans. J Dairy Sci 1991;74:87-95.
17. Lin MY, Yen CL, Chen SH. Management of lactose maldigestion by consuming milk containing lactobacilli. Digestive Diseases & Sciences 1998;43:133-137.
18. Savaiano DA, AbouElAnouar A, Smith DE, Levitt MD. Lactose malabsorption from yogurt, pasteurized yogurt, sweet acidophilus milk and cultured milk in lactase-deficient individuals. Am J Clin Nut 1984;40:1219-1223.
19. McDonough FE, Hitchins AD, Wrong NP, Wells P, Bodwell CE. Modification of Sweet acidophilus milk to improve utilization by lactose-intolerant persons. Am J Clin Nut 1987;45:570-574.
20. Kim HS, Gilland SE. Lactobacillus acidophilus as a dietary adjunct to aid lactose digestion in humans. J Dairy Science 1983;66:959-966.
21. Guyatt G, Sackett D, Adachi J, et al. A clinicians guide for conducting randomised trials in individual patients. CMAJ 1988;139:497.-
22. Ramirez FC, Lee K, Graham DY. All lactase preparations are not the same: results of a prospective, randomized, placebo-controlled trial. Am J Gastroenterol 1994;89:566-570.
Methods: We searched randomized controlled trials published between 1966 and December 2002. Databases in the search strategy included Medline and AMED. We reviewed references of clinical trials and contacted authors of major articles and manufacturers of probiotic commercial products. Quality assessment was based on the McMaster guides and was performed by 5 independent reviewers. Data extraction was performed by 2 reviewers.
Results: A master list of 90 articles was compiled. Ten articles met inclusion and exclusion criteria and were consistent with our clinical question. Of the 9 studies that measured breath hydrogen, 3 were positive, 3 were negative, and 3 had both positive and negative results. Of the 7 studies that measured symptoms, 1 yielded positive results, 5 were negative, and 1 had both positive and negative outcomes.
Conclusions: Probiotic supplementation in general did not alleviate the symptoms and signs of lactose intolerance in adults in this review. Some evidence suggests that specific strains, concentrations, and preparations are effective. Further clinical trials of specific strains and concentrations are necessary to delineate this potential therapeutic relationship.
- Become familiar with the strains, concentrations, and preparations of probiotics most likely to be effective.
- Because a given individual may respond well to probiotics, suggest a trial of a probiotic supplement—perhaps conducting an n-of-1 trial for an objective assessment.
- If a trial of probiotic does not achieve desired results, advise the patient of the many other options to treat lactose intolerance.
Judging from our systematic review of the literature, probiotic supplementation is not effective universally for lactose intolerance in adults. However, some evidence suggests that specific strains, concentrations, and preparations of probiotics can be effective.
Discuss probiotic supplementation with lactose-intolerant patients. “Try it” is a reasonable suggestion, given additional evidence that there are individuals whose symptoms of lactose intolerance will, for unknown reasons, respond to probiotics.
For those who find no benefit in probiotics, several other therapeutic options can be recommended.
Prevailing wisdom about lactose intolerance
Lactose intolerant persons suffer such symptoms as abdominal cramping, bloating, and diarrhea after ingesting lactose-containing foods, including nonfermented dairy products.1 This intolerance to dairy products may result in a person receiving less than the recommended intake of calcium and protein, especially in developing countries.
Primary lactase deficiency is the most common form of lactose intolerance.1 In the US, 15% of Caucasians, over 50% of Mexican Americans, and over 80% of African Americans have lactose intolerance.2
Treatment options for lactase deficiency
Lactose-intolerant persons digest yogurt, which is fermented, more easily than milk.2 Nonfermented lactose-containing foods can be consumed in small quantities or with proteins and fats to delay gastric emptying. Nonfermented dairy products are generally tolerated if they are prehydrolyzed to reduce levels of lactose (such as reduced-lactose or lactose-free milk). Finally, synthetic enzyme (lactase) tablets can be taken with lactose-containing dairy foods in an attempt to alleviate symptoms.2
What are probiotics?
Probiotics are live microorganisms that, when ingested, have beneficial effects on the prevention or treatment of disease.3 Some probiotics, such as Lactobacillus, contain β-galactosidase or lactase intracellularly so that ingestion of lactase-containing probiotics might be beneficial for lactose-intolerant individuals, either consumed with food or taken separately as a supplement.
Theoretically, probiotics ingested as supplements would adhere to the intestinal lining and digest dietary lactose, thereby alleviating malabsorptive symptoms from excessive lactose. Probiotics have other positive effects: treating and preventing diarrhea (infectious and antibiotic induced), relieving symptoms of irritable bowel syndrome, alleviating inflammatory bowel disease, and decreasing atopic disease.4,5 The Food and Agriculture Organization of the United Nations and the World Health Organization have reported that there is adequate scientific evidence of the potential for probiotic foods to provide health benefits, and that specific strains are safe for human use.6
Purported advantages of probiotics. Probiotic supplementation may be preferred over lactose-free products due to the inability to monitor and control all dairy products consumed. The varied efficacy of lactase enzymes in different individuals may render probiotics the favored supplement. Also, the option of a natural treatment may appeal to many people.
Testing for lactose intolerance
The hydrogen breath test is the gold standard for diagnosing lactose intolerance. Intestinal bacteria metabolize carbohydrate to generate hydrogen that is rapidly absorbed into the blood perfusing the gut and cleared during a single passage through the lungs.
A lactose dose of 25 to 50 g is given after an overnight fast. A rise in the hydrogen level of more than 20 parts per million (ppm) over baseline suggests hypolactasia.7 At a cutoff of 20 ppm, the test has a specificity of 90%. False positives may occur secondary to severe bacterial overgrowth of the small bowel, smoking, and aspirin use. False negative results are seen in persons receiving oral antibiotics or high colonic enemas, suffering severe diarrhea, or lacking bacterial flora.8
Another use of the breath hydrogen test is to measure the quantity of lactose malabsorbed. This theory was based on a study of lactulose in which ingested doses of 5, 10, or 20 g resulted in a linear increase in breath hydrogen along with the similar malabsorption patterns of lactulose and lactose.9
The purpose of our systematic review was to determine if probiotics have a positive effect in patients with lactose intolerance. We found no systematic reviews or meta-analyses in the Cochrane Database of Systematic Reviews or the Database of Reviews of Effectiveness (DARE).
Methods
Inclusion criteria
The clinical question researched was “Does the addition of probiotics to nonfermented dairy products decrease lactose intolerance at a single meal?” Inclusion criteria for review were studies that were randomized placebo-controlled clinical trials, that involved adults diagnosed with lactose intolerance via breath hydrogen >20 ppm above baseline after lactose consumption, that used probiotic supplementation in any form as the intervention, and that included the outcomes of symptoms or breath hydrogen test results.
Search strategy and assessment
Four authors (MD, KK, KL, JM) independently searched Medline and Allied and Complementary Medicine Database (AMED) for studies published between 1966 and December 2002. Four authors performed individual searches using the Medical Subject Heading (MeSH) terms 1) “lactose intolerance” and “Lactobacillus”; 2) “lactose intolerance” and “probiotics”; 3) “lactose intolerance” and “yogurt”; and 4) “diarrhea, bloating, abdominal pain” and “yogurt.” The search strategies for each member were documented, and the resulting published listings were combined.
The initial set of articles was pulled and references from those studies were searched. In addition, manufacturers of Lactobacillus supplements and authors identified with expertise in lactose intolerance were contacted by phone or e-mail in an effort to look for any unpublished or ongoing trials possibly missed in the initial search.
Each author independently assessed each of the selected articles for validity using the recommendations made by the Evidence-Based Medicine Working Group at McMaster University.10 These validity criteria included patient similarity, evidence of controls, randomization, allocation concealment, blinding, completion of follow-up, use of intention-to-treat, and similarity of intervention and control groups. The authors then met to discuss their assessment and clarify any article concerns. General agreement was reached, and there were no dissenting views.
Data extraction
A standardized data extraction form was developed by 1 author (FD) and each paper’s information was extracted by 1 of the other authors (KL) and verified by the final author (FD). The following data were extracted: number of treatment arms, types of treatment arms (including forms of probiotics), number of subjects per treatment arm, study design, data presentation, and results obtained.
No formal statistical procedures or tests were performed. Authors hoped that appropriate data could be collected from each paper so that a meta-analysis could be performed. However, the lack of standardized data presentation for breath hydrogen and symptom results made data pooling impossible.
Results
Medline and AMED searches yielded 75 clinical trials. The reference search from these studies gave an additional 15 trials. No studies were identified through manufacturer or expert author inquiries. From the master list of 90 studies, 22 met inclusion and exclusion criteria. Of the 22, 10 were consistent with our clinical question. Of these 10 articles used in the study, 8 were obtained from the Medline and AMED searches, and 2 were obtained from the references.
Of the 10 randomized placebo-controlled trials, sample sizes for probiotic treatment arms ranged from 5 (Dehkordi) to 20 (Lin & Yen). Probiotic arms varied in subtype, strain, and concentration. Most of the studies (9) used the Lactobacillus acidophilus subtype as the intervention. Four trials examined probiotics other than, or in addition to, L acidophilus (Dehkordi, Jiang, Lin & Yen, Lin & Savaiano). Dehkordi performed 2 experiments. The first experiment examined the additive of effect of Lactobacillus and Bifidobacterium longum. The second compared only Lactobacillus strains with control milk.
Lin & Savaiano in 1990 compared 3 Lactobacillus strains, each with 2 different concentrations, as well as the combination probiotic subtypes of Streptococcus thermophilus/Lactobacillus bulgaricus at 2 concentrations with the control milk.
In 1998, Lin & Yen compared 2 concentrations of an L acidophilus strain and 2 concentrations of an L bulgaricus strain with placebo. McDonough examined the effects of sonicated (intracellular lactase release) acidophilus milk in addition to acidophilus milk on breath hydrogen results.
Four of the 10 randomized controlled trials were performed in a crossover design (Newcomer, Lin & Savaiano, Lin & Yen, and Savaiano) while the remaining 6 varied in randomized designs.
TABLE 1 shows the validity characteristics for the 10 clinical trials published between 1981 and 1998 that met inclusion and exclusion criteria. While all were randomized controlled trials with similar patients, interventions, and controls, none of the 10 concealed the allocation of the interventions. Lin & Yen’s 1998 study failed to mention the percentage of subjects followed-up and, thus, intention-to-treat did not figure into the analysis. Three of the 10 (Dehkordi, Onwulata, McDonough) did not specify if their studies involved double-blinding.
Descriptors of each trial’s treatment arms, subjects, design, data presentation, and results are shown in TABLE W1. Of the 9 studies that measured the disease-oriented outcome of breath hydrogen, 3 were positive, 3 were negative, and 3 had both positive and negative (mixed) results. Of the 7 studies that measured the patient-oriented outcome of symptoms, 1 yielded positive results, 5 were negative, and 1 had mixed outcomes (TABLE 2).
TABLE 1
Validity characteristics of randomized controlled trials studying the effects of probiotics on lactose intolerance
| LEAD AUTHOR | PATIENTS SIMILAR | RCT | ASSIGNMENT CONCEALED | DOUBLE-BLINDING | 100% FOLLOW-UP | INTENTION TO-TREAT | INTERVENT./CONTROLS SIMILAR |
|---|---|---|---|---|---|---|---|
| Dehkordi (1995)11 | Yes | Yes | No | Not specified | Yes | N/A | Yes |
| Jiang (1996)12 | Yes | Yes | No | Yes | Yes | N/A | Yes |
| Mustapha (1997)13 | Yes | Yes | No | Yes | Yes | N/A | Yes |
| Newcomer (1983)14 | Yes | Yes | No | Yes | Yes | N/A | Yes |
| Onwulata (1989)15 | Yes | Yes | No | Not specified | Yes | N/A | Yes |
| Lin, Savaiano (1991)16 | Yes | Yes | No | Yes | Yes | N/A | Yes |
| Lin, Yen (1998)17 | Yes | Yes | No | Yes | Not mentioned | Not mentioned | Yes |
| Savaiano (1984)18 | Yes | Yes | No | Yes* | Yes | N/A | Yes |
| McDonough (1987)19 | Yes | Yes | No | Not specified | Yes | N/A | Yes |
| Kim (1983)20 | Yes | Yes | No | Yes | Yes | N/A | Yes |
| RCT, randomized controlled trial; N/A, not applicable secondary to 100% follow-up and subject analysis consistent with group assignment. | |||||||
| * Described as “blinded” but “no attempt to mask flavor or texture.” | |||||||
TABLE 2
Does the addition of probiotics to non-fermented dairy products decrease lactose intolerance at a single meal?
| LEAD AUTHOR | BREATH HYDROGEN RESULTS* | SYMPTOM RESULTS | COMMENTS |
|---|---|---|---|
| Dehkordi (1995) | Negative (1 of 1 Expt 1; 2 of 2 Expt 2) | Not measured | Non-probiotic treatment arm of whole milk with corn flakes “alleviated lactose malabsorption significantly” (P<.01).11 |
| Jiang (1996) | Positive (2 of 3) | Negative (2 of 3 flatulence, 3 of 3 abdom. pain, 3 of 3 meteorism, 3 of 3 borborygmi, 3 of 3 diarrhea) | |
| Mustapha (1997) | Positive (3 of 4) | Mixed | 1 of 4 probiotic treatment arms w/ significantly less flatulence; 1 w/ sig. less bloating; 2 w/ sig. less diarrhea. No difference in rumbling symptom. |
| Newcomer (1983) | Not measured | Negative (1 of 1) | |
| Onwulata (1989) | Negative (1 of 1) | Negative (1 of 1) | |
| Lin, Savaiano (1991) | Mixed | Negative (7 of 8) | 3 of 8 probiotic treatment arms w/ sig. difference in mean breath hydrogen. 1 of 8 probiotic treatment arms eliminated intolerance symptoms “in all subjects.” |
| Lin, Yen (1998) | Mixed | Positive (3 of 4) | 2 of 4 probiotic treatment arms w/ sig. difference in mean breath hydrogen. |
| Savaiano (1984) | Negative (1 of 1) | Negative (1 of 1) | |
| McDonough (1987) | Mixed | Not measured | 1 of 2 probiotic treatment arms w/ sig. difference in mean breath hydrogen. |
| Kim (1983) | Positive (2 of 3) | Not measured | |
| Summary (10 studies): Breath hydrogen = 3 positive studies, 3 negative, 3 mixed, 1 not measured. *Expressed as number of probiotic treatment arm results per number of probiotic treatment arms in study. Examples: negative (2 of 3) = 2 negative treatment arms of 3 probiotic treatment arms; Positive 1 of 1 = 1 positive treatment arm of 1 treatment arm. | |||
Discussion
This review of controlled clinical trials produced a negative answer to the question: “Do probiotics decrease lactose intolerance at a single meal including nonfermented dairy products?” We reviewed articles that involved the simultaneous combination of probiotics and non-fermented dairy products in objectively identified lactose-intolerant individuals.
Strengths of this review
All review studies selected patients who had both gastrointestinal symptoms and positive breath hydrogen test results. All studies used appropriate methodology of randomized design (LOE: 1b). All studies involved a control group or a crossover design in which intervention patients served as their own controls. Further strengths of this review are an adequate number of studies with strong methodology, most (7 of 10) measured the patient-oriented outcome of symptoms, and reports of no adverse effects of probiotic treatments.
Weaknesses of the review
The variations in probiotic subtype, strain, and concentration are weaknesses in this review. Probiotic subtypes and strains vary with regard to β-galactosidase activity, intestinal adherence, cell wall thickness, and other characteristics that may affect clinical efficacy. Jiang showed significant breath hydrogen results with B longum B6 grown in lactose-containing media, while the same strain grown in glucose- and lactose-containing media was not effective. He also found the former strain significantly reduced the symptom of flatulence but not pain, meteorism, borborygmi, or diarrhea.
Only 2 of the 9 L acidophilus studies reported use of similar strains of L acidophilus B (Mustapha, Lin and Yen). Six of the 9 L acidophilus studies accounted for the probiotic subtype and concentration but not its strain. Instead the L acidophilus intervention was expressed as L acidophilus milk or sweet acidophilus milk (Dehkordi, Newcomer, Onwulata, Savaiano, McDonough, Kim). A potential strain outcome association may exist with L acidophilus B. Both Mustapha and Lin and Yen showed positive outcomes with this treatment arm in breath hydrogen and symptom results (TABLE W1).
Trials using L bulgaricus (Lin, Savaiano, and Lin and Yen) may have isolated a therapeutic subtype other than acidophilus. Lin, Savaiano found that 1 of 2 L bulgaricus/S thermophilus combinations significantly reduced symptoms. Whether this difference may be attributed to 1 of the 2 subtypes or their combination can only be speculated.
Additionally, Lin and Yen found that both strains of L bulgaricus 449 at concentrations of 108 and 109 significantly improved breath hydrogen and symptom scores. This positive association may be related to any or all of its subtype, strain, or concentration. Also in that study, both probiotic subtypes of L acidophilus and L bulgaricus at concentrations of 109 significantly reduce symptoms. Unfortunately, there was not enough specific information on strain characteristics to draw any firm conclusions. In future studies, careful attention to bacterial characteristics may provide a definitive answer to our questions.
The lack of standardized data presentation for breath hydrogen and symptoms in these 10 trials was a limitation. Some papers had only graphs of mean breath hydrogen, some showed differences from baseline, and some showed various summary statistics of breath hydrogen over different time periods. There was no standard objective measure of symptoms such as a Likert scale. Instead, symptoms were expressed in various ways (number of instances, scoring systems, or sole mention in text format). For these reasons, a meta-analysis could not be performed. This review could be further criticized because authors were not directly contacted for raw data for a potential meta-analysis.
Recommendations from this review
Several recommendations can be extracted from the results of this review.
First, probiotics in general do not reduce lactose intolerance (SOR: A). However, some evidence suggests that specific strains and concentrations are effective (SOR: B).
Second, there were enough positive treatment arms to suggest that some individuals will, for unknown reasons, have their symptoms eliminated or reduced with probiotics (SOR: B). It is reasonable, therefore, for clinicians to simply tell patients to “try it.” For a more objective analysis, an n-of-1 trial could be used.21 Clinicians will have to keep in mind that many people presumed to have lactose intolerance do not meet standard diagnostic criteria when objectively assessed.
Third, several strategies are available to lactose-intolerant persons (SOR: C). Yogurt, lactase enzymes, lactose-free or lactose-reduced products, specific foods, and probiotics selective for strain, concentration, and preparation are all supported by evidence. Onwulata compared results of probiotic milk, lactase tablets plus milk, hydrolyzed lactose milk, and yogurt with that of whole milk. Only yogurt and hydrolyzed lactose milk yielded significantly lower breath hydrogen results. Six of 10 patients reported symptoms with probiotic milk, 3 of 10 with lactase tablets, 1 of 10 with hydrolyzed milk, and no symptoms were reported with yogurt.
Dehkordi showed that probiotic milk had no effect on breath hydrogen results, but his treatment arm of cornflakes with whole milk did significantly affect results. McDonough found that when sweet acidophilus milk was sonicated to release intracellular lactase from the bacterial cells, a significant change in breath hydrogen resulted. Unfortunately, neither Dehkordi nor McDonough measured symptoms in their studies to specify patient-oriented outcomes.
Fourth, many individuals with symptoms of lactose intolerance do not meet the definition of diagnosis as measured by breath hydrogen testing (SOR: B). All clinical trials in this review declined subject enrollment if lactose intolerance symptoms were unconfirmed by breath hydrogen testing, thereby accepting only true positives.
There are several reasons why probiotic supplementation may be superior to commercial lactase supplementation. Patients have varied responses to lactase supplementation with meals, and different preparations may be more or less effective for the same quantity of lactose ingested.22 Also, as mentioned earlier, other research supports the role of probiotics in preventing diarrheal illness, treating irritable bowel syndrome and inflammatory bowel disease, and possibly benefiting persons with atopic disease. Finally, if lactase-producing probiotics are clinically effective and can also adhere to the intestinal lining, patients may experience prolonged reduction or remission of symptoms without the need to ingest any tablets with meals.
Two of the 10 studies (Newcomer, Kim) examined long-term probiotic use for 1 and 2 weeks, respectively. Newcomer measured only symptoms, showing no significant difference between L acidophilus milk and unaltered milk. Kim found that 2 of 3 L acidophilus concentrations significantly decreased breath hydrogen results, but the study did not measure symptoms. We can infer a negative patient-oriented outcome of long-term probiotic intervention based on these 2 trials. However, this domain of chronic probiotic use to reduce lactose intolerance would benefit from additional studies for comparison.
In conclusion, probiotic supplementation in general was not effective at reducing lactose intolerance of adults. Some evidence suggests that certain strains, concentrations, and preparations are effective. Clinicians could discuss probiotic supplementation with patients as an alternative treatment. There were enough positive treatment arms to suggest there may be individuals who respond to probiotics. Further studies are needed to determine specific probiotic relationships. The best studies would be those using crossover randomized double-blind design of selected probiotic strains and concentrations and objectively measuring breath hydrogen and symptoms with a long enough wash-out period to eliminate the chance of gut colonization.
Acknowledgments
Material in this article has been previously presented at the following: “Probiotic Supplementation as Treatment for Lactose Intolerance: a Systematic Review,” Fellows works-in-progress poster presentation at the STFM 36th Annual Conference, Atlanta, GA, September 2003, Kara M. Levri, Kari Ketvertis, Mark Deramo, Joel H. Merenstein, Frank D’Amico; “Probiotic Supplementation as Treatment for Lactose Intolerance: A Systematic Review,” Grand Professor Rounds, UPMC St. Margaret, Pittsburgh, Pa, June 2003, Kara M. Levri, Kari Ketvertis, Mark Deramo; “Probiotic Supplementation as Treatment for Lactose Intolerance: a Systematic Review,” Pennsylvania Academy of Family Physicians Research Day, Philadelphia, Pa, April 2003, Kara M. Levri.
CORRESPONDING AUTHOR
Kara M. Levri, MD, MPH, UPMC St. Margaret, 3937 Butler Street, Pittsburgh, PA 15201. E-mail: [email protected].
1. Haubrich WS, Schaffner F, Berk JE. Gastroenterology. Philadelphia, Pa: W.B. Saunders; 1995.
2. Vesa TH, Marteau P, Korpeia R. Lactose intolerance. J Am Col Nutr 2000;19:165S-175S.
3. McFarland LV, Elmer GW. Biotherapeutic agents: past, present and future. Microecol Ther 1995;23:46-73.
4. Kopp-Hoolihan L. Prophylactic and therapeutic uses of probiotics: a review. J Am Diet Assoc 2001;101:229-241.
5. Drisko J, Giles C, Bischoff B. Probiotics in health maintenance and disease prevention. Alt Med Rev 2003;8:143-155.
6. Food and Agriculture Organization of the United Nations and World Health Organization. Regulatory and clinical aspects of dairy probiotics. Food and Agriculture Organization of the United Nations and World Health Organization Expert Consultation Report. Food and Agriculture Organization of the United Nations and World Health Organization Working Group Report; 2001. Available at: www.isapp.net/probio_report.pdf.
7. Newcomer AD, McGill DB, Thomas PJ, Hofman AF. Prospective comparison of indirect methods for detecting lactase deficiency. N Engl J Med 1975;293:1232.-
8. Kerlin P, Wong L. Breath hydrogen testing in bacterial overgrowth of the small intestine. Gastroenterology 1988;95:982.-
9. Florent C, Flourie B, Leblond A, Rautureau M, Bernier JJ, Rambaud JC. Influence of chronic lactulose ingestion on the colonic metabolism of lactulose in man (an in vivo study). J Clin Invest 1985;75:608-613.
10. Slawson DC, Shaughnessy AF. Teaching information mastery: Creating informed consumers of medical information. JABFP 1999;12:444-449.
11. Dehkordi N, Rao DR, Warren AP, Chawan CB. Lactose malabsorption as influenced by chocolate milk, skim milk, sucrose, whole milk, and lactic cultures. J Am Dietetic Assoc 1995;95:484-486.
12. Jiang T, Mustapha A, Savaiano D. Improvement of lactose digestion in humans by ingestion of unfermented milk containing bifidobacterium longum. J Dairy Sci 1996;79:750-757.
13. Mustapha A, Jiang T, Savaiano DA. Improvement of lactose digestion by humans following ingestion of unfermented acidophilus milk: influence of bile sensitivity, lactose transport, and acid tolerance of lacto-bacillus acidophilus. J Dairy Sci 1997;80:1537-1545.
14. Newcomer AD, Park HS, O’Brien PC, McGill DB. Response of patients with irritable bowel syndrome and lactase deficiency using unfermented acidophilus milk. Am J Clin Nutrition 1983;38:257-263.
15. Onwulata CI, Rao DR, Vankineni. Relative efficiency of yogurt, sweet acidophilus milk, hydrolyzed-lactose milk, and a commercial lactase tablet in alleviating lac-tose maldigestion. Am J Clin Nutrition 1989;49:1233-1237.
16. Lin MY, Savaiano D, Harlander S. Influence of nonfermented dairy products containing bacterial starter cultures on lactose maldigestion in humans. J Dairy Sci 1991;74:87-95.
17. Lin MY, Yen CL, Chen SH. Management of lactose maldigestion by consuming milk containing lactobacilli. Digestive Diseases & Sciences 1998;43:133-137.
18. Savaiano DA, AbouElAnouar A, Smith DE, Levitt MD. Lactose malabsorption from yogurt, pasteurized yogurt, sweet acidophilus milk and cultured milk in lactase-deficient individuals. Am J Clin Nut 1984;40:1219-1223.
19. McDonough FE, Hitchins AD, Wrong NP, Wells P, Bodwell CE. Modification of Sweet acidophilus milk to improve utilization by lactose-intolerant persons. Am J Clin Nut 1987;45:570-574.
20. Kim HS, Gilland SE. Lactobacillus acidophilus as a dietary adjunct to aid lactose digestion in humans. J Dairy Science 1983;66:959-966.
21. Guyatt G, Sackett D, Adachi J, et al. A clinicians guide for conducting randomised trials in individual patients. CMAJ 1988;139:497.-
22. Ramirez FC, Lee K, Graham DY. All lactase preparations are not the same: results of a prospective, randomized, placebo-controlled trial. Am J Gastroenterol 1994;89:566-570.
Screening for prostate cancer: Who and how often?
- Engage patients in shared decision making by discussing the benefits and risks of prostate cancer screening. Patients who review educational pamphlets before an office visit engage more fully in the decision-making process. (B)
- If performing prostate cancer screening, limit to men with greater than 10 years life expectancy. (B)
- Because the lead time of a diagnosis based on PSA screening is estimated to be 5 to 7 years, PSA screening every other year is unlikely to cause a loss of sensitivity. (B)
- Men with tumors with a Gleason score less than 5 are the best candidates for “watchful waiting,” having a favorable 20-year survival. (B)
Prostate cancer screening in asymptomatic men remains controversial, and it is difficult to present its benefits and risks quickly in a way that is understandable to patients. Yet many expert groups agree that physicians should enter into a mutual decision-making process with patients.1-3
This article reviews the latest information relevant to the controversy, offers “talking points” for family physicians to use when discussing screening with patients, and lists websites that patients may find helpful when making a decision about prostate cancer screening.
For this review, we searched for recent articles that are generalizable to a primary care population and of the highest evidence level available. We preferentially discuss population-based studies, studies from randomized trials of screening, and meta-analyses, rather than results that are hospital- or clinic-based. For a complete systematic review of this topic (from 2002), readers are referred to one conducted for the Agency for Healthcare Research and Quality.4 (See Scope of the problem).
Adenocarcinoma of the prostate is a significant public health burden. Age, family history, and race are the only known risk factors. Most cancers (86%) are diagnosed while still confined to the prostate; however, invasion beyond the capsule is sometimes not apparent until surgery.
Incidence. In 2005, there will be approximately 232,090 new cases of prostate cancer.5 American men have a 17% chance of being diagnosed with prostate cancer; African Americans have a 65% greater risk of developing prostate cancer than Caucasians.6 In fact, African Americans have the highest prostate cancer annual age-adjusted incidence rates in the world: 272/100,000 compared with 164/100,000 for Caucasian Americans.6 The rate for US Asian/Pacific Islander and Hispanic men is less than that for Caucasian Americans.
Mortality. There will be approximately 30,350 prostate cancer deaths in 2004.5 There is 3% chance of dying from prostate cancer; however, the risk of death is about 55% higher for African American men than Caucasian American men.6
Risk factors other than race. Risk of prostate cancer diagnosis increases with age: 1 in 48 men aged 40 to 59 years will be diagnosed with prostate cancer, while 1 in 8 men aged 60 to 79 years are at risk.7 A man who has a first-degree relative with prostate cancer is 2.4 times as likely to be diagnosed with prostate cancer as a man with no affected relatives.8
Key components of the controversy
How effective is screening?
A good screening test does 2 things. First, it detects a disease earlier than it would be detected with no screening at all, and it does so with sufficient accuracy to avoid a large number of false-positive and false-negative results.
Second, it leads to treatment of early disease that will likely produce a more favorable health outcome than waiting to treat patients who have signs and symptoms of disease.9 Unfortunately it is still unclear whether screening tests for prostate cancer meet these 2 criteria.
Skewed numbers. Yes, estimates of false-positive and false-negative results are available from numerous studies of different populations. However, in most studies, only men with abnormal test results receive a biopsy. Men with normal screening test results are not biopsied. Therefore the number of false negatives (and true negatives) is unknown. Furthermore, these estimates are often based on patients from urology clinics, a group more likely to have disease, thereby increasing the positive predictive value of a given screening test.
Whether current screening methods—in particular, prostate-specific antigen (PSA)—identify prostate cancers destined to become clinically relevant is also unknown. If screening does identify such cancers, a decrease in prostate cancer mortality among men who were screened is expected. If it does not, overdiagnosis and treatment of clinically insignificant cancers will negatively impact the quality of men’s lives without extending their life spans.
Clinical variability of the disease
The natural history of prostate cancer is uncertain. If cancer is left unidentified or untreated, more men will die with prostate cancer than of prostate cancer.
Clinically, prostate cancer ranges from an asymptomatic slow-growing tumor to an aggressive cancer with painful metastases. Treatment may be unnecessary at one end of the spectrum and palliative at the other.
The goal of screening is to identify slow-growing tumors destined to extend beyond the prostate while they are confined to the prostate and amenable to treatment, thereby decreasing the risk of prostate cancer morbidity and death.
Usually low morbidity. For a 50-year-old man, the risk of being diagnosed with prostate cancer by age 80 years is 15%; however, the same man has a 1.4% chance of dying of prostate cancer over that 30-year period.7 This 10-fold difference shows that prostate cancer usually is not a fatal illness. Another indication of the often benign nature of the disease is the high percentage of prostate cancers identified at surgery for bladder cancer; up to 40% of specimens contain unsuspected prostate cancer (level of evidence [LOE]: 2c).10,11
Most clinical diagnoses (80%) and prostate cancer deaths (90%) occur among men older than 65 years;6 the median age at diagnosis is 72 years.12 More than 75% of men older than 85 years will have histological prostate cancer (LOE: 2c).13 Many men live with their disease for more than 10 years, but do not die of it (LOE: 2c).12 Additionally, a review of several decision analyses indicates that men 75 years of age and older are not likely to benefit from screening and aggressive treatment (LOE: 2a).14
Hence the recommendation: if performing prostate cancer screening, limit to men with greater than 10 years life expectancy.15
Details of screening tests
Digital rectal examination insufficient
Digital rectal examination (DRE)—palpating the prostate gland to determine size and consistency—is one screening tool for prostate cancer, usually performed in conjunction with PSA testing.15 It is not a difficult or expensive test, but its reproducibility is only fair, even among experienced urologists (LOE: 2b).16
The sensitivity and specificity of DRE can only be estimated because men with a normal finding on DRE are not routinely biopsied in any studies (TABLE 1).17,18 One of two pertinent meta-analyses18 included studies that followed men with a negative DRE finding for development of prostate cancer (LOE: 2a). Both meta-analyses of DRE as a screening tool found that the included studies were heterogeneous in their study populations and definition of abnormal DRE test result (LOE: 2a). The positive predictive value (PPV) of DRE was 28% in one meta-analysis and 18% in the other.
TABLE 1
Characteristics of screening tests for prostate cancer
| TEST/SOURCE | DESCRIPTION (LEVEL OF EVIDENCE) | SN ESTIMATE (%) | SP ESTIMATE (%) | LIKELIHOOD RATIO | PPV (%) |
|---|---|---|---|---|---|
| Abnormal DRE18 | Meta-analysis of studies that performed biopsies for abnormal DRE (2a) | 59 (51%–67%) | 94 (91%–96%) | + 9.8 – 0.4 | 28 (20–36) |
| Abnormal DRE17 | Meta-analysis of studies that performed biopsies for abnormal DRE or PSA (2a) | 53.2 | 83.6 | + 3.24 – 0.56 | 17.8 |
| PSA >4 ng/mL12 | Review of multiple cohort studies with diverse populations, not systematic | Mean = 71 | Mean = 75 | + 2.8 – 0.30 | 37 |
| PSA >4 ng/mL19 | Longitudinal retrospective study of prostate cancers that developed within 2 years of PSA test (3b) | 73.2 | 85.4 | + 5.0 – 0.2 | |
| PSA >4 ng/mL20 | Nested case-control study of prostate cancers that developed within 5 years of PSA test in a cohort study (3b) | 86 | 94 | + 14.3 – 0.15 | |
| PSA > 4 ng/mL17 | Meta-analysis of studies that performed biopsies for abnormal PSA or DRE (2a) | 72.1 | 93.2 | + 10.2 – 0.30 | 25.1 |
| Sn, sensitivity; Sp, specificity; PPV, positive predictive value; | |||||
| PSA, prostate-specific antigen; DRE, digital rectal examination. | |||||
Prostate-specific antigen: Improving its clinical usefulness
Prostate-specific antigen (PSA), first detected in serum in 1979, is a protein produced by prostate epithelial cells. It was originally used to follow men treated for prostate cancer for evidence of recurrence. In the late 1980s, it became widely used in the US to screen for prostate cancer.
An elevated PSA level is suggestive but not diagnostic of prostate cancer. Elevated levels also occur with advancing age, increased prostate size, and prostatitis, and following ejaculation. Prostate manipulation such as biopsy and surgery (but not digital examination) also elevates PSA.
Customary cutpoint. An abnormal serum PSA level is commonly regarded as 4 ng/mL or greater. At this cutpoint, most studies report sensitivity for cancer of around 70%, with more variability in specificity (TABLE 1). Again, in most studies that report sensitivity and specificity, men with a PSA level less than 4 ng/mL did not undergo prostate biopsy; therefore, the number of false negatives and true negatives are only estimates.
In nested case-control studies of longitudinal cohorts, eligible cases were defined by the length of time between an abnormal PSA result and prostate cancer diagnosis, while controls were men who were not diagnosed with prostate cancer during the same time period (however, a biopsy was not usually performed). The PPV of an abnormal PSA level is estimated at 25% to 37%. As a comparison, the PPV of a positive mammogram finding for women 50 to 59 years is 4% to 9%, and 10% to 19% for women age 60 to 69.21
Suggested strategies to improve PSA accuracy. Approximately 70% of men with an elevated serum PSA level do not have cancer. To decrease the number of unnecessary biopsies, experts have suggested several strategies:
- using DRE with PSA
- calculating a ratio of free PSA (unbound to protein) or complexed PSA (bound to protein) to total PSA
- measuring PSA density, which incorporates the volume of the prostate gland and is subject to observer variability in prostate volume measurement
- recording PSA velocity, which is the annual rate of change in PSA level and requires 3 or more measurements.
Revise the cutpoint? The cutpoint of 4 ng/mL has been deemed too high by some clinicians. A recent report of men enrolled in a large prostate cancer prevention trial found that among the 9459 men receiving placebo, 2950 had a PSA level of 4 ng/mL or less and had normal prostates on DRE (LOE: 1b).22 All 2950 underwent a prostate biopsy; 449 (15.2%) were positive for cancer. Nearly 30% of those had a PSA level of 2 ng/mL or less.
Approximately 25% of tumors in men referred for biopsy because of abnormal PSA or DRE findings are thought to be discovered by chance due to the biopsy procedure and the high prevalence of disease (LOE: 2c).23 Furthermore, a recent study indicates that annual PSA fluctuation is substantial; 45% of men who initially had a value of 4 ng/mL or greater, subsequently had a normal level (LOE: 2b).24 Isolated abnormal levels should be confirmed before referral for biopsy.
Identifying clinically relevant cancers
The continued controversy around PSA screening relates to the potential over-diagnosis of localized prostate cancers that are not likely to become clinically significant. The ideal screening test would predictably identify cancers likely to progress.
Screening over-detects
Several computer simulations have estimated the amount of over-detection of prostate cancer. The National Cancer Institute’s Surveillance, Epidemiology and End Results (SEER) registry data demonstrated that the proportion of prostate cancer found through PSA testing that otherwise would not have been diagnosed in the patient’s lifetime was 29% for white men and 44% for black men (LOE: 2c).25
An Italian study found that the proportional excess of cancers detected by screening over those that would have been expected in the absence of screening is greater than 50% (LOE: 2c).26
Finally, a model based on results from the European randomized study of prostate cancer screening estimated that a screening program with a 4-year interval from age 55 to 67 has an over-detection rate of 48% (cancers that would not have been diagnosed in the absence of screening) (LOE: 2c).27 Additionally, the authors determined that such screening might advance prostate cancer diagnosis by at least 10 years. Previous estimates of diagnosis lead time have been in the 5- to 7-year range (LOE: 2b).28 These findings indicate that screening intervals of 2 to 4 years are unlikely to cause a loss of sensitivity.
Spread of tumor
Spread of the tumor beyond the prostate capsule is a poor prognostic sign.29 Unfortunately, this occurrence is often not known until surgery, and the result usually is an “up-staging” between clinical diagnosis and pathological diagnosis. Nevertheless, most cancers (86%) diagnosed between 1992 and 1999 were localized to the prostate.6 Because these cancers have not spread beyond the prostate at the time of diagnosis, they are more likely to be curable. They are also more likely to represent tumors that may grow so slowly that the host will die of something other than prostate cancer.
Gleason score
Gleason score is another predictor of cancers destined to become clinically relevant (FIGURE 1). A Gleason score of 7 or greater denotes moderate to poor cellular differentiation and indicates a greater potential for progression than lower Gleason values.29 A recent long-term follow-up report on a cohort of men with localized cancer treated conservatively demonstrated that men with low-grade tumors (Gleason score 2–4) have a minimal risk of dying from prostate cancer after 20 years, while men with high-grade tumors (Gleason score of 8–10) have high probability of prostate cancer death within 10 years of diagnosis (LOE: 2b).30 Ecological31 and clinical studies32 indicate that a substantial proportion of PSA-detected cancers are moderately differentiated. This is especially true in a first round of screening; as in the European randomized study of screening, where 36% of cancers were Gleason score 7 or higher (LOE: 1b).33
FIGURE 1
Calculating the Gleason score
The Gleason score is based on the level of differentiation and growth pattern of prostate cancer cells. Cancer cells that closely resemble the normal prostate cells when viewed under low-power magnification are well differentiated. Cancer cells that do not retain the structure of the surrounding normal cells are poorly differentiated. Scores range from 1 to 5.
In examining histologic samples of a patient’s prostate tissue, the pathologist will identify the 2 most commonly occurring patterns (types of differentiation) among the cancer cells and assign a numerical value to each pattern. The 2 numbers are then added to yield the final Gleason score. If a single pattern dominates, the pathologist will simply double the corresponding value.
Total scores range from 2 to 10. Scores in the range of 2–4 are considered well-differentiated, 5–7 are moderately differentiated, and 8–10 are poorly differentiated. In general, the higher the score, the worse the prognosis. Men with well-differentiated tumors that are treated conservatively have minimal risk of dying from prostate cancer.
Is declining mortality a sign of screening success?
Prostate cancer mortality has been declining since the mid-1990s in numerous parts of the world; the US,6,34 Canada,35 Australia,36 and the United Kingdom37 have all reported a reduction in the rate of prostate cancer deaths. Advocates of PSA screening point to this trend as evidence of the effectiveness of screening. But such ecological data are difficult to interpret. For instance, although much less PSA screening is performed in the UK, mortality trends are similar to those in the US where PSA testing has been used more widely.38
Aggressive screening not necessarily the reason. In the US, 2 geographic areas—Seattle, Washington and Connecticut—provided a natural experiment to compare the effect of aggressive screening on prostate cancer mortality (LOE: 2c).39 Although more aggressive screening and treatment took place in the Seattle area, prostate cancer mortality rates were similar to those in Connecticut over 11 years of follow-up. Similarly, in a study in British Columbia, prostate cancer mortality from 1985 to 1999 was not associated with the intensity of PSA screening (LOE: 2c).40
Other possible explanations. If the mortality decrease is not related to PSA screening, what could cause it? One explanation is “attribution bias.” Death certificate misattribution of cause of death from prostate cancer may partially explain the pattern of increasing, then decreasing mortality rates (LOE: 2c).41 Improvement in prostate cancer treatment, especially for advanced stage, and in particular hormone therapy, is another possible explanation for the decreasing prostate cancer mortality (LOE: 2c).14,42
Benefits of screening
The benefit of any effective screening test is a decrease in the risk of the screened-disease mortality. The best way to demonstrate decreased risk is through a randomized controlled study of the screening test, and 2 such trials are underway for prostate cancer. In the meantime, a decision model estimates that aggressive treatment of organ-confined disease potentially adds 3 years of life for men in their fifties, 1.5 years for men in their sixties, and 0.4 years for men in their seventies (LOE: 2c).3
Others have concluded that 25 men with clinically detected prostate cancer would need to be treated with surgery to prevent 1 prostate cancer death during a 6-year period, without evidence that quality of life is improved (LOE: 2c).43
Consider quality of life. With uncertainty surrounding improvement in the quantity of life as a result of prostate cancer screening, improved quality of life may be an issue for patients. Focus group research has demonstrated that some patients believe it is better to know if a cancer is present than to wonder if it will be diagnosed when it is too late for cure.44
General quality of life has been found to be similar among men treated for prostate cancer and age-matched controls without prostate cancer; however, urinary, sexual, and bowel function vary substantially between treated and untreated men and by treatment type (LOE: 3b) (TABLE 2).45,46 In general, men treated with radical prostatectomy and brachytherapy often report better general quality of life than men who undergo radiation treatment, despite having more urinary and sexual problems (LOE: 2b).47,48
TABLE 2
Estimates of risk associated with specific prostate cancer treatments 12 months or more after treatment
| TREATMENT OUTCOMES | RADICAL PROSTATECTOMY (%) | EXTERNAL BEAM RADIATION (%) | BRACHY-THERAPY* (%) | ANDROGEN DEPRIVATION THERAPY (%) | UNTREATED (%) |
|---|---|---|---|---|---|
| Death within 2 months of treatment | 0.5–0.7 | 0.2–0.5 | 0.2–0.5 | ||
| Urinary problems: | |||||
| Incontinence | 10–50 | 2–16 | 6–16 | ||
| Wearing pads | 5–32 | 2–12 | 2–16 | ||
| Urinary bother† | 4–20 | 3–15 | 3–16 | ||
| Sexual problems: | |||||
| Impotence | 50–80‡ | 30–60 | 20–60** | 70–92 | 20–50 |
| Sexual bother | 10–40 | 10–30 | 10–18 | 25–38 | 10–32 |
| Bowel problems: | |||||
| Bowel problems§ | 9–15 | 6–35 | 4–20 | ||
| Loose stools/diarrhea | 15–21 | 6–37 | 4–10 | ||
| Bowel bother | 1–3 | 4–12 | 2–10 | ||
| Other symptoms | Breast swelling: 5–25 | ||||
| Hot flashes: 50–60 | |||||
| * Fewer studies on brachytherapy are available, especially those with long-term follow-up; therefore, these findings are less certain than other entries. | |||||
| ‡ Includes nerve-sparing prostatectomy. | |||||
| † EBRT and brachytherapy patients are more likely to experience irritative voiding symptoms (i.e. dysuria, urgency and hesitancy and noctoria), while RP patients are more likely to experience incontinence. | |||||
| ** Impotence risk gradually increases with time after treatment. | |||||
| § Includes symptoms such as painful bowel movement and urgency | |||||
| Sources:references 14, 50–53, 65–71. | |||||
Harms of screening
The chances of undergoing a biopsy based on an abnormal screening PSA are estimated at 15% to 40% depending on the patient’s age (FIGURE 2).3 There are adverse effects associated with transrectal biopsy of the prostate. In 2 large population-basedstudies of screening, the most frequent complications were hematuria and hematospermia (LOE: 1b, 2b) (TABLE 3), with more serious consequences such as sepsis and hospitalization occurring in fewer than 1% of patients. A study of 100 screened men with an abnormal PSA who underwent prostate biopsy found that although 69% felt moderate to severe pain with the biopsy, 80% would be willing to undergo a repeat biopsy (LOE: 1b).49
Treatment options. If the biopsy result is positive, the most common treatment options for localized cancer—which represents over 80% of all prostate cancers diagnosed6—include radical prostatectomy, external beam radiation therapy, brachytherapy (internal radiation therapy) or expectant management (watchful waiting). Population-based studies have reported outcomes for these treatment options (TABLE 2). Outcomes derived from hospital-based series of other prostate cancer treatments, such as cryotherapy and 3-dimensional radiation, are available, but the estimates often reflect the experience of only a few hospitals and are not representative of other facilities. Androgen ablation is the standard treatment for metastatic prostate cancer.
Untoward effects of treatment. Approximately 60% of radical prostatectomy patients report some incontinence 12 months or more after surgery (LOE: 2b),50,51 and about 30% of patients need to wear pads for urine leakage (LOE: 2b).50-53 Men undergoing radiation therapy have less urinary incontinence, but about 30% complain of diarrhea and loose stools (LOE: 2b).51,52 Both therapies are associated with a high percentage of erectile dysfunction: approximately 60% of radiation therapy patients and 75% of surgery patients report their erections are not firm enough for intercourse (LOE: 2b).51,52
Expectant management (following the cancer with regular PSA and ultrasound testing) is sometimes difficult to “sell” to patients whose fear of cancer dictates that the only logical response is to “cut it out.”44 A recent randomized trial indicated that radical prostatectomy lowers prostate cancer mortality, local progression, distant metastasis, and overall survival as compared with watchful waiting over a median of 8.2 years of follow-up (LOE: 1b).54 However, these results may have little relevance to prostate cancer screening since only 5% of the cancers were screen-detected and 76% were palpable.
FIGURE 2
Yield of screening 1000 men for prostate cancer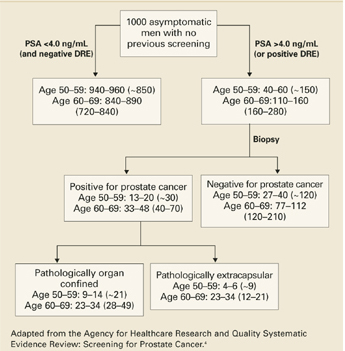
TABLE 3
Percentage of patients with specific complication of transrectal prostate biopsy
| CONDITION | TYROL STUDY63 | EUROPEAN RANDOMIZED STUDY OF SCREENING 64 |
|---|---|---|
| Gross hematuria >1 day | 12.5% | 22.6% |
| Hematospermia | 29.8% | 50.4% |
| Significant pain | 4.0% | 7.5% |
| Rectal bleeding | 0.6% | 1.3% |
| Nausea | 0.8% | 0.3% |
| Fever >38.5°C | 0.8% | 3.5% |
| Epididymitis | 0.7% | 0.07% |
| Sepsis | 0.3% | Not available |
| Hospitalization | Not available | 0.5% |
| Tyrol study63: LOE: 2b, N=6024 biopsies; ERSS study64: LOE: 1b, N=5802 biopsies. | ||
Recommendations from expert groups
Different expert groups have conflicting recommendations. Both the American Urological Association and the American Cancer Society recommend annual PSA screening starting at age 50 for most men; younger if risk factors are present. Groups that are evidence based tend to recommend a shared decision making process with patients. The AAFP and American College of Physicians advise physicians to counsel men on the known risks and uncertain benefits of screening for prostate cancer. The US Preventive Services Task Force 2002 update concluded that evidence is insufficient to recommend for or against routine screening for prostate cancer using PSA or DRE. The National Cancer Institute cites a lack of evidence to determine a net benefit for PSA or DRE screening.
When will we know more?
Only 1 randomized controlled trial of prostate cancer screening has been completed55: 46,193 men were randomized to either PSA and DRE or no screening from 1989 to 1996. The study had methodological problems; for instance, only 23% of the group randomized to screening was screened. The investigators in the trial have interpreted its results as demonstrating a decrease in prostate cancer deaths in the screened group compared with the unscreened group (15 vs 48.7 per 100,000 man-years).55 Others have criticized the statistical analysis and calculated the results using an “intent to screen” analysis, finding no difference in prostate cancer deaths between the 2 groups.3,56
Two randomized controlled trials of screening are ongoing: the National Cancer Institute’s Prostate, Lung, Colon, Ovarian (PLCO) Screening Trial57 and the European Randomized Study of Screening for Prostate Cancer.58 Both were started in the mid-1990s and will not have results available for a few more years. Also underway is a randomized trial of intervention (radical prostatectomy) versus expectant management, called the Prostate Cancer Intervention Versus Observation Trial (PIVOT).59
Counseling recommendations
However, providing men with information on prostate cancer screening before they discussed it with their family physician, rather than after the visit, resulted in patients having a significantly more active role in making a screening decision, and lower levels of decisional conflict (LOE: 2b).61 Informational pamphlets are available through the AAFP and CDC websites listed in TABLE 4. Additional websites containing prostate cancer screening information are found in TABLE 4. We also provide a bullet item list of key points for discussion with patients (TABLE 5), which can be used along with the balance sheet provided here (TABLE 2).
Shared decision-making is not an easy or quick process. Yet, the majority of patients will benefit from the discussion, regardless of the final decision. Of course, there are instances when a shared decision-making process is well-documented, and still results in an undesirable outcome;62 however, while the evidence for screening remains controversial, patients have the right to know that those controversies exist and why they exist.
TABLE 4
Useful websites for patients to find prostate cancer screening information
| CENTERS FOR DISEASE CONTROL AND PREVENTION |
| www.cdc.gov/cancer/prostate/decisionguide/index.htm |
| 10th grade reading level* |
| Good coverage of screening and treatment controversies |
| Offers downloadable PDF version |
| NATIONAL CANCER INSTITUTE |
| cis.nci.nih.gov/asp/FactSheetPub/AlphaSubList.asp?alpha=47 |
| 10th grade reading level |
| FAQ format |
| Offers Spanish version |
| AMERICAN CANCER SOCIETY |
| www.cancer.org/docroot/CRI/content/CRI_2_4_3X_Can_prostate_ cancer_be_found_early_36.asp |
| 12th grade reading level |
| Lacks discussion of treatment options and their side effects |
| Biased in favor of screening but acknowledges that other distinguished organizations are not |
| AMERICAN UROLOGICAL ASSOCIATION |
| www.urologyhealth.org/adult/index.cfm?cat=09 |
| 12th grade reading level |
| Easy to navigate among screening and specific treatment pages |
| Biased in favor of PSA screening |
| AMERICAN ACADEMY OF FAMILY PHYSICIANS |
| familydoctor.org/healthfacts/361/ |
| 11th grade reading level |
| Question/answer format |
| Very straightforward, lacks depth |
| www.aafp.org/x19519.xml |
| 7th grade reading level |
| Separate information sheet for patients and physicians |
| Presents possible outcomes of PSA test and prostate cancer treatment in easy-to-follow format |
| WEBMD |
| my.webmd.com/medical_information/condition_centers/prostate_cancer/default.htm |
| 9th grade reading level |
| Question/answer format |
| Specifically addresses false negative and positives with current estimates |
| DARTMOUTH CENTER FOR SHARED DECISION MAKING |
| www.dhmc.org/dhmc-internet-upload/file_collection/PSA.pdf |
| 6th grade reading level |
| Well-designed, simple presentation of pros and cons of PSA testing |
| *Fleish-Kincaid grade level score based on average sentence length and average number of syllables per word. |
TABLE 5
Talking points for patients and physicians
| Prostate cancer is an important men’s health problem |
| Screening may prevent early prostate cancer death |
| DRE alone has little value as a screening test |
| Age, prostate size, prostatitis, ejaculation, prostate biopsy, and prostate surgery can cause a falsely elevated PSA test |
| Approximately 70% of men with an elevated serum PSA do not have cancer |
| The percentage of PSA screening false negatives ranges from 10%–22% in large studies |
| If the test is abnormal, a biopsy will be recommended |
| If the biopsy is positive, treatment options will be given |
| Many men experience long-term urinary incontinence and impotence related to their treatment |
CORRESPONDING AUTHOR
Kendra Schwartz, MD, MSPH, 101 E. Alexandrine, Detroit, MI 48201, E-mail: [email protected]
1. American Academy of Family Physicians. Summary of recommendation for periodic health examinations. August 2002. Available at: www.aafp.org/PreBuilt/PHERev5.30802.pdf. Accessed on June 10, 2005.
2. US Preventive Services Task Force. Screening for Prostate Cancer. 2002. Available at: www.ahrq.gov/clinic/uspstf/uspsprca.htm. Accessed on June 10, 2005.
3. American College of Physicians. Screening for prostate cancer. Position paper. Clinical Guideline: Part III. Ann Intern Med 1997;126:480-484.
4. Harris R, Lohr K, Beck R, Fink K, Godley P, Bunton A. Screening for prostate cancer. Systematic Evidence Review for AHRQ. Available at: www.ahrq.gov/uspstfix.htm. Accessed on June 10, 2005.
5. American Cancer Society. Cancer statistics 2005. CA Cancer J Clin 2005;55:10-30.
6. Ries L, Eisner M, Kosary C, et al. SEER Cancer Statistics Review, 1975–2000. Bethesda, Md: National Cancer Institute; 2003. Available at seer.cancer.gov/csr/1975_2002/. Accessed on June 10, 2005.
7. DevCan: Probability of dying of cancer [computer program]. Version 5.1. Bethesda, Md: National Cancer Instititute; 2003. Available at: srab.cancer.gov/devcan/. Accessed on June 10, 2005.
8. Neal DE, Leung HY, Powell PH, Hamdy FC, Donovan JL. Unanswered questions in screening for prostate cancer. Eur J Cancer 2000;36:1316-1321.
9. US Preventive Services Task Force. Guide to Clinical Preventive Services. 2nd ed. Alexandria, Va: International Medical Publishing; 1996.
10. Kabalin J, McNeal J, Price H, Freiha F, Stamey T. Unsuspected adenocarcinoma of the prostate in patients undergooing cystoprostatectomy for other causes: incidence, histology and morphometric observations. J Urol 1989;141:1091-1094.
11. Montie J, Wood DJ, Pontes J, Boyett J, Levin H. Adenocarcinoma of the prostate in cystoprostatectomy specimens removed for bladder cancer. Cancer 1989;63:381-385.
12. Bunting PS. Screening for prostate cancer with prostate-specific antigen: beware the biases. Clin Chim Acta 2002;315:71-97.
13. Gronberg H. Prostate cancer epidemiology. Lancet 2003;361:859-864.
14. Harris R, Lohr KN. Screening for prostate cancer: an update of the evidence for the U.S. Preventive Services Task Force. Ann Intern Med 2002;137:917-929.
15. American Cancer Society. ACS Cancer Detection Guidelines. Available at: www.cancer.org/docroot/PED/content/PED_2_3X_ACS_Cancer_Detection_Guidelines _36.asp. Accessed June 10, 2005.
16. Smith D, Catalona W. Interexaminer variability of digital rectal examination in detecting prostate cancer. Urology 1995;45:70-74.
17. Kishor M, Cable G. Meta-analysis of prostate-specific antigen and digital rectal examination as screening tests for prostate carcinoma. J Am Board Fam Pract 2003;16:95-101.
18. Hoogendam A, Buntix F, deVet HCW. The diagnostic value of digital rectal examination in primary care screening for prostate cancer: a meta-analysis. Fam Pract 1999;16:621-626.
19. Gann PH, Hennekens CH, Stampfer MJ. A prospective evaluation of plasma prostate-specific antigen for detection of prostatic cancer. JAMA 1995;273:289-294.
20. Hakama M, Stenman UH, Aromaa A, Leinonen J, Hakulinen T, Knekt I. Validity of the prostate specific antigen test for prostate cancer screening: followup study with a bank of 21,000 sera in Finland. J Urol 2001;166:2189-2191.
21. Humphrey L, Helfand M, Chan B, Woolf S. Breast cancer screening: summary of the evidence. Ann Intern Med 2002;137:344-346.
22. Thompson I, Pauler D, Goodman P, et al. Prevalence of prostate cancer among men with a prostate-specific antigen level <4 ng per milliliter. N Engl J Med 2004;350:2239-2246.
23. Collins MM, Ransohoff D, MJ Barry. Early detection of prostate cancer-serendipity strikes again. JAMA 1997;278:1516-1519.
24. Eastham J, Riedel E, Scardino P, et al. Variation of serum prostate-specific antigen levels. An evaluation of year-to-year fluctuations. JAMA 2003;289:2695-2700.
25. Etzioni R, Penson DF, Legler JM, et al. Overdiagnosis due to prostate-specific antigen screening: lessons from U.S. prostate cancer incidence trends. J Natl Cancer Inst 2002;94:981-990.
26. Zappa M, Ciatto S, Bonardi R, Mazzotta A. Overdiagnosis of prostate carcinoma by screening: an estimate based on the results of the Florence Screening Pilot Study. Ann Oncol 1998;9:1297-1300.
27. Draisma G, Boer R, Otto S, et al. Lead times and overdetection due to prostate-specific antigen screening: estimates from the European randomized study of screening for prostate cancer. J Natl Cancer Inst 2003;95:868-878.
28. Auvin A, Maattanen L, Stenman UH, et al. Lead-time in prostate cancer screening (Finland). Cancer Causes Control 2002;13:279-285.
29. Gleason D, Mellinger G. Group at VACUR. Prediction of prognosis for prostatic adenocarcinoma by combined histological grading and clinical staging. J Urol 1974;111:58-64.
30. Albertson PC, Hanley JA, Fine J. 20-Year outcomes following conservative management of clinically localized prostate cancer. JAMA 2005;293:2095-2101.
31. Schwartz K, Grignon D, Sakr W, Wood DJ. Prostate cancer histologic trends in the metropolitan Detroit are, 1982 to 1996. Urology 1999;53:769-774.
32. Smith D, Catalona W. The nature of prostate cancer detected through prostate specific antigen based screening. J Urol 1994;152:1732-1736.
33. Hoedemaeker RF, van der Kwast T, Boer R, et al. Pathological features of prostate cancer found at population-based screening with a four-year interval. J Natl Cancer Inst 2001;93:1153-1158.
34. Chu KC, Tarone RE, Freeman HP. Trends in prostate cancer mortality among black men and white men in the United States. Cancer 2003;97:1507-1516.
35. National Cancer Institute of Canada. Canadian cancer statistics 2001. Toronto: National Cancer Institute of Canada; 2001. Available at: www.ncic.cancer.ca. Accessed June 10, 2005.
36. Coory M, Baade P. Mortality from prostate cancer is decreasing. Med J Aust 2002;176:345-345.
37. Majeed A, Babb P, Jones J, Quinn M. Trends in prostate cancer incidence, mortality and survival in England and Wales, 1971–1998. BJU Int 2000;85:1058-1062.
38. Oliver S, Gunnell D, Donovan J. Comparison of trends in prostate-cancer mortality in England and Wales and the USA. Lancet 2000;355:1788-1789.
39. Lu-Yao G, Albertsen PC, Stanford JL, Stukel TA, Walker-Corkery ES, Barry MJ. Natural experiment examining impact of aggressive screening and treatment on prostate cancer mortality in two fixed cohorts from Seattle area and Connecticut. BMJ 2002;325:740.-
40. Coldman A, Phillips N, Pickles T. Trends in prostate cancer incidence and mortality: an analysis of mortality change by screening intensity. CMAJ 2003;168:31-35.
41. Feuer EJ, Merrill RM, Hankey BF. Cancer surveillance series: interpreting trends in prostate cancer—part II: Cause of death misclassification and the recent rise and fall in prostate cancer mortality. J Natl Cancer Inst 1999;91:1025-1032.
42. Frankel S, Smith GD, Donovan J, Neal D. Screening for prostate cancer. Lancet 2003;361:1122-1128.
43. Partin MR, Wilt TJ. Informing patients about prostate cancer screening: identifying and meeting the challenges while the evidence remains uncertain. Am J Med 2002;113:691-693.
44. McFall SL, Hamm RM. Interpretation of prostate cancer screening events and outcomes: a focus group study. Patient Educ Couns 2003;49:207-218.
45. Litwin MS, Hays RD, Fink A, et al. Quality-of-life outcomes in men treated for localized prostate cancer. JAMA 1995;273:129-135.
46. Penson DF, Litwin MS. Quality of life after treatment for prostate cancer. Curr Urol Rep 2003;4:185-195.
47. Lubeck DP, Litwin MS, Henning JM, Stoddard ML, Flanders SC, Carroll PR. Changes in the health-related quality of life in the first year after treatment for prostate cancer: results from CaPSURE. Urology 1999;53:180-186.
48. Bacon C, Giovannucci E, Testa M, Kawachi I. The impact of cancer treatment on quality of life outcomes for patients with localized prostate cancer. J Urol 2001;166:1804-1810.
49. Makinen T, Auvinen A, Hakama M, Stenman UH, Tammela TL. Acceptability and complications of prostate biopsy in population-based PSA screening versus routine clinical practice: a prospective, controlled study. Urology 2002;60:846-850.
50. Fowler FJ, Jr, Barry MJ, Lu-Yao G, Roman A, Wasson J, Wennberg JE. Patient-reported complications and follow-up treatment after radical prostatectomy. The National Medicare Experience: 1988-1990 (updated June 1993). Urology 1993;42:622-629.
51. Schwartz K, Bunner S, Bearer R, Severson RK. Complications from treatment for prostate carcinoma among men in the Detroit area. Cancer 2002;95:82-89.
52. Potosky AL, Legler J, Albertsen PC, et al. Health outcomes after prostatectomy or radiotherapy for prostate cancer: results from the Prostate Cancer Outcomes Study. J Natl Cancer Inst 2000;92:1582-1592.
53. Sebesta M, Cespedes RD, Luhman E, Optenberg S, Thompson IM. Questionnaire-based outcomes of urinary incontinence and satisfaction rates after radical prostatectomy in a national study population. Urology 2002;60:1055-1058.
54. Bill-Axelson A, Holmberg L, Ruutu M, et al. Radical prostatectomy versus watchful waiting in early prostate cancer. N Engl J Med 2005;352:1977-1184.
55. Labrie F, Candas B, Dupont A, et al. Screening decreases prostate cancer death: first analysis of the 1988 Quebec prospective randomized controlled trial. Prostate 1999;38:83-91.
56. Alexander FE, Prescott RJ. Reply to Labrie et al. Results of the mortality analysis of the Quebec randomized controlled trial (RCT). Prostate 1999;40:135-137.
57. Prorok P, Andriole G, Bresalier R, et al. Design of the Prostate, Lung, Colorectal and Ovarian (PLCO) Cancer Screening Trial. Control Clin Trials 2000;21:273S-309S.
58. Standaert B, Denis L. The European Randomized Study of Screening for Prostate Cancer: an update. Cancer 1997;80:1830-1834.
59. Wilt TJ, Brawer M. The Prostate Cancer Intervention Versus Observation Trial: a randomized trial comparing radical prostatectomy versus expectant management for the treatment of clinically localized prostate cancer. J Urol 1994;152:1910-1914.
60. Schapira M, VanRuiswyk J. The effect of an illustrated pamphlet decision-aid on the use of prostate cancer screening tests. J Fam Pract 2000;49:418-424.
61. Davison B, Kirk P, Degner L, Hassard T. Information and patient participation in screening for prostate cancer. Patient Educ Couns 1999;37:255-263.
62. Merenstein D. Winners and losers. JAMA 2004;291:15-16.
63. Horninger W, Berger A, Pelzer A, et al. Screening for prostate cancer: updated experience from the Tyrol study. Current Urol Reports 2004;5:220-225.
64. Raaijmakers R, Kirkels WJ, Roobol MJ, Wildhagen MF, Schrder FH. Complication rates and risk factors of 5802 transrectal ultrasound-guided sextant biopsies of the prostate within a population-based screening program. Urology 2002;60:826-830.
65. Fowler F, Barry MJ, Lu-Yao G, Wasson J, Bin L. Outcomes of external beam radiation therapy for prostate cancer: a study of Medicare beneficiaries in three Surveillance, Epidemiology, and End Results areas. J Clin Oncol 1996;14:2258-2265.
66. Hollenbeck BK, Dunn RL, Wei JT, Sandler HM, Sanda MG. Sexual health recovery after prostatectomy, external radiation, or brachytherapy for early stage prostate cancer. Curr Urol Rep 2004;5:212-219.
67. Potosky AL, Knopf K, Clegg LX, et al. Quality-of-life outcomes after primary androgen deprivation therapy: results from the Prostate Cancer Outcomes Study. J Clin Oncol 2001;19:3750-3757.
68. Lee R, Penson DF. Treatment outcomes in localized prostate cancer: a patient-oriented approach. Semin Urol Oncol 2002;20:63-73.
69. Stanford JL, Feng Z, Hamilton AS, et al. Urinary and sexual function after radical prostatectomy for clinically localized prostate cancer: the Prostate Cancer Outcomes Study. JAMA 2000;283:354-360.
70. Robinson JW, Moritz S, Fung T. Meta-analysis of rates of erectile function after treatment of localized prostate carcinoma. Int J Radiat Oncol Biol Phys 2002;54:1063-1068.
71. Coley CM, Barry MJ, Fleming C, Fahs MC, Mulley AG. Early detection of prostate cancer. Part II: Estimating the risks, benefits, and costs. American College of Physicians. Ann Intern Med 1997;126:468-479.
- Engage patients in shared decision making by discussing the benefits and risks of prostate cancer screening. Patients who review educational pamphlets before an office visit engage more fully in the decision-making process. (B)
- If performing prostate cancer screening, limit to men with greater than 10 years life expectancy. (B)
- Because the lead time of a diagnosis based on PSA screening is estimated to be 5 to 7 years, PSA screening every other year is unlikely to cause a loss of sensitivity. (B)
- Men with tumors with a Gleason score less than 5 are the best candidates for “watchful waiting,” having a favorable 20-year survival. (B)
Prostate cancer screening in asymptomatic men remains controversial, and it is difficult to present its benefits and risks quickly in a way that is understandable to patients. Yet many expert groups agree that physicians should enter into a mutual decision-making process with patients.1-3
This article reviews the latest information relevant to the controversy, offers “talking points” for family physicians to use when discussing screening with patients, and lists websites that patients may find helpful when making a decision about prostate cancer screening.
For this review, we searched for recent articles that are generalizable to a primary care population and of the highest evidence level available. We preferentially discuss population-based studies, studies from randomized trials of screening, and meta-analyses, rather than results that are hospital- or clinic-based. For a complete systematic review of this topic (from 2002), readers are referred to one conducted for the Agency for Healthcare Research and Quality.4 (See Scope of the problem).
Adenocarcinoma of the prostate is a significant public health burden. Age, family history, and race are the only known risk factors. Most cancers (86%) are diagnosed while still confined to the prostate; however, invasion beyond the capsule is sometimes not apparent until surgery.
Incidence. In 2005, there will be approximately 232,090 new cases of prostate cancer.5 American men have a 17% chance of being diagnosed with prostate cancer; African Americans have a 65% greater risk of developing prostate cancer than Caucasians.6 In fact, African Americans have the highest prostate cancer annual age-adjusted incidence rates in the world: 272/100,000 compared with 164/100,000 for Caucasian Americans.6 The rate for US Asian/Pacific Islander and Hispanic men is less than that for Caucasian Americans.
Mortality. There will be approximately 30,350 prostate cancer deaths in 2004.5 There is 3% chance of dying from prostate cancer; however, the risk of death is about 55% higher for African American men than Caucasian American men.6
Risk factors other than race. Risk of prostate cancer diagnosis increases with age: 1 in 48 men aged 40 to 59 years will be diagnosed with prostate cancer, while 1 in 8 men aged 60 to 79 years are at risk.7 A man who has a first-degree relative with prostate cancer is 2.4 times as likely to be diagnosed with prostate cancer as a man with no affected relatives.8
Key components of the controversy
How effective is screening?
A good screening test does 2 things. First, it detects a disease earlier than it would be detected with no screening at all, and it does so with sufficient accuracy to avoid a large number of false-positive and false-negative results.
Second, it leads to treatment of early disease that will likely produce a more favorable health outcome than waiting to treat patients who have signs and symptoms of disease.9 Unfortunately it is still unclear whether screening tests for prostate cancer meet these 2 criteria.
Skewed numbers. Yes, estimates of false-positive and false-negative results are available from numerous studies of different populations. However, in most studies, only men with abnormal test results receive a biopsy. Men with normal screening test results are not biopsied. Therefore the number of false negatives (and true negatives) is unknown. Furthermore, these estimates are often based on patients from urology clinics, a group more likely to have disease, thereby increasing the positive predictive value of a given screening test.
Whether current screening methods—in particular, prostate-specific antigen (PSA)—identify prostate cancers destined to become clinically relevant is also unknown. If screening does identify such cancers, a decrease in prostate cancer mortality among men who were screened is expected. If it does not, overdiagnosis and treatment of clinically insignificant cancers will negatively impact the quality of men’s lives without extending their life spans.
Clinical variability of the disease
The natural history of prostate cancer is uncertain. If cancer is left unidentified or untreated, more men will die with prostate cancer than of prostate cancer.
Clinically, prostate cancer ranges from an asymptomatic slow-growing tumor to an aggressive cancer with painful metastases. Treatment may be unnecessary at one end of the spectrum and palliative at the other.
The goal of screening is to identify slow-growing tumors destined to extend beyond the prostate while they are confined to the prostate and amenable to treatment, thereby decreasing the risk of prostate cancer morbidity and death.
Usually low morbidity. For a 50-year-old man, the risk of being diagnosed with prostate cancer by age 80 years is 15%; however, the same man has a 1.4% chance of dying of prostate cancer over that 30-year period.7 This 10-fold difference shows that prostate cancer usually is not a fatal illness. Another indication of the often benign nature of the disease is the high percentage of prostate cancers identified at surgery for bladder cancer; up to 40% of specimens contain unsuspected prostate cancer (level of evidence [LOE]: 2c).10,11
Most clinical diagnoses (80%) and prostate cancer deaths (90%) occur among men older than 65 years;6 the median age at diagnosis is 72 years.12 More than 75% of men older than 85 years will have histological prostate cancer (LOE: 2c).13 Many men live with their disease for more than 10 years, but do not die of it (LOE: 2c).12 Additionally, a review of several decision analyses indicates that men 75 years of age and older are not likely to benefit from screening and aggressive treatment (LOE: 2a).14
Hence the recommendation: if performing prostate cancer screening, limit to men with greater than 10 years life expectancy.15
Details of screening tests
Digital rectal examination insufficient
Digital rectal examination (DRE)—palpating the prostate gland to determine size and consistency—is one screening tool for prostate cancer, usually performed in conjunction with PSA testing.15 It is not a difficult or expensive test, but its reproducibility is only fair, even among experienced urologists (LOE: 2b).16
The sensitivity and specificity of DRE can only be estimated because men with a normal finding on DRE are not routinely biopsied in any studies (TABLE 1).17,18 One of two pertinent meta-analyses18 included studies that followed men with a negative DRE finding for development of prostate cancer (LOE: 2a). Both meta-analyses of DRE as a screening tool found that the included studies were heterogeneous in their study populations and definition of abnormal DRE test result (LOE: 2a). The positive predictive value (PPV) of DRE was 28% in one meta-analysis and 18% in the other.
TABLE 1
Characteristics of screening tests for prostate cancer
| TEST/SOURCE | DESCRIPTION (LEVEL OF EVIDENCE) | SN ESTIMATE (%) | SP ESTIMATE (%) | LIKELIHOOD RATIO | PPV (%) |
|---|---|---|---|---|---|
| Abnormal DRE18 | Meta-analysis of studies that performed biopsies for abnormal DRE (2a) | 59 (51%–67%) | 94 (91%–96%) | + 9.8 – 0.4 | 28 (20–36) |
| Abnormal DRE17 | Meta-analysis of studies that performed biopsies for abnormal DRE or PSA (2a) | 53.2 | 83.6 | + 3.24 – 0.56 | 17.8 |
| PSA >4 ng/mL12 | Review of multiple cohort studies with diverse populations, not systematic | Mean = 71 | Mean = 75 | + 2.8 – 0.30 | 37 |
| PSA >4 ng/mL19 | Longitudinal retrospective study of prostate cancers that developed within 2 years of PSA test (3b) | 73.2 | 85.4 | + 5.0 – 0.2 | |
| PSA >4 ng/mL20 | Nested case-control study of prostate cancers that developed within 5 years of PSA test in a cohort study (3b) | 86 | 94 | + 14.3 – 0.15 | |
| PSA > 4 ng/mL17 | Meta-analysis of studies that performed biopsies for abnormal PSA or DRE (2a) | 72.1 | 93.2 | + 10.2 – 0.30 | 25.1 |
| Sn, sensitivity; Sp, specificity; PPV, positive predictive value; | |||||
| PSA, prostate-specific antigen; DRE, digital rectal examination. | |||||
Prostate-specific antigen: Improving its clinical usefulness
Prostate-specific antigen (PSA), first detected in serum in 1979, is a protein produced by prostate epithelial cells. It was originally used to follow men treated for prostate cancer for evidence of recurrence. In the late 1980s, it became widely used in the US to screen for prostate cancer.
An elevated PSA level is suggestive but not diagnostic of prostate cancer. Elevated levels also occur with advancing age, increased prostate size, and prostatitis, and following ejaculation. Prostate manipulation such as biopsy and surgery (but not digital examination) also elevates PSA.
Customary cutpoint. An abnormal serum PSA level is commonly regarded as 4 ng/mL or greater. At this cutpoint, most studies report sensitivity for cancer of around 70%, with more variability in specificity (TABLE 1). Again, in most studies that report sensitivity and specificity, men with a PSA level less than 4 ng/mL did not undergo prostate biopsy; therefore, the number of false negatives and true negatives are only estimates.
In nested case-control studies of longitudinal cohorts, eligible cases were defined by the length of time between an abnormal PSA result and prostate cancer diagnosis, while controls were men who were not diagnosed with prostate cancer during the same time period (however, a biopsy was not usually performed). The PPV of an abnormal PSA level is estimated at 25% to 37%. As a comparison, the PPV of a positive mammogram finding for women 50 to 59 years is 4% to 9%, and 10% to 19% for women age 60 to 69.21
Suggested strategies to improve PSA accuracy. Approximately 70% of men with an elevated serum PSA level do not have cancer. To decrease the number of unnecessary biopsies, experts have suggested several strategies:
- using DRE with PSA
- calculating a ratio of free PSA (unbound to protein) or complexed PSA (bound to protein) to total PSA
- measuring PSA density, which incorporates the volume of the prostate gland and is subject to observer variability in prostate volume measurement
- recording PSA velocity, which is the annual rate of change in PSA level and requires 3 or more measurements.
Revise the cutpoint? The cutpoint of 4 ng/mL has been deemed too high by some clinicians. A recent report of men enrolled in a large prostate cancer prevention trial found that among the 9459 men receiving placebo, 2950 had a PSA level of 4 ng/mL or less and had normal prostates on DRE (LOE: 1b).22 All 2950 underwent a prostate biopsy; 449 (15.2%) were positive for cancer. Nearly 30% of those had a PSA level of 2 ng/mL or less.
Approximately 25% of tumors in men referred for biopsy because of abnormal PSA or DRE findings are thought to be discovered by chance due to the biopsy procedure and the high prevalence of disease (LOE: 2c).23 Furthermore, a recent study indicates that annual PSA fluctuation is substantial; 45% of men who initially had a value of 4 ng/mL or greater, subsequently had a normal level (LOE: 2b).24 Isolated abnormal levels should be confirmed before referral for biopsy.
Identifying clinically relevant cancers
The continued controversy around PSA screening relates to the potential over-diagnosis of localized prostate cancers that are not likely to become clinically significant. The ideal screening test would predictably identify cancers likely to progress.
Screening over-detects
Several computer simulations have estimated the amount of over-detection of prostate cancer. The National Cancer Institute’s Surveillance, Epidemiology and End Results (SEER) registry data demonstrated that the proportion of prostate cancer found through PSA testing that otherwise would not have been diagnosed in the patient’s lifetime was 29% for white men and 44% for black men (LOE: 2c).25
An Italian study found that the proportional excess of cancers detected by screening over those that would have been expected in the absence of screening is greater than 50% (LOE: 2c).26
Finally, a model based on results from the European randomized study of prostate cancer screening estimated that a screening program with a 4-year interval from age 55 to 67 has an over-detection rate of 48% (cancers that would not have been diagnosed in the absence of screening) (LOE: 2c).27 Additionally, the authors determined that such screening might advance prostate cancer diagnosis by at least 10 years. Previous estimates of diagnosis lead time have been in the 5- to 7-year range (LOE: 2b).28 These findings indicate that screening intervals of 2 to 4 years are unlikely to cause a loss of sensitivity.
Spread of tumor
Spread of the tumor beyond the prostate capsule is a poor prognostic sign.29 Unfortunately, this occurrence is often not known until surgery, and the result usually is an “up-staging” between clinical diagnosis and pathological diagnosis. Nevertheless, most cancers (86%) diagnosed between 1992 and 1999 were localized to the prostate.6 Because these cancers have not spread beyond the prostate at the time of diagnosis, they are more likely to be curable. They are also more likely to represent tumors that may grow so slowly that the host will die of something other than prostate cancer.
Gleason score
Gleason score is another predictor of cancers destined to become clinically relevant (FIGURE 1). A Gleason score of 7 or greater denotes moderate to poor cellular differentiation and indicates a greater potential for progression than lower Gleason values.29 A recent long-term follow-up report on a cohort of men with localized cancer treated conservatively demonstrated that men with low-grade tumors (Gleason score 2–4) have a minimal risk of dying from prostate cancer after 20 years, while men with high-grade tumors (Gleason score of 8–10) have high probability of prostate cancer death within 10 years of diagnosis (LOE: 2b).30 Ecological31 and clinical studies32 indicate that a substantial proportion of PSA-detected cancers are moderately differentiated. This is especially true in a first round of screening; as in the European randomized study of screening, where 36% of cancers were Gleason score 7 or higher (LOE: 1b).33
FIGURE 1
Calculating the Gleason score
The Gleason score is based on the level of differentiation and growth pattern of prostate cancer cells. Cancer cells that closely resemble the normal prostate cells when viewed under low-power magnification are well differentiated. Cancer cells that do not retain the structure of the surrounding normal cells are poorly differentiated. Scores range from 1 to 5.
In examining histologic samples of a patient’s prostate tissue, the pathologist will identify the 2 most commonly occurring patterns (types of differentiation) among the cancer cells and assign a numerical value to each pattern. The 2 numbers are then added to yield the final Gleason score. If a single pattern dominates, the pathologist will simply double the corresponding value.
Total scores range from 2 to 10. Scores in the range of 2–4 are considered well-differentiated, 5–7 are moderately differentiated, and 8–10 are poorly differentiated. In general, the higher the score, the worse the prognosis. Men with well-differentiated tumors that are treated conservatively have minimal risk of dying from prostate cancer.
Is declining mortality a sign of screening success?
Prostate cancer mortality has been declining since the mid-1990s in numerous parts of the world; the US,6,34 Canada,35 Australia,36 and the United Kingdom37 have all reported a reduction in the rate of prostate cancer deaths. Advocates of PSA screening point to this trend as evidence of the effectiveness of screening. But such ecological data are difficult to interpret. For instance, although much less PSA screening is performed in the UK, mortality trends are similar to those in the US where PSA testing has been used more widely.38
Aggressive screening not necessarily the reason. In the US, 2 geographic areas—Seattle, Washington and Connecticut—provided a natural experiment to compare the effect of aggressive screening on prostate cancer mortality (LOE: 2c).39 Although more aggressive screening and treatment took place in the Seattle area, prostate cancer mortality rates were similar to those in Connecticut over 11 years of follow-up. Similarly, in a study in British Columbia, prostate cancer mortality from 1985 to 1999 was not associated with the intensity of PSA screening (LOE: 2c).40
Other possible explanations. If the mortality decrease is not related to PSA screening, what could cause it? One explanation is “attribution bias.” Death certificate misattribution of cause of death from prostate cancer may partially explain the pattern of increasing, then decreasing mortality rates (LOE: 2c).41 Improvement in prostate cancer treatment, especially for advanced stage, and in particular hormone therapy, is another possible explanation for the decreasing prostate cancer mortality (LOE: 2c).14,42
Benefits of screening
The benefit of any effective screening test is a decrease in the risk of the screened-disease mortality. The best way to demonstrate decreased risk is through a randomized controlled study of the screening test, and 2 such trials are underway for prostate cancer. In the meantime, a decision model estimates that aggressive treatment of organ-confined disease potentially adds 3 years of life for men in their fifties, 1.5 years for men in their sixties, and 0.4 years for men in their seventies (LOE: 2c).3
Others have concluded that 25 men with clinically detected prostate cancer would need to be treated with surgery to prevent 1 prostate cancer death during a 6-year period, without evidence that quality of life is improved (LOE: 2c).43
Consider quality of life. With uncertainty surrounding improvement in the quantity of life as a result of prostate cancer screening, improved quality of life may be an issue for patients. Focus group research has demonstrated that some patients believe it is better to know if a cancer is present than to wonder if it will be diagnosed when it is too late for cure.44
General quality of life has been found to be similar among men treated for prostate cancer and age-matched controls without prostate cancer; however, urinary, sexual, and bowel function vary substantially between treated and untreated men and by treatment type (LOE: 3b) (TABLE 2).45,46 In general, men treated with radical prostatectomy and brachytherapy often report better general quality of life than men who undergo radiation treatment, despite having more urinary and sexual problems (LOE: 2b).47,48
TABLE 2
Estimates of risk associated with specific prostate cancer treatments 12 months or more after treatment
| TREATMENT OUTCOMES | RADICAL PROSTATECTOMY (%) | EXTERNAL BEAM RADIATION (%) | BRACHY-THERAPY* (%) | ANDROGEN DEPRIVATION THERAPY (%) | UNTREATED (%) |
|---|---|---|---|---|---|
| Death within 2 months of treatment | 0.5–0.7 | 0.2–0.5 | 0.2–0.5 | ||
| Urinary problems: | |||||
| Incontinence | 10–50 | 2–16 | 6–16 | ||
| Wearing pads | 5–32 | 2–12 | 2–16 | ||
| Urinary bother† | 4–20 | 3–15 | 3–16 | ||
| Sexual problems: | |||||
| Impotence | 50–80‡ | 30–60 | 20–60** | 70–92 | 20–50 |
| Sexual bother | 10–40 | 10–30 | 10–18 | 25–38 | 10–32 |
| Bowel problems: | |||||
| Bowel problems§ | 9–15 | 6–35 | 4–20 | ||
| Loose stools/diarrhea | 15–21 | 6–37 | 4–10 | ||
| Bowel bother | 1–3 | 4–12 | 2–10 | ||
| Other symptoms | Breast swelling: 5–25 | ||||
| Hot flashes: 50–60 | |||||
| * Fewer studies on brachytherapy are available, especially those with long-term follow-up; therefore, these findings are less certain than other entries. | |||||
| ‡ Includes nerve-sparing prostatectomy. | |||||
| † EBRT and brachytherapy patients are more likely to experience irritative voiding symptoms (i.e. dysuria, urgency and hesitancy and noctoria), while RP patients are more likely to experience incontinence. | |||||
| ** Impotence risk gradually increases with time after treatment. | |||||
| § Includes symptoms such as painful bowel movement and urgency | |||||
| Sources:references 14, 50–53, 65–71. | |||||
Harms of screening
The chances of undergoing a biopsy based on an abnormal screening PSA are estimated at 15% to 40% depending on the patient’s age (FIGURE 2).3 There are adverse effects associated with transrectal biopsy of the prostate. In 2 large population-basedstudies of screening, the most frequent complications were hematuria and hematospermia (LOE: 1b, 2b) (TABLE 3), with more serious consequences such as sepsis and hospitalization occurring in fewer than 1% of patients. A study of 100 screened men with an abnormal PSA who underwent prostate biopsy found that although 69% felt moderate to severe pain with the biopsy, 80% would be willing to undergo a repeat biopsy (LOE: 1b).49
Treatment options. If the biopsy result is positive, the most common treatment options for localized cancer—which represents over 80% of all prostate cancers diagnosed6—include radical prostatectomy, external beam radiation therapy, brachytherapy (internal radiation therapy) or expectant management (watchful waiting). Population-based studies have reported outcomes for these treatment options (TABLE 2). Outcomes derived from hospital-based series of other prostate cancer treatments, such as cryotherapy and 3-dimensional radiation, are available, but the estimates often reflect the experience of only a few hospitals and are not representative of other facilities. Androgen ablation is the standard treatment for metastatic prostate cancer.
Untoward effects of treatment. Approximately 60% of radical prostatectomy patients report some incontinence 12 months or more after surgery (LOE: 2b),50,51 and about 30% of patients need to wear pads for urine leakage (LOE: 2b).50-53 Men undergoing radiation therapy have less urinary incontinence, but about 30% complain of diarrhea and loose stools (LOE: 2b).51,52 Both therapies are associated with a high percentage of erectile dysfunction: approximately 60% of radiation therapy patients and 75% of surgery patients report their erections are not firm enough for intercourse (LOE: 2b).51,52
Expectant management (following the cancer with regular PSA and ultrasound testing) is sometimes difficult to “sell” to patients whose fear of cancer dictates that the only logical response is to “cut it out.”44 A recent randomized trial indicated that radical prostatectomy lowers prostate cancer mortality, local progression, distant metastasis, and overall survival as compared with watchful waiting over a median of 8.2 years of follow-up (LOE: 1b).54 However, these results may have little relevance to prostate cancer screening since only 5% of the cancers were screen-detected and 76% were palpable.
FIGURE 2
Yield of screening 1000 men for prostate cancer
TABLE 3
Percentage of patients with specific complication of transrectal prostate biopsy
| CONDITION | TYROL STUDY63 | EUROPEAN RANDOMIZED STUDY OF SCREENING 64 |
|---|---|---|
| Gross hematuria >1 day | 12.5% | 22.6% |
| Hematospermia | 29.8% | 50.4% |
| Significant pain | 4.0% | 7.5% |
| Rectal bleeding | 0.6% | 1.3% |
| Nausea | 0.8% | 0.3% |
| Fever >38.5°C | 0.8% | 3.5% |
| Epididymitis | 0.7% | 0.07% |
| Sepsis | 0.3% | Not available |
| Hospitalization | Not available | 0.5% |
| Tyrol study63: LOE: 2b, N=6024 biopsies; ERSS study64: LOE: 1b, N=5802 biopsies. | ||
Recommendations from expert groups
Different expert groups have conflicting recommendations. Both the American Urological Association and the American Cancer Society recommend annual PSA screening starting at age 50 for most men; younger if risk factors are present. Groups that are evidence based tend to recommend a shared decision making process with patients. The AAFP and American College of Physicians advise physicians to counsel men on the known risks and uncertain benefits of screening for prostate cancer. The US Preventive Services Task Force 2002 update concluded that evidence is insufficient to recommend for or against routine screening for prostate cancer using PSA or DRE. The National Cancer Institute cites a lack of evidence to determine a net benefit for PSA or DRE screening.
When will we know more?
Only 1 randomized controlled trial of prostate cancer screening has been completed55: 46,193 men were randomized to either PSA and DRE or no screening from 1989 to 1996. The study had methodological problems; for instance, only 23% of the group randomized to screening was screened. The investigators in the trial have interpreted its results as demonstrating a decrease in prostate cancer deaths in the screened group compared with the unscreened group (15 vs 48.7 per 100,000 man-years).55 Others have criticized the statistical analysis and calculated the results using an “intent to screen” analysis, finding no difference in prostate cancer deaths between the 2 groups.3,56
Two randomized controlled trials of screening are ongoing: the National Cancer Institute’s Prostate, Lung, Colon, Ovarian (PLCO) Screening Trial57 and the European Randomized Study of Screening for Prostate Cancer.58 Both were started in the mid-1990s and will not have results available for a few more years. Also underway is a randomized trial of intervention (radical prostatectomy) versus expectant management, called the Prostate Cancer Intervention Versus Observation Trial (PIVOT).59
Counseling recommendations
However, providing men with information on prostate cancer screening before they discussed it with their family physician, rather than after the visit, resulted in patients having a significantly more active role in making a screening decision, and lower levels of decisional conflict (LOE: 2b).61 Informational pamphlets are available through the AAFP and CDC websites listed in TABLE 4. Additional websites containing prostate cancer screening information are found in TABLE 4. We also provide a bullet item list of key points for discussion with patients (TABLE 5), which can be used along with the balance sheet provided here (TABLE 2).
Shared decision-making is not an easy or quick process. Yet, the majority of patients will benefit from the discussion, regardless of the final decision. Of course, there are instances when a shared decision-making process is well-documented, and still results in an undesirable outcome;62 however, while the evidence for screening remains controversial, patients have the right to know that those controversies exist and why they exist.
TABLE 4
Useful websites for patients to find prostate cancer screening information
| CENTERS FOR DISEASE CONTROL AND PREVENTION |
| www.cdc.gov/cancer/prostate/decisionguide/index.htm |
| 10th grade reading level* |
| Good coverage of screening and treatment controversies |
| Offers downloadable PDF version |
| NATIONAL CANCER INSTITUTE |
| cis.nci.nih.gov/asp/FactSheetPub/AlphaSubList.asp?alpha=47 |
| 10th grade reading level |
| FAQ format |
| Offers Spanish version |
| AMERICAN CANCER SOCIETY |
| www.cancer.org/docroot/CRI/content/CRI_2_4_3X_Can_prostate_ cancer_be_found_early_36.asp |
| 12th grade reading level |
| Lacks discussion of treatment options and their side effects |
| Biased in favor of screening but acknowledges that other distinguished organizations are not |
| AMERICAN UROLOGICAL ASSOCIATION |
| www.urologyhealth.org/adult/index.cfm?cat=09 |
| 12th grade reading level |
| Easy to navigate among screening and specific treatment pages |
| Biased in favor of PSA screening |
| AMERICAN ACADEMY OF FAMILY PHYSICIANS |
| familydoctor.org/healthfacts/361/ |
| 11th grade reading level |
| Question/answer format |
| Very straightforward, lacks depth |
| www.aafp.org/x19519.xml |
| 7th grade reading level |
| Separate information sheet for patients and physicians |
| Presents possible outcomes of PSA test and prostate cancer treatment in easy-to-follow format |
| WEBMD |
| my.webmd.com/medical_information/condition_centers/prostate_cancer/default.htm |
| 9th grade reading level |
| Question/answer format |
| Specifically addresses false negative and positives with current estimates |
| DARTMOUTH CENTER FOR SHARED DECISION MAKING |
| www.dhmc.org/dhmc-internet-upload/file_collection/PSA.pdf |
| 6th grade reading level |
| Well-designed, simple presentation of pros and cons of PSA testing |
| *Fleish-Kincaid grade level score based on average sentence length and average number of syllables per word. |
TABLE 5
Talking points for patients and physicians
| Prostate cancer is an important men’s health problem |
| Screening may prevent early prostate cancer death |
| DRE alone has little value as a screening test |
| Age, prostate size, prostatitis, ejaculation, prostate biopsy, and prostate surgery can cause a falsely elevated PSA test |
| Approximately 70% of men with an elevated serum PSA do not have cancer |
| The percentage of PSA screening false negatives ranges from 10%–22% in large studies |
| If the test is abnormal, a biopsy will be recommended |
| If the biopsy is positive, treatment options will be given |
| Many men experience long-term urinary incontinence and impotence related to their treatment |
CORRESPONDING AUTHOR
Kendra Schwartz, MD, MSPH, 101 E. Alexandrine, Detroit, MI 48201, E-mail: [email protected]
1. American Academy of Family Physicians. Summary of recommendation for periodic health examinations. August 2002. Available at: www.aafp.org/PreBuilt/PHERev5.30802.pdf. Accessed on June 10, 2005.
2. US Preventive Services Task Force. Screening for Prostate Cancer. 2002. Available at: www.ahrq.gov/clinic/uspstf/uspsprca.htm. Accessed on June 10, 2005.
3. American College of Physicians. Screening for prostate cancer. Position paper. Clinical Guideline: Part III. Ann Intern Med 1997;126:480-484.
4. Harris R, Lohr K, Beck R, Fink K, Godley P, Bunton A. Screening for prostate cancer. Systematic Evidence Review for AHRQ. Available at: www.ahrq.gov/uspstfix.htm. Accessed on June 10, 2005.
5. American Cancer Society. Cancer statistics 2005. CA Cancer J Clin 2005;55:10-30.
6. Ries L, Eisner M, Kosary C, et al. SEER Cancer Statistics Review, 1975–2000. Bethesda, Md: National Cancer Institute; 2003. Available at seer.cancer.gov/csr/1975_2002/. Accessed on June 10, 2005.
7. DevCan: Probability of dying of cancer [computer program]. Version 5.1. Bethesda, Md: National Cancer Instititute; 2003. Available at: srab.cancer.gov/devcan/. Accessed on June 10, 2005.
8. Neal DE, Leung HY, Powell PH, Hamdy FC, Donovan JL. Unanswered questions in screening for prostate cancer. Eur J Cancer 2000;36:1316-1321.
9. US Preventive Services Task Force. Guide to Clinical Preventive Services. 2nd ed. Alexandria, Va: International Medical Publishing; 1996.
10. Kabalin J, McNeal J, Price H, Freiha F, Stamey T. Unsuspected adenocarcinoma of the prostate in patients undergooing cystoprostatectomy for other causes: incidence, histology and morphometric observations. J Urol 1989;141:1091-1094.
11. Montie J, Wood DJ, Pontes J, Boyett J, Levin H. Adenocarcinoma of the prostate in cystoprostatectomy specimens removed for bladder cancer. Cancer 1989;63:381-385.
12. Bunting PS. Screening for prostate cancer with prostate-specific antigen: beware the biases. Clin Chim Acta 2002;315:71-97.
13. Gronberg H. Prostate cancer epidemiology. Lancet 2003;361:859-864.
14. Harris R, Lohr KN. Screening for prostate cancer: an update of the evidence for the U.S. Preventive Services Task Force. Ann Intern Med 2002;137:917-929.
15. American Cancer Society. ACS Cancer Detection Guidelines. Available at: www.cancer.org/docroot/PED/content/PED_2_3X_ACS_Cancer_Detection_Guidelines _36.asp. Accessed June 10, 2005.
16. Smith D, Catalona W. Interexaminer variability of digital rectal examination in detecting prostate cancer. Urology 1995;45:70-74.
17. Kishor M, Cable G. Meta-analysis of prostate-specific antigen and digital rectal examination as screening tests for prostate carcinoma. J Am Board Fam Pract 2003;16:95-101.
18. Hoogendam A, Buntix F, deVet HCW. The diagnostic value of digital rectal examination in primary care screening for prostate cancer: a meta-analysis. Fam Pract 1999;16:621-626.
19. Gann PH, Hennekens CH, Stampfer MJ. A prospective evaluation of plasma prostate-specific antigen for detection of prostatic cancer. JAMA 1995;273:289-294.
20. Hakama M, Stenman UH, Aromaa A, Leinonen J, Hakulinen T, Knekt I. Validity of the prostate specific antigen test for prostate cancer screening: followup study with a bank of 21,000 sera in Finland. J Urol 2001;166:2189-2191.
21. Humphrey L, Helfand M, Chan B, Woolf S. Breast cancer screening: summary of the evidence. Ann Intern Med 2002;137:344-346.
22. Thompson I, Pauler D, Goodman P, et al. Prevalence of prostate cancer among men with a prostate-specific antigen level <4 ng per milliliter. N Engl J Med 2004;350:2239-2246.
23. Collins MM, Ransohoff D, MJ Barry. Early detection of prostate cancer-serendipity strikes again. JAMA 1997;278:1516-1519.
24. Eastham J, Riedel E, Scardino P, et al. Variation of serum prostate-specific antigen levels. An evaluation of year-to-year fluctuations. JAMA 2003;289:2695-2700.
25. Etzioni R, Penson DF, Legler JM, et al. Overdiagnosis due to prostate-specific antigen screening: lessons from U.S. prostate cancer incidence trends. J Natl Cancer Inst 2002;94:981-990.
26. Zappa M, Ciatto S, Bonardi R, Mazzotta A. Overdiagnosis of prostate carcinoma by screening: an estimate based on the results of the Florence Screening Pilot Study. Ann Oncol 1998;9:1297-1300.
27. Draisma G, Boer R, Otto S, et al. Lead times and overdetection due to prostate-specific antigen screening: estimates from the European randomized study of screening for prostate cancer. J Natl Cancer Inst 2003;95:868-878.
28. Auvin A, Maattanen L, Stenman UH, et al. Lead-time in prostate cancer screening (Finland). Cancer Causes Control 2002;13:279-285.
29. Gleason D, Mellinger G. Group at VACUR. Prediction of prognosis for prostatic adenocarcinoma by combined histological grading and clinical staging. J Urol 1974;111:58-64.
30. Albertson PC, Hanley JA, Fine J. 20-Year outcomes following conservative management of clinically localized prostate cancer. JAMA 2005;293:2095-2101.
31. Schwartz K, Grignon D, Sakr W, Wood DJ. Prostate cancer histologic trends in the metropolitan Detroit are, 1982 to 1996. Urology 1999;53:769-774.
32. Smith D, Catalona W. The nature of prostate cancer detected through prostate specific antigen based screening. J Urol 1994;152:1732-1736.
33. Hoedemaeker RF, van der Kwast T, Boer R, et al. Pathological features of prostate cancer found at population-based screening with a four-year interval. J Natl Cancer Inst 2001;93:1153-1158.
34. Chu KC, Tarone RE, Freeman HP. Trends in prostate cancer mortality among black men and white men in the United States. Cancer 2003;97:1507-1516.
35. National Cancer Institute of Canada. Canadian cancer statistics 2001. Toronto: National Cancer Institute of Canada; 2001. Available at: www.ncic.cancer.ca. Accessed June 10, 2005.
36. Coory M, Baade P. Mortality from prostate cancer is decreasing. Med J Aust 2002;176:345-345.
37. Majeed A, Babb P, Jones J, Quinn M. Trends in prostate cancer incidence, mortality and survival in England and Wales, 1971–1998. BJU Int 2000;85:1058-1062.
38. Oliver S, Gunnell D, Donovan J. Comparison of trends in prostate-cancer mortality in England and Wales and the USA. Lancet 2000;355:1788-1789.
39. Lu-Yao G, Albertsen PC, Stanford JL, Stukel TA, Walker-Corkery ES, Barry MJ. Natural experiment examining impact of aggressive screening and treatment on prostate cancer mortality in two fixed cohorts from Seattle area and Connecticut. BMJ 2002;325:740.-
40. Coldman A, Phillips N, Pickles T. Trends in prostate cancer incidence and mortality: an analysis of mortality change by screening intensity. CMAJ 2003;168:31-35.
41. Feuer EJ, Merrill RM, Hankey BF. Cancer surveillance series: interpreting trends in prostate cancer—part II: Cause of death misclassification and the recent rise and fall in prostate cancer mortality. J Natl Cancer Inst 1999;91:1025-1032.
42. Frankel S, Smith GD, Donovan J, Neal D. Screening for prostate cancer. Lancet 2003;361:1122-1128.
43. Partin MR, Wilt TJ. Informing patients about prostate cancer screening: identifying and meeting the challenges while the evidence remains uncertain. Am J Med 2002;113:691-693.
44. McFall SL, Hamm RM. Interpretation of prostate cancer screening events and outcomes: a focus group study. Patient Educ Couns 2003;49:207-218.
45. Litwin MS, Hays RD, Fink A, et al. Quality-of-life outcomes in men treated for localized prostate cancer. JAMA 1995;273:129-135.
46. Penson DF, Litwin MS. Quality of life after treatment for prostate cancer. Curr Urol Rep 2003;4:185-195.
47. Lubeck DP, Litwin MS, Henning JM, Stoddard ML, Flanders SC, Carroll PR. Changes in the health-related quality of life in the first year after treatment for prostate cancer: results from CaPSURE. Urology 1999;53:180-186.
48. Bacon C, Giovannucci E, Testa M, Kawachi I. The impact of cancer treatment on quality of life outcomes for patients with localized prostate cancer. J Urol 2001;166:1804-1810.
49. Makinen T, Auvinen A, Hakama M, Stenman UH, Tammela TL. Acceptability and complications of prostate biopsy in population-based PSA screening versus routine clinical practice: a prospective, controlled study. Urology 2002;60:846-850.
50. Fowler FJ, Jr, Barry MJ, Lu-Yao G, Roman A, Wasson J, Wennberg JE. Patient-reported complications and follow-up treatment after radical prostatectomy. The National Medicare Experience: 1988-1990 (updated June 1993). Urology 1993;42:622-629.
51. Schwartz K, Bunner S, Bearer R, Severson RK. Complications from treatment for prostate carcinoma among men in the Detroit area. Cancer 2002;95:82-89.
52. Potosky AL, Legler J, Albertsen PC, et al. Health outcomes after prostatectomy or radiotherapy for prostate cancer: results from the Prostate Cancer Outcomes Study. J Natl Cancer Inst 2000;92:1582-1592.
53. Sebesta M, Cespedes RD, Luhman E, Optenberg S, Thompson IM. Questionnaire-based outcomes of urinary incontinence and satisfaction rates after radical prostatectomy in a national study population. Urology 2002;60:1055-1058.
54. Bill-Axelson A, Holmberg L, Ruutu M, et al. Radical prostatectomy versus watchful waiting in early prostate cancer. N Engl J Med 2005;352:1977-1184.
55. Labrie F, Candas B, Dupont A, et al. Screening decreases prostate cancer death: first analysis of the 1988 Quebec prospective randomized controlled trial. Prostate 1999;38:83-91.
56. Alexander FE, Prescott RJ. Reply to Labrie et al. Results of the mortality analysis of the Quebec randomized controlled trial (RCT). Prostate 1999;40:135-137.
57. Prorok P, Andriole G, Bresalier R, et al. Design of the Prostate, Lung, Colorectal and Ovarian (PLCO) Cancer Screening Trial. Control Clin Trials 2000;21:273S-309S.
58. Standaert B, Denis L. The European Randomized Study of Screening for Prostate Cancer: an update. Cancer 1997;80:1830-1834.
59. Wilt TJ, Brawer M. The Prostate Cancer Intervention Versus Observation Trial: a randomized trial comparing radical prostatectomy versus expectant management for the treatment of clinically localized prostate cancer. J Urol 1994;152:1910-1914.
60. Schapira M, VanRuiswyk J. The effect of an illustrated pamphlet decision-aid on the use of prostate cancer screening tests. J Fam Pract 2000;49:418-424.
61. Davison B, Kirk P, Degner L, Hassard T. Information and patient participation in screening for prostate cancer. Patient Educ Couns 1999;37:255-263.
62. Merenstein D. Winners and losers. JAMA 2004;291:15-16.
63. Horninger W, Berger A, Pelzer A, et al. Screening for prostate cancer: updated experience from the Tyrol study. Current Urol Reports 2004;5:220-225.
64. Raaijmakers R, Kirkels WJ, Roobol MJ, Wildhagen MF, Schrder FH. Complication rates and risk factors of 5802 transrectal ultrasound-guided sextant biopsies of the prostate within a population-based screening program. Urology 2002;60:826-830.
65. Fowler F, Barry MJ, Lu-Yao G, Wasson J, Bin L. Outcomes of external beam radiation therapy for prostate cancer: a study of Medicare beneficiaries in three Surveillance, Epidemiology, and End Results areas. J Clin Oncol 1996;14:2258-2265.
66. Hollenbeck BK, Dunn RL, Wei JT, Sandler HM, Sanda MG. Sexual health recovery after prostatectomy, external radiation, or brachytherapy for early stage prostate cancer. Curr Urol Rep 2004;5:212-219.
67. Potosky AL, Knopf K, Clegg LX, et al. Quality-of-life outcomes after primary androgen deprivation therapy: results from the Prostate Cancer Outcomes Study. J Clin Oncol 2001;19:3750-3757.
68. Lee R, Penson DF. Treatment outcomes in localized prostate cancer: a patient-oriented approach. Semin Urol Oncol 2002;20:63-73.
69. Stanford JL, Feng Z, Hamilton AS, et al. Urinary and sexual function after radical prostatectomy for clinically localized prostate cancer: the Prostate Cancer Outcomes Study. JAMA 2000;283:354-360.
70. Robinson JW, Moritz S, Fung T. Meta-analysis of rates of erectile function after treatment of localized prostate carcinoma. Int J Radiat Oncol Biol Phys 2002;54:1063-1068.
71. Coley CM, Barry MJ, Fleming C, Fahs MC, Mulley AG. Early detection of prostate cancer. Part II: Estimating the risks, benefits, and costs. American College of Physicians. Ann Intern Med 1997;126:468-479.
Complex regional pain syndrome underdiagnosed
- Complex regional pain syndrome (CRPS) type 1 may be diagnosed by history and physical exam with no further testing (B). Several different diagnostic criteria have undergone validity testing: the 1993 IASP criteria, Bruehl’s criteria, and Veldman’s criteria; there is no compelling reason to recommend 1 set of criteria over the others (C).
- Some cases of CRPS type 1 may be preventable. Some cases of CRPS type 1 in post-stroke upper extremity hemiplegia (also known as shoulder-hand syndrome) may be prevented by early inpatient rehabilitation (C) and avoidance of shoulder trauma to the affected arm (B). Some cases of post-fracture CRPS type 1 may be prevented with 500 mg vitamin C daily started upon diagnosis of fracture and continued through healing (B).
Do you have a patient recovering from a limb fracture who is complaining of pain and tenderness long after most patients with a similar injury would be symptom free? The problem may be an under-recognized one—complex regional pain syndrome (CRPS) type 1, also known as reflex sympathetic dystrophy. The problem is also encountered in immobilized limbs of post-stroke patients.
Persons with persistent post-traumatic pain eventually diagnosed with CRPS type 1 often undergo unnecessary testing resulting in inappropriate or delayed treatment.1
Signs and symptoms typical of CRPS type 1 can also occur transiently with a normally recovering immobilized limb,2,3 so diagnosis of CRPS type 1 is based on increasing severity and duration of signs and symptoms (level of evidence [LOE]: 3; consensus guidelines)4:
- pain
- hyperalgesia/allodynia (pain or exaggerated response resulting from a normally painless or only slightly painful stimulus)
- joint stiffness
- swelling
- autonomic abnormalities (often sweating and temperature differences compared with the unaffected limb).
Diagnosis: Watch recovery course over first 9 weeks
Clinicians face a number of challenges in diagnosing CRPS type 1. No psychological or personality traits appear to predispose to CRPS type 1 (LOE: 2, lower-quality literature review).5 Fracture types and severity of injury among persons who develop CRPS type 1 are not significantly different from persons who recover normally (LOE: 2, case control studies).6,7 The key is to remain alert to deviation from the normal course of recovery.
Studies have shown that 9 weeks post injury, persons with persistent pain, tenderness, swelling, joint stiffness (fingers and wrist), and sweating or temperature changes in the injured limb may have CRPS type 1 (LOE: 2, case series and case control studies).6,8 In a prospective case series (n=109), no new cases of CRPS type 1 developed beyond 9 weeks (LOE: 2, case series).8
Diagnostic criteria: No consensus
No one test identifies all persons with CRPS type 1. There is no objective gold standard for diagnosis.9 Instead, researchers and clinicians must rely on clinically derived diagnostic criteria. Unfortunately, despite the development of diagnostic criteria by the IASP in 1994 (TABLE 1),4 experts have not reached consensus on the best method of diagnosis, and several different sets of diagnostic criteria are used.7,10
Initial IASP criteria.Of these, the 1994 IASP consensus-based diagnostic criteria appear to be most widely used in the litera- ture. These criteria were intended as a starting point, requiring validation through future clinical research.4,11 In further studies using controls with neuropathic conditions, IASP criteria have demonstrated low specificity (TABLE 2 ).11,12
The diagnosis of CRPS type I is often missed,1,29,30so it is likely that the diagnosis rate per population of 0.02% reported in a recent population based study is an underestimate of the actual prevalence.31 After distal radial fracture, rates of CRPS type I have varied widely in reports, from 0.9% 32 to 15% 33 to 28%.34 After tibial shaft fracture, Sarangi et al 35 reported that 30% of persons developed CRPS type I.
In cases of post-stroke hemiplegia, CRPS type I has been reported in the paralyzed arm at rates between 25% 36 and 40%.37 However, in a more recent study among stroke patients in the US who underwent early inpatient rehabilitation, Petchkrua et al reported a lower incidence of about 2%.38 Impairment can be severe among persons with persistent CRPS type 1. A prospective study revealed that activities of daily living were significantly impaired in 62% of persons with chronic CRPS type 1.39
Criteria refinements.Derived from 1 of these studies, Bruehl’s criteria were subsequently developed to improve the IASP criteria (TABLE 1).11Several other sets of diagnostic criteria exist, but only Veldman’s criteria ( TABLE 1),13 which have been adopted as the standard in the Netherlands, have undergone further study.14 Studies of Bruehl’s and IASP criteria have measured specificity and sensitivity, and along with Veldman’s criteria, interobserver reliability (TABLE 2 ).11,12,14,15 However, these numbers must be interpreted with care due to the absence of an objective and independent gold standard.
The absence of an objective gold standard does not mean CRPS type 1 is not a “real” disorder.12 In developing diagnostic criteria for CRPS, the IASP turned to models developed for other conditions without objectively measurable findings: the International Headache Society (IHS) classification and the Diagnostic and Statistical Manual of Mental Disorders (DSM). These descriptive systems are based largely on history and self-reported symptoms rather than on clinical signs and laboratory tests. The accuracy of these types of diagnostic criteria is refined over time, through repeated, controlled validation studies using the best means available.11
Specificity of criteria. Specificity has been tested using controls with neuro-pathic conditions.11,12 In these studies, nonblinded clinicians applied CRPS type 1 diagnostic criteria, except the exclusion criterion, to patients who had either CRPS type 1 or neuropathic pain from other causes. Many persons with peripheral neuropathy met criteria for CRPS type 1. However, as stated in the IASP criteria, the diagnosis of CRPS type 1 is not considered until common causes of neuropathic pain and post-traumatic limb pain have been excluded.4 As long as the primary care provider considers and rules out other causes of pain, the clinically relevant specificity of these criteria is likely much higher.
Sensitivity of criteria varies.The sensitivity in these studies is based on a non-independent reference standard. Patients with CRPS type 1 were chosen for these studies using clinical criteria, and these criteria were reapplied by study clinicians to determine sensitivity.11,12 This method does not allow any determination of whether cases of CRPS type 1 might be missed by the criteria. Sensitivity measured in this way more closely resembles interobserver reliability—the likelihood that different clinicians using the same diagnostic criteria will reach the same diagnosis— and it appears quite good, especially for IASP criteria, in these 2 studies.11,12
However, when interobserver reliability has been directly studied, albeit in small studies of 3 and 6 observers, only Veldman’s criteria achieve good reliability; IASP and Bruehl’s criteria appear unreliable ( TABLE 3).15,16 However, IASP and Bruehl’s criteria do fall within the range of reliability of other clinical assessments including medical fitness for a job and shoulder disorders.15
TABLE 1
Diagnostic criteria for CRPS type 1*
| NAME | CRITERIA |
|---|---|
| IASP 1994 consensus criteria4 | Criteria 2, 3 and 4 are necessary for a diagnosis of CRPS type 1.10
|
| Bruehl’s criteria: IASP-family11 |
|
| Veldman’s criteria13 |
|
| *IASP definition of CRSP 1: A variety of painful conditions following injury which appears regionally having a distal predominance of abnormal findings, exceeding in both magnitude and duration the expected clinical course of the inciting event and often resulting in significant impairment of motor function, and showing variable progression over time. (All 3 criteria sets use this definition.) | |
TABLE 2
Accuracy of diagnostic criteria for CRPS type 1
| CRITERIA TESTED | STUDY OF ACCURACY | STUDY QUALITY | CONTROL GROUP | SN | SP | LR+ | LR- | PV+ | PV- |
|---|---|---|---|---|---|---|---|---|---|
| IASP | Bruehl et al, 199911 | 3 (non-indep. ref. standard | Patients with diabetic neuropathy, polyneuropathy, postherpetic neuralgia, and radiculopathy | 98% | 36% | 1.5 | 0.1 | 0.21 | 0.99 |
| IASP | Galer et al, 199812 | 3 (non-indep. ref. standard) | Patients with diabetic neuropathy | 100% | 55% | 2.2 | 0 | 0.28 | 1.0 |
| Bruehl’s | Bruehl et al, 199911 | 3 (non-indep. ref. standard) | Patients with diabetic neuropathy, polyneuropathy, postherpetic neuralgia and radiculopathy | 70% | 94% | 12 | 0.3 | 0.67 | 0.94 |
| Sn, sensitivity; Sp, specificity; LR+, positive likelihood ratio; LR-, negative likelihood ratio; PV+, positive predictive value (probability of disease given a positive test); PV-, negative predictive value (probability of disease given a negative test). PV+ and PV- assume baseline likelihood of disease of 15%. | |||||||||
TABLE 3
Interobserver reliability of diagnostic criteria for CRPS type 1
| DIAGNOSTIC CRITERIA TESTED | STUDY QUALITY | STUDY SIZE | INTEROBSERVER RELIABILITY |
|---|---|---|---|
| IASP15 | 2 (small cohort study) | 6 diagnosticians | Poor |
| Bruehl’s15 | 2 (small cohort study) | 6 diagnosticians | Borderline moderate |
| Veldman’s16 | 2 (small cohort study) | 3 diagnosticians | Good |
Factors undermining objective evaluation
Despite clinically based diagnostic criteria, researchers and physicians continue to use office, laboratory, and radiographic tests to diagnose CRPS type 1,1,10 perhaps in an attempt to provide a more objective basis for the diagnosis. However, the evaluation of these methods has been plagued by difficulties.
First, because current clinical diagnostic criteria are not yet optimized or even standardized in the literature, there is no gold standard by which to measure the accuracy of these tests.
Second, patients in different studies have been diagnosed with CRPS type 1 by varying criteria.
Third, CRPS type 1 presents differently in different people, and symptoms and signs vary over time in the same person. As a result, the sets of diagnostic criteria have been designed with various clinical findings, and CRPS patients may meet only a few at any one time.
For example, if a group of CRPS type 1 patients were tested for sweating abnormalities, only 24% at best might be expected to test positive (see TABLE 4 for representative frequency of symptoms and signs),17 resulting in an apparent sensitivity of 24% for sweating abnormalities. This is why it is important for clinicians to consider patients’ report of typical signs even when these signs are not present on exam when making a diagnosis of CRPS type 1.
TABLE 4
Frequency of symptoms and clinically observed signs in CRPS type 1
| Variables | SIGNS (%) | Symptoms (%) |
|---|---|---|
| Allodynia | 74 | — |
| Decreased range of motion | 70 | 80 |
| Color changes | 66 | 87 |
| Hyperalgesia | 63 | — |
| Temperature asymmetry | 56 | 79 |
| Edema | 56 | 80 |
| Weakness | 56 | 75 |
| Sweating changes | 24 | 53 |
| Skin changes | 20 | 24 |
| Dystonia | 14 | 20 |
| Nail changes | 9 | 21 |
| Hair changes | 9 | 19 |
| Tremor | 9 | 24 |
| Hyperesthesia | — | 65 |
| “Burning” pain | — | 81 |
| By exam or report in patients meeting IASP criteria for CRPS, adapted from Harden et al, 1999.17 | ||
Diagnostic instrumentation adds little
Some investigators have tried using instruments to measure the clinically apparent signs included in diagnostic criteria— volumetry to measure edema, thermometry to measure skin temperature differences, and resting sweat output (RSO) to measure sweating.
Confounding nature of CRPS 1. The value of these tests is limited by factors such as the duration of CRPS type 1, time of day, relaxation of the subject, ambient temperature, body temperature, and exact placement of the measuring device,18,19 so it is not clear that objective measurement is practical or adds precision. In fact, in a study comparing testing to clinical diagnosis, instrumentation added little to the overall accuracy of diagnosing CRPS type 1 (LOE: 2, prospective cohort study).14
Sympathetic nerve block unhelpful. Other investigators have focused on testing to improve or replace clinical diagnostic criteria. Although at one time a response to sympathetic block was considered diagnostic for CRPS type 1,4 subsequent studies have demonstrated there is a significant placebo response to sympathetic block, that many persons with CRPS type 1 do not respond, and that some persons with other neuropathic pain conditions do respond. A negative or positive response to sympathetic block cannot rule CRPS type 1 in or out (LOE: 2, systematic reviews with only a few high-quality studies).20-22
Radiographic findings add nothing. Bone scanning (scintigraphy) and radiography have been used frequently in the diagnosis of CRPS type 1. Although 3phase scintigraphy looking for different uptake of radioisotope between affected and unaffected limbs has been touted as an objective and definitive test for CRPS type 1,23 this method also suffers from the subjective interpretation of the radiologist and poor interobserver reliability.24 Researchers disagree on whether the typical appearance on scintigraphy is periarticular cuffing 25,26 or diffuse uptake of radioisotope,27 and about whether delayed phase scintigraphy is adequate 26 or whether 3-phase scintigraphy is necessary.27
To make the interpretation of these scans more objective, quantitative analysis of bone scans has been undertaken; however, subjective interpretation was required to decide where to measure the uptake and what degree of difference between affected and unaffected limbs was considered positive for CRPS type 1.27
In 1 study, without mention of whether the radiologist was blinded but using an appropriate post-traumatic control group, sensitivity of 80% and specificity of 80% were reported (LOE: 2, casecontrol design).27 In a cohort of persons with upper extremity pain, also without mention of blinding, sensitivity of 73% and specificity of 86% were reported (LOE: 2, cohort design).25 Using normal controls, not a clinically relevant comparison, sensitivity of 97% and specificity of 86% using bone scans have been reported (LOE: 2, case control design).26
Despite the reasonable sensitivity and specificity of the bone scans in these studies, clinical assessment was used as the gold standard for diagnosis and the bone scans did not add any degree of accuracy to that clinical assessment. Based on these studies, clinicians using a bone scan to rule in or rule out CRPS type 1 instead of using a clinical assessment risk missing up to 27% of cases and over-diagnosing 20% of cases.
Older literature suggested that osteopenia/porosis demonstrated on plain radiography or dual energy x-ray absorptiometry (DEXA) scanning was important for the diagnosis of CRPS type 1, but more recent studies have revealed sensitivity for plain radiography as low as 23% (LOE: 2, exploratory cohort study with good reference standards)13 and for DEXA a sensitivity of 76% (LOE: 2, case-control design).28 No studies were identified that used a control group post-trauma, so an adequate assessment of specificity has not been made.
Applying the evidence in practice
CRPS type 1 is often relegated to specialists. But, in fact, no special equipment or testing is required for the diagnosis of CRPS type 1, and the best treatments appear to be non-invasive and completely within the realm of family medicine.
With more attention to deviations from the normal course of recovery from trauma, the family physician will begin to recognize more cases of CRPS type 1 and can have full confidence that the treatments prescribed and monitored are in fact the treatments of choice.
Preventing CRPS 1
For persons with hemiplegia, and of course early inpatient rehabilitation of post-stroke patients with upper extremity hemiplegia. Give 500 mg of vitamin C daily to post-fracture patients in the hope of preventing CRPS type 1 (SOR: B).
Researchers have been unable to identify the underlying pathophysiology for CRPS type 1, perhaps in part because patients with different pathophysiologies may present with similar clinical findings.9 Recent discovery of an HLA linkage suggests that there may be a genetic predisposition to CRPS type 1.40
By definition, in CRPS type 1 no major nerve damage can be detected, but there may be damage to nerve fibers too small to detect on electromyograph. Research suggests that injured peripheral C-fibers and A-delta pain fibers immediately flood the central nervous system (CNS) with neurochemicals via the dorsal root ganglion and central pain projecting neurons of the CNS. The CNS is pathologically altered and sends signals to the injured area that serve to maintain the clinical signs and symptoms of CRPS type 1: peripheral pain and sensory changes, local sympathetic changes in blood vessels and sweat glands, and local motor changes.9 Abnormal sympathetic activity can be clearly demonstrated, but there is no evidence to suggest that this is the cause of CRSP type 1.41
Base evaluation on history and physical exam
More often, the family physician will be in the position of evaluating persistent post-traumatic pain. Given the absence of compelling evidence in the literature, rely on your experience to guide the work up.
To diagnose CRPS type 1, first rule out other diseases (FIGURE).4 The frequency with which other conditions occur in persons at risk for CRPS type 1 is not known because the research concerning CRPS type 1 has been undertaken in specialty care clinics; primary care physicians had already done the work of excluding many other disorders.
Physical diagnosis. The differential diagnosis for limb pain is extensive and includes fracture non-union, tendonitis, diabetic neuropathy,4 osteomyelitis or cellulitis,13 polyneuropathy, radiculopathy,11 phlebothrombosis,13 and Raynaud’s disease.13 Physical exam will reveal signs of infection, focal tenderness consistent with tendonitis, erythema suggestive of cellulitis, a distribution of pain following a nerve suggestive of radiculopathy or carpal tunnel syndrome, or the stocking-glove distribution diabetic neuropathy.
Auxiliary testing. Limited testing may be helpful. Plain radiography or bone scanning may identify a poorly healed fracture or other bony lesions. A white blood cell count and inflammatory markers may identify infection or autoimmune disorders.
Using the diagnostic criteria. Once other disorders have been ruled out, evidence does support the diagnosis of CRPS type 1 based on history and physical exam without further testing (SOR: B). In the absence of clear evidence supporting 1 set of criteria over the others, clinicians may use IASP, Bruehl’s, or Veldman’s clinical criteria for diagnosis (SOR: C). While the IASP criteria are nonspecific and possibly not as reproducible as Bruehl’s or Veldman’s criteria, they are cited more widely the literature including treatment trials. The criteria (FIGURE) can also be combined to encompass their complementary aspects (SOR: C, this author’s opinion).
CRPS has historically been described as comprising 2 distinct subtypes: type 1, also known as reflex sympathetic dystrophy, in which nerve damage is not detectable, and type 2, also known as causalgia, in which nerve damage can be detected by electromyograph (EMG) but pain is not confined to the distribution of that nerve.4 However, the clinical relevance of distinguishing the 2 types of CRPS has not been proven. Although the mechanism of pain is hypothesized to be different, thus far the 2 syndromes appear to be clinically similar (LOE: 2, case-control study).11 Many, but not all, recent articles on treatment of CRPS combine types 1 and 2 in their subject populations. Yet, because CRPS types 1 and 2 have not yet been officially merged and because some researchers continue to make the distinction in studies, this paper will focus on CRPS type 1.
The nature of, diagnostic criteria for, and even the naming of CRPS have been controversial. In 1995 the International Association for the Study of Pain (IASP) recommended abandoning the commonly used term reflex sympathetic dystrophy because: 1) the existence of a “reflex” is questionable, 2) “sympathetic” or autonomic changes may not be causative, and 3) “dystrophy” is rare.4 Despite this recommendation, a review of the literature 5 years later revealed that the terms reflex sympathetic dystrophy and causalgia are still commonly used, along with algodystrophy, shoulder-hand syndrome, Sudeck’s atrophy, and transient osteoporosis.42
ACKNOWLEDGMENTS
The authors would like to express their appreciation to Cheryl Mongillo, Peggy Lardear, and Brian Pellini for their assistance in preparing the manuscript, Dolores Moran and Diane Wolfe for their assistance in finding articles, and to Roger Rodrigue, MD for reviewing the manuscript. Funding for this project was provided by a grant from the Delaware Department of Health and Social Services, Division of Public Health.
CORRESPONDING AUTHOR
Anna Quisel, MD, Anna Quisel, MD, c/o Cheryl Mongillo, Family Medicine Center, 1401 Foulk Road, Wilmington, DE 19803. E-mail: [email protected].
1. Allen G, Galer BS, Schwartz L. Epidemiology of complex regional pain syndrome: a retrospective chart review of 134 patients. Pain 1999;80:539-544.
2. Birklein F, Kunzel W, Sieweke N. Despite clinical similarities there are significant differences between acute limb trauma and complex regional pain syndrome I (CRPS I). Pain 2001;93:165-171.
3. Schurmann M, Gradl G, Andress HJ, Furst H, Schildberg FW. Assessment of peripheral sympathetic nervous function for diagnosing early posttraumatic complex regional pain syndrome type I. Pain 1999;80:149-159.
4. Stanton-Hicks M, Janig W, Hassenbusch S, Haddox JD, Boas R, Wilson P. Reflex sympathetic dystrophy: changing concepts and taxonomy. Pain 1995;63:127-133.
5. Lynch ME. Psychological aspects of reflex sympathetic dystrophy: a review of the adult and paediatric literature. Pain 1992;49:337-347.
6. Field J, Atkins R. Algodystrophy is an early complication of Colles’ fracture: What are the implications. J Hand Surg Br 1997;22B(2):178-182.
7. Reinders MF, Geertzen JH, Dijkstra PU. Complex regional pain syndrome type I: use of the International Association for the Study of Pain diagnostic criteria defined in 1994. Clin J Pain 2002;18:207-215.
8. Atkins R, Duckworth T, Kanis JA. Algodystrophy following Colles’ fracture. J Hand Surg Br 1989;14:161-164.
9. Baron R, Fields HL, Janig W, Kitt C, Levine JD. National Institutes of Health Workshop: reflex sympathetic dystrophy/complex regional pain syndromes— state-of-the-science. Anesth Analg 2002;95:1812-1816.
10. van de Beek WJ, Schwartzman RJ, van Nes SI, Delhaas EM, van Hilten JJ. Diagnostic criteria used in studies of reflex sympathetic dystrophy. Neurology 2002;58:522-526.
11. Bruehl S, Harden RN, Galer BS, et al. External validation of IASP diagnostic criteria for Complex Regional Pain Syndrome and proposed research diagnostic criteria. International Association for the Study of Pain. Pain 1999;81:147-154.
12. Galer BS, Bruehl S, Harden RN. IASP diagnostic criteria for complex regional pain syndrome: a preliminary empirical validation study. Clin J Pain 1998;14:48-54.
13. Veldman PH, Reynen HM, Arntz IE, Goris RJ. Signs and symptoms of reflex sympathetic dystrophy: prospective study of 829 patients. Lancet 1993;342:1012-1016.
14. Oerlemans HM, Oostendorp RA, de Boo T, Perez RS, Goris RJ. Signs and symptoms in complex regional pain syndrome type I/reflex sympathetic dystrophy: judgment of the physician versus objective measurement. Clin J Pain 1999;15:224-232.
15. van de Vusse AC, Stomp-van den Berg SG, de Vet HC, Weber WE. Interobserver reliability of diagnosis in patients with complex regional pain syndrome. Eur J Pain 2003;7:259-265.
16. Perez RS, Burm PE, Zuurmond WW, et al. Interrater reliability of diagnosing complex regional pain syndrome type I. Acta Anaesthesiologica Scandinavica 2002;46:447-450.
17. Harden RN, Bruehl S, Galer BS, et al. Complex regional pain syndrome: are the IASP diagnostic criteria valid and sufficiently comprehensive? Pain 1999;83:211-219.
18. Wasner G, Schattschneider J, Baron R. Skin temperature side differences—a diagnostic tool for CRPS? Pain 2002;98:19-26.
19. Sandroni P, Low PA, Ferrer T, Opfer-Gehrking TL, Willner CL, Wilson PR. Complex regional pain syndrome I (CRPS I): prospective study and laboratory evaluation. Clin J Pain 1998;14:282-289.
20. Kingery WS. A critical review of controlled clinical trials for peripheral neuropathic pain and complex regional pain syndromes. Pain 1997;73:123-139.
21. Perez RS, Kwakkel G, Zuurmond WW, de Lange JJ. Treatment of reflex sympathetic dystrophy (CRPS type 1). a research synthesis of 21 randomized clinical trials. J Pain Symptom Manage 2001;21:511-526.
22. Cepeda MS, Lau J, Carr DB. Defining the therapeutic role of local anesthetic sympathetic blockade in complex regional pain syndrome: a narrative and systematic review. Clin J Pain 2002;18:216-233.
23. Demangeat JL, Constantinesco A, Brunot B, Foucher G, Farcot JM. Three-phase bone scanning in reflex sympathetic dystrophy of the hand. J Nucl Med 1988;29:26-32.
24. Lee GW, Weeks PM. The role of bone scintigraphy in diagnosing reflex sympathetic dystrophy [comment]. J Hand Surg Amer 1995;20:458-463.
25. Schiepers C, Bormans I, De Roo M. Three-phase bone scan and dynamic vascular scintigraphy in algoneurodystrophy of the upper extremity. Acta Orthop Belg 1998;64:322-327.
26. Todorovic-Tirnanic M, Obradovic V, Han R, et al. Diagnostic approach to reflex sympathetic dystrophy after fracture: radiography or bone scintigraphy? Eur J Nuclear Med 1995;22:1187-1193.
27. Zyluk A. The usefulness of quantitative evaluation of three-phase scintigraphy in the diagnosis of posttraumatic reflex sympathetic dystrophy. J Hand Surg 1999;24:16-21.
28. Chapurlat RD, Duboeuf FP, Liens D, Meunier PJ. Dual energy x-ray absorptiometry in patients with low limb reflex sympathetic dystrophy syndrome. J Rheumatol 1996;23:1557-1559.
29. Murray CS, Cohen A, Perkins T, Davidson JE, Sills JA. Morbidity in reflex sympathetic dystrophy. Arch Dis Child 2000;82:231-233.
30. Wesdock KA, Stanton RP, Singsen BH. Reflex sympathetic dystrophy in children. A physical therapy approach. Arthritis Care Res 1991;4:32-38.
31. Sandroni P, Benrud-Larson LM, McClelland RL, Low PA. Complex regional pain syndrome type I: incidence and prevalence in Olmsted county, a population-based study. Pain 2003;103:199-207.
32. Hove LM. Nerve entrapment and reflex sympathetic dystrophy after fractures of the distal radius. Scan J. Plast Resconstr Surg Hand Surg 1995;29:53-58.
33. Schurmann M, Gradl G, Zaspel J, Kayser M, Lohr P, Andress HJ. Peripheral sympathetic function as a predictor of complex regional pain syndrome type I (CRPS I) in patients with radial fracture. Auton Neurosci 2000;86:127-134.
34. Bickerstaff DR, Kanis JA. Algodystrophy: an underrecognized complication of minor trauma. Br J Rheumatol 1994;33:240-248.
35. Sarangi PP, Ward AJ, Smith EJ, Staddon GE, Atkins RM. Algodystrophy and osteoporosis after tibial fractures. J Bone Joint Surg Br 1993;75:450-452.
36. Greyson ND, Tepperman PS. Three-phase bone studies in hemiplegia with reflex sympathetic dystrophy and the effect of disuse. J Nucl Med 1984;25:423-429.
37. Wang YL, Tsau JC, Huang MH, Lee BH, Li CH. Reflex sympathetic dystrophy syndrome in stroke patients with hemiplegia-three phase bone scintigraphy and clinical characteristics. Kaohsiung J Med Sci 1998;14:40-47.
38. Petchkrua W, Weiss DJ, Patel RR. Reassessment of the incidence of complex regional pain syndrome type 1 following stroke. Neurorehabil Neural Repair 2000;14:59-63.
39. Geertzen JH, Dijkstra PU, van Sonderen EL, Groothoff JW, ten Duis HJ, Eisma WH. Relationship between impairments, disability and handicap in reflex sympathetic dystrophy patients: a long-term follow up study. Clin Rehabil 1998;12:402-412.
40. van de Beek WJ, Roep BO, van der Slik AR, Giphart MJ, van Hilten BJ. Susceptibility loci for complex regional pain syndrome. Pain 2003;103:93-97.
41. Commentary on RSD focus article Bandolier 2002. Available at: www.jr2.ox.ac.uk/bandolier/booth/ painpag/wisdom/RSD.html. Accessed on May 17, 2005.
42. Alvarez-Lario B, Aretxabala-Alcibar I, Alegre-Lopez J, Alonso-Valdivielso JL. Acceptance of the different denominations for reflex sympathetic dystrophy. Ann Rheum Dis 2001;60:77-79.
- Complex regional pain syndrome (CRPS) type 1 may be diagnosed by history and physical exam with no further testing (B). Several different diagnostic criteria have undergone validity testing: the 1993 IASP criteria, Bruehl’s criteria, and Veldman’s criteria; there is no compelling reason to recommend 1 set of criteria over the others (C).
- Some cases of CRPS type 1 may be preventable. Some cases of CRPS type 1 in post-stroke upper extremity hemiplegia (also known as shoulder-hand syndrome) may be prevented by early inpatient rehabilitation (C) and avoidance of shoulder trauma to the affected arm (B). Some cases of post-fracture CRPS type 1 may be prevented with 500 mg vitamin C daily started upon diagnosis of fracture and continued through healing (B).
Do you have a patient recovering from a limb fracture who is complaining of pain and tenderness long after most patients with a similar injury would be symptom free? The problem may be an under-recognized one—complex regional pain syndrome (CRPS) type 1, also known as reflex sympathetic dystrophy. The problem is also encountered in immobilized limbs of post-stroke patients.
Persons with persistent post-traumatic pain eventually diagnosed with CRPS type 1 often undergo unnecessary testing resulting in inappropriate or delayed treatment.1
Signs and symptoms typical of CRPS type 1 can also occur transiently with a normally recovering immobilized limb,2,3 so diagnosis of CRPS type 1 is based on increasing severity and duration of signs and symptoms (level of evidence [LOE]: 3; consensus guidelines)4:
- pain
- hyperalgesia/allodynia (pain or exaggerated response resulting from a normally painless or only slightly painful stimulus)
- joint stiffness
- swelling
- autonomic abnormalities (often sweating and temperature differences compared with the unaffected limb).
Diagnosis: Watch recovery course over first 9 weeks
Clinicians face a number of challenges in diagnosing CRPS type 1. No psychological or personality traits appear to predispose to CRPS type 1 (LOE: 2, lower-quality literature review).5 Fracture types and severity of injury among persons who develop CRPS type 1 are not significantly different from persons who recover normally (LOE: 2, case control studies).6,7 The key is to remain alert to deviation from the normal course of recovery.
Studies have shown that 9 weeks post injury, persons with persistent pain, tenderness, swelling, joint stiffness (fingers and wrist), and sweating or temperature changes in the injured limb may have CRPS type 1 (LOE: 2, case series and case control studies).6,8 In a prospective case series (n=109), no new cases of CRPS type 1 developed beyond 9 weeks (LOE: 2, case series).8
Diagnostic criteria: No consensus
No one test identifies all persons with CRPS type 1. There is no objective gold standard for diagnosis.9 Instead, researchers and clinicians must rely on clinically derived diagnostic criteria. Unfortunately, despite the development of diagnostic criteria by the IASP in 1994 (TABLE 1),4 experts have not reached consensus on the best method of diagnosis, and several different sets of diagnostic criteria are used.7,10
Initial IASP criteria.Of these, the 1994 IASP consensus-based diagnostic criteria appear to be most widely used in the litera- ture. These criteria were intended as a starting point, requiring validation through future clinical research.4,11 In further studies using controls with neuropathic conditions, IASP criteria have demonstrated low specificity (TABLE 2 ).11,12
The diagnosis of CRPS type I is often missed,1,29,30so it is likely that the diagnosis rate per population of 0.02% reported in a recent population based study is an underestimate of the actual prevalence.31 After distal radial fracture, rates of CRPS type I have varied widely in reports, from 0.9% 32 to 15% 33 to 28%.34 After tibial shaft fracture, Sarangi et al 35 reported that 30% of persons developed CRPS type I.
In cases of post-stroke hemiplegia, CRPS type I has been reported in the paralyzed arm at rates between 25% 36 and 40%.37 However, in a more recent study among stroke patients in the US who underwent early inpatient rehabilitation, Petchkrua et al reported a lower incidence of about 2%.38 Impairment can be severe among persons with persistent CRPS type 1. A prospective study revealed that activities of daily living were significantly impaired in 62% of persons with chronic CRPS type 1.39
Criteria refinements.Derived from 1 of these studies, Bruehl’s criteria were subsequently developed to improve the IASP criteria (TABLE 1).11Several other sets of diagnostic criteria exist, but only Veldman’s criteria ( TABLE 1),13 which have been adopted as the standard in the Netherlands, have undergone further study.14 Studies of Bruehl’s and IASP criteria have measured specificity and sensitivity, and along with Veldman’s criteria, interobserver reliability (TABLE 2 ).11,12,14,15 However, these numbers must be interpreted with care due to the absence of an objective and independent gold standard.
The absence of an objective gold standard does not mean CRPS type 1 is not a “real” disorder.12 In developing diagnostic criteria for CRPS, the IASP turned to models developed for other conditions without objectively measurable findings: the International Headache Society (IHS) classification and the Diagnostic and Statistical Manual of Mental Disorders (DSM). These descriptive systems are based largely on history and self-reported symptoms rather than on clinical signs and laboratory tests. The accuracy of these types of diagnostic criteria is refined over time, through repeated, controlled validation studies using the best means available.11
Specificity of criteria. Specificity has been tested using controls with neuro-pathic conditions.11,12 In these studies, nonblinded clinicians applied CRPS type 1 diagnostic criteria, except the exclusion criterion, to patients who had either CRPS type 1 or neuropathic pain from other causes. Many persons with peripheral neuropathy met criteria for CRPS type 1. However, as stated in the IASP criteria, the diagnosis of CRPS type 1 is not considered until common causes of neuropathic pain and post-traumatic limb pain have been excluded.4 As long as the primary care provider considers and rules out other causes of pain, the clinically relevant specificity of these criteria is likely much higher.
Sensitivity of criteria varies.The sensitivity in these studies is based on a non-independent reference standard. Patients with CRPS type 1 were chosen for these studies using clinical criteria, and these criteria were reapplied by study clinicians to determine sensitivity.11,12 This method does not allow any determination of whether cases of CRPS type 1 might be missed by the criteria. Sensitivity measured in this way more closely resembles interobserver reliability—the likelihood that different clinicians using the same diagnostic criteria will reach the same diagnosis— and it appears quite good, especially for IASP criteria, in these 2 studies.11,12
However, when interobserver reliability has been directly studied, albeit in small studies of 3 and 6 observers, only Veldman’s criteria achieve good reliability; IASP and Bruehl’s criteria appear unreliable ( TABLE 3).15,16 However, IASP and Bruehl’s criteria do fall within the range of reliability of other clinical assessments including medical fitness for a job and shoulder disorders.15
TABLE 1
Diagnostic criteria for CRPS type 1*
| NAME | CRITERIA |
|---|---|
| IASP 1994 consensus criteria4 | Criteria 2, 3 and 4 are necessary for a diagnosis of CRPS type 1.10
|
| Bruehl’s criteria: IASP-family11 |
|
| Veldman’s criteria13 |
|
| *IASP definition of CRSP 1: A variety of painful conditions following injury which appears regionally having a distal predominance of abnormal findings, exceeding in both magnitude and duration the expected clinical course of the inciting event and often resulting in significant impairment of motor function, and showing variable progression over time. (All 3 criteria sets use this definition.) | |
TABLE 2
Accuracy of diagnostic criteria for CRPS type 1
| CRITERIA TESTED | STUDY OF ACCURACY | STUDY QUALITY | CONTROL GROUP | SN | SP | LR+ | LR- | PV+ | PV- |
|---|---|---|---|---|---|---|---|---|---|
| IASP | Bruehl et al, 199911 | 3 (non-indep. ref. standard | Patients with diabetic neuropathy, polyneuropathy, postherpetic neuralgia, and radiculopathy | 98% | 36% | 1.5 | 0.1 | 0.21 | 0.99 |
| IASP | Galer et al, 199812 | 3 (non-indep. ref. standard) | Patients with diabetic neuropathy | 100% | 55% | 2.2 | 0 | 0.28 | 1.0 |
| Bruehl’s | Bruehl et al, 199911 | 3 (non-indep. ref. standard) | Patients with diabetic neuropathy, polyneuropathy, postherpetic neuralgia and radiculopathy | 70% | 94% | 12 | 0.3 | 0.67 | 0.94 |
| Sn, sensitivity; Sp, specificity; LR+, positive likelihood ratio; LR-, negative likelihood ratio; PV+, positive predictive value (probability of disease given a positive test); PV-, negative predictive value (probability of disease given a negative test). PV+ and PV- assume baseline likelihood of disease of 15%. | |||||||||
TABLE 3
Interobserver reliability of diagnostic criteria for CRPS type 1
| DIAGNOSTIC CRITERIA TESTED | STUDY QUALITY | STUDY SIZE | INTEROBSERVER RELIABILITY |
|---|---|---|---|
| IASP15 | 2 (small cohort study) | 6 diagnosticians | Poor |
| Bruehl’s15 | 2 (small cohort study) | 6 diagnosticians | Borderline moderate |
| Veldman’s16 | 2 (small cohort study) | 3 diagnosticians | Good |
Factors undermining objective evaluation
Despite clinically based diagnostic criteria, researchers and physicians continue to use office, laboratory, and radiographic tests to diagnose CRPS type 1,1,10 perhaps in an attempt to provide a more objective basis for the diagnosis. However, the evaluation of these methods has been plagued by difficulties.
First, because current clinical diagnostic criteria are not yet optimized or even standardized in the literature, there is no gold standard by which to measure the accuracy of these tests.
Second, patients in different studies have been diagnosed with CRPS type 1 by varying criteria.
Third, CRPS type 1 presents differently in different people, and symptoms and signs vary over time in the same person. As a result, the sets of diagnostic criteria have been designed with various clinical findings, and CRPS patients may meet only a few at any one time.
For example, if a group of CRPS type 1 patients were tested for sweating abnormalities, only 24% at best might be expected to test positive (see TABLE 4 for representative frequency of symptoms and signs),17 resulting in an apparent sensitivity of 24% for sweating abnormalities. This is why it is important for clinicians to consider patients’ report of typical signs even when these signs are not present on exam when making a diagnosis of CRPS type 1.
TABLE 4
Frequency of symptoms and clinically observed signs in CRPS type 1
| Variables | SIGNS (%) | Symptoms (%) |
|---|---|---|
| Allodynia | 74 | — |
| Decreased range of motion | 70 | 80 |
| Color changes | 66 | 87 |
| Hyperalgesia | 63 | — |
| Temperature asymmetry | 56 | 79 |
| Edema | 56 | 80 |
| Weakness | 56 | 75 |
| Sweating changes | 24 | 53 |
| Skin changes | 20 | 24 |
| Dystonia | 14 | 20 |
| Nail changes | 9 | 21 |
| Hair changes | 9 | 19 |
| Tremor | 9 | 24 |
| Hyperesthesia | — | 65 |
| “Burning” pain | — | 81 |
| By exam or report in patients meeting IASP criteria for CRPS, adapted from Harden et al, 1999.17 | ||
Diagnostic instrumentation adds little
Some investigators have tried using instruments to measure the clinically apparent signs included in diagnostic criteria— volumetry to measure edema, thermometry to measure skin temperature differences, and resting sweat output (RSO) to measure sweating.
Confounding nature of CRPS 1. The value of these tests is limited by factors such as the duration of CRPS type 1, time of day, relaxation of the subject, ambient temperature, body temperature, and exact placement of the measuring device,18,19 so it is not clear that objective measurement is practical or adds precision. In fact, in a study comparing testing to clinical diagnosis, instrumentation added little to the overall accuracy of diagnosing CRPS type 1 (LOE: 2, prospective cohort study).14
Sympathetic nerve block unhelpful. Other investigators have focused on testing to improve or replace clinical diagnostic criteria. Although at one time a response to sympathetic block was considered diagnostic for CRPS type 1,4 subsequent studies have demonstrated there is a significant placebo response to sympathetic block, that many persons with CRPS type 1 do not respond, and that some persons with other neuropathic pain conditions do respond. A negative or positive response to sympathetic block cannot rule CRPS type 1 in or out (LOE: 2, systematic reviews with only a few high-quality studies).20-22
Radiographic findings add nothing. Bone scanning (scintigraphy) and radiography have been used frequently in the diagnosis of CRPS type 1. Although 3phase scintigraphy looking for different uptake of radioisotope between affected and unaffected limbs has been touted as an objective and definitive test for CRPS type 1,23 this method also suffers from the subjective interpretation of the radiologist and poor interobserver reliability.24 Researchers disagree on whether the typical appearance on scintigraphy is periarticular cuffing 25,26 or diffuse uptake of radioisotope,27 and about whether delayed phase scintigraphy is adequate 26 or whether 3-phase scintigraphy is necessary.27
To make the interpretation of these scans more objective, quantitative analysis of bone scans has been undertaken; however, subjective interpretation was required to decide where to measure the uptake and what degree of difference between affected and unaffected limbs was considered positive for CRPS type 1.27
In 1 study, without mention of whether the radiologist was blinded but using an appropriate post-traumatic control group, sensitivity of 80% and specificity of 80% were reported (LOE: 2, casecontrol design).27 In a cohort of persons with upper extremity pain, also without mention of blinding, sensitivity of 73% and specificity of 86% were reported (LOE: 2, cohort design).25 Using normal controls, not a clinically relevant comparison, sensitivity of 97% and specificity of 86% using bone scans have been reported (LOE: 2, case control design).26
Despite the reasonable sensitivity and specificity of the bone scans in these studies, clinical assessment was used as the gold standard for diagnosis and the bone scans did not add any degree of accuracy to that clinical assessment. Based on these studies, clinicians using a bone scan to rule in or rule out CRPS type 1 instead of using a clinical assessment risk missing up to 27% of cases and over-diagnosing 20% of cases.
Older literature suggested that osteopenia/porosis demonstrated on plain radiography or dual energy x-ray absorptiometry (DEXA) scanning was important for the diagnosis of CRPS type 1, but more recent studies have revealed sensitivity for plain radiography as low as 23% (LOE: 2, exploratory cohort study with good reference standards)13 and for DEXA a sensitivity of 76% (LOE: 2, case-control design).28 No studies were identified that used a control group post-trauma, so an adequate assessment of specificity has not been made.
Applying the evidence in practice
CRPS type 1 is often relegated to specialists. But, in fact, no special equipment or testing is required for the diagnosis of CRPS type 1, and the best treatments appear to be non-invasive and completely within the realm of family medicine.
With more attention to deviations from the normal course of recovery from trauma, the family physician will begin to recognize more cases of CRPS type 1 and can have full confidence that the treatments prescribed and monitored are in fact the treatments of choice.
Preventing CRPS 1
For persons with hemiplegia, and of course early inpatient rehabilitation of post-stroke patients with upper extremity hemiplegia. Give 500 mg of vitamin C daily to post-fracture patients in the hope of preventing CRPS type 1 (SOR: B).
Researchers have been unable to identify the underlying pathophysiology for CRPS type 1, perhaps in part because patients with different pathophysiologies may present with similar clinical findings.9 Recent discovery of an HLA linkage suggests that there may be a genetic predisposition to CRPS type 1.40
By definition, in CRPS type 1 no major nerve damage can be detected, but there may be damage to nerve fibers too small to detect on electromyograph. Research suggests that injured peripheral C-fibers and A-delta pain fibers immediately flood the central nervous system (CNS) with neurochemicals via the dorsal root ganglion and central pain projecting neurons of the CNS. The CNS is pathologically altered and sends signals to the injured area that serve to maintain the clinical signs and symptoms of CRPS type 1: peripheral pain and sensory changes, local sympathetic changes in blood vessels and sweat glands, and local motor changes.9 Abnormal sympathetic activity can be clearly demonstrated, but there is no evidence to suggest that this is the cause of CRSP type 1.41
Base evaluation on history and physical exam
More often, the family physician will be in the position of evaluating persistent post-traumatic pain. Given the absence of compelling evidence in the literature, rely on your experience to guide the work up.
To diagnose CRPS type 1, first rule out other diseases (FIGURE).4 The frequency with which other conditions occur in persons at risk for CRPS type 1 is not known because the research concerning CRPS type 1 has been undertaken in specialty care clinics; primary care physicians had already done the work of excluding many other disorders.
Physical diagnosis. The differential diagnosis for limb pain is extensive and includes fracture non-union, tendonitis, diabetic neuropathy,4 osteomyelitis or cellulitis,13 polyneuropathy, radiculopathy,11 phlebothrombosis,13 and Raynaud’s disease.13 Physical exam will reveal signs of infection, focal tenderness consistent with tendonitis, erythema suggestive of cellulitis, a distribution of pain following a nerve suggestive of radiculopathy or carpal tunnel syndrome, or the stocking-glove distribution diabetic neuropathy.
Auxiliary testing. Limited testing may be helpful. Plain radiography or bone scanning may identify a poorly healed fracture or other bony lesions. A white blood cell count and inflammatory markers may identify infection or autoimmune disorders.
Using the diagnostic criteria. Once other disorders have been ruled out, evidence does support the diagnosis of CRPS type 1 based on history and physical exam without further testing (SOR: B). In the absence of clear evidence supporting 1 set of criteria over the others, clinicians may use IASP, Bruehl’s, or Veldman’s clinical criteria for diagnosis (SOR: C). While the IASP criteria are nonspecific and possibly not as reproducible as Bruehl’s or Veldman’s criteria, they are cited more widely the literature including treatment trials. The criteria (FIGURE) can also be combined to encompass their complementary aspects (SOR: C, this author’s opinion).
CRPS has historically been described as comprising 2 distinct subtypes: type 1, also known as reflex sympathetic dystrophy, in which nerve damage is not detectable, and type 2, also known as causalgia, in which nerve damage can be detected by electromyograph (EMG) but pain is not confined to the distribution of that nerve.4 However, the clinical relevance of distinguishing the 2 types of CRPS has not been proven. Although the mechanism of pain is hypothesized to be different, thus far the 2 syndromes appear to be clinically similar (LOE: 2, case-control study).11 Many, but not all, recent articles on treatment of CRPS combine types 1 and 2 in their subject populations. Yet, because CRPS types 1 and 2 have not yet been officially merged and because some researchers continue to make the distinction in studies, this paper will focus on CRPS type 1.
The nature of, diagnostic criteria for, and even the naming of CRPS have been controversial. In 1995 the International Association for the Study of Pain (IASP) recommended abandoning the commonly used term reflex sympathetic dystrophy because: 1) the existence of a “reflex” is questionable, 2) “sympathetic” or autonomic changes may not be causative, and 3) “dystrophy” is rare.4 Despite this recommendation, a review of the literature 5 years later revealed that the terms reflex sympathetic dystrophy and causalgia are still commonly used, along with algodystrophy, shoulder-hand syndrome, Sudeck’s atrophy, and transient osteoporosis.42
ACKNOWLEDGMENTS
The authors would like to express their appreciation to Cheryl Mongillo, Peggy Lardear, and Brian Pellini for their assistance in preparing the manuscript, Dolores Moran and Diane Wolfe for their assistance in finding articles, and to Roger Rodrigue, MD for reviewing the manuscript. Funding for this project was provided by a grant from the Delaware Department of Health and Social Services, Division of Public Health.
CORRESPONDING AUTHOR
Anna Quisel, MD, Anna Quisel, MD, c/o Cheryl Mongillo, Family Medicine Center, 1401 Foulk Road, Wilmington, DE 19803. E-mail: [email protected].
1. Allen G, Galer BS, Schwartz L. Epidemiology of complex regional pain syndrome: a retrospective chart review of 134 patients. Pain 1999;80:539-544.
2. Birklein F, Kunzel W, Sieweke N. Despite clinical similarities there are significant differences between acute limb trauma and complex regional pain syndrome I (CRPS I). Pain 2001;93:165-171.
3. Schurmann M, Gradl G, Andress HJ, Furst H, Schildberg FW. Assessment of peripheral sympathetic nervous function for diagnosing early posttraumatic complex regional pain syndrome type I. Pain 1999;80:149-159.
4. Stanton-Hicks M, Janig W, Hassenbusch S, Haddox JD, Boas R, Wilson P. Reflex sympathetic dystrophy: changing concepts and taxonomy. Pain 1995;63:127-133.
5. Lynch ME. Psychological aspects of reflex sympathetic dystrophy: a review of the adult and paediatric literature. Pain 1992;49:337-347.
6. Field J, Atkins R. Algodystrophy is an early complication of Colles’ fracture: What are the implications. J Hand Surg Br 1997;22B(2):178-182.
7. Reinders MF, Geertzen JH, Dijkstra PU. Complex regional pain syndrome type I: use of the International Association for the Study of Pain diagnostic criteria defined in 1994. Clin J Pain 2002;18:207-215.
8. Atkins R, Duckworth T, Kanis JA. Algodystrophy following Colles’ fracture. J Hand Surg Br 1989;14:161-164.
9. Baron R, Fields HL, Janig W, Kitt C, Levine JD. National Institutes of Health Workshop: reflex sympathetic dystrophy/complex regional pain syndromes— state-of-the-science. Anesth Analg 2002;95:1812-1816.
10. van de Beek WJ, Schwartzman RJ, van Nes SI, Delhaas EM, van Hilten JJ. Diagnostic criteria used in studies of reflex sympathetic dystrophy. Neurology 2002;58:522-526.
11. Bruehl S, Harden RN, Galer BS, et al. External validation of IASP diagnostic criteria for Complex Regional Pain Syndrome and proposed research diagnostic criteria. International Association for the Study of Pain. Pain 1999;81:147-154.
12. Galer BS, Bruehl S, Harden RN. IASP diagnostic criteria for complex regional pain syndrome: a preliminary empirical validation study. Clin J Pain 1998;14:48-54.
13. Veldman PH, Reynen HM, Arntz IE, Goris RJ. Signs and symptoms of reflex sympathetic dystrophy: prospective study of 829 patients. Lancet 1993;342:1012-1016.
14. Oerlemans HM, Oostendorp RA, de Boo T, Perez RS, Goris RJ. Signs and symptoms in complex regional pain syndrome type I/reflex sympathetic dystrophy: judgment of the physician versus objective measurement. Clin J Pain 1999;15:224-232.
15. van de Vusse AC, Stomp-van den Berg SG, de Vet HC, Weber WE. Interobserver reliability of diagnosis in patients with complex regional pain syndrome. Eur J Pain 2003;7:259-265.
16. Perez RS, Burm PE, Zuurmond WW, et al. Interrater reliability of diagnosing complex regional pain syndrome type I. Acta Anaesthesiologica Scandinavica 2002;46:447-450.
17. Harden RN, Bruehl S, Galer BS, et al. Complex regional pain syndrome: are the IASP diagnostic criteria valid and sufficiently comprehensive? Pain 1999;83:211-219.
18. Wasner G, Schattschneider J, Baron R. Skin temperature side differences—a diagnostic tool for CRPS? Pain 2002;98:19-26.
19. Sandroni P, Low PA, Ferrer T, Opfer-Gehrking TL, Willner CL, Wilson PR. Complex regional pain syndrome I (CRPS I): prospective study and laboratory evaluation. Clin J Pain 1998;14:282-289.
20. Kingery WS. A critical review of controlled clinical trials for peripheral neuropathic pain and complex regional pain syndromes. Pain 1997;73:123-139.
21. Perez RS, Kwakkel G, Zuurmond WW, de Lange JJ. Treatment of reflex sympathetic dystrophy (CRPS type 1). a research synthesis of 21 randomized clinical trials. J Pain Symptom Manage 2001;21:511-526.
22. Cepeda MS, Lau J, Carr DB. Defining the therapeutic role of local anesthetic sympathetic blockade in complex regional pain syndrome: a narrative and systematic review. Clin J Pain 2002;18:216-233.
23. Demangeat JL, Constantinesco A, Brunot B, Foucher G, Farcot JM. Three-phase bone scanning in reflex sympathetic dystrophy of the hand. J Nucl Med 1988;29:26-32.
24. Lee GW, Weeks PM. The role of bone scintigraphy in diagnosing reflex sympathetic dystrophy [comment]. J Hand Surg Amer 1995;20:458-463.
25. Schiepers C, Bormans I, De Roo M. Three-phase bone scan and dynamic vascular scintigraphy in algoneurodystrophy of the upper extremity. Acta Orthop Belg 1998;64:322-327.
26. Todorovic-Tirnanic M, Obradovic V, Han R, et al. Diagnostic approach to reflex sympathetic dystrophy after fracture: radiography or bone scintigraphy? Eur J Nuclear Med 1995;22:1187-1193.
27. Zyluk A. The usefulness of quantitative evaluation of three-phase scintigraphy in the diagnosis of posttraumatic reflex sympathetic dystrophy. J Hand Surg 1999;24:16-21.
28. Chapurlat RD, Duboeuf FP, Liens D, Meunier PJ. Dual energy x-ray absorptiometry in patients with low limb reflex sympathetic dystrophy syndrome. J Rheumatol 1996;23:1557-1559.
29. Murray CS, Cohen A, Perkins T, Davidson JE, Sills JA. Morbidity in reflex sympathetic dystrophy. Arch Dis Child 2000;82:231-233.
30. Wesdock KA, Stanton RP, Singsen BH. Reflex sympathetic dystrophy in children. A physical therapy approach. Arthritis Care Res 1991;4:32-38.
31. Sandroni P, Benrud-Larson LM, McClelland RL, Low PA. Complex regional pain syndrome type I: incidence and prevalence in Olmsted county, a population-based study. Pain 2003;103:199-207.
32. Hove LM. Nerve entrapment and reflex sympathetic dystrophy after fractures of the distal radius. Scan J. Plast Resconstr Surg Hand Surg 1995;29:53-58.
33. Schurmann M, Gradl G, Zaspel J, Kayser M, Lohr P, Andress HJ. Peripheral sympathetic function as a predictor of complex regional pain syndrome type I (CRPS I) in patients with radial fracture. Auton Neurosci 2000;86:127-134.
34. Bickerstaff DR, Kanis JA. Algodystrophy: an underrecognized complication of minor trauma. Br J Rheumatol 1994;33:240-248.
35. Sarangi PP, Ward AJ, Smith EJ, Staddon GE, Atkins RM. Algodystrophy and osteoporosis after tibial fractures. J Bone Joint Surg Br 1993;75:450-452.
36. Greyson ND, Tepperman PS. Three-phase bone studies in hemiplegia with reflex sympathetic dystrophy and the effect of disuse. J Nucl Med 1984;25:423-429.
37. Wang YL, Tsau JC, Huang MH, Lee BH, Li CH. Reflex sympathetic dystrophy syndrome in stroke patients with hemiplegia-three phase bone scintigraphy and clinical characteristics. Kaohsiung J Med Sci 1998;14:40-47.
38. Petchkrua W, Weiss DJ, Patel RR. Reassessment of the incidence of complex regional pain syndrome type 1 following stroke. Neurorehabil Neural Repair 2000;14:59-63.
39. Geertzen JH, Dijkstra PU, van Sonderen EL, Groothoff JW, ten Duis HJ, Eisma WH. Relationship between impairments, disability and handicap in reflex sympathetic dystrophy patients: a long-term follow up study. Clin Rehabil 1998;12:402-412.
40. van de Beek WJ, Roep BO, van der Slik AR, Giphart MJ, van Hilten BJ. Susceptibility loci for complex regional pain syndrome. Pain 2003;103:93-97.
41. Commentary on RSD focus article Bandolier 2002. Available at: www.jr2.ox.ac.uk/bandolier/booth/ painpag/wisdom/RSD.html. Accessed on May 17, 2005.
42. Alvarez-Lario B, Aretxabala-Alcibar I, Alegre-Lopez J, Alonso-Valdivielso JL. Acceptance of the different denominations for reflex sympathetic dystrophy. Ann Rheum Dis 2001;60:77-79.
The less familiar side of heart failure: Symptomatic diastolic dysfunction
- Arrange for echocardiography or radionuclide angiography within 72 hours of a heart failure exacerbation. An ejection fraction >50% in the presence of signs and symptoms of heart failure makes the diagnosis of diastolic heart failure probable (B).
- To treat associated hypertension, use angiotensin receptor blockers (ARBs), angiotensin-converting enzyme (ACE) inhibitors, beta-blockers, calcium channel blockers, or diuretics to achieve a blood pressure goal of <130/80 mm Hg (C).
- When using beta-blockers to control heart rate, titrate doses more aggressively than would be done for systolic failure, to reach a goal of 60 to 70 bpm (B).
- Use ACE inhibitors/ARBs to decrease hospitalizations, decrease symptoms, and prevent left ventricular remodeling (A).
Heart failure is a growing epidemic in the US, estimated to cause at least 20% of all hospitalizations in persons over 65 years of age. It is also the leading inpatient diagnosis among Medicare recipients with this age group.1,2,3 More than 5 million people in the US have heart failure, with approximately 550,000 new cases diagnosed annually.
Growing epidemiologic evidence suggests that studies of heart failure have underrepresented a large patient population with a natural history different from that of left ventricular (LV) systolic dysfunction.4-8One third to one half of patients with signs and symptoms of heart failure have preserved left ventricular function (LVF). They are said to have diastolic heart failure (DHF).
Identifying persons with this less-understood form of heart failure can be challenging. Skillful discernment is needed to avoid mistakenly attributing symptoms to other causes. DHF is particularly common among elderly women with hypertension; every patient with signs and symptoms of heart failure should undergo echocardiography to determine LV function.
Though the evidence base for DHF treatment is less well established than it is for systolic heart failure (SHF), data from recent trials have offered a promising direction.
New categorization of heart failure
The relative scopes of DHF and SHF will be better appreciated by understanding how recently developed guidelines have restructured the historical classification of heart failure.
Heart failure is defined by the American College of Cardiology (ACC) and the American Heart Association (AHA) as a complex syndrome resulting from any structural or functional cardiac disorder that impairs the ability of the ventricles to fill with or eject blood.9 The older terms, low-vs high-output failure, are now regarded as obsolete and have been abandoned in favor of distinguishing between abnormalities of systolic and diastolic function.10-12
ACC/AHA heart failure staging system
Severity of heart failure symptoms has traditionally been gauged by the New York Heart Association (NYHA) classification system. A criticism of the NYHA scale, however, is that patients may fluctuate in and out of the varying functional classes. To correct this shortcoming of the NYHA scale, the ACC and the AHA devised a new staging system to describe the progression of heart failure.9 The premise of this new system is to provide permanence to each sequential progression through the stages of heart failure while complementing the existing NYHA scale.9,13
New model. Patients with Stage A heart failure are at high risk of developing heart failure based on comorbidities and medical history.
Patients with Stage B heart failure have some component of structural heart disease but are asymptomatic.
Patients with Stage C heart failure have underlying structural abnormalities and have symptoms, or have had symptoms of heart failure in the past.
Patients with Stage D heart failure are refractory to conventional medical therapy and have end-stage symptoms.
TABLE 1 shows how the ACC/AHA Heart Failure Staging System correlates with the NYHA Classification scheme. Family practitioners can use the new heart failure staging system to identify and recognize risk factors for the development of heart failure and then seek to aggressively prevent or reverse them.
TABLE 1
Relationship of the ACC/AHA Heart Failure
| ACC/AHA STAGES OF HEART FAILURE | NYHA FUNCTIONAL CLASSIFICATION |
|---|---|
| A- high risk for development of HF; no underlying structural cardiac disease (ie, hypertension, diabetes, hyperlipidemia, etc) | No correlation |
| B- Structural heart disease but asymptomatic (ie, LVH) | I- patients with no limitation of activities; they suffer no symptoms from ordinary physical activity |
| C- Structural heart disease with past or current symptoms of heart failure | II- patients with slight, mild limitation of activity; they are comfortable with rest or with mild exertion |
| III- patients with marked limitation of activity; they are comfortable only at rest | |
| D- Refractory heart failure | IV- patients who should be at complete rest, confined to bed or chair; any physical activity brings on discomfort and symptoms occur at rest |
| Patients with Stage A heart failure are at high risk of developing clinical HF and are not representative of any patients categorized under the NHYA functional classification system, as they are not yet symptomatic. Patients with Stage B heart failure have some form of structural heart disease without associated symptoms and correlate best with NYHA Class I patients. Patients with Stage C heart failure have the same underlying structural cardiac disorders associated with Stage B, but they have past or current symptoms of HF. Depending on the severity of their condition, patients with Stage C heart failure may fall within any of the NYHA functional classes. Patients with Stage D heart failure have symptoms refractory to optimized medical and interventional therapies and are representative of NYHA Class IV patients. | |
Who is at risk for DHF?
Risk factors for the development of DHF include advanced age, female sex, hypertension, and coronary ischemia. Approximately 50% of those older than 70 years who have heart failure have preserved LV function.14-16 In a large epidemiologic study of elderly patients with heart failure, women were twice as likely as men to have preserved LV function.17 In examining post-myocardial infarction (MI) patients with heart failure, women and those with smaller infarctions were also more likely to have preserved LV function (odds ratio=1.97; 95% confidence interval [CI], 1.27–3.07).18
Hypertension is a well known cause of left ventricular hypertrophy (LVH), which is a causal mechanism for DHF.19,20 Levy et al, in a study of 5143 subjects from the original Framingham Heart Study participants and Framingham Offspring participants, found that hypertension predated the development of heart failure in 91% of cases among patients in this cohort.21 In this sample, hypertension also carried the greatest population-attributable risk for the development of heart failure of all risk factors considered (39% in men and 59% in women). Hypertension also had the highest prevalence of all risk factors in this study (60% in men and 62% in women). Untreated hypertension leads to an increasing incidence of LVH and associated diastolic dysfunction. Increased LV mass and stiffness cause noncompliance and abnormal relaxation of the ventricular wall leading to increased diastolic pressures.4,19-21
Coronary ischemia can also cause diastolic dysfunction.20 Data from the Framingham Heart Study indicate that the prevalence of MI was 10% in hypertensive men and 3% in hypertensive women.21 MI is a well known precursor of LV systolic dysfunction; however, the relationship to diastolic dysfunction is less clear. Although the prevalence of MI was associated with a 5- to 6-fold risk for heart failure in Framingham subjects, after adjustment for age and other risk factors, fewer than half of the patients who subsequently developed heart failure had a history of MI. This finding supports the role of untreated hypertension in the pathogenesis of DHF.21
Physical examination does not help distinguish between DHF and SHF. Signs and symptoms of both disorders are relatively the same.22 Therefore, the presence of one or more of these risk factors in the setting of heart failure and preserved LV function supports the diagnosis of DHF.14-17TABLE 2 summarizes known clinical characteristics and features of SHF and DHF. All patients with systolic heart failure have some component of diastolic dysfunction as well.10,12,23,24
TABLE 2
Characteristics of patients with systolic vs diastolic heart failure
| Differentiating systolic and diastolic dysfunction | 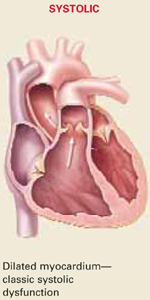 | 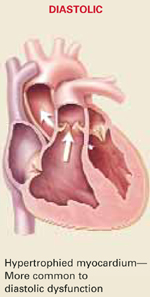 |
| Etiology | Commonly associated with previous MI; exists concurrently with diastolic dysfunction | Pathogenesis is multifocal; associated more often with systemic hypertension, may exist alone without a component of systolic heart failure |
| Gender-specific differences | Both sexes affected | More common in women |
| Age-related differences | All ages affected | More common in elderly patients |
| Echocardiographic findings | Depressed LVEF <40% | Preserved LVEF >40% |
| Symptomatology | Identical—unable to differentiate with clinical examination | Identical—unable to differentiate with clinical examination |
| Long-term prognosis | 15% annual mortality rate | 5 to 8% annual mortality rate |
| MI, myocardial infarction; LVEF, left ventricular ejection fraction. | ||
Diagnosis is made clinically
No consensus exists on standardized criteria for diagnosing diastolic heart failure. However, 3 diagnostic levels—possible, probable, and definite DHF—have been proposed by Vasan and Levy.11
Possible DHF is defined as signs and symptoms of heart failure (TABLE 3) in patients with normal LV function, but lacking an assessment of ventricular function in proximity to the heart failure event.
Probable DHF is defined as (1) signs and symptoms of heart failure and (2) an ejection fraction >50% measured via echocardiography or radionuclide angio-graphy within 72 hours of the heart failure exacerbation.
Definite DHF is defined as (1) signs and symptoms of heart failure, (2) an ejection fraction >50% measured via the above methods within 72 hours of the patient’s presentation, and (3) increased left-ventricular end diastolic pressure (LVEDP) measured during cardiac catheterization.
TABLE 3
Modified Framingham criteria for diagnosing heart failure
| Need 2 major or 1 major and 2 minor fulfilled criteria for diagnosis of heart failure. |
|---|
| MAJOR CRITERIA |
| Paroxysmal nocturnal dyspnea |
| Orthopnea |
| Elevated jugular venous pressure |
| Pulmonary rales |
| Cardiomegaly on radiography |
| Acute pulmonary edema |
| S3 gallop |
| Weight loss >4.5 kg in response to treatment of heart failure |
| MINOR CRITERIA |
| Bilateral ankle/leg edema |
| Nocturnal cough |
| Dyspnea on ordinary exertion |
| Hepatomegaly |
| Pleural effusion |
| Tachycardia >120 bpm |
| MAJOR OR MINOR |
| Weight loss >4.5 kg in 5 days in response to treatment of heart failure |
| From: McKee et al, N Engl J Med 1971; 285:1441-1446.26 |
Direct assessment of diastolic function unnecessary
Evidence of diastolic dysfunction as determined by echocardiography or cardiac catheterization has been debated as a necessary third diagnostic criterion.24 The problem, though, is that there is no simple means of reliably diagnosing diastolic dysfunction with echocardiography (E:A ratios, deceleration or relaxation times), and that performing cardiac catheterization to measure LVEDP is impractical.22
Furthermore, Zile et al have shown that, though cardiac catheterization helps to confirm diastolic dysfunction, it is not necessary to establish the diagnosis. In this study, 63 patients with clinically defined diastolic heart failure based on the Framingham criteria underwent diagnostic cardiac catheterization; 58 (92%) of these patients were also found to have an abnormal LVEDP, indicative of diastolic dysfunction.25 Therefore, the diagnosis of DHF can be made in the setting of heart failure in a patient with a normal ejection fraction.
Order echocardiography within 72 hours of symptom onset
A major challenge for clinicians is to determine whether a patient’s dyspnea is a true symptom of heart failure. Signs and symptoms of heart failure must be defined using clinical indicators such as the Framingham heart failure criteria (FIGURE).26 Diagnosis of heart failure is more easily made for a patient presenting to the emergency department with acute pulmonary edema than it is for an outpatient seen repeatedly for shortness of breath over months.
For a patient presenting with acute pulmonary edema, an echocardiogram should be performed within 72 hours of symptoms to document cardiac function in proximity to the heart failure exacerbation. The ejection fraction of patients with DHF can remain within normal range, even during acute decompensation.27,28 Stroke volume and cardiac output may be decreased despite a normal ejection fraction.
Cardiogenic pulmonary edema in DHF patients results from the stiffened ventricle’s inability to compensate for increased venous return due to an expansion in central blood volume or sodium retention. Subsequently, diastolic pressures elevate and impede lung compliance, which increases the work of breathing and dyspnea.20,29 A normal ejection fraction and symptom diminishment following diuresis in the setting of acute decompensation help confirm the diagnosis of DHF, especially when other disease states are complicating the clinical picture.30
Elevated BNP levels may be helpful
An elevated level of b-type natriuretic peptide (BNP) can help confirm the clinical diagnosis of heart failure, and it has been shown in small studies to be a valid marker of DHF.31,32 In a study of 294 patients referred for echocardiography to evaluate LV function, Lubien et al found that a BNP value of at least 62 pg/mL had a sensitivity of 85%, a specificity of 83%, and an accuracy of 84% for heart failure in patients with a normal ejection fraction.32 All patients with systolic dysfunction defined by an ejection fraction <50% were excluded from this study. These results, though promising, must be confirmed by further studies evaluating the diagnostic utility of BNP to detect active heart failure symptoms in patients with diastolic dysfunction.
Treatment of symptomatic diastolic dysfunction
For SHF patients, multiple large outcome trials have clearly documented the benefit of angiotensin-converting enzyme (ACE) inhibitors, beta-blockers, and aldosterone antagonists in reducing mortality.33-36 The relative paucity of outcome data for DHF has resulted in medical therapy primarily centered on modifying physiologic factors to improve LV filling and relaxation. Specifically, treatment should focus on symptom reduction, balancing fluid status, controlling heart rate, decreasing any ischemia, and achieving blood pressure goals.19,20,22,31 Though many of the medications used to treat SHF are also used for DHF, there are several important differences in appropriate initiation and subsequent titration of these drugs in the 2 settings.20,31
While treatment of DHF is largely theoretical, a limited number of well-designed, randomized studies are available to help determine appropriate therapy.37-39TABLE 4 provides a summary of the evidence base for evaluation and treatment of systolic vs diastolic heart failure.40TABLE 5 gives a synopsis of these studies. A suggested diagnostic and treatment approach for patients with DHF is outlined in the FIGURE. After determining whether a patient has DHF— primarily through the ruling out of other conditions and confirmation with echocardiographic studies—consider the applicability of each treatment based on a patient’s medical history and present condition.
TABLE 4
Comparative evidence base for evaluation and treatment of systolic vs diastolic heart failure
| LEVEL OF EVIDENCE* | ||
|---|---|---|
| FEATURE | SYSTOLIC HEART FAILURE | DIASTOLIC HEART FAILURE |
| Prevalence and risk factors | III | III |
| Non-invasive diagnostic methodologies | I - assessment of LVEF | IV, VII† |
| I - measurement of BNP levels | ||
| Prognosis | I - II | II, III |
| Treatment with ACE inhibitor, ARB, beta-blockers, and digitalis | I‡ | II, V-VII |
| Prevention trials (treatment of asymptomatic precursor condition) | I | None |
*
| ||
| † Diagnosis is primarily by exclusion of systolic heart failure; measurement of LVEF and BNP is also useful. | ||
| ‡ Cochrane review and meta-analysis. | ||
| ACE, angiotensin-converting enzyme; ARB, angiotensin receptor blocker; LVEF, left ventricular ejection fraction; BNP, b-type natriuretic peptide. Adapted and reproduced with permission from the BMJ Publishing Group and Dr. Ramachandran S. Vasan. BMJ 2003; 327:1181-1182.40 | ||
TABLE 5
Diastolic heart failure outcome trials
| TRIAL | BACKGROUND AND CONTEXT | REPRESENTATIVE PATIENT POPULATION | AVG LVEF OF PARTICIPANTS | NNT | SOR* (LOE) |
|---|---|---|---|---|---|
| CHARM-Preserved | Candesartan added to standard heart failure therapy in patients with LVEF >40% | N=3023 | 54% | 36† | A (1b) |
| 60% NYHA Class II | 42‡ | ||||
| 38% NYHA Class III | |||||
| 2% NYHA Class IV | |||||
| DIG Ancillary Trial | Digoxin + ACE inhibitors and diuretics in patients with LVEF >45% | N=988 | Not reported | N/A§ | B (1b) |
| NYHA classification not specified | |||||
| Propranolol Study, Aronow et al | Propranolol added to ACE inhibitors and diuretics in post-MI patients with LVEF 40% | N=158 | 56% | 5¶ | A (1b) |
| 52% NYHA Class II | |||||
| 48% NYHA Class III | |||||
| *Based on the guidelines for evidence quality outlined by the Center for Evidence-Based Medicine, available at: www.cebm.net/levels_ of_evidence.asp. A(1b) = consistent level 1 studies; individual randomized controlled trial (with narrow confidence interval). B(1b) = consistent level 2 or 3 studies or extrapolations from level 1 studies; individual randomized controlled trial (with narrow confidence interval) | |||||
| † For the composite of cardiovascular death, hospital admission for heart failure, MI, or cerebrovascular accident over 3 years | |||||
| ‡ For recurrent admissions for heart failure exacerbations over 3 years | |||||
| § No statistical differences between groups in rates of hospitalization or mortality over 3 years | |||||
| ¶ All-cause mortality over a mean of 32 months | |||||
| NNT, number needed to treat to prevent one death or other specified endpoint; LVEF, left ventricular ejection fraction; ACE, angiotensin-converting enzyme; NYHA, New York Heart Association classification; CHARM, Candesartan in Heart failure: Assessment of Reduction in Mortality and morbidity; DIG, Digitalis Investigation Group. | |||||
Medications to control blood pressure
Hypertension is a major risk factor for DHF, and the ACC/AHA heart failure guidelines recommend a lower blood pressure goal for patients with diastolic heart failure than for those with uncomplicated hypertension (ie, <130/80 mm Hg).9 Angiotensin receptor blockers (ARBs), ACE inhibitors, beta-blockers, calcium channel blockers, and diuretics may all be employed to achieve this blood pressure goal.
Angiotensin II receptor blockers. The use of ARBs in the treatment of DHF was recently evaluated in the CHARM-Preserved Study. Candesartan, 32 mg once daily, when added to a background therapy of mostly diuretics and beta-blockers (initially excluding the use of ACE inhibitors but later permitted in appropriate patients following the release of the HOPE trial results), was found to have a modest impact in preventing recurrent admissions for heart failure exacerbations (number needed to treat [NNT]=42 over 3 years).37 Candesartan also demonstrated a more favorable impact on the composite end-point of cardiovascular death, hospitalization for heart failure, MI, and stroke (NNT=36).
ACE inhibitors. For post-MI patients with DHF, ACE inhibitors have improved treadmill duration and NYHA functional class.41 Further studies are needed to determine whether an ACE inhibitor or an ARB is preferred or whether they may be used safely together in the management of DHF.
Beta-blockers. Propranolol, when added to an ACE inhibitor and diuretic, has been shown to significantly reduce mortality in a small prospective study of 158 post-MI patients with an average LVEF of 56% and NYHA Class II or III symptoms.38 Seventy percent of the study patients were women (n=111) and the mean age was 81 years. The dose of pro-pranolol in this study was increased in 10-mg increments at 10-day intervals up to a total daily dose of 30 mg 3 times daily.
All 79 patients randomized to receive propranolol successfully reached the target dose; however, 14% (n=11) discontinued therapy due to worsening heart failure or hypotension. The absolute reduction in total mortality among patients receiving propranolol was 20%, compared with the study group receiving only standard heart failure therapy (NNT=5 for a median of 32 months of follow-up, P=.007). The positive effect of beta-blocker therapy in this small study merits another larger, complementary trial to confirm its benefits in a bigger patient population with the same characteristics.
Control of volume status
Diuretics. It has long been recognized that diuretics are a useful and necessary adjunct in the management of volume overload in patients with heart failure42; however, no large, long-term studies are available to evaluate the effects of these medications on mortality.43 Without concurrent ACE inhibitor/ARB and beta-blocker therapy, diuretics have been shown to cause rebound sympathetic activation.44,45
For patients with either systolic or diastolic dysfunction, diuretics may be dosed aggressively to achieve euvolemia. But for patients with DHF who are partly dependent on volume coupled with increased heart rate to maintain cardiac output, excessive diuresis can cause a significant reduction in preload, which can worsen symptoms.20,22,30 It is advocated that long-term diuretics should be used judiciously in the treatment of both SHF and DHF, with individualized, tailored therapy being preferred and daily weights used as a guide to determine optimum fluid status.9
Medications to control heart rate
Beta-blockers. In addition to their anti-hypertensive effects, beta-blockers may also be used as rate-lowering therapy in the treatment of DHF. Dosing and titration in this setting are handled differently than for SHF. Whereas titration of beta-blockers in SHF requires careful adjustment to avoid worsening of the patients’ symptoms and subsequent exacerbation,46-48 dosing in DHF can be more aggressive, with a resting heart rate goal of 60 to 70 bpm.20,49 Beta-blockers are used as negative chronotropes in this instance to improve left ventricular filling. Beta-blockers are also useful in the management of ischemia and angina associated with diastolic heart failure.19,20
Calcium channel blockers. For patients with contraindications to beta-blocker therapy, non-dihydropyridine calcium channel blockers (verapamil, diltiazem) may be employed as rate-lowering therapy for DHF.19 Unlike the other drugs used in DHF, non-dihydropyridine calcium channel blockers have no role in the treatment of SHF except in the presence of tachyarrhythmias.20
Dihyropyridine calcium channel blockers (ie, amlodipine, felodipine) should be reserved for heart failure patients in general with angina refractory to beta-blockers. Amlodipine and felodipine are probably the safest of the dihydropyridine calcium channel blockers to use for the treatment of angina as they have not been shown to worsen existing SHF.50,51 Verapamil has been shown in a small study to increase exercise capacity and heart failure score in patients with DHF.52
Digitalis. The use of digoxin in patients with DHF was evaluated in the Digitalis Investigation Group (DIG) ancillary trial, a parallel substudy of the overall DIG Trial that enrolled 988 patients with diastolic dysfunction.39 DHF patients receiving digoxin were found to have fewer symptoms and hospitalizations, although this finding was not statistically significant. These findings should be weighed against recent data suggesting that digoxin predisposes women with depressed left ventricular systolic dysfunction to an increased risk of death.53 The role of digoxin in DHF is unclear, and it is recommended that its use be restricted to patients with recurrent hospitalizations and refractory tachyarrhythmias despite optimized medical therapy.9,20,30,54
Prognosis
The annual mortality of patients with DHF has been reported as 5% to 8%, whereas mortality associated with SHF approximates 10% to 15%. However, in patients aged >70 years, both SHF and DHF have a 5-year mortality of 50% and both have an estimated 50% annual hospital admission rate.58
Looking forward
Greater recognition of the disorder and more enrollment of patients with DHF in outcome-based studies will hopefully improve our understanding and approach to treatment of this specific form of heart failure.40,55
Ongoing studies that may provide more evidence-based data to guide therapy for DHF include the Irbesartan in Heart Failure with Preserved Systolic Function Trial (I-PRESERVE), Perindopril for Elderly People with Chronic Heart Failure Study (PEP-CHF) and Study of the Effects of Nebivolol Intervention on Outcomes and Rehospitalisation in Seniors with Heart Failure (SENIORS).56-58
- Amlodipine • Norvasc
- Candesartan • Atacand
- Digoxin • Lanoxin
- Diltiazem • Cardizem, Cartia, Pilacor, Tiazac
- Enalapril • Vasotec
- Felodipine • Plendil
- Hydrazaline • Apresoline
- Propanolol • Betachron, Inderal
- Verapamil • Calan, Covem, Isoptin, Verelan
Acknowledgments
The authors wish to thank Thomas Hill and JoAnn Moates for their invaluable research assistance in preparation of this manuscript.
CORRESPONDING AUTHOR
Spencer A. Morris, PharmD, BCPS, Georgetown Hospital System, Georgetown Memorial Hospital, 606 Black River Road, Georgetown, SC 29440. E-mail: [email protected].
1. American Heart Association. Heart Disease and Stroke Statistics—2004 Update. Dallas, Texas: American Heart Association; 2003.
2. Popvic JR, Hall MJ. 1999 National Hospital Discharge Survey. Advance data from vital and health statistics; no. 319. Hyattsville, Maryland: Nation Center for Health Statistics, 2001.
3. Krumholz HM, Parent EM, Tu N, et al. Readmission after hospitalization for congestive heart failure among Medicare beneficiaries. Arch Intern Med 1997;157:99-104.
4. Krum H, Gilbert RE. Demographics and concomitant disorders in heart failure. Lancet 2003;362:147-158.
5. Redfield MM, Jacobsen SJ, Burnett JC, et al. Burden of systolic and diastolic ventricular dysfunction in the community: appreciating the scope of the heart failure epidemic. JAMA 2003;289:194-202.
6. Senni M, Tribouilloy CM, Rodeheffer RJ, et al. Congestive heart failure in the community: a study of all incident cases in Olmsted County, Minnesota, in 1991. Circulation 1998;98:2282.-
7. Vasan RS, Larson MG, Benjamin EJ, et al. Congestive heart failure in subjects with normal versus reduced left ventricular ejection fraction: prevalence and mortality in a population-based cohort. J Am Coll Cardiol 1999;33:1948.-
8. Kitzman DW, Gardin JM, Arnold A, et al. Heart failure with preserved LV function in the elderly: clinical and echocardiographic correlates from the Cardiovascular Health Study. Circulation 1999;94:1433.-
9. Hunt SA, Baker DW, Chin MH, et al. ACC/AHA guidelines for the evaluation and management of chronic heart failure in the adult: full text: a report of the American College of Cardiology/American Heart Association Task Force on Practice Guidelines (Committee to revise the 1995 Guidelines for the Evaluation and Management of Heart Failure). Available at: http://www.acc.org/clinical/guidelines/failure/pdfs/hf_fulltext.pdf.
10. Gaasch WH. Diagnosis and treatment of heart failure based on left ventricular systolic or diastolic dysfunction. JAMA 1994;271:1276-1280.
11. Vasan RS, Levy D. Defining diastolic heart failure: a call for standardized diagnostic criteria. Circulation 2000;101:2118-2121.
12. Grossman W. Defining diastolic dysfunction. Circulation 2000;101:2020-2021.
13. Brozena SC, Jessup M. The new staging system for heart failure: what every primary care physician should know. Geriatrics 2003;58:31-36.
14. McDermott MM, Feinglas J, Sy J, et al. Hospitalized congestive heart failure patients with preserved versus abnormal left ventricular systolic function; clinical characteristics and drug therapy. Am J Med 1995;99:629-635.
15. Vasan RS, Benjamin EJ, Levy D. Prevalence, clinical features and prognosis of diastolic heart failure; an epidemiologic perspective. J Am Coll Cardiol 1995;26:1565.-
16. Kitzman DW, Gardin JM, Gottdiener JS, et al. for the CHS Research Group. Importance of heart failure with preserved systolic function in patients >65 years of age. Am J Cardiol 2001;87:413-419.
17. Masoudi FA, Havranek EP, Smith G, et al. Gender, age and heart failure with preserved left ventricular systolic function. J Am Coll Cardiol 2003;41:217-223.
18. Hellermann JP, Jacobsen SJ, Reeder GS, et al. Heart failure after myocardial infarction: Prevalence of preserved left ventricular systolic function in the community. Am Heart J 2003;145:742-748.
19. Bonow RO, Udelson JE. Left ventricular diastolic dysfunction as a cause of congestive heart failure: mechanisms and management. Ann Intern Med 1992;117:502-510.
20. Zile MR, Brutsaert DL. New concepts in diastolic dysfunction and diastolic heart failure: Part II: causal mechanisms and treatment. Circulation 2002;105:1503-1508.
21. Levy D, Larson MG, Vasan RS, Kannel WB, Ho KK. The progression from hypertension to congestive heart failure. JAMA 1996;275:1557-1562.
22. Vasan RS, Benjamin EJ, Levy D. Congestive heart failure with normal left ventricular systolic function: clinical approaches to the diagnosis and treatment of diastolic heart failure. Arch Intern Med 1996;156:146-157.
23. Zile MR, Brutsaert DL. New concepts in diastolic dysfunction and diastolic heart failure: Part I: diagnosis, prognosis, and measurements of diastolic function. Circulation 2002;105:1387-1393.
24. How to diagnose diastolic heart failure. European Study Group on Diastolic Heart Failure. Eur Heart J 1998;19:990.-
25. Zile MR, Gaasch WH, Carroll JD, et al. Heart failure with a normal ejection fraction: is measurement of diastolic function necessary to make the diagnosis of diastolic heart failure? Circulation 2001;104:779-782.
26. McKee PA, Castelli WP, McNamara PM, et al. The natural history of congestive heart failure: the Framingham study. N Engl J Med 1971;285:1441-1446.
27. Gandi SK, Powers JC, Nomeir A, et al. The pathogenesis of acute pulmonary edema associated with hypertension. N Engl J Med 2001;344:17-60.
28. Kitzman DW, Little WC, Brubaker PH, et al. Pathophysiological characterization of isolated dias-tolic heart failure in comparison to systolic heart failure. JAMA 2002;288:2144-2150.
29. Zile MR, Baicu CF, Gaasch WH. Diastolic heart fail-ure—abnormalities in active relaxation and passive stiffness of the left ventricle. N Engl J Med 2004;350:1953-1959.
30. Elesber AA, Redfield MM. Approach to patients with heart failure and normal ejection fraction. Mayo Clin Proc 2001;76:1047-1052.
31. Angeja BG, Grossman W. Evaluation and management of diastolic heart failure. Circulation 2003;107:659.-
32. Lubien E, DeMaria A, Krishnaswamy P, et al. Utility of b-natriuretic peptide in detecting diastolic dysfunction: comparison with Doppler velocity recordings. Circulation 2002;105:595-601.
33. Garg R, Yusuf S. Overview of randomized trials of angiotensin-converting enzyme inhibitors on mortality and morbidity in patients with heart failure. JAMA 1995;273:1450-1456.
34. Foody JM, Farrell MH, Krumholz HM. β-blocker therapy in heart failure: scientific review. JAMA 2002;287:883-889.
35. Pitt B, Zannad F, Remme WJ. The effect of spirono-lactone on morbidity and mortality in patients with severe heart failure. N Engl J Med 1999;341:709-717.
36. Pitt B, Remme W, Zannad F. Eplerenone, a selective aldosterone blocker, in patients with left ventricular dysfunction after myocardial infarction. N Engl J Med 2003;348:1309-1321.
37. Yusuf S, Pfeffer MA, Swedberg, et al. Effects of candesartan in patients with chronic heart failure and preserved left-ventricular ejection fraction: the CHARM-Preserved Trial. Lancet 2003;362:777-781.
38. Aronow WS, Ahn C, Kronzon I. Effects of propranolol versus no propranolol on total mortality plus nonfatal myocardial infarction in older patients with prior myocardial infarction, congestive heart failure, and left ventricular ejection fraction >40% treated with diuretics plus angiotensin-converting enzyme inhibitors. Am J Cardiol 1997;80:207-209.
39. The Digitalis Investigation Group. The effect of digoxin on mortality and morbidity in patients with heart failure. N Engl J Med 1997;336:525.-
40. Vasan RS. Diastolic heart failure: the condition exists and needs to be recognized, prevented, and treated. BMJ 2003;327:1181-1182.
41. Aronow WS, Kronzon I. Effect of enalapril on congestive heart failure treated with diuretics in elderly patients with prior myocardial infarction and normal left ventricular ejection fraction. Am J Cardiol 1993;71:602-604.
42. Wilson JR, Reichek N, Dunkman WB, Golberg S. Effect of diuresis on the performance of the failing left ventricle in man. Am J Med 1981;70:234-239.
43. Faris R, Flather M, Purcell H, et al. Current evidence supporting the role of diuretics in heart failure: a meta analysis of randomized controlled trials. Int J Cardiol 2002;82:149-158.
44. Cowie MR, Zaphiriou A. Management of chronic heart failure. Br Med J 2002;325:422-425.
45. Cody RJ, Kubo SH, Pickworth KK. Diuretic treatment for the sodium retention of congestive heart failure. Arch Intern Med 1994;154:1905-1914.
46. The Cardiac Insufficiency Bisoprolol Study II (CIBIS-II): a randomised trial Lancet 1999;353:9-13.
47. Effect of metoprolol CR/XL in chronic heart failure: Metoprolol CR/XL Randomised Intervention Trial in Congestive Heart Failure (MERIT-HF) Lancet 1999;353:2001-2007.
48. Packer M, Coats AJ, Fowler MB, et al. Effect of carvedilol on survival in severe chronic heart failure. N Engl J Med 2001;344:1651-1658.
49. Levine HJ. Optimum heart rate of large failing hearts. Am J Cardiol 1988;61:633-636.
50. O’Connor CM, Carson PE, Miller AB, et al. Effect of amlodipine on mode of death among patients with advanced heart failure in the PRAISE trial. Prospective Randomized Amlodipine Survival Evaluation. Am J Cardiol 1998;82:881-887.
51. Amabile CM, Spencer AP. Keeping your patient with heart failure safe: a review of potentially dangerous medications. Arch Intern Med 2004;164:709-720.
52. Setaro J, Zaret BL, Schueman Ds, et al. Usefulness of verapamil for congestive heart failure associated with abnormal left ventricular diastolic performance. Am J Cardiol 1990;66:981-986.
53. Rathore SS, Wang Y, Krumholz HM. Sex-based differences in the effect of digoxin for the treatment of heart failure. N Engl J Med 2002;347:1403-1411.
54. Yamani MH. When should digoxin be used in patients with diastolic dysfunction? Cleve Clin J Med 2001;68:481,-485.
55. Vasan RS, Benjamin EJ. Diastolic heart failure—no time to relax. N Engl J Med 2001;344:56-58.
56. Carson P, Massie B. I-PRESERVE (Irbesartan in Heart Failure with Preserved Systolic Function) Study initiation presented at the European Society of Cardiology Annual Meeting, September 3, 2002, Berlin.
57. Cleland JG, Tendera M, Adamus J, et al. Perindopril for elderly people with chronic heart failure: the PEP-CHF study.
- Arrange for echocardiography or radionuclide angiography within 72 hours of a heart failure exacerbation. An ejection fraction >50% in the presence of signs and symptoms of heart failure makes the diagnosis of diastolic heart failure probable (B).
- To treat associated hypertension, use angiotensin receptor blockers (ARBs), angiotensin-converting enzyme (ACE) inhibitors, beta-blockers, calcium channel blockers, or diuretics to achieve a blood pressure goal of <130/80 mm Hg (C).
- When using beta-blockers to control heart rate, titrate doses more aggressively than would be done for systolic failure, to reach a goal of 60 to 70 bpm (B).
- Use ACE inhibitors/ARBs to decrease hospitalizations, decrease symptoms, and prevent left ventricular remodeling (A).
Heart failure is a growing epidemic in the US, estimated to cause at least 20% of all hospitalizations in persons over 65 years of age. It is also the leading inpatient diagnosis among Medicare recipients with this age group.1,2,3 More than 5 million people in the US have heart failure, with approximately 550,000 new cases diagnosed annually.
Growing epidemiologic evidence suggests that studies of heart failure have underrepresented a large patient population with a natural history different from that of left ventricular (LV) systolic dysfunction.4-8One third to one half of patients with signs and symptoms of heart failure have preserved left ventricular function (LVF). They are said to have diastolic heart failure (DHF).
Identifying persons with this less-understood form of heart failure can be challenging. Skillful discernment is needed to avoid mistakenly attributing symptoms to other causes. DHF is particularly common among elderly women with hypertension; every patient with signs and symptoms of heart failure should undergo echocardiography to determine LV function.
Though the evidence base for DHF treatment is less well established than it is for systolic heart failure (SHF), data from recent trials have offered a promising direction.
New categorization of heart failure
The relative scopes of DHF and SHF will be better appreciated by understanding how recently developed guidelines have restructured the historical classification of heart failure.
Heart failure is defined by the American College of Cardiology (ACC) and the American Heart Association (AHA) as a complex syndrome resulting from any structural or functional cardiac disorder that impairs the ability of the ventricles to fill with or eject blood.9 The older terms, low-vs high-output failure, are now regarded as obsolete and have been abandoned in favor of distinguishing between abnormalities of systolic and diastolic function.10-12
ACC/AHA heart failure staging system
Severity of heart failure symptoms has traditionally been gauged by the New York Heart Association (NYHA) classification system. A criticism of the NYHA scale, however, is that patients may fluctuate in and out of the varying functional classes. To correct this shortcoming of the NYHA scale, the ACC and the AHA devised a new staging system to describe the progression of heart failure.9 The premise of this new system is to provide permanence to each sequential progression through the stages of heart failure while complementing the existing NYHA scale.9,13
New model. Patients with Stage A heart failure are at high risk of developing heart failure based on comorbidities and medical history.
Patients with Stage B heart failure have some component of structural heart disease but are asymptomatic.
Patients with Stage C heart failure have underlying structural abnormalities and have symptoms, or have had symptoms of heart failure in the past.
Patients with Stage D heart failure are refractory to conventional medical therapy and have end-stage symptoms.
TABLE 1 shows how the ACC/AHA Heart Failure Staging System correlates with the NYHA Classification scheme. Family practitioners can use the new heart failure staging system to identify and recognize risk factors for the development of heart failure and then seek to aggressively prevent or reverse them.
TABLE 1
Relationship of the ACC/AHA Heart Failure
| ACC/AHA STAGES OF HEART FAILURE | NYHA FUNCTIONAL CLASSIFICATION |
|---|---|
| A- high risk for development of HF; no underlying structural cardiac disease (ie, hypertension, diabetes, hyperlipidemia, etc) | No correlation |
| B- Structural heart disease but asymptomatic (ie, LVH) | I- patients with no limitation of activities; they suffer no symptoms from ordinary physical activity |
| C- Structural heart disease with past or current symptoms of heart failure | II- patients with slight, mild limitation of activity; they are comfortable with rest or with mild exertion |
| III- patients with marked limitation of activity; they are comfortable only at rest | |
| D- Refractory heart failure | IV- patients who should be at complete rest, confined to bed or chair; any physical activity brings on discomfort and symptoms occur at rest |
| Patients with Stage A heart failure are at high risk of developing clinical HF and are not representative of any patients categorized under the NHYA functional classification system, as they are not yet symptomatic. Patients with Stage B heart failure have some form of structural heart disease without associated symptoms and correlate best with NYHA Class I patients. Patients with Stage C heart failure have the same underlying structural cardiac disorders associated with Stage B, but they have past or current symptoms of HF. Depending on the severity of their condition, patients with Stage C heart failure may fall within any of the NYHA functional classes. Patients with Stage D heart failure have symptoms refractory to optimized medical and interventional therapies and are representative of NYHA Class IV patients. | |
Who is at risk for DHF?
Risk factors for the development of DHF include advanced age, female sex, hypertension, and coronary ischemia. Approximately 50% of those older than 70 years who have heart failure have preserved LV function.14-16 In a large epidemiologic study of elderly patients with heart failure, women were twice as likely as men to have preserved LV function.17 In examining post-myocardial infarction (MI) patients with heart failure, women and those with smaller infarctions were also more likely to have preserved LV function (odds ratio=1.97; 95% confidence interval [CI], 1.27–3.07).18
Hypertension is a well known cause of left ventricular hypertrophy (LVH), which is a causal mechanism for DHF.19,20 Levy et al, in a study of 5143 subjects from the original Framingham Heart Study participants and Framingham Offspring participants, found that hypertension predated the development of heart failure in 91% of cases among patients in this cohort.21 In this sample, hypertension also carried the greatest population-attributable risk for the development of heart failure of all risk factors considered (39% in men and 59% in women). Hypertension also had the highest prevalence of all risk factors in this study (60% in men and 62% in women). Untreated hypertension leads to an increasing incidence of LVH and associated diastolic dysfunction. Increased LV mass and stiffness cause noncompliance and abnormal relaxation of the ventricular wall leading to increased diastolic pressures.4,19-21
Coronary ischemia can also cause diastolic dysfunction.20 Data from the Framingham Heart Study indicate that the prevalence of MI was 10% in hypertensive men and 3% in hypertensive women.21 MI is a well known precursor of LV systolic dysfunction; however, the relationship to diastolic dysfunction is less clear. Although the prevalence of MI was associated with a 5- to 6-fold risk for heart failure in Framingham subjects, after adjustment for age and other risk factors, fewer than half of the patients who subsequently developed heart failure had a history of MI. This finding supports the role of untreated hypertension in the pathogenesis of DHF.21
Physical examination does not help distinguish between DHF and SHF. Signs and symptoms of both disorders are relatively the same.22 Therefore, the presence of one or more of these risk factors in the setting of heart failure and preserved LV function supports the diagnosis of DHF.14-17TABLE 2 summarizes known clinical characteristics and features of SHF and DHF. All patients with systolic heart failure have some component of diastolic dysfunction as well.10,12,23,24
TABLE 2
Characteristics of patients with systolic vs diastolic heart failure
| Differentiating systolic and diastolic dysfunction | | |
| Etiology | Commonly associated with previous MI; exists concurrently with diastolic dysfunction | Pathogenesis is multifocal; associated more often with systemic hypertension, may exist alone without a component of systolic heart failure |
| Gender-specific differences | Both sexes affected | More common in women |
| Age-related differences | All ages affected | More common in elderly patients |
| Echocardiographic findings | Depressed LVEF <40% | Preserved LVEF >40% |
| Symptomatology | Identical—unable to differentiate with clinical examination | Identical—unable to differentiate with clinical examination |
| Long-term prognosis | 15% annual mortality rate | 5 to 8% annual mortality rate |
| MI, myocardial infarction; LVEF, left ventricular ejection fraction. | ||
Diagnosis is made clinically
No consensus exists on standardized criteria for diagnosing diastolic heart failure. However, 3 diagnostic levels—possible, probable, and definite DHF—have been proposed by Vasan and Levy.11
Possible DHF is defined as signs and symptoms of heart failure (TABLE 3) in patients with normal LV function, but lacking an assessment of ventricular function in proximity to the heart failure event.
Probable DHF is defined as (1) signs and symptoms of heart failure and (2) an ejection fraction >50% measured via echocardiography or radionuclide angio-graphy within 72 hours of the heart failure exacerbation.
Definite DHF is defined as (1) signs and symptoms of heart failure, (2) an ejection fraction >50% measured via the above methods within 72 hours of the patient’s presentation, and (3) increased left-ventricular end diastolic pressure (LVEDP) measured during cardiac catheterization.
TABLE 3
Modified Framingham criteria for diagnosing heart failure
| Need 2 major or 1 major and 2 minor fulfilled criteria for diagnosis of heart failure. |
|---|
| MAJOR CRITERIA |
| Paroxysmal nocturnal dyspnea |
| Orthopnea |
| Elevated jugular venous pressure |
| Pulmonary rales |
| Cardiomegaly on radiography |
| Acute pulmonary edema |
| S3 gallop |
| Weight loss >4.5 kg in response to treatment of heart failure |
| MINOR CRITERIA |
| Bilateral ankle/leg edema |
| Nocturnal cough |
| Dyspnea on ordinary exertion |
| Hepatomegaly |
| Pleural effusion |
| Tachycardia >120 bpm |
| MAJOR OR MINOR |
| Weight loss >4.5 kg in 5 days in response to treatment of heart failure |
| From: McKee et al, N Engl J Med 1971; 285:1441-1446.26 |
Direct assessment of diastolic function unnecessary
Evidence of diastolic dysfunction as determined by echocardiography or cardiac catheterization has been debated as a necessary third diagnostic criterion.24 The problem, though, is that there is no simple means of reliably diagnosing diastolic dysfunction with echocardiography (E:A ratios, deceleration or relaxation times), and that performing cardiac catheterization to measure LVEDP is impractical.22
Furthermore, Zile et al have shown that, though cardiac catheterization helps to confirm diastolic dysfunction, it is not necessary to establish the diagnosis. In this study, 63 patients with clinically defined diastolic heart failure based on the Framingham criteria underwent diagnostic cardiac catheterization; 58 (92%) of these patients were also found to have an abnormal LVEDP, indicative of diastolic dysfunction.25 Therefore, the diagnosis of DHF can be made in the setting of heart failure in a patient with a normal ejection fraction.
Order echocardiography within 72 hours of symptom onset
A major challenge for clinicians is to determine whether a patient’s dyspnea is a true symptom of heart failure. Signs and symptoms of heart failure must be defined using clinical indicators such as the Framingham heart failure criteria (FIGURE).26 Diagnosis of heart failure is more easily made for a patient presenting to the emergency department with acute pulmonary edema than it is for an outpatient seen repeatedly for shortness of breath over months.
For a patient presenting with acute pulmonary edema, an echocardiogram should be performed within 72 hours of symptoms to document cardiac function in proximity to the heart failure exacerbation. The ejection fraction of patients with DHF can remain within normal range, even during acute decompensation.27,28 Stroke volume and cardiac output may be decreased despite a normal ejection fraction.
Cardiogenic pulmonary edema in DHF patients results from the stiffened ventricle’s inability to compensate for increased venous return due to an expansion in central blood volume or sodium retention. Subsequently, diastolic pressures elevate and impede lung compliance, which increases the work of breathing and dyspnea.20,29 A normal ejection fraction and symptom diminishment following diuresis in the setting of acute decompensation help confirm the diagnosis of DHF, especially when other disease states are complicating the clinical picture.30
Elevated BNP levels may be helpful
An elevated level of b-type natriuretic peptide (BNP) can help confirm the clinical diagnosis of heart failure, and it has been shown in small studies to be a valid marker of DHF.31,32 In a study of 294 patients referred for echocardiography to evaluate LV function, Lubien et al found that a BNP value of at least 62 pg/mL had a sensitivity of 85%, a specificity of 83%, and an accuracy of 84% for heart failure in patients with a normal ejection fraction.32 All patients with systolic dysfunction defined by an ejection fraction <50% were excluded from this study. These results, though promising, must be confirmed by further studies evaluating the diagnostic utility of BNP to detect active heart failure symptoms in patients with diastolic dysfunction.
Treatment of symptomatic diastolic dysfunction
For SHF patients, multiple large outcome trials have clearly documented the benefit of angiotensin-converting enzyme (ACE) inhibitors, beta-blockers, and aldosterone antagonists in reducing mortality.33-36 The relative paucity of outcome data for DHF has resulted in medical therapy primarily centered on modifying physiologic factors to improve LV filling and relaxation. Specifically, treatment should focus on symptom reduction, balancing fluid status, controlling heart rate, decreasing any ischemia, and achieving blood pressure goals.19,20,22,31 Though many of the medications used to treat SHF are also used for DHF, there are several important differences in appropriate initiation and subsequent titration of these drugs in the 2 settings.20,31
While treatment of DHF is largely theoretical, a limited number of well-designed, randomized studies are available to help determine appropriate therapy.37-39TABLE 4 provides a summary of the evidence base for evaluation and treatment of systolic vs diastolic heart failure.40TABLE 5 gives a synopsis of these studies. A suggested diagnostic and treatment approach for patients with DHF is outlined in the FIGURE. After determining whether a patient has DHF— primarily through the ruling out of other conditions and confirmation with echocardiographic studies—consider the applicability of each treatment based on a patient’s medical history and present condition.
TABLE 4
Comparative evidence base for evaluation and treatment of systolic vs diastolic heart failure
| LEVEL OF EVIDENCE* | ||
|---|---|---|
| FEATURE | SYSTOLIC HEART FAILURE | DIASTOLIC HEART FAILURE |
| Prevalence and risk factors | III | III |
| Non-invasive diagnostic methodologies | I - assessment of LVEF | IV, VII† |
| I - measurement of BNP levels | ||
| Prognosis | I - II | II, III |
| Treatment with ACE inhibitor, ARB, beta-blockers, and digitalis | I‡ | II, V-VII |
| Prevention trials (treatment of asymptomatic precursor condition) | I | None |
*
| ||
| † Diagnosis is primarily by exclusion of systolic heart failure; measurement of LVEF and BNP is also useful. | ||
| ‡ Cochrane review and meta-analysis. | ||
| ACE, angiotensin-converting enzyme; ARB, angiotensin receptor blocker; LVEF, left ventricular ejection fraction; BNP, b-type natriuretic peptide. Adapted and reproduced with permission from the BMJ Publishing Group and Dr. Ramachandran S. Vasan. BMJ 2003; 327:1181-1182.40 | ||
TABLE 5
Diastolic heart failure outcome trials
| TRIAL | BACKGROUND AND CONTEXT | REPRESENTATIVE PATIENT POPULATION | AVG LVEF OF PARTICIPANTS | NNT | SOR* (LOE) |
|---|---|---|---|---|---|
| CHARM-Preserved | Candesartan added to standard heart failure therapy in patients with LVEF >40% | N=3023 | 54% | 36† | A (1b) |
| 60% NYHA Class II | 42‡ | ||||
| 38% NYHA Class III | |||||
| 2% NYHA Class IV | |||||
| DIG Ancillary Trial | Digoxin + ACE inhibitors and diuretics in patients with LVEF >45% | N=988 | Not reported | N/A§ | B (1b) |
| NYHA classification not specified | |||||
| Propranolol Study, Aronow et al | Propranolol added to ACE inhibitors and diuretics in post-MI patients with LVEF 40% | N=158 | 56% | 5¶ | A (1b) |
| 52% NYHA Class II | |||||
| 48% NYHA Class III | |||||
| *Based on the guidelines for evidence quality outlined by the Center for Evidence-Based Medicine, available at: www.cebm.net/levels_ of_evidence.asp. A(1b) = consistent level 1 studies; individual randomized controlled trial (with narrow confidence interval). B(1b) = consistent level 2 or 3 studies or extrapolations from level 1 studies; individual randomized controlled trial (with narrow confidence interval) | |||||
| † For the composite of cardiovascular death, hospital admission for heart failure, MI, or cerebrovascular accident over 3 years | |||||
| ‡ For recurrent admissions for heart failure exacerbations over 3 years | |||||
| § No statistical differences between groups in rates of hospitalization or mortality over 3 years | |||||
| ¶ All-cause mortality over a mean of 32 months | |||||
| NNT, number needed to treat to prevent one death or other specified endpoint; LVEF, left ventricular ejection fraction; ACE, angiotensin-converting enzyme; NYHA, New York Heart Association classification; CHARM, Candesartan in Heart failure: Assessment of Reduction in Mortality and morbidity; DIG, Digitalis Investigation Group. | |||||
Medications to control blood pressure
Hypertension is a major risk factor for DHF, and the ACC/AHA heart failure guidelines recommend a lower blood pressure goal for patients with diastolic heart failure than for those with uncomplicated hypertension (ie, <130/80 mm Hg).9 Angiotensin receptor blockers (ARBs), ACE inhibitors, beta-blockers, calcium channel blockers, and diuretics may all be employed to achieve this blood pressure goal.
Angiotensin II receptor blockers. The use of ARBs in the treatment of DHF was recently evaluated in the CHARM-Preserved Study. Candesartan, 32 mg once daily, when added to a background therapy of mostly diuretics and beta-blockers (initially excluding the use of ACE inhibitors but later permitted in appropriate patients following the release of the HOPE trial results), was found to have a modest impact in preventing recurrent admissions for heart failure exacerbations (number needed to treat [NNT]=42 over 3 years).37 Candesartan also demonstrated a more favorable impact on the composite end-point of cardiovascular death, hospitalization for heart failure, MI, and stroke (NNT=36).
ACE inhibitors. For post-MI patients with DHF, ACE inhibitors have improved treadmill duration and NYHA functional class.41 Further studies are needed to determine whether an ACE inhibitor or an ARB is preferred or whether they may be used safely together in the management of DHF.
Beta-blockers. Propranolol, when added to an ACE inhibitor and diuretic, has been shown to significantly reduce mortality in a small prospective study of 158 post-MI patients with an average LVEF of 56% and NYHA Class II or III symptoms.38 Seventy percent of the study patients were women (n=111) and the mean age was 81 years. The dose of pro-pranolol in this study was increased in 10-mg increments at 10-day intervals up to a total daily dose of 30 mg 3 times daily.
All 79 patients randomized to receive propranolol successfully reached the target dose; however, 14% (n=11) discontinued therapy due to worsening heart failure or hypotension. The absolute reduction in total mortality among patients receiving propranolol was 20%, compared with the study group receiving only standard heart failure therapy (NNT=5 for a median of 32 months of follow-up, P=.007). The positive effect of beta-blocker therapy in this small study merits another larger, complementary trial to confirm its benefits in a bigger patient population with the same characteristics.
Control of volume status
Diuretics. It has long been recognized that diuretics are a useful and necessary adjunct in the management of volume overload in patients with heart failure42; however, no large, long-term studies are available to evaluate the effects of these medications on mortality.43 Without concurrent ACE inhibitor/ARB and beta-blocker therapy, diuretics have been shown to cause rebound sympathetic activation.44,45
For patients with either systolic or diastolic dysfunction, diuretics may be dosed aggressively to achieve euvolemia. But for patients with DHF who are partly dependent on volume coupled with increased heart rate to maintain cardiac output, excessive diuresis can cause a significant reduction in preload, which can worsen symptoms.20,22,30 It is advocated that long-term diuretics should be used judiciously in the treatment of both SHF and DHF, with individualized, tailored therapy being preferred and daily weights used as a guide to determine optimum fluid status.9
Medications to control heart rate
Beta-blockers. In addition to their anti-hypertensive effects, beta-blockers may also be used as rate-lowering therapy in the treatment of DHF. Dosing and titration in this setting are handled differently than for SHF. Whereas titration of beta-blockers in SHF requires careful adjustment to avoid worsening of the patients’ symptoms and subsequent exacerbation,46-48 dosing in DHF can be more aggressive, with a resting heart rate goal of 60 to 70 bpm.20,49 Beta-blockers are used as negative chronotropes in this instance to improve left ventricular filling. Beta-blockers are also useful in the management of ischemia and angina associated with diastolic heart failure.19,20
Calcium channel blockers. For patients with contraindications to beta-blocker therapy, non-dihydropyridine calcium channel blockers (verapamil, diltiazem) may be employed as rate-lowering therapy for DHF.19 Unlike the other drugs used in DHF, non-dihydropyridine calcium channel blockers have no role in the treatment of SHF except in the presence of tachyarrhythmias.20
Dihyropyridine calcium channel blockers (ie, amlodipine, felodipine) should be reserved for heart failure patients in general with angina refractory to beta-blockers. Amlodipine and felodipine are probably the safest of the dihydropyridine calcium channel blockers to use for the treatment of angina as they have not been shown to worsen existing SHF.50,51 Verapamil has been shown in a small study to increase exercise capacity and heart failure score in patients with DHF.52
Digitalis. The use of digoxin in patients with DHF was evaluated in the Digitalis Investigation Group (DIG) ancillary trial, a parallel substudy of the overall DIG Trial that enrolled 988 patients with diastolic dysfunction.39 DHF patients receiving digoxin were found to have fewer symptoms and hospitalizations, although this finding was not statistically significant. These findings should be weighed against recent data suggesting that digoxin predisposes women with depressed left ventricular systolic dysfunction to an increased risk of death.53 The role of digoxin in DHF is unclear, and it is recommended that its use be restricted to patients with recurrent hospitalizations and refractory tachyarrhythmias despite optimized medical therapy.9,20,30,54
Prognosis
The annual mortality of patients with DHF has been reported as 5% to 8%, whereas mortality associated with SHF approximates 10% to 15%. However, in patients aged >70 years, both SHF and DHF have a 5-year mortality of 50% and both have an estimated 50% annual hospital admission rate.58
Looking forward
Greater recognition of the disorder and more enrollment of patients with DHF in outcome-based studies will hopefully improve our understanding and approach to treatment of this specific form of heart failure.40,55
Ongoing studies that may provide more evidence-based data to guide therapy for DHF include the Irbesartan in Heart Failure with Preserved Systolic Function Trial (I-PRESERVE), Perindopril for Elderly People with Chronic Heart Failure Study (PEP-CHF) and Study of the Effects of Nebivolol Intervention on Outcomes and Rehospitalisation in Seniors with Heart Failure (SENIORS).56-58
- Amlodipine • Norvasc
- Candesartan • Atacand
- Digoxin • Lanoxin
- Diltiazem • Cardizem, Cartia, Pilacor, Tiazac
- Enalapril • Vasotec
- Felodipine • Plendil
- Hydrazaline • Apresoline
- Propanolol • Betachron, Inderal
- Verapamil • Calan, Covem, Isoptin, Verelan
Acknowledgments
The authors wish to thank Thomas Hill and JoAnn Moates for their invaluable research assistance in preparation of this manuscript.
CORRESPONDING AUTHOR
Spencer A. Morris, PharmD, BCPS, Georgetown Hospital System, Georgetown Memorial Hospital, 606 Black River Road, Georgetown, SC 29440. E-mail: [email protected].
1. American Heart Association. Heart Disease and Stroke Statistics—2004 Update. Dallas, Texas: American Heart Association; 2003.
2. Popvic JR, Hall MJ. 1999 National Hospital Discharge Survey. Advance data from vital and health statistics; no. 319. Hyattsville, Maryland: Nation Center for Health Statistics, 2001.
3. Krumholz HM, Parent EM, Tu N, et al. Readmission after hospitalization for congestive heart failure among Medicare beneficiaries. Arch Intern Med 1997;157:99-104.
4. Krum H, Gilbert RE. Demographics and concomitant disorders in heart failure. Lancet 2003;362:147-158.
5. Redfield MM, Jacobsen SJ, Burnett JC, et al. Burden of systolic and diastolic ventricular dysfunction in the community: appreciating the scope of the heart failure epidemic. JAMA 2003;289:194-202.
6. Senni M, Tribouilloy CM, Rodeheffer RJ, et al. Congestive heart failure in the community: a study of all incident cases in Olmsted County, Minnesota, in 1991. Circulation 1998;98:2282.-
7. Vasan RS, Larson MG, Benjamin EJ, et al. Congestive heart failure in subjects with normal versus reduced left ventricular ejection fraction: prevalence and mortality in a population-based cohort. J Am Coll Cardiol 1999;33:1948.-
8. Kitzman DW, Gardin JM, Arnold A, et al. Heart failure with preserved LV function in the elderly: clinical and echocardiographic correlates from the Cardiovascular Health Study. Circulation 1999;94:1433.-
9. Hunt SA, Baker DW, Chin MH, et al. ACC/AHA guidelines for the evaluation and management of chronic heart failure in the adult: full text: a report of the American College of Cardiology/American Heart Association Task Force on Practice Guidelines (Committee to revise the 1995 Guidelines for the Evaluation and Management of Heart Failure). Available at: http://www.acc.org/clinical/guidelines/failure/pdfs/hf_fulltext.pdf.
10. Gaasch WH. Diagnosis and treatment of heart failure based on left ventricular systolic or diastolic dysfunction. JAMA 1994;271:1276-1280.
11. Vasan RS, Levy D. Defining diastolic heart failure: a call for standardized diagnostic criteria. Circulation 2000;101:2118-2121.
12. Grossman W. Defining diastolic dysfunction. Circulation 2000;101:2020-2021.
13. Brozena SC, Jessup M. The new staging system for heart failure: what every primary care physician should know. Geriatrics 2003;58:31-36.
14. McDermott MM, Feinglas J, Sy J, et al. Hospitalized congestive heart failure patients with preserved versus abnormal left ventricular systolic function; clinical characteristics and drug therapy. Am J Med 1995;99:629-635.
15. Vasan RS, Benjamin EJ, Levy D. Prevalence, clinical features and prognosis of diastolic heart failure; an epidemiologic perspective. J Am Coll Cardiol 1995;26:1565.-
16. Kitzman DW, Gardin JM, Gottdiener JS, et al. for the CHS Research Group. Importance of heart failure with preserved systolic function in patients >65 years of age. Am J Cardiol 2001;87:413-419.
17. Masoudi FA, Havranek EP, Smith G, et al. Gender, age and heart failure with preserved left ventricular systolic function. J Am Coll Cardiol 2003;41:217-223.
18. Hellermann JP, Jacobsen SJ, Reeder GS, et al. Heart failure after myocardial infarction: Prevalence of preserved left ventricular systolic function in the community. Am Heart J 2003;145:742-748.
19. Bonow RO, Udelson JE. Left ventricular diastolic dysfunction as a cause of congestive heart failure: mechanisms and management. Ann Intern Med 1992;117:502-510.
20. Zile MR, Brutsaert DL. New concepts in diastolic dysfunction and diastolic heart failure: Part II: causal mechanisms and treatment. Circulation 2002;105:1503-1508.
21. Levy D, Larson MG, Vasan RS, Kannel WB, Ho KK. The progression from hypertension to congestive heart failure. JAMA 1996;275:1557-1562.
22. Vasan RS, Benjamin EJ, Levy D. Congestive heart failure with normal left ventricular systolic function: clinical approaches to the diagnosis and treatment of diastolic heart failure. Arch Intern Med 1996;156:146-157.
23. Zile MR, Brutsaert DL. New concepts in diastolic dysfunction and diastolic heart failure: Part I: diagnosis, prognosis, and measurements of diastolic function. Circulation 2002;105:1387-1393.
24. How to diagnose diastolic heart failure. European Study Group on Diastolic Heart Failure. Eur Heart J 1998;19:990.-
25. Zile MR, Gaasch WH, Carroll JD, et al. Heart failure with a normal ejection fraction: is measurement of diastolic function necessary to make the diagnosis of diastolic heart failure? Circulation 2001;104:779-782.
26. McKee PA, Castelli WP, McNamara PM, et al. The natural history of congestive heart failure: the Framingham study. N Engl J Med 1971;285:1441-1446.
27. Gandi SK, Powers JC, Nomeir A, et al. The pathogenesis of acute pulmonary edema associated with hypertension. N Engl J Med 2001;344:17-60.
28. Kitzman DW, Little WC, Brubaker PH, et al. Pathophysiological characterization of isolated dias-tolic heart failure in comparison to systolic heart failure. JAMA 2002;288:2144-2150.
29. Zile MR, Baicu CF, Gaasch WH. Diastolic heart fail-ure—abnormalities in active relaxation and passive stiffness of the left ventricle. N Engl J Med 2004;350:1953-1959.
30. Elesber AA, Redfield MM. Approach to patients with heart failure and normal ejection fraction. Mayo Clin Proc 2001;76:1047-1052.
31. Angeja BG, Grossman W. Evaluation and management of diastolic heart failure. Circulation 2003;107:659.-
32. Lubien E, DeMaria A, Krishnaswamy P, et al. Utility of b-natriuretic peptide in detecting diastolic dysfunction: comparison with Doppler velocity recordings. Circulation 2002;105:595-601.
33. Garg R, Yusuf S. Overview of randomized trials of angiotensin-converting enzyme inhibitors on mortality and morbidity in patients with heart failure. JAMA 1995;273:1450-1456.
34. Foody JM, Farrell MH, Krumholz HM. β-blocker therapy in heart failure: scientific review. JAMA 2002;287:883-889.
35. Pitt B, Zannad F, Remme WJ. The effect of spirono-lactone on morbidity and mortality in patients with severe heart failure. N Engl J Med 1999;341:709-717.
36. Pitt B, Remme W, Zannad F. Eplerenone, a selective aldosterone blocker, in patients with left ventricular dysfunction after myocardial infarction. N Engl J Med 2003;348:1309-1321.
37. Yusuf S, Pfeffer MA, Swedberg, et al. Effects of candesartan in patients with chronic heart failure and preserved left-ventricular ejection fraction: the CHARM-Preserved Trial. Lancet 2003;362:777-781.
38. Aronow WS, Ahn C, Kronzon I. Effects of propranolol versus no propranolol on total mortality plus nonfatal myocardial infarction in older patients with prior myocardial infarction, congestive heart failure, and left ventricular ejection fraction >40% treated with diuretics plus angiotensin-converting enzyme inhibitors. Am J Cardiol 1997;80:207-209.
39. The Digitalis Investigation Group. The effect of digoxin on mortality and morbidity in patients with heart failure. N Engl J Med 1997;336:525.-
40. Vasan RS. Diastolic heart failure: the condition exists and needs to be recognized, prevented, and treated. BMJ 2003;327:1181-1182.
41. Aronow WS, Kronzon I. Effect of enalapril on congestive heart failure treated with diuretics in elderly patients with prior myocardial infarction and normal left ventricular ejection fraction. Am J Cardiol 1993;71:602-604.
42. Wilson JR, Reichek N, Dunkman WB, Golberg S. Effect of diuresis on the performance of the failing left ventricle in man. Am J Med 1981;70:234-239.
43. Faris R, Flather M, Purcell H, et al. Current evidence supporting the role of diuretics in heart failure: a meta analysis of randomized controlled trials. Int J Cardiol 2002;82:149-158.
44. Cowie MR, Zaphiriou A. Management of chronic heart failure. Br Med J 2002;325:422-425.
45. Cody RJ, Kubo SH, Pickworth KK. Diuretic treatment for the sodium retention of congestive heart failure. Arch Intern Med 1994;154:1905-1914.
46. The Cardiac Insufficiency Bisoprolol Study II (CIBIS-II): a randomised trial Lancet 1999;353:9-13.
47. Effect of metoprolol CR/XL in chronic heart failure: Metoprolol CR/XL Randomised Intervention Trial in Congestive Heart Failure (MERIT-HF) Lancet 1999;353:2001-2007.
48. Packer M, Coats AJ, Fowler MB, et al. Effect of carvedilol on survival in severe chronic heart failure. N Engl J Med 2001;344:1651-1658.
49. Levine HJ. Optimum heart rate of large failing hearts. Am J Cardiol 1988;61:633-636.
50. O’Connor CM, Carson PE, Miller AB, et al. Effect of amlodipine on mode of death among patients with advanced heart failure in the PRAISE trial. Prospective Randomized Amlodipine Survival Evaluation. Am J Cardiol 1998;82:881-887.
51. Amabile CM, Spencer AP. Keeping your patient with heart failure safe: a review of potentially dangerous medications. Arch Intern Med 2004;164:709-720.
52. Setaro J, Zaret BL, Schueman Ds, et al. Usefulness of verapamil for congestive heart failure associated with abnormal left ventricular diastolic performance. Am J Cardiol 1990;66:981-986.
53. Rathore SS, Wang Y, Krumholz HM. Sex-based differences in the effect of digoxin for the treatment of heart failure. N Engl J Med 2002;347:1403-1411.
54. Yamani MH. When should digoxin be used in patients with diastolic dysfunction? Cleve Clin J Med 2001;68:481,-485.
55. Vasan RS, Benjamin EJ. Diastolic heart failure—no time to relax. N Engl J Med 2001;344:56-58.
56. Carson P, Massie B. I-PRESERVE (Irbesartan in Heart Failure with Preserved Systolic Function) Study initiation presented at the European Society of Cardiology Annual Meeting, September 3, 2002, Berlin.
57. Cleland JG, Tendera M, Adamus J, et al. Perindopril for elderly people with chronic heart failure: the PEP-CHF study.
How should we care for atopic dermatitis?
GRADE A RECOMMENDATIONS
- Long-term, intermittent application of topical corticosteroids is appropriate, effective, and safe. Hydration and occlusion enhance delivery. Data are limited regarding steroid concentration, duration of treatment, and frequency of use.
- Emollients are effective and safe. They are useful for both prevention and treatment of episodes.
- Topical tar is effective, but compliance is reduced due to staining of clothing.
- Topical calcineurin inhibitors (immunomodulators, such as pimecrolimus and tacrolimus) reduce the rash severity and symptoms in children and adults.
- Systemic immunomodulary agents (such as cyclosporin) are effective against severe atopic dermatitis, but of limited value because of adverse effects.
- Oral antibiotics should be used to treat infected skin. They are not helpful for uninfected atopic dermatitis.
- Topical antibiotics are effective for skin infections, but they lead to the development of resistance.
- Oral antihistamines do not relieve pruritis associated with atopic dermatitis. They are indicated for patients with accompanying allergies (rhinitis, conjunctivitis, or urticaria).
- Dietary supplements are not effective.
- Ultraviolet phototherapy is effective.
GRADE B RECOMMENDATIONS
- Dietary restriction is useful only for infants with proven egg allergies.
- Ultraviolet phototherapy coupled with methoxypsoralen (PUVA) is helpful.
GRADE C RECOMMENDATIONS
- Combining education with psychotherapy can reduce symptoms.
- Systemic corticosteroids can be used for short-term treatment. However, there are concerns about rebound flaring and adverse effects.
- Interferon gamma is effective.
- The efficacy of leukotriene inhibitors, desensitization injections, and theophylline is unclear.
- The effectiveness of alternative treatments (herbal therapies, hypnotherapy, acupuncture, massage, or biofeedback) is unclear.
Do topical steroids relieve atopic dermatitis?
What are the indications for pimecrolimus topical therapy?
Is ultraviolet phototherapy useful?
Are systemic corticosteroids indicated?
What is the role of immunomodulary therapies?
Children and adults with atopic dermatitis (eczema) are the target populations of a guideline that was recently funded and developed by the American Academy of Dermatology (AAD). The AAD Work Group and Guideline/Outcomes Task Force created the original document. The entire AAD membership was solicited for review and comment. The final recommendations were reviewed and approved by the AAD board of directors. The intended users are physicians.
The evidence categories for this guideline are therapeutic effectiveness and treatment. Outcomes considered are 1) occurrence of atopic dermatitis; 2) therapeutic effectiveness, as measured by clinical signs and symptoms, blood cortisol levels, symptom scores, bacterial colonization, and serum immunoglobulin E (IgE) levels; and 3) adverse events. Their rating scheme has been updated to comply with the Strength of Recommendation taxonomy (SORT). 1
Guideline relevance and limitations
Atopic dermatitis is a common problem encountered by family physicians. It typically manifests in infants aged 1 to 6 months; approximately 60% of patients experience their first outbreak by age 1 year and 90% by age 5 years. Onset of atopic dermatitis in adolescence or later is uncommon and should prompt consideration of another diagnosis.2 Females usually have a worse prognosis than males.
A lengthy bibliography accompanies this guideline. The guideline is strengthened by use of summary tables and weakened by lack of a cost-effectiveness analysis.
Guideline development and evidence review
The work group was convened and the scope of the guideline was defined. They identified clinical questions to structure the primary issues in diagnosis and management. A literature search in Medline and EMBASE databases spanning the years 1990 to June 3, 2003, was performed. Additional searches were done by hand searching publications, including reviews, meta-analyses and correspondence.
The resultant prospective studies for treatments were screened for outcome evidence. A meta-analysis of patient data and a systematic review of the evidence were performed. Quality and strength of evidence were weighted according to a rating scheme.
Source for this guideline
Hanifin JM, Cooper KD, Ho VC, et al. Guidelines of care for atopic dermatitis. J Am Acad Dermatol 2004; 50:391–404.
Other guidelines for atopic dermatitis
Guidelines for the evaluation of food allergies
This guideline from 2001 provides a rational approach to the evaluation of food allergies. Children with atopic dermatitis have a greater risk of food allergies. Allergy testing should be performed, when there is poor response to initial treatments.
Source. American Gastroenterological Association medical position statement: guidelines for the evaluation of food allergies. Gastroenterology 2001; 120:1023–1025.
Rhinitis
This guideline, revised in 2003, contains very little information about atopic dermatitis.
Source. Institute for Clinical Systems Improvement (ICSI). Rhinitis. Bloomington, Minn: Institute for Clinical Systems Improvement (ICSI); 2003 May. 34 p. [86 references]
Neonatal skin care
This guideline is mostly directed to routine skin care for infants and does not list separate special instructions for atopic dermatitis.
Source. Association of Women’s Health, Obstetric and Neonatal Nurses (AWHONN). Neonatal Skin Care. Evidence-based Clinical Practice Guideline. Washington, DC: AWHONN; 2001. 54 p. [148 references]
CORRESPONDENCE
Keith B. Holten, MD, 825 Locust Street, Wilmington, OH 45177. E-mail: [email protected]
1. Ebell M, Siwek J, Weiss BD, et al. Strength of recommendation taxonomy (SORT): A patient-centered approach to grading evidence in the medical literature. J FamPract 2004;53:111-120.
2. Ghidorzi AJ, Jr. Atopic dermatitis. eMedicine. June 2001. Available at: www.emedicine.com/emerg/topic130.htm. Accessed on April 20, 2005.
GRADE A RECOMMENDATIONS
- Long-term, intermittent application of topical corticosteroids is appropriate, effective, and safe. Hydration and occlusion enhance delivery. Data are limited regarding steroid concentration, duration of treatment, and frequency of use.
- Emollients are effective and safe. They are useful for both prevention and treatment of episodes.
- Topical tar is effective, but compliance is reduced due to staining of clothing.
- Topical calcineurin inhibitors (immunomodulators, such as pimecrolimus and tacrolimus) reduce the rash severity and symptoms in children and adults.
- Systemic immunomodulary agents (such as cyclosporin) are effective against severe atopic dermatitis, but of limited value because of adverse effects.
- Oral antibiotics should be used to treat infected skin. They are not helpful for uninfected atopic dermatitis.
- Topical antibiotics are effective for skin infections, but they lead to the development of resistance.
- Oral antihistamines do not relieve pruritis associated with atopic dermatitis. They are indicated for patients with accompanying allergies (rhinitis, conjunctivitis, or urticaria).
- Dietary supplements are not effective.
- Ultraviolet phototherapy is effective.
GRADE B RECOMMENDATIONS
- Dietary restriction is useful only for infants with proven egg allergies.
- Ultraviolet phototherapy coupled with methoxypsoralen (PUVA) is helpful.
GRADE C RECOMMENDATIONS
- Combining education with psychotherapy can reduce symptoms.
- Systemic corticosteroids can be used for short-term treatment. However, there are concerns about rebound flaring and adverse effects.
- Interferon gamma is effective.
- The efficacy of leukotriene inhibitors, desensitization injections, and theophylline is unclear.
- The effectiveness of alternative treatments (herbal therapies, hypnotherapy, acupuncture, massage, or biofeedback) is unclear.
Do topical steroids relieve atopic dermatitis?
What are the indications for pimecrolimus topical therapy?
Is ultraviolet phototherapy useful?
Are systemic corticosteroids indicated?
What is the role of immunomodulary therapies?
Children and adults with atopic dermatitis (eczema) are the target populations of a guideline that was recently funded and developed by the American Academy of Dermatology (AAD). The AAD Work Group and Guideline/Outcomes Task Force created the original document. The entire AAD membership was solicited for review and comment. The final recommendations were reviewed and approved by the AAD board of directors. The intended users are physicians.
The evidence categories for this guideline are therapeutic effectiveness and treatment. Outcomes considered are 1) occurrence of atopic dermatitis; 2) therapeutic effectiveness, as measured by clinical signs and symptoms, blood cortisol levels, symptom scores, bacterial colonization, and serum immunoglobulin E (IgE) levels; and 3) adverse events. Their rating scheme has been updated to comply with the Strength of Recommendation taxonomy (SORT). 1
Guideline relevance and limitations
Atopic dermatitis is a common problem encountered by family physicians. It typically manifests in infants aged 1 to 6 months; approximately 60% of patients experience their first outbreak by age 1 year and 90% by age 5 years. Onset of atopic dermatitis in adolescence or later is uncommon and should prompt consideration of another diagnosis.2 Females usually have a worse prognosis than males.
A lengthy bibliography accompanies this guideline. The guideline is strengthened by use of summary tables and weakened by lack of a cost-effectiveness analysis.
Guideline development and evidence review
The work group was convened and the scope of the guideline was defined. They identified clinical questions to structure the primary issues in diagnosis and management. A literature search in Medline and EMBASE databases spanning the years 1990 to June 3, 2003, was performed. Additional searches were done by hand searching publications, including reviews, meta-analyses and correspondence.
The resultant prospective studies for treatments were screened for outcome evidence. A meta-analysis of patient data and a systematic review of the evidence were performed. Quality and strength of evidence were weighted according to a rating scheme.
Source for this guideline
Hanifin JM, Cooper KD, Ho VC, et al. Guidelines of care for atopic dermatitis. J Am Acad Dermatol 2004; 50:391–404.
Other guidelines for atopic dermatitis
Guidelines for the evaluation of food allergies
This guideline from 2001 provides a rational approach to the evaluation of food allergies. Children with atopic dermatitis have a greater risk of food allergies. Allergy testing should be performed, when there is poor response to initial treatments.
Source. American Gastroenterological Association medical position statement: guidelines for the evaluation of food allergies. Gastroenterology 2001; 120:1023–1025.
Rhinitis
This guideline, revised in 2003, contains very little information about atopic dermatitis.
Source. Institute for Clinical Systems Improvement (ICSI). Rhinitis. Bloomington, Minn: Institute for Clinical Systems Improvement (ICSI); 2003 May. 34 p. [86 references]
Neonatal skin care
This guideline is mostly directed to routine skin care for infants and does not list separate special instructions for atopic dermatitis.
Source. Association of Women’s Health, Obstetric and Neonatal Nurses (AWHONN). Neonatal Skin Care. Evidence-based Clinical Practice Guideline. Washington, DC: AWHONN; 2001. 54 p. [148 references]
CORRESPONDENCE
Keith B. Holten, MD, 825 Locust Street, Wilmington, OH 45177. E-mail: [email protected]
1. Ebell M, Siwek J, Weiss BD, et al. Strength of recommendation taxonomy (SORT): A patient-centered approach to grading evidence in the medical literature. J FamPract 2004;53:111-120.
2. Ghidorzi AJ, Jr. Atopic dermatitis. eMedicine. June 2001. Available at: www.emedicine.com/emerg/topic130.htm. Accessed on April 20, 2005.
Preventing recurrent ischemic stroke: A 3-step plan
- Once a stroke patient has stabilized, if there is no contraindication, consider starting an antihypertensive agent regardless of the baseline blood pressure.
- For symptomatic patients with high-grade carotid stenosis (70% to 99%), plan a course of medical management plus carotid endarterectomy (CEA). With moderate carotid stenosis (50% to 69%), CEA offers only moderate stroke risk reduction.
- When aspirin is the antiplatelet drug of choice, it is reasonable to use daily doses between 50 mg and 325 mg.
For patients with atherosclerotic ischemic infarction, 3 steps are needed to achieve the goal of preventing recurrent stroke: address risk factors, clear blocked arteries, and thin the blood.
Step 1: Address risk factors
Risk factors that are non-modifiable put patients at highest risk for recurrent stroke and dictate more aggressive management measures.
Advanced age is the most serious non-modifiable risk factor for stroke.1 Risk of stroke in those older than 65 years is 16 to 25 times higher than the risk for younger people.2
Sex, family history, race, ethnicity, and geographic location also show a positive correlation with stroke incidence. Men are 1.25 times more likely to suffer stroke than women,1 although women account for 60% of stroke fatalities.3 The “stroke belt,” a cluster of 11 states in the southeastern United States, has considerably higher stroke mortality than the country as a whole.4 African Americans are at greater risk for primary ischemic stroke and stroke mortality than are whites.3
TABLE 1 lists modifiable risk factors.5 Studies show that even after a stroke, these factors are often not aggressively treated, with most patients falling outside guideline recommendations for treatment of at least 1 risk factor.6 In risk management, the greatest benefit is in controlling hypertension.
TABLE 1
Modifiable risk factors for ischemic stroke in general population
| FACTOR | PREVALENCE (%) | RELATIVE RISK |
|---|---|---|
| Hypertension | 25–40 | 3–5 |
| Elevated total cholesterol level (>240 mg/dL [6.21 mmol/L]) | 6–40 | 1.8–2.6 |
| Physical inactivity | 25–50 | 2.0–3.5 |
| Smoking | 25 | 1.5 |
| Diabetes | 4–20 | 1.8–3.0 |
| Obesity | 18 | 1.8–2.4 |
| Asymptomatic carotid stenosis (>50%) | 2–8 | 2 |
| Alcohol consumption (>5 drinks/d) | 2–5 | 1.6 |
| Atrial fibrillation | 1 | 5 (nonvalvular) 17 (valvular) |
| Modified from: Straus SE, et al. JAMA 2002; 288:1388–1395. | ||
Hypertension
Up to 50% of all strokes are attributable to hypertension,1,7 making this the most commonly encountered modifiable risk factor. Risk of stroke rises proportionately with increasing blood pressure. Systolic levels of 160 mm Hg or higher, or diastolic levels of 95 mm Hg or higher, carry a relative risk of approximately 4.1,7
Even small reductions in blood pressure decrease the risk of stroke substantially.9
The Joint National Committee on Prevention, Detection, Evaluation, and Treatment of High Blood Pressure recently released its JNC 7 Report,5 which says that increased risk for cardiovascular disease begins at systolic blood pressure of 115 mm Hg and diastolic blood pressure of 75 mg Hg.
The current recommendation for blood pressure control is <140/90 mm Hg, with tighter control (130/85 mm Hg) being prescribed for patients with diabetes.8 The JNC 7 report established a new classification: prehypertension (120/80 mm Hg to 130/89).5 For secondary stroke prevention, studies are under way to investigate the safety and efficacy of more aggressive medical management to target a systolic blood pressure target of 120 to 130 mm Hg.
Clinical trials with antihypertensive agents. Recent trials using various antihypertensive therapies have yielded apparently contradictory data. The only prospective randomized trial of antihypertensive agents focusing on secondary stroke prevention was the Perindopril Protection Against Recurrent Stroke Study (PROGRESS). It enrolled 6105 patients with a history of stroke or transient ischemic attack (TIA) within 5 years of randomization. Patients were randomized to receive placebo or perindopril with or without indapamide (added at the treating doctor’s discretion) and were followed for 4 years.9
Patients in the treatment arm had a mean blood pressure reduction of 9/4 mm Hg. Relative risk reduction for stroke in the treatment arm was 28%. Stroke rate decreased by 43% (blood pressure reduction 12/5 mm Hg) for patients prescribed perindopril plus indapamide, while monotherapy with perindopril did not significantly reduce stroke rate. Benefit was found for patients not considered hypertensive at entry; the number of non-hypertensive patients needed to treat to prevent 1 major vascular event was 22.10
The Heart Outcomes Prevention Evaluation (HOPE) trial studied both primary and secondary stroke prevention, randomizing 9297 patients age 55 or over with high risk for vascular disease (coronary artery disease, stroke, peripheral vascular disease, or diabetes plus at least 1 other cardiovascular risk factor).11 Patients were treated with ramipril or placebo and followed for 5 years. The ramipril arm had a mean blood pressure reduction of 3/2 mm Hg, and exhibited a statistically significant 31% relative risk reduction in stroke. The risk reduction appears to be out of proportion to the blood pressure reduction, suggesting additional benefit from the angiotensin-converting enzyme inhibitor independent of its antihypertensive effect.
In the Losartan Intervention for Endpoint Reduction (LIFE) trial, addressing primary prevention, 9193 hypertensive patients were randomized to receive losartan or atenolol and were followed for a mean of 4.8 years.12 In the losartan arm, there was a 13% reduction in the combined endpoint of stroke, myocardial infarction (MI), and vascular death, with a 25% reduction in the rate of stroke despite a similar reduction in blood pressure in each arm.
In the largest of the trials, the Antihypertensive and Lipid-Lowering Treatment to Prevent Heart Attack Trial (ALLHAT), 33,357 patients with hypertension and at least 1 other vascular risk factor were randomly assigned to receive chlorthalidone, amlodipine, or lisinopril, and were followed for 4.9 years.15 No differences between treatments were found for the primary outcome (fatal coronary heart disease or nonfatal MI). In a head-to-head comparison of chlorthalidone and lisinopril, chlorthalidone yielded a 15% reduction in the rate of stroke.
Stroke is the leading cause of adult disability, the second leading cause of dementia, and the third leading cause of death in the United States. Stroke survivors are at significantly increased risk for subsequent stroke,13 with more than 75% of secondary vascular events being stroke.3 Therefore, prevention of secondary stroke saves lives, prevents disability, and is a prudent allocation of medical resources. Direct costs attributable to stroke in the United States are estimated at $28.3 billion a year, with total costs greater than $50 billion.3,14
Applying the evidence. Although no class of antihypertensive therapy is clearly superior to others for primary or secondary stroke prevention, it is clear that lowering blood pressure is effective.
Since most hypertensive stroke patients will require at least 2 agents to control blood pressure, using a thiazide diuretic or an agent to inhibit the renin-angiotensin system or both appears to be reasonable.
Once a stroke patient has stabilized, if there is no contraindication, consider starting an antihypertensive agent regardless of the baseline blood pressure.16
Hypercholesterolemia
In general, higher levels of low-density lipoprotein (LDL) cholesterol increase the risk of vascular disease. Multiple high-quality prospective randomized trials have demonstrated improved vascular outcomes for patients with coronary artery disease.17 However, the direct link to secondary prevention after stroke is somewhat tenuous.18
Clinical trials with statin therapy. Several trials have reported a benefit with statin therapy for primary stroke prevention. The Scandinavian Simvastatin Survival Study (4S) was the first to demonstrate that lowering cholesterol with a statin drug can reduce the risk of stroke by 30% compared with placebo in patients with hypercholesterolemia at high risk for vascular disease.19
The Cholesterol And Recurrent Events (CARE) trial confirmed the benefit of statin therapy in reducing the rate of stroke in a population at high vascular risk.20 In the CARE trial, pravastatin reduced the rate of stroke by 31% compared with placebo.
The Medical Research Council Heart Protection Study (HPS) randomized 20,536 high-risk patients to receive 40 mg simvastatin daily or placebo.21 Researchers found a statistically significant 25% risk reduction in prespecified endpoint stroke with an even more impressive reduction of 30% in ischemic stroke. However, in the non-prespecified analysis of patients entering the trial with ischemic stroke or TIA, no benefit of statin therapy was found for secondary stroke prevention.22
Applying available recommendations. Trials are under way to prospectively test the benefit of statin therapy for secondary stroke prevention.23 Until the results of those trials are available, guidelines are available to help with decision making. The NCEP III guidelines recommend a target LDL cholesterol level below 100 mg/dL for patients with symptomatic atherosclerotic disease.24
Cardiac risk factors
Atrial fibrillation (AF), valvular disease, coronary artery disease, and recent large MI increase the risk for stroke. Of these, AF shows the strongest association. AF increases with age and is found in 5.9% of patients older than 65 years.4 It is present in more than one third of stroke patients older than 75 and is the most common cause of ischemic stroke in this age group.25,26 Although much less common than nonvalvular AF, valvular AF poses an even greater risk.7
Applying the evidence. Prescribe war-farin for stroke patients with AF (see Anticoagulation, below). While there is a paucity of data on prevention in other causes of cardioembolic stroke, most patients with cardioembolic stroke may benefit from chronic anticoagulation.
Lifestyle risk factors
Cigarette smoking. Early studies on the association between cigarette smoking and stroke reported variable results. The Framingham Study, in a multivariate analysis, found that when hypertension and age are taken into account, smoking is a significant risk factor.27 In a prospective study of 7735 men, Wannamethee and colleagues found benefit to stopping smoking, with light smokers dropping to the level of nonsmokers and heavy smokers dropping to about a twofold risk of nonsmokers in 5 years.28 The benefit was greatest for hypertensive patients.
With the data now available, it is clear that cigarette smoking is a modifiable risk factor for ischemic infarction. Patients at risk for stroke should be given assistance in smoking cessation.
Alcohol use and abuse. The relationship between alcohol consumption and stroke risk is complex; risk with heavy use differs from that with light use. There may be racial differences in regard to alcohol risk and stroke.
Palomaki and colleagues found a protective effect of light alcohol use, with ≤50 g/wk reducing the risk of ischemic stroke.29 Data from the Framingham Study failed to show an association between alcohol consumption and ischemic stroke although there was a suggestion of reduced risk with wine.30 While the data are not completely clear, it is reasonable to recommend avoiding heavy alcohol consumption as a measure of stroke risk reduction.
Physical activity. Regular exercise has been shown to reduce the risk of cardiovascular disease by decreasing blood pressure, reducing obesity, and improving glucose homeostasis, all of which should help reduce stroke risk.
Studies looking for an association between exercise and reduced stroke risk have produced mixed results. An evidence-based recommendation cannot be made. However, in view of the low cost and low risk of the intervention, instituting a program of progressive physical activity as part of a risk reduction program after stroke is a reasonable recommendation.
The American Heart Association’s Guidelines for Primary Prevention of Cardiovascular Disease and Stroke from 2002 suggest there is a benefit from vigorous activity for 20 to 40 minutes, 3 to 5 days per week, if no medical contraindications exist.31
Diet. There is a paucity of good data regarding the potential protective effects of diet in secondary stroke prevention. Diets high in fruits and vegetables may have a protective effect against ischemic stroke.32
Current recommendations from the American Heart Association include 5 or more servings of fruits and vegetables per day, and 6 servings of grain products.33 They recommend limiting foods with high content of cholesterol raising fatty acids and food high in cholesterol.
Step 2: Clear blocked arteries
Carotid stenosis
Carotid stenosis was recognized as an important risk factor for stroke in the 1950s. Carotid endarterectomy (CEA) was reported as a putative therapy shortly thereafter. The popularity of the surgery increased steadily through the mid-1980s despite an absence of evidence for the operation’s safety or efficacy. Trials were organized in North America and Europe to test the surgery’s potential risks and benefits. More recently, trials comparing CEA to angioplasty with and without stenting were organized.
Clinical trials with carotid endarterectomy/angioplasty, with or without stenting. Several multicenter trials have explored the benefit of CEA for symptomatic patients with varying degrees of ipsilateral carotid artery stenosis. These trials found a high degree of benefit for best medical management plus CEA compared with medical treatment alone for symptomatic patients with high-grade stenosis (70% to 99%), but only moderate stroke risk reduction with moderate carotid stenosis (50% to 69%). With mild stenosis (<50%), no benefit was found for surgical intervention.34
Even for patients with 70% to 99% stenosis, benefit can be eliminated by a high rate of perisurgical complications.35 Surprisingly, CEA was also of little or no benefit for patients with symptomatic carotid near occlusion.35
Other factors influencing the relative benefit of CEA include gender (men benefit more than women), age ≥75 years (older patients do better), and timing of surgery (maximum benefit when done within 2 weeks of the most recent symptoms).36
Devices for performing carotid angioplasty with or without stenting were recently approved by the Food and Drug Administration. However, this is a new technology that has not been proven superior to CEA for most patients with symptomatic stenosis.
Applying the evidence. Be sure all patients with severe or moderate stenosis receive appropriate surgical evaluation for CEA (TABLE 2). For symptomatic patients with very high-grade carotid stenosis and surgical risks so high that the surgeon believes CEA is not an option, carotid angioplasty and stenting can be considered. A recent trial found a trend toward non-inferiority for angioplasty and stenting compared with CEA in a high-risk population. However, widespread application of this technique should await completion of clinical trials testing it in more typical cerebrovascular patients.
TABLE 2
Factors determining management of symptomatic carotid stenosis
| FAVORING MEDICAL THERAPY ALONE | FAVORING CEA |
|---|---|
| Stenosis <50% | Stenosis 70%–99%* |
| Stenosis 50%–69%, with qualification† | Age ≥75 years |
| String sign‡ | Hemispheric stroke |
| Last symptoms >3 years earlier | Last symptoms ≤2 weeks earlier |
| TMB only symptom | Contralateral occlusion |
| *Consider angioplasty with or without stenting in patients with symptomatic stenosis 70% to 99% who have failed medical management and are not candidates for CEA. | |
| † Arrange for serial imaging every 6 to 12 months, and consider CEA if stenosis increases to >70% | |
| ‡ String sign is an angiographic finding of severe carotid stenosis associated with distal collapse of the internal carotid artery in the neck. | |
| CEA, carotid endarterectomy; TMB, transient monocular blindness. | |
| Adapted from JL Saver with permission. January 14, 2004. | |
Intracranial stenosis
Patients found to have ischemic stroke secondary to intracranial large artery stenosis or occlusion present a difficult therapeutic problem. An attempt to bypass the blocked artery was studied in a large prospective randomized trial of extracranial to intracranial bypass surgery. While the study remains controversial to this day, it failed to show any benefit for surgery compared with best medical management.37 A study is now underway to examine whether patients selected for the procedure based on results of positron emission tomography will benefit.
Attempts to open stenotic and even occluded intracranial arteries have been reported in anecdotal series. However, the safety, efficacy, and durability of these procedures in this setting are speculative and should only be considered in exceptional circumstances.
Medical management of intracranial stenosis is also controversial. A retrospective study suggested that these patients may do better with anticoagulation compared with aspirin. However, a prospective randomized trial found that warfarin was no more effective than aspirin and increased risk.38
Applying the evidence. At this time, patients who have ischemic stroke due to large artery intracranial stenosis should be treated with best medical management including risk reduction and antithrombotic agents (see below). Bypass or angioplasty should be considered only if medical management fails.
Step 3: Thin the blood Anticoagulation
Warfarin is appropriate for primary stroke prevention in many patients with AF and for secondary prevention in most AF patients with a history of embolic events.10 For secondary prevention, warfarin is 68% better than placebo and significantly better than aspirin.7 Appropriate timing of warfarin therapy following ischemic stroke or TIA is controversial. Some trials indicate that the risk without acute anticoagulation is fairly low in the first 2 weeks following an initial stroke, and that the risk of recurrent stroke does not diminish with anticoagulation.
Anticoagulation for secondary stroke prevention in patients with noncardioembolic stroke is an issue still unsettled. The Stroke Prevention In Reversible Ischemia Trial (SPIRIT) compared anticoagulants—phenprocoumon, acenocoumarol, or warfarin—(international normalized ratio [INR]=3.0–4.5) with aspirin (30 mg daily) in the prevention of death from all vascular causes, nonfatal stroke, nonfatal MI, or nonfatal major bleeding complication.39 A high rate of major bleeding complications in the anticoagulation arm led to early termination of this study.39 The hazard ratio associated with the use of anticoagulants was 2.3 (95% confidence interval [CI], 1.6–3.5). Intracranial hemorrhage was the most frequently encountered bleeding complication.
The Warfarin-Aspirin Recurrent Stroke Study (WARSS) was conducted with 2206 patients who had suffered recent noncardioembolic ischemic strokes. 40 Dose-adjusted warfarin (INR=1.4–2.8) was compared with aspirin 325 mg daily.40 The primary end point of death or recurrent ischemic stroke occurred in 16.9% of patients.40 No significant differences in efficacy were found between warfarin and aspirin. Safety profiles were similar as well, although patients taking warfarin had significantly more minor hemorrhages than did those in the aspirin group.40 The Warfarin-Aspirin in Symptomatic Intracranial Disease trial compared dose-adjusted warfarin (INR=2–3) with aspirin 1300 mg/d in 569 patients with symptomatic intracranial stenosis. They recently reported a recurrent stroke rate of 11% to 12% for each treatment arm, with a somewhat higher rate of hemorrhage in the patients receiving warfarin.41
Applying the evidence. Given the absence of data favoring warfarin for secondary stroke prevention in most ischemic stroke settings apart from cardioembolic stroke, using antiplatelet agents as a first line therapy is reasonable. Based on subset analysis of data from the WARSS trial, prescribing warfarin for patients who have failed aspirin is not a reasonable choice for most patients.
Antiplatelet agents
Aspirin. Aspirin both inhibits and promotes thrombogenesis. In its antithrombotic activity, aspirin inactivates platelet cyclooxygenase irreversibly—which, in turn, inhibits formation of thromboxane A2, a potent stimulator of platelet activation and vasoconstriction. This irreversible inhibition lasts for the lifespan of the platelet (about 7 to 10 days). Aspirin’s prothrombotic action comes from blocking production of endothelial prostacyclin, a prostaglandin that causes vasodilation and deaggregation.
Aspirin is the most commonly prescribed drug for prevention of secondary stroke. Yet, despite 21 randomized clinical trials involving more than 18,000 participants, consensus is lacking on many aspects of using aspirin for stroke prevention. In a meta-analysis of trials enrolling patients with previous TIA or stroke, treatment with antiplatelet agents compared with control reduced the rate of subsequent non-fatal stroke from 10.8% to 8.3%.42
Aspirin has significant gastrointestinal (GI) toxicity and causes GI bleeding.43 The relative risk of developing peptic ulcer is 1.3, and symptoms of upper gastrotoxicity may cause withdrawal from aspirin treatment.43 Hemorrhagic stroke increases with aspirin use, but for patients at risk for secondary ischemic stroke, aspirin’s antithrombotic benefit outweighs the increased risk of hemorrhagic stroke (or GI toxicity).44
Aspirin dosing is controversial despite a large number of randomized, controlled trials. Faced with the same published papers and involvement in many of the same studies worldwide, experts fail to reach consensus on an optimal dose between 30 mg and 1500 mg. When aspirin is the antiplatelet drug of choice, absent data to show that higher dosing provides greater benefit, it is reasonable to use daily doses between 50 mg and 325 mg.
Ticlopidine. Ticlopidine is a thienopyridine derivative that irreversibly inhibits platelet aggregation by blocking the adenosine diphosphate (ADP) receptor, and it requires metabolism in the liver for this activity to take place. Ticlopidine, given 250 mg twice a day, inhibits platelet function within 24 to 48 hours of administration, peaks at 3 to 7 days, and lasts for the lifespan of the platelet.45 Bleeding time is doubled and remains prolonged for 4 to 10 days after the last dose.
The Ticlopidine Aspirin Stroke Study (TASS) examined the effects of ticlopidine 500 mg versus aspirin 1300 mg on the risk of stroke or death in 3069 patients with recent ischemic events. Ticlopidine was more effective than aspirin in reducing the risk of death from any cause or nonfatal stroke.46 The risk of fatal or nonfatal stroke was reduced by 21% compared with aspirin.46
Subgroup analysis of TASS suggested a more favorable benefit-to-risk ratio for nonwhite patients compared with white patients.47 In an attempt to validate this subgroup analysis, a second study, the African American Antiplatelet Stroke Prevention Study (AAASPS), randomized 1809 black patients with recent noncar-dioembolic stroke to receive ticlopidine 500 mg/d or aspirin 650 mg/d, and followed them for 2 years. The researchers reported no difference between the agents in the prevention of recurrent stroke, MI, or vascular death.48
Unfortunately, the clinical usefulness of this compound is limited by side effects. Diarrhea and skin rash, the most common side effects, were usually relieved by a temporary reduction in dose. However, severe reversible neutropenia occurred in nearly 1% of patients.46 Potentially life threatening thrombotic thrombocytopenic purpura has also been associated with ticlopidine. The potential for a serious adverse event requires that patients be carefully monitored during the first 3 months of treatment.46 This side effect profile makes ticlopidine a poor choice as a first line drug for secondary stroke prevention.
Clopidogrel. Like ticlopidine, clopidogrel is a thienopyridine derivative and blocks the ADP receptor. Clopidogrel’s antiplatelet effect is dose-related, with 75 mg causing prolongation of bleeding time roughly equivalent to 500 mg of ticlopidine. After a loading dose of 300 mg, the onset of action is about 2 to 5 hours, and peak platelet inhibition occurs between 3 and 7 days. Like ticlopidine, bleeding time remains prolonged for 4 to 10 days after the last dose.
The Clopidogrel versus Aspirin in Patients at Risk of Ischemic Events (CAPRIE) trial evaluated clopidogrel (75 mg once daily) versus aspirin (325 mg once daily) in reducing the risk of the combined outcome of ischemic stroke, MI, or vascular death in more than 19,000 patients who entered the trial with recent ischemic stroke, recent MI, or symptomatic peripheral vascular disease.49 A modest but statistically significant relative risk reduction of 8.7% was found for clopidogrel over aspirin (95% CI, 0.3–16.5; P=.043). For the subgroup of patients entering the trial with stroke, there was a risk reduction of 7.3% favoring clopidogrel, but this did not reach statistical significance (95% CI, –5.7 to 18.7; P=.26).
The main adverse events experienced by patients taking clopidogrel were diarrhea and rash. Patients taking aspirin experienced gastrointestinal discomfort and, more seriously, a small but statistically significant increase in gastrointestinal hemorrhage.49
The Clopidogrel in Unstable Angina to Prevent Recurrent Events (CURE) trial examined the effects of clopidogrel plus aspirin compared with aspirin alone on the combined end point of: (1) cardiovascular death, MI, or stroke; and (2) cardiovascular death, MI, stroke, or refractory ischemia in 12,562 patients with an acute coronary syndrome without ST segment elevation.50 Combination antiplatelet therapy demonstrated a relative risk reduction of 20% (95% CI, 0.72–0.90; P<.001; absolute risk reduction [ARR]=2.1%) and 16% (95% CI, 0.79–0.94; P<.001; ARR=2.3%) for the 2 primary endpoints compared with aspirin alone. Major bleeding was significantly more common in the clopidogrel plus aspirin group (relative risk increase of 38%; 95% CI, 1.13–1.67; P=.001; absolute risk increase =1%).
The applicability of the CURE trial findings to a stroke population is questionable, however. This trial addressed neither the efficacy nor the safety of this combination in a stroke population. Results were recently reported by the Management of Atherothrombosis with Clopidogrel in High Risk Patients with Recent Transient Ischemic Attack or Ischemic Stroke (MATCH) trial, which compared clopidogrel alone with clopidogrel plus aspirin in a population of patients with recent stroke or TIA plus 1 vascular risk factor.51
Researchers reported no significant difference in prevention of a combined vascular outcome or in preventing ischemic stroke alone. They did find a significant increase in life-threatening bleeding and major bleeding using the combination of aspirin and clopidogrel. Unfortunately, this trial did not address the issue of safety or efficacy of the combination of aspirin plus clopidogrel versus aspirin alone. The Stroke Prevention in Small Subcortical Strokes (SPS3) trial, an NINDS-funded study, will address this question, but the results of that trial are several years away.
Lau and colleagues52 report that the platelet inhibition activity of clopidogrel was attenuated in patients undergoing coronary artery stent implantation and who were being treated with 10 to 40 mg of atorvastatin. Antiplatelet activity was significantly attenuated for up to 8 days after stent implantation in these patients, compared with clopidogrel alone.
Based on the data, clopidogrel is the first-line drug of choice for secondary stroke prevention for patients unable to take aspirin. The combination of aspirin and clopidogrel has increased risk without increasing efficacy and, therefore, is not a reasonable first-line choice for secondary stroke prevention.
Aspirin plus extended-release dipyridamole (ER-DP). Dipyridamole reversibly inhibits platelet activity by inhibiting both platelet phosphodiesterase and the uptake of adenosine. For the standard release formulation, the time to peak concentration varies from 34 to 75 minutes.53 Standard-release dipyridamole falls below its therapeutic level about 6 to 8 hours after the last dose. And because its inhibition of platelet function is reversible, 3 to 4 daily doses of the drug are necessary to maintain the desired antiplatelet effect.54 ER-DP reportedly requires twice daily dosing and achieves a therapeutic steady state after approximately 48 hours. Combining aspirin with ER-DP has the potential for taking advantage of the inhibition of the platelet cyclooxygenase and phosphodiesterase plus the platelet uptake of adenosine.
The second European Stroke Prevention Study (ESPS-2) investigated, in a population at high risk for stroke, the safety and efficacy of 4 antiplatelet strategies: (1) aspirin 25 mg twice daily; (2) extended-release dipyridamole 200 mg twice daily; (3) combination aspirin 25 mg plus extended-release dipyridamole 200 mg twice daily; (4) and placebo.55
Compared with placebo, aspirin alone reduced stroke risk by 18.1% (P=.013) , dipyridamole alone by 16.3% (P=.039), and the combination agent by 37.0% (P<.001). The relative risk reductions for the combined end point of stroke or death were 13.2% (P=.016) with aspirin, 15.4% (P=.015) with dipyridamole, and 24.4% (P<.001) with the combination agent.
Headache and gastrointestinal disturbances were common adverse events in all treatment groups, but bleeding episodes were more frequent and severe only in the regimens that contained aspirin.55 In the aspirin group, 8.2% of patients reported bleeding, while in the aspirin plus ER-DP group, 8.7% reported bleeding.
This was the first trial to demonstrate that very-low-dose aspirin is effective in preventing secondary stroke.55 Efficacy was also found for extended-release dipyridamole as a single agent. The risk reduction achieved with the combination agent was approximately double that of either component alone.55 Aspirin plus ER-DP reduced stroke risk by 23% over aspirin alone.56
In progress now are trials validating ESPS2, comparing clopidogrel plus aspirin with aspirin alone, and comparing combination aspirin plus ER-DP with clopidogrel.
Applying the evidence. Until these trials are complete, reasonable first-line choices for secondary stroke prevention are aspirin alone or in combination with ER-DP. For patients unable to take aspirin, consider giving clopidogrel alone.
CORRESPONDENCE
Stanley N. Cohen, MD, 8700 Beverly Blvd, Suite 4127, Los Angeles, CA 90048. E-mail: [email protected]
1. Sacco RL, Benjamin EJ, Broderick JP, et al. American Heart Association prevention conference IV: Prevention and rehabilitation of stroke. Stroke 1997;28:1507-1517.
2. Centers for Disease Control. Fastats. Available at: www.cdc.gov/nchs/fastats.
3. American Stroke Association. Heart disease and stroke statistics—2003 update. Dallas, Tex: American Heart Association; 2002.
4. Perry HM, Roccella EJ. Conference report on stroke mortality in the southeastern United States. Hypertension 1998;31:1206-1215.
5. Chobanian AV, Bakris GL, Black HR, et al. The seventh report of the Joint National Committee on Prevention, Detection, Evaluation, and Treatment of High Blood Pressure. The JNC 7 Report. JAMA 2003;289:2560-2572.
6. Cheng EM, Jolly D, Date L, Cohen SN. Inadequate control of modifiable risk factors a year after a stroke. J Stroke Cerebrovasc Disease, in press.
7. Sacco RL. Risk factors, outcomes, and stroke subtypes for ischemic stroke. Neurology 1997;49(suppl 4):S39-S44.
8. Joint National Committee. The sixth report of the joint national committee on prevention, detection, evaluation, and treatment of high blood pressure. Arch Intern Med 1997;24:2413-2446.
9. PROGRESS Collaborative Group. Randomised trial of a perindopril-based blood-pressure-lowering regimen among 6105 individuals with previous stroke or transient ischaemic attack. Lancet 2001;358:1033-1041.
10. van Gijn J. The PROGRESS trial: preventing strokes by lowering blood pressure in patients with cerebral ischemia. Stroke 2002;33:319-320.
11. Heart Outcomes Prevention Evaluation Study Investigators. Effects of an angiotensin-converting-enzyme inhibitor, ramipril, on cardiovascular events in high-risk patients. N Engl J Med 2000;342:145-153.
12. Dahlof B, Devereux RB, Kjeldsen SE, et al. and the LIFE Study Group. Cardiovascular morbidity and mortality in the losartan intervention for endpoint reduction in hypertension study (LIFE): a randomized trial against atenolol. Lancet 2002;359:995-1003.
13. Vickrey BG, Rector TS, Wickstrom SL, et al. Occurrence of secondary ischemic events among persons with atherosclerotic vascular disease. Stroke 2002;33:901-906.
14. American Heart Association. Heart Disease and Stroke Statistics—2005 Update. Dallas, Tex.: American Heart Association; 2005. Available at: www.americanheart.org/downloadable/heart/1105390918119HDSStats2005Upd ate.pdf. Accessed on March 30, 2005.
15. ALLHAT Officers and Coordinators for the ALLHAT Collaborative Research Group. Major outcomes in high-risk hypertensive patients randomized to angiotensin-converting enzyme inhibitor or calcium channel blocker vs diuretic: The Antihypertensive and Lipid-Lowering Treatment to Prevent Heart Attack Trial (ALLHAT). JAMA 2002;288:2981-2997.
16. Bath P. Blood pressure-lowering for secondary prevention of stroke: ACE inhibition is not the key. Stroke 2003;34:1334-1335.
17. Streja DA. Managing lipids in stroke patients. In Cohen SN (ed): Management of Acute Ischemic Stroke New York: McGraw-Hill; 2000;119-132.
18. Boden-Albala B, Sacco RL. Modifiable risk factors for stroke: hypertension, diabetes mellitus, lipids, tobacco use, physical inactivity, and alcohol. In: Gorelick PB, Alter M (eds). The Prevention of Stroke New York: Parthenon Publishing Group; 2002;21-37.
19. Scandinavian Simvastatin Survival Study Group. Randomised trial of cholesterol lowering in 4444 patients with coronary heart disease: the Scandinavian Simvastatin Survival Study (4S). Lancet 1994;344:1383-1389.
20. Sacks FM, Pfeffer MA, Moye LA, et al. and the Cholesterol and Recurrent Events Trial Investigators. The effect of pravastatin on coronary events after MI in patients with average cholesterol levels. N Engl J Med 1996;335:1001-1009.
21. Heart Protection Study Collaborative Group. MRC/BHF heart protection study of cholesterol lowering with simvastatin in 20536 high-risk individuals: a randomised placebo-controlled trial. Lancet 2002;360:7-22.
22. Coull BM. Statin therapy after acute ischemic stroke in the Heart Protection Study. Stroke 2004;35:2233-2234.
23. The SPARCL Investigators. Design and baseline characteristics of the Stroke Prevention by Aggressive Reduction in Cholesterol Levels (SPARCL) Study. Cerebrovasc Dis 2003;16:389-395.
24. Expert Panel on Detection, Evaluation, and Treatment of High Blood Cholesterol in Adults. Executive Summary of the Third Report of The National Cholesterol Education Program (NCEP) Expert Panel on Detection, Evaluation, and Treatment of High Blood Cholesterol in Adults (Adult Treatment Panel III). JAMA 2001;285:2486-2497.
25. Hart RG, Sherman DG, Easton JD, Cairns JA. Prevention of stroke in patients with nonvalvular atrial fibrillation. Neurology 1998;51:674-681.
26. Hart RG, Halperin JL. Atrial fibrillation and stroke. Stroke 2001;32:803-808.
27. Wolf PA, D’Agostino B, Kannel WB, et al. Cigarette smoking as a risk factor for stroke. JAMA 1988;259:1025-1029.
28. Wannamethee G, Perry IJ, Sharper AG. Haematocfrit, hypertension and risk of stroke. J Intern Med 1994;235:163-168.
29. Palomaki H, Kaste M. Regular light to moderate intake of alcohol and risk of ischemic stroke: is there a beneficial effect? Stroke 1993;24:1828-1832.
30. Djousse L, Ellison RC, Beiser A, et al. Alcohol consumption and risk of ischemic stroke: the Framingham Study. Stroke 2002;33:907-912.
31. Pearson TA, Blair SN, Daniels SR, et al. AHA guidelines for primary prevention of cardiovascular disease and stroke: 2002 update: Consensus panel guide to comprehensive risk reduction for adult patients without coronary or other atherosclerotic vascular diseases. American Heart Association Science Advisory and Coordinating Committee. Circulation 2002;106:388-391.
32. Joshipura KJ, Ascherio A, Manson JE, et al. Fruit and vegetable intake in relation to risk of ischemic stroke. JAMA 1999;282:1233-1239.
33. Krauss RM, Eckel RH, Howard B, et al. AHA dietary guidelines: Revision 2000: A statement for healthcare professionals from the nutrition committee of the American Heart Association. Stroke 2000;31:2751-2766.
34. Rothwell PM, Eliasziw M, Gutnikov SA, et al. Analysis of pooled data from the randomized controlled trials of endarterectomy for symptomatic carotid stenosis. Lancet 2003;361:107-116.
35. Rothwell PM, Gutnikov SA, Warlow CP. for the European Carotid Surgry Trialists’ Collaboration. Reanalysis of the final results of the European Carotid Surgery Trial. Stroke 2003;34:514-523.
36. Rothwell PM, Eliasziw M, Gutnikov SA, et al. Endarterectomy for symptomatic carotid stenosis in relation to clinical subgroups and timing of surgery. Lancet 2004;363:915-924.
37. EC/IC Bypass Study Group. Failure of extracranial-intracranial arterial bypass to reduce the risk of ischemic stroke: results of an international randomized trial. N Engl J Med 1985;313:1191-1200.
38. Chimowitz MI, Lynn MJ, Howlett-Smith H, et al. Comparison of warfarin and aspirin for symptomatic intracranial arterial stenosis. N Engl J Med 2005;352:1305-1316.
39. The Stroke Prevention In Reversible Ischemia Trial (SPIRIT) Study Group. A randomized trial of anticoagulants versus aspirin after cerebral ischemia of presumed arterial origin. Ann Neurol 1997;42:857-865.
40. Mohr JP, Thompson JLP, Lazar RM, et al. A comparison of warfarin and aspirin for the prevention of recurrent ischemic stroke. N Engl J Med 2001;345:1444-1451.
41. Chimowitz M, Howell-Smith H, Stern B, et. and WASID Investigators. Warfarin-Aspirin Symptomatic Intracranial Disease (WASID) trial: final results. Stroke 2004;35:235.-
42. Antithrombotic Trialists’ Collaboration. Collaborative meta-analysis of randomized trials of antiplatelet therapy for prevention of death, myocardial infarction, and stroke in high risk patients. BMJ 2002;324:71-86.
43. Roderick PJ, Wilkes HC, Meade TW. The gastrointestinal toxicity of aspirin: an overview of randomised controlled trials. Br J Clin Pharmacol 1993;35:219-226.
44. He J, Whelton PK, Vu B, Klag MJ. Aspirin and risk of hemorrhagic stroke. JAMA 1998;280:1930-1935.
45. Quinn MJ, Fitzgerald DJ. Ticlopidine and clopidogrel. Circulation 1999;100:1667-1672.
46. Hass WK, Easton JD, Adams HP, et al. A randomized trial comparing ticlopidine hydrochloride with aspirin for the prevention of stroke in high-risk patients. N Engl J Med 1989;321:501-507.
47. Weissberg LA. for the Ticlopidine Aspirin Stroke Study Group. The efficacy and safety of ticlopidine and aspirin in non-whites: analysis of a patient subgroup from the Ticlopidine Aspirin Stroke Study. Neurology 1993;43:27-31.
48. Gorelick PB, Richardson D, Kelly M, et al. and African American Antiplatelet Stroke Prevention (AAASPS) Investigators. Aspirin and ticlopidine for prevention of recurrent stroke in black patients. JAMA 2003;289:2947-2957.
49. CAPRIE Steering Committee. A randomised, blinded, trial of clopidogrel versus aspirin in patients at risk of ischaemic events (CAPRIE). Lancet 1996;348:1329-1339.
50. Mehta SR, Yusuf S. Clopidogrel in Unstable angina to prevent Recurrent Events (CURE) Study Investigators. The Clopidogrel in Unstable angina to prevent Recurrent Events (CURE) trial programme; rationale, design and baseline characteristics including a meta-analysis of the effects of thienopyridines in vascular disease. Eur Heart J 2000;21:2033-2041.
51. Diener HC, Bogousslavsky J, Brass LM, et al. MATCH investigators. Aspirin and clopidogrel compared with clopidogrel alone after recent ischaemic stroke or transient ischaemic attack in high-risk patients (MATCH): randomised, double-blind, placebo-controlled trial. Lancet 2004;364:331-337.
52. Lau WC, Waskell LA, Watkins PB, et al. Atorvastatin reduces the ability of clopidogrel to inhibit platelet aggregation. A new drug-drug interaction. Circulation 2003;107:32-37.
53. Mahony C, Wolfram KM, Cocchetto DM, Bjornsson TD. Dipyridamole kinetics. Clin Pharmacol Ther 1982;31:330-338.
54. Dresse A, Chevolet C, Delapierre D, et al. Pharmacokinetics of oral dipyridamole (Persantine) and its effect on platelet adenosine uptake in man. Eur J Clin Pharmacol 1982;23:229-234.
55. Diener HC, Cunha L, Forbes C, Sivenius J, Smets P, Lowenthal A. European Stroke Prevention Study.2. Dipyridamole and acetylsalicylic acid in the secondary prevention of stroke. J Neurol Sci 1996;143:1-13.
56. Wilterdink JL, Easton JD. Dipyridamole plus aspirin in cerebrovascular disease. Arch Neurol 1999;56:1087-1092.
- Once a stroke patient has stabilized, if there is no contraindication, consider starting an antihypertensive agent regardless of the baseline blood pressure.
- For symptomatic patients with high-grade carotid stenosis (70% to 99%), plan a course of medical management plus carotid endarterectomy (CEA). With moderate carotid stenosis (50% to 69%), CEA offers only moderate stroke risk reduction.
- When aspirin is the antiplatelet drug of choice, it is reasonable to use daily doses between 50 mg and 325 mg.
For patients with atherosclerotic ischemic infarction, 3 steps are needed to achieve the goal of preventing recurrent stroke: address risk factors, clear blocked arteries, and thin the blood.
Step 1: Address risk factors
Risk factors that are non-modifiable put patients at highest risk for recurrent stroke and dictate more aggressive management measures.
Advanced age is the most serious non-modifiable risk factor for stroke.1 Risk of stroke in those older than 65 years is 16 to 25 times higher than the risk for younger people.2
Sex, family history, race, ethnicity, and geographic location also show a positive correlation with stroke incidence. Men are 1.25 times more likely to suffer stroke than women,1 although women account for 60% of stroke fatalities.3 The “stroke belt,” a cluster of 11 states in the southeastern United States, has considerably higher stroke mortality than the country as a whole.4 African Americans are at greater risk for primary ischemic stroke and stroke mortality than are whites.3
TABLE 1 lists modifiable risk factors.5 Studies show that even after a stroke, these factors are often not aggressively treated, with most patients falling outside guideline recommendations for treatment of at least 1 risk factor.6 In risk management, the greatest benefit is in controlling hypertension.
TABLE 1
Modifiable risk factors for ischemic stroke in general population
| FACTOR | PREVALENCE (%) | RELATIVE RISK |
|---|---|---|
| Hypertension | 25–40 | 3–5 |
| Elevated total cholesterol level (>240 mg/dL [6.21 mmol/L]) | 6–40 | 1.8–2.6 |
| Physical inactivity | 25–50 | 2.0–3.5 |
| Smoking | 25 | 1.5 |
| Diabetes | 4–20 | 1.8–3.0 |
| Obesity | 18 | 1.8–2.4 |
| Asymptomatic carotid stenosis (>50%) | 2–8 | 2 |
| Alcohol consumption (>5 drinks/d) | 2–5 | 1.6 |
| Atrial fibrillation | 1 | 5 (nonvalvular) 17 (valvular) |
| Modified from: Straus SE, et al. JAMA 2002; 288:1388–1395. | ||
Hypertension
Up to 50% of all strokes are attributable to hypertension,1,7 making this the most commonly encountered modifiable risk factor. Risk of stroke rises proportionately with increasing blood pressure. Systolic levels of 160 mm Hg or higher, or diastolic levels of 95 mm Hg or higher, carry a relative risk of approximately 4.1,7
Even small reductions in blood pressure decrease the risk of stroke substantially.9
The Joint National Committee on Prevention, Detection, Evaluation, and Treatment of High Blood Pressure recently released its JNC 7 Report,5 which says that increased risk for cardiovascular disease begins at systolic blood pressure of 115 mm Hg and diastolic blood pressure of 75 mg Hg.
The current recommendation for blood pressure control is <140/90 mm Hg, with tighter control (130/85 mm Hg) being prescribed for patients with diabetes.8 The JNC 7 report established a new classification: prehypertension (120/80 mm Hg to 130/89).5 For secondary stroke prevention, studies are under way to investigate the safety and efficacy of more aggressive medical management to target a systolic blood pressure target of 120 to 130 mm Hg.
Clinical trials with antihypertensive agents. Recent trials using various antihypertensive therapies have yielded apparently contradictory data. The only prospective randomized trial of antihypertensive agents focusing on secondary stroke prevention was the Perindopril Protection Against Recurrent Stroke Study (PROGRESS). It enrolled 6105 patients with a history of stroke or transient ischemic attack (TIA) within 5 years of randomization. Patients were randomized to receive placebo or perindopril with or without indapamide (added at the treating doctor’s discretion) and were followed for 4 years.9
Patients in the treatment arm had a mean blood pressure reduction of 9/4 mm Hg. Relative risk reduction for stroke in the treatment arm was 28%. Stroke rate decreased by 43% (blood pressure reduction 12/5 mm Hg) for patients prescribed perindopril plus indapamide, while monotherapy with perindopril did not significantly reduce stroke rate. Benefit was found for patients not considered hypertensive at entry; the number of non-hypertensive patients needed to treat to prevent 1 major vascular event was 22.10
The Heart Outcomes Prevention Evaluation (HOPE) trial studied both primary and secondary stroke prevention, randomizing 9297 patients age 55 or over with high risk for vascular disease (coronary artery disease, stroke, peripheral vascular disease, or diabetes plus at least 1 other cardiovascular risk factor).11 Patients were treated with ramipril or placebo and followed for 5 years. The ramipril arm had a mean blood pressure reduction of 3/2 mm Hg, and exhibited a statistically significant 31% relative risk reduction in stroke. The risk reduction appears to be out of proportion to the blood pressure reduction, suggesting additional benefit from the angiotensin-converting enzyme inhibitor independent of its antihypertensive effect.
In the Losartan Intervention for Endpoint Reduction (LIFE) trial, addressing primary prevention, 9193 hypertensive patients were randomized to receive losartan or atenolol and were followed for a mean of 4.8 years.12 In the losartan arm, there was a 13% reduction in the combined endpoint of stroke, myocardial infarction (MI), and vascular death, with a 25% reduction in the rate of stroke despite a similar reduction in blood pressure in each arm.
In the largest of the trials, the Antihypertensive and Lipid-Lowering Treatment to Prevent Heart Attack Trial (ALLHAT), 33,357 patients with hypertension and at least 1 other vascular risk factor were randomly assigned to receive chlorthalidone, amlodipine, or lisinopril, and were followed for 4.9 years.15 No differences between treatments were found for the primary outcome (fatal coronary heart disease or nonfatal MI). In a head-to-head comparison of chlorthalidone and lisinopril, chlorthalidone yielded a 15% reduction in the rate of stroke.
Stroke is the leading cause of adult disability, the second leading cause of dementia, and the third leading cause of death in the United States. Stroke survivors are at significantly increased risk for subsequent stroke,13 with more than 75% of secondary vascular events being stroke.3 Therefore, prevention of secondary stroke saves lives, prevents disability, and is a prudent allocation of medical resources. Direct costs attributable to stroke in the United States are estimated at $28.3 billion a year, with total costs greater than $50 billion.3,14
Applying the evidence. Although no class of antihypertensive therapy is clearly superior to others for primary or secondary stroke prevention, it is clear that lowering blood pressure is effective.
Since most hypertensive stroke patients will require at least 2 agents to control blood pressure, using a thiazide diuretic or an agent to inhibit the renin-angiotensin system or both appears to be reasonable.
Once a stroke patient has stabilized, if there is no contraindication, consider starting an antihypertensive agent regardless of the baseline blood pressure.16
Hypercholesterolemia
In general, higher levels of low-density lipoprotein (LDL) cholesterol increase the risk of vascular disease. Multiple high-quality prospective randomized trials have demonstrated improved vascular outcomes for patients with coronary artery disease.17 However, the direct link to secondary prevention after stroke is somewhat tenuous.18
Clinical trials with statin therapy. Several trials have reported a benefit with statin therapy for primary stroke prevention. The Scandinavian Simvastatin Survival Study (4S) was the first to demonstrate that lowering cholesterol with a statin drug can reduce the risk of stroke by 30% compared with placebo in patients with hypercholesterolemia at high risk for vascular disease.19
The Cholesterol And Recurrent Events (CARE) trial confirmed the benefit of statin therapy in reducing the rate of stroke in a population at high vascular risk.20 In the CARE trial, pravastatin reduced the rate of stroke by 31% compared with placebo.
The Medical Research Council Heart Protection Study (HPS) randomized 20,536 high-risk patients to receive 40 mg simvastatin daily or placebo.21 Researchers found a statistically significant 25% risk reduction in prespecified endpoint stroke with an even more impressive reduction of 30% in ischemic stroke. However, in the non-prespecified analysis of patients entering the trial with ischemic stroke or TIA, no benefit of statin therapy was found for secondary stroke prevention.22
Applying available recommendations. Trials are under way to prospectively test the benefit of statin therapy for secondary stroke prevention.23 Until the results of those trials are available, guidelines are available to help with decision making. The NCEP III guidelines recommend a target LDL cholesterol level below 100 mg/dL for patients with symptomatic atherosclerotic disease.24
Cardiac risk factors
Atrial fibrillation (AF), valvular disease, coronary artery disease, and recent large MI increase the risk for stroke. Of these, AF shows the strongest association. AF increases with age and is found in 5.9% of patients older than 65 years.4 It is present in more than one third of stroke patients older than 75 and is the most common cause of ischemic stroke in this age group.25,26 Although much less common than nonvalvular AF, valvular AF poses an even greater risk.7
Applying the evidence. Prescribe war-farin for stroke patients with AF (see Anticoagulation, below). While there is a paucity of data on prevention in other causes of cardioembolic stroke, most patients with cardioembolic stroke may benefit from chronic anticoagulation.
Lifestyle risk factors
Cigarette smoking. Early studies on the association between cigarette smoking and stroke reported variable results. The Framingham Study, in a multivariate analysis, found that when hypertension and age are taken into account, smoking is a significant risk factor.27 In a prospective study of 7735 men, Wannamethee and colleagues found benefit to stopping smoking, with light smokers dropping to the level of nonsmokers and heavy smokers dropping to about a twofold risk of nonsmokers in 5 years.28 The benefit was greatest for hypertensive patients.
With the data now available, it is clear that cigarette smoking is a modifiable risk factor for ischemic infarction. Patients at risk for stroke should be given assistance in smoking cessation.
Alcohol use and abuse. The relationship between alcohol consumption and stroke risk is complex; risk with heavy use differs from that with light use. There may be racial differences in regard to alcohol risk and stroke.
Palomaki and colleagues found a protective effect of light alcohol use, with ≤50 g/wk reducing the risk of ischemic stroke.29 Data from the Framingham Study failed to show an association between alcohol consumption and ischemic stroke although there was a suggestion of reduced risk with wine.30 While the data are not completely clear, it is reasonable to recommend avoiding heavy alcohol consumption as a measure of stroke risk reduction.
Physical activity. Regular exercise has been shown to reduce the risk of cardiovascular disease by decreasing blood pressure, reducing obesity, and improving glucose homeostasis, all of which should help reduce stroke risk.
Studies looking for an association between exercise and reduced stroke risk have produced mixed results. An evidence-based recommendation cannot be made. However, in view of the low cost and low risk of the intervention, instituting a program of progressive physical activity as part of a risk reduction program after stroke is a reasonable recommendation.
The American Heart Association’s Guidelines for Primary Prevention of Cardiovascular Disease and Stroke from 2002 suggest there is a benefit from vigorous activity for 20 to 40 minutes, 3 to 5 days per week, if no medical contraindications exist.31
Diet. There is a paucity of good data regarding the potential protective effects of diet in secondary stroke prevention. Diets high in fruits and vegetables may have a protective effect against ischemic stroke.32
Current recommendations from the American Heart Association include 5 or more servings of fruits and vegetables per day, and 6 servings of grain products.33 They recommend limiting foods with high content of cholesterol raising fatty acids and food high in cholesterol.
Step 2: Clear blocked arteries
Carotid stenosis
Carotid stenosis was recognized as an important risk factor for stroke in the 1950s. Carotid endarterectomy (CEA) was reported as a putative therapy shortly thereafter. The popularity of the surgery increased steadily through the mid-1980s despite an absence of evidence for the operation’s safety or efficacy. Trials were organized in North America and Europe to test the surgery’s potential risks and benefits. More recently, trials comparing CEA to angioplasty with and without stenting were organized.
Clinical trials with carotid endarterectomy/angioplasty, with or without stenting. Several multicenter trials have explored the benefit of CEA for symptomatic patients with varying degrees of ipsilateral carotid artery stenosis. These trials found a high degree of benefit for best medical management plus CEA compared with medical treatment alone for symptomatic patients with high-grade stenosis (70% to 99%), but only moderate stroke risk reduction with moderate carotid stenosis (50% to 69%). With mild stenosis (<50%), no benefit was found for surgical intervention.34
Even for patients with 70% to 99% stenosis, benefit can be eliminated by a high rate of perisurgical complications.35 Surprisingly, CEA was also of little or no benefit for patients with symptomatic carotid near occlusion.35
Other factors influencing the relative benefit of CEA include gender (men benefit more than women), age ≥75 years (older patients do better), and timing of surgery (maximum benefit when done within 2 weeks of the most recent symptoms).36
Devices for performing carotid angioplasty with or without stenting were recently approved by the Food and Drug Administration. However, this is a new technology that has not been proven superior to CEA for most patients with symptomatic stenosis.
Applying the evidence. Be sure all patients with severe or moderate stenosis receive appropriate surgical evaluation for CEA (TABLE 2). For symptomatic patients with very high-grade carotid stenosis and surgical risks so high that the surgeon believes CEA is not an option, carotid angioplasty and stenting can be considered. A recent trial found a trend toward non-inferiority for angioplasty and stenting compared with CEA in a high-risk population. However, widespread application of this technique should await completion of clinical trials testing it in more typical cerebrovascular patients.
TABLE 2
Factors determining management of symptomatic carotid stenosis
| FAVORING MEDICAL THERAPY ALONE | FAVORING CEA |
|---|---|
| Stenosis <50% | Stenosis 70%–99%* |
| Stenosis 50%–69%, with qualification† | Age ≥75 years |
| String sign‡ | Hemispheric stroke |
| Last symptoms >3 years earlier | Last symptoms ≤2 weeks earlier |
| TMB only symptom | Contralateral occlusion |
| *Consider angioplasty with or without stenting in patients with symptomatic stenosis 70% to 99% who have failed medical management and are not candidates for CEA. | |
| † Arrange for serial imaging every 6 to 12 months, and consider CEA if stenosis increases to >70% | |
| ‡ String sign is an angiographic finding of severe carotid stenosis associated with distal collapse of the internal carotid artery in the neck. | |
| CEA, carotid endarterectomy; TMB, transient monocular blindness. | |
| Adapted from JL Saver with permission. January 14, 2004. | |
Intracranial stenosis
Patients found to have ischemic stroke secondary to intracranial large artery stenosis or occlusion present a difficult therapeutic problem. An attempt to bypass the blocked artery was studied in a large prospective randomized trial of extracranial to intracranial bypass surgery. While the study remains controversial to this day, it failed to show any benefit for surgery compared with best medical management.37 A study is now underway to examine whether patients selected for the procedure based on results of positron emission tomography will benefit.
Attempts to open stenotic and even occluded intracranial arteries have been reported in anecdotal series. However, the safety, efficacy, and durability of these procedures in this setting are speculative and should only be considered in exceptional circumstances.
Medical management of intracranial stenosis is also controversial. A retrospective study suggested that these patients may do better with anticoagulation compared with aspirin. However, a prospective randomized trial found that warfarin was no more effective than aspirin and increased risk.38
Applying the evidence. At this time, patients who have ischemic stroke due to large artery intracranial stenosis should be treated with best medical management including risk reduction and antithrombotic agents (see below). Bypass or angioplasty should be considered only if medical management fails.
Step 3: Thin the blood Anticoagulation
Warfarin is appropriate for primary stroke prevention in many patients with AF and for secondary prevention in most AF patients with a history of embolic events.10 For secondary prevention, warfarin is 68% better than placebo and significantly better than aspirin.7 Appropriate timing of warfarin therapy following ischemic stroke or TIA is controversial. Some trials indicate that the risk without acute anticoagulation is fairly low in the first 2 weeks following an initial stroke, and that the risk of recurrent stroke does not diminish with anticoagulation.
Anticoagulation for secondary stroke prevention in patients with noncardioembolic stroke is an issue still unsettled. The Stroke Prevention In Reversible Ischemia Trial (SPIRIT) compared anticoagulants—phenprocoumon, acenocoumarol, or warfarin—(international normalized ratio [INR]=3.0–4.5) with aspirin (30 mg daily) in the prevention of death from all vascular causes, nonfatal stroke, nonfatal MI, or nonfatal major bleeding complication.39 A high rate of major bleeding complications in the anticoagulation arm led to early termination of this study.39 The hazard ratio associated with the use of anticoagulants was 2.3 (95% confidence interval [CI], 1.6–3.5). Intracranial hemorrhage was the most frequently encountered bleeding complication.
The Warfarin-Aspirin Recurrent Stroke Study (WARSS) was conducted with 2206 patients who had suffered recent noncardioembolic ischemic strokes. 40 Dose-adjusted warfarin (INR=1.4–2.8) was compared with aspirin 325 mg daily.40 The primary end point of death or recurrent ischemic stroke occurred in 16.9% of patients.40 No significant differences in efficacy were found between warfarin and aspirin. Safety profiles were similar as well, although patients taking warfarin had significantly more minor hemorrhages than did those in the aspirin group.40 The Warfarin-Aspirin in Symptomatic Intracranial Disease trial compared dose-adjusted warfarin (INR=2–3) with aspirin 1300 mg/d in 569 patients with symptomatic intracranial stenosis. They recently reported a recurrent stroke rate of 11% to 12% for each treatment arm, with a somewhat higher rate of hemorrhage in the patients receiving warfarin.41
Applying the evidence. Given the absence of data favoring warfarin for secondary stroke prevention in most ischemic stroke settings apart from cardioembolic stroke, using antiplatelet agents as a first line therapy is reasonable. Based on subset analysis of data from the WARSS trial, prescribing warfarin for patients who have failed aspirin is not a reasonable choice for most patients.
Antiplatelet agents
Aspirin. Aspirin both inhibits and promotes thrombogenesis. In its antithrombotic activity, aspirin inactivates platelet cyclooxygenase irreversibly—which, in turn, inhibits formation of thromboxane A2, a potent stimulator of platelet activation and vasoconstriction. This irreversible inhibition lasts for the lifespan of the platelet (about 7 to 10 days). Aspirin’s prothrombotic action comes from blocking production of endothelial prostacyclin, a prostaglandin that causes vasodilation and deaggregation.
Aspirin is the most commonly prescribed drug for prevention of secondary stroke. Yet, despite 21 randomized clinical trials involving more than 18,000 participants, consensus is lacking on many aspects of using aspirin for stroke prevention. In a meta-analysis of trials enrolling patients with previous TIA or stroke, treatment with antiplatelet agents compared with control reduced the rate of subsequent non-fatal stroke from 10.8% to 8.3%.42
Aspirin has significant gastrointestinal (GI) toxicity and causes GI bleeding.43 The relative risk of developing peptic ulcer is 1.3, and symptoms of upper gastrotoxicity may cause withdrawal from aspirin treatment.43 Hemorrhagic stroke increases with aspirin use, but for patients at risk for secondary ischemic stroke, aspirin’s antithrombotic benefit outweighs the increased risk of hemorrhagic stroke (or GI toxicity).44
Aspirin dosing is controversial despite a large number of randomized, controlled trials. Faced with the same published papers and involvement in many of the same studies worldwide, experts fail to reach consensus on an optimal dose between 30 mg and 1500 mg. When aspirin is the antiplatelet drug of choice, absent data to show that higher dosing provides greater benefit, it is reasonable to use daily doses between 50 mg and 325 mg.
Ticlopidine. Ticlopidine is a thienopyridine derivative that irreversibly inhibits platelet aggregation by blocking the adenosine diphosphate (ADP) receptor, and it requires metabolism in the liver for this activity to take place. Ticlopidine, given 250 mg twice a day, inhibits platelet function within 24 to 48 hours of administration, peaks at 3 to 7 days, and lasts for the lifespan of the platelet.45 Bleeding time is doubled and remains prolonged for 4 to 10 days after the last dose.
The Ticlopidine Aspirin Stroke Study (TASS) examined the effects of ticlopidine 500 mg versus aspirin 1300 mg on the risk of stroke or death in 3069 patients with recent ischemic events. Ticlopidine was more effective than aspirin in reducing the risk of death from any cause or nonfatal stroke.46 The risk of fatal or nonfatal stroke was reduced by 21% compared with aspirin.46
Subgroup analysis of TASS suggested a more favorable benefit-to-risk ratio for nonwhite patients compared with white patients.47 In an attempt to validate this subgroup analysis, a second study, the African American Antiplatelet Stroke Prevention Study (AAASPS), randomized 1809 black patients with recent noncar-dioembolic stroke to receive ticlopidine 500 mg/d or aspirin 650 mg/d, and followed them for 2 years. The researchers reported no difference between the agents in the prevention of recurrent stroke, MI, or vascular death.48
Unfortunately, the clinical usefulness of this compound is limited by side effects. Diarrhea and skin rash, the most common side effects, were usually relieved by a temporary reduction in dose. However, severe reversible neutropenia occurred in nearly 1% of patients.46 Potentially life threatening thrombotic thrombocytopenic purpura has also been associated with ticlopidine. The potential for a serious adverse event requires that patients be carefully monitored during the first 3 months of treatment.46 This side effect profile makes ticlopidine a poor choice as a first line drug for secondary stroke prevention.
Clopidogrel. Like ticlopidine, clopidogrel is a thienopyridine derivative and blocks the ADP receptor. Clopidogrel’s antiplatelet effect is dose-related, with 75 mg causing prolongation of bleeding time roughly equivalent to 500 mg of ticlopidine. After a loading dose of 300 mg, the onset of action is about 2 to 5 hours, and peak platelet inhibition occurs between 3 and 7 days. Like ticlopidine, bleeding time remains prolonged for 4 to 10 days after the last dose.
The Clopidogrel versus Aspirin in Patients at Risk of Ischemic Events (CAPRIE) trial evaluated clopidogrel (75 mg once daily) versus aspirin (325 mg once daily) in reducing the risk of the combined outcome of ischemic stroke, MI, or vascular death in more than 19,000 patients who entered the trial with recent ischemic stroke, recent MI, or symptomatic peripheral vascular disease.49 A modest but statistically significant relative risk reduction of 8.7% was found for clopidogrel over aspirin (95% CI, 0.3–16.5; P=.043). For the subgroup of patients entering the trial with stroke, there was a risk reduction of 7.3% favoring clopidogrel, but this did not reach statistical significance (95% CI, –5.7 to 18.7; P=.26).
The main adverse events experienced by patients taking clopidogrel were diarrhea and rash. Patients taking aspirin experienced gastrointestinal discomfort and, more seriously, a small but statistically significant increase in gastrointestinal hemorrhage.49
The Clopidogrel in Unstable Angina to Prevent Recurrent Events (CURE) trial examined the effects of clopidogrel plus aspirin compared with aspirin alone on the combined end point of: (1) cardiovascular death, MI, or stroke; and (2) cardiovascular death, MI, stroke, or refractory ischemia in 12,562 patients with an acute coronary syndrome without ST segment elevation.50 Combination antiplatelet therapy demonstrated a relative risk reduction of 20% (95% CI, 0.72–0.90; P<.001; absolute risk reduction [ARR]=2.1%) and 16% (95% CI, 0.79–0.94; P<.001; ARR=2.3%) for the 2 primary endpoints compared with aspirin alone. Major bleeding was significantly more common in the clopidogrel plus aspirin group (relative risk increase of 38%; 95% CI, 1.13–1.67; P=.001; absolute risk increase =1%).
The applicability of the CURE trial findings to a stroke population is questionable, however. This trial addressed neither the efficacy nor the safety of this combination in a stroke population. Results were recently reported by the Management of Atherothrombosis with Clopidogrel in High Risk Patients with Recent Transient Ischemic Attack or Ischemic Stroke (MATCH) trial, which compared clopidogrel alone with clopidogrel plus aspirin in a population of patients with recent stroke or TIA plus 1 vascular risk factor.51
Researchers reported no significant difference in prevention of a combined vascular outcome or in preventing ischemic stroke alone. They did find a significant increase in life-threatening bleeding and major bleeding using the combination of aspirin and clopidogrel. Unfortunately, this trial did not address the issue of safety or efficacy of the combination of aspirin plus clopidogrel versus aspirin alone. The Stroke Prevention in Small Subcortical Strokes (SPS3) trial, an NINDS-funded study, will address this question, but the results of that trial are several years away.
Lau and colleagues52 report that the platelet inhibition activity of clopidogrel was attenuated in patients undergoing coronary artery stent implantation and who were being treated with 10 to 40 mg of atorvastatin. Antiplatelet activity was significantly attenuated for up to 8 days after stent implantation in these patients, compared with clopidogrel alone.
Based on the data, clopidogrel is the first-line drug of choice for secondary stroke prevention for patients unable to take aspirin. The combination of aspirin and clopidogrel has increased risk without increasing efficacy and, therefore, is not a reasonable first-line choice for secondary stroke prevention.
Aspirin plus extended-release dipyridamole (ER-DP). Dipyridamole reversibly inhibits platelet activity by inhibiting both platelet phosphodiesterase and the uptake of adenosine. For the standard release formulation, the time to peak concentration varies from 34 to 75 minutes.53 Standard-release dipyridamole falls below its therapeutic level about 6 to 8 hours after the last dose. And because its inhibition of platelet function is reversible, 3 to 4 daily doses of the drug are necessary to maintain the desired antiplatelet effect.54 ER-DP reportedly requires twice daily dosing and achieves a therapeutic steady state after approximately 48 hours. Combining aspirin with ER-DP has the potential for taking advantage of the inhibition of the platelet cyclooxygenase and phosphodiesterase plus the platelet uptake of adenosine.
The second European Stroke Prevention Study (ESPS-2) investigated, in a population at high risk for stroke, the safety and efficacy of 4 antiplatelet strategies: (1) aspirin 25 mg twice daily; (2) extended-release dipyridamole 200 mg twice daily; (3) combination aspirin 25 mg plus extended-release dipyridamole 200 mg twice daily; (4) and placebo.55
Compared with placebo, aspirin alone reduced stroke risk by 18.1% (P=.013) , dipyridamole alone by 16.3% (P=.039), and the combination agent by 37.0% (P<.001). The relative risk reductions for the combined end point of stroke or death were 13.2% (P=.016) with aspirin, 15.4% (P=.015) with dipyridamole, and 24.4% (P<.001) with the combination agent.
Headache and gastrointestinal disturbances were common adverse events in all treatment groups, but bleeding episodes were more frequent and severe only in the regimens that contained aspirin.55 In the aspirin group, 8.2% of patients reported bleeding, while in the aspirin plus ER-DP group, 8.7% reported bleeding.
This was the first trial to demonstrate that very-low-dose aspirin is effective in preventing secondary stroke.55 Efficacy was also found for extended-release dipyridamole as a single agent. The risk reduction achieved with the combination agent was approximately double that of either component alone.55 Aspirin plus ER-DP reduced stroke risk by 23% over aspirin alone.56
In progress now are trials validating ESPS2, comparing clopidogrel plus aspirin with aspirin alone, and comparing combination aspirin plus ER-DP with clopidogrel.
Applying the evidence. Until these trials are complete, reasonable first-line choices for secondary stroke prevention are aspirin alone or in combination with ER-DP. For patients unable to take aspirin, consider giving clopidogrel alone.
CORRESPONDENCE
Stanley N. Cohen, MD, 8700 Beverly Blvd, Suite 4127, Los Angeles, CA 90048. E-mail: [email protected]
1. Sacco RL, Benjamin EJ, Broderick JP, et al. American Heart Association prevention conference IV: Prevention and rehabilitation of stroke. Stroke 1997;28:1507-1517.
2. Centers for Disease Control. Fastats. Available at: www.cdc.gov/nchs/fastats.
3. American Stroke Association. Heart disease and stroke statistics—2003 update. Dallas, Tex: American Heart Association; 2002.
4. Perry HM, Roccella EJ. Conference report on stroke mortality in the southeastern United States. Hypertension 1998;31:1206-1215.
5. Chobanian AV, Bakris GL, Black HR, et al. The seventh report of the Joint National Committee on Prevention, Detection, Evaluation, and Treatment of High Blood Pressure. The JNC 7 Report. JAMA 2003;289:2560-2572.
6. Cheng EM, Jolly D, Date L, Cohen SN. Inadequate control of modifiable risk factors a year after a stroke. J Stroke Cerebrovasc Disease, in press.
7. Sacco RL. Risk factors, outcomes, and stroke subtypes for ischemic stroke. Neurology 1997;49(suppl 4):S39-S44.
8. Joint National Committee. The sixth report of the joint national committee on prevention, detection, evaluation, and treatment of high blood pressure. Arch Intern Med 1997;24:2413-2446.
9. PROGRESS Collaborative Group. Randomised trial of a perindopril-based blood-pressure-lowering regimen among 6105 individuals with previous stroke or transient ischaemic attack. Lancet 2001;358:1033-1041.
10. van Gijn J. The PROGRESS trial: preventing strokes by lowering blood pressure in patients with cerebral ischemia. Stroke 2002;33:319-320.
11. Heart Outcomes Prevention Evaluation Study Investigators. Effects of an angiotensin-converting-enzyme inhibitor, ramipril, on cardiovascular events in high-risk patients. N Engl J Med 2000;342:145-153.
12. Dahlof B, Devereux RB, Kjeldsen SE, et al. and the LIFE Study Group. Cardiovascular morbidity and mortality in the losartan intervention for endpoint reduction in hypertension study (LIFE): a randomized trial against atenolol. Lancet 2002;359:995-1003.
13. Vickrey BG, Rector TS, Wickstrom SL, et al. Occurrence of secondary ischemic events among persons with atherosclerotic vascular disease. Stroke 2002;33:901-906.
14. American Heart Association. Heart Disease and Stroke Statistics—2005 Update. Dallas, Tex.: American Heart Association; 2005. Available at: www.americanheart.org/downloadable/heart/1105390918119HDSStats2005Upd ate.pdf. Accessed on March 30, 2005.
15. ALLHAT Officers and Coordinators for the ALLHAT Collaborative Research Group. Major outcomes in high-risk hypertensive patients randomized to angiotensin-converting enzyme inhibitor or calcium channel blocker vs diuretic: The Antihypertensive and Lipid-Lowering Treatment to Prevent Heart Attack Trial (ALLHAT). JAMA 2002;288:2981-2997.
16. Bath P. Blood pressure-lowering for secondary prevention of stroke: ACE inhibition is not the key. Stroke 2003;34:1334-1335.
17. Streja DA. Managing lipids in stroke patients. In Cohen SN (ed): Management of Acute Ischemic Stroke New York: McGraw-Hill; 2000;119-132.
18. Boden-Albala B, Sacco RL. Modifiable risk factors for stroke: hypertension, diabetes mellitus, lipids, tobacco use, physical inactivity, and alcohol. In: Gorelick PB, Alter M (eds). The Prevention of Stroke New York: Parthenon Publishing Group; 2002;21-37.
19. Scandinavian Simvastatin Survival Study Group. Randomised trial of cholesterol lowering in 4444 patients with coronary heart disease: the Scandinavian Simvastatin Survival Study (4S). Lancet 1994;344:1383-1389.
20. Sacks FM, Pfeffer MA, Moye LA, et al. and the Cholesterol and Recurrent Events Trial Investigators. The effect of pravastatin on coronary events after MI in patients with average cholesterol levels. N Engl J Med 1996;335:1001-1009.
21. Heart Protection Study Collaborative Group. MRC/BHF heart protection study of cholesterol lowering with simvastatin in 20536 high-risk individuals: a randomised placebo-controlled trial. Lancet 2002;360:7-22.
22. Coull BM. Statin therapy after acute ischemic stroke in the Heart Protection Study. Stroke 2004;35:2233-2234.
23. The SPARCL Investigators. Design and baseline characteristics of the Stroke Prevention by Aggressive Reduction in Cholesterol Levels (SPARCL) Study. Cerebrovasc Dis 2003;16:389-395.
24. Expert Panel on Detection, Evaluation, and Treatment of High Blood Cholesterol in Adults. Executive Summary of the Third Report of The National Cholesterol Education Program (NCEP) Expert Panel on Detection, Evaluation, and Treatment of High Blood Cholesterol in Adults (Adult Treatment Panel III). JAMA 2001;285:2486-2497.
25. Hart RG, Sherman DG, Easton JD, Cairns JA. Prevention of stroke in patients with nonvalvular atrial fibrillation. Neurology 1998;51:674-681.
26. Hart RG, Halperin JL. Atrial fibrillation and stroke. Stroke 2001;32:803-808.
27. Wolf PA, D’Agostino B, Kannel WB, et al. Cigarette smoking as a risk factor for stroke. JAMA 1988;259:1025-1029.
28. Wannamethee G, Perry IJ, Sharper AG. Haematocfrit, hypertension and risk of stroke. J Intern Med 1994;235:163-168.
29. Palomaki H, Kaste M. Regular light to moderate intake of alcohol and risk of ischemic stroke: is there a beneficial effect? Stroke 1993;24:1828-1832.
30. Djousse L, Ellison RC, Beiser A, et al. Alcohol consumption and risk of ischemic stroke: the Framingham Study. Stroke 2002;33:907-912.
31. Pearson TA, Blair SN, Daniels SR, et al. AHA guidelines for primary prevention of cardiovascular disease and stroke: 2002 update: Consensus panel guide to comprehensive risk reduction for adult patients without coronary or other atherosclerotic vascular diseases. American Heart Association Science Advisory and Coordinating Committee. Circulation 2002;106:388-391.
32. Joshipura KJ, Ascherio A, Manson JE, et al. Fruit and vegetable intake in relation to risk of ischemic stroke. JAMA 1999;282:1233-1239.
33. Krauss RM, Eckel RH, Howard B, et al. AHA dietary guidelines: Revision 2000: A statement for healthcare professionals from the nutrition committee of the American Heart Association. Stroke 2000;31:2751-2766.
34. Rothwell PM, Eliasziw M, Gutnikov SA, et al. Analysis of pooled data from the randomized controlled trials of endarterectomy for symptomatic carotid stenosis. Lancet 2003;361:107-116.
35. Rothwell PM, Gutnikov SA, Warlow CP. for the European Carotid Surgry Trialists’ Collaboration. Reanalysis of the final results of the European Carotid Surgery Trial. Stroke 2003;34:514-523.
36. Rothwell PM, Eliasziw M, Gutnikov SA, et al. Endarterectomy for symptomatic carotid stenosis in relation to clinical subgroups and timing of surgery. Lancet 2004;363:915-924.
37. EC/IC Bypass Study Group. Failure of extracranial-intracranial arterial bypass to reduce the risk of ischemic stroke: results of an international randomized trial. N Engl J Med 1985;313:1191-1200.
38. Chimowitz MI, Lynn MJ, Howlett-Smith H, et al. Comparison of warfarin and aspirin for symptomatic intracranial arterial stenosis. N Engl J Med 2005;352:1305-1316.
39. The Stroke Prevention In Reversible Ischemia Trial (SPIRIT) Study Group. A randomized trial of anticoagulants versus aspirin after cerebral ischemia of presumed arterial origin. Ann Neurol 1997;42:857-865.
40. Mohr JP, Thompson JLP, Lazar RM, et al. A comparison of warfarin and aspirin for the prevention of recurrent ischemic stroke. N Engl J Med 2001;345:1444-1451.
41. Chimowitz M, Howell-Smith H, Stern B, et. and WASID Investigators. Warfarin-Aspirin Symptomatic Intracranial Disease (WASID) trial: final results. Stroke 2004;35:235.-
42. Antithrombotic Trialists’ Collaboration. Collaborative meta-analysis of randomized trials of antiplatelet therapy for prevention of death, myocardial infarction, and stroke in high risk patients. BMJ 2002;324:71-86.
43. Roderick PJ, Wilkes HC, Meade TW. The gastrointestinal toxicity of aspirin: an overview of randomised controlled trials. Br J Clin Pharmacol 1993;35:219-226.
44. He J, Whelton PK, Vu B, Klag MJ. Aspirin and risk of hemorrhagic stroke. JAMA 1998;280:1930-1935.
45. Quinn MJ, Fitzgerald DJ. Ticlopidine and clopidogrel. Circulation 1999;100:1667-1672.
46. Hass WK, Easton JD, Adams HP, et al. A randomized trial comparing ticlopidine hydrochloride with aspirin for the prevention of stroke in high-risk patients. N Engl J Med 1989;321:501-507.
47. Weissberg LA. for the Ticlopidine Aspirin Stroke Study Group. The efficacy and safety of ticlopidine and aspirin in non-whites: analysis of a patient subgroup from the Ticlopidine Aspirin Stroke Study. Neurology 1993;43:27-31.
48. Gorelick PB, Richardson D, Kelly M, et al. and African American Antiplatelet Stroke Prevention (AAASPS) Investigators. Aspirin and ticlopidine for prevention of recurrent stroke in black patients. JAMA 2003;289:2947-2957.
49. CAPRIE Steering Committee. A randomised, blinded, trial of clopidogrel versus aspirin in patients at risk of ischaemic events (CAPRIE). Lancet 1996;348:1329-1339.
50. Mehta SR, Yusuf S. Clopidogrel in Unstable angina to prevent Recurrent Events (CURE) Study Investigators. The Clopidogrel in Unstable angina to prevent Recurrent Events (CURE) trial programme; rationale, design and baseline characteristics including a meta-analysis of the effects of thienopyridines in vascular disease. Eur Heart J 2000;21:2033-2041.
51. Diener HC, Bogousslavsky J, Brass LM, et al. MATCH investigators. Aspirin and clopidogrel compared with clopidogrel alone after recent ischaemic stroke or transient ischaemic attack in high-risk patients (MATCH): randomised, double-blind, placebo-controlled trial. Lancet 2004;364:331-337.
52. Lau WC, Waskell LA, Watkins PB, et al. Atorvastatin reduces the ability of clopidogrel to inhibit platelet aggregation. A new drug-drug interaction. Circulation 2003;107:32-37.
53. Mahony C, Wolfram KM, Cocchetto DM, Bjornsson TD. Dipyridamole kinetics. Clin Pharmacol Ther 1982;31:330-338.
54. Dresse A, Chevolet C, Delapierre D, et al. Pharmacokinetics of oral dipyridamole (Persantine) and its effect on platelet adenosine uptake in man. Eur J Clin Pharmacol 1982;23:229-234.
55. Diener HC, Cunha L, Forbes C, Sivenius J, Smets P, Lowenthal A. European Stroke Prevention Study.2. Dipyridamole and acetylsalicylic acid in the secondary prevention of stroke. J Neurol Sci 1996;143:1-13.
56. Wilterdink JL, Easton JD. Dipyridamole plus aspirin in cerebrovascular disease. Arch Neurol 1999;56:1087-1092.
Of mites and men: Reference bias in narrative review articles
- When consulting narrative review articles, carefully consider the possibility of citation bias and whether recommendations are based on patient-oriented and not disease-oriented outcomes.
- Consult credible evidence-based resources such as Cochrane before making changes in practice suggested by narrative reviews.
Background: Citations in scientific articles may tend to favor the views presented. We studied whether there is such reference bias in narrative review articles that discuss interventions against house dust mites for people with asthma.
Design: Systematic review of reviews identified in a Medline search that expressed an opinion about the clinical effects of physical or chemical intervention methods.
Main outcome measure: Positive bias was judged to have occurred if the reference list contained a higher proportion of trial references with significant results than among all trials available to the authors (published 2 years or more prior to the review).
Results: Seventy reviews were included, of which 63 (90%) recommended physical interventions. Forty-six reviews had trial references, 4 of these only to chemical interventions. In the remaining 42 reviews, reference bias was detected (P=2 x 10⁻⁸). The most quoted trial had only 7 patients per group, its claimed significant result was probably erroneous, and it did not report a clinical outcome. Intervention recommendations were often based on nonrandomized evidence, and the most quoted nonrandomized controlled study had included only 10 patients per group but claimed very positive results.
Conclusion: The narrative review articles were severely biased, and their positive intervention recommendations are at variance with the systematic Cochrane Review on this topic and a recent very large trial of physical intervention, both of which failed to find an effect.
Trial reports and narrative review articles sometimes favor references supporting the views of the authors, lending credence to a particular treatment1 or hypothesis.2,3 This reference bias may render the conclusions of an article less reliable. Such was the finding in our study of narrative review articles discussing interventions against house dust mites for people with asthma.
Systematic reviews are a more reliable source of information for busy clinicians than narrative reviews, but they can also be problematic. An assessment of papers on asthma, based on a validated tool, showed that 40 of 50 systematic reviews on prevention and treatment had serious or extensive flaws.4 Cochrane systematic reviews on asthma were more rigorous and better reported than systematic reviews published in peer-reviewed, paper-based journals,4 probably because Cochrane Reviews are conducted according to a set of standard methods5 aimed at minimizing bias in the reviews, and because they usually include only randomized trials.
As the index review for our study, we chose the Cochrane Review on house dust mites control measures for asthma,6 to allow us to judge whether the recommendations in narrative reviews reflected fairly the available, reliable scientific evidence.
Methods
Inclusion criteria. Narrative reviews—that is, reviews that did not have a methods section with a search strategy for relevant research papers—were eligible if they expressed an opinion about the clinical effects of chemical or physical interventions aimed at reducing exposure to house dust mite antigens in the homes of mite-sensitive patients with asthma.
Search strategy. A Medline search selected review articles from 1966 to July 2002 using the terms review* and mite* and asthma*, with no language restrictions. Additional review articles could have been found in other databases, but we chose Medline since it is freely available and likely preferred by physicians.
Data collection. Abstracts identified in the Medline search were read by one of us (LMS), who excluded articles that clearly were not reviews or that reviewed aspects other than treatments (eg, causes of asthma only). Both authors read the remaining articles in full, and conducted another round of exclusion.
Data extraction was performed independently and results were compared. Disagreements were resolved by discussion; they were usually due to simple oversight, such as a missing trial reference. Interventions were classified as physical (eg, vacuum cleaning, washing, bed covers, heating, freezing), chemical (eg, acaricides), or combinations. The review-authors’ opinions were classified into 2 groups: positive, recommending 1 or more interventions (in a few cases rather vaguely, such as allergen avoidance), or neutral/negative (eg, more research is needed or the interventions should not be used).
The index review. The Cochrane review on house dust-mite control measures for asthma was first published in 1998 in the Cochrane Library8 and in BMJ.8 The latest update from 2001 included 28 randomized trials, one of which was 3-armed.9 When referring to randomized trials in our study, the sample is the 28 trial reports included in the Cochrane review. The Cochrane review, which included 939 patients in the analysis, failed to find an effect of chemical or physical methods on any of the outcomes (number of patients improved, asthma symptoms, medication usage, peak flow, FEV1, and bronchial hyperreactivity).
Data analysis. For reviews with positive intervention recommendations, the supporting references to randomized trials were compared with all those randomized trials that might potentially have been known to the authors—that is, published 2 years or more prior to the publication date of the review.1
If, for example, a review recommended acaricides and quoted 3 trials that claimed a significant effect of this intervention and 1 trial that did not, and if 8 trials were available at the time but only 3 favored acaricides, this would be a positively biased selection of references, since the proportion of positive trials in the reference list, 3/4, was greater than among all the available trials, 3/8.1
We did not judge whether the significance testing was correctly done but noted whether the trial authors had reported 1 or more significant results favoring the intervention. We then used a sign test, for positive vs negative selection, to determine whether there was significant reference bias.
Results
The Medline search identified 302 abstracts, of which 151 were clearly of no relevance and 5 were abstracts of the index Cochrane review. Of the remaining 146, 6 were excluded because of the language; 140 were read in full, and a further 70 were excluded for other reasons. This left 70 reviews that all had intervention recommendations (positive, neutral, or negative); 63 of them (90%) positively recommended physical interventions and 30 (43%) recommended chemical interventions (TABLE).
The reviews were published between 1971 and 2002 (see the APPENDIX); they were all narrative in regard to interventions—ie, had no methods section or search strategy, whereas 1 review was systematic in regard to economy.10 Forty-six reviews (66%) contained references to a least 1 randomized trial (range 1–20, median 2, interquartile range 1–3), 4 of these to chemical interventions only. In total there were 162 trial references out of 777 possible (21%). The most quoted trial 9 had 22 citations.
Thirty-nine of the 46 reviews with trials (85%) also had references to non-randomized controlled studies that had been excluded from the Cochrane review. The authors rarely distinguished between the 2 designs but emphasized equally, or some times even more, the results obtained with nonrandomized studies. The most quoted nonrandomized study11 was referred to 25 times.
TABLE
Reviews and treatment recommendations
| INTERVENTIONS | POSITIVE RECOMMENDATIONS | NEUTRAL OR NEGATIVE RECOMMENDATIONS | NO RECOMMENDATIONS | |||
|---|---|---|---|---|---|---|
| Total | With trials | Total | With trials | Total | With trials | |
| Physical | 63 (90%) | 38 | 7 (10%) | 4 | 0 | 0 |
| Chemical | 30 (43%) | 23 | 25 (36%) | 16 | 15 (21%) | 7 |
| Distribution of the included reviews with their treatment recommendations. Of the 63 reviews with positive physical treatment recommendations, 38 had physical trial references and were included in the statistical analysis. | ||||||
Citations to trials in reviews
Since all reviews (TABLE) had an opinion on physical interventions, and since most trials were of physical interventions, we restricted the analysis to the 38 reviews with a positive recommendation for physical interventions and omitted 4 with a neutral or negative recommendation for physical interventions. We excluded 2 trial reports of physical interventions because they were published in Italian12 and Dutch13; none of the reviews quoted the Italian trial and 1 quoted the Dutch trial.
There was significant bias towards a positive selection of references in the reviews that recommended physical interventions; 10 reviews were neutral in this respect, whereas 27 reviews had a positive selection and 1 a negative selection (P=2 x 10⁻⁸). Conversely, the 4 reviews that did not recommend physical interventions all had a negative selection of references.
Discussion
Intervention recommendations in narrative reviews of house dust mites and asthma do not reflect the available, reliable evidence. Ninety percent of the reviews positively recommended physical interventions, although the Cochrane review of 28 trials on the topic6 failed to find an effect of physical and chemical interventions.
Cochrane reviews are also to some extent subjective, but trials published after the latest update of the Cochrane review on mites have provided support to its negative findings. Of note is a recently published trial of 732 patients who were allergic to mites.14 It was a double-blind, placebo-controlled trial conducted in Britain to investigate the effect of physical intervention measures (allergen-impermeable covers for mattress, pillow, and quilt). Although the interventions reduced mite allergen levels after 6 months, peak flow, medication use, and asthma symptoms were very similar in the 2 groups. During the next 6 months there was a planned reduction of inhaled corticosteroids, and also after this period, the outcomes were very similar—the morning peak flow was 431 L/min in both groups. The authors concluded that the intervention seemed clinically ineffective, in accordance with the findings of the Cochrane review.14
The narrative reviews were heavily biased by a selection of trial references that supported the opinions of the authors. When this was not the case, some authors—instead of ignoring negative results—used them as evidence that more rigorous intervention measures are needed for a positive intervention effect.
Physical interventions may need to be applied repeatedly before the reduction in allergen levels is sufficient to be effective. However, the lack of effect was also apparent in the subgroup of trials with long treatment duration or follow-up. And, if interventions were effective, one would expect to see at least some effect also in short-term trials.
Some of the authors of narrative reviews used long trial duration as a positive selection criterion for what they believed were relevant trials, but most often disregarded whether the trials were of acceptable quality in other respects. For example, the most popular randomized trial ran for a year9 and was quoted by 22 of the 35 reviews with trial references where it could have been quoted (63% citation rate). However, this trial had only 7 patients per group in the analysis, the outcome was not a clinical outcome but the result of a histamine tolerance test, and the part of the trial that yielded a significant result was not blinded. Furthermore, this result was probably not statistically significant. The authors claimed a significant result with nonparametric testing (P<.05), but when we repeated the test, using their raw data as depicted in a graph, we got P=.07; and in the comparison with the placebo group that was used in the Cochrane review of the trials,6 we got P=.15 for the geometric mean.
This trial9 is not only the most quoted in our sample of reviews, it is also the most quoted of our 28 included trials in the Science Citation Index as of September 17, 2003, where it had received 209 citations. We find it disturbing that 7 children in a nonblinded trial with no clinical outcomes have been so influential for the intervention recommendations over the past 10 years.
A survey of review articles on the relation between diet and heart disease3 showed that authors often used nonrandomized studies to create a false impression of consensus by referring to them together with the randomized trials if their results supported the authors’ opinion and ignoring them if they did not. We also found a high citation rate for nonrandomized studies. In fact, the most popular nonrandomized controlled study was only surpassed in citation rate by the small randomized trial just discussed. It was a physical intervention study,11 quoted by 25 of the 45 reviews with trial references where it could have been quoted (56% citation rate). This study was usually referred to without comment on its methodology. It had only 10 patients per group and its duration was only 1 month. The likely explanation for the high quotation rate for this study is that it had a very positive outcome for the intervention. It therefore seems that the reported results were more important than the study duration as a criterion for selection of studies for quotation.
The 24 reviews we excluded from statistical analysis because they had no references to randomized trials generally had strong intervention recommendations and argued that a reduced allergen level will lead to patient improvement. The authors often based this claim on uncontrolled studies in which the patients had been relocated to a dry, high-altitude location in the Alps with good clinical effect, but the authors failed to appreciate that the kind of allergen reduction achieved in these studies currently appears impossible to obtain in the patients’ homes.
Authors of review articles can be expected to stay abreast with new trials and to be familiar with systematic reviews within their field of expertise. However, the only systematic review6-8 in this area was quoted in just 6 of 12 reviews published at least 2 years later than the Cochrane review. Only 1 review15 did not recommend physical intervention because of the findings in the Cochrane review; another review16 disregarded the Cochrane review with the reasoning that few of the included trials obtained a reduction in allergen levels (although the Results section of the Cochrane review explained that the results were very similar in the subgroup of trials that reported successful mite reduction6).
Of the other 4 reviews that quoted the Cochrane review, the first17 mentioned it only in the introduction; the second18 claimed that the methods investigated were out of date; the third19 noted that an expert panel reviewing the same articles had come to a different conclusion than the Cochrane review; and the fourth20 stated that the complexity and heterogeneity of the interventions limited the utility of a simple statistical summary of the data as presented in the Cochrane review. Interestingly, all 4 reviews recommended physical intervention. It therefore seems that the assets of a systematic approach to the literature based on a predefined protocol, and applying rigorous methodology, was little understood.
We conclude that narrative review articles on house dust mites and asthma are severely biased in their selection of references and very unreliable in their intervention recommendations. This finding may be generalizable, since there is no reason to believe that physicians specializing in asthma should be more biased than others1-3 when they write reviews.
CORRESPONDING AUTHOR
Peter C. Gøtzsche, MD, DrMedSci, Nordic Cochrane Centre, Rigshospitalet, DK-2100 København Ø, Denmark. E-mail: [email protected].
1. Gøtzsche PC. Reference bias in reports of drug trials. Br Med J 1987;295:654-656.
2. Ravnskov U. Cholesterol lowering trials in coronary heart disease: frequency of citation and outcome. BMJ 1992;305:15-19.
3. Ravnskov U. Quotation bias in reviews of the diet-heart idea. J Clin Epidemiol 1995;48:713-719.
4. Jadad AR, Moher M, Browman GP, et al. Systematic reviews and meta-analyses on treatment of asthma: critical evaluation. BMJ 2000;320:537-540.
5. Clarke M, Oxman AD. eds Cochrane Reviewers’ Handbook 4.1.6 [updated January 2003]. Available at: www.cochrane.dk/cochrane/handbook/handbook.htm.
6. Gøtzsche PC, Johansen HK, Burr ML, Hammarquist C. House dust mite control measures for asthma (Cochrane Review). In:The Cochrane Library, issue 3. Oxford: Update Software; 2001.
7. Hammarquist C, Burr ML, Gøtzsche PC. House dust mite control measures for asthma (Cochrane review). In: The Cochrane Library, issue 3. Oxford: Update Software; 1998.
8. Gøtzsche PC, Hammarquist C, Burr M. House dust mite control measures in the management of asthma: meta-analysis. BMJ 1998;317:1105-1110.
9. Ehnert B, Lau-Schadendorf S, Weber A, Buettner P, Schou C, Wahn U. Reducing domestic exposure to dust mite allergen reduces bronchial hyperreactivity in sensitive children with asthma. J Allergy Clin Immunol 1992;90:135-138.
10. Mellis CM, Peat JK, Woolcock AJ. The cost of asthma: can it be reduced? Pharmacoeconomics 1993;3:205-219.
11. Murray AB, Ferguson AC. Dust-free bedrooms in the treatment of asthmatic children with house dust or house dust mite allergy: a controlled trial. Pediatrics 1983;71:418-422.
12. Cinti C, Canessa PA, Lavecchia MA, Capecchi V. The efficacy of ‘mite-proof’ mattress-covers and pillow-covers in the control of asthma in patients allergic to mites [in Italian]. Lotta Contro La Tuberculosi e Le Malattie Polmonari Sociali 1996;66:131-138.
13. Maesen FP, Sluysmans FG, Brombacher PJ, Smeets JJ. [Experience with the use of air filtration-apparatus in homes of atopic subjects allergic to house dust]. Acta Tuberc Pneumol Belg 1977;68:133-146.
14. Woodcock A, Forster L, et al. Control of exposure to mite allergen and allergen-impermeable bed covers for adults with asthma. N Engl J Med 2003;349:225-236.
15. Strachan DP. The role of environmental factors in asthma. Br Med Bull 2000;56:865-882.
16. Custovic A, Woodcock A. Clinical effects of allergen avoidance. Clin Rev Allergy Immunol 2000;18:397-419.
17. Vaughan JW, Platts-Mills TA. New approaches to environmental control. Clin Rev Allergy Immunol 2000;18:325-339.
18. Schnyder B, Schweri T, Thomann B, Pichler C. [Allergy to house dust mites]. Schweiz Med Wochenschr 2000;130:443-447.
19. de Blay F, Casel S, Colas F, Spirlet F, Pauli G. [Elimination of airborne allergens from the household environment]. Rev Mal Respir 2000;17:29-39.
20. Tovey E, Marks G. Methods and effectiveness of environmental control. J Allergy Clin Immunol 1999;103(2 Pt 1):179-191.
- When consulting narrative review articles, carefully consider the possibility of citation bias and whether recommendations are based on patient-oriented and not disease-oriented outcomes.
- Consult credible evidence-based resources such as Cochrane before making changes in practice suggested by narrative reviews.
Background: Citations in scientific articles may tend to favor the views presented. We studied whether there is such reference bias in narrative review articles that discuss interventions against house dust mites for people with asthma.
Design: Systematic review of reviews identified in a Medline search that expressed an opinion about the clinical effects of physical or chemical intervention methods.
Main outcome measure: Positive bias was judged to have occurred if the reference list contained a higher proportion of trial references with significant results than among all trials available to the authors (published 2 years or more prior to the review).
Results: Seventy reviews were included, of which 63 (90%) recommended physical interventions. Forty-six reviews had trial references, 4 of these only to chemical interventions. In the remaining 42 reviews, reference bias was detected (P=2 x 10⁻⁸). The most quoted trial had only 7 patients per group, its claimed significant result was probably erroneous, and it did not report a clinical outcome. Intervention recommendations were often based on nonrandomized evidence, and the most quoted nonrandomized controlled study had included only 10 patients per group but claimed very positive results.
Conclusion: The narrative review articles were severely biased, and their positive intervention recommendations are at variance with the systematic Cochrane Review on this topic and a recent very large trial of physical intervention, both of which failed to find an effect.
Trial reports and narrative review articles sometimes favor references supporting the views of the authors, lending credence to a particular treatment1 or hypothesis.2,3 This reference bias may render the conclusions of an article less reliable. Such was the finding in our study of narrative review articles discussing interventions against house dust mites for people with asthma.
Systematic reviews are a more reliable source of information for busy clinicians than narrative reviews, but they can also be problematic. An assessment of papers on asthma, based on a validated tool, showed that 40 of 50 systematic reviews on prevention and treatment had serious or extensive flaws.4 Cochrane systematic reviews on asthma were more rigorous and better reported than systematic reviews published in peer-reviewed, paper-based journals,4 probably because Cochrane Reviews are conducted according to a set of standard methods5 aimed at minimizing bias in the reviews, and because they usually include only randomized trials.
As the index review for our study, we chose the Cochrane Review on house dust mites control measures for asthma,6 to allow us to judge whether the recommendations in narrative reviews reflected fairly the available, reliable scientific evidence.
Methods
Inclusion criteria. Narrative reviews—that is, reviews that did not have a methods section with a search strategy for relevant research papers—were eligible if they expressed an opinion about the clinical effects of chemical or physical interventions aimed at reducing exposure to house dust mite antigens in the homes of mite-sensitive patients with asthma.
Search strategy. A Medline search selected review articles from 1966 to July 2002 using the terms review* and mite* and asthma*, with no language restrictions. Additional review articles could have been found in other databases, but we chose Medline since it is freely available and likely preferred by physicians.
Data collection. Abstracts identified in the Medline search were read by one of us (LMS), who excluded articles that clearly were not reviews or that reviewed aspects other than treatments (eg, causes of asthma only). Both authors read the remaining articles in full, and conducted another round of exclusion.
Data extraction was performed independently and results were compared. Disagreements were resolved by discussion; they were usually due to simple oversight, such as a missing trial reference. Interventions were classified as physical (eg, vacuum cleaning, washing, bed covers, heating, freezing), chemical (eg, acaricides), or combinations. The review-authors’ opinions were classified into 2 groups: positive, recommending 1 or more interventions (in a few cases rather vaguely, such as allergen avoidance), or neutral/negative (eg, more research is needed or the interventions should not be used).
The index review. The Cochrane review on house dust-mite control measures for asthma was first published in 1998 in the Cochrane Library8 and in BMJ.8 The latest update from 2001 included 28 randomized trials, one of which was 3-armed.9 When referring to randomized trials in our study, the sample is the 28 trial reports included in the Cochrane review. The Cochrane review, which included 939 patients in the analysis, failed to find an effect of chemical or physical methods on any of the outcomes (number of patients improved, asthma symptoms, medication usage, peak flow, FEV1, and bronchial hyperreactivity).
Data analysis. For reviews with positive intervention recommendations, the supporting references to randomized trials were compared with all those randomized trials that might potentially have been known to the authors—that is, published 2 years or more prior to the publication date of the review.1
If, for example, a review recommended acaricides and quoted 3 trials that claimed a significant effect of this intervention and 1 trial that did not, and if 8 trials were available at the time but only 3 favored acaricides, this would be a positively biased selection of references, since the proportion of positive trials in the reference list, 3/4, was greater than among all the available trials, 3/8.1
We did not judge whether the significance testing was correctly done but noted whether the trial authors had reported 1 or more significant results favoring the intervention. We then used a sign test, for positive vs negative selection, to determine whether there was significant reference bias.
Results
The Medline search identified 302 abstracts, of which 151 were clearly of no relevance and 5 were abstracts of the index Cochrane review. Of the remaining 146, 6 were excluded because of the language; 140 were read in full, and a further 70 were excluded for other reasons. This left 70 reviews that all had intervention recommendations (positive, neutral, or negative); 63 of them (90%) positively recommended physical interventions and 30 (43%) recommended chemical interventions (TABLE).
The reviews were published between 1971 and 2002 (see the APPENDIX); they were all narrative in regard to interventions—ie, had no methods section or search strategy, whereas 1 review was systematic in regard to economy.10 Forty-six reviews (66%) contained references to a least 1 randomized trial (range 1–20, median 2, interquartile range 1–3), 4 of these to chemical interventions only. In total there were 162 trial references out of 777 possible (21%). The most quoted trial 9 had 22 citations.
Thirty-nine of the 46 reviews with trials (85%) also had references to non-randomized controlled studies that had been excluded from the Cochrane review. The authors rarely distinguished between the 2 designs but emphasized equally, or some times even more, the results obtained with nonrandomized studies. The most quoted nonrandomized study11 was referred to 25 times.
TABLE
Reviews and treatment recommendations
| INTERVENTIONS | POSITIVE RECOMMENDATIONS | NEUTRAL OR NEGATIVE RECOMMENDATIONS | NO RECOMMENDATIONS | |||
|---|---|---|---|---|---|---|
| Total | With trials | Total | With trials | Total | With trials | |
| Physical | 63 (90%) | 38 | 7 (10%) | 4 | 0 | 0 |
| Chemical | 30 (43%) | 23 | 25 (36%) | 16 | 15 (21%) | 7 |
| Distribution of the included reviews with their treatment recommendations. Of the 63 reviews with positive physical treatment recommendations, 38 had physical trial references and were included in the statistical analysis. | ||||||
Citations to trials in reviews
Since all reviews (TABLE) had an opinion on physical interventions, and since most trials were of physical interventions, we restricted the analysis to the 38 reviews with a positive recommendation for physical interventions and omitted 4 with a neutral or negative recommendation for physical interventions. We excluded 2 trial reports of physical interventions because they were published in Italian12 and Dutch13; none of the reviews quoted the Italian trial and 1 quoted the Dutch trial.
There was significant bias towards a positive selection of references in the reviews that recommended physical interventions; 10 reviews were neutral in this respect, whereas 27 reviews had a positive selection and 1 a negative selection (P=2 x 10⁻⁸). Conversely, the 4 reviews that did not recommend physical interventions all had a negative selection of references.
Discussion
Intervention recommendations in narrative reviews of house dust mites and asthma do not reflect the available, reliable evidence. Ninety percent of the reviews positively recommended physical interventions, although the Cochrane review of 28 trials on the topic6 failed to find an effect of physical and chemical interventions.
Cochrane reviews are also to some extent subjective, but trials published after the latest update of the Cochrane review on mites have provided support to its negative findings. Of note is a recently published trial of 732 patients who were allergic to mites.14 It was a double-blind, placebo-controlled trial conducted in Britain to investigate the effect of physical intervention measures (allergen-impermeable covers for mattress, pillow, and quilt). Although the interventions reduced mite allergen levels after 6 months, peak flow, medication use, and asthma symptoms were very similar in the 2 groups. During the next 6 months there was a planned reduction of inhaled corticosteroids, and also after this period, the outcomes were very similar—the morning peak flow was 431 L/min in both groups. The authors concluded that the intervention seemed clinically ineffective, in accordance with the findings of the Cochrane review.14
The narrative reviews were heavily biased by a selection of trial references that supported the opinions of the authors. When this was not the case, some authors—instead of ignoring negative results—used them as evidence that more rigorous intervention measures are needed for a positive intervention effect.
Physical interventions may need to be applied repeatedly before the reduction in allergen levels is sufficient to be effective. However, the lack of effect was also apparent in the subgroup of trials with long treatment duration or follow-up. And, if interventions were effective, one would expect to see at least some effect also in short-term trials.
Some of the authors of narrative reviews used long trial duration as a positive selection criterion for what they believed were relevant trials, but most often disregarded whether the trials were of acceptable quality in other respects. For example, the most popular randomized trial ran for a year9 and was quoted by 22 of the 35 reviews with trial references where it could have been quoted (63% citation rate). However, this trial had only 7 patients per group in the analysis, the outcome was not a clinical outcome but the result of a histamine tolerance test, and the part of the trial that yielded a significant result was not blinded. Furthermore, this result was probably not statistically significant. The authors claimed a significant result with nonparametric testing (P<.05), but when we repeated the test, using their raw data as depicted in a graph, we got P=.07; and in the comparison with the placebo group that was used in the Cochrane review of the trials,6 we got P=.15 for the geometric mean.
This trial9 is not only the most quoted in our sample of reviews, it is also the most quoted of our 28 included trials in the Science Citation Index as of September 17, 2003, where it had received 209 citations. We find it disturbing that 7 children in a nonblinded trial with no clinical outcomes have been so influential for the intervention recommendations over the past 10 years.
A survey of review articles on the relation between diet and heart disease3 showed that authors often used nonrandomized studies to create a false impression of consensus by referring to them together with the randomized trials if their results supported the authors’ opinion and ignoring them if they did not. We also found a high citation rate for nonrandomized studies. In fact, the most popular nonrandomized controlled study was only surpassed in citation rate by the small randomized trial just discussed. It was a physical intervention study,11 quoted by 25 of the 45 reviews with trial references where it could have been quoted (56% citation rate). This study was usually referred to without comment on its methodology. It had only 10 patients per group and its duration was only 1 month. The likely explanation for the high quotation rate for this study is that it had a very positive outcome for the intervention. It therefore seems that the reported results were more important than the study duration as a criterion for selection of studies for quotation.
The 24 reviews we excluded from statistical analysis because they had no references to randomized trials generally had strong intervention recommendations and argued that a reduced allergen level will lead to patient improvement. The authors often based this claim on uncontrolled studies in which the patients had been relocated to a dry, high-altitude location in the Alps with good clinical effect, but the authors failed to appreciate that the kind of allergen reduction achieved in these studies currently appears impossible to obtain in the patients’ homes.
Authors of review articles can be expected to stay abreast with new trials and to be familiar with systematic reviews within their field of expertise. However, the only systematic review6-8 in this area was quoted in just 6 of 12 reviews published at least 2 years later than the Cochrane review. Only 1 review15 did not recommend physical intervention because of the findings in the Cochrane review; another review16 disregarded the Cochrane review with the reasoning that few of the included trials obtained a reduction in allergen levels (although the Results section of the Cochrane review explained that the results were very similar in the subgroup of trials that reported successful mite reduction6).
Of the other 4 reviews that quoted the Cochrane review, the first17 mentioned it only in the introduction; the second18 claimed that the methods investigated were out of date; the third19 noted that an expert panel reviewing the same articles had come to a different conclusion than the Cochrane review; and the fourth20 stated that the complexity and heterogeneity of the interventions limited the utility of a simple statistical summary of the data as presented in the Cochrane review. Interestingly, all 4 reviews recommended physical intervention. It therefore seems that the assets of a systematic approach to the literature based on a predefined protocol, and applying rigorous methodology, was little understood.
We conclude that narrative review articles on house dust mites and asthma are severely biased in their selection of references and very unreliable in their intervention recommendations. This finding may be generalizable, since there is no reason to believe that physicians specializing in asthma should be more biased than others1-3 when they write reviews.
CORRESPONDING AUTHOR
Peter C. Gøtzsche, MD, DrMedSci, Nordic Cochrane Centre, Rigshospitalet, DK-2100 København Ø, Denmark. E-mail: [email protected].
1. Gøtzsche PC. Reference bias in reports of drug trials. Br Med J 1987;295:654-656.
2. Ravnskov U. Cholesterol lowering trials in coronary heart disease: frequency of citation and outcome. BMJ 1992;305:15-19.
3. Ravnskov U. Quotation bias in reviews of the diet-heart idea. J Clin Epidemiol 1995;48:713-719.
4. Jadad AR, Moher M, Browman GP, et al. Systematic reviews and meta-analyses on treatment of asthma: critical evaluation. BMJ 2000;320:537-540.
5. Clarke M, Oxman AD. eds Cochrane Reviewers’ Handbook 4.1.6 [updated January 2003]. Available at: www.cochrane.dk/cochrane/handbook/handbook.htm.
6. Gøtzsche PC, Johansen HK, Burr ML, Hammarquist C. House dust mite control measures for asthma (Cochrane Review). In:The Cochrane Library, issue 3. Oxford: Update Software; 2001.
7. Hammarquist C, Burr ML, Gøtzsche PC. House dust mite control measures for asthma (Cochrane review). In: The Cochrane Library, issue 3. Oxford: Update Software; 1998.
8. Gøtzsche PC, Hammarquist C, Burr M. House dust mite control measures in the management of asthma: meta-analysis. BMJ 1998;317:1105-1110.
9. Ehnert B, Lau-Schadendorf S, Weber A, Buettner P, Schou C, Wahn U. Reducing domestic exposure to dust mite allergen reduces bronchial hyperreactivity in sensitive children with asthma. J Allergy Clin Immunol 1992;90:135-138.
10. Mellis CM, Peat JK, Woolcock AJ. The cost of asthma: can it be reduced? Pharmacoeconomics 1993;3:205-219.
11. Murray AB, Ferguson AC. Dust-free bedrooms in the treatment of asthmatic children with house dust or house dust mite allergy: a controlled trial. Pediatrics 1983;71:418-422.
12. Cinti C, Canessa PA, Lavecchia MA, Capecchi V. The efficacy of ‘mite-proof’ mattress-covers and pillow-covers in the control of asthma in patients allergic to mites [in Italian]. Lotta Contro La Tuberculosi e Le Malattie Polmonari Sociali 1996;66:131-138.
13. Maesen FP, Sluysmans FG, Brombacher PJ, Smeets JJ. [Experience with the use of air filtration-apparatus in homes of atopic subjects allergic to house dust]. Acta Tuberc Pneumol Belg 1977;68:133-146.
14. Woodcock A, Forster L, et al. Control of exposure to mite allergen and allergen-impermeable bed covers for adults with asthma. N Engl J Med 2003;349:225-236.
15. Strachan DP. The role of environmental factors in asthma. Br Med Bull 2000;56:865-882.
16. Custovic A, Woodcock A. Clinical effects of allergen avoidance. Clin Rev Allergy Immunol 2000;18:397-419.
17. Vaughan JW, Platts-Mills TA. New approaches to environmental control. Clin Rev Allergy Immunol 2000;18:325-339.
18. Schnyder B, Schweri T, Thomann B, Pichler C. [Allergy to house dust mites]. Schweiz Med Wochenschr 2000;130:443-447.
19. de Blay F, Casel S, Colas F, Spirlet F, Pauli G. [Elimination of airborne allergens from the household environment]. Rev Mal Respir 2000;17:29-39.
20. Tovey E, Marks G. Methods and effectiveness of environmental control. J Allergy Clin Immunol 1999;103(2 Pt 1):179-191.
Acute otitis media: Making sense of recent guidelines on antimicrobial treatment
- High-dose amoxicillin (80 to 90 mg/kg/d divided twice daily) remains the drug of choice for treatment of acute otitis media despite increasing antimicrobial resistance. (B)
- For persistent or recurrent acute otitis media, guidelines recommend high-dose amoxicillin/clavulanate (90/6.4 mg/kg/d), cefdinir, cefprozil, cefpodoxime, cefuroxime or ceftriaxone.(B)
- Increasing the dose of amoxicillin does not cover infection with β-lactamase-producing pathogens; add the β-lactamase inhibitor clavulanate to amoxicillin, or choose a cephalosporin with good activity against S pneumoniae and good β-lactamase stability.(A)
- Key factors for enhancing compliance are taste of suspension, dosing frequency, and duration of therapy. (B)
Empiric treatment of acute otitis media (AOM) should target Streptococcus pneumoniae, nontypeable Haemophilus influenzae, and Moraxella catarrhalis—these bacteria are most often isolated in AOM.1 Group A streptococci and Staphylococcus aureus are involved less often.1 Viruses are the sole AOM pathogen in fewer than 10% of cases; Mycoplasma pneumoniae and Chlamydia pneumoniae rarely cause AOM.
Amoxicillin, 80 to 90 mg/kg/d divided twice daily, remains the drug of choice for AOM despite increasing antimicrobial resistance. Over-diagnosis of AOM and frequent spontaneous resolution of true AOM make amoxicillin the most cost-effective agent. For persistent or recurrent AOM, guidelines recommend high-dose amoxicillin/clavulanate, 90/6.4 mg/kg/d, cefdinir, cefprozil, cefpodoxime, cefuroxime, or ceftriaxone. When the diagnosis is uncertain or the child is older than 2 years, observation may be an option.
The American Academy of Pediatrics and the American Academy of Family Physicians (AAP/AAFP) guideline for management of AOM has several new recommendations that could influence antimicrobial choices for AOM. Among them are use of cephalosporins for non-anaphylaxis penicillin-allergic patients, and regard for such compliance factors as product taste, dosing frequency, and length of therapy.
Pertinent guidelines
The Drug-Resistant Streptococcus pneumoniae (DRSP) Therapeutic Working Group sponsored by the Centers for Disease Control and Prevention (CDC) published recommendations for the management of AOM in 1999.2 A guideline on the treatment of persistent and recurrent AOM based on the recommendations made by the CDC were published by a Clinical Advisory Committee in 2000.3 The AAFP and AAP published a new guideline in 2004.4
What the guidelines agree on
AOM may be difficult to diagnose. The history and symptoms are neither sensitive nor specific enough to make an accurate diagnosis of AOM.5,6 Although various definitions of AOM have been proposed, all agree that AOM is a diagnosis based on visualization of the tympanic membrane and assessment of middle-ear fluid status. Certain physical signs, including bulging of the tympanic membrane, distortion of the light reflex, redness, and disappearance of the translucency of the tympanic membrane are typical of AOM (FIGURE 1).7
AOM must be differentiated from OME. It is crucial to distinguish between AOM and otitis media with effusion (OME) because OME is usually not treated with antimicrobials.7 This is a clinical conundrum because OME often precedes and follows AOM (FIGURE 1).
Although OME is considered asymptomatic except for hearing loss, it is now known to cause mild to moderate otalgia associated with tympanic membrane stretching.1,3,7 Ear tugging and poor sleep follow.
The optimal physical finding to differentiate OME from AOM is tympanic membrane position. Patients with AOM have a bulging tympanic membrane; those with OME have a neutral or retracted tympanic membrane (FIGURE 1). Tympanic membrane position is best assessed with pneumatic otoscopy.1,3,7
Tympanocentesis usually necessary. All guidelines advocate that physicians either learn the skills needed to perform tympanocentesis, or refer patients to a clinician who can perform the procedure when 2 sequential treatment failures occur and for other indications.2-4 In cases of persistent or recurrent AOM, tympanocentesis with a culture of the middle-ear fluid may be especially useful in guiding treatment. In addition, evacuation of the middle-ear effusion can be helpful in breaking the cycle of persistent and recurrent AOM.
Criteria for choosing an antimicrobial. The most important consideration in selecting an antimicrobial is efficacy against S pneumoniae. Although this pathogen as a cause of AOM is decreasing in the wake of widespread use of the 7-valent pneumococcal conjugate vaccine,8 it is also the least likely of the 3 main pathogens to resolve spontaneously without treatment.2,9
All guidelines also recommend that the selected antibiotic have efficacy against β-lactamase-producing strains of H influenzae and M catarrhalis.
S pneumoniae with reduced susceptibility to penicillin, and H influenzae that produce β-lactamase, are significantly more prevalent among children than adults, especially among children who attend day care, who have received antimicrobials within the preceding month, or who have not responded to recent treatment.2,3 An antimicrobial chosen empirically must not only have activity against the major pathogens, but it must also achieve a peak concentration in the middle-ear fluid sufficient to eradicate S pneumoniae with reduced susceptibility to penicillin and retain activity if β-lactamase is produced by a gram-negative organism.
All guidelines recommend oral amoxicillin as first-line therapy in AOM. The AAP/AAFP guideline recommends increasing the dosage used for empiric treatment from 40–45 mg/kg/d to 80–90 mg/kg/d for all children, because the prevalence of penicillin-resistant S pneumoniae has continued to rise and has reached a level in 2004 where standard-dose amoxicillin is no longer considered adequate (see Acute otitis media’s etiologic profile today).
Both penicillin-intermediate S pneumoniae (minimum inhibitory concentration [MIC] 0.12–1.0 μg/mL) and resistant S pneumoniae (penicillin MIC ≥2.0 μg/mL) are common causes of AOM in the United States.10 Further complicating treatment, most resistant strains of S pneumoniae are also resistant to other classes of antimicrobials, such as macrolides, trimethoprim/sulfamethoxazole, and clindamycin.
A steadily increasing number of H influenzae and nearly all M catarrhalis strains are β-lactamase producers.11 These resistant pathogens are most commonly isolated from children in day care, from children younger than 2 years of age, during the winter months, from children recently treated with antimicrobials, and from those who have not responded to treatment.3,12
Extensive and often inappropriate use of antimicrobials has contributed to increased resistance, which complicates treatment of AOM, increases treatment failure, has motivated a search for newer drugs effective against resistant strains.
Differences among the guidelines
After the CDC2 and Clinical Advisory Committee3 guidelines were published, the Agency for Healthcare Research and Quality (AHRQ) report13 was released; it suggested most episodes of AOM resolve without the use of antimicrobials. Therefore, the AAP/AAFP guideline4 included a watchful waiting option in its clinical algorithm.
Disagreement over watchful waiting. The CDC guideline did not comment on spontaneous resolution and watchful waiting as an option, and the Clinical Advisory Committee3 did not agree with the often quoted 70% to 80% spontaneous resolution. The Clinical Advisory Committee and Wald14 expressed concerns that the included studies used poor enrollment criteria and likely misclassified some benign upper respiratory infections and OME as AOM. Wald resigned from the AAP/AAFP writing group in a dispute on this issue. She and the Clinical Advisory Committee favored effective antibiotic therapy because it more rapidly resolves the clinical signs and symptoms of AOM,13 and because children who receive only symptomatic treatment have consistently higher failure rates than those treated with antimicrobials.13
How compliance factors influence treatment outcomes. The CDC guidelines2 did not give weight to the taste of the medication, frequency of dosing, duration of therapy, or adverse side effects (rash, spitting, vomiting, and diarrhea). The Clinical Advisory Committee guideline3 and the AAP/AAFP guideline4 viewed these compliance factors as important in selecting an appropriate antimicrobial for children.3,12,15
Two new antibiotics were licensed following publication of the CDC and Clinical Advisory Committee Guidelines—amoxicillin/clavulanate extra-strength, and the third-generation cephalosporin, cefdinir. Cefdinir was endorsed by the Clinical Advisory Committee and the AAP/AAFP guideline, given the drug’s efficacy and compliance-enhancing features—ie, pleasant taste, once- or twice-per-day dosing, and a 5-day course for AOM treatment.
Which drugs get priority. In the event initial amoxicillin treatment fails, all guidelines recommend high-dose amoxicillin/clavulanate as a preferred second-line agent.
In addition, the CDC and Clinical Advisory Committee guidelines cite one or several of the cephalosporins as preferred second-line agents, including ceftriaxone, cefdinir, cefpodoxime, cefprozil, or cefuroxime.
The AAP/AAFP guideline endorsed cefdinir, cefpodoxime, cefuroxime, and ceftriaxone as alternatives to amoxicillin and amoxicillin/clavulanate for patients with “non-type I allergy.” The addition of cefdinir was based on satisfactory efficacy and high-compliance potential. Designation of the preferred cephalosporins as “alternatives” was not explained.
No guideline recommends trimethoprim/sulfamethoxazole (TMP/SMX) or azithromycin as a preferred second-line choice unless a severe reaction like anaphylaxis due to penicillin allergy is a confounding factor. Other antibiotics are recommended alone or in combination in some but not all guidelines (TABLE 1).
TABLE 1
Consistency of guidelines for acute otitis media
| All recommend as first-line | Amoxicillin, mostly at 80–90 mg/kg/d |
| All recommend as second-line | Amoxicillin/clavulanate, mostly “ES” 80–90 mg/kg/d |
| Some recommend as second-line | Cefdinir 14 mg/kg/d |
| Cefprozil 30 mg/kg/d | |
| Cefuroxime axetil 30 mg/kg/d | |
| Cefpodoxime 10 mg/kg/d | |
| Ceftriaxone 50 mg/kg/d | |
| Not recommended by any guideline Unless pathogen known to be sensitive; patient had severe allergic reaction to penicillin or amoxicillin; or combined with another antibiotic that is effective against additional organisms | Azithromycin |
| Clarithromycin | |
| Trimethoprim/sulfamethoxazole | |
| Erythromycin/sulfisoxazole | |
| Cefaclor | |
| Loracarbef | |
| Cefixime | |
| Ceftibuten | |
| Clindamycin |
Particulars of the CDC recommendations
In choosing preferred agents, the CDC gave primary consideration to pharmacokinetic/pharmacodynamic data and to clinical efficacy trials that used tympanocentesis results (especially double tympanocentesis) as evidence of diagnosis and bacteriologic outcome. Of the 16 FDA-approved drugs for the treatment of AOM, many lacked data on efficacy against multidrugresistant S pneumoniae or β-lactamaseproducing H influenzae.
Following its review of the evidence base in 1997–1998, the CDC selected amoxicillin as the treatment of choice. The amoxicillin dose varied. If a child had been treated with an antibiotic in the preceding month, was aged <2 years, or had attended day care, the dose was increased from 40–45 mg/kg/d to 80–90 mg/kg/d.
High-dose amoxicillin/clavulanate, cefuroxime axetil, and intramuscular ceftriaxone (3 injections) were endorsed as the most appropriate alternative antimicrobials.
If resistant S pneumoniae was the isolate identified with tympanocentesis, clindamycin became another choice (TABLE 2).
TABLE 2
AOM treatment recommendations by the CDC DRSP Working Group
| ANTIBIOTICS IN PRIOR MONTH? | DAY 0 | CLINICALLY DEFINED TREATMENT FAILURE ON DAY 3 | CLINICALLY DEFINED TREATMENT FAILURE ON DAY 10–28 |
|---|---|---|---|
| No | High-dose amoxicillin; or usual-dose amoxicillin | High-dose amoxicillin/clavulanate; or cefuroxime axetil; or IM ceftriaxone | Same as day 3 |
| Yes | High-dose amoxicillin; or high-dose amoxicillin/clavulanate; or cefuroxime axetil | IM ceftriaxone; or clindamycin; tympanocentesis | High-dose amoxicillin/clavulanate; or cefuroxime axetil; or IM ceftriaxone; tympanocentesis |
| High-dose amoxicillin = 80–100 mg/kg/d. High-dose amoxicillin clavulanate = 80–100 mg/kg/d for the amoxicillin component (requires newer formulation, or combination with amoxicillin). Ceftriaxone injections recommended for 3 days. Clindamycin is not effective against H influenzaeor M catarrhalis. | |||
Recommendations from a clinical advisory committee
A clinical advisory committee made recommendations focused on the medical management of persistent and recurrent AOM.5 Persistent AOM was defined as the persistence of the signs and symptoms of middle-ear infection following 1 or 2 courses of antimicrobials, whereas recurrent AOM was defined as 3 or more episodes of AOM in a 6-month time span or 4 or more episodes in a 12-month time span.
These guidelines coincide with the CDC guidelines in that amoxicillin/clavulanate (amoxicillin, 45–90 mg/kg/d; clavulanate, 6.4 mg/kg/d), cefuroxime axetil, and intramuscular ceftriaxone were endorsed as appropriate agents for persistent and recurrent AOM. Based on an analysis of clinical outcomes, cefpodoxime, cefprozil, and cefdinir were also recommended in this treatment algorithm (FIGURE 2).16-19
AAP/AAFP guideline details
The AAP/AAFP guideline recommended antimicrobials or observation for children with AOM, taking into consideration patient age and certainty of the diagnosis (TABLE 3).
In recommending the observation option, the committee cited rising bacterial resistance, injudicious antibiotic use, viruses as a common cause of AOM, a high spontaneous cure rate for AOM (80%–90%), and the lack of a substantial increase in complications when such a strategy is applied (as in the Netherlands).
Amoxicillin, 80–90 mg/kg/d, was selected by the AAP/AAFP as the empiric antibiotic preferred for AOM. High-dose amoxicillin/clavulanate or ceftriaxone were recommended if amoxicillin treatment fails, or as alternatives to amoxicillin in the presence of any 1 of 3 CDC guideline risk factors: (1) antibiotic treatment in the past month, (2) patient younger than 2 years of age, or (3) day care attendance (TABLE 4).
Cefdinir, cefpodoxime, or cefuroxime were recommended for patients allergic to penicillin, unless the allergic reaction was severe, such as anaphylaxis (TABLE 4). Azithromycin or clarithromycin were preferred for patients with severe penicillin allergy.
In the event alternative antibiotic therapy failed, it was recommended that the patient receive 3 injections of ceftriaxone or undergo tympanocentesis to make a bacteriologic diagnosis.
Clindamycin was proposed as an option for presumed penicillin-resistant pneumococcal infection not responding to the previous regimens.
TABLE 3
AAP/AAFP criteria for treatment decisions in children with acute otitis media
| AGE | CERTAIN DIAGNOSIS | UNCERTAIN DIAGNOSIS | |
|---|---|---|---|
| Under 6 months | Antibacterial therapy | Antibacterial therapy | |
| 6 months to 2 years | Antibacterial therapy | Antibacterial therapy if severe illness. Observation option* if non-severe illness. | |
| 2 years or older | Antibacterial therapy if severe illness. Observation option* if non-severe illness | Observation option* | |
| Modified from the New York State Department of Health and the New York Region Otitis Project Committee20,21 | |||
| *Observation is an appropriate option only when follow-up can be assured and antibacterial agents started if symptoms persist or worsen. | |||
| Non-severe illness is mild otalgia and fever <39°C in the past 24 hours. Severe illness is moderate to severe otalgia or fever 39°C. A certain diagnosis of AOM meets all 3 criteria: 1) rapid onset, 2) signs of middle-ear effusion, and 3) signs and symptoms of middle-ear inflammation. | |||
TABLE 4
AAP/AAFP therapy options for AOM in varying clinical circumstances
| At diagnosis when observation is not an option |
| Recommended: Amoxicillin 80-90 mg/kg/d |
| Alternative for penicillin allergy: Non-type I: cefdinir, cefuroxime, cefpodoxime; Type I: azithromycin, clarithromycin |
| Clinically defined failure of observation option after 48 to 72 hours |
| Recommended: Amoxicillin 80-90 mg/kg/day |
| Alternative for penicillin allergy: Non-type I: cefdinir, cefuroxime, cefpodoxime; Type I: azithromycin, clarithromycin |
| Clinically defined failure of initial antibiotic treatment after 48 to 72 hours |
| Recommended: Amoxicillin/clavulanate (90 mg/kg/d of amoxicillin component, with 6.4 mg/kg/d of clavulanate) |
| Alternative for penicillin allergy: Non-Type I: ceftriaxone—3 days; Type I: clindamycin |
| At diagnosis when observation is not an option |
| Recommended: Amoxicillin/clavulanate (90 mg/kg/d of amoxicillin with 6.4 mg/kg/d of clavulanate |
| Alternative for penicillin allergy: Ceftriaxone—1 or 3 days |
| Clinically defined failure of observation option after 48 to 72 hours |
| Recommended: Amoxicillin/clavulanate (90 mg/kg/d of amoxicillin with 6.4 mg/kg/d of clavulanate) |
| Alternative for penicillin allergy: Ceftriaxone 1 or 3 days |
| Clinically defined failure of initial antibiotic treatment after 48 to 72 hours |
| Recommended: Ceftriaxone 3 days |
| Alternative for penicillin allergy: Tympanocentesis, clindamycin |
Implementing guideline recommendations in clinical practice
Amoxicillin usually first choice. Of the available oral agents, amoxicillin has the greatest in vitro activity against pneumococci.2,20 In addition to an excellent pharmacokinetic profile, amoxicillin has a long history of safety and clinical efficacy when used to treat AOM. Because resistant S pneumoniae are highly prevalent in the US, a higher dose of amoxicillin (80–90 mg/kg/d in divided doses) has become the first-line therapy.2-4
Covering for β-lactamase-producing pathogens. However, increasing the amoxicillin dose does not cover the patient at risk for infection with β-lactamase-producing pathogens. In this case, add the β-lactamase inhibitor, clavulanate, to amoxicillin (Augmentin ES), or choose a cephalosporin with good activity against S pneumoniae and good β-lactamase stability.
What to do when initial treatment fails. Treatment failure can occur for a variety of reasons besides poor drug efficacy: incorrect diagnosis, poor compliance, inadequate drug dose or frequency, atypical pharmacokinetics or pharmacodynamics, concurrent viral infection, or highly resistant bacteria.12 In most cases in which amoxicillin therapy fails, there is no single perfect alternative. That is why several antimicrobials are recommended as second-line agents by the various guidelines. Without firm identification of a causative agent by tympanocentesis, select an agent effective against β-lactamaseproducing pathogens and multi-drug-resistant S pneumoniae.2,2,12
Abandoned treatments. Trimethoprim/sulfamethoxazole and erythromycinsulfisoxazole are no longer recommended as first- or second-line treatments for AOM, except as alternatives for patients with severe penicillin-allergy. Recent studies have shown substantial pneumococcal resistance to these agents.2,10,21
Azithromycin widely used but not recommended. Azithromycin is commonly used for AOM in children, largely because of its compliance-enhancing feature as a once-per-day treatment given for 1, 3, or 5 days. However, no guideline endorses azithromycin for AOM unless the patient is allergic to penicillin. The reason no expert group recommends azithromycin is a consequence of pivotal double tympanocentesis studies conducted by Dagan et al22 and Hoberman et al.23 In the work by Dagan, eradication of S pneumoniae by azithromycin was slower than with amoxicillin/clavulanate,22 and slower eradication impacts clinical outcomes.24 But more important, Dagan et al showed that azithromycin was no more effective than placebo in eradicating H influenzae.22
Consider compliance-enhancing factors. Key factors are taste of suspension, dosing frequency, and duration of therapy. A drawback with several of the antibiotics recommended by guidelines is their taste (TABLE 5). Intramuscular ceftriaxone is an alternative for resistant bacterial strains and for those patients who experience nausea or simply refuse oral medications. However, in cases of resistant S pneumoniae, ceftriaxone typically must be administered in 3 separate injections, which is not only unappealing for young children, but difficult for parents to comply with because of additional office visits and costs.3,12
The factor most likely to enhance compliance is a shorter course of therapy. Evidence is strong and growing stronger that a 5-day course of therapy is as effective as a 10-day course. In a 1997 review of the data26 and a meta-analysis,27 it was suggested that data were sufficient to recommend a 5-day antibiotic course for AOM in children unless the child was less than 2 years of age or otitisprone. Subsequently, conflicting data have been published (TABLE 6, available online at www.jfponline.com).
Guidelines vary in their endorsement of 5-day vs 10-day or variable regimens for treatment of AOM; most favor the 10-day course for younger children (defined as <2 years old to <6 years old), pending further studies. Nevertheless, shorter courses of therapy are preferable whenever possible because the evidence suggests shorter courses improve compliance, decrease the selection of resistant pathogens, and preclude surreptitious use of leftover antibiotics retained from longer courses.28
TABLE 5
Comparative taste ratings for antibiotic suspensions
| Compliance-enhancing, strongly |
| Amoxicillin |
| Cefaclor (Ceclor) |
| Cefdinir (Omnicef) |
| Cefixime (Suprax) |
| Loracarbef (Lorabid) |
| Compliance enhancing, moderately |
| Cefprozil (Cefzil) |
| Ceftibuten (Cedax) |
| Equivocal compliance enhancement |
| Azithromycin (Zithromax) |
| Not compliance-enhancing |
| Amoxicillin-clavulanate (Augmentin) |
| Erythromycin-sulfisoxazole (Pediazole) |
| TMP-SMZ (Bactrim or Septra) |
| Discourages compliance |
| Cefpodoxime (Vantin) |
| Cefuroxime (Ceftin) |
| Clarithromycin (Biaxin) |
| Sources: Steele et al 2001;33 Ruff et al 1991;34 Demers et al 1994.35 |
What’s on the horizon
Research continues on the effect of the heptavalent pneumococcal conjugate vaccine (PCV7) on reducing the prevalence of AOM. In the first studies, the vaccine’s efficacy in preventing otitis media of any origin was 6% to 7%.29,30 However, the PCV7 may be more beneficial for children with AOM than initially calculated; among those 24 to 59 months of age who have a history of recurrent AOM, the vaccine’s effect is greater.8 Other pneumococcal conjugate vaccines containing more serotypes are being developed and tested. Their impact on AOM remains to be determined.
Other classes of antimicrobials are being studied to determine their effectiveness in AOM. Two fluoroquinolones, gatifloxacin and levofloxacin—effective against the pathogens that cause AOM, including resistant S pnuemoniae—have undergone clinical trial evaluation in children as young as 6 months old. Safety concerns about arthropathy and tendonitis described in juvenile animals but not children appear to have been allayed.31
Also being studied is another antimicrobial class—the ketolides, specifically telithromycin. This third-generation macrolide has less propensity to select for macrolide-resistant pathogens, and more potent activity against macrolide- and penicillin-resistant S pneumoniae and against H influenzae than azithromycin or clarithromycin.32 Telithromycin has shown promising results in studies of AOM treatment.
- Amoxicillin/clavulanate • Augmentin
- Azithromycin • Zithromax
- Cefdinir • Omnicef
- Cefixime • Suprax
- Cefpodoxime • Vantin
- Cefprozil • Cefzil
- Ceftriaxone • Rocephin
- Cefuroxime • Ceftin
- Clarithromycin • Biaxin
- Erythromycin-sulfisoxazole • Eryzole, Pediazole
- Gatifloxacin • Tequin
- Levofloxacin • Levaquin
- Loracarbef • Lorabid
- Telithromycin • Ketek
- TMP-SMZ • Bactrim, Cotrim, Septra, Sulfatrim
CORRESPONDING AUTHOR
Michael E. Pichichero, MD, University of Rochester Medical Center, Elmwood Pediatric Group, 601 Elmwood Avenue, Box 672, Rochester, NY 14642. E-mail: [email protected]
1. Pelton SI. Otitis media. In: Principles and Practice of Pediatric Infectious Diseases, Long SS, et al, eds. Philadelphia, Pa: Churchill Livingstone; 2003: chap 27.
2. Dowell SF, Butler JC, Giebink GS. Acute otitis media: management and surveillance in an era of pneumococcal resistance. Nurse Pract 1999;24(10 Suppl):1-9.
3. Pichichero ME, Reiner SA, Brook I, et al. Controversies in the medical management of persistent and recurrent otitis media. Ann Otol Rhinol Laryngol 2000;109:2-12.
4. American Academy of Pediatrics Subcommittee on Management of Acute Otitis Media. Clinical practice guideline: Diagnosis and management of acute otitis media. Pediatrics 2004;113:1451-1466.
5. Heikkinen T, Ruuskanen O. Signs and symptoms predicting acute otitis media. Arch Pediatr Adolesc Med 1995;149:26-29.
6. Kontiokari T, Koivunen P, Niemala M, Pokka T, Uhari M. Symptoms of acute otitis media. Pediatr Infect Dis J 1998;17:676-679.
7. Pichichero ME. Acute otitis media: Part I. Improving diagnostic accuracy. Am Fam Physician 2000;61:2051-2056.
8. Casey JR, Pichichero ME. Changes in frequency and pathogens causing acute otitis media in 1995–2003. Ped Infect Dis J 2004;23:824-828.
9. Barnett ED, Klein JO. The problem of resistant bacteria for the management of acute otitis media. Pediatr Clin North Am 1995;42:509-517.
10. Doern GV, Pfaller MA, Kugler K, Freeman J, Jones RN. Prevalence of antimicrobial resistance among respiratory tract isolates of Streptococcus pneumoniae in North America: 1997 results from the SENTRY antimicrobial surveillance program. Clin Infect Dis 1998;27:764-770.
11. Doern GV, Jones RN, Pfaller MA, Kugler K. Haemophilus influenzae and Moraxella catarrhalis from patients with community-acquired respiratory tract infections: antibacterial susceptibility patterns from the SENTRY antibacterial surveillance program (United States and Canada, 1997). J Antimicrob Chemother 1999;43:385-389.
12. Pichichero ME. Acute otitis media: Part II. Treatment in an era of increasing antibiotic resistance. Am Fam Phys 2000;61:2410-2416.
13. Marcy M, Takata GS, Shekelle P, et al. Management of acute otitis media. Evidence report/technology assessment no. 15. AHRQ Publication No. 01-E010. Rockville, Md: Agency for Healthcare Research and Quality; 2001.
14. Wald ER. Acute otitis media: more trouble with the evidence. Pediatr Infect Dis J 2003;22:103-104.
15. Wandstrat TL, Kaplan B. Pharmacoeconomic impact of factors affecting compliance with antibiotic regimens in the treatment of acute otitis media. Pediatr Infect Dis J 1997;16(Suppl):S27-S29.
16. Block SL, McCarty JM, Hedrick JA, et al. Comparative safety and efficacy of cefdinir vs amoxicillin/clavulanate for treatment of suppurative acute otitis media in children. Pediatr Infect Dis J 2000;19(Suppl):S159-S165.
17. Block SL, Hedrick JA, Kratzer J, Nemeth MA, Tack KJ. Five-day twice daily cefdinir therapy for acute otitis media: Microbiologic and clinical efficacy. Pediatr Infect Dis J 2000;19(Suppl):S153-S158.
18. Hedrick HA, Sher LD, Schwartz RH, Pierce PF. Cefprozil verus high dose amoxicillin/clavulanate in children with acute otitis media. Clin Ther 2001;23:193-204.
19. Van Dyk JC, Terespolsky SA, Meyer CS, Can Niekerk CH, Klugman KP. Penetration of cefpodoxime into middle ear fluid in pediatric patients with acute otitis media. Pediatr Infect Dis J 1997;16:79-81.
20. Craig WA, Andes D. Pharmacokinetics and pharmacodynamics of antibiotics in otitis media. Ped Infect Dis J 1996;15:255-259.
21. Jacobs MR, Bajaksouzian S, Zilles A, et al. Susceptibilities of Streptococcus pneumoniae and Haemophilus influenzaeto 10 oral antimicrobial agents based on pharmacodynamic parameters: 1997 US Surveilance Study. Antimicrob Agents Chemother 1999;43:1901-1908.
22. Dagan R, Johnson CE, Mc Linn S. Bacteriologic and clinical efficacy of amoxicillin/clavulanate vs. azithromycin in acute otitis media. Pediatr Infect Dis J 2000;20:829-837.
23. Hoberman A. Extra-strength amoxicillin-clavulanate (A/C-ES) vs. azithromycin (AZI) for acute otitis media (AOM) in children. 43rd Interscience Conference on Antimicrobial Agents and Chemotherapy 2003 Session 88 G-459.
24. Dagan R, Leibovitz E, Greenberg D, et al. Early eradication of pathogens from middle ear fluid during antibiotic treatment of acute otitis media is associated with improved clinical outcome. Pediatr Infect Dis J 1998;17:776-782.
25. Howie VM. Eradication of bacterial pathogens from middle ear infection. Clin Infect Dis 1992;14(Suppl 2):209-210.
26. Pichichero ME, Cohen R. Shortened course of antibiotic therapy for acute otitis media, sinusitis, and tonsillopharyngitis. Pediatr Infect Dis J 1997;16:680-685.
27. Kozyrskyj AL, Hildes-Ripstein E, Longstaffe SEA, et al. Treatment of acute otitis media with a shortened course of antibiotics: A meta-analysis. JAMA 1998;279:1736-1742.
28. Pichichero ME. Dynamics of antibiotic prescribing for children. JAMA 2002;287:23.-
29. Black S, Shinefield H, Fireman B. Efficacy, safety and the immunogenicity of heptavalent pneumococcal conjugate vaccine in children. Pediatr Infect Dis J 2000;19:187-195.
30. Eskola J, Kilpi T, Palmu A, et al. Efficacy of a pneumococcal conjugate vaccine against acute otitis media. N Engl J Med 2001;344:403-409.
31. Yee CL, Duffy C, Gerbino PG, Stryker S, Noel GJ. Tendon or joint disorders in children after treatment with fluoroquinolones or azithromycin. Ped Infect Dis J 2002;21:525-529.
32. Ackerman G, Rodloff AC. Drugs of the 21st century: Telithromycin (HMR 3647)—the first ketolide. J Antimicrob Chemother 2003;51:497-511.
33. Steele RW, Thomas MP, Begue RE. Compliance issues related to the selection of antibiotic suspensions for children. Pediatr Infect Dis J 2001;20:1-5.
34. Ruff ME, Schotik DA, Bass JW. Antimicrobial drug suspensions: A blind comparison of taste of fourteen common pediatric drugs. Pediatr Infect Dis J 1991;10:30-33.
35. Demers DM, Chan DS, Bass JW. Antimicrobial drug suspensions: A blinded comparison of taste of twelve common pediatric drugs including cefixime, cefpodoxime, cefprozil, and loracarbef. Pediatr Infect Dis J 1994;13:87-89.
- High-dose amoxicillin (80 to 90 mg/kg/d divided twice daily) remains the drug of choice for treatment of acute otitis media despite increasing antimicrobial resistance. (B)
- For persistent or recurrent acute otitis media, guidelines recommend high-dose amoxicillin/clavulanate (90/6.4 mg/kg/d), cefdinir, cefprozil, cefpodoxime, cefuroxime or ceftriaxone.(B)
- Increasing the dose of amoxicillin does not cover infection with β-lactamase-producing pathogens; add the β-lactamase inhibitor clavulanate to amoxicillin, or choose a cephalosporin with good activity against S pneumoniae and good β-lactamase stability.(A)
- Key factors for enhancing compliance are taste of suspension, dosing frequency, and duration of therapy. (B)
Empiric treatment of acute otitis media (AOM) should target Streptococcus pneumoniae, nontypeable Haemophilus influenzae, and Moraxella catarrhalis—these bacteria are most often isolated in AOM.1 Group A streptococci and Staphylococcus aureus are involved less often.1 Viruses are the sole AOM pathogen in fewer than 10% of cases; Mycoplasma pneumoniae and Chlamydia pneumoniae rarely cause AOM.
Amoxicillin, 80 to 90 mg/kg/d divided twice daily, remains the drug of choice for AOM despite increasing antimicrobial resistance. Over-diagnosis of AOM and frequent spontaneous resolution of true AOM make amoxicillin the most cost-effective agent. For persistent or recurrent AOM, guidelines recommend high-dose amoxicillin/clavulanate, 90/6.4 mg/kg/d, cefdinir, cefprozil, cefpodoxime, cefuroxime, or ceftriaxone. When the diagnosis is uncertain or the child is older than 2 years, observation may be an option.
The American Academy of Pediatrics and the American Academy of Family Physicians (AAP/AAFP) guideline for management of AOM has several new recommendations that could influence antimicrobial choices for AOM. Among them are use of cephalosporins for non-anaphylaxis penicillin-allergic patients, and regard for such compliance factors as product taste, dosing frequency, and length of therapy.
Pertinent guidelines
The Drug-Resistant Streptococcus pneumoniae (DRSP) Therapeutic Working Group sponsored by the Centers for Disease Control and Prevention (CDC) published recommendations for the management of AOM in 1999.2 A guideline on the treatment of persistent and recurrent AOM based on the recommendations made by the CDC were published by a Clinical Advisory Committee in 2000.3 The AAFP and AAP published a new guideline in 2004.4
What the guidelines agree on
AOM may be difficult to diagnose. The history and symptoms are neither sensitive nor specific enough to make an accurate diagnosis of AOM.5,6 Although various definitions of AOM have been proposed, all agree that AOM is a diagnosis based on visualization of the tympanic membrane and assessment of middle-ear fluid status. Certain physical signs, including bulging of the tympanic membrane, distortion of the light reflex, redness, and disappearance of the translucency of the tympanic membrane are typical of AOM (FIGURE 1).7
AOM must be differentiated from OME. It is crucial to distinguish between AOM and otitis media with effusion (OME) because OME is usually not treated with antimicrobials.7 This is a clinical conundrum because OME often precedes and follows AOM (FIGURE 1).
Although OME is considered asymptomatic except for hearing loss, it is now known to cause mild to moderate otalgia associated with tympanic membrane stretching.1,3,7 Ear tugging and poor sleep follow.
The optimal physical finding to differentiate OME from AOM is tympanic membrane position. Patients with AOM have a bulging tympanic membrane; those with OME have a neutral or retracted tympanic membrane (FIGURE 1). Tympanic membrane position is best assessed with pneumatic otoscopy.1,3,7
Tympanocentesis usually necessary. All guidelines advocate that physicians either learn the skills needed to perform tympanocentesis, or refer patients to a clinician who can perform the procedure when 2 sequential treatment failures occur and for other indications.2-4 In cases of persistent or recurrent AOM, tympanocentesis with a culture of the middle-ear fluid may be especially useful in guiding treatment. In addition, evacuation of the middle-ear effusion can be helpful in breaking the cycle of persistent and recurrent AOM.
Criteria for choosing an antimicrobial. The most important consideration in selecting an antimicrobial is efficacy against S pneumoniae. Although this pathogen as a cause of AOM is decreasing in the wake of widespread use of the 7-valent pneumococcal conjugate vaccine,8 it is also the least likely of the 3 main pathogens to resolve spontaneously without treatment.2,9
All guidelines also recommend that the selected antibiotic have efficacy against β-lactamase-producing strains of H influenzae and M catarrhalis.
S pneumoniae with reduced susceptibility to penicillin, and H influenzae that produce β-lactamase, are significantly more prevalent among children than adults, especially among children who attend day care, who have received antimicrobials within the preceding month, or who have not responded to recent treatment.2,3 An antimicrobial chosen empirically must not only have activity against the major pathogens, but it must also achieve a peak concentration in the middle-ear fluid sufficient to eradicate S pneumoniae with reduced susceptibility to penicillin and retain activity if β-lactamase is produced by a gram-negative organism.
All guidelines recommend oral amoxicillin as first-line therapy in AOM. The AAP/AAFP guideline recommends increasing the dosage used for empiric treatment from 40–45 mg/kg/d to 80–90 mg/kg/d for all children, because the prevalence of penicillin-resistant S pneumoniae has continued to rise and has reached a level in 2004 where standard-dose amoxicillin is no longer considered adequate (see Acute otitis media’s etiologic profile today).
Both penicillin-intermediate S pneumoniae (minimum inhibitory concentration [MIC] 0.12–1.0 μg/mL) and resistant S pneumoniae (penicillin MIC ≥2.0 μg/mL) are common causes of AOM in the United States.10 Further complicating treatment, most resistant strains of S pneumoniae are also resistant to other classes of antimicrobials, such as macrolides, trimethoprim/sulfamethoxazole, and clindamycin.
A steadily increasing number of H influenzae and nearly all M catarrhalis strains are β-lactamase producers.11 These resistant pathogens are most commonly isolated from children in day care, from children younger than 2 years of age, during the winter months, from children recently treated with antimicrobials, and from those who have not responded to treatment.3,12
Extensive and often inappropriate use of antimicrobials has contributed to increased resistance, which complicates treatment of AOM, increases treatment failure, has motivated a search for newer drugs effective against resistant strains.
Differences among the guidelines
After the CDC2 and Clinical Advisory Committee3 guidelines were published, the Agency for Healthcare Research and Quality (AHRQ) report13 was released; it suggested most episodes of AOM resolve without the use of antimicrobials. Therefore, the AAP/AAFP guideline4 included a watchful waiting option in its clinical algorithm.
Disagreement over watchful waiting. The CDC guideline did not comment on spontaneous resolution and watchful waiting as an option, and the Clinical Advisory Committee3 did not agree with the often quoted 70% to 80% spontaneous resolution. The Clinical Advisory Committee and Wald14 expressed concerns that the included studies used poor enrollment criteria and likely misclassified some benign upper respiratory infections and OME as AOM. Wald resigned from the AAP/AAFP writing group in a dispute on this issue. She and the Clinical Advisory Committee favored effective antibiotic therapy because it more rapidly resolves the clinical signs and symptoms of AOM,13 and because children who receive only symptomatic treatment have consistently higher failure rates than those treated with antimicrobials.13
How compliance factors influence treatment outcomes. The CDC guidelines2 did not give weight to the taste of the medication, frequency of dosing, duration of therapy, or adverse side effects (rash, spitting, vomiting, and diarrhea). The Clinical Advisory Committee guideline3 and the AAP/AAFP guideline4 viewed these compliance factors as important in selecting an appropriate antimicrobial for children.3,12,15
Two new antibiotics were licensed following publication of the CDC and Clinical Advisory Committee Guidelines—amoxicillin/clavulanate extra-strength, and the third-generation cephalosporin, cefdinir. Cefdinir was endorsed by the Clinical Advisory Committee and the AAP/AAFP guideline, given the drug’s efficacy and compliance-enhancing features—ie, pleasant taste, once- or twice-per-day dosing, and a 5-day course for AOM treatment.
Which drugs get priority. In the event initial amoxicillin treatment fails, all guidelines recommend high-dose amoxicillin/clavulanate as a preferred second-line agent.
In addition, the CDC and Clinical Advisory Committee guidelines cite one or several of the cephalosporins as preferred second-line agents, including ceftriaxone, cefdinir, cefpodoxime, cefprozil, or cefuroxime.
The AAP/AAFP guideline endorsed cefdinir, cefpodoxime, cefuroxime, and ceftriaxone as alternatives to amoxicillin and amoxicillin/clavulanate for patients with “non-type I allergy.” The addition of cefdinir was based on satisfactory efficacy and high-compliance potential. Designation of the preferred cephalosporins as “alternatives” was not explained.
No guideline recommends trimethoprim/sulfamethoxazole (TMP/SMX) or azithromycin as a preferred second-line choice unless a severe reaction like anaphylaxis due to penicillin allergy is a confounding factor. Other antibiotics are recommended alone or in combination in some but not all guidelines (TABLE 1).
TABLE 1
Consistency of guidelines for acute otitis media
| All recommend as first-line | Amoxicillin, mostly at 80–90 mg/kg/d |
| All recommend as second-line | Amoxicillin/clavulanate, mostly “ES” 80–90 mg/kg/d |
| Some recommend as second-line | Cefdinir 14 mg/kg/d |
| Cefprozil 30 mg/kg/d | |
| Cefuroxime axetil 30 mg/kg/d | |
| Cefpodoxime 10 mg/kg/d | |
| Ceftriaxone 50 mg/kg/d | |
| Not recommended by any guideline Unless pathogen known to be sensitive; patient had severe allergic reaction to penicillin or amoxicillin; or combined with another antibiotic that is effective against additional organisms | Azithromycin |
| Clarithromycin | |
| Trimethoprim/sulfamethoxazole | |
| Erythromycin/sulfisoxazole | |
| Cefaclor | |
| Loracarbef | |
| Cefixime | |
| Ceftibuten | |
| Clindamycin |
Particulars of the CDC recommendations
In choosing preferred agents, the CDC gave primary consideration to pharmacokinetic/pharmacodynamic data and to clinical efficacy trials that used tympanocentesis results (especially double tympanocentesis) as evidence of diagnosis and bacteriologic outcome. Of the 16 FDA-approved drugs for the treatment of AOM, many lacked data on efficacy against multidrugresistant S pneumoniae or β-lactamaseproducing H influenzae.
Following its review of the evidence base in 1997–1998, the CDC selected amoxicillin as the treatment of choice. The amoxicillin dose varied. If a child had been treated with an antibiotic in the preceding month, was aged <2 years, or had attended day care, the dose was increased from 40–45 mg/kg/d to 80–90 mg/kg/d.
High-dose amoxicillin/clavulanate, cefuroxime axetil, and intramuscular ceftriaxone (3 injections) were endorsed as the most appropriate alternative antimicrobials.
If resistant S pneumoniae was the isolate identified with tympanocentesis, clindamycin became another choice (TABLE 2).
TABLE 2
AOM treatment recommendations by the CDC DRSP Working Group
| ANTIBIOTICS IN PRIOR MONTH? | DAY 0 | CLINICALLY DEFINED TREATMENT FAILURE ON DAY 3 | CLINICALLY DEFINED TREATMENT FAILURE ON DAY 10–28 |
|---|---|---|---|
| No | High-dose amoxicillin; or usual-dose amoxicillin | High-dose amoxicillin/clavulanate; or cefuroxime axetil; or IM ceftriaxone | Same as day 3 |
| Yes | High-dose amoxicillin; or high-dose amoxicillin/clavulanate; or cefuroxime axetil | IM ceftriaxone; or clindamycin; tympanocentesis | High-dose amoxicillin/clavulanate; or cefuroxime axetil; or IM ceftriaxone; tympanocentesis |
| High-dose amoxicillin = 80–100 mg/kg/d. High-dose amoxicillin clavulanate = 80–100 mg/kg/d for the amoxicillin component (requires newer formulation, or combination with amoxicillin). Ceftriaxone injections recommended for 3 days. Clindamycin is not effective against H influenzaeor M catarrhalis. | |||
Recommendations from a clinical advisory committee
A clinical advisory committee made recommendations focused on the medical management of persistent and recurrent AOM.5 Persistent AOM was defined as the persistence of the signs and symptoms of middle-ear infection following 1 or 2 courses of antimicrobials, whereas recurrent AOM was defined as 3 or more episodes of AOM in a 6-month time span or 4 or more episodes in a 12-month time span.
These guidelines coincide with the CDC guidelines in that amoxicillin/clavulanate (amoxicillin, 45–90 mg/kg/d; clavulanate, 6.4 mg/kg/d), cefuroxime axetil, and intramuscular ceftriaxone were endorsed as appropriate agents for persistent and recurrent AOM. Based on an analysis of clinical outcomes, cefpodoxime, cefprozil, and cefdinir were also recommended in this treatment algorithm (FIGURE 2).16-19
AAP/AAFP guideline details
The AAP/AAFP guideline recommended antimicrobials or observation for children with AOM, taking into consideration patient age and certainty of the diagnosis (TABLE 3).
In recommending the observation option, the committee cited rising bacterial resistance, injudicious antibiotic use, viruses as a common cause of AOM, a high spontaneous cure rate for AOM (80%–90%), and the lack of a substantial increase in complications when such a strategy is applied (as in the Netherlands).
Amoxicillin, 80–90 mg/kg/d, was selected by the AAP/AAFP as the empiric antibiotic preferred for AOM. High-dose amoxicillin/clavulanate or ceftriaxone were recommended if amoxicillin treatment fails, or as alternatives to amoxicillin in the presence of any 1 of 3 CDC guideline risk factors: (1) antibiotic treatment in the past month, (2) patient younger than 2 years of age, or (3) day care attendance (TABLE 4).
Cefdinir, cefpodoxime, or cefuroxime were recommended for patients allergic to penicillin, unless the allergic reaction was severe, such as anaphylaxis (TABLE 4). Azithromycin or clarithromycin were preferred for patients with severe penicillin allergy.
In the event alternative antibiotic therapy failed, it was recommended that the patient receive 3 injections of ceftriaxone or undergo tympanocentesis to make a bacteriologic diagnosis.
Clindamycin was proposed as an option for presumed penicillin-resistant pneumococcal infection not responding to the previous regimens.
TABLE 3
AAP/AAFP criteria for treatment decisions in children with acute otitis media
| AGE | CERTAIN DIAGNOSIS | UNCERTAIN DIAGNOSIS | |
|---|---|---|---|
| Under 6 months | Antibacterial therapy | Antibacterial therapy | |
| 6 months to 2 years | Antibacterial therapy | Antibacterial therapy if severe illness. Observation option* if non-severe illness. | |
| 2 years or older | Antibacterial therapy if severe illness. Observation option* if non-severe illness | Observation option* | |
| Modified from the New York State Department of Health and the New York Region Otitis Project Committee20,21 | |||
| *Observation is an appropriate option only when follow-up can be assured and antibacterial agents started if symptoms persist or worsen. | |||
| Non-severe illness is mild otalgia and fever <39°C in the past 24 hours. Severe illness is moderate to severe otalgia or fever 39°C. A certain diagnosis of AOM meets all 3 criteria: 1) rapid onset, 2) signs of middle-ear effusion, and 3) signs and symptoms of middle-ear inflammation. | |||
TABLE 4
AAP/AAFP therapy options for AOM in varying clinical circumstances
| At diagnosis when observation is not an option |
| Recommended: Amoxicillin 80-90 mg/kg/d |
| Alternative for penicillin allergy: Non-type I: cefdinir, cefuroxime, cefpodoxime; Type I: azithromycin, clarithromycin |
| Clinically defined failure of observation option after 48 to 72 hours |
| Recommended: Amoxicillin 80-90 mg/kg/day |
| Alternative for penicillin allergy: Non-type I: cefdinir, cefuroxime, cefpodoxime; Type I: azithromycin, clarithromycin |
| Clinically defined failure of initial antibiotic treatment after 48 to 72 hours |
| Recommended: Amoxicillin/clavulanate (90 mg/kg/d of amoxicillin component, with 6.4 mg/kg/d of clavulanate) |
| Alternative for penicillin allergy: Non-Type I: ceftriaxone—3 days; Type I: clindamycin |
| At diagnosis when observation is not an option |
| Recommended: Amoxicillin/clavulanate (90 mg/kg/d of amoxicillin with 6.4 mg/kg/d of clavulanate |
| Alternative for penicillin allergy: Ceftriaxone—1 or 3 days |
| Clinically defined failure of observation option after 48 to 72 hours |
| Recommended: Amoxicillin/clavulanate (90 mg/kg/d of amoxicillin with 6.4 mg/kg/d of clavulanate) |
| Alternative for penicillin allergy: Ceftriaxone 1 or 3 days |
| Clinically defined failure of initial antibiotic treatment after 48 to 72 hours |
| Recommended: Ceftriaxone 3 days |
| Alternative for penicillin allergy: Tympanocentesis, clindamycin |
Implementing guideline recommendations in clinical practice
Amoxicillin usually first choice. Of the available oral agents, amoxicillin has the greatest in vitro activity against pneumococci.2,20 In addition to an excellent pharmacokinetic profile, amoxicillin has a long history of safety and clinical efficacy when used to treat AOM. Because resistant S pneumoniae are highly prevalent in the US, a higher dose of amoxicillin (80–90 mg/kg/d in divided doses) has become the first-line therapy.2-4
Covering for β-lactamase-producing pathogens. However, increasing the amoxicillin dose does not cover the patient at risk for infection with β-lactamase-producing pathogens. In this case, add the β-lactamase inhibitor, clavulanate, to amoxicillin (Augmentin ES), or choose a cephalosporin with good activity against S pneumoniae and good β-lactamase stability.
What to do when initial treatment fails. Treatment failure can occur for a variety of reasons besides poor drug efficacy: incorrect diagnosis, poor compliance, inadequate drug dose or frequency, atypical pharmacokinetics or pharmacodynamics, concurrent viral infection, or highly resistant bacteria.12 In most cases in which amoxicillin therapy fails, there is no single perfect alternative. That is why several antimicrobials are recommended as second-line agents by the various guidelines. Without firm identification of a causative agent by tympanocentesis, select an agent effective against β-lactamaseproducing pathogens and multi-drug-resistant S pneumoniae.2,2,12
Abandoned treatments. Trimethoprim/sulfamethoxazole and erythromycinsulfisoxazole are no longer recommended as first- or second-line treatments for AOM, except as alternatives for patients with severe penicillin-allergy. Recent studies have shown substantial pneumococcal resistance to these agents.2,10,21
Azithromycin widely used but not recommended. Azithromycin is commonly used for AOM in children, largely because of its compliance-enhancing feature as a once-per-day treatment given for 1, 3, or 5 days. However, no guideline endorses azithromycin for AOM unless the patient is allergic to penicillin. The reason no expert group recommends azithromycin is a consequence of pivotal double tympanocentesis studies conducted by Dagan et al22 and Hoberman et al.23 In the work by Dagan, eradication of S pneumoniae by azithromycin was slower than with amoxicillin/clavulanate,22 and slower eradication impacts clinical outcomes.24 But more important, Dagan et al showed that azithromycin was no more effective than placebo in eradicating H influenzae.22
Consider compliance-enhancing factors. Key factors are taste of suspension, dosing frequency, and duration of therapy. A drawback with several of the antibiotics recommended by guidelines is their taste (TABLE 5). Intramuscular ceftriaxone is an alternative for resistant bacterial strains and for those patients who experience nausea or simply refuse oral medications. However, in cases of resistant S pneumoniae, ceftriaxone typically must be administered in 3 separate injections, which is not only unappealing for young children, but difficult for parents to comply with because of additional office visits and costs.3,12
The factor most likely to enhance compliance is a shorter course of therapy. Evidence is strong and growing stronger that a 5-day course of therapy is as effective as a 10-day course. In a 1997 review of the data26 and a meta-analysis,27 it was suggested that data were sufficient to recommend a 5-day antibiotic course for AOM in children unless the child was less than 2 years of age or otitisprone. Subsequently, conflicting data have been published (TABLE 6, available online at www.jfponline.com).
Guidelines vary in their endorsement of 5-day vs 10-day or variable regimens for treatment of AOM; most favor the 10-day course for younger children (defined as <2 years old to <6 years old), pending further studies. Nevertheless, shorter courses of therapy are preferable whenever possible because the evidence suggests shorter courses improve compliance, decrease the selection of resistant pathogens, and preclude surreptitious use of leftover antibiotics retained from longer courses.28
TABLE 5
Comparative taste ratings for antibiotic suspensions
| Compliance-enhancing, strongly |
| Amoxicillin |
| Cefaclor (Ceclor) |
| Cefdinir (Omnicef) |
| Cefixime (Suprax) |
| Loracarbef (Lorabid) |
| Compliance enhancing, moderately |
| Cefprozil (Cefzil) |
| Ceftibuten (Cedax) |
| Equivocal compliance enhancement |
| Azithromycin (Zithromax) |
| Not compliance-enhancing |
| Amoxicillin-clavulanate (Augmentin) |
| Erythromycin-sulfisoxazole (Pediazole) |
| TMP-SMZ (Bactrim or Septra) |
| Discourages compliance |
| Cefpodoxime (Vantin) |
| Cefuroxime (Ceftin) |
| Clarithromycin (Biaxin) |
| Sources: Steele et al 2001;33 Ruff et al 1991;34 Demers et al 1994.35 |
What’s on the horizon
Research continues on the effect of the heptavalent pneumococcal conjugate vaccine (PCV7) on reducing the prevalence of AOM. In the first studies, the vaccine’s efficacy in preventing otitis media of any origin was 6% to 7%.29,30 However, the PCV7 may be more beneficial for children with AOM than initially calculated; among those 24 to 59 months of age who have a history of recurrent AOM, the vaccine’s effect is greater.8 Other pneumococcal conjugate vaccines containing more serotypes are being developed and tested. Their impact on AOM remains to be determined.
Other classes of antimicrobials are being studied to determine their effectiveness in AOM. Two fluoroquinolones, gatifloxacin and levofloxacin—effective against the pathogens that cause AOM, including resistant S pnuemoniae—have undergone clinical trial evaluation in children as young as 6 months old. Safety concerns about arthropathy and tendonitis described in juvenile animals but not children appear to have been allayed.31
Also being studied is another antimicrobial class—the ketolides, specifically telithromycin. This third-generation macrolide has less propensity to select for macrolide-resistant pathogens, and more potent activity against macrolide- and penicillin-resistant S pneumoniae and against H influenzae than azithromycin or clarithromycin.32 Telithromycin has shown promising results in studies of AOM treatment.
- Amoxicillin/clavulanate • Augmentin
- Azithromycin • Zithromax
- Cefdinir • Omnicef
- Cefixime • Suprax
- Cefpodoxime • Vantin
- Cefprozil • Cefzil
- Ceftriaxone • Rocephin
- Cefuroxime • Ceftin
- Clarithromycin • Biaxin
- Erythromycin-sulfisoxazole • Eryzole, Pediazole
- Gatifloxacin • Tequin
- Levofloxacin • Levaquin
- Loracarbef • Lorabid
- Telithromycin • Ketek
- TMP-SMZ • Bactrim, Cotrim, Septra, Sulfatrim
CORRESPONDING AUTHOR
Michael E. Pichichero, MD, University of Rochester Medical Center, Elmwood Pediatric Group, 601 Elmwood Avenue, Box 672, Rochester, NY 14642. E-mail: [email protected]
1. Pelton SI. Otitis media. In: Principles and Practice of Pediatric Infectious Diseases, Long SS, et al, eds. Philadelphia, Pa: Churchill Livingstone; 2003: chap 27.
2. Dowell SF, Butler JC, Giebink GS. Acute otitis media: management and surveillance in an era of pneumococcal resistance. Nurse Pract 1999;24(10 Suppl):1-9.
3. Pichichero ME, Reiner SA, Brook I, et al. Controversies in the medical management of persistent and recurrent otitis media. Ann Otol Rhinol Laryngol 2000;109:2-12.
4. American Academy of Pediatrics Subcommittee on Management of Acute Otitis Media. Clinical practice guideline: Diagnosis and management of acute otitis media. Pediatrics 2004;113:1451-1466.
5. Heikkinen T, Ruuskanen O. Signs and symptoms predicting acute otitis media. Arch Pediatr Adolesc Med 1995;149:26-29.
6. Kontiokari T, Koivunen P, Niemala M, Pokka T, Uhari M. Symptoms of acute otitis media. Pediatr Infect Dis J 1998;17:676-679.
7. Pichichero ME. Acute otitis media: Part I. Improving diagnostic accuracy. Am Fam Physician 2000;61:2051-2056.
8. Casey JR, Pichichero ME. Changes in frequency and pathogens causing acute otitis media in 1995–2003. Ped Infect Dis J 2004;23:824-828.
9. Barnett ED, Klein JO. The problem of resistant bacteria for the management of acute otitis media. Pediatr Clin North Am 1995;42:509-517.
10. Doern GV, Pfaller MA, Kugler K, Freeman J, Jones RN. Prevalence of antimicrobial resistance among respiratory tract isolates of Streptococcus pneumoniae in North America: 1997 results from the SENTRY antimicrobial surveillance program. Clin Infect Dis 1998;27:764-770.
11. Doern GV, Jones RN, Pfaller MA, Kugler K. Haemophilus influenzae and Moraxella catarrhalis from patients with community-acquired respiratory tract infections: antibacterial susceptibility patterns from the SENTRY antibacterial surveillance program (United States and Canada, 1997). J Antimicrob Chemother 1999;43:385-389.
12. Pichichero ME. Acute otitis media: Part II. Treatment in an era of increasing antibiotic resistance. Am Fam Phys 2000;61:2410-2416.
13. Marcy M, Takata GS, Shekelle P, et al. Management of acute otitis media. Evidence report/technology assessment no. 15. AHRQ Publication No. 01-E010. Rockville, Md: Agency for Healthcare Research and Quality; 2001.
14. Wald ER. Acute otitis media: more trouble with the evidence. Pediatr Infect Dis J 2003;22:103-104.
15. Wandstrat TL, Kaplan B. Pharmacoeconomic impact of factors affecting compliance with antibiotic regimens in the treatment of acute otitis media. Pediatr Infect Dis J 1997;16(Suppl):S27-S29.
16. Block SL, McCarty JM, Hedrick JA, et al. Comparative safety and efficacy of cefdinir vs amoxicillin/clavulanate for treatment of suppurative acute otitis media in children. Pediatr Infect Dis J 2000;19(Suppl):S159-S165.
17. Block SL, Hedrick JA, Kratzer J, Nemeth MA, Tack KJ. Five-day twice daily cefdinir therapy for acute otitis media: Microbiologic and clinical efficacy. Pediatr Infect Dis J 2000;19(Suppl):S153-S158.
18. Hedrick HA, Sher LD, Schwartz RH, Pierce PF. Cefprozil verus high dose amoxicillin/clavulanate in children with acute otitis media. Clin Ther 2001;23:193-204.
19. Van Dyk JC, Terespolsky SA, Meyer CS, Can Niekerk CH, Klugman KP. Penetration of cefpodoxime into middle ear fluid in pediatric patients with acute otitis media. Pediatr Infect Dis J 1997;16:79-81.
20. Craig WA, Andes D. Pharmacokinetics and pharmacodynamics of antibiotics in otitis media. Ped Infect Dis J 1996;15:255-259.
21. Jacobs MR, Bajaksouzian S, Zilles A, et al. Susceptibilities of Streptococcus pneumoniae and Haemophilus influenzaeto 10 oral antimicrobial agents based on pharmacodynamic parameters: 1997 US Surveilance Study. Antimicrob Agents Chemother 1999;43:1901-1908.
22. Dagan R, Johnson CE, Mc Linn S. Bacteriologic and clinical efficacy of amoxicillin/clavulanate vs. azithromycin in acute otitis media. Pediatr Infect Dis J 2000;20:829-837.
23. Hoberman A. Extra-strength amoxicillin-clavulanate (A/C-ES) vs. azithromycin (AZI) for acute otitis media (AOM) in children. 43rd Interscience Conference on Antimicrobial Agents and Chemotherapy 2003 Session 88 G-459.
24. Dagan R, Leibovitz E, Greenberg D, et al. Early eradication of pathogens from middle ear fluid during antibiotic treatment of acute otitis media is associated with improved clinical outcome. Pediatr Infect Dis J 1998;17:776-782.
25. Howie VM. Eradication of bacterial pathogens from middle ear infection. Clin Infect Dis 1992;14(Suppl 2):209-210.
26. Pichichero ME, Cohen R. Shortened course of antibiotic therapy for acute otitis media, sinusitis, and tonsillopharyngitis. Pediatr Infect Dis J 1997;16:680-685.
27. Kozyrskyj AL, Hildes-Ripstein E, Longstaffe SEA, et al. Treatment of acute otitis media with a shortened course of antibiotics: A meta-analysis. JAMA 1998;279:1736-1742.
28. Pichichero ME. Dynamics of antibiotic prescribing for children. JAMA 2002;287:23.-
29. Black S, Shinefield H, Fireman B. Efficacy, safety and the immunogenicity of heptavalent pneumococcal conjugate vaccine in children. Pediatr Infect Dis J 2000;19:187-195.
30. Eskola J, Kilpi T, Palmu A, et al. Efficacy of a pneumococcal conjugate vaccine against acute otitis media. N Engl J Med 2001;344:403-409.
31. Yee CL, Duffy C, Gerbino PG, Stryker S, Noel GJ. Tendon or joint disorders in children after treatment with fluoroquinolones or azithromycin. Ped Infect Dis J 2002;21:525-529.
32. Ackerman G, Rodloff AC. Drugs of the 21st century: Telithromycin (HMR 3647)—the first ketolide. J Antimicrob Chemother 2003;51:497-511.
33. Steele RW, Thomas MP, Begue RE. Compliance issues related to the selection of antibiotic suspensions for children. Pediatr Infect Dis J 2001;20:1-5.
34. Ruff ME, Schotik DA, Bass JW. Antimicrobial drug suspensions: A blind comparison of taste of fourteen common pediatric drugs. Pediatr Infect Dis J 1991;10:30-33.
35. Demers DM, Chan DS, Bass JW. Antimicrobial drug suspensions: A blinded comparison of taste of twelve common pediatric drugs including cefixime, cefpodoxime, cefprozil, and loracarbef. Pediatr Infect Dis J 1994;13:87-89.
Community-acquired Bacterial Respiratory Tract Infections: Consensus Recommendations
- To minimize development and spread of antibiotic resistance, it is important to administer the correct antibacterial, by the best route, in the right amount, at optimum intervals, and for the appropriate duration.
- Streptococcus pneumoniae and Haemophilus influenzae are the 2 most common bacterial pathogens observed in community-acquired respiratory tract infections.
- Surveillance studies indicate increasing rates of in vitro resistance by S pneumoniae to many β-lactam and macrolide antibiotics.
- To minimize risk of resistance-associated recurrence or relapse, antibacterial agents should be prescribed in accordance with existing guidelines and local resistance patterns. Patient compliance with dosage and duration of therapy should be fostered.
- Preliminary data suggest that high-dose, short-course antibacterial therapy may be as effective as longer courses of low-dose therapy.
Community-acquired respiratory tract infections (CARTIs) are a reason for seeking medical attention. In 2001, there were 28.4 million office visits in the United States for an acute respiratory tract infection (excluding pharyngitis).1
Management of CARTIs poses several challenges. According to the World Health Organization (WHO), “for every 100 respiratory infections, only 20% require antibiotic treatment”2 —the remaining 80 infections most likely have a viral origin. Thus, antibacterial therapy should be avoided unless a bacterial cause has been confirmed or is deemed likely.
Once that determination has been made, clinicians need to separate patients who can be safely managed as outpatients from those who need to be hospitalized. Disease severity is, of course, an important consideration in this selection process.3-8
For management of patients who will not be hospitalized, the WHO and the Society for Healthcare Epidemiology of America/Infectious Diseases Society of America (SHEA/IDSA) offer the 3 Ds: administer the correct drug, at the right dose, and for the appropriate duration, to minimize development and spread of resistance.9,10 A recent consensus conference coordinated by the Primary Care Education Consortium and Texas Academy of Family Physicians elaborated on this mnemonic as it relates to outpatient management of 3 CARTIs: community-acquired pneumonia, acute bacterial exacerbations of chronic bronchitis, and acute bacterial rhinosinusitis. Its recommendations, which have been drawn largely from existing evidence-based guidelines, form the basis for this review.
Drug selection
Treatment with an antibacterial agent will not be medically warranted in the majority of patients with a CARTI. Many of these patients will, however, expect to go home with an antibiotic prescription. The primary care clinician can reduce such expectations and prevent unnecessary reconsultations by briefly addressing four issues: 1) the natural course of the viral illness, 2) the lack of effectiveness of antibiotics, 3) the problem of antibiotic resistance, and 4) the side effects of antibiotics.11
When selecting an antibacterial agent for patients with pneumonia, bronchitis, or rhinosinusitis for which a bacterial cause has been identified or deemed likely, several factors need to be taken into account, including the suspected or identified pathogens, local resistance patterns, previous therapy, patient allergies, and the patient’s ability to tolerate treatment failure. Many of these factors are considered by professional organizations that regularly develop guidelines for CARTIs based on the best available evidence. Perhaps most critical for decision-making in the primary care setting is an understanding of evolving microbiology and resistance patterns.
Common pathogens
There is considerable overlap among pathogens commonly found in CARTIs. Streptococcus pneumoniae and Haemophilus influenzae are most often observed in the outpatient setting.
Community-acquired pneumonia. In outpatients with mild illness, S pneumoniae, Mycoplasma pneumoniae, Chlamydia species (particularly Chlamydia pneumoniae, now called Chlamydophilia pneumoniae), and H influenzae are the most common pathogens.12,13 In patients younger than 50 years without significant comorbidity, Mycoplasma species are the most common pathogens. Older patients and those with significant comorbidity are more likely infected with S pneumoniae,13 a Gram-negative enteric bacillus, Pseudomonas aeruginosa, or Legionella.5,14
Bacterial bronchitis. In addition to S pneumoniae and H influenzae, Moraxella catarrhalis is a frequent pathogen in bacterial exacerbations of chronic bronchitis.15P aeruginosa and other Gram-negative bacilli are also seen, especially in patients with a severe acute exacerbation who have a forced expiratory volume in 1 second (FEV1) of 35% of predicted or less.16 Infection due to multiple pathogens occurs in a small percentage of all patients with chronic bronchitis, particularly those with severe exacerbations. Fewer than 10% of acute exacerbations are due to an atypical bacterium, usually C pneumoniae. M pneumoniae and Legionella pneumophila are implicated even less frequently.15
Bacterial rhinosinusitis.S pneumoniae and H influenzae also are frequent causes of acute bacterial rhinosinusitis. Other pathogens commonly seen in this condition include other Streptococcus species, M catarrhalis, oral anaerobes, Staphylococcus aureus in adults, and M catarrhalis, Streptococcus pyogenes, and anaerobes in children.17
Resistance
Antibiotic resistance is an important consideration in the management of CARTIs. There is little doubt that widespread use of antibiotics leads to in vitro bacterial resistance.18-20 However, because clinical success has been observed in the presence of pathogens with low-level resistance, there is some debate as to whether low-level antibiotic resistance has a significant effect on clinical outcomes.18,21-29 Even so, the US Centers for Disease Control and Prevention has determined that people who attend or work at child-care centers and those who recently used antimicrobial agents are at increased risk for infection with drug-resistant S pneumoniae.30 Moreover, the WHO has stated that infection with resistant pathogens prolongs illness and increases the probability of a fatal outcome.31
Several surveillance programs that monitor antibiotic resistance patterns—including the Alexander Project32 and Tracking Resistance in the United States Today (TRUST)33-36 —have confirmed widespread resistance to antibiotics commonly used to treat CARTIs in the United States. β-Lactam resistance due to penicillin-binding protein changes in S pneumoniae has increased significantly over the past decade. Generally, more than 30% of S pneumoniae are now resistant to penicillins and macrolides (including azithromycin and clarithromycin, the ‘advanced’ agents in this group). A smaller number (6%) are resistant to amoxicillin/clavulanate, although this appears to be a result of in vitro test parameters involving primarily strains with high-level β-lactam resistance. Some cephalosporins also show greater activity than penicillin against intermediately susceptible S pneumoniae, but are not effective against highly resistant strains. In contrast, fewer than 1% of all pneumococci are resistant to newer fluoroquinolones (the so-called respiratory fluoroquinolones, such as gatifloxacin, gemifloxacin, levofloxacin, moxifloxacin) and the ketolide telithromycin.
The prevalence of β-lactamase–producing strains of H influenzae appears to have leveled off. Approximately 30% of H influenzae strains are resistant to ampicillin, while fewer than 1% are resistant to amoxicillin/clavulanate, cefuroxime, macrolides, and newer fluoroquinolones.
More than 90% of M catarrhalis isolates produce β-lactamase, thereby conferring resistance to ampicillin and amoxicillin.
Significant geographical variation in resistance has been observed. The prevalence of penicillin-resistant S pneumoniae ranges from 8% in New England to 25% in the South Atlantic, while ampicillin-resistant H influenzae is seen most often in New England (35%) and least often in the Rocky Mountain region (24%).33,34,36 Significant differences within a community also have been observed.37 Thus, knowledge of local resistance patterns is necessary. This information generally is available from local hospitals, although such data may be more reflective of nosocomial pathogens, or state health departments.
Community-acquired pneumonia
The 2003 guidelines of the IDSA give advanced macrolides and respiratory fluoroquinolones a prominent role in the management of community-acquired pneumonia (TABLE 1).5 The IDSA reviewed data from more than 150 clinical trials conducted in adults over 15 years. The IDSA panel acknowledged the increasing in vitro resistance of S pneumoniae to the macrolides, but noted that reports of clinical failure have not paralleled this. The panel also pointed out the significantly lower rates of resistance to the respiratory fluoroquinolones and expressed concern that abuse of these agents could lead to increased resistance by S pneumoniae.
In a previously healthy person who has not taken an antibiotic in the last 3 months, the IDSA recommends a macrolide or doxycycline as first-line therapy, whereas a fluoroquinolone, high-dose amoxicillin/clavulanate, or a macrolide plus high-dose amoxicillin should be used if an antibiotic has been taken during the last 3 months. Patients with a significant comorbidity can be treated with a fluoroquinolone without regard to recent antibiotic use. Alternatively, a macrolide can be used alone in patients who have not taken an antibiotic in 3 months, but otherwise must be used in combination with high-dose amoxicillin. High-dose amoxicillin/clavulanate or cefpodoxime, cefprozil, or cefuroxime can be used in those with a significant comorbidity and recent antibiotic use.
TABLE 1
Initial empiric therapy in outpatients with community-acquired pneumonia
| Clinical characteristics | No recent antibiotic therapy | Antibiotics during past 3 months |
|---|---|---|
| Previously healthy |
|
|
| Comorbidities (chronic obstructive pulmonary disease, diabetes, renal failure, congestive heart failure, malignancy) |
|
|
| Suspected aspiration with infection |
| |
| Influenza with bacterial superinfection |
| |
| Adapted from Mandell et al.5 © 2003 Infectious Diseases Society of America. | ||
Bacterial bronchitis
A panel of primary care physicians and specialists convened by the Canadian Thoracic Society (CTS) reviewed nearly 400 published articles on acute bacterial exacerbations of chronic bronchitis, including evidence-based reviews such as the Cochrane Database. The 2003 CTS guidelines recommend that treatment be based on the risk for treatment failure (TABLE 2).8
Antibacterial treatment is not recommended for patients whose clinical history and symptoms suggest a viral infection (group 0) unless symptoms persist for more than 10 to 14 days. In those cases, bacterial superinfection with M pneumoniae, C pneumoniae, or Bordetella pertussis is possible. Patients with chronic bronchitis but without risk factors for treatment failure (group 1) may be treated with a variety of first-line agents, including azithromycin, clarithromycin, cefuroxime, cefprozil, cefixime, amoxicillin, doxycycline, or trimethoprim/sulfamethoxazole. For patients in group 1 who fail first-line therapy, and as first-line therapy for patients in group 2, a fluoroquinolone or amoxicillin/clavulanate is recommended. Patients in group 3 are more likely to be infected with a Gram-negative pathogen, such as Ps aeruginosa or Enterobacter species, and are least able to tolerate treatment failure. Hence, ciprofloxacin is appropriate in the outpatient setting.
TABLE 2
Initial empiric therapy in outpatients with acute bacterial exacerbations of chronic bronchitis
| Group | Clinical status | Symptoms/risk factors | Initial treatment | Alternative when 1st-line agent fails |
|---|---|---|---|---|
| 0 | Acute tracheobronchitis |
|
|
|
| 1 | Chronic bronchitis without risk factors |
|
|
|
| 2 | Chronic bronchitis with risk factors |
|
|
|
| 3 | Chronic suppurative bronchitis |
|
| |
| Adapted from Balter et al,8 with permission. The publisher of Can Respir J does not assume responsibility for errors or discrepancies that may have occurred. | ||||
Bacterial rhinosinusitis
The recommendations for management of acute bacterial rhinosinusitis issued by the Sinus and Allergy Health Partnership (SAHP), a not-for-profit organization created by the American Academy of Otolaryngic Allergy, the American Academy of Otolaryngology-Head and Neck Surgery, and the American Rhinologic Society, are based on a variety of factors. These include rate of spontaneous resolution, pathogen distribution, antibacterial resistance data, the importance of S pneumoniae in intracranial and extrasinus complications, and the ability of a patient to tolerate treatment failure (TABLE 3).17 The panel reviewed more than 150 published articles on management of children and adults with bacterial rhinosinusitis.
As in the pneumonia guidelines, recent antibiotic use is an important consideration when selecting an antibiotic since resistant pathogens are likely. β-Lactam agents play a major role as initial therapy in both children and adults. This recommendation is consistent with those of Williams et al who reviewed 49 clinical trials involving 13,660 patients. These investigators recommended 7 to 14 days of penicillin or amoxicillin for acute maxillary sinusitis confirmed radiographically or by aspiration.38
The SAHP recommended higher doses of amoxicillin (with or without clavulanate) in patients who have recently taken an antibiotic or who have moderate disease. Fluoroquinolones are recommended as alternatives in patients with mild disease who have not taken an antibiotic in the last 4 to 6 weeks. However, in patients with mild disease who have taken antibiotics recently or who have moderate disease, fluoroquinolones are recommended as first-line therapy. Macrolides are recommended only for patients with a β-lactam allergy since failure rates of 20% to 25% are possible. Lack of improvement or worsening symptoms after 72 hours should prompt reevaluation, may necessitate cultures and/or a CT scan, and should raise the possibility of causal organisms other than S pneumoniae, H influenzae, and M catarrhalis.
TABLE 3
Initial empiric therapy in outpatients with acute bacterial rhinosinusitis
| Initial therapy | Alternative agent if no improvement or worsening after 72 hours | |
|---|---|---|
| Mild disease, no antibiotic during past 4 to 6 weeks | ||
| Children |
|
|
| Children with β-lactam allergy |
|
|
| Adults |
|
|
| Adults with β-lactam allergy |
|
|
| Mild disease and antibiotic during past 4 to 6 weeks or moderate disease | ||
| Children |
|
|
| Children with β-lactam allergy |
|
|
| Adults |
|
|
| Adults with β-lactam allergy |
|
|
| Adapted from Anon et al17 © 2004, with permission from American Academy of Otolaryngology-Head and Neck Surgery Foundation, Inc. | ||
Dose and duration
While each of the three guidelines provides detailed recommendations regarding selection of an antibacterial agent, the dose and duration of therapy generally are not well defined. Fortunately, other sources provide guidance in these 2 areas.
First, an independent international panel of infectious diseases experts, whose goal was to identify ways to improve prescription of antibiotics for lower respiratory tract infections, stressed that an important purpose of therapy is to reduce bacterial load and, in fact, treat to bacteriologic cure.19 Antibiotic therapy that allows some bacteria to survive increases the risk of early recurrence or relapse and encourages resistance selection. Such therapy is, therefore, inappropriate. The panel concurred with the WHO and others that the likelihood of bacterial persistence increases when antibiotics are prescribed in low doses, especially if given over long periods.18,39-41 Prolonged low-dose antibiotic therapy, which has been common practice for many infections, is contrary to the WHO Global Strategy for Containment of Antimicrobial Resistance, which notes that single-agent therapy for a short duration is 1 of several actions that can be taken to minimize bacterial resistance.42 Shorter courses of antibiotic therapy also are consistent with SHEA/IDSA recommendations.10
The clinical appropriateness of this recommendation is reinforced by the changes that have occurred during the past decade in the management of selected urinary tract infections (UTIs). Some UTIs that previously had been treated with low-dose antibiotics for 10 to 14 days now are treated with only 1 or a few high doses of a single agent. Other infections for which clinical data support shorter courses of antibiotic therapy include uncomplicated cellulitis,43 ventilator-associated pneumonia,44 and meningococcal disease.45
Shorter-course antibacterial therapy for CARTIs increasingly has been the focus of clinical trials. The focus is not unreasonable. Many of the antibiotics used for CARTIs are very potent against the pathogens commonly encountered, penetrate infected tissues well, are available in oral formulations, and are generally well tolerated. However, to optimize an antibiotic’s bactericidal potential, it is necessary to base the dosing regimen on its pharmacodynamics. From a pharmacodynamic perspective, there are 2 groups of antibiotics, those with concentration-dependent killing and those with time-dependent killing. For agents with concentration-dependent killing, such as fluoroquinolones, ketolides, and aminoglycosides, the goal is to select a dose that achieves a higher peak concentration and/or a larger area under the plasma concentration curve, with acceptable tolerability. In contrast, antibiotics that rely on time-dependent killing, such as β-lactams, macrolides, azalides, tetracyclines, and some others, require extended durations of concentrations above the MIC90 of the bacterial pathogen(s). Consequently, multiple daily dosing may be preferable.46
Dose. A few studies have compared high-dose, short-course therapy with therapy using standard doses and durations (TABLE 4). To assess the impact of highdose, short-course therapy on post-treatment resistant pneumococcal carriage, Schrag compared amoxicillin given either as 90 mg/kg/day for 5 days (high-dose, short-course) or 40 mg/kg/day for 10 days (standard) in 797 children with a respiratory tract infection.47 At day 28, nasal carriage of penicillin-resistant S pneumoniae was detected in 24% of the high-dose, shortcourse group and in 32% of the standard group (relative risk, 0.77; P=0.03). Among the pneumococcal carriers, the risk of penicillin-resistant S pneumoniae was significantly lower in the high-dose, short-course group than in the standard therapy group (relative risk, 0.78; P=0.01)
Another study investigated high-dose, short-course therapy with levofloxacin in patients with mild to severe community-acquired pneumonia. Patients received levofloxacin 750 mg/d for 5 days or 500 mg/d for 10 days.48 The clinical success rates were 92.4% and 91.1%, respectively, while the bacteriologic eradication rates at 7 to 14 days post-therapy were 93.2% and 92.4%, respectively, thereby demonstrating that high-dose, shortcourse levofloxacin therapy is at least as effective as standard levofloxacin therapy.
Duration. Short-course therapy using standard doses of azithromycin, gemifloxacin, levofloxacin, moxifloxacin, and telithromycin has been investigated in clinical trials of CARTIs (FIGURE). In patients with community-acquired pneumonia, 5 days of therapy with telithromycin was shown to be equivalent to a 7-day course (both using a single daily dose of 800 mg), as well as to clarithromycin 500 mg bid for 10 days.49
In studies of acute exacerbations of chronic bronchitis, a 3-day course of azithromycin was equivalent to clarithromycin for 10 days50 and gemifloxacin for 5 days was equivalent to a sequential combination of ceftriaxone and cefuroxime axetil for up to 10 days.51 Levofloxacin for 3 days and azithromycin for 5 days provided equivalent outcomes,52 as did levofloxacin for 5 days and amoxicillin/clavulanate for 10 days.52 Moxifloxacin for 5 days provided results equivalent to those of 7 days of amoxicillin, clarithromycin, or cefuroxime axetil.53 Five days of telithromycin was shown to be equivalent to 10 days of amoxicillin/clavu-lanate54 or cefuroxime axetil.55
Studies of acute bacterial rhinosinusitis have demonstrated equivalent results with azithromycin for 3 days and amoxicillin/clavulanate for 10 days.50 Similarly, telithromycin for 5 days was equivalent to 10 days of telithromycin, amoxicillin/clavulanate, or cefuroxime axetil.56
These clinical trials demonstrate that short-course therapy achieves clinical cure and/or bacteriologic eradication rates that are at least equivalent to those of standard therapy, with no significant difference in safety. Symptomatic improvement is faster and total antibiotic exposure is reduced with short-course therapy.
A significant advantage of short-course antibacterial therapy is improved patient adherence. Adherence is 10% to 20% better with 5-day courses than with 10-day courses,47,57 and is significantly better with 1 or 2 daily doses than with 3 or more daily doses.58-60 In fact, a recent market research study showed that patients perceive once-daily, short-course antibiotic treatment to be significantly more effective than longer courses. This may be due to faster improvement of infection-related symptoms.61 For example, Dunbar et al observed that significantly more patients treated with high-dose, short-course levofloxacin experienced subjective and objective resolution of fever by day 3 compared with those who received standard-dose, short-course levofloxacin.48
TABLE 4
Clinical trials of high-dose, short-course antibiotic therapy
| Drug regimen | N (ref) | Outcome |
|---|---|---|
| Amoxicillin 90 mg/kg/d x 5 d vs Amoxicillin 40 mg/kg/d x 10 d | 797 |
|
| (47) | ||
| Levofloxacin 750 mg/d x 5d vs Levofloxacin 500 mg/d x 10 d | 390 |
|
| (48) |
TABLE 5 Clinical trials of standard-dose, short-course antibiotic therapy
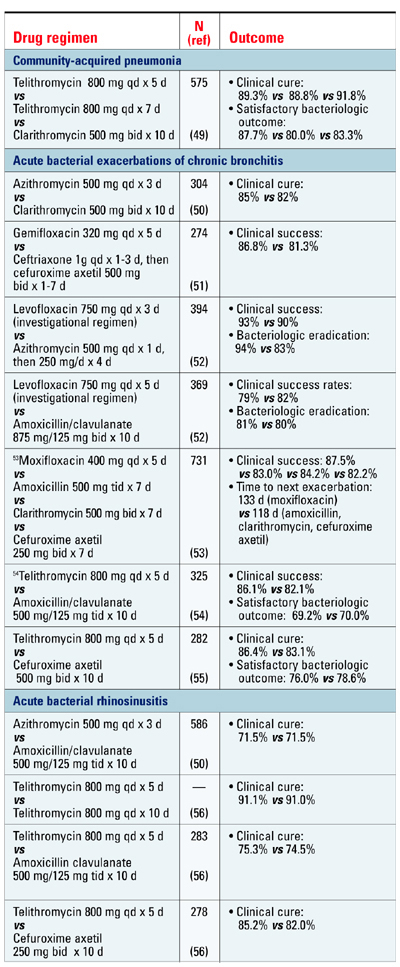
Summary
Essential questions that need to be answered for every patient who presents with a possible CARTI include : 1) Is antibacterial therapy necessary? 2) If so, what is the best antibiotic and at what dose and for how long should it be administered? Accumulating evidence indicates that some antibiotics when given in high doses for a short duration are as effective and safe as standard therapy for CARTIs. Short-course therapy also promotes patient compliance.
Disclosures:
The authors reported the following financial relationships: Dr Brunton: consultant to Abbott, Ortho-McNeil Pharmaceutical, Inc., and SanofiAventis. Dr Carmichael: consultant to Ortho-McNeil Pharmaceutical, Inc.; on the speakers’ bureaus for Bristol-Myers Squibb Company, Merck & Co., OrthoMcNeil Pharmaceutical, Inc., and Pfizer Inc. Dr Fitzgerald: on the speakers’ bureaus for Boehringer Ingelheim, GlaxoSmithKline, Ortho-McNeil Pharmaceutical, Inc., Pfizer Inc., Sepracor Inc., and 3M. Dr Liu: on the speakers’ bureaus for Aventis Pharmaceuticals, Bayer Pharmaceuticals Corporation, Bristol-Myers Squibb Company, Cobist, GlaxoSmithKline, Merck & Co., Ortho-McNeil Pharmaceutical, Inc., Pfizer Inc., Purdue Pharma, Oscient Pharmaceuticals Corporation, and Wyeth Pharmaceuticals. Dr Varon: on the speakers’ bureau for Ortho-McNeil Pharmaceutical, Inc. Dr. Weiland: consultant to Abbott Laboratories, Ortho-McNeil Pharmaceutical, Inc., and Pfizer Inc.
This supplement to The Journal of Family Practice is supported by a grant from Ortho-McNeil Pharmaceutical, Inc. It was adapted from a consensus conference coordinated by the Primary Care Education Consortium and Texas Academy of Family Physicians and was edited and peer-reviewed by The Journal of Family Practice. © 2005 Quadrant HealthCom Inc. and Primary Care Education Consortium.
1. Centers for Disease Control and Prevention. National Center for Health Statistics website. National Ambulatory Medical Care Survey: 2001 Summary. Available at: http://www.cdc.gov/nchs/data/ad/ad337.pdf. Accessed February 2, 2005.
2. World Health Organization.World Health Organization web site. World Health Organization Report on Infectious Diseases 2000. Overcoming antimicrobial resistance. Chapter 4. Big guns of resistance. Available at: http://www.who.int/infectious-disease-report/2000/. Accessed February 2, 2005.
3. Metlay JP, Fine MJ. Testing strategies in the initial management of patients with community-acquired pneumonia. Ann Intern Med. 2003;138:109-118.
4. File TM. Community-acquired pneumonia. Lancet. 2003;362:1991-2001.
5. Mandell LA, Bartlett JG, Dowell SF, File TM, Jr, Musher DM, Whitney C. Update of practice guidelines for the management of community-acquired pneumonia in immunocompetent adults. Clin Infect Dis. 2003;37:1405-1433.
6. Fine MJ, Auble TE, Yealy DM, et al. A prediction rule to identify low-risk patients with community-acquired pneumonia. N Engl J Med. 1997;336:243-250.
7. Anthonisen NR, Manfreda J, Warren CP, Hershfield ES, Harding GK, Nelson NA. Antibiotic therapy in exacerbations of chronic obstructive pulmonary disease. Ann Intern Med. 1987;106:196-204.
8. Balter MS, La Forge J, Low DE, Mandell L, Grossman RF. Canadian guidelines for the management of acute exacerbations of chronic bronchitis. Can Respir J. 2003;10(suppl B):3B-32B.
9. World Health Organization. World Health Organization web site. World Health Organization Report on Infectious Diseases 2000. Overcoming antimicrobial resistance. Chapter 5. A call to action: A massive effort to provide proper treatment. Available at: http://www.who.int/infectious-disease-report/2000/. Accessed February 2, 2005.
10. Shlaes DM, Gerding DN, John JF, Jr, et al. Society for Healthcare Epidemiology of America and Infectious Diseases Society of America Joint Committee on the Prevention of Antimicrobial Resistance: guidelines for the prevention of antimicrobial resistance in hospitals. Clin Infect Dis. 1997;25:584-599.
11. Scottish Intercollegiate Guidelines Network. National Guideline Clearinghouse website. Community management of lower respiratory tract infection in adults. A national clinical guideline. Available at: http://www.guideline.gov/summary/summary.aspx?ss=15& doc_id=3361&nbr=2587&string=respiratory%20AND%20tract%20AND% 20infection. Accessed December 17, 2004.
12. Bochud PY, Moser F, Erard P, et al. Community-acquired pneumonia. A prospective outpatient study. Medicine (Baltimore). 2001;80:75-87.
13. Falguera M, Sacristan O, Nogues A, et al. Nonsevere community-acquired pneumonia: correlation between cause and severity or comorbidity. Arch Intern Med. 2001;161:1866-1872.
14. Ruiz M, Ewig S, Marcos MA, et al. Etiology of community-acquired pneumonia: impact of age, comorbidity, and severity. Am J Respir Crit Care Med. 1999;160:397-405.
15. Sethi S. Infectious etiology of acute exacerbations of chronic bronchitis. Chest. 2000;117(5 Suppl 2):380S-385S.
16. Eller J, Ede A, Schaberg T, Niederman MS, Mauch H, Lode H. Infective exacerbations of chronic bronchitis: relation between bacteriologic etiology and lung function. Chest. 1998;113:1542-1548.
17. Anon JB, Jacobs MR, Poole MD, et al. Antimicrobial treatment guidelines for acute bacterial rhinosinusitis. Otolaryngol Head Neck Surg. 2004;130(1 Suppl):1-45.
18. Albrich WC, Monnet DL, Harbarth S. Antibiotic selection pressure and resistance in Streptococcus pneumoniae. and Streptococcus pyogenes. Emerg Infect Dis. 2004;10:514-517.
19. Ball P, Baquero F, Cars O, et al. Antibiotic therapy of community respiratory tract infections: strategies for optimal outcomes and minimized resistance emergence. J Antimicrob Chemother. 2002;49:31-40.
20. Harbarth S, Albrich W, Brun-Buisson C. Outpatient antibiotic use and prevalence of antibiotic-resistant pneumococci in France and Germany: a sociocultural perspective. Emerg Infect Dis. 2002;8:1460-1467.
21. Lonks JR, Garau J, Medeiros AA. Implications of antimicrobial resistance in the empirical treatment of community-acquired respiratory tract infections: the case of macrolides. J Antimicrob Chemother. 2002;50(Suppl S2):87-92.
22. Lonks JR, Garau J, Gomez L, et al. Failure of macrolide antibiotic treatment in patients with bacteremia due to erythromycin-resistant Streptococcus pneumoniae. Clin Infect Dis. 2002;35:556-564.
23. Moellering RC, Jr, Craig W, Edmond M, et al. Clinical and public health implications of macrolide-resistant Streptococcus pneumoniae. J Chemother. 2002;14(suppl 3):42-56.
24. Davidson R, Cavalcanti R, Brunton JL, et al. Resistance to levofloxacin and failure of treatment of pneumococcal pneumonia. N Engl J Med. 2002;346:747-750.
25. Musher DM, Dowell ME, Shortridge VD, et al. Emergence of macrolide resistance during treatment of pneumococcal pneumonia. N Engl J Med. 2002;346:630-631.
26. Waterer GW, Buckingham SC, Kessler LA, Quasney MW, Wunderink RG. Decreasing β-lactam resistance in Pneumococci. from the Memphis region: analysis of 2,152 isolates From 1996 to 2001. Chest. 2003;124:519-525.
27. Nuermberger E, Bishai WR. The clinical significance of macrolide-resistant Streptococcus pneumoniae.: it’s all relative. Clin Infect Dis. 2004;38:99-103.
28. Yu VL, Chiou CC, Feldman C, et al. An international prospective study of pneumococcal bacteremia: correlation with in vitro resistance, antibiotics administered, and clinical outcome. Clin Infect Dis. 2003;37:230-237.
29. Metlay JP. Update on community-acquired pneumonia: impact of antibiotic resistance on clinical outcomes. Curr Opin Infect Dis. 2002;15:163-167.
30. Centers for Disease Control and Prevention. Centers for Disease Control and Prevention web site. Drug-resistant Streptococcus pneumoniae disease. Available at: http://www.cdc.gov/ncidod/dbmd/diseaseinfo/drugresisstreppneum_t.htm. Accessed January 4, 2005.
31. World Health Organization World Health Organization web site. World Health Organization Report on Infectious Diseases 2000. Overcoming antimicrobial resistance. Chapter 3. Factors contributing to resistance. Available at: http://www.who.int/infectious-disease-report/2000/. Accessed February 2, 2005.
32. Jacobs MR, Felmingham D, Appelbaum PC, Gruneberg RN. The Alexander Project 1998-2000: susceptibility of pathogens isolated from communityacquired respiratory tract infection to commonly used antimicrobial agents. J Antimicrob Chemother. 2003;52:229-246.
33. Thornsberry C, Sahm DF, Kelly LJ, et al. Regional trends in antimicrobial resistance among clinical isolates of Streptococcus pneumoniae., Haemophilus influenzae., and Moraxella catarrhalis. in the United States: results from the TRUST Surveillance Program, 1999-2000. Clin Infect Dis. 2002;34(suppl 1):S4-S16.
34. Karlowsky JA, Thornsberry C, Jones ME, Evangelista AT, Critchley IA, Sahm DF. Factors associated with relative rates of antimicrobial resistance among Streptococcus pneumoniae. in the United States: results from the TRUST Surveillance Program (1998-2002). Clin Infect Dis. 2003;36:963-970.
35. Karlowsky JA, Kelly LJ, Thornsberry C, et al. Susceptibility to fluoroquinolones among commonly isolated Gram-negative bacilli in 2000: TRUST and TSN data for the United States. Tracking Resistance in the United States Today. The Surveillance Network. Int J Antimicrob Agents. 2002;19:21-31.
36. Karlowsky JA, Thornsberry C, Critchley IA, et al. Susceptibilities to levofloxacin in Streptococcus pneumoniae., Haemophilus influenzae., and Moraxella catarrhalis. clinical isolates from children: results from 2000-2001 and 2001-2002 TRUST studies in the United States. Antimicrob Agents Chemother. 2003;47:1790-1797.
37. Quale J, Landman D, Ravishankar J, Flores C, Bratu S. Streptococcus pneumo.-niae., Brooklyn, New York: fluoroquinolone resistance at our doorstep. Emerg Infect Dis. 2002;8:594-597.
38. Williams JW, Jr, Aguilar C, Cornell J, et al. Antibiotics for acute maxillary sinusitis. Cochrane Database Syst Rev. 2004;2:CD000243.-
39. Guillemot D, Carbon C, Balkau B, et al. Low dosage and long treatment duration of β-lactam: risk factors for carriage of penicillin-resistant Streptococcus pneumoniae. JAMA. 1998;279:365-370.
40. Scheld WM. Maintaining fluoroquinolone class efficacy: review of influencing factors. Emerg Infect Dis. 2003;9:1-9.
41. Thomson KS. Minimizing quinolone resistance: are the new agents more or less likely to cause resistance? J Antimicrob Chemother. 2000;45:719-723.
42. World Health Organization. World Health Organization web site. WHO global strategy for containment of antimicrobial resistance. Available at: http://www.who.int/csr/resources/publications/drugresist/en/EGlobal_Strat.pdf. Accessed February 2, 2005.
43. Hepburn MJ, Dooley DP, Skidmore PJ, Ellis MW, Starnes WF, Hasewinkle WC. Comparison of short-course (5 days) and standard (10 days) treatment for uncomplicated cellulitis. Arch Intern Med. 2004;164:1669-1674.
44. Chastre J, Wolff M, Fagon JY, et al. Comparison of 8 vs 15 days of antibiotic therapy for ventilator-associated pneumonia in adults: a randomized trial. JAMA. 2003;290:2588-2598.
45. Ellis-Pegler R, Galler L, Roberts S, Thomas M, Woodhouse A. Three days of intravenous benzyl penicillin treatment of meningococcal disease in adults. Clin Infect Dis. 2003;37:658-662.
46. Craig WA. Basic pharmacodynamics of antibacterials with clinical applications to the use of β-lactams, glycopeptides, and linezolid. Infect Dis Clin North Am. 2003;17:479-501.
47. Schrag SJ, Pena C, Fernandez J, et al. Effect of short-course, high-dose amoxicillin therapy on resistant pneumococcal carriage: a randomized trial. JAMA. 2001;286:49-56.
48. Dunbar LM, Wunderink RG, Habib MP, et al. High-dose, short-course levofloxacin for community-acquired pneumonia: a new treatment paradigm. Clin Infect Dis. 2003;37:752-760.
49. Tellier G, Niederman MS, Nusrat R, Patel M, Lavin B. Clinical and bacteriological efficacy and safety of 5 and 7 day regimens of telithromycin once daily compared with a 10 day regimen of clarithromycin twice daily in patients with mild to moderate community-acquired pneumonia. J Antimicrob Chemother. 2004;54:515-523.
50. Zithromax [prescribing information] New York, NY: Pfizer Labs; 2004.
51. Wilson R, Langan C, Ball P, Bateman K, Pypstra R. Oral gemifloxacin once daily for 5 days compared with sequential therapy with i.v. ceftriaxone/oral cefuroxime (maximum of 10 days) in the treatment of hospitalized patients with acute exacerbations of chronic bronchitis. Respir Med. 2003;97:242-249.
52. Tennenberg A, Walker K, Khashab M, Zadelkis N. The safety and efficacy of short-course (3-5 days), 750 mg levofloxacin (LVX) for acute bacterial exacerbation of chronic bronchitis (ABECB). Presented at: American Thoracic Society 100th International Conference, May 21-26, 2004, Orlando, Fl.
53. Wilson R, Allegra L, Huchon G, et al. Short-term and long-term outcomes of moxifloxacin compared to standard antibiotic treatment in acute exacerbations of chronic bronchitis. Chest. 2004;125:953-964.
54. Aubier M, Aldons PM, Leak A, et al. Telithromycin is as effective as amoxicillin/clavulanate in acute exacerbations of chronic bronchitis. Respir Med. 2002;96:862-871.
55. Zervos MJ, Heyder AM, Leroy B. Oral telithromycin 800 mg once daily for 5 days versus cefuroxime axetil 500 mg twice daily for 10 days in adults with acute exacerbations of chronic bronchitis. J Int Med Res. 2003;31:157-169.
56. Ketek [prescribing information]. Kansas City, Mo: Aventis Pharmaceuticals Inc.; 2004.
57. Carbon C, Chatelin A, Bingen E, et al. A double-blind randomized trial comparing the efficacy and safety of a 5-day course of cefotiam hexetil with that of a 10-day course of penicillin V in adult patients with pharyngitis caused by group A β-haemolytic streptococci. J Antimicrob Chemother 1995;35:843-854.
58. Cockburn J, Gibberd RW, Reid AL, Sanson-Fisher RW. Determinants of noncompliance with short term antibiotic regimens. Br Med J (Clin Res Ed). 1987;295:814-818.
59. Greenberg RN. Overview of patient compliance with medication dosing: a literature review. Clin Ther. 1984;6:592-599.
60. Claxton AJ, Cramer J, Pierce C. A systematic review of the associations between dose regimens and medication compliance. Clin Ther. 2001;23:1296-1310.
61. Perez-Gorricho B, Ripoll M. Does short-course antibiotic therapy better meet patient expectations? Int J Antimicrob Agents. 2003;21:222-228.
- To minimize development and spread of antibiotic resistance, it is important to administer the correct antibacterial, by the best route, in the right amount, at optimum intervals, and for the appropriate duration.
- Streptococcus pneumoniae and Haemophilus influenzae are the 2 most common bacterial pathogens observed in community-acquired respiratory tract infections.
- Surveillance studies indicate increasing rates of in vitro resistance by S pneumoniae to many β-lactam and macrolide antibiotics.
- To minimize risk of resistance-associated recurrence or relapse, antibacterial agents should be prescribed in accordance with existing guidelines and local resistance patterns. Patient compliance with dosage and duration of therapy should be fostered.
- Preliminary data suggest that high-dose, short-course antibacterial therapy may be as effective as longer courses of low-dose therapy.
Community-acquired respiratory tract infections (CARTIs) are a reason for seeking medical attention. In 2001, there were 28.4 million office visits in the United States for an acute respiratory tract infection (excluding pharyngitis).1
Management of CARTIs poses several challenges. According to the World Health Organization (WHO), “for every 100 respiratory infections, only 20% require antibiotic treatment”2 —the remaining 80 infections most likely have a viral origin. Thus, antibacterial therapy should be avoided unless a bacterial cause has been confirmed or is deemed likely.
Once that determination has been made, clinicians need to separate patients who can be safely managed as outpatients from those who need to be hospitalized. Disease severity is, of course, an important consideration in this selection process.3-8
For management of patients who will not be hospitalized, the WHO and the Society for Healthcare Epidemiology of America/Infectious Diseases Society of America (SHEA/IDSA) offer the 3 Ds: administer the correct drug, at the right dose, and for the appropriate duration, to minimize development and spread of resistance.9,10 A recent consensus conference coordinated by the Primary Care Education Consortium and Texas Academy of Family Physicians elaborated on this mnemonic as it relates to outpatient management of 3 CARTIs: community-acquired pneumonia, acute bacterial exacerbations of chronic bronchitis, and acute bacterial rhinosinusitis. Its recommendations, which have been drawn largely from existing evidence-based guidelines, form the basis for this review.
Drug selection
Treatment with an antibacterial agent will not be medically warranted in the majority of patients with a CARTI. Many of these patients will, however, expect to go home with an antibiotic prescription. The primary care clinician can reduce such expectations and prevent unnecessary reconsultations by briefly addressing four issues: 1) the natural course of the viral illness, 2) the lack of effectiveness of antibiotics, 3) the problem of antibiotic resistance, and 4) the side effects of antibiotics.11
When selecting an antibacterial agent for patients with pneumonia, bronchitis, or rhinosinusitis for which a bacterial cause has been identified or deemed likely, several factors need to be taken into account, including the suspected or identified pathogens, local resistance patterns, previous therapy, patient allergies, and the patient’s ability to tolerate treatment failure. Many of these factors are considered by professional organizations that regularly develop guidelines for CARTIs based on the best available evidence. Perhaps most critical for decision-making in the primary care setting is an understanding of evolving microbiology and resistance patterns.
Common pathogens
There is considerable overlap among pathogens commonly found in CARTIs. Streptococcus pneumoniae and Haemophilus influenzae are most often observed in the outpatient setting.
Community-acquired pneumonia. In outpatients with mild illness, S pneumoniae, Mycoplasma pneumoniae, Chlamydia species (particularly Chlamydia pneumoniae, now called Chlamydophilia pneumoniae), and H influenzae are the most common pathogens.12,13 In patients younger than 50 years without significant comorbidity, Mycoplasma species are the most common pathogens. Older patients and those with significant comorbidity are more likely infected with S pneumoniae,13 a Gram-negative enteric bacillus, Pseudomonas aeruginosa, or Legionella.5,14
Bacterial bronchitis. In addition to S pneumoniae and H influenzae, Moraxella catarrhalis is a frequent pathogen in bacterial exacerbations of chronic bronchitis.15P aeruginosa and other Gram-negative bacilli are also seen, especially in patients with a severe acute exacerbation who have a forced expiratory volume in 1 second (FEV1) of 35% of predicted or less.16 Infection due to multiple pathogens occurs in a small percentage of all patients with chronic bronchitis, particularly those with severe exacerbations. Fewer than 10% of acute exacerbations are due to an atypical bacterium, usually C pneumoniae. M pneumoniae and Legionella pneumophila are implicated even less frequently.15
Bacterial rhinosinusitis.S pneumoniae and H influenzae also are frequent causes of acute bacterial rhinosinusitis. Other pathogens commonly seen in this condition include other Streptococcus species, M catarrhalis, oral anaerobes, Staphylococcus aureus in adults, and M catarrhalis, Streptococcus pyogenes, and anaerobes in children.17
Resistance
Antibiotic resistance is an important consideration in the management of CARTIs. There is little doubt that widespread use of antibiotics leads to in vitro bacterial resistance.18-20 However, because clinical success has been observed in the presence of pathogens with low-level resistance, there is some debate as to whether low-level antibiotic resistance has a significant effect on clinical outcomes.18,21-29 Even so, the US Centers for Disease Control and Prevention has determined that people who attend or work at child-care centers and those who recently used antimicrobial agents are at increased risk for infection with drug-resistant S pneumoniae.30 Moreover, the WHO has stated that infection with resistant pathogens prolongs illness and increases the probability of a fatal outcome.31
Several surveillance programs that monitor antibiotic resistance patterns—including the Alexander Project32 and Tracking Resistance in the United States Today (TRUST)33-36 —have confirmed widespread resistance to antibiotics commonly used to treat CARTIs in the United States. β-Lactam resistance due to penicillin-binding protein changes in S pneumoniae has increased significantly over the past decade. Generally, more than 30% of S pneumoniae are now resistant to penicillins and macrolides (including azithromycin and clarithromycin, the ‘advanced’ agents in this group). A smaller number (6%) are resistant to amoxicillin/clavulanate, although this appears to be a result of in vitro test parameters involving primarily strains with high-level β-lactam resistance. Some cephalosporins also show greater activity than penicillin against intermediately susceptible S pneumoniae, but are not effective against highly resistant strains. In contrast, fewer than 1% of all pneumococci are resistant to newer fluoroquinolones (the so-called respiratory fluoroquinolones, such as gatifloxacin, gemifloxacin, levofloxacin, moxifloxacin) and the ketolide telithromycin.
The prevalence of β-lactamase–producing strains of H influenzae appears to have leveled off. Approximately 30% of H influenzae strains are resistant to ampicillin, while fewer than 1% are resistant to amoxicillin/clavulanate, cefuroxime, macrolides, and newer fluoroquinolones.
More than 90% of M catarrhalis isolates produce β-lactamase, thereby conferring resistance to ampicillin and amoxicillin.
Significant geographical variation in resistance has been observed. The prevalence of penicillin-resistant S pneumoniae ranges from 8% in New England to 25% in the South Atlantic, while ampicillin-resistant H influenzae is seen most often in New England (35%) and least often in the Rocky Mountain region (24%).33,34,36 Significant differences within a community also have been observed.37 Thus, knowledge of local resistance patterns is necessary. This information generally is available from local hospitals, although such data may be more reflective of nosocomial pathogens, or state health departments.
Community-acquired pneumonia
The 2003 guidelines of the IDSA give advanced macrolides and respiratory fluoroquinolones a prominent role in the management of community-acquired pneumonia (TABLE 1).5 The IDSA reviewed data from more than 150 clinical trials conducted in adults over 15 years. The IDSA panel acknowledged the increasing in vitro resistance of S pneumoniae to the macrolides, but noted that reports of clinical failure have not paralleled this. The panel also pointed out the significantly lower rates of resistance to the respiratory fluoroquinolones and expressed concern that abuse of these agents could lead to increased resistance by S pneumoniae.
In a previously healthy person who has not taken an antibiotic in the last 3 months, the IDSA recommends a macrolide or doxycycline as first-line therapy, whereas a fluoroquinolone, high-dose amoxicillin/clavulanate, or a macrolide plus high-dose amoxicillin should be used if an antibiotic has been taken during the last 3 months. Patients with a significant comorbidity can be treated with a fluoroquinolone without regard to recent antibiotic use. Alternatively, a macrolide can be used alone in patients who have not taken an antibiotic in 3 months, but otherwise must be used in combination with high-dose amoxicillin. High-dose amoxicillin/clavulanate or cefpodoxime, cefprozil, or cefuroxime can be used in those with a significant comorbidity and recent antibiotic use.
TABLE 1
Initial empiric therapy in outpatients with community-acquired pneumonia
| Clinical characteristics | No recent antibiotic therapy | Antibiotics during past 3 months |
|---|---|---|
| Previously healthy |
|
|
| Comorbidities (chronic obstructive pulmonary disease, diabetes, renal failure, congestive heart failure, malignancy) |
|
|
| Suspected aspiration with infection |
| |
| Influenza with bacterial superinfection |
| |
| Adapted from Mandell et al.5 © 2003 Infectious Diseases Society of America. | ||
Bacterial bronchitis
A panel of primary care physicians and specialists convened by the Canadian Thoracic Society (CTS) reviewed nearly 400 published articles on acute bacterial exacerbations of chronic bronchitis, including evidence-based reviews such as the Cochrane Database. The 2003 CTS guidelines recommend that treatment be based on the risk for treatment failure (TABLE 2).8
Antibacterial treatment is not recommended for patients whose clinical history and symptoms suggest a viral infection (group 0) unless symptoms persist for more than 10 to 14 days. In those cases, bacterial superinfection with M pneumoniae, C pneumoniae, or Bordetella pertussis is possible. Patients with chronic bronchitis but without risk factors for treatment failure (group 1) may be treated with a variety of first-line agents, including azithromycin, clarithromycin, cefuroxime, cefprozil, cefixime, amoxicillin, doxycycline, or trimethoprim/sulfamethoxazole. For patients in group 1 who fail first-line therapy, and as first-line therapy for patients in group 2, a fluoroquinolone or amoxicillin/clavulanate is recommended. Patients in group 3 are more likely to be infected with a Gram-negative pathogen, such as Ps aeruginosa or Enterobacter species, and are least able to tolerate treatment failure. Hence, ciprofloxacin is appropriate in the outpatient setting.
TABLE 2
Initial empiric therapy in outpatients with acute bacterial exacerbations of chronic bronchitis
| Group | Clinical status | Symptoms/risk factors | Initial treatment | Alternative when 1st-line agent fails |
|---|---|---|---|---|
| 0 | Acute tracheobronchitis |
|
|
|
| 1 | Chronic bronchitis without risk factors |
|
|
|
| 2 | Chronic bronchitis with risk factors |
|
|
|
| 3 | Chronic suppurative bronchitis |
|
| |
| Adapted from Balter et al,8 with permission. The publisher of Can Respir J does not assume responsibility for errors or discrepancies that may have occurred. | ||||
Bacterial rhinosinusitis
The recommendations for management of acute bacterial rhinosinusitis issued by the Sinus and Allergy Health Partnership (SAHP), a not-for-profit organization created by the American Academy of Otolaryngic Allergy, the American Academy of Otolaryngology-Head and Neck Surgery, and the American Rhinologic Society, are based on a variety of factors. These include rate of spontaneous resolution, pathogen distribution, antibacterial resistance data, the importance of S pneumoniae in intracranial and extrasinus complications, and the ability of a patient to tolerate treatment failure (TABLE 3).17 The panel reviewed more than 150 published articles on management of children and adults with bacterial rhinosinusitis.
As in the pneumonia guidelines, recent antibiotic use is an important consideration when selecting an antibiotic since resistant pathogens are likely. β-Lactam agents play a major role as initial therapy in both children and adults. This recommendation is consistent with those of Williams et al who reviewed 49 clinical trials involving 13,660 patients. These investigators recommended 7 to 14 days of penicillin or amoxicillin for acute maxillary sinusitis confirmed radiographically or by aspiration.38
The SAHP recommended higher doses of amoxicillin (with or without clavulanate) in patients who have recently taken an antibiotic or who have moderate disease. Fluoroquinolones are recommended as alternatives in patients with mild disease who have not taken an antibiotic in the last 4 to 6 weeks. However, in patients with mild disease who have taken antibiotics recently or who have moderate disease, fluoroquinolones are recommended as first-line therapy. Macrolides are recommended only for patients with a β-lactam allergy since failure rates of 20% to 25% are possible. Lack of improvement or worsening symptoms after 72 hours should prompt reevaluation, may necessitate cultures and/or a CT scan, and should raise the possibility of causal organisms other than S pneumoniae, H influenzae, and M catarrhalis.
TABLE 3
Initial empiric therapy in outpatients with acute bacterial rhinosinusitis
| Initial therapy | Alternative agent if no improvement or worsening after 72 hours | |
|---|---|---|
| Mild disease, no antibiotic during past 4 to 6 weeks | ||
| Children |
|
|
| Children with β-lactam allergy |
|
|
| Adults |
|
|
| Adults with β-lactam allergy |
|
|
| Mild disease and antibiotic during past 4 to 6 weeks or moderate disease | ||
| Children |
|
|
| Children with β-lactam allergy |
|
|
| Adults |
|
|
| Adults with β-lactam allergy |
|
|
| Adapted from Anon et al17 © 2004, with permission from American Academy of Otolaryngology-Head and Neck Surgery Foundation, Inc. | ||
Dose and duration
While each of the three guidelines provides detailed recommendations regarding selection of an antibacterial agent, the dose and duration of therapy generally are not well defined. Fortunately, other sources provide guidance in these 2 areas.
First, an independent international panel of infectious diseases experts, whose goal was to identify ways to improve prescription of antibiotics for lower respiratory tract infections, stressed that an important purpose of therapy is to reduce bacterial load and, in fact, treat to bacteriologic cure.19 Antibiotic therapy that allows some bacteria to survive increases the risk of early recurrence or relapse and encourages resistance selection. Such therapy is, therefore, inappropriate. The panel concurred with the WHO and others that the likelihood of bacterial persistence increases when antibiotics are prescribed in low doses, especially if given over long periods.18,39-41 Prolonged low-dose antibiotic therapy, which has been common practice for many infections, is contrary to the WHO Global Strategy for Containment of Antimicrobial Resistance, which notes that single-agent therapy for a short duration is 1 of several actions that can be taken to minimize bacterial resistance.42 Shorter courses of antibiotic therapy also are consistent with SHEA/IDSA recommendations.10
The clinical appropriateness of this recommendation is reinforced by the changes that have occurred during the past decade in the management of selected urinary tract infections (UTIs). Some UTIs that previously had been treated with low-dose antibiotics for 10 to 14 days now are treated with only 1 or a few high doses of a single agent. Other infections for which clinical data support shorter courses of antibiotic therapy include uncomplicated cellulitis,43 ventilator-associated pneumonia,44 and meningococcal disease.45
Shorter-course antibacterial therapy for CARTIs increasingly has been the focus of clinical trials. The focus is not unreasonable. Many of the antibiotics used for CARTIs are very potent against the pathogens commonly encountered, penetrate infected tissues well, are available in oral formulations, and are generally well tolerated. However, to optimize an antibiotic’s bactericidal potential, it is necessary to base the dosing regimen on its pharmacodynamics. From a pharmacodynamic perspective, there are 2 groups of antibiotics, those with concentration-dependent killing and those with time-dependent killing. For agents with concentration-dependent killing, such as fluoroquinolones, ketolides, and aminoglycosides, the goal is to select a dose that achieves a higher peak concentration and/or a larger area under the plasma concentration curve, with acceptable tolerability. In contrast, antibiotics that rely on time-dependent killing, such as β-lactams, macrolides, azalides, tetracyclines, and some others, require extended durations of concentrations above the MIC90 of the bacterial pathogen(s). Consequently, multiple daily dosing may be preferable.46
Dose. A few studies have compared high-dose, short-course therapy with therapy using standard doses and durations (TABLE 4). To assess the impact of highdose, short-course therapy on post-treatment resistant pneumococcal carriage, Schrag compared amoxicillin given either as 90 mg/kg/day for 5 days (high-dose, short-course) or 40 mg/kg/day for 10 days (standard) in 797 children with a respiratory tract infection.47 At day 28, nasal carriage of penicillin-resistant S pneumoniae was detected in 24% of the high-dose, shortcourse group and in 32% of the standard group (relative risk, 0.77; P=0.03). Among the pneumococcal carriers, the risk of penicillin-resistant S pneumoniae was significantly lower in the high-dose, short-course group than in the standard therapy group (relative risk, 0.78; P=0.01)
Another study investigated high-dose, short-course therapy with levofloxacin in patients with mild to severe community-acquired pneumonia. Patients received levofloxacin 750 mg/d for 5 days or 500 mg/d for 10 days.48 The clinical success rates were 92.4% and 91.1%, respectively, while the bacteriologic eradication rates at 7 to 14 days post-therapy were 93.2% and 92.4%, respectively, thereby demonstrating that high-dose, shortcourse levofloxacin therapy is at least as effective as standard levofloxacin therapy.
Duration. Short-course therapy using standard doses of azithromycin, gemifloxacin, levofloxacin, moxifloxacin, and telithromycin has been investigated in clinical trials of CARTIs (FIGURE). In patients with community-acquired pneumonia, 5 days of therapy with telithromycin was shown to be equivalent to a 7-day course (both using a single daily dose of 800 mg), as well as to clarithromycin 500 mg bid for 10 days.49
In studies of acute exacerbations of chronic bronchitis, a 3-day course of azithromycin was equivalent to clarithromycin for 10 days50 and gemifloxacin for 5 days was equivalent to a sequential combination of ceftriaxone and cefuroxime axetil for up to 10 days.51 Levofloxacin for 3 days and azithromycin for 5 days provided equivalent outcomes,52 as did levofloxacin for 5 days and amoxicillin/clavulanate for 10 days.52 Moxifloxacin for 5 days provided results equivalent to those of 7 days of amoxicillin, clarithromycin, or cefuroxime axetil.53 Five days of telithromycin was shown to be equivalent to 10 days of amoxicillin/clavu-lanate54 or cefuroxime axetil.55
Studies of acute bacterial rhinosinusitis have demonstrated equivalent results with azithromycin for 3 days and amoxicillin/clavulanate for 10 days.50 Similarly, telithromycin for 5 days was equivalent to 10 days of telithromycin, amoxicillin/clavulanate, or cefuroxime axetil.56
These clinical trials demonstrate that short-course therapy achieves clinical cure and/or bacteriologic eradication rates that are at least equivalent to those of standard therapy, with no significant difference in safety. Symptomatic improvement is faster and total antibiotic exposure is reduced with short-course therapy.
A significant advantage of short-course antibacterial therapy is improved patient adherence. Adherence is 10% to 20% better with 5-day courses than with 10-day courses,47,57 and is significantly better with 1 or 2 daily doses than with 3 or more daily doses.58-60 In fact, a recent market research study showed that patients perceive once-daily, short-course antibiotic treatment to be significantly more effective than longer courses. This may be due to faster improvement of infection-related symptoms.61 For example, Dunbar et al observed that significantly more patients treated with high-dose, short-course levofloxacin experienced subjective and objective resolution of fever by day 3 compared with those who received standard-dose, short-course levofloxacin.48
TABLE 4
Clinical trials of high-dose, short-course antibiotic therapy
| Drug regimen | N (ref) | Outcome |
|---|---|---|
| Amoxicillin 90 mg/kg/d x 5 d vs Amoxicillin 40 mg/kg/d x 10 d | 797 |
|
| (47) | ||
| Levofloxacin 750 mg/d x 5d vs Levofloxacin 500 mg/d x 10 d | 390 |
|
| (48) |
TABLE 5 Clinical trials of standard-dose, short-course antibiotic therapy
Summary
Essential questions that need to be answered for every patient who presents with a possible CARTI include : 1) Is antibacterial therapy necessary? 2) If so, what is the best antibiotic and at what dose and for how long should it be administered? Accumulating evidence indicates that some antibiotics when given in high doses for a short duration are as effective and safe as standard therapy for CARTIs. Short-course therapy also promotes patient compliance.
Disclosures:
The authors reported the following financial relationships: Dr Brunton: consultant to Abbott, Ortho-McNeil Pharmaceutical, Inc., and SanofiAventis. Dr Carmichael: consultant to Ortho-McNeil Pharmaceutical, Inc.; on the speakers’ bureaus for Bristol-Myers Squibb Company, Merck & Co., OrthoMcNeil Pharmaceutical, Inc., and Pfizer Inc. Dr Fitzgerald: on the speakers’ bureaus for Boehringer Ingelheim, GlaxoSmithKline, Ortho-McNeil Pharmaceutical, Inc., Pfizer Inc., Sepracor Inc., and 3M. Dr Liu: on the speakers’ bureaus for Aventis Pharmaceuticals, Bayer Pharmaceuticals Corporation, Bristol-Myers Squibb Company, Cobist, GlaxoSmithKline, Merck & Co., Ortho-McNeil Pharmaceutical, Inc., Pfizer Inc., Purdue Pharma, Oscient Pharmaceuticals Corporation, and Wyeth Pharmaceuticals. Dr Varon: on the speakers’ bureau for Ortho-McNeil Pharmaceutical, Inc. Dr. Weiland: consultant to Abbott Laboratories, Ortho-McNeil Pharmaceutical, Inc., and Pfizer Inc.
This supplement to The Journal of Family Practice is supported by a grant from Ortho-McNeil Pharmaceutical, Inc. It was adapted from a consensus conference coordinated by the Primary Care Education Consortium and Texas Academy of Family Physicians and was edited and peer-reviewed by The Journal of Family Practice. © 2005 Quadrant HealthCom Inc. and Primary Care Education Consortium.
1. Centers for Disease Control and Prevention. National Center for Health Statistics website. National Ambulatory Medical Care Survey: 2001 Summary. Available at: http://www.cdc.gov/nchs/data/ad/ad337.pdf. Accessed February 2, 2005.
2. World Health Organization.World Health Organization web site. World Health Organization Report on Infectious Diseases 2000. Overcoming antimicrobial resistance. Chapter 4. Big guns of resistance. Available at: http://www.who.int/infectious-disease-report/2000/. Accessed February 2, 2005.
3. Metlay JP, Fine MJ. Testing strategies in the initial management of patients with community-acquired pneumonia. Ann Intern Med. 2003;138:109-118.
4. File TM. Community-acquired pneumonia. Lancet. 2003;362:1991-2001.
5. Mandell LA, Bartlett JG, Dowell SF, File TM, Jr, Musher DM, Whitney C. Update of practice guidelines for the management of community-acquired pneumonia in immunocompetent adults. Clin Infect Dis. 2003;37:1405-1433.
6. Fine MJ, Auble TE, Yealy DM, et al. A prediction rule to identify low-risk patients with community-acquired pneumonia. N Engl J Med. 1997;336:243-250.
7. Anthonisen NR, Manfreda J, Warren CP, Hershfield ES, Harding GK, Nelson NA. Antibiotic therapy in exacerbations of chronic obstructive pulmonary disease. Ann Intern Med. 1987;106:196-204.
8. Balter MS, La Forge J, Low DE, Mandell L, Grossman RF. Canadian guidelines for the management of acute exacerbations of chronic bronchitis. Can Respir J. 2003;10(suppl B):3B-32B.
9. World Health Organization. World Health Organization web site. World Health Organization Report on Infectious Diseases 2000. Overcoming antimicrobial resistance. Chapter 5. A call to action: A massive effort to provide proper treatment. Available at: http://www.who.int/infectious-disease-report/2000/. Accessed February 2, 2005.
10. Shlaes DM, Gerding DN, John JF, Jr, et al. Society for Healthcare Epidemiology of America and Infectious Diseases Society of America Joint Committee on the Prevention of Antimicrobial Resistance: guidelines for the prevention of antimicrobial resistance in hospitals. Clin Infect Dis. 1997;25:584-599.
11. Scottish Intercollegiate Guidelines Network. National Guideline Clearinghouse website. Community management of lower respiratory tract infection in adults. A national clinical guideline. Available at: http://www.guideline.gov/summary/summary.aspx?ss=15& doc_id=3361&nbr=2587&string=respiratory%20AND%20tract%20AND% 20infection. Accessed December 17, 2004.
12. Bochud PY, Moser F, Erard P, et al. Community-acquired pneumonia. A prospective outpatient study. Medicine (Baltimore). 2001;80:75-87.
13. Falguera M, Sacristan O, Nogues A, et al. Nonsevere community-acquired pneumonia: correlation between cause and severity or comorbidity. Arch Intern Med. 2001;161:1866-1872.
14. Ruiz M, Ewig S, Marcos MA, et al. Etiology of community-acquired pneumonia: impact of age, comorbidity, and severity. Am J Respir Crit Care Med. 1999;160:397-405.
15. Sethi S. Infectious etiology of acute exacerbations of chronic bronchitis. Chest. 2000;117(5 Suppl 2):380S-385S.
16. Eller J, Ede A, Schaberg T, Niederman MS, Mauch H, Lode H. Infective exacerbations of chronic bronchitis: relation between bacteriologic etiology and lung function. Chest. 1998;113:1542-1548.
17. Anon JB, Jacobs MR, Poole MD, et al. Antimicrobial treatment guidelines for acute bacterial rhinosinusitis. Otolaryngol Head Neck Surg. 2004;130(1 Suppl):1-45.
18. Albrich WC, Monnet DL, Harbarth S. Antibiotic selection pressure and resistance in Streptococcus pneumoniae. and Streptococcus pyogenes. Emerg Infect Dis. 2004;10:514-517.
19. Ball P, Baquero F, Cars O, et al. Antibiotic therapy of community respiratory tract infections: strategies for optimal outcomes and minimized resistance emergence. J Antimicrob Chemother. 2002;49:31-40.
20. Harbarth S, Albrich W, Brun-Buisson C. Outpatient antibiotic use and prevalence of antibiotic-resistant pneumococci in France and Germany: a sociocultural perspective. Emerg Infect Dis. 2002;8:1460-1467.
21. Lonks JR, Garau J, Medeiros AA. Implications of antimicrobial resistance in the empirical treatment of community-acquired respiratory tract infections: the case of macrolides. J Antimicrob Chemother. 2002;50(Suppl S2):87-92.
22. Lonks JR, Garau J, Gomez L, et al. Failure of macrolide antibiotic treatment in patients with bacteremia due to erythromycin-resistant Streptococcus pneumoniae. Clin Infect Dis. 2002;35:556-564.
23. Moellering RC, Jr, Craig W, Edmond M, et al. Clinical and public health implications of macrolide-resistant Streptococcus pneumoniae. J Chemother. 2002;14(suppl 3):42-56.
24. Davidson R, Cavalcanti R, Brunton JL, et al. Resistance to levofloxacin and failure of treatment of pneumococcal pneumonia. N Engl J Med. 2002;346:747-750.
25. Musher DM, Dowell ME, Shortridge VD, et al. Emergence of macrolide resistance during treatment of pneumococcal pneumonia. N Engl J Med. 2002;346:630-631.
26. Waterer GW, Buckingham SC, Kessler LA, Quasney MW, Wunderink RG. Decreasing β-lactam resistance in Pneumococci. from the Memphis region: analysis of 2,152 isolates From 1996 to 2001. Chest. 2003;124:519-525.
27. Nuermberger E, Bishai WR. The clinical significance of macrolide-resistant Streptococcus pneumoniae.: it’s all relative. Clin Infect Dis. 2004;38:99-103.
28. Yu VL, Chiou CC, Feldman C, et al. An international prospective study of pneumococcal bacteremia: correlation with in vitro resistance, antibiotics administered, and clinical outcome. Clin Infect Dis. 2003;37:230-237.
29. Metlay JP. Update on community-acquired pneumonia: impact of antibiotic resistance on clinical outcomes. Curr Opin Infect Dis. 2002;15:163-167.
30. Centers for Disease Control and Prevention. Centers for Disease Control and Prevention web site. Drug-resistant Streptococcus pneumoniae disease. Available at: http://www.cdc.gov/ncidod/dbmd/diseaseinfo/drugresisstreppneum_t.htm. Accessed January 4, 2005.
31. World Health Organization World Health Organization web site. World Health Organization Report on Infectious Diseases 2000. Overcoming antimicrobial resistance. Chapter 3. Factors contributing to resistance. Available at: http://www.who.int/infectious-disease-report/2000/. Accessed February 2, 2005.
32. Jacobs MR, Felmingham D, Appelbaum PC, Gruneberg RN. The Alexander Project 1998-2000: susceptibility of pathogens isolated from communityacquired respiratory tract infection to commonly used antimicrobial agents. J Antimicrob Chemother. 2003;52:229-246.
33. Thornsberry C, Sahm DF, Kelly LJ, et al. Regional trends in antimicrobial resistance among clinical isolates of Streptococcus pneumoniae., Haemophilus influenzae., and Moraxella catarrhalis. in the United States: results from the TRUST Surveillance Program, 1999-2000. Clin Infect Dis. 2002;34(suppl 1):S4-S16.
34. Karlowsky JA, Thornsberry C, Jones ME, Evangelista AT, Critchley IA, Sahm DF. Factors associated with relative rates of antimicrobial resistance among Streptococcus pneumoniae. in the United States: results from the TRUST Surveillance Program (1998-2002). Clin Infect Dis. 2003;36:963-970.
35. Karlowsky JA, Kelly LJ, Thornsberry C, et al. Susceptibility to fluoroquinolones among commonly isolated Gram-negative bacilli in 2000: TRUST and TSN data for the United States. Tracking Resistance in the United States Today. The Surveillance Network. Int J Antimicrob Agents. 2002;19:21-31.
36. Karlowsky JA, Thornsberry C, Critchley IA, et al. Susceptibilities to levofloxacin in Streptococcus pneumoniae., Haemophilus influenzae., and Moraxella catarrhalis. clinical isolates from children: results from 2000-2001 and 2001-2002 TRUST studies in the United States. Antimicrob Agents Chemother. 2003;47:1790-1797.
37. Quale J, Landman D, Ravishankar J, Flores C, Bratu S. Streptococcus pneumo.-niae., Brooklyn, New York: fluoroquinolone resistance at our doorstep. Emerg Infect Dis. 2002;8:594-597.
38. Williams JW, Jr, Aguilar C, Cornell J, et al. Antibiotics for acute maxillary sinusitis. Cochrane Database Syst Rev. 2004;2:CD000243.-
39. Guillemot D, Carbon C, Balkau B, et al. Low dosage and long treatment duration of β-lactam: risk factors for carriage of penicillin-resistant Streptococcus pneumoniae. JAMA. 1998;279:365-370.
40. Scheld WM. Maintaining fluoroquinolone class efficacy: review of influencing factors. Emerg Infect Dis. 2003;9:1-9.
41. Thomson KS. Minimizing quinolone resistance: are the new agents more or less likely to cause resistance? J Antimicrob Chemother. 2000;45:719-723.
42. World Health Organization. World Health Organization web site. WHO global strategy for containment of antimicrobial resistance. Available at: http://www.who.int/csr/resources/publications/drugresist/en/EGlobal_Strat.pdf. Accessed February 2, 2005.
43. Hepburn MJ, Dooley DP, Skidmore PJ, Ellis MW, Starnes WF, Hasewinkle WC. Comparison of short-course (5 days) and standard (10 days) treatment for uncomplicated cellulitis. Arch Intern Med. 2004;164:1669-1674.
44. Chastre J, Wolff M, Fagon JY, et al. Comparison of 8 vs 15 days of antibiotic therapy for ventilator-associated pneumonia in adults: a randomized trial. JAMA. 2003;290:2588-2598.
45. Ellis-Pegler R, Galler L, Roberts S, Thomas M, Woodhouse A. Three days of intravenous benzyl penicillin treatment of meningococcal disease in adults. Clin Infect Dis. 2003;37:658-662.
46. Craig WA. Basic pharmacodynamics of antibacterials with clinical applications to the use of β-lactams, glycopeptides, and linezolid. Infect Dis Clin North Am. 2003;17:479-501.
47. Schrag SJ, Pena C, Fernandez J, et al. Effect of short-course, high-dose amoxicillin therapy on resistant pneumococcal carriage: a randomized trial. JAMA. 2001;286:49-56.
48. Dunbar LM, Wunderink RG, Habib MP, et al. High-dose, short-course levofloxacin for community-acquired pneumonia: a new treatment paradigm. Clin Infect Dis. 2003;37:752-760.
49. Tellier G, Niederman MS, Nusrat R, Patel M, Lavin B. Clinical and bacteriological efficacy and safety of 5 and 7 day regimens of telithromycin once daily compared with a 10 day regimen of clarithromycin twice daily in patients with mild to moderate community-acquired pneumonia. J Antimicrob Chemother. 2004;54:515-523.
50. Zithromax [prescribing information] New York, NY: Pfizer Labs; 2004.
51. Wilson R, Langan C, Ball P, Bateman K, Pypstra R. Oral gemifloxacin once daily for 5 days compared with sequential therapy with i.v. ceftriaxone/oral cefuroxime (maximum of 10 days) in the treatment of hospitalized patients with acute exacerbations of chronic bronchitis. Respir Med. 2003;97:242-249.
52. Tennenberg A, Walker K, Khashab M, Zadelkis N. The safety and efficacy of short-course (3-5 days), 750 mg levofloxacin (LVX) for acute bacterial exacerbation of chronic bronchitis (ABECB). Presented at: American Thoracic Society 100th International Conference, May 21-26, 2004, Orlando, Fl.
53. Wilson R, Allegra L, Huchon G, et al. Short-term and long-term outcomes of moxifloxacin compared to standard antibiotic treatment in acute exacerbations of chronic bronchitis. Chest. 2004;125:953-964.
54. Aubier M, Aldons PM, Leak A, et al. Telithromycin is as effective as amoxicillin/clavulanate in acute exacerbations of chronic bronchitis. Respir Med. 2002;96:862-871.
55. Zervos MJ, Heyder AM, Leroy B. Oral telithromycin 800 mg once daily for 5 days versus cefuroxime axetil 500 mg twice daily for 10 days in adults with acute exacerbations of chronic bronchitis. J Int Med Res. 2003;31:157-169.
56. Ketek [prescribing information]. Kansas City, Mo: Aventis Pharmaceuticals Inc.; 2004.
57. Carbon C, Chatelin A, Bingen E, et al. A double-blind randomized trial comparing the efficacy and safety of a 5-day course of cefotiam hexetil with that of a 10-day course of penicillin V in adult patients with pharyngitis caused by group A β-haemolytic streptococci. J Antimicrob Chemother 1995;35:843-854.
58. Cockburn J, Gibberd RW, Reid AL, Sanson-Fisher RW. Determinants of noncompliance with short term antibiotic regimens. Br Med J (Clin Res Ed). 1987;295:814-818.
59. Greenberg RN. Overview of patient compliance with medication dosing: a literature review. Clin Ther. 1984;6:592-599.
60. Claxton AJ, Cramer J, Pierce C. A systematic review of the associations between dose regimens and medication compliance. Clin Ther. 2001;23:1296-1310.
61. Perez-Gorricho B, Ripoll M. Does short-course antibiotic therapy better meet patient expectations? Int J Antimicrob Agents. 2003;21:222-228.
Preterm labor: Diagnostic and therapeutic options are not all alike
- Consider progesterone to reduce the risk of recurrent preterm delivery (A).
- Consider calcium channel blockers (CCBs) as initial therapy for preterm labor; though these are Class C agents in pregnancy, CCBs are at least as effective as other agents and cause no known fetal or neonatal side effects (A).
- Consider tocolytic therapy for preterm labor, to prolong pregnancy for 2 to 7 days and thereby permit administration of antenatal corticosteroids and transfer to a tertiary center, if needed (A). Maintenance and recurrent use of tocolytics has not proven beneficial and should be avoided (A).
Despite diagnostic and therapeutic advances in premature labor, the rate of preterm delivery has increased in the United States. Preterm delivery, defined as birth before 37 weeks gestation, occurs in about 12% of pregnancies,1 and it is the leading cause of mortality among non-anomalous fetuses.2 Among premature newborns who survive, 10% to 15% have significant handicaps.3 Long-term sequelae include visual or hearing impairment, chronic lung disease, developmental delay, and cerebral palsy.4 The annual cost of premature birth in the United States exceeds $5 billion, and the rate of preterm delivery has increased in recent years.5,6 Specific maternal attributes increase risk of preterm delivery, though these factors need not be present for premature delivery to occur.
Standard techniques of physical diagnosis may not accurately detect preterm labor, either missing the diagnosis or prompting unnecessary hospitalization and treatment. Select imaging studies can more reliably indicate a true need for intervention.
This article reviews the risk factors for preterm birth, the tests available to accurately diagnose preterm labor, and the medications available to prevent or postpone premature delivery.
Risk factors
Preterm delivery is categorized as spontaneous or indicated. Almost 75% of preterm births occur after spontaneous preterm labor or preterm premature rupture of the membranes (PPROM). The remaining 25% of early births are elective due to conditions potentially harmful to either the mother or the fetus.7
Maternal risk factors for spontaneous preterm births are listed in Table 1.7-13 The risk factors for preterm labor and PPROM are similar, with the exception that those whose membranes rupture prematurely are more likely to be indigent, to smoke cigarettes, and to have bleeding in the current pregnancy.
Not all preterm births carry the same risks. Early preterm birth—delivery before 32 weeks— is associated with clinical or subclinical infection, short cervical length, and the presence of fetal fibronectin in the cervicovaginal secretions. It tends to recur and leads to long-term fetal morbidity. Late preterm birth—delivery after 32 weeks but before 37 weeks—is associated with increased uterine contractions, tends to mimic normal labor, and is less likely to cause peripartum morbidity.7 Despite these known risk factors, women can experience preterm labor without exhibiting any of them.
TABLE 1
Maternal risk factors for spontaneous preterm birth
| Risk factor | Odds ratio |
|---|---|
| Bacterial vaginosis at <16 weeks | 7 |
| Periodontal infection | 4 |
| Prior preterm birth | 4 |
| Prepregnancy BMI <20 | 3 |
| Interpregnancy interval <6 mo | 2 |
| Bleeding in 2nd trimester | 2 |
| African-American race | 2 |
| Psychiatric disorder | 1.6 |
| Cigarette smoking | 1.5 |
| Gestational diabetes | 1.2 |
| Sources: Iams 20027 ; Leitich et al 20038 ; Jeffcoat et al 20019 ; Moutquin 200310 ; Smith et al 200311 ; Kelly et al 200212 ; Hedderson et al 2003.13 | |
Increasing the accuracy of diagnosis
Uterine contractions before 37 weeks and concomitant change in cervical dilation or effacement as detected by digital examination comprise the standard definition of preterm labor.
Caveats with clinical evaluation
The problem with the definition above is that women may not perceive contractions, and that contractions are at times difficult to differentiate from benign Braxton-Hicks contractions of normal pregnancy. Moreover, digital assessment of the cervix lacks reproducibility when the dilation is <3 cm or effacement is < 80%.7 Clinical evaluation alone can easily suggest prematurity when it is absent and miss it when it is present.7
Imaging and lab evaluation more telling
The ability to diagnose preterm labor improves with the use of transvaginal cervical sonography or measurement of fetal fibronectin.
Lesser cervical length means greater risk. Likelihood of preterm delivery is inversely proportional to cervical length measured at 18 to 28 weeks. A length of ≤2.5 cm is the threshold for abnormal condition (level of evidence [LOE]: 2).6
Fibronectin detected late may mean delivery early. Fibronectin, an extracellular glycoprotein described as the glue that attaches the fetal membrane to the underlying uterine decidua, is normally absent in cervicovaginal secretions between weeks 22 and 37 of pregnancy. Its presence (50 ng/mL) between 22 to 24 weeks is a predictor of spontaneous preterm birth; its absence makes premature delivery unlikely (LOE: 2).
Imaging and test results justify management decisions. The predictive accuracies of abnormal cervical length and of the presence of fibronectin are depicted in the Figure .7 The major benefit of these two tests is when they are normal (cervical length >2.5 cm or negative fetal fibronectin), unnecessary intervention is avoided.14 If, for example, a patient is having contractions and the cervical length is greater than 2.5 cm, or fetal fibronectin is absent, tocolytics can be discontinued and hospitalization avoided.
FIGURE
Value of transvaginal cervical imaging and fetal fibronectin measurement in predicting spontaneous preterm birth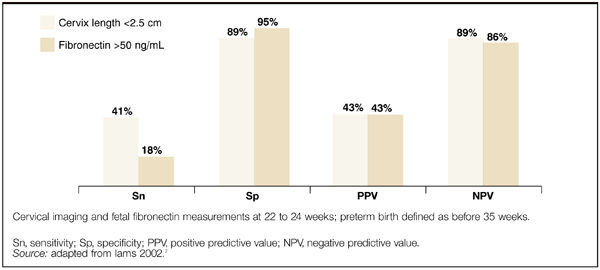
Preventing preterm labor
Progestational agents
Many authors have advocated the use of progestational agents to inhibit premature labor. Progesterone’s presumed mechanisms are inhibition of the oxytocin effect of prostaglandin F2a and stimulation of α-adrenergic receptors, thereby increasing the α-adrenergic tocolytic response.15,16 Natural progesterone appears to be free of any untoward teratogenic, metabolic, or hemodynamic effects.17
Studies favoring progesterone. Two double-blind, placebo-controlled studies assessed the use of 17 α-hydroxyprogesterone caproate in preventing premature labor in high-risk populations. These patients had histories of preterm deliveries or spontaneous abortions.
Weekly intramuscular (IM) injections of 250 mg were started at 12 to 16 weeks gestation and given until 37 weeks or delivery, whichever came first. In both studies, the rate of premature deliveries was significantly lower in the treated group than the control group (number needed to treat [NNT]=2.4 and 4.6). In addition, neither mothers nor infants experienced adverse effects attributable to 17 α-hydroxyprogesterone caproate (LOE: 2).18,19 However, these studies were small—43 and 79 patients.
A large double-blind, placebo-controlled, randomized study established the effectiveness of 17 α-hydroxyprogesterone caproate in preventing preterm delivery.23 Four hundred fifty-nine pregnant women with a history of preterm delivery were randomized to receive weekly injections of 17 α-hydroxyprogesterone caproate 250 mg or placebo beginning at 16 to 20 weeks gestation and continuing to 36 weeks. Significantly fewer women in the treated group than the control group gave birth before 37 weeks, 36.3% v 54.9%, respectively (NNT=6; LOE: 1). Perhaps more importantly, treatment resulted in significant reductions in birth weight <2500 g (NNT=7), necrotizing enterocolitis (NNT=38), need for supplemental oxygen (NNT=11), and intraventricular hemorrhage (NNT=26). Swelling, bruising, or rash at the injection site were the most common adverse effects of 17 α-hydroxyprogesterone caproate administration.
Vaginal progesterone suppositories have also been shown to decrease the rate of preterm birth in patients at increased risk.17 da Fonseca et al noted that among 142 women who had 1 prior preterm birth, prophylactic cerclage, or uterine malformation, daily use of a 100-mg vaginal progesterone suppository compared with placebo significantly decreased the likelihood of delivery prior to 37 weeks, 14% v 28% (NNT=7; LOE: 1). Adverse effects of progesterone suppositories were not mentioned.
Studies lacking clear benefit. Another investigator enrolled 168 active-duty military women into a randomized double-blind study that evaluated weekly IM injections of 1000 mg 17 α-hydroxyprogesterone caproate or placebo beginning between 16 and 20 weeks gestation.20 The study population was chosen based on a report that active-duty pregnant military personnel had an increased number of pregnancy complications including low birth-weight infants and increased premature delivery.21 In contrast to the previous studies, no significant difference in premature labor or perinatal mortality was seen between the 2 groups (LOE: 2). Perhaps although active-duty personnel are at a higher risk for preterm labor, the risk is not as high as it is with previous preterm birth, prior spontaneous abortion, and so forth.
An additional small study of 77 women with twin pregnancies investigated the use of 17 α-hydroxyprogesterone caproate to prevent preterm delivery.22 Patients were randomized to receive weekly injections of 17 α-hydroxyprogesterone caproate 250 mg or placebo from the 28th gestational week until the 37th week or delivery. The mean duration of pregnancy did not differ between the two groups of women, nor did perinatal mortality (LOE: 2).
Evidence generally supports use of progesterone. Based on available data, consider administering progesterone to women at high risk for preterm delivery to prevent recurrent preterm birth (SOR: A). These data are summarized in Table 2 .
Hydroxyprogesterone caproate in oil is commercially available in the United States in 125 mg/mL and 250 mg/mL strengths. It is not, however, approved by the Food and Drug Administration (FDA) for the prevention of preterm labor.
Progesterone suppositories are also not FDA approved, and they are commercially unavailable in the US. Therefore, they have to be extemporaneously compounded.
TABLE 2
Evidence generally supports progesterone in prevention of preterm labor
| Study | Treatment | Comment | NNT | LOE |
|---|---|---|---|---|
| Johnson18 | Weekly IM 250 mg injections of 17 α-hydroxyprogesterone caproate | Decreased preterm delivery | 2.4 | 2 |
| Yemeni19 | Weekly IM 250 mg injections of 17 α-hydroxyprogesterone caproate | Decreased preterm delivery | 4.6 | 2 |
| Hauth20 | Weekly IM 1000 mg injections of 17 α-hydroxyprogesterone caproate | Did not decrease preterm delivery | N/A | 2 |
| Hartikainen-Sorri22 | Weekly IM 250 mg injections of 17 α-hydroxyprogesterone caproate | Did not decrease preterm delivery | N/A | 2 |
| Meis23 | Weekly IM 250 mg injections of 17 α-hydroxyprogesterone caproate | Decreased preterm Delivery | 6 | 1 |
| da Fonseca17 | Daily 100 mg progesterone vaginal suppositories | Decreased preterm delivery | 7 | 1 |
| NNT, number needed to treat; LOE, level of evidence; IM, intramuscular; N/A, not applicable. | ||||
Treating bacterial vaginosis may not prevent preterm labor
Bacterial vaginosis (BV) during pregnancy has been associated with preterm birth, and antibiotics have been thought perhaps to reduce this risk. A systematic review of 10 trials including 4249 pregnant women with BV showed that, although antibiotics eradicated BV, they did not significantly reduce the risk of birth before 32, 34, or 37 weeks (LOE: 1).24 This was true even for women with a history of preterm delivery. However, antibiotics did decrease the risk of PPROM. The authors concluded that evidence does not support screening all pregnant women for asymptomatic BV to prevent preterm birth.
Treating asymptomatic bacteriuria may prevent preterm labor
Asymptomatic bacteriuria in pregnant women has also been associated with preterm birth. One review of 14 trials comparing antibiotic treatment with placebo in this patient population—though not of high quality—demonstrated decreased incidences of pyelonephritis and preterm birth or low birth weight (LOE: 1).25
Treating preterm labor
The primary goal of using tocolytics in preterm labor is to prolong pregnancy for 2 to 7 days, permitting administration of corticosteroids and transfer to a tertiary care center when necessary. Recommendations for the treatment of preterm labor are summarized in Table 3 .
TABLE 3
Evaluation of proposed treatments for preterm labor
| Treatment | Comment | NNT | LOE | References |
|---|---|---|---|---|
| Calcium channel blockers | Reduce preterm delivery, decrease neonatal morbidity, well-tolerated | 11 | 1 | 26, 27 |
| Beta-agonists | Prolong pregnancy but no beneficial effect on neonatal morbidity; maternal side effects often lead to discontinuation | N/A | 1 | 33, 34 |
| Magnesium sulfate | Does not prolong pregnancy; maternal side effects often lead to discontinuation | N/A | 1 | 33, 40 |
| Prostaglandin inhibitors | Prolong pregnancy but no beneficial effect on neonatal morbidity; increase risk of postpartum hemorrhage | N/A | 1 | 33 |
| 2 | 43 | |||
| Antibiotics | No evidence to support use | N/A | 1 | 44 |
| Corticosteroids | Strongly recommended; decrease neonatal morbidity, well-tolerated | U | 1 | 46 |
| NNT, number needed to treat; LOE, level of evidence; N/A, not applicable; U, unavailable data. | ||||
Calcium channel blockers safe, effective
Calcium channel blockers (CCBs) are nonspecific smooth muscle relaxants. They prevent the influx of extracellular calcium ions into the myometrial cell, thereby exerting their tocolytic effect. Nifedipine is the most widely studied CCB in the management of preterm labor.
A systematic review of 12 randomized controlled trials including 1029 women demonstrated that CCBs significantly reduced the rate of preterm delivery within 7 days of the start of treatment and before 34 weeks gestation (LOE: 1).26 Compared with betamimetics, CCBs caused fewer maternal adverse effects, and decreased the frequency of neonatal respiratory distress syndrome, necrotizing enterocolitis, intraventricular hemorrhage, and jaundice. The authors concluded that CCBs are preferable to betamimetics for tocolysis.
Calcium channel blockers have also been compared with magnesium. Eighty women at 20 to 34 weeks gestation with documented cervical change were randomized to receive nifedipine or magnesium.27 No difference in tocolytic efficacy was observed between the treatments, but there were significantly fewer maternal side effects among the nifedipine-treated patients (LOE: 2).
CCBs appear not to adversely affect the human fetus.28,29 There was no significant increase in congenital anomalies among 586 mothers who had been exposed to CCBs compared with 907 controls: 2.6% vs 2.4%, respectively (LOE: 2).30 CCBs are effective at reducing the rate of preterm delivery, decreasing neonatal morbidity and mortality, and are well tolerated by both mother and baby. Although some other tocolytics (such as beta-agonists and prostaglandin inhibitors) prolong pregnancy, they have not demonstrated a beneficial effect on neonatal morbidity.
Dosing recommendations for nifedipine are a 30 mg loading dose, followed by 10 to 20 mg every 4 to 6 hours.31 Maternal side effects may include flushing, headache, nausea, dizziness, and transient hypotension. Neonatal side effects have not been documented. Nifedipine should not be used in conjunction with magnesium sulfate because the combination has resulted in cardiac collapse (LOE: 3).32
Beta-agonists marginally useful
Beta-agonists increase cyclic AMP, thereby causing smooth muscle relaxation. Betamimetics are widely used as tocolytic agents. Although they have been shown to prolong pregnancy by 24 to 48 hours, they have not decreased adverse perinatal or neonatal outcomes (LOE: 1).33,34 In addition, they have been associated with maternal side effects of palpitations, arrhythmias, nausea, tremor, chorioamnionitis, hyperglycemia, hypokalemia, and pulmonary edema. The risk of pulmonary edema increases if beta-agonists are used with magnesium sulfate.33,35 Fetal and neonatal side effects may include tachycardia, hyperinsulinemia, and hyperglycemia.14,35
Terbutaline is the preferred beta-agonist for preterm labor due to low cost and multiple dose forms. It may be administered subcutaneously, 0.25 mg every 30 minutes up to 1 mg in 4 hours, or by intravenous infusion, 2.5 to 10 μg per minute up to an effective maximum dose of no more than 30 μg per minute. Once stabilized, the patient is often maintained on oral terbutaline, 2.5 to 5 μg by mouth every 4 to 6 hours until term. This practice, however, has not been shown to significantly prolong pregnancy (LOE: 1).36
The major benefit of terbutaline may be in the management of preterm uterine contractions without cervical changes. Among patients with premature contractions at 20 to 34 weeks, who were randomized to hydration or observation or a single subcutaneous dose of 0.25 mg of terbutaline, the shortest length of stay in triage was for the women who received the terbutaline (LOE: 1).37
Magnesium sulfate: No good rationale for use
Magnesium sulfate in the management of preterm labor is controversial. Although widely used in North America, it is generally avoided in Europe, Australia, and the United Kingdom38,39 due to the absence of clear evidence showing efficacy in the face of its adverse effect profile. Data from systematic reviews indicate it does not delay or prevent preterm birth (LOE: 1).33,40 In addition, maternal side effects may require discontinuation of treatment. Side effects include flushing, nausea, headache, ileus, and hypocalcemia. Pulmonary edema is a serious maternal side effect and is increased when magnesium is co-administered with other tocolytic agents. Cardiac arrest is rare.14,33 Not only does evidence suggest magnesium sulfate does not delay or prevent preterm birth, but one study suggests its use may increase infant mortality (LOE: 2).41
In one trial of 1062 women, magnesium sulfate or placebo was given at 30 weeks’ gestation. Two years following birth, children of mothers who received magnesium sulfate exhibited less gross motor dysfunction than those born to mothers who received placebo, 18% vs 34% respectively (LOE: 1).42 However, the rate of pediatric mortality and cerebral palsy, the primary endpoints of the study, did not differ between the groups. Further studies are necessary before magnesium sulfate can be recommended for neuroprotection.
Prostaglandin inhibitors may be preferred for hydramnios
Indomethacin is the prostaglandin synthetase inhibitor most studied in preterm labor, though the numbers of patients in these studies was generally small.33 Indomethacin reduced the rate of preterm delivery within 7 days of treatment and before 37 weeks gestation. However, it did not decrease the rate of neonatal morbidity. Importantly, indomethacin was associated with an increased risk of postpartum hemorrhage (LOE: 1).33 A retrospective review demonstrated an increase in incidence and severity of postnatal patent ductus arteriosus in neonates whose mothers were treated with indomethacin (LOE: 2).43 Most prospective studies, however, have not found this complication. Prostaglandin inhibitors may be the preferred choice of tocolytics if hydramnios is suspected in conjunction with preterm labor.
Antibiotics: one indication only
It is hypothesized that women who experience preterm labor have infections of the upper genital tract, and that infection or inflammation leads to contractions. A meta-analysis of 11 randomized trials with 7428 women in preterm labor and intact membranes demonstrated that, although prophylactic antibiotics decreased the incidence of maternal infection, there was no benefit in neonatal outcomes (LOE: 1).44 Although it did not reach statistical significance, there was a trend towards an increase in neonatal deaths in the antibiotic group, raising concerns about their use. Therefore, administration of prophylactic antibiotics in this patient population is not recommended. Conversely, antibiotic prophylaxis is recommended for all women colonized with group B streptococcus, unless a cesarean delivery is planned, to prevent perinatal disease.45
Corticosteroids beneficial for preterm infants
Antenatal corticosteroids reduce mortality, incidence and severity of respiratory distress syndrome, and intraventricular hemorrhage in preterm infants (LOE: 1).46 Women at risk for preterm delivery between 24 and 34 weeks of gestation should be given betamethasone 12 mg IM, two doses 24 hours apart, or dexamethasone 6 mg IM, two doses 12 hours apart. There are no significant maternal or neonatal adverse effects with these regimens. Administration of tocolytic drugs may be necessary to prolong gestation and provide time for steroids to act.
Corresponding author
Adrienne Z. Ables, PharmD, Spartanburg Family Medicine Residency Program, 853 N Church St Suite 510, Spartanburg, SC 29303. E-mail: [email protected].
1. Ventura SJ, Martin JA, Curtin SC, Menacker F, Hamilton BE. Births: final data for 1999. Natl Vital Stat Rep 2001;49:1-100.
2. Rush RW, Davey DA, Segal ML. The effect of preterm delivery on perinatal mortality. Br J Obstet Gynaecol 1978;85:806-811.
3. Ehrenhaft PM, Wagner JL, Herdman RC. Changing prognosis for very low birth weight infants. Obstet Gynecol 1989;74:528.-
4. Hack M, Taylor HG, Klein N, Eiben R, Schatschneider C, Mercuri-Munich N. School-age outcomes in children with birth weight under 750 g. N Engl J Med 1994;331:753-759.
5. Rogowski JA. The economics of preterm delivery. Prenat Neonat Med 1998;3:16-20.
6. Iams JD, Goldenberg RL, Meis PJ, et al. The length of the cervix and the risk of spontaneous premature delivery. N Engl J Med 1996;334:567-572.
7. Iams JD. Preterm birth. In: Gabbe SG, Niebyl JR, Simpson JL, eds. Obstetrics: Normal and Problem Pregnancies 4th ed. New York, NY: Churchill Livingstone; 2002.
8. Leitich H, Bodner-Adler B, Brunbauer M, Egarter C, Husslei P. Bacterial vaginosis as a risk factor for preterm delivery: A meta-analysis. Am J Obstet Gynecol 2003;189:139-147.
9. Jeffcoat MK, Geurs NC, Reddy MS, Cliver SP, Goldenberg RL, Hauth JC. Periodontal infection and preterm birth: Results of prospective study. J Am Dent Assoc. 2001;132:875-880.
10. Moutquin JM. Socio-economic and psychosocial factors in the management and prevention of preterm labour. Br J Obstet Gynaecol 2003;110:56-60.
11. Smith GC, Pell JP, Dobbie R. Interpregnancy interval and risk of preterm birth and neonatal death: Retrospective cohort study. BMJ 2003;327:313-319.
12. Kelly RH, Russo J, Holt VL, Danielsen BH, Zatzick DF, Walker E, Kato W. Psychiatric and substance use disorders as risk factors for low birth weight and preterm delivery. Obstet Gynecol 2002;100:297-304.
13. Hedderson MM, Ferrara A, Sacks DA. Gestational diabetes mellitus and lesser degrees of pregnancy hyperglycemia: Association with increased risk of spontaneous preterm birth. Obstet Gynecol 2003;102:850-856.
14. American College of Obstetricians and Gynecologists Management of preterm labor. ACOG practical bulletin no. 43. Washington, DC: ACOG, 2003.
15. Lockwood CJ, Senyei AE, Dischie MR, et al. Fetal fibronectin in cervical and vaginal secretions as a predictor of preterm delivery. N Engl J Med 1991;325:669-674.
16. Fuchs AR, Fuchs R. Endocrinology of human parturition: a review. Br J Obstet Gynaecol 1984;91:948-67.
17. da Fonseca EB, Bittar R, Carvalho MHB, et al. Prophylactic administration of progesterone by vaginal suppository to reduce the incidence of spontaneous preterm birth in women at increased risk: A randomized placebo-controlled double blind study. Am J Obstet Gynecol 2003;188:419-424.
18. Johnson JW, Austin KL, Jones GS, et al. Efficacy of 17 a-hydroxyprogesterone caproate in the prevention of premature labor. N Engl J Med 1975;293:675-689.
19. Yemeni M, Borenstein R, Dreazen E, et al. Prevention of premature labor by 17 a-hydroxyprogesterone caproate. Am J Obstet Gynecol 1985;151:574-577.
20. Hauth JC, Gilstrap LC, Brekken AL, et al. The effect of 17 a-hydroxyprogesterone caproate on pregnancy outcome in an active-duty military population. Am J Obstet Gynecol 1983;146:187-190.
21. Fox ME, Harris RE, Brekken AL. The active duty military pregnancy: a new high-risk category. Am J Obstet Gynecol 1977;129:705-707.
22. Hartikainen-Sorri AL, Kauppila A, Tuimala R. Inefficacy of 17 a-hydroxyprogesterone caproate in the prevention of prematurity in twin pregnancy. Obstet Gynecol 1980;56:692-695.
23. Meis PJ. 17 Alpha hydroxyprogesterone caproate prevents recurrent preterm birth. N Engl J Med 2003;348:2379-2385.
24. McDonald H, Brocklehurst P, Parsons J, Vigneswaran R. Antibiotics for treating bacterial vaginosis in pregnancy (Cochrane Review).In: The Cochrane Library, Issue 2, 2004. Chichester, UK: John Wiley & Sons, Ltd.
25. Smaill F. Antibiotics for asymptomatic bacteriuria in pregnancy (Cochrane Review).In: The Cochrane Library, Issue 2, 2004. Chichester, UK: John Wiley & Sons, Ltd.
26. King JF, Flenady VJ, Papatsonis DNM, et al. Calcium channel blockers for inhibiting preterm labour (Cochrane Review).In: The Cochrane Library, Issue 3, 2003. Oxford: Update Software.
27. Glock, JL, Morales WJ. Efficacy and safety of nifedipine versus magnesium sulfate in the management of preterm labor: a randomized study. Am J Obstet Gynecol 1993;169:960-964.
28. Sorensen HT, Steffensen FH, Olesen C, et al. Pregnancy outcome in women exposed to calcium channel blockers. Reprod Toxicol 1998;12:383-384.
29. Magee LA, Schick B, Donnefeld AE, et al. The safety of calcium channel blockers in human pregnancy: a prospective, multicenter cohort study. Am J Obstet Gynecol 1996;174:823-828.
30. Sorensen HT, Czeizel AE, Rockenbauer M, et al. The risk of limb deficiencies and other congenital abnormalities in children exposed in utero to calcium channel blockers. Acta Obstet Gynecol Scand 2001;80:397-401.
31. Hearne AE, Nagey DA. Therapeutic agents in preterm labor: tocolytic agents. Clin Obstet Gynecol 2000;43:787-801.
32. Ben-Ami M, Giladi Y, Shalev E. The combination of magnesium sulphate and nifedipine: a cause of neuromuscular blockade. Br J Obstet Gynaecol 1994;101:262-263.
33. Gyetvai K, Hannah M E, Hodnett E D, et al. Tocolytics for preterm labor: a systematic review. Obstet Gynecol 1999;94:869-877.
34. King JF, Grant A, Keirse MJNC, et al. Beta-mimetics in preterm labor: an overview of the randomized controlled trials. Br J Obstet Gynaecol 1988;95:211-222.
35. Jeyabalan A, Caritis SN. Pharmacologic inhibition of preterm labor. Clin Obstset Gynecol 2002;45:99-113.
36. Macones GA, Berlin M, Berlin J. Efficacy of oral beta-ago-nist maintenance therapy in preterm labor: a meta-analysis. Obstet Gynecol 1995;85:313-317.
37. Guinn DA, Goepfert AR, Owen J, Brumfield C, Hauth JC. Management options in women with preterm uterine contractions: A randomized clinical trial. Am J Obstet Gynecol 1997;177:814-818.
38. Norwitz ER, Robinson JN, Challis JRG. The control of labor. N Engl J Med 1999;341:660-666.
39. Bennett P, Edwards D. Use of magnesium sulphate in obstetrics. Lancet 1997;350:1491.-
40. Crowther CA, Hiller JE, Doyle LW. Magnesium sulphate for preventing preterm birth in threatened preterm labour (Cochrane Review).In: The Cochrane Library, Issue 3, 2003. Oxford: Update Software.
41. Mittendorf R, Covert R, Boman J, et al. Is tocolytic magnesium sulfate associated with increased total paediatric mortality? Lancet 1997;350:1517-1518.
42. Crowther CA, Hiller JE, Haslam RR. Effect of magnesium sulfate given for neuroprotection before preterm birth. A randomized controlled trial. JAMA 2003;290:2669-2676.
43. Hammerman C, Glaser J, Kaplan M, et al. Indomethacin tocolysis increases postnatal patent ductus arteriosus severity. Pediatrics 1998;102:E56.-
44. King J, Flenady V. Prophylactic antibiotics for inhibiting preterm labour with intact membranes (Cochrane Review).In: The Cochrane Library, Issue 3, 2003. Oxford: Update Software.
45. Schrag S, Gorwitz R, Fultz-Butts K, Schuchat A. Prevention of perinatal group B streptococcal disease. Revised guidelines from CDC. MMWR Recomm Rep 2002;51(RR-11):1-22.Available at:www.cdc.gov/mmwr/PDF/RR/RR5111.pdf. Accessed January 21, 2005.
46. Crowley P. Prophylactic corticosteroids for preterm birth (Cochrane Review).In: The Cochrane Library, Issue 4, 2003. Oxford: Update Software.
- Consider progesterone to reduce the risk of recurrent preterm delivery (A).
- Consider calcium channel blockers (CCBs) as initial therapy for preterm labor; though these are Class C agents in pregnancy, CCBs are at least as effective as other agents and cause no known fetal or neonatal side effects (A).
- Consider tocolytic therapy for preterm labor, to prolong pregnancy for 2 to 7 days and thereby permit administration of antenatal corticosteroids and transfer to a tertiary center, if needed (A). Maintenance and recurrent use of tocolytics has not proven beneficial and should be avoided (A).
Despite diagnostic and therapeutic advances in premature labor, the rate of preterm delivery has increased in the United States. Preterm delivery, defined as birth before 37 weeks gestation, occurs in about 12% of pregnancies,1 and it is the leading cause of mortality among non-anomalous fetuses.2 Among premature newborns who survive, 10% to 15% have significant handicaps.3 Long-term sequelae include visual or hearing impairment, chronic lung disease, developmental delay, and cerebral palsy.4 The annual cost of premature birth in the United States exceeds $5 billion, and the rate of preterm delivery has increased in recent years.5,6 Specific maternal attributes increase risk of preterm delivery, though these factors need not be present for premature delivery to occur.
Standard techniques of physical diagnosis may not accurately detect preterm labor, either missing the diagnosis or prompting unnecessary hospitalization and treatment. Select imaging studies can more reliably indicate a true need for intervention.
This article reviews the risk factors for preterm birth, the tests available to accurately diagnose preterm labor, and the medications available to prevent or postpone premature delivery.
Risk factors
Preterm delivery is categorized as spontaneous or indicated. Almost 75% of preterm births occur after spontaneous preterm labor or preterm premature rupture of the membranes (PPROM). The remaining 25% of early births are elective due to conditions potentially harmful to either the mother or the fetus.7
Maternal risk factors for spontaneous preterm births are listed in Table 1.7-13 The risk factors for preterm labor and PPROM are similar, with the exception that those whose membranes rupture prematurely are more likely to be indigent, to smoke cigarettes, and to have bleeding in the current pregnancy.
Not all preterm births carry the same risks. Early preterm birth—delivery before 32 weeks— is associated with clinical or subclinical infection, short cervical length, and the presence of fetal fibronectin in the cervicovaginal secretions. It tends to recur and leads to long-term fetal morbidity. Late preterm birth—delivery after 32 weeks but before 37 weeks—is associated with increased uterine contractions, tends to mimic normal labor, and is less likely to cause peripartum morbidity.7 Despite these known risk factors, women can experience preterm labor without exhibiting any of them.
TABLE 1
Maternal risk factors for spontaneous preterm birth
| Risk factor | Odds ratio |
|---|---|
| Bacterial vaginosis at <16 weeks | 7 |
| Periodontal infection | 4 |
| Prior preterm birth | 4 |
| Prepregnancy BMI <20 | 3 |
| Interpregnancy interval <6 mo | 2 |
| Bleeding in 2nd trimester | 2 |
| African-American race | 2 |
| Psychiatric disorder | 1.6 |
| Cigarette smoking | 1.5 |
| Gestational diabetes | 1.2 |
| Sources: Iams 20027 ; Leitich et al 20038 ; Jeffcoat et al 20019 ; Moutquin 200310 ; Smith et al 200311 ; Kelly et al 200212 ; Hedderson et al 2003.13 | |
Increasing the accuracy of diagnosis
Uterine contractions before 37 weeks and concomitant change in cervical dilation or effacement as detected by digital examination comprise the standard definition of preterm labor.
Caveats with clinical evaluation
The problem with the definition above is that women may not perceive contractions, and that contractions are at times difficult to differentiate from benign Braxton-Hicks contractions of normal pregnancy. Moreover, digital assessment of the cervix lacks reproducibility when the dilation is <3 cm or effacement is < 80%.7 Clinical evaluation alone can easily suggest prematurity when it is absent and miss it when it is present.7
Imaging and lab evaluation more telling
The ability to diagnose preterm labor improves with the use of transvaginal cervical sonography or measurement of fetal fibronectin.
Lesser cervical length means greater risk. Likelihood of preterm delivery is inversely proportional to cervical length measured at 18 to 28 weeks. A length of ≤2.5 cm is the threshold for abnormal condition (level of evidence [LOE]: 2).6
Fibronectin detected late may mean delivery early. Fibronectin, an extracellular glycoprotein described as the glue that attaches the fetal membrane to the underlying uterine decidua, is normally absent in cervicovaginal secretions between weeks 22 and 37 of pregnancy. Its presence (50 ng/mL) between 22 to 24 weeks is a predictor of spontaneous preterm birth; its absence makes premature delivery unlikely (LOE: 2).
Imaging and test results justify management decisions. The predictive accuracies of abnormal cervical length and of the presence of fibronectin are depicted in the Figure .7 The major benefit of these two tests is when they are normal (cervical length >2.5 cm or negative fetal fibronectin), unnecessary intervention is avoided.14 If, for example, a patient is having contractions and the cervical length is greater than 2.5 cm, or fetal fibronectin is absent, tocolytics can be discontinued and hospitalization avoided.
FIGURE
Value of transvaginal cervical imaging and fetal fibronectin measurement in predicting spontaneous preterm birth
Preventing preterm labor
Progestational agents
Many authors have advocated the use of progestational agents to inhibit premature labor. Progesterone’s presumed mechanisms are inhibition of the oxytocin effect of prostaglandin F2a and stimulation of α-adrenergic receptors, thereby increasing the α-adrenergic tocolytic response.15,16 Natural progesterone appears to be free of any untoward teratogenic, metabolic, or hemodynamic effects.17
Studies favoring progesterone. Two double-blind, placebo-controlled studies assessed the use of 17 α-hydroxyprogesterone caproate in preventing premature labor in high-risk populations. These patients had histories of preterm deliveries or spontaneous abortions.
Weekly intramuscular (IM) injections of 250 mg were started at 12 to 16 weeks gestation and given until 37 weeks or delivery, whichever came first. In both studies, the rate of premature deliveries was significantly lower in the treated group than the control group (number needed to treat [NNT]=2.4 and 4.6). In addition, neither mothers nor infants experienced adverse effects attributable to 17 α-hydroxyprogesterone caproate (LOE: 2).18,19 However, these studies were small—43 and 79 patients.
A large double-blind, placebo-controlled, randomized study established the effectiveness of 17 α-hydroxyprogesterone caproate in preventing preterm delivery.23 Four hundred fifty-nine pregnant women with a history of preterm delivery were randomized to receive weekly injections of 17 α-hydroxyprogesterone caproate 250 mg or placebo beginning at 16 to 20 weeks gestation and continuing to 36 weeks. Significantly fewer women in the treated group than the control group gave birth before 37 weeks, 36.3% v 54.9%, respectively (NNT=6; LOE: 1). Perhaps more importantly, treatment resulted in significant reductions in birth weight <2500 g (NNT=7), necrotizing enterocolitis (NNT=38), need for supplemental oxygen (NNT=11), and intraventricular hemorrhage (NNT=26). Swelling, bruising, or rash at the injection site were the most common adverse effects of 17 α-hydroxyprogesterone caproate administration.
Vaginal progesterone suppositories have also been shown to decrease the rate of preterm birth in patients at increased risk.17 da Fonseca et al noted that among 142 women who had 1 prior preterm birth, prophylactic cerclage, or uterine malformation, daily use of a 100-mg vaginal progesterone suppository compared with placebo significantly decreased the likelihood of delivery prior to 37 weeks, 14% v 28% (NNT=7; LOE: 1). Adverse effects of progesterone suppositories were not mentioned.
Studies lacking clear benefit. Another investigator enrolled 168 active-duty military women into a randomized double-blind study that evaluated weekly IM injections of 1000 mg 17 α-hydroxyprogesterone caproate or placebo beginning between 16 and 20 weeks gestation.20 The study population was chosen based on a report that active-duty pregnant military personnel had an increased number of pregnancy complications including low birth-weight infants and increased premature delivery.21 In contrast to the previous studies, no significant difference in premature labor or perinatal mortality was seen between the 2 groups (LOE: 2). Perhaps although active-duty personnel are at a higher risk for preterm labor, the risk is not as high as it is with previous preterm birth, prior spontaneous abortion, and so forth.
An additional small study of 77 women with twin pregnancies investigated the use of 17 α-hydroxyprogesterone caproate to prevent preterm delivery.22 Patients were randomized to receive weekly injections of 17 α-hydroxyprogesterone caproate 250 mg or placebo from the 28th gestational week until the 37th week or delivery. The mean duration of pregnancy did not differ between the two groups of women, nor did perinatal mortality (LOE: 2).
Evidence generally supports use of progesterone. Based on available data, consider administering progesterone to women at high risk for preterm delivery to prevent recurrent preterm birth (SOR: A). These data are summarized in Table 2 .
Hydroxyprogesterone caproate in oil is commercially available in the United States in 125 mg/mL and 250 mg/mL strengths. It is not, however, approved by the Food and Drug Administration (FDA) for the prevention of preterm labor.
Progesterone suppositories are also not FDA approved, and they are commercially unavailable in the US. Therefore, they have to be extemporaneously compounded.
TABLE 2
Evidence generally supports progesterone in prevention of preterm labor
| Study | Treatment | Comment | NNT | LOE |
|---|---|---|---|---|
| Johnson18 | Weekly IM 250 mg injections of 17 α-hydroxyprogesterone caproate | Decreased preterm delivery | 2.4 | 2 |
| Yemeni19 | Weekly IM 250 mg injections of 17 α-hydroxyprogesterone caproate | Decreased preterm delivery | 4.6 | 2 |
| Hauth20 | Weekly IM 1000 mg injections of 17 α-hydroxyprogesterone caproate | Did not decrease preterm delivery | N/A | 2 |
| Hartikainen-Sorri22 | Weekly IM 250 mg injections of 17 α-hydroxyprogesterone caproate | Did not decrease preterm delivery | N/A | 2 |
| Meis23 | Weekly IM 250 mg injections of 17 α-hydroxyprogesterone caproate | Decreased preterm Delivery | 6 | 1 |
| da Fonseca17 | Daily 100 mg progesterone vaginal suppositories | Decreased preterm delivery | 7 | 1 |
| NNT, number needed to treat; LOE, level of evidence; IM, intramuscular; N/A, not applicable. | ||||
Treating bacterial vaginosis may not prevent preterm labor
Bacterial vaginosis (BV) during pregnancy has been associated with preterm birth, and antibiotics have been thought perhaps to reduce this risk. A systematic review of 10 trials including 4249 pregnant women with BV showed that, although antibiotics eradicated BV, they did not significantly reduce the risk of birth before 32, 34, or 37 weeks (LOE: 1).24 This was true even for women with a history of preterm delivery. However, antibiotics did decrease the risk of PPROM. The authors concluded that evidence does not support screening all pregnant women for asymptomatic BV to prevent preterm birth.
Treating asymptomatic bacteriuria may prevent preterm labor
Asymptomatic bacteriuria in pregnant women has also been associated with preterm birth. One review of 14 trials comparing antibiotic treatment with placebo in this patient population—though not of high quality—demonstrated decreased incidences of pyelonephritis and preterm birth or low birth weight (LOE: 1).25
Treating preterm labor
The primary goal of using tocolytics in preterm labor is to prolong pregnancy for 2 to 7 days, permitting administration of corticosteroids and transfer to a tertiary care center when necessary. Recommendations for the treatment of preterm labor are summarized in Table 3 .
TABLE 3
Evaluation of proposed treatments for preterm labor
| Treatment | Comment | NNT | LOE | References |
|---|---|---|---|---|
| Calcium channel blockers | Reduce preterm delivery, decrease neonatal morbidity, well-tolerated | 11 | 1 | 26, 27 |
| Beta-agonists | Prolong pregnancy but no beneficial effect on neonatal morbidity; maternal side effects often lead to discontinuation | N/A | 1 | 33, 34 |
| Magnesium sulfate | Does not prolong pregnancy; maternal side effects often lead to discontinuation | N/A | 1 | 33, 40 |
| Prostaglandin inhibitors | Prolong pregnancy but no beneficial effect on neonatal morbidity; increase risk of postpartum hemorrhage | N/A | 1 | 33 |
| 2 | 43 | |||
| Antibiotics | No evidence to support use | N/A | 1 | 44 |
| Corticosteroids | Strongly recommended; decrease neonatal morbidity, well-tolerated | U | 1 | 46 |
| NNT, number needed to treat; LOE, level of evidence; N/A, not applicable; U, unavailable data. | ||||
Calcium channel blockers safe, effective
Calcium channel blockers (CCBs) are nonspecific smooth muscle relaxants. They prevent the influx of extracellular calcium ions into the myometrial cell, thereby exerting their tocolytic effect. Nifedipine is the most widely studied CCB in the management of preterm labor.
A systematic review of 12 randomized controlled trials including 1029 women demonstrated that CCBs significantly reduced the rate of preterm delivery within 7 days of the start of treatment and before 34 weeks gestation (LOE: 1).26 Compared with betamimetics, CCBs caused fewer maternal adverse effects, and decreased the frequency of neonatal respiratory distress syndrome, necrotizing enterocolitis, intraventricular hemorrhage, and jaundice. The authors concluded that CCBs are preferable to betamimetics for tocolysis.
Calcium channel blockers have also been compared with magnesium. Eighty women at 20 to 34 weeks gestation with documented cervical change were randomized to receive nifedipine or magnesium.27 No difference in tocolytic efficacy was observed between the treatments, but there were significantly fewer maternal side effects among the nifedipine-treated patients (LOE: 2).
CCBs appear not to adversely affect the human fetus.28,29 There was no significant increase in congenital anomalies among 586 mothers who had been exposed to CCBs compared with 907 controls: 2.6% vs 2.4%, respectively (LOE: 2).30 CCBs are effective at reducing the rate of preterm delivery, decreasing neonatal morbidity and mortality, and are well tolerated by both mother and baby. Although some other tocolytics (such as beta-agonists and prostaglandin inhibitors) prolong pregnancy, they have not demonstrated a beneficial effect on neonatal morbidity.
Dosing recommendations for nifedipine are a 30 mg loading dose, followed by 10 to 20 mg every 4 to 6 hours.31 Maternal side effects may include flushing, headache, nausea, dizziness, and transient hypotension. Neonatal side effects have not been documented. Nifedipine should not be used in conjunction with magnesium sulfate because the combination has resulted in cardiac collapse (LOE: 3).32
Beta-agonists marginally useful
Beta-agonists increase cyclic AMP, thereby causing smooth muscle relaxation. Betamimetics are widely used as tocolytic agents. Although they have been shown to prolong pregnancy by 24 to 48 hours, they have not decreased adverse perinatal or neonatal outcomes (LOE: 1).33,34 In addition, they have been associated with maternal side effects of palpitations, arrhythmias, nausea, tremor, chorioamnionitis, hyperglycemia, hypokalemia, and pulmonary edema. The risk of pulmonary edema increases if beta-agonists are used with magnesium sulfate.33,35 Fetal and neonatal side effects may include tachycardia, hyperinsulinemia, and hyperglycemia.14,35
Terbutaline is the preferred beta-agonist for preterm labor due to low cost and multiple dose forms. It may be administered subcutaneously, 0.25 mg every 30 minutes up to 1 mg in 4 hours, or by intravenous infusion, 2.5 to 10 μg per minute up to an effective maximum dose of no more than 30 μg per minute. Once stabilized, the patient is often maintained on oral terbutaline, 2.5 to 5 μg by mouth every 4 to 6 hours until term. This practice, however, has not been shown to significantly prolong pregnancy (LOE: 1).36
The major benefit of terbutaline may be in the management of preterm uterine contractions without cervical changes. Among patients with premature contractions at 20 to 34 weeks, who were randomized to hydration or observation or a single subcutaneous dose of 0.25 mg of terbutaline, the shortest length of stay in triage was for the women who received the terbutaline (LOE: 1).37
Magnesium sulfate: No good rationale for use
Magnesium sulfate in the management of preterm labor is controversial. Although widely used in North America, it is generally avoided in Europe, Australia, and the United Kingdom38,39 due to the absence of clear evidence showing efficacy in the face of its adverse effect profile. Data from systematic reviews indicate it does not delay or prevent preterm birth (LOE: 1).33,40 In addition, maternal side effects may require discontinuation of treatment. Side effects include flushing, nausea, headache, ileus, and hypocalcemia. Pulmonary edema is a serious maternal side effect and is increased when magnesium is co-administered with other tocolytic agents. Cardiac arrest is rare.14,33 Not only does evidence suggest magnesium sulfate does not delay or prevent preterm birth, but one study suggests its use may increase infant mortality (LOE: 2).41
In one trial of 1062 women, magnesium sulfate or placebo was given at 30 weeks’ gestation. Two years following birth, children of mothers who received magnesium sulfate exhibited less gross motor dysfunction than those born to mothers who received placebo, 18% vs 34% respectively (LOE: 1).42 However, the rate of pediatric mortality and cerebral palsy, the primary endpoints of the study, did not differ between the groups. Further studies are necessary before magnesium sulfate can be recommended for neuroprotection.
Prostaglandin inhibitors may be preferred for hydramnios
Indomethacin is the prostaglandin synthetase inhibitor most studied in preterm labor, though the numbers of patients in these studies was generally small.33 Indomethacin reduced the rate of preterm delivery within 7 days of treatment and before 37 weeks gestation. However, it did not decrease the rate of neonatal morbidity. Importantly, indomethacin was associated with an increased risk of postpartum hemorrhage (LOE: 1).33 A retrospective review demonstrated an increase in incidence and severity of postnatal patent ductus arteriosus in neonates whose mothers were treated with indomethacin (LOE: 2).43 Most prospective studies, however, have not found this complication. Prostaglandin inhibitors may be the preferred choice of tocolytics if hydramnios is suspected in conjunction with preterm labor.
Antibiotics: one indication only
It is hypothesized that women who experience preterm labor have infections of the upper genital tract, and that infection or inflammation leads to contractions. A meta-analysis of 11 randomized trials with 7428 women in preterm labor and intact membranes demonstrated that, although prophylactic antibiotics decreased the incidence of maternal infection, there was no benefit in neonatal outcomes (LOE: 1).44 Although it did not reach statistical significance, there was a trend towards an increase in neonatal deaths in the antibiotic group, raising concerns about their use. Therefore, administration of prophylactic antibiotics in this patient population is not recommended. Conversely, antibiotic prophylaxis is recommended for all women colonized with group B streptococcus, unless a cesarean delivery is planned, to prevent perinatal disease.45
Corticosteroids beneficial for preterm infants
Antenatal corticosteroids reduce mortality, incidence and severity of respiratory distress syndrome, and intraventricular hemorrhage in preterm infants (LOE: 1).46 Women at risk for preterm delivery between 24 and 34 weeks of gestation should be given betamethasone 12 mg IM, two doses 24 hours apart, or dexamethasone 6 mg IM, two doses 12 hours apart. There are no significant maternal or neonatal adverse effects with these regimens. Administration of tocolytic drugs may be necessary to prolong gestation and provide time for steroids to act.
Corresponding author
Adrienne Z. Ables, PharmD, Spartanburg Family Medicine Residency Program, 853 N Church St Suite 510, Spartanburg, SC 29303. E-mail: [email protected].
1. Ventura SJ, Martin JA, Curtin SC, Menacker F, Hamilton BE. Births: final data for 1999. Natl Vital Stat Rep 2001;49:1-100.
2. Rush RW, Davey DA, Segal ML. The effect of preterm delivery on perinatal mortality. Br J Obstet Gynaecol 1978;85:806-811.
3. Ehrenhaft PM, Wagner JL, Herdman RC. Changing prognosis for very low birth weight infants. Obstet Gynecol 1989;74:528.-
4. Hack M, Taylor HG, Klein N, Eiben R, Schatschneider C, Mercuri-Munich N. School-age outcomes in children with birth weight under 750 g. N Engl J Med 1994;331:753-759.
5. Rogowski JA. The economics of preterm delivery. Prenat Neonat Med 1998;3:16-20.
6. Iams JD, Goldenberg RL, Meis PJ, et al. The length of the cervix and the risk of spontaneous premature delivery. N Engl J Med 1996;334:567-572.
7. Iams JD. Preterm birth. In: Gabbe SG, Niebyl JR, Simpson JL, eds. Obstetrics: Normal and Problem Pregnancies 4th ed. New York, NY: Churchill Livingstone; 2002.
8. Leitich H, Bodner-Adler B, Brunbauer M, Egarter C, Husslei P. Bacterial vaginosis as a risk factor for preterm delivery: A meta-analysis. Am J Obstet Gynecol 2003;189:139-147.
9. Jeffcoat MK, Geurs NC, Reddy MS, Cliver SP, Goldenberg RL, Hauth JC. Periodontal infection and preterm birth: Results of prospective study. J Am Dent Assoc. 2001;132:875-880.
10. Moutquin JM. Socio-economic and psychosocial factors in the management and prevention of preterm labour. Br J Obstet Gynaecol 2003;110:56-60.
11. Smith GC, Pell JP, Dobbie R. Interpregnancy interval and risk of preterm birth and neonatal death: Retrospective cohort study. BMJ 2003;327:313-319.
12. Kelly RH, Russo J, Holt VL, Danielsen BH, Zatzick DF, Walker E, Kato W. Psychiatric and substance use disorders as risk factors for low birth weight and preterm delivery. Obstet Gynecol 2002;100:297-304.
13. Hedderson MM, Ferrara A, Sacks DA. Gestational diabetes mellitus and lesser degrees of pregnancy hyperglycemia: Association with increased risk of spontaneous preterm birth. Obstet Gynecol 2003;102:850-856.
14. American College of Obstetricians and Gynecologists Management of preterm labor. ACOG practical bulletin no. 43. Washington, DC: ACOG, 2003.
15. Lockwood CJ, Senyei AE, Dischie MR, et al. Fetal fibronectin in cervical and vaginal secretions as a predictor of preterm delivery. N Engl J Med 1991;325:669-674.
16. Fuchs AR, Fuchs R. Endocrinology of human parturition: a review. Br J Obstet Gynaecol 1984;91:948-67.
17. da Fonseca EB, Bittar R, Carvalho MHB, et al. Prophylactic administration of progesterone by vaginal suppository to reduce the incidence of spontaneous preterm birth in women at increased risk: A randomized placebo-controlled double blind study. Am J Obstet Gynecol 2003;188:419-424.
18. Johnson JW, Austin KL, Jones GS, et al. Efficacy of 17 a-hydroxyprogesterone caproate in the prevention of premature labor. N Engl J Med 1975;293:675-689.
19. Yemeni M, Borenstein R, Dreazen E, et al. Prevention of premature labor by 17 a-hydroxyprogesterone caproate. Am J Obstet Gynecol 1985;151:574-577.
20. Hauth JC, Gilstrap LC, Brekken AL, et al. The effect of 17 a-hydroxyprogesterone caproate on pregnancy outcome in an active-duty military population. Am J Obstet Gynecol 1983;146:187-190.
21. Fox ME, Harris RE, Brekken AL. The active duty military pregnancy: a new high-risk category. Am J Obstet Gynecol 1977;129:705-707.
22. Hartikainen-Sorri AL, Kauppila A, Tuimala R. Inefficacy of 17 a-hydroxyprogesterone caproate in the prevention of prematurity in twin pregnancy. Obstet Gynecol 1980;56:692-695.
23. Meis PJ. 17 Alpha hydroxyprogesterone caproate prevents recurrent preterm birth. N Engl J Med 2003;348:2379-2385.
24. McDonald H, Brocklehurst P, Parsons J, Vigneswaran R. Antibiotics for treating bacterial vaginosis in pregnancy (Cochrane Review).In: The Cochrane Library, Issue 2, 2004. Chichester, UK: John Wiley & Sons, Ltd.
25. Smaill F. Antibiotics for asymptomatic bacteriuria in pregnancy (Cochrane Review).In: The Cochrane Library, Issue 2, 2004. Chichester, UK: John Wiley & Sons, Ltd.
26. King JF, Flenady VJ, Papatsonis DNM, et al. Calcium channel blockers for inhibiting preterm labour (Cochrane Review).In: The Cochrane Library, Issue 3, 2003. Oxford: Update Software.
27. Glock, JL, Morales WJ. Efficacy and safety of nifedipine versus magnesium sulfate in the management of preterm labor: a randomized study. Am J Obstet Gynecol 1993;169:960-964.
28. Sorensen HT, Steffensen FH, Olesen C, et al. Pregnancy outcome in women exposed to calcium channel blockers. Reprod Toxicol 1998;12:383-384.
29. Magee LA, Schick B, Donnefeld AE, et al. The safety of calcium channel blockers in human pregnancy: a prospective, multicenter cohort study. Am J Obstet Gynecol 1996;174:823-828.
30. Sorensen HT, Czeizel AE, Rockenbauer M, et al. The risk of limb deficiencies and other congenital abnormalities in children exposed in utero to calcium channel blockers. Acta Obstet Gynecol Scand 2001;80:397-401.
31. Hearne AE, Nagey DA. Therapeutic agents in preterm labor: tocolytic agents. Clin Obstet Gynecol 2000;43:787-801.
32. Ben-Ami M, Giladi Y, Shalev E. The combination of magnesium sulphate and nifedipine: a cause of neuromuscular blockade. Br J Obstet Gynaecol 1994;101:262-263.
33. Gyetvai K, Hannah M E, Hodnett E D, et al. Tocolytics for preterm labor: a systematic review. Obstet Gynecol 1999;94:869-877.
34. King JF, Grant A, Keirse MJNC, et al. Beta-mimetics in preterm labor: an overview of the randomized controlled trials. Br J Obstet Gynaecol 1988;95:211-222.
35. Jeyabalan A, Caritis SN. Pharmacologic inhibition of preterm labor. Clin Obstset Gynecol 2002;45:99-113.
36. Macones GA, Berlin M, Berlin J. Efficacy of oral beta-ago-nist maintenance therapy in preterm labor: a meta-analysis. Obstet Gynecol 1995;85:313-317.
37. Guinn DA, Goepfert AR, Owen J, Brumfield C, Hauth JC. Management options in women with preterm uterine contractions: A randomized clinical trial. Am J Obstet Gynecol 1997;177:814-818.
38. Norwitz ER, Robinson JN, Challis JRG. The control of labor. N Engl J Med 1999;341:660-666.
39. Bennett P, Edwards D. Use of magnesium sulphate in obstetrics. Lancet 1997;350:1491.-
40. Crowther CA, Hiller JE, Doyle LW. Magnesium sulphate for preventing preterm birth in threatened preterm labour (Cochrane Review).In: The Cochrane Library, Issue 3, 2003. Oxford: Update Software.
41. Mittendorf R, Covert R, Boman J, et al. Is tocolytic magnesium sulfate associated with increased total paediatric mortality? Lancet 1997;350:1517-1518.
42. Crowther CA, Hiller JE, Haslam RR. Effect of magnesium sulfate given for neuroprotection before preterm birth. A randomized controlled trial. JAMA 2003;290:2669-2676.
43. Hammerman C, Glaser J, Kaplan M, et al. Indomethacin tocolysis increases postnatal patent ductus arteriosus severity. Pediatrics 1998;102:E56.-
44. King J, Flenady V. Prophylactic antibiotics for inhibiting preterm labour with intact membranes (Cochrane Review).In: The Cochrane Library, Issue 3, 2003. Oxford: Update Software.
45. Schrag S, Gorwitz R, Fultz-Butts K, Schuchat A. Prevention of perinatal group B streptococcal disease. Revised guidelines from CDC. MMWR Recomm Rep 2002;51(RR-11):1-22.Available at:www.cdc.gov/mmwr/PDF/RR/RR5111.pdf. Accessed January 21, 2005.
46. Crowley P. Prophylactic corticosteroids for preterm birth (Cochrane Review).In: The Cochrane Library, Issue 4, 2003. Oxford: Update Software.