User login
Long-term management of patients with unstable angina and NSTEMI
- Immediately upon presentation of non-ST-elevation myocardial infarction (NSTEMI), aspirin therapy (81–325 mg) should be initiated (A). If aspirin is contraindicated, clopidogrel (300-mg loading dose followed by 75 mg/d) should be administered (A).
- In patients for whom an early noninterventional approach is planned, or for patients not at high risk of bleeding for whom percutaneous coronary intervention (PCI) is planned, clopidogrel 75 mg (once daily) should be added to aspirin therapy as quickly as possible and continued for up to 9 months (B).
- Aggressive low-density lipoprotein (LDL) cholesterol-lowering therapy and general cardiovascular risk reduction are important in long-term management of these patients. Thus, a fibrate or niacin should be administered if the high-density lipoprotein (HDL) cholesterol is <40 mg/dL (B).
- In patients with LDL cholesterol >100 mg/dL, HMG-CoA reductase inhibitors (statins) and diet should be started during admission and continued after discharge (B).
In the long-term care of patients with acute coronary syndrome, recently published w that prognostic benefits improve with more aggressive antiplatelet therapy for those at high risk for recurrent events. Moreover, long-term care should include aggressive LDL cholesterol-lowering therapy and use of beta-blockers and angiotensin-converting enzyme (ACE) inhibitors, in addition to diet modification and exercise.
STEMI and NSTEMI: The new nomenclature
Coronary artery disease, the leading cause of death in the United States,1 can manifest in many ways involving a constellation of symptoms, electrocardiogram changes, and serum markers. These acute coronary syndromes result from decreased coronary blood flow and cause chest discomfort, usually at rest, with or without characteristic radiation, or such comparable anginal equivalents as weakness, dyspnea, and diaphoresis.
STEMI. An elevated ST-segment with elevated levels of such cardiac markers as creatine kinase myocardial band or troponin I or troponin T are consistent with a diagnosis of ST-elevation myocardial infarction (STEMI). The old term, acute myocardial infarction, was defined by the presence of pathological Q waves (Q wave MI).
NSTEMI. Patients with elevated serum levels of creatine kinase myocardial band or troponin I or troponin T, but no ST-segment elevation, are said to have non-ST-elevation myocardial infarction (NSTEMI).
Unstable angina. Normal levels of serum cardiac markers and an absence of ST-elevation are consistent with a diagnosis of unstable angina (Figure). Of patients with STEMI, most will ultimately experience a Q-wave MI; a minority will have a non–Q-wave MI. Of patients with NSTEMI, most will sustain a non–Q-wave MI, while a minority will sustain a Q-wave MI.
Unstable angina and NSTEMI are urgent and life-threatening problems. Chest pain and related symptoms account for 5.3 million visits to US emergency departments per year2 and account for 1.4 million hospitalizations annually.3 Approximately 15% of those presenting with unstable angina and NSTEMI go on to (re)infarct or die within 30 days.4
FIGURE
Unstable angina and NSTEMI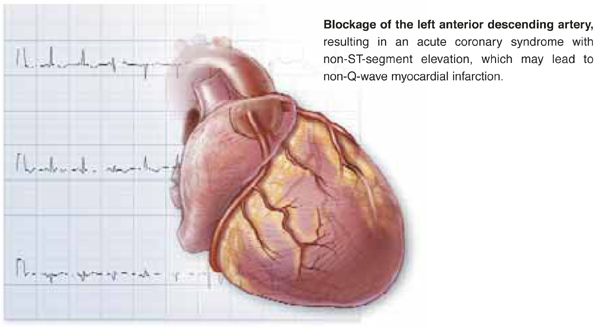
FIGURE
Nomenclature of acute coronary syndrome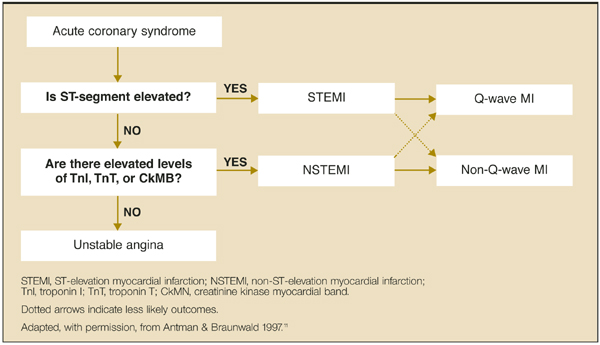
ACC/AHA Guidelines
In 2000 the American College of Cardiology and the American Heart Association (ACC/AHA) Task Force on Practice Guidelines published their evidence-based recommendations for treatment of unstable angina/NSTEMI following an exhaustive review of the literature.
New trials in acute coronary syndromes
Since 2000, knowledge of acute coronary syndromes advanced considerably with results of large pivotal randomized controlled studies, which necessitated updating the ACC/AHA guidelines just 21 months after their completion. The most notable of these studies were the Clopidogrel in Unstable Angina to Prevent Recurrent Ischemic Events (CURE) trial,6 the Percutaneous Coronary Intervention (PCI)-CURE7 subset analysis, and the Myocardial Ischemia Reduction with Aggressive Cholesterol Lowering (MIRACL) trial.8
Although incorporation of antiplatelet therapy is the focus of this article, the ultimate objective of the new revised guidelines is improved clinical outcomes for patients with acute coronary syndromes by improving early risk assessment, using revascularization procedures aggressively when risk for future cardiac events is high, using short- and long-term antiplatelet and antithrombotic agents, and modifying long-term risk.
2002 revised guidelines
The studies reviewed in the 2002 revised guidelines assessed multiple therapies in the reduction of recurrent MI, stroke, and other cardiovascular events following patients’ presentation with unstable angina and NSTEMI. The studies also evaluated traditional therapies for acute coronary syndromes, such as unfractionated heparin, beta-blockers, and aspirin, as well as more recent therapies, including low-molecular-weight heparin, antiplatelet therapy (parenteral glycoprotein IIb/IIIa [GP IIb/IIIa] antagonists and ADP-receptor antagonists [thienopyridines]), lipid-lowering therapy (HMG-CoA reductase inhibitors, or statins), and antihypertensive agents.2
The results of these trials have lead to changes in the initial management of patients following an new ischemic event, as well as the choice of medical therapy begun in the hospital and continued following discharge. Patients are given an individualized medical regimen based on specific needs that include in-hospital findings relating to the type of recent procedure, risk factors for subsequent ischemic events and drug tolerability. Such a regimen, although beyond the scope of this discussion, can be recalled as “ABCDE,” for Anti-platelet agents/ACE inhibitors, Beta-blockers, Blood pressure control, Cholesterol (lipid)-lowering agents, Cigarette cessation, Diet modification, Diabetes control, Exercise, and Education.
Important changes in long-term management
For most primary care physicians—with the possible exception of those in rural areas, who are faced with the burden of emergent care—the most important aspect of the revised guidelines is the changes in recommendations for long-term management of patients with unstable angina and NSTEMI. The goal of these new recommendations is to reduce the risk of subsequent cardiovascular events, such as death, recurrent MI, congestive heart failure, and stroke. Based on the results of the groundbreaking studies reviewed by the ACC/AHA panel, major changes to the original guidelines were necessary for the areas of long-term antiplatelet therapy and risk reduction.
TABLE
ACC/AHA task force classifications on patient evaluation and therapy
| Levels of evidence | ||
|---|---|---|
| A (highest) | B (intermediate) | C (lowest) |
| Data derived from multiple randomized clinical trials involving large numbers of patients. | Data derived from limited number of randomized clinical trials involving small numbers of patients or from analyses of nonrandomized trials or observation registries. | Basis of recommendation from expert opinion. large numbers of patients. |
| Recommendations made were based on expert analyses of published data. | ||
Antiplatelet therapy
Antiplatelet therapy—aspirin, GP IIb/IIIa antagonists, or an ADP-receptor antagonist (eg, clopidogrel)—is critical in the treatment and management of patients with unstable angina/NSTEMI.2 Based on the ACC/AHA Task Force classification (Table), aspirin (81–325 mg) should be initiated as quickly as possible after the condition is recognized, and continued indefinitely (SOR: A).
Clopidogrel (300-mg loading dose followed by 75 mg/d) should be administered to patients unable to take aspirin (SOR: A). In addition, clopidogrel 75 mg (once daily) should be added to aspirin therapy as quickly as possible and continued for up to 9 months in patients for whom an early noninterventional approach is planned (SOR: A), or for patients with a planned PCI who are not at high risk of bleeding (SOR: B).2
The CURE trial: clopidogrel and aspirin
The principal studies underlying the new recommendations for long-term antiplatelet therapy are the CURE trial6 and the PCI-CURE7 subset analysis. In the CURE trial, 12,562 patients who presented with unstable angina/NSTEMI within 24 hours following the onset of symptoms were randomized to receive clopidogrel (loading dose of 300 mg followed by 75 mg/d) with aspirin or placebo with aspirin for 3 to 12 months (mean follow-up, 9 months).
The relative risk (RR) of the primary composite outcome including incidence of cardiovascular death, nonfatal MI, or stroke was lower by 20% (RR=0.80; 95% confidence interval [CI], 0.72–0.90; P<.001) in the clopidogrel arm. Similarly, a composite outcome also including revascularization was lower by 14% (RR=0.86; P<.001) for those who received clopidogrel. Benefits were seen in all risk groups. A significant increase in bleeding events was observed in the group that received clopidogrel plus aspirin compared with aspirin alone (major bleeding, P=.001; minor bleeding, P<.001).6
CURE patients were followed for up to 1 year, with a mean follow-up period of 9 months. In addition to the early benefits seen, from day 31 up to 1 year there was a highly significant incremental reduction of 18% in the primary outcome (P<.001) with clopidogrel.7
The PCI-CURE subset: Percutaneous coronary interventions
In the PCI-CURE trial, a subset of patients recruited for CURE who underwent PCI was pretreated with aspirin 325 mg and clopidogrel 75 mg for a median of 10 days. These patients received either clopidogrel or ticlopidine for 4 weeks, and then were restarted on either clopidogrel 75 mg (80%) or placebo in addition to aspirin for an additional mean of 8 months with up to 1 year of follow-up.
Long-term administration of clopidogrel 75 mg following PCI resulted in a 30% reduction (RR=0.70; 95% CI, 0.50–0.70; P=.03) in cardiovascular death, MI, and any revascularization, with a 31% reduction in cardiovascular death or MI (P=.002) compared with placebo. Major bleeding rates were similar between groups (P=.64).9
The CREDO study
The new guidelines for long-term antiplatelet therapy are further supported by the subsequently published Clopidogrel for the Reduction of Events During Observation (CREDO) study.10 CREDO demonstrated a 26.9% relative risk reduction in the combined risk of death, MI, or stroke (95% CI, 3.9%–44.4%; P=.02) in patients with long-term (12 months) aspirin plus clopidogrel 75 mg therapy compared with aspirin plus placebo in 2116 patients undergoing elective PCI or deemed at high likelihood of undergoing PCI. There was no significant increase in the risk of major bleeding (P=.07) between the placebo and clopidogrel arms.
Risk reduction
The revised guidelines also included updated recommendations for risk reduction. It is now recommended that a fibrate or niacin be administered if the HDL cholesterol level is <40 mg/dL (SOR: B).2 Further, statins and a heart-healthy diet should be started during admission and continued after discharge for patients with LDL cholesterol >100 mg/dL (SOR: B).2
This recommendation is based in part on the MIRACL trial, in which 3086 acute coronary syndrome patients treated with atorvastatin, 24 to 96 hours after hospital admission, demonstrated a significant reduction in the composite rate of death, nonfatal MI, resuscitated cardiac arrest, or recurrent ischemia compared with those who received placebo (14.8% vs 17.4%) (RR=0.84; 95% CI, 0.70–1.00; P=.048). Patients were followed for up to 16 weeks after starting therapy. Abnormal liver transaminases (>3 times upper limit of normal) occurred more often in the atorvastatin group than the placebo group (2.5% vs 0.6%; P<.001).8
- Atorvastatin • Lipitor
- Clopidogrel • Plavix
- Ticlopidine • Ticlid
Correspondence
John S. Banas, MD, FACC, Morristown Memorial Hospital, 100 Madison Ave, Morristown, NJ 07960. E-mail: [email protected].
1. American Heart Association. Heart and Stroke Statistical Update. Available at: www.americanheart.org. Accessed on March 31, 2004.
2. Braunwald E, Antman EM, Beasley JW, et al. ACC/AHA guideline update for the management of patients with unstable angina and non-ST-segment elevation myocardial infarction—2002: summary article: report of the American College of Cardiology/American Heart Association Task Force on Practice Guidelines. Circulation 2002;106:1893-1900.
3. Graves EJ, Kozak LJ. Detailed diagnoses and procedures, National Hospital Discharge Survey, 1996. National Center for Health Statistics. Vital Health Stat 1998;13:i-iii,1-151.
4. The Pursuit Trial Investigators. Inhibition of platelet glycoprotein IIb/IIIa with eptifibatide in patients with acute coronary syndromes. N Engl J Med 1998;339:436-443.
5. Braunwald E, Antman EM, Beasley JW, et al. ACC/AHA guidelines for the management of patients with unstable angina and non-ST-segment elevation myocardial infarction: a report of the American College of Cardiology/American Heart Association Task Force on Practice Guidelines (Committee on the Management of Patients With Unstable Angina). J Am Coll Cardiol 2000;36:970-1062.
6. Yusuf S, Zhao F, Mehta SR, Chrolavicius S, Tognoni G, Fox KK. Effects of clopidogrel in addition to aspirin in patients with acute coronary syndromes without ST-segment elevation. N Eng J Med 2001;345:494-502.
7. Mehta SR, Yusuf S. Short- and long-term oral antiplatelet therapy in acute coronary syndromes and percutaneous coronary interventions. J Am Coll Cardiol 2003;41:79S-88S.
8. Schwartz GG, Olsson AG, Ezekowitz MD, et al. Effects of atorvastatin on early recurrent ischemic events in acute coronary syndromes: the MIRACL study, a randomized controlled trial. JAMA 2001;285:1711-1718.
9. Mehta SR, Yusuf S, Peters RJ, et al. Effects of pretreatment with clopidogrel and aspirin followed by long-term therapy in patients undergoing percutaneous coronary intervention: the PCI-CURE study. Lancet 2001;358:527-533.
10. Steinhubl SR, Berger PB. Mann JT for the CREDO Investigators. Early and sustained dual oral antiplatelet therapy following percutaneous coronary intervention. A randomized controlled trial. JAMA 2002;288:2411-2420.
11. Antman EM, Braunwald E. Acute myocardial infarction. In: Braunwald E, ed. Heart Disease: A Textbook of Cardiovascular Medicine. Philadelphia, Pa: WB Saunders, 1997.
- Immediately upon presentation of non-ST-elevation myocardial infarction (NSTEMI), aspirin therapy (81–325 mg) should be initiated (A). If aspirin is contraindicated, clopidogrel (300-mg loading dose followed by 75 mg/d) should be administered (A).
- In patients for whom an early noninterventional approach is planned, or for patients not at high risk of bleeding for whom percutaneous coronary intervention (PCI) is planned, clopidogrel 75 mg (once daily) should be added to aspirin therapy as quickly as possible and continued for up to 9 months (B).
- Aggressive low-density lipoprotein (LDL) cholesterol-lowering therapy and general cardiovascular risk reduction are important in long-term management of these patients. Thus, a fibrate or niacin should be administered if the high-density lipoprotein (HDL) cholesterol is <40 mg/dL (B).
- In patients with LDL cholesterol >100 mg/dL, HMG-CoA reductase inhibitors (statins) and diet should be started during admission and continued after discharge (B).
In the long-term care of patients with acute coronary syndrome, recently published w that prognostic benefits improve with more aggressive antiplatelet therapy for those at high risk for recurrent events. Moreover, long-term care should include aggressive LDL cholesterol-lowering therapy and use of beta-blockers and angiotensin-converting enzyme (ACE) inhibitors, in addition to diet modification and exercise.
STEMI and NSTEMI: The new nomenclature
Coronary artery disease, the leading cause of death in the United States,1 can manifest in many ways involving a constellation of symptoms, electrocardiogram changes, and serum markers. These acute coronary syndromes result from decreased coronary blood flow and cause chest discomfort, usually at rest, with or without characteristic radiation, or such comparable anginal equivalents as weakness, dyspnea, and diaphoresis.
STEMI. An elevated ST-segment with elevated levels of such cardiac markers as creatine kinase myocardial band or troponin I or troponin T are consistent with a diagnosis of ST-elevation myocardial infarction (STEMI). The old term, acute myocardial infarction, was defined by the presence of pathological Q waves (Q wave MI).
NSTEMI. Patients with elevated serum levels of creatine kinase myocardial band or troponin I or troponin T, but no ST-segment elevation, are said to have non-ST-elevation myocardial infarction (NSTEMI).
Unstable angina. Normal levels of serum cardiac markers and an absence of ST-elevation are consistent with a diagnosis of unstable angina (Figure). Of patients with STEMI, most will ultimately experience a Q-wave MI; a minority will have a non–Q-wave MI. Of patients with NSTEMI, most will sustain a non–Q-wave MI, while a minority will sustain a Q-wave MI.
Unstable angina and NSTEMI are urgent and life-threatening problems. Chest pain and related symptoms account for 5.3 million visits to US emergency departments per year2 and account for 1.4 million hospitalizations annually.3 Approximately 15% of those presenting with unstable angina and NSTEMI go on to (re)infarct or die within 30 days.4
FIGURE
Unstable angina and NSTEMI
FIGURE
Nomenclature of acute coronary syndrome
ACC/AHA Guidelines
In 2000 the American College of Cardiology and the American Heart Association (ACC/AHA) Task Force on Practice Guidelines published their evidence-based recommendations for treatment of unstable angina/NSTEMI following an exhaustive review of the literature.
New trials in acute coronary syndromes
Since 2000, knowledge of acute coronary syndromes advanced considerably with results of large pivotal randomized controlled studies, which necessitated updating the ACC/AHA guidelines just 21 months after their completion. The most notable of these studies were the Clopidogrel in Unstable Angina to Prevent Recurrent Ischemic Events (CURE) trial,6 the Percutaneous Coronary Intervention (PCI)-CURE7 subset analysis, and the Myocardial Ischemia Reduction with Aggressive Cholesterol Lowering (MIRACL) trial.8
Although incorporation of antiplatelet therapy is the focus of this article, the ultimate objective of the new revised guidelines is improved clinical outcomes for patients with acute coronary syndromes by improving early risk assessment, using revascularization procedures aggressively when risk for future cardiac events is high, using short- and long-term antiplatelet and antithrombotic agents, and modifying long-term risk.
2002 revised guidelines
The studies reviewed in the 2002 revised guidelines assessed multiple therapies in the reduction of recurrent MI, stroke, and other cardiovascular events following patients’ presentation with unstable angina and NSTEMI. The studies also evaluated traditional therapies for acute coronary syndromes, such as unfractionated heparin, beta-blockers, and aspirin, as well as more recent therapies, including low-molecular-weight heparin, antiplatelet therapy (parenteral glycoprotein IIb/IIIa [GP IIb/IIIa] antagonists and ADP-receptor antagonists [thienopyridines]), lipid-lowering therapy (HMG-CoA reductase inhibitors, or statins), and antihypertensive agents.2
The results of these trials have lead to changes in the initial management of patients following an new ischemic event, as well as the choice of medical therapy begun in the hospital and continued following discharge. Patients are given an individualized medical regimen based on specific needs that include in-hospital findings relating to the type of recent procedure, risk factors for subsequent ischemic events and drug tolerability. Such a regimen, although beyond the scope of this discussion, can be recalled as “ABCDE,” for Anti-platelet agents/ACE inhibitors, Beta-blockers, Blood pressure control, Cholesterol (lipid)-lowering agents, Cigarette cessation, Diet modification, Diabetes control, Exercise, and Education.
Important changes in long-term management
For most primary care physicians—with the possible exception of those in rural areas, who are faced with the burden of emergent care—the most important aspect of the revised guidelines is the changes in recommendations for long-term management of patients with unstable angina and NSTEMI. The goal of these new recommendations is to reduce the risk of subsequent cardiovascular events, such as death, recurrent MI, congestive heart failure, and stroke. Based on the results of the groundbreaking studies reviewed by the ACC/AHA panel, major changes to the original guidelines were necessary for the areas of long-term antiplatelet therapy and risk reduction.
TABLE
ACC/AHA task force classifications on patient evaluation and therapy
| Levels of evidence | ||
|---|---|---|
| A (highest) | B (intermediate) | C (lowest) |
| Data derived from multiple randomized clinical trials involving large numbers of patients. | Data derived from limited number of randomized clinical trials involving small numbers of patients or from analyses of nonrandomized trials or observation registries. | Basis of recommendation from expert opinion. large numbers of patients. |
| Recommendations made were based on expert analyses of published data. | ||
Antiplatelet therapy
Antiplatelet therapy—aspirin, GP IIb/IIIa antagonists, or an ADP-receptor antagonist (eg, clopidogrel)—is critical in the treatment and management of patients with unstable angina/NSTEMI.2 Based on the ACC/AHA Task Force classification (Table), aspirin (81–325 mg) should be initiated as quickly as possible after the condition is recognized, and continued indefinitely (SOR: A).
Clopidogrel (300-mg loading dose followed by 75 mg/d) should be administered to patients unable to take aspirin (SOR: A). In addition, clopidogrel 75 mg (once daily) should be added to aspirin therapy as quickly as possible and continued for up to 9 months in patients for whom an early noninterventional approach is planned (SOR: A), or for patients with a planned PCI who are not at high risk of bleeding (SOR: B).2
The CURE trial: clopidogrel and aspirin
The principal studies underlying the new recommendations for long-term antiplatelet therapy are the CURE trial6 and the PCI-CURE7 subset analysis. In the CURE trial, 12,562 patients who presented with unstable angina/NSTEMI within 24 hours following the onset of symptoms were randomized to receive clopidogrel (loading dose of 300 mg followed by 75 mg/d) with aspirin or placebo with aspirin for 3 to 12 months (mean follow-up, 9 months).
The relative risk (RR) of the primary composite outcome including incidence of cardiovascular death, nonfatal MI, or stroke was lower by 20% (RR=0.80; 95% confidence interval [CI], 0.72–0.90; P<.001) in the clopidogrel arm. Similarly, a composite outcome also including revascularization was lower by 14% (RR=0.86; P<.001) for those who received clopidogrel. Benefits were seen in all risk groups. A significant increase in bleeding events was observed in the group that received clopidogrel plus aspirin compared with aspirin alone (major bleeding, P=.001; minor bleeding, P<.001).6
CURE patients were followed for up to 1 year, with a mean follow-up period of 9 months. In addition to the early benefits seen, from day 31 up to 1 year there was a highly significant incremental reduction of 18% in the primary outcome (P<.001) with clopidogrel.7
The PCI-CURE subset: Percutaneous coronary interventions
In the PCI-CURE trial, a subset of patients recruited for CURE who underwent PCI was pretreated with aspirin 325 mg and clopidogrel 75 mg for a median of 10 days. These patients received either clopidogrel or ticlopidine for 4 weeks, and then were restarted on either clopidogrel 75 mg (80%) or placebo in addition to aspirin for an additional mean of 8 months with up to 1 year of follow-up.
Long-term administration of clopidogrel 75 mg following PCI resulted in a 30% reduction (RR=0.70; 95% CI, 0.50–0.70; P=.03) in cardiovascular death, MI, and any revascularization, with a 31% reduction in cardiovascular death or MI (P=.002) compared with placebo. Major bleeding rates were similar between groups (P=.64).9
The CREDO study
The new guidelines for long-term antiplatelet therapy are further supported by the subsequently published Clopidogrel for the Reduction of Events During Observation (CREDO) study.10 CREDO demonstrated a 26.9% relative risk reduction in the combined risk of death, MI, or stroke (95% CI, 3.9%–44.4%; P=.02) in patients with long-term (12 months) aspirin plus clopidogrel 75 mg therapy compared with aspirin plus placebo in 2116 patients undergoing elective PCI or deemed at high likelihood of undergoing PCI. There was no significant increase in the risk of major bleeding (P=.07) between the placebo and clopidogrel arms.
Risk reduction
The revised guidelines also included updated recommendations for risk reduction. It is now recommended that a fibrate or niacin be administered if the HDL cholesterol level is <40 mg/dL (SOR: B).2 Further, statins and a heart-healthy diet should be started during admission and continued after discharge for patients with LDL cholesterol >100 mg/dL (SOR: B).2
This recommendation is based in part on the MIRACL trial, in which 3086 acute coronary syndrome patients treated with atorvastatin, 24 to 96 hours after hospital admission, demonstrated a significant reduction in the composite rate of death, nonfatal MI, resuscitated cardiac arrest, or recurrent ischemia compared with those who received placebo (14.8% vs 17.4%) (RR=0.84; 95% CI, 0.70–1.00; P=.048). Patients were followed for up to 16 weeks after starting therapy. Abnormal liver transaminases (>3 times upper limit of normal) occurred more often in the atorvastatin group than the placebo group (2.5% vs 0.6%; P<.001).8
- Atorvastatin • Lipitor
- Clopidogrel • Plavix
- Ticlopidine • Ticlid
Correspondence
John S. Banas, MD, FACC, Morristown Memorial Hospital, 100 Madison Ave, Morristown, NJ 07960. E-mail: [email protected].
1. American Heart Association. Heart and Stroke Statistical Update. Available at: www.americanheart.org. Accessed on March 31, 2004.
2. Braunwald E, Antman EM, Beasley JW, et al. ACC/AHA guideline update for the management of patients with unstable angina and non-ST-segment elevation myocardial infarction—2002: summary article: report of the American College of Cardiology/American Heart Association Task Force on Practice Guidelines. Circulation 2002;106:1893-1900.
3. Graves EJ, Kozak LJ. Detailed diagnoses and procedures, National Hospital Discharge Survey, 1996. National Center for Health Statistics. Vital Health Stat 1998;13:i-iii,1-151.
4. The Pursuit Trial Investigators. Inhibition of platelet glycoprotein IIb/IIIa with eptifibatide in patients with acute coronary syndromes. N Engl J Med 1998;339:436-443.
5. Braunwald E, Antman EM, Beasley JW, et al. ACC/AHA guidelines for the management of patients with unstable angina and non-ST-segment elevation myocardial infarction: a report of the American College of Cardiology/American Heart Association Task Force on Practice Guidelines (Committee on the Management of Patients With Unstable Angina). J Am Coll Cardiol 2000;36:970-1062.
6. Yusuf S, Zhao F, Mehta SR, Chrolavicius S, Tognoni G, Fox KK. Effects of clopidogrel in addition to aspirin in patients with acute coronary syndromes without ST-segment elevation. N Eng J Med 2001;345:494-502.
7. Mehta SR, Yusuf S. Short- and long-term oral antiplatelet therapy in acute coronary syndromes and percutaneous coronary interventions. J Am Coll Cardiol 2003;41:79S-88S.
8. Schwartz GG, Olsson AG, Ezekowitz MD, et al. Effects of atorvastatin on early recurrent ischemic events in acute coronary syndromes: the MIRACL study, a randomized controlled trial. JAMA 2001;285:1711-1718.
9. Mehta SR, Yusuf S, Peters RJ, et al. Effects of pretreatment with clopidogrel and aspirin followed by long-term therapy in patients undergoing percutaneous coronary intervention: the PCI-CURE study. Lancet 2001;358:527-533.
10. Steinhubl SR, Berger PB. Mann JT for the CREDO Investigators. Early and sustained dual oral antiplatelet therapy following percutaneous coronary intervention. A randomized controlled trial. JAMA 2002;288:2411-2420.
11. Antman EM, Braunwald E. Acute myocardial infarction. In: Braunwald E, ed. Heart Disease: A Textbook of Cardiovascular Medicine. Philadelphia, Pa: WB Saunders, 1997.
Treating type 2 diabetes: Targeting the causative factors
- Self-monitoring of blood glucose is an integral component of diabetes therapy and should always be included in the management plan (SOR:C).
- Medical nutrition therapy should be individualized, preferably by a registered dietitian familiar with diabetes (SOR:B).
- A regular physical activity program is recommended for all patients with diabetes who are capable of participating (SOR:B).
- When a monotherapy fails, combine drugs with different mechanisms of action to achieve an additive effect (SOR:A).
- The combination of sulfonylurea and metformin has proven effective in many studies. One showed that initial treatment with glyburide/metformin improved glycemic control better than either glyburide or metformin monotherapy (SOR: A).
Glycemic control in diabetes begins with a patient’s adherence to several nonpharmacologic measures. Without such a commitment, success in controlling the disease will be difficult to achieve, and otherwise appropriate drug therapy will be hindered.
Most antidiabetic agents comparably reduce glycosylated hemoglobin (A1c) levels. However, a particular agent may be preferred depending on a patient’s characteristics. And some circumstances call for combination therapy. This article reviews the advantages and disadvantages of the many pharmacologic treatments for glucose control and hyperglycemia in type 2 diabetes.
Benefits Of Diabetes Control
The benefits of diabetes control are detailed in this issue of THE JOURNAL OF FAMILY PRACTICE (“Strategies to reduce complications in type 2 diabetes,” pages 366–374). For every percentage-point reduction in hemoglobin A1c, it is possible to achieve a 22% to 35% reduction in microvascular complications.1,2 Cardiovascular disease can be reduced in patients with diabetes by treating hypertension3,4 and hyperlipidemia, prescribing aspirin therapy, using angiotensin-converting enzyme (ACE) inhibitors, and with smoking cessation.5,6
Targets For Glycemic Control
The American Diabetes Association’s (ADA) recommended targets for glycemic control are a preprandial blood glucose level of 80–120 mg/dL, a bedtime blood glucose level of 100–140 mg/dL, and a hemoglobin A1c level of <7% (with a level of >8% requiring additional measures). Hemoglobin A1c is the best determinant of glycemic exposure, and its mean value is a nationally recognized indicator of how well diabetes is being managed.7 The American College of Endocrinology has adopted a more aggressive approach by designating an A1c level of 6.5% as both a target and action level.8
Self-monitoring of blood glucose
Self-monitoring of blood glucose (SMBG) is an integral component of diabetes therapy (strength of recommendation [SOR]: C) and should always be included in the management plan (SOR: C). The optimal frequency and timing of SMBG for type 2 diabetes is not known, but they should be sufficient to facilitate reaching glucose goals. The A1c test should be performed at least semi-annually for patients with stable glycemic control, and quarterly for patients not meeting glycemic goals or those who are changing therapy. A1c levels and mean plasma glucose levels can be approximately correlated (Table 1).7
TABLE 1
Correlation between hemoglobin A1clevels and mean plasma glucose levels
| Hemoglobin A1c(%) | Mean plasma glucose (mg/dL) |
|---|---|
| 6 | 135 |
| 7 | 170 |
| 8 | 205 |
| 9 | 240 |
| 10 | 275 |
| 11 | 310 |
| 12 | 345 |
Nonpharmacologic Therapy
Nonpharmacologic measures remain the cornerstone of managing type 2 diabetes. Hyperglycemia adversely and reversibly affects both insulin resistance and insulin secretion. Improvement in glycemic control can occur through dietary modification and regular exercise.
A recent meta-analysis of randomized controlled trials of diabetes patient education observed a net decrease in HbA1c of 0.32% in intervention groups vs control.9 Interventions that included a face-to-face delivery, cognitive reframing teaching method, and exercise content were more likely to improve glycemic control.
Education
Lifestyle changes involving diet, exercise, and usually weight loss are key to effective management of diabetes. If patients are to change their behavior, they must be given detailed training.6 Self-management also necessitates that patients engage in problem solving. This requires that each aspect of the management plan is understood and agreed upon by the patient and providers, and that the goals and treatment plan are individualized and reasonable.
Diet: recommend soluble fiber, reduce calories
Medical nutrition therapy should be individualized and preferably provided by a registered dietitian familiar with diabetes (SOR: B). The goals of nutrition therapy, according to the ADA, are to attain recommended body weight and prevent or reverse obesity. The means of achieving these goals are nutrition assessment and modification of nutrient intake and lifestyle through healthy food choices and physical activity.7
A high intake of dietary fiber (particularly the soluble type) above the level recommended by the ADA improves glycemic control, decreases hyperinsulinemia, and lowers plasma lipid concentrations.10
Hypocaloric diets cause glucose plasma levels to fall, in some cases to a normal level with a weight loss of even 5 to 10 pounds.7,11 Hypoglycemic medications are of course most effective in nonobese persons. But effectiveness is also improved if weight that is gained can be limited. Despite the clear benefit of weight loss, only a few patients are able to attain and maintain substantial weight loss. Maintenance of a reduced or elevated body weight is associated with compensatory changes in energy expenditure, which oppose the maintenance of body weight that is different from the usual weight.13 Part of the individualization of therapy is respect of personal and cultural preferences, lifestyles, and financial considerations.
Physical activity: a little goes a long way
A regular physical activity program is recommended for all patients with diabetes who are capable of participating (SOR: B).7 It improves blood glucose control, reduces cardiovascular risk factors, aids weight loss, and enhances well being.7 A recently published prospective cohort study showed that walking at least 2 hours a week was associated with a 39% lower all-cause mortality (hazard rate ratio [HRR], 0.61; 95% CI, 0.48–0.78) and a 34% lower cardiovascular mortality (HRR, 0.66; 95% CI, 0.45–0.96) across a diverse spectrum of adults with diabetes. The NNT (to prevent 1 death per year) is 61 for patients who walk at least 2 hours/week.14
In prescribing a physical activity plan for a patient, consider cardiovascular disease risk factors or complications to minimize the risk of untoward events. Micro- and macrovascular disease are of course prevalent among persons with diabetes, often resulting in functional limitations that make exercise more difficult.
Other priorities
Other recommended components of care include daily aspirin use, foot care exams, tobacco cessation, pneumococcal and influenza vaccinations, and an annual dilated retinal exam.
Pharmacologic Therapy
The coexisting defects in type 2 diabetes mellitus are as follows:
- resistance to insulin action in muscle
- defective pancreatic insulin secretion
- unrestrained hepatic glucose production, aggravated by increased lipolysis in adipose tissue.
Drug therapy is aimed at each of these defects, and also at reducing carbohydrate absorption in the small intestine (Figure 1). As far as antihyperglycemic effect is concerned, no one category of antidiabetic agent is favored over another.15 Except for nateglinide and α-glucosidase inhibitors (AGIs), each of the drug categories leads to a similar reduction in A1c.16 However, patient characteristics may lead to selection of a particular agent. Table 2 summarizes oral treatment options, their relative advantages and costs.
FIGURE 1
Drug therapies for coexisting defects in type 2 diabetes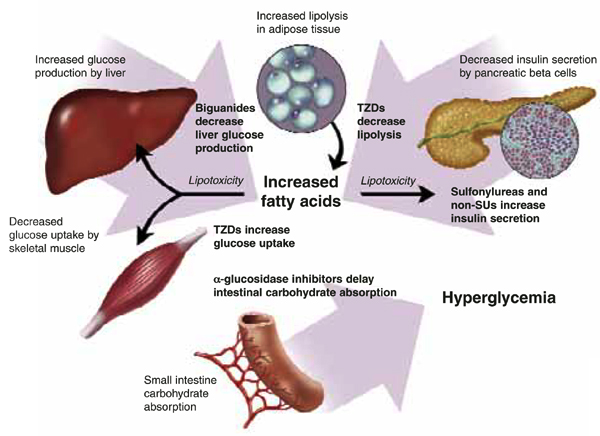
TABLE 2
Pharmacologic treatments for type 2 diabetes: monotherapies
| Target population | Advantages | Disadvantages | Dosing | Cost* |
|---|---|---|---|---|
| Sulfonylureas | ||||
| Recent type 2 DM diagnosis | Rapid FPG reduction | Weight gain | Glyburide: 1.25–20 mg once or twice daily (micronized, 0.75–12 mg once or twice daily) | $22.80 (5 mg, #120) |
| Type 2 DM <5 years duration | Low cost | Increased risk of hypoglycemia | Glipizide: 2.5–40 mg once or twice daily (extended-release, 2.5–20 mg once daily) | $14.66 (10 mg, #120) |
| Glimepiride: 1–8 mg once daily | $51.98 (10 mg, #60) | |||
| $57.98 (4 mg, #60) | ||||
| Non-sulfonylurea secretagogues (meglitinides) | ||||
| Recent type 2 DM diagnosis | Reduced risk of hypoclycemia | Higher cost | Nateglinide: 60–120 mg 3 times daily | $85.99 (120mg, #90) |
| Elevated PPG | Short-acting | Frequent dosing | Repaglinide: 0.5–4 mg 3 or 4 times daily | $218.06 (2 mg, #240) |
| Meal-adjusted dosing | ||||
| Biguanides | ||||
| Overweight/obese | No weight gain | GI side effects | Metformin: 500–1000 mg 2 or 3 times daily | $77.99 (850 mg, #90) |
| Insulin resistant | Reduced risk of hypoglycemia | High cost | Metformin XR: 1000–2000 mg once or twice daily | $89.98 (500 mg, #120) |
| Rare lactic acidosis | ||||
| TZDs | ||||
| Insulin resistant | Reduced amount of insulin | High cost | Rosiglitazone: 4–8 mg once or twice daily | $135.99 (8 mg, #30) |
| Overweight/obese | Reduced risk of hypoglycemia | Weight gain | Pioglitazone: 15–45 mg once daily | $153.99 (45 mg, #30) |
| Slow onset of action | ||||
| Liver toxicity | ||||
| AGIs | ||||
| Elevated PPG | Reduced risk of hypoglycemia | High cost | Acarbose: 50–100 mg 3 times daily | $67.99 (100 mg, #90) |
| Contraindications to other agents | Non-systemic action | GI side effects | Miglitol: 50–100 mg 3 times daily | $66.99 (100 mg, #90) |
| *Drug costs for 30 days’ supply of maximum daily dosage. From www.drugstore.com, December 2003. | ||||
| DM, diabetes mellitus; TZD, thiazolidinediones; AGT, a-glucosidase inhibitors; FPG, fasting plasma glucose; PPG, postprandial glucose; GI, gastrointestinal | ||||
Sulfonylureas
Sulfonylureas directly increase insulin secretion by binding to the sulfonylurea receptor on pancreatic beta cells; they provide a relatively quick onset of action. First-generation sulfonylureas (eg, tolbutamide, chlorpropamide) and second-generation sulfonylureas (eg, glyburide, glipizide, glimepiride) are equivalent in their maximum hypoglycemic effect.17
Second-generation agents are used more commonly than first-generation. They all contain the sulfonylurea moiety, but different chemical substitutions in the basic molecule change pharmacokinetics, resulting in different durations of action.17 Second-generation agents are probably safer than first-generation drugs, being less likely to cause hyponatremia, disulfiram-like reactions, or prolonged hypoglycemia.18
At maximal doses, sulfonylureas lower A1c levels by 1–2 percentage points and fasting plasma glucose concentrations by 60–70 mg/dL;15 however, the glucose lowering effect typically plateaus after half the maximal recommended dose is reached. Sulfonylureas have no consistent effect on dyslipidemia. In UK Prospective Diabetes Study (UKPDS) 33, though improved glycemic control with sulfonylureas (or insulin) led to a 25% reduction in microvascular endpoints (mostly less retinal photocoagulation) (P<.01), sulfonylureas (or insulin) did not significantly reduce death or all-cause mortality compared with diet treatment.2
Adverse effects. The primary adverse effects of sulfonylureas are weight gain and hypoglycemia. In UKPDS 33, weight gain at 10 years was 2.6 kg (99% confidence interval [CI], 1.6–3.6) with chlorpropamide and 1.7 kg (99% CI, 0.7–2.7) with glyburide, compared with patients receiving diet therapy (each P<.001).2 In the same study, the rate of major hypoglycemic episodes (third-party help or medical intervention necessary) while on therapy was 0.4%/year for chlorpropamide and 0.6%/year for glyburide, compared with 0.1%/year for diet.
Glyburide and chlorpropamide have active metabolites with renal elimination, and they should therefore be used with caution in patients with renal insufficiency. In 1971, the University Group Diabetes Project (UGDP) observed a twofold increase in the rate of cardiovascular death among patients receiving tolbutamide compared with those receiving insulin or placebo.18 This led to a decades long debate on the validity of this conclusion.19 More recently, UKPDS 33 did not demonstrate any increased cardiovascular mortality among patients receiving glyburide or chlorpropamide, and has largely negated this earlier concern.2
Cost. Sulfonylureas are the least expensive oral agents used to treat type 2 diabetes.
TABLE 3
Pharmacological treatments for type 2 diabetes: combination therapies
| Sulfonylureas | Meglitinides | Biguanides | TZDs | AGIs | |
|---|---|---|---|---|---|
| Double combination therapy option* | ✓ | ✓ | |||
| Double combination therapy option† | ✓ | ✓ | |||
| Double combination therapy option | ✓ | ✓ | |||
| Double combination therapy option | ✓ | ✓ | |||
| Double combination therapy option | ✓ | ✓ | |||
| Double combination therapy option | ✓ | ✓ | |||
| Triple combination therapy option | ✓ | ✓ | ✓ | ||
| Triple combination therapy option | ✓ | ✓ | ✓ | ||
| If therapeutic goals are not met using the above combinations; switch to insulin with or without oral agent. | |||||
| *Available as Glucovance (metformin/glyburide) or as Metaglip (metformin/glipizide) | |||||
| † Available as Avandamet (rosiglitazone/metformin) | |||||
Non-sulfonylurea secretagogues
Like sulfonylureas, the non-sulfonylurea secretagogues (non-SU), repaglinide and nateglinide, stimulate beta cells to increase insulin secretion. However, the non-SU agents mediate their action through a different, adjacent site on the “sulfonylurea receptor.” Comparatively, the non-SU agents have a faster onset of action (20 minutes), shorter half-life (about 1.0–1.5 hours), and greater effects on postprandial glucose excursions than do sulfonylureas.20 In contrast to the sulfonylureas, the extent of insulin release with non-SU agents is glucose dependent, and therefore they may have less risk of hypoglycemia several hours after meals.15
A group of metabolic abnormalities that increase cardiovascular risk has been recognized since 1988 and has been given many names—Syndrome X, insulin resistance syndrome, dysmetabolic syndrome, The Deadly Quartet.73 The National Cholesterol Education Program Adult Treatment Panel III recently recodified this syndrome as shown below. The principles for diet and exercise discussed in this article also apply to the goals of reducing obesity and physical inactivity in the metabolic syndrome, and preliminary data suggest a reduction in the risk for type 2 diabetes (NNT per year=27; P=.000174) and for cardiovascular disease.75
| Risk factor | Defining level |
|---|---|
| Abdominal obesity | Waist circumference |
| Men | >102 cm (>40 in) |
| Women | >88 cm (>35 in) |
| Triglycerides | ≥150 mg/dL |
| HDL cholesterol | |
| Men | <40 mg/dL |
| Women | <50 mg/dL |
| Blood pressure | ≥130/85 mm Hg |
| Fasting glucose | ≥110 mg/dL |
Repaglinide lowers the A1c level by 1.7–1.9 percentage points, similar in efficacy to sulfonylureas. Nateglinide appears somewhat less efficacious and lowers A1c by 0.6–1.0 percentage points.15 Nateglinide was significantly less effective than glyburide at lowering A1c levels and the fasting plasma glucose in one 24-week study. Non-SUs added to sulfonylureas produce no additional benefit in glycemic control. The effect of non-SUs on microvascular or macrovascular endpoints is unknown.
Adverse effects. Hypoglycemia is the primary adverse effect of non-SUs. Confirmed hypoglycemia (plasma glucose <60 mg/dL) was observed in 2.4% of patients taking nateglinide compared with 0.4% of those receiving placebo. Mild or moderate hypoglycemia occurred in 16% of repaglinide patients, 20% of glyburide patients, and 19% of glipizide patients in one-year comparative studies. Further comparative studies are needed to determine if non-SUs produce significantly less hypoglycemia and weight gain than sulfonylureas.
Cost. Non-SUs must be dosed 3 times daily at the start of meals. One relative disadvantage is their increased cost compared with sulfonylureas.
Biguanides
The only biguanide marketed in the US is metformin. Its primary action is to inhibit hepatic glucose production and, to a much lesser extent, enhance insulin sensitivity in peripheral tissues.21 Metformin does not stimulate insulin secretion and does not cause hypoglycemia when used as monotherapy, but it can potentiate hypoglycemia in combination with insulin or insulin secretagogues.
Metformin is similar in efficacy to the sulfonylureas. It lowers A1c by 1.5–2.0 percentage points and fasting plasma glucose by 60–80 mg/dL. Its antihyperglycemic efficacy is independent of patient age, duration of diabetes, or BMI.22
In the UKPDS 34 study, a subgroup of obese patients was randomized to receive intensive control (group 1, metformin; group 2, a sulfonylurea or insulin) or conventional diet therapy (group 3). Despite a similar reduction in the A1c level between the 2 intensive-treatment groups, patients treated with metformin had a 32% reduction for any diabetes-related endpoint (95% CI, 13–47; P=.002), 43% fewer diabetes-related deaths (95% CI, 9–63; P=.017), and a 36% reduction in all cause mortality, compared with the diet therapy group (95% CI, 9–55; P=.011).23
Metformin also showed significant benefit when compared with patients receiving sulfonylurea or insulin (group 2). The absolute risk of any diabetes endpoint was 29.8 vs. 40.1 (events per 1000 patient-years; P=.0034), all-cause mortality (13.5 vs 18.9; P=.021), and stroke (3.3 vs 6.2; P=.032), respectively, for metformin vs sulfonylurea or insulin (group 2). Thus, metformin is the only oral hypoglycemic agent proven to reduce macrovascular risk in overweight patients with type 2 diabetes. For perspective, in overweight patients, metformin significantly reduced all-cause mortality (NNT per year=141; 95% CI, 115–183; P=.011), and any diabetes-related outcome (NNT per year=74; 95% CI, 63–90; P=.0023), compared with diet alone.23,24
Metformin induces weight loss (2–3 kg), preferentially involving adipose tissue in obese patients with type 2 diabetes over 4 to 6 months.22,25 In UKPDS 34, weight gain was similar among those treated with metformin and diet (approximately 2 kg); weight gain over 10 years was less with metformin, however, than with sulfonylurea (approximately 4 kg) or insulin (approximately 6 kg).23 Metformin also significantly improved levels of total cholesterol, low-density lipoprotein (LDL) cholesterol, and triglycerides when compared with glyburide or placebo.22
Risk of lactic acidosis. Lactic acidosis associated with metformin is a rare but serious adverse event, with an estimated prevalence of 3 cases per 100,000.26 The product labeling notes most of these cases have occurred among patients with significant renal insufficiency, including both intrinsic renal disease and renal hypoperfusion. Absolute contraindications include renal disease (serum creatinine ≥1.5 mg/dL [males] and ≥1.4 mg/dL [females]), congestive heart failure requiring pharmacological treatment, and acute or chronic metabolic acidosis. It should also be discontinued at the time of radiologic studies using intravascular iodinated contrast materials.
Additional “precautionary conditions” include age ≥80 years (unless measurement of creatinine clearance demonstrates that renal function is not reduced), hepatic disease, cationic drug use, conditions associated with hypoxia (eg, chronic obstructive pulmonary disease [COPD], acute myocardial infarction, dehydration, sepsis), excessive alcohol intake, and surgery, until patient’s oral intake is resumed.
Is the risk overstated? Despite these extensive precautions, published studies show that metformin is commonly prescribed to patients with absolute contraindications.27,28 One recent study observed that 11.2% of Medicare beneficiaries hospitalized with congestive heart failure and concomitant diabetes were treated with metformin.28 In the absence of advanced renal dysfunction, metformin rarely accumulates in the body,29 and accumulation of metformin is rarely reported as a cause of lactic acidosis.30,31 Rather, tissue hypoxia acts as a trigger in most cases. Metformin should therefore be discontinued whenever tissue hypoxia is suspected.31
A recent systematic review and meta analysis found no evidence that metformin was associated with an increased risk of lactic acidosis if the drug was prescribed under study conditions, taking into account contraindications.32 Refinement and clarification of the risk for lactic acidosis in these various populations is needed, to ensure optimal patient safety and to further assess this highly effective medication.
Common adverse effects associated with metformin are diarrhea and nausea, which can be minimized by administering the drug with meals and slowly titrating the dose, or perhaps by using the extended-release formulation.
Thiazolidinediones
Thiazolidinediones (TZDs) include rosiglitazone and pioglitazone. These agents, like metformin, do not increase insulin secretion but depend on the presence of insulin for their activity. TZDs are agonists at peroxisome-proliferator-activated receptor gamma (PPAR-γ) receptors in peripheral tissues such as skeletal muscle, where they increase glucose uptake.15 Thus, their predominant effect is to decrease insulin resistance.
TZDs have similar antihyperglycemic efficacy as sulfonylureas or metformin. They decrease A1c levels by 0.6–1.9 percentage points and lower fasting plasma glucose levels by 50–80 mg/dL.15 They have a slower onset of action compared with other hypoglycemic drugs, and intervals of 3 to 4 weeks should be allowed between doses before increasing the dosage. TZDs also have favorable effects on lipid levels: HDL concentrations increase and triglyceride concentrations decrease with their use.33 It is not known whether they decrease macrovascular or microvascular complications, although such studies are underway.
Adverse effects. TZDs are typically well tolerated, though weight gain of 1–3 kg, edema (4%–5%) and anemia (1%–2%) can occur. Weight gain and edema are more pronounced when TZDs are used in combination with insulin. Anemia is likely due to increased plasma volume rather than any significant hematological effect.
Due to adverse events related to volume expansion, TZDs are not recommended for patients with New York Heart Association class III or IV heart failure. A recent consensus statement from the American Heart Association and the ADA stresses that before administering TZD treatment, the physician should explore the possible presence of cardiac disease, use of other drugs that cause fluid retention, and the pathogenesis of any existing edema or dyspnea.34
Although troglitazone was removed from the market due to its association with hepatocellular injury, pioglitazone and rosiglitazone are not as convincingly associated with liver injury.15 In preapproval clinical studies, less than 0.5% of patients treated with rosiglitzone and pioglitazone had elevations in alanine transaminase (ALT) >3 times the upper limit of normal.
The incidence of hepatitis or acute liver failure from troglitazone was compared with rosiglitazone, pioglitazone, metformin, and glyburide, by analysis of spontaneously reported adverse events to the Food and Drug Administration (FDA) MEDWATCH database during the first 15 months of marketing of each drug.35,36 The incidence of hepatitis per million prescriptions was 21.5, 14.7, 9.4, 2.9, and 4.1, respectively, while the incidence of acute liver failure per 100,000 prescriptions was 4.6, 0.9, 0.8, 0.2, and 0. It appears that postmarketing data support preclinical studies, in that the incidence of acute liver failure is an order of magnitude higher for troglitazone vs. other TZDs.35 However, the FDA recommends avoiding their use in patients with baseline ALT levels >2.5 times the upper limit of normal. The FDA recently reduced the recommended frequency for ALT monitoring for pioglitazone (and is currently considering the same for rosiglitazone). Serum ALT is recommended prior to initiation and then periodically thereafter.
Cost. TZDs are expensive relative to other hypoglycemic agents.
α-glucosidase inhibitors
The α-glucosidase inhibitors (AGIs), acarbose and miglitol, act through competitive, reversible inhibition of membrane-bound intestinal α-glucosidase, which hydrolyzes complex carbohydrates to glucose and other monosaccharides. This inhibition delays glucose absorption and decreases postprandial hyperglycemia.37 Thus, they have a nonsystemic mechanism of action.
These agents cause a modest reduction in the A1c level (0.5–1.0 percentage points) and are thus less effective than sulfonylureas, metformin, or TZDs. They do not reduce fasting plasma glucose levels, but reduce postprandial hyperglycemia by 50 mg/dL.38 No long-term studies have evaluated whether AGIs reduce diabetes-related macrovascular or microvascular outcomes.
Adverse effects. While AGIs are virtually free of serious toxicities, patient tolerability can be a problem due to adverse gastrointestinal effects. In indirect comparisons from placebo-controlled trials, patients treated with miglitol and acarbose commonly reported abdominal pain (11.7%, 19%), diarrhea (28.7%, 31%), and flatulence (41.5%, 74%), respectively. Systemic accumulation of AGIs has been shown to increase in proportion to the degree of renal insufficiency, and their use is not recommended for patients with serum creatinine >2.0 mg/dL. However, whether such patients are at greater risk of any toxicity is unknown. Acarbose at doses above 100 mg 3 times daily has been associated with elevated serum transaminase levels; however, this risk appears negligible at standard doses.
Insulin
Insulin is the oldest therapy for diabetes, and it has no upper dose limit.39 It increases insulin levels and can reduce A1c levels by 1.5 to 2.5 percentage points. Though half of diabetes patients need insulin eventually for optimal control, historically it has been introduced late in the disease process unless patients have severe hyperglycemia (fasting blood sugar >350 mg/dL) or ketonuria.38 However, it is effective in gaining initial control, decreasing gluconeogenesis and increasing glucose uptake. Disadvantages are weight gain, hypoglycemia, and patient reluctance to give injections.
When insulin is indicated. Patients who exhibit persistent hyperglycemia despite oral hypoglycemic therapy may stop the oral drug(s) and begin insulin. By combining insulin with oral therapy, lower insulin doses may be used to achieve desired control vs using insulin alone.40 For some patients a basal supplement of insulin may be sufficient and can be given as a single dose at bedtime, without an oral hypoglycemic drug.41
Insulin regimens. Various insulin regimens are available: very rapid acting (lispro and aspart), rapid acting (regular), intermediate acting (isophane insulin [NPH] and lente) and very long acting (ultralente and glargine). Glargine insulin (Lantus) has more predictable absorption than NPH, lente, and ultralente. Lantus, compared with NPH, has been associated with less nocturnal and postprandial hypoglycemia.38,42,43 This is consistent with the peakless and longer duration of glargine compared with NPH.44 A recent randomized controlled trial demonstrated that morning insulin glargine lowered A1c levels more than a bedtime dose of NPH (–1.24 vs –0.84; 95% CI, 0.23%–0.58%) or a bedtime dose of glargine (–1.24 vs –0.96%; 95% CI, 0.11%–0.46%).45 Glargine’s only relative disadvantage is increased cost.
Combination products. Combination insulin options are 70 NPH/30 regular, 50 NPH/50 regular, and 75 lispro protamine/25 lispro. Many combinations of insulin regimens have been used successfully. The typical range of insulin needed for monotherapy is 0.4–1 U/kg/d. Once-daily injection of intermediate acting or long acting insulins at bedtime or before breakfast, once-daily or twice-daily combinations of intermediate and rapid acting insulins, and more complex regimens have been used to good effect.
Using prandial insulin at each meal with separate basal insulin adds flexibility to meal times and doses administered.43 With multiple-dose intensive insulin therapy, a basal dose suppresses hepatic glucose output and the bolus doses enhance postprandial glucose uptake. This intensive insulin treatment reduces mortality among critically ill patients in surgical intensive care units and for those with acute myocardial infarction.46,47 An algorithm for using progressive therapy in diabetes mellitus is shown in Figure 2.48
FIGURE 2
ADA recommendations for the treatment of type 2 diabetes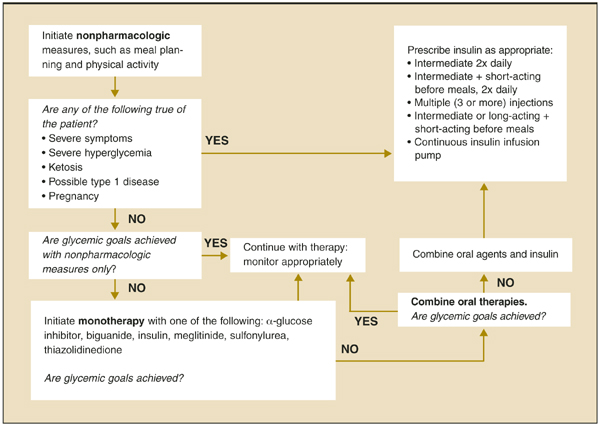
Combination Therapy
Over time glycemic control becomes more difficult, even with maximum monotherapy for patients with healthy lifestyles. It was shown in UKPDS 49 that monotherapy with sulfonylurea, metformin, or insulin eventually fails in most cases—by 3 years after diagnosis, about 50% of patients need more than monotherapy; 75% by 9 years.49 In UKPDS 33, the median A1c level increased steadily over 10 years with both conventional therapy and intensive therapy (Figure 3).2
Several options are available when monotherapy fails. Based on expert opinion, the principle is to combine drugs with different mechanisms of action to achieve an additive effect for glycemic control. Combination products may simplify the treatment regimen and improve adherence. In many instances, they may also cost less.50
Successful combinations. The combination of sulfonylurea and metformin has proven effective in many studies.22,51,52 One study showed that initial treatment with glyburide/metformin improved glycemic control better than either glyburide or metformin monotherapy (SOR: A).53,54 The addition of the non-SU secretagogues repaglinide and nateglinide to metformin significantly improved glycemic control, with repaglinide showing superiority over nateglinide.55 A TZD added to a sulfonylurea has also significantly improved A1c and fasting blood sugar results.56 Patients whose diabetes was inadequately controlled with diet alone or diet plus a sulfonylurea showed improvement with the addition of the AGI miglitol, compared with addition of placebo.57 The AGI acarbose has shown to be an effective addition to diet, metformin, sulfonylurea, and insulin.58 A TZD added to metformin has also been shown to improve glycemic control.59 A non-SU added to patients inadequately controlled with a TZD has also been effective.60
The early addition of insulin when maximal sulfonylurea therapy is inadequate has been effective.61-63 When introducing insulin, a nighttime regimen of NPH or glargine, 10 units at bedtime, is an appropriate dose (SOR: C). This is easier and less costly than often assumed, and helps improve glycemic control.64 Most patients require combination therapy as their disease progresses.39
FIGURE 3
Glycemic control in type 2 DM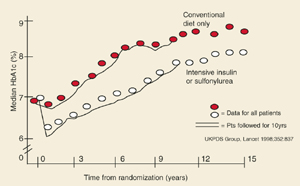
Improving Outcomes
Cumulative survey data reveal a wide gap between guideline recommendations and the care patients receive.65 One study showed that physicians initiated treatment changes only after the A1c level had reached 9.0% or higher instead of the 8.0% level recommended by ADA.66 How can the quality of management be improved?
In private practices and institutions, many interventions have been shown to improve outcomes in diabetes mellitus. Education measures work, and they include chart audits, reminder cards, pharmacist collaboration, flow sheets, and nursing initiatives.67,68 Effective disease-management programs have also used clinical guidelines, outcomes reporting, coverage of glucose meters and strips, and the support of clinical leadership.69
Computerized systems that track patients and recommended laboratory tests have improved screening rates and glycemic and blood pressure control.70 Monitoring patients’ readiness to change has allowed targeted education to improve A1c levels.71 Continuity of care has also improved the quality of disease control by increasing adherence to recommended tests and exams.72
Acknowlegments
The authors thank Marie Hamer, RN, for her continuous diabetes quality improvement efforts and Jean Camarata for her editorial and reference acquisition assistance.
Corresponding author
John E. Sutherland, MD, Northeast Iowa Family Practice Residency Program, University of Iowa College of Medicine, 2055 Kimball Avenue, Waterloo, Iowa 50702. E-mail: [email protected].
1. Vinik AI, Vinik E. Prevention of the complications of diabetes. Am J Manag Care. 2003;9 suppl:S63-S80.
2. UK Prospective Diabetes Study (UKPDS) Group. Intensive blood-glucose control with sulphonylureas or insulin compared with conventional treatment and risk of complications in patients with type 2 diabetes (UKPDS 33). Lancet. 1998;352:837-853.
3. Arauz-Pacheco C, Parrott MA, Raskin P. American Diabetes Association Treatment of hypertension in adults with diabetes. Diabetes Care. 2004;27 (suppl):S65-67.
4. UK Prospective Diabetes Study Group. Tight blood pressure control and risk of macrovascular and microvascular complications in type 2 diabetes: UKPDS 38. BMJ. 1998;317:703-713.
5. Beckman JA, Creager MA, Libby P. Diabetes and atherosclerosis: epidemiology, pathophysiology, and management. JAMA. 2002;287:2570-2581.
6. Kendall DM, Bergenstal RM. Comprehensive management of patients with type 2 diabetes: establishing priorities of care. Am J Manag Care. 2001;7 (suppl):S327-S343.
7. American Diabetes Association. Standards of medical care in Diabetes. Diabetes Care. 2004;27(suppl):15-35.
8. Peterson KA. Diabetes management in the primary care setting: summary. Am J Med. 2002;113(suppl 6A):36S-40S.
9. Ellis SE, Speroff T, Dittus RS, Brown A, Pichert JW, Elasy TA. Diabetes patient education: A meta-analysis and meta-regression. Patient Educ Couns. 2004;52:97-105.
10. Chandalia M, Garg A, Lutjohann D, et al. Beneficial effects of high dietary fiber intake in patients with type 2 diabetes mellitus. N Engl J Med. 2000;342:1392-1398.
11. Hadden DR, Montgomery DAD, Skelly RJ, et al. Maturity onset diabetes mellitus: response to intensive dietary management. Br Med J. 1975;3:276-278.
12. Niskenen LK, Uusitupa MI, Surlund H, et al. Five-year follow-up study on plasma insulin levels in newly diagnosed NIDDM patients and nondiabetic subjects. Diabetes Care. 1009;13:41-48.
13. Leibel R, Rosenbaum M, Hirsch J. Changes in energy expenditure resulting from altered body weight. N Engl J Med. 1995;332:621-628.
14. Gregg EW, Gerzoff RB, Caspersen CJ, et al. Relationship of walking to mortality among US adults with diabetes. Arch Intern Med. 2003;163:1440-1447.
15. Inzucchi SE. Oral antihyperglycemic therapy for type 2 diabetes: scientific review. JAMA. 2002;287:360-372.
16. Holmboe ES. Oral antihyperglycemic therapy for type 2 diabetes: clinical apparatus. JAMA. 2002;287:373-376.
17. Rang HP, Dale MM, Ritter JM, Moore PK. The endocrine pancreas and the control of blood glucose. In: Pharmacology. 5th ed. London: Churchill-Living-stone/Elsevier Science; 2003;380-394.
18. Davis SN, Granner DK. Insulin, oral hypoglycemic agents, and the pharmacology of the endocrine pancreas. In: Hardman JG, Limbird LE, Gilman AG, eds. Goodman & Gilman’s The Pharmacological Basis of Therapeutics. 10th ed. New York, NY: McGraw-Hill; 2001;1679-1714.
19. Goldner MG, Knatterud GL, Prout TE. Effects of hypoglycemic agents on vascular complications in patients with adult-onset diabetes. 3. Clinical implications of UGDP results. JAMA. 1971;218:1400-1410.
20. Hollander P, Schwartz SL, Gatlin MR, et al. Importance of early insulin secretion: comparison of nateglinide and glyburide in previously diet-treated patients with type 2 diabetes. Diabetes Care. 2001;24:983-988.
21. Inzucchi SE, Maggs DG, Spollett GR, et al. Efficacy and metabolic effects of metformin and troglitazone in type II diabetes mellitus. N Engl J Med. 1998;338:867-872.
22. DeFronzo RA, Goodman AM. Efficacy of metformin in patients with non-insulin-dependent diabetes mellitus. The Multicenter Metformin Study Group. N Engl J Med. 1995;333:541-549.
23. UKPDS Group Effect of intensive blood-glucose control with metformin on complications in overweight patients with type 2 diabetes (UKPDS 34). Lancet. 1998;352:854-865.
24. Shaughnessy AF, Slawson DC. What happened to the valid POEMs? A survey of review articles on the treatment of type 2 diabetes. BMJ. 2003;327:266.-
25. Stumvoll M, Nurjhan N, Perriello G, Dailey G, Gerich JE. Metabolic effects of metformin in non insulin-dependent diabetes mellitus. N Engl J Med. 1995;333:550-554.
26. Brown JB, Pedula MS, Barzilay J, et al. Lactic acidosis rates in type 2 diabetes. Diabetes Care. 1998;21:1659-1663.
27. Calabrese AT, Coley KC, DaPos SV, Swanson D, Rao RH. Evaluation of prescribing practices: risk of lactic acidosis with metformin therapy. Arch Intern Med. 2002;162:434-437.
28. Masoudi FA, Wang Y, Inzucchi SE, et al. Metformin and thiazolidinedione use in Medicare patients with heart failure. JAMA. 2003;290:81-85.
29. Scheen AJ. Clinical pharmacokinetics of metformin. Clin Pharmacokinet. 1996;30:359-371.
30. Lalau JD, Lacroix C, De Cagny B, Fournier A. Metformin-associated lactic acidosis in diabetic patients with acute renal failure. A critical analysis of its pathogenesis and prognosis. Nephrol Dial Transplant. 1994;9 (suppl 4):126-129.
31. Jones GC, Macklin JP, Alexander WD. Contraindications to the use of metformin. BMJ. 2003;3:131-132.
32. Salpeter SR, Greyber E, Pasternak GA, Salpeter EE. Risk of fatal and nonfatal lactic acidosis with metformin use in type 2 diabetes mellitus: systematic review and metaanalysis. Arch Intern Med. 2003;63:2594-2602.
33. Aronoff S, Rosenblatt S, Braithwaite S, Egan JW, Mathiesen AL, Schnieder RL. Pioglitazone hydrochloride monotherapy improves glycemic control in the treatment of patients with type 2 diabetes: a 6 month randomized placebo-controlled dose-response study. The Pioglitazone 001 Study Group. Diabetes Care. 2000;23:1605-1611.
34. Nesto RW, Bell D, Bonow RO, et al. Thiazolidinedione use, fluid retention, and congestive heart failure: a consensus statement from the American Heart Association and American Diabetes Association. October 7, 2003. Circulation. 2003;108:2941-2948.
35. Tolman KG, Chandramouli J. Hepatotoxicity of the thiazolidinediones. Clin Liver Dis. 2003;7:369-379.
36. Zawadzki JK, Green L, Graham BJ. Thioglitazone-associated 15-month post-marketing hepatotoxicity. Poster abstract. FDA Science Forum. Available at: vm.cfsan.fda.gov/~frf/forum02/a187ab4.htm. Accessed on February 25, 2004.;
37. Lebowitz HE. a-Glucosidase inhibitors as agents in the treatment of diabetes. Diabetes Rev. 1998;6:132-145.
38. Chan JL, Abrahamson MJ. Pharmacological management of type 2 diabetes mellitus: rationale for rational use of insulin. Mayo Clin Proc. 2003;78:459-467.
39. Nathan DM. Initial management of glycemia in type 2 diabetes mellitus. N Engl J Med. 2002;347:1342-1349.
40. Pugh JA, Wagner ML, Sawyer J, Ramirez G, Tuley M, Friedberg SJ. Is combination sulfonylurea and insulin therapy useful in NIDDM patients? A metaanalysis. Diabetes Care. 1992;15:953-959.
41. Cusi K, Cunningham GR, Comstock JP. Safety and efficacy of normalizing fasting glucose with bedtime NPH insulin alone in NIDDM. Diabetes Care. 1995;18:843-851.
42. White JR, Davis SN, Cooppan R, et al. Clarifying the role of insulin in type 2 diabetes management. Clinical Diabetes. 2003;1:14-21.
43. DeWitt DE, Hirsch IR. Outpatient insulin therapy in type 1 and type 2 diabetes mellitus: scientific review. JAMA. 2003;289:2254-2264.
44. - Yki, Jarvinen H, Dressler A, Ziemen M. HOE 901/3002 Study Group Less nocturnal hypoglycemia and better post-dinner glucose control with bedtime insulin glargine compared with bedtime NPH insulin during insulin combination therapy in type 2 diabetes. Diabetes Care. 2000;23:1130-1136.
45. Fritsche A, Schweitzer MA, Haring HU. 4001 Study Group Glimepiride combined with morning insulin glargine, bedtime neutral protamine hagedorn insulin, or bedtime insulin glargine in patients with type 2 diabetes. A randomized, controlled trial. Ann Intern Med. 2003;138:952-959.
46. van den Berghe G, Wouters P, Weekers F, et al. Intensive insulin therapy in critically ill patients. N Engl J Med. 2001;345:1359-1367.
47. Malmberg K, Norhammar A, Wedel H, Ryden L. Glycometabolic state at admission: important risk marker of mortality in conventionally treated patients with diabetes mellitus and acute myocardial infarction: long-term results from the Diabetes and Insulin-Glucose Infusion in Acute Myocardial Infarction (DIGAMI) study. Circulation. 1999;99:2626-2632.
48. Zimmerman BR. Therapy for type 2 diabetes mellitus. In: Medical Management of Type 2 Diabetes. 4th ed. Alexandria, Va: American Diabetes Association; 1998.;
49. Turner RC, Cull CA, Frighi V, Holman RR. Glycemic control with diet, sulfonylurea, metformin, or insulin in patients with type 2 diabetes mellitus. Progressive requirement for multiple therapies (UKPDS 49). JAMA. 1999;281:2005-2012.
50. Leichter SB, Thomas S. combination medications in diabetes care: an opportunity that merits more attention. Clin Diabetes. 2003;21:175-178.
51. Hermann LS, Schersten B, Bitzen P, et al. Therapeutic comparison of metformin and sulfonylurea, alone and in various combinations. A double-blind controlled study. Diabetes Care. 1994;17:1100-1109.
52. Jeppesen J, Zhou M, Chen Y, Reaven G. Effect of metformin on postprandial lipemia in patients with fairly to poorly controlled NIDDM. Diabetes Care. 1994;17:1093-1099.
53. Garber AJ, Larsen J, Schneider SH, et al. Simultaneous glyburide/metformin therapy is superior to component monotherapy as an initial pharmacological treatment for type 2 diabetes. Diabetes Obes Metab. 2002;4:201-208.
54. Riddle M. Combining sulfonylureas and other oral agents. Am J Med. 2000;108(suppl 6A):15S-22S.
55. Raskin P, Klaff L, McGill J, et al. Efficacy and safety of combination therapy: repaglinide plus metformin versus nateglinide plus metformin. Diabetes Care. 2003;26:2063-2068.
56. Kipnes MS, Krosnick A, Rendell MS, Egan JW, Mathisen AL, Schneider RL. Pioglitazone hydrochloride in combination with sulfonylurea therapy improves glycemic control in patients with type 2 diabetes mellitus: a randomized, placebo-controlled study. Am J Med. 2001;111:10-17.
57. Johnston PS, Feig PU, Coniff RF, Krol A, Davidson JA, Haffner SM. Long-term titrated-dose a-glucosidase inhibition in non-insulin-requiring Hispanic NIDDM patients. Diabetes Care. 1998;21:409-415.
58. Chiasson J, Josse RG, Hunt JA, et al. The efficacy of acarbose in the treatment of patients with non-insulin-dependent diabetes mellitus. A multicenter controlled clinical trial. Ann Intern Med. 1994;121:928-935.
59. Fonseca V, Rosenstock J, Patwardhan R, Salzman A. Effect of metformin and rosiglitazone combination therapy in patients with type 2 diabetes mellitus: a randomized controlled trial. JAMA. 2000;283:1695-1702.
60. Fonseca V, Grunberger G, Gupta S, Shen S, Foley JE. Addition of nateglinide to rosiglitazone monotherapy suppresses mealtime hyperglycemia and improves overall glycemic control. Diabetes Care. 2003;26:1685-1690.
61. Wright A, Burden ACF, Paisey RB, Cull CA, Holman RR; UKPDS. Sulfonylurea inadequacy: efficacy of addition of insulin over 6 years in patients with type 2 diabetes in the U.K. Prospective Diabetes Study (UKPDS 57). Diabetes Care. 2002;25:330-336.
62. Garber AJ. Benefits of combination therapy of insulin and oral hypoglycemic agents. Arch Intern Med. 2003;163:1781-1782.
63. Westphal SA, Palumbo PJ. Insulin and oral hypoglycemic agents should not be used in combination in the treatment of type 2 diabetes. Arch Intern Med. 2003;163:1783-1785.
64. DeWitt DE, Dugdale DC. Using new insulin strategies in the outpatient treatment of diabetes: clinical applications. JAMA. 2003;289:2265-2269.
65. Saaddine JB, Engelgau MM, Beckles GL, Gregg EW, Thompson TJ, Narayan KM. A diabetes report card for the United States: quality of care in the 1990s. Ann Intern Med. 2002;136:565-574.
66. Brown JB, Nichols GA. Slow response to loss of glycemic control in type 2 diabetes mellitus. Am J Manag Care. 2003;9:213-217.
67. Sutherland JE, Hoehns JD, O’Donnell B, Wiblin RT. Diabetes management quality improvement in a family practice residency program. J Am Board Fam Pract. 2001;14:243-251.
68. De Grauw W, van Gerwen W, van de Lisdonk EH, van den Hoogen HJ, van den Bosch WJ, van Weel C. Outcomes of audit-enhanced monitoring of patients with type 2 diabetes. J Fam Pract. 2002;51:459-464.
69. Sidorov J, Gabbay R, Harris R, et al. Disease management for diabetes mellitus: impact on hemoglobin A1c. Am J Manag Care. 2000;6:1217-1226.
70. Domurat ES. Diabetes managed care and clinical outcomes: the Harbor City, California Kaiser Permanente diabetes care system. Am J Manag Care. 1999;5:1299-1307.
71. Peterson K, Hughes M. Readiness to change and clinical success in a diabetes educational program. J Am Board Fam Pract. 2002;15:266-270.
72. Parchman ML, Burge SK. Continuity and quality of care in type 2 diabetes: a Residency Research Network at South Texas study. J Fam Pract. 2002;51:619-624.
73. Fagan TC, Deedwania PC. The cardiovascular dysmetabolic syndrome. Am J Med. 1998;105(suppl):77S-82S.
74. Tuomilehto J, Lindstrom J, Eriksson JG, et al. Prevention of type 2 diabetes mellitus by changes in lifestyle among subjects with impaired glucose tolerance. N Engl J Med. 2001;344:1343-1350.
75. Meigs JB. The metabolic syndrome. BMJ. 2003;327:61-62.
- Self-monitoring of blood glucose is an integral component of diabetes therapy and should always be included in the management plan (SOR:C).
- Medical nutrition therapy should be individualized, preferably by a registered dietitian familiar with diabetes (SOR:B).
- A regular physical activity program is recommended for all patients with diabetes who are capable of participating (SOR:B).
- When a monotherapy fails, combine drugs with different mechanisms of action to achieve an additive effect (SOR:A).
- The combination of sulfonylurea and metformin has proven effective in many studies. One showed that initial treatment with glyburide/metformin improved glycemic control better than either glyburide or metformin monotherapy (SOR: A).
Glycemic control in diabetes begins with a patient’s adherence to several nonpharmacologic measures. Without such a commitment, success in controlling the disease will be difficult to achieve, and otherwise appropriate drug therapy will be hindered.
Most antidiabetic agents comparably reduce glycosylated hemoglobin (A1c) levels. However, a particular agent may be preferred depending on a patient’s characteristics. And some circumstances call for combination therapy. This article reviews the advantages and disadvantages of the many pharmacologic treatments for glucose control and hyperglycemia in type 2 diabetes.
Benefits Of Diabetes Control
The benefits of diabetes control are detailed in this issue of THE JOURNAL OF FAMILY PRACTICE (“Strategies to reduce complications in type 2 diabetes,” pages 366–374). For every percentage-point reduction in hemoglobin A1c, it is possible to achieve a 22% to 35% reduction in microvascular complications.1,2 Cardiovascular disease can be reduced in patients with diabetes by treating hypertension3,4 and hyperlipidemia, prescribing aspirin therapy, using angiotensin-converting enzyme (ACE) inhibitors, and with smoking cessation.5,6
Targets For Glycemic Control
The American Diabetes Association’s (ADA) recommended targets for glycemic control are a preprandial blood glucose level of 80–120 mg/dL, a bedtime blood glucose level of 100–140 mg/dL, and a hemoglobin A1c level of <7% (with a level of >8% requiring additional measures). Hemoglobin A1c is the best determinant of glycemic exposure, and its mean value is a nationally recognized indicator of how well diabetes is being managed.7 The American College of Endocrinology has adopted a more aggressive approach by designating an A1c level of 6.5% as both a target and action level.8
Self-monitoring of blood glucose
Self-monitoring of blood glucose (SMBG) is an integral component of diabetes therapy (strength of recommendation [SOR]: C) and should always be included in the management plan (SOR: C). The optimal frequency and timing of SMBG for type 2 diabetes is not known, but they should be sufficient to facilitate reaching glucose goals. The A1c test should be performed at least semi-annually for patients with stable glycemic control, and quarterly for patients not meeting glycemic goals or those who are changing therapy. A1c levels and mean plasma glucose levels can be approximately correlated (Table 1).7
TABLE 1
Correlation between hemoglobin A1clevels and mean plasma glucose levels
| Hemoglobin A1c(%) | Mean plasma glucose (mg/dL) |
|---|---|
| 6 | 135 |
| 7 | 170 |
| 8 | 205 |
| 9 | 240 |
| 10 | 275 |
| 11 | 310 |
| 12 | 345 |
Nonpharmacologic Therapy
Nonpharmacologic measures remain the cornerstone of managing type 2 diabetes. Hyperglycemia adversely and reversibly affects both insulin resistance and insulin secretion. Improvement in glycemic control can occur through dietary modification and regular exercise.
A recent meta-analysis of randomized controlled trials of diabetes patient education observed a net decrease in HbA1c of 0.32% in intervention groups vs control.9 Interventions that included a face-to-face delivery, cognitive reframing teaching method, and exercise content were more likely to improve glycemic control.
Education
Lifestyle changes involving diet, exercise, and usually weight loss are key to effective management of diabetes. If patients are to change their behavior, they must be given detailed training.6 Self-management also necessitates that patients engage in problem solving. This requires that each aspect of the management plan is understood and agreed upon by the patient and providers, and that the goals and treatment plan are individualized and reasonable.
Diet: recommend soluble fiber, reduce calories
Medical nutrition therapy should be individualized and preferably provided by a registered dietitian familiar with diabetes (SOR: B). The goals of nutrition therapy, according to the ADA, are to attain recommended body weight and prevent or reverse obesity. The means of achieving these goals are nutrition assessment and modification of nutrient intake and lifestyle through healthy food choices and physical activity.7
A high intake of dietary fiber (particularly the soluble type) above the level recommended by the ADA improves glycemic control, decreases hyperinsulinemia, and lowers plasma lipid concentrations.10
Hypocaloric diets cause glucose plasma levels to fall, in some cases to a normal level with a weight loss of even 5 to 10 pounds.7,11 Hypoglycemic medications are of course most effective in nonobese persons. But effectiveness is also improved if weight that is gained can be limited. Despite the clear benefit of weight loss, only a few patients are able to attain and maintain substantial weight loss. Maintenance of a reduced or elevated body weight is associated with compensatory changes in energy expenditure, which oppose the maintenance of body weight that is different from the usual weight.13 Part of the individualization of therapy is respect of personal and cultural preferences, lifestyles, and financial considerations.
Physical activity: a little goes a long way
A regular physical activity program is recommended for all patients with diabetes who are capable of participating (SOR: B).7 It improves blood glucose control, reduces cardiovascular risk factors, aids weight loss, and enhances well being.7 A recently published prospective cohort study showed that walking at least 2 hours a week was associated with a 39% lower all-cause mortality (hazard rate ratio [HRR], 0.61; 95% CI, 0.48–0.78) and a 34% lower cardiovascular mortality (HRR, 0.66; 95% CI, 0.45–0.96) across a diverse spectrum of adults with diabetes. The NNT (to prevent 1 death per year) is 61 for patients who walk at least 2 hours/week.14
In prescribing a physical activity plan for a patient, consider cardiovascular disease risk factors or complications to minimize the risk of untoward events. Micro- and macrovascular disease are of course prevalent among persons with diabetes, often resulting in functional limitations that make exercise more difficult.
Other priorities
Other recommended components of care include daily aspirin use, foot care exams, tobacco cessation, pneumococcal and influenza vaccinations, and an annual dilated retinal exam.
Pharmacologic Therapy
The coexisting defects in type 2 diabetes mellitus are as follows:
- resistance to insulin action in muscle
- defective pancreatic insulin secretion
- unrestrained hepatic glucose production, aggravated by increased lipolysis in adipose tissue.
Drug therapy is aimed at each of these defects, and also at reducing carbohydrate absorption in the small intestine (Figure 1). As far as antihyperglycemic effect is concerned, no one category of antidiabetic agent is favored over another.15 Except for nateglinide and α-glucosidase inhibitors (AGIs), each of the drug categories leads to a similar reduction in A1c.16 However, patient characteristics may lead to selection of a particular agent. Table 2 summarizes oral treatment options, their relative advantages and costs.
FIGURE 1
Drug therapies for coexisting defects in type 2 diabetes
TABLE 2
Pharmacologic treatments for type 2 diabetes: monotherapies
| Target population | Advantages | Disadvantages | Dosing | Cost* |
|---|---|---|---|---|
| Sulfonylureas | ||||
| Recent type 2 DM diagnosis | Rapid FPG reduction | Weight gain | Glyburide: 1.25–20 mg once or twice daily (micronized, 0.75–12 mg once or twice daily) | $22.80 (5 mg, #120) |
| Type 2 DM <5 years duration | Low cost | Increased risk of hypoglycemia | Glipizide: 2.5–40 mg once or twice daily (extended-release, 2.5–20 mg once daily) | $14.66 (10 mg, #120) |
| Glimepiride: 1–8 mg once daily | $51.98 (10 mg, #60) | |||
| $57.98 (4 mg, #60) | ||||
| Non-sulfonylurea secretagogues (meglitinides) | ||||
| Recent type 2 DM diagnosis | Reduced risk of hypoclycemia | Higher cost | Nateglinide: 60–120 mg 3 times daily | $85.99 (120mg, #90) |
| Elevated PPG | Short-acting | Frequent dosing | Repaglinide: 0.5–4 mg 3 or 4 times daily | $218.06 (2 mg, #240) |
| Meal-adjusted dosing | ||||
| Biguanides | ||||
| Overweight/obese | No weight gain | GI side effects | Metformin: 500–1000 mg 2 or 3 times daily | $77.99 (850 mg, #90) |
| Insulin resistant | Reduced risk of hypoglycemia | High cost | Metformin XR: 1000–2000 mg once or twice daily | $89.98 (500 mg, #120) |
| Rare lactic acidosis | ||||
| TZDs | ||||
| Insulin resistant | Reduced amount of insulin | High cost | Rosiglitazone: 4–8 mg once or twice daily | $135.99 (8 mg, #30) |
| Overweight/obese | Reduced risk of hypoglycemia | Weight gain | Pioglitazone: 15–45 mg once daily | $153.99 (45 mg, #30) |
| Slow onset of action | ||||
| Liver toxicity | ||||
| AGIs | ||||
| Elevated PPG | Reduced risk of hypoglycemia | High cost | Acarbose: 50–100 mg 3 times daily | $67.99 (100 mg, #90) |
| Contraindications to other agents | Non-systemic action | GI side effects | Miglitol: 50–100 mg 3 times daily | $66.99 (100 mg, #90) |
| *Drug costs for 30 days’ supply of maximum daily dosage. From www.drugstore.com, December 2003. | ||||
| DM, diabetes mellitus; TZD, thiazolidinediones; AGT, a-glucosidase inhibitors; FPG, fasting plasma glucose; PPG, postprandial glucose; GI, gastrointestinal | ||||
Sulfonylureas
Sulfonylureas directly increase insulin secretion by binding to the sulfonylurea receptor on pancreatic beta cells; they provide a relatively quick onset of action. First-generation sulfonylureas (eg, tolbutamide, chlorpropamide) and second-generation sulfonylureas (eg, glyburide, glipizide, glimepiride) are equivalent in their maximum hypoglycemic effect.17
Second-generation agents are used more commonly than first-generation. They all contain the sulfonylurea moiety, but different chemical substitutions in the basic molecule change pharmacokinetics, resulting in different durations of action.17 Second-generation agents are probably safer than first-generation drugs, being less likely to cause hyponatremia, disulfiram-like reactions, or prolonged hypoglycemia.18
At maximal doses, sulfonylureas lower A1c levels by 1–2 percentage points and fasting plasma glucose concentrations by 60–70 mg/dL;15 however, the glucose lowering effect typically plateaus after half the maximal recommended dose is reached. Sulfonylureas have no consistent effect on dyslipidemia. In UK Prospective Diabetes Study (UKPDS) 33, though improved glycemic control with sulfonylureas (or insulin) led to a 25% reduction in microvascular endpoints (mostly less retinal photocoagulation) (P<.01), sulfonylureas (or insulin) did not significantly reduce death or all-cause mortality compared with diet treatment.2
Adverse effects. The primary adverse effects of sulfonylureas are weight gain and hypoglycemia. In UKPDS 33, weight gain at 10 years was 2.6 kg (99% confidence interval [CI], 1.6–3.6) with chlorpropamide and 1.7 kg (99% CI, 0.7–2.7) with glyburide, compared with patients receiving diet therapy (each P<.001).2 In the same study, the rate of major hypoglycemic episodes (third-party help or medical intervention necessary) while on therapy was 0.4%/year for chlorpropamide and 0.6%/year for glyburide, compared with 0.1%/year for diet.
Glyburide and chlorpropamide have active metabolites with renal elimination, and they should therefore be used with caution in patients with renal insufficiency. In 1971, the University Group Diabetes Project (UGDP) observed a twofold increase in the rate of cardiovascular death among patients receiving tolbutamide compared with those receiving insulin or placebo.18 This led to a decades long debate on the validity of this conclusion.19 More recently, UKPDS 33 did not demonstrate any increased cardiovascular mortality among patients receiving glyburide or chlorpropamide, and has largely negated this earlier concern.2
Cost. Sulfonylureas are the least expensive oral agents used to treat type 2 diabetes.
TABLE 3
Pharmacological treatments for type 2 diabetes: combination therapies
| Sulfonylureas | Meglitinides | Biguanides | TZDs | AGIs | |
|---|---|---|---|---|---|
| Double combination therapy option* | ✓ | ✓ | |||
| Double combination therapy option† | ✓ | ✓ | |||
| Double combination therapy option | ✓ | ✓ | |||
| Double combination therapy option | ✓ | ✓ | |||
| Double combination therapy option | ✓ | ✓ | |||
| Double combination therapy option | ✓ | ✓ | |||
| Triple combination therapy option | ✓ | ✓ | ✓ | ||
| Triple combination therapy option | ✓ | ✓ | ✓ | ||
| If therapeutic goals are not met using the above combinations; switch to insulin with or without oral agent. | |||||
| *Available as Glucovance (metformin/glyburide) or as Metaglip (metformin/glipizide) | |||||
| † Available as Avandamet (rosiglitazone/metformin) | |||||
Non-sulfonylurea secretagogues
Like sulfonylureas, the non-sulfonylurea secretagogues (non-SU), repaglinide and nateglinide, stimulate beta cells to increase insulin secretion. However, the non-SU agents mediate their action through a different, adjacent site on the “sulfonylurea receptor.” Comparatively, the non-SU agents have a faster onset of action (20 minutes), shorter half-life (about 1.0–1.5 hours), and greater effects on postprandial glucose excursions than do sulfonylureas.20 In contrast to the sulfonylureas, the extent of insulin release with non-SU agents is glucose dependent, and therefore they may have less risk of hypoglycemia several hours after meals.15
A group of metabolic abnormalities that increase cardiovascular risk has been recognized since 1988 and has been given many names—Syndrome X, insulin resistance syndrome, dysmetabolic syndrome, The Deadly Quartet.73 The National Cholesterol Education Program Adult Treatment Panel III recently recodified this syndrome as shown below. The principles for diet and exercise discussed in this article also apply to the goals of reducing obesity and physical inactivity in the metabolic syndrome, and preliminary data suggest a reduction in the risk for type 2 diabetes (NNT per year=27; P=.000174) and for cardiovascular disease.75
| Risk factor | Defining level |
|---|---|
| Abdominal obesity | Waist circumference |
| Men | >102 cm (>40 in) |
| Women | >88 cm (>35 in) |
| Triglycerides | ≥150 mg/dL |
| HDL cholesterol | |
| Men | <40 mg/dL |
| Women | <50 mg/dL |
| Blood pressure | ≥130/85 mm Hg |
| Fasting glucose | ≥110 mg/dL |
Repaglinide lowers the A1c level by 1.7–1.9 percentage points, similar in efficacy to sulfonylureas. Nateglinide appears somewhat less efficacious and lowers A1c by 0.6–1.0 percentage points.15 Nateglinide was significantly less effective than glyburide at lowering A1c levels and the fasting plasma glucose in one 24-week study. Non-SUs added to sulfonylureas produce no additional benefit in glycemic control. The effect of non-SUs on microvascular or macrovascular endpoints is unknown.
Adverse effects. Hypoglycemia is the primary adverse effect of non-SUs. Confirmed hypoglycemia (plasma glucose <60 mg/dL) was observed in 2.4% of patients taking nateglinide compared with 0.4% of those receiving placebo. Mild or moderate hypoglycemia occurred in 16% of repaglinide patients, 20% of glyburide patients, and 19% of glipizide patients in one-year comparative studies. Further comparative studies are needed to determine if non-SUs produce significantly less hypoglycemia and weight gain than sulfonylureas.
Cost. Non-SUs must be dosed 3 times daily at the start of meals. One relative disadvantage is their increased cost compared with sulfonylureas.
Biguanides
The only biguanide marketed in the US is metformin. Its primary action is to inhibit hepatic glucose production and, to a much lesser extent, enhance insulin sensitivity in peripheral tissues.21 Metformin does not stimulate insulin secretion and does not cause hypoglycemia when used as monotherapy, but it can potentiate hypoglycemia in combination with insulin or insulin secretagogues.
Metformin is similar in efficacy to the sulfonylureas. It lowers A1c by 1.5–2.0 percentage points and fasting plasma glucose by 60–80 mg/dL. Its antihyperglycemic efficacy is independent of patient age, duration of diabetes, or BMI.22
In the UKPDS 34 study, a subgroup of obese patients was randomized to receive intensive control (group 1, metformin; group 2, a sulfonylurea or insulin) or conventional diet therapy (group 3). Despite a similar reduction in the A1c level between the 2 intensive-treatment groups, patients treated with metformin had a 32% reduction for any diabetes-related endpoint (95% CI, 13–47; P=.002), 43% fewer diabetes-related deaths (95% CI, 9–63; P=.017), and a 36% reduction in all cause mortality, compared with the diet therapy group (95% CI, 9–55; P=.011).23
Metformin also showed significant benefit when compared with patients receiving sulfonylurea or insulin (group 2). The absolute risk of any diabetes endpoint was 29.8 vs. 40.1 (events per 1000 patient-years; P=.0034), all-cause mortality (13.5 vs 18.9; P=.021), and stroke (3.3 vs 6.2; P=.032), respectively, for metformin vs sulfonylurea or insulin (group 2). Thus, metformin is the only oral hypoglycemic agent proven to reduce macrovascular risk in overweight patients with type 2 diabetes. For perspective, in overweight patients, metformin significantly reduced all-cause mortality (NNT per year=141; 95% CI, 115–183; P=.011), and any diabetes-related outcome (NNT per year=74; 95% CI, 63–90; P=.0023), compared with diet alone.23,24
Metformin induces weight loss (2–3 kg), preferentially involving adipose tissue in obese patients with type 2 diabetes over 4 to 6 months.22,25 In UKPDS 34, weight gain was similar among those treated with metformin and diet (approximately 2 kg); weight gain over 10 years was less with metformin, however, than with sulfonylurea (approximately 4 kg) or insulin (approximately 6 kg).23 Metformin also significantly improved levels of total cholesterol, low-density lipoprotein (LDL) cholesterol, and triglycerides when compared with glyburide or placebo.22
Risk of lactic acidosis. Lactic acidosis associated with metformin is a rare but serious adverse event, with an estimated prevalence of 3 cases per 100,000.26 The product labeling notes most of these cases have occurred among patients with significant renal insufficiency, including both intrinsic renal disease and renal hypoperfusion. Absolute contraindications include renal disease (serum creatinine ≥1.5 mg/dL [males] and ≥1.4 mg/dL [females]), congestive heart failure requiring pharmacological treatment, and acute or chronic metabolic acidosis. It should also be discontinued at the time of radiologic studies using intravascular iodinated contrast materials.
Additional “precautionary conditions” include age ≥80 years (unless measurement of creatinine clearance demonstrates that renal function is not reduced), hepatic disease, cationic drug use, conditions associated with hypoxia (eg, chronic obstructive pulmonary disease [COPD], acute myocardial infarction, dehydration, sepsis), excessive alcohol intake, and surgery, until patient’s oral intake is resumed.
Is the risk overstated? Despite these extensive precautions, published studies show that metformin is commonly prescribed to patients with absolute contraindications.27,28 One recent study observed that 11.2% of Medicare beneficiaries hospitalized with congestive heart failure and concomitant diabetes were treated with metformin.28 In the absence of advanced renal dysfunction, metformin rarely accumulates in the body,29 and accumulation of metformin is rarely reported as a cause of lactic acidosis.30,31 Rather, tissue hypoxia acts as a trigger in most cases. Metformin should therefore be discontinued whenever tissue hypoxia is suspected.31
A recent systematic review and meta analysis found no evidence that metformin was associated with an increased risk of lactic acidosis if the drug was prescribed under study conditions, taking into account contraindications.32 Refinement and clarification of the risk for lactic acidosis in these various populations is needed, to ensure optimal patient safety and to further assess this highly effective medication.
Common adverse effects associated with metformin are diarrhea and nausea, which can be minimized by administering the drug with meals and slowly titrating the dose, or perhaps by using the extended-release formulation.
Thiazolidinediones
Thiazolidinediones (TZDs) include rosiglitazone and pioglitazone. These agents, like metformin, do not increase insulin secretion but depend on the presence of insulin for their activity. TZDs are agonists at peroxisome-proliferator-activated receptor gamma (PPAR-γ) receptors in peripheral tissues such as skeletal muscle, where they increase glucose uptake.15 Thus, their predominant effect is to decrease insulin resistance.
TZDs have similar antihyperglycemic efficacy as sulfonylureas or metformin. They decrease A1c levels by 0.6–1.9 percentage points and lower fasting plasma glucose levels by 50–80 mg/dL.15 They have a slower onset of action compared with other hypoglycemic drugs, and intervals of 3 to 4 weeks should be allowed between doses before increasing the dosage. TZDs also have favorable effects on lipid levels: HDL concentrations increase and triglyceride concentrations decrease with their use.33 It is not known whether they decrease macrovascular or microvascular complications, although such studies are underway.
Adverse effects. TZDs are typically well tolerated, though weight gain of 1–3 kg, edema (4%–5%) and anemia (1%–2%) can occur. Weight gain and edema are more pronounced when TZDs are used in combination with insulin. Anemia is likely due to increased plasma volume rather than any significant hematological effect.
Due to adverse events related to volume expansion, TZDs are not recommended for patients with New York Heart Association class III or IV heart failure. A recent consensus statement from the American Heart Association and the ADA stresses that before administering TZD treatment, the physician should explore the possible presence of cardiac disease, use of other drugs that cause fluid retention, and the pathogenesis of any existing edema or dyspnea.34
Although troglitazone was removed from the market due to its association with hepatocellular injury, pioglitazone and rosiglitazone are not as convincingly associated with liver injury.15 In preapproval clinical studies, less than 0.5% of patients treated with rosiglitzone and pioglitazone had elevations in alanine transaminase (ALT) >3 times the upper limit of normal.
The incidence of hepatitis or acute liver failure from troglitazone was compared with rosiglitazone, pioglitazone, metformin, and glyburide, by analysis of spontaneously reported adverse events to the Food and Drug Administration (FDA) MEDWATCH database during the first 15 months of marketing of each drug.35,36 The incidence of hepatitis per million prescriptions was 21.5, 14.7, 9.4, 2.9, and 4.1, respectively, while the incidence of acute liver failure per 100,000 prescriptions was 4.6, 0.9, 0.8, 0.2, and 0. It appears that postmarketing data support preclinical studies, in that the incidence of acute liver failure is an order of magnitude higher for troglitazone vs. other TZDs.35 However, the FDA recommends avoiding their use in patients with baseline ALT levels >2.5 times the upper limit of normal. The FDA recently reduced the recommended frequency for ALT monitoring for pioglitazone (and is currently considering the same for rosiglitazone). Serum ALT is recommended prior to initiation and then periodically thereafter.
Cost. TZDs are expensive relative to other hypoglycemic agents.
α-glucosidase inhibitors
The α-glucosidase inhibitors (AGIs), acarbose and miglitol, act through competitive, reversible inhibition of membrane-bound intestinal α-glucosidase, which hydrolyzes complex carbohydrates to glucose and other monosaccharides. This inhibition delays glucose absorption and decreases postprandial hyperglycemia.37 Thus, they have a nonsystemic mechanism of action.
These agents cause a modest reduction in the A1c level (0.5–1.0 percentage points) and are thus less effective than sulfonylureas, metformin, or TZDs. They do not reduce fasting plasma glucose levels, but reduce postprandial hyperglycemia by 50 mg/dL.38 No long-term studies have evaluated whether AGIs reduce diabetes-related macrovascular or microvascular outcomes.
Adverse effects. While AGIs are virtually free of serious toxicities, patient tolerability can be a problem due to adverse gastrointestinal effects. In indirect comparisons from placebo-controlled trials, patients treated with miglitol and acarbose commonly reported abdominal pain (11.7%, 19%), diarrhea (28.7%, 31%), and flatulence (41.5%, 74%), respectively. Systemic accumulation of AGIs has been shown to increase in proportion to the degree of renal insufficiency, and their use is not recommended for patients with serum creatinine >2.0 mg/dL. However, whether such patients are at greater risk of any toxicity is unknown. Acarbose at doses above 100 mg 3 times daily has been associated with elevated serum transaminase levels; however, this risk appears negligible at standard doses.
Insulin
Insulin is the oldest therapy for diabetes, and it has no upper dose limit.39 It increases insulin levels and can reduce A1c levels by 1.5 to 2.5 percentage points. Though half of diabetes patients need insulin eventually for optimal control, historically it has been introduced late in the disease process unless patients have severe hyperglycemia (fasting blood sugar >350 mg/dL) or ketonuria.38 However, it is effective in gaining initial control, decreasing gluconeogenesis and increasing glucose uptake. Disadvantages are weight gain, hypoglycemia, and patient reluctance to give injections.
When insulin is indicated. Patients who exhibit persistent hyperglycemia despite oral hypoglycemic therapy may stop the oral drug(s) and begin insulin. By combining insulin with oral therapy, lower insulin doses may be used to achieve desired control vs using insulin alone.40 For some patients a basal supplement of insulin may be sufficient and can be given as a single dose at bedtime, without an oral hypoglycemic drug.41
Insulin regimens. Various insulin regimens are available: very rapid acting (lispro and aspart), rapid acting (regular), intermediate acting (isophane insulin [NPH] and lente) and very long acting (ultralente and glargine). Glargine insulin (Lantus) has more predictable absorption than NPH, lente, and ultralente. Lantus, compared with NPH, has been associated with less nocturnal and postprandial hypoglycemia.38,42,43 This is consistent with the peakless and longer duration of glargine compared with NPH.44 A recent randomized controlled trial demonstrated that morning insulin glargine lowered A1c levels more than a bedtime dose of NPH (–1.24 vs –0.84; 95% CI, 0.23%–0.58%) or a bedtime dose of glargine (–1.24 vs –0.96%; 95% CI, 0.11%–0.46%).45 Glargine’s only relative disadvantage is increased cost.
Combination products. Combination insulin options are 70 NPH/30 regular, 50 NPH/50 regular, and 75 lispro protamine/25 lispro. Many combinations of insulin regimens have been used successfully. The typical range of insulin needed for monotherapy is 0.4–1 U/kg/d. Once-daily injection of intermediate acting or long acting insulins at bedtime or before breakfast, once-daily or twice-daily combinations of intermediate and rapid acting insulins, and more complex regimens have been used to good effect.
Using prandial insulin at each meal with separate basal insulin adds flexibility to meal times and doses administered.43 With multiple-dose intensive insulin therapy, a basal dose suppresses hepatic glucose output and the bolus doses enhance postprandial glucose uptake. This intensive insulin treatment reduces mortality among critically ill patients in surgical intensive care units and for those with acute myocardial infarction.46,47 An algorithm for using progressive therapy in diabetes mellitus is shown in Figure 2.48
FIGURE 2
ADA recommendations for the treatment of type 2 diabetes
Combination Therapy
Over time glycemic control becomes more difficult, even with maximum monotherapy for patients with healthy lifestyles. It was shown in UKPDS 49 that monotherapy with sulfonylurea, metformin, or insulin eventually fails in most cases—by 3 years after diagnosis, about 50% of patients need more than monotherapy; 75% by 9 years.49 In UKPDS 33, the median A1c level increased steadily over 10 years with both conventional therapy and intensive therapy (Figure 3).2
Several options are available when monotherapy fails. Based on expert opinion, the principle is to combine drugs with different mechanisms of action to achieve an additive effect for glycemic control. Combination products may simplify the treatment regimen and improve adherence. In many instances, they may also cost less.50
Successful combinations. The combination of sulfonylurea and metformin has proven effective in many studies.22,51,52 One study showed that initial treatment with glyburide/metformin improved glycemic control better than either glyburide or metformin monotherapy (SOR: A).53,54 The addition of the non-SU secretagogues repaglinide and nateglinide to metformin significantly improved glycemic control, with repaglinide showing superiority over nateglinide.55 A TZD added to a sulfonylurea has also significantly improved A1c and fasting blood sugar results.56 Patients whose diabetes was inadequately controlled with diet alone or diet plus a sulfonylurea showed improvement with the addition of the AGI miglitol, compared with addition of placebo.57 The AGI acarbose has shown to be an effective addition to diet, metformin, sulfonylurea, and insulin.58 A TZD added to metformin has also been shown to improve glycemic control.59 A non-SU added to patients inadequately controlled with a TZD has also been effective.60
The early addition of insulin when maximal sulfonylurea therapy is inadequate has been effective.61-63 When introducing insulin, a nighttime regimen of NPH or glargine, 10 units at bedtime, is an appropriate dose (SOR: C). This is easier and less costly than often assumed, and helps improve glycemic control.64 Most patients require combination therapy as their disease progresses.39
FIGURE 3
Glycemic control in type 2 DM
Improving Outcomes
Cumulative survey data reveal a wide gap between guideline recommendations and the care patients receive.65 One study showed that physicians initiated treatment changes only after the A1c level had reached 9.0% or higher instead of the 8.0% level recommended by ADA.66 How can the quality of management be improved?
In private practices and institutions, many interventions have been shown to improve outcomes in diabetes mellitus. Education measures work, and they include chart audits, reminder cards, pharmacist collaboration, flow sheets, and nursing initiatives.67,68 Effective disease-management programs have also used clinical guidelines, outcomes reporting, coverage of glucose meters and strips, and the support of clinical leadership.69
Computerized systems that track patients and recommended laboratory tests have improved screening rates and glycemic and blood pressure control.70 Monitoring patients’ readiness to change has allowed targeted education to improve A1c levels.71 Continuity of care has also improved the quality of disease control by increasing adherence to recommended tests and exams.72
Acknowlegments
The authors thank Marie Hamer, RN, for her continuous diabetes quality improvement efforts and Jean Camarata for her editorial and reference acquisition assistance.
Corresponding author
John E. Sutherland, MD, Northeast Iowa Family Practice Residency Program, University of Iowa College of Medicine, 2055 Kimball Avenue, Waterloo, Iowa 50702. E-mail: [email protected].
1. Vinik AI, Vinik E. Prevention of the complications of diabetes. Am J Manag Care. 2003;9 suppl:S63-S80.
2. UK Prospective Diabetes Study (UKPDS) Group. Intensive blood-glucose control with sulphonylureas or insulin compared with conventional treatment and risk of complications in patients with type 2 diabetes (UKPDS 33). Lancet. 1998;352:837-853.
3. Arauz-Pacheco C, Parrott MA, Raskin P. American Diabetes Association Treatment of hypertension in adults with diabetes. Diabetes Care. 2004;27 (suppl):S65-67.
4. UK Prospective Diabetes Study Group. Tight blood pressure control and risk of macrovascular and microvascular complications in type 2 diabetes: UKPDS 38. BMJ. 1998;317:703-713.
5. Beckman JA, Creager MA, Libby P. Diabetes and atherosclerosis: epidemiology, pathophysiology, and management. JAMA. 2002;287:2570-2581.
6. Kendall DM, Bergenstal RM. Comprehensive management of patients with type 2 diabetes: establishing priorities of care. Am J Manag Care. 2001;7 (suppl):S327-S343.
7. American Diabetes Association. Standards of medical care in Diabetes. Diabetes Care. 2004;27(suppl):15-35.
8. Peterson KA. Diabetes management in the primary care setting: summary. Am J Med. 2002;113(suppl 6A):36S-40S.
9. Ellis SE, Speroff T, Dittus RS, Brown A, Pichert JW, Elasy TA. Diabetes patient education: A meta-analysis and meta-regression. Patient Educ Couns. 2004;52:97-105.
10. Chandalia M, Garg A, Lutjohann D, et al. Beneficial effects of high dietary fiber intake in patients with type 2 diabetes mellitus. N Engl J Med. 2000;342:1392-1398.
11. Hadden DR, Montgomery DAD, Skelly RJ, et al. Maturity onset diabetes mellitus: response to intensive dietary management. Br Med J. 1975;3:276-278.
12. Niskenen LK, Uusitupa MI, Surlund H, et al. Five-year follow-up study on plasma insulin levels in newly diagnosed NIDDM patients and nondiabetic subjects. Diabetes Care. 1009;13:41-48.
13. Leibel R, Rosenbaum M, Hirsch J. Changes in energy expenditure resulting from altered body weight. N Engl J Med. 1995;332:621-628.
14. Gregg EW, Gerzoff RB, Caspersen CJ, et al. Relationship of walking to mortality among US adults with diabetes. Arch Intern Med. 2003;163:1440-1447.
15. Inzucchi SE. Oral antihyperglycemic therapy for type 2 diabetes: scientific review. JAMA. 2002;287:360-372.
16. Holmboe ES. Oral antihyperglycemic therapy for type 2 diabetes: clinical apparatus. JAMA. 2002;287:373-376.
17. Rang HP, Dale MM, Ritter JM, Moore PK. The endocrine pancreas and the control of blood glucose. In: Pharmacology. 5th ed. London: Churchill-Living-stone/Elsevier Science; 2003;380-394.
18. Davis SN, Granner DK. Insulin, oral hypoglycemic agents, and the pharmacology of the endocrine pancreas. In: Hardman JG, Limbird LE, Gilman AG, eds. Goodman & Gilman’s The Pharmacological Basis of Therapeutics. 10th ed. New York, NY: McGraw-Hill; 2001;1679-1714.
19. Goldner MG, Knatterud GL, Prout TE. Effects of hypoglycemic agents on vascular complications in patients with adult-onset diabetes. 3. Clinical implications of UGDP results. JAMA. 1971;218:1400-1410.
20. Hollander P, Schwartz SL, Gatlin MR, et al. Importance of early insulin secretion: comparison of nateglinide and glyburide in previously diet-treated patients with type 2 diabetes. Diabetes Care. 2001;24:983-988.
21. Inzucchi SE, Maggs DG, Spollett GR, et al. Efficacy and metabolic effects of metformin and troglitazone in type II diabetes mellitus. N Engl J Med. 1998;338:867-872.
22. DeFronzo RA, Goodman AM. Efficacy of metformin in patients with non-insulin-dependent diabetes mellitus. The Multicenter Metformin Study Group. N Engl J Med. 1995;333:541-549.
23. UKPDS Group Effect of intensive blood-glucose control with metformin on complications in overweight patients with type 2 diabetes (UKPDS 34). Lancet. 1998;352:854-865.
24. Shaughnessy AF, Slawson DC. What happened to the valid POEMs? A survey of review articles on the treatment of type 2 diabetes. BMJ. 2003;327:266.-
25. Stumvoll M, Nurjhan N, Perriello G, Dailey G, Gerich JE. Metabolic effects of metformin in non insulin-dependent diabetes mellitus. N Engl J Med. 1995;333:550-554.
26. Brown JB, Pedula MS, Barzilay J, et al. Lactic acidosis rates in type 2 diabetes. Diabetes Care. 1998;21:1659-1663.
27. Calabrese AT, Coley KC, DaPos SV, Swanson D, Rao RH. Evaluation of prescribing practices: risk of lactic acidosis with metformin therapy. Arch Intern Med. 2002;162:434-437.
28. Masoudi FA, Wang Y, Inzucchi SE, et al. Metformin and thiazolidinedione use in Medicare patients with heart failure. JAMA. 2003;290:81-85.
29. Scheen AJ. Clinical pharmacokinetics of metformin. Clin Pharmacokinet. 1996;30:359-371.
30. Lalau JD, Lacroix C, De Cagny B, Fournier A. Metformin-associated lactic acidosis in diabetic patients with acute renal failure. A critical analysis of its pathogenesis and prognosis. Nephrol Dial Transplant. 1994;9 (suppl 4):126-129.
31. Jones GC, Macklin JP, Alexander WD. Contraindications to the use of metformin. BMJ. 2003;3:131-132.
32. Salpeter SR, Greyber E, Pasternak GA, Salpeter EE. Risk of fatal and nonfatal lactic acidosis with metformin use in type 2 diabetes mellitus: systematic review and metaanalysis. Arch Intern Med. 2003;63:2594-2602.
33. Aronoff S, Rosenblatt S, Braithwaite S, Egan JW, Mathiesen AL, Schnieder RL. Pioglitazone hydrochloride monotherapy improves glycemic control in the treatment of patients with type 2 diabetes: a 6 month randomized placebo-controlled dose-response study. The Pioglitazone 001 Study Group. Diabetes Care. 2000;23:1605-1611.
34. Nesto RW, Bell D, Bonow RO, et al. Thiazolidinedione use, fluid retention, and congestive heart failure: a consensus statement from the American Heart Association and American Diabetes Association. October 7, 2003. Circulation. 2003;108:2941-2948.
35. Tolman KG, Chandramouli J. Hepatotoxicity of the thiazolidinediones. Clin Liver Dis. 2003;7:369-379.
36. Zawadzki JK, Green L, Graham BJ. Thioglitazone-associated 15-month post-marketing hepatotoxicity. Poster abstract. FDA Science Forum. Available at: vm.cfsan.fda.gov/~frf/forum02/a187ab4.htm. Accessed on February 25, 2004.;
37. Lebowitz HE. a-Glucosidase inhibitors as agents in the treatment of diabetes. Diabetes Rev. 1998;6:132-145.
38. Chan JL, Abrahamson MJ. Pharmacological management of type 2 diabetes mellitus: rationale for rational use of insulin. Mayo Clin Proc. 2003;78:459-467.
39. Nathan DM. Initial management of glycemia in type 2 diabetes mellitus. N Engl J Med. 2002;347:1342-1349.
40. Pugh JA, Wagner ML, Sawyer J, Ramirez G, Tuley M, Friedberg SJ. Is combination sulfonylurea and insulin therapy useful in NIDDM patients? A metaanalysis. Diabetes Care. 1992;15:953-959.
41. Cusi K, Cunningham GR, Comstock JP. Safety and efficacy of normalizing fasting glucose with bedtime NPH insulin alone in NIDDM. Diabetes Care. 1995;18:843-851.
42. White JR, Davis SN, Cooppan R, et al. Clarifying the role of insulin in type 2 diabetes management. Clinical Diabetes. 2003;1:14-21.
43. DeWitt DE, Hirsch IR. Outpatient insulin therapy in type 1 and type 2 diabetes mellitus: scientific review. JAMA. 2003;289:2254-2264.
44. - Yki, Jarvinen H, Dressler A, Ziemen M. HOE 901/3002 Study Group Less nocturnal hypoglycemia and better post-dinner glucose control with bedtime insulin glargine compared with bedtime NPH insulin during insulin combination therapy in type 2 diabetes. Diabetes Care. 2000;23:1130-1136.
45. Fritsche A, Schweitzer MA, Haring HU. 4001 Study Group Glimepiride combined with morning insulin glargine, bedtime neutral protamine hagedorn insulin, or bedtime insulin glargine in patients with type 2 diabetes. A randomized, controlled trial. Ann Intern Med. 2003;138:952-959.
46. van den Berghe G, Wouters P, Weekers F, et al. Intensive insulin therapy in critically ill patients. N Engl J Med. 2001;345:1359-1367.
47. Malmberg K, Norhammar A, Wedel H, Ryden L. Glycometabolic state at admission: important risk marker of mortality in conventionally treated patients with diabetes mellitus and acute myocardial infarction: long-term results from the Diabetes and Insulin-Glucose Infusion in Acute Myocardial Infarction (DIGAMI) study. Circulation. 1999;99:2626-2632.
48. Zimmerman BR. Therapy for type 2 diabetes mellitus. In: Medical Management of Type 2 Diabetes. 4th ed. Alexandria, Va: American Diabetes Association; 1998.;
49. Turner RC, Cull CA, Frighi V, Holman RR. Glycemic control with diet, sulfonylurea, metformin, or insulin in patients with type 2 diabetes mellitus. Progressive requirement for multiple therapies (UKPDS 49). JAMA. 1999;281:2005-2012.
50. Leichter SB, Thomas S. combination medications in diabetes care: an opportunity that merits more attention. Clin Diabetes. 2003;21:175-178.
51. Hermann LS, Schersten B, Bitzen P, et al. Therapeutic comparison of metformin and sulfonylurea, alone and in various combinations. A double-blind controlled study. Diabetes Care. 1994;17:1100-1109.
52. Jeppesen J, Zhou M, Chen Y, Reaven G. Effect of metformin on postprandial lipemia in patients with fairly to poorly controlled NIDDM. Diabetes Care. 1994;17:1093-1099.
53. Garber AJ, Larsen J, Schneider SH, et al. Simultaneous glyburide/metformin therapy is superior to component monotherapy as an initial pharmacological treatment for type 2 diabetes. Diabetes Obes Metab. 2002;4:201-208.
54. Riddle M. Combining sulfonylureas and other oral agents. Am J Med. 2000;108(suppl 6A):15S-22S.
55. Raskin P, Klaff L, McGill J, et al. Efficacy and safety of combination therapy: repaglinide plus metformin versus nateglinide plus metformin. Diabetes Care. 2003;26:2063-2068.
56. Kipnes MS, Krosnick A, Rendell MS, Egan JW, Mathisen AL, Schneider RL. Pioglitazone hydrochloride in combination with sulfonylurea therapy improves glycemic control in patients with type 2 diabetes mellitus: a randomized, placebo-controlled study. Am J Med. 2001;111:10-17.
57. Johnston PS, Feig PU, Coniff RF, Krol A, Davidson JA, Haffner SM. Long-term titrated-dose a-glucosidase inhibition in non-insulin-requiring Hispanic NIDDM patients. Diabetes Care. 1998;21:409-415.
58. Chiasson J, Josse RG, Hunt JA, et al. The efficacy of acarbose in the treatment of patients with non-insulin-dependent diabetes mellitus. A multicenter controlled clinical trial. Ann Intern Med. 1994;121:928-935.
59. Fonseca V, Rosenstock J, Patwardhan R, Salzman A. Effect of metformin and rosiglitazone combination therapy in patients with type 2 diabetes mellitus: a randomized controlled trial. JAMA. 2000;283:1695-1702.
60. Fonseca V, Grunberger G, Gupta S, Shen S, Foley JE. Addition of nateglinide to rosiglitazone monotherapy suppresses mealtime hyperglycemia and improves overall glycemic control. Diabetes Care. 2003;26:1685-1690.
61. Wright A, Burden ACF, Paisey RB, Cull CA, Holman RR; UKPDS. Sulfonylurea inadequacy: efficacy of addition of insulin over 6 years in patients with type 2 diabetes in the U.K. Prospective Diabetes Study (UKPDS 57). Diabetes Care. 2002;25:330-336.
62. Garber AJ. Benefits of combination therapy of insulin and oral hypoglycemic agents. Arch Intern Med. 2003;163:1781-1782.
63. Westphal SA, Palumbo PJ. Insulin and oral hypoglycemic agents should not be used in combination in the treatment of type 2 diabetes. Arch Intern Med. 2003;163:1783-1785.
64. DeWitt DE, Dugdale DC. Using new insulin strategies in the outpatient treatment of diabetes: clinical applications. JAMA. 2003;289:2265-2269.
65. Saaddine JB, Engelgau MM, Beckles GL, Gregg EW, Thompson TJ, Narayan KM. A diabetes report card for the United States: quality of care in the 1990s. Ann Intern Med. 2002;136:565-574.
66. Brown JB, Nichols GA. Slow response to loss of glycemic control in type 2 diabetes mellitus. Am J Manag Care. 2003;9:213-217.
67. Sutherland JE, Hoehns JD, O’Donnell B, Wiblin RT. Diabetes management quality improvement in a family practice residency program. J Am Board Fam Pract. 2001;14:243-251.
68. De Grauw W, van Gerwen W, van de Lisdonk EH, van den Hoogen HJ, van den Bosch WJ, van Weel C. Outcomes of audit-enhanced monitoring of patients with type 2 diabetes. J Fam Pract. 2002;51:459-464.
69. Sidorov J, Gabbay R, Harris R, et al. Disease management for diabetes mellitus: impact on hemoglobin A1c. Am J Manag Care. 2000;6:1217-1226.
70. Domurat ES. Diabetes managed care and clinical outcomes: the Harbor City, California Kaiser Permanente diabetes care system. Am J Manag Care. 1999;5:1299-1307.
71. Peterson K, Hughes M. Readiness to change and clinical success in a diabetes educational program. J Am Board Fam Pract. 2002;15:266-270.
72. Parchman ML, Burge SK. Continuity and quality of care in type 2 diabetes: a Residency Research Network at South Texas study. J Fam Pract. 2002;51:619-624.
73. Fagan TC, Deedwania PC. The cardiovascular dysmetabolic syndrome. Am J Med. 1998;105(suppl):77S-82S.
74. Tuomilehto J, Lindstrom J, Eriksson JG, et al. Prevention of type 2 diabetes mellitus by changes in lifestyle among subjects with impaired glucose tolerance. N Engl J Med. 2001;344:1343-1350.
75. Meigs JB. The metabolic syndrome. BMJ. 2003;327:61-62.
Strategies to reduce complications of type 2 diabetes
- Control blood pressure to at least 150/80 mm Hg or lower to reduce mortality for patients with type 2 diabetes (A). Strongly consider the use of an angiotensin-converting enzyme (ACE) inhibitor to reduce the incidence of myocardial infarction (MI) and total mortality (A).
- In obese patients with type 2 diabetes, consider the use of metformin, unless contraindicated (A).
- Consider the use of a statin for patients with diabetes, even when their cholesterol level is normal (A).
- Screen patients with type 2 diabetes for peripheral neuropathy and peripheral vascular disease to reduce the risk of major amputation (B).
Diabetes need not automatically sentence patients to the well-known ravages of the disease. Evidence-supported preventive strategies can forestall complications.
Increasing evidence suggests diabetes can be prevented by a combination of lifestyle changes and medications. Key interventions for patients with established type 2 diabetes include tight control of blood glucose levels, reduction of blood pressure and lipid levels, and early identification of diabetes-related neuropathy, nephropathy, and retinopathy. Antiplatelet therapy may also be beneficial.
Primary prevention: should intervention begin with prediabetes states?
Treatment of risk factors for diabetes (eg, obesity) and management of prediabetes (eg, impaired glucose tolerance) has suggested early intervention can forestall the development of type 2 diabetes (Table 1). Three trials addressed intensive lifestyle/diet modification. Though the onset of clinically diagnosed diabetes was delayed while patients adhered to these strategies, long-term studies of lifestylemodification have not been performed.1–3
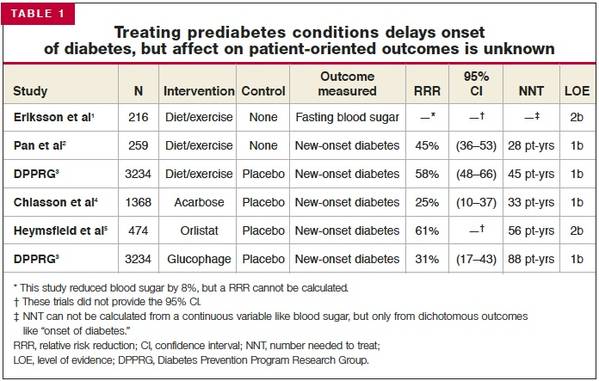
Several other investigations have looked at whether prescription medications achieve similar benefit. Metformin,3 acarbose,4 and orlistat5 have been studied in populations with prediabetes. These interventions appear to delay the onset of diabetes (number needed to treat [NNT]=33–88 patient-years) and to reduce blood sugar levels by 5% to 10%. A post-hoc analysis of the Heart Outcomes Prevention Evaluation (HOPE) trial6 also suggests a favorable effect with the ACE inhibitor, ramipril (NNT=250 patient-years). However, patient-oriented outcomes—development of microvascular or macrovascular disease—were not assessed in these trials. Consequently, the ultimate benefit of treating prediabetes states remains uncertain.
SECONDARY PREVENTION: DOES EARLY DETECTION OF DIABETES HELP DELAY COMPLICATIONS?
No randomized trial of screening has reported any patient-oriented benefits. However, based on consensus opinion, the American Diabetes Association (ADA) recommends screening every person aged 45 years and older every 3 years (strength of recommendation [SOR]: C).7 The characteristics of a clinically recognized disease like diabetes, however, may differ significantly from the characteristics of the subclinical states that would be recognized with screening. Therefore, though the US Preventive Health Services Task Force8 has concluded there is no evidence to recommend screening average risk individuals for diabetes, it does recommend screening individuals at increased risk of macrovascular changes (eg, those with hypertension) (SOR: B). This is based in part on indirect evidence that tighter blood pressure targets may be beneficial for patients with diabetes. (See the Clinical Inquiry, “Does screening for diabetes in at-risk patients improve long-term outcomes?”)
Tertiary prevention: preventing complications of existing diabetes
Patient-oriented outcomes in diabetes can be significantly improved with numerous interventions (Table 2).
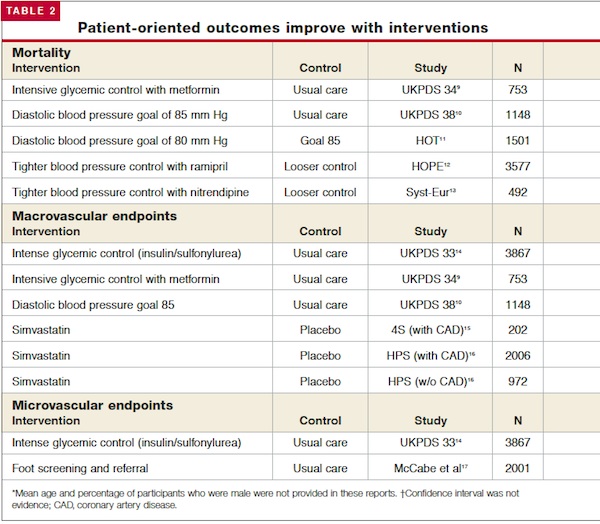
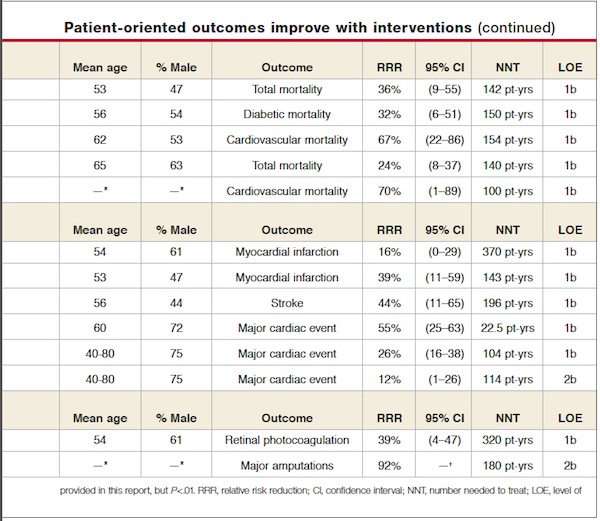
Tight glycemic control warranted
The United Kingdom Prospective Diabetes Study14 (UKPDS) randomized participants to usual diabetic care or intensive glycemic control with insulin or sulfonylureas over 10 years. Intensive control reduced average hemoglobin A1c from 7.9% to 7.0%; it also reduced aggregate microvascular complications, mainly a relative 39% decreased need for photocoagulation for diabetic retinopathy (NNT=320 patient-years). No other individual endpoint was independently affected.
The UKPDS suggested a trend toward 16% fewer relative MIs in the intensive control group; however, the results did not reach statistical significance (P=.052). In addition an increase in major hypoglycemic episodes was noted, worse with insulin than sulfonylureas (relative risk [RR]=257%; number needed to harm [NNH]=1110 patient-years).
Approach to obese patients. The UKPDS also studied intensive control with metformin among a subgroup of obese patients with diabetes (>120% ideal body weight).9 Metformin lowered average hemoglobin A1c only from 8.0% to 7.4%, but reduced relative total mortality by 36% (NNT=142 patient-years). Metformin also reduced the relative chance of MI by 39% (NNT=143 patient-years).
These benefits were reversed, however, in a separate UKPDS subgroup placed first on a sulfonylurea, then receiving metformin if glycemic control was inadequate. Total mortality was relatively increased by 60% (NNH=89 patient-years).9 This adverse outcome disappeared when adjustment was made for age, sex, ethnic group, and glycemic control.
Other potential risks of metformin include lactic acidosis, but 1 recent systematic review found no associated cases of this condition with metformin prescribed in published studies.17
Applying the evidence. Initial treatment of patients with diabetes over 120% of ideal body weight should include tight glucose control with metformin, unless contraindicated (SOR: A). For leaner patients, therapy with a sulfonylurea or insulin is supported by evidence (SOR: B).
Control blood pressure to below 150/80 mm Hg
The UKPDS also compared tight blood pressure control (aiming at systolic <150 mm Hg and diastolic <80) with usual treatment. Tight control reduced relative deaths attributed to diabetes by 32% (NNT=150 patient-years), and demonstrated a trend toward reduced total mortality that was not statistically significant (relative risk reduction [RRR]=18%; 95% confidence interval [CI], –0.8% to 37%). Both stroke (NNT=196 patient-years) and the aggregate endpoint of “all microvascular disease” (NNT=139 patient-years) were significantly reduced by tight blood pressure control.10
The Hypertension Optimal Treatment (HOT) Study Group11 compared various levels of blood pressure control. A reduction in cardiovascular mortality was significant even between those treated with a goal of 80 and 85 mm Hg diastolic (RRR=67%; NNT=133 patient-years). The trend toward reduction in total mortality in this trial also approached statistical significance (P=.068; RRR=42%).
The Syst-Eur trial13 compared tight blood pressure control on nitrendipine with looser control with a variety of agents. Cardiovascular mortality was reduced by 30% with tight control (NNT=100 patient-years).
The Heart Outcomes Prevention Evaluation (HOPE) study6 included patients with diabetes, of which only 56% had a diagnosis of hypertension. It randomized participants to receive ramipril or placebo, in addition to any off-study antihypertensive agents they were already using. The intervention group had both lower average blood pressures as well as lower total mortality by 24% (NNT=140 patient-years).
Type 2 diabetes is the second most common problem seen by family physicians, and represents over 4% of office visits.19 The cost to society is staggering: in the United States, $100 billion was spent in 1997 alone.20 Its toll in clinical outcomes is also dramatic, leading to over 150,000 annual deaths in the US.20
Left unchecked, diabetes leads to microvascular and macrovascular complications. Cardiovascular disease occurs 2 to 3 times more often among patients with diabetes than healthy individuals,21,22 and is also linked to impaired glucose tolerance.23 Cardiovascular events are responsible for over half of deaths in patients with diabetes.20
Each year, neuropathy contributes to ulcers in 2% of patients with diabetes, and amputation in 0.6%.24 Proteinuria occurs in 20% to 40% of all patients with diabetes7; of those, 20% rapidly develop end-stage renal disease.25 Retinopathy is treated at a rate of 1% per year among patients with diabetes.14
Choice of agent important. Lower blood pressure goals have consistently demonstrated benefit across multiple studies. The choice of antihypertensive agent may also affect outcomes (Table 3). The UKPDS blood pressure analysis was also stratified to evaluate whether the results of blood pressure treatment differed between captopril and atenolol. Though compliance was slightly better with captopril, there were no differences in patient-oriented outcomes between the groups.26
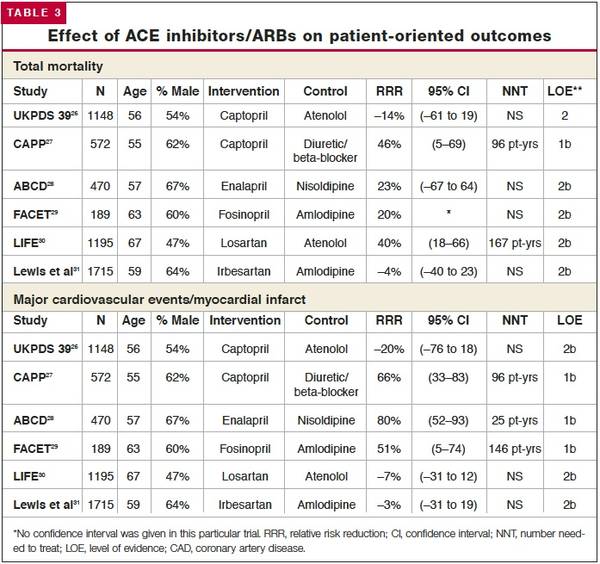
The Captopril Prevention Project (CAPPP)27 compared captopril with diuretics and betablockers alone or in combination. While blood pressure control was about the same in all study groups, the captopril group realized a 66% reduction in MI (NNT=96 patient-years) and a total mortality 46% less than that seen with the other agents (NNT=96 patient-years).
The Appropriate Blood Pressure Control in Diabetes (ABCD) trial28 compared nisoldipine and enalapril. Participants randomized to receive the ACE inhibitor had an 80% decreased risk of MI (NNT=25 patient-years).
In the Fosinopril versus Amlodipine Cardiovascular Events Trial (FACET),29 blood pressure was better controlled with amlodipine, but major vascular events were 51% fewer with the ACE inhibitor (NNT=146 patient-years), again supporting the superior performance of ACE inhibitors.
Angiotensin receptor blockers (ARBs) may have comparable effects to ACE inhibitors. The Losartan Intervention For Endpoint Reduction in Hypertension (LIFE) trial30 studied patients with left ventricular hypertrophy, diabetes, and hypertension, comparing losartan with atenolol. Total mortality with losartan was reduced by a relative 40% compared with atenolol (NNT=167 patientyears). Another study31 of patients with diabetes, hypertension, and nephropathy compared irbesartan with amlodipine. This trial demonstrated no differences in patient-oriented outcomes between the calcium-channel blocker and the ARB.
Applying the evidence. The goals for blood pressure control in type 2 diabetes should be less than 150 mm Hg systolic and 80 mm Hg diastolic (SOR: A). Evidence also strongly supports the use of an ACE inhibitor, or possibly ARB, as first-linetreatment for hypertension in diabetes (SOR: A). Many authorities recommend even more aggressive blood pressure goals.
Lipid management: statins improve outcome
Lowering elevated triglycerides has not been independently associated with an improvement in patient-oriented outcomes. In the Helsinki Heart Study22 and the St. Mary’s, Ealing, Northwick Park Diabetes Cardiovascular Disease Prevention (SENDCAP) trial,32 a fibric acid derivative was compared with placebo. The average triglyceride concentration was decreased, but no significant effect on coronary events was noted. However, elevated triglycerides are associated with the metabolic syndrome, which may warrant lifestyle changes or medication (based on expert opinion).
Treatment with hydroxymethyl glutaryl coenzyme A reductase inhibitors (statins) has better supporting evidence. In the Scandinavia Simvastatin Survival Study (4S),15 202 patients with diabetes, coronary artery disease, and elevated cholesterol were randomized to receive simvastatin or placebo. Major coronary events were reduced by 55% with simvastatin (NNT=22.5 patient-years). Total mortality was reduced, but not to a statistically significant extent (P=.087; RRR=43%).
The Air Force/Texas Coronary Atherosclerosis Prevention Study33 (AFCAPS/TexCAPS) compared lovastatin with placebo for patients with diabetes and healthy individuals with normal cholesterol levels. Though the overall population demonstrated a 37% reduction in first coronary events, the diabetes subgroup had insufficient power to confirm this trend independently.
The Antihypertensive and Lipid-Lowering Treatment to Prevent Heart Attack Trial34 (ALLHAT-LLT) randomized 3638 patients with diabetes to receive pravastatin 40 mg or placebo. No changes were seen in total mortality or cardiovascular events. These results may have been confounded by off-study prescription for statins, given to 32% of those randomized to the placebo group.
The best independent evidence for use of statins in diabetes comes from the Heart Protection Study16 of 3982 patients with diabetes with a total cholesterol level >135 mg/dL and no evidence of coronary disease. They were randomized to receive 40 mg simvastatin or placebo for 5 years. First major vascular events (MI or stroke) were decreased in the simvastatin group by 26% over 5 years (NNT=104 patient-years).
Applying the evidence. Reducing elevated triglycerides in type 2 diabetes is not supported by clear evidence, although elevated triglycerides may be associated with the metabolic syndrome and may warrant lifestyle change (SOR: C).
However, statins—even for those with a normal cholesterol level—reduce macrovascular outcomes (SOR: A), a measure now endorsed by the American College of Physicians.
Anti-platelet therapy
Aspirin prophylaxis in diabetes has weaker support. The Early Treatment Diabetic Retinopathy Study35 (ETDRS) randomized 3711 patients with diabetes to receive aspirin 650 mg or placebo. No benefit in mortality or cardiovascular event rates was documented after 5 years. However, the results did suggest a nonsignificant trend toward reduction of MI (RRR=17%; 95% CI, –4% to 34%; NNT=333).
In the Physician’s Health Study,36 22,071 participants (most of whom did not have diabetes) were randomized to receive aspirin 325 mg every other day or placebo. MI was reduced by 44% with aspirin (NNT=500). The risk of MI in the subgroup of 533 individuals with diabetes paralleled this reduction (RRR=39%), though, independently, the reduction in the subgroup did not reach statistical significance. Bleeding problems were the most common adverse effect of the aspirin, and were increased by 32% (NNH=78 person-years).
In the HOT study,11 a subgroup of 1501 patients with diabetes was randomized to receive aspirin 75 mg or placebo daily. The rate of MI trended downward with aspirin but was not statistically significant. Among the 18,790 patients in this study (most of whom did not have diabetes), MI was 36% less likely to occur with aspirin (NNT=770).
Applying the evidence. Overall, there is some suggestion that persons with cardiac risk factors, like type 2 diabetes, benefit by taking low-dose aspirin to avoid macrovascular complications. No study has confirmed this in a population of individuals with diabetes, but the trends suggest a possible benefit (SOR: C). The decision to use aspirin should be made in consultation with an informed patient.
SCREENING FOR NEUROPATHY
One trial17 has been conducted on screening for neuropathy. It compared monofilament testing and palpation of pedal pulses with “no special care.” Patients with an original positive screen result received a calculation of their ankle-brachial index, foot x-rays, and other measurements, and were referred to a high-risk podiatry clinic if the second level testing showed abnormal results. Major amputations were decreased in the screened group by 92% over 2 years (NNT=180 patient-years). This evidence of benefit is sufficient to recommend screening patients with diabetes for peripheral neuropathy or peripheral vascular disease, and appropriate referral (SOR: B). (See the Clinical Inquiry, “What is the best treatment for diabetic neuropathy?”)
Screening for nephropathy
One systematic review37 found no randomized trials of screening for urinary microalbumin and how it might affect overt nephropathy. However, several studies have looked at treatment of gross proteinuria, and have demonstrated some benefit in patient-oriented outcomes. Improved blood pressure control has reduced progression of nephropathy to end-stage renal disease.38,39 Other studies have suggested that an ACE inhibitor or ARB might provide benefit.30,39
The ADA recommends annual screening for microalbumin based on expert consensus (SOR: C).7 Though early detection of microalbumin might optimize the treatment of nephropathy, it is also possible that screening may detect a population whose disease would have remained subclinical indefinitely. No clear evidence suggests that screening for microalbumin reduces the incidence of patient-oriented outcomes.
Screening for retinopathy
Several trials have evaluated interventions in the diagnosis and prevention of visual loss. As discussed previously, intensive glucose control with sulfonylureas or insulin reduced the need for retinal photocoagulation by 39% in the UKPDS (NNT=320 patient-years).14 Similarly in this trial, tight blood pressure control reduced the progression of retinopathy, compared with usual care. 10
Specific treatments for retinopathy include photocoagulation, which has been demonstrated to significantly reduce severe visual loss by 58% (NNT=30 patient-years).40 One cohort study suggests that screening for retinopathy coupled with appropriate treatment may reduce the onset of visual loss.41 The ADA recommends annual screening for retinopathy with a dilated eye exam based on indirect evidence of its benefit (SOR: B).7
- Acarbose
- Amlodipine
- Atenolol
- Captopril
- Enalapril
- Fosinopril
- Irbesartan
- Losartan
- Lovastatin
- Metformin
- Nisoldipine
- Orlistat
- Pravastatin
- Ramipril
- Simvastatin
- Prandase, Precose
- Norvasc
- Tenoretic; Tenormin
- Capoten
- Vasotec
- Monopril
- Avapro
- Cozaar
- Mevacor
- Glucophage
- Sular
- Xenical
- Pravachol
- Altace
- Zocor
Correspondence
Paul Ullom-Minnich, MD, Partners in Family Care, PO Box 640, Moundridge, KS 67107. E-mail: [email protected].
1. Eriksson J, Lindstrom J, Valle T, et al. Prevention of type II diabetes in subjects with impaired glucose tolerance: the Diabetes Prevention Study (DPS) in Finland. Study design and 1-year interim report on the feasibility of the lifestyle intervention programme. Diabetologia 1999;42:793-801.
2. Pan XR, Li GW, Hu YH, et al. Effects of diet and exercise in preventing NIDDM in people with impaired glucose tolerance. The Da Qing IGT and Diabetes Study. Diabetes Care 1997;20:537.-
3. Diabetes Prevention Program Research Group. Reduction in the incidence of type 2 diabetes with lifestyle intervention or metformin. N Engl J Med 2002;346:393-403.
4. Chiasson JL, Josse RG, Gomis R, Hanefield M, Karasik A, Laasko M. STOP-NIDDM Trial Research Group. Acarbose for prevention of type 2 diabetes mellitus: the STOP-NIDDM randomized trial. Lancet 2002;359:2072-2077.
5. Heymsfield SB, Segal KR, Hauptman J, et al. Effects of weight loss with orlistat on glucose tolerance and progression to type 2 diabetes in obese adults. Arch Intern Med 2000;160:1321-1326.
6. Yusuf S, Gerstein H, Hoogwerf B, et al. HOPE Study Investigators Ramipril and the development of diabetes. JAMA 2001;286:1882-1885.
7. American Diabetes Association Standards of medical care for patients with diabetes mellitus. Diabetes Care 2002;25(suppl 1):S43-S49.
8. US Preventive Services Task Force. Screening for type 2 diabetes mellitus in adults: recommendations and rationale. Ann Intern Med 2003;138:212-214.
9. UK Prospective Diabetes Study (UKPDS) Group. Effect of intensive blood-glucose control with metformin on complications in overweight patients with type 2 diabetes (UKPDS 34). Lancet 1998;352:854-865.
10. UKPDS Group. Tight blood pressure control and risk of macrovascular and microvascular complications in type 2 diabetes: UKPDS 38. BMJ 1998;317:703-713.
11. Hansson L, Zanchetti A, Carruthers SG, et al. Effects of intensive blood-pressure lowering and low-dose aspirin in patients with hypertension: principal results of the Hypertension Optimal Treatment (HOT) randomised trial. HOT Study Group. Lancet 1998;351:1755-1762.
12. Heart Outcomes Prevention Evaluation (HOPE) Study Investigators. Effects of ramipril on cardiovascular and microvascular outcomes in people with diabetes mellitus: results of the Hope Study and MICRO-HOPE substudy. Lancet 2000;355:253-259.
13. Tuomilehto J, Rastenyte D, Birkenhager WH, et al. Effects of calcium-channel blockade in older patients with diabetes and systolic hypertension. Systolic Hypertension in Europe Trial Investigators. N Engl J Med 1999;340:677-684.
14. UKPDS Group Intensive blood-glucose control with sulphonylureas or insulin compared with conventional treatment and risk of complications in patients with type 2 diabetes (UKPDS 33). Lancet 1998;352:837-853.
15. Pyorala K, Pedersen TR, Kjekshus J, Faergeman O, Olsson AG, Thorgeirsson G. Cholesterol lowering with simvastatin improves prognosis of diabetic patients with coronary heart disease. A subgroup analysis of the Scandinavian Simvastatin Survival Study (4S). Diabetes Care 1997;20:614-620.
16. Heart Protection Study Collaborative Group. MRC/BHF Heart Protection Study of cholesterol lowering with simvastatin in 20 536 high-risk individuals: a randomised placebo-controlled trial. Lancet 2002;360:7-22.
17. McCabe CJ, Stevenson RC, Dolan AM. Evaluation of a diabetic foot screening and protection programme. Diabet Med 1998;15:80-84.
18. Salpeter S, Greyber E, Pasternak G, Salpeter E. Risk of fatal and nonfatal lactic acidosis with metformin use in type 2 diabetes mellitus (Cochrane review). The Cochrane Library, Issue 1, 2003. Oxford: Update Software.
19. US Department of Health and Human Services, Centers for Disease Control and Prevention, National Center for Health Statistics, 1999 data. Unpublished data.
20. American Diabetes Association. Economic consequences of diabetes mellitus in the U.S. in 1997. Diabetes Care 1998;21:296-309.
21. Barzilay JI, Spiekerman CF, Kuller LH, et al. Prevalence of clinical and isolated subclinical cardiovascular disease in older adults with glucose disorders: the Cardiovascular Health Study. Diabetes Care 2001;24:1233-1239.
22. Koskinen P, Manttari M, Manninen V, Huttunen JK, Heinonen OP, Frick MH. Coronary heart disease incidence in NIDDM patients in the Helsinki Heart Study. Diabetes Care 1992;15:820-825.
23. Coutinho M, Gerstein HC, Wang Y, Yusuf S. The relationship between glucose and incident cardiovascular events: a metaregression analysis of published data from 20 studies of 95,783 individuals followed for 12.4 years. Diabetes Care 1999;22:233-240.
24. Muller IS, de Grauw WJC, van Gerwen WHEM, Bartelink ML, van Den Hoogen HJM, Rutten GEHM. Foot ulceration and lower limb amputation in type 2 diabetic patients in Dutch primary care. Diabetes Care 2002;25:570-574.
25. Brenner BM, Cooper ME, de Zeeuw D, et al. Effects of losartan on renal and cardiovascular outcomes in patients with type 2 diabetes and nephrophathy. N Engl J Med 2001;345:861-869.
26. UKPDS Group. Efficacy of atenolol and captopril in reducing risk of macrovascular and microvascular complications in type 2 diabetes: UKPDS 39. BMJ 1998;317:713-720.
27. Niskanen L, Hedner T, Hansson L, Lanke J, Niklason A. CAPPP Study Group. Reduced cardiovascular morbidity and mortality in hypertensive diabetic patients on first-line therapy with an ACE inhibitor compared with a diuretic/beta-blocker-based treatment regimen: a subanalysis of the Captopril Prevention Project. Diabetes Care 2001;24:2091-2096.
28. Estacio RO, Jeffers BW, Hiatt WR, Biggerstaff SL, Gifford N, Schrier RW. The effect of nisoldipine as compared with enalapril on cardiovascular events in patients with non-insulin-dependent diabetes and hypertension. N Engl J Med 1998;338:645-652.
29. Tatti P, Pahor M, Byington RP, et al. Outcome results of the Fosfinopril Versus Amlodipine Cardiovascular Events Randomized Trial (FACET) in patients with hypertension and NIDDM. Diabetes Care 1998;21:597-603.
30. Lindholm LH, Ibsen H, Dahlof B, et al. Cardiovascular morbidity and mortality in patients with diabetes in the Losartan Intervention For Endpoint reduction in hypertension study (LIFE): a randomised trial against atenolol. Lancet 2002;359:1004-1010.
31. Lewis EJ, Hunsicker LG, Clarke WR, et al. Renoprotective effect of the angiotensin-receptor antagonist irbesartan in patients with nephropathy due to type 2 diabetes. N Engl J Med 2001;345:851-860.
32. Elkeles RS, Diamond JR, Poulter C, et al. Cardiovascular outcomes in type 2 diabetes. A double-blind placebo-controlled study of bezafibrate: the St Mary’s, Ealing, Northwick Park Diabetes Cardiovascular Disease Prevention (SENDCAP) Study. Diabetes Care 1998;21:641-648.
33. Downs JR, Clearfield M, Weis S, et al. Primary prevention of acute coronary events with lovastatin in men and women with average cholesterol levels. Results of AFCAPS/TexCAPS. Air Force/Texas Coronary Atherosclerosis Prevention Study. JAMA 1998;279:1615-1622.
34. The ALLHAT Collaborative Research Group. Major Outcomes in modestly hypercholesterolemic, hypertensive patients randomized to pravastatin vs. usual care. Anti-hypertensive and Lipid-Lowering Treatment to Prevent Heart Attack Trial (ALLHAT-LLT). JAMA 2002;288:2998-3007.
35. ETDRS Investigators. Aspirin effects on mortality and morbidity in patients with diabetes mellitus. Early Treatment Diabetic Retinopathy Study report 14. JAMA 1992;268:1292-1300.
36. Steering Committee of the Physicians’ Health Study Research Group. Final report on the aspirin component of the ongoing Physicians’ Health Study. N Engl J Med 1989;321:129-135.
37. Scheid DC, McCarthy LH, Lawler FH, et al. Screening for microalbuminuria to prevent nephropathy in patients with diabetes: A systematic review of the evidence. J Fam Pract 2001;50:661-667.
38. Brenner BM, Cooper ME, de Zeeuw D, et al. Effects of losartan on renal and cardiovascular outcomes in patients with type 2 diabetes and nephropathy. N Engl J Med 2001;345:861-869.
39. Lewis EJ, Hunsicker LG, Bain RP. The effect of angiotensin-converting-enzyme inhibition on diabetic nephropathy. The Collaborative Study Group. N Engl J Med 1994;329:1456-1462.
40. Diabetic Retinopathy Study Research Group. Photocoagulation treatment of proliferative diabetic retinopathy. Clinical application of Diabetic Retinopathy Study (DRS) findings, DRS Report Number 8. Opthalmology 1981;88:583-600.
41. Arun CS, Ngugi N, Lovelock L, Taylor R. Effectiveness of screening in preventing blindness due to diabetic retinopathy. Diabetic Med 2003;20:186-190.
- Control blood pressure to at least 150/80 mm Hg or lower to reduce mortality for patients with type 2 diabetes (A). Strongly consider the use of an angiotensin-converting enzyme (ACE) inhibitor to reduce the incidence of myocardial infarction (MI) and total mortality (A).
- In obese patients with type 2 diabetes, consider the use of metformin, unless contraindicated (A).
- Consider the use of a statin for patients with diabetes, even when their cholesterol level is normal (A).
- Screen patients with type 2 diabetes for peripheral neuropathy and peripheral vascular disease to reduce the risk of major amputation (B).
Diabetes need not automatically sentence patients to the well-known ravages of the disease. Evidence-supported preventive strategies can forestall complications.
Increasing evidence suggests diabetes can be prevented by a combination of lifestyle changes and medications. Key interventions for patients with established type 2 diabetes include tight control of blood glucose levels, reduction of blood pressure and lipid levels, and early identification of diabetes-related neuropathy, nephropathy, and retinopathy. Antiplatelet therapy may also be beneficial.
Primary prevention: should intervention begin with prediabetes states?
Treatment of risk factors for diabetes (eg, obesity) and management of prediabetes (eg, impaired glucose tolerance) has suggested early intervention can forestall the development of type 2 diabetes (Table 1). Three trials addressed intensive lifestyle/diet modification. Though the onset of clinically diagnosed diabetes was delayed while patients adhered to these strategies, long-term studies of lifestylemodification have not been performed.1–3
Several other investigations have looked at whether prescription medications achieve similar benefit. Metformin,3 acarbose,4 and orlistat5 have been studied in populations with prediabetes. These interventions appear to delay the onset of diabetes (number needed to treat [NNT]=33–88 patient-years) and to reduce blood sugar levels by 5% to 10%. A post-hoc analysis of the Heart Outcomes Prevention Evaluation (HOPE) trial6 also suggests a favorable effect with the ACE inhibitor, ramipril (NNT=250 patient-years). However, patient-oriented outcomes—development of microvascular or macrovascular disease—were not assessed in these trials. Consequently, the ultimate benefit of treating prediabetes states remains uncertain.
SECONDARY PREVENTION: DOES EARLY DETECTION OF DIABETES HELP DELAY COMPLICATIONS?
No randomized trial of screening has reported any patient-oriented benefits. However, based on consensus opinion, the American Diabetes Association (ADA) recommends screening every person aged 45 years and older every 3 years (strength of recommendation [SOR]: C).7 The characteristics of a clinically recognized disease like diabetes, however, may differ significantly from the characteristics of the subclinical states that would be recognized with screening. Therefore, though the US Preventive Health Services Task Force8 has concluded there is no evidence to recommend screening average risk individuals for diabetes, it does recommend screening individuals at increased risk of macrovascular changes (eg, those with hypertension) (SOR: B). This is based in part on indirect evidence that tighter blood pressure targets may be beneficial for patients with diabetes. (See the Clinical Inquiry, “Does screening for diabetes in at-risk patients improve long-term outcomes?”)
Tertiary prevention: preventing complications of existing diabetes
Patient-oriented outcomes in diabetes can be significantly improved with numerous interventions (Table 2).
Tight glycemic control warranted
The United Kingdom Prospective Diabetes Study14 (UKPDS) randomized participants to usual diabetic care or intensive glycemic control with insulin or sulfonylureas over 10 years. Intensive control reduced average hemoglobin A1c from 7.9% to 7.0%; it also reduced aggregate microvascular complications, mainly a relative 39% decreased need for photocoagulation for diabetic retinopathy (NNT=320 patient-years). No other individual endpoint was independently affected.
The UKPDS suggested a trend toward 16% fewer relative MIs in the intensive control group; however, the results did not reach statistical significance (P=.052). In addition an increase in major hypoglycemic episodes was noted, worse with insulin than sulfonylureas (relative risk [RR]=257%; number needed to harm [NNH]=1110 patient-years).
Approach to obese patients. The UKPDS also studied intensive control with metformin among a subgroup of obese patients with diabetes (>120% ideal body weight).9 Metformin lowered average hemoglobin A1c only from 8.0% to 7.4%, but reduced relative total mortality by 36% (NNT=142 patient-years). Metformin also reduced the relative chance of MI by 39% (NNT=143 patient-years).
These benefits were reversed, however, in a separate UKPDS subgroup placed first on a sulfonylurea, then receiving metformin if glycemic control was inadequate. Total mortality was relatively increased by 60% (NNH=89 patient-years).9 This adverse outcome disappeared when adjustment was made for age, sex, ethnic group, and glycemic control.
Other potential risks of metformin include lactic acidosis, but 1 recent systematic review found no associated cases of this condition with metformin prescribed in published studies.17
Applying the evidence. Initial treatment of patients with diabetes over 120% of ideal body weight should include tight glucose control with metformin, unless contraindicated (SOR: A). For leaner patients, therapy with a sulfonylurea or insulin is supported by evidence (SOR: B).
Control blood pressure to below 150/80 mm Hg
The UKPDS also compared tight blood pressure control (aiming at systolic <150 mm Hg and diastolic <80) with usual treatment. Tight control reduced relative deaths attributed to diabetes by 32% (NNT=150 patient-years), and demonstrated a trend toward reduced total mortality that was not statistically significant (relative risk reduction [RRR]=18%; 95% confidence interval [CI], –0.8% to 37%). Both stroke (NNT=196 patient-years) and the aggregate endpoint of “all microvascular disease” (NNT=139 patient-years) were significantly reduced by tight blood pressure control.10
The Hypertension Optimal Treatment (HOT) Study Group11 compared various levels of blood pressure control. A reduction in cardiovascular mortality was significant even between those treated with a goal of 80 and 85 mm Hg diastolic (RRR=67%; NNT=133 patient-years). The trend toward reduction in total mortality in this trial also approached statistical significance (P=.068; RRR=42%).
The Syst-Eur trial13 compared tight blood pressure control on nitrendipine with looser control with a variety of agents. Cardiovascular mortality was reduced by 30% with tight control (NNT=100 patient-years).
The Heart Outcomes Prevention Evaluation (HOPE) study6 included patients with diabetes, of which only 56% had a diagnosis of hypertension. It randomized participants to receive ramipril or placebo, in addition to any off-study antihypertensive agents they were already using. The intervention group had both lower average blood pressures as well as lower total mortality by 24% (NNT=140 patient-years).
Type 2 diabetes is the second most common problem seen by family physicians, and represents over 4% of office visits.19 The cost to society is staggering: in the United States, $100 billion was spent in 1997 alone.20 Its toll in clinical outcomes is also dramatic, leading to over 150,000 annual deaths in the US.20
Left unchecked, diabetes leads to microvascular and macrovascular complications. Cardiovascular disease occurs 2 to 3 times more often among patients with diabetes than healthy individuals,21,22 and is also linked to impaired glucose tolerance.23 Cardiovascular events are responsible for over half of deaths in patients with diabetes.20
Each year, neuropathy contributes to ulcers in 2% of patients with diabetes, and amputation in 0.6%.24 Proteinuria occurs in 20% to 40% of all patients with diabetes7; of those, 20% rapidly develop end-stage renal disease.25 Retinopathy is treated at a rate of 1% per year among patients with diabetes.14
Choice of agent important. Lower blood pressure goals have consistently demonstrated benefit across multiple studies. The choice of antihypertensive agent may also affect outcomes (Table 3). The UKPDS blood pressure analysis was also stratified to evaluate whether the results of blood pressure treatment differed between captopril and atenolol. Though compliance was slightly better with captopril, there were no differences in patient-oriented outcomes between the groups.26
The Captopril Prevention Project (CAPPP)27 compared captopril with diuretics and betablockers alone or in combination. While blood pressure control was about the same in all study groups, the captopril group realized a 66% reduction in MI (NNT=96 patient-years) and a total mortality 46% less than that seen with the other agents (NNT=96 patient-years).
The Appropriate Blood Pressure Control in Diabetes (ABCD) trial28 compared nisoldipine and enalapril. Participants randomized to receive the ACE inhibitor had an 80% decreased risk of MI (NNT=25 patient-years).
In the Fosinopril versus Amlodipine Cardiovascular Events Trial (FACET),29 blood pressure was better controlled with amlodipine, but major vascular events were 51% fewer with the ACE inhibitor (NNT=146 patient-years), again supporting the superior performance of ACE inhibitors.
Angiotensin receptor blockers (ARBs) may have comparable effects to ACE inhibitors. The Losartan Intervention For Endpoint Reduction in Hypertension (LIFE) trial30 studied patients with left ventricular hypertrophy, diabetes, and hypertension, comparing losartan with atenolol. Total mortality with losartan was reduced by a relative 40% compared with atenolol (NNT=167 patientyears). Another study31 of patients with diabetes, hypertension, and nephropathy compared irbesartan with amlodipine. This trial demonstrated no differences in patient-oriented outcomes between the calcium-channel blocker and the ARB.
Applying the evidence. The goals for blood pressure control in type 2 diabetes should be less than 150 mm Hg systolic and 80 mm Hg diastolic (SOR: A). Evidence also strongly supports the use of an ACE inhibitor, or possibly ARB, as first-linetreatment for hypertension in diabetes (SOR: A). Many authorities recommend even more aggressive blood pressure goals.
Lipid management: statins improve outcome
Lowering elevated triglycerides has not been independently associated with an improvement in patient-oriented outcomes. In the Helsinki Heart Study22 and the St. Mary’s, Ealing, Northwick Park Diabetes Cardiovascular Disease Prevention (SENDCAP) trial,32 a fibric acid derivative was compared with placebo. The average triglyceride concentration was decreased, but no significant effect on coronary events was noted. However, elevated triglycerides are associated with the metabolic syndrome, which may warrant lifestyle changes or medication (based on expert opinion).
Treatment with hydroxymethyl glutaryl coenzyme A reductase inhibitors (statins) has better supporting evidence. In the Scandinavia Simvastatin Survival Study (4S),15 202 patients with diabetes, coronary artery disease, and elevated cholesterol were randomized to receive simvastatin or placebo. Major coronary events were reduced by 55% with simvastatin (NNT=22.5 patient-years). Total mortality was reduced, but not to a statistically significant extent (P=.087; RRR=43%).
The Air Force/Texas Coronary Atherosclerosis Prevention Study33 (AFCAPS/TexCAPS) compared lovastatin with placebo for patients with diabetes and healthy individuals with normal cholesterol levels. Though the overall population demonstrated a 37% reduction in first coronary events, the diabetes subgroup had insufficient power to confirm this trend independently.
The Antihypertensive and Lipid-Lowering Treatment to Prevent Heart Attack Trial34 (ALLHAT-LLT) randomized 3638 patients with diabetes to receive pravastatin 40 mg or placebo. No changes were seen in total mortality or cardiovascular events. These results may have been confounded by off-study prescription for statins, given to 32% of those randomized to the placebo group.
The best independent evidence for use of statins in diabetes comes from the Heart Protection Study16 of 3982 patients with diabetes with a total cholesterol level >135 mg/dL and no evidence of coronary disease. They were randomized to receive 40 mg simvastatin or placebo for 5 years. First major vascular events (MI or stroke) were decreased in the simvastatin group by 26% over 5 years (NNT=104 patient-years).
Applying the evidence. Reducing elevated triglycerides in type 2 diabetes is not supported by clear evidence, although elevated triglycerides may be associated with the metabolic syndrome and may warrant lifestyle change (SOR: C).
However, statins—even for those with a normal cholesterol level—reduce macrovascular outcomes (SOR: A), a measure now endorsed by the American College of Physicians.
Anti-platelet therapy
Aspirin prophylaxis in diabetes has weaker support. The Early Treatment Diabetic Retinopathy Study35 (ETDRS) randomized 3711 patients with diabetes to receive aspirin 650 mg or placebo. No benefit in mortality or cardiovascular event rates was documented after 5 years. However, the results did suggest a nonsignificant trend toward reduction of MI (RRR=17%; 95% CI, –4% to 34%; NNT=333).
In the Physician’s Health Study,36 22,071 participants (most of whom did not have diabetes) were randomized to receive aspirin 325 mg every other day or placebo. MI was reduced by 44% with aspirin (NNT=500). The risk of MI in the subgroup of 533 individuals with diabetes paralleled this reduction (RRR=39%), though, independently, the reduction in the subgroup did not reach statistical significance. Bleeding problems were the most common adverse effect of the aspirin, and were increased by 32% (NNH=78 person-years).
In the HOT study,11 a subgroup of 1501 patients with diabetes was randomized to receive aspirin 75 mg or placebo daily. The rate of MI trended downward with aspirin but was not statistically significant. Among the 18,790 patients in this study (most of whom did not have diabetes), MI was 36% less likely to occur with aspirin (NNT=770).
Applying the evidence. Overall, there is some suggestion that persons with cardiac risk factors, like type 2 diabetes, benefit by taking low-dose aspirin to avoid macrovascular complications. No study has confirmed this in a population of individuals with diabetes, but the trends suggest a possible benefit (SOR: C). The decision to use aspirin should be made in consultation with an informed patient.
SCREENING FOR NEUROPATHY
One trial17 has been conducted on screening for neuropathy. It compared monofilament testing and palpation of pedal pulses with “no special care.” Patients with an original positive screen result received a calculation of their ankle-brachial index, foot x-rays, and other measurements, and were referred to a high-risk podiatry clinic if the second level testing showed abnormal results. Major amputations were decreased in the screened group by 92% over 2 years (NNT=180 patient-years). This evidence of benefit is sufficient to recommend screening patients with diabetes for peripheral neuropathy or peripheral vascular disease, and appropriate referral (SOR: B). (See the Clinical Inquiry, “What is the best treatment for diabetic neuropathy?”)
Screening for nephropathy
One systematic review37 found no randomized trials of screening for urinary microalbumin and how it might affect overt nephropathy. However, several studies have looked at treatment of gross proteinuria, and have demonstrated some benefit in patient-oriented outcomes. Improved blood pressure control has reduced progression of nephropathy to end-stage renal disease.38,39 Other studies have suggested that an ACE inhibitor or ARB might provide benefit.30,39
The ADA recommends annual screening for microalbumin based on expert consensus (SOR: C).7 Though early detection of microalbumin might optimize the treatment of nephropathy, it is also possible that screening may detect a population whose disease would have remained subclinical indefinitely. No clear evidence suggests that screening for microalbumin reduces the incidence of patient-oriented outcomes.
Screening for retinopathy
Several trials have evaluated interventions in the diagnosis and prevention of visual loss. As discussed previously, intensive glucose control with sulfonylureas or insulin reduced the need for retinal photocoagulation by 39% in the UKPDS (NNT=320 patient-years).14 Similarly in this trial, tight blood pressure control reduced the progression of retinopathy, compared with usual care. 10
Specific treatments for retinopathy include photocoagulation, which has been demonstrated to significantly reduce severe visual loss by 58% (NNT=30 patient-years).40 One cohort study suggests that screening for retinopathy coupled with appropriate treatment may reduce the onset of visual loss.41 The ADA recommends annual screening for retinopathy with a dilated eye exam based on indirect evidence of its benefit (SOR: B).7
- Acarbose
- Amlodipine
- Atenolol
- Captopril
- Enalapril
- Fosinopril
- Irbesartan
- Losartan
- Lovastatin
- Metformin
- Nisoldipine
- Orlistat
- Pravastatin
- Ramipril
- Simvastatin
- Prandase, Precose
- Norvasc
- Tenoretic; Tenormin
- Capoten
- Vasotec
- Monopril
- Avapro
- Cozaar
- Mevacor
- Glucophage
- Sular
- Xenical
- Pravachol
- Altace
- Zocor
Correspondence
Paul Ullom-Minnich, MD, Partners in Family Care, PO Box 640, Moundridge, KS 67107. E-mail: [email protected].
1. Eriksson J, Lindstrom J, Valle T, et al. Prevention of type II diabetes in subjects with impaired glucose tolerance: the Diabetes Prevention Study (DPS) in Finland. Study design and 1-year interim report on the feasibility of the lifestyle intervention programme. Diabetologia 1999;42:793-801.
2. Pan XR, Li GW, Hu YH, et al. Effects of diet and exercise in preventing NIDDM in people with impaired glucose tolerance. The Da Qing IGT and Diabetes Study. Diabetes Care 1997;20:537.-
3. Diabetes Prevention Program Research Group. Reduction in the incidence of type 2 diabetes with lifestyle intervention or metformin. N Engl J Med 2002;346:393-403.
4. Chiasson JL, Josse RG, Gomis R, Hanefield M, Karasik A, Laasko M. STOP-NIDDM Trial Research Group. Acarbose for prevention of type 2 diabetes mellitus: the STOP-NIDDM randomized trial. Lancet 2002;359:2072-2077.
5. Heymsfield SB, Segal KR, Hauptman J, et al. Effects of weight loss with orlistat on glucose tolerance and progression to type 2 diabetes in obese adults. Arch Intern Med 2000;160:1321-1326.
6. Yusuf S, Gerstein H, Hoogwerf B, et al. HOPE Study Investigators Ramipril and the development of diabetes. JAMA 2001;286:1882-1885.
7. American Diabetes Association Standards of medical care for patients with diabetes mellitus. Diabetes Care 2002;25(suppl 1):S43-S49.
8. US Preventive Services Task Force. Screening for type 2 diabetes mellitus in adults: recommendations and rationale. Ann Intern Med 2003;138:212-214.
9. UK Prospective Diabetes Study (UKPDS) Group. Effect of intensive blood-glucose control with metformin on complications in overweight patients with type 2 diabetes (UKPDS 34). Lancet 1998;352:854-865.
10. UKPDS Group. Tight blood pressure control and risk of macrovascular and microvascular complications in type 2 diabetes: UKPDS 38. BMJ 1998;317:703-713.
11. Hansson L, Zanchetti A, Carruthers SG, et al. Effects of intensive blood-pressure lowering and low-dose aspirin in patients with hypertension: principal results of the Hypertension Optimal Treatment (HOT) randomised trial. HOT Study Group. Lancet 1998;351:1755-1762.
12. Heart Outcomes Prevention Evaluation (HOPE) Study Investigators. Effects of ramipril on cardiovascular and microvascular outcomes in people with diabetes mellitus: results of the Hope Study and MICRO-HOPE substudy. Lancet 2000;355:253-259.
13. Tuomilehto J, Rastenyte D, Birkenhager WH, et al. Effects of calcium-channel blockade in older patients with diabetes and systolic hypertension. Systolic Hypertension in Europe Trial Investigators. N Engl J Med 1999;340:677-684.
14. UKPDS Group Intensive blood-glucose control with sulphonylureas or insulin compared with conventional treatment and risk of complications in patients with type 2 diabetes (UKPDS 33). Lancet 1998;352:837-853.
15. Pyorala K, Pedersen TR, Kjekshus J, Faergeman O, Olsson AG, Thorgeirsson G. Cholesterol lowering with simvastatin improves prognosis of diabetic patients with coronary heart disease. A subgroup analysis of the Scandinavian Simvastatin Survival Study (4S). Diabetes Care 1997;20:614-620.
16. Heart Protection Study Collaborative Group. MRC/BHF Heart Protection Study of cholesterol lowering with simvastatin in 20 536 high-risk individuals: a randomised placebo-controlled trial. Lancet 2002;360:7-22.
17. McCabe CJ, Stevenson RC, Dolan AM. Evaluation of a diabetic foot screening and protection programme. Diabet Med 1998;15:80-84.
18. Salpeter S, Greyber E, Pasternak G, Salpeter E. Risk of fatal and nonfatal lactic acidosis with metformin use in type 2 diabetes mellitus (Cochrane review). The Cochrane Library, Issue 1, 2003. Oxford: Update Software.
19. US Department of Health and Human Services, Centers for Disease Control and Prevention, National Center for Health Statistics, 1999 data. Unpublished data.
20. American Diabetes Association. Economic consequences of diabetes mellitus in the U.S. in 1997. Diabetes Care 1998;21:296-309.
21. Barzilay JI, Spiekerman CF, Kuller LH, et al. Prevalence of clinical and isolated subclinical cardiovascular disease in older adults with glucose disorders: the Cardiovascular Health Study. Diabetes Care 2001;24:1233-1239.
22. Koskinen P, Manttari M, Manninen V, Huttunen JK, Heinonen OP, Frick MH. Coronary heart disease incidence in NIDDM patients in the Helsinki Heart Study. Diabetes Care 1992;15:820-825.
23. Coutinho M, Gerstein HC, Wang Y, Yusuf S. The relationship between glucose and incident cardiovascular events: a metaregression analysis of published data from 20 studies of 95,783 individuals followed for 12.4 years. Diabetes Care 1999;22:233-240.
24. Muller IS, de Grauw WJC, van Gerwen WHEM, Bartelink ML, van Den Hoogen HJM, Rutten GEHM. Foot ulceration and lower limb amputation in type 2 diabetic patients in Dutch primary care. Diabetes Care 2002;25:570-574.
25. Brenner BM, Cooper ME, de Zeeuw D, et al. Effects of losartan on renal and cardiovascular outcomes in patients with type 2 diabetes and nephrophathy. N Engl J Med 2001;345:861-869.
26. UKPDS Group. Efficacy of atenolol and captopril in reducing risk of macrovascular and microvascular complications in type 2 diabetes: UKPDS 39. BMJ 1998;317:713-720.
27. Niskanen L, Hedner T, Hansson L, Lanke J, Niklason A. CAPPP Study Group. Reduced cardiovascular morbidity and mortality in hypertensive diabetic patients on first-line therapy with an ACE inhibitor compared with a diuretic/beta-blocker-based treatment regimen: a subanalysis of the Captopril Prevention Project. Diabetes Care 2001;24:2091-2096.
28. Estacio RO, Jeffers BW, Hiatt WR, Biggerstaff SL, Gifford N, Schrier RW. The effect of nisoldipine as compared with enalapril on cardiovascular events in patients with non-insulin-dependent diabetes and hypertension. N Engl J Med 1998;338:645-652.
29. Tatti P, Pahor M, Byington RP, et al. Outcome results of the Fosfinopril Versus Amlodipine Cardiovascular Events Randomized Trial (FACET) in patients with hypertension and NIDDM. Diabetes Care 1998;21:597-603.
30. Lindholm LH, Ibsen H, Dahlof B, et al. Cardiovascular morbidity and mortality in patients with diabetes in the Losartan Intervention For Endpoint reduction in hypertension study (LIFE): a randomised trial against atenolol. Lancet 2002;359:1004-1010.
31. Lewis EJ, Hunsicker LG, Clarke WR, et al. Renoprotective effect of the angiotensin-receptor antagonist irbesartan in patients with nephropathy due to type 2 diabetes. N Engl J Med 2001;345:851-860.
32. Elkeles RS, Diamond JR, Poulter C, et al. Cardiovascular outcomes in type 2 diabetes. A double-blind placebo-controlled study of bezafibrate: the St Mary’s, Ealing, Northwick Park Diabetes Cardiovascular Disease Prevention (SENDCAP) Study. Diabetes Care 1998;21:641-648.
33. Downs JR, Clearfield M, Weis S, et al. Primary prevention of acute coronary events with lovastatin in men and women with average cholesterol levels. Results of AFCAPS/TexCAPS. Air Force/Texas Coronary Atherosclerosis Prevention Study. JAMA 1998;279:1615-1622.
34. The ALLHAT Collaborative Research Group. Major Outcomes in modestly hypercholesterolemic, hypertensive patients randomized to pravastatin vs. usual care. Anti-hypertensive and Lipid-Lowering Treatment to Prevent Heart Attack Trial (ALLHAT-LLT). JAMA 2002;288:2998-3007.
35. ETDRS Investigators. Aspirin effects on mortality and morbidity in patients with diabetes mellitus. Early Treatment Diabetic Retinopathy Study report 14. JAMA 1992;268:1292-1300.
36. Steering Committee of the Physicians’ Health Study Research Group. Final report on the aspirin component of the ongoing Physicians’ Health Study. N Engl J Med 1989;321:129-135.
37. Scheid DC, McCarthy LH, Lawler FH, et al. Screening for microalbuminuria to prevent nephropathy in patients with diabetes: A systematic review of the evidence. J Fam Pract 2001;50:661-667.
38. Brenner BM, Cooper ME, de Zeeuw D, et al. Effects of losartan on renal and cardiovascular outcomes in patients with type 2 diabetes and nephropathy. N Engl J Med 2001;345:861-869.
39. Lewis EJ, Hunsicker LG, Bain RP. The effect of angiotensin-converting-enzyme inhibition on diabetic nephropathy. The Collaborative Study Group. N Engl J Med 1994;329:1456-1462.
40. Diabetic Retinopathy Study Research Group. Photocoagulation treatment of proliferative diabetic retinopathy. Clinical application of Diabetic Retinopathy Study (DRS) findings, DRS Report Number 8. Opthalmology 1981;88:583-600.
41. Arun CS, Ngugi N, Lovelock L, Taylor R. Effectiveness of screening in preventing blindness due to diabetic retinopathy. Diabetic Med 2003;20:186-190.
Exercise and antidepressants improve fibromyalgia
- Fibromyalgia is diagnosed based on a patient’s report of widespread pain of 3 months’duration or longer, and identification of 11 of 18 possible tender points (C).
- Fibromyalgia is functionally disabling and diminishes well-being; therefore, supportive care and evidence-based interventions should be offered (C).
- Aerobic exercise and antidepressants have been shown to moderately relieve symptoms of fibromyalgia in the short term (A).
When a patient complains of pain “all over,” consider fibromyalgia, which typically causes a well-documented pattern of pain and characteristic points of tenderness observable on physical exam. Once alternative diagnoses have been ruled out, offer the patient a 2-pronged therapeutic regimen that has proven successful at moderately relieving symptoms.
First rule out concomitant or mimicking disorders
Consider the differential diagnosis carefully.1 A person who meets the criteria for fibromyalgia may have yet another cause of chronic pain, such as rheumatoid arthritis, or may instead have a different treatable condition that mimics fibromyalgia.
Drug-induced myopathy. Pain suggestive of fibromyalgia should prompt a review of the patient’s medicines. Drug-induced myopathy may occur in persons taking colchicine, statins, corticosteroids, or antimalarial drugs.
Connective tissue, autoimmune, and rheumatologic disorders. Consider this group of disorders next. In 1 study, one fourth of persons referred to a rheumatology clinic with presumed fibromyalgia instead had a spondyloarthropathy.2
Dermatomyositis and polymyositis may present with muscle pain and tenderness but, unlike fibromyalgia, cause proximal muscle weakness.
Systemic lupus erythematosus, rheumatoid arthritis, and polymyalgia rheumatica can also lead to widespread pain.
Blood tests such as antinuclear antibody (ANA), C-reactive protein, or erythrocyte sedimentation rate (ESR) may prove helpful when a patient has a history of unexplained rashes, fever, weight loss, joint swelling, iritis, hepatitis, nephritis, or inflammatory back pain (onset before age 40, insidious onset, present for more than 3 months, associated with morning stiffness, improvement with exercise).3 In the absence of these signs, ANA, rheumatoid factor, and ESR testing in persons with fatigue and diffuse musculoskeletal pain have low positive predictive value.4 The rate of false-positive ANA results may be as high as 8% to 11%, especially at low titers.5,6
Hypothyroidism. Widespread musculoskeletal pain has also been associated with hypothyroidism (level of evidence [LOE]: 2, case-control design),7,8 supporting the inclusion of a thyroidstimulating hormone in the work-up of fibromyalgia (strength of recommendation [SOR]: B). More recent research suggests that musculoskeletal pain is more related to thyroid microsomal antibodies than to hypothyroidism,9 but there has been no further evaluation of antithyroid antibodies in persons with fibromyalgia.
Diagnosis: mostly by clinical judgment
Persons with fibromyalgia have widespread pain, often worst in the neck and trunk.1 Additional symptoms include fatigue, morning stiffness, waking unrefreshed, paresthesias, and headache.1,10-15 (See “The toll of fibromyalgia.”)
In community-based studies, 2% of adults16 and 1.2% to 6.2% of school-age children screened positive for fibromyalgia.17-19 Females are at higher risk than males, and risk increases with age, peaking between 55 and 79 years.
Morbidity associated with fibromyalgia is considerable.16,20,21 In one report,persons with fibromyalgia scored lower on a well-being scale than persons with rheumatoid arthritis or advanced cancer.22
Persons with fibromyalgia use an average of 2.7 drugs at any one time for related symptoms, and they make an average of 10 outpatient visits per year and are hospitalized once every 3 years.23
Fibromyalgia has been associated with osteoporosis.24 Compared with other rheumatic diseases, fibromyalgia results in a high rate of surgery, including hysterectomies, appendectomies, back and neck surgery, and carpal tunnel surgery.23,25 Among adults who seek medical attention, fewer than 30% have been reported to recover from fibromyalgia within 10 years of onset.26-29
However,symptoms tend to remain stable27 or lessen over time,28,30-32 with no increase in 10-year mortality.33 Children appear much more likely to recover from fibromyalgia, with complete resolution in more than 50% by 2 to 3 years in several studies.13,18,34,35
Cormorbid conditions
Compared with other rheumatologic conditions, persons with fibromyalgia more often suffer from comorbid conditions,23 including chronic fatigue syndrome, migraine headaches, irritable bowel syndrome, irritable bladder symptoms, temporomandibular joint syndrome, myofascial pain syndrome, restless legs syndrome, and affective disorders.23,36,37
Accepted criteria
The diagnosis of fibromyalgia is based on 2 criteria:
1. A patient’s report of widespread pain (right and left sides of the body, above and below the waist, and including the axial skeleton) persisting for at least 3 months
2. The clinician’s identification of at least 11 of 18 potential tender points as specified in the American College of Rheumatology (ACR) 1990 Criteria for the Classification of Fibromyalgia (Figure) (LOE: 3, case-control design, nonindependent reference standard).1
These criteria do not exclude persons with rheumatic diseases or other chronic pain conditions.1,37-39
Caveats with the criteria
Despite these well-defined criteria, the diagnosis is not as clear-cut as it may appear. In 1990, the ACR convened a panel of 24 experts to define and standardize the diagnosis of fibromyalgia. The basis for this consensus was a group of 293 patients with fibromyalgia, each of whom had been assessed by one of the expert investigators according to “his or her usual method of diagnosis.” 1
The investigators determined the unique characteristics of fibromyalgia by comparing the 293 cases to 265 controls who had other chronic pain conditions (eg, low back pain syndromes, neck pain syndromes, regional tendonitis, possible systemic lupus erythematosus, rheumatoid arthritis). The investigators considered a multitude of symptoms and signs including sleep disturbance, morning stiffness, paresthesias, irritable bowel syndrome, fatigue, and anxiety. Their conclusion was that widespread pain and tender points were the most sensitive (88.4%) and specific (81.1%) distinguishing criteria for fibromyalgia.1
No reference standard. However, these calculations of sensitivity and specificity are less meaningful than in studies where an independent reference standard or gold standard is available. The ACR expert panel derived the criteria in a circular way using a nonindependent reference standard—ie, patients thought to have fibromyalgia compared with control patients thought not to have fibromyalgia. The expert panel essentially set the specificity of the criteria at 100%, since the specificity is based on the rate of false positives.
Furthermore, because there was no objective gold standard for determining who truly had fibromyalgia (and we do not yet have an independent biologic “test” for this condition), this panel could not determine whether additional symptoms or signs that should be considered in the diagnosis of fibromyalgia.
Biases, dubious representation? Unknown elements in this analysis are 1) how closely the reference population used to develop these criteria represents the true population of persons with fibromyalgia, and 2) the biases of the ACR experts. Finally, the positive and negative predictive values of these criteria will depend on the prevalence of fibromyalgia and other similar conditions.
Morbidity not predicted by criteria. In addition, the 1990 ACR criteria assume the number of tender points and degree of pain are directly proportional to overall morbidity; however, a person with fewer than 11 tender points may experience significant morbidity, indicating that the sensitivity of the criteria may be low.40-42 As suggested by Wolfe in 1997, “the tender point count functions as a sedimentation rate for distress” in persons with chronic pain.42 Thus, the authors of the 1990 ACR study stated that ACR criteria should not be applied rigidly in diagnosing and treating fibromyalgia,42 leaving a large role for clinical judgment.
Subjective factors. A final difficulty with the diagnosis of fibromyalgia is its dependence on patient report and examiner technique.1 In the 1990 ACR criteria, tender points were defined as a complaint of pain (or any more dramatic response) when an examiner applied 4 kg of pressure with the pulp of the thumb or first two or three fingers, calibrated with a dolorimeter (a device that can measure the amount and rate of pressure applied over a specified surface area).1 It has been shown that practitioners require training to apply 4 kg of force with regularity.43
However, applying exactly 4 kg of pressure may not be clinically important. Other studies have shown that finger palpation or dolorimetry identifies tender points with equal accuracy (LOE: 3, case-control design with non-independent reference standard).44,45
Manual palpation
A controlled study of manual palpation was conducted to standardize the tender point survey described in the Figure. 46 This method compares well with the ACR 1990 method, with a sensitivity of 88.6% and a specificity of 71.4%.46
To speed up the examination, a particular sequence of palpating survey points was established, with the patient positioned as outlined in the Figure. Using the thumb pad of his/her dominant hand, each examiner applied 4 kg of pressure, at a rate of 1 kg per second, just once at each survey point. Examiners learned to apply the proper amount of pressure by standing a patient on a scale and watching the scale while pressing down perpendicularly on the trapezius survey point.
The examinee was seated throughout the exam, except when lying on the side for palpation of the trochanter and lying supine for palpation of the knee. A tender point was identified when the patient rated the pain resulting from palpation at least 2 out of 10 (0, no pain; 10 worst pain) (LOE: 3, case-control design, nonindependent reference standard).46
Until a firm biologic basis for fibromyalgia is discovered and a true gold standard for testing is developed, the diagnosis of fibromyalgia will remain a matter of clinical judgment and convention (SOR: C).
Treatment
A diagnosis of fibromyalgia alone may result in health benefits. In a year-long study published in 1986, Cathey et al reported that among 81 persons diagnosed with fibromyalgia, hospitalization rates decreased in the year following diagnosis (LOE: 2, case-control design).47
Treatments for fibromyalgia are numerous, ranging from balneotherapy (bathing) to low-energy laser therapy, and studies of interventions are often poorly designed, based on small numbers of patients, report nonstandardized outcomes, and yield conflicting results.48
Two interventions—aerobic exercise and antidepressant therapy—appear to improve fibromyalgia.
Aerobic exercise
Though pain relief is insignificant with aerobic exercise, other positive effects are significant (SOR: A). A 2003 Cochrane review identified 7 high-quality studies of aerobic training, defined as: 1) frequency of 2 days per week; 2) intensity sufficient to achieve 40% to 85% of heart rate reserve, or 55% to 90% of predicted maximum heart rate; 3) duration of sessions 20 to 60 minutes, either continuously or intermittently throughout the day, using any mode of aerobic exercise; and 4) a total exercise period of at least 6 weeks (Table 1).49
Improved functioning, tender-point threshold. Study subjects engaged in aerobic dancing, whole-body aerobics, stationary cycling, and walking. Persons who exercised improved in global well-being, physical function, and aerobic fitness (by about 17%), and raised the pain threshold of tender points (by about 35%).49 Four of the studies were similar enough to be combined for meta-analysis, showing a statistically robust but modest reduction in tender-point threshold (LOE: 1).
Although it seems likely that pain or fatigue might increase at least initially with exercise, participants in the exercise groups were not deterred; the researchers pointed out that reporting of adverse effects of aerobic exercise appeared incomplete, but there was no significant difference in drop-out rates between the exercise (25.1%) and control groups (12.5%).49
In the long-term studies (>6 months), improvements were noted up to 1 year after treatment ended but not after 4.5 years.49 This Cochrane review further supports aerobic exercise as bring beneficial for persons with fibromyalgia.50,51
Additional improvement measures. A similar systematic review concluded that although studies were too heterogeneous to draw final conclusions, preliminary data supported aerobic exercise (LOE: 2, with heterogeneous studies).50 In another comprehensive meta-analysis of all treatments for fibromyalgia, heterogeneous treatment studies ranging from exercise to physical therapy were identified as physically-based treatments. The analysis revealed a positive effect on physical status (including tender-point index, grip strength, and physician global rating of pain symptoms), fibromyalgia symptoms (including self-reported fatigue and pain using visual analog scales), and psychological status (including measurements of the Hamilton Depression and Anxiety Scales), with no effect on daily functioning (including outcome measures such as the Fibromyalgia Impact Questionnaire [FIQ]) (LOE: 2, with heterogeneous studies).51
The authors noted that the magnitude of the positive effects of physically-based treatments on fibromyalgia were comparable with drug treatment judged effective for arthritis.51
TABLE 1
Aerobic exercise for fibromyalgia: the evidence
| Aerobic exercise (SOR: A) | |||
|---|---|---|---|
| Study (LOE) | Treatment specifics | Results | Comments |
| Busch et al49(1) | Supervised aerobic training—eg, aerobic dancing, stationary cycling, walking: 1) frequency of 2 days per week, 2) intensity sufficient to achieve 40%–85% of heart rate reserve or 55%–90% predicted maximum heart rate, 3) duration of sessions of 20–60 minutes duration, either continuously or intermittently throughout the day, and using any mode of aerobic exercise, 4) total time period of at least 6 weeks, maximum 1 year in these studies. | Benefits over controls: improvements in aerobic performance, tender points, and global well-being. | 4 high-quality aerobic training studies included in meta-analysis. No significant improvements in pain intensity, fatigue, sleep, and psycho-logical function. |
| Adverse effects: poorly reported. | |||
| Sim et al50(2) | Not standardized, but 3 studies set exercise intensity at 60%–75% of max.heart rate.Duration 6 weeks to 20 weeks. | Benefits over controls: preliminary evidence for improvements in symptoms. | Heterogeneous studies. |
| Adverse effects: not reported. | |||
| Rossy et al51(2) | Loosely defined and heterogeneous, including “exercise, strengthening, walking, stretching, pool therapy, cycling, swimming, and aerobics.” | Benefits over controls: improvement in physical status, fibromyalgia symptoms, and psychological status with effectiveness comparable with pharmacologic treatment for arthritis pain. | Heterogeneous studies.No improvement in daily functioning. |
| Adverse effects: not reported. | |||
| SOR,strength of recommendation; LOE,level of evidence.For an explanation of these ratings | |||
Less certain nonpharmacologic therapies
Other nonpharmacologic treatments for fibromyalgia are educational interventions, relaxation therapy, cognitive-behavioral therapy, and acupuncture. These therapies have undergone rigorous analysis, but studies have been too heterogeneous to allow for strong conclusions across the studies.50
A recent Cochrane review concluded that although physical training plus education had a positive effect at long-term follow up, evidence is insufficient to recommend multidisciplinary rehabilitation, defined as the care of a physician plus psychological, social, and vocational interventions (SOR: C).52
In contrast, other investigators have concluded that multidisciplinary treatment incorporating physically and psychologically based treatments was more successful than treatment with a single modality.51 A systematic review of acupuncture identified only 1 high-quality randomized controlled trial (Table 2), which did show some improvement in symptoms (SOR: C).53
TABLE 2
Alternative nonpharmacologic therapies for fibromyalgia: the evidence
| Multidisciplinary rehabilitation (physician and psychological, social, or vocational interventions) (SOR: C) | |||
|---|---|---|---|
| Study (LOE) | Treatment specifics | Results | Comments |
| Karjalainen et al52(2) | Education plus physical training vs education; education plus cognitive treatment vs education and group discussion; behavioral therapy vs education; stress management vs aerobic exercise. | Benefits over controls: not significant. | Heterogeneous studies.No high-quality randomized controlled trials identified. |
| Adverse effects: not reported. | |||
| Acupuncture (SOR: B) | |||
| Berman et al53 (2) | Systematic review. | Benefits over placebo: improvements in pain, stiffness, global improvement. | Only 1 randomized controlled trial.No long-term results. |
| Adverse effects: pain with needle insertion. | |||
| SOR,strength of recommendation; LOE,level of evidence.For an explanation of these ratings. | |||
Therapy with antidepressants
Of all pharmacologic treatments, antidepressants have undergone the most thorough study. Although the optimal role of medications in fibromyalgia has not been delineated, 3 metaanalyses have reported that antidepressants, most commonly amitriptyline, reduce symptoms during treatment of a few months duration (SOR: A) (Table 3).54,55
Any antidepressants. Pooled results from 13 studies (8 of tricyclics, 3 of selective serotonin reuptake inhibitors, 2 of s-adenosylmethionine) revealed a moderate effect on pain, sleep, and global well-being, and a mild effect on fatigue and number of trigger points.54 The authors calculated that persons with fibromyalgia treated with antidepressants were 4 times more likely to improve than persons treated with placebo (number need to treat [NNT]=4). Adverse effects appeared insignificant but were poorly reported in the individual studies.
Tricyclics only. In another meta-analysis, 9 high-quality studies of tricyclic antidepressants (amitriptyline, dothiepin, clomipramine, maprotiline and cyclobenzaprine—classified by the authors as a tricyclic antidepressant) were analyzed for 7 outcomes (patient self-rating of pain, fatigue, stiffness, and sleep; the patient and physician global assessment of improvement; and tenderness of tender points). Significant responses were observed in 25% to 37% of patients. On meta-analysis, outcome measures improved moderately overall with tricyclic treatment, mostly in sleep and global assessment, least in stiffness and tenderness. Long-term safety (more than 8 weeks) and efficacy of tricyclic therapy for fibromyalgia have not been demonstrated.55
Combined trials.A third meta-analysis demonstrated improvement when trials of different antidepressants were combined.51 By pooling studies of antidepressants (amitriptyline, dothiepin, fluoxetine, citalopram, and S-adenosylmethionine) improvements in physical status, fibromyalgia symptoms, and psychological status were found, with no improvement in daily functioning.51 Although the effect was smaller than physicallybased treatments, the effect size was still comparable to drug treatment for arthritis.51
Muscle relaxants (primarily cyclobenzaprine) and nonsteroidal anti-inflammatories have been studied, with no evidence of a positive effect.51 Thus, the best evidence currently supports the use of aerobic exercise and antidepressants, particularly tricyclics, for the treatment of fibromyalgia.
TABLE 3
Antidepressant therapy for fibromyalgia: the evidence
| Antidepressants (SOR: A) | |||
|---|---|---|---|
| Study (LOE) | Treatment specifics | Results | Comments |
| Arnold et al55(1) | Tricyclic antidepressants: | Benefits over placebo: significant response in 25%–37% of patients with moderate improvements in sleep, pain, and globel assessment by patient and physician, and modest improvements in fatigue tenderness and stiffness. | Studies short-term, most less than 6 weeks.In the only trial of 26 weeks, by the end of the study, the effectiveness of amitriptyline and cyclobenzaprine were no greater than placebo. |
| Amitriptyline 25–50 mg daily (n=4 trials) | |||
| Dothiepin 75 mg daily (n=1) | |||
| Cyclobenzaprine 10–40 mg daily (n=4) | |||
| Clomipramine 75 mg daily (n=1) | |||
| Maprotiline 75 mg daily (n=1) | |||
| O’Malley et al54(2) | Amitriptyline 50 mg daily (n=8 trials) | Benefits over placebo: number needed to treat of 4 with moderate improvements in sleep, overall well-being, and pain severity. Mild improvements in fatigue and number of tender points. | Combined effects from heterogeneous classes of antidepressants. |
| S-adenosylmethionine 200–800 mg daily (n=2) | |||
| Cyclobenzaprine 20 mg daily (PM), 10 mg daily (PM) (n=1) | |||
| Fluoxetine 20 mg daily (n=2) | |||
| Citalopram 20 mg daily (n=1) | |||
| Clomipramine 75 mg once daily (n=1) | |||
| Rossy et al51(2) | Amitriptyline (n=7 trials) | Benefits over placebo: improvement in physical status and fibromyalgia symptoms with effectiveness comparable with pharmacologic treatment for arthritis pain. | Heterogeneous studies. No effect on daily functioning or psychological status. |
| Dothiepin (n=1) | |||
| Fluoxetine (n=2) | |||
| Citalopram (n=1) | |||
| 5-hydroxytryptophan (n=1) | |||
| Adverse effects: not reported. | |||
| SOR,strength of recommendation; LOE,level of evidence.For an explanation of these ratings. | |||
Instructions to patients, management follow-up
Persons with fibromyalgia should know that although specific symptoms, particularly pain, may be not be dramatically reduced with treatment, aerobic exercise and tricyclic antidepressants alleviate some symptoms with minimal adverse effects (SOR: A). Emphasize that these treatments have been shown to improve one’s ability to cope with fibromyalgia symptoms. The best-studied antidepressant for treating fibromyalgia is amitriptyline, usually given at 25 to 50 mg, nightly.
Exercise. Prescribe aerobic exercise, at least twice per week for 20 to 60 minutes, targeting a heart rate of 55% to 90% of the predicted maximum (180 beats per minute-age) (SOR: A). One caveat: aerobic exercise in the literature was usually supervised, so the ideal exercise regimen might be a fibromyalgia-specific program.
Medication. Consider a trial of amitriptyline, 25 to 50 mg every night, for up to 6 weeks (SOR A). A caveat: tricyclic antidepressants may also have significant side effects, which could outweigh moderate benefits. Moreover, treatment effectiveness beyond 2 months has not been proven. Therefore, longitudinal measurement of outcomes should be part of ongoing care.
Follow-up. Studies have not determined which measures are best to follow (see “Assessing treatment efficacy”), but they might include the following (SOR: C):
- Pain (eg, visual analogue scale, pain drawings)
- Number of tender points, and tenderness
- Physical function (eg, cardiorespiratory fitness, self-reported physical function measured by the physical-impairment subscale of the FIQ,56 strength)
- Global well-being or perceived improvement (eg, physician-rated change, FIQ total score)
- Self-efficacy (eg, Arthritis Self-efficacy Questionnaire)
- Fatigue and sleep (eg, FIQ fatigsubscale, sleep visual analogue scale)
- Psychological function (eg, FIQ subscales for depression and anxiety)
- Ability to work
- Health care consumption and costs.47,50
Education or psychological coping strategies may also contribute positively to overall patient and family well-being. Consider education/psychological counseling (SOR: C) and acupuncture (SOR: B).
The Fibromyalgia Impact Questionnaire: myalgia.com/Paintools/fibromyalgia_impact_questionnair1.htm
Visual analogue pain scale: www.outcomesassessment.org/QVAS%20Form.pdf
Arthritis Self-Efficacy Questionnaire: patienteducation.stanford.edu/research/searthritis.pdf
Acknowledgments
The authors would like to express their appreciation to Cheryl Mongillo, Peggy Lardear, and Brian Pellini for their assistance in preparing the manuscript as well as Dolores Moran and Diane Wolf for their library assistance, and to James Newman, MD, rheumatologist, for his expert suggestions. Funding for this project was provided by a grant from the Delaware Department of Health and Social Services, Division of Public Health.of Health and Social Services, Division of Public Health.
- Amitripyline • Elavil
- Citalopram • Celexa
- Clomipramine • Anafranil
- Cyclobenzaprine • Flexeril
- Dothiepin • Prothiaden
- Fluoxetine • Prozac
- Maprotiline • Ludoimil
Corresponding author
Anna Quisel, MD, c/o Cheryl Mongillo, Department of Family and Community Medicine, Christiana Care Health Systems, 1401 Foulk Road, Wilmington, DE 19803. E-mail: [email protected].
1. Wolfe F, Smythe HA, Yunus MB, et al. The American College of Rheumatology 1990 criteria for the classification of fibromyalgia. Arthritis Rheum 1990;33:160-172.
2. Fitzcharles MA, Esdaile JM. The overdiagnosis of fibromyalgia syndrome. Am J Med 1997;103:44-50.
3. Dougados M, van der, Linden S, Juhlin R, et al. The European Spondylarthropathy Study Group preliminary criteria for the classification of spondylarthropathy. Arthritis Rheum 1991;34:1218-1227.
4. Suarez-Almazor ME, Gonzalez-Lopez L, Gamez-Nava JI, Belseck E, Kendall CJ, Davis P. Utilization and predictive value of laboratory tests in patients referred to rheumatologists by primary care physicians. J Rheumatol 1998;25:1980-1985.
5. Al-Allaf AW, Ottewell L, Pullar T. The prevalence and significance of positive antinuclear antibodies in patients with fibromyalgia syndrome: 2-4 years’ follow-up. Clin Rheumatol 2002;21:472-477.
6. Yunus MB, Hussey FX, Aldag JC. Antinuclear antibodies and connective tissue disease features in fibromyalgia syndrome: a controlled study. J Rheumatol 1993;20:1557-1560.
7. Delamere JP, Scott DL, Felix-Davies DD. Thyroid dysfunction and rheumatic diseases. J R Soc Med 1982;75:102-106.
8. Carette S, Lefrancois L. Fibrositis and primary hypothyroidism. J Rheumatol 1988;15:1418-1421.
9. Aarflot T, Bruusgaard D. Association between chronic widespread musculoskeletal complaints and thyroid autoimmunity. Results from a community survey. Scand J Prim Health Care 1996;14:111-115.
10. White KP, Speechley M, Harth M, Ostbye T. The London Fibromyalgia Epidemiology Study: comparing the demographic and clinical characteristics in 100 random community cases of fibromyalgia versus controls. J Rheumatol 1999;26:1577-1585.
11. Wolfe F, Hawley DJ. Evidence of disordered symptom appraisal in fibromyalgia: increased rates of reported comorbidity and comorbidity severity. Clin Exp Rheumatol 1999;17:297-303.
12. Leventhal LJ. Management of fibromyalgia. Ann Intern Med 1999;131:850-858.
13. Gedalia A, Garcia CO, Molina JF, Bradford NJ, Espinoza LR. Fibromyalgia syndrome: experience in a pediatric rheumatology clinic. Clin Exp Rheumatol 2000;18:415-419.
14. Yunus MB, Masi AT. Juvenile primary fibromyalgia syndrome. A clinical study of thirty-three patients and matched normal controls. Arthritis Rheum 1985;28:138-145.
15. Tayag-Kier CE, Keenan GF, Scalzi LV, et al. Sleep and periodic limb movement in sleep in juvenile fibromyalgia. Pediatrics 2000;106:E70.-
16. Wolfe F, Ross K, Anderson J, Russell IJ, Hebert L. The prevalence and characteristics of fibromyalgia in the general population. Arthritis Rheum 1995;38:19-28.
17. Buskila D, Press J, Gedalia A, et al. Assessment of nonarticular tenderness and prevalence of fibromyalgia in children. J Rheumatol 1993;20:368-370.
18. Mikkelsson M. One year outcome of preadolescents with fibromyalgia. J Rheumatol 1999;26:674-682.
19. Clark P, Burgos-Vargas R, Medina-Palma C, Lavielle P, Marina FF. Prevalence of fibromyalgia in children: a clinical study of Mexican children. J Rheumatol. 1998;25:2009-2014.
20. Henriksson C, Liedberg G. Factors of importance for work disability in women with fibromyalgia. J Rheumatol 2000;27:1271-1276.
21. White KP, Speechley M, Harth M, Ostbye T. Comparing self-reported function and work disability in 100 community cases of fibromyalgia syndrome versus controls in London, Ontario: the London Fibromyalgia Epidemiology Study. Arthritis Rheum 1999;42:76-83.
22. Kaplan RM, Schmidt SM, Cronan TA. Quality of well being in patients with fibromyalgia. J Rheumatol 2000;27:785-789.
23. Wolfe F, Anderson J, Harkness D, et al. A prospective, longitudinal, multicenter study of service utilization and costs in fibromyalgia. Arthritis Rheum 1997;40:1560-1570.
24. Swezey RL, Adams J. Fibromyalgia: a risk factor for osteoporosis. J Rheumatol 1999;26:2642-2644.
25. ter Borg EJ, Gerards-Rociu E, Haanen HC, Westers P. High frequency of hysterectomies and appendectomies in fibromyalgia compared with rheumatoid arthritis: a pilot study. Clin Rheumatol 1999;18:1-3.
26. Forseth KO, Forre O, Gran JT. A 5.5 year prospective study of self-reported musculoskeletal pain and of fibromyalgia in a female population: significance and natural history. Clin Rheumatol 1999;18:114-121.
27. Wolfe F, Anderson J, Harkness D, et al. Health status and disease severity in fibromyalgia: results of a six-center longitudinal study. Arthritis Rheum 1997;40:1571-1579.
28. Kennedy M, Felson DT. A prospective long-term study of fibromyalgia syndrome. Arthritis Rheum 1996;39:682-685.
29. Waylonis GW, Perkins RH. Post-traumatic fibromyalgia. A long-term follow-up. Am J Phys Med Rehabil 1994;73:403-412.
30. Baumgartner E, Finckh A, Cedraschi C, Vischer TL. A six year prospective study of a cohort of patients with fibromyalgia. Ann Rheum Dis 2002;61:644-645.
31. Mengshoel AM, Haugen M. Health status in fibromyalgia—a followup study. J Rheumatol 2001;28:2085-2089.
32. Poyhia R, Da Costa D, Fitzcharles MA. Pain and pain relief in fibromyalgia patients followed for three years. Arthritis Rheum 2001;45:355-361.
33. Makela M, Heliovaara M. Prevalence of primary fibromyalgia in the Finnish population. BMJ 1991;303:216-219.
34. Buskila D, Neumann L, Hershman E, Gedalia A, Press J, Sukenik S. Fibromyalgia syndrome in children—an outcome study. J Rheumatol 1995;22:525-528.
35. Siegel DM, Janeway D, Baum J. Fibromyalgia syndrome in children and adolescents: clinical features at presentation and status at follow-up. Pediatrics 1998;101:377-382.
36. Jason LA, Taylor RR, Kennedy CL. Chronic fatigue. Psychosom Med 2000;62:655-663.
37. Hedenberg-Magnusson B, Ernberg M, Kopp S. Presence of orofacial pain and temporomandibular disorder in fibromyalgia. A study by questionnaire. Swed Dent J 1999;23:185-192.
38. Buskila D, Odes LR, Neumann L, Odes HS. Fibromyalgia in inflammatory bowel disease. J Rheumatol 1999;26:1167-1171.
39. Goldenberg DL. Clinical manifestations and diagnosis of fibromyalgia. UpToDate [computer database]. Wellesley, Mass: UpToDate; 2001.
40. Croft P, Schollum J, Silman A. Population study of tender point counts and pain as evidence of fibromyalgia. BMJ 1994;309:696-699.
41. Croft P, Burt J, Schollum J, Thomas E, Macfarlane G, Silman A. More pain, more tender points: is fibromyalgia just one end of a continuous spectrum? Ann Rheum Dis 1996;55:482-485.
42. Wolfe F. The relation between tender points and fibromyalgia symptom variables: evidence that fibromyalgia is not a discrete disorder in the clinic. Ann Rheum Dis 1997;56:268-271.
43. Smythe H. Examination for tenderness: learning to use 4 kg force. J Rheumatol 1998;25:149-151.
44. Tunks E, McCain GA, Hart LE, et al. The reliability of examination for tenderness in patients with myofacial pain, chronic fibromyalgia and controls. J Rheumatol 1995;22:944-952.
45. Jacobs JW, Geenen R, van der Heide A, Rasker JJ, Bijlsma JW. Are tender point scores assessed by manual palpation in fibromyalgia reliable? An investigation into the variance of tender point scores. Scand J Rheumatol 1995;24:243-247.
46. Okifuji A, Turk D, Sinclair J, Starz T, Marcus D. A standardized manual tender point survey. I. Development and determination of a threshold point for the identification of positive tender points in fibromyalgia syndrome. J Rheumatol 1997;24:377-383.
47. Cathey M, Wolfe F, Kleinheksel S, Hawley D. Socioeconomic impact of fibrositis. A study of 81 patients with primary fibrositis. Am J Med 1986;81:78-84.
48. Bandolier. Fibromyalgia: diagnosis and treatment. Bandolier 2001;110:90-92.
49. Busch A, Schachter CL, Peloso PM, Bombardier C. Exercise for treating fibromyalgia syndrome. Cochrane Database Syst Rev 2002;3:CD003786.-
50. Sim J, Adams N. Systematic review of randomized controlled trials of nonpharmacological interventions for fibromyalgia. Clin J Pain 2002;18:324-336.
51. Rossy LA, Buckelew SP, Dorr N, et al. A meta-analysis of fibromyalgia treatment interventions. Ann Behav Med 1999;21:180-191.
52. Karjalainen K, Malmivaara A, van Tulder M, et al. Multidisciplinary rehabilitation for fibromyalgia and musculoskeletal pain in working age adults. The Cochrane Library 2003(1).
53. Berman BM, Ezzo J, Hadhazy V, Swyers JP. Is acupuncture effective in the treatment of fibromyalgia? J Fam Pract 1999;48:213-218.
54. O’Malley PG, Balden E, Tomkins G, Santoro J, Kroenke K, Jackson JL. Treatment of fibromyalgia with antidepressants: a meta-analysis. J Gen Itern Med 2000;15:659-666.
55. Arnold LM, Keck PE, Welge JA. Antidepressment treatment of fibromyalgia. A meta-analysis and review. Psychosomatics 2000;41:104-113.
56. Burckhardt C, Clark S, Bennett R. The fibromyalgia impact questionnaire: development and validation. J Rheumatol 1991;18:728-733.
- Fibromyalgia is diagnosed based on a patient’s report of widespread pain of 3 months’duration or longer, and identification of 11 of 18 possible tender points (C).
- Fibromyalgia is functionally disabling and diminishes well-being; therefore, supportive care and evidence-based interventions should be offered (C).
- Aerobic exercise and antidepressants have been shown to moderately relieve symptoms of fibromyalgia in the short term (A).
When a patient complains of pain “all over,” consider fibromyalgia, which typically causes a well-documented pattern of pain and characteristic points of tenderness observable on physical exam. Once alternative diagnoses have been ruled out, offer the patient a 2-pronged therapeutic regimen that has proven successful at moderately relieving symptoms.
First rule out concomitant or mimicking disorders
Consider the differential diagnosis carefully.1 A person who meets the criteria for fibromyalgia may have yet another cause of chronic pain, such as rheumatoid arthritis, or may instead have a different treatable condition that mimics fibromyalgia.
Drug-induced myopathy. Pain suggestive of fibromyalgia should prompt a review of the patient’s medicines. Drug-induced myopathy may occur in persons taking colchicine, statins, corticosteroids, or antimalarial drugs.
Connective tissue, autoimmune, and rheumatologic disorders. Consider this group of disorders next. In 1 study, one fourth of persons referred to a rheumatology clinic with presumed fibromyalgia instead had a spondyloarthropathy.2
Dermatomyositis and polymyositis may present with muscle pain and tenderness but, unlike fibromyalgia, cause proximal muscle weakness.
Systemic lupus erythematosus, rheumatoid arthritis, and polymyalgia rheumatica can also lead to widespread pain.
Blood tests such as antinuclear antibody (ANA), C-reactive protein, or erythrocyte sedimentation rate (ESR) may prove helpful when a patient has a history of unexplained rashes, fever, weight loss, joint swelling, iritis, hepatitis, nephritis, or inflammatory back pain (onset before age 40, insidious onset, present for more than 3 months, associated with morning stiffness, improvement with exercise).3 In the absence of these signs, ANA, rheumatoid factor, and ESR testing in persons with fatigue and diffuse musculoskeletal pain have low positive predictive value.4 The rate of false-positive ANA results may be as high as 8% to 11%, especially at low titers.5,6
Hypothyroidism. Widespread musculoskeletal pain has also been associated with hypothyroidism (level of evidence [LOE]: 2, case-control design),7,8 supporting the inclusion of a thyroidstimulating hormone in the work-up of fibromyalgia (strength of recommendation [SOR]: B). More recent research suggests that musculoskeletal pain is more related to thyroid microsomal antibodies than to hypothyroidism,9 but there has been no further evaluation of antithyroid antibodies in persons with fibromyalgia.
Diagnosis: mostly by clinical judgment
Persons with fibromyalgia have widespread pain, often worst in the neck and trunk.1 Additional symptoms include fatigue, morning stiffness, waking unrefreshed, paresthesias, and headache.1,10-15 (See “The toll of fibromyalgia.”)
In community-based studies, 2% of adults16 and 1.2% to 6.2% of school-age children screened positive for fibromyalgia.17-19 Females are at higher risk than males, and risk increases with age, peaking between 55 and 79 years.
Morbidity associated with fibromyalgia is considerable.16,20,21 In one report,persons with fibromyalgia scored lower on a well-being scale than persons with rheumatoid arthritis or advanced cancer.22
Persons with fibromyalgia use an average of 2.7 drugs at any one time for related symptoms, and they make an average of 10 outpatient visits per year and are hospitalized once every 3 years.23
Fibromyalgia has been associated with osteoporosis.24 Compared with other rheumatic diseases, fibromyalgia results in a high rate of surgery, including hysterectomies, appendectomies, back and neck surgery, and carpal tunnel surgery.23,25 Among adults who seek medical attention, fewer than 30% have been reported to recover from fibromyalgia within 10 years of onset.26-29
However,symptoms tend to remain stable27 or lessen over time,28,30-32 with no increase in 10-year mortality.33 Children appear much more likely to recover from fibromyalgia, with complete resolution in more than 50% by 2 to 3 years in several studies.13,18,34,35
Cormorbid conditions
Compared with other rheumatologic conditions, persons with fibromyalgia more often suffer from comorbid conditions,23 including chronic fatigue syndrome, migraine headaches, irritable bowel syndrome, irritable bladder symptoms, temporomandibular joint syndrome, myofascial pain syndrome, restless legs syndrome, and affective disorders.23,36,37
Accepted criteria
The diagnosis of fibromyalgia is based on 2 criteria:
1. A patient’s report of widespread pain (right and left sides of the body, above and below the waist, and including the axial skeleton) persisting for at least 3 months
2. The clinician’s identification of at least 11 of 18 potential tender points as specified in the American College of Rheumatology (ACR) 1990 Criteria for the Classification of Fibromyalgia (Figure) (LOE: 3, case-control design, nonindependent reference standard).1
These criteria do not exclude persons with rheumatic diseases or other chronic pain conditions.1,37-39
Caveats with the criteria
Despite these well-defined criteria, the diagnosis is not as clear-cut as it may appear. In 1990, the ACR convened a panel of 24 experts to define and standardize the diagnosis of fibromyalgia. The basis for this consensus was a group of 293 patients with fibromyalgia, each of whom had been assessed by one of the expert investigators according to “his or her usual method of diagnosis.” 1
The investigators determined the unique characteristics of fibromyalgia by comparing the 293 cases to 265 controls who had other chronic pain conditions (eg, low back pain syndromes, neck pain syndromes, regional tendonitis, possible systemic lupus erythematosus, rheumatoid arthritis). The investigators considered a multitude of symptoms and signs including sleep disturbance, morning stiffness, paresthesias, irritable bowel syndrome, fatigue, and anxiety. Their conclusion was that widespread pain and tender points were the most sensitive (88.4%) and specific (81.1%) distinguishing criteria for fibromyalgia.1
No reference standard. However, these calculations of sensitivity and specificity are less meaningful than in studies where an independent reference standard or gold standard is available. The ACR expert panel derived the criteria in a circular way using a nonindependent reference standard—ie, patients thought to have fibromyalgia compared with control patients thought not to have fibromyalgia. The expert panel essentially set the specificity of the criteria at 100%, since the specificity is based on the rate of false positives.
Furthermore, because there was no objective gold standard for determining who truly had fibromyalgia (and we do not yet have an independent biologic “test” for this condition), this panel could not determine whether additional symptoms or signs that should be considered in the diagnosis of fibromyalgia.
Biases, dubious representation? Unknown elements in this analysis are 1) how closely the reference population used to develop these criteria represents the true population of persons with fibromyalgia, and 2) the biases of the ACR experts. Finally, the positive and negative predictive values of these criteria will depend on the prevalence of fibromyalgia and other similar conditions.
Morbidity not predicted by criteria. In addition, the 1990 ACR criteria assume the number of tender points and degree of pain are directly proportional to overall morbidity; however, a person with fewer than 11 tender points may experience significant morbidity, indicating that the sensitivity of the criteria may be low.40-42 As suggested by Wolfe in 1997, “the tender point count functions as a sedimentation rate for distress” in persons with chronic pain.42 Thus, the authors of the 1990 ACR study stated that ACR criteria should not be applied rigidly in diagnosing and treating fibromyalgia,42 leaving a large role for clinical judgment.
Subjective factors. A final difficulty with the diagnosis of fibromyalgia is its dependence on patient report and examiner technique.1 In the 1990 ACR criteria, tender points were defined as a complaint of pain (or any more dramatic response) when an examiner applied 4 kg of pressure with the pulp of the thumb or first two or three fingers, calibrated with a dolorimeter (a device that can measure the amount and rate of pressure applied over a specified surface area).1 It has been shown that practitioners require training to apply 4 kg of force with regularity.43
However, applying exactly 4 kg of pressure may not be clinically important. Other studies have shown that finger palpation or dolorimetry identifies tender points with equal accuracy (LOE: 3, case-control design with non-independent reference standard).44,45
Manual palpation
A controlled study of manual palpation was conducted to standardize the tender point survey described in the Figure. 46 This method compares well with the ACR 1990 method, with a sensitivity of 88.6% and a specificity of 71.4%.46
To speed up the examination, a particular sequence of palpating survey points was established, with the patient positioned as outlined in the Figure. Using the thumb pad of his/her dominant hand, each examiner applied 4 kg of pressure, at a rate of 1 kg per second, just once at each survey point. Examiners learned to apply the proper amount of pressure by standing a patient on a scale and watching the scale while pressing down perpendicularly on the trapezius survey point.
The examinee was seated throughout the exam, except when lying on the side for palpation of the trochanter and lying supine for palpation of the knee. A tender point was identified when the patient rated the pain resulting from palpation at least 2 out of 10 (0, no pain; 10 worst pain) (LOE: 3, case-control design, nonindependent reference standard).46
Until a firm biologic basis for fibromyalgia is discovered and a true gold standard for testing is developed, the diagnosis of fibromyalgia will remain a matter of clinical judgment and convention (SOR: C).
Treatment
A diagnosis of fibromyalgia alone may result in health benefits. In a year-long study published in 1986, Cathey et al reported that among 81 persons diagnosed with fibromyalgia, hospitalization rates decreased in the year following diagnosis (LOE: 2, case-control design).47
Treatments for fibromyalgia are numerous, ranging from balneotherapy (bathing) to low-energy laser therapy, and studies of interventions are often poorly designed, based on small numbers of patients, report nonstandardized outcomes, and yield conflicting results.48
Two interventions—aerobic exercise and antidepressant therapy—appear to improve fibromyalgia.
Aerobic exercise
Though pain relief is insignificant with aerobic exercise, other positive effects are significant (SOR: A). A 2003 Cochrane review identified 7 high-quality studies of aerobic training, defined as: 1) frequency of 2 days per week; 2) intensity sufficient to achieve 40% to 85% of heart rate reserve, or 55% to 90% of predicted maximum heart rate; 3) duration of sessions 20 to 60 minutes, either continuously or intermittently throughout the day, using any mode of aerobic exercise; and 4) a total exercise period of at least 6 weeks (Table 1).49
Improved functioning, tender-point threshold. Study subjects engaged in aerobic dancing, whole-body aerobics, stationary cycling, and walking. Persons who exercised improved in global well-being, physical function, and aerobic fitness (by about 17%), and raised the pain threshold of tender points (by about 35%).49 Four of the studies were similar enough to be combined for meta-analysis, showing a statistically robust but modest reduction in tender-point threshold (LOE: 1).
Although it seems likely that pain or fatigue might increase at least initially with exercise, participants in the exercise groups were not deterred; the researchers pointed out that reporting of adverse effects of aerobic exercise appeared incomplete, but there was no significant difference in drop-out rates between the exercise (25.1%) and control groups (12.5%).49
In the long-term studies (>6 months), improvements were noted up to 1 year after treatment ended but not after 4.5 years.49 This Cochrane review further supports aerobic exercise as bring beneficial for persons with fibromyalgia.50,51
Additional improvement measures. A similar systematic review concluded that although studies were too heterogeneous to draw final conclusions, preliminary data supported aerobic exercise (LOE: 2, with heterogeneous studies).50 In another comprehensive meta-analysis of all treatments for fibromyalgia, heterogeneous treatment studies ranging from exercise to physical therapy were identified as physically-based treatments. The analysis revealed a positive effect on physical status (including tender-point index, grip strength, and physician global rating of pain symptoms), fibromyalgia symptoms (including self-reported fatigue and pain using visual analog scales), and psychological status (including measurements of the Hamilton Depression and Anxiety Scales), with no effect on daily functioning (including outcome measures such as the Fibromyalgia Impact Questionnaire [FIQ]) (LOE: 2, with heterogeneous studies).51
The authors noted that the magnitude of the positive effects of physically-based treatments on fibromyalgia were comparable with drug treatment judged effective for arthritis.51
TABLE 1
Aerobic exercise for fibromyalgia: the evidence
| Aerobic exercise (SOR: A) | |||
|---|---|---|---|
| Study (LOE) | Treatment specifics | Results | Comments |
| Busch et al49(1) | Supervised aerobic training—eg, aerobic dancing, stationary cycling, walking: 1) frequency of 2 days per week, 2) intensity sufficient to achieve 40%–85% of heart rate reserve or 55%–90% predicted maximum heart rate, 3) duration of sessions of 20–60 minutes duration, either continuously or intermittently throughout the day, and using any mode of aerobic exercise, 4) total time period of at least 6 weeks, maximum 1 year in these studies. | Benefits over controls: improvements in aerobic performance, tender points, and global well-being. | 4 high-quality aerobic training studies included in meta-analysis. No significant improvements in pain intensity, fatigue, sleep, and psycho-logical function. |
| Adverse effects: poorly reported. | |||
| Sim et al50(2) | Not standardized, but 3 studies set exercise intensity at 60%–75% of max.heart rate.Duration 6 weeks to 20 weeks. | Benefits over controls: preliminary evidence for improvements in symptoms. | Heterogeneous studies. |
| Adverse effects: not reported. | |||
| Rossy et al51(2) | Loosely defined and heterogeneous, including “exercise, strengthening, walking, stretching, pool therapy, cycling, swimming, and aerobics.” | Benefits over controls: improvement in physical status, fibromyalgia symptoms, and psychological status with effectiveness comparable with pharmacologic treatment for arthritis pain. | Heterogeneous studies.No improvement in daily functioning. |
| Adverse effects: not reported. | |||
| SOR,strength of recommendation; LOE,level of evidence.For an explanation of these ratings | |||
Less certain nonpharmacologic therapies
Other nonpharmacologic treatments for fibromyalgia are educational interventions, relaxation therapy, cognitive-behavioral therapy, and acupuncture. These therapies have undergone rigorous analysis, but studies have been too heterogeneous to allow for strong conclusions across the studies.50
A recent Cochrane review concluded that although physical training plus education had a positive effect at long-term follow up, evidence is insufficient to recommend multidisciplinary rehabilitation, defined as the care of a physician plus psychological, social, and vocational interventions (SOR: C).52
In contrast, other investigators have concluded that multidisciplinary treatment incorporating physically and psychologically based treatments was more successful than treatment with a single modality.51 A systematic review of acupuncture identified only 1 high-quality randomized controlled trial (Table 2), which did show some improvement in symptoms (SOR: C).53
TABLE 2
Alternative nonpharmacologic therapies for fibromyalgia: the evidence
| Multidisciplinary rehabilitation (physician and psychological, social, or vocational interventions) (SOR: C) | |||
|---|---|---|---|
| Study (LOE) | Treatment specifics | Results | Comments |
| Karjalainen et al52(2) | Education plus physical training vs education; education plus cognitive treatment vs education and group discussion; behavioral therapy vs education; stress management vs aerobic exercise. | Benefits over controls: not significant. | Heterogeneous studies.No high-quality randomized controlled trials identified. |
| Adverse effects: not reported. | |||
| Acupuncture (SOR: B) | |||
| Berman et al53 (2) | Systematic review. | Benefits over placebo: improvements in pain, stiffness, global improvement. | Only 1 randomized controlled trial.No long-term results. |
| Adverse effects: pain with needle insertion. | |||
| SOR,strength of recommendation; LOE,level of evidence.For an explanation of these ratings. | |||
Therapy with antidepressants
Of all pharmacologic treatments, antidepressants have undergone the most thorough study. Although the optimal role of medications in fibromyalgia has not been delineated, 3 metaanalyses have reported that antidepressants, most commonly amitriptyline, reduce symptoms during treatment of a few months duration (SOR: A) (Table 3).54,55
Any antidepressants. Pooled results from 13 studies (8 of tricyclics, 3 of selective serotonin reuptake inhibitors, 2 of s-adenosylmethionine) revealed a moderate effect on pain, sleep, and global well-being, and a mild effect on fatigue and number of trigger points.54 The authors calculated that persons with fibromyalgia treated with antidepressants were 4 times more likely to improve than persons treated with placebo (number need to treat [NNT]=4). Adverse effects appeared insignificant but were poorly reported in the individual studies.
Tricyclics only. In another meta-analysis, 9 high-quality studies of tricyclic antidepressants (amitriptyline, dothiepin, clomipramine, maprotiline and cyclobenzaprine—classified by the authors as a tricyclic antidepressant) were analyzed for 7 outcomes (patient self-rating of pain, fatigue, stiffness, and sleep; the patient and physician global assessment of improvement; and tenderness of tender points). Significant responses were observed in 25% to 37% of patients. On meta-analysis, outcome measures improved moderately overall with tricyclic treatment, mostly in sleep and global assessment, least in stiffness and tenderness. Long-term safety (more than 8 weeks) and efficacy of tricyclic therapy for fibromyalgia have not been demonstrated.55
Combined trials.A third meta-analysis demonstrated improvement when trials of different antidepressants were combined.51 By pooling studies of antidepressants (amitriptyline, dothiepin, fluoxetine, citalopram, and S-adenosylmethionine) improvements in physical status, fibromyalgia symptoms, and psychological status were found, with no improvement in daily functioning.51 Although the effect was smaller than physicallybased treatments, the effect size was still comparable to drug treatment for arthritis.51
Muscle relaxants (primarily cyclobenzaprine) and nonsteroidal anti-inflammatories have been studied, with no evidence of a positive effect.51 Thus, the best evidence currently supports the use of aerobic exercise and antidepressants, particularly tricyclics, for the treatment of fibromyalgia.
TABLE 3
Antidepressant therapy for fibromyalgia: the evidence
| Antidepressants (SOR: A) | |||
|---|---|---|---|
| Study (LOE) | Treatment specifics | Results | Comments |
| Arnold et al55(1) | Tricyclic antidepressants: | Benefits over placebo: significant response in 25%–37% of patients with moderate improvements in sleep, pain, and globel assessment by patient and physician, and modest improvements in fatigue tenderness and stiffness. | Studies short-term, most less than 6 weeks.In the only trial of 26 weeks, by the end of the study, the effectiveness of amitriptyline and cyclobenzaprine were no greater than placebo. |
| Amitriptyline 25–50 mg daily (n=4 trials) | |||
| Dothiepin 75 mg daily (n=1) | |||
| Cyclobenzaprine 10–40 mg daily (n=4) | |||
| Clomipramine 75 mg daily (n=1) | |||
| Maprotiline 75 mg daily (n=1) | |||
| O’Malley et al54(2) | Amitriptyline 50 mg daily (n=8 trials) | Benefits over placebo: number needed to treat of 4 with moderate improvements in sleep, overall well-being, and pain severity. Mild improvements in fatigue and number of tender points. | Combined effects from heterogeneous classes of antidepressants. |
| S-adenosylmethionine 200–800 mg daily (n=2) | |||
| Cyclobenzaprine 20 mg daily (PM), 10 mg daily (PM) (n=1) | |||
| Fluoxetine 20 mg daily (n=2) | |||
| Citalopram 20 mg daily (n=1) | |||
| Clomipramine 75 mg once daily (n=1) | |||
| Rossy et al51(2) | Amitriptyline (n=7 trials) | Benefits over placebo: improvement in physical status and fibromyalgia symptoms with effectiveness comparable with pharmacologic treatment for arthritis pain. | Heterogeneous studies. No effect on daily functioning or psychological status. |
| Dothiepin (n=1) | |||
| Fluoxetine (n=2) | |||
| Citalopram (n=1) | |||
| 5-hydroxytryptophan (n=1) | |||
| Adverse effects: not reported. | |||
| SOR,strength of recommendation; LOE,level of evidence.For an explanation of these ratings. | |||
Instructions to patients, management follow-up
Persons with fibromyalgia should know that although specific symptoms, particularly pain, may be not be dramatically reduced with treatment, aerobic exercise and tricyclic antidepressants alleviate some symptoms with minimal adverse effects (SOR: A). Emphasize that these treatments have been shown to improve one’s ability to cope with fibromyalgia symptoms. The best-studied antidepressant for treating fibromyalgia is amitriptyline, usually given at 25 to 50 mg, nightly.
Exercise. Prescribe aerobic exercise, at least twice per week for 20 to 60 minutes, targeting a heart rate of 55% to 90% of the predicted maximum (180 beats per minute-age) (SOR: A). One caveat: aerobic exercise in the literature was usually supervised, so the ideal exercise regimen might be a fibromyalgia-specific program.
Medication. Consider a trial of amitriptyline, 25 to 50 mg every night, for up to 6 weeks (SOR A). A caveat: tricyclic antidepressants may also have significant side effects, which could outweigh moderate benefits. Moreover, treatment effectiveness beyond 2 months has not been proven. Therefore, longitudinal measurement of outcomes should be part of ongoing care.
Follow-up. Studies have not determined which measures are best to follow (see “Assessing treatment efficacy”), but they might include the following (SOR: C):
- Pain (eg, visual analogue scale, pain drawings)
- Number of tender points, and tenderness
- Physical function (eg, cardiorespiratory fitness, self-reported physical function measured by the physical-impairment subscale of the FIQ,56 strength)
- Global well-being or perceived improvement (eg, physician-rated change, FIQ total score)
- Self-efficacy (eg, Arthritis Self-efficacy Questionnaire)
- Fatigue and sleep (eg, FIQ fatigsubscale, sleep visual analogue scale)
- Psychological function (eg, FIQ subscales for depression and anxiety)
- Ability to work
- Health care consumption and costs.47,50
Education or psychological coping strategies may also contribute positively to overall patient and family well-being. Consider education/psychological counseling (SOR: C) and acupuncture (SOR: B).
The Fibromyalgia Impact Questionnaire: myalgia.com/Paintools/fibromyalgia_impact_questionnair1.htm
Visual analogue pain scale: www.outcomesassessment.org/QVAS%20Form.pdf
Arthritis Self-Efficacy Questionnaire: patienteducation.stanford.edu/research/searthritis.pdf
Acknowledgments
The authors would like to express their appreciation to Cheryl Mongillo, Peggy Lardear, and Brian Pellini for their assistance in preparing the manuscript as well as Dolores Moran and Diane Wolf for their library assistance, and to James Newman, MD, rheumatologist, for his expert suggestions. Funding for this project was provided by a grant from the Delaware Department of Health and Social Services, Division of Public Health.of Health and Social Services, Division of Public Health.
- Amitripyline • Elavil
- Citalopram • Celexa
- Clomipramine • Anafranil
- Cyclobenzaprine • Flexeril
- Dothiepin • Prothiaden
- Fluoxetine • Prozac
- Maprotiline • Ludoimil
Corresponding author
Anna Quisel, MD, c/o Cheryl Mongillo, Department of Family and Community Medicine, Christiana Care Health Systems, 1401 Foulk Road, Wilmington, DE 19803. E-mail: [email protected].
1. Wolfe F, Smythe HA, Yunus MB, et al. The American College of Rheumatology 1990 criteria for the classification of fibromyalgia. Arthritis Rheum 1990;33:160-172.
2. Fitzcharles MA, Esdaile JM. The overdiagnosis of fibromyalgia syndrome. Am J Med 1997;103:44-50.
3. Dougados M, van der, Linden S, Juhlin R, et al. The European Spondylarthropathy Study Group preliminary criteria for the classification of spondylarthropathy. Arthritis Rheum 1991;34:1218-1227.
4. Suarez-Almazor ME, Gonzalez-Lopez L, Gamez-Nava JI, Belseck E, Kendall CJ, Davis P. Utilization and predictive value of laboratory tests in patients referred to rheumatologists by primary care physicians. J Rheumatol 1998;25:1980-1985.
5. Al-Allaf AW, Ottewell L, Pullar T. The prevalence and significance of positive antinuclear antibodies in patients with fibromyalgia syndrome: 2-4 years’ follow-up. Clin Rheumatol 2002;21:472-477.
6. Yunus MB, Hussey FX, Aldag JC. Antinuclear antibodies and connective tissue disease features in fibromyalgia syndrome: a controlled study. J Rheumatol 1993;20:1557-1560.
7. Delamere JP, Scott DL, Felix-Davies DD. Thyroid dysfunction and rheumatic diseases. J R Soc Med 1982;75:102-106.
8. Carette S, Lefrancois L. Fibrositis and primary hypothyroidism. J Rheumatol 1988;15:1418-1421.
9. Aarflot T, Bruusgaard D. Association between chronic widespread musculoskeletal complaints and thyroid autoimmunity. Results from a community survey. Scand J Prim Health Care 1996;14:111-115.
10. White KP, Speechley M, Harth M, Ostbye T. The London Fibromyalgia Epidemiology Study: comparing the demographic and clinical characteristics in 100 random community cases of fibromyalgia versus controls. J Rheumatol 1999;26:1577-1585.
11. Wolfe F, Hawley DJ. Evidence of disordered symptom appraisal in fibromyalgia: increased rates of reported comorbidity and comorbidity severity. Clin Exp Rheumatol 1999;17:297-303.
12. Leventhal LJ. Management of fibromyalgia. Ann Intern Med 1999;131:850-858.
13. Gedalia A, Garcia CO, Molina JF, Bradford NJ, Espinoza LR. Fibromyalgia syndrome: experience in a pediatric rheumatology clinic. Clin Exp Rheumatol 2000;18:415-419.
14. Yunus MB, Masi AT. Juvenile primary fibromyalgia syndrome. A clinical study of thirty-three patients and matched normal controls. Arthritis Rheum 1985;28:138-145.
15. Tayag-Kier CE, Keenan GF, Scalzi LV, et al. Sleep and periodic limb movement in sleep in juvenile fibromyalgia. Pediatrics 2000;106:E70.-
16. Wolfe F, Ross K, Anderson J, Russell IJ, Hebert L. The prevalence and characteristics of fibromyalgia in the general population. Arthritis Rheum 1995;38:19-28.
17. Buskila D, Press J, Gedalia A, et al. Assessment of nonarticular tenderness and prevalence of fibromyalgia in children. J Rheumatol 1993;20:368-370.
18. Mikkelsson M. One year outcome of preadolescents with fibromyalgia. J Rheumatol 1999;26:674-682.
19. Clark P, Burgos-Vargas R, Medina-Palma C, Lavielle P, Marina FF. Prevalence of fibromyalgia in children: a clinical study of Mexican children. J Rheumatol. 1998;25:2009-2014.
20. Henriksson C, Liedberg G. Factors of importance for work disability in women with fibromyalgia. J Rheumatol 2000;27:1271-1276.
21. White KP, Speechley M, Harth M, Ostbye T. Comparing self-reported function and work disability in 100 community cases of fibromyalgia syndrome versus controls in London, Ontario: the London Fibromyalgia Epidemiology Study. Arthritis Rheum 1999;42:76-83.
22. Kaplan RM, Schmidt SM, Cronan TA. Quality of well being in patients with fibromyalgia. J Rheumatol 2000;27:785-789.
23. Wolfe F, Anderson J, Harkness D, et al. A prospective, longitudinal, multicenter study of service utilization and costs in fibromyalgia. Arthritis Rheum 1997;40:1560-1570.
24. Swezey RL, Adams J. Fibromyalgia: a risk factor for osteoporosis. J Rheumatol 1999;26:2642-2644.
25. ter Borg EJ, Gerards-Rociu E, Haanen HC, Westers P. High frequency of hysterectomies and appendectomies in fibromyalgia compared with rheumatoid arthritis: a pilot study. Clin Rheumatol 1999;18:1-3.
26. Forseth KO, Forre O, Gran JT. A 5.5 year prospective study of self-reported musculoskeletal pain and of fibromyalgia in a female population: significance and natural history. Clin Rheumatol 1999;18:114-121.
27. Wolfe F, Anderson J, Harkness D, et al. Health status and disease severity in fibromyalgia: results of a six-center longitudinal study. Arthritis Rheum 1997;40:1571-1579.
28. Kennedy M, Felson DT. A prospective long-term study of fibromyalgia syndrome. Arthritis Rheum 1996;39:682-685.
29. Waylonis GW, Perkins RH. Post-traumatic fibromyalgia. A long-term follow-up. Am J Phys Med Rehabil 1994;73:403-412.
30. Baumgartner E, Finckh A, Cedraschi C, Vischer TL. A six year prospective study of a cohort of patients with fibromyalgia. Ann Rheum Dis 2002;61:644-645.
31. Mengshoel AM, Haugen M. Health status in fibromyalgia—a followup study. J Rheumatol 2001;28:2085-2089.
32. Poyhia R, Da Costa D, Fitzcharles MA. Pain and pain relief in fibromyalgia patients followed for three years. Arthritis Rheum 2001;45:355-361.
33. Makela M, Heliovaara M. Prevalence of primary fibromyalgia in the Finnish population. BMJ 1991;303:216-219.
34. Buskila D, Neumann L, Hershman E, Gedalia A, Press J, Sukenik S. Fibromyalgia syndrome in children—an outcome study. J Rheumatol 1995;22:525-528.
35. Siegel DM, Janeway D, Baum J. Fibromyalgia syndrome in children and adolescents: clinical features at presentation and status at follow-up. Pediatrics 1998;101:377-382.
36. Jason LA, Taylor RR, Kennedy CL. Chronic fatigue. Psychosom Med 2000;62:655-663.
37. Hedenberg-Magnusson B, Ernberg M, Kopp S. Presence of orofacial pain and temporomandibular disorder in fibromyalgia. A study by questionnaire. Swed Dent J 1999;23:185-192.
38. Buskila D, Odes LR, Neumann L, Odes HS. Fibromyalgia in inflammatory bowel disease. J Rheumatol 1999;26:1167-1171.
39. Goldenberg DL. Clinical manifestations and diagnosis of fibromyalgia. UpToDate [computer database]. Wellesley, Mass: UpToDate; 2001.
40. Croft P, Schollum J, Silman A. Population study of tender point counts and pain as evidence of fibromyalgia. BMJ 1994;309:696-699.
41. Croft P, Burt J, Schollum J, Thomas E, Macfarlane G, Silman A. More pain, more tender points: is fibromyalgia just one end of a continuous spectrum? Ann Rheum Dis 1996;55:482-485.
42. Wolfe F. The relation between tender points and fibromyalgia symptom variables: evidence that fibromyalgia is not a discrete disorder in the clinic. Ann Rheum Dis 1997;56:268-271.
43. Smythe H. Examination for tenderness: learning to use 4 kg force. J Rheumatol 1998;25:149-151.
44. Tunks E, McCain GA, Hart LE, et al. The reliability of examination for tenderness in patients with myofacial pain, chronic fibromyalgia and controls. J Rheumatol 1995;22:944-952.
45. Jacobs JW, Geenen R, van der Heide A, Rasker JJ, Bijlsma JW. Are tender point scores assessed by manual palpation in fibromyalgia reliable? An investigation into the variance of tender point scores. Scand J Rheumatol 1995;24:243-247.
46. Okifuji A, Turk D, Sinclair J, Starz T, Marcus D. A standardized manual tender point survey. I. Development and determination of a threshold point for the identification of positive tender points in fibromyalgia syndrome. J Rheumatol 1997;24:377-383.
47. Cathey M, Wolfe F, Kleinheksel S, Hawley D. Socioeconomic impact of fibrositis. A study of 81 patients with primary fibrositis. Am J Med 1986;81:78-84.
48. Bandolier. Fibromyalgia: diagnosis and treatment. Bandolier 2001;110:90-92.
49. Busch A, Schachter CL, Peloso PM, Bombardier C. Exercise for treating fibromyalgia syndrome. Cochrane Database Syst Rev 2002;3:CD003786.-
50. Sim J, Adams N. Systematic review of randomized controlled trials of nonpharmacological interventions for fibromyalgia. Clin J Pain 2002;18:324-336.
51. Rossy LA, Buckelew SP, Dorr N, et al. A meta-analysis of fibromyalgia treatment interventions. Ann Behav Med 1999;21:180-191.
52. Karjalainen K, Malmivaara A, van Tulder M, et al. Multidisciplinary rehabilitation for fibromyalgia and musculoskeletal pain in working age adults. The Cochrane Library 2003(1).
53. Berman BM, Ezzo J, Hadhazy V, Swyers JP. Is acupuncture effective in the treatment of fibromyalgia? J Fam Pract 1999;48:213-218.
54. O’Malley PG, Balden E, Tomkins G, Santoro J, Kroenke K, Jackson JL. Treatment of fibromyalgia with antidepressants: a meta-analysis. J Gen Itern Med 2000;15:659-666.
55. Arnold LM, Keck PE, Welge JA. Antidepressment treatment of fibromyalgia. A meta-analysis and review. Psychosomatics 2000;41:104-113.
56. Burckhardt C, Clark S, Bennett R. The fibromyalgia impact questionnaire: development and validation. J Rheumatol 1991;18:728-733.
Preventing phenytoin intoxication: Safer use of a familiar anticonvulsant
- To load phenytoin initially or to add a supplemental load, use this formula: for each μg/mL desired increase in the phenytoin serum level, increase the loading dose by 0.75 mg/kg (C).
- Measure the peak serum level shortly after loading—30 to 60 minutes or more after giving intravenous phenytoin, 2 hours or more after intravenous fosphenytoin, 4 hours or more after intramuscular fosphenytoin, and 16–24 hours after accelerated oral loading (C).
- The daily maintenance dose (mg/kg/d) ordinarily needed to achieve a specified serum level or maintain it after loading is calculated thus: (8 x target serum level)/(6 + target serum level) (C).
- Safe practice for initiating or adjusting a maintenance dosage should include patient education and close follow-up (C).
Despite the introduction of new anticonvulsant drugs, phenytoin is still a first-line medication for common types of epileptic seizures, particularly those caused by focal brain lesions.1-4 Available in parenteral and oral form, phenytoin (or its pro-drug, fosphenytoin) is widely used. An estimated 873,000 prescriptions for phenytoin were issued during office visits in 2001.5
Phenytoin carries a special risk of dose-related toxicity, due to its saturation (zero-order) pharmacokinetics: serum levels often rise much more than would ordinarily be expected after initiating or increasing a maintenance dose. This predicts a vulnerability to toxicity, but does not predict exactly when this will occur in the individual.
The risk of toxicity can be minimized, however, by applying practical dosing and monitoring strategies based on the understanding of phenytoin pharmacokinetics, and by educating patients appropriately.
Patients at risk: the scope of the problem
Extrapolating from the more than 5000 hospitals in the US6 to our experience in an urban community hospital, we estimate there may be as many as 25,000 cases of phenytoin intoxication presenting annually to emergency departments or resulting in hospitalization in the United States. In 1 study, a tertiary hospital recorded phenytoin intoxication from all causes at a rate of 1 inpatient admission per month over a 10-year period.7 Another study at a major hospital found 143 instances of phenytoin levels >25 μg/mL in 1 year; 86% of 120 studied cases were toxic, representing 33% of all adverse drug reactions reported.8 Thus, evidence points to a substantial problem with patient safety nationwide.
Adverse drug events like phenytoin intoxication increase morbidity, causing such injuries as falls due to ataxia and resulting in expenses of office or emergency department visits and hospitalization. While no prescription strategy, system of monitoring, or “safety net” is likely to eliminate phenytoin mishaps, an informed and active approach to therapeutic management can minimize instances of intoxication.
Action points and safety tips in phenytoin therapy
Safe therapy with phenytoin depends on observing particular courses of action at 4 stages:
- Loading
- Institution of a maintenance regimen
- Adjustment of the regimen
- Monitoring, follow-up, and patient education.
Loading
Loading is indicated when the risk of seizures is so great that adequate serum levels of the drug must be reached rapidly. Such situations would include status epilepticus; repeated new seizures (excluding most withdrawal seizures, for example); breakthrough seizures with a low anticonvulsant level; and a first seizure with a high likelihood of repeating, as with a demonstrated focal brain lesion. Depending on the degree of urgency, loading can be accomplished with intravenous phenytoin (at an infusion rate of no more than 50 mg/min), with intravenous or intramuscular fosphenytoin, or with oral phenytoin.
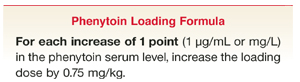
To load initially, or to add a supplemental load to increase an insufficient phenytoin level, the following formula based on a distribution constant for phenytoin indicates the amount of drug needed to raise the level by a specified amount.9
Use the loading formula. The peak serum level of phenytoin after intravenous loading is a function of the drug’s distribution in the body and is independent of the pharmacokinetics of elimination. Subsequent metabolism, which may be affected by other drugs or impairments (eg, liver disease), will affect elimination of the loaded drug but not ordinarily the calculated loading dose. Overloading phenytoin has been documented as a cause of early toxicity.7 According to the formula above, a 60-kg patient with no detectable starting level and an (arbitrary) target serum level of 15 μg/mL should need only 675 mg of phenytoin, and not the 1000 mg often administered.
This loading formula is also applicable to supplementary (“booster”) loading to reach a higher serum level quickly, either because the initial loading dose did not achieve the intended level or because that level was inadequate to control seizures. In this context, simply increasing the existing or planned daily maintenance dose raises the level too slowly. In addition, the increased maintenance dosage may be inappropriate if the cause of the low level is noncompliance. A higher maintenance dose, under conditions of complete or improved compliance, probably will lead to toxicity.
Measure serum levels. A sound preventive approach10 is to measure the peak serum level shortly after loading11,12—one-half hour to 1 hour or more after giving intravenous phenytoin, 2 hours or more after intravenous fosphenytoin, 4 hours or more after intramuscular fosphenytoin, and 16 to 24 hours after accelerated oral loading. While measuring a post-load serum level is not established as a standard of care, the rationale is that a relatively high serum level forewarns of increased risk of early intoxication because of a high starting point for maintenance therapy, and a low level indicates greater vulnerability to seizures (Table 1).
TABLE 1
Preventing phenytoin intoxication at loading (independent of pharmacokinetics of elimination)
| Toxicity risk | Preventive action |
|---|---|
| Complications of intravenous infusion | Avoid excessive infusion rate (maximum, 50 mg/min); monitor blood pressure and ECG; assure good IV placement |
| Overload | Calculate dose by formula, best estimate of prior level |
| Loading formula: to increase the phenytoin serum level by point (1 μg/mL or mg/L), the loading dose should be 0.75 mg/kg. | |
Check post-load level:
|
Initial maintenance dosing
A useful maintenance dose formula yields the dose ordinarily needed to achieve a specified serum level or maintain it after loading:9

For a target maintenance level of 15 μg/mL in a 60-kg adult, the dose would be 5.71 mg/kg/d x 60 kg = 343 mg/d (which can guide selection of a practical, starting dosage regimen, such as 300 or 350 mg/d, or 5–6 mg/kg/d, as is often recommended).13 This formula is more accurate than guessing at 5 mg/kg vs 6 mg/kg; increasingly, such formulas will be incorporated into computerized dosing protocols, thus putting the advised dose only a click or 2 away.
Even calculated dosages should be subject to modification by individual patient factors, including age, reliability, health status (such as liver function), and potential medication interactions. Computerized protocols will help, but the uncertainty of individual responses14 simply means that close symptomatic or serum monitoring must be implemented, while not overreacting to isolated variations (Table 2).15
Important caveat. Phenytoin is typically 90% protein-bound in the serum. Active free phenytoin may be higher than expected if serum albumin is decreased or if bound phenytoin is displaced by other drugs (eg, valproate). Thus, toxicity may be present despite non-elevated total levels of phenytoin, and successive increases in the dosage may cause or exacerbate toxicity. Consider obtaining a free phenytoin level, commonly available by specific requisition, if clinical toxicity is suspected despite total levels that do not suggest toxicity. Consultation or careful review of all potential metabolic interactions helps to ensure proper management in such cases.
Adjusting dosage and the maintenance
level. Here is a practical guide16 for incrementally increasing the phenytoin maintenance regimen (at steady state) for an adult:
- serum level <7 μg/mL, increase daily maintenance dose by 100 mg
- serum level of 7–11 μg/mL, increase by 50 mg
- serum level 12 μg/mL, increase by only 30 mg.
This guide reflects the fundamental principle of phenytoin’s pharmacokinetics: as the serum level approaches, enters, and increases through the therapeutic range, metabolic elimination does not rise proportionately, as it would in the more usual, first-order pharmacokinetics. In zero-order, saturation kinetics, an absolute amount of drug is eliminated per unit of time (as in the case of ethanol). The higher the phenytoin level, the more likely a seemingly reasonable increment in daily dosage, such as 100 mg (as from 300 mg to 400 mg per day) will turn out to be a prescription for toxicity (Table 3).
TABLE 2
Preventing phenytoin intoxication at initial maintenance dosing
| Toxicity risk | Preventive action |
|---|---|
| Excessive dose, causing rising level to toxicity | Dose by maintenance-dose formula, adjusting for individual patient factors (eg, liver function). The best safety net is following closely.Maintenance Dose Formula: dose (mg/kg/d) = (8 x target serum level)/(6 + target level). |
| Incipient side effects going unrecognized | Patient education on early side effects (eg, drowsiness, grogginess, imbalance, vague, dizziness) and need to report promptly; follow-up monitoring by provider for symptoms and serum level. |
TABLE 3
Preventing phenytoin intoxication at dosage adjustment
| Toxicity risk | Preventive action |
|---|---|
| Mistaken change in maintenance dosage, leading to toxicity (eg, dosage is appropriate, but patient has been noncompliant) | Determine whether need for change is urgent; if so, give supplemental load to achieve target, by loading dose formula. |
| Do not increase maintenance dose for acute response but only for sustained response if prior maintenance dosage shown to be inadequate. | |
Maintenance dose adjustment guideline:
| |
| Increasing maintenance dose by too large an increment at one time (eg, 100 mg/d with a level of 14 μg/mL) | Focus on the patient, not the serum level in isolation. Only if clinically indicated, increase the maintenance dose according to guideline based on current serum level. Close follow-up, monitoring, and patient education as above. |
| Unnecessary increase in dose in patient who has long been optimally controlled with a “low” level (eg, 9 μg/mL, therapeutic range 10–20 μg/mL) | Use “therapeutic range” as a general guide, but individualize dose according to each patient’s seizure control, any particular risks (eg, driving, job safety), and any side effects. |
Monitoring for “dose-related” (concentration related) toxicity
After starting or adjusting a phenytoin regi-men, a common practice—but an inadequate one from a preventive point of view—is to order a serum drug level 2 or more weeks hence, to determine the steady-state level. If toxicity is to occur, however, it will happen before a steady state is reached, which is normally expected in 5 to 7 half-lives (or in 5–14 days at a typical phenytoin “half-life” of 24–48 hours).
Phenytoin toxicity may occur earlier than this because of its zero-order, saturation kinetics, which progressively increases the time required for 50% elimination as the level rises. Arrangements should be made to monitor the patient for toxic symptoms and consider a serum level several days (eg, 3–7 days) after dosage adjustment. Even if this level is not excessively elevated, a rise from a post-load level portends heightened risk of toxicity.
Follow-up management: educate patients
Patient safety during therapy depends not only on adhering to rational pharmacologic principles, but also on patient education and active safeguards. A patient’s awareness of toxic symptoms functions as an early-warning system. Inform patients not only about “allergic” side effects, but about incipient, dose-related side effects, including drowsiness and impaired balance, and drug-drug and drug-disease interactions. Follow-up cannot follow a cookbook approach, and slowly developing symptoms, such as drowsiness, may be minimized by the patient.
As they are developed, computer-based protocols can facilitate dosing orders and can prompt patient education, provision of handouts, and appropriate follow-up appointments or other monitoring contacts.
Follow-up intervals depend upon the condition of the patient, including the ability to recognize and report symptoms. Ideally, a weekly phone call or other contact—initiated by the patient, family, other caregivers, or clinician—should be made until the patient appears to be well controlled with an acceptable serum level and without side effects. Subsequently, patient and caregiver attention to monitoring symptoms and potential interactions remains the best, practicable safeguard against clinical toxicity.14
Our 140-bed, urban community teaching hospital logs 30,000 emergency visits each year. We retrospectively documented an average of 5 cases of inadvertent, symptomatic phenytoin intoxication per year in our emergency department over a 4-year period. The range of phenytoin levels was 22.2–59.4 μg/mL (therapeutic range 10–20 μg/mL), and the median was 39 μg/mL.
Of the 15 patients seen in the first 3 years, 12 were admitted to the hospital, generating an average charge of $4119. During the fourth year, we implemented a didactic and case-based program to educate house officers and attending physicians about phenytoin pharmacokinetics, the risks of dose-related toxicity, and ways to prevent it.
Over the subsequent 3 years (without any major change in overall patterns of drug choice), prospective surveillance revealed only 1 to 2 cases of phenytoin intoxication per year, 2 of which occurred in difficult-to-control patients with repeated emergency visits.
Acknowledgments
The authors thank Blaise F.D. Bourgeois, MD, for providing pharmacologic background information.
- Bupropion • Zyban
- Carbamazepine • Atretol, Depitol, Epitol, Tegretol
- Gabapentin • Neurontin
- Lamotrigine • Lamictal
- Nortriptyline • Aventyl, Pamelor
- Oxcarbazepine • Trileptal
- Phenytoin • Dilantin, Phenytek
- Tiagabine • Gabitril
- Topiramate • Topamax
- Valproic acid • Depakene, Depakote
- Vigabatrin • Sabril (available only in Canada)
Corresponding author
Thomas H. Glick, MD, 1493 Cambridge St., Cambridge, MA 02139. E-mail: [email protected]
1. Vanderhoff BT, Delphia M, Pommering TL. Neurology. In: Rakel RE. Textbook of Family Practice. 6th ed. Philadelphia, Pa: WB Saunders; 2002.
2. Middleton DB. Seizure disorders. In: Taylor RB, ed. Family Medicine: Principles and Practice. 6th ed. New York, NY: Springer; 2003.
3. Lowenstein DH. Seizures and epilepsy. In: Braunwald E, Fauci AS,Kasper DL, Hauser SL, Longo DL, Jameson JL. Harrison’s Principles of Internal Medicine. 15th ed. New York, NY: McGraw-Hill; 2001.
4. Polack CV, Pollack ES. Seizures. In: Marx JA, et al. Rosen’s Emergency Medicine. 5th ed. St. Louis, Mo: Mosby; 2002.
5. Cherry DK, Burt CW, Woodwell DA. National Ambulatory Medical Care Survey: 2001 Summary. Advance data from vital and health statistics: no 337. Hyattsville, Md: National Center for Health Statistics; 2003. Available at: www.cdc.gov/nchs/products/pubs/pubd/ad/331-340/331-340.htm. Accessed on February 11, 2004.
6. American Hospital Association. Hospital Statistics (1997, table 110). Chicago, Ill: AHA; 1999.
7. Murphy JM, Motiwala R, Devinsky O. Phenytoin Intoxication. South Medical J 1991;84:1199-1204.
8. McGill LJ, Pushpa N, Hamann G, Hagemann TM. Identification of risk factors associated with phenytoin toxicity. Neurology 1997;48 (suppl):A105.-
9. Bourgeois BFD. Pharmacokinetics and pharmacodynamics of antiepileptic drugs. In: Wyllie E, ed. Treatment of Epilepsy. 3rd ed. Philadelphia, Pa: Lippincott, Williams and Wilkins; 2001.
10. Glauser TA, Pippinger CE. Controversies in blood-level monitoring: Reexamining its role in the treatment of epilepsy. Epilepsia 2000;41(Suppl 8):S6-S15.
12. Cranford RE, Leppik IE, Patrick B, et al. Intravenous phenytoin: Clinical and pharmacokinetic aspects. Neurology 1978;28:874-880.
13. Warner A, Privitera M, Bates D. Standards of laboratory practice: antiepileptic drug monitoring. Clin Chem 1998;44:1085-1095.
14. Birnbaum A, Hardie NA, Leppik IE, et al. Variability of total phenytoin serum concentrations within elderly nursing home residents. Neurology 2003;60:555-559.
15. Lesser RP, Sundaram M. Treat the patient, not the test. Neurology 2003;60:534-535.
16. Brodie MJ, Dichter MA. Antiepileptic drugs. New Engl J Med 1996;334:168-175.
17. Privitera MD. Clinical rules for phenytoin dosing. Ann Pharmacother 1993;27:1169-1173.
- To load phenytoin initially or to add a supplemental load, use this formula: for each μg/mL desired increase in the phenytoin serum level, increase the loading dose by 0.75 mg/kg (C).
- Measure the peak serum level shortly after loading—30 to 60 minutes or more after giving intravenous phenytoin, 2 hours or more after intravenous fosphenytoin, 4 hours or more after intramuscular fosphenytoin, and 16–24 hours after accelerated oral loading (C).
- The daily maintenance dose (mg/kg/d) ordinarily needed to achieve a specified serum level or maintain it after loading is calculated thus: (8 x target serum level)/(6 + target serum level) (C).
- Safe practice for initiating or adjusting a maintenance dosage should include patient education and close follow-up (C).
Despite the introduction of new anticonvulsant drugs, phenytoin is still a first-line medication for common types of epileptic seizures, particularly those caused by focal brain lesions.1-4 Available in parenteral and oral form, phenytoin (or its pro-drug, fosphenytoin) is widely used. An estimated 873,000 prescriptions for phenytoin were issued during office visits in 2001.5
Phenytoin carries a special risk of dose-related toxicity, due to its saturation (zero-order) pharmacokinetics: serum levels often rise much more than would ordinarily be expected after initiating or increasing a maintenance dose. This predicts a vulnerability to toxicity, but does not predict exactly when this will occur in the individual.
The risk of toxicity can be minimized, however, by applying practical dosing and monitoring strategies based on the understanding of phenytoin pharmacokinetics, and by educating patients appropriately.
Patients at risk: the scope of the problem
Extrapolating from the more than 5000 hospitals in the US6 to our experience in an urban community hospital, we estimate there may be as many as 25,000 cases of phenytoin intoxication presenting annually to emergency departments or resulting in hospitalization in the United States. In 1 study, a tertiary hospital recorded phenytoin intoxication from all causes at a rate of 1 inpatient admission per month over a 10-year period.7 Another study at a major hospital found 143 instances of phenytoin levels >25 μg/mL in 1 year; 86% of 120 studied cases were toxic, representing 33% of all adverse drug reactions reported.8 Thus, evidence points to a substantial problem with patient safety nationwide.
Adverse drug events like phenytoin intoxication increase morbidity, causing such injuries as falls due to ataxia and resulting in expenses of office or emergency department visits and hospitalization. While no prescription strategy, system of monitoring, or “safety net” is likely to eliminate phenytoin mishaps, an informed and active approach to therapeutic management can minimize instances of intoxication.
Action points and safety tips in phenytoin therapy
Safe therapy with phenytoin depends on observing particular courses of action at 4 stages:
- Loading
- Institution of a maintenance regimen
- Adjustment of the regimen
- Monitoring, follow-up, and patient education.
Loading
Loading is indicated when the risk of seizures is so great that adequate serum levels of the drug must be reached rapidly. Such situations would include status epilepticus; repeated new seizures (excluding most withdrawal seizures, for example); breakthrough seizures with a low anticonvulsant level; and a first seizure with a high likelihood of repeating, as with a demonstrated focal brain lesion. Depending on the degree of urgency, loading can be accomplished with intravenous phenytoin (at an infusion rate of no more than 50 mg/min), with intravenous or intramuscular fosphenytoin, or with oral phenytoin.
To load initially, or to add a supplemental load to increase an insufficient phenytoin level, the following formula based on a distribution constant for phenytoin indicates the amount of drug needed to raise the level by a specified amount.9
Use the loading formula. The peak serum level of phenytoin after intravenous loading is a function of the drug’s distribution in the body and is independent of the pharmacokinetics of elimination. Subsequent metabolism, which may be affected by other drugs or impairments (eg, liver disease), will affect elimination of the loaded drug but not ordinarily the calculated loading dose. Overloading phenytoin has been documented as a cause of early toxicity.7 According to the formula above, a 60-kg patient with no detectable starting level and an (arbitrary) target serum level of 15 μg/mL should need only 675 mg of phenytoin, and not the 1000 mg often administered.
This loading formula is also applicable to supplementary (“booster”) loading to reach a higher serum level quickly, either because the initial loading dose did not achieve the intended level or because that level was inadequate to control seizures. In this context, simply increasing the existing or planned daily maintenance dose raises the level too slowly. In addition, the increased maintenance dosage may be inappropriate if the cause of the low level is noncompliance. A higher maintenance dose, under conditions of complete or improved compliance, probably will lead to toxicity.
Measure serum levels. A sound preventive approach10 is to measure the peak serum level shortly after loading11,12—one-half hour to 1 hour or more after giving intravenous phenytoin, 2 hours or more after intravenous fosphenytoin, 4 hours or more after intramuscular fosphenytoin, and 16 to 24 hours after accelerated oral loading. While measuring a post-load serum level is not established as a standard of care, the rationale is that a relatively high serum level forewarns of increased risk of early intoxication because of a high starting point for maintenance therapy, and a low level indicates greater vulnerability to seizures (Table 1).
TABLE 1
Preventing phenytoin intoxication at loading (independent of pharmacokinetics of elimination)
| Toxicity risk | Preventive action |
|---|---|
| Complications of intravenous infusion | Avoid excessive infusion rate (maximum, 50 mg/min); monitor blood pressure and ECG; assure good IV placement |
| Overload | Calculate dose by formula, best estimate of prior level |
| Loading formula: to increase the phenytoin serum level by point (1 μg/mL or mg/L), the loading dose should be 0.75 mg/kg. | |
Check post-load level:
|
Initial maintenance dosing
A useful maintenance dose formula yields the dose ordinarily needed to achieve a specified serum level or maintain it after loading:9
For a target maintenance level of 15 μg/mL in a 60-kg adult, the dose would be 5.71 mg/kg/d x 60 kg = 343 mg/d (which can guide selection of a practical, starting dosage regimen, such as 300 or 350 mg/d, or 5–6 mg/kg/d, as is often recommended).13 This formula is more accurate than guessing at 5 mg/kg vs 6 mg/kg; increasingly, such formulas will be incorporated into computerized dosing protocols, thus putting the advised dose only a click or 2 away.
Even calculated dosages should be subject to modification by individual patient factors, including age, reliability, health status (such as liver function), and potential medication interactions. Computerized protocols will help, but the uncertainty of individual responses14 simply means that close symptomatic or serum monitoring must be implemented, while not overreacting to isolated variations (Table 2).15
Important caveat. Phenytoin is typically 90% protein-bound in the serum. Active free phenytoin may be higher than expected if serum albumin is decreased or if bound phenytoin is displaced by other drugs (eg, valproate). Thus, toxicity may be present despite non-elevated total levels of phenytoin, and successive increases in the dosage may cause or exacerbate toxicity. Consider obtaining a free phenytoin level, commonly available by specific requisition, if clinical toxicity is suspected despite total levels that do not suggest toxicity. Consultation or careful review of all potential metabolic interactions helps to ensure proper management in such cases.
Adjusting dosage and the maintenance
level. Here is a practical guide16 for incrementally increasing the phenytoin maintenance regimen (at steady state) for an adult:
- serum level <7 μg/mL, increase daily maintenance dose by 100 mg
- serum level of 7–11 μg/mL, increase by 50 mg
- serum level 12 μg/mL, increase by only 30 mg.
This guide reflects the fundamental principle of phenytoin’s pharmacokinetics: as the serum level approaches, enters, and increases through the therapeutic range, metabolic elimination does not rise proportionately, as it would in the more usual, first-order pharmacokinetics. In zero-order, saturation kinetics, an absolute amount of drug is eliminated per unit of time (as in the case of ethanol). The higher the phenytoin level, the more likely a seemingly reasonable increment in daily dosage, such as 100 mg (as from 300 mg to 400 mg per day) will turn out to be a prescription for toxicity (Table 3).
TABLE 2
Preventing phenytoin intoxication at initial maintenance dosing
| Toxicity risk | Preventive action |
|---|---|
| Excessive dose, causing rising level to toxicity | Dose by maintenance-dose formula, adjusting for individual patient factors (eg, liver function). The best safety net is following closely.Maintenance Dose Formula: dose (mg/kg/d) = (8 x target serum level)/(6 + target level). |
| Incipient side effects going unrecognized | Patient education on early side effects (eg, drowsiness, grogginess, imbalance, vague, dizziness) and need to report promptly; follow-up monitoring by provider for symptoms and serum level. |
TABLE 3
Preventing phenytoin intoxication at dosage adjustment
| Toxicity risk | Preventive action |
|---|---|
| Mistaken change in maintenance dosage, leading to toxicity (eg, dosage is appropriate, but patient has been noncompliant) | Determine whether need for change is urgent; if so, give supplemental load to achieve target, by loading dose formula. |
| Do not increase maintenance dose for acute response but only for sustained response if prior maintenance dosage shown to be inadequate. | |
Maintenance dose adjustment guideline:
| |
| Increasing maintenance dose by too large an increment at one time (eg, 100 mg/d with a level of 14 μg/mL) | Focus on the patient, not the serum level in isolation. Only if clinically indicated, increase the maintenance dose according to guideline based on current serum level. Close follow-up, monitoring, and patient education as above. |
| Unnecessary increase in dose in patient who has long been optimally controlled with a “low” level (eg, 9 μg/mL, therapeutic range 10–20 μg/mL) | Use “therapeutic range” as a general guide, but individualize dose according to each patient’s seizure control, any particular risks (eg, driving, job safety), and any side effects. |
Monitoring for “dose-related” (concentration related) toxicity
After starting or adjusting a phenytoin regi-men, a common practice—but an inadequate one from a preventive point of view—is to order a serum drug level 2 or more weeks hence, to determine the steady-state level. If toxicity is to occur, however, it will happen before a steady state is reached, which is normally expected in 5 to 7 half-lives (or in 5–14 days at a typical phenytoin “half-life” of 24–48 hours).
Phenytoin toxicity may occur earlier than this because of its zero-order, saturation kinetics, which progressively increases the time required for 50% elimination as the level rises. Arrangements should be made to monitor the patient for toxic symptoms and consider a serum level several days (eg, 3–7 days) after dosage adjustment. Even if this level is not excessively elevated, a rise from a post-load level portends heightened risk of toxicity.
Follow-up management: educate patients
Patient safety during therapy depends not only on adhering to rational pharmacologic principles, but also on patient education and active safeguards. A patient’s awareness of toxic symptoms functions as an early-warning system. Inform patients not only about “allergic” side effects, but about incipient, dose-related side effects, including drowsiness and impaired balance, and drug-drug and drug-disease interactions. Follow-up cannot follow a cookbook approach, and slowly developing symptoms, such as drowsiness, may be minimized by the patient.
As they are developed, computer-based protocols can facilitate dosing orders and can prompt patient education, provision of handouts, and appropriate follow-up appointments or other monitoring contacts.
Follow-up intervals depend upon the condition of the patient, including the ability to recognize and report symptoms. Ideally, a weekly phone call or other contact—initiated by the patient, family, other caregivers, or clinician—should be made until the patient appears to be well controlled with an acceptable serum level and without side effects. Subsequently, patient and caregiver attention to monitoring symptoms and potential interactions remains the best, practicable safeguard against clinical toxicity.14
Our 140-bed, urban community teaching hospital logs 30,000 emergency visits each year. We retrospectively documented an average of 5 cases of inadvertent, symptomatic phenytoin intoxication per year in our emergency department over a 4-year period. The range of phenytoin levels was 22.2–59.4 μg/mL (therapeutic range 10–20 μg/mL), and the median was 39 μg/mL.
Of the 15 patients seen in the first 3 years, 12 were admitted to the hospital, generating an average charge of $4119. During the fourth year, we implemented a didactic and case-based program to educate house officers and attending physicians about phenytoin pharmacokinetics, the risks of dose-related toxicity, and ways to prevent it.
Over the subsequent 3 years (without any major change in overall patterns of drug choice), prospective surveillance revealed only 1 to 2 cases of phenytoin intoxication per year, 2 of which occurred in difficult-to-control patients with repeated emergency visits.
Acknowledgments
The authors thank Blaise F.D. Bourgeois, MD, for providing pharmacologic background information.
- Bupropion • Zyban
- Carbamazepine • Atretol, Depitol, Epitol, Tegretol
- Gabapentin • Neurontin
- Lamotrigine • Lamictal
- Nortriptyline • Aventyl, Pamelor
- Oxcarbazepine • Trileptal
- Phenytoin • Dilantin, Phenytek
- Tiagabine • Gabitril
- Topiramate • Topamax
- Valproic acid • Depakene, Depakote
- Vigabatrin • Sabril (available only in Canada)
Corresponding author
Thomas H. Glick, MD, 1493 Cambridge St., Cambridge, MA 02139. E-mail: [email protected]
1. Vanderhoff BT, Delphia M, Pommering TL. Neurology. In: Rakel RE. Textbook of Family Practice. 6th ed. Philadelphia, Pa: WB Saunders; 2002.
2. Middleton DB. Seizure disorders. In: Taylor RB, ed. Family Medicine: Principles and Practice. 6th ed. New York, NY: Springer; 2003.
3. Lowenstein DH. Seizures and epilepsy. In: Braunwald E, Fauci AS,Kasper DL, Hauser SL, Longo DL, Jameson JL. Harrison’s Principles of Internal Medicine. 15th ed. New York, NY: McGraw-Hill; 2001.
4. Polack CV, Pollack ES. Seizures. In: Marx JA, et al. Rosen’s Emergency Medicine. 5th ed. St. Louis, Mo: Mosby; 2002.
5. Cherry DK, Burt CW, Woodwell DA. National Ambulatory Medical Care Survey: 2001 Summary. Advance data from vital and health statistics: no 337. Hyattsville, Md: National Center for Health Statistics; 2003. Available at: www.cdc.gov/nchs/products/pubs/pubd/ad/331-340/331-340.htm. Accessed on February 11, 2004.
6. American Hospital Association. Hospital Statistics (1997, table 110). Chicago, Ill: AHA; 1999.
7. Murphy JM, Motiwala R, Devinsky O. Phenytoin Intoxication. South Medical J 1991;84:1199-1204.
8. McGill LJ, Pushpa N, Hamann G, Hagemann TM. Identification of risk factors associated with phenytoin toxicity. Neurology 1997;48 (suppl):A105.-
9. Bourgeois BFD. Pharmacokinetics and pharmacodynamics of antiepileptic drugs. In: Wyllie E, ed. Treatment of Epilepsy. 3rd ed. Philadelphia, Pa: Lippincott, Williams and Wilkins; 2001.
10. Glauser TA, Pippinger CE. Controversies in blood-level monitoring: Reexamining its role in the treatment of epilepsy. Epilepsia 2000;41(Suppl 8):S6-S15.
12. Cranford RE, Leppik IE, Patrick B, et al. Intravenous phenytoin: Clinical and pharmacokinetic aspects. Neurology 1978;28:874-880.
13. Warner A, Privitera M, Bates D. Standards of laboratory practice: antiepileptic drug monitoring. Clin Chem 1998;44:1085-1095.
14. Birnbaum A, Hardie NA, Leppik IE, et al. Variability of total phenytoin serum concentrations within elderly nursing home residents. Neurology 2003;60:555-559.
15. Lesser RP, Sundaram M. Treat the patient, not the test. Neurology 2003;60:534-535.
16. Brodie MJ, Dichter MA. Antiepileptic drugs. New Engl J Med 1996;334:168-175.
17. Privitera MD. Clinical rules for phenytoin dosing. Ann Pharmacother 1993;27:1169-1173.
Relative risks and odds ratios: What’s the difference?
Some studies use relative risks (RRs) to describe results; others use odds ratios (ORs). Both are calculated from simple 2x2 tables. The question of which statistic to use is subtle but very important.
Relative risk
Probability is the likelihood of an event in relation to all possible events. If a horse wins 2 out of every 5 races, its probability of winning is 2/5 (40%).
Relative risk is a ratio of probabilities. It compares the incidence or risk of an event among those with a specific exposure with those who were not exposed (eg, myocardial infarctions in those who smoke cigarettes compared with those who do not) (Figure). RR is based upon the incidence of an event given that we already know the study partic-ipants’ exposure status. It is only appropriate, therefore, to use RR for prospective cohort studies.
FIGURE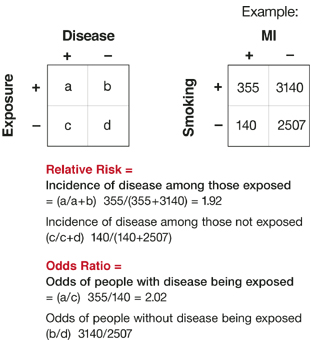
Source for MI data: Njolstad I, et al. Smoking, serum lipids, blood pressure, and sex differences in myocardial infarction. Circulation 1996; 93:450-456.
Odds ratio
Odds compare events with nonevents. If a horse wins 2 out of every 5 races, its odds of winning are 2 to 3 (expressed as 2:3). An odds ratio is a ratio of ratios. It compares the presence to absence of an exposure given that we already know about a specific outcome (eg, presence-to-absence ratio of cigarette smoking in those who had an MI compared with the same ratio in those who did not have an MI) (Figure). OR can be used to describe the results of case control as well as prospective cohort studies.
Comparing the two
OR and RR are usually comparable in magnitude when the disease studied is rare (eg, most cancers). However, an OR can overestimate and magnify risk, especially when the disease is more common (eg, hypertension) and should be avoided in such cases if RR can be used.
Correspondence
Allen Last MD, 3518 Fifth Avenue, Pittsburgh, PA 15261. E-mail: [email protected].
An ounce of prevention: The evidence supporting periconception health care
- Offer smoking cessation interventions to all women of childbearing age who smoke. (A)
- Offer folic acid supplementation to all pregnant women as well as women of childbearing age. (A)
- Offer women with diabetes intensive glycemic control before pregnancy. (B)
- Offer women who take antiepileptic medications folic acid supplementation and a transition to monotherapy, while avoiding phenytoin and valproic acid if possible. (B)
- Screen pregnant women and women of childbearing age to further reduce the incidence of congenital rubella syndrome. (C)
- Alcohol cessation advice has not consistently been shown to decrease alcohol intake or morbidity in women. Written information on the fetal effects of alcohol should be provided to women who use alcohol during pregnancy. (B)
This article reviews 6 important, evidence-based recommendations for periconception care: smoking cessation, folic acid supplementation and multivitamin use, diabetes care, epilepsy drug use, rubella immunization, and alcohol abuse. With time so limited during primary care visits, physicians often miss opportunities to provide periconception health care. However, some of the recommendations do not take long to convey. And though others may require significant effort on the part of the physician and patient, the benefits can be substantial.
In 2000, women aged 18 to 44 years made 4.1 million outpatient visits to family physicians.1 Each of these visits was an opportunity to educate a patient about periconception health. Opportune encounters include well-woman exams, discussions about a negative pregnancy test, and follow-up visits for spontaneous or therapeutic abortions. Sexually active women using less-than-effective birth control (or none at all) would also benefit from preconception counseling. For women of childbearing age who have diabetes or epilepsy, make preconception interventions part of their routine medical care.
Smoking cessation
Twenty-five percent of women of reproductive age in the US are cigarette smokers—higher than the percentage of smokers among all women.2 Up to 90% continue to smoke during pregnancy.3 The 2001 Surgeon General’s Report on Women and Smoking reports that cigarette smoking causes the highest proportion of preventable problems related to pregnancy and the neonatal period. The report estimates that smoking cessation would reduce all infant deaths by 10%.
How smoking adversely affects pregnancy
One meta-analysis found that women who smoke during pregnancy have significantly increased risks of placenta previa, placental abruption, ectopic pregnancy, and preterm premature rupture of membranes (level of evidence [LOE]: 2a).4 Maternal cigarette smoking also increases the risk of stillbirth, intrauterine growth retardation, and sudden infant death syndrome (SIDS). Smoking cessation during pregnancy, especially early on, reduced the risk of most of these conditions.5
Interventions that work
The best evidence for the effectiveness of smoking cessation interventions is found in studies of nonpregnant patients. Such evidence would likely be applicable to women seeking preconception care.
Multiple Cochrane Database reviews have addressed smoking cessation in nonpregnant patients. The reviews are meta-analyses of randomized, controlled trials (LOE: 1a) and provide strong evidence for the value of smoking cessation interventions in the general population. Interventions that increase quit rates include the following: brief physician advice,6 telephone counseling,7 nicotine replacement therapy (primarily gum and patches were studied),8 group therapy,9 and bupropion or nortriptyline10 (Table).
A Cochrane Database review of smoking cessation in pregnancy found that 6.4% fewer women smoked during the third trimester of pregnancy after intervention (LOE: 1a).11 Studies that looked at neonatal outcomes showed a reduction in low birth weight and preterm birth (number needed to treat [NNT]=75 for low birthweight; NNT=90 for preterm birth). There were no differences in other outcomes; however, the trials were not powered to detect such differences. Interventions found to be effective included informing women about the effects of smoking on a fetus and the benefits of quitting, recommending to smokers that they quit, and teaching cognitive-behavioral strategies for smoking cessation.
Our data were found through a search of the following databases: Medline, Cochrane Database of Systematic Reviews, Database of Abstracts of Reviews of Effects, Cochrane Central Register of Controlled Trials, and the American College of Physicians Journal Club. We selected the areas with the strongest evidence available for reduction of congenital anomalies available for review. We also focused on subjects whose interventions proved to be effective in improving neonatal outcomes.
TABLE
Effective smoking cessation interventions
| Intervention | Number of studies | Number of participants | OR* (95% CI) | NNT |
|---|---|---|---|---|
| Brief physician advice | 16 | 13,575 | 1.69 (1.45–1.98) | 58 |
| Telephone counseling | 13 | 16,462 | 1.56 (1.38–1.77) | 40 |
| Nicotine replacement therapy | 97 | 37,760 | 1.74 (1.64–1.86) | 16 |
| Group therapy vs self-help | 16 | 4395 | 1.97 (1.57–2.48) | 22 |
| Group therapy vs no treatment | 6 | 775 | 2.19 (1.42–3.37) | 10 |
| Bupropion | 16 | 5374 | 1.97 (1.67–2.34) | 11 |
| Nortriptyline | 5 | 861 | 2.80 (1.81–4.32) | 9 |
| Smoking cessation interventions in pregnancy | 34 | 9945 | 1.89 (1.67–2.13) | 16 |
| *Odds ratio for successful smoking cessation. For an explanation of odds ratios, see the Language of Evidence, page 108. | ||||
| OR, odds ratio; CI, confidence interval; NNT, number needed to treat | ||||
Applying the evidence
Because of the proven reduction in neonatal morbidity, smoking cessation counseling may be the most effective part of periconception care. Advise smoking cessation to all women who smoke, before and during pregnancy (strength of recommendation [SOR]: A).
Folic acid and multivitamins
Neural tube defects occur in 1 in 1000 babies delivered in the US. The Medical Research Council Vitamin Study found that mothers who had a child with neural tube defects reduced the risk of having another child with neural tube defects by 72% if they took 4 mg of folic acid a day prior to conception and during the first trimester.12
A large primary prevention trial in Hungary showed the risk of anomalies (including neural tube defects) in babies decreased by 46% among mothers randomized to receive folic acid.13 A Cochrane meta-analysis demonstrated a 3-fold decreased risk of a first neural tube defect if women took folic acid. The absolute risk of neural tube defects decreased from 10.2/1000 in the control group to 2.4/1000 in the folic acid group. The NNT to prevent 1 neural tube defect was 847.14
Studies have shown that periconception multivitamin intake confers other benefits as well: decreased risk of genitourinary malformations, cleft lip and cleft palate, and neuroectodermal tumors in offspring. In all studies, the multivitamins contained folic acid, but most studies were unable to look at folic acid independently.15-18
Optimal dose of folic acid
Studies have attempted to determine the most beneficial dose of folic acid and how it should be consumed (ie, diet, supplementation, fortification). Study results, however, are conflicting.19,20
In 1992, the US Preventive Services Task Force (USPSTF) recommended women of childbearing age consume 0.4 mg/d folic acid,21 but it did not make a recommendation on the form of folic acid.
Patient education that works
Women in the US are not fully aware of the benefits of taking multivitamins with folic acid prior to conception and during pregnancy. A 2002 survey showed that only 20% of women knew that folic acid could prevent certain birth defects. Even fewer women knew they have to take folic acid prior to conception (7% in the survey).22
Though many studies have shown that education increases awareness about folic acid, only a few have investigated if awareness leads to changes in behavior.23 In highly motivated women, education does appear to influence behavior changes. A study in Texas showed that women who had children with neural tube defects and had received advice about taking folic acid prior to subsequent pregnancies were more likely to use supplements than women who did not receive this advice.24 Another study looked at women planning a pregnancy who had preconception counseling. Counseling about folic acid increased folic acid intake.25
The USPSTF expected a 70% decrease in incidence of neural tube defects if its 1992 recommendation was followed. In 1998, the Food and Drug Administration began requiring the fortification of cereal grains at the level of 140 μg/100 g grain. This was expected to increase the intake of folate in women by 100 μg/d and decrease the incidence of neural tube defects by 20%.26
Data from the Centers for Disease Control and Prevention (CDC) has shown that folate status had improved significantly in women of childbearing age,27 and the incidence of neuroblastoma has decreased by 19%, from 37.8/100,000 prior to supplementation to 30.5/100,000 since fortification became mandatory.28
Applying the evidence
Increased folic acid intake significantly decreases neural tube defects. Education about folic acid increases vitamin use in motivated women (SOR: A). Folic acid supplementation of food is an effective population-based intervention to reduce neural tube defects (SOR: B). Folic acid intake by women decreases genitourinary and cleft-lip malformations and neuroblastoma in their infants (SOR: B).
Diabetes mellitus
Estimates of pregestational diabetes in women of childbearing age range from 1.9% to 3.5%.29,30 Diabetes has been associated with decreased fertility, spontaneous abortions, and congenital anomalies. Several studies have correlated spontaneous abortion rates with hemoglobin A1c values at the time of conception (LOE: 2a).31
Glycemic control reduces spontaneous abortions
One prospective trial32 compared the spontaneous abortion rate in diabetic women who receive intensive preconception insulin therapy with the rate in women who receive usual care (LOE: 2b). A spontaneous abortion rate of 8.4% occurred in the preconception treatment group compared with 28% in the pregnancy care–only group (NNT=5). Limitations of this study include the small number of participants and the lack of randomization. However, given all the benefits of improved glycemic control, preconception glycemic control is recommended to reduce the spontaneous abortion rate in diabetic women (SOR: B).
Other benefits of glycemic control
Major congenital malformations occur in 4% to 11% of infants of diabetic mothers compared with a background rate of 1.2% to 2.1%. Higher values of hemoglobin A1c in the first trimester have been associated with these increased rates of congenital anomalies. However, it is not clear if the association is linear or if a threshold level of hemoglobin A1c exists, above which the anomaly rate increases. Anomalies most commonly occur in the cardiovascular, skeletal, and central nervous systems before 8 weeks gestational age. Therefore, the critical time for preventing congenital anomalies is before conception.
Preconception care reduces anomalies overall
One meta-analysis of 16 studies provides evidence for the value of preconception care in reducing congenital anomalies due to diabetes mellitus.33 The interventions included both inpatient and out-patient optimization of glucose control. The analysis reviews 8 prospective and 8 retrospective cohort studies with a total of 2651 offspring. The results of all 16 studies were consistent.
Hemoglobin A1c values were significantly lower in the preconception care group. The overall rate for major congenital anomalies was 2.1% in the preconception group compared with 6.5% in the pregnancy care group (NNT=23) (LOE: 2a). The studies with the lowest anomaly rates had a pre-meal glucose target of <120 mg/dL, and participants injected insulin 4 times daily. A cost-benefit analysis based on a mathematical model of preconception diabetic care calculated that intensive preconception care for women with diabetes would save an average of $1720 per enrollee when adverse maternal and neonatal outcomes are taken into account.34
Intensive preconception glycemic control helps prevent major congenital anomalies in children born to women with diabetes (SOR: B).
Epilepsy
Compared with healthy women, women with epilepsy have higher rates of infertility and miscarriage and higher rates of infants with congenital anomalies (4%–8%; mainly neural tube defects and heart defects).35 Therefore, women with epilepsy (5.6/1000 among women aged 15 to 6436) should receive special attention to preconception care. Adding to the urgency for counseling is the fact that medications for epilepsy can reduce the effectiveness of some forms of hormonal contraception.
Medications are the problem
A source of debate has been whether the increased rate of anomalies is due to epilepsy or the medications used to treat it. A cohort study compared 3 groups of pregnant women: those taking antiepileptic medications (some were taking these medications for other conditions, such as bipolar disorder), women with epilepsy who were not on medications, and a control group. The rate of major and minor malformations among infants of women taking antiepileptic medications was 20.6%, compared with 8.5% in the control group (LOE: 2b).37 Women with epilepsy who were not on medications had a similar anomaly rate to the control group.
The medications primarily associated with congenital anomalies were valproic acid, carbamazepine, and phenytoin; polytherapy was associated with a higher anomaly rate. The data on newer antiepileptic medications (eg, gabapentin, lamotrigine, oxcarbazepine, tiagabine, topiramate, and vigabatrin) are insufficient to determine if anomaly rates are increased among fetuses exposed to them.38 Because folic acid supplementation has been associated with lower rates of infants with neural tube defects, higher-dose folic acid supplementation (1–4 mg/d) has been recommended for women with epilepsy (LOE: 5).
Change treatment before conception
One cohort study has examined the effectiveness of preconception counseling for women with epilepsy.39 The investigators compared women referred to a preconception epilepsy clinic with women who presented during pregnancy. In the preconception group, all women were placed on folic acid, two thirds were shifted to monotherapy prior to conception, and 6% were able to stop their epilepsy medications. The epilepsy clinic followed a protocol for confirming the diagnosis of epilepsy, determining if a woman was a candidate to discontinue medications, avoiding use of phenytoin and valproic acid, and switching as many women to monotherapy as possible.
The preconception care group had no major fetal malformations, compared with 18% in the pregnancy group (NNT=6) (LOE: 2b).
Applying the evidence
On the basis of this study, women with epilepsy who are considering pregnancy should be switched to monotherapy and potentially less teratogenic medications (when possible), and should receive at least 1 mg/d folic acid prior to conception (SOR: B).
Rubella
Immunization has reduced the occurrence of rubella in the US from 57,686 cases in 1969 (when vaccination was started) to 279 cases in 1999.40 Cases of congenital rubella syndrome in the US have fallen to a low of 3 cases in 2001. However, rubella and congenital rubella syndrome are still fairly common in developing countries, many of which have no rubella vaccine program or have only recently started such programs.
In the US, rubella infection is most likely to occur among Hispanic patients (especially foreign-born patients) and among families that refuse immunization.41 A review of 12 cases of congenital rubella after an outbreak in the early 1990s found that more than 50% of the mothers had 2 or more medical visits where rubella testing/immunization could have been done. Similarly, another study found that 62% of women who gave birth to infants with congenital rubella syndrome had at least 1 missed opportunity for immunization prior to that pregnancy.42
Although no prospective studies confirm this observation, the authors calculated that the single most effective policy for prevention of congenital rubella syndrome would be screening pregnant women for rubella immunity and postpartum immunization of nonimmune women (SOR: C).
Alcohol
The Institute of Medicine recognizes alcohol-related birth defects (ARBD) and alcohol-related neurodevelopmental disorder (ARND) in addition to fetal alcohol syndrome (FAS) as potential effects of alcohol use in pregnancy and the periconception period.43
A diagnosis of FAS requires characteristic facial anomalies, growth retardation, and neurodevelopmental abnormalities. A category of partial FAS does exist; affected children have some of the characteristic facial anomalies, and either growth retardation, neurodevelopmental abnormalities, or cognitive/behavioral abnormalities with no other explanation.
ARBD includes a confirmed history of maternal alcohol use plus one or more congenital defects (most commonly cardiac, renal, vision, hearing, or skeletal. ARND requires a confirmed history of maternal alcohol use and either the neurodevelopmental abnormalities or cognitive/behavioral abnormalities found in partial FAS.
The prevalence of FAS in the US population is estimated at 0.5 to 2 per 1000 births, with up to 10/1000 newborns having some effect from alcohol exposure.44 The rate of FAS is more than 20 times higher in the US compared with other countries, including European countries, partially due to differences in diagnosis.45
Strict abstinence required?
Whether a safe threshold of alcohol consumption exists before or during pregnancy is a point of controversy. Many US authorities recommend against any alcohol intake before or during pregnancy. The effects of alcohol on a fetus depend on the amount of alcohol consumed at one time, timing of alcohol consumption in gestation, and duration of alcohol use in pregnancy.
This is complicated by the fact that studies have used varying definitions of light and heavy alcohol use, with categories that often overlap between different studies.46 Binge drinking (defined as more than 5 drinks on a single day), even when episodic, is more dangerous to fetal brain development than nonbinge drinking.47
Less severe problems can occur
Although a high level of alcohol use in pregnancy is associated with more severely affected offspring, a 1984 study of 31,000 pregnancies showed a higher risk of growth retardation if a mother had even 1 drink a day (LOE: 2b).48 A 2001 study of more than 600 urban African American children showed continued behavioral effects of alcohol at ages 6 to 7 with low levels (1 drink daily) of maternal alcohol consumption (LOE: 2b).49
Some intervention attempts show promise
A review of trials in which physicians briefly counseled nonpregnant women who were problem drinkers found no consistent decrease in drinking.50 Trials of personalized advice to pregnant women have also found it to be no more effective than written information alone.51 A written self-help manual, however, did improve cessation rates among women at a prenatal clinic.52
The CDC sponsored a pilot project to encourage alcohol cessation and effective contraception in women at risk for alcohol-exposed pregnancy.53 Although not a controlled trial, this more extensive intervention showed promise. Of the 143 women enrolled, 68.5% had either stopped their alcohol consumption or were using effective contraception by the 6-month follow up.
Applying the evidence
Written information about the risks of alcohol use in pregnancy should be provided to pregnant women who consume alcohol (SOR: B). There is not enough data to recommend physician counseling for alcohol cessation before or during pregnancy. More comprehensive interventions may be more effective, but have yet to be fully studied. No studies have evaluated neonatal outcomes in the offspring of women who are counseled on alcohol cessation in the periconception period.
Acknowledgments
The authors would like to thank Robert Taylor, MD and Scott Fields, MD for their assistance in reviewing this manuscript. The authors have no conflicts of interest to report.
- Bupropion • Zyban
- Carbamazepine • Atretol, Depitol, Epitol, Tegretol
- Gabapentin • Neurontin
- Lamotrigine • Lamictal
- Nortriptyline • Aventyl, Pamelor
- Oxcarbazepine • Trileptal
- Phenytoin • Cerebyx, Dilantin, Mesantoin, Peganone, Phenytek
- Tiagabine • Gabitril
- Topiramate • Topamax
- Valproic acid • Depakene, Depakote
- Vigabatrin • Sabril (available only in Canada)
Corresponding author
Heather Paladine, MD, Oregon Health and Science University, 3181 SW Sam Jackson Park Road, Mail Code FM, Portland OR 97239-3098. E-mail: [email protected].
1. US Department of Health and Human Services, Public Health Service, Centers for Disease Control and Prevention, National Center for Health Statistics, 2000. Unpublished data. Available at: www.aafp.org/x782.xml. Accessed on January 4, 2004.
2. Centers for Disease Control and Prevention (CDC). National Health Interview Survey (NHIS). Atlanta, Ga: Department of Health and Human Services, Centers for Disease Control and Prevention, 1999. Available at: www.cdc.gov/nchs/nhis.htm. Accessed on January 4, 2004.
3. US Department of Health and Human Services. Women and Smoking: A Report of the Surgeon General. Atlanta, Ga: Department of Health and Human Services, Centers for Disease Control and Prevention, National Center for Chronic Disease Prevention and Health Promotion, Office on Smoking and Health, 2001. Available at: www.cdc.gov/tobacco/sgr/sgr_forwomen/index.htm. Accessed on January 4, 2004.
4. Castles A, Adams K, Melvin CI, Kelsch C, Boulton ML. Effects of smoking during pregnancy. Five meta-analyses. Am J Prev Med 1999;16:208-215.
5. Andres RL, Day MC. Perinatal complications associated with maternal tobacco use. Semin Neonatol 2000;5:231-241.
6. Silagy C, Stead LF. Physician advice for smoking cessation. Cochrane Tobacco Addiction Group. Cochrane Database Syst Rev 2003; Issue 1.
7. Stead LF, Lancaster T, Perera R. Telephone counselling for smoking cessation. Cochrane Tobacco Addiction Group. Cochrane Database Syst Rev 2003; Issue 1.
8. Silagy C, Lancaster T, Stead L, Mant D, Fowler G. Nicotine replacement therapy for smoking cessation. Cochrane Tobacco Addiction Group. Cochrane Database Syst Rev 2003; Issue 1.
9. Stead LF, Lancaster T. Group behaviour therapy programmes for smoking cessation. Cochrane Tobacco Addiction Group. Cochrane Database Syst Rev 2003; Issue 1.
10. Hughes JR, Stead LF, Lancaster T. Antidepressants for smoking cessation. Cochrane Tobacco Addiction Group. Cochrane Database Syst Rev 2003; Issue 1.
11. Lumley J, Oliver S, Waters E. Interventions for promoting smoking cessation during pregnancy. Cochrane Pregnancy and Childbirth Group. Cochrane Database Syst Rev 2003; Issue 1.
12. Prevention of neural tube defects: results of the Medical Research Council Vitamin Study. MRC Vitamin Study Research Group. Lancet 1991;338:131-137.
13. Czeizel AE, Dudas I, Metneki J. Prevention of the first occurrence of neural-tube defects by periconceptional vitamin supplementation. N Engl J Med 1992;327:1832-1835.
14. Lumley J, Watson L, Watson M, Bower C. Periconceptional supplementation with folate and/or multivitamins for preventing neural tube defects. Cochrane Pregnancy and Childbirth Group. Cochrane Database Syst Rev 2002; Issue 3.
15. Li D, Daling JR, Mueller BA, Hickok DE, Fantel AG, Weiss NS. Periconceptional multivitamin use in relation to the risk of congenital urinary tract anomalies. Epidemiology 1995;6:212-218.
16. Shaw GM, Lammer EJ, Wasserman CR, O’Malley CD, Tolarova MM. Risks of orofacial clefts in children born to women using multivitamins containing folic acid periconceptionally. Lancet 1995;345:393-396.
17. Itikala PR, Watkins M, Mulinare J, Moore CA, Liu Y. Maternal multivitamin use and orofacial clefts in offspring. Teratology 2001;63:79-86.
18. Olshan AF, Smith JC, Bondy ML, Neglia JP, Pollock BH. Maternal vitamin use and reduced risk of neuroblastoma. Epidemiology 2002;13:575-580.
19. Brouwer IA, van Dusseldorp M, West CE, et al. Dietary folate from vegetables and citrus fruit decreases plasma homocysteine concentrations in humans in a dietary controlled trial. J Nutr 1999;129:1135-1139.
20. Cuskelly GJ, McNulty H, Scott JM. Effect of increasing dietary folate on red-cell folate: implications for prevention of neural tube defects. Lancet 1996;347:657-659.
21. United States Preventive Services Task Force. Guide to Clinical Preventive Services. 2nd ed. Rockville, Md: Agency for Health Care Research and Quality; 1996. Available at: odphp.osophs.dhhs.gov/pubs/guidecps.tcpstoc.htm. Accessed on January 4, 2004.
22. March of Dimes Birth Defects Foundation. Folic acid and the prevention of birth defects: a national survey of pre-pregnancy awareness and behavior among women of childbearing age, 1995-2002. Conducted by the Gallup Organization. White Plains, NY: March of Dimes Foundation; 2002. Publication no. 31-1677-02.
23. Folic acid campaign and evaluation—southwestern Virginia, 1997-1999. MMWR Morb Mortal Wkly Rep 1999;48:914-917.
24. Canfield MA, Anderson JL, Waller DK, Palmer SE, Kaye CI. Folic acid awareness and use among women with a history of a neural tube defect pregnancy—Texas, 2000-2001. MMWR Recomm Rep 2002;51(RR-13):16-19.
25. de Weerd S, Thomas CM, Cikot RJ, Steegers-Theunissen RF, DeBoo TM, Steegers EA. Preconception counseling improves folate status of women planning pregnancy. Obstet Gynecol 2002;99:45-50.
26. Green NS. Folic acid supplementation and prevention of birth defects. J Nutr 2002;123(8 Suppl):2356S-2360S.
27. Rader JI, Yetley EA. Nationwide folate fortification has complex ramifications and requires careful monitoring over time. Arch Intern Med 2002;162:608-609.
28. Honein MA, Paulozzi LJ, Matthews TJ, Erickson JD, Wong LY. Impact of folic acid fortification of the US food supply on the occurrence of neural tube defects. JAMA 2001;285:2981-2986.
29. Centers for Disease Control and Prevention (CDC). National Health Interview Survey Atlanta, Ga: US Department of Health and Human Services, Centers for Disease Control and Prevention, 1992.
30. CDC. Third National Health and Nutrition Examination Survey (NHANES III). Hyattsville, Md: National Center for Health Statistics, Division of Data Services, 1998.
31. Combs CA, Kitzmiller JL. Spontaneous abortion and congenital malformations in diabetes. Baillieres Clin Obstet Gynecol 1991;5:315-331.
32. Dicker D, Feldberg D, Samuel N, et al. Spontaneous abortion in patients with insulin-dependent diabetes mellitus: the effect of preconceptional diabetic control. Am J Obstet Gynecol 1988;158:1161-1164.
33. Ray JG, O’Brien TE, Chan WS. Preconception care and the risk of congenital anomalies in the offspring of women with diabetes mellitus. Q J Med 2001;94:435-444.
34. Elixhauser A, Weschler JM, Kitzmiller JL, et al. Cost-benefit analysis of preconception care for women with established diabetes mellitus. Diabetes Care 1993;16:1146-1157.
35. Morrell MJ. Guidelines for the care of women with epilepsy. Neurology 1998;51(5 Supplement 4):S21-S27.
36. CDC. Current trends. Prevalence of self-reported epilepsy—United States, 1986-1990. MMWR Morb Mortal Wkly Rep 1994;43:810-811817-818.
37. Holmes LB, Harvey EA, Coull BA, et al. The teratogenicity of anticonvulsant drugs. N Engl J Med 2001;344:1132-1138.
38. Sabers A, Gram L. Newer anticonvulsants: comparative review of drug interactions and adverse effects. Drugs 2000;60:23-33.
39. Betts T, Fox C. Proactive pre-conception counseling for women with epilepsy—is it effective? Seizure 1999;8:322-327.
40. Control and prevention of rubella: Evaluation and management of suspected outbreaks, rubella in pregnant women, and surveillance for congenital rubella syndrome. MMWR Recomm Rep 2001;50(RR-12):1-23.
41. Wharton M, Hughes H, Reilly M, eds. Manual for the Surveillance of Vaccine-Preventable Diseases. Atlanta, Ga: National Immunization Program, Centers for Disease Control and Prevention; 2002. Available at: www.cdc.gov/nip/publications/surv-manual/default.htm. Accessed on January 4, 2004.
42. Schluter WW, Reef SE, Redd SC, Dykewicz CA. Changing epidemiology of congenital rubella syndrome in the United States. J Infect Dis 1998;178:636-641.
43. Warren KR, Foudin LL. Alcohol-related birth defects—the past, present, and future. Alcohol Res Health 2001;25:153-158.
44. May PA, Gossage JP. Estimating the prevalence of fetal alcohol syndrome: A summary. Alcohol Res Health 2001;25:159-167.
45. Abel EL. An update on incidence of FAS: FAS is not an equal opportunity birth defect. Neurotoxicol Teratol 1995;17:437-443.
46. Knupfer G. Abstaining for foetal health: The fiction that even light drinking is dangerous. Br J Addict 1991;86:1063-1073.
47. Maier SE, West JR. Drinking patterns and alcohol-related birth defects. Alcohol Res Health 2001;25:168-174.
48. Mills JL, Granbard BI, Harley EE, Rhoads GG, Berendes HW. Maternal alcohol consumption and birth weight: how much drinking in pregnancy is safe? JAMA 1984;252:1875-1879.
49. Sood B, Delaney-Black V, Covington C, et al. Prenatal alcohol exposure and childhood behavior at age 6 to 7 years: I. Dose-response effect. Pediatrics 2001;108:E34.-
50. Kahan M, Wilson L, Becker L. Effectiveness of physician-based interventions with problem drinkers: a review. CMAJ 1995;152:851-859.
51. Waterson EJ, Murray-Lyon IM. Preventing fetal alcohol effects: A trial of three methods of giving information in the antenatal clinic. Health Education Research 1990;5:53-61.
52. Reynolds KD, Coombs DW, Lowe JB, Peterson PL, Gayoso E. Evaluation of a self-help program to reduce alcohol consumption among pregnant women. Int J Addict 1995;30:427-443.
53. Floyd RL, Ebrahim SH, Boyle CA, Gould DW. Observations from the CDC. Preventing alcohol-exposed pregnancies among women of childbearing age: The necessity of a pre-conceptional approach. J Womens Health Gen Based Med 1999;8:733-736.
54. The Project CHOICES Intervention Research Group. Reducing the Risk of Alcohol-Exposed Pregnancies: A Study of a Motivational Intervention in Community Settings. Pediatrics 2003;111:1131-1135.
- Offer smoking cessation interventions to all women of childbearing age who smoke. (A)
- Offer folic acid supplementation to all pregnant women as well as women of childbearing age. (A)
- Offer women with diabetes intensive glycemic control before pregnancy. (B)
- Offer women who take antiepileptic medications folic acid supplementation and a transition to monotherapy, while avoiding phenytoin and valproic acid if possible. (B)
- Screen pregnant women and women of childbearing age to further reduce the incidence of congenital rubella syndrome. (C)
- Alcohol cessation advice has not consistently been shown to decrease alcohol intake or morbidity in women. Written information on the fetal effects of alcohol should be provided to women who use alcohol during pregnancy. (B)
This article reviews 6 important, evidence-based recommendations for periconception care: smoking cessation, folic acid supplementation and multivitamin use, diabetes care, epilepsy drug use, rubella immunization, and alcohol abuse. With time so limited during primary care visits, physicians often miss opportunities to provide periconception health care. However, some of the recommendations do not take long to convey. And though others may require significant effort on the part of the physician and patient, the benefits can be substantial.
In 2000, women aged 18 to 44 years made 4.1 million outpatient visits to family physicians.1 Each of these visits was an opportunity to educate a patient about periconception health. Opportune encounters include well-woman exams, discussions about a negative pregnancy test, and follow-up visits for spontaneous or therapeutic abortions. Sexually active women using less-than-effective birth control (or none at all) would also benefit from preconception counseling. For women of childbearing age who have diabetes or epilepsy, make preconception interventions part of their routine medical care.
Smoking cessation
Twenty-five percent of women of reproductive age in the US are cigarette smokers—higher than the percentage of smokers among all women.2 Up to 90% continue to smoke during pregnancy.3 The 2001 Surgeon General’s Report on Women and Smoking reports that cigarette smoking causes the highest proportion of preventable problems related to pregnancy and the neonatal period. The report estimates that smoking cessation would reduce all infant deaths by 10%.
How smoking adversely affects pregnancy
One meta-analysis found that women who smoke during pregnancy have significantly increased risks of placenta previa, placental abruption, ectopic pregnancy, and preterm premature rupture of membranes (level of evidence [LOE]: 2a).4 Maternal cigarette smoking also increases the risk of stillbirth, intrauterine growth retardation, and sudden infant death syndrome (SIDS). Smoking cessation during pregnancy, especially early on, reduced the risk of most of these conditions.5
Interventions that work
The best evidence for the effectiveness of smoking cessation interventions is found in studies of nonpregnant patients. Such evidence would likely be applicable to women seeking preconception care.
Multiple Cochrane Database reviews have addressed smoking cessation in nonpregnant patients. The reviews are meta-analyses of randomized, controlled trials (LOE: 1a) and provide strong evidence for the value of smoking cessation interventions in the general population. Interventions that increase quit rates include the following: brief physician advice,6 telephone counseling,7 nicotine replacement therapy (primarily gum and patches were studied),8 group therapy,9 and bupropion or nortriptyline10 (Table).
A Cochrane Database review of smoking cessation in pregnancy found that 6.4% fewer women smoked during the third trimester of pregnancy after intervention (LOE: 1a).11 Studies that looked at neonatal outcomes showed a reduction in low birth weight and preterm birth (number needed to treat [NNT]=75 for low birthweight; NNT=90 for preterm birth). There were no differences in other outcomes; however, the trials were not powered to detect such differences. Interventions found to be effective included informing women about the effects of smoking on a fetus and the benefits of quitting, recommending to smokers that they quit, and teaching cognitive-behavioral strategies for smoking cessation.
Our data were found through a search of the following databases: Medline, Cochrane Database of Systematic Reviews, Database of Abstracts of Reviews of Effects, Cochrane Central Register of Controlled Trials, and the American College of Physicians Journal Club. We selected the areas with the strongest evidence available for reduction of congenital anomalies available for review. We also focused on subjects whose interventions proved to be effective in improving neonatal outcomes.
TABLE
Effective smoking cessation interventions
| Intervention | Number of studies | Number of participants | OR* (95% CI) | NNT |
|---|---|---|---|---|
| Brief physician advice | 16 | 13,575 | 1.69 (1.45–1.98) | 58 |
| Telephone counseling | 13 | 16,462 | 1.56 (1.38–1.77) | 40 |
| Nicotine replacement therapy | 97 | 37,760 | 1.74 (1.64–1.86) | 16 |
| Group therapy vs self-help | 16 | 4395 | 1.97 (1.57–2.48) | 22 |
| Group therapy vs no treatment | 6 | 775 | 2.19 (1.42–3.37) | 10 |
| Bupropion | 16 | 5374 | 1.97 (1.67–2.34) | 11 |
| Nortriptyline | 5 | 861 | 2.80 (1.81–4.32) | 9 |
| Smoking cessation interventions in pregnancy | 34 | 9945 | 1.89 (1.67–2.13) | 16 |
| *Odds ratio for successful smoking cessation. For an explanation of odds ratios, see the Language of Evidence, page 108. | ||||
| OR, odds ratio; CI, confidence interval; NNT, number needed to treat | ||||
Applying the evidence
Because of the proven reduction in neonatal morbidity, smoking cessation counseling may be the most effective part of periconception care. Advise smoking cessation to all women who smoke, before and during pregnancy (strength of recommendation [SOR]: A).
Folic acid and multivitamins
Neural tube defects occur in 1 in 1000 babies delivered in the US. The Medical Research Council Vitamin Study found that mothers who had a child with neural tube defects reduced the risk of having another child with neural tube defects by 72% if they took 4 mg of folic acid a day prior to conception and during the first trimester.12
A large primary prevention trial in Hungary showed the risk of anomalies (including neural tube defects) in babies decreased by 46% among mothers randomized to receive folic acid.13 A Cochrane meta-analysis demonstrated a 3-fold decreased risk of a first neural tube defect if women took folic acid. The absolute risk of neural tube defects decreased from 10.2/1000 in the control group to 2.4/1000 in the folic acid group. The NNT to prevent 1 neural tube defect was 847.14
Studies have shown that periconception multivitamin intake confers other benefits as well: decreased risk of genitourinary malformations, cleft lip and cleft palate, and neuroectodermal tumors in offspring. In all studies, the multivitamins contained folic acid, but most studies were unable to look at folic acid independently.15-18
Optimal dose of folic acid
Studies have attempted to determine the most beneficial dose of folic acid and how it should be consumed (ie, diet, supplementation, fortification). Study results, however, are conflicting.19,20
In 1992, the US Preventive Services Task Force (USPSTF) recommended women of childbearing age consume 0.4 mg/d folic acid,21 but it did not make a recommendation on the form of folic acid.
Patient education that works
Women in the US are not fully aware of the benefits of taking multivitamins with folic acid prior to conception and during pregnancy. A 2002 survey showed that only 20% of women knew that folic acid could prevent certain birth defects. Even fewer women knew they have to take folic acid prior to conception (7% in the survey).22
Though many studies have shown that education increases awareness about folic acid, only a few have investigated if awareness leads to changes in behavior.23 In highly motivated women, education does appear to influence behavior changes. A study in Texas showed that women who had children with neural tube defects and had received advice about taking folic acid prior to subsequent pregnancies were more likely to use supplements than women who did not receive this advice.24 Another study looked at women planning a pregnancy who had preconception counseling. Counseling about folic acid increased folic acid intake.25
The USPSTF expected a 70% decrease in incidence of neural tube defects if its 1992 recommendation was followed. In 1998, the Food and Drug Administration began requiring the fortification of cereal grains at the level of 140 μg/100 g grain. This was expected to increase the intake of folate in women by 100 μg/d and decrease the incidence of neural tube defects by 20%.26
Data from the Centers for Disease Control and Prevention (CDC) has shown that folate status had improved significantly in women of childbearing age,27 and the incidence of neuroblastoma has decreased by 19%, from 37.8/100,000 prior to supplementation to 30.5/100,000 since fortification became mandatory.28
Applying the evidence
Increased folic acid intake significantly decreases neural tube defects. Education about folic acid increases vitamin use in motivated women (SOR: A). Folic acid supplementation of food is an effective population-based intervention to reduce neural tube defects (SOR: B). Folic acid intake by women decreases genitourinary and cleft-lip malformations and neuroblastoma in their infants (SOR: B).
Diabetes mellitus
Estimates of pregestational diabetes in women of childbearing age range from 1.9% to 3.5%.29,30 Diabetes has been associated with decreased fertility, spontaneous abortions, and congenital anomalies. Several studies have correlated spontaneous abortion rates with hemoglobin A1c values at the time of conception (LOE: 2a).31
Glycemic control reduces spontaneous abortions
One prospective trial32 compared the spontaneous abortion rate in diabetic women who receive intensive preconception insulin therapy with the rate in women who receive usual care (LOE: 2b). A spontaneous abortion rate of 8.4% occurred in the preconception treatment group compared with 28% in the pregnancy care–only group (NNT=5). Limitations of this study include the small number of participants and the lack of randomization. However, given all the benefits of improved glycemic control, preconception glycemic control is recommended to reduce the spontaneous abortion rate in diabetic women (SOR: B).
Other benefits of glycemic control
Major congenital malformations occur in 4% to 11% of infants of diabetic mothers compared with a background rate of 1.2% to 2.1%. Higher values of hemoglobin A1c in the first trimester have been associated with these increased rates of congenital anomalies. However, it is not clear if the association is linear or if a threshold level of hemoglobin A1c exists, above which the anomaly rate increases. Anomalies most commonly occur in the cardiovascular, skeletal, and central nervous systems before 8 weeks gestational age. Therefore, the critical time for preventing congenital anomalies is before conception.
Preconception care reduces anomalies overall
One meta-analysis of 16 studies provides evidence for the value of preconception care in reducing congenital anomalies due to diabetes mellitus.33 The interventions included both inpatient and out-patient optimization of glucose control. The analysis reviews 8 prospective and 8 retrospective cohort studies with a total of 2651 offspring. The results of all 16 studies were consistent.
Hemoglobin A1c values were significantly lower in the preconception care group. The overall rate for major congenital anomalies was 2.1% in the preconception group compared with 6.5% in the pregnancy care group (NNT=23) (LOE: 2a). The studies with the lowest anomaly rates had a pre-meal glucose target of <120 mg/dL, and participants injected insulin 4 times daily. A cost-benefit analysis based on a mathematical model of preconception diabetic care calculated that intensive preconception care for women with diabetes would save an average of $1720 per enrollee when adverse maternal and neonatal outcomes are taken into account.34
Intensive preconception glycemic control helps prevent major congenital anomalies in children born to women with diabetes (SOR: B).
Epilepsy
Compared with healthy women, women with epilepsy have higher rates of infertility and miscarriage and higher rates of infants with congenital anomalies (4%–8%; mainly neural tube defects and heart defects).35 Therefore, women with epilepsy (5.6/1000 among women aged 15 to 6436) should receive special attention to preconception care. Adding to the urgency for counseling is the fact that medications for epilepsy can reduce the effectiveness of some forms of hormonal contraception.
Medications are the problem
A source of debate has been whether the increased rate of anomalies is due to epilepsy or the medications used to treat it. A cohort study compared 3 groups of pregnant women: those taking antiepileptic medications (some were taking these medications for other conditions, such as bipolar disorder), women with epilepsy who were not on medications, and a control group. The rate of major and minor malformations among infants of women taking antiepileptic medications was 20.6%, compared with 8.5% in the control group (LOE: 2b).37 Women with epilepsy who were not on medications had a similar anomaly rate to the control group.
The medications primarily associated with congenital anomalies were valproic acid, carbamazepine, and phenytoin; polytherapy was associated with a higher anomaly rate. The data on newer antiepileptic medications (eg, gabapentin, lamotrigine, oxcarbazepine, tiagabine, topiramate, and vigabatrin) are insufficient to determine if anomaly rates are increased among fetuses exposed to them.38 Because folic acid supplementation has been associated with lower rates of infants with neural tube defects, higher-dose folic acid supplementation (1–4 mg/d) has been recommended for women with epilepsy (LOE: 5).
Change treatment before conception
One cohort study has examined the effectiveness of preconception counseling for women with epilepsy.39 The investigators compared women referred to a preconception epilepsy clinic with women who presented during pregnancy. In the preconception group, all women were placed on folic acid, two thirds were shifted to monotherapy prior to conception, and 6% were able to stop their epilepsy medications. The epilepsy clinic followed a protocol for confirming the diagnosis of epilepsy, determining if a woman was a candidate to discontinue medications, avoiding use of phenytoin and valproic acid, and switching as many women to monotherapy as possible.
The preconception care group had no major fetal malformations, compared with 18% in the pregnancy group (NNT=6) (LOE: 2b).
Applying the evidence
On the basis of this study, women with epilepsy who are considering pregnancy should be switched to monotherapy and potentially less teratogenic medications (when possible), and should receive at least 1 mg/d folic acid prior to conception (SOR: B).
Rubella
Immunization has reduced the occurrence of rubella in the US from 57,686 cases in 1969 (when vaccination was started) to 279 cases in 1999.40 Cases of congenital rubella syndrome in the US have fallen to a low of 3 cases in 2001. However, rubella and congenital rubella syndrome are still fairly common in developing countries, many of which have no rubella vaccine program or have only recently started such programs.
In the US, rubella infection is most likely to occur among Hispanic patients (especially foreign-born patients) and among families that refuse immunization.41 A review of 12 cases of congenital rubella after an outbreak in the early 1990s found that more than 50% of the mothers had 2 or more medical visits where rubella testing/immunization could have been done. Similarly, another study found that 62% of women who gave birth to infants with congenital rubella syndrome had at least 1 missed opportunity for immunization prior to that pregnancy.42
Although no prospective studies confirm this observation, the authors calculated that the single most effective policy for prevention of congenital rubella syndrome would be screening pregnant women for rubella immunity and postpartum immunization of nonimmune women (SOR: C).
Alcohol
The Institute of Medicine recognizes alcohol-related birth defects (ARBD) and alcohol-related neurodevelopmental disorder (ARND) in addition to fetal alcohol syndrome (FAS) as potential effects of alcohol use in pregnancy and the periconception period.43
A diagnosis of FAS requires characteristic facial anomalies, growth retardation, and neurodevelopmental abnormalities. A category of partial FAS does exist; affected children have some of the characteristic facial anomalies, and either growth retardation, neurodevelopmental abnormalities, or cognitive/behavioral abnormalities with no other explanation.
ARBD includes a confirmed history of maternal alcohol use plus one or more congenital defects (most commonly cardiac, renal, vision, hearing, or skeletal. ARND requires a confirmed history of maternal alcohol use and either the neurodevelopmental abnormalities or cognitive/behavioral abnormalities found in partial FAS.
The prevalence of FAS in the US population is estimated at 0.5 to 2 per 1000 births, with up to 10/1000 newborns having some effect from alcohol exposure.44 The rate of FAS is more than 20 times higher in the US compared with other countries, including European countries, partially due to differences in diagnosis.45
Strict abstinence required?
Whether a safe threshold of alcohol consumption exists before or during pregnancy is a point of controversy. Many US authorities recommend against any alcohol intake before or during pregnancy. The effects of alcohol on a fetus depend on the amount of alcohol consumed at one time, timing of alcohol consumption in gestation, and duration of alcohol use in pregnancy.
This is complicated by the fact that studies have used varying definitions of light and heavy alcohol use, with categories that often overlap between different studies.46 Binge drinking (defined as more than 5 drinks on a single day), even when episodic, is more dangerous to fetal brain development than nonbinge drinking.47
Less severe problems can occur
Although a high level of alcohol use in pregnancy is associated with more severely affected offspring, a 1984 study of 31,000 pregnancies showed a higher risk of growth retardation if a mother had even 1 drink a day (LOE: 2b).48 A 2001 study of more than 600 urban African American children showed continued behavioral effects of alcohol at ages 6 to 7 with low levels (1 drink daily) of maternal alcohol consumption (LOE: 2b).49
Some intervention attempts show promise
A review of trials in which physicians briefly counseled nonpregnant women who were problem drinkers found no consistent decrease in drinking.50 Trials of personalized advice to pregnant women have also found it to be no more effective than written information alone.51 A written self-help manual, however, did improve cessation rates among women at a prenatal clinic.52
The CDC sponsored a pilot project to encourage alcohol cessation and effective contraception in women at risk for alcohol-exposed pregnancy.53 Although not a controlled trial, this more extensive intervention showed promise. Of the 143 women enrolled, 68.5% had either stopped their alcohol consumption or were using effective contraception by the 6-month follow up.
Applying the evidence
Written information about the risks of alcohol use in pregnancy should be provided to pregnant women who consume alcohol (SOR: B). There is not enough data to recommend physician counseling for alcohol cessation before or during pregnancy. More comprehensive interventions may be more effective, but have yet to be fully studied. No studies have evaluated neonatal outcomes in the offspring of women who are counseled on alcohol cessation in the periconception period.
Acknowledgments
The authors would like to thank Robert Taylor, MD and Scott Fields, MD for their assistance in reviewing this manuscript. The authors have no conflicts of interest to report.
- Bupropion • Zyban
- Carbamazepine • Atretol, Depitol, Epitol, Tegretol
- Gabapentin • Neurontin
- Lamotrigine • Lamictal
- Nortriptyline • Aventyl, Pamelor
- Oxcarbazepine • Trileptal
- Phenytoin • Cerebyx, Dilantin, Mesantoin, Peganone, Phenytek
- Tiagabine • Gabitril
- Topiramate • Topamax
- Valproic acid • Depakene, Depakote
- Vigabatrin • Sabril (available only in Canada)
Corresponding author
Heather Paladine, MD, Oregon Health and Science University, 3181 SW Sam Jackson Park Road, Mail Code FM, Portland OR 97239-3098. E-mail: [email protected].
1. US Department of Health and Human Services, Public Health Service, Centers for Disease Control and Prevention, National Center for Health Statistics, 2000. Unpublished data. Available at: www.aafp.org/x782.xml. Accessed on January 4, 2004.
2. Centers for Disease Control and Prevention (CDC). National Health Interview Survey (NHIS). Atlanta, Ga: Department of Health and Human Services, Centers for Disease Control and Prevention, 1999. Available at: www.cdc.gov/nchs/nhis.htm. Accessed on January 4, 2004.
3. US Department of Health and Human Services. Women and Smoking: A Report of the Surgeon General. Atlanta, Ga: Department of Health and Human Services, Centers for Disease Control and Prevention, National Center for Chronic Disease Prevention and Health Promotion, Office on Smoking and Health, 2001. Available at: www.cdc.gov/tobacco/sgr/sgr_forwomen/index.htm. Accessed on January 4, 2004.
4. Castles A, Adams K, Melvin CI, Kelsch C, Boulton ML. Effects of smoking during pregnancy. Five meta-analyses. Am J Prev Med 1999;16:208-215.
5. Andres RL, Day MC. Perinatal complications associated with maternal tobacco use. Semin Neonatol 2000;5:231-241.
6. Silagy C, Stead LF. Physician advice for smoking cessation. Cochrane Tobacco Addiction Group. Cochrane Database Syst Rev 2003; Issue 1.
7. Stead LF, Lancaster T, Perera R. Telephone counselling for smoking cessation. Cochrane Tobacco Addiction Group. Cochrane Database Syst Rev 2003; Issue 1.
8. Silagy C, Lancaster T, Stead L, Mant D, Fowler G. Nicotine replacement therapy for smoking cessation. Cochrane Tobacco Addiction Group. Cochrane Database Syst Rev 2003; Issue 1.
9. Stead LF, Lancaster T. Group behaviour therapy programmes for smoking cessation. Cochrane Tobacco Addiction Group. Cochrane Database Syst Rev 2003; Issue 1.
10. Hughes JR, Stead LF, Lancaster T. Antidepressants for smoking cessation. Cochrane Tobacco Addiction Group. Cochrane Database Syst Rev 2003; Issue 1.
11. Lumley J, Oliver S, Waters E. Interventions for promoting smoking cessation during pregnancy. Cochrane Pregnancy and Childbirth Group. Cochrane Database Syst Rev 2003; Issue 1.
12. Prevention of neural tube defects: results of the Medical Research Council Vitamin Study. MRC Vitamin Study Research Group. Lancet 1991;338:131-137.
13. Czeizel AE, Dudas I, Metneki J. Prevention of the first occurrence of neural-tube defects by periconceptional vitamin supplementation. N Engl J Med 1992;327:1832-1835.
14. Lumley J, Watson L, Watson M, Bower C. Periconceptional supplementation with folate and/or multivitamins for preventing neural tube defects. Cochrane Pregnancy and Childbirth Group. Cochrane Database Syst Rev 2002; Issue 3.
15. Li D, Daling JR, Mueller BA, Hickok DE, Fantel AG, Weiss NS. Periconceptional multivitamin use in relation to the risk of congenital urinary tract anomalies. Epidemiology 1995;6:212-218.
16. Shaw GM, Lammer EJ, Wasserman CR, O’Malley CD, Tolarova MM. Risks of orofacial clefts in children born to women using multivitamins containing folic acid periconceptionally. Lancet 1995;345:393-396.
17. Itikala PR, Watkins M, Mulinare J, Moore CA, Liu Y. Maternal multivitamin use and orofacial clefts in offspring. Teratology 2001;63:79-86.
18. Olshan AF, Smith JC, Bondy ML, Neglia JP, Pollock BH. Maternal vitamin use and reduced risk of neuroblastoma. Epidemiology 2002;13:575-580.
19. Brouwer IA, van Dusseldorp M, West CE, et al. Dietary folate from vegetables and citrus fruit decreases plasma homocysteine concentrations in humans in a dietary controlled trial. J Nutr 1999;129:1135-1139.
20. Cuskelly GJ, McNulty H, Scott JM. Effect of increasing dietary folate on red-cell folate: implications for prevention of neural tube defects. Lancet 1996;347:657-659.
21. United States Preventive Services Task Force. Guide to Clinical Preventive Services. 2nd ed. Rockville, Md: Agency for Health Care Research and Quality; 1996. Available at: odphp.osophs.dhhs.gov/pubs/guidecps.tcpstoc.htm. Accessed on January 4, 2004.
22. March of Dimes Birth Defects Foundation. Folic acid and the prevention of birth defects: a national survey of pre-pregnancy awareness and behavior among women of childbearing age, 1995-2002. Conducted by the Gallup Organization. White Plains, NY: March of Dimes Foundation; 2002. Publication no. 31-1677-02.
23. Folic acid campaign and evaluation—southwestern Virginia, 1997-1999. MMWR Morb Mortal Wkly Rep 1999;48:914-917.
24. Canfield MA, Anderson JL, Waller DK, Palmer SE, Kaye CI. Folic acid awareness and use among women with a history of a neural tube defect pregnancy—Texas, 2000-2001. MMWR Recomm Rep 2002;51(RR-13):16-19.
25. de Weerd S, Thomas CM, Cikot RJ, Steegers-Theunissen RF, DeBoo TM, Steegers EA. Preconception counseling improves folate status of women planning pregnancy. Obstet Gynecol 2002;99:45-50.
26. Green NS. Folic acid supplementation and prevention of birth defects. J Nutr 2002;123(8 Suppl):2356S-2360S.
27. Rader JI, Yetley EA. Nationwide folate fortification has complex ramifications and requires careful monitoring over time. Arch Intern Med 2002;162:608-609.
28. Honein MA, Paulozzi LJ, Matthews TJ, Erickson JD, Wong LY. Impact of folic acid fortification of the US food supply on the occurrence of neural tube defects. JAMA 2001;285:2981-2986.
29. Centers for Disease Control and Prevention (CDC). National Health Interview Survey Atlanta, Ga: US Department of Health and Human Services, Centers for Disease Control and Prevention, 1992.
30. CDC. Third National Health and Nutrition Examination Survey (NHANES III). Hyattsville, Md: National Center for Health Statistics, Division of Data Services, 1998.
31. Combs CA, Kitzmiller JL. Spontaneous abortion and congenital malformations in diabetes. Baillieres Clin Obstet Gynecol 1991;5:315-331.
32. Dicker D, Feldberg D, Samuel N, et al. Spontaneous abortion in patients with insulin-dependent diabetes mellitus: the effect of preconceptional diabetic control. Am J Obstet Gynecol 1988;158:1161-1164.
33. Ray JG, O’Brien TE, Chan WS. Preconception care and the risk of congenital anomalies in the offspring of women with diabetes mellitus. Q J Med 2001;94:435-444.
34. Elixhauser A, Weschler JM, Kitzmiller JL, et al. Cost-benefit analysis of preconception care for women with established diabetes mellitus. Diabetes Care 1993;16:1146-1157.
35. Morrell MJ. Guidelines for the care of women with epilepsy. Neurology 1998;51(5 Supplement 4):S21-S27.
36. CDC. Current trends. Prevalence of self-reported epilepsy—United States, 1986-1990. MMWR Morb Mortal Wkly Rep 1994;43:810-811817-818.
37. Holmes LB, Harvey EA, Coull BA, et al. The teratogenicity of anticonvulsant drugs. N Engl J Med 2001;344:1132-1138.
38. Sabers A, Gram L. Newer anticonvulsants: comparative review of drug interactions and adverse effects. Drugs 2000;60:23-33.
39. Betts T, Fox C. Proactive pre-conception counseling for women with epilepsy—is it effective? Seizure 1999;8:322-327.
40. Control and prevention of rubella: Evaluation and management of suspected outbreaks, rubella in pregnant women, and surveillance for congenital rubella syndrome. MMWR Recomm Rep 2001;50(RR-12):1-23.
41. Wharton M, Hughes H, Reilly M, eds. Manual for the Surveillance of Vaccine-Preventable Diseases. Atlanta, Ga: National Immunization Program, Centers for Disease Control and Prevention; 2002. Available at: www.cdc.gov/nip/publications/surv-manual/default.htm. Accessed on January 4, 2004.
42. Schluter WW, Reef SE, Redd SC, Dykewicz CA. Changing epidemiology of congenital rubella syndrome in the United States. J Infect Dis 1998;178:636-641.
43. Warren KR, Foudin LL. Alcohol-related birth defects—the past, present, and future. Alcohol Res Health 2001;25:153-158.
44. May PA, Gossage JP. Estimating the prevalence of fetal alcohol syndrome: A summary. Alcohol Res Health 2001;25:159-167.
45. Abel EL. An update on incidence of FAS: FAS is not an equal opportunity birth defect. Neurotoxicol Teratol 1995;17:437-443.
46. Knupfer G. Abstaining for foetal health: The fiction that even light drinking is dangerous. Br J Addict 1991;86:1063-1073.
47. Maier SE, West JR. Drinking patterns and alcohol-related birth defects. Alcohol Res Health 2001;25:168-174.
48. Mills JL, Granbard BI, Harley EE, Rhoads GG, Berendes HW. Maternal alcohol consumption and birth weight: how much drinking in pregnancy is safe? JAMA 1984;252:1875-1879.
49. Sood B, Delaney-Black V, Covington C, et al. Prenatal alcohol exposure and childhood behavior at age 6 to 7 years: I. Dose-response effect. Pediatrics 2001;108:E34.-
50. Kahan M, Wilson L, Becker L. Effectiveness of physician-based interventions with problem drinkers: a review. CMAJ 1995;152:851-859.
51. Waterson EJ, Murray-Lyon IM. Preventing fetal alcohol effects: A trial of three methods of giving information in the antenatal clinic. Health Education Research 1990;5:53-61.
52. Reynolds KD, Coombs DW, Lowe JB, Peterson PL, Gayoso E. Evaluation of a self-help program to reduce alcohol consumption among pregnant women. Int J Addict 1995;30:427-443.
53. Floyd RL, Ebrahim SH, Boyle CA, Gould DW. Observations from the CDC. Preventing alcohol-exposed pregnancies among women of childbearing age: The necessity of a pre-conceptional approach. J Womens Health Gen Based Med 1999;8:733-736.
54. The Project CHOICES Intervention Research Group. Reducing the Risk of Alcohol-Exposed Pregnancies: A Study of a Motivational Intervention in Community Settings. Pediatrics 2003;111:1131-1135.
Simplifying the language of evidence to improve patient care
- Several taxonomies exist for rating individual studies and the strength of recommendations, making the analysis of evidence confusing for practitioners.
- A new grading scale—the Strength of Recommendation Taxonomy (SORT)—will be used by several family medicine and primary care journals (required or optional), allowing readers to learn 1 consistently applied taxonomy of evidence.
- SORT is built around the information mastery framework, which emphasizes the use of patient-oriented outcomes that measure changes in morbidity or mortality. Levels of evidence from 1 to 3 for individual studies also are defined.
- An A-level recommendation is based on consistent and good-quality patient-oriented evidence; a B-level recommendation is based on inconsistent or limited-quality patient-oriented evidence; and a C-level recommendation is based on consensus, usual practice, opinion, disease-oriented evidence, or case series for studies of diagnosis, treatment, prevention, or screening.
Review articles (or overviews) are highly valued by physicians as a way to keep up-to-date with the medical literature. Sometimes though, these articles are based more on the authors’ personal experience, or anecdotes, or incomplete surveys of the literature than on a comprehensive collection of the best available evidence. To improve the quality of review articles, there is an ongoing effort in the medical publishing field to use more explicit grading of the strength of evidence on which recommendations are based.1-4
Making evidence easier to understand
Several journals, including American Family Physician and Journal of Family Practice, have adopted evidence-grading scales that are used in particular articles. Other organizations and publications have also developed evidence-grading scales. The diversity of these scales can be confusing for readers. More than 100 grading scales are in use by various medical publications.5 A level B recommendation in 1 journal may not mean the same thing in another. Even within 1 issue of a journal, evidence-grading scales often vary among the articles. Journal readers do not have the time, energy, or interest to interpret multiple grading scales, and more complex scales are difficult to integrate into daily practice.
Therefore the editors of the US family medicine and primary care journals (ie, American Family Physician, Family Medicine, Journal of Family Practice, Journal of the American Board of Family Practice, and BMJ-USA) and the Family Practice Inquiries Network (FPIN) came together to develop a unified taxonomy for the strength of recommendations based on a body of evidence. The new taxonomy should fulfill several objectives:
- Be uniform in most family medicine journals and electronic databases
- Allow authors to evaluate the strength of recommendation of a body of evidence
- Allow authors to rate the level of evidence for an individual study
- Be comprehensive and allow authors to evaluate studies of screening, diagnosis, therapy, prevention, and prognosis
- Be easy to use and not too time-consuming for authors, reviewers, and editors who may be content experts but not experts in critical appraisal or clinical epidemiology
- Be straightforward enough that primary care physicians can readily integrate the recommendations into daily practice.
Defining terms of evidence
A number of relevant terms must be defined for clarification.
Disease-oriented outcomes. These outcomes include intermediate, histopathologic, physiologic, or surrogate results (eg, blood sugar, blood pressure, flow rate, coronary plaque thickness) that may or may not reflect improvements in patient outcomes.
Patient-oriented outcomes. These are outcomes that matter to patients and help them live longer or better lives, including reduced morbidity, mortality, or symptoms, improved quality of life, or lower cost.
Level of evidence. The validity of an individual study is based on an assessment of its study design. According to some methodologies,6 levels of evidence can refer not only to individual studies but also to the quality of evidence from multiple studies about a specific question or the quality of evidence supporting a clinical intervention. For simplicity and consistency in this proposal, we use the term level of evidence to refer to individual studies.
Strength of recommendation. The strength (or grade) of a recommendation for clinical practice is based on a body of evidence (typically more than 1 study). This approach takes into account the level of evidence of individual studies, the type of outcomes measured by these studies (patient-oriented or disease-oriented), the number, consistency, and coherence of the evidence as a whole, and the relationship between benefits, harms, and costs.
Practice guideline (evidence-based). These guidelines are recommendations for practice that involve a comprehensive search of the literature, an evaluation of the quality of individual studies, and recommendation grades that reflect the quality of the supporting evidence. All search, critical appraisal, and grading methods should be described explicitly and be replicable by similarly skilled authors.
Practice guideline (consensus). Consensus guidelines are recommendations for practice based on expert opinions that typically do not include a systematic search, an assessment of the quality of individual studies, or a system to label the strength of recommendations explicitly.
Research evidence. This evidence is presented in publications of original research, involving collection of original data or the systematic review of other original research publications. It does not include editorials, opinion pieces, or review articles (other than systematic reviews or meta-analyses).
Review article. A nonsystematic overview of a topic is a review article. In most cases, it is not based on an exhaustive, structured review of the literature and does not evaluate the quality of included studies systematically.
Systematic reviews and meta-analyses. A systematic review is a critical assessment of existing evidence that addresses a focused clinical question, includes a comprehensive literature search, appraises the quality of studies, and reports results in a systematic manner. If the studies report comparable quantitative data and have a low degree of variation in their findings, a meta-analysis can be performed to derive a summary estimate of effect.
Most strength-of-evidence scales lack key elements
In March 2002, the Agency for Healthcare Research and Quality (AHRQ) published a report that summarized the state-of-the-art in methods of rating the strength of evidence.5 The report identified a large number of systems for rating the quality of individual studies: 20 for systematic reviews, 49 for randomized controlled trials, 19 for observational studies, and 18 for diagnostic test studies. It also identified 40 scales that graded the strength of a body of evidence consisting of 1 or more studies.
The authors of the AHRQ report proposed that any system for grading the strength of evidence should consider 3 key elements: quality, quantity, and consistency. Quality is the extent to which the identified studies minimize the opportunity for bias and is synonymous with the concept of validity. Quantity is the number of studies and subjects included in those studies. Consistency is the extent to which findings are similar between different studies on the same topic. Only 7 of the 40 systems identified and addressed all 3 elements.6-11
Strength of Recommendation Taxonomy (SORT) contains the key elements
The authors of this article represent the major family medicine journals in the United States and a large family practice academic consortium. Our process began with a series of electronic mail exchanges, was developed during a meeting of the editors, and continued through another series of electronic mail exchanges.
We decided our taxonomy for rating the strength of a recommendation should address the 3 key elements identified in the AHRQ report: quality, quantity, and consistency of evidence. We also were committed to creating a grading scale that could be applied by authors with varying degrees of expertise in evidence-based medicine and clinical epidemiology, and interpreted by physicians with little or no formal training in these areas. We believed that the taxonomy should address the issue of patientoriented evidence versus disease-oriented evidence explicitly and be consistent with the information mastery framework proposed by Slawson and Shaughnessy.2
After considering these criteria and reviewing the existing taxonomies for grading the strength of a recommendation, we decided that a new taxonomy was needed to reflect the needs of our specialty. Existing grading scales were focused on a particular kind of study (ie, prevention or treatment), were too complex, or did not take into account the type of outcome.
Our proposed taxonomy is called the Strength of Recommendations Taxonomy (SORT), and it is shown in Table 1. The taxonomy includes ratings of A, B, or C for the strength of recommendation for a body of evidence. The taxonomy also explains whether a body of evidence represents good-quality or limited-quality evidence, and whether evidence is consistent or inconsistent. The quality of individual studies is rated 1, 2, or 3; numbers are used to distinguish ratings of individual studies from the letters A, B, and C used to evaluate the strength of a recommendation based on a body of evidence. Figure 1 provides information about how to determine the strength of recommendation for management recommendations, and Figure 2 explains how to determine the level of evidence for an individual study. These 2 algorithms should be helpful to authors preparing papers for submission to family medicine journals. The algorithms are to be considered general guidelines, and special circumstances may dictate assignment of a different strength of recommendation (eg, a single, large, well-designed study in a diverse population may warrant an A-level recommendation).
Recommendations based only on improvements in surrogate or disease-oriented outcomes are always categorized as level C, because improvements in disease-oriented outcomes are not always associated with improve-ments in patient-oriented outcomes, as exemplified by several well-known findings from the medical literature. For example, doxazosin lowers blood pressure in African American patients—a seemingly beneficial outcome—but it also increases mortality.12 Similarly, encainide and flecainide reduce the incidence of arrhythmias after acute myocardial infarction, but they also increase mortality.13 Finasteride improves urinary flow rates, but it does not significantly improve urinary tract symptoms in patients with benign prostatic hypertrophy,14 while arthroscopic surgery for osteoarthritis of the knee improves the appearance of cartilage but does not reduce pain or improve joint function.15 Additional examples of clinical situations where disease-oriented evidence disagrees with patient—oriented evidence are shown in Table 2.12-24 Examples of how to apply the taxonomy are given in Table 3.
TABLE 1
How recommendations are graded for strength, and underlying individual studies are rated for quality
| In general, only key recommendations for readers require a grade of the “Strength of Recommendation.” Recommendations should be based on the highest quality evidence available. For example, vitamin E was found in some cohort studies (level 2 study quality) to have a benefit for cardiovascular protection, but good-quality randomized trials (level 1) have not confirmed this effect. Therefore, it is preferable to base clinical recommendations in a manuscript on the level 1 studies. | |||
| Strength of recommendation | Definition | ||
| A | Recommendation based on consistent and good-quality patient-oriented evidence.* | ||
| B | Recommendation based on inconsistent or limited-quality patient-oriented evidence.* | ||
| C | Recommendation based on consensus, usual practice, opinion, disease-oriented evidence,* or case series for studies of diagnosis, treatment, prevention, or screening | ||
| Use the following scheme to determine whether a study measuring patient-oriented outcomes is of good or limited quality, and whether the results are consistent or inconsistent between studies. | |||
| Study quality | Type of Study | ||
| Diagnosis | Treatment/prevention/screening | Prognosis | |
| Level 1—good-quality patient-oriented evidence | Validated clinical decision rule | SR/meta-analysis of RCTs with consistent findings | SR/meta-analysis of good-quality cohort studies |
| SR/meta-analysis of high-quality studies | High-quality individual RCT‡ All-or-none study§ | Prospective cohort study with good follow-up | |
| High-quality diagnostic cohort study† | |||
| Level 2—limited-quality patient-oriented evidence | Unvalidated clinical decision rule | SR/meta-analysis lower-quality clinical trials or of studies with inconsistent findings | SR/meta-analysis of lower-quality cohort studies or with inconsistent results |
| SR/meta-analysis of lower-quality studies or studies with inconsistent findings | Lower-quality clinical trial‡ or prospective cohort study Cohort study | Retrospective cohort study with poor follow-up | |
| Lower-quality diagnostic cohort study or diagnostic case-control study§ | Case-control study | Case-control study Case series | |
| Level 3—other evidence | Consensus guidelines, extrapolations from bench research, usual practice, opinion, other evidence disease-oriented evidence (intermediate or physiologic outcomes only), or case series for studies of diagnosis, treatment, prevention, or screening | ||
| Consistency across studies | |||
| Consistent | Most studies found similar or at least coherent conclusions (coherence means that differences are explainable); or If high-quality and up-to-date systematic reviews or meta-analyses exist, they support the recommendation | ||
| Inconsistent | Considerable variation among study findings and lack of coherence; or If high-quality and up-to-date systematic reviews or meta-analyses exist, they do not find consistent evidence in favor of the recommendation | ||
| *Patient-oriented evidence measures outcomes that matter to patients: morbidity, mortality, symptom improvement, cost reduction, and quality of life. Disease-oriented evidence measures intermediate, physiologic, or surrogate end points that may or may not reflect improvements in patient outcomes (ie, blood pressure, blood chemistry, physiologic function, and pathologic findings). | |||
| † High-quality diagnostic cohort study: cohort design, adequate size, adequate spectrum of patients, blinding, and a consistent, well-defined reference standard. | |||
| ‡ High-quality RCT: allocation concealed, blinding if possible, intention-to-treat analysis, adequate statistical power, adequate follow-up (greater than 80 percent). | |||
| § In an all-or-none study, the treatment causes a dramatic change in outcomes, such as antibiotics for meningitis or surgery for appendicitis, which precludes study in a controlled trial. | |||
| SR, systematic review; RCT, randomized controlled trial | |||
TABLE 2
Examples of inconsistency between disease-oriented and patient-oriented outcomes
| Therapy | Disease-oriented outcome | Patient-oriented outcome |
|---|---|---|
| Doxazosin for blood pressure12 | Reduces blood pressure | Increases morality in African Americans |
| Lidocaine for arrhythmia following acute myocardial infarction13 | Suppresses arrhythmias | Increases mortality |
| Finasteride for benign prostatic hypertrophy14 | Improves urinary flow rate | No clinically important change in symptom scores |
| Sleeping infants on their stomach or side16 | Knowledge of anatomy and physiology suggests that this will decrease the risk of aspiration | Increases risk of sudden infant death syndrome |
| Vitamin E for heart disease17 | Reduces levels of free radicals | No change in mortality |
| Histamine antagonists and proton pump inhibitors for nonulcer dyspepsia18 | Significantly reduces gastric pH levels | Little or no improvement in symptoms in patients with non-gastroesophageal reflux disease, nonulcer dyspepsia |
| Arthroscopic surgery for osteoarthritis of the knee15 | Improves appearance of cartilage after debridement | No change in function or symptoms at 1 year |
| Hormone therapy19 | Reduces low-density lipoprotein cholesterol, increases high-density lipoprotein cholesterol | No decrease in cardiovascular or all-cause mortality; an increase in cardiovascular events in all-cause mortality; an increase in cardiovascular events in women older than 60 years (Women’s Health Initiative) with combined hormone therapy |
| Insulin therapy in type 2 diabetes mellitus20 | Keeps blood sugar below 120 mg/dL (6.7 mmol/l) | Does not reduce overall mortality |
| Sodium fluoride for fracture prevention21 | Increases bone density | Does not reduce fracture rate |
| Lidocaine prophylaxis following acute myocardial infarction22 | Suppresses arrhythmias | Increases mortality |
| Clofibrate for hyperlipidemia23 | Reduces lipids | Does not reduce mortality |
| Beta-blockers for heart failure24 | Reduces cardiac output | Reduces mortality in moderate to severe disease |
TABLE 3
Examples of how to apply the SORT in practice
| Example 1: While a number of observational studies (level of evidence—2) suggested a cardiovascular benefit from vitamin E, a large, well-designed, randomized trial with a diverse patient population (level of evidence—1) showed the opposite. The strength of recommendation against routine, long-term use of vitamin E to prevent heart disease, based on the best available evidence, should be A. |
| Example 2: A Cochrane review finds 7 clinical trials that are consistent in their support of a mechanical intervention for low back pain, but the trials were poorly designed (ie, unblinded, nonrandomized, or with allocation to groups unconcealed). In this case, the strength of recommendation in favor of these mechanical interventions is B (consistent but lower-quality clinical trials). |
| Example 3: A meta-analysis finds 9 high-quality clinical trials of the use of a new drug in the treatment of pulmonary fibrosis. Two of the studies find harm, 2 find no benefit, and 5 show some benefit. The strength of recommendation in favor of this drug would be B (inconsistent results of good-quality, randomized controlled trials). |
| Example 4: A new drug increases the forced expiratory volume in 1 second (FEV1) and peak flow rate in patients with an acute asthma exacerbation. Data on symptom improvement is lacking. The strength of recommendation in favor of using this drug is C (disease-oriented evidence only). |
FIGURE 1
Determining the strength of a recommendation based on a body of evidence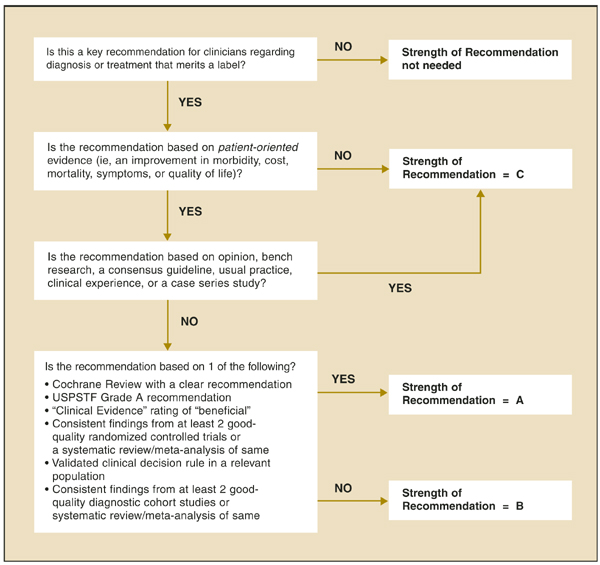
FIGURE 2
Determining the level of evidence for an individual study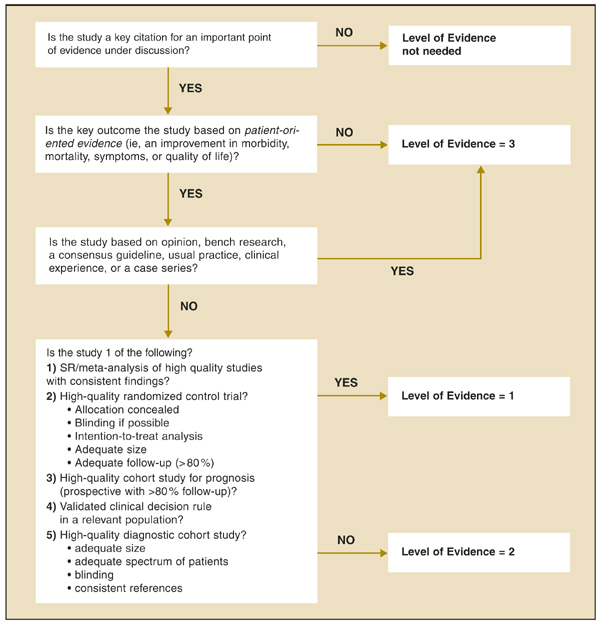
The advantages of SORT
We believe there are several advantages to our proposed taxonomy. It is straightforward and comprehensive, is easily applied by authors and physicians, and explicitly addresses the issue of patient-oriented versus disease-oriented evidence. The latter attribute distinguishes SORT from most other evidence grading scales. These strengths also create some limitations. Some clinicians may be concerned that the taxonomy is not as detailed in its assessment of study designs as others, such as that of the Centre for Evidence-Based Medicine (CEBM).25 However, the primary difference between the 2 taxonomies is that the CEBM version distinguishes between good and poor observational studies while the SORT version does not. We concluded that the advantages of a system that provides the physician with a clear recommendation that is strong (A), moderate (B), or weak (C) in its support of a particular intervention outweighs the theoretic benefit of distinguishing between lower quality and higher quality observational studies, particularly because there is no objective evidence that the latter distinction carries important differences in clinical recommendations.
Any publication applying SORT (or any other evidence-based taxonomy) should describe carefully the search process that preceded the assignment of a SORT rating. For example, authors could perform a comprehensive search of MEDLINE and the gray literature, a comprehensive search of MEDLINE alone, or a more focused search of MEDLINE plus secondary evidence-based sources of information.
Walkovers: Creating linkages with SORT
Some organizations, such as the CEBM,25 the Cochrane Collaboration,7 and the US Preventive Services Task Force (USPSTF),6 have developed their own grading scales for the strength of recommendations based on a body of evidence and are unlikely to abandon them. Other organizations, such as FPIN,26 publish their work in a variety of settings and must be able to move between taxonomies. We have developed a set of optional walkovers that suggest how authors, editors, and readers might move from 1 taxonomy to another. Walkovers for the CEBM and USPSTF taxonomies are shown in Table 4.
Many authors and experts in evidence-based medicine use the “Level of Evidence” taxonomy from the CEBM to rate the quality of individual studies.25 A walkover from the 5-level CEBM scale to the simpler 3-level SORT scale for individual studies is shown in Table 5.
TABLE 4
Suggested walkovers between taxonomies for assessing the strength of a recommendation based on a body of evidence
| SORT | CEBM | BMJ’s Clinical Evidence |
|---|---|---|
| A. Recommendation based on consistent and good-quality patient-oriented evidence | A. Consistent level 1 studies | Beneficial |
| B. Recommendation based on inconsistent or limited-quality patient-oriented evidence | B. Consistent level 2 or 3 studies or extrapolations from level 1 studies | Likely to be beneficial Likely to be ineffective or harmful (recommendation against) |
| C. Level 4 studies or extrapola-tions from level 2 or 3 studies | Unlikely to be beneficial (recommendation against) | |
| C. Recommendation based on consensus, usual practice, disease-oriented evidence, case series for studies of treatment or screening, and/on opinion | D. Level 5 evidence or troublingly inconsistent inconclusive studies of of any level | Unknown effectiveness |
| SORT, Strength of Evidence Taxonomy; CEBM, Centre for Evidence-Based Medicine; BMJ, BMJ Publishing Group. | ||
TABLE 5
Suggested walkover between CEBM and SORT for assessing the level of evidence of an individual study
| SORT | CEBM | |
|---|---|---|
| Treatment/screening | Other categories | |
| Level 1 | Levels 1a to 1c | Levels 1a to 1c |
| Level 2 | Level 2 or 3 | Levels 2 to 4 |
| Level 3 | Level 4 or 5 and any study that measures measures intermediate or surrogate outcomes | Level 5 andany study that intermediate or surrogate outcomes |
| CEBM, Centre for Evidence-Based Medicine; | ||
| SORT, Strength of Recommendation Taxonomy | ||
SORT can improve patient care
The SORT is a comprehensive taxonomy for evaluating the strength of a recommendation based on a body of evidence and the quality of an individual study. If applied consistently by authors and editors in the family medicine literature, it has the potential to make it easier for physicians to apply the results of research in their practice through the information mastery approach and to incorporate evidence-based medicine into their patient care.
Like any such grading scale, it is a work in progress. As we learn more about biases in study design, and as the authors and readers who use the taxonomy become more sophisticated about principles of information mastery, evidence-based medicine, and critical appraisal, it is likely to evolve. We remain open to suggestions from the primary care community for refining and improving SORT.
Acknowledgments
The authors thank Lee Green, MD, MPH, John Epling, MD, Kurt Stange, MD, PhD, and Margaret Gourlay, MD, for helpful comments on the manuscript. The authors indicate that they do not have any conflicts of interest. Sources of funding: none reported. This article has been simultaneously published in print and online by American Family Physician, Journal of Family Practice, Journal of the American Board of Family Practice, and online by Family Practice Inquiries Network. Copyright © 2004 American Family Physician, a publication of the American Academy of Family Physicians. All rights reserved.
1. Evidence-based medicine . A new approach to teaching the practice of medicine. JAMA 1992;268:2420-2425.
2. Slawson DC, Shaughnessy AF, Bennett JH. Becoming a medical information master: feeling good about not knowing everything. J Fam Pract 1994;38:505-513.
3. Shaughnessy AF, Slawson DC, Bennett JH. Becoming an information master: a guidebook to the medical information jungle. J Fam Pract 1994;39:489-499.
4. Siwek J, Gourlay ML, Slawson DC, Shaughnessy AF. How to write an evidence-based clinical review article. Am Fam Physician 2002;65:251-258.
5. Systems to rate the strength of scientific evidence. Summary, evidence report/technology assessment: number 47. AHRQ pub. no. 02-E015, March 2002. Agency for Healthcare Research and Quality, Rockville, Md. Available at: www.ahrq.gov/clinic/epcsums/strengthsum.htm. Accessed on November 13, 2003.
6. Harris RP, Helfand M, Woolf SH, Lohr KN, Mulrow CD, Teutsch SM, et al. Current methods of the U.S. Preventive Services Task Force: a review of the process. Am J Prev Med 2001;20(3 suppl):21-35.
7. Clarke M, Oxman AD. Cochrane reviewer’s handbook 4.0. The Cochrane Collaboration, 2003. Available at: www.cochrane.org/resources/handbook/handbook.pdf. Accessed on November 13, 2003.
8. Gyorkos TW, Tannenbaum TN, Abrahamowicz M, Oxman AD, Scott EA, Millson ME, et al. An approach to the development of practice guidelines for community health interventions. Can J Public Health 1994;85(suppl 1):S8-S13.
9. Briss PA, Zaza S, Pappaioanou M, et al. Developing an evidence-based guide to community preventive services—methods. Am J Prev Med 2000;18(1 suppl):35-43.
10. Greer N, Mosser G, Logan G, Halaas GW. A practical approach to evidence grading. Jt Comm J Qual Improv 2000;26:700-712.
11. Guyatt GH, Haynes RB, Jaeschke RZ, et al. Users’ guides to the medical literature: XXV. Evidence-based medicine: principles for applying the users’ guides to patient care. JAMA 2000;284:1290-1296.
12. Major cardiovascular events in hypertensive patients randomized to doxazosin vs chlorthalidone: the antihypertensive and lipid-lowering treatment to prevent heart attack trial (ALLHAT) JAMA 2000;283:1967-1975.
13. Echt DS, Liebson PR, Mitchell LB, et al. Mortality and morbidity in patients receiving encainide, flecainide, or placebo. N Engl J Med 1991;324:781-788.
14. Lepor H, Williford WO, Barry MJ, et al. The efficacy of terazosin, finasteride, or both in benign prostatic hyperplasia. N Engl J Med 1996;335:533-539.
15. Moseley JB, O’Malley K, Petersen NJ, et al. A controlled trial of arthroscopic surgery for osteoarthritis of the knee. N Engl J Med 2002;347:81-88.
16. Dwyer T, Ponsonby AL. Sudden infant death syndrome: after the “back to sleep” campaign. BMJ 1996;313:180-181.
17. Yusuf S, Dagenais G, Pogue J, Bosch J, Sleight P. Vitamin E supplementation and cardiovascular events in high-risk patients. N Engl J Med 2000;342:154-160.
18. Moayyedi P, Soo S, Deeks J, Delaney B, Innes M, Forman D. Pharmacological interventions for non-ulcer dyspepsia. Cochrane Database Syst Rev 2003;(1):CD001960.-
19. Rossouw JE, Anderson GL, Prentice RL, et al. Risks and benefits of estrogen plus progestin in healthy postmenopausal women: principal results from the Women’s Health Initiative randomized controlled trial. JAMA 2002;288:321-333.
20. Intensive blood-glucose control with sulphonylureas or insulin compared with conventional treatment and risk of complications in patients with type 2 diabetes (UKPDS 33). Lancet 1998;352:837-853.
21. Meunier PJ, Sebert JL, Reginster JY, et al. Fluoride salts are no better at preventing new vertebral fractures than calcium-vitamin D in postmenopausal osteoporosis: the FAVO Study. Osteoporos Int 1998;8:4-12.
22. MacMahon S, Collins R, Peto R, Koster RW, Yusuf S. Effects of prophylactic lidocaine in suspected acute myocardial infarction. An overview of results from the randomized, controlled trials. JAMA 1988;260:1910-1916.
23. Grumbach K. How effective is drug treatment of hypercholesterolemia? A guided tour of the major clinical trials for the primary care physician. J Am Board Fam Pract 1991;4:437-445.
24. Heidenreich PA, Lee TT, Massie BM. Effect of beta-blockade on mortality in patients with heart failure: a metaanalysis of randomized clinical trials. J Am Coll Cardiol 1997;30:27-34.
25. Centre for Evidence-Based Medicine. Levels of evidence and grades of recommendation. Available at: www.cebm.net/levels_of_evidence.asp. Accessed on November 13, 2003.
26. Family Practice Inquiries Network. (FPIN). Available at: www.fpin.org. Accessed on November 13, 2003.
- Several taxonomies exist for rating individual studies and the strength of recommendations, making the analysis of evidence confusing for practitioners.
- A new grading scale—the Strength of Recommendation Taxonomy (SORT)—will be used by several family medicine and primary care journals (required or optional), allowing readers to learn 1 consistently applied taxonomy of evidence.
- SORT is built around the information mastery framework, which emphasizes the use of patient-oriented outcomes that measure changes in morbidity or mortality. Levels of evidence from 1 to 3 for individual studies also are defined.
- An A-level recommendation is based on consistent and good-quality patient-oriented evidence; a B-level recommendation is based on inconsistent or limited-quality patient-oriented evidence; and a C-level recommendation is based on consensus, usual practice, opinion, disease-oriented evidence, or case series for studies of diagnosis, treatment, prevention, or screening.
Review articles (or overviews) are highly valued by physicians as a way to keep up-to-date with the medical literature. Sometimes though, these articles are based more on the authors’ personal experience, or anecdotes, or incomplete surveys of the literature than on a comprehensive collection of the best available evidence. To improve the quality of review articles, there is an ongoing effort in the medical publishing field to use more explicit grading of the strength of evidence on which recommendations are based.1-4
Making evidence easier to understand
Several journals, including American Family Physician and Journal of Family Practice, have adopted evidence-grading scales that are used in particular articles. Other organizations and publications have also developed evidence-grading scales. The diversity of these scales can be confusing for readers. More than 100 grading scales are in use by various medical publications.5 A level B recommendation in 1 journal may not mean the same thing in another. Even within 1 issue of a journal, evidence-grading scales often vary among the articles. Journal readers do not have the time, energy, or interest to interpret multiple grading scales, and more complex scales are difficult to integrate into daily practice.
Therefore the editors of the US family medicine and primary care journals (ie, American Family Physician, Family Medicine, Journal of Family Practice, Journal of the American Board of Family Practice, and BMJ-USA) and the Family Practice Inquiries Network (FPIN) came together to develop a unified taxonomy for the strength of recommendations based on a body of evidence. The new taxonomy should fulfill several objectives:
- Be uniform in most family medicine journals and electronic databases
- Allow authors to evaluate the strength of recommendation of a body of evidence
- Allow authors to rate the level of evidence for an individual study
- Be comprehensive and allow authors to evaluate studies of screening, diagnosis, therapy, prevention, and prognosis
- Be easy to use and not too time-consuming for authors, reviewers, and editors who may be content experts but not experts in critical appraisal or clinical epidemiology
- Be straightforward enough that primary care physicians can readily integrate the recommendations into daily practice.
Defining terms of evidence
A number of relevant terms must be defined for clarification.
Disease-oriented outcomes. These outcomes include intermediate, histopathologic, physiologic, or surrogate results (eg, blood sugar, blood pressure, flow rate, coronary plaque thickness) that may or may not reflect improvements in patient outcomes.
Patient-oriented outcomes. These are outcomes that matter to patients and help them live longer or better lives, including reduced morbidity, mortality, or symptoms, improved quality of life, or lower cost.
Level of evidence. The validity of an individual study is based on an assessment of its study design. According to some methodologies,6 levels of evidence can refer not only to individual studies but also to the quality of evidence from multiple studies about a specific question or the quality of evidence supporting a clinical intervention. For simplicity and consistency in this proposal, we use the term level of evidence to refer to individual studies.
Strength of recommendation. The strength (or grade) of a recommendation for clinical practice is based on a body of evidence (typically more than 1 study). This approach takes into account the level of evidence of individual studies, the type of outcomes measured by these studies (patient-oriented or disease-oriented), the number, consistency, and coherence of the evidence as a whole, and the relationship between benefits, harms, and costs.
Practice guideline (evidence-based). These guidelines are recommendations for practice that involve a comprehensive search of the literature, an evaluation of the quality of individual studies, and recommendation grades that reflect the quality of the supporting evidence. All search, critical appraisal, and grading methods should be described explicitly and be replicable by similarly skilled authors.
Practice guideline (consensus). Consensus guidelines are recommendations for practice based on expert opinions that typically do not include a systematic search, an assessment of the quality of individual studies, or a system to label the strength of recommendations explicitly.
Research evidence. This evidence is presented in publications of original research, involving collection of original data or the systematic review of other original research publications. It does not include editorials, opinion pieces, or review articles (other than systematic reviews or meta-analyses).
Review article. A nonsystematic overview of a topic is a review article. In most cases, it is not based on an exhaustive, structured review of the literature and does not evaluate the quality of included studies systematically.
Systematic reviews and meta-analyses. A systematic review is a critical assessment of existing evidence that addresses a focused clinical question, includes a comprehensive literature search, appraises the quality of studies, and reports results in a systematic manner. If the studies report comparable quantitative data and have a low degree of variation in their findings, a meta-analysis can be performed to derive a summary estimate of effect.
Most strength-of-evidence scales lack key elements
In March 2002, the Agency for Healthcare Research and Quality (AHRQ) published a report that summarized the state-of-the-art in methods of rating the strength of evidence.5 The report identified a large number of systems for rating the quality of individual studies: 20 for systematic reviews, 49 for randomized controlled trials, 19 for observational studies, and 18 for diagnostic test studies. It also identified 40 scales that graded the strength of a body of evidence consisting of 1 or more studies.
The authors of the AHRQ report proposed that any system for grading the strength of evidence should consider 3 key elements: quality, quantity, and consistency. Quality is the extent to which the identified studies minimize the opportunity for bias and is synonymous with the concept of validity. Quantity is the number of studies and subjects included in those studies. Consistency is the extent to which findings are similar between different studies on the same topic. Only 7 of the 40 systems identified and addressed all 3 elements.6-11
Strength of Recommendation Taxonomy (SORT) contains the key elements
The authors of this article represent the major family medicine journals in the United States and a large family practice academic consortium. Our process began with a series of electronic mail exchanges, was developed during a meeting of the editors, and continued through another series of electronic mail exchanges.
We decided our taxonomy for rating the strength of a recommendation should address the 3 key elements identified in the AHRQ report: quality, quantity, and consistency of evidence. We also were committed to creating a grading scale that could be applied by authors with varying degrees of expertise in evidence-based medicine and clinical epidemiology, and interpreted by physicians with little or no formal training in these areas. We believed that the taxonomy should address the issue of patientoriented evidence versus disease-oriented evidence explicitly and be consistent with the information mastery framework proposed by Slawson and Shaughnessy.2
After considering these criteria and reviewing the existing taxonomies for grading the strength of a recommendation, we decided that a new taxonomy was needed to reflect the needs of our specialty. Existing grading scales were focused on a particular kind of study (ie, prevention or treatment), were too complex, or did not take into account the type of outcome.
Our proposed taxonomy is called the Strength of Recommendations Taxonomy (SORT), and it is shown in Table 1. The taxonomy includes ratings of A, B, or C for the strength of recommendation for a body of evidence. The taxonomy also explains whether a body of evidence represents good-quality or limited-quality evidence, and whether evidence is consistent or inconsistent. The quality of individual studies is rated 1, 2, or 3; numbers are used to distinguish ratings of individual studies from the letters A, B, and C used to evaluate the strength of a recommendation based on a body of evidence. Figure 1 provides information about how to determine the strength of recommendation for management recommendations, and Figure 2 explains how to determine the level of evidence for an individual study. These 2 algorithms should be helpful to authors preparing papers for submission to family medicine journals. The algorithms are to be considered general guidelines, and special circumstances may dictate assignment of a different strength of recommendation (eg, a single, large, well-designed study in a diverse population may warrant an A-level recommendation).
Recommendations based only on improvements in surrogate or disease-oriented outcomes are always categorized as level C, because improvements in disease-oriented outcomes are not always associated with improve-ments in patient-oriented outcomes, as exemplified by several well-known findings from the medical literature. For example, doxazosin lowers blood pressure in African American patients—a seemingly beneficial outcome—but it also increases mortality.12 Similarly, encainide and flecainide reduce the incidence of arrhythmias after acute myocardial infarction, but they also increase mortality.13 Finasteride improves urinary flow rates, but it does not significantly improve urinary tract symptoms in patients with benign prostatic hypertrophy,14 while arthroscopic surgery for osteoarthritis of the knee improves the appearance of cartilage but does not reduce pain or improve joint function.15 Additional examples of clinical situations where disease-oriented evidence disagrees with patient—oriented evidence are shown in Table 2.12-24 Examples of how to apply the taxonomy are given in Table 3.
TABLE 1
How recommendations are graded for strength, and underlying individual studies are rated for quality
| In general, only key recommendations for readers require a grade of the “Strength of Recommendation.” Recommendations should be based on the highest quality evidence available. For example, vitamin E was found in some cohort studies (level 2 study quality) to have a benefit for cardiovascular protection, but good-quality randomized trials (level 1) have not confirmed this effect. Therefore, it is preferable to base clinical recommendations in a manuscript on the level 1 studies. | |||
| Strength of recommendation | Definition | ||
| A | Recommendation based on consistent and good-quality patient-oriented evidence.* | ||
| B | Recommendation based on inconsistent or limited-quality patient-oriented evidence.* | ||
| C | Recommendation based on consensus, usual practice, opinion, disease-oriented evidence,* or case series for studies of diagnosis, treatment, prevention, or screening | ||
| Use the following scheme to determine whether a study measuring patient-oriented outcomes is of good or limited quality, and whether the results are consistent or inconsistent between studies. | |||
| Study quality | Type of Study | ||
| Diagnosis | Treatment/prevention/screening | Prognosis | |
| Level 1—good-quality patient-oriented evidence | Validated clinical decision rule | SR/meta-analysis of RCTs with consistent findings | SR/meta-analysis of good-quality cohort studies |
| SR/meta-analysis of high-quality studies | High-quality individual RCT‡ All-or-none study§ | Prospective cohort study with good follow-up | |
| High-quality diagnostic cohort study† | |||
| Level 2—limited-quality patient-oriented evidence | Unvalidated clinical decision rule | SR/meta-analysis lower-quality clinical trials or of studies with inconsistent findings | SR/meta-analysis of lower-quality cohort studies or with inconsistent results |
| SR/meta-analysis of lower-quality studies or studies with inconsistent findings | Lower-quality clinical trial‡ or prospective cohort study Cohort study | Retrospective cohort study with poor follow-up | |
| Lower-quality diagnostic cohort study or diagnostic case-control study§ | Case-control study | Case-control study Case series | |
| Level 3—other evidence | Consensus guidelines, extrapolations from bench research, usual practice, opinion, other evidence disease-oriented evidence (intermediate or physiologic outcomes only), or case series for studies of diagnosis, treatment, prevention, or screening | ||
| Consistency across studies | |||
| Consistent | Most studies found similar or at least coherent conclusions (coherence means that differences are explainable); or If high-quality and up-to-date systematic reviews or meta-analyses exist, they support the recommendation | ||
| Inconsistent | Considerable variation among study findings and lack of coherence; or If high-quality and up-to-date systematic reviews or meta-analyses exist, they do not find consistent evidence in favor of the recommendation | ||
| *Patient-oriented evidence measures outcomes that matter to patients: morbidity, mortality, symptom improvement, cost reduction, and quality of life. Disease-oriented evidence measures intermediate, physiologic, or surrogate end points that may or may not reflect improvements in patient outcomes (ie, blood pressure, blood chemistry, physiologic function, and pathologic findings). | |||
| † High-quality diagnostic cohort study: cohort design, adequate size, adequate spectrum of patients, blinding, and a consistent, well-defined reference standard. | |||
| ‡ High-quality RCT: allocation concealed, blinding if possible, intention-to-treat analysis, adequate statistical power, adequate follow-up (greater than 80 percent). | |||
| § In an all-or-none study, the treatment causes a dramatic change in outcomes, such as antibiotics for meningitis or surgery for appendicitis, which precludes study in a controlled trial. | |||
| SR, systematic review; RCT, randomized controlled trial | |||
TABLE 2
Examples of inconsistency between disease-oriented and patient-oriented outcomes
| Therapy | Disease-oriented outcome | Patient-oriented outcome |
|---|---|---|
| Doxazosin for blood pressure12 | Reduces blood pressure | Increases morality in African Americans |
| Lidocaine for arrhythmia following acute myocardial infarction13 | Suppresses arrhythmias | Increases mortality |
| Finasteride for benign prostatic hypertrophy14 | Improves urinary flow rate | No clinically important change in symptom scores |
| Sleeping infants on their stomach or side16 | Knowledge of anatomy and physiology suggests that this will decrease the risk of aspiration | Increases risk of sudden infant death syndrome |
| Vitamin E for heart disease17 | Reduces levels of free radicals | No change in mortality |
| Histamine antagonists and proton pump inhibitors for nonulcer dyspepsia18 | Significantly reduces gastric pH levels | Little or no improvement in symptoms in patients with non-gastroesophageal reflux disease, nonulcer dyspepsia |
| Arthroscopic surgery for osteoarthritis of the knee15 | Improves appearance of cartilage after debridement | No change in function or symptoms at 1 year |
| Hormone therapy19 | Reduces low-density lipoprotein cholesterol, increases high-density lipoprotein cholesterol | No decrease in cardiovascular or all-cause mortality; an increase in cardiovascular events in all-cause mortality; an increase in cardiovascular events in women older than 60 years (Women’s Health Initiative) with combined hormone therapy |
| Insulin therapy in type 2 diabetes mellitus20 | Keeps blood sugar below 120 mg/dL (6.7 mmol/l) | Does not reduce overall mortality |
| Sodium fluoride for fracture prevention21 | Increases bone density | Does not reduce fracture rate |
| Lidocaine prophylaxis following acute myocardial infarction22 | Suppresses arrhythmias | Increases mortality |
| Clofibrate for hyperlipidemia23 | Reduces lipids | Does not reduce mortality |
| Beta-blockers for heart failure24 | Reduces cardiac output | Reduces mortality in moderate to severe disease |
TABLE 3
Examples of how to apply the SORT in practice
| Example 1: While a number of observational studies (level of evidence—2) suggested a cardiovascular benefit from vitamin E, a large, well-designed, randomized trial with a diverse patient population (level of evidence—1) showed the opposite. The strength of recommendation against routine, long-term use of vitamin E to prevent heart disease, based on the best available evidence, should be A. |
| Example 2: A Cochrane review finds 7 clinical trials that are consistent in their support of a mechanical intervention for low back pain, but the trials were poorly designed (ie, unblinded, nonrandomized, or with allocation to groups unconcealed). In this case, the strength of recommendation in favor of these mechanical interventions is B (consistent but lower-quality clinical trials). |
| Example 3: A meta-analysis finds 9 high-quality clinical trials of the use of a new drug in the treatment of pulmonary fibrosis. Two of the studies find harm, 2 find no benefit, and 5 show some benefit. The strength of recommendation in favor of this drug would be B (inconsistent results of good-quality, randomized controlled trials). |
| Example 4: A new drug increases the forced expiratory volume in 1 second (FEV1) and peak flow rate in patients with an acute asthma exacerbation. Data on symptom improvement is lacking. The strength of recommendation in favor of using this drug is C (disease-oriented evidence only). |
FIGURE 1
Determining the strength of a recommendation based on a body of evidence
FIGURE 2
Determining the level of evidence for an individual study
The advantages of SORT
We believe there are several advantages to our proposed taxonomy. It is straightforward and comprehensive, is easily applied by authors and physicians, and explicitly addresses the issue of patient-oriented versus disease-oriented evidence. The latter attribute distinguishes SORT from most other evidence grading scales. These strengths also create some limitations. Some clinicians may be concerned that the taxonomy is not as detailed in its assessment of study designs as others, such as that of the Centre for Evidence-Based Medicine (CEBM).25 However, the primary difference between the 2 taxonomies is that the CEBM version distinguishes between good and poor observational studies while the SORT version does not. We concluded that the advantages of a system that provides the physician with a clear recommendation that is strong (A), moderate (B), or weak (C) in its support of a particular intervention outweighs the theoretic benefit of distinguishing between lower quality and higher quality observational studies, particularly because there is no objective evidence that the latter distinction carries important differences in clinical recommendations.
Any publication applying SORT (or any other evidence-based taxonomy) should describe carefully the search process that preceded the assignment of a SORT rating. For example, authors could perform a comprehensive search of MEDLINE and the gray literature, a comprehensive search of MEDLINE alone, or a more focused search of MEDLINE plus secondary evidence-based sources of information.
Walkovers: Creating linkages with SORT
Some organizations, such as the CEBM,25 the Cochrane Collaboration,7 and the US Preventive Services Task Force (USPSTF),6 have developed their own grading scales for the strength of recommendations based on a body of evidence and are unlikely to abandon them. Other organizations, such as FPIN,26 publish their work in a variety of settings and must be able to move between taxonomies. We have developed a set of optional walkovers that suggest how authors, editors, and readers might move from 1 taxonomy to another. Walkovers for the CEBM and USPSTF taxonomies are shown in Table 4.
Many authors and experts in evidence-based medicine use the “Level of Evidence” taxonomy from the CEBM to rate the quality of individual studies.25 A walkover from the 5-level CEBM scale to the simpler 3-level SORT scale for individual studies is shown in Table 5.
TABLE 4
Suggested walkovers between taxonomies for assessing the strength of a recommendation based on a body of evidence
| SORT | CEBM | BMJ’s Clinical Evidence |
|---|---|---|
| A. Recommendation based on consistent and good-quality patient-oriented evidence | A. Consistent level 1 studies | Beneficial |
| B. Recommendation based on inconsistent or limited-quality patient-oriented evidence | B. Consistent level 2 or 3 studies or extrapolations from level 1 studies | Likely to be beneficial Likely to be ineffective or harmful (recommendation against) |
| C. Level 4 studies or extrapola-tions from level 2 or 3 studies | Unlikely to be beneficial (recommendation against) | |
| C. Recommendation based on consensus, usual practice, disease-oriented evidence, case series for studies of treatment or screening, and/on opinion | D. Level 5 evidence or troublingly inconsistent inconclusive studies of of any level | Unknown effectiveness |
| SORT, Strength of Evidence Taxonomy; CEBM, Centre for Evidence-Based Medicine; BMJ, BMJ Publishing Group. | ||
TABLE 5
Suggested walkover between CEBM and SORT for assessing the level of evidence of an individual study
| SORT | CEBM | |
|---|---|---|
| Treatment/screening | Other categories | |
| Level 1 | Levels 1a to 1c | Levels 1a to 1c |
| Level 2 | Level 2 or 3 | Levels 2 to 4 |
| Level 3 | Level 4 or 5 and any study that measures measures intermediate or surrogate outcomes | Level 5 andany study that intermediate or surrogate outcomes |
| CEBM, Centre for Evidence-Based Medicine; | ||
| SORT, Strength of Recommendation Taxonomy | ||
SORT can improve patient care
The SORT is a comprehensive taxonomy for evaluating the strength of a recommendation based on a body of evidence and the quality of an individual study. If applied consistently by authors and editors in the family medicine literature, it has the potential to make it easier for physicians to apply the results of research in their practice through the information mastery approach and to incorporate evidence-based medicine into their patient care.
Like any such grading scale, it is a work in progress. As we learn more about biases in study design, and as the authors and readers who use the taxonomy become more sophisticated about principles of information mastery, evidence-based medicine, and critical appraisal, it is likely to evolve. We remain open to suggestions from the primary care community for refining and improving SORT.
Acknowledgments
The authors thank Lee Green, MD, MPH, John Epling, MD, Kurt Stange, MD, PhD, and Margaret Gourlay, MD, for helpful comments on the manuscript. The authors indicate that they do not have any conflicts of interest. Sources of funding: none reported. This article has been simultaneously published in print and online by American Family Physician, Journal of Family Practice, Journal of the American Board of Family Practice, and online by Family Practice Inquiries Network. Copyright © 2004 American Family Physician, a publication of the American Academy of Family Physicians. All rights reserved.
1. Evidence-based medicine . A new approach to teaching the practice of medicine. JAMA 1992;268:2420-2425.
2. Slawson DC, Shaughnessy AF, Bennett JH. Becoming a medical information master: feeling good about not knowing everything. J Fam Pract 1994;38:505-513.
3. Shaughnessy AF, Slawson DC, Bennett JH. Becoming an information master: a guidebook to the medical information jungle. J Fam Pract 1994;39:489-499.
4. Siwek J, Gourlay ML, Slawson DC, Shaughnessy AF. How to write an evidence-based clinical review article. Am Fam Physician 2002;65:251-258.
5. Systems to rate the strength of scientific evidence. Summary, evidence report/technology assessment: number 47. AHRQ pub. no. 02-E015, March 2002. Agency for Healthcare Research and Quality, Rockville, Md. Available at: www.ahrq.gov/clinic/epcsums/strengthsum.htm. Accessed on November 13, 2003.
6. Harris RP, Helfand M, Woolf SH, Lohr KN, Mulrow CD, Teutsch SM, et al. Current methods of the U.S. Preventive Services Task Force: a review of the process. Am J Prev Med 2001;20(3 suppl):21-35.
7. Clarke M, Oxman AD. Cochrane reviewer’s handbook 4.0. The Cochrane Collaboration, 2003. Available at: www.cochrane.org/resources/handbook/handbook.pdf. Accessed on November 13, 2003.
8. Gyorkos TW, Tannenbaum TN, Abrahamowicz M, Oxman AD, Scott EA, Millson ME, et al. An approach to the development of practice guidelines for community health interventions. Can J Public Health 1994;85(suppl 1):S8-S13.
9. Briss PA, Zaza S, Pappaioanou M, et al. Developing an evidence-based guide to community preventive services—methods. Am J Prev Med 2000;18(1 suppl):35-43.
10. Greer N, Mosser G, Logan G, Halaas GW. A practical approach to evidence grading. Jt Comm J Qual Improv 2000;26:700-712.
11. Guyatt GH, Haynes RB, Jaeschke RZ, et al. Users’ guides to the medical literature: XXV. Evidence-based medicine: principles for applying the users’ guides to patient care. JAMA 2000;284:1290-1296.
12. Major cardiovascular events in hypertensive patients randomized to doxazosin vs chlorthalidone: the antihypertensive and lipid-lowering treatment to prevent heart attack trial (ALLHAT) JAMA 2000;283:1967-1975.
13. Echt DS, Liebson PR, Mitchell LB, et al. Mortality and morbidity in patients receiving encainide, flecainide, or placebo. N Engl J Med 1991;324:781-788.
14. Lepor H, Williford WO, Barry MJ, et al. The efficacy of terazosin, finasteride, or both in benign prostatic hyperplasia. N Engl J Med 1996;335:533-539.
15. Moseley JB, O’Malley K, Petersen NJ, et al. A controlled trial of arthroscopic surgery for osteoarthritis of the knee. N Engl J Med 2002;347:81-88.
16. Dwyer T, Ponsonby AL. Sudden infant death syndrome: after the “back to sleep” campaign. BMJ 1996;313:180-181.
17. Yusuf S, Dagenais G, Pogue J, Bosch J, Sleight P. Vitamin E supplementation and cardiovascular events in high-risk patients. N Engl J Med 2000;342:154-160.
18. Moayyedi P, Soo S, Deeks J, Delaney B, Innes M, Forman D. Pharmacological interventions for non-ulcer dyspepsia. Cochrane Database Syst Rev 2003;(1):CD001960.-
19. Rossouw JE, Anderson GL, Prentice RL, et al. Risks and benefits of estrogen plus progestin in healthy postmenopausal women: principal results from the Women’s Health Initiative randomized controlled trial. JAMA 2002;288:321-333.
20. Intensive blood-glucose control with sulphonylureas or insulin compared with conventional treatment and risk of complications in patients with type 2 diabetes (UKPDS 33). Lancet 1998;352:837-853.
21. Meunier PJ, Sebert JL, Reginster JY, et al. Fluoride salts are no better at preventing new vertebral fractures than calcium-vitamin D in postmenopausal osteoporosis: the FAVO Study. Osteoporos Int 1998;8:4-12.
22. MacMahon S, Collins R, Peto R, Koster RW, Yusuf S. Effects of prophylactic lidocaine in suspected acute myocardial infarction. An overview of results from the randomized, controlled trials. JAMA 1988;260:1910-1916.
23. Grumbach K. How effective is drug treatment of hypercholesterolemia? A guided tour of the major clinical trials for the primary care physician. J Am Board Fam Pract 1991;4:437-445.
24. Heidenreich PA, Lee TT, Massie BM. Effect of beta-blockade on mortality in patients with heart failure: a metaanalysis of randomized clinical trials. J Am Coll Cardiol 1997;30:27-34.
25. Centre for Evidence-Based Medicine. Levels of evidence and grades of recommendation. Available at: www.cebm.net/levels_of_evidence.asp. Accessed on November 13, 2003.
26. Family Practice Inquiries Network. (FPIN). Available at: www.fpin.org. Accessed on November 13, 2003.
Treating urinary incontinence in the elderly—conservative measures that work: A systematic review
- Behavioral therapy reduces urinary accidents in elderly patients with urge, stress, and mixed incontinence.
- Bladder training is helpful for urge incontinence; pelvic floor exercises are helpful for stress incontinence; both are helpful for those with mixed incontinence.
- The effect of drug therapy in the elderly is unclear, as there are only a few studies of sufficient methodological quality. However, drug therapy is less effective than behavioral therapy.
Objective: To evaluate the effectiveness of conservative treatment in the community-based elderly (aged ≥55 years) with stress, urge, and mixed urinary incontinence.
Design: Systematic review of before-after studies or randomized controlled trials on the effect of exercise and drug therapy in urinary incontinence.
Main outcomes measured: Reduction of urinary accidents, patient’s perception, cystometric measurement, perineometry, and side effects.
Search strategy: MEDLINE (1966–2001), EMBASE (1986–2001), Science Citation Index (1988–2001), The Cochrane Library, and PiCarta were searched.
Results: Four before-after studies and 4 randomized controlled trials were identified. Drug therapy alone: no study of sufficient quality. Drug therapy compared with behavioral therapy, 3 studies: bladder sphincter biofeedback reduced urinary accidents in cases of urge or mixed incontinence by 80.7%, significantly better than oxybutynin (68.5%) or placebo (39.4%). Adding drug to behavioral treatment or behavioral to drug treatment also resulted in significant reduction in urodynamic urge incontinence (57.5% – 88.5% vs 72.7 – 84.3%). Pelvic floor exercises alone reduced urinary accidents by 48% (compared with 53% for phenylpropanolamine) in patients with mixed or stress incontinence. Behavioral therapy, 5 studies: bladder-sphincter biofeedback in case of urge or mixed incontinence, bladder training in case of urge incontinence and pelvic floor exercises in case of stress incontinence reduced the urinary accidents with 68% to 94%.
Conclusion: There are only a few studies of sufficient methodological quality on the effect of conservative treatment of urinary incontinence in the elderly. Behavioral therapy reduced urinary accidents; the effect of drug therapy is unclear. We recommend behavioral therapy as first choice.
The physiologic goals of treatment are strengthening urethral resistance or reducing detrusor muscle contractions. Behavioral technique—pelvic floor exercises and bladder training with biofeedback—and pharmacotherapy are the treatments of choice for the elderly, provided it is possible to assess the likely health gains. Surgery, the most invasive and riskiest treatment, is usually a last resort.
Methods
The authors performed computerized searches of MEDLINE (1966–2001), EMBASE (1986–2001), the Science Citation Index (1988–2001), the Cochrane Library, and PiCarta. The search was limited to publications in English and Dutch. Search terms were elderly and aged combined with urinary incontinence and conservative management, conservative therapy, conservative treatment, bladder training, drug treatment, pelvic floor muscle training, behavior management, behavior therapy, and biofeedback. We supplemented this search strategy by checking articles referenced in other publications.
The titles and abstracts were then screened for the following inclusion criteria: longitudinal cohort, before-after studies or randomized controlled trials, age ≥55 years, community-dwelling population, and conservative therapy.
Stress incontinence is involuntary leakage on effort or exertion, or on sneezing or coughing. Stress incontinence may result from diminished bulk and tone of perineal tissue or weakness of the pelvic floor muscle.
Urge incontinence is involuntary leakage accompanied by or immediately preceded by urgency. Causes are “deconditioned” voiding reflexes due to chronic low-volume voiding, infection, or bladder stones.
Mixed incontinence is involuntary leakage associated with urgency and with exertion, effort, sneezing, or coughing.
The methodological quality of the selected studies was evaluated by a modified Delphi-2 scale. (This scale is available online at www.jfponline.com, as Table W1).10 Two researchers (TT, AJ) scored the studies independently; they were blinded for information on authors and journals. In cases of disagreement, the researchers met to reach consensus.
After meeting inclusion criteria, randomized controlled trials were scored from 0 to 9; before-after studies from 0 to 3. A randomized controlled trial needed a score of at least 7 to be included; a before-after studied needed a 2.5; in trials where blinding was not possible, a 4 was needed.
Results
The search yielded 157 publications; 135 studies did not meet inclusion criteria. Of the 22 remaining studies, 6 were excluded because they did not use a general population. Consequently, 16 studies were included: 6 with a before-after design and 11 randomized controlled trials.
Methodological quality
The quality scores for the 6 before-after studies ranged from 0 to 3. Two studies scored less than 2.5 and were excluded. (Information on excluded studies is available online at www.jfponline.com as Table W2.)
Quality scores for the 11 randomized controlled trials ranged from 0 to 9. Four of the 5 studies with the possibility to blind scored <7, and 3 of the 6 studies with no possibility to blind scored <4; they were excluded.11,18
Results of drug and behavioral therapy
In 3 studies, the effect of medication alone or in combination with behavioral therapy was examined (Table 1).
Biofeedback is superior. Burgio et al19 studied the effect of bladder-sphincter biofeedback vs oxybutynin and placebo in 190 women with urge or mixed incontinence. Oxybutynin is an anticholinergic drug that reduces detrusor muscle contractions. Anorectal biofeedback helped patients sense pelvic muscles and taught them how to contract and relax these muscles selectively while keeping abdominal muscles relaxed. Patients were taught not to rush to the toilet as a response to the bladder sensation but relax the whole body and contract the pelvic floor. The reduction of urinary accidents in the daily bladder report was significant. This effect was significantly better in the bladder-sphincter biofeedback group compared with the drug group; the drug group had results significantly better than the placebo group.
Success with augmented therapies. Subsequently, researchers offered the patients who were not completely dry to participate in an extension study, which added drug therapy for those in the behavioral therapy group and vice-versa.20 Thirty-five women participated in this study. Both groups had additional significant reductions in urinary accidents as documented in the bladder diary.
Pelvic floor exercises helpful. Wells et al21 compared 6 months of pelvic floor exercises without biofeedback with 2 weeks of phenylpropanolamine hydrochloride, an alpha-adrenergic agonist. (Note that in the US this product has been taken off the market.) Alpha-adrenergic agents stimulate the receptor located in the urethra, increasing urethral pressure. The subjects were 115 women with urodynamic mixed or stress incontinence.
The reduction in urinary accidents was similar in both groups—48% and 53%, respectively. Also the subjective improvement was similar. Only the digital test of pelvic floor muscle strength was significantly better in the pelvic floor exercise group.
TABLE 1
Effect of medication and exercises on urinary incontinence in the elderly
| Study, quality scores | N*, (drop-outs) | Population, age (mean, SD) | Definition of incontinence | Intervention and duration (design) | Measurements and outcomes† |
|---|---|---|---|---|---|
| Burgio19 (1998), 7.5/7 | 190 (7) | General, 55–92 (69.3 ± 7.9) | At least 2 urge accidents per week for 3 months (urodynamic predominant UI) | Bladder-sphincter bio-feedback twice weekly; 2.5 mg oxybutynin 3 times daily; placebo weeks (RCT) |
|
| Burgio20 (2000), 3/3 | 35 (0) | Subjects not dry or not satisfied after 1 intervention (1998 study), 55–91 (67.7 ± 7.5) | Not given | If behavorial training alone in 1998 study, added drug therapy; if drug therapy alone in study, added behavorial therapy for 8 weeks (B-A) |
|
| Wells21 (1991), 3.5/3 | 115 (38) | Open population, 55–66 (66 ± 8) | Urinary loss of any degree (urodynamic SI, UI, or MI) | PFE for 6 months or 100 mg/d for 2 weeks (RCT) |
|
| * N includes no men | |||||
| † Measurements and outcomes are: | |||||
| |||||
| SD, standard deviation; SI, stress incontinence; UI, urge incontinence; MI, mixed incontinence; RCT, randomized controlled trial; B-A, before-after; PFE, pelvic floor exercise; PPA, phenylpropanolamine | |||||
Results of behavioral therapy only
Five studies focused on the effect of behavioral therapy only (Table 2). Three surveys studied the effect of bladder-sphincter biofeedback, 1 the effect of bladder training without biofeedback, and 1 the effect of pelvic floor exercises with biofeedback.
McDowell et al22,23 used anorectal biofeedback, demonstrating the abdominal pressure and pelvic floor activity to teach patients to relax abdominal muscles selectively and contract/relax the pelvic floor in case of stress, urge, and mixed incontinence. The home exercises consisted of 10 to 15 contractions of the pelvic floor muscles for 10 seconds, followed by an equal period of relaxation in a lying, standing, and sitting position 3 times a day.
They also taught urge strategies. Patients were taught not to rush to the toilet but to relax the whole body, contract the pelvic floor, and increase their voiding interval until they achieved an interval of 2 to 3 hours.
In Burgio et al,24 researchers filled the bladder after voiding; this taught patients to be aware of bladder contractions before they felt any bladder sensation, and to relax the abdominal muscles, contract the pelvic floor, and try to diminish the bladder pressure.
The conclusion of all 3 studies was that bladder-sphincter biofeedback reduced the urinary accidents for stress, urge, and mixed incontinence significantly.
Fantl et al25 examined the effect of bladder training in 123 women with urge incontinence. They were asked to increase their voiding interval until a schedule of once every 3 hours was achieved, or they were admitted to a control group without intervention. Bladder training reduced the urinary accidents significantly for all 3 types of urinary incontinence.
Baigis-Smith et al26 investigated the influence of behavioral intervention in 54 patients who received pelvic floor biofeedback without measuring the abdominal pressure as in previous studies. Patients had to relax and contract their pelvic floor 50 times for 10 seconds, 3 times a day, until they experienced improvement. The number of urinary accidents reduced from 17.4 times a week to 4.2 times a week for stress, urge, and mixed incontinence.
TABLE 2
Effect of behavioral therapy in the elderly with urinary incontinence
| Study, quality scores | N* (% men), dropouts | Population, age UI (mean, SD) | Definition of (type of incontinence | Intervention + duration of intervention (design) | Measurements and outcomes† |
|---|---|---|---|---|---|
| Baigis-Smith26 (1989), 3/3 | 54 (17%), 0 | General population 60–86 (74.4 ± 7.2) | At least once every 2 weeks (SI, UI, MI by history) | PFE and bio-feedback until improvement (B–A) |
|
| Burgio24 (1985), 3/2.5 | 39 (23%) 0 | General population, 65–86 (74.4 ± 7.2) | At least once a month (urodynamic SI, UI, DI) | Bladder and sphincter biofeed-back 2–4 times weekly, 1–8 ses-sions depending on progress (B–A) |
|
| Fantl25 (1991), 4.5/4.5 | 123 (0%) 0 | General population, 55–90 (67 ± 8) | Not given (urodynamic UI, SI, or MI) | Bladder training/control for 6 weeks (RCT) |
|
| McDowell22 (1992), 3/3 | 29 (7%), 18 | Self-referred to incontinence program or referred by physicians/geeriatricians, 56–90 (74.6 ± 8.1) | At least once every 2 weeks for at least 3 months (SI, UI, MI in bladder diary) | Bladder-sphincter biofeedback twice weekly, duration depanding on the patient’s progress and abilities,average 5.6 sessions (B-A) |
|
| McDowell23 (1999), 5/5 | 93 (10%), 10 | Individuals with incontinence were identified from 2 large HHA and asked to par-ticipate, 60–97 (76.7 ± 7.2) | At least twice a week for at least 3 months (SI, UI, MI in bladder diary) | Bladder-sphincter biofeedback weekly/placebo (crossover) for 8 weeks (RCT) |
|
| * N = number of completers | |||||
† Measurements and outcomes are:
| |||||
| SD, standard deviation; SI, stress incontinence; UI, urge incontinence; MI, mixed incontinence; B-A, before-after; RCT, randomized controlled trial; PFE, pelvic floor exercise; HHA, home health agency | |||||
Discussion
Conservative therapy effective
This review discusses 3 types of behavioral therapy for urinary incontinence: bladder training for urge incontinence (sometimes in combination with pelvic floor exercises), pelvic floor exercises for stress incontinence, and both for mixed incontinence. All 3 types of behavioral therapy reduced urinary accidents in the elderly.
Remarkable is the conclusion of Fantl et al25 that bladder training is also effective for stress incontinence alone. In almost all previous studies on the effectiveness of bladder training, patients with stress incontinence were excluded. More research is needed before we can recommend this therapy for stress incontinence.
Few studies met our methodological quality criteria. The selected studies were difficult to compare because of differences in treatment, methods, and outcomes. For that reason, more research with standardized outcome measures can help establish the relative effectiveness of behavioral therapy—with or without biofeedback—and to evaluate the effect of each therapy in different types of incontinence.
We found 2 methodologically good surveys about the effect of pharmacotherapy in elderly with urinary incontinence. Just 1 study focused on the effect of anticholinergic agents on urge incontinence and mixed incontinence; it found these agents less efficacious than behavioral therapy but better than placebo.
We also found 1 study on alpha-adrenergic agents for stress or mixed incontinence—their ability to reduce urinary accidents seemed comparable with pelvic floor exercise. The weakness of this study was the lack of a control group.
It was remarkable, however, that pelvic floor exercise was less efficacious compared with the other studies. We need more doubleblinded randomized controlled trials to prove clinical efficacy of pharmacology in the elderly with urinary incontinence. In studies with a younger population, anticholinergic agents seem to be effective for urge incontinence, but the effect of adrenergic agents in a younger population is unclear, and has never been investigated in men.27-29
Conclusion
Conservative therapy is effective for elderly patients with stress, urge, or mixed incontinence. Given the effectiveness of behavioral therapy, the absence of the side effects, and its low cost and ease of practice at home, we recommend it as the therapy of choice for urge incontinence in the elderly. We propose pharmacotherapy as second-line therapy for urge incontinence. Surgical treatment should be reserved for those who doo not respond to either of these.
Given the success posible with conservative measures, physicians should routinely ask elderly patients about incontinence.
Corresponding author
Prof. Dr. A.L.M Lagro-Janssen, Department of General Practice and Social Medicine, Nijmegen University, HSV 229, Postbus 9101, 6500 HB Nijmegen, The Netherlands. E-mail: [email protected].
1. Valk M. Urinary incontinence in psychogeriatric nursing home patients. Concept, causes and prevalence. A literature overview [dissertation]. Utrecht: University of Utrecht, 1999.
2. Brocklehurst JC. Urinary incontinence in the community-analysis of a MORI poll. BMJ 1993;306:832-834.
3. Manfrey SJ, Finklestein LH. Treatment of urinary incontinence in the geriatric patient. JAMA 1982;81:691-696.
4. Ouslander JE, Kare RL, Abrass IB. Urinary incontinence in nursing home patients. JAMA 1982;248:1194-1198.
5. Ouslander JE, Karw RL. The cost of urinary incontinence in nursing homes. Med Care 1984;22:69-79.
6. Robinson D, Pearce KF, Preissen JS, Dugan E, Suggs PK, Cohen SJ. Relationship between patient report of urinary incontinence symptoms and quality of life measures. Obstet Gynecol 1998;91:224-228.
7. Simeonova Z, Milson I, Kullendorff AM, Molander U, Bengtsoon C. The prevalence of urinary incontinence and its influence on the quality of life in women from urban Swedish population. Acta Obstet Gynecol Scan 1999;78:546-551.
8. Burgio KL, Ives DG, Locher JC, Arena VC, Kuller LH. Tretament seeking for urinary incontinence in older adults. J Am Geriatr Soc 1994;42:208-212.
9. Goldstein M, Hawthorne ME, Engberg S, et al. Urinary incontinence: Why people do not seek treatment. J Gerontol Nurs 1992;18:15-20.
10. Verhagen AP, Vet de HC, Bie de RA, et al. The Delphi List: A criteria list for quality assessment of randomized clinical trials for conducting systematic reviews developed by Delphi Consensus. J Clin Epidemiol 1998;51:1235-1241.
11. Bear M, Dwyer JW, Benveneste D, Jett K, Dougherty M. Home based management of urinary incontinence: a pilot study with both frail and independent elders. J Wound Ostomy 1997;24:163-171.
12. Burns PA, Pranikoff K, Nochajski TH, Hadley EC, Levy KJ, Ory MG. A comparison of effectiveness of biofeedback and pelvic muscle exercise treatment of stress incontinence in older community-dwelling women. J Gerontol 1993;48:M167-M174.
13. Burton JR, Pearce KL, Burgio LK, Engel BT, Whitehead WE. Behavioral training for urinary incontinence in elderly ambulatory patients. J Am Geriatr Soc 1988;36:693-698.
14. Molander U, Mislon I, Ekelund P, Arvidsson L, Eriksson O. A health care program for the investigation and treatment of elderly women with urinary incontinence and related urogenital symptoms. Acta Obstet Gynecol Scand 1991;70:137-142.
15. Ouslander JG. Effects of Terodiline on urinary incontinence among older non-institutionalized women. J Am Geriatr Soc 1993;41:915-922.
16. Szonyi G, Collas DM, Ding YY, Malone-Lee JG. Oxybutynin with bladder retraining for detrusor instability in elderly people: a randomized trial. Age Ageing 1995;24:287-291.
17. Tapp AJ, Cardozo LD, Versi E, Cooper D. The treatment of detrusor instability in post-meopausal women with oxybutynin chloride: a double blind placebo controlled study. Br J Obstet Gynaecol 1990;97:521-526.
18. Walter S, Hansen J, Hansen L, Maegaard E, Meyhoff HH, Nordling J. Urinary incontinence in old age. A controlled clinical trail of emepronium bromide. Br J Urol 1982;54:249-251.
19. Burgio KL, Locher JL, Goode PS, et al. Behavioral vs drug treatment for urge urinary incontinence in older women: a randomized controlled trial. JAMA 1998;280:1995-2000.
20. Burgio KL, Locher JL, Goode PS. Combined behavioral and drug therapy for urge incontinence in older women. J Am Geriatr Soc 2000;48:370-374.
21. Wells TJ, Brink CA, Diokno AC, Wolfe R, Gillis GL. Pelvic muscle exercise for stress urinary incontinence in elderly women. J Am Geriatr Soc 1991;39:785-791.
22. McDowell BJ, Burgio KL, Dombrowski M, Locher JL, Rodriguez E. An interdisciplinary approach to the assessment and behavioral treatment of urinary incontinence in geriatric outpatients. Am Geriatr Soc 1992;40:370-374.
23. McDowell BJ, Engberg S, Sereika S, et al. Effectiveness of behavioral therapy to treat incontinence in homebound older adults. J Am Geriatr Soc 1999;47:309-318.
24. Burgio KL, Whitehead WE, Engel BT. Urinary incontinence in the elderly. Bladder-sphincter biofeedback and toileting skills training. Ann Intern Med 1985;103:507-515.
25. Fantl JA, Wyman JF, McClish DK, et al. Efficacy of bladder training in older women with urinary incontinence. JAMA 1991;265:609-613.
26. Baigis-Smith J, Smith DA, Rose M, Newman DK. Managing urinary incontinence in community-residing elderly persons. Gerontologist 1989;29:229-233.
27. Herbison P, Hay-Smith J, Ellis G, Moore K. Effectiveness of anticholinergic drugs compared with placebo in the treatment of overactive bladder: systematic review. Br Med J 2003;326:841-844.
28. Alhasso A, Glazener CMA, Pickard R, N’Dow J. Adrenergic drugs for urinary incontinence in aldults (Cochrane Review). In: The Cochrane Library., Issue 2, 2003. Oxford: Update Software.
29. Hay-Smith J, Herbison P, Ellis G, Moore K. Anticholinergic drugs versus placebo for overactive bladder syndrome in adults (Cochrane Review). In: The Cochrane Library., Issue 2, 2003. Oxford: Update Software.
- Behavioral therapy reduces urinary accidents in elderly patients with urge, stress, and mixed incontinence.
- Bladder training is helpful for urge incontinence; pelvic floor exercises are helpful for stress incontinence; both are helpful for those with mixed incontinence.
- The effect of drug therapy in the elderly is unclear, as there are only a few studies of sufficient methodological quality. However, drug therapy is less effective than behavioral therapy.
Objective: To evaluate the effectiveness of conservative treatment in the community-based elderly (aged ≥55 years) with stress, urge, and mixed urinary incontinence.
Design: Systematic review of before-after studies or randomized controlled trials on the effect of exercise and drug therapy in urinary incontinence.
Main outcomes measured: Reduction of urinary accidents, patient’s perception, cystometric measurement, perineometry, and side effects.
Search strategy: MEDLINE (1966–2001), EMBASE (1986–2001), Science Citation Index (1988–2001), The Cochrane Library, and PiCarta were searched.
Results: Four before-after studies and 4 randomized controlled trials were identified. Drug therapy alone: no study of sufficient quality. Drug therapy compared with behavioral therapy, 3 studies: bladder sphincter biofeedback reduced urinary accidents in cases of urge or mixed incontinence by 80.7%, significantly better than oxybutynin (68.5%) or placebo (39.4%). Adding drug to behavioral treatment or behavioral to drug treatment also resulted in significant reduction in urodynamic urge incontinence (57.5% – 88.5% vs 72.7 – 84.3%). Pelvic floor exercises alone reduced urinary accidents by 48% (compared with 53% for phenylpropanolamine) in patients with mixed or stress incontinence. Behavioral therapy, 5 studies: bladder-sphincter biofeedback in case of urge or mixed incontinence, bladder training in case of urge incontinence and pelvic floor exercises in case of stress incontinence reduced the urinary accidents with 68% to 94%.
Conclusion: There are only a few studies of sufficient methodological quality on the effect of conservative treatment of urinary incontinence in the elderly. Behavioral therapy reduced urinary accidents; the effect of drug therapy is unclear. We recommend behavioral therapy as first choice.
The physiologic goals of treatment are strengthening urethral resistance or reducing detrusor muscle contractions. Behavioral technique—pelvic floor exercises and bladder training with biofeedback—and pharmacotherapy are the treatments of choice for the elderly, provided it is possible to assess the likely health gains. Surgery, the most invasive and riskiest treatment, is usually a last resort.
Methods
The authors performed computerized searches of MEDLINE (1966–2001), EMBASE (1986–2001), the Science Citation Index (1988–2001), the Cochrane Library, and PiCarta. The search was limited to publications in English and Dutch. Search terms were elderly and aged combined with urinary incontinence and conservative management, conservative therapy, conservative treatment, bladder training, drug treatment, pelvic floor muscle training, behavior management, behavior therapy, and biofeedback. We supplemented this search strategy by checking articles referenced in other publications.
The titles and abstracts were then screened for the following inclusion criteria: longitudinal cohort, before-after studies or randomized controlled trials, age ≥55 years, community-dwelling population, and conservative therapy.
Stress incontinence is involuntary leakage on effort or exertion, or on sneezing or coughing. Stress incontinence may result from diminished bulk and tone of perineal tissue or weakness of the pelvic floor muscle.
Urge incontinence is involuntary leakage accompanied by or immediately preceded by urgency. Causes are “deconditioned” voiding reflexes due to chronic low-volume voiding, infection, or bladder stones.
Mixed incontinence is involuntary leakage associated with urgency and with exertion, effort, sneezing, or coughing.
The methodological quality of the selected studies was evaluated by a modified Delphi-2 scale. (This scale is available online at www.jfponline.com, as Table W1).10 Two researchers (TT, AJ) scored the studies independently; they were blinded for information on authors and journals. In cases of disagreement, the researchers met to reach consensus.
After meeting inclusion criteria, randomized controlled trials were scored from 0 to 9; before-after studies from 0 to 3. A randomized controlled trial needed a score of at least 7 to be included; a before-after studied needed a 2.5; in trials where blinding was not possible, a 4 was needed.
Results
The search yielded 157 publications; 135 studies did not meet inclusion criteria. Of the 22 remaining studies, 6 were excluded because they did not use a general population. Consequently, 16 studies were included: 6 with a before-after design and 11 randomized controlled trials.
Methodological quality
The quality scores for the 6 before-after studies ranged from 0 to 3. Two studies scored less than 2.5 and were excluded. (Information on excluded studies is available online at www.jfponline.com as Table W2.)
Quality scores for the 11 randomized controlled trials ranged from 0 to 9. Four of the 5 studies with the possibility to blind scored <7, and 3 of the 6 studies with no possibility to blind scored <4; they were excluded.11,18
Results of drug and behavioral therapy
In 3 studies, the effect of medication alone or in combination with behavioral therapy was examined (Table 1).
Biofeedback is superior. Burgio et al19 studied the effect of bladder-sphincter biofeedback vs oxybutynin and placebo in 190 women with urge or mixed incontinence. Oxybutynin is an anticholinergic drug that reduces detrusor muscle contractions. Anorectal biofeedback helped patients sense pelvic muscles and taught them how to contract and relax these muscles selectively while keeping abdominal muscles relaxed. Patients were taught not to rush to the toilet as a response to the bladder sensation but relax the whole body and contract the pelvic floor. The reduction of urinary accidents in the daily bladder report was significant. This effect was significantly better in the bladder-sphincter biofeedback group compared with the drug group; the drug group had results significantly better than the placebo group.
Success with augmented therapies. Subsequently, researchers offered the patients who were not completely dry to participate in an extension study, which added drug therapy for those in the behavioral therapy group and vice-versa.20 Thirty-five women participated in this study. Both groups had additional significant reductions in urinary accidents as documented in the bladder diary.
Pelvic floor exercises helpful. Wells et al21 compared 6 months of pelvic floor exercises without biofeedback with 2 weeks of phenylpropanolamine hydrochloride, an alpha-adrenergic agonist. (Note that in the US this product has been taken off the market.) Alpha-adrenergic agents stimulate the receptor located in the urethra, increasing urethral pressure. The subjects were 115 women with urodynamic mixed or stress incontinence.
The reduction in urinary accidents was similar in both groups—48% and 53%, respectively. Also the subjective improvement was similar. Only the digital test of pelvic floor muscle strength was significantly better in the pelvic floor exercise group.
TABLE 1
Effect of medication and exercises on urinary incontinence in the elderly
| Study, quality scores | N*, (drop-outs) | Population, age (mean, SD) | Definition of incontinence | Intervention and duration (design) | Measurements and outcomes† |
|---|---|---|---|---|---|
| Burgio19 (1998), 7.5/7 | 190 (7) | General, 55–92 (69.3 ± 7.9) | At least 2 urge accidents per week for 3 months (urodynamic predominant UI) | Bladder-sphincter bio-feedback twice weekly; 2.5 mg oxybutynin 3 times daily; placebo weeks (RCT) |
|
| Burgio20 (2000), 3/3 | 35 (0) | Subjects not dry or not satisfied after 1 intervention (1998 study), 55–91 (67.7 ± 7.5) | Not given | If behavorial training alone in 1998 study, added drug therapy; if drug therapy alone in study, added behavorial therapy for 8 weeks (B-A) |
|
| Wells21 (1991), 3.5/3 | 115 (38) | Open population, 55–66 (66 ± 8) | Urinary loss of any degree (urodynamic SI, UI, or MI) | PFE for 6 months or 100 mg/d for 2 weeks (RCT) |
|
| * N includes no men | |||||
| † Measurements and outcomes are: | |||||
| |||||
| SD, standard deviation; SI, stress incontinence; UI, urge incontinence; MI, mixed incontinence; RCT, randomized controlled trial; B-A, before-after; PFE, pelvic floor exercise; PPA, phenylpropanolamine | |||||
Results of behavioral therapy only
Five studies focused on the effect of behavioral therapy only (Table 2). Three surveys studied the effect of bladder-sphincter biofeedback, 1 the effect of bladder training without biofeedback, and 1 the effect of pelvic floor exercises with biofeedback.
McDowell et al22,23 used anorectal biofeedback, demonstrating the abdominal pressure and pelvic floor activity to teach patients to relax abdominal muscles selectively and contract/relax the pelvic floor in case of stress, urge, and mixed incontinence. The home exercises consisted of 10 to 15 contractions of the pelvic floor muscles for 10 seconds, followed by an equal period of relaxation in a lying, standing, and sitting position 3 times a day.
They also taught urge strategies. Patients were taught not to rush to the toilet but to relax the whole body, contract the pelvic floor, and increase their voiding interval until they achieved an interval of 2 to 3 hours.
In Burgio et al,24 researchers filled the bladder after voiding; this taught patients to be aware of bladder contractions before they felt any bladder sensation, and to relax the abdominal muscles, contract the pelvic floor, and try to diminish the bladder pressure.
The conclusion of all 3 studies was that bladder-sphincter biofeedback reduced the urinary accidents for stress, urge, and mixed incontinence significantly.
Fantl et al25 examined the effect of bladder training in 123 women with urge incontinence. They were asked to increase their voiding interval until a schedule of once every 3 hours was achieved, or they were admitted to a control group without intervention. Bladder training reduced the urinary accidents significantly for all 3 types of urinary incontinence.
Baigis-Smith et al26 investigated the influence of behavioral intervention in 54 patients who received pelvic floor biofeedback without measuring the abdominal pressure as in previous studies. Patients had to relax and contract their pelvic floor 50 times for 10 seconds, 3 times a day, until they experienced improvement. The number of urinary accidents reduced from 17.4 times a week to 4.2 times a week for stress, urge, and mixed incontinence.
TABLE 2
Effect of behavioral therapy in the elderly with urinary incontinence
| Study, quality scores | N* (% men), dropouts | Population, age UI (mean, SD) | Definition of (type of incontinence | Intervention + duration of intervention (design) | Measurements and outcomes† |
|---|---|---|---|---|---|
| Baigis-Smith26 (1989), 3/3 | 54 (17%), 0 | General population 60–86 (74.4 ± 7.2) | At least once every 2 weeks (SI, UI, MI by history) | PFE and bio-feedback until improvement (B–A) |
|
| Burgio24 (1985), 3/2.5 | 39 (23%) 0 | General population, 65–86 (74.4 ± 7.2) | At least once a month (urodynamic SI, UI, DI) | Bladder and sphincter biofeed-back 2–4 times weekly, 1–8 ses-sions depending on progress (B–A) |
|
| Fantl25 (1991), 4.5/4.5 | 123 (0%) 0 | General population, 55–90 (67 ± 8) | Not given (urodynamic UI, SI, or MI) | Bladder training/control for 6 weeks (RCT) |
|
| McDowell22 (1992), 3/3 | 29 (7%), 18 | Self-referred to incontinence program or referred by physicians/geeriatricians, 56–90 (74.6 ± 8.1) | At least once every 2 weeks for at least 3 months (SI, UI, MI in bladder diary) | Bladder-sphincter biofeedback twice weekly, duration depanding on the patient’s progress and abilities,average 5.6 sessions (B-A) |
|
| McDowell23 (1999), 5/5 | 93 (10%), 10 | Individuals with incontinence were identified from 2 large HHA and asked to par-ticipate, 60–97 (76.7 ± 7.2) | At least twice a week for at least 3 months (SI, UI, MI in bladder diary) | Bladder-sphincter biofeedback weekly/placebo (crossover) for 8 weeks (RCT) |
|
| * N = number of completers | |||||
† Measurements and outcomes are:
| |||||
| SD, standard deviation; SI, stress incontinence; UI, urge incontinence; MI, mixed incontinence; B-A, before-after; RCT, randomized controlled trial; PFE, pelvic floor exercise; HHA, home health agency | |||||
Discussion
Conservative therapy effective
This review discusses 3 types of behavioral therapy for urinary incontinence: bladder training for urge incontinence (sometimes in combination with pelvic floor exercises), pelvic floor exercises for stress incontinence, and both for mixed incontinence. All 3 types of behavioral therapy reduced urinary accidents in the elderly.
Remarkable is the conclusion of Fantl et al25 that bladder training is also effective for stress incontinence alone. In almost all previous studies on the effectiveness of bladder training, patients with stress incontinence were excluded. More research is needed before we can recommend this therapy for stress incontinence.
Few studies met our methodological quality criteria. The selected studies were difficult to compare because of differences in treatment, methods, and outcomes. For that reason, more research with standardized outcome measures can help establish the relative effectiveness of behavioral therapy—with or without biofeedback—and to evaluate the effect of each therapy in different types of incontinence.
We found 2 methodologically good surveys about the effect of pharmacotherapy in elderly with urinary incontinence. Just 1 study focused on the effect of anticholinergic agents on urge incontinence and mixed incontinence; it found these agents less efficacious than behavioral therapy but better than placebo.
We also found 1 study on alpha-adrenergic agents for stress or mixed incontinence—their ability to reduce urinary accidents seemed comparable with pelvic floor exercise. The weakness of this study was the lack of a control group.
It was remarkable, however, that pelvic floor exercise was less efficacious compared with the other studies. We need more doubleblinded randomized controlled trials to prove clinical efficacy of pharmacology in the elderly with urinary incontinence. In studies with a younger population, anticholinergic agents seem to be effective for urge incontinence, but the effect of adrenergic agents in a younger population is unclear, and has never been investigated in men.27-29
Conclusion
Conservative therapy is effective for elderly patients with stress, urge, or mixed incontinence. Given the effectiveness of behavioral therapy, the absence of the side effects, and its low cost and ease of practice at home, we recommend it as the therapy of choice for urge incontinence in the elderly. We propose pharmacotherapy as second-line therapy for urge incontinence. Surgical treatment should be reserved for those who doo not respond to either of these.
Given the success posible with conservative measures, physicians should routinely ask elderly patients about incontinence.
Corresponding author
Prof. Dr. A.L.M Lagro-Janssen, Department of General Practice and Social Medicine, Nijmegen University, HSV 229, Postbus 9101, 6500 HB Nijmegen, The Netherlands. E-mail: [email protected].
1. Valk M. Urinary incontinence in psychogeriatric nursing home patients. Concept, causes and prevalence. A literature overview [dissertation]. Utrecht: University of Utrecht, 1999.
2. Brocklehurst JC. Urinary incontinence in the community-analysis of a MORI poll. BMJ 1993;306:832-834.
3. Manfrey SJ, Finklestein LH. Treatment of urinary incontinence in the geriatric patient. JAMA 1982;81:691-696.
4. Ouslander JE, Kare RL, Abrass IB. Urinary incontinence in nursing home patients. JAMA 1982;248:1194-1198.
5. Ouslander JE, Karw RL. The cost of urinary incontinence in nursing homes. Med Care 1984;22:69-79.
6. Robinson D, Pearce KF, Preissen JS, Dugan E, Suggs PK, Cohen SJ. Relationship between patient report of urinary incontinence symptoms and quality of life measures. Obstet Gynecol 1998;91:224-228.
7. Simeonova Z, Milson I, Kullendorff AM, Molander U, Bengtsoon C. The prevalence of urinary incontinence and its influence on the quality of life in women from urban Swedish population. Acta Obstet Gynecol Scan 1999;78:546-551.
8. Burgio KL, Ives DG, Locher JC, Arena VC, Kuller LH. Tretament seeking for urinary incontinence in older adults. J Am Geriatr Soc 1994;42:208-212.
9. Goldstein M, Hawthorne ME, Engberg S, et al. Urinary incontinence: Why people do not seek treatment. J Gerontol Nurs 1992;18:15-20.
10. Verhagen AP, Vet de HC, Bie de RA, et al. The Delphi List: A criteria list for quality assessment of randomized clinical trials for conducting systematic reviews developed by Delphi Consensus. J Clin Epidemiol 1998;51:1235-1241.
11. Bear M, Dwyer JW, Benveneste D, Jett K, Dougherty M. Home based management of urinary incontinence: a pilot study with both frail and independent elders. J Wound Ostomy 1997;24:163-171.
12. Burns PA, Pranikoff K, Nochajski TH, Hadley EC, Levy KJ, Ory MG. A comparison of effectiveness of biofeedback and pelvic muscle exercise treatment of stress incontinence in older community-dwelling women. J Gerontol 1993;48:M167-M174.
13. Burton JR, Pearce KL, Burgio LK, Engel BT, Whitehead WE. Behavioral training for urinary incontinence in elderly ambulatory patients. J Am Geriatr Soc 1988;36:693-698.
14. Molander U, Mislon I, Ekelund P, Arvidsson L, Eriksson O. A health care program for the investigation and treatment of elderly women with urinary incontinence and related urogenital symptoms. Acta Obstet Gynecol Scand 1991;70:137-142.
15. Ouslander JG. Effects of Terodiline on urinary incontinence among older non-institutionalized women. J Am Geriatr Soc 1993;41:915-922.
16. Szonyi G, Collas DM, Ding YY, Malone-Lee JG. Oxybutynin with bladder retraining for detrusor instability in elderly people: a randomized trial. Age Ageing 1995;24:287-291.
17. Tapp AJ, Cardozo LD, Versi E, Cooper D. The treatment of detrusor instability in post-meopausal women with oxybutynin chloride: a double blind placebo controlled study. Br J Obstet Gynaecol 1990;97:521-526.
18. Walter S, Hansen J, Hansen L, Maegaard E, Meyhoff HH, Nordling J. Urinary incontinence in old age. A controlled clinical trail of emepronium bromide. Br J Urol 1982;54:249-251.
19. Burgio KL, Locher JL, Goode PS, et al. Behavioral vs drug treatment for urge urinary incontinence in older women: a randomized controlled trial. JAMA 1998;280:1995-2000.
20. Burgio KL, Locher JL, Goode PS. Combined behavioral and drug therapy for urge incontinence in older women. J Am Geriatr Soc 2000;48:370-374.
21. Wells TJ, Brink CA, Diokno AC, Wolfe R, Gillis GL. Pelvic muscle exercise for stress urinary incontinence in elderly women. J Am Geriatr Soc 1991;39:785-791.
22. McDowell BJ, Burgio KL, Dombrowski M, Locher JL, Rodriguez E. An interdisciplinary approach to the assessment and behavioral treatment of urinary incontinence in geriatric outpatients. Am Geriatr Soc 1992;40:370-374.
23. McDowell BJ, Engberg S, Sereika S, et al. Effectiveness of behavioral therapy to treat incontinence in homebound older adults. J Am Geriatr Soc 1999;47:309-318.
24. Burgio KL, Whitehead WE, Engel BT. Urinary incontinence in the elderly. Bladder-sphincter biofeedback and toileting skills training. Ann Intern Med 1985;103:507-515.
25. Fantl JA, Wyman JF, McClish DK, et al. Efficacy of bladder training in older women with urinary incontinence. JAMA 1991;265:609-613.
26. Baigis-Smith J, Smith DA, Rose M, Newman DK. Managing urinary incontinence in community-residing elderly persons. Gerontologist 1989;29:229-233.
27. Herbison P, Hay-Smith J, Ellis G, Moore K. Effectiveness of anticholinergic drugs compared with placebo in the treatment of overactive bladder: systematic review. Br Med J 2003;326:841-844.
28. Alhasso A, Glazener CMA, Pickard R, N’Dow J. Adrenergic drugs for urinary incontinence in aldults (Cochrane Review). In: The Cochrane Library., Issue 2, 2003. Oxford: Update Software.
29. Hay-Smith J, Herbison P, Ellis G, Moore K. Anticholinergic drugs versus placebo for overactive bladder syndrome in adults (Cochrane Review). In: The Cochrane Library., Issue 2, 2003. Oxford: Update Software.
Screening accuracy for late-life depression in primary care: A systematic review
Objective: To determine the accuracy of depression screening instruments for older adults in primary care.
Study Design: Systematic review
Data Sources: MEDLINE, PsycINFO (search dates 1966 to January 2002), and the Cochrane database on depression, anxiety and neurosis. We also searched the second Guide to Clinical Preventive Services, the 1993 Agency for Health Care Policy and Research Clinical Practice Guideline on Depression, and recent systematic reviews. Hand-checking of bibliographies and extensive peer review were also used to identify potential articles.
Outcomes Measured: A predefined search strategy targeted only studies of adults aged 65 years or older in primary care or community settings, including long-term care. Articles were included in this review if they reported original data and tested depression screening instruments against a criterion standard, yielding sensitivity and specificity.
Results: Eighteen articles met criteria and are included in this review, representing 9 different screening instruments. The most commonly evaluated were the Geriatric Depression Scale (30-and 15-item versions), the Center for Epidemiologic Studies Depression Scale, and the SelfCARE(D). Differences in the performance of these 3 instruments were minimal; sensitivities ranged from 74% to 100% and specificities ranged from 53% to 98%.
Conclusions: Accurate and feasible screening instruments are available for detecting late-life depression in primary care. More research is needed to determine the accuracy of depression screening instruments for demented individuals, and for those with subthreshold depressive disorders.
When depression is detected and treated in older patients, not only do symptoms subside, but behavior, cognitive functioning, and overall quality of life improve.1 We conducted a systematic review to determine the accuracy of instruments for detecting unrecognized late-life depression in the primary care setting. Several instruments are comparable in sensitivity and specificity, though the 15-item Geriatric Depression Scale is particularly useful in the primary care setting.
Search methods
As a part of a broader review for the US Preventive Services Task Force and the Research Triangle Institute–University of North Carolina at Chapel Hill Evidence-Based Practice Center, we prepared a strategy to identify articles relevant to the accuracy of depression screening instruments for older adults in the primary care setting. We searched for articles in MEDLINE, PsycINFO (search dates 1966 to January 2002), and the Cochrane database on depression, anxiety, and neurosis. We also searched the second Guide to Clinical Preventive Services,2 the 1993 Agency for Health Care Policy and Research (AHCPR) Clinical Practice Guideline on Depression, and recent systematic reviews.3 We also hand-checked bibliographies and used extensive peer review to identify potential articles.
We used the search terms depression, depressive disorder, mass screening, sensitivity and specificity, reproducibility of results, primary health care, ambulatory care, family practice, and the names of common screening and diagnostic instruments used to detect depression. Our search was limited to English-language texts and to ages greater than 65 years.
Inclusion and exclusion criteria
For inclusion, articles must have reported on depression screening in a primary care population of adults aged greater than 65 years. They must have used a criterion standard as comparison and provided information on diagnostic accuracy (usually sensitivity and specificity). Studies performed in the community and in long-term care settings, but not in psychiatric facilities or clinics, were included.
We excluded studies that extracted briefer instruments from the parent version retrospectively; for example, if an investigator evaluated a 5-item version of the Geriatric Depression Scale (GDS), he or she must have defined the specific questions prior to administering the instrument, rather than extracting the 5 items based on posthoc analyses.
The criterion standards must have been commonly accepted, structured or semistructured diagnostic interviews or independent evaluations performed by psychiatrists based on Diagnostic and Statistic Manual of Mental Disorders, revised 3rd or 4th editions (DSM-IIIR, DSM-IV), International Classification of Diseases, 10th ed (ICD-10), or Research Diagnostic Criteria. Our selection criteria are consistent with recognized standards for reviewing diagnostic tests, specifically in eliminating spectrum bias and requiring a criterion standard.4
Review standards
Both authors independently reviewed the abstracts and full articles generated from the searches. Discrepancies about eligibility were resolved by consensus after review of the entire article. For each included study, we extracted information about the screening instrument, the criterion standard, sensitivity and specificity, average age of participants, their dementia status, and the study setting. To further estimate accuracy, we calculated 95% confidence intervals around each measure of sensitivity and specificity. Multiple screening instruments precluded a meaningful meta-analysis of these results.
Results
Our initial search strategy yielded 1325 potential articles, 1269 of which could be eliminated by title review. Of the 56 articles remaining, 38 were eliminated after identifying exclusion criteria in the abstract or the manuscript: 17 because there was no criterion standard, 7 because the setting was not appropriate, 8 because the population was not geriatric, and 6 with varying methodologic exclusions. Eighteen articles met our inclusion criteria and specifically examined the performance of depression screening instruments for older adults in primary care ( Table 1 ).
The included studies were carried out among a wide spectrum of patients mostly in general practice settings, with the exception of 1 in a nursing home and 1 receiving home care. Two studies specifically included patients with dementia. Nine different instruments were used; most had 20 or fewer questions and were relatively easy to administer.
Overall test performance in detecting major depression was similarly favorable among the instruments, with sensitivities ranging from 67% to 100% and specificities ranging from 53% to 98%. All but 2 studies5,6 reported sensitivity and specificity based on optimal cutpoints determined by post-hoc receiving-operating characteristic (ROC) curve analyses, possibly exaggerating test performance in comparison with the studies testing predetermined cutpoints.
Five studies6,11,19,22,23 explicitly stated that interviewers performing the criterion standard exam were blinded to the results of the screening test; the remainder did not report on blinding, although in most cases blinding was implied by the use of a second “independent” rater.
Geriatric Depression Scale. The GDS, the Center for Epidemiologic Studies Depression scale (CES-D), and the SelfCARE(D) were the most-evaluated screening instruments. The GDS has both a 30- and 15-item version and was designed in a yes/no format for self- or caregiver administration, making it easy to use. It minimizes questions about somatic and vegetative symptoms, which can overlap with symptoms of concurrent medical illness.
The GDS has been validated repeatedly in psychiatric settings.23-27 Nine studies5-10,12 evaluated its use in primary care elderly, most using the 15-item version and a cutpoint of 3 to 5. Sensitivity and specificity ranged from 79%–100% and 67%–80%, respectively.
Center for Epidemiological Studies Depression Scale. The CES-D can be self-administered. It lists 20 statements addressing depressive symptoms over the last week, asking the participant to rank the frequency of these feelings from “rarely” to “most of the time.” Its psychometric properties have been consistently strong in younger adults in the community.
In the 5 studies13-16 that evaluated this instrument, cutpoints varied from 9 to 21. The resultant sensitivities were 75%–93%, with specificities ranging from 73%–87%. One study16 also specifically evaluated the performance of the CES-D in mildly demented subjects with an average Mini-Mental State Examination (MMSE) of 19, and showed similar test characteristics to the patients without dementia. This instrument was perceived as generally easy to administer, except in a nursing-home population where the questions had to be repeated multiple times.
Papassotiropoulos et al17 used the CES-D and the General Health Questionnaire (GHQ) to identify subthreshold depression in a community sample in Greece. They defined subthreshold depression as fewer than 5 depressive symptoms in a 2-week period; brief, monthly depressive symptoms not occurring for a 2-week duration; and, any significant single depressive symptom not specified by duration or frequency. Accuracy was poor for delineating these syndromes, with sensitivities below 50% and specificities of 75% and 72%, respectively.
Lyness and colleagues15 used the CES-D, as well as the GDS-15, to identify minor depression in their cohort. They defined minor depression as having sad mood or loss of interest and at least 2, but fewer than 5, additional depressive symptoms within a 2-week period. The CES-D revealed a sensitivity of 40% and specificity of 82% for detecting minor depression, while the GDS-15 had a sensitivity and specificity of 70% and 80%, respectively.
SelfCARE(D). The SelfCARE(D) is a self-administered instrument that requests responses to 12 items on a Likert scale, reflecting depressive symptoms over the last month. It was derived from a larger, previously validated instrument used in England.18
In 1 of 3 included studies, Bird and colleagues18 reported the original results in a 1987 outpatient sample, showing a sensitivity of 77% and specificity of 98%, with a cutpoint of 5. Since then it has been validated again in general practice and in home care.19,20 Both studies revealed sensitivities in the 90% range, but the specificity in home care was 53% vs 86% in general practice.
Caribbean Culture–Specific Screen. In an effort to address the potential cultural limitations of common instruments, Rait and colleagues11 tested the Caribbean Culture–Specific Screen (CCSS) in the growing contingent of Caribbeans of African descent in the United Kingdom. They found that it performed well, but not better than the Brief Assessment Schedule Depression Cards or the GDS-15. Each had a sensitivity of 92%, with specificities ranging from 71%–84%.
Similarly, Abas et al12 tested the CCSS and the GDS-15 in an African-Caribbean population, reporting sensitivities of 82% for both instruments, and specificities of 68% for the CCSS and 82% for the GDS-15.
Cornell Scale for Depression in Dementia. Dementia poses barriers to effective screening for depression given the obvious limitations in self report due to cognitive impairment. The Cornell Scale for Depression in Dementia (CSDD) was specifically designed for this population and calls for the clinician to use both patient and caregiver information to complete the screen.
The CSDD is categorized by questions on mood, behavior, physical signs, diurnal patterns, and ideational disturbances. Each item is on a 3-point scale for a possible total score of 38, with higher scores indicating more depression. Most data generated about the CSDD have come from hospitalized patients, in whom it has demonstrated acceptable validity and reliability in demented and nondemented patients.29-31
We identified 1 study evaluating the CSDD that met our criteria. Vida et al22 screened outpatients from a family medicine clinic and found a sensitivity of 90% and specificity of 75% for detecting major depression.
Other instruments. Several very brief instruments have been validated in psychiatric or hospital settings where the prevalence of depressive symptoms is often high,32,33 but few have been tested in older primary care patients. Howe et al34 attempted to validate a 1-question screen (MHI-1) derived from the mental health component of the SF-36, asking elderly participants, “in the past month, how much of the time have you felt downhearted or sad?” (1=none, 6=all the time). They showed that as a “stand alone” screen, the MHI-1 did not perform well in the primary care setting, with a sensitivity of 67% and a specificity of 60%.
TABLE 1
Articles relevant to late-life depression screening
| Author | Test/cutpoint | Criterion standard | Avg. age | Dementia | Sn (%) (95% CI) | Sp (%) (95% CI) |
|---|---|---|---|---|---|---|
| D’Ath et al5 | GDS-15/5 | GMS/AGECAT | 74 | Not tested | 91 (86–96) | 72 (66–78) |
| Gerety et al6 | GDS/11 | SCID* | 79 | Avg MMSE 23 (SD4.7) | 89 (72–96) | 68 (58–77) |
| CES-D/16 | 74 (55–86) | 70 (60–79) | ||||
| Neal and Baldwin7 | GDS/11 | GMS/AGECAT | 77 | Not tested | 83 (72–94) | 80 (68–92) |
| Van Marjwick et al8 | GDS/7 | DIS | 74 | Mild/none | 79 (76–82) | 67 (63–71) |
| Arthur et al9 | GDS-15/3 | ICD-10 | 80 | None | 100 (98–102) | 72 (67–77) |
| Hoyl et al10 | GDS-15/5 | SCID | 75 | Avg MMSE 27 (SD 2.6) | 94 (89–99) | 82 (73–91) |
| Rait et al11 | GDS-15/4 | GMS/AGECAT* | >60 | Not tested | 92 (64–100) | 71 (63–79) |
| BASEDEC/6 | 92 (64–100) | 84 (78–91) | ||||
| CCSS/6 | 92 (64–100) | 79 (71–86) | ||||
| Abas et al12 | GDS-15/5 | GMS/AGECAT | >60 | Avg. MMSE 24 (SD 4.6) | 82 (62–92) | 82 (62–92) |
| CCSS/5 | 82 (62–92) | 68 (54–79) | ||||
| Beekman et al13 | CES-D/20 | DIS | 55-82 | None | 93 (91–95) | 73 (69–77) |
| Lewisohn et al14 | CES-D/12 | RDC, DSM-IIIR | 64 | Not reported | 76 (73–79) | 77 (74–80) |
| Lyness et al15 | CES-D/21 | SCID | 71 | Not tested | – | – |
| – Major depression | 92 (87–97) | 87 (81–93) | ||||
| – Minor depression | 40 (32–48) | 82 (75–89) | ||||
| GDS/10 | ||||||
| – Major depression | 100 (98–102) | 84 (78–90) | ||||
| – Minor depression | 70 (62–78) | 80 (73–87) | ||||
| Papassotiropoulos et al16 | CES-D/8 (demented excluded) | CIDI | >60 | Avg MMSE 27 (SD 6.0) | 75 (70–80) | 74 (67–81) |
| CES-D/9 (demented excluded) | CIDI | >60 | Avg MMSE 19 (SD 5.5)n demented sample | 75 (70–80) | 72 (67–77) | |
| 75 (70–80) | 72 (67–77) | |||||
| Papassotiropoulos et al17 | GHQ-12/0 Subthreshold depression | CIDI, DSM-IIIR; not reported | >60 | Avg. MMSE 28 (SD 2.0) | 46 (40-52) | 72 (67–77) |
| CES-D/9 Subthreshold depression | 39 (33-45) | 75 (70-80) | ||||
| Bird et al18 | SelfCARE(D)/5 | Independent psychiatric assessment* | 73 | Not tested | 77 (67–87) | 98 (95–101) |
| Upadhyaya and Stanley19 | SelfCARE(D)/5 | GMS/AGECAT* | 71 | Not tested | 95 (90–100) | 86 (78–94) |
| 74 (55–86) | 70 (60–79) | |||||
| Banerjee et al20 | SelfCARE(D)/8 | GMS/AGECAT | >65 | Not tested | 90 (86–94 | 53 (46–60) |
| Howe et al21 | MHI-1/2 | GMS/AGECAT | 81 | Excluded “organic mpairment” | 67 (58–76) | 60 (50–70) |
| Vida et al22 | Cornell Screen/7 | RDC* | 72 | Avg MMSE 19 (SD 7.8) | 90 (80–100) | 75 (60–90) |
| *These studies were blinded; all others were not reported. | ||||||
| GDS, Geriatric Depression Scale, 30-item; GDS-15, Geriatric Depression Scale, 15-item; GHQ, General Health Questionnaire; DIS, Diagnostic Interview Schedule; BASEDEC, Brief Assessment Schedule Depression Cards; CES-D, Center for Epidemiologic Study-Depression; MHI-1, single question from the Mental Health Inventory [“in the past month, how much have you felt downhearted or sad (1: none-6: all the time)”]; GMS, Geriatric Mental State/AGECAT computer program; CIDI, Composite International Diagnostic Interview; SCID, Structured Clinical Interview for DSM IIIR; CCSS, Caribbean Culture Specific Screen; RDC, Research Diagnostic Criteria; DSM IIIR, Diagnostic and Statistical Manual of Mental Disorders,3rd ed rev; MMSE, Mini Mental State Examination; ICD-10, International Classification of Diseases, 10th ed | ||||||
Discussion: late-life depression can be diagnosed accurately
Our systematic review shows that several instruments demonstrate good accuracy for detecting late-life major depression in primary care. The GDS, CES-D and SelfCARE(D) have comparable sensitivities and specificities. The CES-D and CCSD have similarly favorable accuracy in demented patients with an average MMSE score of 19.
A 1-question screen shows poor results, as do studies using the GHQ, CES-D, and GDS-15 to detect nonmajor depression. Finally, 2 studies demonstrate that a culturally specific screen in African-Caribbeans performs well, but no better than, the GDS.
The GDS has longstanding success in identifying major depression in psychiatric and hospital settings and now demonstrates accuracy in primary care, where the 15-item version in its yes/no self-administered format represents a realistic tool for use in the community or the clinic.
With a record of successful use in general adult research, the CES-D also has the benefit of a known track record and relative ease of administration. Evidence from this review suggests that it can be extended to the older primary care population. The SelfCARE(D) is comparably accurate in general practice, but has lower specificity in home care.
Our review highlights the need to further investigate the accuracy of screening tools for depression in patients with dementia, specifically where cognitive impairment may be severe. Using the CSDD, an instrument specifically designed for patients with dementia, Vida et al22 found good accuracy for detecting depression; however, they studied patients with relatively mild dementia. The prevalence of depression in dementia is 15% to 40%.35 Given the increasing incidence of dementia in our aging population, the availability of accurate screening tools that specifically account for the coexistence of these 2 common disorders is important.
This review also reveals a lack of screening accuracy for nonmajor depressive disorders using 3 common instruments. Lyness and colleagues36 showed that there is considerable functional disability in subsyndromal depression, which is more prevalent than major depression. Others show similar findings, supporting the significant morbidity caused by depressive symptoms not severe enough to cross threshold for a major disorder.37,38 As the characterization of nonmajor depressive disorders evolves, screening instruments should be developed and validated specifically for these syndromes.39
Late-life depressive disorders have a convincing burden of suffering, often go undetected, and have known effective treatments.40 Our systematic review reveals that accurate screening instruments are available to detect major depression in older primary care patients. Based on format and length ( Table 2 ), several could easily be self-administered or administered by nonclinicians in the waiting room. We recommend the 15-item GDS ( Figure ) because of its yes/no format and ease of scoring. Future work should include tests of depression screening accuracy for demented populations, and for nonmajor depressive disorders. Investigators should also evaluate the accuracy of very short instruments, such as the 5-item version of the GDS10 in the primary care setting. Acceptable administration times and ease of use is likely to determine the realistic application of proven instruments.
TABLE 2
Selected screening instruments and their characteristics
| Instrument | Format | Item | Time to administer | Sn (%) | Sp (%) |
|---|---|---|---|---|---|
| GDS-15 | Yes/no questions about current symptoms | 15 | 2–3 minutes | 82–100 | 72–82 |
| CES-D | Rates frequency of selected symptoms over last week | 20 | 2–3 minutes | 74–93 | 70–87 |
| SelfCareD | Multiple choice responses regarding symptoms over last month | 12 | 2–3 minutes | 77–95 | 53–98 |
| GDS-15: Geriatric Depression Scale, 15-item; CES-D: Center for Epidemiologic Study-Depression; Sn, sensitivity; Sp, specificity. Sensitivity and specificity values represent the range reported from the eligible studies in our review. | |||||
FIGURE
Geriatric Depression Scale, 15-item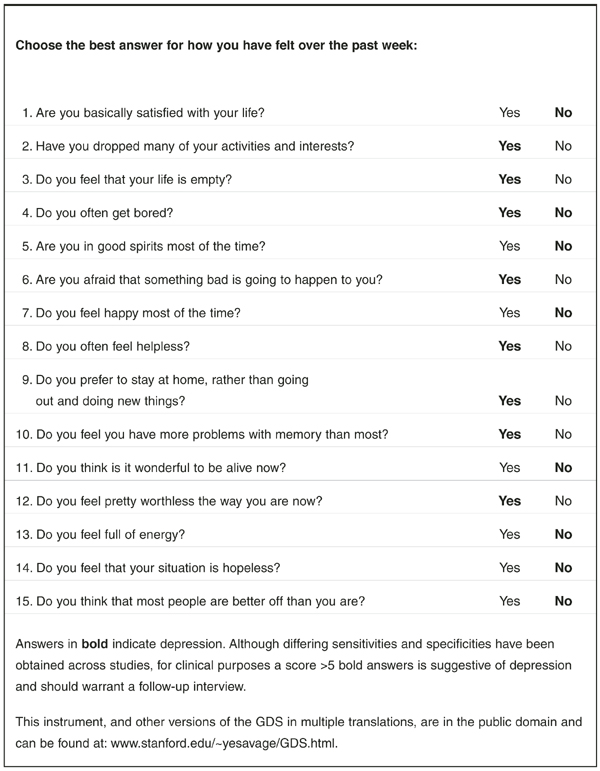
Acknowledgments
The authors would like to thank Dr. Carmen Lewis for her thoughtful review of this manuscript. The authors report no competing interests. Funding sources: Robert Wood Johnson Clinical Scholars Program; Agency for Healthcare Research and Quality contract # 290-97-0011.
Corresponding author
Lea C. Watson MD, MPH, Geriatric Psychiatry, Box 3903, Duke University Medical Center, Durham, NC 27710. E-mail: [email protected].
1. Mulsant BH, Ganguli M. Epidemiology and diagnosis of depression in late life. J Clin Psychiatry 1999;60(suppl 20):9-15.
2. US Preventive Services Task Force. Guide to Clinical Preventive Services. 2nd ed. Alexandria, Va: International Medical Publishing; 1996.
3. Pignone MP, Gaynes BN, Rushton JL, et al. Screening for depression in adults: a summary of the evidence for the US Preventive Services Task Force. Ann Intern Med 2002;136:765-776.
4. Lijmer JG, Mol BW, Heisterkamp S, et al. Empirical evidence of design-related bias in studies of diagnostic tests. JAMA 1999;282:1061-1066.
5. D’Ath P, Katona P, Mullan E, Evans S, Katona C. Screening, detection and management of depression in elderly primary care attenders. I: The acceptability and performance of the 15 item Geriatric Depression Scale (GDS15) and the development of short versions. Fam Pract 1994;11:260-266.
6. Gerety MB, Williams JW, Jr, Mulrow CD, et al. Performance of case-finding tools for depression in the nursing home: influence of clinical and functional characteristics and selection of optimal threshold scores. J Am Geriatr Soc 1994;42:1103-1109.
7. Neal R, Baldwin R. Screening for anxiety and depression in elderly medical outpatients. Age and Ageing 1994;23:461-464.
8. van Marwijk HV, Wallace P, de Bock GD, Hermans J, Kapteinaa Mulder JD. Evaluation of the feasibility, reliability and diagnostic value of shortened versions of the geriatric depression scale. Br J Gen Prac 1995;45:195-199.
9. Arthur A, Jagger C, Lindesay J, Graham C, Clarke M. Using an annual over-75 health check to screen for depression: validation of the short Geriatric Depression Scale (GDS15) within general practice. Int J Geriatr Psychiatry 1999;14:431-439.
10. Hoyl MT, Alessi CA, Harker JO, et al. Development and testing of a five-item version of the Geriatric Depression Scale. J Am Geriatr Soc 1999;47:873-878.
11. Rait G, Burns A, Baldwin R, et al. Screening for depression in African-Caribbean elders. Fam Pract 1999;16:591-595.
12. Abas MA, Phillips C, Carter J, Walter S, Banerjee S, Levy R. Culturally sensitive validation of screening questionnaires for depression in older African-Caribbean people living in south London. Br J Psychiatry 1998;173:249-254.
13. Beekman AT, Deeg DJ, Van Limbeek J, Braam AW, de Vries MR, Van Tillburg W. Criterion validity of the Center for Epidemiologic Studies Depression scale (CES-D): results from a community-based sample of older subjects in The Netherlands. Psychol Med 1997;27:231-235.
14. Lewinsohn PM, Seeley JR, Roberts RE, Allen NB. Center for Epidemiologic Studies Depression Scale (CES-D) as a screening instrument for depression among community-residing older adults. Psychol Aging 1997;12:277-287.
15. Lyness JM, Noel TK, Cox C, et al. Screening for depression in elderly primary care patients. A comparison of the Center for Epidemiologic Studies-Depression Scale and the Geriatric Depression Scale. Arch Intern Med 1997;157:449-454.
16. Papassotiropoulos A, Heun R, Maier W. The impact of dementia on the detection of depression in elderly subjects from the general population. Psychol Med 1999;29:113-120.
17. Papassotiropoulos A, Heun R. Detection of subthreshold depression and subthreshold anxiety in the elderly. Int J Geriatr Psychiatry 1999;14:643-650.
18. Bird A, Macdonald A, Mann A, et al. Preliminary experience with the SelfCARE(D): a self-rating depression questionnaire for use in elderly, non-institutionalized subjects. Int J Geriatr Psychiatry 1987;2.
19. Upadhyaya AK, Stanley I. Detection of depression in primary care comparison of two self. administered scales. Int J Geriatr Psychiatry 1997;12:35-37.
20. Banerjee S, Shamash K, MacDonald AJ, et al. The use of the SelfCARE(D) as a screening tool for depression in the clients of local authority home care services-a preliminary study. Int J Geriatr Psychiatry 1998;13:695-699.
21. Howe A, Bath P, Goudie F, et al. Getting the questions right: an example of loss of validity during transfer of a brief screening approach for depression in the elderly. Int J Geriatr Psychiatry 2000;15:650-655.
22. Vida S, Des Rosiers P, Carrier L, Gauthier S. Depression in Alzheimer’s disease: receiver operating characteristic analysis of the Cornell Scale for Depression in Dementia and the Hamilton Depression Scale. J Geriatr Psychiatry Neur 1994;7:159-162.
23. Sheik J, Yesavage J. Geriatric Depression Scale (GDS): recent findings and development of a shorter version. New York, NY: Howarth Press; 1986.
24. Yesavage JA, Brink TL, Rose TL, et al. Development and validation of a geriatric depression screening scale: a preliminary report. J Psychiatr Res 1982;17:37-49.
25. Fountoulakis KN, Tsolaki M, Iacovides A, et al. The validation of the short form of the Geriatric Depression Scale (GDS) in Greece. Aging (Milano) 1999;11:367-372.
26. Lim PP, Ng LL, Chiam PC, Ong PS, Ngui FT, Sahadevan S. Validation and comparison of three brief depression scales in an elderly Chinese population. Int J Geriatr Psychiatry 2000;15:824-830.
27. Almeida OP, Almeida SA. Short versions of the geriatric depression scale: a study of their validity for the diagnosis of a major depressive episode according to ICD-10 and DSM-IV. Int J Geriatr Psychiatry 1999;14:858-865.
28. Mulrow CD, Williams JW, Jr, Gerety MB, Ramirez G, Montiel OM, Kerber C. Case-finding instruments for depression in primary care settings. Ann Intern Med 1995;122:913-921.
29. Alexopoulos G, Abrams R, Young R, Shamoian CA. Use of the Cornell Scale in Nondemented Patients. J Am Geriatr Soc 1988;36:230-236.
30. Alexopoulos G, Abrams R, Young R, Shamoian CA. Cornell Scale for Depression in Dementia. Biol Psychiatry 1988;23:271-284.
31. Harwood D, Ownby R, Barker W, Duara R. The factor structure of the Cornell Scale for Depression in Dementia among probable Alzheimer’s disease patients. Am J Geriatr Psychiatry 1998;6:212-220.
32. Weyerer S, Killmann U, Ames D, Allen N. The Even Briefer Assessment Scale for Depression (EBAS DEP): its suitability for the elderly in geriatric care in English-and German- speaking countries. Int J Geriatr Psychiatry 1999;14:473-480.
33. Pomeroy IM, Clark CR, Philp I. The effectiveness of very short scales for depression screening in elderly medical patients. Int J Geriatr Psychiatry 2001;16:321-326.
34. Howe A, Bath P, Goudie F, et al. Getting the questions right: an example of loss of validity during transfer of a brief screening approach for depression in the elderly. Int J Geriatr Psychiatry 2000;15:650-655.
35. Lyketsos G, Baker L, Warren A, et al. Major and minor depression in Alzheimer’s disease: prevalence and impact. J Neuropsychiatry Clin Neurosci 1997;9:556-561.
36. Lyness JM, King DA, Cox C, Yoediono Z, Caine ED. The importance of subsyndromal depression in older primary care patients: prevalence and associated functional disability. J Am Geriatr Soc 1999;47:647-652.
37. Hendrie H, Callahan C, Levitt E. Prevalence rates of major depressive disorders: the effect of varying diagnostic criteria in an older primary care population. Am J Geriatr Psychiatry 1995;3:119-131.
38. Unutzer J, Patrick D, Simon G, et al. Depressive symptoms and the cost of health services in HMO patients aged 65 years and older. JAMA 1997;277:1618-1623.
39. Lavretsky H, Kumar A. Clinically significant non-major depression: old concepts, new insights. Am J Geriatr Psychiatry 2002;10:239-255.
40. Lebowitz BD, Pearson JL, Schneider LS, et al. Diagnosis and treatment of depression in late life. Consensus statement update. JAMA 1997;278:1186-1190.
Objective: To determine the accuracy of depression screening instruments for older adults in primary care.
Study Design: Systematic review
Data Sources: MEDLINE, PsycINFO (search dates 1966 to January 2002), and the Cochrane database on depression, anxiety and neurosis. We also searched the second Guide to Clinical Preventive Services, the 1993 Agency for Health Care Policy and Research Clinical Practice Guideline on Depression, and recent systematic reviews. Hand-checking of bibliographies and extensive peer review were also used to identify potential articles.
Outcomes Measured: A predefined search strategy targeted only studies of adults aged 65 years or older in primary care or community settings, including long-term care. Articles were included in this review if they reported original data and tested depression screening instruments against a criterion standard, yielding sensitivity and specificity.
Results: Eighteen articles met criteria and are included in this review, representing 9 different screening instruments. The most commonly evaluated were the Geriatric Depression Scale (30-and 15-item versions), the Center for Epidemiologic Studies Depression Scale, and the SelfCARE(D). Differences in the performance of these 3 instruments were minimal; sensitivities ranged from 74% to 100% and specificities ranged from 53% to 98%.
Conclusions: Accurate and feasible screening instruments are available for detecting late-life depression in primary care. More research is needed to determine the accuracy of depression screening instruments for demented individuals, and for those with subthreshold depressive disorders.
When depression is detected and treated in older patients, not only do symptoms subside, but behavior, cognitive functioning, and overall quality of life improve.1 We conducted a systematic review to determine the accuracy of instruments for detecting unrecognized late-life depression in the primary care setting. Several instruments are comparable in sensitivity and specificity, though the 15-item Geriatric Depression Scale is particularly useful in the primary care setting.
Search methods
As a part of a broader review for the US Preventive Services Task Force and the Research Triangle Institute–University of North Carolina at Chapel Hill Evidence-Based Practice Center, we prepared a strategy to identify articles relevant to the accuracy of depression screening instruments for older adults in the primary care setting. We searched for articles in MEDLINE, PsycINFO (search dates 1966 to January 2002), and the Cochrane database on depression, anxiety, and neurosis. We also searched the second Guide to Clinical Preventive Services,2 the 1993 Agency for Health Care Policy and Research (AHCPR) Clinical Practice Guideline on Depression, and recent systematic reviews.3 We also hand-checked bibliographies and used extensive peer review to identify potential articles.
We used the search terms depression, depressive disorder, mass screening, sensitivity and specificity, reproducibility of results, primary health care, ambulatory care, family practice, and the names of common screening and diagnostic instruments used to detect depression. Our search was limited to English-language texts and to ages greater than 65 years.
Inclusion and exclusion criteria
For inclusion, articles must have reported on depression screening in a primary care population of adults aged greater than 65 years. They must have used a criterion standard as comparison and provided information on diagnostic accuracy (usually sensitivity and specificity). Studies performed in the community and in long-term care settings, but not in psychiatric facilities or clinics, were included.
We excluded studies that extracted briefer instruments from the parent version retrospectively; for example, if an investigator evaluated a 5-item version of the Geriatric Depression Scale (GDS), he or she must have defined the specific questions prior to administering the instrument, rather than extracting the 5 items based on posthoc analyses.
The criterion standards must have been commonly accepted, structured or semistructured diagnostic interviews or independent evaluations performed by psychiatrists based on Diagnostic and Statistic Manual of Mental Disorders, revised 3rd or 4th editions (DSM-IIIR, DSM-IV), International Classification of Diseases, 10th ed (ICD-10), or Research Diagnostic Criteria. Our selection criteria are consistent with recognized standards for reviewing diagnostic tests, specifically in eliminating spectrum bias and requiring a criterion standard.4
Review standards
Both authors independently reviewed the abstracts and full articles generated from the searches. Discrepancies about eligibility were resolved by consensus after review of the entire article. For each included study, we extracted information about the screening instrument, the criterion standard, sensitivity and specificity, average age of participants, their dementia status, and the study setting. To further estimate accuracy, we calculated 95% confidence intervals around each measure of sensitivity and specificity. Multiple screening instruments precluded a meaningful meta-analysis of these results.
Results
Our initial search strategy yielded 1325 potential articles, 1269 of which could be eliminated by title review. Of the 56 articles remaining, 38 were eliminated after identifying exclusion criteria in the abstract or the manuscript: 17 because there was no criterion standard, 7 because the setting was not appropriate, 8 because the population was not geriatric, and 6 with varying methodologic exclusions. Eighteen articles met our inclusion criteria and specifically examined the performance of depression screening instruments for older adults in primary care ( Table 1 ).
The included studies were carried out among a wide spectrum of patients mostly in general practice settings, with the exception of 1 in a nursing home and 1 receiving home care. Two studies specifically included patients with dementia. Nine different instruments were used; most had 20 or fewer questions and were relatively easy to administer.
Overall test performance in detecting major depression was similarly favorable among the instruments, with sensitivities ranging from 67% to 100% and specificities ranging from 53% to 98%. All but 2 studies5,6 reported sensitivity and specificity based on optimal cutpoints determined by post-hoc receiving-operating characteristic (ROC) curve analyses, possibly exaggerating test performance in comparison with the studies testing predetermined cutpoints.
Five studies6,11,19,22,23 explicitly stated that interviewers performing the criterion standard exam were blinded to the results of the screening test; the remainder did not report on blinding, although in most cases blinding was implied by the use of a second “independent” rater.
Geriatric Depression Scale. The GDS, the Center for Epidemiologic Studies Depression scale (CES-D), and the SelfCARE(D) were the most-evaluated screening instruments. The GDS has both a 30- and 15-item version and was designed in a yes/no format for self- or caregiver administration, making it easy to use. It minimizes questions about somatic and vegetative symptoms, which can overlap with symptoms of concurrent medical illness.
The GDS has been validated repeatedly in psychiatric settings.23-27 Nine studies5-10,12 evaluated its use in primary care elderly, most using the 15-item version and a cutpoint of 3 to 5. Sensitivity and specificity ranged from 79%–100% and 67%–80%, respectively.
Center for Epidemiological Studies Depression Scale. The CES-D can be self-administered. It lists 20 statements addressing depressive symptoms over the last week, asking the participant to rank the frequency of these feelings from “rarely” to “most of the time.” Its psychometric properties have been consistently strong in younger adults in the community.
In the 5 studies13-16 that evaluated this instrument, cutpoints varied from 9 to 21. The resultant sensitivities were 75%–93%, with specificities ranging from 73%–87%. One study16 also specifically evaluated the performance of the CES-D in mildly demented subjects with an average Mini-Mental State Examination (MMSE) of 19, and showed similar test characteristics to the patients without dementia. This instrument was perceived as generally easy to administer, except in a nursing-home population where the questions had to be repeated multiple times.
Papassotiropoulos et al17 used the CES-D and the General Health Questionnaire (GHQ) to identify subthreshold depression in a community sample in Greece. They defined subthreshold depression as fewer than 5 depressive symptoms in a 2-week period; brief, monthly depressive symptoms not occurring for a 2-week duration; and, any significant single depressive symptom not specified by duration or frequency. Accuracy was poor for delineating these syndromes, with sensitivities below 50% and specificities of 75% and 72%, respectively.
Lyness and colleagues15 used the CES-D, as well as the GDS-15, to identify minor depression in their cohort. They defined minor depression as having sad mood or loss of interest and at least 2, but fewer than 5, additional depressive symptoms within a 2-week period. The CES-D revealed a sensitivity of 40% and specificity of 82% for detecting minor depression, while the GDS-15 had a sensitivity and specificity of 70% and 80%, respectively.
SelfCARE(D). The SelfCARE(D) is a self-administered instrument that requests responses to 12 items on a Likert scale, reflecting depressive symptoms over the last month. It was derived from a larger, previously validated instrument used in England.18
In 1 of 3 included studies, Bird and colleagues18 reported the original results in a 1987 outpatient sample, showing a sensitivity of 77% and specificity of 98%, with a cutpoint of 5. Since then it has been validated again in general practice and in home care.19,20 Both studies revealed sensitivities in the 90% range, but the specificity in home care was 53% vs 86% in general practice.
Caribbean Culture–Specific Screen. In an effort to address the potential cultural limitations of common instruments, Rait and colleagues11 tested the Caribbean Culture–Specific Screen (CCSS) in the growing contingent of Caribbeans of African descent in the United Kingdom. They found that it performed well, but not better than the Brief Assessment Schedule Depression Cards or the GDS-15. Each had a sensitivity of 92%, with specificities ranging from 71%–84%.
Similarly, Abas et al12 tested the CCSS and the GDS-15 in an African-Caribbean population, reporting sensitivities of 82% for both instruments, and specificities of 68% for the CCSS and 82% for the GDS-15.
Cornell Scale for Depression in Dementia. Dementia poses barriers to effective screening for depression given the obvious limitations in self report due to cognitive impairment. The Cornell Scale for Depression in Dementia (CSDD) was specifically designed for this population and calls for the clinician to use both patient and caregiver information to complete the screen.
The CSDD is categorized by questions on mood, behavior, physical signs, diurnal patterns, and ideational disturbances. Each item is on a 3-point scale for a possible total score of 38, with higher scores indicating more depression. Most data generated about the CSDD have come from hospitalized patients, in whom it has demonstrated acceptable validity and reliability in demented and nondemented patients.29-31
We identified 1 study evaluating the CSDD that met our criteria. Vida et al22 screened outpatients from a family medicine clinic and found a sensitivity of 90% and specificity of 75% for detecting major depression.
Other instruments. Several very brief instruments have been validated in psychiatric or hospital settings where the prevalence of depressive symptoms is often high,32,33 but few have been tested in older primary care patients. Howe et al34 attempted to validate a 1-question screen (MHI-1) derived from the mental health component of the SF-36, asking elderly participants, “in the past month, how much of the time have you felt downhearted or sad?” (1=none, 6=all the time). They showed that as a “stand alone” screen, the MHI-1 did not perform well in the primary care setting, with a sensitivity of 67% and a specificity of 60%.
TABLE 1
Articles relevant to late-life depression screening
| Author | Test/cutpoint | Criterion standard | Avg. age | Dementia | Sn (%) (95% CI) | Sp (%) (95% CI) |
|---|---|---|---|---|---|---|
| D’Ath et al5 | GDS-15/5 | GMS/AGECAT | 74 | Not tested | 91 (86–96) | 72 (66–78) |
| Gerety et al6 | GDS/11 | SCID* | 79 | Avg MMSE 23 (SD4.7) | 89 (72–96) | 68 (58–77) |
| CES-D/16 | 74 (55–86) | 70 (60–79) | ||||
| Neal and Baldwin7 | GDS/11 | GMS/AGECAT | 77 | Not tested | 83 (72–94) | 80 (68–92) |
| Van Marjwick et al8 | GDS/7 | DIS | 74 | Mild/none | 79 (76–82) | 67 (63–71) |
| Arthur et al9 | GDS-15/3 | ICD-10 | 80 | None | 100 (98–102) | 72 (67–77) |
| Hoyl et al10 | GDS-15/5 | SCID | 75 | Avg MMSE 27 (SD 2.6) | 94 (89–99) | 82 (73–91) |
| Rait et al11 | GDS-15/4 | GMS/AGECAT* | >60 | Not tested | 92 (64–100) | 71 (63–79) |
| BASEDEC/6 | 92 (64–100) | 84 (78–91) | ||||
| CCSS/6 | 92 (64–100) | 79 (71–86) | ||||
| Abas et al12 | GDS-15/5 | GMS/AGECAT | >60 | Avg. MMSE 24 (SD 4.6) | 82 (62–92) | 82 (62–92) |
| CCSS/5 | 82 (62–92) | 68 (54–79) | ||||
| Beekman et al13 | CES-D/20 | DIS | 55-82 | None | 93 (91–95) | 73 (69–77) |
| Lewisohn et al14 | CES-D/12 | RDC, DSM-IIIR | 64 | Not reported | 76 (73–79) | 77 (74–80) |
| Lyness et al15 | CES-D/21 | SCID | 71 | Not tested | – | – |
| – Major depression | 92 (87–97) | 87 (81–93) | ||||
| – Minor depression | 40 (32–48) | 82 (75–89) | ||||
| GDS/10 | ||||||
| – Major depression | 100 (98–102) | 84 (78–90) | ||||
| – Minor depression | 70 (62–78) | 80 (73–87) | ||||
| Papassotiropoulos et al16 | CES-D/8 (demented excluded) | CIDI | >60 | Avg MMSE 27 (SD 6.0) | 75 (70–80) | 74 (67–81) |
| CES-D/9 (demented excluded) | CIDI | >60 | Avg MMSE 19 (SD 5.5)n demented sample | 75 (70–80) | 72 (67–77) | |
| 75 (70–80) | 72 (67–77) | |||||
| Papassotiropoulos et al17 | GHQ-12/0 Subthreshold depression | CIDI, DSM-IIIR; not reported | >60 | Avg. MMSE 28 (SD 2.0) | 46 (40-52) | 72 (67–77) |
| CES-D/9 Subthreshold depression | 39 (33-45) | 75 (70-80) | ||||
| Bird et al18 | SelfCARE(D)/5 | Independent psychiatric assessment* | 73 | Not tested | 77 (67–87) | 98 (95–101) |
| Upadhyaya and Stanley19 | SelfCARE(D)/5 | GMS/AGECAT* | 71 | Not tested | 95 (90–100) | 86 (78–94) |
| 74 (55–86) | 70 (60–79) | |||||
| Banerjee et al20 | SelfCARE(D)/8 | GMS/AGECAT | >65 | Not tested | 90 (86–94 | 53 (46–60) |
| Howe et al21 | MHI-1/2 | GMS/AGECAT | 81 | Excluded “organic mpairment” | 67 (58–76) | 60 (50–70) |
| Vida et al22 | Cornell Screen/7 | RDC* | 72 | Avg MMSE 19 (SD 7.8) | 90 (80–100) | 75 (60–90) |
| *These studies were blinded; all others were not reported. | ||||||
| GDS, Geriatric Depression Scale, 30-item; GDS-15, Geriatric Depression Scale, 15-item; GHQ, General Health Questionnaire; DIS, Diagnostic Interview Schedule; BASEDEC, Brief Assessment Schedule Depression Cards; CES-D, Center for Epidemiologic Study-Depression; MHI-1, single question from the Mental Health Inventory [“in the past month, how much have you felt downhearted or sad (1: none-6: all the time)”]; GMS, Geriatric Mental State/AGECAT computer program; CIDI, Composite International Diagnostic Interview; SCID, Structured Clinical Interview for DSM IIIR; CCSS, Caribbean Culture Specific Screen; RDC, Research Diagnostic Criteria; DSM IIIR, Diagnostic and Statistical Manual of Mental Disorders,3rd ed rev; MMSE, Mini Mental State Examination; ICD-10, International Classification of Diseases, 10th ed | ||||||
Discussion: late-life depression can be diagnosed accurately
Our systematic review shows that several instruments demonstrate good accuracy for detecting late-life major depression in primary care. The GDS, CES-D and SelfCARE(D) have comparable sensitivities and specificities. The CES-D and CCSD have similarly favorable accuracy in demented patients with an average MMSE score of 19.
A 1-question screen shows poor results, as do studies using the GHQ, CES-D, and GDS-15 to detect nonmajor depression. Finally, 2 studies demonstrate that a culturally specific screen in African-Caribbeans performs well, but no better than, the GDS.
The GDS has longstanding success in identifying major depression in psychiatric and hospital settings and now demonstrates accuracy in primary care, where the 15-item version in its yes/no self-administered format represents a realistic tool for use in the community or the clinic.
With a record of successful use in general adult research, the CES-D also has the benefit of a known track record and relative ease of administration. Evidence from this review suggests that it can be extended to the older primary care population. The SelfCARE(D) is comparably accurate in general practice, but has lower specificity in home care.
Our review highlights the need to further investigate the accuracy of screening tools for depression in patients with dementia, specifically where cognitive impairment may be severe. Using the CSDD, an instrument specifically designed for patients with dementia, Vida et al22 found good accuracy for detecting depression; however, they studied patients with relatively mild dementia. The prevalence of depression in dementia is 15% to 40%.35 Given the increasing incidence of dementia in our aging population, the availability of accurate screening tools that specifically account for the coexistence of these 2 common disorders is important.
This review also reveals a lack of screening accuracy for nonmajor depressive disorders using 3 common instruments. Lyness and colleagues36 showed that there is considerable functional disability in subsyndromal depression, which is more prevalent than major depression. Others show similar findings, supporting the significant morbidity caused by depressive symptoms not severe enough to cross threshold for a major disorder.37,38 As the characterization of nonmajor depressive disorders evolves, screening instruments should be developed and validated specifically for these syndromes.39
Late-life depressive disorders have a convincing burden of suffering, often go undetected, and have known effective treatments.40 Our systematic review reveals that accurate screening instruments are available to detect major depression in older primary care patients. Based on format and length ( Table 2 ), several could easily be self-administered or administered by nonclinicians in the waiting room. We recommend the 15-item GDS ( Figure ) because of its yes/no format and ease of scoring. Future work should include tests of depression screening accuracy for demented populations, and for nonmajor depressive disorders. Investigators should also evaluate the accuracy of very short instruments, such as the 5-item version of the GDS10 in the primary care setting. Acceptable administration times and ease of use is likely to determine the realistic application of proven instruments.
TABLE 2
Selected screening instruments and their characteristics
| Instrument | Format | Item | Time to administer | Sn (%) | Sp (%) |
|---|---|---|---|---|---|
| GDS-15 | Yes/no questions about current symptoms | 15 | 2–3 minutes | 82–100 | 72–82 |
| CES-D | Rates frequency of selected symptoms over last week | 20 | 2–3 minutes | 74–93 | 70–87 |
| SelfCareD | Multiple choice responses regarding symptoms over last month | 12 | 2–3 minutes | 77–95 | 53–98 |
| GDS-15: Geriatric Depression Scale, 15-item; CES-D: Center for Epidemiologic Study-Depression; Sn, sensitivity; Sp, specificity. Sensitivity and specificity values represent the range reported from the eligible studies in our review. | |||||
FIGURE
Geriatric Depression Scale, 15-item
Acknowledgments
The authors would like to thank Dr. Carmen Lewis for her thoughtful review of this manuscript. The authors report no competing interests. Funding sources: Robert Wood Johnson Clinical Scholars Program; Agency for Healthcare Research and Quality contract # 290-97-0011.
Corresponding author
Lea C. Watson MD, MPH, Geriatric Psychiatry, Box 3903, Duke University Medical Center, Durham, NC 27710. E-mail: [email protected].
1. Mulsant BH, Ganguli M. Epidemiology and diagnosis of depression in late life. J Clin Psychiatry 1999;60(suppl 20):9-15.
2. US Preventive Services Task Force. Guide to Clinical Preventive Services. 2nd ed. Alexandria, Va: International Medical Publishing; 1996.
3. Pignone MP, Gaynes BN, Rushton JL, et al. Screening for depression in adults: a summary of the evidence for the US Preventive Services Task Force. Ann Intern Med 2002;136:765-776.
4. Lijmer JG, Mol BW, Heisterkamp S, et al. Empirical evidence of design-related bias in studies of diagnostic tests. JAMA 1999;282:1061-1066.
5. D’Ath P, Katona P, Mullan E, Evans S, Katona C. Screening, detection and management of depression in elderly primary care attenders. I: The acceptability and performance of the 15 item Geriatric Depression Scale (GDS15) and the development of short versions. Fam Pract 1994;11:260-266.
6. Gerety MB, Williams JW, Jr, Mulrow CD, et al. Performance of case-finding tools for depression in the nursing home: influence of clinical and functional characteristics and selection of optimal threshold scores. J Am Geriatr Soc 1994;42:1103-1109.
7. Neal R, Baldwin R. Screening for anxiety and depression in elderly medical outpatients. Age and Ageing 1994;23:461-464.
8. van Marwijk HV, Wallace P, de Bock GD, Hermans J, Kapteinaa Mulder JD. Evaluation of the feasibility, reliability and diagnostic value of shortened versions of the geriatric depression scale. Br J Gen Prac 1995;45:195-199.
9. Arthur A, Jagger C, Lindesay J, Graham C, Clarke M. Using an annual over-75 health check to screen for depression: validation of the short Geriatric Depression Scale (GDS15) within general practice. Int J Geriatr Psychiatry 1999;14:431-439.
10. Hoyl MT, Alessi CA, Harker JO, et al. Development and testing of a five-item version of the Geriatric Depression Scale. J Am Geriatr Soc 1999;47:873-878.
11. Rait G, Burns A, Baldwin R, et al. Screening for depression in African-Caribbean elders. Fam Pract 1999;16:591-595.
12. Abas MA, Phillips C, Carter J, Walter S, Banerjee S, Levy R. Culturally sensitive validation of screening questionnaires for depression in older African-Caribbean people living in south London. Br J Psychiatry 1998;173:249-254.
13. Beekman AT, Deeg DJ, Van Limbeek J, Braam AW, de Vries MR, Van Tillburg W. Criterion validity of the Center for Epidemiologic Studies Depression scale (CES-D): results from a community-based sample of older subjects in The Netherlands. Psychol Med 1997;27:231-235.
14. Lewinsohn PM, Seeley JR, Roberts RE, Allen NB. Center for Epidemiologic Studies Depression Scale (CES-D) as a screening instrument for depression among community-residing older adults. Psychol Aging 1997;12:277-287.
15. Lyness JM, Noel TK, Cox C, et al. Screening for depression in elderly primary care patients. A comparison of the Center for Epidemiologic Studies-Depression Scale and the Geriatric Depression Scale. Arch Intern Med 1997;157:449-454.
16. Papassotiropoulos A, Heun R, Maier W. The impact of dementia on the detection of depression in elderly subjects from the general population. Psychol Med 1999;29:113-120.
17. Papassotiropoulos A, Heun R. Detection of subthreshold depression and subthreshold anxiety in the elderly. Int J Geriatr Psychiatry 1999;14:643-650.
18. Bird A, Macdonald A, Mann A, et al. Preliminary experience with the SelfCARE(D): a self-rating depression questionnaire for use in elderly, non-institutionalized subjects. Int J Geriatr Psychiatry 1987;2.
19. Upadhyaya AK, Stanley I. Detection of depression in primary care comparison of two self. administered scales. Int J Geriatr Psychiatry 1997;12:35-37.
20. Banerjee S, Shamash K, MacDonald AJ, et al. The use of the SelfCARE(D) as a screening tool for depression in the clients of local authority home care services-a preliminary study. Int J Geriatr Psychiatry 1998;13:695-699.
21. Howe A, Bath P, Goudie F, et al. Getting the questions right: an example of loss of validity during transfer of a brief screening approach for depression in the elderly. Int J Geriatr Psychiatry 2000;15:650-655.
22. Vida S, Des Rosiers P, Carrier L, Gauthier S. Depression in Alzheimer’s disease: receiver operating characteristic analysis of the Cornell Scale for Depression in Dementia and the Hamilton Depression Scale. J Geriatr Psychiatry Neur 1994;7:159-162.
23. Sheik J, Yesavage J. Geriatric Depression Scale (GDS): recent findings and development of a shorter version. New York, NY: Howarth Press; 1986.
24. Yesavage JA, Brink TL, Rose TL, et al. Development and validation of a geriatric depression screening scale: a preliminary report. J Psychiatr Res 1982;17:37-49.
25. Fountoulakis KN, Tsolaki M, Iacovides A, et al. The validation of the short form of the Geriatric Depression Scale (GDS) in Greece. Aging (Milano) 1999;11:367-372.
26. Lim PP, Ng LL, Chiam PC, Ong PS, Ngui FT, Sahadevan S. Validation and comparison of three brief depression scales in an elderly Chinese population. Int J Geriatr Psychiatry 2000;15:824-830.
27. Almeida OP, Almeida SA. Short versions of the geriatric depression scale: a study of their validity for the diagnosis of a major depressive episode according to ICD-10 and DSM-IV. Int J Geriatr Psychiatry 1999;14:858-865.
28. Mulrow CD, Williams JW, Jr, Gerety MB, Ramirez G, Montiel OM, Kerber C. Case-finding instruments for depression in primary care settings. Ann Intern Med 1995;122:913-921.
29. Alexopoulos G, Abrams R, Young R, Shamoian CA. Use of the Cornell Scale in Nondemented Patients. J Am Geriatr Soc 1988;36:230-236.
30. Alexopoulos G, Abrams R, Young R, Shamoian CA. Cornell Scale for Depression in Dementia. Biol Psychiatry 1988;23:271-284.
31. Harwood D, Ownby R, Barker W, Duara R. The factor structure of the Cornell Scale for Depression in Dementia among probable Alzheimer’s disease patients. Am J Geriatr Psychiatry 1998;6:212-220.
32. Weyerer S, Killmann U, Ames D, Allen N. The Even Briefer Assessment Scale for Depression (EBAS DEP): its suitability for the elderly in geriatric care in English-and German- speaking countries. Int J Geriatr Psychiatry 1999;14:473-480.
33. Pomeroy IM, Clark CR, Philp I. The effectiveness of very short scales for depression screening in elderly medical patients. Int J Geriatr Psychiatry 2001;16:321-326.
34. Howe A, Bath P, Goudie F, et al. Getting the questions right: an example of loss of validity during transfer of a brief screening approach for depression in the elderly. Int J Geriatr Psychiatry 2000;15:650-655.
35. Lyketsos G, Baker L, Warren A, et al. Major and minor depression in Alzheimer’s disease: prevalence and impact. J Neuropsychiatry Clin Neurosci 1997;9:556-561.
36. Lyness JM, King DA, Cox C, Yoediono Z, Caine ED. The importance of subsyndromal depression in older primary care patients: prevalence and associated functional disability. J Am Geriatr Soc 1999;47:647-652.
37. Hendrie H, Callahan C, Levitt E. Prevalence rates of major depressive disorders: the effect of varying diagnostic criteria in an older primary care population. Am J Geriatr Psychiatry 1995;3:119-131.
38. Unutzer J, Patrick D, Simon G, et al. Depressive symptoms and the cost of health services in HMO patients aged 65 years and older. JAMA 1997;277:1618-1623.
39. Lavretsky H, Kumar A. Clinically significant non-major depression: old concepts, new insights. Am J Geriatr Psychiatry 2002;10:239-255.
40. Lebowitz BD, Pearson JL, Schneider LS, et al. Diagnosis and treatment of depression in late life. Consensus statement update. JAMA 1997;278:1186-1190.