User login
Establishing a Genetic Cancer Risk Assessment Clinic
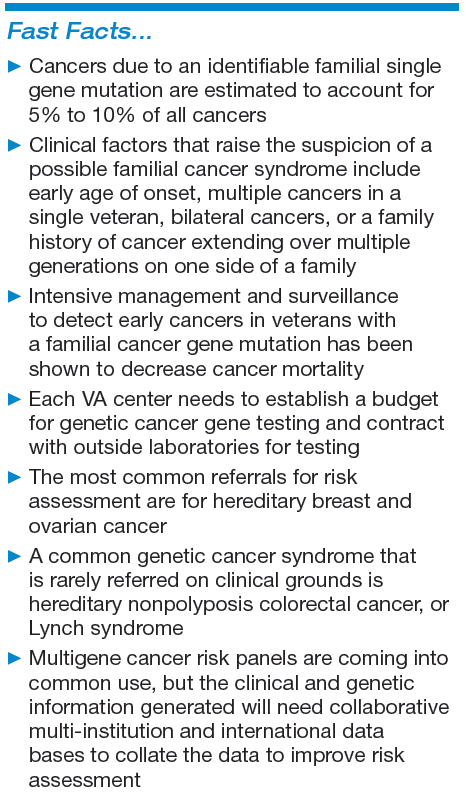
Genetic cancers are relatively uncommon but not rare. Although there has not been a comprehensive study of the incidence of cancers that are caused by an identifiable single gene mutation, it is estimated that they account for approximately 5% to 10% of all cancers, or 50,000 to 100,000 patients annually in the U.S.1 The hallmarks of a genetic cancer syndrome are early onset, multiple family members in multiple generations with cancer, bilateral cancer, and multiple cancers in the same person.
Until recently, the VA has not had a significant interest in genetic cancer risk assessment (GCRA). This is changing, however, because veterans with identified genetic risks for cancer can benefit from targeted screening and intervention strategies to lower their risk of dying of cancer. The value of GCRA was also recognized in the 2015 standards for accreditation of the American College of Surgeons, which include a requirement for programs to include a provision for GCRA.2
The 2 most common familial cancer syndromes are hereditary breast and ovarian cancer (HBOC) syndrome, which occurs in about 5% of all patients with breast cancer, and Lynch syndrome (LS), or hereditary nonpolyposis colorectal cancer (CRC) syndrome, which occurs in about 3% of all patients with CRC.3,4 Other familial cancer syndromes are rare: For example, familial adenomatous polyposis (FAP) accounts for 0.2% to 0.5% of all CRC cases.5
The Raymond G. Murphy VAMC in Albuquerque is the sole VA hospital in New Mexico. Its catchment area extends into southern Colorado, eastern Arizona, and western Texas. About 40 CRCs and 8 breast cancers are diagnosed at this facility yearly. Given the incidence of these familial cancer syndromes, one might expect to see 1 LS case/year, 1 HBOC case every 2 years, and 1 FAP or attenuated FAP case every 5 to 10 years.
Methods
In 2010, a GCRA clinic was set up to evaluate and manage treatment of veterans who might have inherited a genetic cancer syndrome. Prior to that, veterans with suspected genetic cancer family syndromes were referred to the University of New Mexico for evaluation and testing. Initially, the pathology department (PD) paid for genetic testing. However, due to the cost of testing, a formal budget for genetic testing was approved. Contracts were set up by the PD with outside laboratories for genetic testing services. For quality control, all veterans who were referred for genetic evaluation were seen by Dr. Lin.
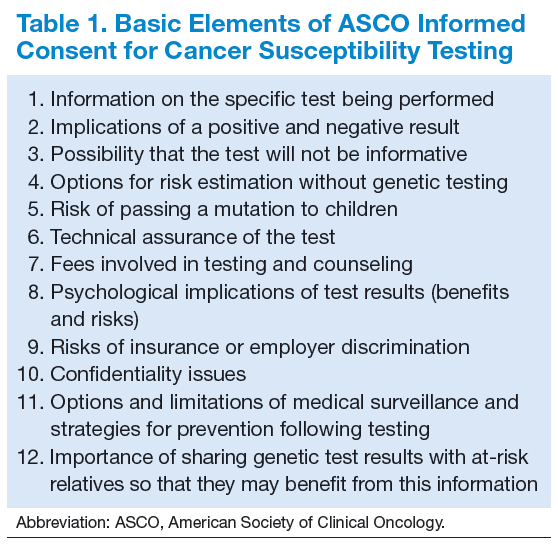
The initial consultation consisted of construction of a family pedigree and evaluation, using available models or tables, such as the Myriad tables (BRCA), Penn II BRCA, or PREMM1,2,6 (LS), to estimate likelihood of finding a mutation. Veterans who had a 10% likelihood of finding a gene mutation were counseled, following the American Society of Clinical Oncology guidelines (Table 1). Those who consented to genetic testing signed a consent form and were given a copy of that form and a copy of their family pedigree. Because the VA covers the cost of counseling and testing, cost was not discussed.
Veterans had a follow-up visit to review the test results. Patients were counseled on treatment recommendations, including a copy of current consensus recommendations, and disclosure to the family. The recommendations were then included in the patient’s electronic medical record. For example, BRCA patients had a discussion of risks and benefits of various management options, including breast magnetic resonance imaging, prophylactic mastectomy, and prophylactic bilateral salpingo-oophorectomy, once childbearing was complete.
Results
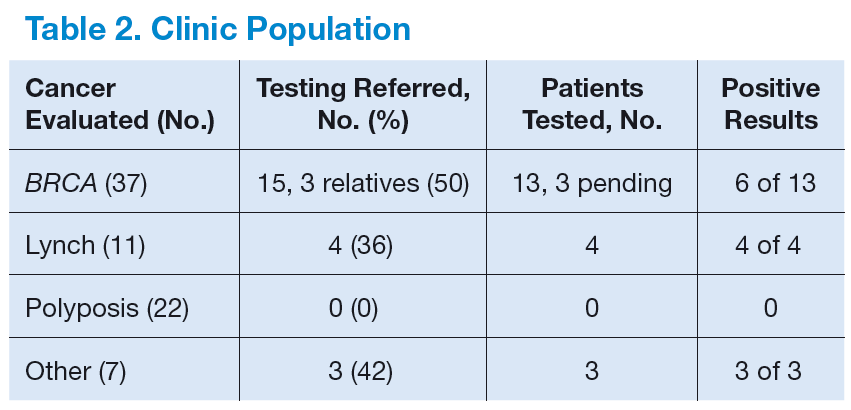
Table 2 shows the number of veterans referred to the GCRA clinic since it started in late 2010, categorized by the likely genetic syndrome, the number and percentage of veterans where genetic testing was recommended, and the results of testing. Four veterans, 2 with LS, 1 with CHEK2 mutation, and 1 with Peutz-Jeghers syndrome, were identified outside the VA system but were referred for counseling. One of the veterans with LS was referred by an outside provider who obtained a suspicious family history, and the other was identified via pathologic screening. The miscellaneous group included 1 veteran with MEN 1 and 1 veteran with Birt-Hogg-Dube.
There are a number of interesting results. Although the number of patients referred for LS was low, the number of annual referrals for possible BRCA was about equal to the number of patients with breast cancer who were diagnosed and treated yearly. Although this could have been due to pent up demand initially, the number of annual referrals has not decreased with time. Furthermore, the number of patients referred for polyposis has been considerably higher than would be expected by the rarity of attenuated FAP. Initially, patients with 10 to 20 polyps of any type were referred for evaluation. All but 1 had their first polyp diagnosed after the age of 50 years. Five veterans who were referred to GCRA had < 10 polyps lifetime, 3 veterans had between 10 and 20 polyps, and 12 veterans have had ≥ 20 adenomatous polyps over their lifetime. None seen to date have had a personal or family history of gastrointestinal (GI) cancer.
Discussion
A genetic cancer risk assessment clinic was set up in a VA hospital and has been running successfully for 4 years. Although many parts of setting up such a clinic are common to a community GCRA clinic, there are also aspects that are specific to a VA setting.6
Because genetic testing is relatively expensive, a budget must be set up and approved by VA administration. This budget is based on the estimated number of veterans that will be referred yearly, the likely percentage that will need to be tested, and the cost of testing. Currently, the average cost of a single gene test is about $2,000 to $3,000. Some patients will need to have 2 to 4 genes tested. Furthermore, many centers are now moving to multigene testing, and the cost of these panels is about $10,000 or more, though this is less than the cumulative cost of the genes done individually.
Since there is currently no national VA contract for genetic cancer testing, each VA facility needs to negotiate contracts with outside laboratories. Several of these laboratories offer gene panel testing, but the panels vary from one laboratory to another.
Limiting the number of providers who can order genetic testing helps maintain quality control and ensure a comprehensive database of patient testing. At the Albuquerque VAMC, Dr. Lin is currently the only provider who can order genetic testing for cancer risk assessment. Nearly all GCRA consultations, from obtaining a detailed family history to providing education on the risks, benefits, and limitations of genetic testing, can be conducted via telemedicine. The VA GCRA program in Utah has established a number of telemedicine collaborations with VA facilities around the country, beginning with BRCA consultations and branching out into a national LS screening program.
The first few years of the program have shown some unexpected results, including a much higher referral rate for HBOC referrals than was anticipated. The reasons for this are not clear. The high rate of polyposis referrals can be attributed in large part to the robust CRC screening program in the VA system. Veterans are routinely screened for CRC with occult blood tests, and positive results are referred for colonoscopy. Nearly 400 veterans per year have a colonoscopy at the Albuquerque VAMC.
Because the VA screening program begins at age 50 years, nearly all the veterans referred to date have had their first polyp diagnosed at age ≥ 50 years. Unfortunately, the 1 patient who had polyps and CRC at a young age was not tested due to lack of budget when she was evaluated. By contrast, in a large study, the median age of first polyp diagnosis in patients with APC mutation was 30 years, and with biallelic MUTYH mutations was 47 years.7
The difficulty in distinguishing which veterans should be tested for attenuated FAP lies in the fact that age of onset and personal or family history alone or in
combination do not seem to be adequate discriminators to screen out low-risk veterans who do not need testing.7 Considering the number of veterans referred each year and the incidence of attenuated FAP, if every veteran who fit the current criteria of 20 adenomatous polyps lifetime were tested, about 35 to 70 veterans would have to be tested to detect 1 mutation carrier. The development of clinical criteria to identify low-risk patients would be very helpful.
On the other hand, referrals for LS were uncommon. This is consistent with results reported elsewhere.8 For this reason, diagnosis of LS has shifted from clinical identification to pathologic screening for the molecular hallmarks of LS in tumor specimens.8,9 Shortly after the GCRA clinic was established, a pathologist with an interest in GI malignancies developed and validated a pathologic screening program using immunohistochemistry (IHC) staining for mismatch repair (MMR) gene expression, with the assistance of a pathologist who had been involved in a community-based LS screening program.9 For the past 3 years, all CRC patients aged ≤ 60 years have been screened for loss of expression of MMR IHC. Patients identified have been seen in the GCRA clinic to discuss possible genetic testing. This screening program is now extending to all patients with CRC aged ≤ 70 years, in line with consensus recommendations.10
The Future
The lack of a national VA contract with outside laboratories for genetic testing means that each facility has to negotiate its own contract, which is a wasteful duplication of resources that needs to be addressed. Beyond this parochial concern, GCRA is undergoing a revolution in diagnosing and managing cancer risk. In the past, a careful family history was followed by selected single gene testing for mutations, using Sanger sequencing. However, many laboratories are now offering multigene testing using next-generation sequencing that can look at multiple genes, all the way up to whole genome sequencing. Current estimates for the actual cost to the laboratory for a whole genome using next-generation sequencing is about $1,000.
A number of laboratories also have been offering multigene panels for testing in patients with familial cancer syndromes. The genes in these panels include those with a well-documented association with known cancer syndromes as well as other genes where mutations may confer only a modestly increased risk. Furthermore, new genetic syndromes and new genes associated with known syndromes are being reported yearly.
This revolution in technology and the virtual explosion in the amount of data generated have raised as many questions as answers.11 One joke in the genetic testing community goes: “$1,000 genome, $100,000 interpretation.” Among the remaining issues are how to counsel patients about the possible results from multigene testing, including the possibility of results that may be applicable to noncancer-related diagnoses; what to do about the unanticipated actionable finding (incidentaloma); how to interpret and treat a patient whose gene test results are at odds with the clinical family history; how to treat patients whose panel returns with a mutation in a gene that has only a minor increased risk for the cancers; how genes with modestly increased or decreased risk singly or in combination may modify highrisk gene expression; and how to address variants of unknown significance.
A general consensus has emerged that these questions will need much more research correlating genetic and clinical data to answer. As a result, many leading researchers have set up multi-institutional, international collaborative groups directed at specific syndromes, which pool data from many investigators to answer questions beyond the capability of any single investigator or group. These big data collaborative studies are already beginning to publish early results and seem to represent the future of genetic cancer risk assessment, a field that is at once dynamic, exciting, and confusing.4
A major question is whether and how the VA can cooperate with these international consortia. The VA has particular concerns about confidentiality based on past experience, but it also has a unique group of patients who could provide valuable contributions to our knowledge about genetic markers for disease, including cancer. A method for the VA system to provide data to collaborative groups who are advancing our knowledge of the genetic risk factors for cancer while protecting the confidentiality of veterans could provide a model for collaboration between the VA and non-VA health care systems.
Author disclosures
The author reports no actual or potential conflicts of interest with regard to this article.
Disclaimer
The opinions expressed herein are those of the author and do not necessarily reflect those of Federal Practitioner, Frontline Medical Communications Inc., the U.S. Government, or any of its agencies. This article may discuss unlabeled or investigational use of certain drugs. Please review the complete prescribing information for specific drugs or drug combinations—including indications, contraindications, warnings, and adverse effects—before administering pharmacologic therapy to patients.
Click here to read the digital edition.
1. Claus EB, Schildkraut JM, Thompson WD, Risch NJ. The genetic attributable risk of breast and ovarian cancer. Cancer. 1996;77(11):2318-2324.
2. American College of Surgeons. Cancer Program Standards 2012: Ensuring Patient- Centered Care, v1.2.1. Chicago, IL: American College of Surgeons; 2012. https://www.facs.org/~/media/files/quality%20programs/cancer/coc/programstandards2012.ashx. Accessed July 6, 2015.
3. Campeau PM, Foulkes WD, Tischkowitz MD. Hereditary breast cancer: new genetic developments, new therapeutic avenues. Hum Genet. 2008;124(1):31-34.
4. Moreira L, Balaguer F, Lindor N, et al; EPICOLON Consortium. Identification of Lynch syndrome among patients with colorectal cancer. JAMA. 2012;308(15):1555-1565.
5. Bülow S, Faurschou Nielsen T, Bülow C, Bisgaard ML, Karlsen L, Moesgaard F. The incidence rate of familial adenomatous polyposis. Results from the Danish Polyposis Register. Int J Colorect Dis. 1996;11(2):88-91.
6. Duncan PR, Lin JT. Ingredients for success: a familial cancer clinic in an oncology
practice setting. J Oncol Pract. 2011;7(1):39-42.
7. Grover S, Kastrinos F, Steyerberg EW, et al. Prevalence and phenotypes of APC and MUTYH mutations in patients with multiple colorectal adenomas. JAMA. 2012;308(5):485-492.
8. Hampel H, de la Chapelle A. How do we approach the goal of identifying everybody with Lynch syndrome? Fam Cancer. 2013;12(2):313-317.
9. Duncan PR, Lin JT, Feddersen R. Prospective screening for Lynch syndrome (LS) in a cohort of colorectal cancer (CRC) surgical patients in a community hospital. J Clin Oncol. 2010;28(suppl; abstr 1535):15s.
10. Giardiello FM, Allen JI, Axilbund JE, et al. Guidelines on genetic evaluation and management of Lynch syndrome: a consensus statement by the US Multi-Society Task Force on Colorectal Cancer. Dis Colon Rectum. 2014;57(8):1025-1048.
11. Domchek SM, Bradbury A, Garber JE, Offit K, Robson ME. Multiplex genetic testing for cancer susceptibility: out on a high wire without a net? J Clin Oncol. 2013;31(10):1267-1270.
Genetic cancers are relatively uncommon but not rare. Although there has not been a comprehensive study of the incidence of cancers that are caused by an identifiable single gene mutation, it is estimated that they account for approximately 5% to 10% of all cancers, or 50,000 to 100,000 patients annually in the U.S.1 The hallmarks of a genetic cancer syndrome are early onset, multiple family members in multiple generations with cancer, bilateral cancer, and multiple cancers in the same person.
Until recently, the VA has not had a significant interest in genetic cancer risk assessment (GCRA). This is changing, however, because veterans with identified genetic risks for cancer can benefit from targeted screening and intervention strategies to lower their risk of dying of cancer. The value of GCRA was also recognized in the 2015 standards for accreditation of the American College of Surgeons, which include a requirement for programs to include a provision for GCRA.2
The 2 most common familial cancer syndromes are hereditary breast and ovarian cancer (HBOC) syndrome, which occurs in about 5% of all patients with breast cancer, and Lynch syndrome (LS), or hereditary nonpolyposis colorectal cancer (CRC) syndrome, which occurs in about 3% of all patients with CRC.3,4 Other familial cancer syndromes are rare: For example, familial adenomatous polyposis (FAP) accounts for 0.2% to 0.5% of all CRC cases.5
The Raymond G. Murphy VAMC in Albuquerque is the sole VA hospital in New Mexico. Its catchment area extends into southern Colorado, eastern Arizona, and western Texas. About 40 CRCs and 8 breast cancers are diagnosed at this facility yearly. Given the incidence of these familial cancer syndromes, one might expect to see 1 LS case/year, 1 HBOC case every 2 years, and 1 FAP or attenuated FAP case every 5 to 10 years.
Methods
In 2010, a GCRA clinic was set up to evaluate and manage treatment of veterans who might have inherited a genetic cancer syndrome. Prior to that, veterans with suspected genetic cancer family syndromes were referred to the University of New Mexico for evaluation and testing. Initially, the pathology department (PD) paid for genetic testing. However, due to the cost of testing, a formal budget for genetic testing was approved. Contracts were set up by the PD with outside laboratories for genetic testing services. For quality control, all veterans who were referred for genetic evaluation were seen by Dr. Lin.
The initial consultation consisted of construction of a family pedigree and evaluation, using available models or tables, such as the Myriad tables (BRCA), Penn II BRCA, or PREMM1,2,6 (LS), to estimate likelihood of finding a mutation. Veterans who had a 10% likelihood of finding a gene mutation were counseled, following the American Society of Clinical Oncology guidelines (Table 1). Those who consented to genetic testing signed a consent form and were given a copy of that form and a copy of their family pedigree. Because the VA covers the cost of counseling and testing, cost was not discussed.
Veterans had a follow-up visit to review the test results. Patients were counseled on treatment recommendations, including a copy of current consensus recommendations, and disclosure to the family. The recommendations were then included in the patient’s electronic medical record. For example, BRCA patients had a discussion of risks and benefits of various management options, including breast magnetic resonance imaging, prophylactic mastectomy, and prophylactic bilateral salpingo-oophorectomy, once childbearing was complete.
Results
Table 2 shows the number of veterans referred to the GCRA clinic since it started in late 2010, categorized by the likely genetic syndrome, the number and percentage of veterans where genetic testing was recommended, and the results of testing. Four veterans, 2 with LS, 1 with CHEK2 mutation, and 1 with Peutz-Jeghers syndrome, were identified outside the VA system but were referred for counseling. One of the veterans with LS was referred by an outside provider who obtained a suspicious family history, and the other was identified via pathologic screening. The miscellaneous group included 1 veteran with MEN 1 and 1 veteran with Birt-Hogg-Dube.
There are a number of interesting results. Although the number of patients referred for LS was low, the number of annual referrals for possible BRCA was about equal to the number of patients with breast cancer who were diagnosed and treated yearly. Although this could have been due to pent up demand initially, the number of annual referrals has not decreased with time. Furthermore, the number of patients referred for polyposis has been considerably higher than would be expected by the rarity of attenuated FAP. Initially, patients with 10 to 20 polyps of any type were referred for evaluation. All but 1 had their first polyp diagnosed after the age of 50 years. Five veterans who were referred to GCRA had < 10 polyps lifetime, 3 veterans had between 10 and 20 polyps, and 12 veterans have had ≥ 20 adenomatous polyps over their lifetime. None seen to date have had a personal or family history of gastrointestinal (GI) cancer.
Discussion
A genetic cancer risk assessment clinic was set up in a VA hospital and has been running successfully for 4 years. Although many parts of setting up such a clinic are common to a community GCRA clinic, there are also aspects that are specific to a VA setting.6
Because genetic testing is relatively expensive, a budget must be set up and approved by VA administration. This budget is based on the estimated number of veterans that will be referred yearly, the likely percentage that will need to be tested, and the cost of testing. Currently, the average cost of a single gene test is about $2,000 to $3,000. Some patients will need to have 2 to 4 genes tested. Furthermore, many centers are now moving to multigene testing, and the cost of these panels is about $10,000 or more, though this is less than the cumulative cost of the genes done individually.
Since there is currently no national VA contract for genetic cancer testing, each VA facility needs to negotiate contracts with outside laboratories. Several of these laboratories offer gene panel testing, but the panels vary from one laboratory to another.
Limiting the number of providers who can order genetic testing helps maintain quality control and ensure a comprehensive database of patient testing. At the Albuquerque VAMC, Dr. Lin is currently the only provider who can order genetic testing for cancer risk assessment. Nearly all GCRA consultations, from obtaining a detailed family history to providing education on the risks, benefits, and limitations of genetic testing, can be conducted via telemedicine. The VA GCRA program in Utah has established a number of telemedicine collaborations with VA facilities around the country, beginning with BRCA consultations and branching out into a national LS screening program.
The first few years of the program have shown some unexpected results, including a much higher referral rate for HBOC referrals than was anticipated. The reasons for this are not clear. The high rate of polyposis referrals can be attributed in large part to the robust CRC screening program in the VA system. Veterans are routinely screened for CRC with occult blood tests, and positive results are referred for colonoscopy. Nearly 400 veterans per year have a colonoscopy at the Albuquerque VAMC.
Because the VA screening program begins at age 50 years, nearly all the veterans referred to date have had their first polyp diagnosed at age ≥ 50 years. Unfortunately, the 1 patient who had polyps and CRC at a young age was not tested due to lack of budget when she was evaluated. By contrast, in a large study, the median age of first polyp diagnosis in patients with APC mutation was 30 years, and with biallelic MUTYH mutations was 47 years.7
The difficulty in distinguishing which veterans should be tested for attenuated FAP lies in the fact that age of onset and personal or family history alone or in
combination do not seem to be adequate discriminators to screen out low-risk veterans who do not need testing.7 Considering the number of veterans referred each year and the incidence of attenuated FAP, if every veteran who fit the current criteria of 20 adenomatous polyps lifetime were tested, about 35 to 70 veterans would have to be tested to detect 1 mutation carrier. The development of clinical criteria to identify low-risk patients would be very helpful.
On the other hand, referrals for LS were uncommon. This is consistent with results reported elsewhere.8 For this reason, diagnosis of LS has shifted from clinical identification to pathologic screening for the molecular hallmarks of LS in tumor specimens.8,9 Shortly after the GCRA clinic was established, a pathologist with an interest in GI malignancies developed and validated a pathologic screening program using immunohistochemistry (IHC) staining for mismatch repair (MMR) gene expression, with the assistance of a pathologist who had been involved in a community-based LS screening program.9 For the past 3 years, all CRC patients aged ≤ 60 years have been screened for loss of expression of MMR IHC. Patients identified have been seen in the GCRA clinic to discuss possible genetic testing. This screening program is now extending to all patients with CRC aged ≤ 70 years, in line with consensus recommendations.10
The Future
The lack of a national VA contract with outside laboratories for genetic testing means that each facility has to negotiate its own contract, which is a wasteful duplication of resources that needs to be addressed. Beyond this parochial concern, GCRA is undergoing a revolution in diagnosing and managing cancer risk. In the past, a careful family history was followed by selected single gene testing for mutations, using Sanger sequencing. However, many laboratories are now offering multigene testing using next-generation sequencing that can look at multiple genes, all the way up to whole genome sequencing. Current estimates for the actual cost to the laboratory for a whole genome using next-generation sequencing is about $1,000.
A number of laboratories also have been offering multigene panels for testing in patients with familial cancer syndromes. The genes in these panels include those with a well-documented association with known cancer syndromes as well as other genes where mutations may confer only a modestly increased risk. Furthermore, new genetic syndromes and new genes associated with known syndromes are being reported yearly.
This revolution in technology and the virtual explosion in the amount of data generated have raised as many questions as answers.11 One joke in the genetic testing community goes: “$1,000 genome, $100,000 interpretation.” Among the remaining issues are how to counsel patients about the possible results from multigene testing, including the possibility of results that may be applicable to noncancer-related diagnoses; what to do about the unanticipated actionable finding (incidentaloma); how to interpret and treat a patient whose gene test results are at odds with the clinical family history; how to treat patients whose panel returns with a mutation in a gene that has only a minor increased risk for the cancers; how genes with modestly increased or decreased risk singly or in combination may modify highrisk gene expression; and how to address variants of unknown significance.
A general consensus has emerged that these questions will need much more research correlating genetic and clinical data to answer. As a result, many leading researchers have set up multi-institutional, international collaborative groups directed at specific syndromes, which pool data from many investigators to answer questions beyond the capability of any single investigator or group. These big data collaborative studies are already beginning to publish early results and seem to represent the future of genetic cancer risk assessment, a field that is at once dynamic, exciting, and confusing.4
A major question is whether and how the VA can cooperate with these international consortia. The VA has particular concerns about confidentiality based on past experience, but it also has a unique group of patients who could provide valuable contributions to our knowledge about genetic markers for disease, including cancer. A method for the VA system to provide data to collaborative groups who are advancing our knowledge of the genetic risk factors for cancer while protecting the confidentiality of veterans could provide a model for collaboration between the VA and non-VA health care systems.
Author disclosures
The author reports no actual or potential conflicts of interest with regard to this article.
Disclaimer
The opinions expressed herein are those of the author and do not necessarily reflect those of Federal Practitioner, Frontline Medical Communications Inc., the U.S. Government, or any of its agencies. This article may discuss unlabeled or investigational use of certain drugs. Please review the complete prescribing information for specific drugs or drug combinations—including indications, contraindications, warnings, and adverse effects—before administering pharmacologic therapy to patients.
Click here to read the digital edition.
1. Claus EB, Schildkraut JM, Thompson WD, Risch NJ. The genetic attributable risk of breast and ovarian cancer. Cancer. 1996;77(11):2318-2324.
2. American College of Surgeons. Cancer Program Standards 2012: Ensuring Patient- Centered Care, v1.2.1. Chicago, IL: American College of Surgeons; 2012. https://www.facs.org/~/media/files/quality%20programs/cancer/coc/programstandards2012.ashx. Accessed July 6, 2015.
3. Campeau PM, Foulkes WD, Tischkowitz MD. Hereditary breast cancer: new genetic developments, new therapeutic avenues. Hum Genet. 2008;124(1):31-34.
4. Moreira L, Balaguer F, Lindor N, et al; EPICOLON Consortium. Identification of Lynch syndrome among patients with colorectal cancer. JAMA. 2012;308(15):1555-1565.
5. Bülow S, Faurschou Nielsen T, Bülow C, Bisgaard ML, Karlsen L, Moesgaard F. The incidence rate of familial adenomatous polyposis. Results from the Danish Polyposis Register. Int J Colorect Dis. 1996;11(2):88-91.
6. Duncan PR, Lin JT. Ingredients for success: a familial cancer clinic in an oncology
practice setting. J Oncol Pract. 2011;7(1):39-42.
7. Grover S, Kastrinos F, Steyerberg EW, et al. Prevalence and phenotypes of APC and MUTYH mutations in patients with multiple colorectal adenomas. JAMA. 2012;308(5):485-492.
8. Hampel H, de la Chapelle A. How do we approach the goal of identifying everybody with Lynch syndrome? Fam Cancer. 2013;12(2):313-317.
9. Duncan PR, Lin JT, Feddersen R. Prospective screening for Lynch syndrome (LS) in a cohort of colorectal cancer (CRC) surgical patients in a community hospital. J Clin Oncol. 2010;28(suppl; abstr 1535):15s.
10. Giardiello FM, Allen JI, Axilbund JE, et al. Guidelines on genetic evaluation and management of Lynch syndrome: a consensus statement by the US Multi-Society Task Force on Colorectal Cancer. Dis Colon Rectum. 2014;57(8):1025-1048.
11. Domchek SM, Bradbury A, Garber JE, Offit K, Robson ME. Multiplex genetic testing for cancer susceptibility: out on a high wire without a net? J Clin Oncol. 2013;31(10):1267-1270.
Improving Patient Satisfaction in Dermatology: A Prospective Study of an Urban Dermatology Clinic
The Patient Protection and Affordable Care Act was signed into law in 2010, aiming to expand access to and improve the quality of health care in the United States. In the states that expanded Medicaid eligibility, uninsurance among adults decreased from 15.8% in September 2013 to 7.3% in March 2016, a decline of 53.8%.1 On average, these newly insured individuals were younger and more likely to report fair to poor health than those previously insured. Approximately half of the newly insured have family incomes at or below 138% of the federal poverty level.1
Improvement in quality in medicine is not as easily quantified. Several programs have been implemented through the Centers for Medicare & Medicaid Services to measure and reimburse hospital systems and providers based on the quality and value of care being provided. Because of the complexity in defining quality in medicine, patient satisfaction has become a proxy measurement tool.2 With higher numbers of insured patients and an increased demand for services, dermatologists are being challenged to improve availability of services and respond to patients’ needs and desires as expressed through satisfaction surveys.
Few studies have assessed patient satisfaction in dermatology practices. As patient satisfaction surveys move to the forefront under the Patient Protection and Affordable Care Act, hospitals and providers will try to demonstrate the quality of their care through positive survey responses from patients. Importantly, patient satisfaction is a strong determinate if patients will comply with treatment and continue seeing their practitioner.3 A better understanding of patients’ perceptions regarding quality will allow for targeted interventions to be implemented. This study assesses and analyzes patient satisfaction, nonattendance rates, and cycle times in an outpatient dermatology clinic to provide a snapshot of patient satisfaction in an urban dermatology clinic.
Dr. Adam Sutton discusses the results of this study with Editor-in-Chief Vincent A. DeLeo, MD, in a "Peer to Peer" audiocast, "Measuring Patient Satisfaction: How Do Patients Perceive Quality of Care Delivered by Dermatologists?"
Methods
We conducted a prospective study that was approved by the University of Southern California Health Sciences (Los Angeles, California) institutional review board. A convenience sample of patients 18 years and older who spoke English or Spanish were recruited to participate in the study and agreed to complete the Patient Satisfaction Questionnaire Short Form (PSQ-18) and a demographic questionnaire, both in English or Spanish, at the conclusion of their visit.
Based on schedules and availability, medical students came to our clinic and obtained the surveys in the following manner: After patients checked in, the students approached the patients in the waiting area and asked if they would be willing to participate in the study. If patients agreed to participate, they provided written consent and the medical student handed them an envelope containing paper copies of the survey in English or Spanish, depending on the patient’s preference. Patients were asked to complete the surveys at the end of the visit and return them to the student in the envelope. The medical students did not otherwise participate in the patient’s visit.
Surveys were collected over an 8-month period at Los Angeles County+USC Medical Center dermatology clinics, which are part of a large safety-net health system. Among this population, it is common for patients to lack reliable Internet access or permanent home addresses; therefore, we elected to use point-of-care printed survey forms. Midway through the survey collection, we moved our clinic location; however, patients and physicians did not change. The comparison between clinics showed no substantive differences and did not change the conclusions of the study.
Patient Demographics
Demographic variables were age, sex, ethnicity, highest education level, annual household income, and primary language. Patients were grouped into 4 age categories: 18 to 29 years, 30 to 49 years, 50 to 64 years, and 65 years and older. Ethnicity was classified as Hispanic/Latino or other. Highest education level was classified as high school diploma or lower, and some college or higher. Annual household income was grouped into 3 categories: less than $15,000, $15,000 to $35,000, and more than $35,000.
Patient Satisfaction Questionnaire
The PSQ-18 survey was developed by the RAND Corporation (Santa Monica, California) and has been validated.4 The survey asks patients to rate aspects of their care experience on a 5-point Likert scale (strongly agree, agree, uncertain, disagree, strongly disagree), with 5 representing highest satisfaction. The survey contains 18 questions and is scored on 7 subscales: general satisfaction, technical quality, interpersonal manner, communication, financial aspects, time spent with doctor, and accessibility and convenience. The survey typically takes less than 5 minutes to complete.
Cycle Times and Nonattendance Rates
Cycle time is defined as the total amount of time that a patient spends in a clinic from check in to checkout, which was collected from our scheduling system for each patient who agreed to participate in the study. Cycle times were grouped into 4 categories: 0 to 60 minutes, 61 to 90 minutes, 91 to 120 minutes, and 121 minutes or more. During the study period, data also were collected from the electronic health record system regarding the number of patients with appointments scheduled and the number of patients who attended each clinic. From these figures, the rate of nonattendance for each clinic was calculated.
Statistical Analysis
Demographic results were calculated using arithmetic means. The PSQ-18 subscale scores were compared among demographic subgroups using a generalized linear model. Covariates included age, sex, ethnicity, highest education level, annual household income, and primary language. All statistical analyses were conducted using SAS software version 9.2.
Results
Of the 298 participants surveyed, the average age was 49 years, 51% were male, 73% self-identified as Hispanic/Latino, 64% spoke Spanish, 58% had a high school diploma or lower, and 68% reported an annual household income of less than $15,000 (Table 1).
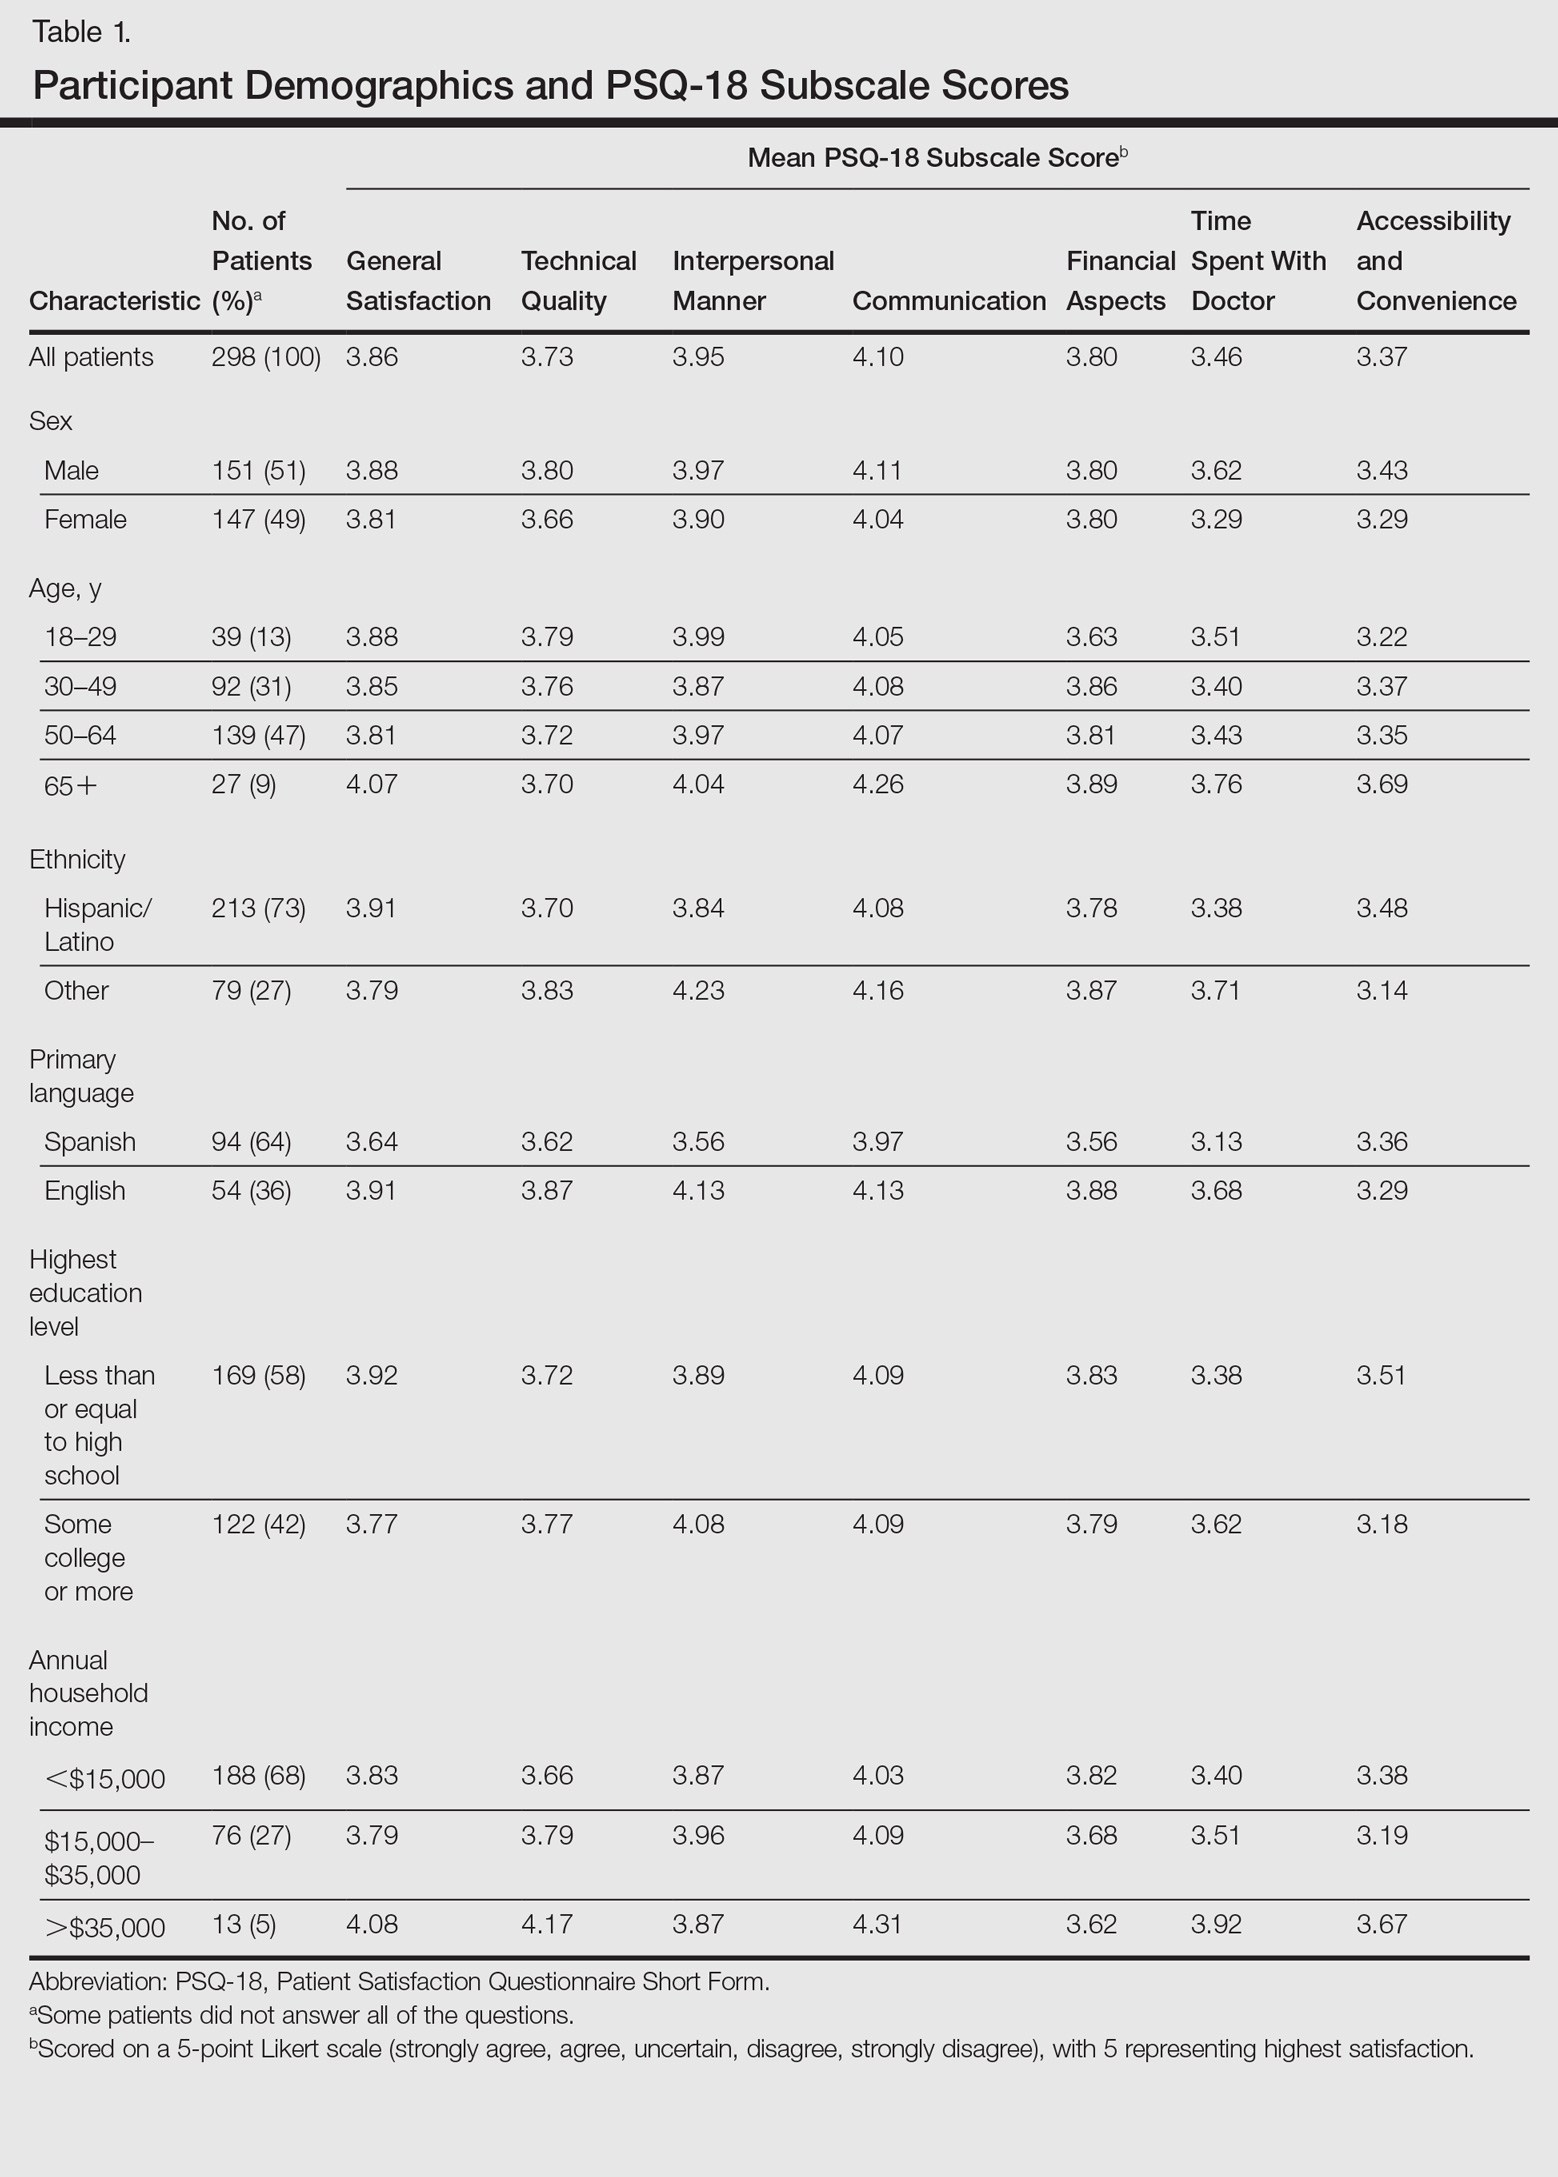
Table 1 shows PSQ-18 scores for all patients stratified by demographics. Notably, patients with some college or more were significantly more satisfied on the interpersonal manner (P<.03) and time spent with doctor (P<.007) subscales when compared to those who were less educated, but they had lower general satisfaction scores (P<.001). Patients with a reported annual household income of greater than $35,000 were more satisfied on the technical quality (P<.07) and time spent with doctor (P<.04) subscales when compared to those making less than $15,000. The patients with a household income greater than $35,000 also were more satisfied with accessibility and convenience (P<.05) than those making $15,000 to $35,000. When stratified by sex, the time spent with doctor subscale was significantly higher in males than females (P<.001). (Statistically significant differences when stratifying by age, ethnicity, and language are noted in the “Comment” section.)
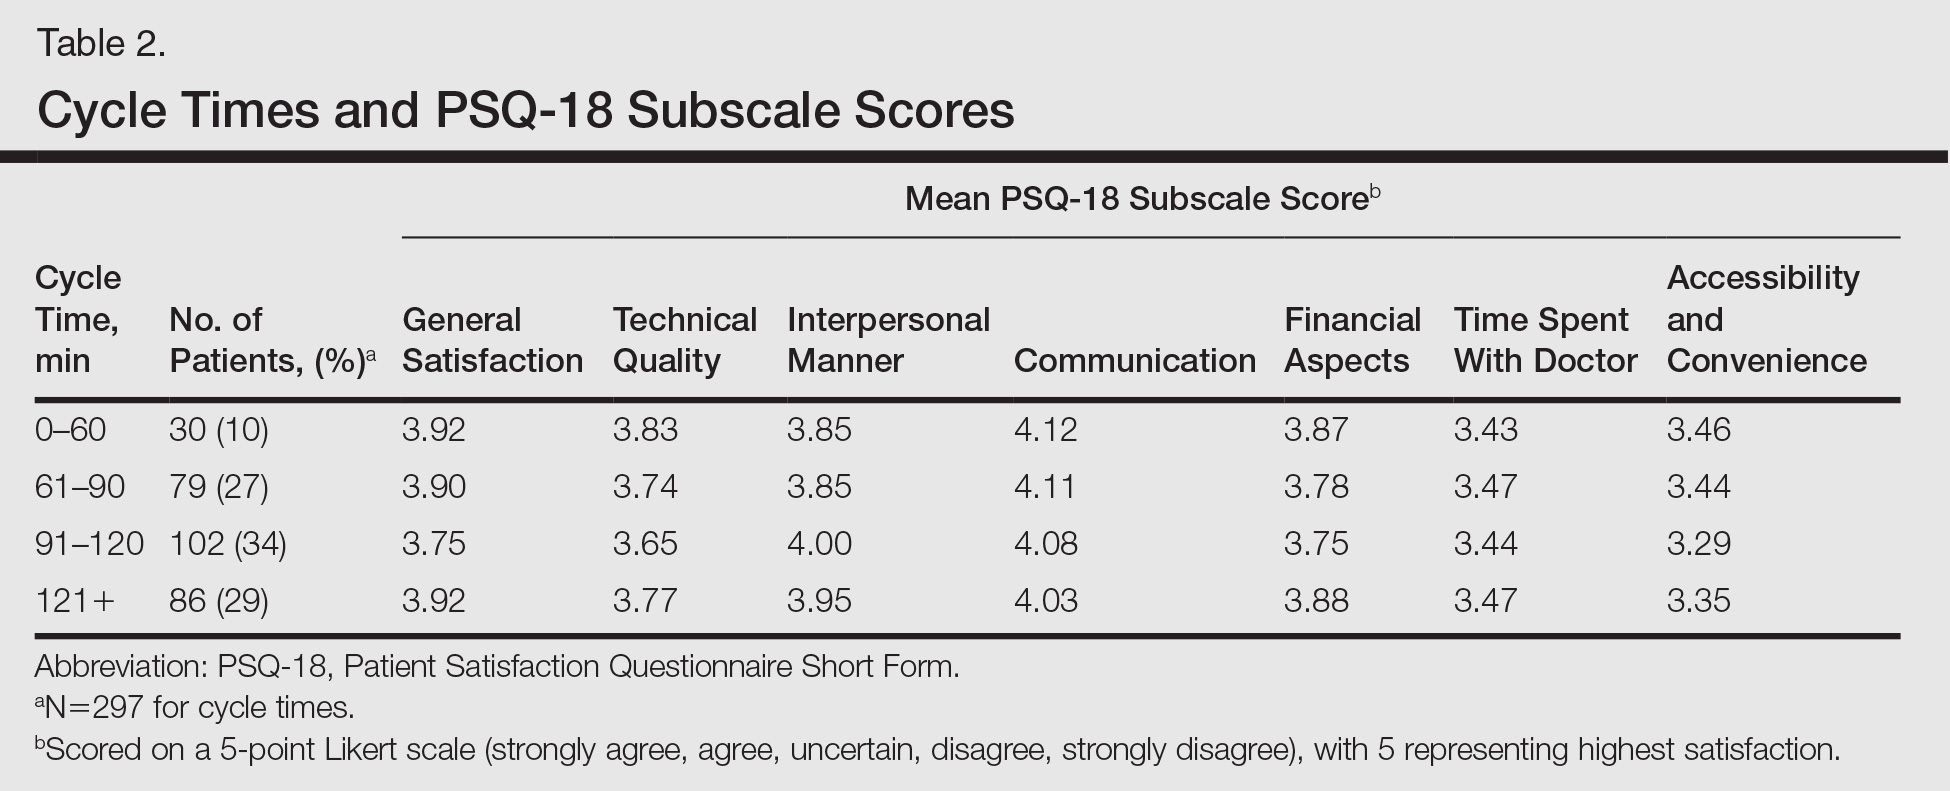
Patients’ average cycle time from check in to checkout was 102 minutes (range, 24–177 minutes). There was no statistically significant difference in patient satisfaction subscale scores when stratifying patients by cycle time. During a period comparable to the time that surveys were collected, our mean (standard deviation [SD]) nonattendance rate was 30% (7%). Therefore, based on 2 SDs, there was a 95% chance that 16% to 44% of patients would not attend their scheduled appointments in each clinic.
Comment
Our dermatology clinic received an average general satisfaction subscale score of 3.86. Although the general impression of patients was positive, there were subscale scores in which the clinic performed below the general satisfaction score; the 2 lowest were time spent with doctor (3.46), and accessibility and convenience (3.37). One possible explanation for the lower time spent with doctor subscale score relates to visiting an academic medical center. Patients often are seen sequentially by a medical student, resident, and supervising physician. This educational model contributes to long cycle times; indeed, average patient visit length was more than 1.5 hours in our study. Meanwhile, patients may consider their “doctor” to be the last member of the medical team they see; thus, the percentage of the clinic visit time that a supervising physician spends with the patient may be perceived by patients as short compared to the overall time spent in the clinic.
Surprisingly, there was no statistically significant difference in patient satisfaction subscale scores, including time spent with doctor, for patients with longer cycle times compared to short cycle times (Table 2), which suggests that the length of clinic visits may have been longer than the threshold for further effect on satisfaction scores. To this point, prior research has shown that patient satisfaction notably drops after 15 minutes of waiting,5 defined as the time from check in to when the patient first sees the provider. Our data set did not allow us to analyze wait time by that definition. However, we used cycle time, which includes various periods of waiting during the patient’s visit. If we had more data points on cycle times less than 30 minutes, we might have detected a clearer relationship of cycle times to patient satisfaction scores.
Satisfaction may not have varied with longer cycle times because differing perceptions might have balanced each other; in some cases, longer cycle times might reflect additional time spent with the provider, which could be perceived as valuable by the patient, and for others the long cycle time might be dissatisfying. Nevertheless, many of our patients were familiar with the county health system and expected to spend 90 minutes or more in clinic for each visit. Regardless, newly insured patients may have different expectations on how their health care should be delivered, an issue that could be investigated in the future.
The accessibility and convenience subscale scores reflected patients’ perception of timeliness and availability of medical care. The way that patients are scheduled at our clinic likely affected this subscale score, as patients must be referred through their primary care provider or the emergency department. We believe that many patients consider the wait for a primary care appointment as part of the overall wait for a dermatology appointment, which affects perception of accessibility and convenience for our clinic.
When we stratified by age, ethnicity, and language, other interesting trends occurred in satisfaction scores. Patients older than 65 years had a statistically significant higher accessibility and convenience subscale score when compared to the groups aged 18 to 29 years (P<.02) and 50 to 64 years (P<.05) as well as a higher but not statistically significant score compared to those aged 30 to 49 years (P<.07). Possible explanations include that older patients are familiar with the workings of our health system or that some of our patients older than 65 years may be retired and have fewer daily obligations. For the time spent with doctor subscale score, patients older than 65 years had higher scores when compared to those aged 30 to 49 years (P<.06) and 50 to 64 years (P<.07), perhaps because providers are spending more time with older individuals who may have more medical issues. A study involving a family medicine clinic also found that older patients were more satisfied with their overall care,6 which may be important given the changing demographics of Americans seeking medical care.
Differences in patient satisfaction when our patients were stratified by primary language and self-identified ethnicity also were noted. English-speaking patients were significantly more satisfied than Spanish-speaking patients in 4 subscales of satisfaction: technical quality (P<.01), interpersonal manner (P<.0001), financial aspects (P<.02), and time spent with doctor (P<.0006). For ethnicity, non-Hispanic/Latino patients had significantly higher subscale satisfaction scores for interpersonal manner (P<.0001) and time spent with doctor (P<.005). Variability in patient satisfaction based on primary language spoken and ethnicity has been described in other health care settings. Differences in satisfaction with care, understanding of potential side effects of a medication, compliance, and perceived rapport with physicians have been described.7-9
In addition to validating quality of care through patient satisfaction surveys, providers will be challenged to increase access to dermatologic services. Health systems that accept predominately Medicaid insurance, such as academic medical centers and safety-net hospitals, will be responsible for caring for millions of newly insured Medicaid patients. However, our high and variable nonattendance rates lead to inefficient use of our resources, often reducing the number of patients that are seen.
Canizares and Penneys10 studied an urban dermatology clinic over a 6-month period (N=508) and found that 17% of patients failed to keep their appointments; the subgroup of individuals with state-assisted insurance plans had the highest nonattendance rate (26%).10 In contrast, a group from Canada (N=5300) found that the nonattendance rate in a private dermatology practice was less than 8%.11 Our average nonattendance rate of 30% is within the range for urban clinics10,12; however, our SD of 7% leads to a high variability in patient volume each clinic day. As a result, on many days a reduced number of patients are seen resulting in a higher per-patient cost of delivering care.
Limitations
A potential bias is that the surveys were completed in the clinic and patients may have been concerned about possible repercussions for negative evaluations, which may have skewed results to be more positive than they otherwise would have been. We attempted to minimize this potential bias by having medical students who were not involved in the patients’ care administer the surveys. We also advised patients that their individual surveys would not be given to their providers and that any identifying information would be removed during data analysis. Our inferences could be affected by use of the terms satisfied and very satisfied in our patient satisfaction survey. Although we may interpret the results as patients reporting their degree of satisfaction, the patient may mean that there is room for improvement.13 Therefore, a survey that allows for more varied responses could potentially lead to different results.
Conclusion
Dermatology practitioners can support the specialty and validate the work they do by achieving high patient satisfaction scores. A study of online reviews compared patient ratings from 23 specialties and found that dermatology ranked second to last, ahead of only psychiatry.14 Our data has highlighted several opportunities to implement interventions that might improve patient satisfaction, though future studies would be required. Expanding or changing office hours, hiring more providers, or improving telephone access are potential interventions that might improve the accessibility and convenience subscale of patient satisfaction. Reducing the variability of nonattendance rates through the creation of resources to provide patients with clear directions and travel options, reminder calls, and instituting fees for missed appointments in some patient populations might allow for more predictable scheduling to optimize flow and the number of patients seen in each clinic.
Other approaches to improve satisfaction scores based on our results could include simple measures such as increasing the perception of time spent with the patient by having the physician sit down briefly in the examination room.15,16 It might be helpful to streamline translation assistance for patients who do not speak English as a primary language. It may be useful to recognize that younger patients have different expectations for clinic visits. For example, offering online scheduling to improve accessibility and convenience may improve satisfaction, particularly in patients who are accustomed to using technology.
It is our hope that while dermatologists continue to provide high quality care, they will work to demonstrate the value of their care by becoming leaders in patient satisfaction. Connecting their satisfaction with health care to patients’ quality of life has the potential to validate our specialty to insurers.
- Shatzer A, Long SK, Zuckerman S. Who are the newly insured as of early March 2014? Urban Institute Health Policy Center website. http://hrms.urban.org/briefs/Who-Are-the-Newly-Insured.html. Published May 22, 2014. Accessed March 17, 2017.
- Press I. Patient Satisfaction: Understanding and Measuring the Experience of Care. 2nd ed. Chicago, IL: Health Administration Press; 2006.
- Carr-Hill RA. The measurement of patient satisfaction. J Public Health Med. 1992;14:236-249.
- Thayparan A, Mahdi E. The Patient Satisfaction Questionnaire Short Form (PSQ-18) as an adaptable, reliable, and validated tool for use in various settings. Med Educ Online. 2013;18:21747.
- Garcia D, Kennedy C, Langager, J, et al. Pulse report 2009: outpatient: patient perspectives on American health care. South Bend, IN: Press Ganey Associates, Inc; 2009.
- Wetmore S, Boisvert L, Graham E, et al. Patient satisfaction with access and continuity of care in a multidisciplinary academic family medicine clinic. Can Fam Physician. 2014;60:E230-E236.
- Carrasquillo O, Orav EJ, Brennan TA, et al. Impact of language barriers on patient satisfaction in an emergency department. J Gen Intern Med. 1999;14:82-87.
- David RA, Rhee M. The impact of language as a barrier to effective health care in an underserved urban Hispanic community. Mt Sinai J Med. 1998;65:393-397.
- Ferguson WJ, Candib LM. Culture, language, and the doctor-patient relationship. Fam Med. 2002;34:353-361.
- Canizares MJ, Penneys NS. The incidence of nonattendance at an urgent care dermatology clinic. J Am Acad Dermatol. 2002;46:457-459.
- Pehr K. No show: incidence of nonattendance at a dermatology practice in a single universal payer model. J Cutan Med Surg. 2007;11:53-56.
- Penneys N, Glaser DA. The incidence of cancellation and non-attendance at a dermatology clinic. J Am Acad Dermatol. 1999;40:714-718.
- Collins K, O’Cathain A. The continuum of patient satisfaction—from satisfied to very satisfied. Soc Sci Med. 2003;57:2465-2470.
- Internet study: highest educated & trained doctors get poorest online reviews [news release]. Denver, CO: Vanguard Communications; April 22, 2015. https://vanguardcommunications.net/best-online-doctor-reviews/. Accessed November 28, 2016.
- Swayden KJ, Anderson KK, Connelly LM, et al. Effect of sitting vs. standing on perception of provider time at bedside: a pilot study. Patient Educ Couns. 2012;86:166-171.
- Sorenson E, Malakouti M, Brown G, et al. Enhancing patient satisfaction in dermatology. Am J Clin Dermatol. 2015;16:1-4.
The Patient Protection and Affordable Care Act was signed into law in 2010, aiming to expand access to and improve the quality of health care in the United States. In the states that expanded Medicaid eligibility, uninsurance among adults decreased from 15.8% in September 2013 to 7.3% in March 2016, a decline of 53.8%.1 On average, these newly insured individuals were younger and more likely to report fair to poor health than those previously insured. Approximately half of the newly insured have family incomes at or below 138% of the federal poverty level.1
Improvement in quality in medicine is not as easily quantified. Several programs have been implemented through the Centers for Medicare & Medicaid Services to measure and reimburse hospital systems and providers based on the quality and value of care being provided. Because of the complexity in defining quality in medicine, patient satisfaction has become a proxy measurement tool.2 With higher numbers of insured patients and an increased demand for services, dermatologists are being challenged to improve availability of services and respond to patients’ needs and desires as expressed through satisfaction surveys.
Few studies have assessed patient satisfaction in dermatology practices. As patient satisfaction surveys move to the forefront under the Patient Protection and Affordable Care Act, hospitals and providers will try to demonstrate the quality of their care through positive survey responses from patients. Importantly, patient satisfaction is a strong determinate if patients will comply with treatment and continue seeing their practitioner.3 A better understanding of patients’ perceptions regarding quality will allow for targeted interventions to be implemented. This study assesses and analyzes patient satisfaction, nonattendance rates, and cycle times in an outpatient dermatology clinic to provide a snapshot of patient satisfaction in an urban dermatology clinic.
Dr. Adam Sutton discusses the results of this study with Editor-in-Chief Vincent A. DeLeo, MD, in a "Peer to Peer" audiocast, "Measuring Patient Satisfaction: How Do Patients Perceive Quality of Care Delivered by Dermatologists?"
Methods
We conducted a prospective study that was approved by the University of Southern California Health Sciences (Los Angeles, California) institutional review board. A convenience sample of patients 18 years and older who spoke English or Spanish were recruited to participate in the study and agreed to complete the Patient Satisfaction Questionnaire Short Form (PSQ-18) and a demographic questionnaire, both in English or Spanish, at the conclusion of their visit.
Based on schedules and availability, medical students came to our clinic and obtained the surveys in the following manner: After patients checked in, the students approached the patients in the waiting area and asked if they would be willing to participate in the study. If patients agreed to participate, they provided written consent and the medical student handed them an envelope containing paper copies of the survey in English or Spanish, depending on the patient’s preference. Patients were asked to complete the surveys at the end of the visit and return them to the student in the envelope. The medical students did not otherwise participate in the patient’s visit.
Surveys were collected over an 8-month period at Los Angeles County+USC Medical Center dermatology clinics, which are part of a large safety-net health system. Among this population, it is common for patients to lack reliable Internet access or permanent home addresses; therefore, we elected to use point-of-care printed survey forms. Midway through the survey collection, we moved our clinic location; however, patients and physicians did not change. The comparison between clinics showed no substantive differences and did not change the conclusions of the study.
Patient Demographics
Demographic variables were age, sex, ethnicity, highest education level, annual household income, and primary language. Patients were grouped into 4 age categories: 18 to 29 years, 30 to 49 years, 50 to 64 years, and 65 years and older. Ethnicity was classified as Hispanic/Latino or other. Highest education level was classified as high school diploma or lower, and some college or higher. Annual household income was grouped into 3 categories: less than $15,000, $15,000 to $35,000, and more than $35,000.
Patient Satisfaction Questionnaire
The PSQ-18 survey was developed by the RAND Corporation (Santa Monica, California) and has been validated.4 The survey asks patients to rate aspects of their care experience on a 5-point Likert scale (strongly agree, agree, uncertain, disagree, strongly disagree), with 5 representing highest satisfaction. The survey contains 18 questions and is scored on 7 subscales: general satisfaction, technical quality, interpersonal manner, communication, financial aspects, time spent with doctor, and accessibility and convenience. The survey typically takes less than 5 minutes to complete.
Cycle Times and Nonattendance Rates
Cycle time is defined as the total amount of time that a patient spends in a clinic from check in to checkout, which was collected from our scheduling system for each patient who agreed to participate in the study. Cycle times were grouped into 4 categories: 0 to 60 minutes, 61 to 90 minutes, 91 to 120 minutes, and 121 minutes or more. During the study period, data also were collected from the electronic health record system regarding the number of patients with appointments scheduled and the number of patients who attended each clinic. From these figures, the rate of nonattendance for each clinic was calculated.
Statistical Analysis
Demographic results were calculated using arithmetic means. The PSQ-18 subscale scores were compared among demographic subgroups using a generalized linear model. Covariates included age, sex, ethnicity, highest education level, annual household income, and primary language. All statistical analyses were conducted using SAS software version 9.2.
Results
Of the 298 participants surveyed, the average age was 49 years, 51% were male, 73% self-identified as Hispanic/Latino, 64% spoke Spanish, 58% had a high school diploma or lower, and 68% reported an annual household income of less than $15,000 (Table 1).
Table 1 shows PSQ-18 scores for all patients stratified by demographics. Notably, patients with some college or more were significantly more satisfied on the interpersonal manner (P<.03) and time spent with doctor (P<.007) subscales when compared to those who were less educated, but they had lower general satisfaction scores (P<.001). Patients with a reported annual household income of greater than $35,000 were more satisfied on the technical quality (P<.07) and time spent with doctor (P<.04) subscales when compared to those making less than $15,000. The patients with a household income greater than $35,000 also were more satisfied with accessibility and convenience (P<.05) than those making $15,000 to $35,000. When stratified by sex, the time spent with doctor subscale was significantly higher in males than females (P<.001). (Statistically significant differences when stratifying by age, ethnicity, and language are noted in the “Comment” section.)
Patients’ average cycle time from check in to checkout was 102 minutes (range, 24–177 minutes). There was no statistically significant difference in patient satisfaction subscale scores when stratifying patients by cycle time. During a period comparable to the time that surveys were collected, our mean (standard deviation [SD]) nonattendance rate was 30% (7%). Therefore, based on 2 SDs, there was a 95% chance that 16% to 44% of patients would not attend their scheduled appointments in each clinic.
Comment
Our dermatology clinic received an average general satisfaction subscale score of 3.86. Although the general impression of patients was positive, there were subscale scores in which the clinic performed below the general satisfaction score; the 2 lowest were time spent with doctor (3.46), and accessibility and convenience (3.37). One possible explanation for the lower time spent with doctor subscale score relates to visiting an academic medical center. Patients often are seen sequentially by a medical student, resident, and supervising physician. This educational model contributes to long cycle times; indeed, average patient visit length was more than 1.5 hours in our study. Meanwhile, patients may consider their “doctor” to be the last member of the medical team they see; thus, the percentage of the clinic visit time that a supervising physician spends with the patient may be perceived by patients as short compared to the overall time spent in the clinic.
Surprisingly, there was no statistically significant difference in patient satisfaction subscale scores, including time spent with doctor, for patients with longer cycle times compared to short cycle times (Table 2), which suggests that the length of clinic visits may have been longer than the threshold for further effect on satisfaction scores. To this point, prior research has shown that patient satisfaction notably drops after 15 minutes of waiting,5 defined as the time from check in to when the patient first sees the provider. Our data set did not allow us to analyze wait time by that definition. However, we used cycle time, which includes various periods of waiting during the patient’s visit. If we had more data points on cycle times less than 30 minutes, we might have detected a clearer relationship of cycle times to patient satisfaction scores.
Satisfaction may not have varied with longer cycle times because differing perceptions might have balanced each other; in some cases, longer cycle times might reflect additional time spent with the provider, which could be perceived as valuable by the patient, and for others the long cycle time might be dissatisfying. Nevertheless, many of our patients were familiar with the county health system and expected to spend 90 minutes or more in clinic for each visit. Regardless, newly insured patients may have different expectations on how their health care should be delivered, an issue that could be investigated in the future.
The accessibility and convenience subscale scores reflected patients’ perception of timeliness and availability of medical care. The way that patients are scheduled at our clinic likely affected this subscale score, as patients must be referred through their primary care provider or the emergency department. We believe that many patients consider the wait for a primary care appointment as part of the overall wait for a dermatology appointment, which affects perception of accessibility and convenience for our clinic.
When we stratified by age, ethnicity, and language, other interesting trends occurred in satisfaction scores. Patients older than 65 years had a statistically significant higher accessibility and convenience subscale score when compared to the groups aged 18 to 29 years (P<.02) and 50 to 64 years (P<.05) as well as a higher but not statistically significant score compared to those aged 30 to 49 years (P<.07). Possible explanations include that older patients are familiar with the workings of our health system or that some of our patients older than 65 years may be retired and have fewer daily obligations. For the time spent with doctor subscale score, patients older than 65 years had higher scores when compared to those aged 30 to 49 years (P<.06) and 50 to 64 years (P<.07), perhaps because providers are spending more time with older individuals who may have more medical issues. A study involving a family medicine clinic also found that older patients were more satisfied with their overall care,6 which may be important given the changing demographics of Americans seeking medical care.
Differences in patient satisfaction when our patients were stratified by primary language and self-identified ethnicity also were noted. English-speaking patients were significantly more satisfied than Spanish-speaking patients in 4 subscales of satisfaction: technical quality (P<.01), interpersonal manner (P<.0001), financial aspects (P<.02), and time spent with doctor (P<.0006). For ethnicity, non-Hispanic/Latino patients had significantly higher subscale satisfaction scores for interpersonal manner (P<.0001) and time spent with doctor (P<.005). Variability in patient satisfaction based on primary language spoken and ethnicity has been described in other health care settings. Differences in satisfaction with care, understanding of potential side effects of a medication, compliance, and perceived rapport with physicians have been described.7-9
In addition to validating quality of care through patient satisfaction surveys, providers will be challenged to increase access to dermatologic services. Health systems that accept predominately Medicaid insurance, such as academic medical centers and safety-net hospitals, will be responsible for caring for millions of newly insured Medicaid patients. However, our high and variable nonattendance rates lead to inefficient use of our resources, often reducing the number of patients that are seen.
Canizares and Penneys10 studied an urban dermatology clinic over a 6-month period (N=508) and found that 17% of patients failed to keep their appointments; the subgroup of individuals with state-assisted insurance plans had the highest nonattendance rate (26%).10 In contrast, a group from Canada (N=5300) found that the nonattendance rate in a private dermatology practice was less than 8%.11 Our average nonattendance rate of 30% is within the range for urban clinics10,12; however, our SD of 7% leads to a high variability in patient volume each clinic day. As a result, on many days a reduced number of patients are seen resulting in a higher per-patient cost of delivering care.
Limitations
A potential bias is that the surveys were completed in the clinic and patients may have been concerned about possible repercussions for negative evaluations, which may have skewed results to be more positive than they otherwise would have been. We attempted to minimize this potential bias by having medical students who were not involved in the patients’ care administer the surveys. We also advised patients that their individual surveys would not be given to their providers and that any identifying information would be removed during data analysis. Our inferences could be affected by use of the terms satisfied and very satisfied in our patient satisfaction survey. Although we may interpret the results as patients reporting their degree of satisfaction, the patient may mean that there is room for improvement.13 Therefore, a survey that allows for more varied responses could potentially lead to different results.
Conclusion
Dermatology practitioners can support the specialty and validate the work they do by achieving high patient satisfaction scores. A study of online reviews compared patient ratings from 23 specialties and found that dermatology ranked second to last, ahead of only psychiatry.14 Our data has highlighted several opportunities to implement interventions that might improve patient satisfaction, though future studies would be required. Expanding or changing office hours, hiring more providers, or improving telephone access are potential interventions that might improve the accessibility and convenience subscale of patient satisfaction. Reducing the variability of nonattendance rates through the creation of resources to provide patients with clear directions and travel options, reminder calls, and instituting fees for missed appointments in some patient populations might allow for more predictable scheduling to optimize flow and the number of patients seen in each clinic.
Other approaches to improve satisfaction scores based on our results could include simple measures such as increasing the perception of time spent with the patient by having the physician sit down briefly in the examination room.15,16 It might be helpful to streamline translation assistance for patients who do not speak English as a primary language. It may be useful to recognize that younger patients have different expectations for clinic visits. For example, offering online scheduling to improve accessibility and convenience may improve satisfaction, particularly in patients who are accustomed to using technology.
It is our hope that while dermatologists continue to provide high quality care, they will work to demonstrate the value of their care by becoming leaders in patient satisfaction. Connecting their satisfaction with health care to patients’ quality of life has the potential to validate our specialty to insurers.
- Shatzer A, Long SK, Zuckerman S. Who are the newly insured as of early March 2014? Urban Institute Health Policy Center website. http://hrms.urban.org/briefs/Who-Are-the-Newly-Insured.html. Published May 22, 2014. Accessed March 17, 2017.
- Press I. Patient Satisfaction: Understanding and Measuring the Experience of Care. 2nd ed. Chicago, IL: Health Administration Press; 2006.
- Carr-Hill RA. The measurement of patient satisfaction. J Public Health Med. 1992;14:236-249.
- Thayparan A, Mahdi E. The Patient Satisfaction Questionnaire Short Form (PSQ-18) as an adaptable, reliable, and validated tool for use in various settings. Med Educ Online. 2013;18:21747.
- Garcia D, Kennedy C, Langager, J, et al. Pulse report 2009: outpatient: patient perspectives on American health care. South Bend, IN: Press Ganey Associates, Inc; 2009.
- Wetmore S, Boisvert L, Graham E, et al. Patient satisfaction with access and continuity of care in a multidisciplinary academic family medicine clinic. Can Fam Physician. 2014;60:E230-E236.
- Carrasquillo O, Orav EJ, Brennan TA, et al. Impact of language barriers on patient satisfaction in an emergency department. J Gen Intern Med. 1999;14:82-87.
- David RA, Rhee M. The impact of language as a barrier to effective health care in an underserved urban Hispanic community. Mt Sinai J Med. 1998;65:393-397.
- Ferguson WJ, Candib LM. Culture, language, and the doctor-patient relationship. Fam Med. 2002;34:353-361.
- Canizares MJ, Penneys NS. The incidence of nonattendance at an urgent care dermatology clinic. J Am Acad Dermatol. 2002;46:457-459.
- Pehr K. No show: incidence of nonattendance at a dermatology practice in a single universal payer model. J Cutan Med Surg. 2007;11:53-56.
- Penneys N, Glaser DA. The incidence of cancellation and non-attendance at a dermatology clinic. J Am Acad Dermatol. 1999;40:714-718.
- Collins K, O’Cathain A. The continuum of patient satisfaction—from satisfied to very satisfied. Soc Sci Med. 2003;57:2465-2470.
- Internet study: highest educated & trained doctors get poorest online reviews [news release]. Denver, CO: Vanguard Communications; April 22, 2015. https://vanguardcommunications.net/best-online-doctor-reviews/. Accessed November 28, 2016.
- Swayden KJ, Anderson KK, Connelly LM, et al. Effect of sitting vs. standing on perception of provider time at bedside: a pilot study. Patient Educ Couns. 2012;86:166-171.
- Sorenson E, Malakouti M, Brown G, et al. Enhancing patient satisfaction in dermatology. Am J Clin Dermatol. 2015;16:1-4.
Practice Points
- Patient experience can be measured through brief point-of-service patient satisfaction questionnaires.
- Stratifying and analyzing patient satisfaction allows for targeted interventions to be developed and implemented.
- Educational handouts in the patient's primary language may help increase satisfaction and improve compliance.

Electronic Collaboration in Dermatology Resident Training Through Social Networking
More than 1.8 billion individuals utilize social media, a number that continues to grow as the social media market expands.1 Social media enables individuals, groups, and organizations to efficiently disperse and access information2-4 and also provides a structure that encourages collaboration between patients, staff, and physicians that cannot be achieved by other communication modalities.4-6 Expert opinions and related educational materials can be shared globally, improving collaboration between dermatologists.6 A structured social networking site for sharing training materials, research, and ideas can help bring the national dermatology community together in a new way.
Other professions have employed social networking tools to accomplish similar goals of organizing training resources; radiology has an electronic database that allows sharing of training materials and incorporates social networking capabilities.7 Their Web software provides functionality for individual file uploading and supports collaboration and sharing, all while maintaining the security of uploaded information. General surgery has already addressed similar concerns via a task force that incorporates all the essential organizations in surgical education.8 Increased satisfaction and academic abilities have been demonstrated with their collaborative curriculum.9 Gastroenterologists also utilize electronic resources; one study showed that using videos to educate patients prior to colonoscopies was superior to face-to-face education.10 In addition, video education may free up time for office staff to accomplish other tasks.
As a specialty, dermatology has not been a leader in the implementation of social networking for collaboration and training purposes. Every dermatologist is an educator. To maintain a successful practice, dermatologists must keep up-to-date on their own clinical knowledge, provide training to their staff, and educate their patients. Although there are numerous educational resources available to dermatologists, an informal survey of 30 dermatology faculty members revealed a practice gap in awareness and utilization of these expanding electronic resources.11
To better understand the needs of the specialty as a whole, we chose to focus on one aspect of dermatology education: resident training. The goal of our study was to survey dermatology residents and faculty to gain a better understanding of how they currently provide education and what online resources and social networking sites they currently use or would be willing to use. The study included 3 central hypotheses: First, residents would be less satisfied with their current curriculum and residents would report greater contributions to the curriculum relative to faculty. Second, both residents and faculty of smaller programs would be more interested in collaborative educational resources relative to larger programs. Lastly, residents would be more willing than faculty to participate in social networking for educational purposes.
Methods
This study was granted institutional review board exemption. Two surveys were developed by the authors to assess the current structure and satisfaction of dermatology residency curriculum and the willingness to participate in social networking to use and share educational materials. The surveys were evaluated for relevance by the survey evaluation team of the Association of Professors of Dermatology (APD). The instrument was not pilot tested.
The surveys were electronically distributed using an online service to dermatology faculty via the APD listserve, which comprised the entirety of the APD membership in 2014. The resident survey was distributed to the dermatology residents via the American Society for Dermatologic Surgery listserve, which included all residents in training (2013-2014 academic year). Second and third invitations to complete the surveys were distributed 3 and 5 weeks later, respectively.
Resident and faculty responses were compared. Additionally, responses were stratified for large (>9 residents) and small programs (≤9 residents) for comparison. Descriptive statistics including means and medians for continuous variables and frequency tables for categorical variables were generated using research and spreadsheet software.
Results
There were 137 survey respondents; 52 of 426 (12.2%) dermatology faculty and 85 of 1539 (5.5%) dermatology residents responded to the survey. Small programs accounted for 24% of total survey responses and 76% were from large programs.
Current Curriculum
The majority of dermatology faculty (44%) and residents (35%) identified 1 to 2 faculty members as contributing to the creation and organization of their respective curricula; however, a notable percentage of residents (9%) reported that no faculty contributed to the organization of the curriculum. Residents noted that senior residents carry twice the responsibility for structuring the curriculum compared to faculty (61% vs 32% of the workload), but faculty described an even split between senior residents and faculty (47% vs 49% of the workload). Faculty believed their residents spend a similar amount of time in resident- and faculty-led instruction (38% vs 35% of their time); however, the majority of residents reported spending too little time in faculty-led instruction (53%). When residents ranked their preference for learning modes, faculty-led and self-study learning were ranked first and second by 48% and 45% of residents, respectively. Resident-led instruction was ranked last by 66% of residents. Likewise, a majority of residents (53%) described their amount of time in faculty-led instruction as too little.
When asked what subjects in dermatology were lacking at their programs, residents reported clinical trials (47%), skin of color (46%), cosmetic dermatology (34%), and aggressive skin cancer/multidisciplinary tumor board (32%). Although 11% of residents reported lacking inpatient dermatology in their curriculum, 0% of faculty reported the same. A notable percentage of faculty reported nothing was lacking compared to residents (25% vs 7%). Despite these different views between residents and faculty on their contributions to and structure of their curriculums, both faculty and residents claimed overall satisfaction (satisfied or very satisfied) with their program’s ability to optimally cover the field of dermatology in 3 years (100% and 91%, respectively).
Large Versus Small Residency Programs
When stratifying the resident responses for small versus large programs, both program sizes reported more time in resident-led instruction than faculty-led instruction. Likewise, residents in both program sizes equally preferred self-study or faculty-led instruction to resident-led instruction. Residents at small programs more often reported lacking instruction in rheumatology, immunobullous diseases, and basic science/skin biology compared to large-program residents. Compared to large-program faculty, small-program faculty reported lacking instruction in cosmetic dermatology.
Faculty at small programs reported spending too little time preparing for their faculty-led instruction compared to faculty at large programs (44% vs 12%). All (100%) of the faculty at small programs were likely to seek out study materials shared by top educators, while 77% of faculty at large programs were likely to do the same. When asked if faculty would translate what their program does well into an electronic format for sharing, 30% of large-program faculty were likely to do so compared to 11% of small-program faculty (Figure 1).
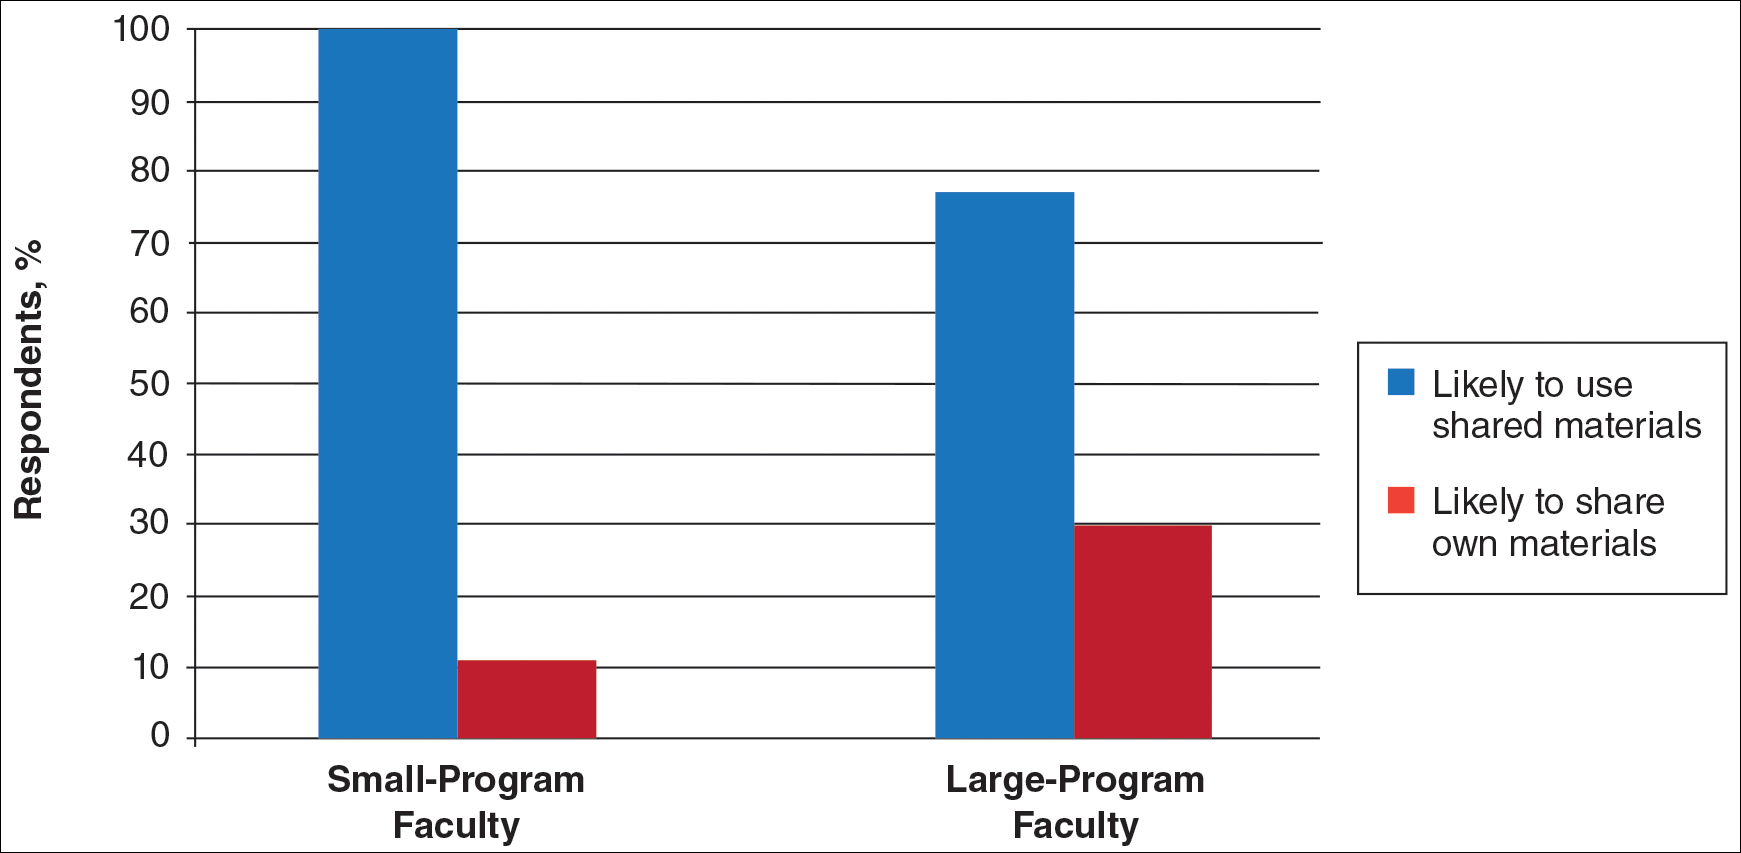
Use of Online Educational Materials and Interest in Collaboration
A majority of faculty and residents stated that they use online educational materials as supplements to traditional classroom lecture and print materials (81% vs 86%); however, almost twice as many residents stated that online educational materials were essential to their current study routines compared to faculty (39% vs 21%).
The majority of faculty (92%) and residents (84%) were either interested or very interested in a collaborative online curriculum. Both residents (85%) and faculty (81%) stated they would be likely to seek out online educational materials shared by top educators. Although both residents and faculty reported many aspects of their curriculums they thought could be beneficial to other dermatology programs (Table 1), only 27% of faculty and 19% of residents were likely to translate those strengths into a shareable electronic format. Several reasons were reported for not contributing to an online curriculum, with lack of time being the most common reason (Table 2).
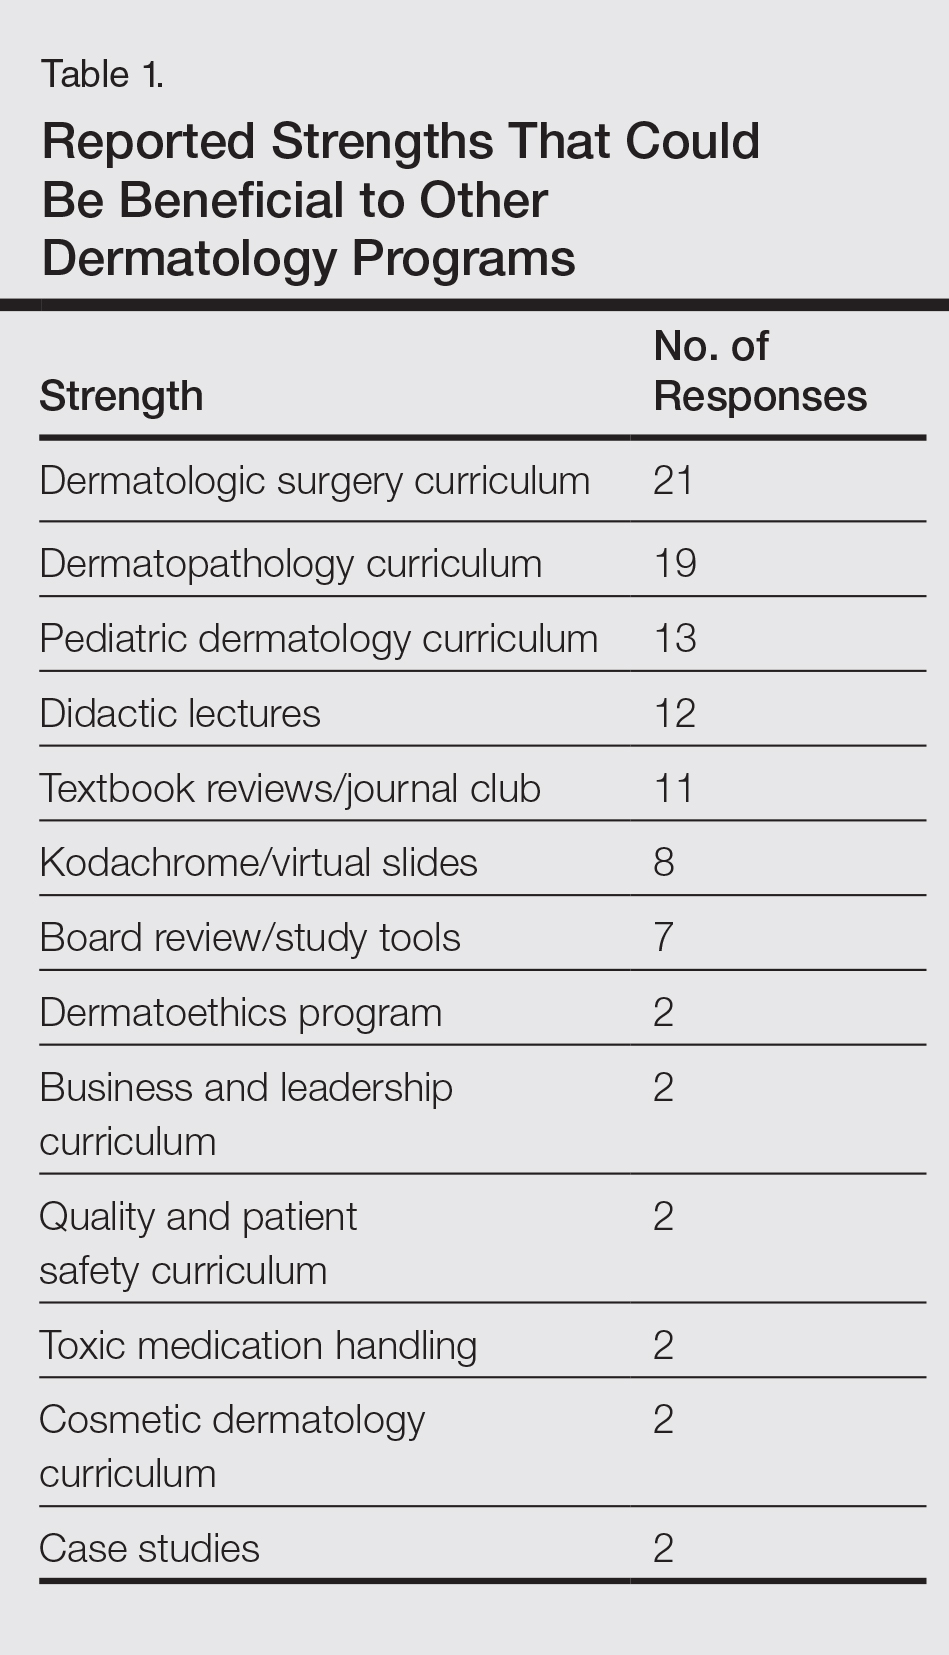
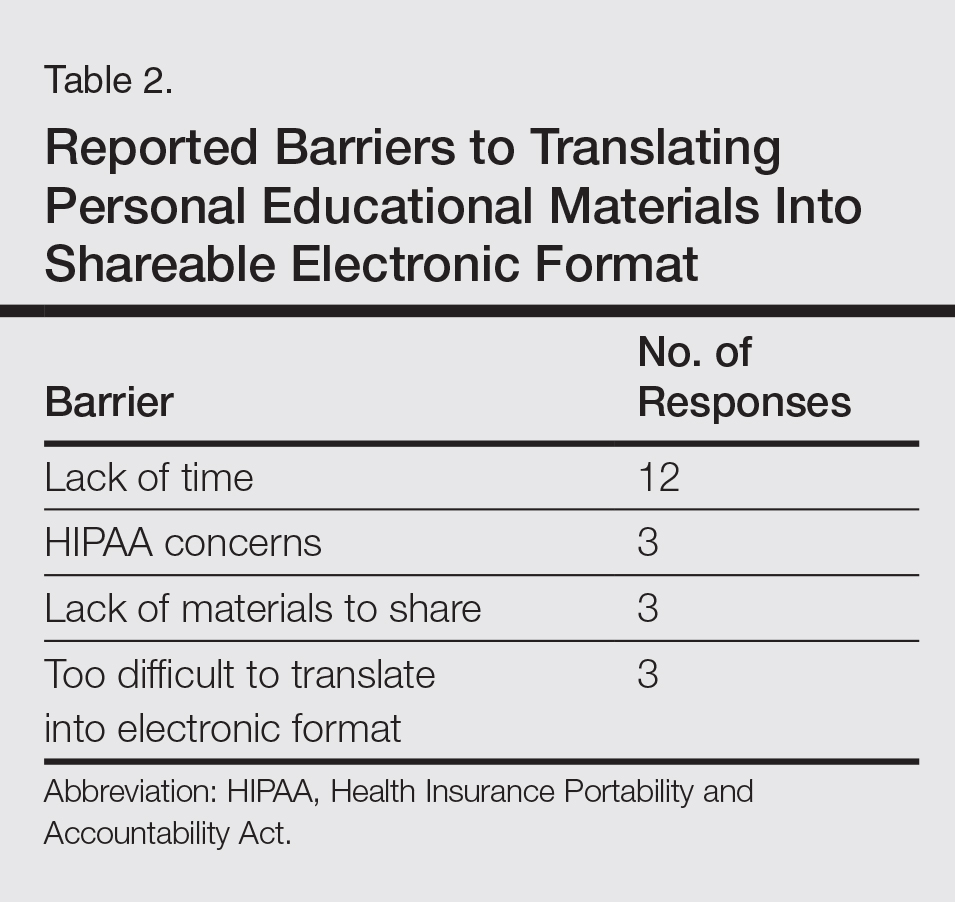
Eighty percent of residents and 88% of faculty reported they were either interested or very interested in being more connected/interactive with their dermatology peers nationally (Figure 2). Likewise, 94% of residents and 87% of faculty agreed that the dermatology community could benefit from a social networking site for educational collaboration. Four times as many residents versus faculty currently use social networking sites (eg, Facebook, LinkedIn, Google Groups) as a primary mode of communication with distant professional peers. The majority of residents (52%) reported they would be likely to participate in a professional social networking site, while the majority of faculty (50%) stated they were neutral on their likelihood of participating. Both residents and faculty reported lack of time as a common reason for being unlikely to utilize a professional social networking site. Other barriers to participation are listed in Table 3.
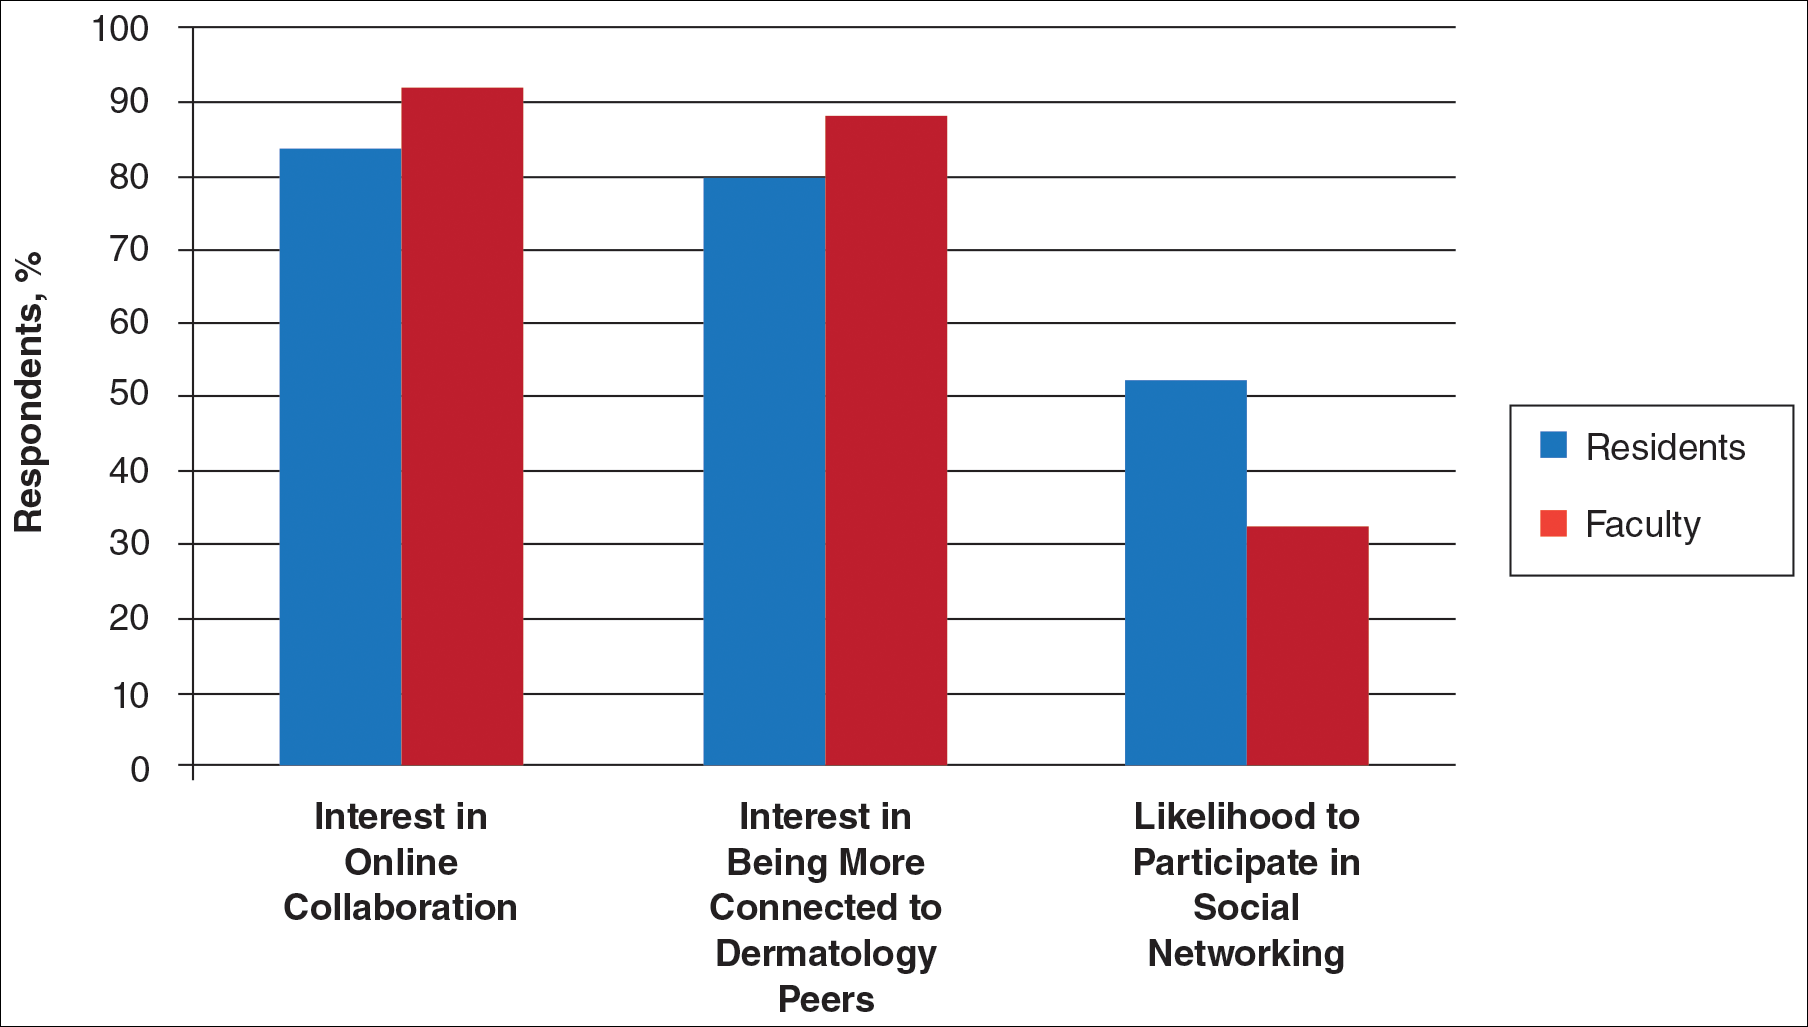
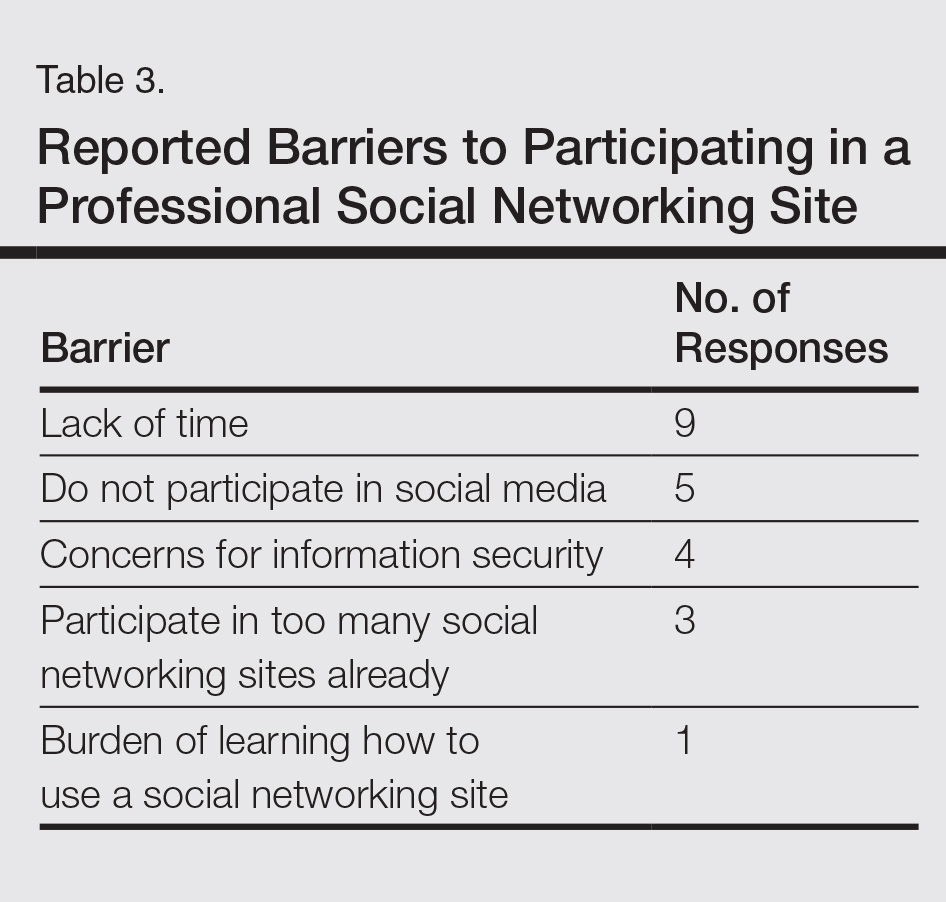
Comment
This study showed how dermatology faculty and residents currently provide training and what online resources and social networking sites they currently use or would be willing to use. The generalizability of the conclusions is limited by the low response rate for the surveys. The results demonstrated the different views between faculty and residents and between large and small residency programs on various topics. This microcosm of dermatology training can likely be applied to other training scenarios in dermatology, including patient education; training of nurses, physician extenders, and office staff; continuing medical education for physicians; and peer-to-peer collaboration.
Hypothesis 1: Partially Proven
We hypothesized that residents would report less satisfaction with their current curriculum and would report greater resident contributions to the curriculum relative to faculty. Overall, residents and faculty reported satisfaction with their curriculums to provide up-to-date information and breadth in the field of dermatology. Despite their overall satisfaction, more residents reported lacking instruction in several dermatology subtopics compared to faculty. Additionally, residents believed they spend twice as much time structuring their curriculum compared to faculty, with some residents reporting no faculty involvement. Although residents preferred faculty-led instruction, a majority of residents reported they do not have enough faculty-led didactics. The preference for faculty-led training is likely due to the expertise of faculty compared to residents.
Hypothesis 2: Partially Proven
We also hypothesized that both residents and faculty of smaller programs would be more interested in collaborative educational resources relative to larger programs. Although there was no difference in interest between residents at small versus large programs, there was a difference between faculty at small versus large programs. Small-program faculty were more interested in using shared materials than larger programs, while large-program faculty were more likely to share their educational materials. Small-program faculty reported spending too little time preparing their lectures, which is possibly due to a lack of time for preparation. Additionally, residents and faculty at smaller programs report their curriculum was lacking specific dermatology topics compared to large programs. These disparities between program sizes indicate a need for a social networking site for training collaboration in dermatology. Large programs have the ability to share what they do well, which small programs are eager to utilize.
Hypothesis 3: Not Proven
We hypothesized that residents would be more willing than faculty to participate in social networking for educational purposes. The majority of faculty and residents were interested in participating in a collaborative online curriculum and using the shared materials from top educators; however, even though such large majorities favored collaboration and sharing, only 27% of faculty and 19% of residents were likely to translate their own materials into a shareable format. Although lack of time was the most common reason for not sharing materials, electronic methods may have the potential to ultimately save time and remove the burden of content creation. The time it would take to translate selected personal training materials into a shareable form would be made up for by the time saved using another educators’ materials. Updating and customizing shared online educational materials can be much quicker and easier than educators creating materials on their own. Dermatologists would be more efficient facilitators of training via high-quality shared materials while decreasing the time burden associated with resident education.5 Another concern for not sharing or participating in a social networking site was skepticism of information security on such a network. The poor organization and information overload of online resources can compound the already existing time constraints on dermatologists, which may limit their ability to utilize such valuable resources. In addition, quality of online resources is not always guaranteed, and determining the sources that are high quality is sometimes a difficult task.6 For online materials to remain useful, there should be a peer-review process to evaluate quality and assess satisfaction.5
Solution: Create a Dermatology Task Force
A dermatology task force could facilitate the resolution of these challenges of online materials. In addition, a task force could cover the administrative support needed to ensure security and provide maintenance on social networks.
The main limitation to implementing a social network is the presence of the administrative infrastructure to jumpstart its creation. A task force incorporating the essential stakeholders in dermatology training is the first step. With inclusive representation from all of the smaller professional dermatology societies, the American Academy of Dermatology is optimally positioned to create this task force. With existing information technologies, a task force could address the concerns revealed in our survey as well as any future concerns that may arise.
The goal is a single social network for dermatologists that has the capability of improving communication and collaboration between professional peers regardless of their practice setting. Such a network is ideal for the practicing dermatologist for the purposes of staff training, patient education, and obtaining continuing medical education credit. Additionally, peer group collaboration would facilitate the understanding and completion of the evolving requirements for Maintenance of Certification from the American Board of Dermatology. The availability of quality shared materials would save time and increase efficiency of an entire dermatology practice. Materials that aid in patient education would allow office staff to dedicate their time to other tasks, thereby increasing productivity. Shared training materials would decrease the burden of staff education, providing more time for advanced hands-on training. This method of collaborative effort is capable of advancing the field of dermatology as a whole. It can overcome geographical and institutional barriers to connect dermatologists with similar interests worldwide; disseminate advances in diagnosis and treatment; and improve the quality of dermatology training of dermatologists, staff, and patients.
- Statistics and facts about social networks. Statista website. http://www.statista.com/topics/1164/social-networks/. Accessed March 22, 2017.
- Baker RC, Klein M, Samaan Z, et al. Effectiveness of an online pediatric primary care curriculum. Acad Pediatr. 2010;10:131-137.
- Dolev JC, O’Sullivan P, Berger T. The eDerm online curriculum: a randomized study of effective skin cancer teaching to medical students. J Am Acad Dermatol. 2011;65:e165-e171.
- Amir M, Sampson BP, Endly D, et al. Social networking sites: emerging and essential tools for communication in dermatology. JAMA Dermatol. 2014;150:56-60.
- Ruiz JG, Mintzer MJ, Leipzig RM. The impact of e-learning in medical education. Acad Med. 2006;81:207-212.
- Hanson AH, Krause LK, Simmons RN, et al. Dermatology education and the internet: traditional and cutting-edge resources. J Am Acad Dermatol. 2011;65:836-842.
- Rowe SP, Siddiqui A, Bonekamp D. The key image and case log application: new radiology software for teaching file creation and case logging that incorporates elements of a social network. Acad Radiol. 2014;21:916-930.
- Bell RH. Surgical council on resident education: a new organization devoted to graduate surgical education. J Am Coll Surg. 2007;204:341-346.
- Kirton OC, Reilly P, Staff I, et al. Development and implementation of an interactive, objective, and simulation-based curriculum for general surgery residents. J Surg Educ. 2012;69:718-723.
- Prakash S, Verma S, McGowan J, et al. Improving the quality of colonoscopy bowel preparation using an educational video. Can J Gastroenterol. 2013;27:696-700.
- Carroll BT. eTools for teaching dermatologic surgery. Paper presented at the Association of Professors of Dermatology 2014 Annual Meeting; September 12-13, 2014; Chicago, IL.
More than 1.8 billion individuals utilize social media, a number that continues to grow as the social media market expands.1 Social media enables individuals, groups, and organizations to efficiently disperse and access information2-4 and also provides a structure that encourages collaboration between patients, staff, and physicians that cannot be achieved by other communication modalities.4-6 Expert opinions and related educational materials can be shared globally, improving collaboration between dermatologists.6 A structured social networking site for sharing training materials, research, and ideas can help bring the national dermatology community together in a new way.
Other professions have employed social networking tools to accomplish similar goals of organizing training resources; radiology has an electronic database that allows sharing of training materials and incorporates social networking capabilities.7 Their Web software provides functionality for individual file uploading and supports collaboration and sharing, all while maintaining the security of uploaded information. General surgery has already addressed similar concerns via a task force that incorporates all the essential organizations in surgical education.8 Increased satisfaction and academic abilities have been demonstrated with their collaborative curriculum.9 Gastroenterologists also utilize electronic resources; one study showed that using videos to educate patients prior to colonoscopies was superior to face-to-face education.10 In addition, video education may free up time for office staff to accomplish other tasks.
As a specialty, dermatology has not been a leader in the implementation of social networking for collaboration and training purposes. Every dermatologist is an educator. To maintain a successful practice, dermatologists must keep up-to-date on their own clinical knowledge, provide training to their staff, and educate their patients. Although there are numerous educational resources available to dermatologists, an informal survey of 30 dermatology faculty members revealed a practice gap in awareness and utilization of these expanding electronic resources.11
To better understand the needs of the specialty as a whole, we chose to focus on one aspect of dermatology education: resident training. The goal of our study was to survey dermatology residents and faculty to gain a better understanding of how they currently provide education and what online resources and social networking sites they currently use or would be willing to use. The study included 3 central hypotheses: First, residents would be less satisfied with their current curriculum and residents would report greater contributions to the curriculum relative to faculty. Second, both residents and faculty of smaller programs would be more interested in collaborative educational resources relative to larger programs. Lastly, residents would be more willing than faculty to participate in social networking for educational purposes.
Methods
This study was granted institutional review board exemption. Two surveys were developed by the authors to assess the current structure and satisfaction of dermatology residency curriculum and the willingness to participate in social networking to use and share educational materials. The surveys were evaluated for relevance by the survey evaluation team of the Association of Professors of Dermatology (APD). The instrument was not pilot tested.
The surveys were electronically distributed using an online service to dermatology faculty via the APD listserve, which comprised the entirety of the APD membership in 2014. The resident survey was distributed to the dermatology residents via the American Society for Dermatologic Surgery listserve, which included all residents in training (2013-2014 academic year). Second and third invitations to complete the surveys were distributed 3 and 5 weeks later, respectively.
Resident and faculty responses were compared. Additionally, responses were stratified for large (>9 residents) and small programs (≤9 residents) for comparison. Descriptive statistics including means and medians for continuous variables and frequency tables for categorical variables were generated using research and spreadsheet software.
Results
There were 137 survey respondents; 52 of 426 (12.2%) dermatology faculty and 85 of 1539 (5.5%) dermatology residents responded to the survey. Small programs accounted for 24% of total survey responses and 76% were from large programs.
Current Curriculum
The majority of dermatology faculty (44%) and residents (35%) identified 1 to 2 faculty members as contributing to the creation and organization of their respective curricula; however, a notable percentage of residents (9%) reported that no faculty contributed to the organization of the curriculum. Residents noted that senior residents carry twice the responsibility for structuring the curriculum compared to faculty (61% vs 32% of the workload), but faculty described an even split between senior residents and faculty (47% vs 49% of the workload). Faculty believed their residents spend a similar amount of time in resident- and faculty-led instruction (38% vs 35% of their time); however, the majority of residents reported spending too little time in faculty-led instruction (53%). When residents ranked their preference for learning modes, faculty-led and self-study learning were ranked first and second by 48% and 45% of residents, respectively. Resident-led instruction was ranked last by 66% of residents. Likewise, a majority of residents (53%) described their amount of time in faculty-led instruction as too little.
When asked what subjects in dermatology were lacking at their programs, residents reported clinical trials (47%), skin of color (46%), cosmetic dermatology (34%), and aggressive skin cancer/multidisciplinary tumor board (32%). Although 11% of residents reported lacking inpatient dermatology in their curriculum, 0% of faculty reported the same. A notable percentage of faculty reported nothing was lacking compared to residents (25% vs 7%). Despite these different views between residents and faculty on their contributions to and structure of their curriculums, both faculty and residents claimed overall satisfaction (satisfied or very satisfied) with their program’s ability to optimally cover the field of dermatology in 3 years (100% and 91%, respectively).
Large Versus Small Residency Programs
When stratifying the resident responses for small versus large programs, both program sizes reported more time in resident-led instruction than faculty-led instruction. Likewise, residents in both program sizes equally preferred self-study or faculty-led instruction to resident-led instruction. Residents at small programs more often reported lacking instruction in rheumatology, immunobullous diseases, and basic science/skin biology compared to large-program residents. Compared to large-program faculty, small-program faculty reported lacking instruction in cosmetic dermatology.
Faculty at small programs reported spending too little time preparing for their faculty-led instruction compared to faculty at large programs (44% vs 12%). All (100%) of the faculty at small programs were likely to seek out study materials shared by top educators, while 77% of faculty at large programs were likely to do the same. When asked if faculty would translate what their program does well into an electronic format for sharing, 30% of large-program faculty were likely to do so compared to 11% of small-program faculty (Figure 1).
Use of Online Educational Materials and Interest in Collaboration
A majority of faculty and residents stated that they use online educational materials as supplements to traditional classroom lecture and print materials (81% vs 86%); however, almost twice as many residents stated that online educational materials were essential to their current study routines compared to faculty (39% vs 21%).
The majority of faculty (92%) and residents (84%) were either interested or very interested in a collaborative online curriculum. Both residents (85%) and faculty (81%) stated they would be likely to seek out online educational materials shared by top educators. Although both residents and faculty reported many aspects of their curriculums they thought could be beneficial to other dermatology programs (Table 1), only 27% of faculty and 19% of residents were likely to translate those strengths into a shareable electronic format. Several reasons were reported for not contributing to an online curriculum, with lack of time being the most common reason (Table 2).
Eighty percent of residents and 88% of faculty reported they were either interested or very interested in being more connected/interactive with their dermatology peers nationally (Figure 2). Likewise, 94% of residents and 87% of faculty agreed that the dermatology community could benefit from a social networking site for educational collaboration. Four times as many residents versus faculty currently use social networking sites (eg, Facebook, LinkedIn, Google Groups) as a primary mode of communication with distant professional peers. The majority of residents (52%) reported they would be likely to participate in a professional social networking site, while the majority of faculty (50%) stated they were neutral on their likelihood of participating. Both residents and faculty reported lack of time as a common reason for being unlikely to utilize a professional social networking site. Other barriers to participation are listed in Table 3.
Comment
This study showed how dermatology faculty and residents currently provide training and what online resources and social networking sites they currently use or would be willing to use. The generalizability of the conclusions is limited by the low response rate for the surveys. The results demonstrated the different views between faculty and residents and between large and small residency programs on various topics. This microcosm of dermatology training can likely be applied to other training scenarios in dermatology, including patient education; training of nurses, physician extenders, and office staff; continuing medical education for physicians; and peer-to-peer collaboration.
Hypothesis 1: Partially Proven
We hypothesized that residents would report less satisfaction with their current curriculum and would report greater resident contributions to the curriculum relative to faculty. Overall, residents and faculty reported satisfaction with their curriculums to provide up-to-date information and breadth in the field of dermatology. Despite their overall satisfaction, more residents reported lacking instruction in several dermatology subtopics compared to faculty. Additionally, residents believed they spend twice as much time structuring their curriculum compared to faculty, with some residents reporting no faculty involvement. Although residents preferred faculty-led instruction, a majority of residents reported they do not have enough faculty-led didactics. The preference for faculty-led training is likely due to the expertise of faculty compared to residents.
Hypothesis 2: Partially Proven
We also hypothesized that both residents and faculty of smaller programs would be more interested in collaborative educational resources relative to larger programs. Although there was no difference in interest between residents at small versus large programs, there was a difference between faculty at small versus large programs. Small-program faculty were more interested in using shared materials than larger programs, while large-program faculty were more likely to share their educational materials. Small-program faculty reported spending too little time preparing their lectures, which is possibly due to a lack of time for preparation. Additionally, residents and faculty at smaller programs report their curriculum was lacking specific dermatology topics compared to large programs. These disparities between program sizes indicate a need for a social networking site for training collaboration in dermatology. Large programs have the ability to share what they do well, which small programs are eager to utilize.
Hypothesis 3: Not Proven
We hypothesized that residents would be more willing than faculty to participate in social networking for educational purposes. The majority of faculty and residents were interested in participating in a collaborative online curriculum and using the shared materials from top educators; however, even though such large majorities favored collaboration and sharing, only 27% of faculty and 19% of residents were likely to translate their own materials into a shareable format. Although lack of time was the most common reason for not sharing materials, electronic methods may have the potential to ultimately save time and remove the burden of content creation. The time it would take to translate selected personal training materials into a shareable form would be made up for by the time saved using another educators’ materials. Updating and customizing shared online educational materials can be much quicker and easier than educators creating materials on their own. Dermatologists would be more efficient facilitators of training via high-quality shared materials while decreasing the time burden associated with resident education.5 Another concern for not sharing or participating in a social networking site was skepticism of information security on such a network. The poor organization and information overload of online resources can compound the already existing time constraints on dermatologists, which may limit their ability to utilize such valuable resources. In addition, quality of online resources is not always guaranteed, and determining the sources that are high quality is sometimes a difficult task.6 For online materials to remain useful, there should be a peer-review process to evaluate quality and assess satisfaction.5
Solution: Create a Dermatology Task Force
A dermatology task force could facilitate the resolution of these challenges of online materials. In addition, a task force could cover the administrative support needed to ensure security and provide maintenance on social networks.
The main limitation to implementing a social network is the presence of the administrative infrastructure to jumpstart its creation. A task force incorporating the essential stakeholders in dermatology training is the first step. With inclusive representation from all of the smaller professional dermatology societies, the American Academy of Dermatology is optimally positioned to create this task force. With existing information technologies, a task force could address the concerns revealed in our survey as well as any future concerns that may arise.
The goal is a single social network for dermatologists that has the capability of improving communication and collaboration between professional peers regardless of their practice setting. Such a network is ideal for the practicing dermatologist for the purposes of staff training, patient education, and obtaining continuing medical education credit. Additionally, peer group collaboration would facilitate the understanding and completion of the evolving requirements for Maintenance of Certification from the American Board of Dermatology. The availability of quality shared materials would save time and increase efficiency of an entire dermatology practice. Materials that aid in patient education would allow office staff to dedicate their time to other tasks, thereby increasing productivity. Shared training materials would decrease the burden of staff education, providing more time for advanced hands-on training. This method of collaborative effort is capable of advancing the field of dermatology as a whole. It can overcome geographical and institutional barriers to connect dermatologists with similar interests worldwide; disseminate advances in diagnosis and treatment; and improve the quality of dermatology training of dermatologists, staff, and patients.
- Statistics and facts about social networks. Statista website. http://www.statista.com/topics/1164/social-networks/. Accessed March 22, 2017.
- Baker RC, Klein M, Samaan Z, et al. Effectiveness of an online pediatric primary care curriculum. Acad Pediatr. 2010;10:131-137.
- Dolev JC, O’Sullivan P, Berger T. The eDerm online curriculum: a randomized study of effective skin cancer teaching to medical students. J Am Acad Dermatol. 2011;65:e165-e171.
- Amir M, Sampson BP, Endly D, et al. Social networking sites: emerging and essential tools for communication in dermatology. JAMA Dermatol. 2014;150:56-60.
- Ruiz JG, Mintzer MJ, Leipzig RM. The impact of e-learning in medical education. Acad Med. 2006;81:207-212.
- Hanson AH, Krause LK, Simmons RN, et al. Dermatology education and the internet: traditional and cutting-edge resources. J Am Acad Dermatol. 2011;65:836-842.
- Rowe SP, Siddiqui A, Bonekamp D. The key image and case log application: new radiology software for teaching file creation and case logging that incorporates elements of a social network. Acad Radiol. 2014;21:916-930.
- Bell RH. Surgical council on resident education: a new organization devoted to graduate surgical education. J Am Coll Surg. 2007;204:341-346.
- Kirton OC, Reilly P, Staff I, et al. Development and implementation of an interactive, objective, and simulation-based curriculum for general surgery residents. J Surg Educ. 2012;69:718-723.
- Prakash S, Verma S, McGowan J, et al. Improving the quality of colonoscopy bowel preparation using an educational video. Can J Gastroenterol. 2013;27:696-700.
- Carroll BT. eTools for teaching dermatologic surgery. Paper presented at the Association of Professors of Dermatology 2014 Annual Meeting; September 12-13, 2014; Chicago, IL.
Practice Points
- Educational collaboration between residency programs via social media can result in more well-rounded dermatologists, which will enhance patient care.
- Social media can connect dermatologists nationwide to improve patient care via collaboration.

Efinaconazole Solution 10% for Treatment of Toenail Onychomycosis in Latino Patients
Onychomycosis is a common progressive fungal infection of the nail bed, matrix, or plate leading to destruction and deformity of the toenails and fingernails.1,2 It represents up to 50% of all nail disorders1,3 with a notable increasing prevalence in the United States.4-6
Latinos represent the largest ethnic minority group in the United States,7 which is growing rapidly through immigration, particularly in the southern United States. Prevalence data are limited. An incidence of 9.3% secondary to dermatophytes was recorded in a dermatology clinic setting (N=2000).8 Onychomycosis was reported in 31.9% of a group of Latino immigrants in North Carolina (N=518), with higher prevalence in poultry workers, possibly due to the work environment.9
Efinaconazole solution 10% was shown to be well tolerated and more effective than a vehicle in a phase 2 study in Mexico.10 Two identical phase 3 studies of 1655 participants assessed the safety and efficacy of efinaconazole solution 10% in the treatment of onychomycosis.11 This post hoc analysis compares the data for Latino versus non-Latino populations.
Methods
We evaluated the results of 2 multicenter, randomized, double-blind, vehicle-controlled studies that included a total of 1655 participants with mild to moderate toenail onychomycosis (20%–50% clinical involvement). Participants were randomized to efinaconazole solu-tion 10% or vehicle once daily (3:1) for 48 weeks with a 4-week posttreatment follow-up period.11
Our post hoc analysis included 270 Latino patients, defined as an individual of Cuban, Mexican, Puerto Rican, or South or Central American origin or other Latino culture, regardless of race. In addition, data were compared to the 1380 non-Latino patients in the 2 studies. Patients who were randomized in error and never received treatment were excluded from the intention-to-treat analysis.
Efficacy Evaluation
The primary efficacy end point was complete cure rate (0% clinical involvement of target toenail, and both negative potassium hydroxide examination and fungal culture) at week 52. Secondary end points included mycologic cure, complete/almost complete cure (≤5% clinical involvement of target toenail, mycologic cure), and treatment success (≤10% clinical involvement of target toenail) at week 52.
Safety Evaluation
Safety assessments included monitoring and recording of adverse events (AEs) at every postbaseline study visit through week 52. All AEs were classified using the Medical Dictionary for Regulatory Activities (version 12.1). Treatment-emergent AEs (ie, events that began after the first application of study drug) that occurred during the study were summarized for each treatment group by the number of patients reporting each event, as well as by system organ class, preferred term, severity, seriousness, and relationship to the study drug.
Results
A total of 270 Latino participants with toenail onychomycosis (efinaconazole solution 10%, n=193; vehicle, n=77) were included in our study. The mean age of participants at baseline was 45.9 years. They were predominantly male (69.6%) and white Latinos (91.1%). The mean area of target toenail involvement was 36.6%, and the mean number of affected nontarget toenails was 2.5. Latino participants tended to be younger than non-Latino participants (45.9 vs 52.6 years), with a higher proportion of females (30.4% vs 21.3%). Disease severity was similar in both populations. Diabetes was reported in 7.0% and 6.7% of Latino and non-Latino participants, respectively, and mean weight was 83.6 and 86.6 kg, respectively.
Primary Efficacy End Points (Observed Case [OC])
At week 52, 25.6% of Latino participants in the efinaconazole group achieved complete cure versus 0% in the vehicle group (P<.001)(Figure 1). The efficacy of efinaconazole was statistically superior in Latino participants versus non-Latino participants (17.2% [P=.012]). The net effect (calculated by active treatment minus vehicle) for Latino participants also was superior to non-Latino participants (25.6% vs 11.6%).
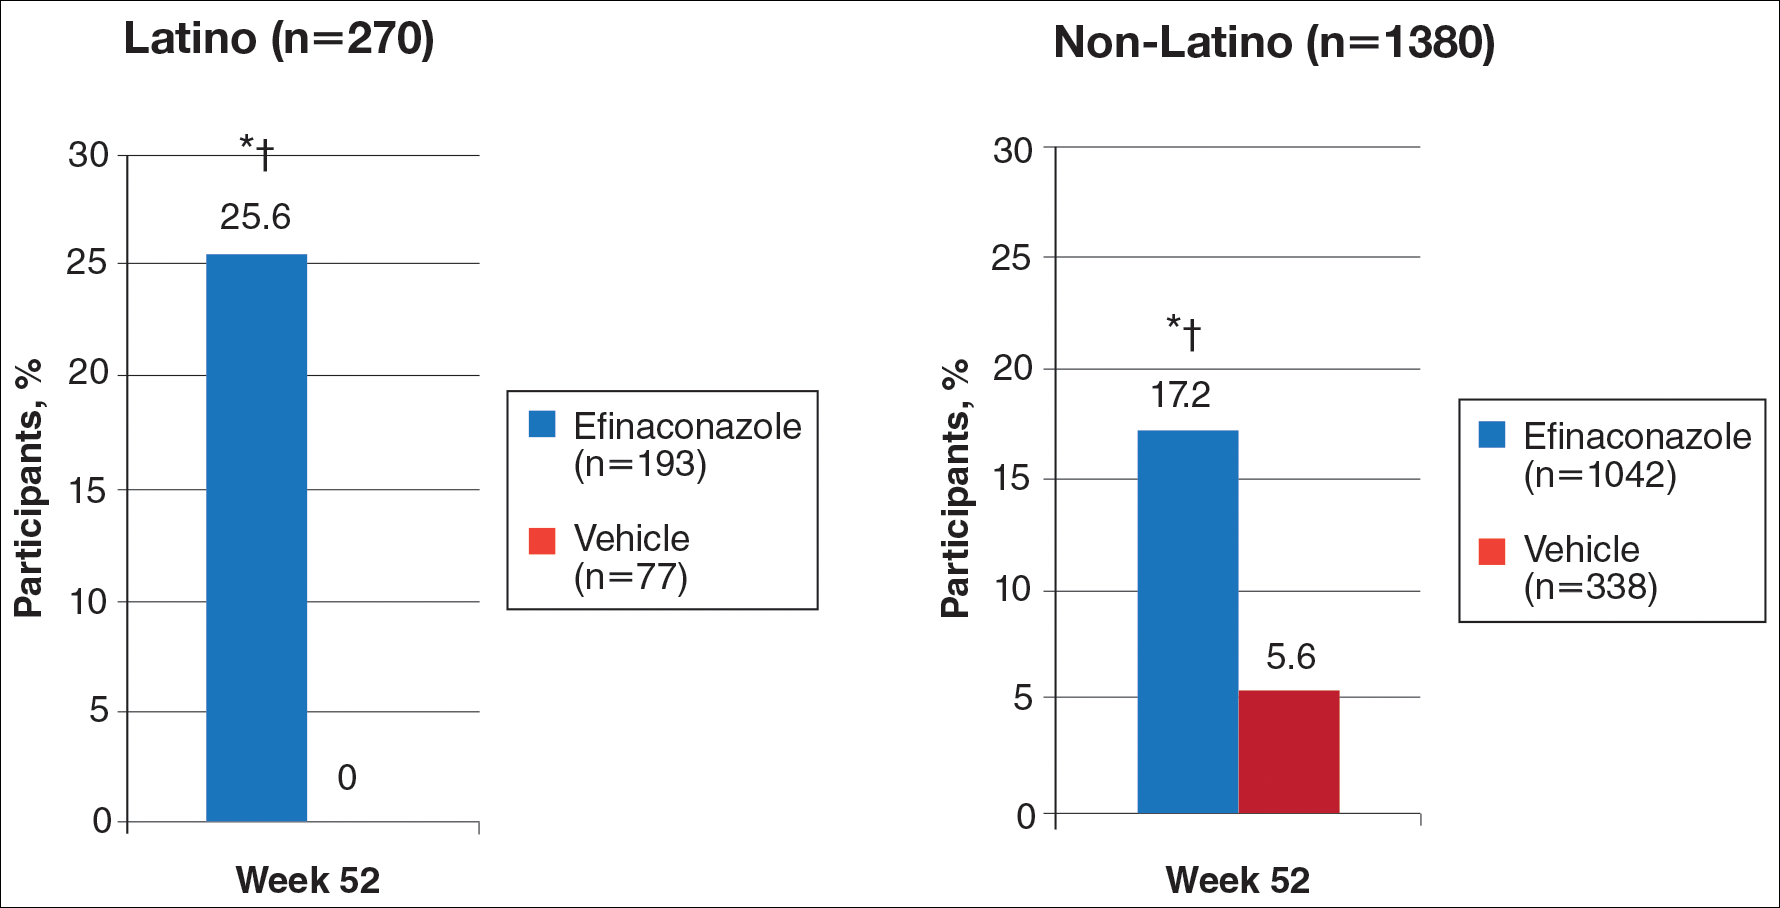
Secondary Efficacy End Points (OC)
At week 52, 61.5% of Latino participants in the efina-conazole group achieved mycologic cure versus 15.3% in the vehicle group (P<.001)(Figure 2). The net effect for Latino participants was superior to non-Latino participants (46.2% vs 38.5%). More Latino participants in the efinaconazole group compared to vehicle group achieved complete/almost complete cure (32.7% vs 1.7%) or treatment success (49.4% vs 5.1%)(all P<.001)(Figure 3). Although there was no significant difference between the 2 groups for secondary efficacy end points, the net effect of efinaconazole was greater for all end points.
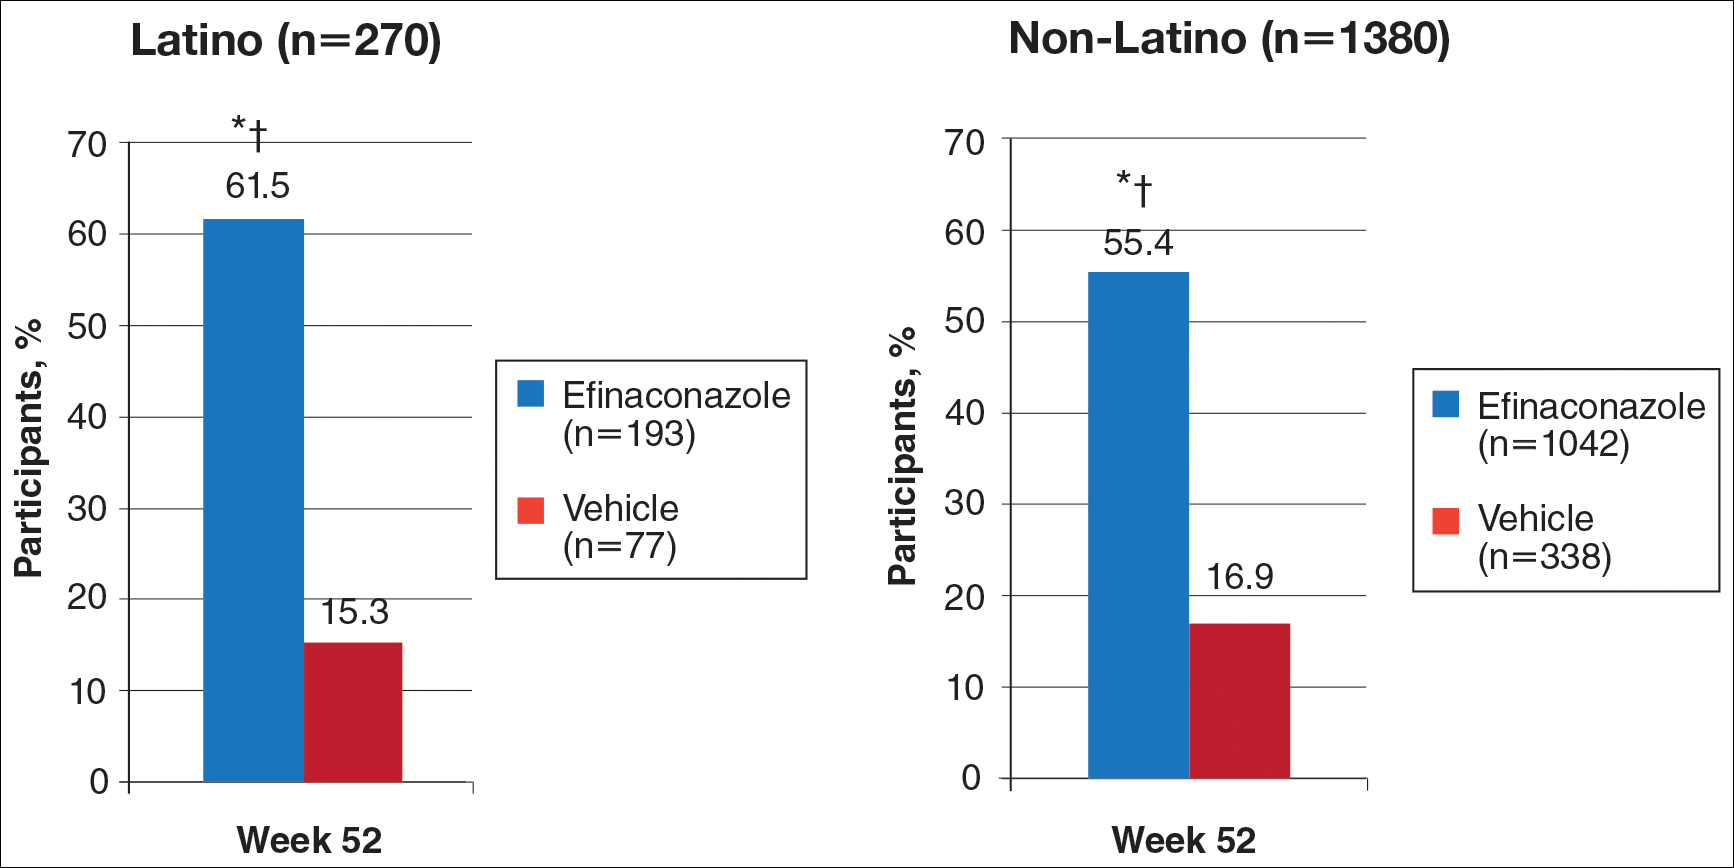
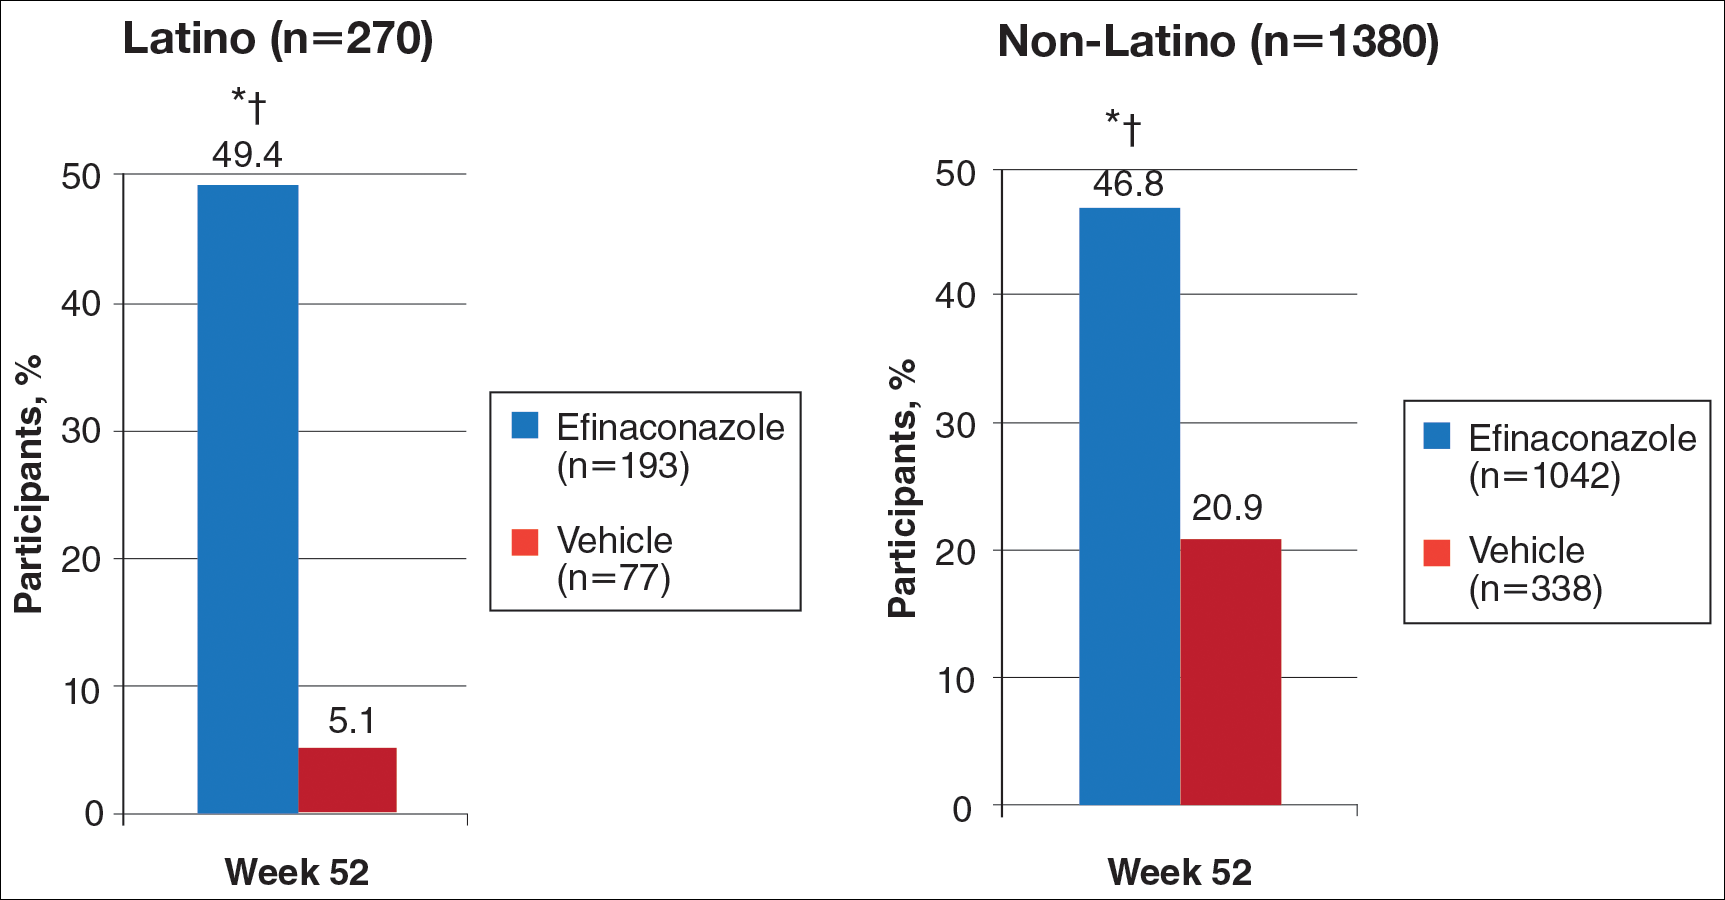
Safety
Adverse event rates were higher in the efinaconazole group than the vehicle group (65.3% vs 54.4%) and were similar in both populations; they were generally mild (61.8% vs 54.5%) or moderate (35.3% vs 45.5%) in severity, not related to study medication (96.8% vs 98.0%), and resolved without sequelae. Only 3 Latino participants (1.6%) discontinued efinaconazole treatment compared to 29 (2.8%) in the non-Latino population.
Comment
With the continued growth of the Latino population in the United States and likely higher prevalence of onychomycosis,9 this post hoc analysis provides important insights into treatment of onychomycosis in this patient population.
Efinaconazole solution 10% was significantly more effective than vehicle in the Latino population (P<.001) and also appeared significantly more effective than the non-Latino population across the 2 phase 3 studies (P=.012). Interestingly, complete cure rates (25.6%) were identical to those reported in the phase 2 study of Mexican patients treated with efinaconazole for 36 weeks.10 Specific data with other topical therapies, such as tavaborole, in Latino patients are not available. One phase 3 study of tavaborole for onychomycosis included 89 Mexican patients (15% of the total study population), but complete cure rates for the overall active treatment group were higher in a second phase 3 study (6.5% vs 9.1%) that did not include participants outside the United States or Canada.12
It is not clear why phase 3 efficacy results with efinaconazole appear better in the Latino population. There are a number of predisposing factors for onychomycosis that are important treatment considerations in Latinos. Obesity is an important factor in the development of onychomycosis,13 with more than 42% of Latino adults in the United States reportedly obese compared to 32.6% of non-Latino adults.14 Obese patients reportedly have shown a poorer response to efinaconazole treatment15; however, in our analysis, the mean weight of the 2 subpopulations was similar at baseline. Diabetes also is associated with an increased risk for onychomycosis16,17 and may be a more important issue in Latinos perhaps due to differences in health care access, social and cultural factors, and/or genetics, as well as the greater incidence of obesity. Prior reports suggest the efficacy of efinaconazole is not substantially influenced by the presence of diabetes,18 and in our 2 subpopulations, baseline incidence of coexisting diabetes was similar. These factors are unlikely to account for the better treatment success seen in our analysis. Efinaconazole has been reported to be more effective in females,19 though the reasons are less clear. The higher proportion of female Latinos (30.4% vs 21.3%) in our study may have had an impact on the results reported, though this baseline characteristic cannot be considered in isolation.
When considering the net effect (active minus vehicle), the apparent benefits of efinaconazole in Latino patients with onychomycosis were more marked. Vehicle complete cure rates at week 52 were 0% compared with 5.6% of non-Latino participants. Vehicle cure rates in randomized controlled trials of toenail onychomycosis are relatively low and appear to be independent of the study characteristics.20 Vehicle cure rates of 2 topical treatments—efinaconazole and tavaborole—reported in their 2 respective phase 3 studies were 3.3% and 5.5% for efinaconzole11 and 0.5% and 1.5% for tavaborole.12 It has been suggested that the higher results seen with the efinaconazole vehicle relate to the formulation, though there is no reason to expect it to perform differently in a Latino population. It also has been suggested that baseline disease severity might impact vehicle treatment outcome.20 In our analysis, the percentage affected nail at baseline was higher in the Latino participants treated with vehicle (38.9% vs 36.2%).
Although the overall level of AEs was similar in Latino versus non-Latino participants treated with efinaconazole, events were generally milder in the Latino subpopulation and fewer participants discontinued because of AEs.
Our study had a number of limitations. A study period of 52 weeks may be too brief to evaluate clinical cure in onychomycosis, as continued improvement could occur with either longer treatment or follow-up. Also, the pivotal studies were not set up to specifically study Latino participants; the demographics and study disposition may not be representative of the general Latino population.
Conclusion
Once-daily treatment with efinaconazole solution 10% may provide a useful topical option in the treatment of Latino patients with toenail onychomycosis.
Acknowledgment
The authors would like to thank Brian Bulley, MSc (Konic Limited, West Sussex, United Kingdom), for medical writing support. Valeant Pharmaceuticals North America LLC funded Konic Limited’s activities pertaining to this manuscript. Dr. Cook-Bolden did not receive funding or any form of compensation for authorship of this publication.
- Scher RK, Coppa LM. Advances in the diagnosis and treatment of onychomycosis. Hosp Med. 1998;34:11-20.
- Crissey JT. Common dermatophyte infections. a simple diagnostic test and current management. Postgrad Med. 1998;103:191-192, 197-200, 205.
- Gupta AK, Jain HC, Lynde CW, et al. Prevalence and epidemiology of onychomycosis in patients visiting physicians’ offices: a multicenter Canadian survey of 15,000 patients. J Am Acad Dermatol. 2000;43:244-248.
- Scher RK, Rich P, Pariser D, et al. The epidemiology, etiology, and pathophysiology of onychomycosis. Semin Cutan Med Surg. 2013;32(2, suppl 1):S2-S4.
- Kumar S, Kimball AB. New antifungal therapies for the treatment of onychomycosis. Expert Opin Investig Drugs. 2009;18:727-734.
- Ghannoum MA, Hajjeh RA, Scher R, et al. A large-scale North American study of fungal isolates from nails: the frequency of onychomycosis, fungal distribution, and antifungal susceptibility patterns. J Am Acad Dermatol. 2000;43:641-648.
- Census 2010: 50 million Latinos. Hispanics account for more than half of nation’s growth in past decade. Pew Hispanic Center website. http://pewhispanic.org/files/reports/140.pdf. Published March 24, 2011. Accessed November 22, 2016.
- Sanchez MR. Cutaneous diseases in Latinos. Dermatol Clin. 2002;21:689-697.
- Pichardo-Geisinger R, Mun˜oz-Ali D, Arcury TA, et al. Dermatologist-diagnosed skin diseases among immigrant Latino poultry processors and other manual workers in North Carolina, USA. Int J Dermatol. 2013;52:1342-1348.
- Tschen EH, Bucko AD, Oizumi N, et al. Efinaconazole solution in the treatment of toenail onychomycosis: a phase 2, multicenter, randomized, double-blind study. J Drugs Dermatol. 2013;12:186-192.
- Elewski BE, Rich P, Pollak R, et al. Efinaconazole 10% solution in the treatment of toenail onychomycosis: two phase III multicenter, randomized, double-blind studies. J Am Acad Dermatol. 2013;68:600-608.
- Elewski BE, Aly R, Baldwin SL, et al. Efficacy and safety of tavaborole topical solution, 5%, a novel boron-based antifungal agent, for the treatment of toenail onychomycosis: results from 2 randomized phase-III studies. J Am Acad Dermatol. 2015;73:62-69.
- Chan MK, Chong LY. A prospective epidemiology survey of foot disease in Hong Kong. J Am Podiatr Med Assoc. 2002;92:450-456.
- Ogden CL, Carroll MD, Kit BK, et al. Prevalence of Obesity Among Adults: United States, 2011-2012. Hyattsville, MD: National Center for Health Statistics, 2013. NCHS data brief, no. 131.
- Elewski BE, Tosti A. Risk factors and comorbidities for onychomycosis: implications for treatment with topical therapy. J Clin Aesthet Dermatol. 2015;8:38-42.
- Tosti A, Hay R, Arenas-Guzmán R. Patients at risk of onychomycosis–risk factor identification and active prevention. J Eur Acad Dermatol Venereol. 2005;19(suppl 1):13-16.
- Sigurgeirsson B, Steingrímsson O. Risk factors associated with onychomycosis. J Eur Acad Dermatol Venereol. 2004;18:48-51.
- Vlahovic TC, Joseph WS. Efinaconazole topical, 10% for the treatment of toenail onychomycosis in patients with diabetes. J Drugs Dermatol. 2014;13:1186-1190.
- Rosen T. Evaluation of gender as a clinically relevant outcome variable in the treatment of onychomycosis with efinaconazole topical solution 10%. Cutis. 2015;96:197-201.
- Gupta AK, Paquet M. Placebo cure rates in the treatment of onychomycosis. J Am Podiatr Med Assoc. 2014;104:277-282.
Onychomycosis is a common progressive fungal infection of the nail bed, matrix, or plate leading to destruction and deformity of the toenails and fingernails.1,2 It represents up to 50% of all nail disorders1,3 with a notable increasing prevalence in the United States.4-6
Latinos represent the largest ethnic minority group in the United States,7 which is growing rapidly through immigration, particularly in the southern United States. Prevalence data are limited. An incidence of 9.3% secondary to dermatophytes was recorded in a dermatology clinic setting (N=2000).8 Onychomycosis was reported in 31.9% of a group of Latino immigrants in North Carolina (N=518), with higher prevalence in poultry workers, possibly due to the work environment.9
Efinaconazole solution 10% was shown to be well tolerated and more effective than a vehicle in a phase 2 study in Mexico.10 Two identical phase 3 studies of 1655 participants assessed the safety and efficacy of efinaconazole solution 10% in the treatment of onychomycosis.11 This post hoc analysis compares the data for Latino versus non-Latino populations.
Methods
We evaluated the results of 2 multicenter, randomized, double-blind, vehicle-controlled studies that included a total of 1655 participants with mild to moderate toenail onychomycosis (20%–50% clinical involvement). Participants were randomized to efinaconazole solu-tion 10% or vehicle once daily (3:1) for 48 weeks with a 4-week posttreatment follow-up period.11
Our post hoc analysis included 270 Latino patients, defined as an individual of Cuban, Mexican, Puerto Rican, or South or Central American origin or other Latino culture, regardless of race. In addition, data were compared to the 1380 non-Latino patients in the 2 studies. Patients who were randomized in error and never received treatment were excluded from the intention-to-treat analysis.
Efficacy Evaluation
The primary efficacy end point was complete cure rate (0% clinical involvement of target toenail, and both negative potassium hydroxide examination and fungal culture) at week 52. Secondary end points included mycologic cure, complete/almost complete cure (≤5% clinical involvement of target toenail, mycologic cure), and treatment success (≤10% clinical involvement of target toenail) at week 52.
Safety Evaluation
Safety assessments included monitoring and recording of adverse events (AEs) at every postbaseline study visit through week 52. All AEs were classified using the Medical Dictionary for Regulatory Activities (version 12.1). Treatment-emergent AEs (ie, events that began after the first application of study drug) that occurred during the study were summarized for each treatment group by the number of patients reporting each event, as well as by system organ class, preferred term, severity, seriousness, and relationship to the study drug.
Results
A total of 270 Latino participants with toenail onychomycosis (efinaconazole solution 10%, n=193; vehicle, n=77) were included in our study. The mean age of participants at baseline was 45.9 years. They were predominantly male (69.6%) and white Latinos (91.1%). The mean area of target toenail involvement was 36.6%, and the mean number of affected nontarget toenails was 2.5. Latino participants tended to be younger than non-Latino participants (45.9 vs 52.6 years), with a higher proportion of females (30.4% vs 21.3%). Disease severity was similar in both populations. Diabetes was reported in 7.0% and 6.7% of Latino and non-Latino participants, respectively, and mean weight was 83.6 and 86.6 kg, respectively.
Primary Efficacy End Points (Observed Case [OC])
At week 52, 25.6% of Latino participants in the efinaconazole group achieved complete cure versus 0% in the vehicle group (P<.001)(Figure 1). The efficacy of efinaconazole was statistically superior in Latino participants versus non-Latino participants (17.2% [P=.012]). The net effect (calculated by active treatment minus vehicle) for Latino participants also was superior to non-Latino participants (25.6% vs 11.6%).
Secondary Efficacy End Points (OC)
At week 52, 61.5% of Latino participants in the efina-conazole group achieved mycologic cure versus 15.3% in the vehicle group (P<.001)(Figure 2). The net effect for Latino participants was superior to non-Latino participants (46.2% vs 38.5%). More Latino participants in the efinaconazole group compared to vehicle group achieved complete/almost complete cure (32.7% vs 1.7%) or treatment success (49.4% vs 5.1%)(all P<.001)(Figure 3). Although there was no significant difference between the 2 groups for secondary efficacy end points, the net effect of efinaconazole was greater for all end points.
Safety
Adverse event rates were higher in the efinaconazole group than the vehicle group (65.3% vs 54.4%) and were similar in both populations; they were generally mild (61.8% vs 54.5%) or moderate (35.3% vs 45.5%) in severity, not related to study medication (96.8% vs 98.0%), and resolved without sequelae. Only 3 Latino participants (1.6%) discontinued efinaconazole treatment compared to 29 (2.8%) in the non-Latino population.
Comment
With the continued growth of the Latino population in the United States and likely higher prevalence of onychomycosis,9 this post hoc analysis provides important insights into treatment of onychomycosis in this patient population.
Efinaconazole solution 10% was significantly more effective than vehicle in the Latino population (P<.001) and also appeared significantly more effective than the non-Latino population across the 2 phase 3 studies (P=.012). Interestingly, complete cure rates (25.6%) were identical to those reported in the phase 2 study of Mexican patients treated with efinaconazole for 36 weeks.10 Specific data with other topical therapies, such as tavaborole, in Latino patients are not available. One phase 3 study of tavaborole for onychomycosis included 89 Mexican patients (15% of the total study population), but complete cure rates for the overall active treatment group were higher in a second phase 3 study (6.5% vs 9.1%) that did not include participants outside the United States or Canada.12
It is not clear why phase 3 efficacy results with efinaconazole appear better in the Latino population. There are a number of predisposing factors for onychomycosis that are important treatment considerations in Latinos. Obesity is an important factor in the development of onychomycosis,13 with more than 42% of Latino adults in the United States reportedly obese compared to 32.6% of non-Latino adults.14 Obese patients reportedly have shown a poorer response to efinaconazole treatment15; however, in our analysis, the mean weight of the 2 subpopulations was similar at baseline. Diabetes also is associated with an increased risk for onychomycosis16,17 and may be a more important issue in Latinos perhaps due to differences in health care access, social and cultural factors, and/or genetics, as well as the greater incidence of obesity. Prior reports suggest the efficacy of efinaconazole is not substantially influenced by the presence of diabetes,18 and in our 2 subpopulations, baseline incidence of coexisting diabetes was similar. These factors are unlikely to account for the better treatment success seen in our analysis. Efinaconazole has been reported to be more effective in females,19 though the reasons are less clear. The higher proportion of female Latinos (30.4% vs 21.3%) in our study may have had an impact on the results reported, though this baseline characteristic cannot be considered in isolation.
When considering the net effect (active minus vehicle), the apparent benefits of efinaconazole in Latino patients with onychomycosis were more marked. Vehicle complete cure rates at week 52 were 0% compared with 5.6% of non-Latino participants. Vehicle cure rates in randomized controlled trials of toenail onychomycosis are relatively low and appear to be independent of the study characteristics.20 Vehicle cure rates of 2 topical treatments—efinaconazole and tavaborole—reported in their 2 respective phase 3 studies were 3.3% and 5.5% for efinaconzole11 and 0.5% and 1.5% for tavaborole.12 It has been suggested that the higher results seen with the efinaconazole vehicle relate to the formulation, though there is no reason to expect it to perform differently in a Latino population. It also has been suggested that baseline disease severity might impact vehicle treatment outcome.20 In our analysis, the percentage affected nail at baseline was higher in the Latino participants treated with vehicle (38.9% vs 36.2%).
Although the overall level of AEs was similar in Latino versus non-Latino participants treated with efinaconazole, events were generally milder in the Latino subpopulation and fewer participants discontinued because of AEs.
Our study had a number of limitations. A study period of 52 weeks may be too brief to evaluate clinical cure in onychomycosis, as continued improvement could occur with either longer treatment or follow-up. Also, the pivotal studies were not set up to specifically study Latino participants; the demographics and study disposition may not be representative of the general Latino population.
Conclusion
Once-daily treatment with efinaconazole solution 10% may provide a useful topical option in the treatment of Latino patients with toenail onychomycosis.
Acknowledgment
The authors would like to thank Brian Bulley, MSc (Konic Limited, West Sussex, United Kingdom), for medical writing support. Valeant Pharmaceuticals North America LLC funded Konic Limited’s activities pertaining to this manuscript. Dr. Cook-Bolden did not receive funding or any form of compensation for authorship of this publication.
- Scher RK, Coppa LM. Advances in the diagnosis and treatment of onychomycosis. Hosp Med. 1998;34:11-20.
- Crissey JT. Common dermatophyte infections. a simple diagnostic test and current management. Postgrad Med. 1998;103:191-192, 197-200, 205.
- Gupta AK, Jain HC, Lynde CW, et al. Prevalence and epidemiology of onychomycosis in patients visiting physicians’ offices: a multicenter Canadian survey of 15,000 patients. J Am Acad Dermatol. 2000;43:244-248.
- Scher RK, Rich P, Pariser D, et al. The epidemiology, etiology, and pathophysiology of onychomycosis. Semin Cutan Med Surg. 2013;32(2, suppl 1):S2-S4.
- Kumar S, Kimball AB. New antifungal therapies for the treatment of onychomycosis. Expert Opin Investig Drugs. 2009;18:727-734.
- Ghannoum MA, Hajjeh RA, Scher R, et al. A large-scale North American study of fungal isolates from nails: the frequency of onychomycosis, fungal distribution, and antifungal susceptibility patterns. J Am Acad Dermatol. 2000;43:641-648.
- Census 2010: 50 million Latinos. Hispanics account for more than half of nation’s growth in past decade. Pew Hispanic Center website. http://pewhispanic.org/files/reports/140.pdf. Published March 24, 2011. Accessed November 22, 2016.
- Sanchez MR. Cutaneous diseases in Latinos. Dermatol Clin. 2002;21:689-697.
- Pichardo-Geisinger R, Mun˜oz-Ali D, Arcury TA, et al. Dermatologist-diagnosed skin diseases among immigrant Latino poultry processors and other manual workers in North Carolina, USA. Int J Dermatol. 2013;52:1342-1348.
- Tschen EH, Bucko AD, Oizumi N, et al. Efinaconazole solution in the treatment of toenail onychomycosis: a phase 2, multicenter, randomized, double-blind study. J Drugs Dermatol. 2013;12:186-192.
- Elewski BE, Rich P, Pollak R, et al. Efinaconazole 10% solution in the treatment of toenail onychomycosis: two phase III multicenter, randomized, double-blind studies. J Am Acad Dermatol. 2013;68:600-608.
- Elewski BE, Aly R, Baldwin SL, et al. Efficacy and safety of tavaborole topical solution, 5%, a novel boron-based antifungal agent, for the treatment of toenail onychomycosis: results from 2 randomized phase-III studies. J Am Acad Dermatol. 2015;73:62-69.
- Chan MK, Chong LY. A prospective epidemiology survey of foot disease in Hong Kong. J Am Podiatr Med Assoc. 2002;92:450-456.
- Ogden CL, Carroll MD, Kit BK, et al. Prevalence of Obesity Among Adults: United States, 2011-2012. Hyattsville, MD: National Center for Health Statistics, 2013. NCHS data brief, no. 131.
- Elewski BE, Tosti A. Risk factors and comorbidities for onychomycosis: implications for treatment with topical therapy. J Clin Aesthet Dermatol. 2015;8:38-42.
- Tosti A, Hay R, Arenas-Guzmán R. Patients at risk of onychomycosis–risk factor identification and active prevention. J Eur Acad Dermatol Venereol. 2005;19(suppl 1):13-16.
- Sigurgeirsson B, Steingrímsson O. Risk factors associated with onychomycosis. J Eur Acad Dermatol Venereol. 2004;18:48-51.
- Vlahovic TC, Joseph WS. Efinaconazole topical, 10% for the treatment of toenail onychomycosis in patients with diabetes. J Drugs Dermatol. 2014;13:1186-1190.
- Rosen T. Evaluation of gender as a clinically relevant outcome variable in the treatment of onychomycosis with efinaconazole topical solution 10%. Cutis. 2015;96:197-201.
- Gupta AK, Paquet M. Placebo cure rates in the treatment of onychomycosis. J Am Podiatr Med Assoc. 2014;104:277-282.
Practice Points
- Onychomycosis is a common disease of importance in the increasing Latino population of the United States, especially due to predisposing factors such as obesity and diabetes mellitus. Specific data on the treatment of this patient population are lacking.
- Two large phase 3 studies with topical efinaconazole treatment included a notable number of Latino patients.
- Complete cure rates with efinaconazole in Latino participants were notably greater than those observed in the non-Latino population, and treatment was well tolerated in both groups.
- Treatment of onychomycosis is important to possibly prevent a more serious infectious disease involving the lower extremities, especially in those with comorbidities such as obesity, diabetes, and peripheral vascular disease.
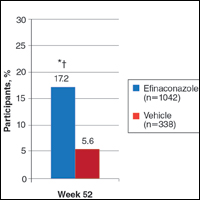
Can scribes boost FPs’ efficiency and job satisfaction?
ABSTRACT
Purpose Research in other medical specialties has shown that the addition of medical scribes to the clinical team enhances physicians’ practice experience and increases productivity. To date, literature on the implementation of scribes in primary care is limited. To determine the feasibility and benefits of implementing scribes in family medicine, we undertook a pilot mixed-method quality improvement (QI) study.
Methods In 2014, we incorporated 4 part-time scribes into an academic family medicine practice consisting of 7 physicians. We then measured, via survey and time-tracking data, the impact the scribes had on physician office hours and productivity, time spent on documentation, perceptions of work-life balance, and physician and patient satisfaction.
Results Six of the 7 faculty physicians participated. This study demonstrated that the use of scribes in a busy academic primary care practice substantially reduced the amount of time that family physicians spent on charting, improved work-life balance, and had good patient acceptance. Specifically, the physicians spent an average of 5.1 fewer hours/week (hrs/wk) on documentation, while various measures of productivity revealed increases ranging from 9.2% to 28.8%. Perhaps most important of all, when the results of the pilot study were annualized, they were projected to generate $168,600 per year—more than twice the $79,500 annual cost of 2 full-time equivalent scribes.
Surveys assessing work-life balance demonstrated improvement in the physicians’ perception of the administrative burden/paperwork related to practice and a decrease in their perception of the extent to which work encroached on their personal lives. In addition, survey data from 313 patients at the time of their ambulatory visit with a scribe present revealed a high level of comfort. Likewise, surveys completed by physicians after 55 clinical sessions (ie, blocks of consecutive, uninterrupted patient appointments; there are usually 2 sessions per day) revealed good to excellent ratings more than 90% of the time.
Conclusion In an outpatient family medicine clinic, the use of scribes substantially improved physicians’ efficiency, job satisfaction, and productivity without negatively impacting the patient experience.
While electronic medical records (EMRs) are important tools for improving patient care and communication, they bring with them an additional administrative burden for health care providers. In the emergency medicine literature, scribes have been reported to reduce that burden and improve clinicians’ productivity and satisfaction.1-4 Additionally, studies have reported increases in patient volume, generated billings, and provider morale, as well as decreases in emergency department (ED) lengths of stay.5 A recent review of the emergency medicine literature concluded that scribes have “the ability to allay the burden of documentation, improve throughput in the ED, and potentially enhance doctors’ satisfaction.”6
Similar benefits following scribe implementation have been reported in the literature of other specialties. A maternal-fetal medicine practice reported significant increases in generated billings and reimbursement.7 Increases in physician productivity and improvements in physician-patient interactions were reported in a cardiology clinic,8 and a urology practice reported high satisfaction and acceptance rates among both patients and physicians.9
Practice management literature and an article in The New York Times have anecdotally described the benefits of scribes in clinical practice10-12 with the latter noting that, “Physicians who use [scribes] say they feel liberated from the constant note-taking ...” and that “scribes have helped restore joy in the practice of medicine.”10
A small retrospective review that appeared in The Journal of Family Practice last year looked at the quality of scribes’ notes and found that they were rated slightly higher than physicians’ notes—at least for diabetes visits. However, it did not address the issues of physician productivity or satisfaction. (See "Medical scribes: How do their notes stack up?" 2016;65:155-159.)
The only family medicine study that we did find that addressed these 2 issues was one done in Oregon. The study noted that scribes enabled physicians to see 24 patients per day—up from 18, with accompanying improvements in physician “quality of life.”13 Absent from the literature are quantitative data on the feasibility and benefits of implementing scribes in family medicine.
Could a study at our facility offer some insights? In light of the paucity of published data on scribes in family medicine, and the fact that a survey conducted at our health center revealed that our faculty physicians felt overburdened by the administrative demands of clinical practice,14 we decided to study whether scribes might improve the work climate for clinicians at our family medicine residency training site. Our goal was to assess the impact of scribes on physician and patient satisfaction and on hours physicians spent on administrative tasks generated by clinical care.
METHODS
The study took place at the Barre Family Health Center (BFHC), a rural, freestanding family health center/residency site owned and operated by UMassMemorial Health Care (UMMHC), the major teaching/clinical affiliate of the University of Massachusetts Medical School. The health care providers of BFHC conduct 40,000 patient visits annually. Without scribes, the physicians typically dictated their notes at the end of the day, and they became available for review/sign off usually within 24 hours.
Six of the 7 faculty physicians working at BFHC in 2014 (including the lead author) participated in the pilot study (the seventh declined to participate). Three male and 3 female physicians between the ages of 34 and 65 years participated; they had been in practice between 5 and 40 years. All of the physicians had used an EMR for 5 years or more, and all but 2 had previously used a paper record. Residents and advanced practitioners did not participate because limited funding allowed for the hiring of only 2 full-time equivalent (FTE; 4 part-time) scribes.
Contracting for services. We contracted with an outside vendor for scribe services. Prior to their arrival at our health care center, the scribes received online training on medical vocabulary, note structure, billing and coding, and patient confidentiality (HIPAA). Once they arrived, on-site training detailed workflow, precharting, use of templates, the EMR and chart organization, and billing. In addition to typing notes into the EMR during patient visits, the scribes helped develop processes for scheduling, alerting patients to the scribe’s role, and defining when scribes should and should not be present in the exam room. The chief scribe created a monthly schedule, which enabled staff to determine which physician schedules should have extra appointment slots added. This was imperative because our parent institution mandated that new initiatives yield a 25% return on investment (ROI).
Using standard scripting and consent methods, nursing staff informed patients during rooming that the provider was working with a scribe, explained the scribe’s role, and asked about any objections to the scribe’s presence. Patients could decline scribe involvement, and all scribes were routinely excused during genital and rectal examinations.
Data collection
Data were collected during the 6-month trial period from May through October of 2014. The number of hours physicians spent at BFHC and at home working on clinical documentation was collected using a smartphone time-tracking application for two 3-week periods: the first period was in April 2014, before the scribes came on board; the second period was at the end of the 6-month scribe implementation period. In order to assess effects on productivity and whether the project was meeting the required ROI for continuation, we included a retrospective review of the EMR for both of the 3-week periods to document total clinical hours, number of clinic sessions (blocks of consecutive, uninterrupted appointments), average hours per session, the number of patient appointments scheduled per session, and the number of patient visits actually conducted per session (accounting for no-shows and unused appointments).
Physician work-life balance. We utilized 19 questions most relevant to this project’s focus from the 36-item Physician Work-Life Survey.15 Items were scored on a 5-point Likert scale ranging from ‘strongly disagree’ (1) to ‘strongly agree’ (5). The BFHC ambulatory manager distributed surveys to physicians immediately prior to the trial with scribes and 2 weeks after the conclusion of the 6-month trial.
Patient and provider satisfaction. During the 6-month intervention period, satisfaction surveys9 were distributed to patients by scribes at the end of the office visit and to physicians at the end of each scribed session, after notes were completed and reviewed. Patient surveys consisted of 6 closed-end questions regarding comfort level with the scribe in the exam room, willingness to have a scribe present for subsequent visits, importance of the scribe being the same gender/age as the patient, and overall satisfaction with the scribe’s presence (TABLE 1).
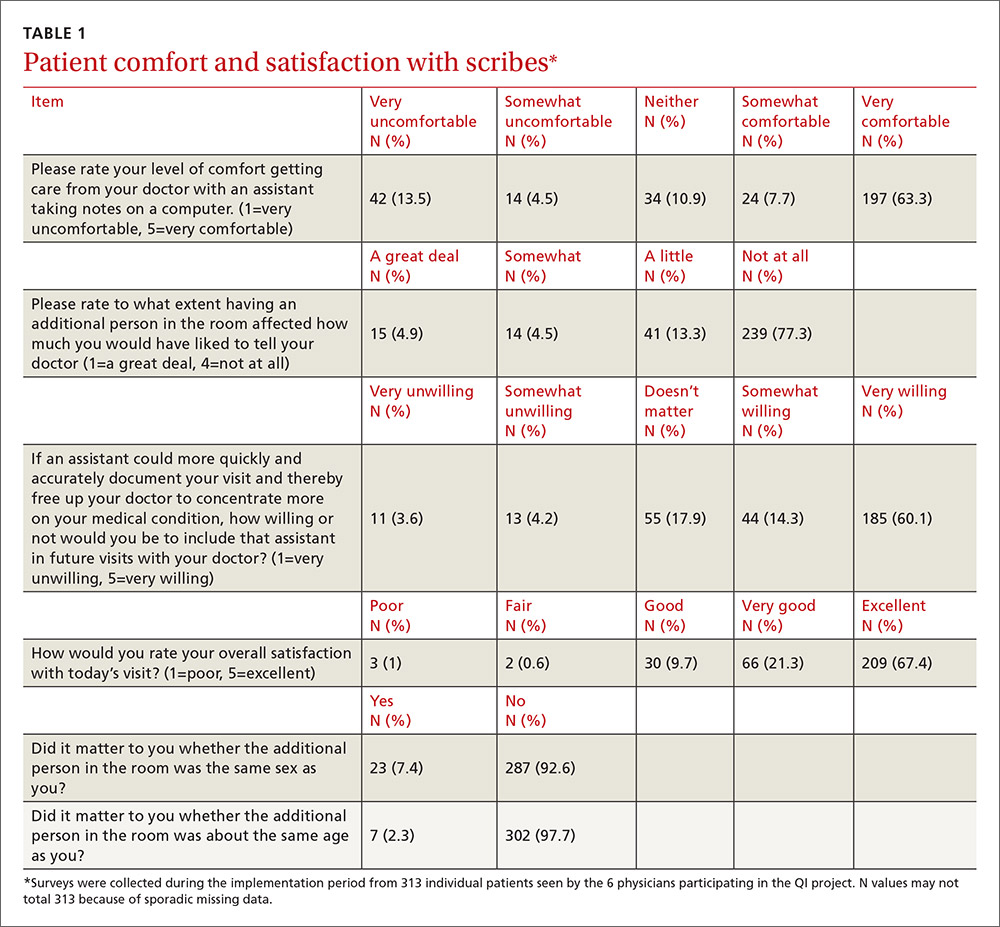
Physician surveys included 5 closed-end questions9 regarding comfort level with the scribe’s presence, ease of EMR documentation, change in office hours with having a scribe for that day’s session(s), and overall helpfulness of the scribe (TABLE 2). Open-ended questions on both surveys asked for additional comments or concerns regarding scribes and the scribe’s impact on patient encounters.
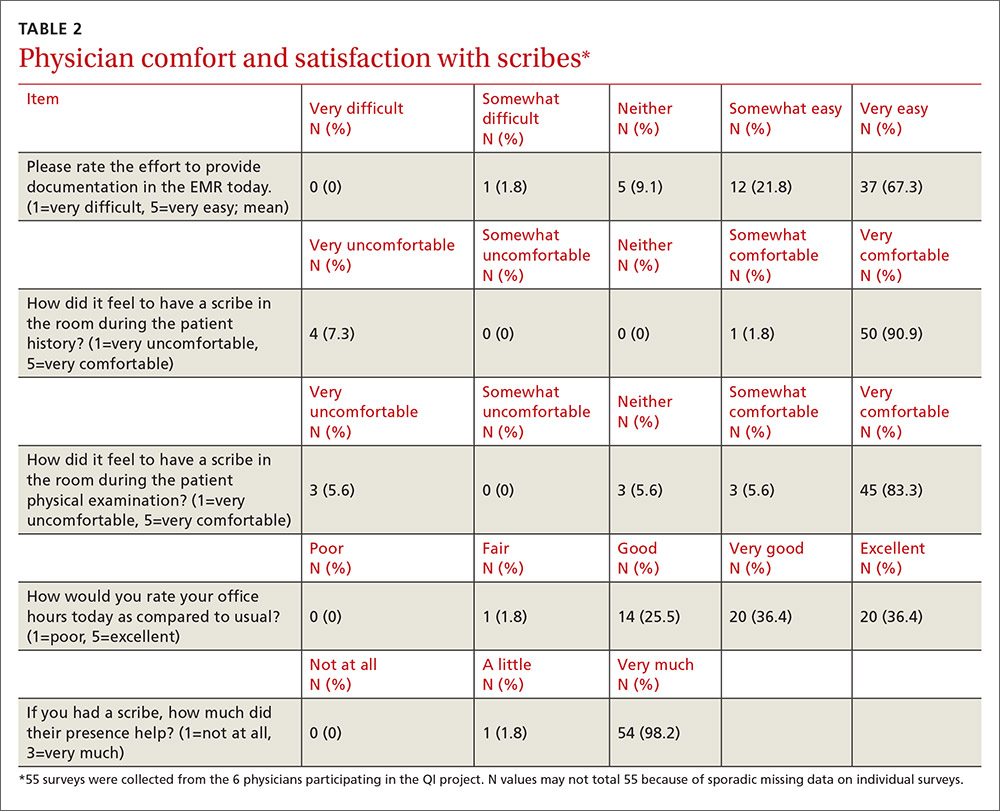
Our goal was to collect a minimum of 100 completed patient surveys and 50 completed physician surveys representing as many different patient demographics, visit types, days of the week, and times of day as possible. Surveys were anonymous and distributed during the second and third months of the trial, giving the scribes a one-month training and adjustment period.
Impact assessment, professional development needs. At the end of the 6-month study period, we held 2 focus groups—one with nurses and one with scribes. From the nurses, we solicited insights regarding the impact of scribes on patient volume, patient satisfaction, visit flow, and EMR documentation.
Scribes were asked about job skills needed, amount of training received, comfort in the exam room (both for themselves and patients), frequency of feedback received, balancing physician style with EMR documentation needs, and lessons learned.
Data analysis
Data were analyzed using the software SPSS V22.0. Univariate statistics were used to analyze patient and physician satisfaction, as well as clinic volume, time tracking, and EMR documentation. Initially, bivariate statistics were used to examine pre- and post-trial physician and patient data, but then non-parametric comparisons were used because of small sample sizes (and the resulting data being distributed abnormally). Detailed focus group notes were reviewed by all study investigators and summarized for dominant themes to support the quantitative evaluation. Lastly, the study was evaluated by the University of Massachusetts Institutional Review Board and was waived from review/oversight because of its QI intent.
RESULTS
Physician findings. Fifty-five physician surveys were completed during the 6-month period (TABLE 2). All of the physicians who were asked to complete this short survey at the end of the day (after reviewing notes with their scribe) did so. Physicians reported a high degree of satisfaction with collaboration with scribes. Their comments reflected positive experiences, including an improved ability to remain on schedule, having assistance finding important information in the record, and having notes completed at the end of the session.
TABLE 3 shows high satisfaction with clinical roles and colleagues with no substantive changes over time regarding these questions. However, the incorporation of scribes had a positive impact on issues related to physician morale, due to changes in paperwork, administrative duties, and work schedules.
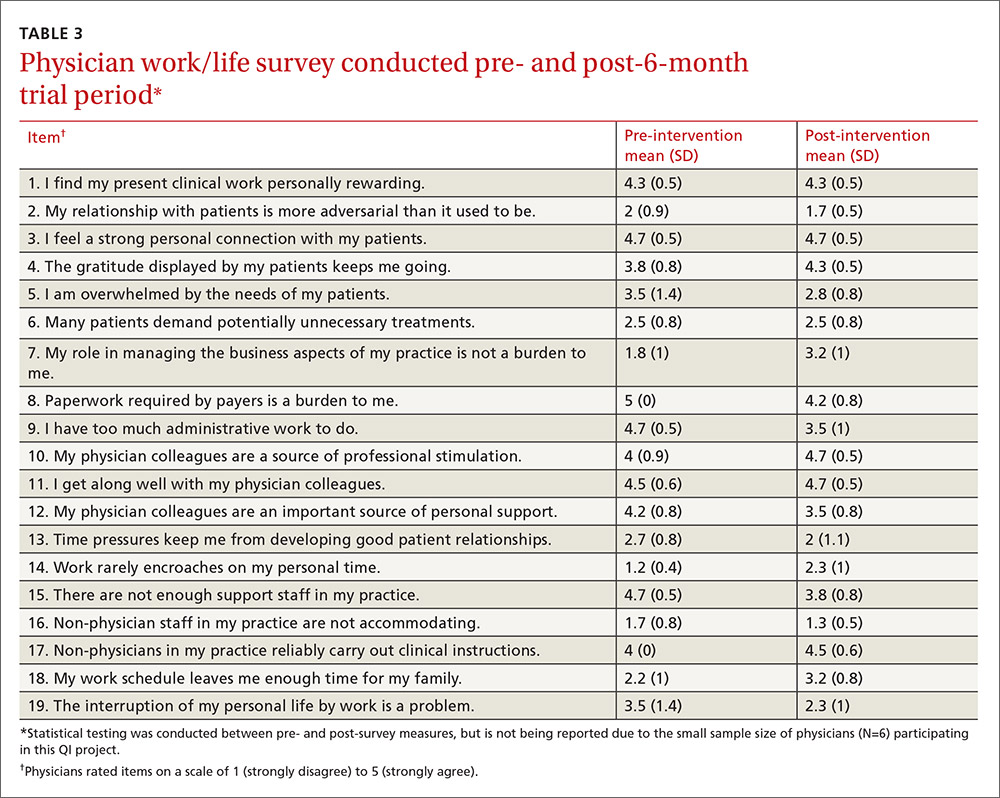
Review of patient scheduling and documentation (TABLE 4) revealed visits per clinical session increased 28.8% from 6.6 to 8.5, and for sessions with 10 or more appointment slots available, billable visits increased 9.2% from 8.7 to 9.5. This increase was a result of adding an additional appointment slot to the schedule when a scribe was assigned and a greater physician willingness to overbook when scribe assistance was available.
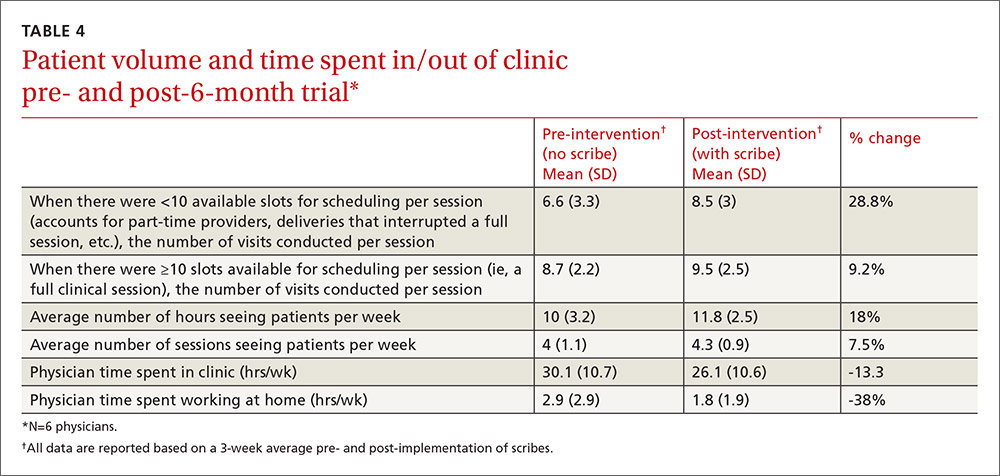
A comparison of time tracking pre- and post-intervention showed a 13% decrease in time spent in the clinic, from a 3-week average of 30.1 hrs/wk to 26.1 hrs/wk (TABLE 4). Time spent working at home decreased 38%, from a 3-week average of 2.9 hrs/wk to 1.8 hrs/wk. These reductions occurred despite average scheduled clinic hours being 18% higher (35.5 vs 30.1) during the post- vs pre-intervention measurement periods.
Patient findings. TABLE 1 summarizes the 313 patient responses. Less than 10% of patients declined to have a scribe during the visit. Patients reported a high level of comfort with the scribe and indicated that having a scribe in the room had little impact on what they would have liked to tell their doctor. Nearly all open-ended comments were positive and reflected feelings that the scribe’s presence enabled their provider to focus more on them and less on the computer.
Focus group findings
The scribe focus group identified a number of skills thought to be necessary to be successful in the job, including typing quickly; having technology/computer-searching strategy skills; and being detail-oriented, organized, and able to multitask. Scribes estimated that it took 2 to 6 weeks to feel comfortable doing the job. Physician feedback was preferred at the end of every session.
Lastly, the 4 scribes identified several challenges that should be addressed in future training, such as how to: 1. document a visit when the patient has a complicated medical history and the communication between the doctor and the patient is implicit; 2. incorporate the particulars of a visit into a patient’s full medical history; and 3. sift through the volume of previous notes when a physician has been seeing a patient for a long period of time.
The nurses’ focus group identified many positive effects on patient care. They reported no significant challenges with introducing scribes to patients. Improvements in timely availability of documentation enhanced their ability to respond quickly and more completely to patient queries. The nurses noted that the use of scribes improved patient care and made them “a better practice.”
DISCUSSION
This study demonstrated that the use of scribes in a busy academic primary care practice substantially reduced the amount of time that family practitioners spent on charting, improved work-life balance, and had good patient acceptance. Our time-tracking studies demonstrated that physicians spent 5.1 fewer hrs/wk working—4 fewer hrs/wk in the clinic, and 1.1 fewer hrs/wk outside of the clinic—while clinical hours and productivity per session increased. Patients reported high satisfaction with scribed visits and a willingness to have scribes in the future. Creating notes in real time and having immediate availability after the session was a plus for nursing staff in providing follow-up patient care.
Concerns by physicians that having another person in the room would alter the physician-patient relationship were not substantiated, perhaps because the staff routinely obtained consent and explained the scribe’s role. Consistent with previous work, we found no suggestion that a scribe’s presence affected patients’ willingness to discuss sensitive issues.9 Patients reacted positively to scribes who enabled physicians to focus more on the patient and less on charting.
Despite increased patient volume, physician morale improved. Physicians left work more than an hour earlier per day, on average, and spent over 1 hour less per week working on clinical documentation outside the office. Physician surveys showed an improvement in perceptions of how much work encroached on their personal life, consistent with the time-tracking data. These results have significant implications for clinician retention, productivity, and satisfaction.
Since our site is an academic training site, one might wonder how residents and advanced practitioners viewed this implementation, as they were not initially included. From the perspective of the administrators, this was a feasibility study. Clinicians who were not included understood that if this pilot was successful, the use of scribes would be expanded in the future. In fact, because of these positive results, our institution has expanded the scribe program, so that it now covers all clinical sessions for faculty in our center and is rolling out a similar program in 3 other departmental academic practices.
Financial implications. At the beginning of this initiative, our institution required that we cover the cost of the program plus generate a 25% ROI. Using a conservative 9.2% increase in billable visits, we extrapolated that utilizing 2 FTE scribes would result in an additional 860 visits annually. Per our hospital’s finance department, estimated revenue generated by our facility-based practice per visit is $196, including ancillaries. That means that additional visits would generate an estimated $168,600 annually—more than twice the $79,500 annual cost of 2 FTE scribes, yielding a 112% ROI. Furthermore, patient access improved by making more visits available. Beyond the positive direct ROI, the improvements in physician morale and work-life balance have positive implications for retention, likely substantially increasing the long-term, overall ROI.
Challenges. Implementing a new program in a large organization proved to be challenging. The biggest hurdle was convincing our institution’s administration and finance department that this new expense would pay for itself in both tangible (increased visits per session) and intangible (increased physician satisfaction and retention) ways. A cost-sharing arrangement proposed by our department’s administrator convinced hospital administration to move forward. Additional challenges included delays in getting the scribe program started because of vendor selection, purchasing new laptops for scribes, hiring and training scribes, developing new EMR templates, validating provider productivity, and legal/compliance approval of the scribe’s EMR documentation processes to meet third-party and accuracy/quality requirements—all taking longer than anticipated. However, we believe that our results indicate significant potential for other primary care practices.
Limitations. The number of physicians in the study was small, and they all worked in the same location. Social desirability could have biased patient and provider feedback, but our quantitative results were consistent with subjective assessments, suggesting that information bias potential was low. Patient and provider survey findings were also supported by qualitative assessments from both scribes and nursing staff. The size of the project did not lend itself to an analysis controlling for clustering by physician and/or scribe. The focus group discussions were not subject to rigorous qualitative analysis, potentially increasing the risk of biased interpretation. Lastly, we did not have the ability to directly compare sessions with and without scribes during the pilot.
Similarity to other findings. Despite these limitations, our findings are remarkably similar to those of Howard, et al,16 on the pilot implementation of scribes in a community health center, including good patient and clinician acceptance and increased productivity that more than offset the cost of the scribes. We expect that others implementing scribe services in primary care settings will experience similar results.
CORRESPONDENCE
Stephen T. Earls, MD, 151 Worcester Road, Barre, MA 01005; [email protected].
ACKNOWLEDGEMENT
The authors gratefully acknowledge the assistance of Barbara Fisher, MBA, vice president for ambulatory services; Nicholas Comeau, BS; and Brenda Rivard, administrative lead, Barre Family Health Center, UMassMemorial Health Care, in the preparation and execution of this study.
1. Walker K, Ben-Meir M, O’Mullane P, et al. Scribes in an Australian private emergency department: a description of physician productivity. Emerg Med Australas. 2014;26:543-548.
2. Arya R, Salovich DM, Ohman-Strickland P, et al. Impact of scribes on performance indicators in the emergency department. Acad Emerg Med. 2010;17:490-494.
3. Expanded scribe role boosts staff morale. ED Manag. 2009;21:75-77.
4. Scribes, EMR please docs, save $600,000. ED Manag. 2009;21:117-118.
5. Bastani A, Shaqiri B, Palomba K, et al. An ED scribe program is able to improve throughput time and patient satisfaction. Am J Emerg Med. 2014;32:399-402.
6. Cabilan CJ, Eley RM. Review article: potential of medical scribes to allay the burden of documentation and enhance efficiency in Australian emergency departments. Emerg Med Australas. 2015 Aug 13. [Epub ahead of print]
7. Hegstrom L, Leslie J, Hutchinson E, et al. Medical scribes: are scribe programs cost effective in an outpatient MFM setting? Am J Obstet Gynecol. 2013;208:S240.
8. Campbell LL, Case D, Crocker JE, et al. Using medical scribes in a physician practice. J AHIMA. 2012;83:64-69.
9. Koshy S, Feustel PJ, Hong M, et al. Scribes in an ambulatory urology practice: patient and physician satisfaction. J Urol. 2010;184:258-262.
10. Hafner K. A busy doctor’s right hand, ever ready to type. The New York Times. January 12, 2014. Available at: https://www.nytimes.com/2014/01/14/health/a-busy-doctors-right-hand-ever-ready-to-type.html?_r=0. Accessed February 6, 2017.
11. Brady K, Shariff A. Virtual medical scribes: making electronic medical records work for you. J Med Pract Manage. 2013;29:133-136.
12. Baugh R, Jones JE, Troff K, et al. Medical scribes. J Med Pract Manage. 2012;28:195-197.
13. Grimshaw H. Physician scribes improve productivity. Oak Street Medical allows doctors to spend more face time with patients, improve job satisfaction. MGMA Connex. 2012;12:27-28.
14. Morehead Associates, Inc. UMassMemorial Health Care: Physician Satisfaction Survey. 2013.
15. Konrad TR, Williams ES, Linzer M, et al. Measuring physician job satisfaction in a changing workplace and challenging environment. SGIM Career Satisfaction Study Group. Society of General Internal Medicine. Med Care. 1999;37:1174-1182.
16. Howard KA, Helé K, Salibi N, et al. BTW Informing change. Blue Shield of California Foundation. Adapting the EHR scribe model to community health centers: the experience of Shasta Community Health Center’s pilot. Available at: http://informingchange.com/cat-publications/adapting-the-ehr-scribe-model-to-community-health-centers-the-experience-of-shasta-community-health-centers-pilot. Accessed November 6, 2015.
ABSTRACT
Purpose Research in other medical specialties has shown that the addition of medical scribes to the clinical team enhances physicians’ practice experience and increases productivity. To date, literature on the implementation of scribes in primary care is limited. To determine the feasibility and benefits of implementing scribes in family medicine, we undertook a pilot mixed-method quality improvement (QI) study.
Methods In 2014, we incorporated 4 part-time scribes into an academic family medicine practice consisting of 7 physicians. We then measured, via survey and time-tracking data, the impact the scribes had on physician office hours and productivity, time spent on documentation, perceptions of work-life balance, and physician and patient satisfaction.
Results Six of the 7 faculty physicians participated. This study demonstrated that the use of scribes in a busy academic primary care practice substantially reduced the amount of time that family physicians spent on charting, improved work-life balance, and had good patient acceptance. Specifically, the physicians spent an average of 5.1 fewer hours/week (hrs/wk) on documentation, while various measures of productivity revealed increases ranging from 9.2% to 28.8%. Perhaps most important of all, when the results of the pilot study were annualized, they were projected to generate $168,600 per year—more than twice the $79,500 annual cost of 2 full-time equivalent scribes.
Surveys assessing work-life balance demonstrated improvement in the physicians’ perception of the administrative burden/paperwork related to practice and a decrease in their perception of the extent to which work encroached on their personal lives. In addition, survey data from 313 patients at the time of their ambulatory visit with a scribe present revealed a high level of comfort. Likewise, surveys completed by physicians after 55 clinical sessions (ie, blocks of consecutive, uninterrupted patient appointments; there are usually 2 sessions per day) revealed good to excellent ratings more than 90% of the time.
Conclusion In an outpatient family medicine clinic, the use of scribes substantially improved physicians’ efficiency, job satisfaction, and productivity without negatively impacting the patient experience.
While electronic medical records (EMRs) are important tools for improving patient care and communication, they bring with them an additional administrative burden for health care providers. In the emergency medicine literature, scribes have been reported to reduce that burden and improve clinicians’ productivity and satisfaction.1-4 Additionally, studies have reported increases in patient volume, generated billings, and provider morale, as well as decreases in emergency department (ED) lengths of stay.5 A recent review of the emergency medicine literature concluded that scribes have “the ability to allay the burden of documentation, improve throughput in the ED, and potentially enhance doctors’ satisfaction.”6
Similar benefits following scribe implementation have been reported in the literature of other specialties. A maternal-fetal medicine practice reported significant increases in generated billings and reimbursement.7 Increases in physician productivity and improvements in physician-patient interactions were reported in a cardiology clinic,8 and a urology practice reported high satisfaction and acceptance rates among both patients and physicians.9
Practice management literature and an article in The New York Times have anecdotally described the benefits of scribes in clinical practice10-12 with the latter noting that, “Physicians who use [scribes] say they feel liberated from the constant note-taking ...” and that “scribes have helped restore joy in the practice of medicine.”10
A small retrospective review that appeared in The Journal of Family Practice last year looked at the quality of scribes’ notes and found that they were rated slightly higher than physicians’ notes—at least for diabetes visits. However, it did not address the issues of physician productivity or satisfaction. (See "Medical scribes: How do their notes stack up?" 2016;65:155-159.)
The only family medicine study that we did find that addressed these 2 issues was one done in Oregon. The study noted that scribes enabled physicians to see 24 patients per day—up from 18, with accompanying improvements in physician “quality of life.”13 Absent from the literature are quantitative data on the feasibility and benefits of implementing scribes in family medicine.
Could a study at our facility offer some insights? In light of the paucity of published data on scribes in family medicine, and the fact that a survey conducted at our health center revealed that our faculty physicians felt overburdened by the administrative demands of clinical practice,14 we decided to study whether scribes might improve the work climate for clinicians at our family medicine residency training site. Our goal was to assess the impact of scribes on physician and patient satisfaction and on hours physicians spent on administrative tasks generated by clinical care.
METHODS
The study took place at the Barre Family Health Center (BFHC), a rural, freestanding family health center/residency site owned and operated by UMassMemorial Health Care (UMMHC), the major teaching/clinical affiliate of the University of Massachusetts Medical School. The health care providers of BFHC conduct 40,000 patient visits annually. Without scribes, the physicians typically dictated their notes at the end of the day, and they became available for review/sign off usually within 24 hours.
Six of the 7 faculty physicians working at BFHC in 2014 (including the lead author) participated in the pilot study (the seventh declined to participate). Three male and 3 female physicians between the ages of 34 and 65 years participated; they had been in practice between 5 and 40 years. All of the physicians had used an EMR for 5 years or more, and all but 2 had previously used a paper record. Residents and advanced practitioners did not participate because limited funding allowed for the hiring of only 2 full-time equivalent (FTE; 4 part-time) scribes.
Contracting for services. We contracted with an outside vendor for scribe services. Prior to their arrival at our health care center, the scribes received online training on medical vocabulary, note structure, billing and coding, and patient confidentiality (HIPAA). Once they arrived, on-site training detailed workflow, precharting, use of templates, the EMR and chart organization, and billing. In addition to typing notes into the EMR during patient visits, the scribes helped develop processes for scheduling, alerting patients to the scribe’s role, and defining when scribes should and should not be present in the exam room. The chief scribe created a monthly schedule, which enabled staff to determine which physician schedules should have extra appointment slots added. This was imperative because our parent institution mandated that new initiatives yield a 25% return on investment (ROI).
Using standard scripting and consent methods, nursing staff informed patients during rooming that the provider was working with a scribe, explained the scribe’s role, and asked about any objections to the scribe’s presence. Patients could decline scribe involvement, and all scribes were routinely excused during genital and rectal examinations.
Data collection
Data were collected during the 6-month trial period from May through October of 2014. The number of hours physicians spent at BFHC and at home working on clinical documentation was collected using a smartphone time-tracking application for two 3-week periods: the first period was in April 2014, before the scribes came on board; the second period was at the end of the 6-month scribe implementation period. In order to assess effects on productivity and whether the project was meeting the required ROI for continuation, we included a retrospective review of the EMR for both of the 3-week periods to document total clinical hours, number of clinic sessions (blocks of consecutive, uninterrupted appointments), average hours per session, the number of patient appointments scheduled per session, and the number of patient visits actually conducted per session (accounting for no-shows and unused appointments).
Physician work-life balance. We utilized 19 questions most relevant to this project’s focus from the 36-item Physician Work-Life Survey.15 Items were scored on a 5-point Likert scale ranging from ‘strongly disagree’ (1) to ‘strongly agree’ (5). The BFHC ambulatory manager distributed surveys to physicians immediately prior to the trial with scribes and 2 weeks after the conclusion of the 6-month trial.
Patient and provider satisfaction. During the 6-month intervention period, satisfaction surveys9 were distributed to patients by scribes at the end of the office visit and to physicians at the end of each scribed session, after notes were completed and reviewed. Patient surveys consisted of 6 closed-end questions regarding comfort level with the scribe in the exam room, willingness to have a scribe present for subsequent visits, importance of the scribe being the same gender/age as the patient, and overall satisfaction with the scribe’s presence (TABLE 1).
Physician surveys included 5 closed-end questions9 regarding comfort level with the scribe’s presence, ease of EMR documentation, change in office hours with having a scribe for that day’s session(s), and overall helpfulness of the scribe (TABLE 2). Open-ended questions on both surveys asked for additional comments or concerns regarding scribes and the scribe’s impact on patient encounters.
Our goal was to collect a minimum of 100 completed patient surveys and 50 completed physician surveys representing as many different patient demographics, visit types, days of the week, and times of day as possible. Surveys were anonymous and distributed during the second and third months of the trial, giving the scribes a one-month training and adjustment period.
Impact assessment, professional development needs. At the end of the 6-month study period, we held 2 focus groups—one with nurses and one with scribes. From the nurses, we solicited insights regarding the impact of scribes on patient volume, patient satisfaction, visit flow, and EMR documentation.
Scribes were asked about job skills needed, amount of training received, comfort in the exam room (both for themselves and patients), frequency of feedback received, balancing physician style with EMR documentation needs, and lessons learned.
Data analysis
Data were analyzed using the software SPSS V22.0. Univariate statistics were used to analyze patient and physician satisfaction, as well as clinic volume, time tracking, and EMR documentation. Initially, bivariate statistics were used to examine pre- and post-trial physician and patient data, but then non-parametric comparisons were used because of small sample sizes (and the resulting data being distributed abnormally). Detailed focus group notes were reviewed by all study investigators and summarized for dominant themes to support the quantitative evaluation. Lastly, the study was evaluated by the University of Massachusetts Institutional Review Board and was waived from review/oversight because of its QI intent.
RESULTS
Physician findings. Fifty-five physician surveys were completed during the 6-month period (TABLE 2). All of the physicians who were asked to complete this short survey at the end of the day (after reviewing notes with their scribe) did so. Physicians reported a high degree of satisfaction with collaboration with scribes. Their comments reflected positive experiences, including an improved ability to remain on schedule, having assistance finding important information in the record, and having notes completed at the end of the session.
TABLE 3 shows high satisfaction with clinical roles and colleagues with no substantive changes over time regarding these questions. However, the incorporation of scribes had a positive impact on issues related to physician morale, due to changes in paperwork, administrative duties, and work schedules.
Review of patient scheduling and documentation (TABLE 4) revealed visits per clinical session increased 28.8% from 6.6 to 8.5, and for sessions with 10 or more appointment slots available, billable visits increased 9.2% from 8.7 to 9.5. This increase was a result of adding an additional appointment slot to the schedule when a scribe was assigned and a greater physician willingness to overbook when scribe assistance was available.
A comparison of time tracking pre- and post-intervention showed a 13% decrease in time spent in the clinic, from a 3-week average of 30.1 hrs/wk to 26.1 hrs/wk (TABLE 4). Time spent working at home decreased 38%, from a 3-week average of 2.9 hrs/wk to 1.8 hrs/wk. These reductions occurred despite average scheduled clinic hours being 18% higher (35.5 vs 30.1) during the post- vs pre-intervention measurement periods.
Patient findings. TABLE 1 summarizes the 313 patient responses. Less than 10% of patients declined to have a scribe during the visit. Patients reported a high level of comfort with the scribe and indicated that having a scribe in the room had little impact on what they would have liked to tell their doctor. Nearly all open-ended comments were positive and reflected feelings that the scribe’s presence enabled their provider to focus more on them and less on the computer.
Focus group findings
The scribe focus group identified a number of skills thought to be necessary to be successful in the job, including typing quickly; having technology/computer-searching strategy skills; and being detail-oriented, organized, and able to multitask. Scribes estimated that it took 2 to 6 weeks to feel comfortable doing the job. Physician feedback was preferred at the end of every session.
Lastly, the 4 scribes identified several challenges that should be addressed in future training, such as how to: 1. document a visit when the patient has a complicated medical history and the communication between the doctor and the patient is implicit; 2. incorporate the particulars of a visit into a patient’s full medical history; and 3. sift through the volume of previous notes when a physician has been seeing a patient for a long period of time.
The nurses’ focus group identified many positive effects on patient care. They reported no significant challenges with introducing scribes to patients. Improvements in timely availability of documentation enhanced their ability to respond quickly and more completely to patient queries. The nurses noted that the use of scribes improved patient care and made them “a better practice.”
DISCUSSION
This study demonstrated that the use of scribes in a busy academic primary care practice substantially reduced the amount of time that family practitioners spent on charting, improved work-life balance, and had good patient acceptance. Our time-tracking studies demonstrated that physicians spent 5.1 fewer hrs/wk working—4 fewer hrs/wk in the clinic, and 1.1 fewer hrs/wk outside of the clinic—while clinical hours and productivity per session increased. Patients reported high satisfaction with scribed visits and a willingness to have scribes in the future. Creating notes in real time and having immediate availability after the session was a plus for nursing staff in providing follow-up patient care.
Concerns by physicians that having another person in the room would alter the physician-patient relationship were not substantiated, perhaps because the staff routinely obtained consent and explained the scribe’s role. Consistent with previous work, we found no suggestion that a scribe’s presence affected patients’ willingness to discuss sensitive issues.9 Patients reacted positively to scribes who enabled physicians to focus more on the patient and less on charting.
Despite increased patient volume, physician morale improved. Physicians left work more than an hour earlier per day, on average, and spent over 1 hour less per week working on clinical documentation outside the office. Physician surveys showed an improvement in perceptions of how much work encroached on their personal life, consistent with the time-tracking data. These results have significant implications for clinician retention, productivity, and satisfaction.
Since our site is an academic training site, one might wonder how residents and advanced practitioners viewed this implementation, as they were not initially included. From the perspective of the administrators, this was a feasibility study. Clinicians who were not included understood that if this pilot was successful, the use of scribes would be expanded in the future. In fact, because of these positive results, our institution has expanded the scribe program, so that it now covers all clinical sessions for faculty in our center and is rolling out a similar program in 3 other departmental academic practices.
Financial implications. At the beginning of this initiative, our institution required that we cover the cost of the program plus generate a 25% ROI. Using a conservative 9.2% increase in billable visits, we extrapolated that utilizing 2 FTE scribes would result in an additional 860 visits annually. Per our hospital’s finance department, estimated revenue generated by our facility-based practice per visit is $196, including ancillaries. That means that additional visits would generate an estimated $168,600 annually—more than twice the $79,500 annual cost of 2 FTE scribes, yielding a 112% ROI. Furthermore, patient access improved by making more visits available. Beyond the positive direct ROI, the improvements in physician morale and work-life balance have positive implications for retention, likely substantially increasing the long-term, overall ROI.
Challenges. Implementing a new program in a large organization proved to be challenging. The biggest hurdle was convincing our institution’s administration and finance department that this new expense would pay for itself in both tangible (increased visits per session) and intangible (increased physician satisfaction and retention) ways. A cost-sharing arrangement proposed by our department’s administrator convinced hospital administration to move forward. Additional challenges included delays in getting the scribe program started because of vendor selection, purchasing new laptops for scribes, hiring and training scribes, developing new EMR templates, validating provider productivity, and legal/compliance approval of the scribe’s EMR documentation processes to meet third-party and accuracy/quality requirements—all taking longer than anticipated. However, we believe that our results indicate significant potential for other primary care practices.
Limitations. The number of physicians in the study was small, and they all worked in the same location. Social desirability could have biased patient and provider feedback, but our quantitative results were consistent with subjective assessments, suggesting that information bias potential was low. Patient and provider survey findings were also supported by qualitative assessments from both scribes and nursing staff. The size of the project did not lend itself to an analysis controlling for clustering by physician and/or scribe. The focus group discussions were not subject to rigorous qualitative analysis, potentially increasing the risk of biased interpretation. Lastly, we did not have the ability to directly compare sessions with and without scribes during the pilot.
Similarity to other findings. Despite these limitations, our findings are remarkably similar to those of Howard, et al,16 on the pilot implementation of scribes in a community health center, including good patient and clinician acceptance and increased productivity that more than offset the cost of the scribes. We expect that others implementing scribe services in primary care settings will experience similar results.
CORRESPONDENCE
Stephen T. Earls, MD, 151 Worcester Road, Barre, MA 01005; [email protected].
ACKNOWLEDGEMENT
The authors gratefully acknowledge the assistance of Barbara Fisher, MBA, vice president for ambulatory services; Nicholas Comeau, BS; and Brenda Rivard, administrative lead, Barre Family Health Center, UMassMemorial Health Care, in the preparation and execution of this study.
1. Walker K, Ben-Meir M, O’Mullane P, et al. Scribes in an Australian private emergency department: a description of physician productivity. Emerg Med Australas. 2014;26:543-548.
2. Arya R, Salovich DM, Ohman-Strickland P, et al. Impact of scribes on performance indicators in the emergency department. Acad Emerg Med. 2010;17:490-494.
3. Expanded scribe role boosts staff morale. ED Manag. 2009;21:75-77.
4. Scribes, EMR please docs, save $600,000. ED Manag. 2009;21:117-118.
5. Bastani A, Shaqiri B, Palomba K, et al. An ED scribe program is able to improve throughput time and patient satisfaction. Am J Emerg Med. 2014;32:399-402.
6. Cabilan CJ, Eley RM. Review article: potential of medical scribes to allay the burden of documentation and enhance efficiency in Australian emergency departments. Emerg Med Australas. 2015 Aug 13. [Epub ahead of print]
7. Hegstrom L, Leslie J, Hutchinson E, et al. Medical scribes: are scribe programs cost effective in an outpatient MFM setting? Am J Obstet Gynecol. 2013;208:S240.
8. Campbell LL, Case D, Crocker JE, et al. Using medical scribes in a physician practice. J AHIMA. 2012;83:64-69.
9. Koshy S, Feustel PJ, Hong M, et al. Scribes in an ambulatory urology practice: patient and physician satisfaction. J Urol. 2010;184:258-262.
10. Hafner K. A busy doctor’s right hand, ever ready to type. The New York Times. January 12, 2014. Available at: https://www.nytimes.com/2014/01/14/health/a-busy-doctors-right-hand-ever-ready-to-type.html?_r=0. Accessed February 6, 2017.
11. Brady K, Shariff A. Virtual medical scribes: making electronic medical records work for you. J Med Pract Manage. 2013;29:133-136.
12. Baugh R, Jones JE, Troff K, et al. Medical scribes. J Med Pract Manage. 2012;28:195-197.
13. Grimshaw H. Physician scribes improve productivity. Oak Street Medical allows doctors to spend more face time with patients, improve job satisfaction. MGMA Connex. 2012;12:27-28.
14. Morehead Associates, Inc. UMassMemorial Health Care: Physician Satisfaction Survey. 2013.
15. Konrad TR, Williams ES, Linzer M, et al. Measuring physician job satisfaction in a changing workplace and challenging environment. SGIM Career Satisfaction Study Group. Society of General Internal Medicine. Med Care. 1999;37:1174-1182.
16. Howard KA, Helé K, Salibi N, et al. BTW Informing change. Blue Shield of California Foundation. Adapting the EHR scribe model to community health centers: the experience of Shasta Community Health Center’s pilot. Available at: http://informingchange.com/cat-publications/adapting-the-ehr-scribe-model-to-community-health-centers-the-experience-of-shasta-community-health-centers-pilot. Accessed November 6, 2015.

Systemic Therapy in Metastatic Melanoma
Melanoma is the most aggressive form of skin cancer, contributing to about 76,000 new cases and more than 9,000 deaths in 2014.1 Depending on the stage of the disease, 5-year melanoma survival can range from 15% to 97%. Patients with local and distant metastases have a 5-year survival of about 60% and 15%, respectively.2
The incidence of melanoma is rising, partly because of the increasing number of skin biopsies being performed.3 If melanoma is diagnosed early, surgical excision is the treatment of choice. In patients with oligometastatic disease (cancer that has spread, but only to 1 or a small number of sites), complete surgical excision of the metastases may provide prolonged overall survival (OS) and delay the need to use systemic therapy.4
Recently, many new drug therapies have shown promising results in clinical trials, which may improve the prognosis of metastatic disease. This article reviews currently available systemic treatment options for the management of metastatic melanoma, the role of cytotoxic chemotherapy and interleukin-2 (IL-2), and the latest therapies available, including immune checkpoint inhibitors.
Cytotoxic Chemotherapy and Interleukin-2
Cytotoxic chemotherapy does not have an established role in the initial treatment of metastatic melanoma. Currently, cytotoxic chemotherapy is used in patients who have not responded to immunotherapy or molecular targeted therapy. The most commonly used drugs include dacarbazine and its prodrug, temozolomide. Several studies have failed to demonstrate a survival benefit using a single-agent chemotherapy with either dacarbazine or temozolomide.5,6
Other agents used in metastatic melanoma include nitrosoureas (fotemustine), platinum compounds (cisplatin, carboplatin), vinca alkaloids (vincristine),
and taxanes (paclitaxel). None of these agents provide a survival benefit, but an objective response may be seen in a minority of cases. Combination chemotherapy regimens have not shown an advantage over singleagent dacarbazine or temozolomide.7,8
High-dose IL-2 has been used in cases of metastatic melanoma with good performance status (PS) and organ function. Studies have shown a complete response rate of 3% to 7% and a prolonged disease-free survival in a minority of patients.9-11 The use of highdose IL-2, however, is limited by the high incidence of adverse effects (AEs), which include bacterial sepsis, pulmonary edema, arrhythmias, fever, and on some occasions, death due to complications.10 The use of IL-2 requires admission of the patient to a specialized unit for AE monitoring and management. Because of its ability to “cure” a minority of patients, a role still exists for IL-2 therapy in the treatment of younger, healthy patients with no evidence of organ dysfunction at baseline.
Immune Checkpoint Inhibitors
Checkpoint inhibitors are a class of drugs that unmask the immune system to fight against cancer cells. This class of drugs has shown significant activity and survival advantage in recent phase 2 and 3 trials. The class includes the anticytotoxic T-lymphocyte antigen 4 (CTLA-4) antibody ipilimumab and monoclonal antibodies targeting the programmed death 1 protein (PD-1) or its ligand (PD-L1).
Anti-CTLA-4 Antibodies: Ipilimumab
Cytotoxic T-lymphocyte antigen 4 is the antigen responsible for inhibition of cytotoxic T-cell-mediated immunity against foreign antigens presented by the antigen presenting cells (APCs). The APCs cause activation of the T cells when peptide fragments of intracellular proteins are presented in combination with mixed histocompatibility complex molecules. This step requires interaction of a costimulatory molecule (B7) on the APCs with a cluster of differentiation 28 protein (CD28) receptor located on T cells. CTLA-4 competes with CD28 to bind with the B7 molecule, thereby inhibiting the activation of the cytotoxic T cells (Figure 1). This pathway is thought to help with development of tolerance to host tissue antigens. Ipilimumab is a human monoclonal antibody that inhibits this CTLA-4 molecule and facilitates T-cell mediated antitumor activity.12 By blocking the CTLA-4 molecule, ipilimumab also mediates its autoimmune AEs on the host tissues.
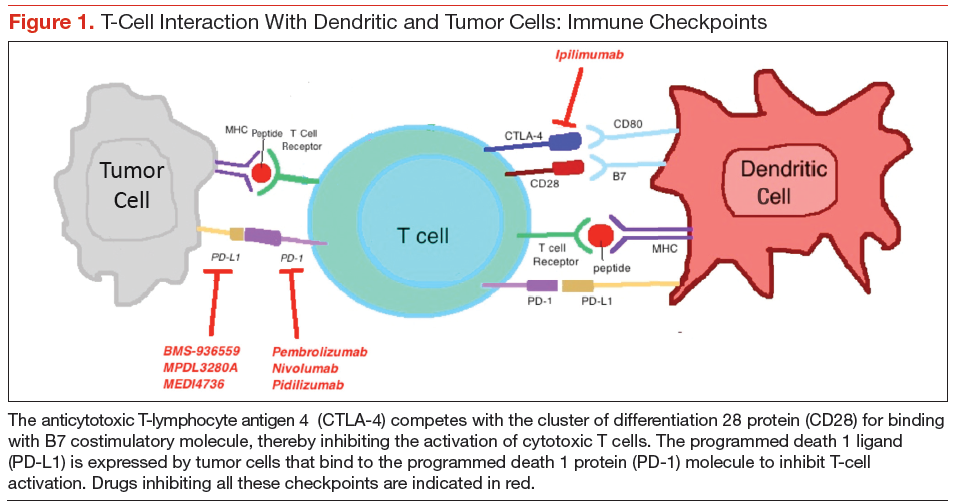
Hodi and colleagues conducted a phase 3 trial of ipilimumab, including 676 patients who progressed after prior treatment for stage III or IV melanoma, and found that median OS was significantly better in the ipilimumab groups: 10 months in the ipilimumab plus gp100 peptide vaccine group vs 6.4 months in the gp100 vaccine alone group; 10.1 months in the ipilimumab alone group vs 6.4 months in the gp100 vaccine alone group.13 In another phase 3 trial comparing ipilimumab plus dacarbazine to dacarbazine alone, the ipilimumab group had a significantly improved OS (11.2 months vs 9.1 months).1 Survival rates with ipilimumab were prolonged for up to 3 years compared with the dacarbazine plus placebo group. However, the combination was associated with increased incidence of hepatotoxicity, thereby limiting its use.
A long-term survival analysis of 10 prospective and 2 retrospective studies of ipilimumab showed a median OS of 11.4 months and a long-term survival that began at 3 years with a plateau at 10 years of 21%, which was independent of prior therapy or ipilimumab dose.14 The immune-related AEs of ipilimumab are secondary to its activity against the host antigens and include dermatitis, enterocolitis, hepatitis, and endocrinopathies.15
A recent phase 2 trial studied the combination of ipilimumab with granulocyte-macrophage colonystimulating factor in 245 patients with stage III and IV melanoma. Median OS after 13 months was significantly higher with the combination compared with ipilimumab alone. The 1-year survival rate was 69% with
the combination and 53% with ipilimumab alone. There was no difference in the overall response rate (ORR) or progression-free survival (PFS) between the 2 groups. However, the AEs were significantly reduced with the combination (45% vs 58%).16 The dose of ipilimumab used in the trial was higher than the approved dose, making it difficult to apply the results in practice without further studies on the combination.
Anti-PD-1 Antibodies
Programmed death 1 ligands (PD-L1 and PD-L2) are expressed by tumor or stromal cells to inhibit the T-cell mediated antitumor activity. These ligands bind to the PD-1 protein on the surface of activated T cells to mediate their immunosuppressive effects. Interruption of this interaction by either anti-PD-1 antibodies or anti-PD-L1 antibodies facilitates tumor cell killing by activated T cells.17
Pembrozilumab and nivolumab are the 2 anti-PD-1 monoclonal antibodies that have been approved for treatment of metastatic melanoma. In a phase 1 trial
of pembrolizumab, 411 patients with advanced melanoma (consisting of both ipilimumab-naïve [IPI-N] and ipilimumab-treated [IPI-T] patients), ORR was 40% in IPI-N and 28% in IPI-T patients with a 1-year OS of 71% in all patients. Median PFS was 24 weeks in IPI-N and 23 weeks in IPI-T pts.18 There was no difference in outcomes and safety profiles across the various dosing regimens.18,19 Of note, pembrolizumab had antitumor activity irrespective of the PS, lactate dehydrogenase levels, BRAF (B-Raf proto-oncogene, serine/threonine kinase) gene mutation, metastatic stage, and number and type of prior therapy. In a subgroup analysis, 173 patients who had progression after treatment with ipilimumab were randomly assigned to pembrolizumab 2 mg/kg every 3 weeks (q3w) or 10 mg/kg q3w dosing regimens. Both groups had no significant difference in the ORR (26% in both) and safety profiles.20
In the 2012 KEYNOTE-002 clinical trial, a randomized phase 2 trial involving 540 patients with ipilimumab-refractory advanced melanoma, patients were randomized 1:1:1 to pembrolizumab 2 mg/kg or 10 mg/kg q3w or investigator-choice chemotherapy (control arm consisting of carboplatin plus paclitaxel, carboplatin, paclitaxel, dacarbazine, or temozolomide). The 6-month PFS was significantly improved with pembrolizumab (34% and 38% for pembrolizumab 2 mg/kg and 10 mg/kg, respectively) compared with 16% with chemotherapy. The ORR was significantly better with pembrolizumab (21% at 2 mg/kg, 25% at 10 mg/kg) compared with the control arm (4%).21 These findings led to the approval of pembrolizumab by the FDA for treatment of patients with advanced melanoma who have progressed on ipilimumab. Pembrolizumab is generally well tolerated. The most common AEs include fatigue, pruritus, and rash.
Nivolumab was studied in a recent phase 1 trial in which 107 patients with previously treated advanced melanoma were treated with escalated doses every
2 weeks.22 The 2-year and 3-year OS rates were 48% and 41%, respectively. Objective responses were seen in 32% of the patients. The median response duration was 23 months.23
The first phase 3 trial was conducted in 418 patients with previously untreated metastatic melanoma BRAF mutation. Patients were randomized to receive either nivolumab or dacarbazine. The PFS and OS were significantly better with nivolumab compared with dacarbazine (PFS 5.1 months vs 2.2 months; OS 73% vs 42% at 1 year).24 The AE profile of nivolumab is similar to pembrolizumab and includes lung, skin, endocrine, renal, and gastrointestinal tract toxicities.
Preliminary results of another phase 3 trial were presented at the European Society of Medical Oncology 2014 meeting. Patients with previously treated metastatic melanoma (ipilimumab or BRAF inhibitor) were randomized in a 2:1 ratio to receive either nivolumab or investigators’ choice chemotherapy (dacarbazine or carboplatin plus paclitaxel). The ORR was significantly better with nivolumab (32% vs 11%), and 95% of patients were still responding after 6 months. The nivolumab group showed a complete remission in 3% of the patients with 34% of the responses lasting ≥ 6 months.25 This led to the recent approval of nivolumab for patients with metastatic melanoma with a BRAF mutation who have advanced on ipilimumab. In the phase 3 NCT01844505 trial patients are being randomized to receive ipilimumab, nivolumab, or both.
A newer PD-1 inhibitor, pidilizumab, was studied in a phase 2 trial that included 103 patients with metastatic melanoma, 51% of whom had received therapy with ipilimumab. The ORR in the study group was relatively lower (6%), but the OS at 1 year was 64.5%.26 Further studies are underway to evaluate the role of this drug in metastatic melanoma.
The response with both nivolumab and pembrolizumab is durable as well as sustained, even after discontinuation of therapy. None of the deaths in the aforementioned studies were atributed to drug-related toxicities. As evidenced by current data, these 2 drugs hold a great promise for the management of patients who progress after therapy with anti-CTLA-4 antibodies.
Anti-PD-L1 Antibodies
The anti-PD-L1 monoclonal antibodies work in a similar way to the PD-1 inhibitors and block the interaction between the PD-1 and its ligand, PD-L1. This causes sustained activation of cytotoxic T cells and facilitates their antitumor activity. Two of PD-L1 inhibitors have shown clinical activity against metastatic melanoma.
BMS-936559, the first PD-L1 antibody, is being studied in a phase 1 trial that includes 55 patients with advanced melanoma along with 152 patients with other solid malignancies. Three patients achieved a complete response, and 5 patients had an objective response lasting 1 year. The ORR for melanoma was 17%, with disease stabilization of ≥ 24 weeks in 27% of the patients.27 Common AEs included infusion reactions, diarrhea, fatigue, rash, hypothyroidism, and hepatitis.
The second PD-L1 antibody, MPDL3280A, was studied in a phase 1 trial of 45 patients with metastatic melanoma. An ORR of 29% was observed, along with a 24-week PFS of 43%.28 Commonly noted AEs included hyperglycemia and elevated liver aminotransferases.
A newer PD-L1 inhibitor, MEDI4736, is being studied for advanced malignancies in 8 patients with melanoma. In preliminary analysis, MEDI4736 demonstrated a partial response in 1 out of 8 melanoma patients with a disease control rate of 46%.29 Although the PD-L1 inhibitors seem promising, more information will help discern their role in the management of metastatic melanoma.
Combined Anti-CTLA-4 Plus Anti-PD-1 Antibody
The combination of ipilimumab and the PD-1 inhibitor nivolumab was tested in a phase 1 trial in which both drugs were used concurrently as well as sequentially in metastatic melanoma.30 The 1- and 2-year OS in patients who were treated concurrently was 82% and 75%, respectively. Complete remission was seen in 17% of the patients, and the responses were seen irrespective of the BRAF mutation status. The responses were durable, and about 64% of the objective responses remain in remission at last follow-up.31 Grade 3 to grade 4 AEs were noted in 53% of the patients, with 11 patients requiring discontinuation of the medications. More studies are required to ascertain the optimum dosage of the combination prior to its approval for use in metastatic melanoma.
Molecular Targeted Therapy
The RAS-RAF–mitogen-activated protein kinase (MAPK)/extracellular signal-regulated kinase (ERK) signaling pathway is activated in almost 90% of patients
with melanoma.32 This pathway is normally required for the growth and survival of nonmalignant cells. In malignant transformation, mutations and/or overexpression is seen at various levels including KIT, NRAS, BRAF, and the MEK protein. This leads to activation of serine and threonine protein kinases, which lead to uncontrolled cell proliferation and survival.33
Novel therapeutic approaches have tried inhibiting one or more of these pathways for melanoma treatment. The most important mediator of tumorigenesis is BRAF, which is a downstream receptor of NRAS, and is mutated in almost 50% of melanoma cases.34 NRAS mutations are seen in 15% to 20% of cutaneous melanomas.35,36 After its activation, the RAF enzyme—coded by the BRAF gene—causes phosphorylation of the MEK protein, which activates ERK. This ERK activation leads to growth signaling and is the final pathway in several malignancies (Figure 2).37,38
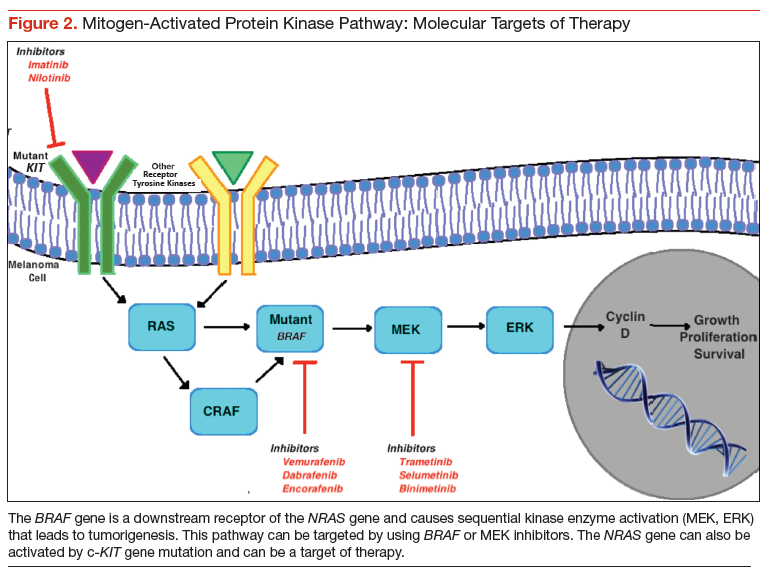
BRAF Inhibitors
BRAF is the first mediator whose inhibition led to clinically significant outcomes in patients with melanoma. The most common BRAF mutation consists of the
substitution of glutamic acid for valine at amino acid 600 (V600E mutation) with majority of the remainder consisting of an alternate substitution (V600V or V600K).34 Vemurafenib and dabrafenib are the 2 BRAF inhibitors that have been shown to improve tumor regression, PFS, and OS considerably, especially in combination with a MEK protein inhibitor. In the phase 3 BRIM-3 trial, the vemurafenib group had a significantly prolonged PFS and OS compared with dacarbazine (13.6 months vs 9.7 months; 6.9 months vs 1.6 months, respectively). It was the first study to show improved survival with vemurafenib in both the V600E and V600K BRAF mutant melanomas.39
Another BRAF inhibitor, dabrafenib, was approved by the FDA for treatment of advanced melanoma with BRAF V600E mutation. It was tested in a phase 3 trial in which it was compared with dacarbazine in patients with advanced melanoma. Median OS in the dabrafenib arm was > 18 months and in dacarbazine arm > 15 months.40 Fifty-seven percent of the patients in dacarbazine arm were crossed over to the dabrafenib arm, thereby confounding the survival data for the former group. Another multicenter, phase 2 trial showed dabrafenib to have activity in melanoma patients with brain metastases, irrespective of previous therapy for the brain metastases.41 The long-term analysis of the BREAK-2 trial, which included 92 patients with metastatic melanoma treated with dabrafenib, showed a median OS of 12.9 months in BRAF V600K group and 13.1 months in BRAF V600E group.42
Adverse effects associated with BRAF inhibition include fatigue, rash, arthralgia, and photosensitivity reactions.43 Dermatologic complications may also include squamous cell carcinoma (SCC) (19%-26%), with keratoacanthoma being the most common subtype.44 These are believed to be likely secondary to the paradoxical activation of the MAPK signaling, since most of these lesions are found to have mutations in the RAS molecule.45 Other specific AEs of dabrafenib include hyperkeratosis (33%) and pyrexia (29%).42
Most patients treated with a BRAF inhibitor eventually have disease progression, likely secondary to reactivation of the MAPK pathway.46,47 This result has led to a heightened interest in combination therapies in an effort to improve outcomes. Combination therapy with ipilimumab and vemurafenib was studied and resulted in a higher incidence of hepatotoxicity (50%).48 However, no hepatotoxicity was seen in a phase 1 trial of combined dabrafenib and ipilimumab.49
Some studies have also suggested that extended BRAF inhibition after progression on a BRAF inhibitor may prolong survival.50,51 The phase 2 trial NCT01983124 is being conducted to evaluate the survival benefit with a combination of vemurafenib and a nitrosourea alkylating agent, fotemustine, in patients who have progressed on vemurafenib alone.
MEK Inhibitors
The inhibition of MEK can halt cell proliferation and induce apoptosis. The phase 3 METRIC trial, which compared the oral MEK inhibitor (trametinib) with chemotherapy, was conducted in 322 patients who had metastatic melanoma with a V600E or V600K BRAF mutation. The PFS and 6-month OS were significantly better with trametinib (4.8 months vs 1.5 months, 81% vs 66%) despite the crossover between the 2 groups.52 The AEs associated with trametinib included rash, diarrhea, and peripheral edema. Another phase 2 trial of trametinib including patients pretreated with a BRAF inhibitor showed no confirmed objective responses, 28% patients with stable disease, and minimal improvement in PFS (2 months). Among patients treated with prior chemotherapy and/or immunotherapy, trametinib showed significant improvement in complete responses, partial responses, stable disease, and the median PFS (2%, 23%, 51%, 4 months, respectively).53
The second MEK inhibitor, binimetinib, was studied in a phase 2 trial of advanced melanoma cases harboring a BRAF V600E or NRAS. Bimetinib demonstrated a PR in 20% cases of both the BRAF and NRAS mutant melanomas. Durable disease control was seen in 43% of the NRAS group and 32% of the BRAF group.54 The AE profile was similar to that seen with trametinib. Bimetinib is being studied in phase 1 and 2 trials with the CDK4/6 inhibitor as well as in the phase 3 trial NCT01763164 compared with dacarbazine in NRAS mutation positive melanomas.55
Selumetinib is a MEK inhibitor that has been compared with dacarbazine and temozolomide with no significant OS advantage. A novel highly specific inhibitor of MEK, cobimetinib, is currently being studied in combination with BRAF inhibitors.
Combined BRAF and MEK Inhibition
A randomized, double-blind, phase 3 study comparing the combination of dabrafenib and trametinib with dabrafenib and placebo in patients with advanced melanoma with a BRAF V600E mutation was presented at the 2014 American Society of Clinical Oncology meeting. Researchers found that after a median follow-up period of 9 months, there was a significant improvement with the combination in the PFS (9.3 months vs 8.8 months) and the ORR (67% vs 51%), with a similar incidence of AEs.56 The combination therapy group had fewer incidences of SCC of the skin but more incidence of pyrexia.
The combination of dabrafenib and trametinib was compared with vemurafenib monotherapy in a recent randomized phase 3 trial among 704 metastatic melanoma patients with a BRAF V600 mutation. Median PFS and ORR were significantly better with combination therapy compared with vemurafenib alone (11.4 months vs 7.3 months, 64% vs 51%, respectively). Overall survival rate at 1 year was significantly improved in the combination group as well (72% vs 65%).57 The incidence of SCC and keratoacanthoma was less in the combination (1%) compared with vemurafenib alone (18%). Another study investigating the coadministration and sequential administration of vemurafenib and trametinib is underway.58
The vemurafenib and cobimetinib combination was studied in a phase 3 trial of previously untreated unresectable locally advanced or metastatic BRAF V600
mutation-positive melanoma. The median PFS was 9.9 months in the combination group and 6.2 months in the control group. The interim analysis showed a 9-month survival rate of 81% in the combination group and 73% in the control group, with no significantly higher incidence of AEs in either arm.59 A longer follow-up will be needed to assess the OS benefit with the combination.
Encorafenib, a selective BRAF inhibitor, has been studied in a phase 1 trial in combination with binimetinib.60 This trial has paved the way to the initiation of a currently ongoing phase 3 trial (NCT01909453) comparing the combination with vemurafenib or encorafenib alone.
C-KIT Inhibitors
Mutations of c-KIT are seen more commonly in chronic sun damage-induced cutaneous melanomas, along with acral and mucosal melanomas.61,62 Earlier trials involving patients without selection for c-KIT mutation positivity failed to show benefit with imatinib. A single-arm, phase 2 trial of imatinib mesylate in patients with metastatic melanoma harboring the c-KIT mutation, an ORR of 23% was achieved, with a median PFS of 3.5 months.63 Imatinib showed an ORR of 29% in a phase 2 trial of mucosal, acral, and in chronic sun damage-induced melanoma patients with c-KIT amplifications and/or mutations. It was demonstrated that c-KIT amplification alone is not as responsive to imatinib compared with c-KIT mutation, suggesting that all patients with these specific melanomas should be tested for KIT mutation status.64
A second-generation c-KIT inhibitor, nilotinib, has shown some promising results with a favorable AE profile in small phase 2 trials.65,66 However, more clinical research will be needed before definite recommendations on its use in cutaneous melanomas can be made. Currently, its role seems to be limited to the management of acral, mucosal, and chronic sun damage-related melanomas with c-KIT mutations.
Future Directions
Angiogenesis promoters, such as vascular endothelial growth factor (VEGF), platelet-derived growth factor, fibroblast growth factor, and interleukin-8, are overexpressed in melanoma. Bevacizumab, an anti-VEGF antibody, has been shown to have some benefit in combination with carboplatin and paclitaxel as a triple therapy.67 However, grade 3 AEs were seen in a portion of patients.
The phosphatidylinositol-3 kinase (PI3K)/Akt/mammalian target of rapamycin (mTOR) pathway has also been studied as a target for melanoma therapy. Everolimus, an mTOR inhibitor, was studied in a phase 2 trial in combination with bevacizumab for treatment of metastatic melanoma. The combination showed improved median PFS and OS with the combination (4 months and 8.6 months, respectively), with 43% of patients alive after 12 months of follow-up.68 This study points to the direction of possible benefits with the combination of anti-VEGF and immunotherapy. A recent study failed to show survival advantage with combination of bevacizumab and temozolomide.69
Buparlisib (BKM120), a PI3K inhibitor, has been shown to have activity in vivo and in vitro against melanoma brain metastases.70 More studies need to be done to assess the possible combination with other established therapies.
Oblimersen is an antisense oligonucleotide that suppresses B-cell lymphoma-2, thereby suppressing its anti-apoptotic effect. The triple combination of oblimersen with temozolomide and albumin-bound paclitaxel has shown to be safe and efficacious in a phase 1 trial, thereby creating a need for further clinical trials.71
Treatment Approach
Systemic therapy for metastatic melanoma depends on several factors, including BRAF mutation status, functional status of the patient, disease burden, and severity of symptoms. Assessing the BRAF mutation status has become an important component in the management of patients with metastatic melanoma. It can help recognize patients who will benefit from molecular targeted therapy. In case of a BRAF-positive melanoma, treatment can be initiated with either immunotherapy or BRAF inhibitors. There are no randomized studies comparing immunotherapy to molecular targeted therapy.
Patients who have good PS and lymph node metastases can be treated initially with IL-2, which has the advantage of inducing cure in a minority of patients but should only be considered in patients with well-preserved organ function who can be monitored in an intensive care setting. On the other hand, patients who have bulky, symptomatic disease and poor PS should be treated initially with BRAF inhibitors. Combination of BRAF and MEK inhibitors can also be used and has an improved PFS and OS with potential to cause early tumor regression. There are studies to suggest suboptimal outcomes in patients who are treated with ipilimumab after progression on a BRAF inhibitor compared with initial treatment with ipilimumab followed by a BRAF inhibitor.72-74 However, all these studies are retrospective and there is no prospective data to suggest the above. BRAF mutation-positive patients who progress on a BRAF inhibitor
can be treated with PD-1 inhibitors.
Patients who do not have a BRAF mutation are unlikely to benefit from a BRAF inhibitor and primarily receive immunotherapy with ipilimumab or IL-2. Whenever possible, such patients should be enrolled in a clinical trial, as they have a poor prognosis. Patients who progress on ipilimumab can be treated with one of the PD-1 inhibitors (pembrolizumab, nivolumab). These PD-L1 inhibitors are still being investigated for use in such situations.
The role of chemotherapy in the management of metastatic melanoma has been limited by numerous studies showing significantly better survival with immunotherapy and molecular targeted therapy. Dacarbazine is the only FDA-approved drug for the treatment of melanoma. Its use is reserved mainly for patients who are not candidates for any of the other therapies available, including enrollment in a clinical trial.
Conclusion
Therapies for metastatic melanoma are in a state of flux. In the past decade, several new therapeutic agents have been introduced for the management of this potentially lethal disease. The treatment of metastatic melanoma has gradually shifted from cytotoxic chemotherapy toward a more individualized treatment that has a definite survival advantage over traditional counterparts. The advent of novel therapies has led to initiation of further studies to determine their role in the treatment of advanced melanoma, singly or in combination with other agents. In addition to evaluating new agents, more studies are needed to compare existing treatment modalities so that definitive treatment protocols can be formulated.
Acknowledgement
The authors would like to thank Felicia Ratnaraj, MD, for her assistance in creating the figures.
Author disclosures
The authors report no actual or potential conflicts of interest with regard to this article.
Disclaimer
The opinions expressed herein are those of the authors and do not necessarily reflect those of Federal Practitioner, Frontline Medical Communications Inc., the U.S. Government, or any of its agencies. This article may discuss unlabeled or investigational use of certain drugs. Please review the complete prescribing information for specific drugs or drug combinations—including indications, contraindications, warnings, and adverse effects—before administering pharmacologic therapy to patients.
Click here to read the digital edition.
1. Siegel R, Ma J, Zou Z, Jemal A. Cancer statistics, 2014. CA Cancer J Clin.2014;64(1):9-29.
2. Balch CM, Gershenwald JE, Soong SJ, et al. Final version of 2009 AJCC melanoma staging and classification. J Clin Oncol. 2009;27(36):6199-6206.
3. Welch HG, Woloshin S, Schwartz LM. Skin biopsy rates and incidence of melanoma:
population based ecological study. BMJ. 2005;331(7515):481.
4. Sosman JA, Moon J, Tuthill RJ, et al. A phase 2 trial of complete resection for stage IV melanoma: results of Southwest Oncology Group Clinical Trial S9430. Cancer. 2011;117(20):4740-4746.
5. Atkins MB. The role of cytotoxic chemotherapeutic agents either alone or in combination with biological response modifiers. In: Kirkwood JK, ed. Molecular Diagnosis, Prevention, & Therapy of Melanoma. New York, NY: Marcel Dekker;1997:219-225.
6. Patel PM, Suciu S, Mortier L, et al. Extended schedule, escalated dose temozolomide versus dacarbazine in stage IV melanoma: final results of a randomised phase III study (EORTC 18032). Eur J Cancer. 2011;47(10):1476-1483.
7. Chapman PB, Einhorn LH, Meyers ML, et al. Phase III multicenter randomized trial of the Dartmouth regimen versus dacarbazine in patients with metastatic melanoma. J Clin Oncol. 1999;17(9):2745-2751.
8. Flaherty KT, Lee SJ, Zhao F, et al. Phase III trial of carboplatin and paclitaxel with
or without sorafenib in metastatic melanoma. J Clin Oncol. 2013;31(3):373-379.
9. Rosenberg SA, Yang JC, Topalian SL, et al. Treatment of 283 consecutive patients with metastatic melanoma or renal cell cancer using high-dose bolus interleukin 2. JAMA. 1994;271(12):907-913.
10. Atkins MB, Lotze MT, Dutcher JP, et al. High-dose recombinant interleukin 2 therapy for patients with metastatic melanoma: analysis of 270 patients treated between 1985 and 1993. J Clin Oncol. 1999;17(7):2105-2116.
11. Atkins MB, Kunkel L, Sznol M, Rosenberg SA. High-dose recombinant interleukin-2 therapy in patients with metastatic melanoma: long-term survival update. Cancer J Sci Am. 2000;6(suppl 1):S11-S14.
12. Hoos A, Ibrahim R, Korman A, et al. Development of ipilimumab: contribution to a new paradigm for cancer immunotherapy. Semin Oncol. 2010;37(5):533-546.
13. Hodi FS, O’Day SJ, McDermott DF, et al. Improved survival with ipilimumab in patients with metastatic melanoma. N Engl J Med. 2010;363(8):711-723.
14. Schadendorf D, Hodi FS, Robert C, et. al. Pooled analysis of long-term survival data from phase II and phase III trials of ipilimumab in unresectable or metastatic melanoma [published online ahead of print February 9, 2015]. J Clin Oncol. pii:JCO.2014.56.2736.
15. Weber JS, Kähler KC, Hauschild A. Management of immune-related adverse events and kinetics of response with ipilimumab. J Clin Oncol. 2012;30(21):2691-2697.
16. Hodi FS, Lee S, McDermott DF, et al. Ipilimumab plus sargramostim vs ipilimumab alone for treatment of metastatic melanoma: a randomized clinical trial. JAMA. 2014;312(17):1744-1753.
17. Topalian SL, Hodi FS, Brahmer JR, et al. Safety, activity, and immune correlates of anti-PD-1 antibody in cancer. N Engl J Med. 2012;366(26):2443-2454.
18. Ribas A, Hodi FS, Kefford R, et al. Efficacy and safety of the anti-PD-1 monoclonal antibody pembrolizumab (MK-3475) in 411 patients (pts) with melanoma (MEL) (Abstract LBA9000). Paper presented at: 2014 American Society of Clinical Oncology (ASCO) meeting; May-June 2014; Chicago, IL.
19. Hamid O, Robert C, Ribas A, et al. Randomized comparison of two doses of the anti-PD-1 monoclonal antibody MK-3475 for ipilimumab-refractory (IPI-R) and IPI-naive (IPI-N) melanoma (MEL) (abstract 3000). Paper presented at: 2014 American Society of Clinical Oncology (ASCO) meeting; May-June 2014; Chicago, IL.
20. Robert C, Ribas A, Wolchok JD, et al. Anti-programmed-death-receptor-1 treatment with pembrolizumab in ipilimumab-refractory advanced melanoma: a randomised dose-comparison cohort of a phase 1 trial. Lancet. 2014; 384(9948):1109-1117.
21. Dummer R, Daud A, Puzanov I, et. al. A randomized controlled comparison of pembrolizumab and chemotherapy in patients with ipilimumab-refractory melanoma. J Transl Med. 2015;13(suppl 1):O5.
22. Topalian SL, Sznol M, McDermott DF, et. al. Survival, durable tumor remission, and long-term safety in patients with advanced melanoma receiving nivolumab. J Clin Oncol. 2014;32(10):1020-1030.
23. Hodi FS, Sznol M, Kluger HM, et al. Long-term survival of ipilimumab-naive patients with advanced melanoma (MEL) treated with nivolumab (anti-PD-1, BMS-936558, ONO-4538) in a phase I trial (abstract 9002). Paper presented at: 2014 American Society of Clinical Oncology (ASCO) meeting; May-June 2014; Chicago, IL.
24. Robert C, Long GV, Brady B, et al. Nivolumab in previously untreated melanoma without BRAF mutation. N Engl J Med. 2015;372(4):320-330.
25. Weber J, D’Angelo S, Gutzmer R, et al. A phase 3 randomized, open-label study of nivolumab versus investigator’s choice of chemotherapy in patients with advanced melanoma after prior anti-CTLA4 therapy (abstract LBA3). Paper presented at: European Society of Medical Oncology 2014 meeting; September 2014; Madrid, Spain.
26. Atkins MB, Kudchadkar RR, Sznol M, et al. Phase 2, multicenter, safety and efficacy study of pidilizumab in patients with metastatic melanoma (abstract 9001). Paper presented at: 2014 American Society of Clinical Oncology (ASCO) meeting; May-June 2014; Chicago, IL.
27. Brahmer JR, Tykodi SS, Chow LQM, et al. Safety and activity of anti-PD-L1 antibody in patients with advanced cancer. N Engl J Med. 2012;366(26):2455-2465.
28. Hamid O, Sosman JA, Lawrence DP, et. al. Clinical activity, safety, and biomarkers of MPDL3280A, an engineered PD-L1 antibody in patients with locally advanced or metastatic melanoma (mM). J Clin Oncol. 2013;31(15)(suppl): Abstract 9010.
29. Lutzky J, Antonia SJ, Blake-Haskins A, et. al. A phase 1 study of MEDI4736, an anti–PD-L1 antibody, in patients with advanced solid tumors. J Clin Oncol. 2014;32(15)(suppl): Abstract 3001.
30. Wolchok JD, Kluger H, Callahan MK, et al. Nivolumab plus ipilimumab in advanced
melanoma. N Engl J Med. 2013;369(2):122-133.
31. Sznol M, Kluger HM, Callahan MK, et al. Survival, response duration, and activity by BRAF mutation (MT) status of nivolumab (NIVO, anti-PD-1, BMS-936558, ONO-4538) and ipilimumab (IPI) concurrent therapy in advanced melanoma (MEL) (abstract LBA9003). Paper presented at: 2014 American Society of Clinical Oncology (ASCO) meeting; May-June 2014; Chicago, IL.
32. Omholt K, Platz A, Kanter L, Ringborg U, Hansson J. NRAS and BRAF mutations arise early during melanoma pathogenesis and are preserved throughout tumor progression. Clin Cancer Res. 2003;9(17):6483-6488.
33. Wellbrock C, Hurlstone A. BRAF as therapeutic target in melanoma. Biochem Pharmacol. 2010;80(5):561-567.
34. Long GV, Menzies AM, Nagrial AM, et al. Prognostic and clinicopathologic associations of oncogenic BRAF in metastatic melanoma. J Clin Oncol. 2011;29(10):1239-1246.
35. Ball NJ, Yohn JJ, Morelli JG, et al. Ras mutations in human melanoma: a marker of malignant progression. J Invest Dermatol. 1994;102(3):285-290.
36. Platz A, Ringborg U, Brahme EM, Lagerlöf B. Melanoma metastases from patients with hereditary cutaneous malignant melanoma contain a high frequency of N-ras activating mutations. Melanoma Res. 1994;4(3):169-177.
37. Beeram M, Patnaik A, Rowinsky EK. Raf: a strategic target for therapeutic development against cancer. J Clin Oncol. 2005;23(27):6771-6790.
38. Terai K, Matsuda M. The amino-terminal B-Raf-specific region mediates calcium-dependent homo- and hetero-dimerization of Raf. EMBO J. 2006;25(15):3556-3564.
39. McArthur GA, Chapman PB, Robert C, et al. Safety and efficacy of vemurafenib in BRAF(V600E) and BRAF(V600K) mutation-positive melanoma (BRIM-3): extended follow-up of a phase 3, randomised, open-label study. Lancet Oncol. 2014;15(3):323-332.
40. Hauschild A, Grob JJ, Demidov LV, et al. An update on BREAK-3, a phase III, randomized trial: dabrafenib versus dacarbazine in patients with BRAF V600E-positive mutation metastatic melanoma (Abstract 9013). Paper presented at: American Society of Clinical Oncology 2013 meeting; May-June 2013; Chicago, IL.
41. Long GV, Trefzer U, Davies MA, et al. Dabrafenib in patients with Val600Glu or Val600Lys BRAF-mutant melanoma metastatic to the brain (BREAK-MB): a multicentre, open-label, phase 2 trial. Lancet Oncol. 2012;13(11):1087-1095.
42. Ascierto PA, Minor DR, Ribas A, et. al., Long-term safety and overall survival update for BREAK-2, a phase 2, single-arm, open-label study of dabrafenib in previously treated metastatic melanoma (NCT01153763). J Clin Oncol. 2014;32(15)(suppl): Abstract 9034.
43. Larkin J, Del Vecchio M, Ascierto PA, et al. Vemurafenib in patients with
BRAF(V600) mutated metastatic melanoma: an open-label, multicentre, safety
study. Lancet Oncol. 2014;15(4):436-444.
44. Lacouture ME, Duvic M, Hauschild A, et al. Analysis of dermatologic events in vemurafenib-treated patients with melanoma. Oncologist. 2013;18(3):314-322.
45. Su F, Viros A, Milagre C, et al. RAS mutations in cutaneous squamous-cell carcinomas in patients treated with BRAF inhibitors. N Engl J Med. 2012;366(3):207-215.
46. Chapman PB, Hauschild A, Robert C, et al. Improved survival with vemurafenib in melanoma with BRAF V600E mutation. N Engl J Med. 2011;364(26):2507-2516.
47. Hauschild A, Grob JJ, Demidov LV, et al. Dabrafenib in BRAF-mutated metastatic melanoma: a multicentre, open-label, phase 3 randomised controlled trial. Lancet. 2012;380(9839):358-365.
48. Ribas A, Hodi FS, Callahan M, et. al. Hepatotoxicity with combination of vemurafenib and ipilimumab. N Engl J Med. 2014;368(14):1365-1366.
49. Linette GP, Puzanov I, Callahan MK, et al. Phase 1 study of the BRAF inhibitor dabrafenib (D) with or without the MEK inhibitor trametinib (T) in combination with ipilimumab (Ipi) for V600E/K mutation–positive unresectable or metastatic melanoma (MM). J Clin Oncol. 2014;32(15)(suppl): Abstract 2511.
50. Chan MMK, Haydu LE, Menzies AM, et al. The nature and management of metastatic melanoma after progression on BRAF inhibitors: effects of extended BRAF inhibition. Cancer. 2014;120(20):3142-3153.
51. Carlino MS, Gowrishankar K, Saunders CAB, et al. Antiproliferative effects of continued mitogen-activated protein kinase pathway inhibition following acquired resistance to BRAF and/or MEK inhibition in melanoma. Mol Cancer Ther. 2013;12(7):1332-1342.
52. Flaherty KT, Robert C, Hersey P, et al. Improved survival with MEK inhibition in BRAF-mutated melanoma. N Engl J Med. 2012;367(2):107-114.
53. Kim KB, Kefford R, Pavlick AC, et. al. Phase II study of the MEK1/MEK2 inhibitor Trametinib in patients with metastatic BRAF-mutant cutaneous melanoma previously treated with or without a BRAF inhibitor. J Clin Oncol. 2013;31(1):482-489.
54. Ascierto PA, Schadendorf D, Berking C, et al. MEK162 for patients with advanced melanoma harbouring NRAS or Val600 BRAF mutations: a non-randomised, open-label phase 2 study. Lancet Oncol. 2013;14(3):249-256.
55. Sosman JA, Kittaneh M, Lolkema MP, et al. A phase 1b/2 study of LEE011 in combination with binimetinib (MEK162) in patients with NRAS-mutant melanoma: early encouraging clinical activity (abstract 9009). Paper presented at: 2014 American Society of Clinical Oncology meeting ; May-June 2014; Chicago, IL.
56. Long GV, Stroyakovskiy D, Gogas H, et al. Combined BRAF and MEK inhibition versus BRAF inhibition alone in melanoma. N Engl J Med. 2014;371(20):1877-1888.
57. Robert C, Karaszewska B, Schachter J, et al. Improved overall survival in melanoma with combined dabrafenib and trametinib. N Engl J Med. 2015;372(1):30-39.
58. Gogas H, Schadendorf D, Dummer R. Vemurafenib treatment in patients with BRAF-mutated melanoma failing MEK inhibition with trametinib. J Clin Oncol. 2014;32(15)(suppl): Abstract 9061.
59. Larkin J, Ascierto PA, Dréno B, et al. Combined vemurafenib and cobimetinib in BRAF-mutated melanoma. N Engl J Med. 2014;371(20):1867-1876.
60. Kefford R, Miller WH, Tan DS, et al. Preliminary results from a phase Ib/II, openlabel, dose-escalation study of the oral BRAF inhibitor LGX818 in combination with the oral MEK1/2 inhibitor MEK162 in BRAF V600-dependent advanced solid tumors (abstract 9019). Paper presented at: 2013 American Society of Clinical Oncology meeting; May-June 2014; Chicago, IL.
61. Curtin JA, Busam K, Pinkel D, Bastian BC. Somatic activation of KIT in distinct
subtypes of melanoma. J Clin Oncol. 2006;24(26):4340-4346.
62. Jin SA, Chun SM, Choi YD, et al. BRAF mutations and KIT aberrations and their clinicopathological correlation in 202 Korean melanomas. J Invest Dermatol. 2013;133(2):579-582.
63. Guo J, Si L, Kong Y et. al. Phase II, open-label, single-arm trial of imatinib mesylate in patients with metastatic melanoma harboring c-Kit mutation or amplification. J Clin Oncol. 2011;29(21):2904-2909.
64. Hodi FS, Corless CL, Giobbie-Hurder A, et al. Imatinib for melanomas harboring mutationally activated or amplified KIT arising on mucosal, acral, and chronically sun-damaged skin. J Clin Oncol. 2013;31(26):3182-3190.
65. Cho JH, Kim KM, Kwon M, Kim JH, Lee J. Nilotinib in patients with metastatic melanoma harboring KIT gene aberration. Invest New Drugs. 2012;30(5): 2008-2014.
66. Lebbe C, Chevret S, Jouary T, et. al. Phase II multicentric uncontrolled national trial assessing the efficacy of nilotinib in the treatment of advanced melanomas with c-KIT mutation or amplification. J Clin Oncol. 2014;32(15)(suppl): Abstract 9032.
67. Perez DG, Suman VJ, Fitch TR, et al. Phase 2 trial of carboplatin, weekly paclitaxel, and biweekly bevacizumab in patients with unresectable stage IV melanoma: a North Central Cancer Treatment Group study, N047A. Cancer. 2009;115(1):119-127.
68. Hainsworth JD, Infante JR, Spigel DR, et al. Bevacizumab and everolimus in the treatment of patients with metastatic melanoma. Cancer. 2010;116(17): 4122-4129.
69. Dronca RS, Allred JB, Perez DG, et. al. Phase II study of temozolomide (TMZ) and everolimus (RAD001) therapy for metastatic melanoma: a North Central Cancer Treatment Group study, N0675. Am J Clin Oncol. 2014;37(4):369-376.
70. Meier FE, Niessner H, Schmitz J, et al. The PI3K inhibitor BKM120 has potent antitumor activity in melanoma brain metastases in vitro and in vivo. J Clin Oncol. 2013;31(15)(suppl): Abstract e20050.
71. Ott PA, Chang J, Madden K, et al. Oblimersen in combination with temozolomide and albumin-bound paclitaxel in patients with advanced melanoma: a phase I trial. Cancer Chemother Pharmacol. 2013;71(1);183-191.
72. Ackerman A, Klein O, McDermott DF, et al. Outcomes of patients with metastatic
melanoma treated with immunotherapy prior to or after BRAF inhibitors. Cancer. 2014;120(11):1695-1701.
73. Ascierto PA, Margolin K. Ipilimumab before BRAF inhibitor treatment may be
more beneficial than vice versa for the majority of patients with advanced melanoma.
Cancer. 2014;120(11):1617-1619.
74. Ascierto PA, Simeone E, Sileni VC, et al. Sequential treatment with ipilimumab and BRAF inhibitors in patients with metastatic melanoma: data from the Italian cohort of the ipilimumab expanded access program. Cancer Invest. 2014;32(4):144-149.
Melanoma is the most aggressive form of skin cancer, contributing to about 76,000 new cases and more than 9,000 deaths in 2014.1 Depending on the stage of the disease, 5-year melanoma survival can range from 15% to 97%. Patients with local and distant metastases have a 5-year survival of about 60% and 15%, respectively.2
The incidence of melanoma is rising, partly because of the increasing number of skin biopsies being performed.3 If melanoma is diagnosed early, surgical excision is the treatment of choice. In patients with oligometastatic disease (cancer that has spread, but only to 1 or a small number of sites), complete surgical excision of the metastases may provide prolonged overall survival (OS) and delay the need to use systemic therapy.4
Recently, many new drug therapies have shown promising results in clinical trials, which may improve the prognosis of metastatic disease. This article reviews currently available systemic treatment options for the management of metastatic melanoma, the role of cytotoxic chemotherapy and interleukin-2 (IL-2), and the latest therapies available, including immune checkpoint inhibitors.
Cytotoxic Chemotherapy and Interleukin-2
Cytotoxic chemotherapy does not have an established role in the initial treatment of metastatic melanoma. Currently, cytotoxic chemotherapy is used in patients who have not responded to immunotherapy or molecular targeted therapy. The most commonly used drugs include dacarbazine and its prodrug, temozolomide. Several studies have failed to demonstrate a survival benefit using a single-agent chemotherapy with either dacarbazine or temozolomide.5,6
Other agents used in metastatic melanoma include nitrosoureas (fotemustine), platinum compounds (cisplatin, carboplatin), vinca alkaloids (vincristine),
and taxanes (paclitaxel). None of these agents provide a survival benefit, but an objective response may be seen in a minority of cases. Combination chemotherapy regimens have not shown an advantage over singleagent dacarbazine or temozolomide.7,8
High-dose IL-2 has been used in cases of metastatic melanoma with good performance status (PS) and organ function. Studies have shown a complete response rate of 3% to 7% and a prolonged disease-free survival in a minority of patients.9-11 The use of highdose IL-2, however, is limited by the high incidence of adverse effects (AEs), which include bacterial sepsis, pulmonary edema, arrhythmias, fever, and on some occasions, death due to complications.10 The use of IL-2 requires admission of the patient to a specialized unit for AE monitoring and management. Because of its ability to “cure” a minority of patients, a role still exists for IL-2 therapy in the treatment of younger, healthy patients with no evidence of organ dysfunction at baseline.
Immune Checkpoint Inhibitors
Checkpoint inhibitors are a class of drugs that unmask the immune system to fight against cancer cells. This class of drugs has shown significant activity and survival advantage in recent phase 2 and 3 trials. The class includes the anticytotoxic T-lymphocyte antigen 4 (CTLA-4) antibody ipilimumab and monoclonal antibodies targeting the programmed death 1 protein (PD-1) or its ligand (PD-L1).
Anti-CTLA-4 Antibodies: Ipilimumab
Cytotoxic T-lymphocyte antigen 4 is the antigen responsible for inhibition of cytotoxic T-cell-mediated immunity against foreign antigens presented by the antigen presenting cells (APCs). The APCs cause activation of the T cells when peptide fragments of intracellular proteins are presented in combination with mixed histocompatibility complex molecules. This step requires interaction of a costimulatory molecule (B7) on the APCs with a cluster of differentiation 28 protein (CD28) receptor located on T cells. CTLA-4 competes with CD28 to bind with the B7 molecule, thereby inhibiting the activation of the cytotoxic T cells (Figure 1). This pathway is thought to help with development of tolerance to host tissue antigens. Ipilimumab is a human monoclonal antibody that inhibits this CTLA-4 molecule and facilitates T-cell mediated antitumor activity.12 By blocking the CTLA-4 molecule, ipilimumab also mediates its autoimmune AEs on the host tissues.
Hodi and colleagues conducted a phase 3 trial of ipilimumab, including 676 patients who progressed after prior treatment for stage III or IV melanoma, and found that median OS was significantly better in the ipilimumab groups: 10 months in the ipilimumab plus gp100 peptide vaccine group vs 6.4 months in the gp100 vaccine alone group; 10.1 months in the ipilimumab alone group vs 6.4 months in the gp100 vaccine alone group.13 In another phase 3 trial comparing ipilimumab plus dacarbazine to dacarbazine alone, the ipilimumab group had a significantly improved OS (11.2 months vs 9.1 months).1 Survival rates with ipilimumab were prolonged for up to 3 years compared with the dacarbazine plus placebo group. However, the combination was associated with increased incidence of hepatotoxicity, thereby limiting its use.
A long-term survival analysis of 10 prospective and 2 retrospective studies of ipilimumab showed a median OS of 11.4 months and a long-term survival that began at 3 years with a plateau at 10 years of 21%, which was independent of prior therapy or ipilimumab dose.14 The immune-related AEs of ipilimumab are secondary to its activity against the host antigens and include dermatitis, enterocolitis, hepatitis, and endocrinopathies.15
A recent phase 2 trial studied the combination of ipilimumab with granulocyte-macrophage colonystimulating factor in 245 patients with stage III and IV melanoma. Median OS after 13 months was significantly higher with the combination compared with ipilimumab alone. The 1-year survival rate was 69% with
the combination and 53% with ipilimumab alone. There was no difference in the overall response rate (ORR) or progression-free survival (PFS) between the 2 groups. However, the AEs were significantly reduced with the combination (45% vs 58%).16 The dose of ipilimumab used in the trial was higher than the approved dose, making it difficult to apply the results in practice without further studies on the combination.
Anti-PD-1 Antibodies
Programmed death 1 ligands (PD-L1 and PD-L2) are expressed by tumor or stromal cells to inhibit the T-cell mediated antitumor activity. These ligands bind to the PD-1 protein on the surface of activated T cells to mediate their immunosuppressive effects. Interruption of this interaction by either anti-PD-1 antibodies or anti-PD-L1 antibodies facilitates tumor cell killing by activated T cells.17
Pembrozilumab and nivolumab are the 2 anti-PD-1 monoclonal antibodies that have been approved for treatment of metastatic melanoma. In a phase 1 trial
of pembrolizumab, 411 patients with advanced melanoma (consisting of both ipilimumab-naïve [IPI-N] and ipilimumab-treated [IPI-T] patients), ORR was 40% in IPI-N and 28% in IPI-T patients with a 1-year OS of 71% in all patients. Median PFS was 24 weeks in IPI-N and 23 weeks in IPI-T pts.18 There was no difference in outcomes and safety profiles across the various dosing regimens.18,19 Of note, pembrolizumab had antitumor activity irrespective of the PS, lactate dehydrogenase levels, BRAF (B-Raf proto-oncogene, serine/threonine kinase) gene mutation, metastatic stage, and number and type of prior therapy. In a subgroup analysis, 173 patients who had progression after treatment with ipilimumab were randomly assigned to pembrolizumab 2 mg/kg every 3 weeks (q3w) or 10 mg/kg q3w dosing regimens. Both groups had no significant difference in the ORR (26% in both) and safety profiles.20
In the 2012 KEYNOTE-002 clinical trial, a randomized phase 2 trial involving 540 patients with ipilimumab-refractory advanced melanoma, patients were randomized 1:1:1 to pembrolizumab 2 mg/kg or 10 mg/kg q3w or investigator-choice chemotherapy (control arm consisting of carboplatin plus paclitaxel, carboplatin, paclitaxel, dacarbazine, or temozolomide). The 6-month PFS was significantly improved with pembrolizumab (34% and 38% for pembrolizumab 2 mg/kg and 10 mg/kg, respectively) compared with 16% with chemotherapy. The ORR was significantly better with pembrolizumab (21% at 2 mg/kg, 25% at 10 mg/kg) compared with the control arm (4%).21 These findings led to the approval of pembrolizumab by the FDA for treatment of patients with advanced melanoma who have progressed on ipilimumab. Pembrolizumab is generally well tolerated. The most common AEs include fatigue, pruritus, and rash.
Nivolumab was studied in a recent phase 1 trial in which 107 patients with previously treated advanced melanoma were treated with escalated doses every
2 weeks.22 The 2-year and 3-year OS rates were 48% and 41%, respectively. Objective responses were seen in 32% of the patients. The median response duration was 23 months.23
The first phase 3 trial was conducted in 418 patients with previously untreated metastatic melanoma BRAF mutation. Patients were randomized to receive either nivolumab or dacarbazine. The PFS and OS were significantly better with nivolumab compared with dacarbazine (PFS 5.1 months vs 2.2 months; OS 73% vs 42% at 1 year).24 The AE profile of nivolumab is similar to pembrolizumab and includes lung, skin, endocrine, renal, and gastrointestinal tract toxicities.
Preliminary results of another phase 3 trial were presented at the European Society of Medical Oncology 2014 meeting. Patients with previously treated metastatic melanoma (ipilimumab or BRAF inhibitor) were randomized in a 2:1 ratio to receive either nivolumab or investigators’ choice chemotherapy (dacarbazine or carboplatin plus paclitaxel). The ORR was significantly better with nivolumab (32% vs 11%), and 95% of patients were still responding after 6 months. The nivolumab group showed a complete remission in 3% of the patients with 34% of the responses lasting ≥ 6 months.25 This led to the recent approval of nivolumab for patients with metastatic melanoma with a BRAF mutation who have advanced on ipilimumab. In the phase 3 NCT01844505 trial patients are being randomized to receive ipilimumab, nivolumab, or both.
A newer PD-1 inhibitor, pidilizumab, was studied in a phase 2 trial that included 103 patients with metastatic melanoma, 51% of whom had received therapy with ipilimumab. The ORR in the study group was relatively lower (6%), but the OS at 1 year was 64.5%.26 Further studies are underway to evaluate the role of this drug in metastatic melanoma.
The response with both nivolumab and pembrolizumab is durable as well as sustained, even after discontinuation of therapy. None of the deaths in the aforementioned studies were atributed to drug-related toxicities. As evidenced by current data, these 2 drugs hold a great promise for the management of patients who progress after therapy with anti-CTLA-4 antibodies.
Anti-PD-L1 Antibodies
The anti-PD-L1 monoclonal antibodies work in a similar way to the PD-1 inhibitors and block the interaction between the PD-1 and its ligand, PD-L1. This causes sustained activation of cytotoxic T cells and facilitates their antitumor activity. Two of PD-L1 inhibitors have shown clinical activity against metastatic melanoma.
BMS-936559, the first PD-L1 antibody, is being studied in a phase 1 trial that includes 55 patients with advanced melanoma along with 152 patients with other solid malignancies. Three patients achieved a complete response, and 5 patients had an objective response lasting 1 year. The ORR for melanoma was 17%, with disease stabilization of ≥ 24 weeks in 27% of the patients.27 Common AEs included infusion reactions, diarrhea, fatigue, rash, hypothyroidism, and hepatitis.
The second PD-L1 antibody, MPDL3280A, was studied in a phase 1 trial of 45 patients with metastatic melanoma. An ORR of 29% was observed, along with a 24-week PFS of 43%.28 Commonly noted AEs included hyperglycemia and elevated liver aminotransferases.
A newer PD-L1 inhibitor, MEDI4736, is being studied for advanced malignancies in 8 patients with melanoma. In preliminary analysis, MEDI4736 demonstrated a partial response in 1 out of 8 melanoma patients with a disease control rate of 46%.29 Although the PD-L1 inhibitors seem promising, more information will help discern their role in the management of metastatic melanoma.
Combined Anti-CTLA-4 Plus Anti-PD-1 Antibody
The combination of ipilimumab and the PD-1 inhibitor nivolumab was tested in a phase 1 trial in which both drugs were used concurrently as well as sequentially in metastatic melanoma.30 The 1- and 2-year OS in patients who were treated concurrently was 82% and 75%, respectively. Complete remission was seen in 17% of the patients, and the responses were seen irrespective of the BRAF mutation status. The responses were durable, and about 64% of the objective responses remain in remission at last follow-up.31 Grade 3 to grade 4 AEs were noted in 53% of the patients, with 11 patients requiring discontinuation of the medications. More studies are required to ascertain the optimum dosage of the combination prior to its approval for use in metastatic melanoma.
Molecular Targeted Therapy
The RAS-RAF–mitogen-activated protein kinase (MAPK)/extracellular signal-regulated kinase (ERK) signaling pathway is activated in almost 90% of patients
with melanoma.32 This pathway is normally required for the growth and survival of nonmalignant cells. In malignant transformation, mutations and/or overexpression is seen at various levels including KIT, NRAS, BRAF, and the MEK protein. This leads to activation of serine and threonine protein kinases, which lead to uncontrolled cell proliferation and survival.33
Novel therapeutic approaches have tried inhibiting one or more of these pathways for melanoma treatment. The most important mediator of tumorigenesis is BRAF, which is a downstream receptor of NRAS, and is mutated in almost 50% of melanoma cases.34 NRAS mutations are seen in 15% to 20% of cutaneous melanomas.35,36 After its activation, the RAF enzyme—coded by the BRAF gene—causes phosphorylation of the MEK protein, which activates ERK. This ERK activation leads to growth signaling and is the final pathway in several malignancies (Figure 2).37,38
BRAF Inhibitors
BRAF is the first mediator whose inhibition led to clinically significant outcomes in patients with melanoma. The most common BRAF mutation consists of the
substitution of glutamic acid for valine at amino acid 600 (V600E mutation) with majority of the remainder consisting of an alternate substitution (V600V or V600K).34 Vemurafenib and dabrafenib are the 2 BRAF inhibitors that have been shown to improve tumor regression, PFS, and OS considerably, especially in combination with a MEK protein inhibitor. In the phase 3 BRIM-3 trial, the vemurafenib group had a significantly prolonged PFS and OS compared with dacarbazine (13.6 months vs 9.7 months; 6.9 months vs 1.6 months, respectively). It was the first study to show improved survival with vemurafenib in both the V600E and V600K BRAF mutant melanomas.39
Another BRAF inhibitor, dabrafenib, was approved by the FDA for treatment of advanced melanoma with BRAF V600E mutation. It was tested in a phase 3 trial in which it was compared with dacarbazine in patients with advanced melanoma. Median OS in the dabrafenib arm was > 18 months and in dacarbazine arm > 15 months.40 Fifty-seven percent of the patients in dacarbazine arm were crossed over to the dabrafenib arm, thereby confounding the survival data for the former group. Another multicenter, phase 2 trial showed dabrafenib to have activity in melanoma patients with brain metastases, irrespective of previous therapy for the brain metastases.41 The long-term analysis of the BREAK-2 trial, which included 92 patients with metastatic melanoma treated with dabrafenib, showed a median OS of 12.9 months in BRAF V600K group and 13.1 months in BRAF V600E group.42
Adverse effects associated with BRAF inhibition include fatigue, rash, arthralgia, and photosensitivity reactions.43 Dermatologic complications may also include squamous cell carcinoma (SCC) (19%-26%), with keratoacanthoma being the most common subtype.44 These are believed to be likely secondary to the paradoxical activation of the MAPK signaling, since most of these lesions are found to have mutations in the RAS molecule.45 Other specific AEs of dabrafenib include hyperkeratosis (33%) and pyrexia (29%).42
Most patients treated with a BRAF inhibitor eventually have disease progression, likely secondary to reactivation of the MAPK pathway.46,47 This result has led to a heightened interest in combination therapies in an effort to improve outcomes. Combination therapy with ipilimumab and vemurafenib was studied and resulted in a higher incidence of hepatotoxicity (50%).48 However, no hepatotoxicity was seen in a phase 1 trial of combined dabrafenib and ipilimumab.49
Some studies have also suggested that extended BRAF inhibition after progression on a BRAF inhibitor may prolong survival.50,51 The phase 2 trial NCT01983124 is being conducted to evaluate the survival benefit with a combination of vemurafenib and a nitrosourea alkylating agent, fotemustine, in patients who have progressed on vemurafenib alone.
MEK Inhibitors
The inhibition of MEK can halt cell proliferation and induce apoptosis. The phase 3 METRIC trial, which compared the oral MEK inhibitor (trametinib) with chemotherapy, was conducted in 322 patients who had metastatic melanoma with a V600E or V600K BRAF mutation. The PFS and 6-month OS were significantly better with trametinib (4.8 months vs 1.5 months, 81% vs 66%) despite the crossover between the 2 groups.52 The AEs associated with trametinib included rash, diarrhea, and peripheral edema. Another phase 2 trial of trametinib including patients pretreated with a BRAF inhibitor showed no confirmed objective responses, 28% patients with stable disease, and minimal improvement in PFS (2 months). Among patients treated with prior chemotherapy and/or immunotherapy, trametinib showed significant improvement in complete responses, partial responses, stable disease, and the median PFS (2%, 23%, 51%, 4 months, respectively).53
The second MEK inhibitor, binimetinib, was studied in a phase 2 trial of advanced melanoma cases harboring a BRAF V600E or NRAS. Bimetinib demonstrated a PR in 20% cases of both the BRAF and NRAS mutant melanomas. Durable disease control was seen in 43% of the NRAS group and 32% of the BRAF group.54 The AE profile was similar to that seen with trametinib. Bimetinib is being studied in phase 1 and 2 trials with the CDK4/6 inhibitor as well as in the phase 3 trial NCT01763164 compared with dacarbazine in NRAS mutation positive melanomas.55
Selumetinib is a MEK inhibitor that has been compared with dacarbazine and temozolomide with no significant OS advantage. A novel highly specific inhibitor of MEK, cobimetinib, is currently being studied in combination with BRAF inhibitors.
Combined BRAF and MEK Inhibition
A randomized, double-blind, phase 3 study comparing the combination of dabrafenib and trametinib with dabrafenib and placebo in patients with advanced melanoma with a BRAF V600E mutation was presented at the 2014 American Society of Clinical Oncology meeting. Researchers found that after a median follow-up period of 9 months, there was a significant improvement with the combination in the PFS (9.3 months vs 8.8 months) and the ORR (67% vs 51%), with a similar incidence of AEs.56 The combination therapy group had fewer incidences of SCC of the skin but more incidence of pyrexia.
The combination of dabrafenib and trametinib was compared with vemurafenib monotherapy in a recent randomized phase 3 trial among 704 metastatic melanoma patients with a BRAF V600 mutation. Median PFS and ORR were significantly better with combination therapy compared with vemurafenib alone (11.4 months vs 7.3 months, 64% vs 51%, respectively). Overall survival rate at 1 year was significantly improved in the combination group as well (72% vs 65%).57 The incidence of SCC and keratoacanthoma was less in the combination (1%) compared with vemurafenib alone (18%). Another study investigating the coadministration and sequential administration of vemurafenib and trametinib is underway.58
The vemurafenib and cobimetinib combination was studied in a phase 3 trial of previously untreated unresectable locally advanced or metastatic BRAF V600
mutation-positive melanoma. The median PFS was 9.9 months in the combination group and 6.2 months in the control group. The interim analysis showed a 9-month survival rate of 81% in the combination group and 73% in the control group, with no significantly higher incidence of AEs in either arm.59 A longer follow-up will be needed to assess the OS benefit with the combination.
Encorafenib, a selective BRAF inhibitor, has been studied in a phase 1 trial in combination with binimetinib.60 This trial has paved the way to the initiation of a currently ongoing phase 3 trial (NCT01909453) comparing the combination with vemurafenib or encorafenib alone.
C-KIT Inhibitors
Mutations of c-KIT are seen more commonly in chronic sun damage-induced cutaneous melanomas, along with acral and mucosal melanomas.61,62 Earlier trials involving patients without selection for c-KIT mutation positivity failed to show benefit with imatinib. A single-arm, phase 2 trial of imatinib mesylate in patients with metastatic melanoma harboring the c-KIT mutation, an ORR of 23% was achieved, with a median PFS of 3.5 months.63 Imatinib showed an ORR of 29% in a phase 2 trial of mucosal, acral, and in chronic sun damage-induced melanoma patients with c-KIT amplifications and/or mutations. It was demonstrated that c-KIT amplification alone is not as responsive to imatinib compared with c-KIT mutation, suggesting that all patients with these specific melanomas should be tested for KIT mutation status.64
A second-generation c-KIT inhibitor, nilotinib, has shown some promising results with a favorable AE profile in small phase 2 trials.65,66 However, more clinical research will be needed before definite recommendations on its use in cutaneous melanomas can be made. Currently, its role seems to be limited to the management of acral, mucosal, and chronic sun damage-related melanomas with c-KIT mutations.
Future Directions
Angiogenesis promoters, such as vascular endothelial growth factor (VEGF), platelet-derived growth factor, fibroblast growth factor, and interleukin-8, are overexpressed in melanoma. Bevacizumab, an anti-VEGF antibody, has been shown to have some benefit in combination with carboplatin and paclitaxel as a triple therapy.67 However, grade 3 AEs were seen in a portion of patients.
The phosphatidylinositol-3 kinase (PI3K)/Akt/mammalian target of rapamycin (mTOR) pathway has also been studied as a target for melanoma therapy. Everolimus, an mTOR inhibitor, was studied in a phase 2 trial in combination with bevacizumab for treatment of metastatic melanoma. The combination showed improved median PFS and OS with the combination (4 months and 8.6 months, respectively), with 43% of patients alive after 12 months of follow-up.68 This study points to the direction of possible benefits with the combination of anti-VEGF and immunotherapy. A recent study failed to show survival advantage with combination of bevacizumab and temozolomide.69
Buparlisib (BKM120), a PI3K inhibitor, has been shown to have activity in vivo and in vitro against melanoma brain metastases.70 More studies need to be done to assess the possible combination with other established therapies.
Oblimersen is an antisense oligonucleotide that suppresses B-cell lymphoma-2, thereby suppressing its anti-apoptotic effect. The triple combination of oblimersen with temozolomide and albumin-bound paclitaxel has shown to be safe and efficacious in a phase 1 trial, thereby creating a need for further clinical trials.71
Treatment Approach
Systemic therapy for metastatic melanoma depends on several factors, including BRAF mutation status, functional status of the patient, disease burden, and severity of symptoms. Assessing the BRAF mutation status has become an important component in the management of patients with metastatic melanoma. It can help recognize patients who will benefit from molecular targeted therapy. In case of a BRAF-positive melanoma, treatment can be initiated with either immunotherapy or BRAF inhibitors. There are no randomized studies comparing immunotherapy to molecular targeted therapy.
Patients who have good PS and lymph node metastases can be treated initially with IL-2, which has the advantage of inducing cure in a minority of patients but should only be considered in patients with well-preserved organ function who can be monitored in an intensive care setting. On the other hand, patients who have bulky, symptomatic disease and poor PS should be treated initially with BRAF inhibitors. Combination of BRAF and MEK inhibitors can also be used and has an improved PFS and OS with potential to cause early tumor regression. There are studies to suggest suboptimal outcomes in patients who are treated with ipilimumab after progression on a BRAF inhibitor compared with initial treatment with ipilimumab followed by a BRAF inhibitor.72-74 However, all these studies are retrospective and there is no prospective data to suggest the above. BRAF mutation-positive patients who progress on a BRAF inhibitor
can be treated with PD-1 inhibitors.
Patients who do not have a BRAF mutation are unlikely to benefit from a BRAF inhibitor and primarily receive immunotherapy with ipilimumab or IL-2. Whenever possible, such patients should be enrolled in a clinical trial, as they have a poor prognosis. Patients who progress on ipilimumab can be treated with one of the PD-1 inhibitors (pembrolizumab, nivolumab). These PD-L1 inhibitors are still being investigated for use in such situations.
The role of chemotherapy in the management of metastatic melanoma has been limited by numerous studies showing significantly better survival with immunotherapy and molecular targeted therapy. Dacarbazine is the only FDA-approved drug for the treatment of melanoma. Its use is reserved mainly for patients who are not candidates for any of the other therapies available, including enrollment in a clinical trial.
Conclusion
Therapies for metastatic melanoma are in a state of flux. In the past decade, several new therapeutic agents have been introduced for the management of this potentially lethal disease. The treatment of metastatic melanoma has gradually shifted from cytotoxic chemotherapy toward a more individualized treatment that has a definite survival advantage over traditional counterparts. The advent of novel therapies has led to initiation of further studies to determine their role in the treatment of advanced melanoma, singly or in combination with other agents. In addition to evaluating new agents, more studies are needed to compare existing treatment modalities so that definitive treatment protocols can be formulated.
Acknowledgement
The authors would like to thank Felicia Ratnaraj, MD, for her assistance in creating the figures.
Author disclosures
The authors report no actual or potential conflicts of interest with regard to this article.
Disclaimer
The opinions expressed herein are those of the authors and do not necessarily reflect those of Federal Practitioner, Frontline Medical Communications Inc., the U.S. Government, or any of its agencies. This article may discuss unlabeled or investigational use of certain drugs. Please review the complete prescribing information for specific drugs or drug combinations—including indications, contraindications, warnings, and adverse effects—before administering pharmacologic therapy to patients.
Click here to read the digital edition.
1. Siegel R, Ma J, Zou Z, Jemal A. Cancer statistics, 2014. CA Cancer J Clin.2014;64(1):9-29.
2. Balch CM, Gershenwald JE, Soong SJ, et al. Final version of 2009 AJCC melanoma staging and classification. J Clin Oncol. 2009;27(36):6199-6206.
3. Welch HG, Woloshin S, Schwartz LM. Skin biopsy rates and incidence of melanoma:
population based ecological study. BMJ. 2005;331(7515):481.
4. Sosman JA, Moon J, Tuthill RJ, et al. A phase 2 trial of complete resection for stage IV melanoma: results of Southwest Oncology Group Clinical Trial S9430. Cancer. 2011;117(20):4740-4746.
5. Atkins MB. The role of cytotoxic chemotherapeutic agents either alone or in combination with biological response modifiers. In: Kirkwood JK, ed. Molecular Diagnosis, Prevention, & Therapy of Melanoma. New York, NY: Marcel Dekker;1997:219-225.
6. Patel PM, Suciu S, Mortier L, et al. Extended schedule, escalated dose temozolomide versus dacarbazine in stage IV melanoma: final results of a randomised phase III study (EORTC 18032). Eur J Cancer. 2011;47(10):1476-1483.
7. Chapman PB, Einhorn LH, Meyers ML, et al. Phase III multicenter randomized trial of the Dartmouth regimen versus dacarbazine in patients with metastatic melanoma. J Clin Oncol. 1999;17(9):2745-2751.
8. Flaherty KT, Lee SJ, Zhao F, et al. Phase III trial of carboplatin and paclitaxel with
or without sorafenib in metastatic melanoma. J Clin Oncol. 2013;31(3):373-379.
9. Rosenberg SA, Yang JC, Topalian SL, et al. Treatment of 283 consecutive patients with metastatic melanoma or renal cell cancer using high-dose bolus interleukin 2. JAMA. 1994;271(12):907-913.
10. Atkins MB, Lotze MT, Dutcher JP, et al. High-dose recombinant interleukin 2 therapy for patients with metastatic melanoma: analysis of 270 patients treated between 1985 and 1993. J Clin Oncol. 1999;17(7):2105-2116.
11. Atkins MB, Kunkel L, Sznol M, Rosenberg SA. High-dose recombinant interleukin-2 therapy in patients with metastatic melanoma: long-term survival update. Cancer J Sci Am. 2000;6(suppl 1):S11-S14.
12. Hoos A, Ibrahim R, Korman A, et al. Development of ipilimumab: contribution to a new paradigm for cancer immunotherapy. Semin Oncol. 2010;37(5):533-546.
13. Hodi FS, O’Day SJ, McDermott DF, et al. Improved survival with ipilimumab in patients with metastatic melanoma. N Engl J Med. 2010;363(8):711-723.
14. Schadendorf D, Hodi FS, Robert C, et. al. Pooled analysis of long-term survival data from phase II and phase III trials of ipilimumab in unresectable or metastatic melanoma [published online ahead of print February 9, 2015]. J Clin Oncol. pii:JCO.2014.56.2736.
15. Weber JS, Kähler KC, Hauschild A. Management of immune-related adverse events and kinetics of response with ipilimumab. J Clin Oncol. 2012;30(21):2691-2697.
16. Hodi FS, Lee S, McDermott DF, et al. Ipilimumab plus sargramostim vs ipilimumab alone for treatment of metastatic melanoma: a randomized clinical trial. JAMA. 2014;312(17):1744-1753.
17. Topalian SL, Hodi FS, Brahmer JR, et al. Safety, activity, and immune correlates of anti-PD-1 antibody in cancer. N Engl J Med. 2012;366(26):2443-2454.
18. Ribas A, Hodi FS, Kefford R, et al. Efficacy and safety of the anti-PD-1 monoclonal antibody pembrolizumab (MK-3475) in 411 patients (pts) with melanoma (MEL) (Abstract LBA9000). Paper presented at: 2014 American Society of Clinical Oncology (ASCO) meeting; May-June 2014; Chicago, IL.
19. Hamid O, Robert C, Ribas A, et al. Randomized comparison of two doses of the anti-PD-1 monoclonal antibody MK-3475 for ipilimumab-refractory (IPI-R) and IPI-naive (IPI-N) melanoma (MEL) (abstract 3000). Paper presented at: 2014 American Society of Clinical Oncology (ASCO) meeting; May-June 2014; Chicago, IL.
20. Robert C, Ribas A, Wolchok JD, et al. Anti-programmed-death-receptor-1 treatment with pembrolizumab in ipilimumab-refractory advanced melanoma: a randomised dose-comparison cohort of a phase 1 trial. Lancet. 2014; 384(9948):1109-1117.
21. Dummer R, Daud A, Puzanov I, et. al. A randomized controlled comparison of pembrolizumab and chemotherapy in patients with ipilimumab-refractory melanoma. J Transl Med. 2015;13(suppl 1):O5.
22. Topalian SL, Sznol M, McDermott DF, et. al. Survival, durable tumor remission, and long-term safety in patients with advanced melanoma receiving nivolumab. J Clin Oncol. 2014;32(10):1020-1030.
23. Hodi FS, Sznol M, Kluger HM, et al. Long-term survival of ipilimumab-naive patients with advanced melanoma (MEL) treated with nivolumab (anti-PD-1, BMS-936558, ONO-4538) in a phase I trial (abstract 9002). Paper presented at: 2014 American Society of Clinical Oncology (ASCO) meeting; May-June 2014; Chicago, IL.
24. Robert C, Long GV, Brady B, et al. Nivolumab in previously untreated melanoma without BRAF mutation. N Engl J Med. 2015;372(4):320-330.
25. Weber J, D’Angelo S, Gutzmer R, et al. A phase 3 randomized, open-label study of nivolumab versus investigator’s choice of chemotherapy in patients with advanced melanoma after prior anti-CTLA4 therapy (abstract LBA3). Paper presented at: European Society of Medical Oncology 2014 meeting; September 2014; Madrid, Spain.
26. Atkins MB, Kudchadkar RR, Sznol M, et al. Phase 2, multicenter, safety and efficacy study of pidilizumab in patients with metastatic melanoma (abstract 9001). Paper presented at: 2014 American Society of Clinical Oncology (ASCO) meeting; May-June 2014; Chicago, IL.
27. Brahmer JR, Tykodi SS, Chow LQM, et al. Safety and activity of anti-PD-L1 antibody in patients with advanced cancer. N Engl J Med. 2012;366(26):2455-2465.
28. Hamid O, Sosman JA, Lawrence DP, et. al. Clinical activity, safety, and biomarkers of MPDL3280A, an engineered PD-L1 antibody in patients with locally advanced or metastatic melanoma (mM). J Clin Oncol. 2013;31(15)(suppl): Abstract 9010.
29. Lutzky J, Antonia SJ, Blake-Haskins A, et. al. A phase 1 study of MEDI4736, an anti–PD-L1 antibody, in patients with advanced solid tumors. J Clin Oncol. 2014;32(15)(suppl): Abstract 3001.
30. Wolchok JD, Kluger H, Callahan MK, et al. Nivolumab plus ipilimumab in advanced
melanoma. N Engl J Med. 2013;369(2):122-133.
31. Sznol M, Kluger HM, Callahan MK, et al. Survival, response duration, and activity by BRAF mutation (MT) status of nivolumab (NIVO, anti-PD-1, BMS-936558, ONO-4538) and ipilimumab (IPI) concurrent therapy in advanced melanoma (MEL) (abstract LBA9003). Paper presented at: 2014 American Society of Clinical Oncology (ASCO) meeting; May-June 2014; Chicago, IL.
32. Omholt K, Platz A, Kanter L, Ringborg U, Hansson J. NRAS and BRAF mutations arise early during melanoma pathogenesis and are preserved throughout tumor progression. Clin Cancer Res. 2003;9(17):6483-6488.
33. Wellbrock C, Hurlstone A. BRAF as therapeutic target in melanoma. Biochem Pharmacol. 2010;80(5):561-567.
34. Long GV, Menzies AM, Nagrial AM, et al. Prognostic and clinicopathologic associations of oncogenic BRAF in metastatic melanoma. J Clin Oncol. 2011;29(10):1239-1246.
35. Ball NJ, Yohn JJ, Morelli JG, et al. Ras mutations in human melanoma: a marker of malignant progression. J Invest Dermatol. 1994;102(3):285-290.
36. Platz A, Ringborg U, Brahme EM, Lagerlöf B. Melanoma metastases from patients with hereditary cutaneous malignant melanoma contain a high frequency of N-ras activating mutations. Melanoma Res. 1994;4(3):169-177.
37. Beeram M, Patnaik A, Rowinsky EK. Raf: a strategic target for therapeutic development against cancer. J Clin Oncol. 2005;23(27):6771-6790.
38. Terai K, Matsuda M. The amino-terminal B-Raf-specific region mediates calcium-dependent homo- and hetero-dimerization of Raf. EMBO J. 2006;25(15):3556-3564.
39. McArthur GA, Chapman PB, Robert C, et al. Safety and efficacy of vemurafenib in BRAF(V600E) and BRAF(V600K) mutation-positive melanoma (BRIM-3): extended follow-up of a phase 3, randomised, open-label study. Lancet Oncol. 2014;15(3):323-332.
40. Hauschild A, Grob JJ, Demidov LV, et al. An update on BREAK-3, a phase III, randomized trial: dabrafenib versus dacarbazine in patients with BRAF V600E-positive mutation metastatic melanoma (Abstract 9013). Paper presented at: American Society of Clinical Oncology 2013 meeting; May-June 2013; Chicago, IL.
41. Long GV, Trefzer U, Davies MA, et al. Dabrafenib in patients with Val600Glu or Val600Lys BRAF-mutant melanoma metastatic to the brain (BREAK-MB): a multicentre, open-label, phase 2 trial. Lancet Oncol. 2012;13(11):1087-1095.
42. Ascierto PA, Minor DR, Ribas A, et. al., Long-term safety and overall survival update for BREAK-2, a phase 2, single-arm, open-label study of dabrafenib in previously treated metastatic melanoma (NCT01153763). J Clin Oncol. 2014;32(15)(suppl): Abstract 9034.
43. Larkin J, Del Vecchio M, Ascierto PA, et al. Vemurafenib in patients with
BRAF(V600) mutated metastatic melanoma: an open-label, multicentre, safety
study. Lancet Oncol. 2014;15(4):436-444.
44. Lacouture ME, Duvic M, Hauschild A, et al. Analysis of dermatologic events in vemurafenib-treated patients with melanoma. Oncologist. 2013;18(3):314-322.
45. Su F, Viros A, Milagre C, et al. RAS mutations in cutaneous squamous-cell carcinomas in patients treated with BRAF inhibitors. N Engl J Med. 2012;366(3):207-215.
46. Chapman PB, Hauschild A, Robert C, et al. Improved survival with vemurafenib in melanoma with BRAF V600E mutation. N Engl J Med. 2011;364(26):2507-2516.
47. Hauschild A, Grob JJ, Demidov LV, et al. Dabrafenib in BRAF-mutated metastatic melanoma: a multicentre, open-label, phase 3 randomised controlled trial. Lancet. 2012;380(9839):358-365.
48. Ribas A, Hodi FS, Callahan M, et. al. Hepatotoxicity with combination of vemurafenib and ipilimumab. N Engl J Med. 2014;368(14):1365-1366.
49. Linette GP, Puzanov I, Callahan MK, et al. Phase 1 study of the BRAF inhibitor dabrafenib (D) with or without the MEK inhibitor trametinib (T) in combination with ipilimumab (Ipi) for V600E/K mutation–positive unresectable or metastatic melanoma (MM). J Clin Oncol. 2014;32(15)(suppl): Abstract 2511.
50. Chan MMK, Haydu LE, Menzies AM, et al. The nature and management of metastatic melanoma after progression on BRAF inhibitors: effects of extended BRAF inhibition. Cancer. 2014;120(20):3142-3153.
51. Carlino MS, Gowrishankar K, Saunders CAB, et al. Antiproliferative effects of continued mitogen-activated protein kinase pathway inhibition following acquired resistance to BRAF and/or MEK inhibition in melanoma. Mol Cancer Ther. 2013;12(7):1332-1342.
52. Flaherty KT, Robert C, Hersey P, et al. Improved survival with MEK inhibition in BRAF-mutated melanoma. N Engl J Med. 2012;367(2):107-114.
53. Kim KB, Kefford R, Pavlick AC, et. al. Phase II study of the MEK1/MEK2 inhibitor Trametinib in patients with metastatic BRAF-mutant cutaneous melanoma previously treated with or without a BRAF inhibitor. J Clin Oncol. 2013;31(1):482-489.
54. Ascierto PA, Schadendorf D, Berking C, et al. MEK162 for patients with advanced melanoma harbouring NRAS or Val600 BRAF mutations: a non-randomised, open-label phase 2 study. Lancet Oncol. 2013;14(3):249-256.
55. Sosman JA, Kittaneh M, Lolkema MP, et al. A phase 1b/2 study of LEE011 in combination with binimetinib (MEK162) in patients with NRAS-mutant melanoma: early encouraging clinical activity (abstract 9009). Paper presented at: 2014 American Society of Clinical Oncology meeting ; May-June 2014; Chicago, IL.
56. Long GV, Stroyakovskiy D, Gogas H, et al. Combined BRAF and MEK inhibition versus BRAF inhibition alone in melanoma. N Engl J Med. 2014;371(20):1877-1888.
57. Robert C, Karaszewska B, Schachter J, et al. Improved overall survival in melanoma with combined dabrafenib and trametinib. N Engl J Med. 2015;372(1):30-39.
58. Gogas H, Schadendorf D, Dummer R. Vemurafenib treatment in patients with BRAF-mutated melanoma failing MEK inhibition with trametinib. J Clin Oncol. 2014;32(15)(suppl): Abstract 9061.
59. Larkin J, Ascierto PA, Dréno B, et al. Combined vemurafenib and cobimetinib in BRAF-mutated melanoma. N Engl J Med. 2014;371(20):1867-1876.
60. Kefford R, Miller WH, Tan DS, et al. Preliminary results from a phase Ib/II, openlabel, dose-escalation study of the oral BRAF inhibitor LGX818 in combination with the oral MEK1/2 inhibitor MEK162 in BRAF V600-dependent advanced solid tumors (abstract 9019). Paper presented at: 2013 American Society of Clinical Oncology meeting; May-June 2014; Chicago, IL.
61. Curtin JA, Busam K, Pinkel D, Bastian BC. Somatic activation of KIT in distinct
subtypes of melanoma. J Clin Oncol. 2006;24(26):4340-4346.
62. Jin SA, Chun SM, Choi YD, et al. BRAF mutations and KIT aberrations and their clinicopathological correlation in 202 Korean melanomas. J Invest Dermatol. 2013;133(2):579-582.
63. Guo J, Si L, Kong Y et. al. Phase II, open-label, single-arm trial of imatinib mesylate in patients with metastatic melanoma harboring c-Kit mutation or amplification. J Clin Oncol. 2011;29(21):2904-2909.
64. Hodi FS, Corless CL, Giobbie-Hurder A, et al. Imatinib for melanomas harboring mutationally activated or amplified KIT arising on mucosal, acral, and chronically sun-damaged skin. J Clin Oncol. 2013;31(26):3182-3190.
65. Cho JH, Kim KM, Kwon M, Kim JH, Lee J. Nilotinib in patients with metastatic melanoma harboring KIT gene aberration. Invest New Drugs. 2012;30(5): 2008-2014.
66. Lebbe C, Chevret S, Jouary T, et. al. Phase II multicentric uncontrolled national trial assessing the efficacy of nilotinib in the treatment of advanced melanomas with c-KIT mutation or amplification. J Clin Oncol. 2014;32(15)(suppl): Abstract 9032.
67. Perez DG, Suman VJ, Fitch TR, et al. Phase 2 trial of carboplatin, weekly paclitaxel, and biweekly bevacizumab in patients with unresectable stage IV melanoma: a North Central Cancer Treatment Group study, N047A. Cancer. 2009;115(1):119-127.
68. Hainsworth JD, Infante JR, Spigel DR, et al. Bevacizumab and everolimus in the treatment of patients with metastatic melanoma. Cancer. 2010;116(17): 4122-4129.
69. Dronca RS, Allred JB, Perez DG, et. al. Phase II study of temozolomide (TMZ) and everolimus (RAD001) therapy for metastatic melanoma: a North Central Cancer Treatment Group study, N0675. Am J Clin Oncol. 2014;37(4):369-376.
70. Meier FE, Niessner H, Schmitz J, et al. The PI3K inhibitor BKM120 has potent antitumor activity in melanoma brain metastases in vitro and in vivo. J Clin Oncol. 2013;31(15)(suppl): Abstract e20050.
71. Ott PA, Chang J, Madden K, et al. Oblimersen in combination with temozolomide and albumin-bound paclitaxel in patients with advanced melanoma: a phase I trial. Cancer Chemother Pharmacol. 2013;71(1);183-191.
72. Ackerman A, Klein O, McDermott DF, et al. Outcomes of patients with metastatic
melanoma treated with immunotherapy prior to or after BRAF inhibitors. Cancer. 2014;120(11):1695-1701.
73. Ascierto PA, Margolin K. Ipilimumab before BRAF inhibitor treatment may be
more beneficial than vice versa for the majority of patients with advanced melanoma.
Cancer. 2014;120(11):1617-1619.
74. Ascierto PA, Simeone E, Sileni VC, et al. Sequential treatment with ipilimumab and BRAF inhibitors in patients with metastatic melanoma: data from the Italian cohort of the ipilimumab expanded access program. Cancer Invest. 2014;32(4):144-149.
Automating venous thromboembolism risk calculation using electronic health record data upon hospital admission: The automated Padua Prediction Score
Hospital-acquired venous thromboembolism (VTE) continues to be a critical quality challenge for U.S. hospitals,1 and high-risk patients are often not adequately prophylaxed. Use of VTE prophylaxis (VTEP) varies as widely as 26% to 85% of patients in various studies, as does patient outcomes and care expenditures.2-6 The 9th edition of the American College of Chest Physicians (CHEST) guidelines7 recommend the Padua Prediction Score (PPS) to select individual patients who may be at high risk for venous thromboembolism (VTE) and could benefit from thromboprophylaxis. Use of the manually calculated PPS to select patients for thromboprophylaxis has been shown to help decrease 30-day and 90-day mortality associated with VTE events after hospitalization to medical services.8 However, the PPS requires time-consuming manual calculation by a provider, who may be focused on more immediate aspects of patient care and several other risk scores competing for his attention, potentially decreasing its use.
Other risk scores that use only discrete scalar data, such as vital signs and lab results to predict early recognition of sepsis, have been successfully automated and implemented within electronic health records (EHRs).9-11 Successful automation of scores requiring input of diagnoses, recent medical events, and current clinical status such as the PPS remains difficult.12 Data representing these characteristics are more prone to error, and harder to translate clearly into a single data field than discrete elements like heart rate, potentially impacting validity of the calculated result.13 To improve usage of guideline based VTE risk assessment and decrease physician burden, we developed an algorithm called Automated Padua Prediction Score (APPS) that automatically calculates the PPS using only EHR data available within prior encounters and the first 4 hours of admission, a similar timeframe to when admitting providers would be entering orders. Our goal was to assess if an automatically calculated version of the PPS, a score that depends on criteria more complex than vital signs and labs, would accurately assess risk for hospital-acquired VTE when compared to traditional manual calculation of the Padua Prediction Score by a provider.
METHODS
Site Description and Ethics
The study was conducted at University of California, San Francisco Medical Center, a 790-bed academic hospital; its Institutional Review Board approved the study and collection of data via chart review. Handling of patient information complied with the Health Insurance Portability and Accountability Act of 1996.
Patient Inclusion
Adult patients admitted to a medical or surgical service between July 1, 2012 and April 1, 2014 were included in the study if they were candidates for VTEP, defined as: length of stay (LOS) greater than 2 days, not on hospice care, not pregnant at admission, no present on admission VTE diagnosis, no known contraindications to prophylaxis (eg, gastrointestinal bleed), and were not receiving therapeutic doses of warfarin, low molecular weight heparins, heparin, or novel anticoagulants prior to admission.
Data Sources
Clinical variables were extracted from the EHR’s enterprise data warehouse (EDW) by SQL Server query (Microsoft, Redmond, Washington) and deposited in a secure database. Chart review was conducted by a trained researcher (Mr. Jacolbia) using the EHR and a standardized protocol. Findings were recorded using REDCap (REDCap Consortium, Vanderbilt University, Nashville, Tennessee). The specific ICD-9, procedure, and lab codes used to determine each criterion of APPS are available in the Appendix.
Creation of the Automated Padua Prediction Score (APPS)
We developed APPS from the original 11 criteria that comprise the Padua Prediction Score: active cancer, previous VTE (excluding superficial vein thrombosis), reduced mobility, known thrombophilic condition, recent (1 month or less) trauma and/or surgery, age 70 years or older, heart and/or respiratory failure, acute myocardial infarction and/or ischemic stroke, acute infection and/or rheumatologic disorder, body mass index (BMI) 30 or higher, and ongoing hormonal treatment.13 APPS has the same scoring methodology as PPS: criteria are weighted from 1 to 3 points and summed with a maximum score of 20, representing highest risk of VTE. To automate the score calculation from data routinely available in the EHR, APPS checks pre-selected structured data fields for specific values within laboratory results, orders, nursing flowsheets and claims. Claims data included all ICD-9 and procedure codes used for billing purposes. If any of the predetermined data elements are found, then the specific criterion is considered positive; otherwise, it is scored as negative. The creators of the PPS were consulted in the generation of these data queries to replicate the original standards for deeming a criterion positive. The automated calculation required no use of natural language processing.
Characterization of Study Population
We recorded patient demographics (age, race, gender, BMI), LOS, and rate of hospital-acquired VTE. These patients were separated into 2 cohorts determined by the VTE prophylaxis they received. The risk profile of patients who received pharmacologic prophylaxis was hypothesized to be inherently different from those who had not. To evaluate APPS within this heterogeneous cohort, patients were divided into 2 major categories: pharmacologic vs. no pharmacologic prophylaxis. If they had a completed order or medication administration record on the institution’s approved formulary for pharmacologic VTEP, they were considered to have received pharmacologic prophylaxis. If they had only a completed order for usage of mechanical prophylaxis (sequential compression devices) or no evidence of any form of VTEP, they were considered to have received no pharmacologic prophylaxis. Patients with evidence of both pharmacologic and mechanical were placed in the pharmacologic prophylaxis group. To ensure that automated designation of prophylaxis group was accurate, we reviewed 40 randomly chosen charts because prior researchers were able to achieve sensitivity and specificity greater than 90% with that sample size.14
The primary outcome of hospital-acquired VTE was defined as an ICD-9 code for VTE (specific codes are found in the Appendix) paired with a “present on admission = no” flag on that encounter’s hospital billing data, abstracted from the EDW. A previous study at this institution used the same methodology and found 212/226 (94%) of patients with a VTE ICD-9 code on claim had evidence of a hospital-acquired VTE event upon chart review.14 Chart review was also completed to ensure that the primary outcome of newly discovered hospital-acquired VTE was differentiated from chronic VTE or history of VTE. Theoretically, ICD-9 codes and other data elements treat chronic VTE, history of VTE, and hospital-acquired VTE as distinct diagnoses, but it was unclear if this was true in our dataset. For 75 randomly selected cases of presumed hospital-acquired VTE, charts were reviewed for evidence that confirmed newly found VTE during that encounter.
Validation of APPS through Comparison to Manual Calculation of the Original PPS
To compare our automated calculation to standard clinical practice, we manually calculated the PPS through chart review within the first 2 days of admission on 300 random patients, a subsample of the entire study cohort. The largest study we could find had manually calculated the PPS of 1,080 hospitalized patients with a mean PPS of 4.86 (standard deviation [SD], 2.26).15 One researcher (Mr. Jacolbia) accessed the EHR with all patient information available to physicians, including admission notes, orders, labs, flowsheets, past medical history, and all prior encounters to calculate and record the PPS. To limit potential score bias, 2 authors (Drs. Elias and Davies) assessed 30 randomly selected charts from the cohort of 300. The standardized chart review protocol mimicked a physician’s approach to determine if a patient met a criterion, such as concluding if he/she had active cancer by examining medication lists for chemotherapy, procedure notes for radiation, and recent diagnoses on problem lists. After the original PPS was manually calculated, APPS was automatically calculated for the same 300 patients. We intended to characterize similarities and differences between APPS and manual calculation prior to investigating APPS’ predictive capacity for the entire study population, because it would not be feasible to manually calculate the PPS for all 30,726 patients.
Statistical Analysis
For the 75 randomly selected cases of presumed hospital-acquired VTE, the number of cases was chosen by powering our analysis to find a difference in proportion of 20% with 90% power, α = 0.05 (two-sided). We conducted χ2 tests on the entire study cohort to determine if there were significant differences in demographics, LOS, and incidence of hospital-acquired VTE by prophylaxis received. For both the pharmacologic and the no pharmacologic prophylaxis groups, we conducted 2-sample Student t tests to determine significant differences in demographics and LOS between patients who experienced a hospital-acquired VTE and those who did not.
For the comparison of our automated calculation to standard clinical practice, we manually calculated the PPS through chart review within the first 2 days of admission on a subsample of 300 random patients. We powered our analysis to detect a difference in mean PPS from 4.86 to 4.36, enough to alter the point value, with 90% power and α = 0.05 (two-sided) and found 300 patients to be comfortably above the required sample size. We compared APPS and manual calculation in the 300-patient cohort using: 2-sample Student t tests to compare mean scores, χ2 tests to compare the frequency with which criteria were positive, and receiver operating characteristic (ROC) curves to determine capacity to predict a hospital-acquired VTE event. Pearson’s correlation was also completed to assess score agreement between APPS and manual calculation on a per-patient basis. After comparing automated calculation of APPS to manual chart review on the same 300 patients, we used APPS to calculate scores for the entire study cohort (n = 30,726). We calculated the mean of APPS by prophylaxis group and whether hospital-acquired VTE had occurred. We analyzed APPS’ ROC curve statistics by prophylaxis group to determine its overall predictive capacity in our study population. Lastly, we computed the time required to calculate APPS per patient. Statistical analyses were conducted using SPSS Statistics (IBM, Armonk, New York) and Python 2.7 (Python Software Foundation, Beaverton, Oregon); 95% confidence intervals (CI) and (SD) were reported when appropriate.
RESULTS
Among the 30,726 unique patients in our entire cohort (all patients admitted during the time period who met the study criteria), we found 6574 (21.4%) on pharmacologic (with or without mechanical) prophylaxis, 13,511 (44.0%) on mechanical only, and 10,641 (34.6%) on no prophylaxis. χ2 tests found no significant differences in demographics, LOS, or incidence of hospital-acquired VTE between the patients who received mechanical prophylaxis only and those who received no prophylaxis (Table 1). Similarly, there were no differences in these characteristics in patients receiving pharmacologic prophylaxis with or without the addition of mechanical prophylaxis. Designation of prophylaxis group by manual chart review vs. our automated process was found to agree in categorization for 39/40 (97.5%) sampled encounters. When comparing the cohort that received pharmacologic prophylaxis against the cohort that did not, there were significant differences in racial distribution, sex, BMI, and average LOS as shown in Table 1. Those who received pharmacologic prophylaxis were found to be significantly older than those who did not (62.7 years versus 53.2 years, P < 0.001), more likely to be male (50.6% vs, 42.4%, P < 0.001), more likely to have hospital-acquired VTE (2.2% vs. 0.5%, P < 0.001), and to have a shorter LOS (7.1 days vs. 9.8, P < 0.001).

Within the cohort group receiving pharmacologic prophylaxis (n = 6574), hospital-acquired VTE occurred in patients who were significantly younger (58.2 years vs. 62.8 years, P = 0.003) with a greater LOS (23.8 days vs. 6.7, P < 0.001) than those without. Within the group receiving no pharmacologic prophylaxis (n = 24,152), hospital-acquired VTE occurred in patients who were significantly older (57.1 years vs. 53.2 years, P = 0.014) with more than twice the LOS (20.2 days vs. 9.7 days, P < 0.001) compared to those without. Sixty-six of 75 (88%) randomly selected patients in which new VTE was identified by the automated electronic query had this diagnosis confirmed during manual chart review.
As shown in Table 2, automated calculation on a subsample of 300 randomly selected patients using APPS had a mean of 5.5 (SD, 2.9) while manual calculation of the original PPS on the same patients had a mean of 5.1 (SD, 2.6). There was no significant difference in mean between manual calculation and APPS (P = 0.073). There were, however, significant differences in how often individual criteria were considered present. The largest contributors to the difference in scores between APPS and manual calculation were “prior VTE” (positive, 16% vs. 8.3%, respectively) and “reduced mobility” (positive, 74.3% vs. 66%, respectively) as shown in Table 2. In the subsample, there were a total of 6 (2.0%) hospital-acquired VTE events. APPS’ automated calculation had an AUC = 0.79 (CI, 0.63-0.95) that was significant (P = 0.016) with a cutoff value of 5. Chart review’s manual calculation of the PPS had an AUC = 0.76 (CI 0.61-0.91) that was also significant (P = 0.029).
Distribution of Patient Characteristics in Cohort

Our entire cohort of 30,726 unique patients admitted during the study period included 260 (0.8%) who experienced hospital-acquired VTEs (Table 3). In patients receiving no pharmacologic prophylaxis, the average APPS was 4.0 (SD, 2.4) for those without VTE and 7.1 (SD, 2.3) for those with VTE. In patients who had received pharmacologic prophylaxis, those without hospital-acquired VTE had an average APPS of 4.9 (SD, 2.6) and those with hospital-acquired VTE averaged 7.7 (SD, 2.6). APPS’ ROC curves for “no pharmacologic prophylaxis” had an AUC = 0.81 (CI, 0.79 – 0.83) that was significant (P < 0.001) with a cutoff value of 5. There was similar performance in the pharmacologic prophylaxis group with an AUC = 0.79 (CI, 0.76 – 0.82) and cutoff value of 5, as shown in the Figure. Over the entire cohort, APPS had a sensitivity of 85.4%, specificity of 53.3%, positive predictive value (PPV) of 1.5%, and a negative predictive value (NPV) of 99.8% when using a cutoff of 5. The average APPS calculation time was 0.03 seconds per encounter. Additional information on individual criteria can be found in Table 3.

DISCUSSION
Automated calculation of APPS using EHR data from prior encounters and the first 4 hours of admission was predictive of in-hospital VTE. APPS performed as well as traditional manual score calculation of the PPS. It was able to do so with no physician input, significantly lessening the burden of calculation and potentially increasing frequency of data-driven VTE risk assessment.
While automated calculation of certain scores is becoming more common, risk calculators that require data beyond vital signs and lab results have lagged,16-19 in part because of uncertainty about 2 issues. The first is whether EHR data accurately represent the current clinical picture. The second is if a machine-interpretable algorithm to determine a clinical status (eg, “active cancer”) would be similar to a doctor’s perception of that same concept. We attempted to better understand these 2 challenges through developing APPS. Concerning accuracy, EHR data correctly represent the clinical scenario: designations of VTEP and hospital-acquired VTE were accurate in approximately 90% of reviewed cases. Regarding the second concern, when comparing APPS to manual calculation, we found significant differences (P < 0.001) in how often 8 of the 11 criteria were positive, yet no significant difference in overall score and similar predictive capacity. Manual calculation appeared more likely to find data in the index encounter or in structured data. For example, “active cancer” may be documented only in a physician’s note, easily accounted for during a physician’s calculation but missed by APPS looking only for structured data. In contrast, automated calculation found historic criteria, such as “prior VTE” or “known thrombophilic condition,” positive more often. If the patient is being admitted for a problem unrelated to blood clots, the physician may have little time or interest to look through hundreds of EHR documents to discover a 2-year-old VTE. As patients’ records become larger and denser, more historic data can become buried and forgotten. While the 2 scores differ on individual criteria, they are similarly predictive and able to bifurcate the at-risk population to those who should and should not receive pharmacologic prophylaxis.

The APPS was found to have near-equal performance in the pharmacologic vs. no pharmacologic prophylaxis cohorts. This finding agrees with a study that found no significant difference in predicting 90-day VTE when looking at 86 risk factors vs. the most significant 4, none of which related to prescribed prophylaxis.18 The original PPS had a reported sensitivity of 94.6%, specificity 62%, PPV 7.5%, and NPV 99.7% in its derivation cohort.13 We matched APPS to the ratio of sensitivity to specificity, using 5 as the cutoff value. APPS performed slightly worse with sensitivity of 85.4%, specificity 53.3%, PPV 1.5%, and NPV 99.8%. This difference may have resulted from the original PPS study’s use of 90-day follow-up to determine VTE occurrence, whereas we looked only until the end of current hospitalization, an average of 9.2 days. Furthermore, the PPS had significantly poorer performance (AUC = 0.62) than that seen in the original derivation cohort in a separate study that manually calculated the score on more than 1000 patients.15
There are important limitations to our study. It was done at a single academic institution using a dataset of VTE-associated, validated research that was well-known to the researchers.20 Another major limitation is the dependence of the algorithm on data available within the first 4 hours of admission and earlier; thus, previous encounters may frequently play an important role. Patients presenting to our health system for the first time would have significantly fewer data available at the time of calculation. Additionally, our data could not reliably tell us the total doses of pharmacologic prophylaxis that a patient received. While most patients will maintain a consistent VTEP regimen once initiated in the hospital, 2 patients with the same LOS may have received differing amounts of pharmacologic prophylaxis. This research study did not assess how much time automatic calculation of VTE risk might save providers, because we did not record the time for each manual abstraction; however, from discussion with the main abstracter, chart review and manual calculation for this study took from 2 to 14 minutes per patient, depending on the number of previous interactions with the health system. Finally, although we chose data elements that are likely to exist at most institutions using an EHR, many institutions’ EHRs do not have EDW capabilities nor programmers who can assist with an automated risk score.
The EHR interventions to assist providers in determining appropriate VTEP have been able to increase rates of VTEP and decrease VTE-associated mortality.16,21 In addition to automating the calculation of guideline-adherent risk scores, there is a need for wider adoption for clinical decision support for VTE. For this reason, we chose only structured data fields from some of the most common elements within our EHR’s data warehouse to derive APPS (Appendix 1). Our study supports the idea that automated calculation of scores requiring input of more complex data such as diagnoses, recent medical events, and current clinical status remains predictive of hospital-acquired VTE risk. Because it is calculated automatically in the background while the clinician completes his or her assessment, the APPS holds the potential to significantly reduce the burden on providers while making guideline-adherent risk assessment more readily accessible. Further research is required to determine the exact amount of time automatic calculation saves, and, more important, if the relatively high predictive capacity we observed using APPS would be reproducible across institutions and could reduce incidence of hospital-acquired VTE.
Disclosures
Dr. Auerbach was supported by NHLBI K24HL098372 during the period of this study. Dr. Khanna, who is an implementation scientist at the University of California San Francisco Center for Digital Health Innovation, is the principal inventor of CareWeb, and may benefit financially from its commercialization. The other authors report no financial conflicts of interest.
1. Galson S. The Surgeon General’s call to action to prevent deep vein thrombosis and pulmonary embolism. 2008. https://www.ncbi.nlm.nih.gov/books/NBK44178/. Accessed February 11, 2016. PubMed
2. Borch KH, Nyegaard C, Hansen JB, et al. Joint effects of obesity and body height on the risk of venous thromboembolism: the Tromsø study. Arterioscler Thromb Vasc Biol. 2011;31(6):1439-44. PubMed
3. Braekkan SK, Borch KH, Mathiesen EB, Njølstad I, Wilsgaard T, Hansen JB.. Body height and risk of venous thromboembolism: the Tromsø Study. Am J Epidemiol. 2010;171(10):1109-1115. PubMed
4. Bounameaux H, Rosendaal FR. Venous thromboembolism: why does ethnicity matter? Circulation. 2011;123(200:2189-2191. PubMed
5. Spyropoulos AC, Anderson FA Jr, Fitzgerald G, et al; IMPROVE Investigators. Predictive and associative models to identify hospitalized medical patients at risk for VTE. Chest. 2011;140(3):706-714. PubMed
6. Rothberg MB, Lindenauer PK, Lahti M, Pekow PS, Selker HP. Risk factor model to predict venous thromboembolism in hospitalized medical patients. J Hosp Med. 2011;6(4):202-209. PubMed
7. Perioperative Management of Antithrombotic Therapy: Prevention of VTE in Nonsurgical Patients: Antithrombotic Therapy and Prevention of Thrombosis, 9th ed: American College of Chest Physicians Evidence-Based Clinical Practice Guidelines. Chest. 2012;141(6):1645.
8. Subbe CP, Kruger M, Rutherford P, Gemmel L. Validation of a modified Early Warning Score in medical admissions. QJM. 2001;94(10):521-526. PubMed
9. Alvarez CA, Clark CA, Zhang S, et al. Predicting out of intensive care unit cardiopulmonary arrest or death using electronic medical record data. BMC Med Inform Decis Mak. 2013;13:28. PubMed
10. Escobar GJ, LaGuardia JC, Turk BJ, Ragins A, Kipnis P, Draper D. Early detection of impending physiologic deterioration among patients who are not in intensive care: development of predictive models using data from an automated electronic medical record. J Hosp Med. 2012;7(5):388-395. PubMed
11. Umscheid CA, Hanish A, Chittams J, Weiner MG, Hecht TE. Effectiveness of a novel and scalable clinical decision support intervention to improve venous thromboembolism prophylaxis: a quasi-experimental study. BMC Med Inform Decis Mak. 2012;12:92. PubMed
12. Tepas JJ 3rd, Rimar JM, Hsiao AL, Nussbaum MS. Automated analysis of electronic medical record data reflects the pathophysiology of operative complications. Surgery. 2013;154(4):918-924. PubMed
13. Barbar S, Noventa F, Rossetto V, et al. A risk assessment model for the identification of hospitalized medical patients at risk for venous thromboembolism: the Padua Prediction Score. J Thromb Haemost. 2010; 8(11):2450-2457. PubMed
14. Khanna R, Maynard G, Sadeghi B, et al. Incidence of hospital-acquired venous thromboembolic codes in medical patients hospitalized in academic medical centers. J Hosp Med. 2014; 9(4):221-225. PubMed
15. Vardi M, Ghanem-Zoubi NO, Zidan R, Yurin V, Bitterman H. Venous thromboembolism and the utility of the Padua Prediction Score in patients with sepsis admitted to internal medicine departments. J Thromb Haemost. 2013;11(3):467-473. PubMed
16. Samama MM, Dahl OE, Mismetti P, et al. An electronic tool for venous thromboembolism prevention in medical and surgical patients. Haematologica. 2006;91(1):64-70. PubMed
17. Mann DM, Kannry JL, Edonyabo D, et al. Rationale, design, and implementation protocol of an electronic health record integrated clinical prediction rule (iCPR) randomized trial in primary care. Implement Sci. 2011;6:109. PubMed
18. Woller SC, Stevens SM, Jones JP, et al. Derivation and validation of a simple model to identify venous thromboembolism risk in medical patients. Am J Med. 2011;124(10):947-954. PubMed
19. Huang W, Anderson FA, Spencer FA, Gallus A, Goldberg RJ. Risk-assessment models for predicting venous thromboembolism among hospitalized non-surgical patients: a systematic review. J Thromb Thrombolysis. 2013;35(1):67-80. PubMed
20. Khanna RR, Kim SB, Jenkins I, et al. Predictive value of the present-on-admission indicator for hospital-acquired venous thromboembolism. Med Care. 2015;53(4):e31-e36. PubMed
21. Kucher N, Koo S, Quiroz R, et al. Electronic alerts to prevent venous thromboembolism a
Hospital-acquired venous thromboembolism (VTE) continues to be a critical quality challenge for U.S. hospitals,1 and high-risk patients are often not adequately prophylaxed. Use of VTE prophylaxis (VTEP) varies as widely as 26% to 85% of patients in various studies, as does patient outcomes and care expenditures.2-6 The 9th edition of the American College of Chest Physicians (CHEST) guidelines7 recommend the Padua Prediction Score (PPS) to select individual patients who may be at high risk for venous thromboembolism (VTE) and could benefit from thromboprophylaxis. Use of the manually calculated PPS to select patients for thromboprophylaxis has been shown to help decrease 30-day and 90-day mortality associated with VTE events after hospitalization to medical services.8 However, the PPS requires time-consuming manual calculation by a provider, who may be focused on more immediate aspects of patient care and several other risk scores competing for his attention, potentially decreasing its use.
Other risk scores that use only discrete scalar data, such as vital signs and lab results to predict early recognition of sepsis, have been successfully automated and implemented within electronic health records (EHRs).9-11 Successful automation of scores requiring input of diagnoses, recent medical events, and current clinical status such as the PPS remains difficult.12 Data representing these characteristics are more prone to error, and harder to translate clearly into a single data field than discrete elements like heart rate, potentially impacting validity of the calculated result.13 To improve usage of guideline based VTE risk assessment and decrease physician burden, we developed an algorithm called Automated Padua Prediction Score (APPS) that automatically calculates the PPS using only EHR data available within prior encounters and the first 4 hours of admission, a similar timeframe to when admitting providers would be entering orders. Our goal was to assess if an automatically calculated version of the PPS, a score that depends on criteria more complex than vital signs and labs, would accurately assess risk for hospital-acquired VTE when compared to traditional manual calculation of the Padua Prediction Score by a provider.
METHODS
Site Description and Ethics
The study was conducted at University of California, San Francisco Medical Center, a 790-bed academic hospital; its Institutional Review Board approved the study and collection of data via chart review. Handling of patient information complied with the Health Insurance Portability and Accountability Act of 1996.
Patient Inclusion
Adult patients admitted to a medical or surgical service between July 1, 2012 and April 1, 2014 were included in the study if they were candidates for VTEP, defined as: length of stay (LOS) greater than 2 days, not on hospice care, not pregnant at admission, no present on admission VTE diagnosis, no known contraindications to prophylaxis (eg, gastrointestinal bleed), and were not receiving therapeutic doses of warfarin, low molecular weight heparins, heparin, or novel anticoagulants prior to admission.
Data Sources
Clinical variables were extracted from the EHR’s enterprise data warehouse (EDW) by SQL Server query (Microsoft, Redmond, Washington) and deposited in a secure database. Chart review was conducted by a trained researcher (Mr. Jacolbia) using the EHR and a standardized protocol. Findings were recorded using REDCap (REDCap Consortium, Vanderbilt University, Nashville, Tennessee). The specific ICD-9, procedure, and lab codes used to determine each criterion of APPS are available in the Appendix.
Creation of the Automated Padua Prediction Score (APPS)
We developed APPS from the original 11 criteria that comprise the Padua Prediction Score: active cancer, previous VTE (excluding superficial vein thrombosis), reduced mobility, known thrombophilic condition, recent (1 month or less) trauma and/or surgery, age 70 years or older, heart and/or respiratory failure, acute myocardial infarction and/or ischemic stroke, acute infection and/or rheumatologic disorder, body mass index (BMI) 30 or higher, and ongoing hormonal treatment.13 APPS has the same scoring methodology as PPS: criteria are weighted from 1 to 3 points and summed with a maximum score of 20, representing highest risk of VTE. To automate the score calculation from data routinely available in the EHR, APPS checks pre-selected structured data fields for specific values within laboratory results, orders, nursing flowsheets and claims. Claims data included all ICD-9 and procedure codes used for billing purposes. If any of the predetermined data elements are found, then the specific criterion is considered positive; otherwise, it is scored as negative. The creators of the PPS were consulted in the generation of these data queries to replicate the original standards for deeming a criterion positive. The automated calculation required no use of natural language processing.
Characterization of Study Population
We recorded patient demographics (age, race, gender, BMI), LOS, and rate of hospital-acquired VTE. These patients were separated into 2 cohorts determined by the VTE prophylaxis they received. The risk profile of patients who received pharmacologic prophylaxis was hypothesized to be inherently different from those who had not. To evaluate APPS within this heterogeneous cohort, patients were divided into 2 major categories: pharmacologic vs. no pharmacologic prophylaxis. If they had a completed order or medication administration record on the institution’s approved formulary for pharmacologic VTEP, they were considered to have received pharmacologic prophylaxis. If they had only a completed order for usage of mechanical prophylaxis (sequential compression devices) or no evidence of any form of VTEP, they were considered to have received no pharmacologic prophylaxis. Patients with evidence of both pharmacologic and mechanical were placed in the pharmacologic prophylaxis group. To ensure that automated designation of prophylaxis group was accurate, we reviewed 40 randomly chosen charts because prior researchers were able to achieve sensitivity and specificity greater than 90% with that sample size.14
The primary outcome of hospital-acquired VTE was defined as an ICD-9 code for VTE (specific codes are found in the Appendix) paired with a “present on admission = no” flag on that encounter’s hospital billing data, abstracted from the EDW. A previous study at this institution used the same methodology and found 212/226 (94%) of patients with a VTE ICD-9 code on claim had evidence of a hospital-acquired VTE event upon chart review.14 Chart review was also completed to ensure that the primary outcome of newly discovered hospital-acquired VTE was differentiated from chronic VTE or history of VTE. Theoretically, ICD-9 codes and other data elements treat chronic VTE, history of VTE, and hospital-acquired VTE as distinct diagnoses, but it was unclear if this was true in our dataset. For 75 randomly selected cases of presumed hospital-acquired VTE, charts were reviewed for evidence that confirmed newly found VTE during that encounter.
Validation of APPS through Comparison to Manual Calculation of the Original PPS
To compare our automated calculation to standard clinical practice, we manually calculated the PPS through chart review within the first 2 days of admission on 300 random patients, a subsample of the entire study cohort. The largest study we could find had manually calculated the PPS of 1,080 hospitalized patients with a mean PPS of 4.86 (standard deviation [SD], 2.26).15 One researcher (Mr. Jacolbia) accessed the EHR with all patient information available to physicians, including admission notes, orders, labs, flowsheets, past medical history, and all prior encounters to calculate and record the PPS. To limit potential score bias, 2 authors (Drs. Elias and Davies) assessed 30 randomly selected charts from the cohort of 300. The standardized chart review protocol mimicked a physician’s approach to determine if a patient met a criterion, such as concluding if he/she had active cancer by examining medication lists for chemotherapy, procedure notes for radiation, and recent diagnoses on problem lists. After the original PPS was manually calculated, APPS was automatically calculated for the same 300 patients. We intended to characterize similarities and differences between APPS and manual calculation prior to investigating APPS’ predictive capacity for the entire study population, because it would not be feasible to manually calculate the PPS for all 30,726 patients.
Statistical Analysis
For the 75 randomly selected cases of presumed hospital-acquired VTE, the number of cases was chosen by powering our analysis to find a difference in proportion of 20% with 90% power, α = 0.05 (two-sided). We conducted χ2 tests on the entire study cohort to determine if there were significant differences in demographics, LOS, and incidence of hospital-acquired VTE by prophylaxis received. For both the pharmacologic and the no pharmacologic prophylaxis groups, we conducted 2-sample Student t tests to determine significant differences in demographics and LOS between patients who experienced a hospital-acquired VTE and those who did not.
For the comparison of our automated calculation to standard clinical practice, we manually calculated the PPS through chart review within the first 2 days of admission on a subsample of 300 random patients. We powered our analysis to detect a difference in mean PPS from 4.86 to 4.36, enough to alter the point value, with 90% power and α = 0.05 (two-sided) and found 300 patients to be comfortably above the required sample size. We compared APPS and manual calculation in the 300-patient cohort using: 2-sample Student t tests to compare mean scores, χ2 tests to compare the frequency with which criteria were positive, and receiver operating characteristic (ROC) curves to determine capacity to predict a hospital-acquired VTE event. Pearson’s correlation was also completed to assess score agreement between APPS and manual calculation on a per-patient basis. After comparing automated calculation of APPS to manual chart review on the same 300 patients, we used APPS to calculate scores for the entire study cohort (n = 30,726). We calculated the mean of APPS by prophylaxis group and whether hospital-acquired VTE had occurred. We analyzed APPS’ ROC curve statistics by prophylaxis group to determine its overall predictive capacity in our study population. Lastly, we computed the time required to calculate APPS per patient. Statistical analyses were conducted using SPSS Statistics (IBM, Armonk, New York) and Python 2.7 (Python Software Foundation, Beaverton, Oregon); 95% confidence intervals (CI) and (SD) were reported when appropriate.
RESULTS
Among the 30,726 unique patients in our entire cohort (all patients admitted during the time period who met the study criteria), we found 6574 (21.4%) on pharmacologic (with or without mechanical) prophylaxis, 13,511 (44.0%) on mechanical only, and 10,641 (34.6%) on no prophylaxis. χ2 tests found no significant differences in demographics, LOS, or incidence of hospital-acquired VTE between the patients who received mechanical prophylaxis only and those who received no prophylaxis (Table 1). Similarly, there were no differences in these characteristics in patients receiving pharmacologic prophylaxis with or without the addition of mechanical prophylaxis. Designation of prophylaxis group by manual chart review vs. our automated process was found to agree in categorization for 39/40 (97.5%) sampled encounters. When comparing the cohort that received pharmacologic prophylaxis against the cohort that did not, there were significant differences in racial distribution, sex, BMI, and average LOS as shown in Table 1. Those who received pharmacologic prophylaxis were found to be significantly older than those who did not (62.7 years versus 53.2 years, P < 0.001), more likely to be male (50.6% vs, 42.4%, P < 0.001), more likely to have hospital-acquired VTE (2.2% vs. 0.5%, P < 0.001), and to have a shorter LOS (7.1 days vs. 9.8, P < 0.001).
Within the cohort group receiving pharmacologic prophylaxis (n = 6574), hospital-acquired VTE occurred in patients who were significantly younger (58.2 years vs. 62.8 years, P = 0.003) with a greater LOS (23.8 days vs. 6.7, P < 0.001) than those without. Within the group receiving no pharmacologic prophylaxis (n = 24,152), hospital-acquired VTE occurred in patients who were significantly older (57.1 years vs. 53.2 years, P = 0.014) with more than twice the LOS (20.2 days vs. 9.7 days, P < 0.001) compared to those without. Sixty-six of 75 (88%) randomly selected patients in which new VTE was identified by the automated electronic query had this diagnosis confirmed during manual chart review.
As shown in Table 2, automated calculation on a subsample of 300 randomly selected patients using APPS had a mean of 5.5 (SD, 2.9) while manual calculation of the original PPS on the same patients had a mean of 5.1 (SD, 2.6). There was no significant difference in mean between manual calculation and APPS (P = 0.073). There were, however, significant differences in how often individual criteria were considered present. The largest contributors to the difference in scores between APPS and manual calculation were “prior VTE” (positive, 16% vs. 8.3%, respectively) and “reduced mobility” (positive, 74.3% vs. 66%, respectively) as shown in Table 2. In the subsample, there were a total of 6 (2.0%) hospital-acquired VTE events. APPS’ automated calculation had an AUC = 0.79 (CI, 0.63-0.95) that was significant (P = 0.016) with a cutoff value of 5. Chart review’s manual calculation of the PPS had an AUC = 0.76 (CI 0.61-0.91) that was also significant (P = 0.029).
Distribution of Patient Characteristics in Cohort
Our entire cohort of 30,726 unique patients admitted during the study period included 260 (0.8%) who experienced hospital-acquired VTEs (Table 3). In patients receiving no pharmacologic prophylaxis, the average APPS was 4.0 (SD, 2.4) for those without VTE and 7.1 (SD, 2.3) for those with VTE. In patients who had received pharmacologic prophylaxis, those without hospital-acquired VTE had an average APPS of 4.9 (SD, 2.6) and those with hospital-acquired VTE averaged 7.7 (SD, 2.6). APPS’ ROC curves for “no pharmacologic prophylaxis” had an AUC = 0.81 (CI, 0.79 – 0.83) that was significant (P < 0.001) with a cutoff value of 5. There was similar performance in the pharmacologic prophylaxis group with an AUC = 0.79 (CI, 0.76 – 0.82) and cutoff value of 5, as shown in the Figure. Over the entire cohort, APPS had a sensitivity of 85.4%, specificity of 53.3%, positive predictive value (PPV) of 1.5%, and a negative predictive value (NPV) of 99.8% when using a cutoff of 5. The average APPS calculation time was 0.03 seconds per encounter. Additional information on individual criteria can be found in Table 3.
DISCUSSION
Automated calculation of APPS using EHR data from prior encounters and the first 4 hours of admission was predictive of in-hospital VTE. APPS performed as well as traditional manual score calculation of the PPS. It was able to do so with no physician input, significantly lessening the burden of calculation and potentially increasing frequency of data-driven VTE risk assessment.
While automated calculation of certain scores is becoming more common, risk calculators that require data beyond vital signs and lab results have lagged,16-19 in part because of uncertainty about 2 issues. The first is whether EHR data accurately represent the current clinical picture. The second is if a machine-interpretable algorithm to determine a clinical status (eg, “active cancer”) would be similar to a doctor’s perception of that same concept. We attempted to better understand these 2 challenges through developing APPS. Concerning accuracy, EHR data correctly represent the clinical scenario: designations of VTEP and hospital-acquired VTE were accurate in approximately 90% of reviewed cases. Regarding the second concern, when comparing APPS to manual calculation, we found significant differences (P < 0.001) in how often 8 of the 11 criteria were positive, yet no significant difference in overall score and similar predictive capacity. Manual calculation appeared more likely to find data in the index encounter or in structured data. For example, “active cancer” may be documented only in a physician’s note, easily accounted for during a physician’s calculation but missed by APPS looking only for structured data. In contrast, automated calculation found historic criteria, such as “prior VTE” or “known thrombophilic condition,” positive more often. If the patient is being admitted for a problem unrelated to blood clots, the physician may have little time or interest to look through hundreds of EHR documents to discover a 2-year-old VTE. As patients’ records become larger and denser, more historic data can become buried and forgotten. While the 2 scores differ on individual criteria, they are similarly predictive and able to bifurcate the at-risk population to those who should and should not receive pharmacologic prophylaxis.
The APPS was found to have near-equal performance in the pharmacologic vs. no pharmacologic prophylaxis cohorts. This finding agrees with a study that found no significant difference in predicting 90-day VTE when looking at 86 risk factors vs. the most significant 4, none of which related to prescribed prophylaxis.18 The original PPS had a reported sensitivity of 94.6%, specificity 62%, PPV 7.5%, and NPV 99.7% in its derivation cohort.13 We matched APPS to the ratio of sensitivity to specificity, using 5 as the cutoff value. APPS performed slightly worse with sensitivity of 85.4%, specificity 53.3%, PPV 1.5%, and NPV 99.8%. This difference may have resulted from the original PPS study’s use of 90-day follow-up to determine VTE occurrence, whereas we looked only until the end of current hospitalization, an average of 9.2 days. Furthermore, the PPS had significantly poorer performance (AUC = 0.62) than that seen in the original derivation cohort in a separate study that manually calculated the score on more than 1000 patients.15
There are important limitations to our study. It was done at a single academic institution using a dataset of VTE-associated, validated research that was well-known to the researchers.20 Another major limitation is the dependence of the algorithm on data available within the first 4 hours of admission and earlier; thus, previous encounters may frequently play an important role. Patients presenting to our health system for the first time would have significantly fewer data available at the time of calculation. Additionally, our data could not reliably tell us the total doses of pharmacologic prophylaxis that a patient received. While most patients will maintain a consistent VTEP regimen once initiated in the hospital, 2 patients with the same LOS may have received differing amounts of pharmacologic prophylaxis. This research study did not assess how much time automatic calculation of VTE risk might save providers, because we did not record the time for each manual abstraction; however, from discussion with the main abstracter, chart review and manual calculation for this study took from 2 to 14 minutes per patient, depending on the number of previous interactions with the health system. Finally, although we chose data elements that are likely to exist at most institutions using an EHR, many institutions’ EHRs do not have EDW capabilities nor programmers who can assist with an automated risk score.
The EHR interventions to assist providers in determining appropriate VTEP have been able to increase rates of VTEP and decrease VTE-associated mortality.16,21 In addition to automating the calculation of guideline-adherent risk scores, there is a need for wider adoption for clinical decision support for VTE. For this reason, we chose only structured data fields from some of the most common elements within our EHR’s data warehouse to derive APPS (Appendix 1). Our study supports the idea that automated calculation of scores requiring input of more complex data such as diagnoses, recent medical events, and current clinical status remains predictive of hospital-acquired VTE risk. Because it is calculated automatically in the background while the clinician completes his or her assessment, the APPS holds the potential to significantly reduce the burden on providers while making guideline-adherent risk assessment more readily accessible. Further research is required to determine the exact amount of time automatic calculation saves, and, more important, if the relatively high predictive capacity we observed using APPS would be reproducible across institutions and could reduce incidence of hospital-acquired VTE.
Disclosures
Dr. Auerbach was supported by NHLBI K24HL098372 during the period of this study. Dr. Khanna, who is an implementation scientist at the University of California San Francisco Center for Digital Health Innovation, is the principal inventor of CareWeb, and may benefit financially from its commercialization. The other authors report no financial conflicts of interest.
1. Galson S. The Surgeon General’s call to action to prevent deep vein thrombosis and pulmonary embolism. 2008. https://www.ncbi.nlm.nih.gov/books/NBK44178/. Accessed February 11, 2016. PubMed
2. Borch KH, Nyegaard C, Hansen JB, et al. Joint effects of obesity and body height on the risk of venous thromboembolism: the Tromsø study. Arterioscler Thromb Vasc Biol. 2011;31(6):1439-44. PubMed
3. Braekkan SK, Borch KH, Mathiesen EB, Njølstad I, Wilsgaard T, Hansen JB.. Body height and risk of venous thromboembolism: the Tromsø Study. Am J Epidemiol. 2010;171(10):1109-1115. PubMed
4. Bounameaux H, Rosendaal FR. Venous thromboembolism: why does ethnicity matter? Circulation. 2011;123(200:2189-2191. PubMed
5. Spyropoulos AC, Anderson FA Jr, Fitzgerald G, et al; IMPROVE Investigators. Predictive and associative models to identify hospitalized medical patients at risk for VTE. Chest. 2011;140(3):706-714. PubMed
6. Rothberg MB, Lindenauer PK, Lahti M, Pekow PS, Selker HP. Risk factor model to predict venous thromboembolism in hospitalized medical patients. J Hosp Med. 2011;6(4):202-209. PubMed
7. Perioperative Management of Antithrombotic Therapy: Prevention of VTE in Nonsurgical Patients: Antithrombotic Therapy and Prevention of Thrombosis, 9th ed: American College of Chest Physicians Evidence-Based Clinical Practice Guidelines. Chest. 2012;141(6):1645.
8. Subbe CP, Kruger M, Rutherford P, Gemmel L. Validation of a modified Early Warning Score in medical admissions. QJM. 2001;94(10):521-526. PubMed
9. Alvarez CA, Clark CA, Zhang S, et al. Predicting out of intensive care unit cardiopulmonary arrest or death using electronic medical record data. BMC Med Inform Decis Mak. 2013;13:28. PubMed
10. Escobar GJ, LaGuardia JC, Turk BJ, Ragins A, Kipnis P, Draper D. Early detection of impending physiologic deterioration among patients who are not in intensive care: development of predictive models using data from an automated electronic medical record. J Hosp Med. 2012;7(5):388-395. PubMed
11. Umscheid CA, Hanish A, Chittams J, Weiner MG, Hecht TE. Effectiveness of a novel and scalable clinical decision support intervention to improve venous thromboembolism prophylaxis: a quasi-experimental study. BMC Med Inform Decis Mak. 2012;12:92. PubMed
12. Tepas JJ 3rd, Rimar JM, Hsiao AL, Nussbaum MS. Automated analysis of electronic medical record data reflects the pathophysiology of operative complications. Surgery. 2013;154(4):918-924. PubMed
13. Barbar S, Noventa F, Rossetto V, et al. A risk assessment model for the identification of hospitalized medical patients at risk for venous thromboembolism: the Padua Prediction Score. J Thromb Haemost. 2010; 8(11):2450-2457. PubMed
14. Khanna R, Maynard G, Sadeghi B, et al. Incidence of hospital-acquired venous thromboembolic codes in medical patients hospitalized in academic medical centers. J Hosp Med. 2014; 9(4):221-225. PubMed
15. Vardi M, Ghanem-Zoubi NO, Zidan R, Yurin V, Bitterman H. Venous thromboembolism and the utility of the Padua Prediction Score in patients with sepsis admitted to internal medicine departments. J Thromb Haemost. 2013;11(3):467-473. PubMed
16. Samama MM, Dahl OE, Mismetti P, et al. An electronic tool for venous thromboembolism prevention in medical and surgical patients. Haematologica. 2006;91(1):64-70. PubMed
17. Mann DM, Kannry JL, Edonyabo D, et al. Rationale, design, and implementation protocol of an electronic health record integrated clinical prediction rule (iCPR) randomized trial in primary care. Implement Sci. 2011;6:109. PubMed
18. Woller SC, Stevens SM, Jones JP, et al. Derivation and validation of a simple model to identify venous thromboembolism risk in medical patients. Am J Med. 2011;124(10):947-954. PubMed
19. Huang W, Anderson FA, Spencer FA, Gallus A, Goldberg RJ. Risk-assessment models for predicting venous thromboembolism among hospitalized non-surgical patients: a systematic review. J Thromb Thrombolysis. 2013;35(1):67-80. PubMed
20. Khanna RR, Kim SB, Jenkins I, et al. Predictive value of the present-on-admission indicator for hospital-acquired venous thromboembolism. Med Care. 2015;53(4):e31-e36. PubMed
21. Kucher N, Koo S, Quiroz R, et al. Electronic alerts to prevent venous thromboembolism a
© 2017 Society of Hospital Medicine
Impact of a Connected Care model on 30-day readmission rates from skilled nursing facilities
Approximately 20% of hospitalized Medicare beneficiaries in the U.S. are discharged to skilled nursing facilities (SNFs) for post-acute care,1,2 and 23.5% of these patients are readmitted within 30 days.3 Because hospital readmissions are costly and associated with worse outcomes,4,5 30-day readmission rates are considered a quality indicator,6 and there are financial penalties for hospitals with higher than expected rates.7 As a result, hospitals invest substantial resources in programs to reduce readmissions.8-10 The SNFs represent an attractive target for readmission reduction efforts, since SNFs contribute a disproportionate share of readmissions.3,4 Because SNF patients are in a monitored environment with high medication adherence, risk factors for readmission likely differ between patients discharged to SNFs and those sent home. For example, 1 study showed that among heart failure patients with cognitive impairment, those discharged to SNFs had lower readmissions during the first 20 days, likely due to better medication adherence.11 Patients discharged to SNFs generally have more complex illnesses, lower functional status, and higher 1-year mortality than patients discharged to the community.12,13 Despite this, SNF patients might have infrequent contact with physicians. Federal regulations require only that patients discharged to SNFs need to be seen within 30 days and then at least once every 30 days thereafter.14 According to the 2014 Office of Inspector General report, one-third of Medicare beneficiaries in SNFs experience adverse events from substandard treatment, inadequate resident monitoring and failure or delay of necessary care, most of which are thought to be preventable.15
To address this issue, the Cleveland Clinic developed a program called “Connected Care SNF,” in which hospital-employed physicians and advanced practice professionals visit patients in selected SNFs 4 to 5 times per week, for the purpose of reducing preventable readmissions. The aim of this study was to assess whether the program reduced 30-day readmissions, and to identify which patients benefited most from the program.
METHODS
Setting and Intervention
The Cleveland Clinic main campus is a tertiary academic medical center with 1400 beds and approximately 50,000 admissions per year. In late 2012, the Cleveland Clinic implemented the Connected Care SNF program, wherein Cleveland Clinic physicians regularly visited patients who were discharged from the Cleveland Clinic main campus to 7 regional SNFs. Beginning in December 2012, these 7 high-volume referral SNFs that were not part of the Cleveland Clinic Health System (CCHS) agreed to participate in the program, which focused on reducing avoidable hospital readmissions and delivering quality care (Table 1). The Connected Care team, comprised of 2 geriatricians (1 of whom was also a palliative medicine specialist), 1 internist, 1 family physician, and 5 advanced practice professionals (nurse practitioners and physician assistants), provided medical services at the participating SNFs. These providers aimed to see patients 4 to 5 times per week, were available on site during working hours, and provided telephone coverage at nights and on weekends. All providers had access to hospital electronic medical records and could communicate with the discharging physician and with specialists familiar with the patient as needed. Prior to the admission, providers were informed about patient arrival and, at the time of admission to the SNF, providers reviewed medications and discussed goals of care with patients and their families. In the SNF, providers worked closely with staff members to deliver medications and timely treatment. They also met monthly with multidisciplinary teams for continuous quality improvement and to review outcomes. Patients at Connected Care SNFs who had their own physicians, including most long-stay and some short-stay residents, did not receive the Connected Care intervention. They constituted less than 10% of the patients discharged from Cleveland Clinic main campus.

Study Design and Population
We reviewed administrative and clinical data from a retrospective cohort of patients discharged to SNF from the Cleveland Clinic main campus from January 1, 2011 to December 31, 2014. We included all patients who were discharged to an SNF during the study period. Our main outcome measure was 30-day all-cause readmissions to any hospital in the Cleveland Clinic Health System (CCHS), including the main campus and 8 regional community hospitals. Study patients were followed until January 30, 2015 to capture 30-day readmissions. According to 2012 Medicare data, of CCHS patients who were readmitted within 30 days, 83% of pneumonia, 81% of major joint replacement, 72% of heart failure and 57% of acute myocardial infarction patients were readmitted to a CCHS facility. As the Cleveland Clinic main campus attracts cardiac patients from a 100+-mile radius, they may be more likely to seek care readmission near home and are not reflective of CCHS patients overall. Because we did not have access to readmissions data from non-CCHS hospitals, we excluded patients who were discharged to SNFs beyond a 25-mile radius from the main campus, where they may be more likely to utilize non-CCHS hospitals for acute hospitalization. We also excluded patients discharged to non-CCHS hospital-based SNFs, which may refer readmissions to their own hospital system. Because the Connected Care program began in December 2012, the years 2011-2012 served as the baseline period. The intervention was conducted at 7 SNFs. All other SNFs within the 25-mile radius were included as controls, except for 3 hospital-based SNFs that would be unlikely to admit patients to CCHS. We compared the change in all-cause 30-day readmission rates after implementation of Connected Care, using all patients discharged to SNFs within 25 miles to control for temporal changes in local readmission rates. Discharge to specific SNFs was determined solely by patient choice.
Data Collection
For each patient, we collected the following data that has been shown to be associated with readmissions:16-18 demographics (age, race, sex, ZIP code), lab values on discharge (hemoglobin and sodium); hemodialysis status; medicine or surgical service; elective surgery or nonelective surgery; details of the index admission index (diagnosis-related group [DRG], Medicare severity-diagnosis-related groups [MS-DRG] weight, primary diagnosis code; principal procedure code; admission date; discharge date, length of stay, and post-acute care provider); and common comorbidities, as listed in Table 2. We also calculated each patient’s HOSPITAL19,20 score. The HOSPITAL score was developed to predict risk of preventable 30-day readmissions,19 but it has also been validated to predict 30-day all-cause readmission rates for patients discharged to SNF.21 The model contains 7 elements (hemoglobin, oncology service, sodium, procedure, index type, admissions within the last year, length of stay) (supplemental Table).Patients with a high score (7 or higher) have a 41% chance of readmission, while those with a low score (4 or lower) have only a 15% chance. 21 We assessed all cause 30-day readmission status from CCHS administrative data. Observation patients and outpatient same-day surgeries were not considered to be admissions. For patients with multiple admissions, each admission was counted as a separate index hospitalization. Cleveland Clinic’s Institutional Review Board approved the study.

Statistical Analysis
For the 7 intervention SNFs, patient characteristics were summarized as means and standard deviations or frequencies and percentages for the periods of 2011-2012 and 2013-2014, respectively, and the 2 periods were compared using the Student t test or χ2 test as appropriate.
Mixed-effects logistic regression models were used to model 30-day readmission rates. Since the intervention was implemented in the last quarter of 2012, we examined the difference in readmission rates before and after that time point. The model included the following fixed effects: SNF type (intervention or usual care), time points (quarters of 2011-2014), whether the time is pre- or postintervention (binary), and the 3-way interaction between SNF type, pre- or postintervention and time points, and patient characteristics. The model also contained a Gaussian random effect at the SNF level to account for possible correlations among the outcomes of patients from the same SNF. For each quarter, the mean adjusted readmission rates of 2 types of SNFs were calculated from the fitted mixed models and plotted over time. Furthermore, we compared the mean readmission rates of the 2 groups in the pre- and postintervention periods. Subgroup analyses were performed for medical and surgical patients, and for patients in the low, intermediate and high HOSPITAL score groups.
All analyses were performed using RStudio (Boston, Massachusetts). Statistical significance was established with 2-sided P values less than 0.05.
RESULTS
We identified 119 SNFs within a 25-mile radius of the hospital. Of these, 6 did not receive any referrals. Three non-CCHS hospital-based SNFs were excluded, leaving a total of 110 SNFs in the study sample: 7 intervention SNFs and 103 usual-care SNFs. Between January 2011 and December 2014, there were 23,408 SNF discharges from Cleveland Clinic main campus, including 13,544 who were discharged to study SNFs (Supplemental Figure). Of these, 3334 were discharged to 7 intervention SNFs and 10,210 were discharged to usual care SNFs. Characteristics of patients in both periods appear in Table 2. At baseline, patients in the intervention and control SNFs varied in a number of ways. Patients at intervention SNFs were older (75.6 vs. 70.2 years; P < 0.001), more likely to be African American (45.5% vs. 35.9%; P < 0.001), female (61% vs. 55.4%; P < 0.001) and to be insured by Medicare (85.2% vs. 71.4%; P < 0.001). Both groups had similar proportions of patients with high, intermediate, and low readmission risk as measured by HOSPITAL score. Compared to the 2011-2012 pre-intervention period, during the 2013-2014 intervention period, there were more surgeries (34.3% vs. 41.9%; P < 0.001), more elective surgeries (21.8% vs. 25.5%; P = 0.01), fewer medical patients (65.7% vs. 58.1%; P < 0.001), and an increase in comorbidities, including myocardial infarction, peripheral vascular disease, and liver disease (Table 2).

Table 3 shows adjusted 30-day readmissions rates, before and during the intervention period at the intervention and usual care SNFs. Compared to the pre-intervention period, 30-day all-cause adjusted readmission rates declined in the intervention SNFs (28.1% to 21.7%, P < 0.001), while it increased slightly at control sites (27.1% to 28.5%, P < 0.001). The Figure shows the adjusted 30-day readmission rates by quarter throughout the study period.

Declines in 30-day readmission rates were greater for medical patients (31.0% to 24.6%, P < 0.001) than surgical patients (22.4% to 17.7%, P < 0.001). Patients with high HOSPITAL scores had the greatest decline, while those with low HOSPITAL scores had smaller declines.
DISCUSSION
In this retrospective study of 4 years of discharges to 110 SNFs, we report on the impact of a Connected Care program, in which a physician visited patients on admission to the SNF and 4 to 5 times per week during their stay. Introduction of the program was followed by a 6.8% absolute reduction in all-cause 30-day readmission rates compared to usual care. The absolute reductions ranged from 4.6% for patients at low risk for readmission to 9.1% for patients at high risk, and medical patients benefited more than surgical patients.
Most studies of interventions to reduce hospital readmissions have focused on patients discharged to the community setting.7-9 Interventions have centered on discharge planning, medication reconciliation, and close follow-up to assess for medication adherence and early signs of deterioration. Because patients in SNFs have their medications administered by staff and are under frequent surveillance, such interventions are unlikely to be helpful in this population. We found no studies that focus on short-stay or skilled patients discharged to SNF. Two studies have demonstrated that interventions can reduce hospitalization from nursing homes.22,23 Neither study included readmissions. The Evercare model consisted of nurse practitioners providing active primary care services within the nursing home, as well as offering incentive payments to nursing homes for not hospitalizing patients.22 During a 2-year period, long term residents who enrolled in Evercare had an almost 50% reduction in incident hospitalizations compared to those who did not.22 INTERACT II was a quality improvement intervention that provided tools, education, and strategies to help identify and manage acute conditions proactively.23 In 25 nursing homes employing INTERACT II, there was a 17% reduction in self-reported hospital admissions during the 6-month project, with higher rates of reduction among nursing homes rated as more engaged in the process.23 Although nursing homes may serve some short-stay or skilled patients, they generally serve long-term populations, and studies have shown that short-stay patients are at higher risk for 30-day readmissions.24
There are a number of reasons that short-term SNF patients are at higher risk for readmission. Although prior to admission, they were considered hospital level of care and received a physician visit daily, on transfer to the SNF, relatively little medical care is available. Current federal regulations regarding physician services at a SNF require the resident to be seen by a physician at least once every 30 days for the first 90 days after admission, and at least once every 60 days thereafter.25
The Connected Care program physicians provided a smooth transition of care from hospital to SNF as well as frequent reassessment. Physicians were alerted prior to hospital discharge and performed an initial comprehensive visit generally on the day of admission to the SNF and always within 48 hours. The initial evaluation is important because miscommunication during the handoff from hospital to SNF may result in incorrect medication regimens or inaccurate assessments. By performing prompt medication reconciliation and periodic reassessments of a patient’s medical condition, the Connected Care providers recreate some of the essential elements of successful outpatient readmissions prevention programs.
They also worked together with each SNF’s interdisciplinary team to deliver quality care. There were monthly meetings at each participating Connected Care SNF. Physicians reviewed monthly 30-day readmissions and performed root-cause analysis. When they discovered challenges to timely medication and treatment delivery during daily rounds, they provided in-services to SNF nurses.
In addition, Connected Care providers discussed goals of care—something that is often overlooked on admission to a SNF. This is particularly important because patients with chronic illnesses who are discharged to SNF often have poor prognoses. For example, Medicare patients with heart failure who are discharged to SNFs have 1-year mortality in excess of 50%.13 By implementing a plan of care consistent with patient and family goals, inappropriate readmissions for terminal patients may be avoided.
Reducing readmissions is important for hospitals because under the Hospital Readmissions Reduction Program, hospitals now face substantial penalties for higher than expected readmissions rates. Hospitals involved in bundled payments or other total cost-of-care arrangements have additional incentive to avoid readmissions. Beginning in 2019, SNFs will also receive incentive payments based on their 30-day all-cause hospital readmissions as part of the Skilled Nursing Facility Value-Based Purchasing program.25 The Connected Care model offers 1 means of achieving this goal through partnership between hospitals and SNFs.
Our study has several limitations. First, our study was observational in nature, so the observed reduction in readmissions could have been due to temporal trends unrelated to the intervention. However, no significant reduction was noted during the same time period in other area SNFs. There was also little change in the characteristics of patients admitted to the intervention SNFs. Importantly, the HOSPITAL score, which can predict 30-day readmission rates,20 did not change throughout the study period. Second, the results reflect patients discharged from a single hospital and may not be generalizable to other geographic areas. However, because the program included 7 SNFs, we believe it could be reproduced in other settings. Third, our readmissions measure included only those patients who returned to a CCHS facility. Although we may have missed some readmissions to other hospital systems, such leakage is uncommon—more than 80% of CCHS patients are readmitted to CCHS facilities—and would be unlikely to differ across the short duration of the study. Finally, at the intervention SNFs, most long-stay and some short-stay residents did not receive the Connected Care intervention because they were cared for by their own physicians who did not participate in Connected Care. Had these patients’ readmissions been excluded from our results, the intervention might appear even more effective.
CONCLUSION
A Connected Care intervention reduced 30-day readmission rates among patients discharged to SNFs from a tertiary academic center. While all subgroups had substantial reductions in readmissions following the implementation of the intervention, patients who are at the highest risk of readmission benefited the most. Further study is necessary to know whether Connected Care can be reproduced in other health care systems and whether it reduces overall costs.
Acknowledgments
The authors would like to thank Michael Felver, MD, and teams for their clinical care of patients; Michael Felver, MD, William Zafirau, MD, Dan Blechschmid, MHA, and Kathy Brezine, and Seth Vilensky, MBA, for their administrative support; and Brad Souder, MPT, for assistance with data collection.
Disclosure
Nothing to report.
1. Medicare Payment Advisory Commission. Report to the Congress: Medicare Payment Policy. Chapter 8. Skilled Nursing Facility Services. March 2013. http://www.medpac.gov/docs/default-source/reports/mar13_entirereport.pdf?sfvrsn=0. Accessed March 1, 2017.
2. Kim DG, Messinger-Rapport BJ. Clarion call for a dedicated clinical and research approach to post-acute care. J Am Med Dir Assoc. 2014;15(8):607. e1-e3. PubMed
3. Mor V, Intrator O, Feng Z, Grabowski D. The revolving door of rehospitalization from skilled nursing facilities. Health Aff. 2010;29(1):57-64. PubMed
4. Jencks SF, Williams MV, Coleman EA. Rehospitalizations among patients in the Medicare fee-for-service program. N Engl J Med. 2009;360(14):1418-1428. PubMed
5. Creditor MC. Hazards of hospitalization of the elderly. Ann Intern Med 1993;118(3):219-223. PubMed
6. Van Walraven C, Bennett C, Jennings A, Austin PC, Forester AJ. Proportion of hospital readmissions deemed avoidable: a systematic review. CMAJ. 2011;183(7):E391-E402. PubMed
7. Brenson RA, Paulus RA, Kalman NS. Medicare’s readmissions-reduction program – a positive alternative. N Engl J Med 2012;366(15):1364-1366. PubMed
8. Jack BW, Chetty VK, Anthony D, et al. A reengineered hospital discharge program to decrease rehospitalization: a randomized trial. Ann Intern Med. 2009;150(3):178-187. PubMed
9. Naylor MD, Brooten D, Campbell R, et al. Comprehensive discharge planning and home follow-up of hospitalized elders: a randomized clinical trial. JAMA. 1999;281(7):613-620. PubMed
10. Coleman EA, Parry C, Chalmers S, Min SJ. The care transition intervention: results of a randomized controlled trial. Arch Intern Med. 2006;166(17):1822-1828. PubMed
11. Patel A, Parikh R, Howell EH, Hsich E, Landers SH, Gorodeski EZ. Mini-cog performance: novel marker of post discharge risk among patients hospitalized for heart failure. Circ Heart Fail. 2015;8(1):8-16. PubMed
12. Walter LC, Brand RJ, Counsell SR, et al. Development and validation of a prognostic index for 1-year mortality in older adults after hospitalization. JAMA. 2001;285(23):2987-2994. PubMed
13. Allen LA, Hernandez AF, Peterson ED, et al. Discharge to a skilled nursing facility and subsequent clinical outcomes among older patients hospitalized for heart failure. Circ Heart Fail. 2011;4(3):293-300. PubMed
14. 42 CFR 483.40 – Physician services. US government Publishing Office. https://www.gpo.gov/fdsys/granule/CFR-2011-title42-vol5/CFR-2011-title42-vol5-sec483-40. Published October 1, 2011. Accessed August 31, 2016.
15. Office of Inspector General. Adverse Events in Skilled Nursing Facilities: National Incidence among Medicare Beneficiaries. OEI-06-11-00370. February 2014. http://oig.hhs.gov/oei/reports/oei-06-11-00370.pdf. Accessed March 22, 2016.
16. Hasan O, Meltzer DO, Shaykevich SA, et al. Hospital readmission in general medicine patients: a prediction model. J Gen Intern Med. 2010;25(3):211-219. PubMed
17. Boult C, Dowd B, McCaffrey D, Boult L, Hernandez R, Krulewitch H. Screening elders for risk of hospital admission. J Am Geriatr Soc. 1993;41(8):811-817. PubMed
18. Silverstein MD, Qin H, Mercer SQ, Fong J, Haydar Z. Risk factors for 30-day hospital readmission in patients ≥65 years of age. Proc (Bayl Univ Med Cent). 2008;21(4):363-372. PubMed
19. Donzé J, Aujesky D, Williams D, Schnipper JL. Potentially avoidable 30-day hospital readmissions in medical patients: derivation and validation of a prediction model. JAMA Intern Med. 2013;173(8):632-638. PubMed
20. Donzé JD, Williams MV, Robinson EJ, et al. International validity of the HOSPITAL score to predict 30-day potentially avoidable hospital readmissions. JAMA Intern Med. 2016;176(4):496-502. PubMed
21. Kim LD, Kou L, Messinger-Rapport BJ, Rothberg MB. Validation of the HOSPITAL score for 30-day all-cause readmissions of patients discharged to skilled nursing facilities. J Am Med Dir Assoc. 2016;17(9):e15-e18. PubMed
22. Kane RL, Keckhafer G, Flood S, Bershardsky B, Siadaty MS. The effect of Evercare on hospital use. J Am Geriatr Soc. 2003;51(10):1427-1434. PubMed
23. Ouslander JG, Lamb G, Tappen R, et al. Interventions to reduce hospitalizations from nursing homes: Evaluation of the INTERACT II collaboration quality improvement project. J Am Geriatr Soc. 2011;59(4):745-753. PubMed
24. Cost drivers for dually eligible beneficiaries: Potentially avoidable hospitalizations from nursing facility, skilled nursing facility, and home and community based service waiver programs. http://www.cms.gov/Research-Statistics-Data-and-Systems/Statistics-Trends-and-Reports/Reports/downloads/costdriverstask2.pdf. Accessed August 31, 2016.
25. H.R. 4302 (113th), Section 215, Protecting Access to Medicare Act of 2014 (PAMA). April 2, 2014. https://www.govtrack.us/congress/bills/113/hr4302/text. Accessed August 31, 2016.
Approximately 20% of hospitalized Medicare beneficiaries in the U.S. are discharged to skilled nursing facilities (SNFs) for post-acute care,1,2 and 23.5% of these patients are readmitted within 30 days.3 Because hospital readmissions are costly and associated with worse outcomes,4,5 30-day readmission rates are considered a quality indicator,6 and there are financial penalties for hospitals with higher than expected rates.7 As a result, hospitals invest substantial resources in programs to reduce readmissions.8-10 The SNFs represent an attractive target for readmission reduction efforts, since SNFs contribute a disproportionate share of readmissions.3,4 Because SNF patients are in a monitored environment with high medication adherence, risk factors for readmission likely differ between patients discharged to SNFs and those sent home. For example, 1 study showed that among heart failure patients with cognitive impairment, those discharged to SNFs had lower readmissions during the first 20 days, likely due to better medication adherence.11 Patients discharged to SNFs generally have more complex illnesses, lower functional status, and higher 1-year mortality than patients discharged to the community.12,13 Despite this, SNF patients might have infrequent contact with physicians. Federal regulations require only that patients discharged to SNFs need to be seen within 30 days and then at least once every 30 days thereafter.14 According to the 2014 Office of Inspector General report, one-third of Medicare beneficiaries in SNFs experience adverse events from substandard treatment, inadequate resident monitoring and failure or delay of necessary care, most of which are thought to be preventable.15
To address this issue, the Cleveland Clinic developed a program called “Connected Care SNF,” in which hospital-employed physicians and advanced practice professionals visit patients in selected SNFs 4 to 5 times per week, for the purpose of reducing preventable readmissions. The aim of this study was to assess whether the program reduced 30-day readmissions, and to identify which patients benefited most from the program.
METHODS
Setting and Intervention
The Cleveland Clinic main campus is a tertiary academic medical center with 1400 beds and approximately 50,000 admissions per year. In late 2012, the Cleveland Clinic implemented the Connected Care SNF program, wherein Cleveland Clinic physicians regularly visited patients who were discharged from the Cleveland Clinic main campus to 7 regional SNFs. Beginning in December 2012, these 7 high-volume referral SNFs that were not part of the Cleveland Clinic Health System (CCHS) agreed to participate in the program, which focused on reducing avoidable hospital readmissions and delivering quality care (Table 1). The Connected Care team, comprised of 2 geriatricians (1 of whom was also a palliative medicine specialist), 1 internist, 1 family physician, and 5 advanced practice professionals (nurse practitioners and physician assistants), provided medical services at the participating SNFs. These providers aimed to see patients 4 to 5 times per week, were available on site during working hours, and provided telephone coverage at nights and on weekends. All providers had access to hospital electronic medical records and could communicate with the discharging physician and with specialists familiar with the patient as needed. Prior to the admission, providers were informed about patient arrival and, at the time of admission to the SNF, providers reviewed medications and discussed goals of care with patients and their families. In the SNF, providers worked closely with staff members to deliver medications and timely treatment. They also met monthly with multidisciplinary teams for continuous quality improvement and to review outcomes. Patients at Connected Care SNFs who had their own physicians, including most long-stay and some short-stay residents, did not receive the Connected Care intervention. They constituted less than 10% of the patients discharged from Cleveland Clinic main campus.
Study Design and Population
We reviewed administrative and clinical data from a retrospective cohort of patients discharged to SNF from the Cleveland Clinic main campus from January 1, 2011 to December 31, 2014. We included all patients who were discharged to an SNF during the study period. Our main outcome measure was 30-day all-cause readmissions to any hospital in the Cleveland Clinic Health System (CCHS), including the main campus and 8 regional community hospitals. Study patients were followed until January 30, 2015 to capture 30-day readmissions. According to 2012 Medicare data, of CCHS patients who were readmitted within 30 days, 83% of pneumonia, 81% of major joint replacement, 72% of heart failure and 57% of acute myocardial infarction patients were readmitted to a CCHS facility. As the Cleveland Clinic main campus attracts cardiac patients from a 100+-mile radius, they may be more likely to seek care readmission near home and are not reflective of CCHS patients overall. Because we did not have access to readmissions data from non-CCHS hospitals, we excluded patients who were discharged to SNFs beyond a 25-mile radius from the main campus, where they may be more likely to utilize non-CCHS hospitals for acute hospitalization. We also excluded patients discharged to non-CCHS hospital-based SNFs, which may refer readmissions to their own hospital system. Because the Connected Care program began in December 2012, the years 2011-2012 served as the baseline period. The intervention was conducted at 7 SNFs. All other SNFs within the 25-mile radius were included as controls, except for 3 hospital-based SNFs that would be unlikely to admit patients to CCHS. We compared the change in all-cause 30-day readmission rates after implementation of Connected Care, using all patients discharged to SNFs within 25 miles to control for temporal changes in local readmission rates. Discharge to specific SNFs was determined solely by patient choice.
Data Collection
For each patient, we collected the following data that has been shown to be associated with readmissions:16-18 demographics (age, race, sex, ZIP code), lab values on discharge (hemoglobin and sodium); hemodialysis status; medicine or surgical service; elective surgery or nonelective surgery; details of the index admission index (diagnosis-related group [DRG], Medicare severity-diagnosis-related groups [MS-DRG] weight, primary diagnosis code; principal procedure code; admission date; discharge date, length of stay, and post-acute care provider); and common comorbidities, as listed in Table 2. We also calculated each patient’s HOSPITAL19,20 score. The HOSPITAL score was developed to predict risk of preventable 30-day readmissions,19 but it has also been validated to predict 30-day all-cause readmission rates for patients discharged to SNF.21 The model contains 7 elements (hemoglobin, oncology service, sodium, procedure, index type, admissions within the last year, length of stay) (supplemental Table).Patients with a high score (7 or higher) have a 41% chance of readmission, while those with a low score (4 or lower) have only a 15% chance. 21 We assessed all cause 30-day readmission status from CCHS administrative data. Observation patients and outpatient same-day surgeries were not considered to be admissions. For patients with multiple admissions, each admission was counted as a separate index hospitalization. Cleveland Clinic’s Institutional Review Board approved the study.
Statistical Analysis
For the 7 intervention SNFs, patient characteristics were summarized as means and standard deviations or frequencies and percentages for the periods of 2011-2012 and 2013-2014, respectively, and the 2 periods were compared using the Student t test or χ2 test as appropriate.
Mixed-effects logistic regression models were used to model 30-day readmission rates. Since the intervention was implemented in the last quarter of 2012, we examined the difference in readmission rates before and after that time point. The model included the following fixed effects: SNF type (intervention or usual care), time points (quarters of 2011-2014), whether the time is pre- or postintervention (binary), and the 3-way interaction between SNF type, pre- or postintervention and time points, and patient characteristics. The model also contained a Gaussian random effect at the SNF level to account for possible correlations among the outcomes of patients from the same SNF. For each quarter, the mean adjusted readmission rates of 2 types of SNFs were calculated from the fitted mixed models and plotted over time. Furthermore, we compared the mean readmission rates of the 2 groups in the pre- and postintervention periods. Subgroup analyses were performed for medical and surgical patients, and for patients in the low, intermediate and high HOSPITAL score groups.
All analyses were performed using RStudio (Boston, Massachusetts). Statistical significance was established with 2-sided P values less than 0.05.
RESULTS
We identified 119 SNFs within a 25-mile radius of the hospital. Of these, 6 did not receive any referrals. Three non-CCHS hospital-based SNFs were excluded, leaving a total of 110 SNFs in the study sample: 7 intervention SNFs and 103 usual-care SNFs. Between January 2011 and December 2014, there were 23,408 SNF discharges from Cleveland Clinic main campus, including 13,544 who were discharged to study SNFs (Supplemental Figure). Of these, 3334 were discharged to 7 intervention SNFs and 10,210 were discharged to usual care SNFs. Characteristics of patients in both periods appear in Table 2. At baseline, patients in the intervention and control SNFs varied in a number of ways. Patients at intervention SNFs were older (75.6 vs. 70.2 years; P < 0.001), more likely to be African American (45.5% vs. 35.9%; P < 0.001), female (61% vs. 55.4%; P < 0.001) and to be insured by Medicare (85.2% vs. 71.4%; P < 0.001). Both groups had similar proportions of patients with high, intermediate, and low readmission risk as measured by HOSPITAL score. Compared to the 2011-2012 pre-intervention period, during the 2013-2014 intervention period, there were more surgeries (34.3% vs. 41.9%; P < 0.001), more elective surgeries (21.8% vs. 25.5%; P = 0.01), fewer medical patients (65.7% vs. 58.1%; P < 0.001), and an increase in comorbidities, including myocardial infarction, peripheral vascular disease, and liver disease (Table 2).
Table 3 shows adjusted 30-day readmissions rates, before and during the intervention period at the intervention and usual care SNFs. Compared to the pre-intervention period, 30-day all-cause adjusted readmission rates declined in the intervention SNFs (28.1% to 21.7%, P < 0.001), while it increased slightly at control sites (27.1% to 28.5%, P < 0.001). The Figure shows the adjusted 30-day readmission rates by quarter throughout the study period.
Declines in 30-day readmission rates were greater for medical patients (31.0% to 24.6%, P < 0.001) than surgical patients (22.4% to 17.7%, P < 0.001). Patients with high HOSPITAL scores had the greatest decline, while those with low HOSPITAL scores had smaller declines.
DISCUSSION
In this retrospective study of 4 years of discharges to 110 SNFs, we report on the impact of a Connected Care program, in which a physician visited patients on admission to the SNF and 4 to 5 times per week during their stay. Introduction of the program was followed by a 6.8% absolute reduction in all-cause 30-day readmission rates compared to usual care. The absolute reductions ranged from 4.6% for patients at low risk for readmission to 9.1% for patients at high risk, and medical patients benefited more than surgical patients.
Most studies of interventions to reduce hospital readmissions have focused on patients discharged to the community setting.7-9 Interventions have centered on discharge planning, medication reconciliation, and close follow-up to assess for medication adherence and early signs of deterioration. Because patients in SNFs have their medications administered by staff and are under frequent surveillance, such interventions are unlikely to be helpful in this population. We found no studies that focus on short-stay or skilled patients discharged to SNF. Two studies have demonstrated that interventions can reduce hospitalization from nursing homes.22,23 Neither study included readmissions. The Evercare model consisted of nurse practitioners providing active primary care services within the nursing home, as well as offering incentive payments to nursing homes for not hospitalizing patients.22 During a 2-year period, long term residents who enrolled in Evercare had an almost 50% reduction in incident hospitalizations compared to those who did not.22 INTERACT II was a quality improvement intervention that provided tools, education, and strategies to help identify and manage acute conditions proactively.23 In 25 nursing homes employing INTERACT II, there was a 17% reduction in self-reported hospital admissions during the 6-month project, with higher rates of reduction among nursing homes rated as more engaged in the process.23 Although nursing homes may serve some short-stay or skilled patients, they generally serve long-term populations, and studies have shown that short-stay patients are at higher risk for 30-day readmissions.24
There are a number of reasons that short-term SNF patients are at higher risk for readmission. Although prior to admission, they were considered hospital level of care and received a physician visit daily, on transfer to the SNF, relatively little medical care is available. Current federal regulations regarding physician services at a SNF require the resident to be seen by a physician at least once every 30 days for the first 90 days after admission, and at least once every 60 days thereafter.25
The Connected Care program physicians provided a smooth transition of care from hospital to SNF as well as frequent reassessment. Physicians were alerted prior to hospital discharge and performed an initial comprehensive visit generally on the day of admission to the SNF and always within 48 hours. The initial evaluation is important because miscommunication during the handoff from hospital to SNF may result in incorrect medication regimens or inaccurate assessments. By performing prompt medication reconciliation and periodic reassessments of a patient’s medical condition, the Connected Care providers recreate some of the essential elements of successful outpatient readmissions prevention programs.
They also worked together with each SNF’s interdisciplinary team to deliver quality care. There were monthly meetings at each participating Connected Care SNF. Physicians reviewed monthly 30-day readmissions and performed root-cause analysis. When they discovered challenges to timely medication and treatment delivery during daily rounds, they provided in-services to SNF nurses.
In addition, Connected Care providers discussed goals of care—something that is often overlooked on admission to a SNF. This is particularly important because patients with chronic illnesses who are discharged to SNF often have poor prognoses. For example, Medicare patients with heart failure who are discharged to SNFs have 1-year mortality in excess of 50%.13 By implementing a plan of care consistent with patient and family goals, inappropriate readmissions for terminal patients may be avoided.
Reducing readmissions is important for hospitals because under the Hospital Readmissions Reduction Program, hospitals now face substantial penalties for higher than expected readmissions rates. Hospitals involved in bundled payments or other total cost-of-care arrangements have additional incentive to avoid readmissions. Beginning in 2019, SNFs will also receive incentive payments based on their 30-day all-cause hospital readmissions as part of the Skilled Nursing Facility Value-Based Purchasing program.25 The Connected Care model offers 1 means of achieving this goal through partnership between hospitals and SNFs.
Our study has several limitations. First, our study was observational in nature, so the observed reduction in readmissions could have been due to temporal trends unrelated to the intervention. However, no significant reduction was noted during the same time period in other area SNFs. There was also little change in the characteristics of patients admitted to the intervention SNFs. Importantly, the HOSPITAL score, which can predict 30-day readmission rates,20 did not change throughout the study period. Second, the results reflect patients discharged from a single hospital and may not be generalizable to other geographic areas. However, because the program included 7 SNFs, we believe it could be reproduced in other settings. Third, our readmissions measure included only those patients who returned to a CCHS facility. Although we may have missed some readmissions to other hospital systems, such leakage is uncommon—more than 80% of CCHS patients are readmitted to CCHS facilities—and would be unlikely to differ across the short duration of the study. Finally, at the intervention SNFs, most long-stay and some short-stay residents did not receive the Connected Care intervention because they were cared for by their own physicians who did not participate in Connected Care. Had these patients’ readmissions been excluded from our results, the intervention might appear even more effective.
CONCLUSION
A Connected Care intervention reduced 30-day readmission rates among patients discharged to SNFs from a tertiary academic center. While all subgroups had substantial reductions in readmissions following the implementation of the intervention, patients who are at the highest risk of readmission benefited the most. Further study is necessary to know whether Connected Care can be reproduced in other health care systems and whether it reduces overall costs.
Acknowledgments
The authors would like to thank Michael Felver, MD, and teams for their clinical care of patients; Michael Felver, MD, William Zafirau, MD, Dan Blechschmid, MHA, and Kathy Brezine, and Seth Vilensky, MBA, for their administrative support; and Brad Souder, MPT, for assistance with data collection.
Disclosure
Nothing to report.
1. Medicare Payment Advisory Commission. Report to the Congress: Medicare Payment Policy. Chapter 8. Skilled Nursing Facility Services. March 2013. http://www.medpac.gov/docs/default-source/reports/mar13_entirereport.pdf?sfvrsn=0. Accessed March 1, 2017.
2. Kim DG, Messinger-Rapport BJ. Clarion call for a dedicated clinical and research approach to post-acute care. J Am Med Dir Assoc. 2014;15(8):607. e1-e3. PubMed
3. Mor V, Intrator O, Feng Z, Grabowski D. The revolving door of rehospitalization from skilled nursing facilities. Health Aff. 2010;29(1):57-64. PubMed
4. Jencks SF, Williams MV, Coleman EA. Rehospitalizations among patients in the Medicare fee-for-service program. N Engl J Med. 2009;360(14):1418-1428. PubMed
5. Creditor MC. Hazards of hospitalization of the elderly. Ann Intern Med 1993;118(3):219-223. PubMed
6. Van Walraven C, Bennett C, Jennings A, Austin PC, Forester AJ. Proportion of hospital readmissions deemed avoidable: a systematic review. CMAJ. 2011;183(7):E391-E402. PubMed
7. Brenson RA, Paulus RA, Kalman NS. Medicare’s readmissions-reduction program – a positive alternative. N Engl J Med 2012;366(15):1364-1366. PubMed
8. Jack BW, Chetty VK, Anthony D, et al. A reengineered hospital discharge program to decrease rehospitalization: a randomized trial. Ann Intern Med. 2009;150(3):178-187. PubMed
9. Naylor MD, Brooten D, Campbell R, et al. Comprehensive discharge planning and home follow-up of hospitalized elders: a randomized clinical trial. JAMA. 1999;281(7):613-620. PubMed
10. Coleman EA, Parry C, Chalmers S, Min SJ. The care transition intervention: results of a randomized controlled trial. Arch Intern Med. 2006;166(17):1822-1828. PubMed
11. Patel A, Parikh R, Howell EH, Hsich E, Landers SH, Gorodeski EZ. Mini-cog performance: novel marker of post discharge risk among patients hospitalized for heart failure. Circ Heart Fail. 2015;8(1):8-16. PubMed
12. Walter LC, Brand RJ, Counsell SR, et al. Development and validation of a prognostic index for 1-year mortality in older adults after hospitalization. JAMA. 2001;285(23):2987-2994. PubMed
13. Allen LA, Hernandez AF, Peterson ED, et al. Discharge to a skilled nursing facility and subsequent clinical outcomes among older patients hospitalized for heart failure. Circ Heart Fail. 2011;4(3):293-300. PubMed
14. 42 CFR 483.40 – Physician services. US government Publishing Office. https://www.gpo.gov/fdsys/granule/CFR-2011-title42-vol5/CFR-2011-title42-vol5-sec483-40. Published October 1, 2011. Accessed August 31, 2016.
15. Office of Inspector General. Adverse Events in Skilled Nursing Facilities: National Incidence among Medicare Beneficiaries. OEI-06-11-00370. February 2014. http://oig.hhs.gov/oei/reports/oei-06-11-00370.pdf. Accessed March 22, 2016.
16. Hasan O, Meltzer DO, Shaykevich SA, et al. Hospital readmission in general medicine patients: a prediction model. J Gen Intern Med. 2010;25(3):211-219. PubMed
17. Boult C, Dowd B, McCaffrey D, Boult L, Hernandez R, Krulewitch H. Screening elders for risk of hospital admission. J Am Geriatr Soc. 1993;41(8):811-817. PubMed
18. Silverstein MD, Qin H, Mercer SQ, Fong J, Haydar Z. Risk factors for 30-day hospital readmission in patients ≥65 years of age. Proc (Bayl Univ Med Cent). 2008;21(4):363-372. PubMed
19. Donzé J, Aujesky D, Williams D, Schnipper JL. Potentially avoidable 30-day hospital readmissions in medical patients: derivation and validation of a prediction model. JAMA Intern Med. 2013;173(8):632-638. PubMed
20. Donzé JD, Williams MV, Robinson EJ, et al. International validity of the HOSPITAL score to predict 30-day potentially avoidable hospital readmissions. JAMA Intern Med. 2016;176(4):496-502. PubMed
21. Kim LD, Kou L, Messinger-Rapport BJ, Rothberg MB. Validation of the HOSPITAL score for 30-day all-cause readmissions of patients discharged to skilled nursing facilities. J Am Med Dir Assoc. 2016;17(9):e15-e18. PubMed
22. Kane RL, Keckhafer G, Flood S, Bershardsky B, Siadaty MS. The effect of Evercare on hospital use. J Am Geriatr Soc. 2003;51(10):1427-1434. PubMed
23. Ouslander JG, Lamb G, Tappen R, et al. Interventions to reduce hospitalizations from nursing homes: Evaluation of the INTERACT II collaboration quality improvement project. J Am Geriatr Soc. 2011;59(4):745-753. PubMed
24. Cost drivers for dually eligible beneficiaries: Potentially avoidable hospitalizations from nursing facility, skilled nursing facility, and home and community based service waiver programs. http://www.cms.gov/Research-Statistics-Data-and-Systems/Statistics-Trends-and-Reports/Reports/downloads/costdriverstask2.pdf. Accessed August 31, 2016.
25. H.R. 4302 (113th), Section 215, Protecting Access to Medicare Act of 2014 (PAMA). April 2, 2014. https://www.govtrack.us/congress/bills/113/hr4302/text. Accessed August 31, 2016.
© 2017 Society of Hospital Medicine
Prognosticating with the hospitalized-patient one-year mortality risk score using information abstracted from the medical record
A patient’s prognosis can strongly influence their medical care. Decisions about diagnostic modalities, treatment options, and the use of preventive therapies can all be affected by the likelihood of a patient’s death in the near future. For example, patients with severely limited survival might forego prophylactic therapy, avoid interventions for asymptomatic issues, and cease screening interventions. Knowing survival probability would also be very helpful as a controlling variable in research analyses whenever death risk might be a possible confounder.
Sixteen indices that aim to predict patient death risk have been described by Yourman et al.1 They were all created from secondary analyses of clinical and administrative datasets, were applicable to patients in a variety of settings (including the community, nursing home, or hospital), and predicted survival probabilities in time horizons ranging from 6 months to 5 years. Prognostic factors that were most commonly included in these indices were comorbidity and functional status. In validation populations, the discrimination of these indices for 1-year survival in hospitalized patients was moderate (with C statistics that ranged from 0.64 to 0.79) with good calibration for broad prognostic ranges.
In 2014, we published the Hospitalized-patient One-year Mortality Risk (HOMR) score.2 This study used health administrative data for all adult Ontarians admitted in 2011 to hospital under nonpsychiatric services (n = 640,022) to estimate the probability of dying within 1 year of admission to hospital (which happened in 11.7% of people). The HOMR score included 12 patient and hospitalization factors (Table 1). It was highly discriminative (C statistic, 0.923; [0.922-0.924]) and well calibrated (the mean relative difference between observed and expected death risk was 2.0% [range, 0.0% to 7.0%]). It was externally validated in more than 3 million adults from Ontario, Alberta, and Boston in whom the C statistic ranged from 0.89 to 0.92 and calibration was excellent.3 We concluded from these studies that the HOMR score is excellent for prognosticating a diverse group of patients using health administrative data.

However, we do not know whether the HOMR score can be applied to patients using primary data (ie, those taken directly from the chart). This question is important for 2 reasons. First, if HOMR accurately predicts death risk using data abstracted from the medical record, it could be used in the clinical setting to assist in clinical decision-making. Second, HOMR uses multiple administrative datasets that are difficult to access and use by most clinical researchers; it is, therefore, important to determine if HOMR is accurate for clinical research based on primary medical record review. The primary objective of this study was to determine the accuracy of the HOMR score when calculated using data abstracted from clinical notes that were available when patients were admitted to hospital. Secondary objectives included determining whether functional measures abstracted were significantly associated with death risk beyond the HOMR score and whether HOMR scores calculated from chart review deviated from those calculated from administrative data.
METHODS
Study Cohort
The study, which was approved by our local research ethics board, took place at the Ottawa Hospital, a 1000-bed teaching hospital that is the primary referral center in our region. We used the hospital admission registry to identify all people 18 years or older who were admitted to a nonpsychiatric service at our hospital between January 1, 2011 and December 31, 2011 (this time frame corresponds with the year used to derive the HOMR score). We excluded overnight patients in the same-day surgery or the bone-marrow transplant units (since they would not have been included in the original study) and those without a valid health card number (which was required to link to provincial data to identify outcomes). From this list, we randomly selected 5000 patients.
Primary Data Collection
For each patient, we retrieved all data required to calculate the HOMR score from the medical record (Table 1). Patient registration information in our electronic medical record was used to identify patient age, sex, admitting service, number of emergency department (ED) visits in the previous year, number of admissions in the previous year (the nursing triage note was reviewed for each admission to determine if it was by ambulance), and whether or not the patient had been discharged from hospital in the previous 30 days. The admitting service consult note was used to determine the admitting diagnosis and whether or not the patient was admitted directly to the intensive care unit. If they were present, the emergency nursing triage note, the ED record of treatment, the admission consult note, the pre-operative consult note, and consult notes were all used to determine the patient’s comorbidities, living status, and home oxygen status. Admission urgency was determined using information from the patient registration information and the ED nursing triage note. All data were abstracted from information that had been registered prior to when the patient was physically transferred to their hospital bed. This ensured that we used only data available at the start of the admission.
Patient functional status has been shown to be strongly associated with survival4 but HOMR only indirectly captures functional information (through the patient’s living status). We, therefore, collected more detailed functional information from the medical record by determining if the patient was dependent for any activities of daily living (ADL) from the emergency nursing triage note, the ED record of treatment, the admission consult note, and the pre-operative consultation. We also collected information that might indicate frailty, which we defined per Clegg et al.5 as “a state of increased vulnerability to poor resolution of homeostasis following a stress.” This information included: delirium or more than 1 fall recorded on the emergency nursing triage note, the ED record of treatment, or the admission consultation note; or whether a geriatric nursing specialist assessment occurred in the ED in the previous 6 months. Finally, we recorded possible indicators of limited social support (no fixed address [from patient registration and nursing triage note], primary contact is not a family member [from the emergency notes, consult, and patient registration], and no religion noted in system [from patient registration]). Patients for whom religion status was missing were classified as having “no religion.”
Analysis
These data were encrypted and linked anonymously to population-based databases to determine whether patients died within 1 year of admission to hospital. We calculated the chart-HOMR score using information from the chart review and determined its association with the outcome using bivariate logistic regression. We compared observed and expected risk of death within 1 year of admission to hospital for each chart-HOMR score value, with expected risks determined from the external validation study.3 We regressed observed death risks on expected death risks for chart-HOMR scores (clustered into 22 groups to ensure adequate numbers in each group); and we gauged overall deviations from expected risk and the relationship between the observed and expected death risk (based on the chart-HOMR score) using the line’s intercept and slope, respectively.6 Next, we replicated methods from our studies2,3 to calculate the administrative-HOMR score in our study cohort using administrative databases. We compared these chart-HOMR and administrative-HOMR scores (and scores for each of its components). Finally, we determined which of the socio-functional factors were associated with 1-year death risk independent of the chart-HOMR score. We used the likelihood ratio test to determine whether these additional socio-functional factors significantly improved the model beyond the chart-HOMR score.7 This test subtracted the -2 logL value of the full model from that containing the chart-HOMR score alone, comparing its value to the χ2 distribution (with degrees of freedom equivalent to the number of additional parameters in the nested model) to determine statistical significance. All analyses were completed using SAS v9.4 (SAS Institute Inc., Cary, North Carolina).
RESULTS
There were 43,883 overnight hospitalizations at our hospital in 2011, and 38,886 hospitalizations were excluded: 1883 hospitalizations were in the same-day surgery or the bone-marrow transplant unit; 2485 did not have a valid health card number; 34,515 were not randomly selected; the records of 3 randomly selected patients had been blocked by our hospital’s privacy department; and 1 patient could not be linked with the population-based administrative datasets.
The 4996 study patients were middle-aged and predominantly female (Table 2). The extensive majority of patients was admitted from the community, was independent for ADL, had a family member as the principal contact, and had no admissions by ambulance in the previous year. Most people had no significant comorbidities or ED visits in the year prior to their admission. The mean chart-HOMR score was 22 (standard deviation [SD], 12), which is associated with a 1.2% expected risk of death within 1 year of hospital admission (Appendix 1).3

A total of 563 patients (11.3%) died within 1 year of admission to hospital (Table 2). In the study cohort, each chart-HOMR component was associated with death status. People who died were older, more likely to be male, had a greater number of important comorbidities, had more ED visits and admissions by ambulance in the previous year, and were more likely to have been discharged in the previous 30 days, and were admitted urgently, directly to the intensive care unit, or with complicated diagnoses. The mean chart-HOMR score differed extensively by survival status (37.4 [SD, 7.5] in those who died vs. 19.9 [SD, 12.2] in those who survived). Three of the socio-functional variables (delirium and falls noted on admission documents, and dependent for any ADL) also varied with death status.
The chart-HOMR score was strongly associated with the likelihood of death within 1 year of admission. When included in a logistic regression model having 1-year death as the outcome, a 1-point increase in the chart-HOMR score was associated with a 19% increase in the odds of death (P < 0.0001). This model (with only the chart-HOMR score) was highly discriminative (C statistic, 0.888) and well calibrated (Hosmer-Lemeshow test, 12.9 [8 df, P = 0.11]).
Observed and expected death risks by chart-HOMR score were similar (Figure 1). The observed total number of deaths (n = 563; 11.3%) exceeded the expected number of deaths (n = 437, 8.7%). When we regressed observed death risks on expected death risks for chart-HOMR scores (clustered into 22 groups), the Hosmer-Lemeshow test was significant, indicating that differences between observed and expected risks were beyond that expected by chance (Hosmer-Lemeshow test, 141.9, 21 df, P < 0.0001). The intercept of this model (0.035; 95% CI, 0.01-0.06) was statistically significant (P = 0.01), indicating that the observed number of cases significantly exceeded the expected; however, its calibration slope (1.02; 95% CI, 0.89-1.16) did not deviate significantly from unity, indicating that the relationship between the observed and expected death risk (based on the chart-HOMR score) remained intact (Figure 1).

The deviations between observed and expected death risks reflected deviations between the c chart-HOMR score and the administrative-HOMR score, with the former being significantly lower than the latter (Figure 2). Overall, the chart-HOMR score was 0.96 points lower (95% CI, 0.81-1.12) than the administrative-HOMR score. The HOMR score components that were notably underestimated using chart data included those for the age-Charlson Comorbidity Index interaction, living status, and admit points. Points for only 2 components (admitting service and admission urgency) were higher when calculated using chart data.

Four additional socio-functional variables collected from medical record review were significantly associated with 1-year death risk independent of the chart-HOMR score (Table 3). Admission documentation noting either delirium or falls were both associated with a significantly increased death risk (adjusted odds ratio [OR], 1.92 [95% CI, 1.24-2.96] and OR 1.96 [95% CI, 1.29-2.99], respectively). An independently increased death risk was also noted in patients who were dependent for any ADL (adjusted OR, 1.99 [95% CI, 1.24-3.19]). The presence of an ED geriatrics consultation within the previous 6 months was associated with a significantly decreased death risk of 60% (adjusted OR, 0.40 [95% CI, 0.20-0.81]). Adding these covariates to the logistic model with the chart-HOMR score significantly improved predictions (likelihood ratio statistic = 33.569, 4df, P < 0.00001).

DISCUSSION
In a large random sample of patients from our hospital, we found that the HOMR score using data abstracted from the medical record was significantly associated with 1-year death risk. The expected death risk based on the chart-HOMR score underestimated observed death risk but the relationship between the chart-HOMR score and death risk was similar to that in studies using administrative data. The HOMR score calculated using data from the chart was lower than that calculated using data from population-based administrative datasets; additional variables indicating patient frailty were significantly associated with 1-year death risk independent of the chart-HOMR score. Since the HOMR score was derived and initially validated using health administrative data, this study using data abstracted from the health record shows that the HOMR score has methodological generalizability.8
We think that our study has several notable findings. First, we found that data abstracted from the medical record can be used to calculate the HOMR score to accurately predict individual death risk. The chart-HOMR score discriminated very well between patients who did and did not die (C statistic, 0.88), which extensively exceeds the discrimination of published death risk indices (whose C statistics range between 0.69 and 0.82). It is also possible that chart abstraction for the HOMR score—without functional status—is simpler than other indices since its components are primarily very objective. (Other indices for hospital-based patients required factors that could be difficult to abstract reliably from the medical record including meeting more than 1 guideline for noncancer hospice care9; ambulation difficulties10; scales such as the Exton-Smith Scale or the Short Portable Mental Status Questionnaire11; weight loss12; functional status4; and pressure sore risk.13) Although expected risks for the chart-HOMR consistently underestimated observed risks (Figure 1), the mean deviation was small (with an absolute difference of 3.5% that can be used as a correction factor when determining expected risks with HOMR scores calculated from chart review), but it was an association between the chart-HOMR score and death risk that remained consistent through the cohort. Second, we found a small but significant decrease in the chart-HOMR score vs. the administrative-HOMR score (Figure 2). Some of these underestimates such as those for the number of ED visits or admissions by ambulance were expected since population-based health administrative databases would best capture such data. However, we were surprised that the comorbidity score was less when calculated using chart vs. database data (Figure 2). This finding is distinct from studies finding that particular comorbidities are documented in the chart are sometimes not coded.14,15 However, we identified comorbidities in the administrative databases using a 1-year ‘look-back’ period so that diagnostic codes from multiple hospitalizations (and from multiple hospitals) could be used to calculate the Charlson Comorbidity Index for a particular patient; this has been shown to increase the capture of comorbidities.16 Third, we found that variables from the chart review indicating frailty were predictive of 1-year death risk independent of the chart-HOMR score (Table 2). This illustrates that mortality risk prediction can be improved for particular patient groups by adding new covariates to the HOMR. Further work is required to determine how to incorporate these (and possibly other) covariates into the HOMR to create a unique chart-HOMR score. Finally, we found that a geriatrics assessment in the ED was associated with a significant (and notable) decrease in death risk. With these data, we are unable to indicate whether this association is causative. However, these findings indicate that the influence of emergency geriatric assessments on patient survival needs to be explored in more detail.
Several issues about our study should be considered when interpreting its results. First, this was a single-center study and the generalizability of our results to other centers is unknown. However, our study had the largest sample size of all primary data prognostic index validation studies1 ensuring that our results are, at the very least, internally reliable. In addition, our simple random sample ensured that we studied a broad assortment of patients to be certain that our results are representative of our institution. Second, we used a single abstractor for the study, which could limit the generalizability of our results. However, almost all the data points that were abstracted for our study were very objective.
In summary, our study shows that the HOMR score can be used to accurately predict 1-year death risk using data abstracted from the patient record. These findings will aid in individual patient prognostication for clinicians and researchers.
Disclosure
The authors report no financial conflicts of interest.
1. Yourman LC, Lee SJ, Schonberg MA, Widera EW, Smith AK. Prognostic indices for older adults: a systematic review. JAMA. 2012;307(2):182-192. PubMed
2. van Walraven C. The Hospital-patient One-year Mortality Risk score accurately predicts long term death risk in hospitalized patients. J Clin Epidemiol. 2014;67(9):1025-1034. PubMed
3. van Walraven C, McAlister FA, Bakal JA, Hawken S, Donzé J. External validation of the Hospital-patient One-year Mortality Risk (HOMR) model for predicting death within 1 year after hospital admission. CMAJ. 2015;187(10):725-733. PubMed
4. Walter LC, Brand RJ, Counsell SR, et al. Development and validation of a prognostic index for 1-year mortality in older adults after hospitalization. JAMA. 2001;285(23):2987-2994. PubMed
5. Clegg A, Young J, Iliffe S et al. Frailty in elderly people. The Lancet 2002;381:752-762. PubMed
6. Crowson CS, Atkinson EJ, Therneau TM. Assessing calibration of prognostic risk scores. Stat Methods Med Res. 2016;25(4):1692-1706. PubMed
7. Harrell FE Jr. Overview of Maximum Likelihood Estimation. Regression Modeling Strategies. New York, NY: Springer-Verlag; 2001: 179-212.
8. Justice AC, Covinsky KE, Berlin JA. Assessing the generalizability of prognostic information. Ann Intern Med. 1999;130(6):515-524. PubMed
9. Fischer SM, Gozansky WS, Sauaia A, Min SJ, Kutner JS, Kramer A. A practical tool to identify patients who may benefit from a palliative approach: the CARING criteria. J Pain Symptom Manage. 2006;31(4):285-292. PubMed
10. Inouye SK, Bogardus ST, Jr, Vitagliano G, et al. Burden of illness score for elderly persons: risk adjustment incorporating the cumulative impact of diseases, physiologic abnormalities, and functional impairments. Med Care. 2003;41(1):70-83. PubMed
11. Pilotto A, Ferrucci L, Franceschi M, et al. Development and validation of a multidimensional prognostic index for one-year mortality from comprehensive geriatric assessment in hospitalized older patients. Rejuvenation Res. 2008;11(1):151-161. PubMed
12. Teno JM, Harrell FE Jr, Knaus W, et al. Prediction of survival for older hospitalized patients: the HELP survival model. Hospitalized Elderly Longitudinal Project. J Am Geriatr Soc. 2000;48(5 suppl):S16-S24. PubMed
13. Dramé M, Novella JL, Lang PO, et al. Derivation and validation of a mortality-risk index from a cohort of frail elderly patients hospitalised in medical wards via emergencies: the SAFES study. Eur J Epidemiol. 2008;23(12):783-791. PubMed
14. Kieszak SM, Flanders WD, Kosinski AS, Shipp CC, Karp H. A comparison of the Charlson comorbidity index derived from medical record data and administrative billing data. J Clin Epidemiol. 1999;52(2):137-142. PubMed
15. Quan H, Parsons GA, Ghali WA. Validity of procedure codes in International Classification of Diseases, 9th revision, clinical modification administrative data. Med Care. 2004;42(8):801-809. PubMed
16. Zhang JX, Iwashyna TJ, Christakis NA. The performance of different lookback periods and sources of information for Charlson cComorbidity adjustment in Medicare claims. Med Care. 1999;37(11):1128-1139. PubMed
A patient’s prognosis can strongly influence their medical care. Decisions about diagnostic modalities, treatment options, and the use of preventive therapies can all be affected by the likelihood of a patient’s death in the near future. For example, patients with severely limited survival might forego prophylactic therapy, avoid interventions for asymptomatic issues, and cease screening interventions. Knowing survival probability would also be very helpful as a controlling variable in research analyses whenever death risk might be a possible confounder.
Sixteen indices that aim to predict patient death risk have been described by Yourman et al.1 They were all created from secondary analyses of clinical and administrative datasets, were applicable to patients in a variety of settings (including the community, nursing home, or hospital), and predicted survival probabilities in time horizons ranging from 6 months to 5 years. Prognostic factors that were most commonly included in these indices were comorbidity and functional status. In validation populations, the discrimination of these indices for 1-year survival in hospitalized patients was moderate (with C statistics that ranged from 0.64 to 0.79) with good calibration for broad prognostic ranges.
In 2014, we published the Hospitalized-patient One-year Mortality Risk (HOMR) score.2 This study used health administrative data for all adult Ontarians admitted in 2011 to hospital under nonpsychiatric services (n = 640,022) to estimate the probability of dying within 1 year of admission to hospital (which happened in 11.7% of people). The HOMR score included 12 patient and hospitalization factors (Table 1). It was highly discriminative (C statistic, 0.923; [0.922-0.924]) and well calibrated (the mean relative difference between observed and expected death risk was 2.0% [range, 0.0% to 7.0%]). It was externally validated in more than 3 million adults from Ontario, Alberta, and Boston in whom the C statistic ranged from 0.89 to 0.92 and calibration was excellent.3 We concluded from these studies that the HOMR score is excellent for prognosticating a diverse group of patients using health administrative data.
However, we do not know whether the HOMR score can be applied to patients using primary data (ie, those taken directly from the chart). This question is important for 2 reasons. First, if HOMR accurately predicts death risk using data abstracted from the medical record, it could be used in the clinical setting to assist in clinical decision-making. Second, HOMR uses multiple administrative datasets that are difficult to access and use by most clinical researchers; it is, therefore, important to determine if HOMR is accurate for clinical research based on primary medical record review. The primary objective of this study was to determine the accuracy of the HOMR score when calculated using data abstracted from clinical notes that were available when patients were admitted to hospital. Secondary objectives included determining whether functional measures abstracted were significantly associated with death risk beyond the HOMR score and whether HOMR scores calculated from chart review deviated from those calculated from administrative data.
METHODS
Study Cohort
The study, which was approved by our local research ethics board, took place at the Ottawa Hospital, a 1000-bed teaching hospital that is the primary referral center in our region. We used the hospital admission registry to identify all people 18 years or older who were admitted to a nonpsychiatric service at our hospital between January 1, 2011 and December 31, 2011 (this time frame corresponds with the year used to derive the HOMR score). We excluded overnight patients in the same-day surgery or the bone-marrow transplant units (since they would not have been included in the original study) and those without a valid health card number (which was required to link to provincial data to identify outcomes). From this list, we randomly selected 5000 patients.
Primary Data Collection
For each patient, we retrieved all data required to calculate the HOMR score from the medical record (Table 1). Patient registration information in our electronic medical record was used to identify patient age, sex, admitting service, number of emergency department (ED) visits in the previous year, number of admissions in the previous year (the nursing triage note was reviewed for each admission to determine if it was by ambulance), and whether or not the patient had been discharged from hospital in the previous 30 days. The admitting service consult note was used to determine the admitting diagnosis and whether or not the patient was admitted directly to the intensive care unit. If they were present, the emergency nursing triage note, the ED record of treatment, the admission consult note, the pre-operative consult note, and consult notes were all used to determine the patient’s comorbidities, living status, and home oxygen status. Admission urgency was determined using information from the patient registration information and the ED nursing triage note. All data were abstracted from information that had been registered prior to when the patient was physically transferred to their hospital bed. This ensured that we used only data available at the start of the admission.
Patient functional status has been shown to be strongly associated with survival4 but HOMR only indirectly captures functional information (through the patient’s living status). We, therefore, collected more detailed functional information from the medical record by determining if the patient was dependent for any activities of daily living (ADL) from the emergency nursing triage note, the ED record of treatment, the admission consult note, and the pre-operative consultation. We also collected information that might indicate frailty, which we defined per Clegg et al.5 as “a state of increased vulnerability to poor resolution of homeostasis following a stress.” This information included: delirium or more than 1 fall recorded on the emergency nursing triage note, the ED record of treatment, or the admission consultation note; or whether a geriatric nursing specialist assessment occurred in the ED in the previous 6 months. Finally, we recorded possible indicators of limited social support (no fixed address [from patient registration and nursing triage note], primary contact is not a family member [from the emergency notes, consult, and patient registration], and no religion noted in system [from patient registration]). Patients for whom religion status was missing were classified as having “no religion.”
Analysis
These data were encrypted and linked anonymously to population-based databases to determine whether patients died within 1 year of admission to hospital. We calculated the chart-HOMR score using information from the chart review and determined its association with the outcome using bivariate logistic regression. We compared observed and expected risk of death within 1 year of admission to hospital for each chart-HOMR score value, with expected risks determined from the external validation study.3 We regressed observed death risks on expected death risks for chart-HOMR scores (clustered into 22 groups to ensure adequate numbers in each group); and we gauged overall deviations from expected risk and the relationship between the observed and expected death risk (based on the chart-HOMR score) using the line’s intercept and slope, respectively.6 Next, we replicated methods from our studies2,3 to calculate the administrative-HOMR score in our study cohort using administrative databases. We compared these chart-HOMR and administrative-HOMR scores (and scores for each of its components). Finally, we determined which of the socio-functional factors were associated with 1-year death risk independent of the chart-HOMR score. We used the likelihood ratio test to determine whether these additional socio-functional factors significantly improved the model beyond the chart-HOMR score.7 This test subtracted the -2 logL value of the full model from that containing the chart-HOMR score alone, comparing its value to the χ2 distribution (with degrees of freedom equivalent to the number of additional parameters in the nested model) to determine statistical significance. All analyses were completed using SAS v9.4 (SAS Institute Inc., Cary, North Carolina).
RESULTS
There were 43,883 overnight hospitalizations at our hospital in 2011, and 38,886 hospitalizations were excluded: 1883 hospitalizations were in the same-day surgery or the bone-marrow transplant unit; 2485 did not have a valid health card number; 34,515 were not randomly selected; the records of 3 randomly selected patients had been blocked by our hospital’s privacy department; and 1 patient could not be linked with the population-based administrative datasets.
The 4996 study patients were middle-aged and predominantly female (Table 2). The extensive majority of patients was admitted from the community, was independent for ADL, had a family member as the principal contact, and had no admissions by ambulance in the previous year. Most people had no significant comorbidities or ED visits in the year prior to their admission. The mean chart-HOMR score was 22 (standard deviation [SD], 12), which is associated with a 1.2% expected risk of death within 1 year of hospital admission (Appendix 1).3
A total of 563 patients (11.3%) died within 1 year of admission to hospital (Table 2). In the study cohort, each chart-HOMR component was associated with death status. People who died were older, more likely to be male, had a greater number of important comorbidities, had more ED visits and admissions by ambulance in the previous year, and were more likely to have been discharged in the previous 30 days, and were admitted urgently, directly to the intensive care unit, or with complicated diagnoses. The mean chart-HOMR score differed extensively by survival status (37.4 [SD, 7.5] in those who died vs. 19.9 [SD, 12.2] in those who survived). Three of the socio-functional variables (delirium and falls noted on admission documents, and dependent for any ADL) also varied with death status.
The chart-HOMR score was strongly associated with the likelihood of death within 1 year of admission. When included in a logistic regression model having 1-year death as the outcome, a 1-point increase in the chart-HOMR score was associated with a 19% increase in the odds of death (P < 0.0001). This model (with only the chart-HOMR score) was highly discriminative (C statistic, 0.888) and well calibrated (Hosmer-Lemeshow test, 12.9 [8 df, P = 0.11]).
Observed and expected death risks by chart-HOMR score were similar (Figure 1). The observed total number of deaths (n = 563; 11.3%) exceeded the expected number of deaths (n = 437, 8.7%). When we regressed observed death risks on expected death risks for chart-HOMR scores (clustered into 22 groups), the Hosmer-Lemeshow test was significant, indicating that differences between observed and expected risks were beyond that expected by chance (Hosmer-Lemeshow test, 141.9, 21 df, P < 0.0001). The intercept of this model (0.035; 95% CI, 0.01-0.06) was statistically significant (P = 0.01), indicating that the observed number of cases significantly exceeded the expected; however, its calibration slope (1.02; 95% CI, 0.89-1.16) did not deviate significantly from unity, indicating that the relationship between the observed and expected death risk (based on the chart-HOMR score) remained intact (Figure 1).
The deviations between observed and expected death risks reflected deviations between the c chart-HOMR score and the administrative-HOMR score, with the former being significantly lower than the latter (Figure 2). Overall, the chart-HOMR score was 0.96 points lower (95% CI, 0.81-1.12) than the administrative-HOMR score. The HOMR score components that were notably underestimated using chart data included those for the age-Charlson Comorbidity Index interaction, living status, and admit points. Points for only 2 components (admitting service and admission urgency) were higher when calculated using chart data.
Four additional socio-functional variables collected from medical record review were significantly associated with 1-year death risk independent of the chart-HOMR score (Table 3). Admission documentation noting either delirium or falls were both associated with a significantly increased death risk (adjusted odds ratio [OR], 1.92 [95% CI, 1.24-2.96] and OR 1.96 [95% CI, 1.29-2.99], respectively). An independently increased death risk was also noted in patients who were dependent for any ADL (adjusted OR, 1.99 [95% CI, 1.24-3.19]). The presence of an ED geriatrics consultation within the previous 6 months was associated with a significantly decreased death risk of 60% (adjusted OR, 0.40 [95% CI, 0.20-0.81]). Adding these covariates to the logistic model with the chart-HOMR score significantly improved predictions (likelihood ratio statistic = 33.569, 4df, P < 0.00001).
DISCUSSION
In a large random sample of patients from our hospital, we found that the HOMR score using data abstracted from the medical record was significantly associated with 1-year death risk. The expected death risk based on the chart-HOMR score underestimated observed death risk but the relationship between the chart-HOMR score and death risk was similar to that in studies using administrative data. The HOMR score calculated using data from the chart was lower than that calculated using data from population-based administrative datasets; additional variables indicating patient frailty were significantly associated with 1-year death risk independent of the chart-HOMR score. Since the HOMR score was derived and initially validated using health administrative data, this study using data abstracted from the health record shows that the HOMR score has methodological generalizability.8
We think that our study has several notable findings. First, we found that data abstracted from the medical record can be used to calculate the HOMR score to accurately predict individual death risk. The chart-HOMR score discriminated very well between patients who did and did not die (C statistic, 0.88), which extensively exceeds the discrimination of published death risk indices (whose C statistics range between 0.69 and 0.82). It is also possible that chart abstraction for the HOMR score—without functional status—is simpler than other indices since its components are primarily very objective. (Other indices for hospital-based patients required factors that could be difficult to abstract reliably from the medical record including meeting more than 1 guideline for noncancer hospice care9; ambulation difficulties10; scales such as the Exton-Smith Scale or the Short Portable Mental Status Questionnaire11; weight loss12; functional status4; and pressure sore risk.13) Although expected risks for the chart-HOMR consistently underestimated observed risks (Figure 1), the mean deviation was small (with an absolute difference of 3.5% that can be used as a correction factor when determining expected risks with HOMR scores calculated from chart review), but it was an association between the chart-HOMR score and death risk that remained consistent through the cohort. Second, we found a small but significant decrease in the chart-HOMR score vs. the administrative-HOMR score (Figure 2). Some of these underestimates such as those for the number of ED visits or admissions by ambulance were expected since population-based health administrative databases would best capture such data. However, we were surprised that the comorbidity score was less when calculated using chart vs. database data (Figure 2). This finding is distinct from studies finding that particular comorbidities are documented in the chart are sometimes not coded.14,15 However, we identified comorbidities in the administrative databases using a 1-year ‘look-back’ period so that diagnostic codes from multiple hospitalizations (and from multiple hospitals) could be used to calculate the Charlson Comorbidity Index for a particular patient; this has been shown to increase the capture of comorbidities.16 Third, we found that variables from the chart review indicating frailty were predictive of 1-year death risk independent of the chart-HOMR score (Table 2). This illustrates that mortality risk prediction can be improved for particular patient groups by adding new covariates to the HOMR. Further work is required to determine how to incorporate these (and possibly other) covariates into the HOMR to create a unique chart-HOMR score. Finally, we found that a geriatrics assessment in the ED was associated with a significant (and notable) decrease in death risk. With these data, we are unable to indicate whether this association is causative. However, these findings indicate that the influence of emergency geriatric assessments on patient survival needs to be explored in more detail.
Several issues about our study should be considered when interpreting its results. First, this was a single-center study and the generalizability of our results to other centers is unknown. However, our study had the largest sample size of all primary data prognostic index validation studies1 ensuring that our results are, at the very least, internally reliable. In addition, our simple random sample ensured that we studied a broad assortment of patients to be certain that our results are representative of our institution. Second, we used a single abstractor for the study, which could limit the generalizability of our results. However, almost all the data points that were abstracted for our study were very objective.
In summary, our study shows that the HOMR score can be used to accurately predict 1-year death risk using data abstracted from the patient record. These findings will aid in individual patient prognostication for clinicians and researchers.
Disclosure
The authors report no financial conflicts of interest.
1. Yourman LC, Lee SJ, Schonberg MA, Widera EW, Smith AK. Prognostic indices for older adults: a systematic review. JAMA. 2012;307(2):182-192. PubMed
2. van Walraven C. The Hospital-patient One-year Mortality Risk score accurately predicts long term death risk in hospitalized patients. J Clin Epidemiol. 2014;67(9):1025-1034. PubMed
3. van Walraven C, McAlister FA, Bakal JA, Hawken S, Donzé J. External validation of the Hospital-patient One-year Mortality Risk (HOMR) model for predicting death within 1 year after hospital admission. CMAJ. 2015;187(10):725-733. PubMed
4. Walter LC, Brand RJ, Counsell SR, et al. Development and validation of a prognostic index for 1-year mortality in older adults after hospitalization. JAMA. 2001;285(23):2987-2994. PubMed
5. Clegg A, Young J, Iliffe S et al. Frailty in elderly people. The Lancet 2002;381:752-762. PubMed
6. Crowson CS, Atkinson EJ, Therneau TM. Assessing calibration of prognostic risk scores. Stat Methods Med Res. 2016;25(4):1692-1706. PubMed
7. Harrell FE Jr. Overview of Maximum Likelihood Estimation. Regression Modeling Strategies. New York, NY: Springer-Verlag; 2001: 179-212.
8. Justice AC, Covinsky KE, Berlin JA. Assessing the generalizability of prognostic information. Ann Intern Med. 1999;130(6):515-524. PubMed
9. Fischer SM, Gozansky WS, Sauaia A, Min SJ, Kutner JS, Kramer A. A practical tool to identify patients who may benefit from a palliative approach: the CARING criteria. J Pain Symptom Manage. 2006;31(4):285-292. PubMed
10. Inouye SK, Bogardus ST, Jr, Vitagliano G, et al. Burden of illness score for elderly persons: risk adjustment incorporating the cumulative impact of diseases, physiologic abnormalities, and functional impairments. Med Care. 2003;41(1):70-83. PubMed
11. Pilotto A, Ferrucci L, Franceschi M, et al. Development and validation of a multidimensional prognostic index for one-year mortality from comprehensive geriatric assessment in hospitalized older patients. Rejuvenation Res. 2008;11(1):151-161. PubMed
12. Teno JM, Harrell FE Jr, Knaus W, et al. Prediction of survival for older hospitalized patients: the HELP survival model. Hospitalized Elderly Longitudinal Project. J Am Geriatr Soc. 2000;48(5 suppl):S16-S24. PubMed
13. Dramé M, Novella JL, Lang PO, et al. Derivation and validation of a mortality-risk index from a cohort of frail elderly patients hospitalised in medical wards via emergencies: the SAFES study. Eur J Epidemiol. 2008;23(12):783-791. PubMed
14. Kieszak SM, Flanders WD, Kosinski AS, Shipp CC, Karp H. A comparison of the Charlson comorbidity index derived from medical record data and administrative billing data. J Clin Epidemiol. 1999;52(2):137-142. PubMed
15. Quan H, Parsons GA, Ghali WA. Validity of procedure codes in International Classification of Diseases, 9th revision, clinical modification administrative data. Med Care. 2004;42(8):801-809. PubMed
16. Zhang JX, Iwashyna TJ, Christakis NA. The performance of different lookback periods and sources of information for Charlson cComorbidity adjustment in Medicare claims. Med Care. 1999;37(11):1128-1139. PubMed
© 2017 Society of Hospital Medicine
Predicting 30-day pneumonia readmissions using electronic health record data
Pneumonia is a leading cause of hospitalizations in the U.S., accounting for more than 1.1 million discharges annually.1 Pneumonia is frequently complicated by hospital readmission, which is costly and potentially avoidable.2,3 Due to financial penalties imposed on hospitals for higher than expected 30-day readmission rates, there is increasing attention to implementing interventions to reduce readmissions in this population.4,5 However, because these programs are resource-intensive, interventions are thought to be most cost-effective if they are targeted to high-risk individuals who are most likely to benefit.6-8
Current pneumonia-specific readmission risk-prediction models that could enable identification of high-risk patients suffer from poor predictive ability, greatly limiting their use, and most were validated among older adults or by using data from single academic medical centers, limiting their generalizability.9-14 A potential reason for poor predictive accuracy is the omission of known robust clinical predictors of pneumonia-related outcomes, including pneumonia severity of illness and stability on discharge.15-17 Approaches using electronic health record (EHR) data, which include this clinically granular data, could enable hospitals to more accurately and pragmatically identify high-risk patients during the index hospitalization and enable interventions to be initiated prior to discharge.
An alternative strategy to identifying high-risk patients for readmission is to use a multi-condition risk-prediction model. Developing and implementing models for every condition may be time-consuming and costly. We have derived and validated 2 multi-condition risk-prediction models using EHR data—1 using data from the first day of hospital admission (‘first-day’ model), and the second incorporating data from the entire hospitalization (‘full-stay’ model) to reflect in-hospital complications and clinical stability at discharge.18,19 However, it is unknown if a multi-condition model for pneumonia would perform as well as a disease-specific model.
This study aimed to develop 2 EHR-based pneumonia-specific readmission risk-prediction models using data routinely collected in clinical practice—a ‘first-day’ and a ‘full-stay’ model—and compare the performance of each model to: 1) one another; 2) the corresponding multi-condition EHR model; and 3) to other potentially useful models in predicting pneumonia readmissions (the Centers for Medicare and Medicaid Services [CMS] pneumonia model, and 2 commonly used pneumonia severity of illness scores validated for predicting mortality). We hypothesized that the pneumonia-specific EHR models would outperform other models; and the full-stay pneumonia-specific model would outperform the first-day pneumonia-specific model.
METHODS
Study Design, Population, and Data Sources
We conducted an observational study using EHR data collected from 6 hospitals (including safety net, community, teaching, and nonteaching hospitals) in north Texas between November 2009 and October 2010, All hospitals used the Epic EHR (Epic Systems Corporation, Verona, WI). Details of this cohort have been published.18,19
We included consecutive hospitalizations among adults 18 years and older discharged from any medicine service with principal discharge diagnoses of pneumonia (ICD-9-CM codes 480-483, 485, 486-487), sepsis (ICD-9-CM codes 038, 995.91, 995.92, 785.52), or respiratory failure (ICD-9-CM codes 518.81, 518.82, 518.84, 799.1) when the latter 2 were also accompanied by a secondary diagnosis of pneumonia.20 For individuals with multiple hospitalizations during the study period, we included only the first hospitalization. We excluded individuals who died during the index hospitalization or within 30 days of discharge, were transferred to another acute care facility, or left against medical advice.
Outcomes
The primary outcome was all-cause 30-day readmission, defined as a nonelective hospitalization within 30 days of discharge to any of 75 acute care hospitals within a 100-mile radius of Dallas, ascertained from an all-payer regional hospitalization database.
Predictor Variables for the Pneumonia-Specific Readmission Models
The selection of candidate predictors was informed by our validated multi-condition risk-prediction models using EHR data available within 24 hours of admission (‘first-day’ multi-condition EHR model) or during the entire hospitalization (‘full-stay’ multi-condition EHR model).18,19 For the pneumonia-specific models, we included all variables in our published multi-condition models as candidate predictors, including sociodemographics, prior utilization, Charlson Comorbidity Index, select laboratory and vital sign abnormalities, length of stay, hospital complications (eg, venous thromboembolism), vital sign instabilities, and disposition status (see Supplemental Table 1 for complete list of variables). We also assessed additional variables specific to pneumonia for inclusion that were: (1) available in the EHR of all participating hospitals; (2) routinely collected or available at the time of admission or discharge; and (3) plausible predictors of adverse outcomes based on literature and clinical expertise. These included select comorbidities (eg, psychiatric conditions, chronic lung disease, history of pneumonia),10,11,21,22 the pneumonia severity index (PSI),16,23,24 intensive care unit stay, and receipt of invasive or noninvasive ventilation. We used a modified PSI score because certain data elements were missing. The modified PSI (henceforth referred to as PSI) did not include nursing home residence and included diagnostic codes as proxies for the presence of pleural effusion (ICD-9-CM codes 510, 511.1, and 511.9) and altered mental status (ICD-9-CM codes 780.0X, 780.97, 293.0, 293.1, and 348.3X).
Statistical Analysis
Model Derivation. Candidate predictor variables were classified as available in the EHR within 24 hours of admission and/or at the time of discharge. For example, socioeconomic factors could be ascertained within the first day of hospitalization, whereas length of stay would not be available until the day of discharge. Predictors with missing values were assumed to be normal (less than 1% missing for each variable). Univariate relationships between readmission and each candidate predictor were assessed in the overall cohort using a pre-specified significance threshold of P ≤ 0.10. Significant variables were entered in the respective first-day and full-stay pneumonia-specific multivariable logistic regression models using stepwise-backward selection with a pre-specified significance threshold of P ≤ 0.05. In sensitivity analyses, we alternately derived our models using stepwise-forward selection, as well as stepwise-backward selection minimizing the Bayesian information criterion and Akaike information criterion separately. These alternate modeling strategies yielded identical predictors to our final models.
Model Validation. Model validation was performed using 5-fold cross-validation, with the overall cohort randomly divided into 5 equal-size subsets.25 For each cycle, 4 subsets were used for training to estimate model coefficients, and the fifth subset was used for validation. This cycle was repeated 5 times with each randomly-divided subset used once as the validation set. We repeated this entire process 50 times and averaged the C statistic estimates to derive an optimism-corrected C statistic. Model calibration was assessed qualitatively by comparing predicted to observed probabilities of readmission by quintiles of predicted risk, and with the Hosmer-Lemeshow goodness-of-fit test.
Comparison to Other Models. The main comparisons of the first-day and full-stay pneumonia-specific EHR model performance were to each other and the corresponding multi-condition EHR model.18,19 The multi-condition EHR models were separately derived and validated within the larger parent cohort from which this study cohort was derived, and outperformed the CMS all-cause model, the HOSPITAL model, and the LACE index.19 To further triangulate our findings, given the lack of other rigorously validated pneumonia-specific risk-prediction models for readmission,14 we compared the pneumonia-specific EHR models to the CMS pneumonia model derived from administrative claims data,10 and 2 commonly used risk-prediction scores for short-term mortality among patients with community-acquired pneumonia, the PSI and CURB-65 scores.16 Although derived and validated using patient-level data, the CMS model was developed to benchmark hospitals according to hospital-level readmission rates.10 The CURB-65 score in this study was also modified to include the same altered mental status diagnostic codes according to the modified PSI as a proxy for “confusion.” Both the PSI and CURB-65 scores were calculated using the most abnormal values within the first 24 hours of admission. The ‘updated’ PSI and the ‘updated’ CURB-65 were calculated using the most abnormal values within 24 hours prior to discharge, or the last known observation prior to discharge if no results were recorded within this time period. A complete list of variables for each of the comparison models are shown in Supplemental Table 1.
We assessed model performance by calculating the C statistic, integrated discrimination index, and net reclassification index (NRI) compared to our pneumonia-specific models. The integrated discrimination index is the difference in the mean predicted probability of readmission between patients who were and were not actually readmitted between 2 models, where more positive values suggest improvement in model performance compared to a reference model.26 The NRI is defined as the sum of the net proportions of correctly reclassified persons with and without the event of interest.27 Here, we calculated a category-based NRI to evaluate the performance of pneumonia-specific models in correctly classifying individuals with and without readmissions into the 2 highest readmission risk quintiles vs the lowest 3 risk quintiles compared to other models.27 This pre-specified cutoff is relevant for hospitals interested in identifying the highest risk individuals for targeted intervention.7 Finally, we assessed calibration of comparator models in our cohort by comparing predicted probability to observed probability of readmission by quintiles of risk for each model. We conducted all analyses using Stata 12.1 (StataCorp, College Station, Texas). This study was approved by the University of Texas Southwestern Medical Center Institutional Review Board.
RESULTS
Of 1463 index hospitalizations (Supplemental Figure 1), the 30-day all-cause readmission rate was 13.6%. Individuals with a 30-day readmission had markedly different sociodemographic and clinical characteristics compared to those not readmitted (Table 1; see Supplemental Table 2 for additional clinical characteristics).

Derivation, Validation, and Performance of the Pneumonia-Specific Readmission Risk-Prediction Models
The final first-day pneumonia-specific EHR model included 7 variables, including sociodemographic characteristics; prior hospitalizations; thrombocytosis, and PSI (Table 2). The first-day pneumonia-specific model had adequate discrimination (C statistic, 0.695; optimism-corrected C statistic 0.675, 95% confidence interval [CI], 0.667-0.685; Table 3). It also effectively stratified individuals across a broad range of risk (average predicted decile of risk ranged from 4% to 33%; Table 3) and was well calibrated (Supplemental Table 3).

The final full-stay pneumonia-specific EHR readmission model included 8 predictors, including 3 variables from the first-day model (median income, thrombocytosis, and prior hospitalizations; Table 2). The full-stay pneumonia-specific EHR model also included vital sign instabilities on discharge, updated PSI, and disposition status (ie, being discharged with home health or to a post-acute care facility was associated with greater odds of readmission, and hospice with lower odds). The full-stay pneumonia-specific EHR model had good discrimination (C statistic, 0.731; optimism-corrected C statistic, 0.714; 95% CI, 0.706-0.720), and stratified individuals across a broad range of risk (average predicted decile of risk ranged from 3% to 37%; Table 3), and was also well calibrated (Supplemental Table 3).

First-Day Pneumonia-Specific EHR Model vs First-Day Multi-Condition EHR Model
The first-day pneumonia-specific EHR model outperformed the first-day multi-condition EHR model with better discrimination (P = 0.029) and more correctly classified individuals in the top 2 highest risk quintiles vs the bottom 3 risk quintiles (Table 3, Supplemental Table 4, and Supplemental Figure 2A). With respect to calibration, the first-day multi-condition EHR model overestimated risk among the highest quintile risk group compared to the first-day pneumonia-specific EHR model (Figure 1A, 1B).

Full-Stay Pneumonia-Specific EHR Model vs Other Models
The full-stay pneumonia-specific EHR model comparatively outperformed the corresponding full-stay multi-condition EHR model, as well as the first-day pneumonia-specific EHR model, the CMS pneumonia model, the updated PSI, and the updated CURB-65 (Table 3, Supplemental Table 5, Supplemental Table 6, and Supplemental Figures 2B and 2C). Compared to the full-stay multi-condition and first-day pneumonia-specific EHR models, the full-stay pneumonia-specific EHR model had better discrimination, better reclassification (NRI, 0.09 and 0.08, respectively), and was able to stratify individuals across a broader range of readmission risk (Table 3). It also had better calibration in the highest quintile risk group compared to the full-stay multi-condition EHR model (Figure 1C and 1D).
Updated vs First-Day Modified PSI and CURB-65 Scores
The updated PSI was more strongly predictive of readmission than the PSI calculated on the day of admission (Wald test, 9.83; P = 0.002). Each 10-point increase in the updated PSI was associated with a 22% increased odds of readmission vs an 11% increase for the PSI calculated upon admission (Table 2). The improved predictive ability of the updated PSI and CURB-65 scores was also reflected in the superior discrimination and calibration vs the respective first-day pneumonia severity of illness scores (Table 3).
DISCUSSION
Using routinely available EHR data from 6 diverse hospitals, we developed 2 pneumonia-specific readmission risk-prediction models that aimed to allow hospitals to identify patients hospitalized with pneumonia at high risk for readmission. Overall, we found that a pneumonia-specific model using EHR data from the entire hospitalization outperformed all other models—including the first-day pneumonia-specific model using data present only on admission, our own multi-condition EHR models, and the CMS pneumonia model based on administrative claims data—in all aspects of model performance (discrimination, calibration, and reclassification). We found that socioeconomic status, prior hospitalizations, thrombocytosis, and measures of clinical severity and stability were important predictors of 30-day all-cause readmissions among patients hospitalized with pneumonia. Additionally, an updated discharge PSI score was a stronger independent predictor of readmissions compared to the PSI score calculated upon admission; and inclusion of the updated PSI in our full-stay pneumonia model led to improved prediction of 30-day readmissions.
The marked improvement in performance of the full-stay pneumonia-specific EHR model compared to the first-day pneumonia-specific model suggests that clinical stability and trajectory during hospitalization (as modeled through disposition status, updated PSI, and vital sign instabilities at discharge) are important predictors of 30-day readmission among patients hospitalized for pneumonia, which was not the case for our EHR-based multi-condition models.19 With the inclusion of these measures, the full-stay pneumonia-specific model correctly reclassified an additional 8% of patients according to their true risk compared to the first-day pneumonia-specific model. One implication of these findings is that hospitals interested in targeting their highest risk individuals with pneumonia for transitional care interventions could do so using the first-day pneumonia-specific EHR model and could refine their targeted strategy at the time of discharge by using the full-stay pneumonia model. This staged risk-prediction strategy would enable hospitals to initiate transitional care interventions for high-risk individuals in the inpatient setting (ie, patient education).7 Then, hospitals could enroll both persistent and newly identified high-risk individuals for outpatient interventions (ie, follow-up telephone call) in the immediate post-discharge period, an interval characterized by heightened vulnerability for adverse events,28 based on patients’ illness severity and stability at discharge. This approach can be implemented by hospitals by building these risk-prediction models directly into the EHR, or by extracting EHR data in near real time as our group has done successfully for heart failure.7
Another key implication of our study is that, for pneumonia, a disease-specific modeling approach has better predictive ability than using a multi-condition model. Compared to multi-condition models, the first-day and full-stay pneumonia-specific EHR models correctly reclassified an additional 6% and 9% of patients, respectively. Thus, hospitals interested in identifying the highest risk patients with pneumonia for targeted interventions should do so using the disease-specific models, if the costs and resources of doing so are within reach of the healthcare system.
An additional novel finding of our study is the added value of an updated PSI for predicting adverse events. Studies of pneumonia severity of illness scores have calculated the PSI and CURB-65 scores using data present only on admission.16,24 While our study also confirms that the PSI calculated upon admission is a significant predictor of readmission,23,29 this study extends this work by showing that an updated PSI score calculated at the time of discharge is an even stronger predictor for readmission, and its inclusion in the model significantly improves risk stratification and prognostication.
Our study was noteworthy for several strengths. First, we used data from a common EHR system, thus potentially allowing for the implementation of the pneumonia-specific models in real time across a number of hospitals. The use of routinely collected data for risk-prediction modeling makes this approach scalable and sustainable, because it obviates the need for burdensome data collection and entry. Second, to our knowledge, this is the first study to measure the additive influence of illness severity and stability at discharge on the readmission risk among patients hospitalized with pneumonia. Third, our study population was derived from 6 hospitals diverse in payer status, age, race/ethnicity, and socioeconomic status. Fourth, our models are less likely to be overfit to the idiosyncrasies of our data given that several predictors included in our final pneumonia-specific models have been associated with readmission in this population, including marital status,13,30 income,11,31 prior hospitalizations,11,13 thrombocytosis,32-34 and vital sign instabilities on discharge.17 Lastly, the discrimination of the CMS pneumonia model in our cohort (C statistic, 0.64) closely matched the discrimination observed in 4 independent cohorts (C statistic, 0.63), suggesting adequate generalizability of our study setting and population.10,12
Our results should be interpreted in the context of several limitations. First, generalizability to other regions beyond north Texas is unknown. Second, although we included a diverse cohort of safety net, community, teaching, and nonteaching hospitals, the pneumonia-specific models were not externally validated in a separate cohort, which may lead to more optimistic estimates of model performance. Third, PSI and CURB-65 scores were modified to use diagnostic codes for altered mental status and pleural effusion, and omitted nursing home residence. Thus, the independent associations for the PSI and CURB-65 scores and their predictive ability are likely attenuated. Fourth, we were unable to include data on medications (antibiotics and steroid use) and outpatient visits, which may influence readmission risk.2,9,13,35-40 Fifth, we included only the first pneumonia hospitalization per patient in this study. Had we included multiple hospitalizations per patient, we anticipate better model performance for the 2 pneumonia-specific EHR models since prior hospitalization was a robust predictor of readmission.
In conclusion, the full-stay pneumonia-specific EHR readmission risk-prediction model outperformed the first-day pneumonia-specific model, multi-condition EHR models, and the CMS pneumonia model. This suggests that: measures of clinical severity and stability at the time of discharge are important predictors for identifying patients at highest risk for readmission; and that EHR data routinely collected for clinical practice can be used to accurately predict risk of readmission among patients hospitalized for pneumonia.
Acknowledgments
The authors would like to acknowledge Ruben Amarasingham, MD, MBA, president and chief executive officer of Parkland Center for Clinical Innovation, and Ferdinand Velasco, MD, chief health information officer at Texas Health Resources for their assistance in assembling the 6-hospital cohort used in this study.
Disclosures
This work was supported by the Agency for Healthcare Research and Quality-funded UT Southwestern Center for Patient-Centered Outcomes Research (R24 HS022418-01); the Commonwealth Foundation (#20100323); the UT Southwestern KL2 Scholars Program supported by the National Institutes of Health (KL2 TR001103 to ANM and OKN); and the National Center for Advancing Translational Sciences at the National Institute of Health (U54 RFA-TR-12-006 to E.A.H.). The study sponsors had no role in design and conduct of the study; collection, management, analysis, and interpretation of the data; and preparation, review, or approval of the manuscript. The authors have no financial conflicts of interest to disclose
1. Centers for Disease Control and Prevention. Pneumonia. http://www.cdc.gov/nchs/fastats/pneumonia.htm. Accessed January 26, 2016.
33. Prina E, Ferrer M, Ranzani OT, et al. Thrombocytosis is a marker of poor outcome in community-acquired pneumonia. Chest. 2013;143(3):767-775. PubMed
34. Violi F, Cangemi R, Calvieri C. Pneumonia, thrombosis and vascular disease. J Thromb Haemost. 2014;12(9):1391-1400. PubMed
35. Weinberger M, Oddone EZ, Henderson WG. Does increased access to primary care reduce hospital readmissions? Veterans Affairs Cooperative Study Group on Primary Care and Hospital Readmission. N Engl J Med. 1996;334(22):1441-1447. PubMed
36. Field TS, Ogarek J, Garber L, Reed G, Gurwitz JH. Association of early post-discharge follow-up by a primary care physician and 30-day rehospitalization among older adults. J Gen Intern Med. 2015;30(5):565-571. PubMed
37. Spatz ES, Sheth SD, Gosch KL, et al. Usual source of care and outcomes following acute myocardial infarction. J Gen Intern Med. 2014;29(6):862-869. PubMed
38. Brooke BS, Stone DH, Cronenwett JL, et al. Early primary care provider follow-up and readmission after high-risk surgery. JAMA Surg. 2014;149(8):821-828. PubMed
39. Adamuz J, Viasus D, Campreciós-Rodriguez P, et al. A prospective cohort study of healthcare visits and rehospitalizations after discharge of patients with community-acquired pneumonia. Respirology. 2011;16(7):1119-1126. PubMed
40. Shorr AF, Zilberberg MD, Reichley R, et al. Readmission following hospitalization for pneumonia: the impact of pneumonia type and its implication for hospitals. Clin Infect Dis. 2013;57(3):362-367. PubMed
Pneumonia is a leading cause of hospitalizations in the U.S., accounting for more than 1.1 million discharges annually.1 Pneumonia is frequently complicated by hospital readmission, which is costly and potentially avoidable.2,3 Due to financial penalties imposed on hospitals for higher than expected 30-day readmission rates, there is increasing attention to implementing interventions to reduce readmissions in this population.4,5 However, because these programs are resource-intensive, interventions are thought to be most cost-effective if they are targeted to high-risk individuals who are most likely to benefit.6-8
Current pneumonia-specific readmission risk-prediction models that could enable identification of high-risk patients suffer from poor predictive ability, greatly limiting their use, and most were validated among older adults or by using data from single academic medical centers, limiting their generalizability.9-14 A potential reason for poor predictive accuracy is the omission of known robust clinical predictors of pneumonia-related outcomes, including pneumonia severity of illness and stability on discharge.15-17 Approaches using electronic health record (EHR) data, which include this clinically granular data, could enable hospitals to more accurately and pragmatically identify high-risk patients during the index hospitalization and enable interventions to be initiated prior to discharge.
An alternative strategy to identifying high-risk patients for readmission is to use a multi-condition risk-prediction model. Developing and implementing models for every condition may be time-consuming and costly. We have derived and validated 2 multi-condition risk-prediction models using EHR data—1 using data from the first day of hospital admission (‘first-day’ model), and the second incorporating data from the entire hospitalization (‘full-stay’ model) to reflect in-hospital complications and clinical stability at discharge.18,19 However, it is unknown if a multi-condition model for pneumonia would perform as well as a disease-specific model.
This study aimed to develop 2 EHR-based pneumonia-specific readmission risk-prediction models using data routinely collected in clinical practice—a ‘first-day’ and a ‘full-stay’ model—and compare the performance of each model to: 1) one another; 2) the corresponding multi-condition EHR model; and 3) to other potentially useful models in predicting pneumonia readmissions (the Centers for Medicare and Medicaid Services [CMS] pneumonia model, and 2 commonly used pneumonia severity of illness scores validated for predicting mortality). We hypothesized that the pneumonia-specific EHR models would outperform other models; and the full-stay pneumonia-specific model would outperform the first-day pneumonia-specific model.
METHODS
Study Design, Population, and Data Sources
We conducted an observational study using EHR data collected from 6 hospitals (including safety net, community, teaching, and nonteaching hospitals) in north Texas between November 2009 and October 2010, All hospitals used the Epic EHR (Epic Systems Corporation, Verona, WI). Details of this cohort have been published.18,19
We included consecutive hospitalizations among adults 18 years and older discharged from any medicine service with principal discharge diagnoses of pneumonia (ICD-9-CM codes 480-483, 485, 486-487), sepsis (ICD-9-CM codes 038, 995.91, 995.92, 785.52), or respiratory failure (ICD-9-CM codes 518.81, 518.82, 518.84, 799.1) when the latter 2 were also accompanied by a secondary diagnosis of pneumonia.20 For individuals with multiple hospitalizations during the study period, we included only the first hospitalization. We excluded individuals who died during the index hospitalization or within 30 days of discharge, were transferred to another acute care facility, or left against medical advice.
Outcomes
The primary outcome was all-cause 30-day readmission, defined as a nonelective hospitalization within 30 days of discharge to any of 75 acute care hospitals within a 100-mile radius of Dallas, ascertained from an all-payer regional hospitalization database.
Predictor Variables for the Pneumonia-Specific Readmission Models
The selection of candidate predictors was informed by our validated multi-condition risk-prediction models using EHR data available within 24 hours of admission (‘first-day’ multi-condition EHR model) or during the entire hospitalization (‘full-stay’ multi-condition EHR model).18,19 For the pneumonia-specific models, we included all variables in our published multi-condition models as candidate predictors, including sociodemographics, prior utilization, Charlson Comorbidity Index, select laboratory and vital sign abnormalities, length of stay, hospital complications (eg, venous thromboembolism), vital sign instabilities, and disposition status (see Supplemental Table 1 for complete list of variables). We also assessed additional variables specific to pneumonia for inclusion that were: (1) available in the EHR of all participating hospitals; (2) routinely collected or available at the time of admission or discharge; and (3) plausible predictors of adverse outcomes based on literature and clinical expertise. These included select comorbidities (eg, psychiatric conditions, chronic lung disease, history of pneumonia),10,11,21,22 the pneumonia severity index (PSI),16,23,24 intensive care unit stay, and receipt of invasive or noninvasive ventilation. We used a modified PSI score because certain data elements were missing. The modified PSI (henceforth referred to as PSI) did not include nursing home residence and included diagnostic codes as proxies for the presence of pleural effusion (ICD-9-CM codes 510, 511.1, and 511.9) and altered mental status (ICD-9-CM codes 780.0X, 780.97, 293.0, 293.1, and 348.3X).
Statistical Analysis
Model Derivation. Candidate predictor variables were classified as available in the EHR within 24 hours of admission and/or at the time of discharge. For example, socioeconomic factors could be ascertained within the first day of hospitalization, whereas length of stay would not be available until the day of discharge. Predictors with missing values were assumed to be normal (less than 1% missing for each variable). Univariate relationships between readmission and each candidate predictor were assessed in the overall cohort using a pre-specified significance threshold of P ≤ 0.10. Significant variables were entered in the respective first-day and full-stay pneumonia-specific multivariable logistic regression models using stepwise-backward selection with a pre-specified significance threshold of P ≤ 0.05. In sensitivity analyses, we alternately derived our models using stepwise-forward selection, as well as stepwise-backward selection minimizing the Bayesian information criterion and Akaike information criterion separately. These alternate modeling strategies yielded identical predictors to our final models.
Model Validation. Model validation was performed using 5-fold cross-validation, with the overall cohort randomly divided into 5 equal-size subsets.25 For each cycle, 4 subsets were used for training to estimate model coefficients, and the fifth subset was used for validation. This cycle was repeated 5 times with each randomly-divided subset used once as the validation set. We repeated this entire process 50 times and averaged the C statistic estimates to derive an optimism-corrected C statistic. Model calibration was assessed qualitatively by comparing predicted to observed probabilities of readmission by quintiles of predicted risk, and with the Hosmer-Lemeshow goodness-of-fit test.
Comparison to Other Models. The main comparisons of the first-day and full-stay pneumonia-specific EHR model performance were to each other and the corresponding multi-condition EHR model.18,19 The multi-condition EHR models were separately derived and validated within the larger parent cohort from which this study cohort was derived, and outperformed the CMS all-cause model, the HOSPITAL model, and the LACE index.19 To further triangulate our findings, given the lack of other rigorously validated pneumonia-specific risk-prediction models for readmission,14 we compared the pneumonia-specific EHR models to the CMS pneumonia model derived from administrative claims data,10 and 2 commonly used risk-prediction scores for short-term mortality among patients with community-acquired pneumonia, the PSI and CURB-65 scores.16 Although derived and validated using patient-level data, the CMS model was developed to benchmark hospitals according to hospital-level readmission rates.10 The CURB-65 score in this study was also modified to include the same altered mental status diagnostic codes according to the modified PSI as a proxy for “confusion.” Both the PSI and CURB-65 scores were calculated using the most abnormal values within the first 24 hours of admission. The ‘updated’ PSI and the ‘updated’ CURB-65 were calculated using the most abnormal values within 24 hours prior to discharge, or the last known observation prior to discharge if no results were recorded within this time period. A complete list of variables for each of the comparison models are shown in Supplemental Table 1.
We assessed model performance by calculating the C statistic, integrated discrimination index, and net reclassification index (NRI) compared to our pneumonia-specific models. The integrated discrimination index is the difference in the mean predicted probability of readmission between patients who were and were not actually readmitted between 2 models, where more positive values suggest improvement in model performance compared to a reference model.26 The NRI is defined as the sum of the net proportions of correctly reclassified persons with and without the event of interest.27 Here, we calculated a category-based NRI to evaluate the performance of pneumonia-specific models in correctly classifying individuals with and without readmissions into the 2 highest readmission risk quintiles vs the lowest 3 risk quintiles compared to other models.27 This pre-specified cutoff is relevant for hospitals interested in identifying the highest risk individuals for targeted intervention.7 Finally, we assessed calibration of comparator models in our cohort by comparing predicted probability to observed probability of readmission by quintiles of risk for each model. We conducted all analyses using Stata 12.1 (StataCorp, College Station, Texas). This study was approved by the University of Texas Southwestern Medical Center Institutional Review Board.
RESULTS
Of 1463 index hospitalizations (Supplemental Figure 1), the 30-day all-cause readmission rate was 13.6%. Individuals with a 30-day readmission had markedly different sociodemographic and clinical characteristics compared to those not readmitted (Table 1; see Supplemental Table 2 for additional clinical characteristics).
Derivation, Validation, and Performance of the Pneumonia-Specific Readmission Risk-Prediction Models
The final first-day pneumonia-specific EHR model included 7 variables, including sociodemographic characteristics; prior hospitalizations; thrombocytosis, and PSI (Table 2). The first-day pneumonia-specific model had adequate discrimination (C statistic, 0.695; optimism-corrected C statistic 0.675, 95% confidence interval [CI], 0.667-0.685; Table 3). It also effectively stratified individuals across a broad range of risk (average predicted decile of risk ranged from 4% to 33%; Table 3) and was well calibrated (Supplemental Table 3).
The final full-stay pneumonia-specific EHR readmission model included 8 predictors, including 3 variables from the first-day model (median income, thrombocytosis, and prior hospitalizations; Table 2). The full-stay pneumonia-specific EHR model also included vital sign instabilities on discharge, updated PSI, and disposition status (ie, being discharged with home health or to a post-acute care facility was associated with greater odds of readmission, and hospice with lower odds). The full-stay pneumonia-specific EHR model had good discrimination (C statistic, 0.731; optimism-corrected C statistic, 0.714; 95% CI, 0.706-0.720), and stratified individuals across a broad range of risk (average predicted decile of risk ranged from 3% to 37%; Table 3), and was also well calibrated (Supplemental Table 3).
First-Day Pneumonia-Specific EHR Model vs First-Day Multi-Condition EHR Model
The first-day pneumonia-specific EHR model outperformed the first-day multi-condition EHR model with better discrimination (P = 0.029) and more correctly classified individuals in the top 2 highest risk quintiles vs the bottom 3 risk quintiles (Table 3, Supplemental Table 4, and Supplemental Figure 2A). With respect to calibration, the first-day multi-condition EHR model overestimated risk among the highest quintile risk group compared to the first-day pneumonia-specific EHR model (Figure 1A, 1B).
Full-Stay Pneumonia-Specific EHR Model vs Other Models
The full-stay pneumonia-specific EHR model comparatively outperformed the corresponding full-stay multi-condition EHR model, as well as the first-day pneumonia-specific EHR model, the CMS pneumonia model, the updated PSI, and the updated CURB-65 (Table 3, Supplemental Table 5, Supplemental Table 6, and Supplemental Figures 2B and 2C). Compared to the full-stay multi-condition and first-day pneumonia-specific EHR models, the full-stay pneumonia-specific EHR model had better discrimination, better reclassification (NRI, 0.09 and 0.08, respectively), and was able to stratify individuals across a broader range of readmission risk (Table 3). It also had better calibration in the highest quintile risk group compared to the full-stay multi-condition EHR model (Figure 1C and 1D).
Updated vs First-Day Modified PSI and CURB-65 Scores
The updated PSI was more strongly predictive of readmission than the PSI calculated on the day of admission (Wald test, 9.83; P = 0.002). Each 10-point increase in the updated PSI was associated with a 22% increased odds of readmission vs an 11% increase for the PSI calculated upon admission (Table 2). The improved predictive ability of the updated PSI and CURB-65 scores was also reflected in the superior discrimination and calibration vs the respective first-day pneumonia severity of illness scores (Table 3).
DISCUSSION
Using routinely available EHR data from 6 diverse hospitals, we developed 2 pneumonia-specific readmission risk-prediction models that aimed to allow hospitals to identify patients hospitalized with pneumonia at high risk for readmission. Overall, we found that a pneumonia-specific model using EHR data from the entire hospitalization outperformed all other models—including the first-day pneumonia-specific model using data present only on admission, our own multi-condition EHR models, and the CMS pneumonia model based on administrative claims data—in all aspects of model performance (discrimination, calibration, and reclassification). We found that socioeconomic status, prior hospitalizations, thrombocytosis, and measures of clinical severity and stability were important predictors of 30-day all-cause readmissions among patients hospitalized with pneumonia. Additionally, an updated discharge PSI score was a stronger independent predictor of readmissions compared to the PSI score calculated upon admission; and inclusion of the updated PSI in our full-stay pneumonia model led to improved prediction of 30-day readmissions.
The marked improvement in performance of the full-stay pneumonia-specific EHR model compared to the first-day pneumonia-specific model suggests that clinical stability and trajectory during hospitalization (as modeled through disposition status, updated PSI, and vital sign instabilities at discharge) are important predictors of 30-day readmission among patients hospitalized for pneumonia, which was not the case for our EHR-based multi-condition models.19 With the inclusion of these measures, the full-stay pneumonia-specific model correctly reclassified an additional 8% of patients according to their true risk compared to the first-day pneumonia-specific model. One implication of these findings is that hospitals interested in targeting their highest risk individuals with pneumonia for transitional care interventions could do so using the first-day pneumonia-specific EHR model and could refine their targeted strategy at the time of discharge by using the full-stay pneumonia model. This staged risk-prediction strategy would enable hospitals to initiate transitional care interventions for high-risk individuals in the inpatient setting (ie, patient education).7 Then, hospitals could enroll both persistent and newly identified high-risk individuals for outpatient interventions (ie, follow-up telephone call) in the immediate post-discharge period, an interval characterized by heightened vulnerability for adverse events,28 based on patients’ illness severity and stability at discharge. This approach can be implemented by hospitals by building these risk-prediction models directly into the EHR, or by extracting EHR data in near real time as our group has done successfully for heart failure.7
Another key implication of our study is that, for pneumonia, a disease-specific modeling approach has better predictive ability than using a multi-condition model. Compared to multi-condition models, the first-day and full-stay pneumonia-specific EHR models correctly reclassified an additional 6% and 9% of patients, respectively. Thus, hospitals interested in identifying the highest risk patients with pneumonia for targeted interventions should do so using the disease-specific models, if the costs and resources of doing so are within reach of the healthcare system.
An additional novel finding of our study is the added value of an updated PSI for predicting adverse events. Studies of pneumonia severity of illness scores have calculated the PSI and CURB-65 scores using data present only on admission.16,24 While our study also confirms that the PSI calculated upon admission is a significant predictor of readmission,23,29 this study extends this work by showing that an updated PSI score calculated at the time of discharge is an even stronger predictor for readmission, and its inclusion in the model significantly improves risk stratification and prognostication.
Our study was noteworthy for several strengths. First, we used data from a common EHR system, thus potentially allowing for the implementation of the pneumonia-specific models in real time across a number of hospitals. The use of routinely collected data for risk-prediction modeling makes this approach scalable and sustainable, because it obviates the need for burdensome data collection and entry. Second, to our knowledge, this is the first study to measure the additive influence of illness severity and stability at discharge on the readmission risk among patients hospitalized with pneumonia. Third, our study population was derived from 6 hospitals diverse in payer status, age, race/ethnicity, and socioeconomic status. Fourth, our models are less likely to be overfit to the idiosyncrasies of our data given that several predictors included in our final pneumonia-specific models have been associated with readmission in this population, including marital status,13,30 income,11,31 prior hospitalizations,11,13 thrombocytosis,32-34 and vital sign instabilities on discharge.17 Lastly, the discrimination of the CMS pneumonia model in our cohort (C statistic, 0.64) closely matched the discrimination observed in 4 independent cohorts (C statistic, 0.63), suggesting adequate generalizability of our study setting and population.10,12
Our results should be interpreted in the context of several limitations. First, generalizability to other regions beyond north Texas is unknown. Second, although we included a diverse cohort of safety net, community, teaching, and nonteaching hospitals, the pneumonia-specific models were not externally validated in a separate cohort, which may lead to more optimistic estimates of model performance. Third, PSI and CURB-65 scores were modified to use diagnostic codes for altered mental status and pleural effusion, and omitted nursing home residence. Thus, the independent associations for the PSI and CURB-65 scores and their predictive ability are likely attenuated. Fourth, we were unable to include data on medications (antibiotics and steroid use) and outpatient visits, which may influence readmission risk.2,9,13,35-40 Fifth, we included only the first pneumonia hospitalization per patient in this study. Had we included multiple hospitalizations per patient, we anticipate better model performance for the 2 pneumonia-specific EHR models since prior hospitalization was a robust predictor of readmission.
In conclusion, the full-stay pneumonia-specific EHR readmission risk-prediction model outperformed the first-day pneumonia-specific model, multi-condition EHR models, and the CMS pneumonia model. This suggests that: measures of clinical severity and stability at the time of discharge are important predictors for identifying patients at highest risk for readmission; and that EHR data routinely collected for clinical practice can be used to accurately predict risk of readmission among patients hospitalized for pneumonia.
Acknowledgments
The authors would like to acknowledge Ruben Amarasingham, MD, MBA, president and chief executive officer of Parkland Center for Clinical Innovation, and Ferdinand Velasco, MD, chief health information officer at Texas Health Resources for their assistance in assembling the 6-hospital cohort used in this study.
Disclosures
This work was supported by the Agency for Healthcare Research and Quality-funded UT Southwestern Center for Patient-Centered Outcomes Research (R24 HS022418-01); the Commonwealth Foundation (#20100323); the UT Southwestern KL2 Scholars Program supported by the National Institutes of Health (KL2 TR001103 to ANM and OKN); and the National Center for Advancing Translational Sciences at the National Institute of Health (U54 RFA-TR-12-006 to E.A.H.). The study sponsors had no role in design and conduct of the study; collection, management, analysis, and interpretation of the data; and preparation, review, or approval of the manuscript. The authors have no financial conflicts of interest to disclose
1. Centers for Disease Control and Prevention. Pneumonia. http://www.cdc.gov/nchs/fastats/pneumonia.htm. Accessed January 26, 2016.
33. Prina E, Ferrer M, Ranzani OT, et al. Thrombocytosis is a marker of poor outcome in community-acquired pneumonia. Chest. 2013;143(3):767-775. PubMed
34. Violi F, Cangemi R, Calvieri C. Pneumonia, thrombosis and vascular disease. J Thromb Haemost. 2014;12(9):1391-1400. PubMed
35. Weinberger M, Oddone EZ, Henderson WG. Does increased access to primary care reduce hospital readmissions? Veterans Affairs Cooperative Study Group on Primary Care and Hospital Readmission. N Engl J Med. 1996;334(22):1441-1447. PubMed
36. Field TS, Ogarek J, Garber L, Reed G, Gurwitz JH. Association of early post-discharge follow-up by a primary care physician and 30-day rehospitalization among older adults. J Gen Intern Med. 2015;30(5):565-571. PubMed
37. Spatz ES, Sheth SD, Gosch KL, et al. Usual source of care and outcomes following acute myocardial infarction. J Gen Intern Med. 2014;29(6):862-869. PubMed
38. Brooke BS, Stone DH, Cronenwett JL, et al. Early primary care provider follow-up and readmission after high-risk surgery. JAMA Surg. 2014;149(8):821-828. PubMed
39. Adamuz J, Viasus D, Campreciós-Rodriguez P, et al. A prospective cohort study of healthcare visits and rehospitalizations after discharge of patients with community-acquired pneumonia. Respirology. 2011;16(7):1119-1126. PubMed
40. Shorr AF, Zilberberg MD, Reichley R, et al. Readmission following hospitalization for pneumonia: the impact of pneumonia type and its implication for hospitals. Clin Infect Dis. 2013;57(3):362-367. PubMed
© 2017 Society of Hospital Medicine