User login
Are antibiotics beneficial for patients with sinusitis complaints?
- If the goal of treating sinusitis with antibiotics is to cure purulent nasal discharge, we are likely over-treating; as our study showed, after 2 weeks most patients in the treatment and placebo groups still had nasal symptoms (A).
- Persons with higher scores on the clinical prediction rule for sinusitis are no more likely to improve with antibiotic treatment than are those with lower scores (A).
- Among those who did improve on antibiotics, a subgroup that could not be clinically characterized improved at a much quicker rate than the others. Until further clinical trials can describe this favorable clinical profile, routine prescribing of antibiotics for sinusitis should be avoided (A).
Background: Sinusitis is the fifth most common reason for patients to visit primary care physicians, yet clinical outcomes relevant to patients are seldom studied.
Objective To determine whether patients with purulent rhinitis, “sinusitis-type symptoms,” improved with antibiotics. Second, to examine a clinical prediction rule to provide preliminary validation data.
Methods: Prospective clinical trial, with double-blinded placebo controlled randomization. The setting was a suburb of Washington, DC, from Oct 1, 2001, to March 31, 2003. All participants were 18 years or older, presenting to a family practice clinic with a complaint of sinusitis and with pus in the nasal cavity, facial pressure, or nasal discharge lasting longer than 7 days. The main outcome measures were resolution of symptoms within a 14-day follow-up period and the time to improvement (days).
Results: After exclusion criteria, 135 patients were randomized to either placebo (n=68) or amoxicillin (n=67) for 10 days. Intention-to-treat analyses showed that 32 (48%) of the amoxicillin group vs 25 (37%) of the placebo group (P=.26) showed complete improvement by the end of the 2-week follow-up period (relative risk=1.3; 95% confidence interval [CI], 0.87–1.94]). Although the rates of improvement were not statistically significantly different at the end of 2 weeks, the amoxicillin group improved significantly earlier, in the course of treatment, a median of 8 vs 12 days, than did the placebo group (P=.039).
Conclusion: For most patients with sinusitis-type complaints, no improvement was seen with antibiotics over placebo. For those who did improve, data suggested there is a subgroup of patients who may benefit from antibiotics.
It is estimated that adults have 2 to 3 colds a year, of which just 0.5% to 2% are complicated by bacterial sinusitis. However, primary care physicians treat over half of these colds with antibiotics.1 Sinusitis is the fifth most common diagnosis for which antibiotics are prescribed in the outpatient setting, with more than $6 billion spent annually in the United States on prescription and over-the-counter medications.1-3 Can we know with greater certainty when antibiotics are indicated for sinusitis?
A meta-analysis of randomized controlled studies has shown that the likelihood of bacterial sinusitis is increased (sensitivity 76%, specificity 79%) and antibiotics are helpful when a patient exhibits at least 3 of 4 cardinal clinical features: 1) purulent nasal discharge predominating on one side; 2) local facial pain predominating on one side; 3) purulent nasal discharge on both sides; and 4) pus in the nasal cavity.2 Although use of these criteria is encouraged, they are based on studies that recruited patients from subspecialty clinics and measured disease-oriented outcomes such as findings on sinus radiographs, CT scans, and sinus puncture with culture.4-12 Most cases of sinusitis, however, are treated in primary care settings where measuring such outcomes is impractical.
Given the lack of epidemiologic evidence as to which patients would benefit from treatment of sinusitis, primary care physicians face the dilemma of deciding during office encounters which patients should receive antibiotics and which have a viral infection for which symptomatic treatment is indicated.13
Our goal was to study the type of patient for whom this dilemma arises and to use clinical improvement as our primary outcome. We randomly assigned patients presenting with sinusitis complaints to receive amoxicillin or placebo, and compared the rates of improvement, time to improvement, and patient’s self-rating of sickness at the end of 2 weeks. We also tested the clinical prediction rule to see if participants with 3 or 4 signs and symptoms had different clinical outcomes than the others.
Methods
Setting
We conducted a randomized double-blind clinical trial of amoxicillin vs placebo. All patients were recruited from a suburban primary care office. Two physicians and one nurse practitioner enrolled and treated all patients over an 18-month period (Oct 1, 2001 to March 31, 2003). The clinicians involved in the study were trained to identify purulent discharge in the nasal cavity. Institutional Review Board approval was obtained from Georgetown University prior to the study. Written informed consent was obtained from all participating patients.
Patients
Patients were eligible to participate if they were 18 years or older; had at least 1 cardinal feature described by the clinical prediction rule: 1) purulent nasal discharge predominating on one side, 2) local facial pain predominating on one side, 3) purulent nasal discharge on both sides, or 4) pus in the nasal cavity; and had symptoms for at least 7 days. Patients were excluded if their histories included antibiotic treatment within the past month, allergy to penicillin, sinus surgery, compromised immunity, pneumonia, or streptococcal pharyngitis.
Randomization
Permuted block randomization stratified for the 3 participating clinicians was used to determine treatment assignment. Patients were given an envelope containing 40 capsules, either a placebo medicine taken twice daily for 10 days or 1000 mg of amoxicillin (500 mg pills) taken twice daily for 10 days. The envelopes were opaque, and each had 40 identical-appearing pills (to ensure allocation concealment). The participating clinicians were naive to the treatment assignments.
Assessment of outcomes
Trained personnel, masked to treatment assignment, conducted follow-up telephone interviews on days 3, 7, and 14 following patients’ visits for sinusitis, to assess clinical improvement. Twelve follow-up questions were asked.
Sample size
The primary outcome used to determine sample size was dichotomous—either “improved” or “not improved” by the end of 2 weeks. Thus, patients were asked, “what day were you entirely improved.” The sample sizes obtained per group (67 for amoxicillin and 68 for placebo) provided 80% power for detecting a change of 25% in rates of improvement.
Statistical analysis
Basic descriptive statistics were used to describe the groups. Baseline characteristics were compared between the 2 groups using chi-square test and Fisher’s exact test for categorical variables. For continuous variables, the Student’s t-test was used; the Wilcoxon Rank Sum test was used for ordinal or skewed variables. Similar statistical tests were used to compare baseline characteristics between the providers and also at the conclusion of the study between the responders for each group.
For the outcome variables, we hypothesized no difference between the groups either in the rates of improvement, times to improvement, or in patients’ self-rating of sickness. The actual proportions improving between the 2 groups were compared using the chi-square test. Relative risk estimates and 95% confidence intervals were calculated to provide measures of risk and precision. Multiple logistic regression was used to compare the rates of improvement adjusting for the number of signs or symptoms classified as either 1, 2, or 3–4, obtained from the clinical prediction rule (Table 1).
The Kaplan-Meier method was used to construct the curves showing the time until patient improvement for each treatment group. The Wilcoxon test was then used to test the statistical significance in these curves (Figure). Cox’s Proportional Hazards regression was used to test for differences in the time to improvement between the groups adjusting for the number of signs or symptoms.
Additionally, a univariate repeated measures analysis of variance model was constructed to compare the 10-point Likert scale scores for the question, “How sick do you feel today?” In this model, the number of signs and symptoms was entered as a covariate in the analysis. Orthogonal contrasts were used as post-hoc tests to compare the difference between the groups within each time point (Table 2 ).
For the subgroup of patients who improved, analysis of covariance was used to compare the mean number of days to improvement between the groups. In this case the number of signs and symptoms was used as the covariate (Table 3). The Kaplan-Meier method and the Wilcoxon test were used to compare the cumulative rates of improvement (Figure). Unadjusted P-values are reported.
Primary analyses were performed using the intention-to-treat principle. All statistical analyses were performed using JMP Software (Product of SAS Institute Inc, Cary, NC). Statistical significance was set at 0.05 and exact P-values are reported.
TABLE 1
Baseline characteristics for amoxicillin and placebo groups
| Characteristic | Placebo (n=68) | Amoxicillin (n=67) |
|---|---|---|
| Purulent nasal discharge predominating on 1 side (%) | 28 (41) | 33 (49) |
| Local facial pain predominating on 1 side (%) | 25 (37) | 28 (42) |
| Purulent nasal discharge on both sides (%) | 45 (66) | 49 (73) |
| Pus in the nasal cavity assessed by provider (%) | 20 (29) | 23 (34) |
| Number of symptoms (%) | ||
| 1 | 34 (50) | 29 (43) |
| 2 | 17 (25) | 11 (17) |
| 3–4 | 17 (25) | 27 (40) |
| Female (%) | 49 (73) | 44 (66) |
| Tobacco use (%) | 6 (9) | 2 (3) |
| Over-the-counter medicines used for sinusitis (%) | 55 (89) | 58 (91) |
| Age mean (SD) | 32.6 (9.5) | 35.1 (10.1) |
| Length of symptoms prior to enrollment in mean days (SD) | 11.7 (6.3) | 10.7 (5.0) |
| Temperature in Fahrenheit mean (SD) | 97.9 (.8) | 97.9 (1.0) |
| Self-rating of health* mean (SD) | 3.1 (2.6) | 3.1 (2.4) |
| Self-rating of severity of cough* mean (SD) | 5.8 (2.5) | 5.1 (2.7) |
| Self-rating of how sick patient feels at enrollment* mean (SD) | 6.3 (1.9) | 6.2 (2.0) |
| Self-rating of severity of headache* mean (SD) | 5.3 (3.1) | 5.6 (2.8) |
| Percentages not always equal to 100%, due to missing data. All P <.05 | ||
| Represents Likert scale from 1 to 10; 1 being perfect to 10 being absolute worst case. | ||
Figure
Kaplan-Meier curve for improvement—amoxicillin (n=67) vs placebo (n=68)*

TABLE 2
Comparison of mean Likert scores by group across follow-up time points Question asked at each time point:
| “On a scale of 1 to 10, How sick do you feel today?”* | |||
|---|---|---|---|
| Time† | Amoxicillin (n=67) | Placebo (n=68) | P value |
| Day 0 (SD) | 6.10 (2.0) | 6.30 (1.9) | NS |
| Day 3 (SD) | 4.33 (1.8) | 4.73 (1.9) | NS |
| Day 7 (SD) | 3.15 (2.1) | 3.30 (2.0) | NS |
| Day 14 (SD) | 2.30 (1.9) | 2.80 (2.5) | NS |
| Likert score of 1 represents “perfect health” to 10 representing “worst condition.” | |||
| * Statistical tests—Orthogonal contrasts. | |||
| † Data shown represent mean and standard deviation (SD). | |||
TABLE 3
Mean number of days to improvement by group and number of signs and symptoms (at baseline) for patients who improved
| Number of signs and symptoms | Amoxicillin (n=32) | Placebo (n=25) |
|---|---|---|
| (1) Mean (n, SD) | 7.8 days (16, 3.7) | 11.0 days (10, 2.6) |
| (2) Mean (n, SD) | 7.8 days (5, 3.7) | 10.3 days (6, 3.2) |
| (3–4) Mean (n, SD) | 8.6 days (11, 3.6) | 10.6 days (9, 3.0) |
| Signs and symptoms are: purulent (yellow, thick) nasal discharge predominating on 1 side, local facial pain predominating on 1 side, purulent nasal discharge on both sides, and pus in the nasal cavity. | ||
Results
During the 18-month enrollment period, the 3 providers recorded all patients aged >18 years who had at least 1 cardinal feature described by the clinical prediction rule and had symptoms for a minimum of 7 days. Thus, initially 308 patients were approached for enrollment; 173 patients did not qualify after the exclusion criteria were applied, leaving 135 patients for randomization. Sixty-seven received amoxicillin and 68 received placebo. For 11 patients in the amoxicillin arm and 8 in the placebo arm, only baseline data were collected. These patients were then considered as lost to follow-up and were counted as “not improved” in the intention-to-treat analysis.
There were no significant differences (P >.05) in baseline characteristics of the treatment groups (Table 1). Additionally, there were no significant differences in the baseline characteristics between the providers (data not shown).
In the amoxicillin group 32 (48%) had completely improved compared with 25 (37%) in the placebo group (P=.26) after 2 weeks (relative risk of treatment failure=1.3; 95% CI, 0.87–1.94). However, individuals in the amoxicillin group did improve significantly earlier, as the Kaplan-Meier curve demonstrates (Figure). The first person in the amoxicillin group improved on day 3, compared with day 7 in the placebo group. This earlier improvement continued throughout the study (P=.039).
Subgroup analysis of the 57 who demonstrated complete recovery shows the amoxicillin group improved earlier as does the Kaplan-Meier curves in the Figure. In the amoxicillin group, the median day to any improvement was day 8 compared with day 12 for the placebo group (P=.005), while the mean day to improvement for the amoxicillin group was 8.1 days vs 10.7 days for placebo group.
When patients were asked “How sick do you feel today,” the average Likert scores decreased from 6. 1 (day 0) to 2.3 (day 14), and 6.3 (day 0) to 2.8 (day 14), in the amoxicillin and placebo groups, respectively. At each time point, there were no significant clinical or statistical differences between the 2 groups in how they rated their improvement (Table 2). Furthermore, examining only those who reported total improvement within 14 days showed no differences among groups.
No statistically significant differences were observed between the treatment groups that entailed the clinical prediction rule. However, in the patients who were improved at 14 days, the average number of days to improvement was consistently between 2 to 2.5 days shorter in the amoxicillin group compared with placebo (Table 3).
Side effects
No patients dropped out of the study due to adverse side effects (Table 4). There were no serious or unexpected side effects, with the majority related to gastrointestinal problems, such as diarrhea and abdominal pain.
TABLE 4
A Frequency of reported side effects by group
| Amoxicillin Adverse effects | Placebo (n=57) | (n=59) |
|---|---|---|
| Total number of patients with any side effects | 13 | 7 |
| Diarrhea | 4 | 1 |
| Nausea | 4 | 5 |
| Emesis | 1 | 0 |
| Abdominal pain | 2 | 1 |
| Rash | 2 | 0 |
| Hot flashes | 0 | 1 |
| Jittery | 0 | 1 |
| Dizziness | 3 | 0 |
| Dry mouth | 1 | 0 |
| Vaginal infection | 2 | 0 |
| Multiple events per patient are possible. | ||
Discussion
With respect to the patient-oriented outcome of clinical improvement, amoxicillin provided no significant benefit over placebo in the treatment of patients presenting with sinusitis complaints. On average our patients who had symptoms for 11 days prior to enrollment and are typical of patients that are often recommended for treatment with antibiotics.14,15
Our findings are consistent with others in which the overall benefit of antibiotics was minimal or nonexistent.16,18 But among individuals who did improve, those who received amoxicillin improved much earlier, both clinically and statistically. Unfortunately we were not able to specify those who are likely to improve. Clearly, further patient-oriented outcome studies are needed to help primary care physicians decide which patients may benefit from antibiotic treatment.
Antibiotics have not been shown to prevent the sequelae of acute sinusitis. One of the major difficulties in treating sinusitis is the lack of agreement about which outcomes are desired.19,20 Nearly 66% of patients diagnosed with sinusitis will get better without treatment, though nearly two thirds of patients will continue to have such symptoms as cough and nasal discharge for up to 3 weeks.21,22 Thus, we believe that to give antibiotics only to individuals who would truly benefit from them, policy makers, primary care physicians, and patients need to reassess clinically what constitutes sinusitis, and what outcomes are most desired. If the goal is to cure purulent nasal discharge, we are likely over-treating with antibiotics; as our study showed, after 2 weeks most patients in both groups still had nasal symptoms.
Our pilot of the clinical prediction rule failed to predict a proper response to antibiotics or the time to improvement. Although our numbers were not large, no trend was observed towards improvement in individuals with a higher score on the clinical prediction rule.
Our study has some important limitations. Interestingly we found different results when we used the dichotomous outcome of totally improved versus the 10-point Likert scale. A priori we decided our primary outcome was the dichotomous improvement, but which measure is more important and should be used is open to varying interpretations. Additionally, our study office unexpectedly closed and thus we could not recruit the number of patients we initially had planned. This limited our power to find differences between groups based on the number of cardinal clinical features. We encountered noncompliance with follow-up, as expected with the study design. We also arbitrarily stopped follow-up at 14 days, and cases that had not entirely improved were considered clinical failures in all but the Likert scale analysis. It is possible our results may have differed if we had continued to follow patients at 21 or 28 days, or if we had conducted the study at more than one office.
Methodologically, we conducted a rigorous study and showed that patients diagnosed with clinical sinusitis fared no better with amoxicillin or placebo, when measuring the patient-oriented outcome of complete improvement. But a subgroup of patients who were given antibiotics did improve at a much quicker rate. The difficulty is in clinically identifying this group and treating them with antibiotics. Conversely, using antibiotics in patients unnecessarily would only cause potential individual and societal harm. More clinically oriented studies need to be conducted to address this issue and elucidate what signs and symptoms these patients exhibit, to help clarify who should be treated with antibiotics.
ACKNOWLEDGMENTS
When this article was prepared, Dan Merenstein was an assistant professor of Family Medicine and Pediatrics at Georgetown University. This study was part of the Capricorn Research Network of Georgetown University. This projectwas supported by a grant from the American Academy ofFamily Physicians and the American Academy of FamilyPhysicians Foundation “Joint AAFP/F-AAFP Grant AwardsProgram” (JGAP). Support was also provided by the CapitolArea Primary Care Research Network. Research presentedat NAPRCG 2003, Banff, Canada.
We thank Joel Merenstein for insightful feedback and intelligent comments about study design and input with manuscript. We thank Goutham Rao and Traci Reisner for editorial help. We thank Community Drug Compounding Center of Pittsburgh and pharmacist Susan Freedenberg for drug development.
Corresponding author
Dan Merenstein, MD, Robert Wood Johnson Clinical Scholar, The Johns Hopkins Hospital, 600 North Wolfe St., Carnegie 291, Baltimore, MD 21287-6220. E-mail: [email protected].
1. Leggett JE. Acute sinusitis. When—and when not—to prescribe antibiotics. Postgrad Med 2004;115(1):13-19.
2. Lau J, et al. Diagnosis and treatment of acute bacterial rhinosinusitis. Evidence Report #9. Rockville, Md: Agency for Health Care Policy and Research; 1999.
3. Brooks I, Gooch WM, 3rd, Jenkins SG, et al. Medical management of acute bacterial sinusitis. Recommendations of a clinical advisory committee on pediatric and adult sinusitis. Ann Otol Rhinol Laryngol Suppl 2000;182:2-20.
4. Williams JW, Jr, Holleman DR, Jr, Samsa GP, Simel DL. Randomized controlled trial of 3 vs 10 days of trimethoprim/sulfamethoxazole for acute maxillary sinusitis. JAMA 1995;273:1015-1021.
5. Williams JW, Jr, Simel DL. Does this patient have sinusitis? Diagnosing acute sinusitis by history and physical examination. JAMA 1993;270:1242-1246.
6. Williams JW, Jr, Simel DL, Roberts L, Samsa GP. Clinical evaluation for sinusitis. Making the diagnosis by history and physical examination. Ann Intern Med 1992;117:705-710.
7. Wald ER, Chiponis D, Ledesma-Medina J. Comparative effectiveness of amoxicillin and amoxicillin-clavulanate potassium in acute paranasal sinus infections in children: a double-blind, placebo-controlled trial. Pediatrics 1986;77:795-800.
8. van Duijn NP, Brouwer HJ, Lamberts H. Use of symptoms and signs to diagnose maxillary sinusitis in general practice: comparison with ultrasonography. BMJ 1992;305:684-687.
9. Alho OP, Ylitalo K, Jokinen K, et al. The common cold in patients with a history of recurrent sinusitis: increased symptoms and radiologic sinusitislike findings. J Fam Pract 2001;50:26-31.
10. Berg O, Carenfelt C. Analysis of symptoms and clinical signs in the maxillary sinus empyema. Acta Otolaryngol 1988;105:343-349.
11. Okuyemi KS, Tsue TT. Radiologic imaging in the management of sinusitis. Am Fam Physician 2002;66:1882-1886.
12. Engels EA, Terrin N, Barza M, Lau J. Meta-analysis of diagnostic tests for acute sinusitis. J Clin Epidemiol 2000;53:852-862.
13. Poole MD. A focus on acute sinusitis in adults: changes in disease management. Am J Med 1999;106:38S-47S;discussion 48S-52S.
14. Desrosiers M, Frankiel S, Hamid QA, et al. Acute bacterial sinusitis in adults: management in the primary care setting. J Otolaryngol 2002;31 Suppl 2:2S2-14.
15. Lindbaek M. Acute sinusitis: guide to selection of anti-bacterial therapy. Drugs 2004;64:805-819.
16. De Sutter AI, De Meyere MJ, Christiaens TC, Van Driel ML, Peersman W, De Maeseneer JM. Does amoxicillin improve outcomes in patients with purulent rhinorrhea? J Fam Pract 2002;51:317-323.
17. Bucher HC, Tschudi P, Young J, et al. BASINUS (Basel Sinusitis Study) Investigators Effect of amoxicillin-clavulanate in clinically diagnosed acute rhinosinusitis: a placebo-controlled, double-blind, randomized trial in general practice. Arch Intern Med 2003;163:1793-1798.
18. Varonen H, Kunnamo I, Savolainen S, et al. Treatment of acute rhinosinusitis diagnosed by clinical criteria or ultrasound in primary care. A placebo-controlled randomised trial. Scand J Prim Health Care 2003;21:121-126.
19. Linder JA, Singer DE, Ancker M, Atlas SJ. Measures of health-related quality of life for adults with acute sinusitis. A systematic review. J Gen Intern Med 2003;18:390-401.
20. Theis J, Oubichon T. Are antibiotics helpful for acute maxillary sinusitis? J Fam Pract 2003;52:490-492;discussion 491.-
21. de Ferranti SD, Ioannidis JP, Lau J, Anninger WV, Barza M. Are amoxycillin and folate inhibitors as effective as other antibiotics for acute sinusitis? A meta-analysis. BMJ 1998;317:632-637.
22. Scott J, Orzano AJ. Evaluation and treatment of the patient with acute undifferentiated respiratory tract infection. J Fam Pract 2001;50:1070-1077.
- If the goal of treating sinusitis with antibiotics is to cure purulent nasal discharge, we are likely over-treating; as our study showed, after 2 weeks most patients in the treatment and placebo groups still had nasal symptoms (A).
- Persons with higher scores on the clinical prediction rule for sinusitis are no more likely to improve with antibiotic treatment than are those with lower scores (A).
- Among those who did improve on antibiotics, a subgroup that could not be clinically characterized improved at a much quicker rate than the others. Until further clinical trials can describe this favorable clinical profile, routine prescribing of antibiotics for sinusitis should be avoided (A).
Background: Sinusitis is the fifth most common reason for patients to visit primary care physicians, yet clinical outcomes relevant to patients are seldom studied.
Objective To determine whether patients with purulent rhinitis, “sinusitis-type symptoms,” improved with antibiotics. Second, to examine a clinical prediction rule to provide preliminary validation data.
Methods: Prospective clinical trial, with double-blinded placebo controlled randomization. The setting was a suburb of Washington, DC, from Oct 1, 2001, to March 31, 2003. All participants were 18 years or older, presenting to a family practice clinic with a complaint of sinusitis and with pus in the nasal cavity, facial pressure, or nasal discharge lasting longer than 7 days. The main outcome measures were resolution of symptoms within a 14-day follow-up period and the time to improvement (days).
Results: After exclusion criteria, 135 patients were randomized to either placebo (n=68) or amoxicillin (n=67) for 10 days. Intention-to-treat analyses showed that 32 (48%) of the amoxicillin group vs 25 (37%) of the placebo group (P=.26) showed complete improvement by the end of the 2-week follow-up period (relative risk=1.3; 95% confidence interval [CI], 0.87–1.94]). Although the rates of improvement were not statistically significantly different at the end of 2 weeks, the amoxicillin group improved significantly earlier, in the course of treatment, a median of 8 vs 12 days, than did the placebo group (P=.039).
Conclusion: For most patients with sinusitis-type complaints, no improvement was seen with antibiotics over placebo. For those who did improve, data suggested there is a subgroup of patients who may benefit from antibiotics.
It is estimated that adults have 2 to 3 colds a year, of which just 0.5% to 2% are complicated by bacterial sinusitis. However, primary care physicians treat over half of these colds with antibiotics.1 Sinusitis is the fifth most common diagnosis for which antibiotics are prescribed in the outpatient setting, with more than $6 billion spent annually in the United States on prescription and over-the-counter medications.1-3 Can we know with greater certainty when antibiotics are indicated for sinusitis?
A meta-analysis of randomized controlled studies has shown that the likelihood of bacterial sinusitis is increased (sensitivity 76%, specificity 79%) and antibiotics are helpful when a patient exhibits at least 3 of 4 cardinal clinical features: 1) purulent nasal discharge predominating on one side; 2) local facial pain predominating on one side; 3) purulent nasal discharge on both sides; and 4) pus in the nasal cavity.2 Although use of these criteria is encouraged, they are based on studies that recruited patients from subspecialty clinics and measured disease-oriented outcomes such as findings on sinus radiographs, CT scans, and sinus puncture with culture.4-12 Most cases of sinusitis, however, are treated in primary care settings where measuring such outcomes is impractical.
Given the lack of epidemiologic evidence as to which patients would benefit from treatment of sinusitis, primary care physicians face the dilemma of deciding during office encounters which patients should receive antibiotics and which have a viral infection for which symptomatic treatment is indicated.13
Our goal was to study the type of patient for whom this dilemma arises and to use clinical improvement as our primary outcome. We randomly assigned patients presenting with sinusitis complaints to receive amoxicillin or placebo, and compared the rates of improvement, time to improvement, and patient’s self-rating of sickness at the end of 2 weeks. We also tested the clinical prediction rule to see if participants with 3 or 4 signs and symptoms had different clinical outcomes than the others.
Methods
Setting
We conducted a randomized double-blind clinical trial of amoxicillin vs placebo. All patients were recruited from a suburban primary care office. Two physicians and one nurse practitioner enrolled and treated all patients over an 18-month period (Oct 1, 2001 to March 31, 2003). The clinicians involved in the study were trained to identify purulent discharge in the nasal cavity. Institutional Review Board approval was obtained from Georgetown University prior to the study. Written informed consent was obtained from all participating patients.
Patients
Patients were eligible to participate if they were 18 years or older; had at least 1 cardinal feature described by the clinical prediction rule: 1) purulent nasal discharge predominating on one side, 2) local facial pain predominating on one side, 3) purulent nasal discharge on both sides, or 4) pus in the nasal cavity; and had symptoms for at least 7 days. Patients were excluded if their histories included antibiotic treatment within the past month, allergy to penicillin, sinus surgery, compromised immunity, pneumonia, or streptococcal pharyngitis.
Randomization
Permuted block randomization stratified for the 3 participating clinicians was used to determine treatment assignment. Patients were given an envelope containing 40 capsules, either a placebo medicine taken twice daily for 10 days or 1000 mg of amoxicillin (500 mg pills) taken twice daily for 10 days. The envelopes were opaque, and each had 40 identical-appearing pills (to ensure allocation concealment). The participating clinicians were naive to the treatment assignments.
Assessment of outcomes
Trained personnel, masked to treatment assignment, conducted follow-up telephone interviews on days 3, 7, and 14 following patients’ visits for sinusitis, to assess clinical improvement. Twelve follow-up questions were asked.
Sample size
The primary outcome used to determine sample size was dichotomous—either “improved” or “not improved” by the end of 2 weeks. Thus, patients were asked, “what day were you entirely improved.” The sample sizes obtained per group (67 for amoxicillin and 68 for placebo) provided 80% power for detecting a change of 25% in rates of improvement.
Statistical analysis
Basic descriptive statistics were used to describe the groups. Baseline characteristics were compared between the 2 groups using chi-square test and Fisher’s exact test for categorical variables. For continuous variables, the Student’s t-test was used; the Wilcoxon Rank Sum test was used for ordinal or skewed variables. Similar statistical tests were used to compare baseline characteristics between the providers and also at the conclusion of the study between the responders for each group.
For the outcome variables, we hypothesized no difference between the groups either in the rates of improvement, times to improvement, or in patients’ self-rating of sickness. The actual proportions improving between the 2 groups were compared using the chi-square test. Relative risk estimates and 95% confidence intervals were calculated to provide measures of risk and precision. Multiple logistic regression was used to compare the rates of improvement adjusting for the number of signs or symptoms classified as either 1, 2, or 3–4, obtained from the clinical prediction rule (Table 1).
The Kaplan-Meier method was used to construct the curves showing the time until patient improvement for each treatment group. The Wilcoxon test was then used to test the statistical significance in these curves (Figure). Cox’s Proportional Hazards regression was used to test for differences in the time to improvement between the groups adjusting for the number of signs or symptoms.
Additionally, a univariate repeated measures analysis of variance model was constructed to compare the 10-point Likert scale scores for the question, “How sick do you feel today?” In this model, the number of signs and symptoms was entered as a covariate in the analysis. Orthogonal contrasts were used as post-hoc tests to compare the difference between the groups within each time point (Table 2 ).
For the subgroup of patients who improved, analysis of covariance was used to compare the mean number of days to improvement between the groups. In this case the number of signs and symptoms was used as the covariate (Table 3). The Kaplan-Meier method and the Wilcoxon test were used to compare the cumulative rates of improvement (Figure). Unadjusted P-values are reported.
Primary analyses were performed using the intention-to-treat principle. All statistical analyses were performed using JMP Software (Product of SAS Institute Inc, Cary, NC). Statistical significance was set at 0.05 and exact P-values are reported.
TABLE 1
Baseline characteristics for amoxicillin and placebo groups
| Characteristic | Placebo (n=68) | Amoxicillin (n=67) |
|---|---|---|
| Purulent nasal discharge predominating on 1 side (%) | 28 (41) | 33 (49) |
| Local facial pain predominating on 1 side (%) | 25 (37) | 28 (42) |
| Purulent nasal discharge on both sides (%) | 45 (66) | 49 (73) |
| Pus in the nasal cavity assessed by provider (%) | 20 (29) | 23 (34) |
| Number of symptoms (%) | ||
| 1 | 34 (50) | 29 (43) |
| 2 | 17 (25) | 11 (17) |
| 3–4 | 17 (25) | 27 (40) |
| Female (%) | 49 (73) | 44 (66) |
| Tobacco use (%) | 6 (9) | 2 (3) |
| Over-the-counter medicines used for sinusitis (%) | 55 (89) | 58 (91) |
| Age mean (SD) | 32.6 (9.5) | 35.1 (10.1) |
| Length of symptoms prior to enrollment in mean days (SD) | 11.7 (6.3) | 10.7 (5.0) |
| Temperature in Fahrenheit mean (SD) | 97.9 (.8) | 97.9 (1.0) |
| Self-rating of health* mean (SD) | 3.1 (2.6) | 3.1 (2.4) |
| Self-rating of severity of cough* mean (SD) | 5.8 (2.5) | 5.1 (2.7) |
| Self-rating of how sick patient feels at enrollment* mean (SD) | 6.3 (1.9) | 6.2 (2.0) |
| Self-rating of severity of headache* mean (SD) | 5.3 (3.1) | 5.6 (2.8) |
| Percentages not always equal to 100%, due to missing data. All P <.05 | ||
| Represents Likert scale from 1 to 10; 1 being perfect to 10 being absolute worst case. | ||
Figure
Kaplan-Meier curve for improvement—amoxicillin (n=67) vs placebo (n=68)*
TABLE 2
Comparison of mean Likert scores by group across follow-up time points Question asked at each time point:
| “On a scale of 1 to 10, How sick do you feel today?”* | |||
|---|---|---|---|
| Time† | Amoxicillin (n=67) | Placebo (n=68) | P value |
| Day 0 (SD) | 6.10 (2.0) | 6.30 (1.9) | NS |
| Day 3 (SD) | 4.33 (1.8) | 4.73 (1.9) | NS |
| Day 7 (SD) | 3.15 (2.1) | 3.30 (2.0) | NS |
| Day 14 (SD) | 2.30 (1.9) | 2.80 (2.5) | NS |
| Likert score of 1 represents “perfect health” to 10 representing “worst condition.” | |||
| * Statistical tests—Orthogonal contrasts. | |||
| † Data shown represent mean and standard deviation (SD). | |||
TABLE 3
Mean number of days to improvement by group and number of signs and symptoms (at baseline) for patients who improved
| Number of signs and symptoms | Amoxicillin (n=32) | Placebo (n=25) |
|---|---|---|
| (1) Mean (n, SD) | 7.8 days (16, 3.7) | 11.0 days (10, 2.6) |
| (2) Mean (n, SD) | 7.8 days (5, 3.7) | 10.3 days (6, 3.2) |
| (3–4) Mean (n, SD) | 8.6 days (11, 3.6) | 10.6 days (9, 3.0) |
| Signs and symptoms are: purulent (yellow, thick) nasal discharge predominating on 1 side, local facial pain predominating on 1 side, purulent nasal discharge on both sides, and pus in the nasal cavity. | ||
Results
During the 18-month enrollment period, the 3 providers recorded all patients aged >18 years who had at least 1 cardinal feature described by the clinical prediction rule and had symptoms for a minimum of 7 days. Thus, initially 308 patients were approached for enrollment; 173 patients did not qualify after the exclusion criteria were applied, leaving 135 patients for randomization. Sixty-seven received amoxicillin and 68 received placebo. For 11 patients in the amoxicillin arm and 8 in the placebo arm, only baseline data were collected. These patients were then considered as lost to follow-up and were counted as “not improved” in the intention-to-treat analysis.
There were no significant differences (P >.05) in baseline characteristics of the treatment groups (Table 1). Additionally, there were no significant differences in the baseline characteristics between the providers (data not shown).
In the amoxicillin group 32 (48%) had completely improved compared with 25 (37%) in the placebo group (P=.26) after 2 weeks (relative risk of treatment failure=1.3; 95% CI, 0.87–1.94). However, individuals in the amoxicillin group did improve significantly earlier, as the Kaplan-Meier curve demonstrates (Figure). The first person in the amoxicillin group improved on day 3, compared with day 7 in the placebo group. This earlier improvement continued throughout the study (P=.039).
Subgroup analysis of the 57 who demonstrated complete recovery shows the amoxicillin group improved earlier as does the Kaplan-Meier curves in the Figure. In the amoxicillin group, the median day to any improvement was day 8 compared with day 12 for the placebo group (P=.005), while the mean day to improvement for the amoxicillin group was 8.1 days vs 10.7 days for placebo group.
When patients were asked “How sick do you feel today,” the average Likert scores decreased from 6. 1 (day 0) to 2.3 (day 14), and 6.3 (day 0) to 2.8 (day 14), in the amoxicillin and placebo groups, respectively. At each time point, there were no significant clinical or statistical differences between the 2 groups in how they rated their improvement (Table 2). Furthermore, examining only those who reported total improvement within 14 days showed no differences among groups.
No statistically significant differences were observed between the treatment groups that entailed the clinical prediction rule. However, in the patients who were improved at 14 days, the average number of days to improvement was consistently between 2 to 2.5 days shorter in the amoxicillin group compared with placebo (Table 3).
Side effects
No patients dropped out of the study due to adverse side effects (Table 4). There were no serious or unexpected side effects, with the majority related to gastrointestinal problems, such as diarrhea and abdominal pain.
TABLE 4
A Frequency of reported side effects by group
| Amoxicillin Adverse effects | Placebo (n=57) | (n=59) |
|---|---|---|
| Total number of patients with any side effects | 13 | 7 |
| Diarrhea | 4 | 1 |
| Nausea | 4 | 5 |
| Emesis | 1 | 0 |
| Abdominal pain | 2 | 1 |
| Rash | 2 | 0 |
| Hot flashes | 0 | 1 |
| Jittery | 0 | 1 |
| Dizziness | 3 | 0 |
| Dry mouth | 1 | 0 |
| Vaginal infection | 2 | 0 |
| Multiple events per patient are possible. | ||
Discussion
With respect to the patient-oriented outcome of clinical improvement, amoxicillin provided no significant benefit over placebo in the treatment of patients presenting with sinusitis complaints. On average our patients who had symptoms for 11 days prior to enrollment and are typical of patients that are often recommended for treatment with antibiotics.14,15
Our findings are consistent with others in which the overall benefit of antibiotics was minimal or nonexistent.16,18 But among individuals who did improve, those who received amoxicillin improved much earlier, both clinically and statistically. Unfortunately we were not able to specify those who are likely to improve. Clearly, further patient-oriented outcome studies are needed to help primary care physicians decide which patients may benefit from antibiotic treatment.
Antibiotics have not been shown to prevent the sequelae of acute sinusitis. One of the major difficulties in treating sinusitis is the lack of agreement about which outcomes are desired.19,20 Nearly 66% of patients diagnosed with sinusitis will get better without treatment, though nearly two thirds of patients will continue to have such symptoms as cough and nasal discharge for up to 3 weeks.21,22 Thus, we believe that to give antibiotics only to individuals who would truly benefit from them, policy makers, primary care physicians, and patients need to reassess clinically what constitutes sinusitis, and what outcomes are most desired. If the goal is to cure purulent nasal discharge, we are likely over-treating with antibiotics; as our study showed, after 2 weeks most patients in both groups still had nasal symptoms.
Our pilot of the clinical prediction rule failed to predict a proper response to antibiotics or the time to improvement. Although our numbers were not large, no trend was observed towards improvement in individuals with a higher score on the clinical prediction rule.
Our study has some important limitations. Interestingly we found different results when we used the dichotomous outcome of totally improved versus the 10-point Likert scale. A priori we decided our primary outcome was the dichotomous improvement, but which measure is more important and should be used is open to varying interpretations. Additionally, our study office unexpectedly closed and thus we could not recruit the number of patients we initially had planned. This limited our power to find differences between groups based on the number of cardinal clinical features. We encountered noncompliance with follow-up, as expected with the study design. We also arbitrarily stopped follow-up at 14 days, and cases that had not entirely improved were considered clinical failures in all but the Likert scale analysis. It is possible our results may have differed if we had continued to follow patients at 21 or 28 days, or if we had conducted the study at more than one office.
Methodologically, we conducted a rigorous study and showed that patients diagnosed with clinical sinusitis fared no better with amoxicillin or placebo, when measuring the patient-oriented outcome of complete improvement. But a subgroup of patients who were given antibiotics did improve at a much quicker rate. The difficulty is in clinically identifying this group and treating them with antibiotics. Conversely, using antibiotics in patients unnecessarily would only cause potential individual and societal harm. More clinically oriented studies need to be conducted to address this issue and elucidate what signs and symptoms these patients exhibit, to help clarify who should be treated with antibiotics.
ACKNOWLEDGMENTS
When this article was prepared, Dan Merenstein was an assistant professor of Family Medicine and Pediatrics at Georgetown University. This study was part of the Capricorn Research Network of Georgetown University. This projectwas supported by a grant from the American Academy ofFamily Physicians and the American Academy of FamilyPhysicians Foundation “Joint AAFP/F-AAFP Grant AwardsProgram” (JGAP). Support was also provided by the CapitolArea Primary Care Research Network. Research presentedat NAPRCG 2003, Banff, Canada.
We thank Joel Merenstein for insightful feedback and intelligent comments about study design and input with manuscript. We thank Goutham Rao and Traci Reisner for editorial help. We thank Community Drug Compounding Center of Pittsburgh and pharmacist Susan Freedenberg for drug development.
Corresponding author
Dan Merenstein, MD, Robert Wood Johnson Clinical Scholar, The Johns Hopkins Hospital, 600 North Wolfe St., Carnegie 291, Baltimore, MD 21287-6220. E-mail: [email protected].
1. Leggett JE. Acute sinusitis. When—and when not—to prescribe antibiotics. Postgrad Med 2004;115(1):13-19.
2. Lau J, et al. Diagnosis and treatment of acute bacterial rhinosinusitis. Evidence Report #9. Rockville, Md: Agency for Health Care Policy and Research; 1999.
3. Brooks I, Gooch WM, 3rd, Jenkins SG, et al. Medical management of acute bacterial sinusitis. Recommendations of a clinical advisory committee on pediatric and adult sinusitis. Ann Otol Rhinol Laryngol Suppl 2000;182:2-20.
4. Williams JW, Jr, Holleman DR, Jr, Samsa GP, Simel DL. Randomized controlled trial of 3 vs 10 days of trimethoprim/sulfamethoxazole for acute maxillary sinusitis. JAMA 1995;273:1015-1021.
5. Williams JW, Jr, Simel DL. Does this patient have sinusitis? Diagnosing acute sinusitis by history and physical examination. JAMA 1993;270:1242-1246.
6. Williams JW, Jr, Simel DL, Roberts L, Samsa GP. Clinical evaluation for sinusitis. Making the diagnosis by history and physical examination. Ann Intern Med 1992;117:705-710.
7. Wald ER, Chiponis D, Ledesma-Medina J. Comparative effectiveness of amoxicillin and amoxicillin-clavulanate potassium in acute paranasal sinus infections in children: a double-blind, placebo-controlled trial. Pediatrics 1986;77:795-800.
8. van Duijn NP, Brouwer HJ, Lamberts H. Use of symptoms and signs to diagnose maxillary sinusitis in general practice: comparison with ultrasonography. BMJ 1992;305:684-687.
9. Alho OP, Ylitalo K, Jokinen K, et al. The common cold in patients with a history of recurrent sinusitis: increased symptoms and radiologic sinusitislike findings. J Fam Pract 2001;50:26-31.
10. Berg O, Carenfelt C. Analysis of symptoms and clinical signs in the maxillary sinus empyema. Acta Otolaryngol 1988;105:343-349.
11. Okuyemi KS, Tsue TT. Radiologic imaging in the management of sinusitis. Am Fam Physician 2002;66:1882-1886.
12. Engels EA, Terrin N, Barza M, Lau J. Meta-analysis of diagnostic tests for acute sinusitis. J Clin Epidemiol 2000;53:852-862.
13. Poole MD. A focus on acute sinusitis in adults: changes in disease management. Am J Med 1999;106:38S-47S;discussion 48S-52S.
14. Desrosiers M, Frankiel S, Hamid QA, et al. Acute bacterial sinusitis in adults: management in the primary care setting. J Otolaryngol 2002;31 Suppl 2:2S2-14.
15. Lindbaek M. Acute sinusitis: guide to selection of anti-bacterial therapy. Drugs 2004;64:805-819.
16. De Sutter AI, De Meyere MJ, Christiaens TC, Van Driel ML, Peersman W, De Maeseneer JM. Does amoxicillin improve outcomes in patients with purulent rhinorrhea? J Fam Pract 2002;51:317-323.
17. Bucher HC, Tschudi P, Young J, et al. BASINUS (Basel Sinusitis Study) Investigators Effect of amoxicillin-clavulanate in clinically diagnosed acute rhinosinusitis: a placebo-controlled, double-blind, randomized trial in general practice. Arch Intern Med 2003;163:1793-1798.
18. Varonen H, Kunnamo I, Savolainen S, et al. Treatment of acute rhinosinusitis diagnosed by clinical criteria or ultrasound in primary care. A placebo-controlled randomised trial. Scand J Prim Health Care 2003;21:121-126.
19. Linder JA, Singer DE, Ancker M, Atlas SJ. Measures of health-related quality of life for adults with acute sinusitis. A systematic review. J Gen Intern Med 2003;18:390-401.
20. Theis J, Oubichon T. Are antibiotics helpful for acute maxillary sinusitis? J Fam Pract 2003;52:490-492;discussion 491.-
21. de Ferranti SD, Ioannidis JP, Lau J, Anninger WV, Barza M. Are amoxycillin and folate inhibitors as effective as other antibiotics for acute sinusitis? A meta-analysis. BMJ 1998;317:632-637.
22. Scott J, Orzano AJ. Evaluation and treatment of the patient with acute undifferentiated respiratory tract infection. J Fam Pract 2001;50:1070-1077.
Second thoughts on integrative medicine
Integrative medicine is a new concept of healthcare.1,2 Confusingly, the term has 2 definitions. The first definition is a healthcare system “that selectively incorporates elements of complementary and alternative medicine (CAM) into comprehensive treatment plans….”1 The second definition is an approach that emphasizes “health and healing rather than disease and treatment. It views patients as whole people with minds and spirits as well as bodies….”1
I would argue that the whole-person concept has always been at the core of good medicine, particularly primary care, and that coining a new name for an old value is counterproductive. If we can agree that the whole-person concept needs no other name, we can greatly simplify matters by letting integrative medicine stand for just one thing—incorporating elements of CAM into routine health care. Let’s consider the implications of this thinking.
The arguments for integrative medicine
Proponents of integrating CAM into routine medical care point to its increasing popularity3 and to the satisfaction of most CAM users.4 They also argue that CAM has largely been a privilege of the affluent class,3 and, to achieve equity in health care, we should integrate CAM across all of society. This line of argument seems logical and well intentioned. But is it convincing?
Just because the affluent are the primary recipients of CAM does not necessarily recommend it to everyone. Their lifestyle choices also put them at greater risk for cancer and gout, and they undergo liposuction more often. That the affluent can afford to pay for CAM does not mean it’s good for them.
The evidence for benefits vs risks
The assumption we should really mistrust is that satisfaction with CAM services is the same as a demonstration of efficacy. The missing link in the logic of integrated medicine is the evidence that CAM does more good than harm. Integrating therapies with uncertain risk-benefit profiles (eg, upper spinal manipulation) or modalities that are pleasant but of dubious value (eg, aromatherapy) would render health care less evidence-based and more expensive but not necessarily more effective.
Of course, not all CAM is ineffective or unsafe.5 CAM interventions that demonstrably do more good than harm should be integrated; those that don’t should not be. Research into CAM is in its infancy, and the area of uncertainty remains huge. For most forms of CAM, we simply cannot be sure about the balance of risk and benefit. To integrate such CAM would be counterproductive. To integrate those therapies that are supported by good data is not integrative medicine but simply evidence-based medicine.
Patient choice and responsible decisions
And what about patient choice? This concept is well-founded in our legal system. As physicians, we are just advisors trying to guide patient choice. Creating a new type of medicine that stands for incorporation of unproven practices into medical routine would, however, be a violation of our duty to be responsible advisors to patients. Responsible advice has to be based on evidence, not on ideology. Decision-makers rightly insist on data, not anecdote.6
In conclusion, the term integrative medicine is superfluous since it stands either for whole-person medicine (a concept already a part of primary care) or for the promotion of integrating well-documented CAM modalities (already being done with evidence-based medicine). The danger of integrative medicine lies in creating a smokescreen behind which dubious practices are pushed into routine healthcare. I believe this would be a serious disservice to all involved—not least, to our patients.
Correspondence
Edzard Ernst, MD, PhD, FRCP, FRCPEd, Complementary Medicine, Peninsula Medical School, Universities of Exeter & Plymouth, 25 Victoria Park Road, Exeter EX2 4NT UK. E-mail: [email protected].
1. Rees L, Weil A. Integrated medicine. BMJ 2001;322:119-120.
2. Caspi O, Bell IR, Rychener D, Gaudet TW, Weil A. The tower of Babel: communication and medicine - an essay on medical education and complementary/alternative medicine. Arch Intern Med 2000;160:3193-3195
3. Eisenberg DM, David RB, Ettner SL, et al. Trends in alternative medicine use in the United States. JAMA 1998;280:1569-1575.
4. Mahady GB, Parrot J, Lee C, Yun GS, Dan A. Botanical dietary supplement use in peri- and postmenopausal women. Menopause 2003;10:65-72.
5. Ernst E, Pittler MH, Stevinson C, White AR. The Desktop Guide to Complementary and Alternative Medicine. Edinburgh: Mosby; 2001.
6. Van Haselen R, Fisher P. Evidence influencing British Health Authorities decisions in purchasing complementary medicine. JAMA 1998;290:1564.-
Integrative medicine is a new concept of healthcare.1,2 Confusingly, the term has 2 definitions. The first definition is a healthcare system “that selectively incorporates elements of complementary and alternative medicine (CAM) into comprehensive treatment plans….”1 The second definition is an approach that emphasizes “health and healing rather than disease and treatment. It views patients as whole people with minds and spirits as well as bodies….”1
I would argue that the whole-person concept has always been at the core of good medicine, particularly primary care, and that coining a new name for an old value is counterproductive. If we can agree that the whole-person concept needs no other name, we can greatly simplify matters by letting integrative medicine stand for just one thing—incorporating elements of CAM into routine health care. Let’s consider the implications of this thinking.
The arguments for integrative medicine
Proponents of integrating CAM into routine medical care point to its increasing popularity3 and to the satisfaction of most CAM users.4 They also argue that CAM has largely been a privilege of the affluent class,3 and, to achieve equity in health care, we should integrate CAM across all of society. This line of argument seems logical and well intentioned. But is it convincing?
Just because the affluent are the primary recipients of CAM does not necessarily recommend it to everyone. Their lifestyle choices also put them at greater risk for cancer and gout, and they undergo liposuction more often. That the affluent can afford to pay for CAM does not mean it’s good for them.
The evidence for benefits vs risks
The assumption we should really mistrust is that satisfaction with CAM services is the same as a demonstration of efficacy. The missing link in the logic of integrated medicine is the evidence that CAM does more good than harm. Integrating therapies with uncertain risk-benefit profiles (eg, upper spinal manipulation) or modalities that are pleasant but of dubious value (eg, aromatherapy) would render health care less evidence-based and more expensive but not necessarily more effective.
Of course, not all CAM is ineffective or unsafe.5 CAM interventions that demonstrably do more good than harm should be integrated; those that don’t should not be. Research into CAM is in its infancy, and the area of uncertainty remains huge. For most forms of CAM, we simply cannot be sure about the balance of risk and benefit. To integrate such CAM would be counterproductive. To integrate those therapies that are supported by good data is not integrative medicine but simply evidence-based medicine.
Patient choice and responsible decisions
And what about patient choice? This concept is well-founded in our legal system. As physicians, we are just advisors trying to guide patient choice. Creating a new type of medicine that stands for incorporation of unproven practices into medical routine would, however, be a violation of our duty to be responsible advisors to patients. Responsible advice has to be based on evidence, not on ideology. Decision-makers rightly insist on data, not anecdote.6
In conclusion, the term integrative medicine is superfluous since it stands either for whole-person medicine (a concept already a part of primary care) or for the promotion of integrating well-documented CAM modalities (already being done with evidence-based medicine). The danger of integrative medicine lies in creating a smokescreen behind which dubious practices are pushed into routine healthcare. I believe this would be a serious disservice to all involved—not least, to our patients.
Correspondence
Edzard Ernst, MD, PhD, FRCP, FRCPEd, Complementary Medicine, Peninsula Medical School, Universities of Exeter & Plymouth, 25 Victoria Park Road, Exeter EX2 4NT UK. E-mail: [email protected].
1. Rees L, Weil A. Integrated medicine. BMJ 2001;322:119-120.
2. Caspi O, Bell IR, Rychener D, Gaudet TW, Weil A. The tower of Babel: communication and medicine - an essay on medical education and complementary/alternative medicine. Arch Intern Med 2000;160:3193-3195
3. Eisenberg DM, David RB, Ettner SL, et al. Trends in alternative medicine use in the United States. JAMA 1998;280:1569-1575.
4. Mahady GB, Parrot J, Lee C, Yun GS, Dan A. Botanical dietary supplement use in peri- and postmenopausal women. Menopause 2003;10:65-72.
5. Ernst E, Pittler MH, Stevinson C, White AR. The Desktop Guide to Complementary and Alternative Medicine. Edinburgh: Mosby; 2001.
6. Van Haselen R, Fisher P. Evidence influencing British Health Authorities decisions in purchasing complementary medicine. JAMA 1998;290:1564.-
Group medical visits and lifestyle modification
Group visits are a fairly new approach to medical treatment. Most frequently, group visits have been used to treat a specific, chronic condition such as non-insulin-dependent diabetes. At the Sastun Center of Integrative Health Care in Mission, Kansas, we created a group medical visit program for all disease states requiring lifestyle modification.
Methods. Our group met monthly for 75 minutes. The first half of the meeting consisted of activities typical of a traditional medical visit. When patients arrived, a nurse measured vital signs and weight, including a body mass index, fat mass, and so forth. The group met around a table. After collecting signed confidentiality agreements from each patient, the physician went around the table and spent time with each patient discussing current medical problems. Unlike a typical office visit, in the group format all members listen and discuss each patient’s situation.
The second half was spent discussing a new topic. A guest speaker or another practitioner at the Sastun Center usually conducted this part of the session. Examples of discussion topics were movement for people with arthritis, yoga stretches and breathing, nutrition with a dietician, a special “dysglycemic” diet, handling holiday stress, and stress-related eating. All patients attending had 1 or more of these health problems: obesity, hypertension, type 2 diabetes, or hyperlipidemia.
Results. Five patients attended at least 4 sessions in 6 months. Other patients attended but not consistently. All members of the study and control groups were female, though this was not intentional. A majority of patients at the Sastun Center are female, so this was not surprising. The average age was 60 years (range, 52–66) for the active group and 50 years (range, 45–60) for the control group.
Overall, participants in the group medical visits exhibited greater improvements in weight loss and in cholesterol, triglyceride, and LDL-C reductions when compared with a control group of other patients from the Sastun Center with similar demographics. The active group had an average weight loss of 10.6 pounds (4.2%) compared with 1.8 pounds (0.9%) for the control group. The total cholesterol for the active group decreased an average of 12.3 mg/dL (6%), while the control group had an average increase of 13 mg/dL (5.7%). Similarly, there was an average decrease in triglycerides of 20 mg/dL (11.2%) for the active group and an average increase of 40.8 mg/dL (27.8%) for the control group. The LDL levels for the active and control groups changed –4 mg/dL (–4.1%) and +3.4 mg/dL (–0.16%), respectively. The HDL levels overall did not change for the active or control groups.
Conclusion. Though our study used very small patient numbers, it appears the patients participating in the group medical visits had greater improvement compared with similar patients not participating in the group. Group medical visits may be a successful method for helping patients who need lifestyle modifications.
Corresponding author: Jane L. Murray, MD, Medical Director, Sastun Center of Integrative Health Care, 5509 Foxridge Drive, Mission, KS 66212. E-mail: [email protected].
Group visits are a fairly new approach to medical treatment. Most frequently, group visits have been used to treat a specific, chronic condition such as non-insulin-dependent diabetes. At the Sastun Center of Integrative Health Care in Mission, Kansas, we created a group medical visit program for all disease states requiring lifestyle modification.
Methods. Our group met monthly for 75 minutes. The first half of the meeting consisted of activities typical of a traditional medical visit. When patients arrived, a nurse measured vital signs and weight, including a body mass index, fat mass, and so forth. The group met around a table. After collecting signed confidentiality agreements from each patient, the physician went around the table and spent time with each patient discussing current medical problems. Unlike a typical office visit, in the group format all members listen and discuss each patient’s situation.
The second half was spent discussing a new topic. A guest speaker or another practitioner at the Sastun Center usually conducted this part of the session. Examples of discussion topics were movement for people with arthritis, yoga stretches and breathing, nutrition with a dietician, a special “dysglycemic” diet, handling holiday stress, and stress-related eating. All patients attending had 1 or more of these health problems: obesity, hypertension, type 2 diabetes, or hyperlipidemia.
Results. Five patients attended at least 4 sessions in 6 months. Other patients attended but not consistently. All members of the study and control groups were female, though this was not intentional. A majority of patients at the Sastun Center are female, so this was not surprising. The average age was 60 years (range, 52–66) for the active group and 50 years (range, 45–60) for the control group.
Overall, participants in the group medical visits exhibited greater improvements in weight loss and in cholesterol, triglyceride, and LDL-C reductions when compared with a control group of other patients from the Sastun Center with similar demographics. The active group had an average weight loss of 10.6 pounds (4.2%) compared with 1.8 pounds (0.9%) for the control group. The total cholesterol for the active group decreased an average of 12.3 mg/dL (6%), while the control group had an average increase of 13 mg/dL (5.7%). Similarly, there was an average decrease in triglycerides of 20 mg/dL (11.2%) for the active group and an average increase of 40.8 mg/dL (27.8%) for the control group. The LDL levels for the active and control groups changed –4 mg/dL (–4.1%) and +3.4 mg/dL (–0.16%), respectively. The HDL levels overall did not change for the active or control groups.
Conclusion. Though our study used very small patient numbers, it appears the patients participating in the group medical visits had greater improvement compared with similar patients not participating in the group. Group medical visits may be a successful method for helping patients who need lifestyle modifications.
Corresponding author: Jane L. Murray, MD, Medical Director, Sastun Center of Integrative Health Care, 5509 Foxridge Drive, Mission, KS 66212. E-mail: [email protected].
Corresponding author: Jane L. Murray, MD, Medical Director, Sastun Center of Integrative Health Care, 5509 Foxridge Drive, Mission, KS 66212. E-mail: [email protected].
Hydroquinone 4%, Tretinoin 0.05%, Fluocinolone Acetonide 0.01%: A Safe and Efficacious 12-Month Treatment for Melasma
Time requirements for diabetes self-management: Too much for many?
- The care physicians commonly recommend may be too time-consuming for many patients. Find out how much time is available and ask about the pressures on that time.
- If time requirements are onerous, help patients set priorities to maximize health.
Background: In Crossing the Quality Chasm, the Institute of Medicine laid out principles to improve quality of care and identified chronic diseases as a starting point. One of those principles was the wise use of patient time, but current recommendations for chronic conditions do not consider time spent on self-care or its impact on patients’ lives.
Objective: To estimate the time required for recommended diabetes self-care.
Methods: A convenience sample of 8 certified diabetes educators derived consensus-based estimates of the time required for all self-care tasks recommended by the American Diabetes Association.
Results: For experienced patients with type 2 diabetes controlled by oral agents, recommended self-care would require more than 2 extra hours daily. Elderly patients and those with newly diagnosed disease, or those with physical limitations, would need more time. Exercise and diet, required for self-care of many chronic conditions, are the most time-consuming tasks.
Conclusion: The time required by recommended self-care is substantial. Crossing the Quality Chasm suggests how clinicians and guideline developers can help patients make the best use of their self-care time: elicit the patient’s perspective; develop evidence on the health consequences of self-care tasks; and respect patients’ time.
To what extent does the time needed to perform diabetes self care diminish patients’ willingness to follow recommendations? Are there means of making self care more acceptable? Consider the following observations about chronic disease in general.
The Institute of Medicine has highlighted the extent to which medical care falls short of its potential. Crossing the Quality Chasm recommended 10 principles to reorient health systems; among them:
- shared information and decision-making to better reflect patient preferences
- evidence-based decision making
- continuous decrease in waste of “resources or patient time.”
Chronic conditions were identified as “a starting point” for applying these recommendations since they are “the leading cause of illness, disability, and death in the United States, affecting almost half of the population and accounting for the majority of health care resources used.”1
Self-care, or self-management, is essential to good care of diabetes, one of the most common chronic conditions. Funnell and Anderson noted that “[m]ore than 95% of diabetes care is done by the patient.”2 Physicians offer instruction, but day-to-day implementation depends on patients themselves, who care for their diabetes “within the context of the other goals, priorities, health issues, family demands, and other personal concerns that make up their lives,”2 When their advice is not followed, and patients’ health suffers, physicians are frustrated by what can seem their patients’ refusal to do the best for their condition.
Researchers have examined a broad range of potential reasons for noncompliance with diabetes self-care recommendations, from patients’ attitudes and beliefs, to health motivation, readiness to change, language barriers, medication regimens, and trust in the medical profession.3-9 Although self-management programs have become more patient-centered,10-15 a review of patient-centered approaches in diabetes noted that “it is apparent that factors other than knowledge are needed to achieve long-term behavioral change.”16 A review of medication compliance concluded that “current methods of improving medication adherence for chronic health problems are mostly complex, labor-intensive, and not predictably effective.”17 Something crucial to success has yet to be identified.
An important missing link may be the time demands of self-care. Evaluations have considered program design and outcomes, but not how the length of diabetes self-care regimens affects patient outcomes. Indeed, scant attention has been paid to time requirements18 and little is known about how much time current recommendations take. To begin to draw attention to time requirements as a potential barrier to good self-management, we present estimates of the time required by recommended diabetes self-care.
Methods
Certified diabetes educators (CDEs) teach self-care skills and evaluate adherence. Their training is based on the American Diabetes Association’s (ADA) Clinical Practice Recommendations,19 which represent the standard of care for diabetes. The guidelines of the American Association of Diabetes Educators20 cover additional self-care elements, such as stress management and social support. We assembled a convenience sample of 8 CDEs, all registered dietitians or registered nurses, from a large teaching hospital and the nearby community. They averaged 13 years of experience as CDEs and 90 patients/month (range, 30–150). An experienced moderator led the meeting; proceedings were tape-recorded and transcribed.
We identified each self-care task in the ADA’s 2002 recommendations; the selections were confirmed by a practicing nurse clinician. We asked the CDEs to add other tasks they considered necessary for the best self-care. Since the focus was on extra time needed for self-care of diabetes, we excluded self-care that most people already do, such as tooth brushing, but retained care that most people should do but generally do not (exercising or preparing healthy foods).21-24
Table 1 details our assumptions and definitions. Table 2 lists self-care tasks. We asked the CDEs to consider a typical patient with type 2 diabetes in a stable phase of care, taking oral hypoglycemic agents, and self-testing blood glucose once daily. They reached consensus on the average time required by this patient for each task, in minutes per day, including preparation and cleanup time. Discussion of other patient types and of circumstances that would change estimated times were encouraged by the moderator.
TABLE 1
Diabetes self care: Assumptions about patients, and definitions of tasks
| Patient characteristics | The CDEs were asked to consider a typical patient with type 2 diabetes, in a stable phase of care, on oral hypoglycemic agents and self-testing blood glucose once daily. These estimates are shown in Table 2. Type 2 diabetes accounts for 90–95% of diabetes in the U.S.25 |
| To provide a basis for considering the variability of time requirements (see text), they also made estimates for other types of patients, ranging from those whose diabetes is controlled by diet alone to elderly patients with multiple chronic conditions. | |
| Task definitions | Time, in minutes per day, represents extra tasks required by diabetes self-care, or extra time for usual tasks. All estimates include time for preparation and cleanup. |
| Taking oral medications (2 min/episode of medication taken) includes time to organize pills for the day or week. All patients are assumed to take aspirin. | |
| Problem solving includes time to make decisions about changes in medication or diet in response to blood sugar values and symptoms, and time for general tasks such as remembering to carry medications, snacks, etc. | |
| Shopping time is the additional time required to read nutrition labels for carbohydrate counting and to make extra trips for perishable fresh produce. Transportation time for extra trips is included. | |
| Exercise includes time to change clothes, shoes, etc. Since most adults do not exercise (see text) the full time required for exercise is included. | |
| Support groups include internet groups, family support, reading groups, supportive group settings, formal diabetes support groups, and church. | |
| Scheduling appointments does not include the time required by the appointments themselves. |
TABLE 2
Estimated time required for recommended care*
| Task | Minutes/day |
|---|---|
| ADA recommendations | |
| Home glucose monitoring | 3 |
| Record keeping | 5 |
| Taking oral medication | 4 |
| Foot care | 10 |
| Oral hygiene, flossing | 1 |
| Problem solving | 12 |
| Meal planning | 10 |
| Shopping | 17 |
| Preparing meals | 30 |
| Exercise | 30 |
| ADA SUBTOTAL | 122 |
| Other desirable self-care | |
| Monitoring blood pressure | 3 |
| Stress management | 10 |
| Support group | 2 |
| Administrative tasks | |
| Phoning educators, doctors | 1 |
| Scheduling appointments | 1 |
| Insurance dealings | 2 |
| Obtaining supplies | 2 |
| TOTAL TIME | 143 |
| *Estimates for patients with stable diabetes who are taking oral agents and self-monitoring blood glucose once | |
Results
Table 2 presents estimated times for a stable patient with type 2 diabetes on oral hypoglycemic agents. The ADA’s recommendations would take this patient 122 minutes per day, more than 2 hours; other tasks bring the total to 143 minutes per day. The first 4 elements, which are unique to diabetes, take only 22 minutes per day. Activities related to exercise or diet, recommended for many chronic conditions, account for most of the time.
The CDEs estimated that patients with newly diagnosed diabetes would take 25% to 30% longer for all tasks. Older and more infirm patients (eg, persons with neurological disorders/stroke, neuropathy, visual impairments, or depression) could require twice as long for most tasks and might also need the help of a caregiver. They might not be able to carry out some tasks, such as exercise. Patients taking insulin need only a few more minutes per day.
Discussion
Estimates by CDEs suggest that recommended diabetes self-care requires more than 2 hours daily. For infirm patients or those with newly diagnosed disease, even more time is required, and some tasks involve the help (and time) of caregivers. These estimates raise an important issue: the care physicians commonly recommend may be too time-consuming for many patients.
In one study, persons with diabetes reported spending a median of 48 minutes daily on self-care tasks.18 Only a few spent no time, but a third to a half skipped specific elements of self-care completely. When asked “What is the biggest obstacle for you in effectively managing your diabetes?” more than a fifth answered “not enough time.”
When patients choose which tasks to undertake, their choices may not optimize health. Although little evidence is currently available to help clinicians and patients prioritize self-care tasks, some tasks are surely more important for certain patients than others. Younger, more mobile patients may benefit more from exercise education than wheelchair-bound patients with advanced disease. Foot care is more important for patients with sensory neuropathy than for those with normal sensation. In the absence of evidence, physicians’ clinical experience can be an important guide to maximizing the benefits of self-care time.
The principles in Crossing the Quality Chasm suggest ways to develop care interactions and guidelines that deal with these realities while keeping the goal of better health front and center.
(1) The report calls for ”recognizing the patient as the source of control and customizing care based on patient needs and values.” Clinicians need to discuss time with patients, to find out how much time is available and the pressures on that time. Such discussions are consistent with the Chronic Care Model, which recommends clinicians “elicit and review data concerning patients’ perspectives” and “help patients to set goals and solve problems.”15
(2) The report calls for evidence-based care and recommends that patients “have unfettered access to their own medical information and to clinical knowledge.” Research is needed to identify the tasks that yield the most improvement in symptoms and health for particular patients. Such “time-effectiveness studies” would show which tasks make the best use of self-care time for patients with specific symptoms and complications. Until such data are available, physicians must rely on clinical experience to help guide patients.
(3) The report calls for “continuous decrease in waste” noting that “the health system should not waste resources or patient time” (italics added). When self-management requires a lot of time, that time deserves to be used carefully and well. We suggest that self-care guidelines consider time requirements. Where they are onerous, ways should be found to reduce them or to help patients set priorities.
Diabetes self-management is an essential component of good care. The time patients devote to self-care deserves serious attention in efforts to improve the quality of care.
Acknowledgements
The authors thank Ann Marie DeLisi, Patricia Prata, Dorothy Caputo, Christine Bazzarre, Ruth Ann Petzinger, Lee Ann Redfern, Carol Salas, and Carolyn Swither, the certified diabetes educators who participated in our focus group.
Corresponding author
Monika M. Safford, MD, MT 643, 1717 11th Avenue South, Birmingham, AL 35294-4410. Email: [email protected].
1. Institute of Medicine Crossing the Quality Chasm: A New Health System for the 21st Century. Washington, DC: National Academy Press; 2001:61-62, 89.
2. Funnell MM, Anderson RM. The problem with compliance in diabetes. JAMA 2000;13:1709.-
3. Kart CS, Engler CA. Predisposition to self-health care: Who does what for themselves and why? J Gerontol 1994;49:S301-S308.
4. Cox RH, Carpenter JP, Bruce FA, et al. Characteristics of low-income African-American and Caucasian adults that are important in self-management of type 2 diabetes. J Community Health 2004;29:155-170.
5. Glasgow RE, Boles SM, McKay HG, et al. The D-Net diabetes self-management program: long-term implementation, outcomes, and generalization results. Prev Med 2003;36:410-419.
6. Peterson KA, Hughes M. Readiness to change and clinical success in a diabetes educational program. J Am Board Fam Pract 2002;15:266-271.
7. Karter AJ, Ferrara A, Darbinian JA, et al. Self-monitoring of blood glucose: Language and financial barriers in a managed care population with diabetes. Diabetes Care 2000;23:477-483.
8. Grant RW, Devita NG, Singer DE, Meigs JB. Polypharmacy and medication adherence in patients with type 2 diabetes. Diabetes Care 2003;26:1408-1412.
9. Vik SA, Maxwell CJ, Hogan DB. Measurement, correlates, and health outcomes of medication adherence among seniors. Ann Pharmacother 2004;38:303-312.
10. Weir MR, Maibach EW, Bakris GL, et al. Implications of a healthy lifestyle and medication analysis for improving hypertension control. Arch Intern Med 2000;160:481-490.
11. Mosley-Williams A, Lumley MA, Gillis M, et al. Barriers to treatment adherence among african american and white women with systemic lupus erythematosus. Arthritis Rheumatol 2002;47:630-638.
12. Safran DG, Taira DA, Rogers WH, et al. Linking primary care performance to outcomes of care. J Fam Pract 1998;47:213-220.
13. Luft FC, Morris CD, Weinberger MH. Compliance to a low-salt diet. Am J Clin Nutr 1997;65:698S-703S.
14. Barr RG, Somers SC, Speizer FE, Camargo CA, Jr. for The National Asthma Education and Prevention Program (NAEPP). Patient factors and medication guideline adherence among older women with asthma. Arch Intern Med 2002;162:1761-1768.
15. Wagner EH, Austin BT, Davis C, et al. Improving chronic illness care: Translating evidence into action. Health Aff 2001;20:64-78.
16. Norris SL, Engelgau MM, Narayan KMV. Effectiveness of self-management training in type 2 diabetes: A systematic review of randomized controlled trials. Diabetes Care 2001;24:561-587.
17. McDonald HP, Garg AX, Haynes RB. Interventions to enhance patient adherence to medication prescriptions: Scientific review. JAMA 2002;288:2868-2879.
18. Safford MM, Russell LB, Suh D. How much time do patients spend on diabetes self-care? [Abstract.] J Gen Intern Med 2003;18(S1)::155.-
19. American Diabetes Association. Clinical Practice Recommendations 2002. Diabetes Care 2002;25:S3-S147.
20. American Association of Diabetes Educators. The 1999 Scope of Practice for Diabetes Educators and the Standards of Practice for Diabetes Educators. Available at: www.aadenet.org. Accessed on June 6, 2002.
21. Lang WP, Farghaly MM, Ronis MM. The relation of preventive dental behaviors to periodontal health status. J Clin Periodontol 1994;21:194-198.
22. White CC, Powell KE, Hogelin GC, et al. The behavioral risk factor surveys: IV. The descriptive epidemiology of exercise. Am J Prev Med 1987;3:304-310.
23. Mokdad AH, Bowman BA, Ford ES, et al. The continuing epidemics of obesity and diabetes in the United States. JAMA 2001;286:1195-1200.
24. American Heart Association. Available at:www.american-heart.org/presenter.jhtml. Accessed on July 29, 2002.
25. National Institutes of Health. Diabetes in America. 2nd ed. Harris MI, Cowie CC, Stern MP, et al., eds. Washington DC: US Government Printing Office, NIH publ. no. 95-1468, 1995.
- The care physicians commonly recommend may be too time-consuming for many patients. Find out how much time is available and ask about the pressures on that time.
- If time requirements are onerous, help patients set priorities to maximize health.
Background: In Crossing the Quality Chasm, the Institute of Medicine laid out principles to improve quality of care and identified chronic diseases as a starting point. One of those principles was the wise use of patient time, but current recommendations for chronic conditions do not consider time spent on self-care or its impact on patients’ lives.
Objective: To estimate the time required for recommended diabetes self-care.
Methods: A convenience sample of 8 certified diabetes educators derived consensus-based estimates of the time required for all self-care tasks recommended by the American Diabetes Association.
Results: For experienced patients with type 2 diabetes controlled by oral agents, recommended self-care would require more than 2 extra hours daily. Elderly patients and those with newly diagnosed disease, or those with physical limitations, would need more time. Exercise and diet, required for self-care of many chronic conditions, are the most time-consuming tasks.
Conclusion: The time required by recommended self-care is substantial. Crossing the Quality Chasm suggests how clinicians and guideline developers can help patients make the best use of their self-care time: elicit the patient’s perspective; develop evidence on the health consequences of self-care tasks; and respect patients’ time.
To what extent does the time needed to perform diabetes self care diminish patients’ willingness to follow recommendations? Are there means of making self care more acceptable? Consider the following observations about chronic disease in general.
The Institute of Medicine has highlighted the extent to which medical care falls short of its potential. Crossing the Quality Chasm recommended 10 principles to reorient health systems; among them:
- shared information and decision-making to better reflect patient preferences
- evidence-based decision making
- continuous decrease in waste of “resources or patient time.”
Chronic conditions were identified as “a starting point” for applying these recommendations since they are “the leading cause of illness, disability, and death in the United States, affecting almost half of the population and accounting for the majority of health care resources used.”1
Self-care, or self-management, is essential to good care of diabetes, one of the most common chronic conditions. Funnell and Anderson noted that “[m]ore than 95% of diabetes care is done by the patient.”2 Physicians offer instruction, but day-to-day implementation depends on patients themselves, who care for their diabetes “within the context of the other goals, priorities, health issues, family demands, and other personal concerns that make up their lives,”2 When their advice is not followed, and patients’ health suffers, physicians are frustrated by what can seem their patients’ refusal to do the best for their condition.
Researchers have examined a broad range of potential reasons for noncompliance with diabetes self-care recommendations, from patients’ attitudes and beliefs, to health motivation, readiness to change, language barriers, medication regimens, and trust in the medical profession.3-9 Although self-management programs have become more patient-centered,10-15 a review of patient-centered approaches in diabetes noted that “it is apparent that factors other than knowledge are needed to achieve long-term behavioral change.”16 A review of medication compliance concluded that “current methods of improving medication adherence for chronic health problems are mostly complex, labor-intensive, and not predictably effective.”17 Something crucial to success has yet to be identified.
An important missing link may be the time demands of self-care. Evaluations have considered program design and outcomes, but not how the length of diabetes self-care regimens affects patient outcomes. Indeed, scant attention has been paid to time requirements18 and little is known about how much time current recommendations take. To begin to draw attention to time requirements as a potential barrier to good self-management, we present estimates of the time required by recommended diabetes self-care.
Methods
Certified diabetes educators (CDEs) teach self-care skills and evaluate adherence. Their training is based on the American Diabetes Association’s (ADA) Clinical Practice Recommendations,19 which represent the standard of care for diabetes. The guidelines of the American Association of Diabetes Educators20 cover additional self-care elements, such as stress management and social support. We assembled a convenience sample of 8 CDEs, all registered dietitians or registered nurses, from a large teaching hospital and the nearby community. They averaged 13 years of experience as CDEs and 90 patients/month (range, 30–150). An experienced moderator led the meeting; proceedings were tape-recorded and transcribed.
We identified each self-care task in the ADA’s 2002 recommendations; the selections were confirmed by a practicing nurse clinician. We asked the CDEs to add other tasks they considered necessary for the best self-care. Since the focus was on extra time needed for self-care of diabetes, we excluded self-care that most people already do, such as tooth brushing, but retained care that most people should do but generally do not (exercising or preparing healthy foods).21-24
Table 1 details our assumptions and definitions. Table 2 lists self-care tasks. We asked the CDEs to consider a typical patient with type 2 diabetes in a stable phase of care, taking oral hypoglycemic agents, and self-testing blood glucose once daily. They reached consensus on the average time required by this patient for each task, in minutes per day, including preparation and cleanup time. Discussion of other patient types and of circumstances that would change estimated times were encouraged by the moderator.
TABLE 1
Diabetes self care: Assumptions about patients, and definitions of tasks
| Patient characteristics | The CDEs were asked to consider a typical patient with type 2 diabetes, in a stable phase of care, on oral hypoglycemic agents and self-testing blood glucose once daily. These estimates are shown in Table 2. Type 2 diabetes accounts for 90–95% of diabetes in the U.S.25 |
| To provide a basis for considering the variability of time requirements (see text), they also made estimates for other types of patients, ranging from those whose diabetes is controlled by diet alone to elderly patients with multiple chronic conditions. | |
| Task definitions | Time, in minutes per day, represents extra tasks required by diabetes self-care, or extra time for usual tasks. All estimates include time for preparation and cleanup. |
| Taking oral medications (2 min/episode of medication taken) includes time to organize pills for the day or week. All patients are assumed to take aspirin. | |
| Problem solving includes time to make decisions about changes in medication or diet in response to blood sugar values and symptoms, and time for general tasks such as remembering to carry medications, snacks, etc. | |
| Shopping time is the additional time required to read nutrition labels for carbohydrate counting and to make extra trips for perishable fresh produce. Transportation time for extra trips is included. | |
| Exercise includes time to change clothes, shoes, etc. Since most adults do not exercise (see text) the full time required for exercise is included. | |
| Support groups include internet groups, family support, reading groups, supportive group settings, formal diabetes support groups, and church. | |
| Scheduling appointments does not include the time required by the appointments themselves. |
TABLE 2
Estimated time required for recommended care*
| Task | Minutes/day |
|---|---|
| ADA recommendations | |
| Home glucose monitoring | 3 |
| Record keeping | 5 |
| Taking oral medication | 4 |
| Foot care | 10 |
| Oral hygiene, flossing | 1 |
| Problem solving | 12 |
| Meal planning | 10 |
| Shopping | 17 |
| Preparing meals | 30 |
| Exercise | 30 |
| ADA SUBTOTAL | 122 |
| Other desirable self-care | |
| Monitoring blood pressure | 3 |
| Stress management | 10 |
| Support group | 2 |
| Administrative tasks | |
| Phoning educators, doctors | 1 |
| Scheduling appointments | 1 |
| Insurance dealings | 2 |
| Obtaining supplies | 2 |
| TOTAL TIME | 143 |
| *Estimates for patients with stable diabetes who are taking oral agents and self-monitoring blood glucose once | |
Results
Table 2 presents estimated times for a stable patient with type 2 diabetes on oral hypoglycemic agents. The ADA’s recommendations would take this patient 122 minutes per day, more than 2 hours; other tasks bring the total to 143 minutes per day. The first 4 elements, which are unique to diabetes, take only 22 minutes per day. Activities related to exercise or diet, recommended for many chronic conditions, account for most of the time.
The CDEs estimated that patients with newly diagnosed diabetes would take 25% to 30% longer for all tasks. Older and more infirm patients (eg, persons with neurological disorders/stroke, neuropathy, visual impairments, or depression) could require twice as long for most tasks and might also need the help of a caregiver. They might not be able to carry out some tasks, such as exercise. Patients taking insulin need only a few more minutes per day.
Discussion
Estimates by CDEs suggest that recommended diabetes self-care requires more than 2 hours daily. For infirm patients or those with newly diagnosed disease, even more time is required, and some tasks involve the help (and time) of caregivers. These estimates raise an important issue: the care physicians commonly recommend may be too time-consuming for many patients.
In one study, persons with diabetes reported spending a median of 48 minutes daily on self-care tasks.18 Only a few spent no time, but a third to a half skipped specific elements of self-care completely. When asked “What is the biggest obstacle for you in effectively managing your diabetes?” more than a fifth answered “not enough time.”
When patients choose which tasks to undertake, their choices may not optimize health. Although little evidence is currently available to help clinicians and patients prioritize self-care tasks, some tasks are surely more important for certain patients than others. Younger, more mobile patients may benefit more from exercise education than wheelchair-bound patients with advanced disease. Foot care is more important for patients with sensory neuropathy than for those with normal sensation. In the absence of evidence, physicians’ clinical experience can be an important guide to maximizing the benefits of self-care time.
The principles in Crossing the Quality Chasm suggest ways to develop care interactions and guidelines that deal with these realities while keeping the goal of better health front and center.
(1) The report calls for ”recognizing the patient as the source of control and customizing care based on patient needs and values.” Clinicians need to discuss time with patients, to find out how much time is available and the pressures on that time. Such discussions are consistent with the Chronic Care Model, which recommends clinicians “elicit and review data concerning patients’ perspectives” and “help patients to set goals and solve problems.”15
(2) The report calls for evidence-based care and recommends that patients “have unfettered access to their own medical information and to clinical knowledge.” Research is needed to identify the tasks that yield the most improvement in symptoms and health for particular patients. Such “time-effectiveness studies” would show which tasks make the best use of self-care time for patients with specific symptoms and complications. Until such data are available, physicians must rely on clinical experience to help guide patients.
(3) The report calls for “continuous decrease in waste” noting that “the health system should not waste resources or patient time” (italics added). When self-management requires a lot of time, that time deserves to be used carefully and well. We suggest that self-care guidelines consider time requirements. Where they are onerous, ways should be found to reduce them or to help patients set priorities.
Diabetes self-management is an essential component of good care. The time patients devote to self-care deserves serious attention in efforts to improve the quality of care.
Acknowledgements
The authors thank Ann Marie DeLisi, Patricia Prata, Dorothy Caputo, Christine Bazzarre, Ruth Ann Petzinger, Lee Ann Redfern, Carol Salas, and Carolyn Swither, the certified diabetes educators who participated in our focus group.
Corresponding author
Monika M. Safford, MD, MT 643, 1717 11th Avenue South, Birmingham, AL 35294-4410. Email: [email protected].
1. Institute of Medicine Crossing the Quality Chasm: A New Health System for the 21st Century. Washington, DC: National Academy Press; 2001:61-62, 89.
2. Funnell MM, Anderson RM. The problem with compliance in diabetes. JAMA 2000;13:1709.-
3. Kart CS, Engler CA. Predisposition to self-health care: Who does what for themselves and why? J Gerontol 1994;49:S301-S308.
4. Cox RH, Carpenter JP, Bruce FA, et al. Characteristics of low-income African-American and Caucasian adults that are important in self-management of type 2 diabetes. J Community Health 2004;29:155-170.
5. Glasgow RE, Boles SM, McKay HG, et al. The D-Net diabetes self-management program: long-term implementation, outcomes, and generalization results. Prev Med 2003;36:410-419.
6. Peterson KA, Hughes M. Readiness to change and clinical success in a diabetes educational program. J Am Board Fam Pract 2002;15:266-271.
7. Karter AJ, Ferrara A, Darbinian JA, et al. Self-monitoring of blood glucose: Language and financial barriers in a managed care population with diabetes. Diabetes Care 2000;23:477-483.
8. Grant RW, Devita NG, Singer DE, Meigs JB. Polypharmacy and medication adherence in patients with type 2 diabetes. Diabetes Care 2003;26:1408-1412.
9. Vik SA, Maxwell CJ, Hogan DB. Measurement, correlates, and health outcomes of medication adherence among seniors. Ann Pharmacother 2004;38:303-312.
10. Weir MR, Maibach EW, Bakris GL, et al. Implications of a healthy lifestyle and medication analysis for improving hypertension control. Arch Intern Med 2000;160:481-490.
11. Mosley-Williams A, Lumley MA, Gillis M, et al. Barriers to treatment adherence among african american and white women with systemic lupus erythematosus. Arthritis Rheumatol 2002;47:630-638.
12. Safran DG, Taira DA, Rogers WH, et al. Linking primary care performance to outcomes of care. J Fam Pract 1998;47:213-220.
13. Luft FC, Morris CD, Weinberger MH. Compliance to a low-salt diet. Am J Clin Nutr 1997;65:698S-703S.
14. Barr RG, Somers SC, Speizer FE, Camargo CA, Jr. for The National Asthma Education and Prevention Program (NAEPP). Patient factors and medication guideline adherence among older women with asthma. Arch Intern Med 2002;162:1761-1768.
15. Wagner EH, Austin BT, Davis C, et al. Improving chronic illness care: Translating evidence into action. Health Aff 2001;20:64-78.
16. Norris SL, Engelgau MM, Narayan KMV. Effectiveness of self-management training in type 2 diabetes: A systematic review of randomized controlled trials. Diabetes Care 2001;24:561-587.
17. McDonald HP, Garg AX, Haynes RB. Interventions to enhance patient adherence to medication prescriptions: Scientific review. JAMA 2002;288:2868-2879.
18. Safford MM, Russell LB, Suh D. How much time do patients spend on diabetes self-care? [Abstract.] J Gen Intern Med 2003;18(S1)::155.-
19. American Diabetes Association. Clinical Practice Recommendations 2002. Diabetes Care 2002;25:S3-S147.
20. American Association of Diabetes Educators. The 1999 Scope of Practice for Diabetes Educators and the Standards of Practice for Diabetes Educators. Available at: www.aadenet.org. Accessed on June 6, 2002.
21. Lang WP, Farghaly MM, Ronis MM. The relation of preventive dental behaviors to periodontal health status. J Clin Periodontol 1994;21:194-198.
22. White CC, Powell KE, Hogelin GC, et al. The behavioral risk factor surveys: IV. The descriptive epidemiology of exercise. Am J Prev Med 1987;3:304-310.
23. Mokdad AH, Bowman BA, Ford ES, et al. The continuing epidemics of obesity and diabetes in the United States. JAMA 2001;286:1195-1200.
24. American Heart Association. Available at:www.american-heart.org/presenter.jhtml. Accessed on July 29, 2002.
25. National Institutes of Health. Diabetes in America. 2nd ed. Harris MI, Cowie CC, Stern MP, et al., eds. Washington DC: US Government Printing Office, NIH publ. no. 95-1468, 1995.
A Microsponge Formulation of Hydroquinone 4% and Retinol 0.15% in the Treatment of Melasma and Postinflammatory Hyperpigmentation
Forest plots: Data summaries at a glance
A forest plot, which most commonly appears in meta-analyses, summarizes results of individual studies and includes a combined or “pooled” estimate of the overall result.
The Figure shows a forest plot with the relative risk (RR) estimates from 5 studies of a new medication for the prevention of stroke. It includes the RR of the incidence of stroke with the new medication vs placebo. If the RR is <1.0, the treatment group has a lower incidence rate than placebo. An RR of 1.0 indicates no difference. The individual squares represent each study’s RR estimate. The lines extending from the squares represent the 95% confidence interval (CI) for the estimate. The size of the square corresponds to the size of the study and therefore the precision of the estimate.
In this example, Study 1 and Study 3 favor the new medication vs placebo. The larger square in Study 3 indicates a larger sample size and more precise result than Study 1. Study 2 also favors the new medication, but since its CI crosses the point of no effect, this result is not statistically significant. The pooled estimate is indicated with a diamond at bottom. Its CI does not cross 1.0, meaning, overall, the result of the meta-analysis is statistically significant and favors the new medication.
A forest plot is an effective way to represent data for a couple of reasons. Results of individual studies, usually with dates of publication and CIs, are summarized with a pooled result. One can also quickly see how much variation exists among studies (ie, whether the individual estimates are distributed tightly around one point or spread widely apart) and the degree of precision of each study.
Figure
Relative risk of the indicence of stroke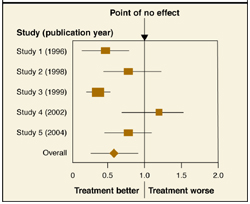
Correspondence
Julie Yeh, MD, UPMC St. Margaret Faculty Development Fellowship Program, 3937 Butler St, Pittsburgh, PA 15215. E-mail: [email protected].
REFERENCE
1. Lewis S, Clarke M. Forest plots: trying to see the wood and the trees. BMJ 2001;322:1479-1480.
A forest plot, which most commonly appears in meta-analyses, summarizes results of individual studies and includes a combined or “pooled” estimate of the overall result.
The Figure shows a forest plot with the relative risk (RR) estimates from 5 studies of a new medication for the prevention of stroke. It includes the RR of the incidence of stroke with the new medication vs placebo. If the RR is <1.0, the treatment group has a lower incidence rate than placebo. An RR of 1.0 indicates no difference. The individual squares represent each study’s RR estimate. The lines extending from the squares represent the 95% confidence interval (CI) for the estimate. The size of the square corresponds to the size of the study and therefore the precision of the estimate.
In this example, Study 1 and Study 3 favor the new medication vs placebo. The larger square in Study 3 indicates a larger sample size and more precise result than Study 1. Study 2 also favors the new medication, but since its CI crosses the point of no effect, this result is not statistically significant. The pooled estimate is indicated with a diamond at bottom. Its CI does not cross 1.0, meaning, overall, the result of the meta-analysis is statistically significant and favors the new medication.
A forest plot is an effective way to represent data for a couple of reasons. Results of individual studies, usually with dates of publication and CIs, are summarized with a pooled result. One can also quickly see how much variation exists among studies (ie, whether the individual estimates are distributed tightly around one point or spread widely apart) and the degree of precision of each study.
Figure
Relative risk of the indicence of stroke
Correspondence
Julie Yeh, MD, UPMC St. Margaret Faculty Development Fellowship Program, 3937 Butler St, Pittsburgh, PA 15215. E-mail: [email protected].
REFERENCE
1. Lewis S, Clarke M. Forest plots: trying to see the wood and the trees. BMJ 2001;322:1479-1480.
REFERENCE
1. Lewis S, Clarke M. Forest plots: trying to see the wood and the trees. BMJ 2001;322:1479-1480.
Mequinol 2%/Tretinoin 0.01% Solution: An Effective and Safe Alternative to Hydroquinone 3% in the Treatment of Solar Lentigines
Consider colonoscopy for young patients with hematochezia
- Nearly 12% of younger patients reporting rectal bleeding in this study had colon adenomas or cancer; thus, strong consideration should be given to colonoscopy in such individuals.
- Colonoscopy is a valuable diagnostic test and can help establish the source of rectal bleeding in nearly 80% of younger patients.
Background Hematochezia is a common complaint in adult patients aged <50 years. Most studies of lower endoscopy for rectal bleeding have concentrated on older patients or have failed to mention the location of lesions.
Objective To determine the findings of complete colonoscopy in adults younger than 50 years with rectal bleeding.
Methods Data were retrieved from medical records and included demographics, indications, endoscopic findings, and histology. Lesions were labeled according to location: proximal to the splenic flexure or distal to (and including) the splenic flexure. Excluded were those with a history of colitis, colorectal cancer, polyps, anemia, significant weight loss, severe bleeding, or strong family history of colorectal cancer.
Results The study included 223 patients with rectal bleeding aged <50 years who had undergone a colonoscopy. Normal findings were recorded for 48 (21.5%). Four (1.8%) were diagnosed with cancer in the distal colon, and 22 (9.9%) were found to have colon adenomas, 6 of whom had proximal adenomas only. Hemorrhoids were present in 135 patients (60.5%). Other findings included colitis, angiodysplasia, diverticulosis, anal fissures, and rectal ulcers.
Conclusions Colon neoplasms may be present even in younger adults with non-urgent rectal bleeding. Though most findings were benign and located in the distal colon, colonoscopy should be strongly considered for this patient group.
The role of colonoscopy is well established for patients aged more than 50 years with positive results on the fecal occult blood test. 1-3 For this population, colonoscopy has beenshown to reduce mortality from colorectal cancer, the second leading cause of cancer-related death in the United States. Colonoscopy has also been useful for diagnosing and treating lower gastrointestinal (GI) bleeding in older persons. 4-10
Some investigators have suggested the entire colon should be visualized in all patients with rectal bleeding. 4-11 Use of investigative colonoscopy has increased dramatically in recent years, particularly for younger patients, while use of sigmoidoscopy has declined. 12
Most of the literature on the investigation of rectal bleeding does not stratify patients by age. 4-8,13-23 Hence, there is no consensus on the proper evaluation of younger adults with rectal bleeding. The literature generally favors colonoscopy over sigmoidoscopy. But for adults aged younger than 50 years, data are sparse.
Rectal bleeding is common among younger patients
In a survey of patients aged 20 to 40 years, a history of rectal bleeding was reported in nearly 20%. 24 The concern with rectal bleeding is that it may indicate potentially serious disease, including colorectal cancer.
Deciding whether to subject a younger adult with non-urgent rectal bleeding to full colonoscopy can be difficult. A valid concern is that the incidence of colon neoplasms may be too low in younger adults to justify the widespread and costly use of colonoscopy. Colonoscopy has a small but finite risk of complications and imposes higher costs, greater discomfort, and more inconvenience for the patient than flexible sigmoidoscopy. On the other hand, the possibility of missing a neoplasm cannot be discounted.
The aim of this study was to review the diagnostic findings of colonoscopy in adults younger than 50 years who had non-urgent rectal bleeding (without alarm symptoms or signs).
Methods
Patients
We included all consecutive patients younger than 50 years who underwent colonoscopy for rectal bleeding at the University of Utah Medical Center or Salt Lake City Veterans Administration Medical Center between March 1997 and November 1999. Rectal bleeding was defined as the passage of bright blood on or within the stool, onto toilet paper, or into the toilet bowl. Patients were excluded if they had a history of colitis, colorectal cancer or polyps, severe bleeding requiring transfusion or hospitalization, unexplained weight loss greater than 5 pounds, iron-deficiency anemia, or a strong family history of colorectal cancer (at least 2 first-degree family members with colorectal cancer or 1 first-degree relative with colorectal cancer before the age of 50 years).
Data collection
Data were collected from medical records retrospectively. Patient demographics, indications for colonoscopy, endoscopic findings, and histology were retrieved.
Endoscopy
Gastroenterology faculty, or fellows under close supervision by the faculty, performed all endoscopic examinations. Informed written consent was obtained from each patient before every procedure. All endoscopic abnormalities were noted and biopsied if indicated, and all polyps were biopsied and removed. The distal colon was defined as that portion from the rectum through the splenic flexure.
Results
Two hundred twenty-three patients younger than 50 years with rectal bleeding underwent complete colonoscopy to the cecum or terminal ileum. Of the 223 patients, 170 (76%) were evaluated at the University of Utah Medical Center, and 53 (24%) were evaluated at the VA Medical Center. No major complications (hemorrhage, perforation, hypoxia) directly related to endoscopy were noted.
The Table summarizes colonoscopy findings. Of the 223 patients, 48 (21.5%) had a normal outcome. Abnormalities were found in 175 patients (78.5%). Hemorrhoids were the most common finding, present in 135 patients (60.5%). In 98 patients (73%), hemorrhoids were the only finding, excluding non-adenomatous polyps. In the other patients with hemorrhoids, coincident adenomas, colitis, and diverticulosis were also diagnosed. Other anorectal diseases, including rectal ulcers or anal fissures, were found in 14 patients (6.3%).
Twenty-six patients (11.6%) had colon neoplasms, either adenomas or adenocarcinomas. Four patients (1.8%) had adenomatous polyps 8 mm in the distal colon. Eighteen patients (8.1%) had adenomas <8 mm; 6 (2.7%) had polyps only in the proximal colon. Hyperplastic polyps were not included in this analysis. Four patients (1.8%) had adenocarcinomas. These cancers were located in the rectum or sigmoid colon. The ages of these patients ranged from 32 to 48 years. One cancer patient had a distant cousin who died of colon cancer at the age of 47; no others had a family history of colon cancer.
Biopsy-proven chronic colitis was found in 13 patients (5.8%). Among the 7 patients who had colitis in the proximal colon, colitis was present in the distal colon as well. Angiodysplasia was found in 2 of the patients (0.9%) and only affected the distal colon. Diverticulosis was found in 19 patients (8.5%).
TABLE
Colonoscopy findings in 223 patients with rectal bleeding
| Finding | Proximal | Distal | Total (%) |
|---|---|---|---|
| Carcinoma | 0 | 4 | 4 (1.8) |
| Colitis | 7 | 13 | 13 (5.8) |
| Tubular adenomas | |||
| ≥8 mm | 0 | 4 | 4 (1.8) |
| <8 mm | 6 | 14 | 18 (8.1) |
| Angiodysplasia | 0 | 2 | 2 (0.9) |
| Diverticulosis | 2 | 19 | 19 (8.5) |
| Hemorrhoids | 0 | 135 | 135 (60.5) |
| Fissure/Rectal ulcer | 0 | 14 | 14 (6.3) |
| Normal colonoscopy | 0 | 0 | 48 (21.5) |
Discussion
Rectal bleeding is a common problem in the US population. In a questionnaire sent by mail, 235 of 1643 respondents (15.5%) aged 20–64 years reported rectal bleeding. 24 The prevalence was higher in younger persons: 18.9% for those aged 20–40 years vs 11.3% for those older than 40 years (P<.001). Only 13.9% of all patients with rectal bleeding in this study had visited a physician for bowel problems in the past year.
A major challenge for the clinician is deciding if a diagnostic endoscopy is necessary and, if so,whether flexible sigmoidoscopy or colonoscopyshould be done. Certainly, the concern of missinga potentially early and curable colon neoplasm substantiates the argument favoring colonoscopy. However, the costs, risks, and inconvenience of doing colonoscopy on every patient with rectal bleeding may overshadow the benefit.
Normal/benign findings
Either normal findings or benign diseases are commonly documented in younger patients with rectal bleeding. Approximately 21% of patients in this study had normal findings on colonoscopy. Hemorrhoids are believed to be the most common cause of rectal bleeding in all age groups, accounting for 27%–72% of cases.8,19
In a random community sample of 202 people older than 30, with no history of cancer or inflammatory bowel disease, 16% reported rectal bleeding in the preceding 6 months. 25 About 43% of the respondents believed they had “hemorrhoids,” based on the presence of anal pain, bleeding, protrusion, or perianal itching. In our study, about 60% of patients had documented hemorrhoids and 6.3% had other anorectal pathology, including anal fissures and rectal ulcers.
Colitis
Colitis was found in nearly 6% of our patients, which is similar to the incidence reported in series on older patients. 26,26,26 Another study found that 6 of 102 patients under the age of 50 with rectal bleeding had colitis. 28 All the patients with colitis in our series were found to have involvement of the distal colon.
Colorectal cancer
Several studies have evaluated the prevalence of colorectal cancer among patients with rectal bleeding. An overall incidence of 4%–19% is reported in some series that included patients older than 50 years. 8,26
In a study of 280 patients younger than 40 by Acosta et al,11 the incidence of colon cancer was 0.03%. Lewis et al retrospectively evaluated 570 patients younger than 50 years with rectal bleeding and found only 1 patient with colorectal cancer.27 An additional 6.7% of patients had colorectal adenomas.
A limitation of this study, however, was that only 40% of patients had a colonoscopy; the other 60% had a flexible sigmoidoscopy. We found a colorectal cancer incidence of 1.8% among patients under 50 years old and all of these cancers were found in the distal colon.
Adenomas
Adenomas were found in 9.9% of our patients. A similar incidence was found in a series that studied the utility of anoscopy in addition to lower endoscopy.28 Only 1.8% of our patients had adenomas 8 mm, and all of these polyps were located in the distal colon. The incidence of adenomas <8 mm was 8.1%, and a third of the patients had polyps in the proximal colon. The relationship of these small adenomas to rectal bleeding is unclear as some of these patients also had hemorrhoids or diverticulosis. Polyps are common, bleed infrequently, and seem to be identified by chance during the investigation of GI bleeding.29-30
Choosing diagnostic tests for younger patients
Choosing between flexible sigmoidoscopy and colonoscopy for younger patients with rectal bleeding is a clinical dilemma. Most of the literature regarding the evaluation of rectal bleeding has either been directed towards older adults or has failed to stratify patients by age.4-8,13-22
One large study retrospectively studied the colonoscopic findings for rectal bleeding in 280 adults younger than 40 years.11 They found significant lesions, including cancers, polyps, colitis, angiodysplasia, diverticula, and rectal ulcers in 21% and concluded that full colonoscopy should be seriously considered even in this younger population. The study did not mention the location of the significant lesions within the colon, so the basis for recommending colonoscopy is unclear. Only 13.9% of patients with rectal bleeding had visited a physician for bowel problems in the past year Also, the study included a substantial number of hyperplastic polyps listed as significant pathology. To date, hyperplastic polyps do not appear to have malignant potential.
A prospective Canadian study found that, among 61 patients younger than 55 undergoing colonoscopy for rectal bleeding, most lesions, including colitis, polyps, cancers, diverticula, and hemorrhoids, were located within 60 cm of the anus.31 However, 1 cancer in a patient with massive bleeding and 1 small polyp were beyond 60 cm. A recent cost-effectiveness analysis by Lewis et al for the diagnosis of rectal bleeding in young persons demonstrated an incremental cost-effectiveness of colonoscopy as the age of the patient increased from 25 years to 45 years.32 At 35 years, the cost-effectiveness of evaluating the whole colon approximated the cost-effectiveness of repeat screening for colorectal cancer. At age 25 years, however, the cost-effectiveness of colonoscopy was more than $270,000 per year of life gained.
By comparison, several large studies have looked at colonoscopic findings in the screening population. Screening colonoscopy detected no colorectal cancers in 906 asymptomatic persons aged 40 to 49 years.33 Adenomatous polyps occurred in 8.7% of patients and advanced polyps (adenomas 10 mm, villous adenomas, adenomas with high-grade dysplasia) occurred in 3.5% patients; 55% of the lesions were located distally. In a Veterans Affairs study, advanced proximal neoplasias or invasive cancer were found in about 10% of patients older than 50 years undergoing screening colonoscopy.34 Of those with advanced proximal adenomas, only 48% had distal adenomas, supporting a role for colonoscopy over flexible sigmoidoscopy in the screening population.
Although none of the advanced adenomas or colon cancers were localized to the proximal colon, our study was not designed to determine the superiority of flexible sigmoidoscopy or colonoscopy. One important point is that flexible sigmoidoscopy at our institutions involves a full colon preparation and, in over 90% of cases, examines the distal 60 cm of colorectum (typically at or near the splenic flexure). Other studies reporting on flexible sigmoidoscopy use only enema preps and evaluate the distal colon less extensively.
The difficulty with more limited colon exams, such as anoscopy, rigid sigmoidoscopy, or flexible sigmoidoscopy, is whether or not a full colonoscopic exam should be performed when only benign anorectal pathology, namely hemorrhoids and anal fissures, are found. Hemorrhoids and anal fissures are the major cause of rectal bleeding and, because they are common, they can be coincident with more significant colon diseases, such as tumors and colitis. In our study, hemorrhoids were the only colonoscopy finding in 73% of the patients with hemorrhoids. The other 27% with hemorrhoids had coincident colorectal pathology, including adenomas and colitis, arguing that the discovery of hemorrhoids on a limited exam of the anorectum should not discourage practitioners from pursuing more detailed exams, such as colonoscopy. We can speculate that anoscopy alone would have missed a significant number of patients with cancers, adenomas, and chronic colitis.
Results and limitations of this study
The results of our study are significant in that approximately 12% of patients younger than 50 years with rectal bleeding had colon neoplasms, including 4 with colon cancers. Furthermore, an additional 13 patients had chronic colitis, another important finding with significant clinical implications for therapy and colorectal cancer surveillance.
Although a significant proportion of patients in this study was evaluated at a tertiary referral center, we believe that referral bias did not strongly influence the results of this study. Most endoscopic referrals originate from primary care providers within the University of Utah’s health care system. Furthermore, VA patients comprised approximately one fourth of the subjects, and VA patients typically receive all of their care within the VA Medical Center.
Because of the small numbers of patients in this study, it is difficult to conclude whether colonoscopy or flexible sigmoidoscopy is warranted in this patient population. However, based on current available evidence, we would strongly recommend consideration of colonoscopy in this patient population. Certainly, a large, prospective trial would be needed to answer the question of whether colonoscopy or flexible sigmoidoscopy is the appropriate test for patients younger than 50 years who present with rectal bleeding.
Corresponding author
Scott K. Kuwada, MD, Division of Gastroenterology, 4R-118 SOM, University of Utah Medical Center, 50 North Medical Drive, Salt Lake City, UT 84132. E-mail: [email protected].
1. Mandel JS, Bond JH, Church TR, et al. Reducing mortality from colorectal cancer by screening for fecal occult blood. N Engl J Med. 1993;328:1365-1371.
2. Kronborg O, Fenger C, Olsen J, Jorgensen OD, Sondergaard O. Randomised study of screening for colorectal cancer with faecal-occult-blood test. Lancet. 1996;348:1467-1471.
3. Hardcastle JD, Chamberlain JO, Robinson MH, et al. Randomised controlled trial of faecal-occult-blood screening for colorectal cancer. Lancet. 1996;348:1472-1477.
4. Helfand M, Marton KI, Zimmer-Gembeck MJ, Sox HC, Jr. History of visible rectal bleeding in a primary care population. Initial assessment and 10-year follow-up. JAMA. 1997;277:44-48.
5. Brenna E, Skreden K, Waldum HL, et al. The benefit of colonoscopy. Scand J Gastroenterol. 1990;25:81-88.
6. Editorial Investigation of rectal bleeding. Lancet. 1989;1:195-197.
7. Graham DJ, Pritchard TJ, Bloom AD. Colonoscopy for intermittent rectal bleeding: impact on patient management. J Surg Res. 1993;54:136-139.
8. Shinya H, Cwern M, Wolf G. Colonoscopy diagnosis and management of rectal bleeding. Surg Clin North Am. 1982;62:897-903.
9. Guillem JG, Forde KA, Treat MR, Neugut AI, Bodian CA. The impact of colonoscopy on early detection of colonic neoplasms in patients with rectal bleeding. Ann Surg. 1987;206:606-611.
10. Tedesco FJ, Waye JD, Raskin JB, Morris SJ, Greenwald RA. Colonoscopic evaluation of rectal bleeding: A study of 304 patients. Ann Intern Med. 1978;89:907-909.
11. Acosta JA, Fournier TK, Knutson TO, Ragland JJ. Colonoscopic evaluation of rectal bleeding in young adults. Am Surg. 1994;60:903-906.
12. Karasick S, Ehrlich SM, Levin DC, et al. Trends in use of barium enema examination, colonoscopy, and sigmoidoscopy: is use commensurate with risk of disease? Radiology. 1995;195:777-785.
13. Scrock TR. Colonoscopy diagnosis and treatment of lower GI bleeding. Surg Clin North Am. 1989;69:1309-1325.
14. Pines A, Shemesh E, Bat L. Pronged rectal bleeding associated with hemorrhoids: the diagnostic contribution of colonoscopy. South Med J. 1987;80:313-314.
15. Brand EJ, Sullivan BH, Jr, Sivak MV, Jr, Rankin GB. Colonoscopy in the diagnosis of unexpected rectal bleeding. Ann Surg. 1980;192:111-113.
16. Cheung PS, Wong SK, Boey J, Lai CK. Frank rectal bleeding: A prospective study of causes in patients over the age of 40. Postgrad Med J. 1988;64:364-368.
17. Dehn T, McGinn FP. Causes of ano-rectal bleeding. Postgrad Med J. 1982;58:92-93.
18. Gane EJ. In practice. Colonoscopy in unexplained lower GI bleeding. N Z Med J. 1992;105:31-33.
19. Goultson KJ, Cook I, Dent OF. How important is rectal bleeding in the diagnosis of bowel cancer and polyps? Lancet. 1986;2:261-264.
20. Kang JY. Investigation of rectal bleeding. Singapore Med J. 1991;32:327-328.
21. Neugut AI, Garbowski GC, Waye JD, et al. Diagnostic yield of colorectal neoplasia with colonoscopy for abdominal pain, change in bowel habits, and rectal bleeding. Am J Gastroenterol. 1993;88:1179-1183.
22. Teague RH, Manning AP, Thornton JR, Salmon PR. Colonoscopy for investigation of unexplained rectal bleeding. Lancet. 1978;1:1350-1352.
23. Swarback ET, Fevre DI, Hunt RH, Thomas BM, Williams CB. Colonoscopy for unexplained rectal bleeding. BMJ. 1978;2:1685-1687.
24. Talley NJ, Jones M. Self-reported rectal bleeding in a United States community: prevalence, risk factors, and health care seeking. Am J Gastroenterol. 1998;93:2179-2183.
25. Dent OF, Goulston KJ, Zubrzycki J, Chapuis PH. Bowel symptoms in an apparently well population. Dis Colon Rectum. 1986;29:243-247.
26. Segal WN, Greenberg PD, Rockey DC, Cello JP, McQuaid KR. The outpatient evaluation of hematochezia. Am J Gastroenterol. 1998;93:179-182.
27. Lewis JD, Shih CE, Blecker D. Endoscopy for hematochezia in patients under 50 years of age. Dig Dis Sci. 2001;46:2660-2665.
28. Korkis AM, McDougall CJ. Rectal bleeding in patients less than 50 years of age. Dig Dis Sci. 1995;40:1520-1523.
29. Lang CA, Ransohoff DF. Fecal occult blood screening for colorectal cancer. Is mortality reduced by chance selection for screening colonoscopy? JAMA. 1994;271:1011-1013.
30. Ahlquist DA, Wieand HS, Moertel CG, et al. Accuracy of fecal occult blood screening for colorectal neoplasia. A prospective study using Hemoccult and HemoQuant tests. JAMA. 1993;269:1262-1267.
31. Van Rosendaal GM, Sutherland LR, Verhoef MJ, et al. Defining the role of fiberoptic sigmoidoscopy in the investigation of patients presenting with bright red rectal bleeding. Am J Gastroenterol. 2000;95:1184-1187.
32. Lewis JD, Brown AR, Localio R, Schwartz JS. Initial evaluation of rectal bleeding in young persons: a cost-effectiveness analysis. Ann Intern Med. 2002;136:99-110.
33. Imperiale TF, Wagner DR, Yin CY, Larkin GN, Rogge JD, Ransohoff DF. Results of screening colonoscopy among persons 40 to 49 years of age. N Engl J Med. 2002;346:1781-1785.
34. Lieberman DA, Weiss DG, Bond JH, Ahnen DJ, Garewal H, Chejfec G. Use of colonoscopy to screen asymptomatic adults for colorectal cancer. Veterans Affairs Cooperative Study Group 380. N Engl J Med. 2000;343:162-168.
- Nearly 12% of younger patients reporting rectal bleeding in this study had colon adenomas or cancer; thus, strong consideration should be given to colonoscopy in such individuals.
- Colonoscopy is a valuable diagnostic test and can help establish the source of rectal bleeding in nearly 80% of younger patients.
Background Hematochezia is a common complaint in adult patients aged <50 years. Most studies of lower endoscopy for rectal bleeding have concentrated on older patients or have failed to mention the location of lesions.
Objective To determine the findings of complete colonoscopy in adults younger than 50 years with rectal bleeding.
Methods Data were retrieved from medical records and included demographics, indications, endoscopic findings, and histology. Lesions were labeled according to location: proximal to the splenic flexure or distal to (and including) the splenic flexure. Excluded were those with a history of colitis, colorectal cancer, polyps, anemia, significant weight loss, severe bleeding, or strong family history of colorectal cancer.
Results The study included 223 patients with rectal bleeding aged <50 years who had undergone a colonoscopy. Normal findings were recorded for 48 (21.5%). Four (1.8%) were diagnosed with cancer in the distal colon, and 22 (9.9%) were found to have colon adenomas, 6 of whom had proximal adenomas only. Hemorrhoids were present in 135 patients (60.5%). Other findings included colitis, angiodysplasia, diverticulosis, anal fissures, and rectal ulcers.
Conclusions Colon neoplasms may be present even in younger adults with non-urgent rectal bleeding. Though most findings were benign and located in the distal colon, colonoscopy should be strongly considered for this patient group.
The role of colonoscopy is well established for patients aged more than 50 years with positive results on the fecal occult blood test. 1-3 For this population, colonoscopy has beenshown to reduce mortality from colorectal cancer, the second leading cause of cancer-related death in the United States. Colonoscopy has also been useful for diagnosing and treating lower gastrointestinal (GI) bleeding in older persons. 4-10
Some investigators have suggested the entire colon should be visualized in all patients with rectal bleeding. 4-11 Use of investigative colonoscopy has increased dramatically in recent years, particularly for younger patients, while use of sigmoidoscopy has declined. 12
Most of the literature on the investigation of rectal bleeding does not stratify patients by age. 4-8,13-23 Hence, there is no consensus on the proper evaluation of younger adults with rectal bleeding. The literature generally favors colonoscopy over sigmoidoscopy. But for adults aged younger than 50 years, data are sparse.
Rectal bleeding is common among younger patients
In a survey of patients aged 20 to 40 years, a history of rectal bleeding was reported in nearly 20%. 24 The concern with rectal bleeding is that it may indicate potentially serious disease, including colorectal cancer.
Deciding whether to subject a younger adult with non-urgent rectal bleeding to full colonoscopy can be difficult. A valid concern is that the incidence of colon neoplasms may be too low in younger adults to justify the widespread and costly use of colonoscopy. Colonoscopy has a small but finite risk of complications and imposes higher costs, greater discomfort, and more inconvenience for the patient than flexible sigmoidoscopy. On the other hand, the possibility of missing a neoplasm cannot be discounted.
The aim of this study was to review the diagnostic findings of colonoscopy in adults younger than 50 years who had non-urgent rectal bleeding (without alarm symptoms or signs).
Methods
Patients
We included all consecutive patients younger than 50 years who underwent colonoscopy for rectal bleeding at the University of Utah Medical Center or Salt Lake City Veterans Administration Medical Center between March 1997 and November 1999. Rectal bleeding was defined as the passage of bright blood on or within the stool, onto toilet paper, or into the toilet bowl. Patients were excluded if they had a history of colitis, colorectal cancer or polyps, severe bleeding requiring transfusion or hospitalization, unexplained weight loss greater than 5 pounds, iron-deficiency anemia, or a strong family history of colorectal cancer (at least 2 first-degree family members with colorectal cancer or 1 first-degree relative with colorectal cancer before the age of 50 years).
Data collection
Data were collected from medical records retrospectively. Patient demographics, indications for colonoscopy, endoscopic findings, and histology were retrieved.
Endoscopy
Gastroenterology faculty, or fellows under close supervision by the faculty, performed all endoscopic examinations. Informed written consent was obtained from each patient before every procedure. All endoscopic abnormalities were noted and biopsied if indicated, and all polyps were biopsied and removed. The distal colon was defined as that portion from the rectum through the splenic flexure.
Results
Two hundred twenty-three patients younger than 50 years with rectal bleeding underwent complete colonoscopy to the cecum or terminal ileum. Of the 223 patients, 170 (76%) were evaluated at the University of Utah Medical Center, and 53 (24%) were evaluated at the VA Medical Center. No major complications (hemorrhage, perforation, hypoxia) directly related to endoscopy were noted.
The Table summarizes colonoscopy findings. Of the 223 patients, 48 (21.5%) had a normal outcome. Abnormalities were found in 175 patients (78.5%). Hemorrhoids were the most common finding, present in 135 patients (60.5%). In 98 patients (73%), hemorrhoids were the only finding, excluding non-adenomatous polyps. In the other patients with hemorrhoids, coincident adenomas, colitis, and diverticulosis were also diagnosed. Other anorectal diseases, including rectal ulcers or anal fissures, were found in 14 patients (6.3%).
Twenty-six patients (11.6%) had colon neoplasms, either adenomas or adenocarcinomas. Four patients (1.8%) had adenomatous polyps 8 mm in the distal colon. Eighteen patients (8.1%) had adenomas <8 mm; 6 (2.7%) had polyps only in the proximal colon. Hyperplastic polyps were not included in this analysis. Four patients (1.8%) had adenocarcinomas. These cancers were located in the rectum or sigmoid colon. The ages of these patients ranged from 32 to 48 years. One cancer patient had a distant cousin who died of colon cancer at the age of 47; no others had a family history of colon cancer.
Biopsy-proven chronic colitis was found in 13 patients (5.8%). Among the 7 patients who had colitis in the proximal colon, colitis was present in the distal colon as well. Angiodysplasia was found in 2 of the patients (0.9%) and only affected the distal colon. Diverticulosis was found in 19 patients (8.5%).
TABLE
Colonoscopy findings in 223 patients with rectal bleeding
| Finding | Proximal | Distal | Total (%) |
|---|---|---|---|
| Carcinoma | 0 | 4 | 4 (1.8) |
| Colitis | 7 | 13 | 13 (5.8) |
| Tubular adenomas | |||
| ≥8 mm | 0 | 4 | 4 (1.8) |
| <8 mm | 6 | 14 | 18 (8.1) |
| Angiodysplasia | 0 | 2 | 2 (0.9) |
| Diverticulosis | 2 | 19 | 19 (8.5) |
| Hemorrhoids | 0 | 135 | 135 (60.5) |
| Fissure/Rectal ulcer | 0 | 14 | 14 (6.3) |
| Normal colonoscopy | 0 | 0 | 48 (21.5) |
Discussion
Rectal bleeding is a common problem in the US population. In a questionnaire sent by mail, 235 of 1643 respondents (15.5%) aged 20–64 years reported rectal bleeding. 24 The prevalence was higher in younger persons: 18.9% for those aged 20–40 years vs 11.3% for those older than 40 years (P<.001). Only 13.9% of all patients with rectal bleeding in this study had visited a physician for bowel problems in the past year.
A major challenge for the clinician is deciding if a diagnostic endoscopy is necessary and, if so,whether flexible sigmoidoscopy or colonoscopyshould be done. Certainly, the concern of missinga potentially early and curable colon neoplasm substantiates the argument favoring colonoscopy. However, the costs, risks, and inconvenience of doing colonoscopy on every patient with rectal bleeding may overshadow the benefit.
Normal/benign findings
Either normal findings or benign diseases are commonly documented in younger patients with rectal bleeding. Approximately 21% of patients in this study had normal findings on colonoscopy. Hemorrhoids are believed to be the most common cause of rectal bleeding in all age groups, accounting for 27%–72% of cases.8,19
In a random community sample of 202 people older than 30, with no history of cancer or inflammatory bowel disease, 16% reported rectal bleeding in the preceding 6 months. 25 About 43% of the respondents believed they had “hemorrhoids,” based on the presence of anal pain, bleeding, protrusion, or perianal itching. In our study, about 60% of patients had documented hemorrhoids and 6.3% had other anorectal pathology, including anal fissures and rectal ulcers.
Colitis
Colitis was found in nearly 6% of our patients, which is similar to the incidence reported in series on older patients. 26,26,26 Another study found that 6 of 102 patients under the age of 50 with rectal bleeding had colitis. 28 All the patients with colitis in our series were found to have involvement of the distal colon.
Colorectal cancer
Several studies have evaluated the prevalence of colorectal cancer among patients with rectal bleeding. An overall incidence of 4%–19% is reported in some series that included patients older than 50 years. 8,26
In a study of 280 patients younger than 40 by Acosta et al,11 the incidence of colon cancer was 0.03%. Lewis et al retrospectively evaluated 570 patients younger than 50 years with rectal bleeding and found only 1 patient with colorectal cancer.27 An additional 6.7% of patients had colorectal adenomas.
A limitation of this study, however, was that only 40% of patients had a colonoscopy; the other 60% had a flexible sigmoidoscopy. We found a colorectal cancer incidence of 1.8% among patients under 50 years old and all of these cancers were found in the distal colon.
Adenomas
Adenomas were found in 9.9% of our patients. A similar incidence was found in a series that studied the utility of anoscopy in addition to lower endoscopy.28 Only 1.8% of our patients had adenomas 8 mm, and all of these polyps were located in the distal colon. The incidence of adenomas <8 mm was 8.1%, and a third of the patients had polyps in the proximal colon. The relationship of these small adenomas to rectal bleeding is unclear as some of these patients also had hemorrhoids or diverticulosis. Polyps are common, bleed infrequently, and seem to be identified by chance during the investigation of GI bleeding.29-30
Choosing diagnostic tests for younger patients
Choosing between flexible sigmoidoscopy and colonoscopy for younger patients with rectal bleeding is a clinical dilemma. Most of the literature regarding the evaluation of rectal bleeding has either been directed towards older adults or has failed to stratify patients by age.4-8,13-22
One large study retrospectively studied the colonoscopic findings for rectal bleeding in 280 adults younger than 40 years.11 They found significant lesions, including cancers, polyps, colitis, angiodysplasia, diverticula, and rectal ulcers in 21% and concluded that full colonoscopy should be seriously considered even in this younger population. The study did not mention the location of the significant lesions within the colon, so the basis for recommending colonoscopy is unclear. Only 13.9% of patients with rectal bleeding had visited a physician for bowel problems in the past year Also, the study included a substantial number of hyperplastic polyps listed as significant pathology. To date, hyperplastic polyps do not appear to have malignant potential.
A prospective Canadian study found that, among 61 patients younger than 55 undergoing colonoscopy for rectal bleeding, most lesions, including colitis, polyps, cancers, diverticula, and hemorrhoids, were located within 60 cm of the anus.31 However, 1 cancer in a patient with massive bleeding and 1 small polyp were beyond 60 cm. A recent cost-effectiveness analysis by Lewis et al for the diagnosis of rectal bleeding in young persons demonstrated an incremental cost-effectiveness of colonoscopy as the age of the patient increased from 25 years to 45 years.32 At 35 years, the cost-effectiveness of evaluating the whole colon approximated the cost-effectiveness of repeat screening for colorectal cancer. At age 25 years, however, the cost-effectiveness of colonoscopy was more than $270,000 per year of life gained.
By comparison, several large studies have looked at colonoscopic findings in the screening population. Screening colonoscopy detected no colorectal cancers in 906 asymptomatic persons aged 40 to 49 years.33 Adenomatous polyps occurred in 8.7% of patients and advanced polyps (adenomas 10 mm, villous adenomas, adenomas with high-grade dysplasia) occurred in 3.5% patients; 55% of the lesions were located distally. In a Veterans Affairs study, advanced proximal neoplasias or invasive cancer were found in about 10% of patients older than 50 years undergoing screening colonoscopy.34 Of those with advanced proximal adenomas, only 48% had distal adenomas, supporting a role for colonoscopy over flexible sigmoidoscopy in the screening population.
Although none of the advanced adenomas or colon cancers were localized to the proximal colon, our study was not designed to determine the superiority of flexible sigmoidoscopy or colonoscopy. One important point is that flexible sigmoidoscopy at our institutions involves a full colon preparation and, in over 90% of cases, examines the distal 60 cm of colorectum (typically at or near the splenic flexure). Other studies reporting on flexible sigmoidoscopy use only enema preps and evaluate the distal colon less extensively.
The difficulty with more limited colon exams, such as anoscopy, rigid sigmoidoscopy, or flexible sigmoidoscopy, is whether or not a full colonoscopic exam should be performed when only benign anorectal pathology, namely hemorrhoids and anal fissures, are found. Hemorrhoids and anal fissures are the major cause of rectal bleeding and, because they are common, they can be coincident with more significant colon diseases, such as tumors and colitis. In our study, hemorrhoids were the only colonoscopy finding in 73% of the patients with hemorrhoids. The other 27% with hemorrhoids had coincident colorectal pathology, including adenomas and colitis, arguing that the discovery of hemorrhoids on a limited exam of the anorectum should not discourage practitioners from pursuing more detailed exams, such as colonoscopy. We can speculate that anoscopy alone would have missed a significant number of patients with cancers, adenomas, and chronic colitis.
Results and limitations of this study
The results of our study are significant in that approximately 12% of patients younger than 50 years with rectal bleeding had colon neoplasms, including 4 with colon cancers. Furthermore, an additional 13 patients had chronic colitis, another important finding with significant clinical implications for therapy and colorectal cancer surveillance.
Although a significant proportion of patients in this study was evaluated at a tertiary referral center, we believe that referral bias did not strongly influence the results of this study. Most endoscopic referrals originate from primary care providers within the University of Utah’s health care system. Furthermore, VA patients comprised approximately one fourth of the subjects, and VA patients typically receive all of their care within the VA Medical Center.
Because of the small numbers of patients in this study, it is difficult to conclude whether colonoscopy or flexible sigmoidoscopy is warranted in this patient population. However, based on current available evidence, we would strongly recommend consideration of colonoscopy in this patient population. Certainly, a large, prospective trial would be needed to answer the question of whether colonoscopy or flexible sigmoidoscopy is the appropriate test for patients younger than 50 years who present with rectal bleeding.
Corresponding author
Scott K. Kuwada, MD, Division of Gastroenterology, 4R-118 SOM, University of Utah Medical Center, 50 North Medical Drive, Salt Lake City, UT 84132. E-mail: [email protected].
1. Mandel JS, Bond JH, Church TR, et al. Reducing mortality from colorectal cancer by screening for fecal occult blood. N Engl J Med. 1993;328:1365-1371.
2. Kronborg O, Fenger C, Olsen J, Jorgensen OD, Sondergaard O. Randomised study of screening for colorectal cancer with faecal-occult-blood test. Lancet. 1996;348:1467-1471.
3. Hardcastle JD, Chamberlain JO, Robinson MH, et al. Randomised controlled trial of faecal-occult-blood screening for colorectal cancer. Lancet. 1996;348:1472-1477.
4. Helfand M, Marton KI, Zimmer-Gembeck MJ, Sox HC, Jr. History of visible rectal bleeding in a primary care population. Initial assessment and 10-year follow-up. JAMA. 1997;277:44-48.
5. Brenna E, Skreden K, Waldum HL, et al. The benefit of colonoscopy. Scand J Gastroenterol. 1990;25:81-88.
6. Editorial Investigation of rectal bleeding. Lancet. 1989;1:195-197.
7. Graham DJ, Pritchard TJ, Bloom AD. Colonoscopy for intermittent rectal bleeding: impact on patient management. J Surg Res. 1993;54:136-139.
8. Shinya H, Cwern M, Wolf G. Colonoscopy diagnosis and management of rectal bleeding. Surg Clin North Am. 1982;62:897-903.
9. Guillem JG, Forde KA, Treat MR, Neugut AI, Bodian CA. The impact of colonoscopy on early detection of colonic neoplasms in patients with rectal bleeding. Ann Surg. 1987;206:606-611.
10. Tedesco FJ, Waye JD, Raskin JB, Morris SJ, Greenwald RA. Colonoscopic evaluation of rectal bleeding: A study of 304 patients. Ann Intern Med. 1978;89:907-909.
11. Acosta JA, Fournier TK, Knutson TO, Ragland JJ. Colonoscopic evaluation of rectal bleeding in young adults. Am Surg. 1994;60:903-906.
12. Karasick S, Ehrlich SM, Levin DC, et al. Trends in use of barium enema examination, colonoscopy, and sigmoidoscopy: is use commensurate with risk of disease? Radiology. 1995;195:777-785.
13. Scrock TR. Colonoscopy diagnosis and treatment of lower GI bleeding. Surg Clin North Am. 1989;69:1309-1325.
14. Pines A, Shemesh E, Bat L. Pronged rectal bleeding associated with hemorrhoids: the diagnostic contribution of colonoscopy. South Med J. 1987;80:313-314.
15. Brand EJ, Sullivan BH, Jr, Sivak MV, Jr, Rankin GB. Colonoscopy in the diagnosis of unexpected rectal bleeding. Ann Surg. 1980;192:111-113.
16. Cheung PS, Wong SK, Boey J, Lai CK. Frank rectal bleeding: A prospective study of causes in patients over the age of 40. Postgrad Med J. 1988;64:364-368.
17. Dehn T, McGinn FP. Causes of ano-rectal bleeding. Postgrad Med J. 1982;58:92-93.
18. Gane EJ. In practice. Colonoscopy in unexplained lower GI bleeding. N Z Med J. 1992;105:31-33.
19. Goultson KJ, Cook I, Dent OF. How important is rectal bleeding in the diagnosis of bowel cancer and polyps? Lancet. 1986;2:261-264.
20. Kang JY. Investigation of rectal bleeding. Singapore Med J. 1991;32:327-328.
21. Neugut AI, Garbowski GC, Waye JD, et al. Diagnostic yield of colorectal neoplasia with colonoscopy for abdominal pain, change in bowel habits, and rectal bleeding. Am J Gastroenterol. 1993;88:1179-1183.
22. Teague RH, Manning AP, Thornton JR, Salmon PR. Colonoscopy for investigation of unexplained rectal bleeding. Lancet. 1978;1:1350-1352.
23. Swarback ET, Fevre DI, Hunt RH, Thomas BM, Williams CB. Colonoscopy for unexplained rectal bleeding. BMJ. 1978;2:1685-1687.
24. Talley NJ, Jones M. Self-reported rectal bleeding in a United States community: prevalence, risk factors, and health care seeking. Am J Gastroenterol. 1998;93:2179-2183.
25. Dent OF, Goulston KJ, Zubrzycki J, Chapuis PH. Bowel symptoms in an apparently well population. Dis Colon Rectum. 1986;29:243-247.
26. Segal WN, Greenberg PD, Rockey DC, Cello JP, McQuaid KR. The outpatient evaluation of hematochezia. Am J Gastroenterol. 1998;93:179-182.
27. Lewis JD, Shih CE, Blecker D. Endoscopy for hematochezia in patients under 50 years of age. Dig Dis Sci. 2001;46:2660-2665.
28. Korkis AM, McDougall CJ. Rectal bleeding in patients less than 50 years of age. Dig Dis Sci. 1995;40:1520-1523.
29. Lang CA, Ransohoff DF. Fecal occult blood screening for colorectal cancer. Is mortality reduced by chance selection for screening colonoscopy? JAMA. 1994;271:1011-1013.
30. Ahlquist DA, Wieand HS, Moertel CG, et al. Accuracy of fecal occult blood screening for colorectal neoplasia. A prospective study using Hemoccult and HemoQuant tests. JAMA. 1993;269:1262-1267.
31. Van Rosendaal GM, Sutherland LR, Verhoef MJ, et al. Defining the role of fiberoptic sigmoidoscopy in the investigation of patients presenting with bright red rectal bleeding. Am J Gastroenterol. 2000;95:1184-1187.
32. Lewis JD, Brown AR, Localio R, Schwartz JS. Initial evaluation of rectal bleeding in young persons: a cost-effectiveness analysis. Ann Intern Med. 2002;136:99-110.
33. Imperiale TF, Wagner DR, Yin CY, Larkin GN, Rogge JD, Ransohoff DF. Results of screening colonoscopy among persons 40 to 49 years of age. N Engl J Med. 2002;346:1781-1785.
34. Lieberman DA, Weiss DG, Bond JH, Ahnen DJ, Garewal H, Chejfec G. Use of colonoscopy to screen asymptomatic adults for colorectal cancer. Veterans Affairs Cooperative Study Group 380. N Engl J Med. 2000;343:162-168.
Estimating mortality reduction by comparing survival curves
In the Carvedilol or Metoprolol European Trial (COMET),1 patients with heart failure were randomized to receive either carvedilol or metoprolol in addition to their current diuretic and angiotensin-converting enzyme inhibitor. A visual comparison of the survival curves shows a reduction in mortality in the carvedilol group compared with those in the metoprolol group (Figure 1).
Figure 1
Comparing survival curves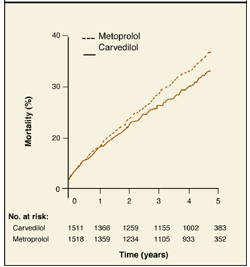
How to derive mortality reduction from survival curves
Different statistical methods are used to compare survival curves. Most commonly used is the hazard ratio, the increased speed with which one group is likely to experience an event at any given time in relation to another group. In the COMET trial, the hazard ratio for all-cause mortality was 0.83. This represents a 17% reduction in the risk of death with carvedilol compared with metoprolol.
A rough estimate of the hazard ratio can be made by comparing median survival (the time point on each curve that corresponds to 50% survival) in both groups. In Figure 2, patients with non-small-cell lung cancer receiving supportive care (group A) had an approximate median survival of 4 months compared with 6 months in those who had also received chemotherapy (group B).
The hazard ratio is estimated by dividing the median survival time of group A by the median survival time of group B, or 4 months/6 months = 0.66. The reduction in risk of death for group B is therefore 37%. It is possible to estimate the hazard ratio this way only when the percent survival falls below 50% in each group.
Figure 2
Estimating hazard ratios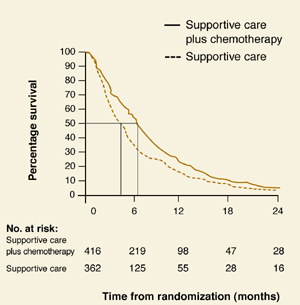
Correspondence
Mary K. Nordling, MD, Lawrence Family Practice Residency, 34 Haverhill Street, Lawrence, MA 01841. Email: [email protected].
1. Poole-Wilson PA, Swedberg K, Cleland JGF, et al. Comparison of carvedilol and metoprolol on clinical outcomes in patients with chronic heart failure in the Carvedilol Or Metoprolol European Trial (COMET): randomized controlled trial. Lancet 2003;362:7-13.
2. Non-small Cell Lung Cancer Collaborative Group. Chemotherapy in non-small cell lung cancer: a meta-analysis using updated data on individual patients from 52 randomised clinical trials. BMJ 1995;311:899-909.
In the Carvedilol or Metoprolol European Trial (COMET),1 patients with heart failure were randomized to receive either carvedilol or metoprolol in addition to their current diuretic and angiotensin-converting enzyme inhibitor. A visual comparison of the survival curves shows a reduction in mortality in the carvedilol group compared with those in the metoprolol group (Figure 1).
Figure 1
Comparing survival curves
How to derive mortality reduction from survival curves
Different statistical methods are used to compare survival curves. Most commonly used is the hazard ratio, the increased speed with which one group is likely to experience an event at any given time in relation to another group. In the COMET trial, the hazard ratio for all-cause mortality was 0.83. This represents a 17% reduction in the risk of death with carvedilol compared with metoprolol.
A rough estimate of the hazard ratio can be made by comparing median survival (the time point on each curve that corresponds to 50% survival) in both groups. In Figure 2, patients with non-small-cell lung cancer receiving supportive care (group A) had an approximate median survival of 4 months compared with 6 months in those who had also received chemotherapy (group B).
The hazard ratio is estimated by dividing the median survival time of group A by the median survival time of group B, or 4 months/6 months = 0.66. The reduction in risk of death for group B is therefore 37%. It is possible to estimate the hazard ratio this way only when the percent survival falls below 50% in each group.
Figure 2
Estimating hazard ratios
Correspondence
Mary K. Nordling, MD, Lawrence Family Practice Residency, 34 Haverhill Street, Lawrence, MA 01841. Email: [email protected].
1. Poole-Wilson PA, Swedberg K, Cleland JGF, et al. Comparison of carvedilol and metoprolol on clinical outcomes in patients with chronic heart failure in the Carvedilol Or Metoprolol European Trial (COMET): randomized controlled trial. Lancet 2003;362:7-13.
2. Non-small Cell Lung Cancer Collaborative Group. Chemotherapy in non-small cell lung cancer: a meta-analysis using updated data on individual patients from 52 randomised clinical trials. BMJ 1995;311:899-909.