User login
Safety and Efficacy of Combined Use of 4-Hydroxyanisole (mequinol) 2%/Tretinoin 0.01% Solution and Sunscreen in Solar Lentigines
Noxious Sensory Perceptions in Patients With Mild to Moderate Rosacea Treated With Azelaic Acid 15% Gel
Raloxifene reduces risk of vertebral fractures and breast cancer in postmenopausal women regardless of prior hormone therapy
- Consider prescribing raloxifene 60 mg/d for postmenopausal women, regardless of whether they have used hormone therapy, to reduce the incidence of vertebral fractures and breast cancer (SOR:B).
Objective: We examined whether past use of hormone therapy influences the effects of raloxifene on the risk of new vertebral fracture, cardiovascular events, or breast cancer.
Study Design: The Multiple Outcomes of Raloxifene Evaluation (MORE) trial examined vertebral fracture incidence as the primary endpoint, breast cancer incidence as a secondary endpoint. Cardiovascular events were collected as secondary safety endpoints.
Population: The MORE trial enrolled 7705 postmenopausal women. Of the 7682 women who reported their previous HT use status, 29% used HT before screening.
Outcomes Measured: Separate logistic regression models analyzed the relationships between prior HT use and the risk of vertebral fracture, cardiovascular events, or breast cancer. Interaction terms with P<.10 were considered to be statistically significant. Confidence intervals for relative risks (RR) were calculated using the Mantel-Haenszel method.
Results: Raloxifene 60 mg/d, the clinically approved dose for osteoporosis prevention and treatment, reduced the risk of vertebral fractures by 54% (RR=0.46) and 29% (RR=0.71) in women with and without prior HT use, respectively (interaction P=.05). A lower incidence of invasive breast cancer in women with prior HT use (RR=0.23) and in women without prior HT use [RR=0.31; interaction P=.60] was observed in women receiving raloxifene (pooled doses). Irrespective of prior HT use, women treated with raloxifene (pooled doses) had no change in incidence of cardiovascular events (interaction P=.56).
Conclusions: The risk of vertebral fractures was lower in women treated with raloxifene, regardless of prior HT use, but there was a suggestion that the effect was greater in women who had used HT. Women randomized to receive raloxifene exhibited a decreased incidence of invasive breast cancer, compared with women receiving placebo. No change occurred in the incidence of cardiovascular events, regardless of prior HT use.
Estrogen-containing hormone therapies (HT) have been used to alleviate menopausal symptoms and to prevent chronic diseases common to postmenopausal women, including osteoporosis and cardiovascular disease.1,2 In this analysis, we use the abbreviation “HT” to refer to postmenopausal hormone therapies, either estrogen alone or combined with progestin.
Based on the findings of the randomized, double-blind Women’s Health Initiative (WHI) study involving estrogen-progestin,3 the Food and Drug Administration (FDA) recommends using HT to treat moderate to severe symptoms of vulvar and vaginal atrophy and vasomotor symptoms associated with the menopause, and to prevent post-menopausal osteoporosis.4 When HT is prescribed only to prevent osteoporosis in women without menopausal symptoms, the FDA recommends that other approved, non-estrogen therapies be considered and that HT be used at the lowest dose for the shortest duration to achieve treatment goals.4 Many postmenopausal women have chosen to discontinue HT in light of these recommendations.5 However, discontinuing HT may increase bone resorption and accelerate bone loss,6,7 which, if untreated, places women at risk for osteoporotic fractures.
The serum estrogen receptor modulator (SERM) raloxifene is not an estrogen, a progestin, or a hormone,8 but it binds to the estrogen receptor to exert effects in the skeletal and cardiovascular systems and in breast tissue.9 In the 4-year Multiple Outcomes of Raloxifene Evaluation (MORE) osteoporosis treatment trial of postmenopausal women, raloxifene 60 mg/d, the approved dose for post-menopausal osteoporosis prevention and treatment, increased bone mineral density (BMD) and significantly reduced the risk for new vertebral fractures with sustained efficacy.10 With the declining use of long-term HT,5 it is clinically relevant and important to determine whether a history of HT use has any influence on the effects of other antiresorptive agents, such as raloxifene, which may be subsequently used for postmenopausal osteoporosis prevention and treatment. The objective of this analysis is to determine the effects of raloxifene on BMD, and the risks of vertebral fractures, cardiovascular events, and breast cancer in post-menopausal women who did or did not use HT prior to screening for the MORE osteoporosis study.
Materials and methods
Subjects and treatment
Details on subject recruitment and follow-up, and complete inclusion and exclusion criteria, were previously described for the MORE study.11 The trial examined the incidence of osteoporotic fractures as a primary endpoint and the incidence of breast cancer as a prespecified secondary endpoint, and it collected reports of cardiovascular events as a secondary safety endpoint.
Researchers enrolled 7705 women up to 80 years of age who were at least 2 years post-menopausal, and who had osteoporosis as defined by radiographically apparent vertebral fractures at baseline or BMD criteria. Women were randomly assigned to receive raloxifene 60 or 120 mg/d, or an identically appearing placebo.11 All women received daily supplements of calcium (500 mg) and vitamin D (400 to 600 IU). An ethical review board at each site approved the MORE study protocol. All women gave written informed consent to participate in the study in accordance with the ethical principles stated in the Declaration of Helsinki.
At study screening, women were asked if they had ever taken HT. Women were excluded from the study if they were experiencing clinically severe menopausal symptoms at the beginning of the study that required estrogen. Women were excluded if they had been treated with therapeutic doses of androgen, calcitonin, or estrogen (>1 cycle or 28 days) alone or with progestin (>1 cycle or 28 days) within 6 months of beginning the study. Women were permitted to have used systemic (oral or transdermal) estrogen and progestin for up to 1 cycle (28 days) during the 6 months before the study. No systemic estrogen and progestin use was allowed within 2 months before study entry. Occasional use of topical estrogens (3 times per week), and oral estriol (2 mg/d) for menopausal symptoms was permitted.
A 1-year double-blind extension phase was added to the 3-year treatment phase.10 All vertebral fracture, cardiovascular, and breast cancer endpoints that occurred over the 48-month study period were included in the present analyses.
Fracture and BMD assessment
New morphometric vertebral fractures, defined using semiquantitative assessment criteria,12 were identified by comparing spinal radiographs taken at 2, 3, and 4 years with baseline radiographs. A new vertebral fracture was defined as a vertebral fracture occurring in a vertebra that was not fractured at baseline. New clinical vertebral fractures were defined as those associated with signs or symptoms suggestive of vertebral fracture, such as back pain, reported either at an interim 6-month clinic visit or at any time between clinic visits,13 and which were subsequently corroborated with radiographs and adjudicated as previously described.10
Lumbar spine and femoral neck BMD were measured annually using dual-energy x-ray densitometry, as previously described.11
Cardiovascular event assessment
Cardiovascular events were collected as a secondary safety endpoint in the MORE trial, as previously described in detail.14 Women were asked at each clinic visit if they had had a myocardial infarction (MI), coronary bypass surgery, percutaneous coronary revascularization, or a stroke since the previous visit, and unsolicited reports of adverse cardiovascular events were recorded. All summaries of reported cardiovascular events were reviewed and adjudicated by 1 board-certified cardiologist, contracted by the sponsor, who was not associated with the trial and was blinded to treatment assignment.
Women with 4 or more risk points, assessed using the same criteria as for enrollment in the Raloxifene Use for The Heart (RUTH) trial,15 were considered to be at high risk for cardiovascular events. Coronary events included MI, unstable angina, or coronary ischemia.14 Cerebrovascular events included stroke and transient ischemic attack.14
Breast cancer assessment
Assessment of breast cancer was a prespecified secondary endpoint of the MORE trial, and was previously described in detail.16 All diagnoses of breast cancer were adjudicated by an independent oncology review board consisting of 5 physician specialists in breast cancer, and chaired by a pharmacologic scientist, none of whom were employed by the sponsor. Previous publications of the MORE breast cancer data have reported 61 cases of invasive breast cancer.16 A subsequent review of the MORE dataset found 1 fewer case of invasive breast cancer in each of the placebo and pooled raloxifene groups, so that 59 cases of invasive breast cancer were confirmed, and this number will be used in the present analysis. The change in the number of cases of invasive breast cancer was small, and had no impact on the overall interpretation of the breast cancer results from the MORE trial.
Results
Characteristics for all subjects at baseline and for women in the placebo group
Of the 7705 women enrolled, 7682 (99.7%) reported their status of previous HT use, with 2235 women (29.1%) having used HT before participating in MORE ( W1, available at www.jfponline.com). Baseline characteristics that were significantly different between women who reported prior HT use and those who reported no prior HT use included age, BMD, and the incidences of vertebral fractures, coronary angioplasty, hypertension, hyperlipidemia, and family histories of osteoporosis or breast cancer (Table W1, available at www.jfponline.com). In the subsets of women who did and who did not use HT previously, the baseline characteristics were not significantly different between the placebo and raloxifene groups, except for diabetes (placebo, 1.9%; raloxifene 60 mg/day, 3.3%; pooled raloxifene, 2.9%; P=.02).
In the placebo group, the incidence of new vertebral fractures, cardiovascular events, and breast cancer at 4 years were not significantly different in women with prior HT use compared with women without prior HT use.
Vertebral fracture events and bone mineral density
After 4 years of treatment with raloxifene 60 mg/d, women with and without prior HT use exhibited significant reductions in new vertebral fractures compared with those taking placebo ( Figure ). Vertebral fracture risk reductions between treatment groups were also statistically significant in subgroups of women with and without prevalent vertebral fractures ( Table1 ). Raloxifene 60 mg/d also reduced the risk of new clinically-apparent vertebral fractures, compared with placebo, in women with prior HT use (absolute risk reduction (ARR)=1.8%; RR=0.52 [95% CI, 0.28–0.96]), and in women without prior HT use (ARR=1.7%; RR=0.61 [95% CI, 0.43–0.87]; interaction P=.66]. The interaction P-values remained similar after adjusting for the baseline fracture risk factors (TableW1 , at www.jfponline.com) that were significantly different between women with and women without prior HT use. Women with and without prior HT use treated with raloxifene 60 mg/d had significant increases in BMD, at the lumbar spine (2.7% and 2.5%, respectively; interaction P=.54), and femoral neck (2.6% and 1.9% respectively; interaction P=.06), compared with placebo. Similar results were observed for fracture and BMD in women treated with the pooled raloxifene doses.
TABLE 1
Absolute and relative risks of new vertebral fractures with raloxifene 60 mg/d compared with placeboa
| Women who had used HT (n=1305) | Women who had notused HT (n=3232) | Overall study population d | |||||||
|---|---|---|---|---|---|---|---|---|---|
| Placebo (n=654) | Raloxifene 60 mg/d(n=651) | RR (95% CI)b [ARR] | Placebo (n=1634) | Raloxifene 60 md/d (n=1598) | RR (95% CI)[ARR] | Interaction P-valuec | RR (95% CI) | ||
| Women with prevalent fractures | 25.36% | 13.68% | 0.54(0.36–0.81)[11.68%] | 24.24% | 17.11% | 0.71(0.57–0.88)[7.13%] | .27 | 0.66(0.55–0.81) | |
| Women without prevalent vertebral | 6.29% | 1.82% | 0.29(0.13–0.63) [4.47%] | 5.54% | 3.46% | 0.62(0.41–0.95)[2.08%] | .09 | 0.51(0.35–0.73) | |
| a Results with raloxifene 60 mg/d are shown since this is the clinically approved dose for osteoporosis prevention and treatment. Results with pooled raloxifene doses were similar. Data from women with at least one post-baseline follow-up spinal radiograph were included in this table. | |||||||||
| b RR (95% CI) denotes relative risk (95% confidence interval) Absolute risk reductions, denoted [ARR], are the differences between the placebo and raloxifene groups. Similar results were observed with raloxifene (pooled 60 mg/d and 120 mg/d doses) on vertebral fracture risk, in women who previously used HT [ARR=6.6%; RR=0.47 (95% CI, 0.35–0.63)], and in women without prior HT use [ARR=4.4%; RR=0.66 (95% CI, 0.55–0.78); interaction P=.06] | |||||||||
| c Results for the overall study population would be used unless the interaction effects between therapy group and prior HT use were statistically significant (P<.10), in which case, the results in the subgroups of women with and women without prior HT use should be used. | |||||||||
| d Delmas et al10 published the results for the overall study population, regardless of whether or not information on the participants’ HT use was available. | |||||||||
FIGURE
Percentage of women with and without prior HT use who experienced new vertebral fractures in the 4-year MORE study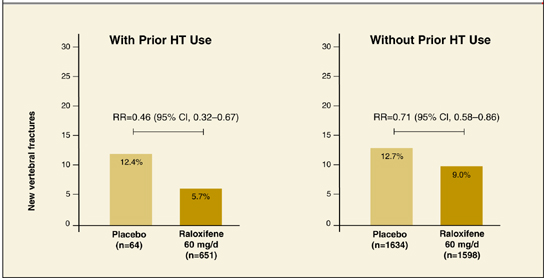
This analysis included all women with at least 1 post-baseline follow-up vertebral radiograph, who reported their status of prior HT use. The relative risks (RR) and 95% confidence intervals (CI) are shown for women treated with either placebo or raloxifene 60 mg/d. The absolute risk reductions were 6.7% in women with prior HT use and 3.7% in women without prior HT use. The interaction P-value was .05.
Cardiovascular events
In women with and without prior HT use, treatment with raloxifene (pooled doses) did not result in statistically significant changes in the incidence of new cardiovascular, coronary, or cerebrovascu-lar events, compared with placebo ( Table2 ). In a subgroup of women who were at high risk of cardiovascular disease,15 prior HT use had no effect on the incidence of new cardiovascular events with raloxifene (pooled doses) treatment ( Table 2 ). The interaction P-values remained similar after adjusting for the baseline cardiovascular risk factors (Table W1, at www.jfponline.com) that were significantly different between women with and without prior HT use.
TABLE 2
Absolute and relative risks of cardiovascular events with raloxifene (pooled doses) compared with placeboa
| Women who had used HT (n=2235) | Women who had not used HT (n=5447) | Overall studypopulation | ||||||
|---|---|---|---|---|---|---|---|---|
| Placebo(n=738) | Pooled raloxifene(n=1497) | RR (95% CI)b [ARR] | Placebo (n=1833) | Pooled raloxifene (n=3614) | RR(95% CI)[ARR] | Interaction P-valuec | RR(95% CI) | |
| Cardiovascular events | 2.71% | 2.87% | 1.06(0.63–1.79)[–0.16%] | 4.15% | 3.68% | 0.89(0.67–1.17) [0.47%] | .56 | 0.92(0.72–1.18) |
| Coronary events | 1.49% | 1.74% | 1.17 (0.58–2.35)[–0.25%] | 2.40% | 2.08% | 0.87 (0.60–1.25) [0.32%] | .46 | 0.92(0.67–1.28) |
| Cerebrovascularevents | 1.22% | 1.14% | 0.93(0.42–2.08)[0.08%] | 1.75% | 1.63% | 0.94 (0.61–1.43)[.012%] | .99 | 0.93(0.64–1.36) |
| Cardiovascularevents in high-risk subgroupd | 12.66% | 5.91% | .047(0.21–1.06)[6.75%] | 13.08% | 8.54% | 0.65 (0.42–1.01)[4.54%] | .49 | 0.60(0.41–0.88) [4.54%] |
| a Pooled raloxifene doses were used in this analysis, since there were few events. There were no differences in the incidence of events between the raloxifene doses. | ||||||||
| b Relative risk (RR), 95% confidence interval (95% CI). Absolute risk reductions, denoted [ARR], are the differences between the placebo and raloxifene groups. | ||||||||
| c The interaction effects between therapy group and prior HT use were not statistically significant (P>.10), so results from the overall study population would be used. Barrett-Connor et al14 reported the results for raloxifene 60 mg/d and raloxifene 120 mg/d in the overall study population, regardless of whether or not information on the participants’ HT use was available. | ||||||||
| d Of the 1029 women in the high-risk subgroup, 764 women had no prior history of HT use (placebo, n=237; raloxifene, n=527), and 265 women reported prior HT use (placebo, n=79; raloxifene, n=186). | ||||||||
Breast cancer
In women with and without prior HT use, similar reductions in the incidence of breast cancer (regardless of invasiveness), invasive breast cancer, and estrogen-receptor positive invasive breast cancer, were observed after raloxifene treatment (pooled doses) compared with placebo ( Table 3 ). The interaction P-values remained similar after adjusting for the baseline breast cancer risk factors (Table W1) that were significantly different between women with and without prior HT use.
TABLE 3
Absolute and relative risks of breast cancer with raloxifene (pooled doses) compared with placeboa
| Women who had used HT (n=2235) | Women who had notused HT (n=5447) | Overall study population | ||||||
|---|---|---|---|---|---|---|---|---|
| Placebo(n=738) | Pooledraloxifene(n=1497) | RR(95% CI)b [ARR] | Placebo(n=1833) | Pooled raloxifene(n=3614) | RR(95% CI)[ARR] | InteractionP-valuec | RR(95% CI) | |
| Breast cancer d | 2.30% | 0.73% | 0.32(0.15–0.68)[1.57%] | 1.47% | 0.64% | 0.43(0.25–0.75)[0.83%] | .52 | 0.38 (0.24–0.58) |
| Invasivebreast cancer | 2.03% | 0.47% | 0.23(0.09–0.56)[1.56%] | 1.25% | 0.39% | 0.31(0.16–0.60) [0.86%] | .60 | 0.28(0.17–0.46) |
| Invasiveestrogen-receptorpositive breastcancer | 1.76% | 0.27% | 0.15(0.05–0.46)[1.49%] | 0.87% | 0.17% | 0.19(0.08–0.49)[0.70%] | .75 | 0.16(0.09–0.30) |
| a Pooled raloxifene doses were used in this analysis, since there were few events. There were no differences in the incidence of events between the raloxifene doses. | ||||||||
| b Relative risk (RR), 95% confidence interval (95% CI). Absolute risk reductions, denoted [ARR], are the differences between the placebo and raloxifene groups. | ||||||||
| c The interaction effects between therapy group and prior HT use were not statistically significant (P>.10), so results from the overall study population would be used. Cauley et al16 reported the results for in the overall study population, regardless of whether or not information on the participants’ HT use was available. | ||||||||
| d All breast cancer, regardless of invasiveness. | ||||||||
Discussion
This analysis examined the effects of raloxifene in women who reported their use of postmenopausal hormone therapies before enrolling in the MORE osteoporosis trial. Compared with placebo, women treated with raloxifene experienced significant decreases in the risks for new vertebral fractures and the incidence of breast cancer, without significant changes in the incidence of cardiovascular events, regardless of previous HT use. These analyses provide further information on the effects of raloxifene on the risks of vertebral fractures,10 cardiovascular events,14 and breast cancer16 seen in the overall MORE study population at 4 years.
This analysis found a differential reduction in vertebral fracture risk with raloxifene between women who did and did not have prior HT use, which may result from possible differences in women who chose to use HT before participating in MORE. In women with previous HT use, a greater proportion had a family history of osteo-porosis and a lower proportion had prevalent ver-tebral fractures at baseline, compared with women who had not used HT. Other unidentified confounding factors, such as the “healthy user” bias commonly associated with women who chose to use HT,17 may also contribute to the differential vertebral fracture risk reduction with raloxifene treatment. The Study of Osteoporotic Fractures showed that women with current estrogen use had significantly decreased fracture risks, but the risk reduction waned in women who discontinued estrogen.18 After HT discontinuation, BMD loss resumes at a rate similar to that seen in women shortly after menopause, suggesting that prior HT use may have limited residual effects on maintaining BMD.7,19 Such findings raise the urgency of evaluating the risk for osteoporosis in women who discontinue HT.
Women treated with raloxifene had no significant changes in the incidence of cardiovascular events, with no differential treatment effect based on prior HT use. In the HERS20 and WHI3 trials, which studied the outcomes of estrogen-progestin therapy in postmenopausal women, similar analyses did not show any significant differential effects of prior HT use on the incidence of cardiovascular events with estrogen-progestin during the respective trials.
In this analysis, women treated with raloxifene had a significantly lower incidence of breast cancer compared with those who received placebo, and this incidence was comparable between women with and without prior HT use. In contrast, women who had used HT before the WHI study had a significant increase in the risk of breast cancer with estrogen-progestin therapy during the study, compared with those who had not used HT.3
A limitation of our analysis that a history of HT use was based on participants’ self-report, which depended on their ability to recall medication they may have taken years earlier. Also, no information was obtained on therapy duration and the doses and formulations of HT. Since the MORE trial was conducted in 25 countries, the patterns and types of HT regimens are expected to be different. The strength of our analysis is that the MORE population was large enough to prospectively collect data on multiple clinical outcomes.
In summary, postmenopausal women treated with raloxifene experienced a significant risk reduction for vertebral fractures, regardless of prior HT use, but women who had used HT may exhibit greater reductions. Women who used raloxifene had no change in the incidence of cardiovascular events and a lower incidence of breast cancer, compared with placebo, regardless of their history of HT use. Since HT is becoming increasingly limited to short-term use for menopausal symptoms, women and their physicians may consider several other therapeutic options to address postmenopausal health concerns.
Acknowledgments
The authors acknowledge the contributions of Leo Plouffe Jr., MD, and Somnath Sarkar, PhD, for suggestions on manuscript content, and Sharon Xiaohan Zou, MS, for statistical programming. A complete list of all investigators in the MORE trial is found in J Clin Endocrinol Metab 2002; 87:3609–3617. Portions of this work were presented at the following meetings: Third European Symposium on Clinical and Economic Aspects of Osteoporosis and Osteoarthritis, Barcelona, Spain, 2002; International Society for Clinical Densitometry (ISCD), Los Angeles, USA,2003; European Calcified Tissue Society (ECTS), Rome, Italy, 2003; International Bone and Mineral Society (IBMS), Osaka, Japan, 2003; European Menopause and Andropause Society (EMAS), Bucharest, Romania, 2003; Ninth Bath Conference on Osteoporosis, Bath, UK, 2003. Eli Lilly and Company sponsored the Multiple Outcomes of Raloxifene Evaluation (MORE) Trial.
Corresponding author
Olof Johnell, MD, PhD, Department of Orthopedics, Universitetssjukhuset MAS, Malmo, SE-20502, Sweden. E-mail: [email protected].
1. Greendale GA, Lee NP, Arriola ER. The menopause. Lancet 1999;353:571-580.
2. Grady D, Rubin SM, Petitti DB, et al. Hormone therapy to prevent disease and prolong life in postmenopausal women. Ann Intern Med 1992;117:1016-1037.
3. Writing Group for the Women’s Health Initiative Investigators. Risks and benefits of estrogen plus progestin in healthy postmenopausal women. Principal results from the Women’s Health Initiative randomized controlled trial. JAMA 2002;288:321-333.
4. Bren L. The estrogen and progestin dilemma: New advice, labeling and guidelines. FDA Consumer 2003;37:10-11.
5. Haas JS, Kaplan CP, Gerstenberger EP, Kerlikowske K. Changes in the use of postmenopausal hormone therapy after the publication of clinical trial results. Ann Intern Med 2004;140:184-188.
6. Gallagher JC, Rapuri PB, Haynatzki G, Detter JR. Effect of discontinuation of estrogen, calcitriol, and the combination of both on bone density and bone markers. J Clin Endocrinol Metab 2002;87:4914-4923.
7. Tremollieres FA, Pouilles JM, Ribot C. Withdrawal of hormone replacement therapy is associated with significant ver-tebral bone loss in postmenopausal women. Osteoporos Int 2001;12:385-390.
8. Riggs BL, Hartmann LC. Selective estrogen-receptor modulators —mechanisms of action and application to clinical practice. N Engl J Med 2003;348:618-629.
9. Maricic M, Gluck O. Review of raloxifene and its clinical applications in osteoporosis. Expert Opin Pharmacother 2002;3:767-775.
10. Delmas PD, Ensrud KE, Adachi JD, et al. Efficacy of raloxifene on vertebral fracture risk reduction in postmenopausal women with osteoporosis: four-year results from a randomized clinical trial. J Clin Endocrinol Metab 2002;87:3609-3617.
11. Ettinger B, Black DM, Mitlak BH, et al. Reduction of verte-bral fracture risk in postmenopausal women with osteo-porosis treated with raloxifene: Results from a 3-year randomized clinical trial. JAMA 1999;282:637-645.
12. Genant HK, Wu CY, van Kuijk C, Nevitt MC. Vertebral fracture assessment using a semiquantitative technique. J Bone Miner Res 1993;8:1137-1148.
13. Maricic M, Adachi JD, Sarkar S, Wu W, Wong M, Harper KD. Early effects of raloxifene on clinical vertebral fractures at 12 months in postmenopausal women with osteoporosis. Arch Intern Med 2002;162:1140-1143.
14. Barrett-Connor E, Grady D, Sashegyi A, et al. Raloxifene and cardiovascular events in osteoporotic postmenopausal women: four-year results from the MORE (Multiple Outcomes of Raloxifene Evaluation) randomized trial. JAMA 2002;287:847-857.
15. Mosca L, Barrett-Connor E, Wenger NK, et al. Design and methods of the Raloxifene Use for The Heart (RUTH) study. Am J Cardiol 2001;88:392-395.
16. Cauley J, Norton L, Lippman ME, et al. Continued breast cancer risk reduction in postmenopausal women treated with raloxifene: 4-year Results from the MORE Trial. Breast Cancer Res Treat 2001;65:125-134.
17. Grodstein F, Clarkson TB, Manson JE. Understanding the divergent data on postmenopausal hormone therapy. N Engl J Med 2003;348:645-650.
18. Cauley J, Seeley DG, Ensrud K, Ettinger B, Black D, Cummings SR. Estrogen replacement therapy and fractures in older women. Study of Osteoporotic Fractures Research Group. Ann Intern Med 1995;122:9-16.
19. Greendale GA, Espeland M, Slone S, Marcus R, Barrett-Connor E. Bone mass response to discontinuation of long-term hormone replacement therapy: results from the Postmenopausal Estrogen/Progestin Interventions (PEPI) Safety Follow-up Study. Arch Intern Med 2002;162:665-672.
20. Grady D, Herrington D, Bittner V, et al. Cardiovascular disease outcomes during 6.8 years of hormone therapy: Heart and Estrogen/Progestin Replacement Study Follow-up (HERS II). JAMA 2002;288:49-57.
21. Looker AC, Wahner HW, Dunn WL, et al. Updated data on proximal femur bone mineral levels of US adults. Osteoporos Int 1998;8:468-489.
- Consider prescribing raloxifene 60 mg/d for postmenopausal women, regardless of whether they have used hormone therapy, to reduce the incidence of vertebral fractures and breast cancer (SOR:B).
Objective: We examined whether past use of hormone therapy influences the effects of raloxifene on the risk of new vertebral fracture, cardiovascular events, or breast cancer.
Study Design: The Multiple Outcomes of Raloxifene Evaluation (MORE) trial examined vertebral fracture incidence as the primary endpoint, breast cancer incidence as a secondary endpoint. Cardiovascular events were collected as secondary safety endpoints.
Population: The MORE trial enrolled 7705 postmenopausal women. Of the 7682 women who reported their previous HT use status, 29% used HT before screening.
Outcomes Measured: Separate logistic regression models analyzed the relationships between prior HT use and the risk of vertebral fracture, cardiovascular events, or breast cancer. Interaction terms with P<.10 were considered to be statistically significant. Confidence intervals for relative risks (RR) were calculated using the Mantel-Haenszel method.
Results: Raloxifene 60 mg/d, the clinically approved dose for osteoporosis prevention and treatment, reduced the risk of vertebral fractures by 54% (RR=0.46) and 29% (RR=0.71) in women with and without prior HT use, respectively (interaction P=.05). A lower incidence of invasive breast cancer in women with prior HT use (RR=0.23) and in women without prior HT use [RR=0.31; interaction P=.60] was observed in women receiving raloxifene (pooled doses). Irrespective of prior HT use, women treated with raloxifene (pooled doses) had no change in incidence of cardiovascular events (interaction P=.56).
Conclusions: The risk of vertebral fractures was lower in women treated with raloxifene, regardless of prior HT use, but there was a suggestion that the effect was greater in women who had used HT. Women randomized to receive raloxifene exhibited a decreased incidence of invasive breast cancer, compared with women receiving placebo. No change occurred in the incidence of cardiovascular events, regardless of prior HT use.
Estrogen-containing hormone therapies (HT) have been used to alleviate menopausal symptoms and to prevent chronic diseases common to postmenopausal women, including osteoporosis and cardiovascular disease.1,2 In this analysis, we use the abbreviation “HT” to refer to postmenopausal hormone therapies, either estrogen alone or combined with progestin.
Based on the findings of the randomized, double-blind Women’s Health Initiative (WHI) study involving estrogen-progestin,3 the Food and Drug Administration (FDA) recommends using HT to treat moderate to severe symptoms of vulvar and vaginal atrophy and vasomotor symptoms associated with the menopause, and to prevent post-menopausal osteoporosis.4 When HT is prescribed only to prevent osteoporosis in women without menopausal symptoms, the FDA recommends that other approved, non-estrogen therapies be considered and that HT be used at the lowest dose for the shortest duration to achieve treatment goals.4 Many postmenopausal women have chosen to discontinue HT in light of these recommendations.5 However, discontinuing HT may increase bone resorption and accelerate bone loss,6,7 which, if untreated, places women at risk for osteoporotic fractures.
The serum estrogen receptor modulator (SERM) raloxifene is not an estrogen, a progestin, or a hormone,8 but it binds to the estrogen receptor to exert effects in the skeletal and cardiovascular systems and in breast tissue.9 In the 4-year Multiple Outcomes of Raloxifene Evaluation (MORE) osteoporosis treatment trial of postmenopausal women, raloxifene 60 mg/d, the approved dose for post-menopausal osteoporosis prevention and treatment, increased bone mineral density (BMD) and significantly reduced the risk for new vertebral fractures with sustained efficacy.10 With the declining use of long-term HT,5 it is clinically relevant and important to determine whether a history of HT use has any influence on the effects of other antiresorptive agents, such as raloxifene, which may be subsequently used for postmenopausal osteoporosis prevention and treatment. The objective of this analysis is to determine the effects of raloxifene on BMD, and the risks of vertebral fractures, cardiovascular events, and breast cancer in post-menopausal women who did or did not use HT prior to screening for the MORE osteoporosis study.
Materials and methods
Subjects and treatment
Details on subject recruitment and follow-up, and complete inclusion and exclusion criteria, were previously described for the MORE study.11 The trial examined the incidence of osteoporotic fractures as a primary endpoint and the incidence of breast cancer as a prespecified secondary endpoint, and it collected reports of cardiovascular events as a secondary safety endpoint.
Researchers enrolled 7705 women up to 80 years of age who were at least 2 years post-menopausal, and who had osteoporosis as defined by radiographically apparent vertebral fractures at baseline or BMD criteria. Women were randomly assigned to receive raloxifene 60 or 120 mg/d, or an identically appearing placebo.11 All women received daily supplements of calcium (500 mg) and vitamin D (400 to 600 IU). An ethical review board at each site approved the MORE study protocol. All women gave written informed consent to participate in the study in accordance with the ethical principles stated in the Declaration of Helsinki.
At study screening, women were asked if they had ever taken HT. Women were excluded from the study if they were experiencing clinically severe menopausal symptoms at the beginning of the study that required estrogen. Women were excluded if they had been treated with therapeutic doses of androgen, calcitonin, or estrogen (>1 cycle or 28 days) alone or with progestin (>1 cycle or 28 days) within 6 months of beginning the study. Women were permitted to have used systemic (oral or transdermal) estrogen and progestin for up to 1 cycle (28 days) during the 6 months before the study. No systemic estrogen and progestin use was allowed within 2 months before study entry. Occasional use of topical estrogens (3 times per week), and oral estriol (2 mg/d) for menopausal symptoms was permitted.
A 1-year double-blind extension phase was added to the 3-year treatment phase.10 All vertebral fracture, cardiovascular, and breast cancer endpoints that occurred over the 48-month study period were included in the present analyses.
Fracture and BMD assessment
New morphometric vertebral fractures, defined using semiquantitative assessment criteria,12 were identified by comparing spinal radiographs taken at 2, 3, and 4 years with baseline radiographs. A new vertebral fracture was defined as a vertebral fracture occurring in a vertebra that was not fractured at baseline. New clinical vertebral fractures were defined as those associated with signs or symptoms suggestive of vertebral fracture, such as back pain, reported either at an interim 6-month clinic visit or at any time between clinic visits,13 and which were subsequently corroborated with radiographs and adjudicated as previously described.10
Lumbar spine and femoral neck BMD were measured annually using dual-energy x-ray densitometry, as previously described.11
Cardiovascular event assessment
Cardiovascular events were collected as a secondary safety endpoint in the MORE trial, as previously described in detail.14 Women were asked at each clinic visit if they had had a myocardial infarction (MI), coronary bypass surgery, percutaneous coronary revascularization, or a stroke since the previous visit, and unsolicited reports of adverse cardiovascular events were recorded. All summaries of reported cardiovascular events were reviewed and adjudicated by 1 board-certified cardiologist, contracted by the sponsor, who was not associated with the trial and was blinded to treatment assignment.
Women with 4 or more risk points, assessed using the same criteria as for enrollment in the Raloxifene Use for The Heart (RUTH) trial,15 were considered to be at high risk for cardiovascular events. Coronary events included MI, unstable angina, or coronary ischemia.14 Cerebrovascular events included stroke and transient ischemic attack.14
Breast cancer assessment
Assessment of breast cancer was a prespecified secondary endpoint of the MORE trial, and was previously described in detail.16 All diagnoses of breast cancer were adjudicated by an independent oncology review board consisting of 5 physician specialists in breast cancer, and chaired by a pharmacologic scientist, none of whom were employed by the sponsor. Previous publications of the MORE breast cancer data have reported 61 cases of invasive breast cancer.16 A subsequent review of the MORE dataset found 1 fewer case of invasive breast cancer in each of the placebo and pooled raloxifene groups, so that 59 cases of invasive breast cancer were confirmed, and this number will be used in the present analysis. The change in the number of cases of invasive breast cancer was small, and had no impact on the overall interpretation of the breast cancer results from the MORE trial.
Results
Characteristics for all subjects at baseline and for women in the placebo group
Of the 7705 women enrolled, 7682 (99.7%) reported their status of previous HT use, with 2235 women (29.1%) having used HT before participating in MORE ( W1, available at www.jfponline.com). Baseline characteristics that were significantly different between women who reported prior HT use and those who reported no prior HT use included age, BMD, and the incidences of vertebral fractures, coronary angioplasty, hypertension, hyperlipidemia, and family histories of osteoporosis or breast cancer (Table W1, available at www.jfponline.com). In the subsets of women who did and who did not use HT previously, the baseline characteristics were not significantly different between the placebo and raloxifene groups, except for diabetes (placebo, 1.9%; raloxifene 60 mg/day, 3.3%; pooled raloxifene, 2.9%; P=.02).
In the placebo group, the incidence of new vertebral fractures, cardiovascular events, and breast cancer at 4 years were not significantly different in women with prior HT use compared with women without prior HT use.
Vertebral fracture events and bone mineral density
After 4 years of treatment with raloxifene 60 mg/d, women with and without prior HT use exhibited significant reductions in new vertebral fractures compared with those taking placebo ( Figure ). Vertebral fracture risk reductions between treatment groups were also statistically significant in subgroups of women with and without prevalent vertebral fractures ( Table1 ). Raloxifene 60 mg/d also reduced the risk of new clinically-apparent vertebral fractures, compared with placebo, in women with prior HT use (absolute risk reduction (ARR)=1.8%; RR=0.52 [95% CI, 0.28–0.96]), and in women without prior HT use (ARR=1.7%; RR=0.61 [95% CI, 0.43–0.87]; interaction P=.66]. The interaction P-values remained similar after adjusting for the baseline fracture risk factors (TableW1 , at www.jfponline.com) that were significantly different between women with and women without prior HT use. Women with and without prior HT use treated with raloxifene 60 mg/d had significant increases in BMD, at the lumbar spine (2.7% and 2.5%, respectively; interaction P=.54), and femoral neck (2.6% and 1.9% respectively; interaction P=.06), compared with placebo. Similar results were observed for fracture and BMD in women treated with the pooled raloxifene doses.
TABLE 1
Absolute and relative risks of new vertebral fractures with raloxifene 60 mg/d compared with placeboa
| Women who had used HT (n=1305) | Women who had notused HT (n=3232) | Overall study population d | |||||||
|---|---|---|---|---|---|---|---|---|---|
| Placebo (n=654) | Raloxifene 60 mg/d(n=651) | RR (95% CI)b [ARR] | Placebo (n=1634) | Raloxifene 60 md/d (n=1598) | RR (95% CI)[ARR] | Interaction P-valuec | RR (95% CI) | ||
| Women with prevalent fractures | 25.36% | 13.68% | 0.54(0.36–0.81)[11.68%] | 24.24% | 17.11% | 0.71(0.57–0.88)[7.13%] | .27 | 0.66(0.55–0.81) | |
| Women without prevalent vertebral | 6.29% | 1.82% | 0.29(0.13–0.63) [4.47%] | 5.54% | 3.46% | 0.62(0.41–0.95)[2.08%] | .09 | 0.51(0.35–0.73) | |
| a Results with raloxifene 60 mg/d are shown since this is the clinically approved dose for osteoporosis prevention and treatment. Results with pooled raloxifene doses were similar. Data from women with at least one post-baseline follow-up spinal radiograph were included in this table. | |||||||||
| b RR (95% CI) denotes relative risk (95% confidence interval) Absolute risk reductions, denoted [ARR], are the differences between the placebo and raloxifene groups. Similar results were observed with raloxifene (pooled 60 mg/d and 120 mg/d doses) on vertebral fracture risk, in women who previously used HT [ARR=6.6%; RR=0.47 (95% CI, 0.35–0.63)], and in women without prior HT use [ARR=4.4%; RR=0.66 (95% CI, 0.55–0.78); interaction P=.06] | |||||||||
| c Results for the overall study population would be used unless the interaction effects between therapy group and prior HT use were statistically significant (P<.10), in which case, the results in the subgroups of women with and women without prior HT use should be used. | |||||||||
| d Delmas et al10 published the results for the overall study population, regardless of whether or not information on the participants’ HT use was available. | |||||||||
FIGURE
Percentage of women with and without prior HT use who experienced new vertebral fractures in the 4-year MORE study
This analysis included all women with at least 1 post-baseline follow-up vertebral radiograph, who reported their status of prior HT use. The relative risks (RR) and 95% confidence intervals (CI) are shown for women treated with either placebo or raloxifene 60 mg/d. The absolute risk reductions were 6.7% in women with prior HT use and 3.7% in women without prior HT use. The interaction P-value was .05.
Cardiovascular events
In women with and without prior HT use, treatment with raloxifene (pooled doses) did not result in statistically significant changes in the incidence of new cardiovascular, coronary, or cerebrovascu-lar events, compared with placebo ( Table2 ). In a subgroup of women who were at high risk of cardiovascular disease,15 prior HT use had no effect on the incidence of new cardiovascular events with raloxifene (pooled doses) treatment ( Table 2 ). The interaction P-values remained similar after adjusting for the baseline cardiovascular risk factors (Table W1, at www.jfponline.com) that were significantly different between women with and without prior HT use.
TABLE 2
Absolute and relative risks of cardiovascular events with raloxifene (pooled doses) compared with placeboa
| Women who had used HT (n=2235) | Women who had not used HT (n=5447) | Overall studypopulation | ||||||
|---|---|---|---|---|---|---|---|---|
| Placebo(n=738) | Pooled raloxifene(n=1497) | RR (95% CI)b [ARR] | Placebo (n=1833) | Pooled raloxifene (n=3614) | RR(95% CI)[ARR] | Interaction P-valuec | RR(95% CI) | |
| Cardiovascular events | 2.71% | 2.87% | 1.06(0.63–1.79)[–0.16%] | 4.15% | 3.68% | 0.89(0.67–1.17) [0.47%] | .56 | 0.92(0.72–1.18) |
| Coronary events | 1.49% | 1.74% | 1.17 (0.58–2.35)[–0.25%] | 2.40% | 2.08% | 0.87 (0.60–1.25) [0.32%] | .46 | 0.92(0.67–1.28) |
| Cerebrovascularevents | 1.22% | 1.14% | 0.93(0.42–2.08)[0.08%] | 1.75% | 1.63% | 0.94 (0.61–1.43)[.012%] | .99 | 0.93(0.64–1.36) |
| Cardiovascularevents in high-risk subgroupd | 12.66% | 5.91% | .047(0.21–1.06)[6.75%] | 13.08% | 8.54% | 0.65 (0.42–1.01)[4.54%] | .49 | 0.60(0.41–0.88) [4.54%] |
| a Pooled raloxifene doses were used in this analysis, since there were few events. There were no differences in the incidence of events between the raloxifene doses. | ||||||||
| b Relative risk (RR), 95% confidence interval (95% CI). Absolute risk reductions, denoted [ARR], are the differences between the placebo and raloxifene groups. | ||||||||
| c The interaction effects between therapy group and prior HT use were not statistically significant (P>.10), so results from the overall study population would be used. Barrett-Connor et al14 reported the results for raloxifene 60 mg/d and raloxifene 120 mg/d in the overall study population, regardless of whether or not information on the participants’ HT use was available. | ||||||||
| d Of the 1029 women in the high-risk subgroup, 764 women had no prior history of HT use (placebo, n=237; raloxifene, n=527), and 265 women reported prior HT use (placebo, n=79; raloxifene, n=186). | ||||||||
Breast cancer
In women with and without prior HT use, similar reductions in the incidence of breast cancer (regardless of invasiveness), invasive breast cancer, and estrogen-receptor positive invasive breast cancer, were observed after raloxifene treatment (pooled doses) compared with placebo ( Table 3 ). The interaction P-values remained similar after adjusting for the baseline breast cancer risk factors (Table W1) that were significantly different between women with and without prior HT use.
TABLE 3
Absolute and relative risks of breast cancer with raloxifene (pooled doses) compared with placeboa
| Women who had used HT (n=2235) | Women who had notused HT (n=5447) | Overall study population | ||||||
|---|---|---|---|---|---|---|---|---|
| Placebo(n=738) | Pooledraloxifene(n=1497) | RR(95% CI)b [ARR] | Placebo(n=1833) | Pooled raloxifene(n=3614) | RR(95% CI)[ARR] | InteractionP-valuec | RR(95% CI) | |
| Breast cancer d | 2.30% | 0.73% | 0.32(0.15–0.68)[1.57%] | 1.47% | 0.64% | 0.43(0.25–0.75)[0.83%] | .52 | 0.38 (0.24–0.58) |
| Invasivebreast cancer | 2.03% | 0.47% | 0.23(0.09–0.56)[1.56%] | 1.25% | 0.39% | 0.31(0.16–0.60) [0.86%] | .60 | 0.28(0.17–0.46) |
| Invasiveestrogen-receptorpositive breastcancer | 1.76% | 0.27% | 0.15(0.05–0.46)[1.49%] | 0.87% | 0.17% | 0.19(0.08–0.49)[0.70%] | .75 | 0.16(0.09–0.30) |
| a Pooled raloxifene doses were used in this analysis, since there were few events. There were no differences in the incidence of events between the raloxifene doses. | ||||||||
| b Relative risk (RR), 95% confidence interval (95% CI). Absolute risk reductions, denoted [ARR], are the differences between the placebo and raloxifene groups. | ||||||||
| c The interaction effects between therapy group and prior HT use were not statistically significant (P>.10), so results from the overall study population would be used. Cauley et al16 reported the results for in the overall study population, regardless of whether or not information on the participants’ HT use was available. | ||||||||
| d All breast cancer, regardless of invasiveness. | ||||||||
Discussion
This analysis examined the effects of raloxifene in women who reported their use of postmenopausal hormone therapies before enrolling in the MORE osteoporosis trial. Compared with placebo, women treated with raloxifene experienced significant decreases in the risks for new vertebral fractures and the incidence of breast cancer, without significant changes in the incidence of cardiovascular events, regardless of previous HT use. These analyses provide further information on the effects of raloxifene on the risks of vertebral fractures,10 cardiovascular events,14 and breast cancer16 seen in the overall MORE study population at 4 years.
This analysis found a differential reduction in vertebral fracture risk with raloxifene between women who did and did not have prior HT use, which may result from possible differences in women who chose to use HT before participating in MORE. In women with previous HT use, a greater proportion had a family history of osteo-porosis and a lower proportion had prevalent ver-tebral fractures at baseline, compared with women who had not used HT. Other unidentified confounding factors, such as the “healthy user” bias commonly associated with women who chose to use HT,17 may also contribute to the differential vertebral fracture risk reduction with raloxifene treatment. The Study of Osteoporotic Fractures showed that women with current estrogen use had significantly decreased fracture risks, but the risk reduction waned in women who discontinued estrogen.18 After HT discontinuation, BMD loss resumes at a rate similar to that seen in women shortly after menopause, suggesting that prior HT use may have limited residual effects on maintaining BMD.7,19 Such findings raise the urgency of evaluating the risk for osteoporosis in women who discontinue HT.
Women treated with raloxifene had no significant changes in the incidence of cardiovascular events, with no differential treatment effect based on prior HT use. In the HERS20 and WHI3 trials, which studied the outcomes of estrogen-progestin therapy in postmenopausal women, similar analyses did not show any significant differential effects of prior HT use on the incidence of cardiovascular events with estrogen-progestin during the respective trials.
In this analysis, women treated with raloxifene had a significantly lower incidence of breast cancer compared with those who received placebo, and this incidence was comparable between women with and without prior HT use. In contrast, women who had used HT before the WHI study had a significant increase in the risk of breast cancer with estrogen-progestin therapy during the study, compared with those who had not used HT.3
A limitation of our analysis that a history of HT use was based on participants’ self-report, which depended on their ability to recall medication they may have taken years earlier. Also, no information was obtained on therapy duration and the doses and formulations of HT. Since the MORE trial was conducted in 25 countries, the patterns and types of HT regimens are expected to be different. The strength of our analysis is that the MORE population was large enough to prospectively collect data on multiple clinical outcomes.
In summary, postmenopausal women treated with raloxifene experienced a significant risk reduction for vertebral fractures, regardless of prior HT use, but women who had used HT may exhibit greater reductions. Women who used raloxifene had no change in the incidence of cardiovascular events and a lower incidence of breast cancer, compared with placebo, regardless of their history of HT use. Since HT is becoming increasingly limited to short-term use for menopausal symptoms, women and their physicians may consider several other therapeutic options to address postmenopausal health concerns.
Acknowledgments
The authors acknowledge the contributions of Leo Plouffe Jr., MD, and Somnath Sarkar, PhD, for suggestions on manuscript content, and Sharon Xiaohan Zou, MS, for statistical programming. A complete list of all investigators in the MORE trial is found in J Clin Endocrinol Metab 2002; 87:3609–3617. Portions of this work were presented at the following meetings: Third European Symposium on Clinical and Economic Aspects of Osteoporosis and Osteoarthritis, Barcelona, Spain, 2002; International Society for Clinical Densitometry (ISCD), Los Angeles, USA,2003; European Calcified Tissue Society (ECTS), Rome, Italy, 2003; International Bone and Mineral Society (IBMS), Osaka, Japan, 2003; European Menopause and Andropause Society (EMAS), Bucharest, Romania, 2003; Ninth Bath Conference on Osteoporosis, Bath, UK, 2003. Eli Lilly and Company sponsored the Multiple Outcomes of Raloxifene Evaluation (MORE) Trial.
Corresponding author
Olof Johnell, MD, PhD, Department of Orthopedics, Universitetssjukhuset MAS, Malmo, SE-20502, Sweden. E-mail: [email protected].
1. Greendale GA, Lee NP, Arriola ER. The menopause. Lancet 1999;353:571-580.
2. Grady D, Rubin SM, Petitti DB, et al. Hormone therapy to prevent disease and prolong life in postmenopausal women. Ann Intern Med 1992;117:1016-1037.
3. Writing Group for the Women’s Health Initiative Investigators. Risks and benefits of estrogen plus progestin in healthy postmenopausal women. Principal results from the Women’s Health Initiative randomized controlled trial. JAMA 2002;288:321-333.
4. Bren L. The estrogen and progestin dilemma: New advice, labeling and guidelines. FDA Consumer 2003;37:10-11.
5. Haas JS, Kaplan CP, Gerstenberger EP, Kerlikowske K. Changes in the use of postmenopausal hormone therapy after the publication of clinical trial results. Ann Intern Med 2004;140:184-188.
6. Gallagher JC, Rapuri PB, Haynatzki G, Detter JR. Effect of discontinuation of estrogen, calcitriol, and the combination of both on bone density and bone markers. J Clin Endocrinol Metab 2002;87:4914-4923.
7. Tremollieres FA, Pouilles JM, Ribot C. Withdrawal of hormone replacement therapy is associated with significant ver-tebral bone loss in postmenopausal women. Osteoporos Int 2001;12:385-390.
8. Riggs BL, Hartmann LC. Selective estrogen-receptor modulators —mechanisms of action and application to clinical practice. N Engl J Med 2003;348:618-629.
9. Maricic M, Gluck O. Review of raloxifene and its clinical applications in osteoporosis. Expert Opin Pharmacother 2002;3:767-775.
10. Delmas PD, Ensrud KE, Adachi JD, et al. Efficacy of raloxifene on vertebral fracture risk reduction in postmenopausal women with osteoporosis: four-year results from a randomized clinical trial. J Clin Endocrinol Metab 2002;87:3609-3617.
11. Ettinger B, Black DM, Mitlak BH, et al. Reduction of verte-bral fracture risk in postmenopausal women with osteo-porosis treated with raloxifene: Results from a 3-year randomized clinical trial. JAMA 1999;282:637-645.
12. Genant HK, Wu CY, van Kuijk C, Nevitt MC. Vertebral fracture assessment using a semiquantitative technique. J Bone Miner Res 1993;8:1137-1148.
13. Maricic M, Adachi JD, Sarkar S, Wu W, Wong M, Harper KD. Early effects of raloxifene on clinical vertebral fractures at 12 months in postmenopausal women with osteoporosis. Arch Intern Med 2002;162:1140-1143.
14. Barrett-Connor E, Grady D, Sashegyi A, et al. Raloxifene and cardiovascular events in osteoporotic postmenopausal women: four-year results from the MORE (Multiple Outcomes of Raloxifene Evaluation) randomized trial. JAMA 2002;287:847-857.
15. Mosca L, Barrett-Connor E, Wenger NK, et al. Design and methods of the Raloxifene Use for The Heart (RUTH) study. Am J Cardiol 2001;88:392-395.
16. Cauley J, Norton L, Lippman ME, et al. Continued breast cancer risk reduction in postmenopausal women treated with raloxifene: 4-year Results from the MORE Trial. Breast Cancer Res Treat 2001;65:125-134.
17. Grodstein F, Clarkson TB, Manson JE. Understanding the divergent data on postmenopausal hormone therapy. N Engl J Med 2003;348:645-650.
18. Cauley J, Seeley DG, Ensrud K, Ettinger B, Black D, Cummings SR. Estrogen replacement therapy and fractures in older women. Study of Osteoporotic Fractures Research Group. Ann Intern Med 1995;122:9-16.
19. Greendale GA, Espeland M, Slone S, Marcus R, Barrett-Connor E. Bone mass response to discontinuation of long-term hormone replacement therapy: results from the Postmenopausal Estrogen/Progestin Interventions (PEPI) Safety Follow-up Study. Arch Intern Med 2002;162:665-672.
20. Grady D, Herrington D, Bittner V, et al. Cardiovascular disease outcomes during 6.8 years of hormone therapy: Heart and Estrogen/Progestin Replacement Study Follow-up (HERS II). JAMA 2002;288:49-57.
21. Looker AC, Wahner HW, Dunn WL, et al. Updated data on proximal femur bone mineral levels of US adults. Osteoporos Int 1998;8:468-489.
Clobetasol Propionate Lotion in the Treatment of Moderate to Severe Plaque-Type Psoriasis
Clinical Benefits in Patients With Psoriasis After Efalizumab Therapy: Clinical Trials Versus Practice
R-E-S-P-E-C-T: Patient reports of disrespect in the health care setting and its impact on care
- Perceptions of disrespect or of receiving unfair treatment within the patient-provider relationship are prevalent, particularly among racial/ethnic minorities.
- Negative perceptions in the patient-doctor relationship can effect whether a patient follows advice or delays needed care.
- Therefore, physicians should strive to be respectful and culturally sensitive to the needs of their patients, regardless of ethnic or racial background.
Objective: The health care encounter is a setting in which racial/ethnic disparities can arise. Patients who experience disrespect in this encounter may be less likely to use health care services that improve outcomes. The objective of this study was to examine factors in the health care encounter and to model how negative perceptions of the encounter influence health care utilization.
Design, subjects, and setting: Data were derived from the Commonwealth Fund 2001 Health Care Quality Survey, a nationwide random-digit-dial survey of 6722 adults, conducted between April 30 and November 5, 2001. Bivariate and multivariate analyses were performed on weighted data.
Main outcome measures: Measures of negative perceptions of the patient-provider relationship included feelings of being treated with disrespect or being looked down upon, a belief that unfair treatment was received due to race or language spoken, and a belief that better treatment would have been received had the respondent had been of a different race. Measures of utilization included receipt of a physical exam within the prior year, receipt of optimal cancer screening and recommended elements of chronic disease care, delay of needed care, and not following the doctor’s advice.
Main results: Minorities were significantly more likely to report being treated with disrespect or being looked down upon in the patient-provider relationship. Specifically, 14.1% of blacks (P=.06), 19.4% of Hispanics (P<.001), and 20.2% if Asians (P<.001) perceived being treated with disrespect or being looked down upon, compared with only 9.4% of whites. Persons who thought that they would have received better treatment if they were of a different race were significantly less likely to receive optimal chronic disease screening and more likely to not follow the doctor’s advice or put off care (P<.01.)
Conclusions: Perceptions of disrespect or of receiving unfair treatment within the patient-provider relationship are prevalent, particularly among racial/ethnic minorities. Such negative perceptions influence health care utilization and may contribute to existing health disparities.
Racial and ethnic disparities in health care have been catalogued across numerous diseases and care settings.1 By clarifying the causes of these disparities, we can develop solutions. In a seminal study, Shulman found in patient simulations that identical presentations for heart disease received different recommendations for care based on the patient’s race and gender, thus pinpointing the patient-provider relationship as a potential source of disparities.2 Other research suggests interactions with non-physician health care personnel might also be a source of negative experiences with care.3
Research is beginning to identify how the health care encounter might relate to disparities in use of services and quality of care. For example, race concordance between the physician and patient, at least for blacks, is associated with higher patient satisfaction and greater participatory decision-making. This in turn can impact compliance and possibly outcomes.4-6 While black patients who have black physicians are more likely to report receipt of counseling about preventive care and cancer screening,7 race concordance does not appear to be independently associated with different patterns of utilization.8
Perceived discrimination has also been associated with lower levels of satisfaction with the health care system.9 In one survey, two thirds of respondents reported feeling discriminated against in their interactions with health care providers due to their race or socioeconomic status.10 How perceived discrimination influences quality and outcomes of care has not been fully explored.
We hypothesized that minority patients and those who do not speak English perceive negative experiences with the health care encounter more often than whites or English-speakers. We further hypothesized that patients who report such negative experiences are less likely to seek care initially or return for follow-up care. We tested these hypotheses using data from the Commonwealth Fund 2001 Health Care Quality Survey.
Methods
Sample
Respondents were from a nationally representative sample of 6722 adults, aged 18 years and older, living in the continental United States, and who speak English, Spanish, Mandarin, Cantonese, Vietnamese, or Korean.
The sampling frame was based on random-digit dialing; telephone exchanges with higher-than-average numbers of minority households were oversampled. In addition to the oversampling based on telephone exchanges, we interviewed members of 394 households identified from a nationwide demographic tracking survey as having an Asian/Asian American or African American family member. Interviews were conducted in English, Spanish, Mandarin, Cantonese, Vietnamese, or Korean, depending on the respondent preference. The response rate for the entire sample was 53.1%.
The final sample was weighted to correct for the disproportionate sample design and to ensure the sample was representative of all adults aged 18 years and older based on the March 2001 Current Population Survey (CPS). The final weighted sample is therefore reflective of the 193 million adults in the United States who have telephones. A more detailed description of the sampling and weighting methods can be found else-where.11 Data were collected between April 30 and November 5, 2001.
We focus on the subset of questions addressing respondent’s experience with the health care encounter and their use of certain health care services. We used STATA Version 6.012 to conduct statistical analyses using the weighted sample.
Dependent variables
Negative perceptions of the patient-provider relationship. We identified factors that define the patient-provider relationship, and formulated questions based on these factors that would elicit meaningful responses. Specific questions included:
- “Did the doctor treat you with a great deal of respect and dignity, a fair amount, not too much, or none at all?” (4-point scale)
- Please tell me if you strongly agree, somewhat agree, somewhat disagree, or strongly disagree with the statement, “I often feel as if my doctor looks down on me and the way I live my life.” (4-point scale)
- “Thinking about all of the experiences you have had with health care visits in the last two years, have you ever felt that the doctor or medical staff you saw judged you unfairly or treated you with disrespect because of how well you speak English?” (yes/no)
- “Thinking about all of the experiences you have had with health care visits in the last two years, have you ever felt that the doctor or medical staff you saw judged you unfairly or treated you with disrespect because of your race or ethnic background?” (yes/no)
- “Do you think there was ever a time when you would have gotten better medical care if you had belonged to a different race or ethnic group?” (yes/no)
Those who said they did not have a doctor were unable to answer these questions and were excluded from our analysis. We combined the first 2 questions into a single dichotomous variable, characterized as “being treated with disrespect,” because both questions described negative perceptions of the health care encounter and because doing so preserved sample size for our analyses.
Utilization and optimal care
We examined self-reported use of specific services, including whether respondents had a physical exam within the past year. For cancer screening and chronic disease care, we created variables designed to represent optimal care. For example, optimal cancer screening was defined as being up to date on all tests for which the individual was eligible, based on age and gender.
These included:
- fecal occult blood testing for colon cancer screening within the prior year (both female and male respondents aged >50 years )
- cervical cancer screening within the prior 3 years (all women over the age of the 18)
- mammography within the prior year (women over the age of 50).
We excluded men younger than 50 years since colon cancer screening is not routinely recommended.
We considered respondents to have optimal chronic disease testing if they reported receiving all appropriate testing relevant for their particular condition. For persons with diabetes, this included having a hemoglobin A1c level checked within the past 6 months, a blood pressure check and foot and eye exams within the year, and cholesterol testing within 5 years. For those with heart disease or hypertension, it included having had blood pressure checked within the prior year and cholesterol testing within the prior 5 years. This approach is consistent with that of McBean et al, who have shown that a combination of appropriate tests is more predictive of glycemic control for diabetes.13
Because we were interested in different aspects of patient-initiated care seeking, we also evaluated delay in seeking care and adherence to physician recommendations as further measures of outcome. Specific questions were:
- “During the last 12 months, was there any time when you had a medical problem but put off, postponed, or did not seek medical care when you needed to?”
- “Has there been a time in the last two years when you didn’t follow the doctor’s advice or treatment plan, get a recommended test, or see a referred doctor?” (asked of respondents who had visited a doctor or clinic or had been admitted to the hospital in the last 2 years.)
Analysis
To test our first hypothesis—that persons of racial/ethnic minorities perceive negative experiences with the health care encounter more often than whites or English speakers—we examined
associations between demographic characteristics, utilization variables, and negative perceptions of the health care encounter using chisquared tests and multivariate logistic regression. In these analyses, we dichotomized education into high school graduate or less, and some technical school/college and more. We dichotomized the primary language spoken at home into non-English and English, and we used federal poverty level groupings (<100%, 100%–200% and >200%) to categorize household income. Almost 19% percent of respondents did not report incomes, so we created a dummy variable to account for those with unreported incomes.
We classified insurance status as none or any (either public or private); race/ethnicity as white, black, Hispanic, Asian, and other (Native American, mixed race, or other). We examined the effect of these variables alone and in concert. For example, we calculated predicted percentages to evaluate the combined effects of race and gender, as well as race and education, in relationship to our outcome variables.
Finally, we used multivariate logistic regression to test the relationship between negative perceptions of the patient-provider relationship and our utilization variables. In these analyses, perceptions were the covariate of interest; we controlled for patient characteristics that could also influence utilization, including education, income, insurance status, presence of a primary physician and existence of a comorbid condition (in this case, hypertension, diabetes, heart disease, asthma, and cancer.) This last variable was, by necessity, excluded from the analysis involving optimal chronic disease testing.
Results
Table 1 describes demographic characteristics and utilization measures for our sample. Consistent with prior literature, blacks and Hispanics had lower incomes and higher rates of non-insurance than both whites and Asians. Hispanics responded most frequently that English was not their primary language.
Hispanics and Asians were less likely than whites to have received optimal chronic disease care, while blacks and Hispanics were more likely than whites to have received optimal cancer screening. There were no differences between racial/ethnic groups in not following the doctor’s advice or in putting off care.
TABLE 1
Demographics/characteristics and health care utilization of study participants
| Overall sample | Whites (%) n=3488 (69) | Blacks (%) n=1037 (11) | Hispanics (%) n=1153 (10.3) | Asians (%) n=669 (4.2) |
|---|---|---|---|---|
| Gender | ||||
| Male | 45.1 | 41.9 | 45.9 | 49.7 |
| Age (years) | ||||
| 18–64 | 79.9* | 86.1* | 91.1* | 91.2* |
| 65+ | 18.9* | 12.5* | 8.6* | 6.9* |
| Education | ||||
| High school grad or less | 44.0 | 56.0 | 68.3 | 25.8 |
| Some college/technical school or more | 56.0 | 44.0* | 31.7* | 74.2* |
| Income as percentage of poverty level | ||||
| <100% | 7.7 | 15.7* | 23.0* | 10.7 |
| 100%–200% | 17.2 | 25.4* | 23.2* | 16.5 |
| >200% | 57.4 | 40.0* | 31.4* | 53.9 |
| Unknown | 17.7 | 18.9* | 22.4* | 18.8 |
| Insurance status | ||||
| None | 10.6* | 20.6* | 32.8* | 13.6 |
| Medicaid | 2.4* | 8.6* | 5.8* | 3.3 |
| All other | 87.0* | 70.8* | 61.4* | 83.1 |
| Presence of chronic illness† | 35.9* | 44.4* | 30.2* | 24.5* |
| English as primary language at home | 99.9* | 99.6* | 59.4* | 91.7* |
| No primary physician | 19.1* | 28.6* | 41.1* | 32.1* |
| Physical exam within prior year | 47.1* | 56.8* | 48.5 | 41.0 |
| Put off care in prior year | 19.5* | 19.4* | 19.2 | 16.3 |
| Sub-sample | n=3205 | n=947 | n=969 | n=561 |
| Not followed doctor’s advice | 24.9* | 21.9* | 21.7 | 22.1 |
| Sub-sample | n=974 | n=367 | n=258 | n=111 |
| Optimal chronic illness screening | 76.9* | 73.7 | 54.8* | 61.5* |
| Sub-sample | n=2612 | n=811 | n=770 | n=401 |
| Optimal cancer screening | 50.2* | 61.9* | 60.1* | 53.3 |
| *Statistically significant difference detected between whites and blacks, Hispanics or Asians with chi-squared test for P<.05. | ||||
| †Hypertension, heart disease, diabetes, asthma. | ||||
Negative perceptions of the patient-provider relationship
Race. Over 14% of blacks, 19% of Hispanics, and 20% of Asians reported they had been treated with disrespect by their doctor. Members of these groups were also more likely than whites to report that they were treated unfairly because of their race or their language, and that they would have received better care had they belonged to a different race (Table 2).
Language. Persons for whom English was not the primary language were also more likely to say they had been treated with disrespect, and to report they would have received better care had they been of a different race. For each racial/ethnic group, bivariate relationships persisted after controlling for other respondent characteristics, including education and income (Table 2).
Sex. Men were significantly more likely than women to perceive being treated with disrespect by the doctor (15.9% vs 11.6%), and the percentage varied by race/ethnicity. Using our model to predict the combined effects of race and gender, we found that Asian and Hispanic men (24% and 23%, respectively) were more likely than black men (17%) or white men (11%) to perceive being treated with disrespect.
Education. Education was similarly associated with perceptions of disrespect. Almost 18% of persons without a college education believed they had been treated with disrespect, versus only 10% of those with a college education. Minorities with lower education were more likely to have this perception. Twenty-nine percent of Asians, 22% of Hispanics, and 19% of blacks without a college education reported being treated with disrespect or being looked down upon, versus 13% of whites.
TABLE 2
Relationship of demographic variables to measures of negative perceptions
| Looked down on or treated with disrespect (%) | Treated unfairly because of race (%) | Treated unfairly because of language (%) | Would have received better care if different race (%) | |
|---|---|---|---|---|
| Overall sample | n=6663 | n=6008 | n=6008 | n=6722 |
| Gender | ||||
| Male | 11.6* | 4.0* | 2.5* | 7.0* |
| Female | 15.8* | 4.3* | 2.7* | 7.2* |
| Primary language | ||||
| English | 13.0* | 3.7* | 2.0* | 6.0* |
| Non-English | 15.9* | 9.8* 1 | 0.1* | 19.5‡ |
| Income as percentage of poverty level | ||||
| <100% | 19.6† | 8.4§ | 4.6* | 12.5* |
| 100%–200% | 17.3‡ | 7.3‡ | 3.9* | 9.5* |
| >200% | 10.1* | 9.9* | 1.7* | 5.1* |
| Insurance status | ||||
| Insured | 11.4* | 2.9* | 1.9* | 5.3* |
| Not insured | 23.0* | 11.4* | 6.4‡ | 16.4* |
| Race | ||||
| White | 9.4* | 1.2* | 0.5* | 1.4* |
| Black | 14.1§ | 7.9* | 3.5* | 15.2* |
| Hispanic | 19.4* | 7.9* | 7.2* | 3.3* |
| Asian | 20.2* | 6.1* | 4.5* | 12.2* |
| Education | ||||
| High school grad or less | 17.9* | 5.0* | 3.7* | 7.8* |
| Some college/technical school or more | 10.3* | 3.6* | 1.9* | 6.6‡ |
| Adjusted percentages using multivariate regression analysis. | ||||
| This table reports predicted percentages derived from our multivariate regression analysis. The dependent variables of interest: “looked down on/treated with disrespect,” “treated unfairly because of race,” “treated unfairly because of language,” and “would have received better care if different race.” Independent variables: gender, language, income, insurance, race, and education. | ||||
| * P.001 † P.01 ‡ P.05 § P.10 | ||||
Impact on care
Respondents who reported being treated with disrespect were significantly less likely to have had a physical exam within the prior year; those with diabetes, hypertension, or heart disease were less likely to have received optimal care. These respondents were also more likely to report not following the doctor’s advice and putting off needed care (Table 3). This relationship was not seen for optimal cancer screening.
Persons who believed they had been treated unfairly due to their race and who thought they would have received better care had they been of a different race were more likely to ignore the doctor’s advice and put off care when medically needed. Those who believed they would have received better care had they been of a different race were also less likely to receive optimal chronic disease care. In analyses not shown, we examined the independent effects of income and education, as well as interactions between these variables and insurance, and found the results basically unchanged.
TABLE 3
Relationship of negative perceptions to health care outcomes
| Exam within prior year (%) | Optimal chronic disease screening (%) | Optimal cancer screening (%) | Did not follow doctor’s advice (%) | Delayed care (%) | |
|---|---|---|---|---|---|
| Treated with disrespect or looked down on | n=6663 | n=1790 | n=4794 | n=6008 | n=6663 |
| Yes | 41.3§ | 58.9† | 52.9 | 32.3† | 31.1* |
| No | 48.6* | 76.0* | 54.1 | 23.6* | 18.6* |
| Treated unfairly because of…Race | n=6008 | n=1729 | 4500 | n=6008 | n=6008 |
| Yes | 52.5* | 50.7‡ | 64.9§ | 46.5* | 40.8† |
| No | 51.4* | 75.3* | 55.3* | 23.9* | 20.2* |
| Language | |||||
| Yes | 48.2* | 62.0* | 59.4* | 32.1* | 37.5‡ |
| No | 51.6* | 74.7* | 55.5* | 24.5* | 20.6* |
| Would have received better treatment if different race | n=6722 | n=1794 | n=4827 | n=6008 | n=6722 |
| Yes | 46.2* | 53.6‡ | 56.6* | 33.8‡ | 33.7* |
| No | 47.4* | 74.3* | 54.2* | 24.1* | 19.2* |
| This table reports predicted percentages derived from our multivariate regression analysis. Dependent variables: “exam within prior year,” “optimal chronic disease screening,” “optimal cancer screening,” “did not follow the doctor’s advice,” and “delayed care.” Principal independent variables: “treated with disrespect or looked down upon,” “treated unfairly because of race,” “treat ed unfairly because of language,” and “would have received better treatment if different race.” In each model, we examined the relationship of the dependent variable to each of our principal independent variables controlling for income, insurance, educa tion, presence of a primary physician, and chronic disease (excluded from the heart disease/diabetes screening regression.) | |||||
| * P≤.001 | |||||
| † P≤.01 | |||||
| ‡ P≤.05 | |||||
| § P≤.10 | |||||
Discussion
We hypothesized that patients who have negative perceptions of the patient-provider relationship would be less likely to seek needed care, and that reports of such feelings would be more prevalent among minority patients. As anticipated, large proportions of blacks, Hispanics, and Asians reported that they were treated with disrespect, were treated unfairly, or would have received better care if their race had been different. Male gender and lower educational attainment were also associated with perceived disrespect, particularly among minorities.
Negative experiences lead to suboptimal care
The finding of greater likelihood of perceived disrespect among minority groups, men, and those with lower levels of education is particularly important in light of the strong relationship between such reports and the quality of care that patients receive. Those who reported that they were treated unfairly because of race were less likely to get a routine physical exam, follow a doctor’s advice, or receive appropriate secondary preventive care for diabetes, heart disease, and hypertension. In other words, negative experiences within the health care environment may jeopardize care for medically needy patients. Receipt of suboptimal care, particularly in the context of chronic disease, is likely to be associated with worse health outcomes, and may contribute to disparities.
Cancer screening the exception
While the relationships between negative perceptions and receipt of care for chronic disease and receipt of a routine physical examination were strong, the correlation did not persist for cancer screening. Black and Hispanic respondents were more likely than whites to receive optimal cancer screening, a finding that has been reported elsewhere.14, 15
We hypothesize that this is in part because a wide array of community programs make special outreach efforts allowing patients to “bypass” the traditional office environment.16 These settings may be more likely to use culturally sensitive approaches or may be so transient that negative perceptions based on race or income may be less likely to form.
However, based on our finding that care requiring follow-up (eg, diabetes management) is less likely to occur with individuals who report negative perceptions of the patient-provider relationship, we would hypothesize that individuals who receive initial cancer screening might be less likely to follow up on abnormal results once screened. It may be that in situations requiring long term relationships, such as chronic disease care, perceptions of discrimination and disrespect may take the greatest toll. This hypothesis is supported by previous literature consistently reporting excess mortality despite higher cancer screening rates among blacks.17-20
Limitations
Our study has several limitations. Because we are relying on self-report, we could not assess which specific aspects of the patient-provider relationship may have influenced the reports of disrespect. Responses may have been affected by experiences completely outside of this relation ship, or outside of the health care system, that independently could have impacted health care utilization. We cannot disentangle how general life experience influences perceptions of the health care encounter or care-seeking; for example respondents who perceive racial bias in other environments such as the workplace may also be more likely to perceive it in the healthcare setting. In addition, self-reported utilization measures may not always be accurate, particularly regarding cancer screening.21,22
Despite the deliberate oversampling of major racial/ethnic groups, we remain limited in our ability to examine important subgroups within them, whether related to ethnicity (eg, Cuban, Vietnamese) or chronic condition (eg, asthma, diabetes), even though some groups may differ dramatically from others.
We also had insufficient numbers of Native Americans to analyze separately.
We excluded respondents who did not have a regular doctor because they were unable to answer key questions about the health care encounter.
Finally, there is no agreement on the definition of age-appropriate breast and cervical cancer screening.23, 24 We conducted additional analyses varying the age criteria for testing, including starting the required age for screening at age 40 (for breast cancer) as well as setting the age cut off for required screening at 65 (for both breast and cervical cancer screening), and found that the results were essentially unchanged from those presented. Similarly, adding prostate cancer screening to our models for men over age 50 did not alter our results significantly.
Research should focus on improving perceptions of care
Although it is difficult to quantify or measure negative responses objectively, the strong relationship between patient perceptions of the encounter and utilization suggests an important area for further attention. These findings suggest there may still be a substantial core of individuals who will actively avoid care, perhaps based on previous negative interpersonal experiences in getting care. Interventions aimed at both doctors and potential patients will be required to address this. Research is needed to focus on what approaches can best improve perceptions of care within the patient-provider relationship and how such interventions can reduce racial disparities in health care.
Acknowledgments
This research was done in part by a grant from The Commonwealth Fund.
Corresponding author
Nicole Lurie, MD, MSPH, RAND Corporation, 1200 S. Hayes Street, Arlington, VA 22202. E-mail: [email protected]
1. Smedley BD StithAY Nelson AR eds Unequal Treatment: Confronting Racial and Ethnic Disparities in Healthcare. Committee on Understanding and Eliminating Racial Disparities in Healthcare. Washington, DC: National Academies Press; 2002.
2. Schulman KA, Berlin JA, Harless W, et al. The effect of race and sex on physicians’ recommendations for cardiac catheterization. N Engl J Med 1999;340:618-626.
3. O’Malley KJ, Haidet P, Sharf B, et al. Trust in physician, facility, and system: qualitative differences between ethnic groups. Presented at Society for General Internal Medicine, 2003 Annual Meeting, Vancouver, BC, April 20-May 3.;
4. Cooper-Patrick L, Gallo JJ, Gonzales JJ, et al. Race, gender, and partnership in the patient-physician relationship. JAMA 1999;282:583-589.
5. Kaplan SH, Greenfield S, Gandex B, Rogers WH, Ware JE, Jr. Characteristics of physicians with participatory decision-making styles. Ann Intern Med 1996;124:497-504.
6. Putnam SM, Stiles WB, Jacob MC, James SA. Patient exposition and physician explanation in initial medical interviews and outcomes of clinical visits. Med Care 1985;23:74-83.
7. Saha S, Komaromy M, Koepsell TD, Bindman AB. Patient-physician racial concordance and the perceived quality and use of health care. Arch Intern Med 1999;159:997-1004.
8. Saha S, Arbalaez JJ, Cooper LA. Influence of physician race vs. patient-physician interactions on the experience of health care. Presented at Society for General Internal Medicine, 2003 Annual Meeting, Vancouver, BC, April 20-May 3..
9. LaVeist TA, Nickerson KJ, Bowie JV. Attitudes about racism, medical mistrust, and satisfaction with care among African American and white cardiac patients. Med Care Res Rev 2000;57 Suppl 1:146-161.
10. Bird ST, Bogart LM. Perceived race based and socioeconomic status (SES)-based discrimination with interactions with health care providers. Ethn Dis 2001;11:554-563.
11. Methodology: Survey on disparities in quality of health care: Spring 2001 Prepared by the Princeton Survey Research Associates for Commonwealth Fund. 2002.;
12. STATA Version 6.0. College Station, Tex: STATA Corporation.
13. McBean AM, Huang Z, Virnig BA, Lurie N, Musgrave D. Racial variation in the control of diabetes among elderly medicare managed care beneficiaries. Diabetes Care 2003;26:3250-3256.
14. Screening for colorectal cancer—United States 1997. MMWRMorb Mortal Weekly Rep 1999;48:116-121.
15. Martin LM, Parker SL, Wingo PA, Heath CW, Jr. Cervical cancer incidence and screening: status report on women in the United States. Cancer Pract 1996;4:130-134.
16. Coughlin SS, Thompson TD, Hall HI, Logan P, Uhler RJ. Breast and cervical carcinoma screening practices among women in rural and nonrural areas of the United States, 1998-1999. Cancer 2002;94:2801-2812.
17. Shelton D, Paturzo D, Flannery J, Gregorio D. Race, stage of disease, and survival with cervical cancer. Ethn Dis 1992;2:47-54.
18. Wingo PA, Tong T, Bolden S. Cancer statistics, 1995. CA Cancer J Clin 1995;45:8-30.
19. Simon MS, Severson RK. Racial differences in survival of female breast cancer in the Detroit metropolitan area. Cancer 1996;77:308-14.
20. Centers for Disease Control and Prevention Behavioral Risk Factor Surveillance Survey.Available at: www.cdc.gov/brfss/.Accessed on August 3, 2004.
21. Lipkus IM, Rimer BK, Lyna PR, Pradhan AA, Conaway M, Woods-Powell CT. Colorectal screening patterns and perceptions of risk among African-American users of a community health center. J Community Health 1996;21:409-427.
22. McGovern P, Lurie N, Margolis K, Slater J. Accuracy of self-report of mammography and Pap smear in a low-income urban population. Am J Prev Med 1998;14:201-208.
23. Saslow D, Runowicz CD, Solomon D, et al. American Cancer Society guideline for the early detection of cervical neoplasia and cancer. CA Cancer J Clin 2002;52:342-362.
24. US Preventive Services Task Force. Screening for breast cancer: recommendations and rationale. Ann Intern Med 2002;137:344-346.
- Perceptions of disrespect or of receiving unfair treatment within the patient-provider relationship are prevalent, particularly among racial/ethnic minorities.
- Negative perceptions in the patient-doctor relationship can effect whether a patient follows advice or delays needed care.
- Therefore, physicians should strive to be respectful and culturally sensitive to the needs of their patients, regardless of ethnic or racial background.
Objective: The health care encounter is a setting in which racial/ethnic disparities can arise. Patients who experience disrespect in this encounter may be less likely to use health care services that improve outcomes. The objective of this study was to examine factors in the health care encounter and to model how negative perceptions of the encounter influence health care utilization.
Design, subjects, and setting: Data were derived from the Commonwealth Fund 2001 Health Care Quality Survey, a nationwide random-digit-dial survey of 6722 adults, conducted between April 30 and November 5, 2001. Bivariate and multivariate analyses were performed on weighted data.
Main outcome measures: Measures of negative perceptions of the patient-provider relationship included feelings of being treated with disrespect or being looked down upon, a belief that unfair treatment was received due to race or language spoken, and a belief that better treatment would have been received had the respondent had been of a different race. Measures of utilization included receipt of a physical exam within the prior year, receipt of optimal cancer screening and recommended elements of chronic disease care, delay of needed care, and not following the doctor’s advice.
Main results: Minorities were significantly more likely to report being treated with disrespect or being looked down upon in the patient-provider relationship. Specifically, 14.1% of blacks (P=.06), 19.4% of Hispanics (P<.001), and 20.2% if Asians (P<.001) perceived being treated with disrespect or being looked down upon, compared with only 9.4% of whites. Persons who thought that they would have received better treatment if they were of a different race were significantly less likely to receive optimal chronic disease screening and more likely to not follow the doctor’s advice or put off care (P<.01.)
Conclusions: Perceptions of disrespect or of receiving unfair treatment within the patient-provider relationship are prevalent, particularly among racial/ethnic minorities. Such negative perceptions influence health care utilization and may contribute to existing health disparities.
Racial and ethnic disparities in health care have been catalogued across numerous diseases and care settings.1 By clarifying the causes of these disparities, we can develop solutions. In a seminal study, Shulman found in patient simulations that identical presentations for heart disease received different recommendations for care based on the patient’s race and gender, thus pinpointing the patient-provider relationship as a potential source of disparities.2 Other research suggests interactions with non-physician health care personnel might also be a source of negative experiences with care.3
Research is beginning to identify how the health care encounter might relate to disparities in use of services and quality of care. For example, race concordance between the physician and patient, at least for blacks, is associated with higher patient satisfaction and greater participatory decision-making. This in turn can impact compliance and possibly outcomes.4-6 While black patients who have black physicians are more likely to report receipt of counseling about preventive care and cancer screening,7 race concordance does not appear to be independently associated with different patterns of utilization.8
Perceived discrimination has also been associated with lower levels of satisfaction with the health care system.9 In one survey, two thirds of respondents reported feeling discriminated against in their interactions with health care providers due to their race or socioeconomic status.10 How perceived discrimination influences quality and outcomes of care has not been fully explored.
We hypothesized that minority patients and those who do not speak English perceive negative experiences with the health care encounter more often than whites or English-speakers. We further hypothesized that patients who report such negative experiences are less likely to seek care initially or return for follow-up care. We tested these hypotheses using data from the Commonwealth Fund 2001 Health Care Quality Survey.
Methods
Sample
Respondents were from a nationally representative sample of 6722 adults, aged 18 years and older, living in the continental United States, and who speak English, Spanish, Mandarin, Cantonese, Vietnamese, or Korean.
The sampling frame was based on random-digit dialing; telephone exchanges with higher-than-average numbers of minority households were oversampled. In addition to the oversampling based on telephone exchanges, we interviewed members of 394 households identified from a nationwide demographic tracking survey as having an Asian/Asian American or African American family member. Interviews were conducted in English, Spanish, Mandarin, Cantonese, Vietnamese, or Korean, depending on the respondent preference. The response rate for the entire sample was 53.1%.
The final sample was weighted to correct for the disproportionate sample design and to ensure the sample was representative of all adults aged 18 years and older based on the March 2001 Current Population Survey (CPS). The final weighted sample is therefore reflective of the 193 million adults in the United States who have telephones. A more detailed description of the sampling and weighting methods can be found else-where.11 Data were collected between April 30 and November 5, 2001.
We focus on the subset of questions addressing respondent’s experience with the health care encounter and their use of certain health care services. We used STATA Version 6.012 to conduct statistical analyses using the weighted sample.
Dependent variables
Negative perceptions of the patient-provider relationship. We identified factors that define the patient-provider relationship, and formulated questions based on these factors that would elicit meaningful responses. Specific questions included:
- “Did the doctor treat you with a great deal of respect and dignity, a fair amount, not too much, or none at all?” (4-point scale)
- Please tell me if you strongly agree, somewhat agree, somewhat disagree, or strongly disagree with the statement, “I often feel as if my doctor looks down on me and the way I live my life.” (4-point scale)
- “Thinking about all of the experiences you have had with health care visits in the last two years, have you ever felt that the doctor or medical staff you saw judged you unfairly or treated you with disrespect because of how well you speak English?” (yes/no)
- “Thinking about all of the experiences you have had with health care visits in the last two years, have you ever felt that the doctor or medical staff you saw judged you unfairly or treated you with disrespect because of your race or ethnic background?” (yes/no)
- “Do you think there was ever a time when you would have gotten better medical care if you had belonged to a different race or ethnic group?” (yes/no)
Those who said they did not have a doctor were unable to answer these questions and were excluded from our analysis. We combined the first 2 questions into a single dichotomous variable, characterized as “being treated with disrespect,” because both questions described negative perceptions of the health care encounter and because doing so preserved sample size for our analyses.
Utilization and optimal care
We examined self-reported use of specific services, including whether respondents had a physical exam within the past year. For cancer screening and chronic disease care, we created variables designed to represent optimal care. For example, optimal cancer screening was defined as being up to date on all tests for which the individual was eligible, based on age and gender.
These included:
- fecal occult blood testing for colon cancer screening within the prior year (both female and male respondents aged >50 years )
- cervical cancer screening within the prior 3 years (all women over the age of the 18)
- mammography within the prior year (women over the age of 50).
We excluded men younger than 50 years since colon cancer screening is not routinely recommended.
We considered respondents to have optimal chronic disease testing if they reported receiving all appropriate testing relevant for their particular condition. For persons with diabetes, this included having a hemoglobin A1c level checked within the past 6 months, a blood pressure check and foot and eye exams within the year, and cholesterol testing within 5 years. For those with heart disease or hypertension, it included having had blood pressure checked within the prior year and cholesterol testing within the prior 5 years. This approach is consistent with that of McBean et al, who have shown that a combination of appropriate tests is more predictive of glycemic control for diabetes.13
Because we were interested in different aspects of patient-initiated care seeking, we also evaluated delay in seeking care and adherence to physician recommendations as further measures of outcome. Specific questions were:
- “During the last 12 months, was there any time when you had a medical problem but put off, postponed, or did not seek medical care when you needed to?”
- “Has there been a time in the last two years when you didn’t follow the doctor’s advice or treatment plan, get a recommended test, or see a referred doctor?” (asked of respondents who had visited a doctor or clinic or had been admitted to the hospital in the last 2 years.)
Analysis
To test our first hypothesis—that persons of racial/ethnic minorities perceive negative experiences with the health care encounter more often than whites or English speakers—we examined
associations between demographic characteristics, utilization variables, and negative perceptions of the health care encounter using chisquared tests and multivariate logistic regression. In these analyses, we dichotomized education into high school graduate or less, and some technical school/college and more. We dichotomized the primary language spoken at home into non-English and English, and we used federal poverty level groupings (<100%, 100%–200% and >200%) to categorize household income. Almost 19% percent of respondents did not report incomes, so we created a dummy variable to account for those with unreported incomes.
We classified insurance status as none or any (either public or private); race/ethnicity as white, black, Hispanic, Asian, and other (Native American, mixed race, or other). We examined the effect of these variables alone and in concert. For example, we calculated predicted percentages to evaluate the combined effects of race and gender, as well as race and education, in relationship to our outcome variables.
Finally, we used multivariate logistic regression to test the relationship between negative perceptions of the patient-provider relationship and our utilization variables. In these analyses, perceptions were the covariate of interest; we controlled for patient characteristics that could also influence utilization, including education, income, insurance status, presence of a primary physician and existence of a comorbid condition (in this case, hypertension, diabetes, heart disease, asthma, and cancer.) This last variable was, by necessity, excluded from the analysis involving optimal chronic disease testing.
Results
Table 1 describes demographic characteristics and utilization measures for our sample. Consistent with prior literature, blacks and Hispanics had lower incomes and higher rates of non-insurance than both whites and Asians. Hispanics responded most frequently that English was not their primary language.
Hispanics and Asians were less likely than whites to have received optimal chronic disease care, while blacks and Hispanics were more likely than whites to have received optimal cancer screening. There were no differences between racial/ethnic groups in not following the doctor’s advice or in putting off care.
TABLE 1
Demographics/characteristics and health care utilization of study participants
| Overall sample | Whites (%) n=3488 (69) | Blacks (%) n=1037 (11) | Hispanics (%) n=1153 (10.3) | Asians (%) n=669 (4.2) |
|---|---|---|---|---|
| Gender | ||||
| Male | 45.1 | 41.9 | 45.9 | 49.7 |
| Age (years) | ||||
| 18–64 | 79.9* | 86.1* | 91.1* | 91.2* |
| 65+ | 18.9* | 12.5* | 8.6* | 6.9* |
| Education | ||||
| High school grad or less | 44.0 | 56.0 | 68.3 | 25.8 |
| Some college/technical school or more | 56.0 | 44.0* | 31.7* | 74.2* |
| Income as percentage of poverty level | ||||
| <100% | 7.7 | 15.7* | 23.0* | 10.7 |
| 100%–200% | 17.2 | 25.4* | 23.2* | 16.5 |
| >200% | 57.4 | 40.0* | 31.4* | 53.9 |
| Unknown | 17.7 | 18.9* | 22.4* | 18.8 |
| Insurance status | ||||
| None | 10.6* | 20.6* | 32.8* | 13.6 |
| Medicaid | 2.4* | 8.6* | 5.8* | 3.3 |
| All other | 87.0* | 70.8* | 61.4* | 83.1 |
| Presence of chronic illness† | 35.9* | 44.4* | 30.2* | 24.5* |
| English as primary language at home | 99.9* | 99.6* | 59.4* | 91.7* |
| No primary physician | 19.1* | 28.6* | 41.1* | 32.1* |
| Physical exam within prior year | 47.1* | 56.8* | 48.5 | 41.0 |
| Put off care in prior year | 19.5* | 19.4* | 19.2 | 16.3 |
| Sub-sample | n=3205 | n=947 | n=969 | n=561 |
| Not followed doctor’s advice | 24.9* | 21.9* | 21.7 | 22.1 |
| Sub-sample | n=974 | n=367 | n=258 | n=111 |
| Optimal chronic illness screening | 76.9* | 73.7 | 54.8* | 61.5* |
| Sub-sample | n=2612 | n=811 | n=770 | n=401 |
| Optimal cancer screening | 50.2* | 61.9* | 60.1* | 53.3 |
| *Statistically significant difference detected between whites and blacks, Hispanics or Asians with chi-squared test for P<.05. | ||||
| †Hypertension, heart disease, diabetes, asthma. | ||||
Negative perceptions of the patient-provider relationship
Race. Over 14% of blacks, 19% of Hispanics, and 20% of Asians reported they had been treated with disrespect by their doctor. Members of these groups were also more likely than whites to report that they were treated unfairly because of their race or their language, and that they would have received better care had they belonged to a different race (Table 2).
Language. Persons for whom English was not the primary language were also more likely to say they had been treated with disrespect, and to report they would have received better care had they been of a different race. For each racial/ethnic group, bivariate relationships persisted after controlling for other respondent characteristics, including education and income (Table 2).
Sex. Men were significantly more likely than women to perceive being treated with disrespect by the doctor (15.9% vs 11.6%), and the percentage varied by race/ethnicity. Using our model to predict the combined effects of race and gender, we found that Asian and Hispanic men (24% and 23%, respectively) were more likely than black men (17%) or white men (11%) to perceive being treated with disrespect.
Education. Education was similarly associated with perceptions of disrespect. Almost 18% of persons without a college education believed they had been treated with disrespect, versus only 10% of those with a college education. Minorities with lower education were more likely to have this perception. Twenty-nine percent of Asians, 22% of Hispanics, and 19% of blacks without a college education reported being treated with disrespect or being looked down upon, versus 13% of whites.
TABLE 2
Relationship of demographic variables to measures of negative perceptions
| Looked down on or treated with disrespect (%) | Treated unfairly because of race (%) | Treated unfairly because of language (%) | Would have received better care if different race (%) | |
|---|---|---|---|---|
| Overall sample | n=6663 | n=6008 | n=6008 | n=6722 |
| Gender | ||||
| Male | 11.6* | 4.0* | 2.5* | 7.0* |
| Female | 15.8* | 4.3* | 2.7* | 7.2* |
| Primary language | ||||
| English | 13.0* | 3.7* | 2.0* | 6.0* |
| Non-English | 15.9* | 9.8* 1 | 0.1* | 19.5‡ |
| Income as percentage of poverty level | ||||
| <100% | 19.6† | 8.4§ | 4.6* | 12.5* |
| 100%–200% | 17.3‡ | 7.3‡ | 3.9* | 9.5* |
| >200% | 10.1* | 9.9* | 1.7* | 5.1* |
| Insurance status | ||||
| Insured | 11.4* | 2.9* | 1.9* | 5.3* |
| Not insured | 23.0* | 11.4* | 6.4‡ | 16.4* |
| Race | ||||
| White | 9.4* | 1.2* | 0.5* | 1.4* |
| Black | 14.1§ | 7.9* | 3.5* | 15.2* |
| Hispanic | 19.4* | 7.9* | 7.2* | 3.3* |
| Asian | 20.2* | 6.1* | 4.5* | 12.2* |
| Education | ||||
| High school grad or less | 17.9* | 5.0* | 3.7* | 7.8* |
| Some college/technical school or more | 10.3* | 3.6* | 1.9* | 6.6‡ |
| Adjusted percentages using multivariate regression analysis. | ||||
| This table reports predicted percentages derived from our multivariate regression analysis. The dependent variables of interest: “looked down on/treated with disrespect,” “treated unfairly because of race,” “treated unfairly because of language,” and “would have received better care if different race.” Independent variables: gender, language, income, insurance, race, and education. | ||||
| * P.001 † P.01 ‡ P.05 § P.10 | ||||
Impact on care
Respondents who reported being treated with disrespect were significantly less likely to have had a physical exam within the prior year; those with diabetes, hypertension, or heart disease were less likely to have received optimal care. These respondents were also more likely to report not following the doctor’s advice and putting off needed care (Table 3). This relationship was not seen for optimal cancer screening.
Persons who believed they had been treated unfairly due to their race and who thought they would have received better care had they been of a different race were more likely to ignore the doctor’s advice and put off care when medically needed. Those who believed they would have received better care had they been of a different race were also less likely to receive optimal chronic disease care. In analyses not shown, we examined the independent effects of income and education, as well as interactions between these variables and insurance, and found the results basically unchanged.
TABLE 3
Relationship of negative perceptions to health care outcomes
| Exam within prior year (%) | Optimal chronic disease screening (%) | Optimal cancer screening (%) | Did not follow doctor’s advice (%) | Delayed care (%) | |
|---|---|---|---|---|---|
| Treated with disrespect or looked down on | n=6663 | n=1790 | n=4794 | n=6008 | n=6663 |
| Yes | 41.3§ | 58.9† | 52.9 | 32.3† | 31.1* |
| No | 48.6* | 76.0* | 54.1 | 23.6* | 18.6* |
| Treated unfairly because of…Race | n=6008 | n=1729 | 4500 | n=6008 | n=6008 |
| Yes | 52.5* | 50.7‡ | 64.9§ | 46.5* | 40.8† |
| No | 51.4* | 75.3* | 55.3* | 23.9* | 20.2* |
| Language | |||||
| Yes | 48.2* | 62.0* | 59.4* | 32.1* | 37.5‡ |
| No | 51.6* | 74.7* | 55.5* | 24.5* | 20.6* |
| Would have received better treatment if different race | n=6722 | n=1794 | n=4827 | n=6008 | n=6722 |
| Yes | 46.2* | 53.6‡ | 56.6* | 33.8‡ | 33.7* |
| No | 47.4* | 74.3* | 54.2* | 24.1* | 19.2* |
| This table reports predicted percentages derived from our multivariate regression analysis. Dependent variables: “exam within prior year,” “optimal chronic disease screening,” “optimal cancer screening,” “did not follow the doctor’s advice,” and “delayed care.” Principal independent variables: “treated with disrespect or looked down upon,” “treated unfairly because of race,” “treat ed unfairly because of language,” and “would have received better treatment if different race.” In each model, we examined the relationship of the dependent variable to each of our principal independent variables controlling for income, insurance, educa tion, presence of a primary physician, and chronic disease (excluded from the heart disease/diabetes screening regression.) | |||||
| * P≤.001 | |||||
| † P≤.01 | |||||
| ‡ P≤.05 | |||||
| § P≤.10 | |||||
Discussion
We hypothesized that patients who have negative perceptions of the patient-provider relationship would be less likely to seek needed care, and that reports of such feelings would be more prevalent among minority patients. As anticipated, large proportions of blacks, Hispanics, and Asians reported that they were treated with disrespect, were treated unfairly, or would have received better care if their race had been different. Male gender and lower educational attainment were also associated with perceived disrespect, particularly among minorities.
Negative experiences lead to suboptimal care
The finding of greater likelihood of perceived disrespect among minority groups, men, and those with lower levels of education is particularly important in light of the strong relationship between such reports and the quality of care that patients receive. Those who reported that they were treated unfairly because of race were less likely to get a routine physical exam, follow a doctor’s advice, or receive appropriate secondary preventive care for diabetes, heart disease, and hypertension. In other words, negative experiences within the health care environment may jeopardize care for medically needy patients. Receipt of suboptimal care, particularly in the context of chronic disease, is likely to be associated with worse health outcomes, and may contribute to disparities.
Cancer screening the exception
While the relationships between negative perceptions and receipt of care for chronic disease and receipt of a routine physical examination were strong, the correlation did not persist for cancer screening. Black and Hispanic respondents were more likely than whites to receive optimal cancer screening, a finding that has been reported elsewhere.14, 15
We hypothesize that this is in part because a wide array of community programs make special outreach efforts allowing patients to “bypass” the traditional office environment.16 These settings may be more likely to use culturally sensitive approaches or may be so transient that negative perceptions based on race or income may be less likely to form.
However, based on our finding that care requiring follow-up (eg, diabetes management) is less likely to occur with individuals who report negative perceptions of the patient-provider relationship, we would hypothesize that individuals who receive initial cancer screening might be less likely to follow up on abnormal results once screened. It may be that in situations requiring long term relationships, such as chronic disease care, perceptions of discrimination and disrespect may take the greatest toll. This hypothesis is supported by previous literature consistently reporting excess mortality despite higher cancer screening rates among blacks.17-20
Limitations
Our study has several limitations. Because we are relying on self-report, we could not assess which specific aspects of the patient-provider relationship may have influenced the reports of disrespect. Responses may have been affected by experiences completely outside of this relation ship, or outside of the health care system, that independently could have impacted health care utilization. We cannot disentangle how general life experience influences perceptions of the health care encounter or care-seeking; for example respondents who perceive racial bias in other environments such as the workplace may also be more likely to perceive it in the healthcare setting. In addition, self-reported utilization measures may not always be accurate, particularly regarding cancer screening.21,22
Despite the deliberate oversampling of major racial/ethnic groups, we remain limited in our ability to examine important subgroups within them, whether related to ethnicity (eg, Cuban, Vietnamese) or chronic condition (eg, asthma, diabetes), even though some groups may differ dramatically from others.
We also had insufficient numbers of Native Americans to analyze separately.
We excluded respondents who did not have a regular doctor because they were unable to answer key questions about the health care encounter.
Finally, there is no agreement on the definition of age-appropriate breast and cervical cancer screening.23, 24 We conducted additional analyses varying the age criteria for testing, including starting the required age for screening at age 40 (for breast cancer) as well as setting the age cut off for required screening at 65 (for both breast and cervical cancer screening), and found that the results were essentially unchanged from those presented. Similarly, adding prostate cancer screening to our models for men over age 50 did not alter our results significantly.
Research should focus on improving perceptions of care
Although it is difficult to quantify or measure negative responses objectively, the strong relationship between patient perceptions of the encounter and utilization suggests an important area for further attention. These findings suggest there may still be a substantial core of individuals who will actively avoid care, perhaps based on previous negative interpersonal experiences in getting care. Interventions aimed at both doctors and potential patients will be required to address this. Research is needed to focus on what approaches can best improve perceptions of care within the patient-provider relationship and how such interventions can reduce racial disparities in health care.
Acknowledgments
This research was done in part by a grant from The Commonwealth Fund.
Corresponding author
Nicole Lurie, MD, MSPH, RAND Corporation, 1200 S. Hayes Street, Arlington, VA 22202. E-mail: [email protected]
1. Smedley BD StithAY Nelson AR eds Unequal Treatment: Confronting Racial and Ethnic Disparities in Healthcare. Committee on Understanding and Eliminating Racial Disparities in Healthcare. Washington, DC: National Academies Press; 2002.
2. Schulman KA, Berlin JA, Harless W, et al. The effect of race and sex on physicians’ recommendations for cardiac catheterization. N Engl J Med 1999;340:618-626.
3. O’Malley KJ, Haidet P, Sharf B, et al. Trust in physician, facility, and system: qualitative differences between ethnic groups. Presented at Society for General Internal Medicine, 2003 Annual Meeting, Vancouver, BC, April 20-May 3.;
4. Cooper-Patrick L, Gallo JJ, Gonzales JJ, et al. Race, gender, and partnership in the patient-physician relationship. JAMA 1999;282:583-589.
5. Kaplan SH, Greenfield S, Gandex B, Rogers WH, Ware JE, Jr. Characteristics of physicians with participatory decision-making styles. Ann Intern Med 1996;124:497-504.
6. Putnam SM, Stiles WB, Jacob MC, James SA. Patient exposition and physician explanation in initial medical interviews and outcomes of clinical visits. Med Care 1985;23:74-83.
7. Saha S, Komaromy M, Koepsell TD, Bindman AB. Patient-physician racial concordance and the perceived quality and use of health care. Arch Intern Med 1999;159:997-1004.
8. Saha S, Arbalaez JJ, Cooper LA. Influence of physician race vs. patient-physician interactions on the experience of health care. Presented at Society for General Internal Medicine, 2003 Annual Meeting, Vancouver, BC, April 20-May 3..
9. LaVeist TA, Nickerson KJ, Bowie JV. Attitudes about racism, medical mistrust, and satisfaction with care among African American and white cardiac patients. Med Care Res Rev 2000;57 Suppl 1:146-161.
10. Bird ST, Bogart LM. Perceived race based and socioeconomic status (SES)-based discrimination with interactions with health care providers. Ethn Dis 2001;11:554-563.
11. Methodology: Survey on disparities in quality of health care: Spring 2001 Prepared by the Princeton Survey Research Associates for Commonwealth Fund. 2002.;
12. STATA Version 6.0. College Station, Tex: STATA Corporation.
13. McBean AM, Huang Z, Virnig BA, Lurie N, Musgrave D. Racial variation in the control of diabetes among elderly medicare managed care beneficiaries. Diabetes Care 2003;26:3250-3256.
14. Screening for colorectal cancer—United States 1997. MMWRMorb Mortal Weekly Rep 1999;48:116-121.
15. Martin LM, Parker SL, Wingo PA, Heath CW, Jr. Cervical cancer incidence and screening: status report on women in the United States. Cancer Pract 1996;4:130-134.
16. Coughlin SS, Thompson TD, Hall HI, Logan P, Uhler RJ. Breast and cervical carcinoma screening practices among women in rural and nonrural areas of the United States, 1998-1999. Cancer 2002;94:2801-2812.
17. Shelton D, Paturzo D, Flannery J, Gregorio D. Race, stage of disease, and survival with cervical cancer. Ethn Dis 1992;2:47-54.
18. Wingo PA, Tong T, Bolden S. Cancer statistics, 1995. CA Cancer J Clin 1995;45:8-30.
19. Simon MS, Severson RK. Racial differences in survival of female breast cancer in the Detroit metropolitan area. Cancer 1996;77:308-14.
20. Centers for Disease Control and Prevention Behavioral Risk Factor Surveillance Survey.Available at: www.cdc.gov/brfss/.Accessed on August 3, 2004.
21. Lipkus IM, Rimer BK, Lyna PR, Pradhan AA, Conaway M, Woods-Powell CT. Colorectal screening patterns and perceptions of risk among African-American users of a community health center. J Community Health 1996;21:409-427.
22. McGovern P, Lurie N, Margolis K, Slater J. Accuracy of self-report of mammography and Pap smear in a low-income urban population. Am J Prev Med 1998;14:201-208.
23. Saslow D, Runowicz CD, Solomon D, et al. American Cancer Society guideline for the early detection of cervical neoplasia and cancer. CA Cancer J Clin 2002;52:342-362.
24. US Preventive Services Task Force. Screening for breast cancer: recommendations and rationale. Ann Intern Med 2002;137:344-346.
Interpretation of survival curves
Survival curves illustrate prognosis. The percentage of patients reaching an endpoint (eg, death, recurrence of disease, or cure) is plotted on the y(vertical) axis against time on the x(horizontal) axis.
Plotting a survival curve
Two common plotting methods are used. With the actuarial method, the x axis is divided into regular intervals (eg, by month) and percent survival is calculated for each interval. With the Kaplan-Meier method, percent survival is recalculated each time a patient dies (or reaches a different endpoint). Consider the example here (Figure).1
Time zerois when each patient entered the trial. Survival is the percentage of patients still alive thereafter. Median survivalis found by extending a horizontal line from the 50% survival point until it intersects the curve (24 months in this case).
FIGURE
Sample survival curve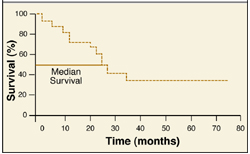
Survival curves have limitations. Consider a study that enrolls patients between 1996 and 2002 and ends in 2005. All that is known about a patient enrolled in 2002 who survived until 2005 is that he or she survived 3 years. Some patients also drop out of the study early or are lost to follow-up. Some patients die from causes other than the one under study.
Censoringis the process of excluding data from survival curves when information about survival is unknown. For a patient who drops out early, for example, only data obtained when the patient was followed would be included. The result is a more accurate picture of survival for the patients under study.
Correspondence
Stephen A. Wilson, MD, UPMC Family Praxctice Residency, 200 Lothrop St., Pittsburgh, PA 15213-2582. E-mail: [email protected].
REFERENCE
1. Skordilis P, Mouzas IA, Dimoulios PD, Alexandrakis G, Moschandrea J, Kouroumalis E. Is endosonography an effective method for detection and local staging of the ampullary carcinoma? A prospective study. BMC Surg 2002; 2(1):1.
Survival curves illustrate prognosis. The percentage of patients reaching an endpoint (eg, death, recurrence of disease, or cure) is plotted on the y(vertical) axis against time on the x(horizontal) axis.
Plotting a survival curve
Two common plotting methods are used. With the actuarial method, the x axis is divided into regular intervals (eg, by month) and percent survival is calculated for each interval. With the Kaplan-Meier method, percent survival is recalculated each time a patient dies (or reaches a different endpoint). Consider the example here (Figure).1
Time zerois when each patient entered the trial. Survival is the percentage of patients still alive thereafter. Median survivalis found by extending a horizontal line from the 50% survival point until it intersects the curve (24 months in this case).
FIGURE
Sample survival curve
Survival curves have limitations. Consider a study that enrolls patients between 1996 and 2002 and ends in 2005. All that is known about a patient enrolled in 2002 who survived until 2005 is that he or she survived 3 years. Some patients also drop out of the study early or are lost to follow-up. Some patients die from causes other than the one under study.
Censoringis the process of excluding data from survival curves when information about survival is unknown. For a patient who drops out early, for example, only data obtained when the patient was followed would be included. The result is a more accurate picture of survival for the patients under study.
Correspondence
Stephen A. Wilson, MD, UPMC Family Praxctice Residency, 200 Lothrop St., Pittsburgh, PA 15213-2582. E-mail: [email protected].
REFERENCE
1. Skordilis P, Mouzas IA, Dimoulios PD, Alexandrakis G, Moschandrea J, Kouroumalis E. Is endosonography an effective method for detection and local staging of the ampullary carcinoma? A prospective study. BMC Surg 2002; 2(1):1.
REFERENCE
1. Skordilis P, Mouzas IA, Dimoulios PD, Alexandrakis G, Moschandrea J, Kouroumalis E. Is endosonography an effective method for detection and local staging of the ampullary carcinoma? A prospective study. BMC Surg 2002; 2(1):1.
Effectiveness of Imiquimod Cream 5% for Treating Childhood Molluscum Contagiosum in a Double-blind, Randomized Pilot Trial
Superiority of a Combined Contraceptive Containing Drospirenone to a Triphasic Preparation Containing Norgestimate in Acne Treatment
Intention-to-treat analysis: Protecting the integrity of randomization
Randomization is a crucial part of most clinical trials. The purpose of randomization in a trial comparing 2 groups is to ensure that the groups differ only with respect to the interventions being compared. Randomization determines not only which treatment subjects receive (eg, drug vs placebo), but also how the results are analyzed at the end of the trial.
Intention to treat prevents biased outcomes
The intention-to-treat principle states that all subjects must be analyzed with respect to the group to which they were randomized. Consider a recent study by Spector et al1 in which patients with dementia were randomized to receive an intervention known as cognitive stimulation therapy (CST) or control (equivalent to placebo in a drug trial). The investigators used an intention-to-treat analysis. The intervention was a complex 14-session training program. Many patients did not complete all the sessions. Whether they had completed all the sessions or not, patients initially randomized to the intervention were still considered to have received the intervention when the results were analyzed.
At first, intention to treat doesn’t seem logical. If we are testing an intervention, doesn’t it make sense to evaluate its effect among patients who complied with it fully, and then compare them with patients who were not assigned to the intervention or failed to comply? The problem is, patients who fail to comply with an intervention for whatever reason (not attending all training sessions in the example above) may differ in an important way from those who do.
In the Spector study, for example, it is possible that patients who attended very few of the sessions were more likely to have some subtle cognitive deficits that limited their participation. If placed in the control group, the 2 groups would these patients were excluded from the analysis or differ not only with respect to the intervention, but also with respect to these subtle factors. The value of randomization, therefore, would be compromised. The treatment arm may even appear to be more effective than it really is.
Correspondence
Kiame J. Mahaniah, MD, Greater Lawrence Family Health Center, 34 Haverhill Street, Lawrence, MA 01841. E-mail: [email protected] .
REFERENCE
1. Spector A, Thorgrimsen L, Woods B, et al. Efficacy of an evidence-based cognitive stimulation therapy programme for people with dementia: randomised controlled trial. Br J Psychiatry 2003;183:248-254.
Randomization is a crucial part of most clinical trials. The purpose of randomization in a trial comparing 2 groups is to ensure that the groups differ only with respect to the interventions being compared. Randomization determines not only which treatment subjects receive (eg, drug vs placebo), but also how the results are analyzed at the end of the trial.
Intention to treat prevents biased outcomes
The intention-to-treat principle states that all subjects must be analyzed with respect to the group to which they were randomized. Consider a recent study by Spector et al1 in which patients with dementia were randomized to receive an intervention known as cognitive stimulation therapy (CST) or control (equivalent to placebo in a drug trial). The investigators used an intention-to-treat analysis. The intervention was a complex 14-session training program. Many patients did not complete all the sessions. Whether they had completed all the sessions or not, patients initially randomized to the intervention were still considered to have received the intervention when the results were analyzed.
At first, intention to treat doesn’t seem logical. If we are testing an intervention, doesn’t it make sense to evaluate its effect among patients who complied with it fully, and then compare them with patients who were not assigned to the intervention or failed to comply? The problem is, patients who fail to comply with an intervention for whatever reason (not attending all training sessions in the example above) may differ in an important way from those who do.
In the Spector study, for example, it is possible that patients who attended very few of the sessions were more likely to have some subtle cognitive deficits that limited their participation. If placed in the control group, the 2 groups would these patients were excluded from the analysis or differ not only with respect to the intervention, but also with respect to these subtle factors. The value of randomization, therefore, would be compromised. The treatment arm may even appear to be more effective than it really is.
Correspondence
Kiame J. Mahaniah, MD, Greater Lawrence Family Health Center, 34 Haverhill Street, Lawrence, MA 01841. E-mail: [email protected] .
REFERENCE
1. Spector A, Thorgrimsen L, Woods B, et al. Efficacy of an evidence-based cognitive stimulation therapy programme for people with dementia: randomised controlled trial. Br J Psychiatry 2003;183:248-254.
REFERENCE
1. Spector A, Thorgrimsen L, Woods B, et al. Efficacy of an evidence-based cognitive stimulation therapy programme for people with dementia: randomised controlled trial. Br J Psychiatry 2003;183:248-254.