User login
Medication Formulation Affects Quality of Life: A Randomized Single-Blind Study of Clobetasol Propionate Foam 0.05% Compared With a Combined Program of Clobetasol Cream 0.05% and Solution 0.05% for the Treatment of Psoriasis
Can I find a doctor? Availability of primary care physicians in the San Francisco Bay Area
Objectives: Primary care physicians function as “gatekeepers” in many managed care systems. With the rapid growth of managed care enrollment, it is crucial that patients have adequate access to primary care physicians. We investigated factors associated with new-patient appointment availability of primary care physicians in the San Francisco Bay Area.
Study Design: Observational cohort.
Population: Cross-sectional survey of primary care physician offices in 2 San Francisco Bay Area counties (n=438).
Outcomes Measured: New-patient appointment availability.
Results: Seventy-five percent of primary care physicians participating in managed care had an appointment available for a new patient.
Conclusions: The limited availability of appointments for new patients may create barriers to primary care in the San Francisco Bay Area, a region with high managed-care penetration.
Recent studies and reports have examined the effect of physician supply on patient access to health care.1,2 However, physician availability is affected not only by distribution of practices, but by whether a patient can actually make an appointment with a provider.
The availability of primary care physicians is central to access to care in most managed care plans. Managed care systems often designate the primary care physician as the “gatekeeper,” the decision maker about patients’ referrals to specialists. Within this kind of system, a patient may not be able to obtain nonemergent care, including specialty care, without access to a primary care physician.
Furthermore, with at least 12% of people changing providers each year,3,4 it is not uncommon for an individual to need to find a new primary care physician who participates in their health plan. The amount of effort needed to find a primary care physician who is accepting new patients, and the possibility of waiting more than a month for an appointment, may affect an individual’s access to care.
Because access to a primary care physician may be limited by these factors, our goal was to characterize the availability of a new-patient appointment with a primary care physician in the northern California counties of Alameda and San Francisco. We further examined whether physician characteristics (eg, sex, years of experience in practice) were associated with appointment availability.
Methods
Study sample
The focus of the study was to examine the availability of primary care physicians for adults between the ages of 18 and 64 years with employer-sponsored insurance in the San Francisco Bay area. Interviewers, posing as patients, made telephone calls to primary care physician’s offices, to parallel the experience of an actual patient seeking a new primary care provider. Current print and online directories of 3 large, open managed care plans available to employees of a large employer were reviewed.
These managed care plans function through an Independent Practice Association model. Two of the 3 plans require primary care physicians to be gatekeepers for all care within the system; ie, a patient must obtain a referral from the primary care physician to have a specialist visit covered by the insurance. The third plan allows patient self-referral to a specialist, but with a higher copay and deductible than with a specialist visit that has been approved by the primary care physician. Physicians working for Kaiser Permanente, the only closed-HMO plan in the study area, were excluded because Kaiser requires a member identification number prior to making an appointment.
Physicians were chosen if they were listed in each of the 3 plan directories, if they had practice addresses in the counties of Alameda or San Francisco, if they listed specialties of internal medicine or family medicine, and if their stated primary activity was clinical care. Doctors of osteopathy were not included.
This selection process identified 469 office-based physicians. Thirty-one physicians were determined to be ineligible during the data collection process (eg, did not meet the original study criteria when the interviewer called). The final study sample was 438 physicians.
Information on 157 physicians was available from the 1997 American Medical Association (AMA) Masterfile, including sex, race/ethnicity, medical school attended, and year of graduation from medical school. For physicians not listed in this older version of the Masterfile, the physician’s sex was obtained either at the time of the interview or from an online plan directory that had this information.
For physicians not listed in the Masterfile or for those with missing information on race/ethnicity, Asian race was determined by investigator review of last names; race/ethnicity for all others was coded as “missing.” Medical school location and year of graduation from medical school for all physicians were obtained from the physician lookup feature of the Medical Board of California Web site.
Data collection
Interviewers made telephone calls to primary care providers’ offices from July 1999 to January 2000. The interviewers posed as patients new to the area, to parallel the experience of an actual patient seeking a new primary care provider.
Telephone calls were made between 9 AM and 5 PM, Monday through Friday. Once an appointment representative for the primary care physician was reached, the interviewer attempted to make an appointment for an initial physical examination, using a standard script. The interviewer stated that she was a new employee, and was in the process of choosing a health plan, based on which insurance plans the primary care physician she was calling currently accepted. If asked what her insurance choices were, the interviewer named the 3 managed care plans used for selecting physicians for the study. If asked for an insurance card number, the interviewer stated that she would bring the appropriate insurance card to the appointment, and would cancel the appointment in advance if the insurance card had not arrived in time for the appointment. If asked, the interviewer stated that she had no urgent health problems. If an appointment was available for a date more than 2 weeks away, the interviewer booked the appointment and canceled it within 1 business day of the initial call.
If the appointment date was less than 2 weeks away, the interviewer noted the time and date but did not book the appointment.
Interviewers recorded information on appointment availability, date and time of appointment, and reason for unavailability. This study was approved by the Committee on Human Research, University of California, San Francisco.
Data and statistical analysis
Several potential predictors of physician availability were examined, including physician’s sex, race/ethnicity, years since graduation from medical school, medical school location, county of practice, and median per capita income of the zip code in which the practice was located. Descriptive statistics on these demographic factors were generated according to appointment availability with Pearson χ2 tests.
We analyzed the ability to get a new-patient appointment with a given primary care physician using a multivariate logistic regression model. Variables were included in the model based on a priori hypotheses. A new race/ethnicity category was created for the logistic regression models by combining African American, Latino, and other, due to small numbers for these groups.
The length of time to an available appointment was also examined. Time to appointment was dichotomized into early appointment (within 0–30 days) and late appointment (>30 days’ wait).
Results
Of the 438 physicians included in the final sample, 328 (74.9%) had an appointment available for a new patient with managed care insurance. Availability varied by physician race/ethnicity, medical school location, years since graduation from medical school, and the median per capita income of the residents in the zip code of the primary care physician’s practice (Table 1).
Appointments were not available for several reasons. Of the 110 primary care physicians who had no appointment available to new patients, 87 (79.1%) were not accepting new patients because of a full practice. Three (2.7%) were on leave or were about to retire. Ten (9.1%) receptionists were unable to book an appointment either because they did not have access to schedules far enough in advance, or because of a basic communication difficulty during repeated calls. One (0.9%) primary care physician was only accepting referred patients. One (0.9%) primary care physician saw only monolingual Chinese-speaking patients.
Eight (7.3%) primary care physicians classed as unavailable required some form of screening, separate from inquiries about insurance or intake assessment forms, before a new patient could be considered for an appointment. Of these 8 physicians, receptionists for 5 said that the physician needed to speak directly with the patient to determine eligibility (not related to insurance), and 1 required a receptionist-administered telephone interview that would be shared with the primary care physician. One required that a written personal questionnaire be filled out and returned for this purpose. The sole remaining primary care physician did not accept current smokers as patients.
TABLE 1
Characteristics of physicians in study
| Characteristic | N (%) | Appointment available (% of total) |
|---|---|---|
| Sex | ||
| Male | 328 (74.9) | 74.7 |
| Female | 110 (25.1) | 75.5 |
| Race/ethnicity | ||
| White | 170 (38.8) | 68.8 |
| Asian | 117 (26.7) | 74.4 |
| African American | 7 (1.6) | 85.7 |
| Latino | 4 (0.9) | 100 |
| Other | 8 (1.8) | 100 |
| Missing | 132 (30.1) | 80.3 |
| County | ||
| Alameda | 217 (49.5) | 74.7 |
| San Francisco | 221 (50.5) | 75.1 |
| Years since graduation from medical school | ||
| ≤10 | 61 (13.9) | 88.5* |
| 11–20 | 123 (28.1) | 74.8 |
| >20 | 254 (58.0) | 71.7 |
| Medical school location | ||
| US | 344 (78.5) | 71.5† |
| Foreign | 94 (21.5) | 87.2 |
| Yearly median income of residents in zip code of practice‡ | ||
| Low | 148 (33.8) | 75.7§ |
| Middle | 144 (32.9) | 81.3 |
| High | 146 (33.3) | 67.8 |
| Total | 438 (100) | 74.9 |
| *P=.02 for x2 comparing differences in appointment availability by years since graduation from medical school. | ||
| † P<.01 for x2 comparing differences in appointment availability by medical school location. | ||
| ‡ Low: $5,106–$22,370; middle: $22,371–$36,507; high: $36,508–$51,926. | ||
| § P=.03 for x2 comparing differences in appointment availability by yearly median income of residents in zip code of primary care physician’s practice. | ||
Predictors of appointment availability
Recent graduates were more likely to have an appointment available than more established physicians (OR=4.2; 95% CI, 1.7–10.3) ( Table 2). Foreign medical school graduates were also more likely to have an appointment available than US-educated physicians (OR=3.5; 95% CI, 1.7–7.3). Primary care physicians practicing in middle-income zip codes were more likely to have a new-patient appointment than those with offices in high-income zip codes (OR=2.1; 95% CI, 1.1–4.0).
TABLE 2
Characteristics associated with appointment availability (multivariate logistic regression)
| Characteristic N=438 | OR | 95% CI |
|---|---|---|
| Sex | ||
| Male | – | – |
| Female | 0.7 | 0.4–1.3 |
| Race/ethnicity | ||
| White | – | – |
| Asian | 0.8 | 0.4–1.5 |
| African American/Latino/other | 6.5 | 0.8–52.7 |
| Missing | 1.7 | 1.0–3.0 |
| County | ||
| Alameda | – | – |
| San Francisco | 1.7 | 1.0–2.8 |
| Years since graduation | ||
| ≤10 | 4.2 | 1.7–10.3 |
| 11–20 | 1.1 | 0.6–1.9 |
| >20 | – | – |
| Medical school location | ||
| US | – | – |
| Foreign | 3.5 | 1.7–7.3 |
| Yearly median income of residents in zip code of practice* | ||
| Low | 1.7 | 0.9–3.1 |
| Middle | 2.1 | 1.1–4.0 |
| High | – | – |
| OR, odds ratio; CI, confidence interval | ||
| * Low: $5,106–$22,370; middle: $22,371–$36,507; high: $36,508–$51,926 | ||
Predictors of length of time to appointment
The length of time to appointment among those primary care physicians with an available appointment ranged from 0 (same-day appointment) to 151 days; the median was 13 days. Seventy-five percent of appointments were available within 30 days. As shown in Table 3, female primary care physicians were significantly less likely than male primary care physicians to have an appointment available within 30 days (OR=0.4; 95% CI, 0.2–0.7).
TABLE 3
Physician characteristics associated with early appointment availability* (multivariate logistic regression)
| Characteristic N=309 | OR | 95% CI |
|---|---|---|
| Sex | ||
| Male | – | – |
| Female | 0.4 | 0.2–0.7 |
| Race/ethnicity | ||
| White | – | – |
| Asian | 1.5 | 0.7–3.3 |
| African American/Latino/other | 0.4 | 0.1–1.6 |
| Missing | 1.0 | 0.5–2.0 |
| County | ||
| Alameda | – | – |
| San Francisco | 0.8 | 0.4–1.5 |
| Years since graduation | ||
| ≤10 | 0.5 | 0.2–1.1 |
| 11–20 | 0.9 | 0.4–1.6 |
| >20 | – | – |
| Medical school location | ||
| US | – | – |
| Foreign | 2.0 | 0.9–4.5 |
| Yearly median income of residents in zip code of practice† | ||
| Low | 1.0 | 0.5–2.1 |
| Middle | 0.7 | 0.3–1.6 |
| High | – | – |
| OR, odds ratio; CI, confidence interval | ||
| * Early appointment is within 0–30 days; late appointment is over 30 days’ wait | ||
| † Low: $5,106–$22,370; middle: $22,371–$36,507; high: $36,508–$51,926. | ||
Discussion
These results suggest that in a highly capitated urban area in California, access to primary care physicians may be restricted for patients seeking a new provider. The median waiting time for a new-patient appointment was 13 days, but the range was wide, from same-day appointments to 151 days of waiting time.
The most common reason for primary care physician unavailability was a “full practice.” In addition, a few primary care physicians required some form of screening before they would consider accepting a new patient into their practice. These screening practices may be a barrier to care. Under current managed care systems, appointment unavailability and long length of wait affect not only primary care services, but also access to specialty care.
This study gathered information on physician availability by means of research assistants posing as patients. We believe that surveying physicians using concealed intent was necessary to directly assess the experience of patients. This design was chosen to minimize inaccurate and potentially biased information.
Similar studies
At least 3 previous studies have used this method to obtain direct information on physician availability. After surveying ambulatory care clinics in 10 US cities, the Medicaid Access Study Group reported a difference in the length of waiting time to an appointment according to insurance status.5 Schwartz et al,6 who studied New York City obstetricians, found that only 42% of pregnant women were able to obtain a prenatal appointment with a physician, with waiting times ranging from 2 days to 7 weeks. Gifford,7 in a survey of Chicago area obstetricians, found that 36% accepted new Medicaid patients, and that fewer obstetricians worked in the poorest zip codes.
Physicians’ characteristics
Certain characteristics of the physicians were associated with availability or time to appointment. Female primary care physicians were significantly less likely to have an “early” appointment (within 30 days) available compared with male primary care physicians. Primary care physicians who had graduated from a medical school outside the US were more available than those who had attended a school in the US. Less experienced primary care physicians were more available than more experienced providers.
We were not able to analyze the availability of African American and Latino physicians separately due to their small numbers. When physicians identifying themselves as African American, Latino, or “other” were combined, the result did not significantly predict availability. The dearth of African American and Latino primary care physicians was striking: these 2 groups comprised only 2.5% of the study sample (n=11).
Limitations
Our study has several limitations. By excluding pediatricians, we were unable to determine primary care physician availability in Independent Practice Association plans for children in the study area. Osteopathic and general practitioners were also excluded; however, these practitioners comprise only a small percentage of primary care physicians in the study area. Information about physician race/ethnicity was frequently unavailable, which limits our ability to make conclusions about the effect of race/ethnicity. Moreover, to minimize missing data on race, we assumed Asian ethnicity for primary care physicians with Asian-origin surnames, and these assumptions may be a source of bias. We repeated analyses without the Asian race assumptions and found a similar lack of association for race in the multivariate models.
Also, we examined only new-patient availability. We do not know what proportion of adults in the study area have an established primary care provider. However, Medical Expenditure Panel Survey data have shown that 73% of the US population has an office-based usual source of health care, and almost 12% of families have members who change their usual source of care each year.3
If these figures are similar for the San Francisco Bay Area population, then finding a new primary care physician is important for a significant number of people in our study area each year. Because this study dealt only with primary care providers in 2 counties of the San Francisco Bay Area, the results may not be generalizable to other regions.
Because our study goal was to characterize the availability of primary care physicians who were gatekeepers in open managed care plans, we obtained information on appointment availability for routine examinations. Results may have differed if we had sought appointments for an urgent health care issue. Finally, we examined access to care in an Independent Practice Association–model managed care system. These findings may not be generalizable to other types of managed care models.
Conclusions
Physician availability is necessary for access to care within managed care plans. By defining primary care physician availability not only as presence in an area, but also as willingness to accept new patients, we are able to better identify potentially unmet needs for primary care. This study demonstrates that in the San Francisco Bay area, patients may experience moderate difficulty in obtaining access to primary care because practices are “closed” to new patients. Managed care plans should consider whether provider availability limits access to medical services in a specific region.
Acknowledgments
The authors thank Annamarie Stehli Nguyen, MPH, and Debbie Jaffe for assisting in data collection; Peter Bacchetti, PhD for statistical consultation; and Karen Vranizan, MA, Alicia Fernandez, MD, and Dean Schillinger, MD, for review of a previous version of the manuscript.
Corresponding author
Jennifer Haas, MD, MSPH, Division of General Medicine, Brigham and Women’s Hospital, 75 Francis Street, Boston, MA 02115. E-mail: [email protected].
1. Grumbach K, Vranizan K, Bindman AB. Physician supply and access to care in urban communities. Health Aff (Millwood) 1997;16:71-86.
2. Knapp KK, Paavola FG, Maine LL, Sorofman B, Politzer RM. Availability of primary care providers and pharmacists in the United States. J Am Pharm Assoc (Wash) 1999;39:127-135.
3. Weinick RM, Zuvekas SH, Drilea SK. Access to health care–sources and barriers, 1996. MEPS Research Findings No. 3. Rockville, Md: Agency for Health Care Policy and Research; 1997. AHCPR publication 98-0001.
4. Reed MC. Why people change their health care providers. Washington, DC: Center for Studying Health System Change; 2000. Data Bulletin No. 16. Available at: http://www.hschange.org/CONTENT/81/. Accessed on July 28, 2003.
5. Access of Medicaid recipients to outpatient care N Engl J Med 1994;330:1426-1430.
6. Schwartz LR, Heagarty M, Graham EH, Pirani S. Measuring access to prenatal care in New York City: a telephone survey of prenatal clinics. Am J Public Health 1996;86:1474-1475.
7. Gifford B. Obstetricians’ receptiveness to teen prenatal patients who are Medicaid recipients. Health Serv Res 1997;32:265-282.
Objectives: Primary care physicians function as “gatekeepers” in many managed care systems. With the rapid growth of managed care enrollment, it is crucial that patients have adequate access to primary care physicians. We investigated factors associated with new-patient appointment availability of primary care physicians in the San Francisco Bay Area.
Study Design: Observational cohort.
Population: Cross-sectional survey of primary care physician offices in 2 San Francisco Bay Area counties (n=438).
Outcomes Measured: New-patient appointment availability.
Results: Seventy-five percent of primary care physicians participating in managed care had an appointment available for a new patient.
Conclusions: The limited availability of appointments for new patients may create barriers to primary care in the San Francisco Bay Area, a region with high managed-care penetration.
Recent studies and reports have examined the effect of physician supply on patient access to health care.1,2 However, physician availability is affected not only by distribution of practices, but by whether a patient can actually make an appointment with a provider.
The availability of primary care physicians is central to access to care in most managed care plans. Managed care systems often designate the primary care physician as the “gatekeeper,” the decision maker about patients’ referrals to specialists. Within this kind of system, a patient may not be able to obtain nonemergent care, including specialty care, without access to a primary care physician.
Furthermore, with at least 12% of people changing providers each year,3,4 it is not uncommon for an individual to need to find a new primary care physician who participates in their health plan. The amount of effort needed to find a primary care physician who is accepting new patients, and the possibility of waiting more than a month for an appointment, may affect an individual’s access to care.
Because access to a primary care physician may be limited by these factors, our goal was to characterize the availability of a new-patient appointment with a primary care physician in the northern California counties of Alameda and San Francisco. We further examined whether physician characteristics (eg, sex, years of experience in practice) were associated with appointment availability.
Methods
Study sample
The focus of the study was to examine the availability of primary care physicians for adults between the ages of 18 and 64 years with employer-sponsored insurance in the San Francisco Bay area. Interviewers, posing as patients, made telephone calls to primary care physician’s offices, to parallel the experience of an actual patient seeking a new primary care provider. Current print and online directories of 3 large, open managed care plans available to employees of a large employer were reviewed.
These managed care plans function through an Independent Practice Association model. Two of the 3 plans require primary care physicians to be gatekeepers for all care within the system; ie, a patient must obtain a referral from the primary care physician to have a specialist visit covered by the insurance. The third plan allows patient self-referral to a specialist, but with a higher copay and deductible than with a specialist visit that has been approved by the primary care physician. Physicians working for Kaiser Permanente, the only closed-HMO plan in the study area, were excluded because Kaiser requires a member identification number prior to making an appointment.
Physicians were chosen if they were listed in each of the 3 plan directories, if they had practice addresses in the counties of Alameda or San Francisco, if they listed specialties of internal medicine or family medicine, and if their stated primary activity was clinical care. Doctors of osteopathy were not included.
This selection process identified 469 office-based physicians. Thirty-one physicians were determined to be ineligible during the data collection process (eg, did not meet the original study criteria when the interviewer called). The final study sample was 438 physicians.
Information on 157 physicians was available from the 1997 American Medical Association (AMA) Masterfile, including sex, race/ethnicity, medical school attended, and year of graduation from medical school. For physicians not listed in this older version of the Masterfile, the physician’s sex was obtained either at the time of the interview or from an online plan directory that had this information.
For physicians not listed in the Masterfile or for those with missing information on race/ethnicity, Asian race was determined by investigator review of last names; race/ethnicity for all others was coded as “missing.” Medical school location and year of graduation from medical school for all physicians were obtained from the physician lookup feature of the Medical Board of California Web site.
Data collection
Interviewers made telephone calls to primary care providers’ offices from July 1999 to January 2000. The interviewers posed as patients new to the area, to parallel the experience of an actual patient seeking a new primary care provider.
Telephone calls were made between 9 AM and 5 PM, Monday through Friday. Once an appointment representative for the primary care physician was reached, the interviewer attempted to make an appointment for an initial physical examination, using a standard script. The interviewer stated that she was a new employee, and was in the process of choosing a health plan, based on which insurance plans the primary care physician she was calling currently accepted. If asked what her insurance choices were, the interviewer named the 3 managed care plans used for selecting physicians for the study. If asked for an insurance card number, the interviewer stated that she would bring the appropriate insurance card to the appointment, and would cancel the appointment in advance if the insurance card had not arrived in time for the appointment. If asked, the interviewer stated that she had no urgent health problems. If an appointment was available for a date more than 2 weeks away, the interviewer booked the appointment and canceled it within 1 business day of the initial call.
If the appointment date was less than 2 weeks away, the interviewer noted the time and date but did not book the appointment.
Interviewers recorded information on appointment availability, date and time of appointment, and reason for unavailability. This study was approved by the Committee on Human Research, University of California, San Francisco.
Data and statistical analysis
Several potential predictors of physician availability were examined, including physician’s sex, race/ethnicity, years since graduation from medical school, medical school location, county of practice, and median per capita income of the zip code in which the practice was located. Descriptive statistics on these demographic factors were generated according to appointment availability with Pearson χ2 tests.
We analyzed the ability to get a new-patient appointment with a given primary care physician using a multivariate logistic regression model. Variables were included in the model based on a priori hypotheses. A new race/ethnicity category was created for the logistic regression models by combining African American, Latino, and other, due to small numbers for these groups.
The length of time to an available appointment was also examined. Time to appointment was dichotomized into early appointment (within 0–30 days) and late appointment (>30 days’ wait).
Results
Of the 438 physicians included in the final sample, 328 (74.9%) had an appointment available for a new patient with managed care insurance. Availability varied by physician race/ethnicity, medical school location, years since graduation from medical school, and the median per capita income of the residents in the zip code of the primary care physician’s practice (Table 1).
Appointments were not available for several reasons. Of the 110 primary care physicians who had no appointment available to new patients, 87 (79.1%) were not accepting new patients because of a full practice. Three (2.7%) were on leave or were about to retire. Ten (9.1%) receptionists were unable to book an appointment either because they did not have access to schedules far enough in advance, or because of a basic communication difficulty during repeated calls. One (0.9%) primary care physician was only accepting referred patients. One (0.9%) primary care physician saw only monolingual Chinese-speaking patients.
Eight (7.3%) primary care physicians classed as unavailable required some form of screening, separate from inquiries about insurance or intake assessment forms, before a new patient could be considered for an appointment. Of these 8 physicians, receptionists for 5 said that the physician needed to speak directly with the patient to determine eligibility (not related to insurance), and 1 required a receptionist-administered telephone interview that would be shared with the primary care physician. One required that a written personal questionnaire be filled out and returned for this purpose. The sole remaining primary care physician did not accept current smokers as patients.
TABLE 1
Characteristics of physicians in study
| Characteristic | N (%) | Appointment available (% of total) |
|---|---|---|
| Sex | ||
| Male | 328 (74.9) | 74.7 |
| Female | 110 (25.1) | 75.5 |
| Race/ethnicity | ||
| White | 170 (38.8) | 68.8 |
| Asian | 117 (26.7) | 74.4 |
| African American | 7 (1.6) | 85.7 |
| Latino | 4 (0.9) | 100 |
| Other | 8 (1.8) | 100 |
| Missing | 132 (30.1) | 80.3 |
| County | ||
| Alameda | 217 (49.5) | 74.7 |
| San Francisco | 221 (50.5) | 75.1 |
| Years since graduation from medical school | ||
| ≤10 | 61 (13.9) | 88.5* |
| 11–20 | 123 (28.1) | 74.8 |
| >20 | 254 (58.0) | 71.7 |
| Medical school location | ||
| US | 344 (78.5) | 71.5† |
| Foreign | 94 (21.5) | 87.2 |
| Yearly median income of residents in zip code of practice‡ | ||
| Low | 148 (33.8) | 75.7§ |
| Middle | 144 (32.9) | 81.3 |
| High | 146 (33.3) | 67.8 |
| Total | 438 (100) | 74.9 |
| *P=.02 for x2 comparing differences in appointment availability by years since graduation from medical school. | ||
| † P<.01 for x2 comparing differences in appointment availability by medical school location. | ||
| ‡ Low: $5,106–$22,370; middle: $22,371–$36,507; high: $36,508–$51,926. | ||
| § P=.03 for x2 comparing differences in appointment availability by yearly median income of residents in zip code of primary care physician’s practice. | ||
Predictors of appointment availability
Recent graduates were more likely to have an appointment available than more established physicians (OR=4.2; 95% CI, 1.7–10.3) ( Table 2). Foreign medical school graduates were also more likely to have an appointment available than US-educated physicians (OR=3.5; 95% CI, 1.7–7.3). Primary care physicians practicing in middle-income zip codes were more likely to have a new-patient appointment than those with offices in high-income zip codes (OR=2.1; 95% CI, 1.1–4.0).
TABLE 2
Characteristics associated with appointment availability (multivariate logistic regression)
| Characteristic N=438 | OR | 95% CI |
|---|---|---|
| Sex | ||
| Male | – | – |
| Female | 0.7 | 0.4–1.3 |
| Race/ethnicity | ||
| White | – | – |
| Asian | 0.8 | 0.4–1.5 |
| African American/Latino/other | 6.5 | 0.8–52.7 |
| Missing | 1.7 | 1.0–3.0 |
| County | ||
| Alameda | – | – |
| San Francisco | 1.7 | 1.0–2.8 |
| Years since graduation | ||
| ≤10 | 4.2 | 1.7–10.3 |
| 11–20 | 1.1 | 0.6–1.9 |
| >20 | – | – |
| Medical school location | ||
| US | – | – |
| Foreign | 3.5 | 1.7–7.3 |
| Yearly median income of residents in zip code of practice* | ||
| Low | 1.7 | 0.9–3.1 |
| Middle | 2.1 | 1.1–4.0 |
| High | – | – |
| OR, odds ratio; CI, confidence interval | ||
| * Low: $5,106–$22,370; middle: $22,371–$36,507; high: $36,508–$51,926 | ||
Predictors of length of time to appointment
The length of time to appointment among those primary care physicians with an available appointment ranged from 0 (same-day appointment) to 151 days; the median was 13 days. Seventy-five percent of appointments were available within 30 days. As shown in Table 3, female primary care physicians were significantly less likely than male primary care physicians to have an appointment available within 30 days (OR=0.4; 95% CI, 0.2–0.7).
TABLE 3
Physician characteristics associated with early appointment availability* (multivariate logistic regression)
| Characteristic N=309 | OR | 95% CI |
|---|---|---|
| Sex | ||
| Male | – | – |
| Female | 0.4 | 0.2–0.7 |
| Race/ethnicity | ||
| White | – | – |
| Asian | 1.5 | 0.7–3.3 |
| African American/Latino/other | 0.4 | 0.1–1.6 |
| Missing | 1.0 | 0.5–2.0 |
| County | ||
| Alameda | – | – |
| San Francisco | 0.8 | 0.4–1.5 |
| Years since graduation | ||
| ≤10 | 0.5 | 0.2–1.1 |
| 11–20 | 0.9 | 0.4–1.6 |
| >20 | – | – |
| Medical school location | ||
| US | – | – |
| Foreign | 2.0 | 0.9–4.5 |
| Yearly median income of residents in zip code of practice† | ||
| Low | 1.0 | 0.5–2.1 |
| Middle | 0.7 | 0.3–1.6 |
| High | – | – |
| OR, odds ratio; CI, confidence interval | ||
| * Early appointment is within 0–30 days; late appointment is over 30 days’ wait | ||
| † Low: $5,106–$22,370; middle: $22,371–$36,507; high: $36,508–$51,926. | ||
Discussion
These results suggest that in a highly capitated urban area in California, access to primary care physicians may be restricted for patients seeking a new provider. The median waiting time for a new-patient appointment was 13 days, but the range was wide, from same-day appointments to 151 days of waiting time.
The most common reason for primary care physician unavailability was a “full practice.” In addition, a few primary care physicians required some form of screening before they would consider accepting a new patient into their practice. These screening practices may be a barrier to care. Under current managed care systems, appointment unavailability and long length of wait affect not only primary care services, but also access to specialty care.
This study gathered information on physician availability by means of research assistants posing as patients. We believe that surveying physicians using concealed intent was necessary to directly assess the experience of patients. This design was chosen to minimize inaccurate and potentially biased information.
Similar studies
At least 3 previous studies have used this method to obtain direct information on physician availability. After surveying ambulatory care clinics in 10 US cities, the Medicaid Access Study Group reported a difference in the length of waiting time to an appointment according to insurance status.5 Schwartz et al,6 who studied New York City obstetricians, found that only 42% of pregnant women were able to obtain a prenatal appointment with a physician, with waiting times ranging from 2 days to 7 weeks. Gifford,7 in a survey of Chicago area obstetricians, found that 36% accepted new Medicaid patients, and that fewer obstetricians worked in the poorest zip codes.
Physicians’ characteristics
Certain characteristics of the physicians were associated with availability or time to appointment. Female primary care physicians were significantly less likely to have an “early” appointment (within 30 days) available compared with male primary care physicians. Primary care physicians who had graduated from a medical school outside the US were more available than those who had attended a school in the US. Less experienced primary care physicians were more available than more experienced providers.
We were not able to analyze the availability of African American and Latino physicians separately due to their small numbers. When physicians identifying themselves as African American, Latino, or “other” were combined, the result did not significantly predict availability. The dearth of African American and Latino primary care physicians was striking: these 2 groups comprised only 2.5% of the study sample (n=11).
Limitations
Our study has several limitations. By excluding pediatricians, we were unable to determine primary care physician availability in Independent Practice Association plans for children in the study area. Osteopathic and general practitioners were also excluded; however, these practitioners comprise only a small percentage of primary care physicians in the study area. Information about physician race/ethnicity was frequently unavailable, which limits our ability to make conclusions about the effect of race/ethnicity. Moreover, to minimize missing data on race, we assumed Asian ethnicity for primary care physicians with Asian-origin surnames, and these assumptions may be a source of bias. We repeated analyses without the Asian race assumptions and found a similar lack of association for race in the multivariate models.
Also, we examined only new-patient availability. We do not know what proportion of adults in the study area have an established primary care provider. However, Medical Expenditure Panel Survey data have shown that 73% of the US population has an office-based usual source of health care, and almost 12% of families have members who change their usual source of care each year.3
If these figures are similar for the San Francisco Bay Area population, then finding a new primary care physician is important for a significant number of people in our study area each year. Because this study dealt only with primary care providers in 2 counties of the San Francisco Bay Area, the results may not be generalizable to other regions.
Because our study goal was to characterize the availability of primary care physicians who were gatekeepers in open managed care plans, we obtained information on appointment availability for routine examinations. Results may have differed if we had sought appointments for an urgent health care issue. Finally, we examined access to care in an Independent Practice Association–model managed care system. These findings may not be generalizable to other types of managed care models.
Conclusions
Physician availability is necessary for access to care within managed care plans. By defining primary care physician availability not only as presence in an area, but also as willingness to accept new patients, we are able to better identify potentially unmet needs for primary care. This study demonstrates that in the San Francisco Bay area, patients may experience moderate difficulty in obtaining access to primary care because practices are “closed” to new patients. Managed care plans should consider whether provider availability limits access to medical services in a specific region.
Acknowledgments
The authors thank Annamarie Stehli Nguyen, MPH, and Debbie Jaffe for assisting in data collection; Peter Bacchetti, PhD for statistical consultation; and Karen Vranizan, MA, Alicia Fernandez, MD, and Dean Schillinger, MD, for review of a previous version of the manuscript.
Corresponding author
Jennifer Haas, MD, MSPH, Division of General Medicine, Brigham and Women’s Hospital, 75 Francis Street, Boston, MA 02115. E-mail: [email protected].
1. Grumbach K, Vranizan K, Bindman AB. Physician supply and access to care in urban communities. Health Aff (Millwood) 1997;16:71-86.
2. Knapp KK, Paavola FG, Maine LL, Sorofman B, Politzer RM. Availability of primary care providers and pharmacists in the United States. J Am Pharm Assoc (Wash) 1999;39:127-135.
3. Weinick RM, Zuvekas SH, Drilea SK. Access to health care–sources and barriers, 1996. MEPS Research Findings No. 3. Rockville, Md: Agency for Health Care Policy and Research; 1997. AHCPR publication 98-0001.
4. Reed MC. Why people change their health care providers. Washington, DC: Center for Studying Health System Change; 2000. Data Bulletin No. 16. Available at: http://www.hschange.org/CONTENT/81/. Accessed on July 28, 2003.
5. Access of Medicaid recipients to outpatient care N Engl J Med 1994;330:1426-1430.
6. Schwartz LR, Heagarty M, Graham EH, Pirani S. Measuring access to prenatal care in New York City: a telephone survey of prenatal clinics. Am J Public Health 1996;86:1474-1475.
7. Gifford B. Obstetricians’ receptiveness to teen prenatal patients who are Medicaid recipients. Health Serv Res 1997;32:265-282.
Herpes Simplex Virus Prophylaxis With Famciclovir in Patients Undergoing Aesthetic Facial CO2 Laser Resurfacing
Comparison of Azithromycin and Cefadroxil for the Treatment of Uncomplicated Skin and Skin Structure Infections
What is an ROC curve?
Receiver-operating characteristic (ROC) curves were developed to assess the quality of radar. In medicine, ROC curves are a way to analyze the accuracy of diagnostic tests and to determine the best threshold or “cutoff” value for distinguishing between positive and negative test results.
Diagnostic testing is almost always a tradeoff between sensitivity and specificity. ROC curves provide a graphic representation of this tradeoff. Setting a cutoff value too low may yield a very high sensitivity (ie, no disease would be missed) but at the expense of specificity (ie, a lot of false-positive results). Setting a cutoff too high would yield high specificity at the expense of sensitivity.
Consider a study by Smith et al,1 who measured the accuracy of B-type natriuretic peptide (BNP) as a test for impaired left ventricular function. They measured BNP levels in 155 elderly patients, who also underwent echocardiography (the diagnostic gold standard). An ROC curve was created by plotting the sensitivity against 1–specificity for different cutoff values of BNP (Figure). For example, the sensitivity and specificity of the BNP test were calculated and plotted, assuming a level of 19.8 pmol/L as a cutoff for a positive test.
The best cutoff has the highest sensitivity and lowest 1–specificity, and is therefore located as high up on the vertical axis and as far left on the horizontal axis as possible (upper left corner). The area under an ROC curve is a measure of the usefulness or “discriminative ” value of a test in general. The greater the area, the more useful the test. The maximum possible area under the curve is simply a perfect square and has an area of 1.0. Smith et al’s1 curve has an area of 0.85. The diagonal 45° line represents a test that has no discriminative value—ie, it’s completely useless.
FIGURE 1
Sample ROC curve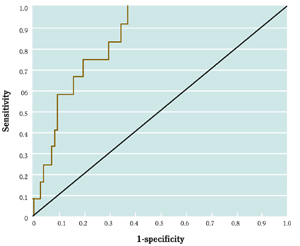
An ROC curve for the accuracy of B-type natriuretic peptide (BNP) as a test for impaired left ventricular function, which plots the sensitivity against 1–specificity for different cutoff values of BNP.
Correspondence
Goutham Rao, MD, 3518 Fifth Avenue, Pittsburgh, PA 15261. E-mail: [email protected].
REFERENCE
1. Smith H, Pickering RM, Struthers A, Simpson I, Mant D. Biochemical diagnosis of ventricular dysfunction in elderly patients in general practice: an observational study. BMJ 2000;320:906-908.
Receiver-operating characteristic (ROC) curves were developed to assess the quality of radar. In medicine, ROC curves are a way to analyze the accuracy of diagnostic tests and to determine the best threshold or “cutoff” value for distinguishing between positive and negative test results.
Diagnostic testing is almost always a tradeoff between sensitivity and specificity. ROC curves provide a graphic representation of this tradeoff. Setting a cutoff value too low may yield a very high sensitivity (ie, no disease would be missed) but at the expense of specificity (ie, a lot of false-positive results). Setting a cutoff too high would yield high specificity at the expense of sensitivity.
Consider a study by Smith et al,1 who measured the accuracy of B-type natriuretic peptide (BNP) as a test for impaired left ventricular function. They measured BNP levels in 155 elderly patients, who also underwent echocardiography (the diagnostic gold standard). An ROC curve was created by plotting the sensitivity against 1–specificity for different cutoff values of BNP (Figure). For example, the sensitivity and specificity of the BNP test were calculated and plotted, assuming a level of 19.8 pmol/L as a cutoff for a positive test.
The best cutoff has the highest sensitivity and lowest 1–specificity, and is therefore located as high up on the vertical axis and as far left on the horizontal axis as possible (upper left corner). The area under an ROC curve is a measure of the usefulness or “discriminative ” value of a test in general. The greater the area, the more useful the test. The maximum possible area under the curve is simply a perfect square and has an area of 1.0. Smith et al’s1 curve has an area of 0.85. The diagonal 45° line represents a test that has no discriminative value—ie, it’s completely useless.
FIGURE 1
Sample ROC curve
An ROC curve for the accuracy of B-type natriuretic peptide (BNP) as a test for impaired left ventricular function, which plots the sensitivity against 1–specificity for different cutoff values of BNP.
Correspondence
Goutham Rao, MD, 3518 Fifth Avenue, Pittsburgh, PA 15261. E-mail: [email protected].
REFERENCE
1. Smith H, Pickering RM, Struthers A, Simpson I, Mant D. Biochemical diagnosis of ventricular dysfunction in elderly patients in general practice: an observational study. BMJ 2000;320:906-908.
REFERENCE
1. Smith H, Pickering RM, Struthers A, Simpson I, Mant D. Biochemical diagnosis of ventricular dysfunction in elderly patients in general practice: an observational study. BMJ 2000;320:906-908.
Water versus gel lubricant for cervical cytology specimens
- Gel should be considered a viable option in obtaining Pap smears to ease insertion, minimize discomfort, and perhaps help maintain regular interval sampling compliance. Physicians choosing to use gel should be careful to apply only a thin layer to the outer blades of the speculum.
- Because approximately two thirds of false-negative smears are related to inadequate sampling, be sure to obtain cells from the transformational zone, where cancer is known to develop.
The medical literature generally recommends moistening the speculum with water for performance of a Papanicolaou (Pap) test, because gel lubricants interfere with specimen analysis and assessment of vaginal secretions.1,2 After an extensive literature search, we found little information that identified or substantiated the type or frequency of interference or distortion in analysis or assessment with regard to gel lubricants on cervical cytologic evaluation. The only study of gel lubricant use that we found recommended further study because surprisingly few Pap smears are rendered inadequate despite the high prevalence of gel use.3
Due to these findings and the lack of literature substantiating interference or distortion with gel lubricants, we investigated whether there is a difference in Pap smear obscuration rates with gellubricated vs water-lubricated speculum samples.
Methods
Target population
The target population consisted of all women who received Pap smears between 1995 and 1999 at the University of Tennessee Health Sciences Center HealthPlex Family Medicine Residency Program in Memphis, Tennessee. Pap smears were obtained by resident physicians in the Department of Family Medicine, University of Tennessee Health Science Center. The specific technique used by the residents was left to their discretion and each was asked to describe the usual use of lubricants.
More than 4169 Pap smears were identified via Current Procedural Terminology codes (A88141, A88155, A88164, and/or A88167). Of these, 649 charts were selected by using every sixth record. From those selected, 615 contained adequate information to be included in the study.
Data collection
We gathered medical record data by using a retrospective review of medical records, including the medical record number, date of birth, date of service, provider performing pelvic examination or obtaining cervical cytology smear, identification of the laboratory processing and reporting each cytology report, and insurance coverage (Medicare, private, self-payer, and TennCare/ Medicaid). Cervical cytology report information retrieved included sample adequacy (satisfactory or unsatisfactory), whether the sample was identified as obscured, and whether obscuration was caused by blood.
We also collected data from the medical record on potential confounders, including socioeconomic status (determined by insurance source) and reproductive status (currently pregnant, menopausal, or posthysterectomy). Medical records containing incomplete documentation of any portion of the review criteria were excluded.
Analysis
Statistical analysis was completed with SAS 8.1. Simple χ2 analysis was used where appropriate to demonstrate associations. A stepwise regression model was considered, but none of the χ2 statistics were significant, which eliminated the need for a modeling procedure.
Results
Of the 615 participants, 50 were pregnant, 49 were menopausal, and 42 had undergone a hysterectomy. By matching clinicians’ survey responses to the cytology specimens they collected, we determined that 379 were acquired with water, 81 with gel, and 155 without lubricant.
We reviewed cytology reports for the documented level of adequacy, the presence of any obscuration, and the type of obscuration (see Table). for cytology findings). All 27 obscured and 4 inadequate specimens (5% of the 615 cytology reports reviewed) were reported among women who were pregnant, menopausal, or posthysterectomy. Menopausal women accounted for 89% (24) of obscured specimens and 100% (4) of inadequate specimens. Within the menopausal group, 63% (15) of the specimens were obscured by blood and 37% (9) were obscured by “other.” The term “other” was not defined further or explained on any cytology report. The 5 laboratories reporting obscuration by “other” were contacted, and all reported that this term defines obscuration by nonblood contaminants. Pregnant women accounted for 7% (2) of the obscured specimens, with 1 obscured by blood and 1 obscured by “other.” Women identified as posthysterectomy contributed 4% (1) of the obscured specimens; it was reported as obscured by “other.”
Reports identifying obscured or inadequate specimens and socioeconomic status were also cross-tabulated against type of lubricant used in consideration for possible bias. The outcome showed no identified indication.
No statistically significant difference was found in the likelihood of specimen obscuration or adequacy vs inadequacy between water, gel, or no lubricant. The occurrence of obscuration was lower with the use of water lubricant (3.2%) than with gel lubricant (6.2%) or no lubricant (6.5%). However, this difference was not statistically significant (P<.20).
TABLE
Lubricant use and cytology findings
| Total no. | Water lubricant, % (n) | Gel lubricant, % (n) | No lubricant, % (n) | |
|---|---|---|---|---|
| Lubricant use reported | 615 | 62 (379) | 13 (81) | 25 (155) |
| Adequate sample | 611 | 99.2 (376) | 98.8 (80) | 100 (155) |
| Inadequate sample | 4 | 0.08 (3) | 1 (1) | 0 (0) |
| Not obscured | 588 | 96.8 (367) | 93.8 (76) | 93.5 (145) |
| Obscured | 27 | 3 (12) | 6.2 (5) | 6.5 (10) |
| By blood | 16 | 58 (7) | 20 (1) | 80 (8) |
| By other* | 11 | 42 (5) | 80 (4) | 20 (2) |
| *Defined as obscuration by nonblood contaminant(s). | ||||
Discussion
The purpose of this study was to identify any differences in the occurrence of contamination or distortion of cervical cytology test results between water and gel as the lubricant. With a sample size that allowed us to detect an absolute difference as small as 7%, we found no significant difference between the use of gel or water lubricant in the likelihood of cell obscuration or inadequacy. These findings did not support current data reported in several publications and may explain the lack of publications describing specific adverse gel effects on sampling collection.
Inadequate specimens in postmenopausal women
The number of obscured and inadequate specimens found within the group of women who had reached menopause was not unexpected because of hormonal changes in cervical cells and the physical structure of the uterus. Although not unexpected, it is of concern that this group includes many older women who constitute an underscreened subgroup who frequently forego routine cervical cancer screening unless they have gynecologic problems.4
In recognizing the need for this group to obtain testing and maintain routine screening compliance, minimizing discomfort related to cervical cell acquisition procedure should be a primary consideration. Because lubricant minimizes friction and optimizes the ease of speculum insertion, gel can be considered an effective choice for these women.
Sampling errors
Nationally, approximately two thirds of false-negative smears are related to inadequate sampling, and the primary sampling error is the failure to obtain cells from the transformational zone, where cancer is known to develop.5,6 The high percentage of specimen adequacy (99% for the water and gel groups and 100% for the no-lubricant group) found during this study may be attributed to the homogeneity in clinical training of the participating residents.
Although different labs evaluated cytology specimens (depending on the payment source), all providers who performed cervical cell acquisition were considered influenced by similar training. Also, all of our residents are taught that when gel lubricant is used, a thin coat is to be placed only on the external speculum blade surfaces.
Limitations of this study
The size of the study population was limited by medical record completeness and the response rate for physician surveys. A larger study might have found a difference, although it is questionable whether such a difference would be statistically significant.
Reliance on a survey of the usual type of lubricant may be less accurate than direct observation; however, direct observation was not practical in our setting. The adequacy and quality of cytology specimens also could have been affected by cervicitis, vaginitis, interval from last menstrual period, and use of hormone therapy, but these conditions would not be expected to affect the patients of physicians using one type of lubricant more than those using another.
In addition, we were limited in designing the study by the lack of comparison literature. As with other studies of this size, further research is recommended, with additional clinicians and study populations to reinforce and elaborate on the current findings.
Conclusions
A thin coat of water-soluble gel on the external vaginal speculum blade surfaces did not compromise the adequacy or interpretation of cervical cytology. Gel should be considered an option in obtaining Pap smears to ease insertion, minimize discomfort, and perhaps help maintain regular interval sampling compliance. Physicians choosing to use gel should be careful to apply only a thin layer to the outer blades of the speculum.
Corresponding author
Pamela D. Connor, PhD, 66 N. Pauline, Memphis, TN 38163. E-mail: [email protected].
1. Katz A. Cervical cancer screening. Role of family physicians. Can Fam Phys 1998;44:1661-1665.
2. Ruffin MT. Papanicolaou smear. Letter to the editor. J Am Board Fam Pract 1988;1:225-226.
3. Casselman CW, Cruthcher RA, Jadusingh IH. Use of watersoluble gel in obtaining the cervical cytologic smear. Acta Cytol 1997;41:1861-1862.
4. Cervical cancer. NIH Consens Statement 1996;14(1):1-38.
5. Holmquist ND. Revisiting the effect of the Pap test on cervical cancer. Am J Public Health 2000;90:620-623.
6. Mayeaux EJ, Brotzman G. Cervical cytologic screening and adjunctive testing. Female Patient 1999;24:35-40.
- Gel should be considered a viable option in obtaining Pap smears to ease insertion, minimize discomfort, and perhaps help maintain regular interval sampling compliance. Physicians choosing to use gel should be careful to apply only a thin layer to the outer blades of the speculum.
- Because approximately two thirds of false-negative smears are related to inadequate sampling, be sure to obtain cells from the transformational zone, where cancer is known to develop.
The medical literature generally recommends moistening the speculum with water for performance of a Papanicolaou (Pap) test, because gel lubricants interfere with specimen analysis and assessment of vaginal secretions.1,2 After an extensive literature search, we found little information that identified or substantiated the type or frequency of interference or distortion in analysis or assessment with regard to gel lubricants on cervical cytologic evaluation. The only study of gel lubricant use that we found recommended further study because surprisingly few Pap smears are rendered inadequate despite the high prevalence of gel use.3
Due to these findings and the lack of literature substantiating interference or distortion with gel lubricants, we investigated whether there is a difference in Pap smear obscuration rates with gellubricated vs water-lubricated speculum samples.
Methods
Target population
The target population consisted of all women who received Pap smears between 1995 and 1999 at the University of Tennessee Health Sciences Center HealthPlex Family Medicine Residency Program in Memphis, Tennessee. Pap smears were obtained by resident physicians in the Department of Family Medicine, University of Tennessee Health Science Center. The specific technique used by the residents was left to their discretion and each was asked to describe the usual use of lubricants.
More than 4169 Pap smears were identified via Current Procedural Terminology codes (A88141, A88155, A88164, and/or A88167). Of these, 649 charts were selected by using every sixth record. From those selected, 615 contained adequate information to be included in the study.
Data collection
We gathered medical record data by using a retrospective review of medical records, including the medical record number, date of birth, date of service, provider performing pelvic examination or obtaining cervical cytology smear, identification of the laboratory processing and reporting each cytology report, and insurance coverage (Medicare, private, self-payer, and TennCare/ Medicaid). Cervical cytology report information retrieved included sample adequacy (satisfactory or unsatisfactory), whether the sample was identified as obscured, and whether obscuration was caused by blood.
We also collected data from the medical record on potential confounders, including socioeconomic status (determined by insurance source) and reproductive status (currently pregnant, menopausal, or posthysterectomy). Medical records containing incomplete documentation of any portion of the review criteria were excluded.
Analysis
Statistical analysis was completed with SAS 8.1. Simple χ2 analysis was used where appropriate to demonstrate associations. A stepwise regression model was considered, but none of the χ2 statistics were significant, which eliminated the need for a modeling procedure.
Results
Of the 615 participants, 50 were pregnant, 49 were menopausal, and 42 had undergone a hysterectomy. By matching clinicians’ survey responses to the cytology specimens they collected, we determined that 379 were acquired with water, 81 with gel, and 155 without lubricant.
We reviewed cytology reports for the documented level of adequacy, the presence of any obscuration, and the type of obscuration (see Table). for cytology findings). All 27 obscured and 4 inadequate specimens (5% of the 615 cytology reports reviewed) were reported among women who were pregnant, menopausal, or posthysterectomy. Menopausal women accounted for 89% (24) of obscured specimens and 100% (4) of inadequate specimens. Within the menopausal group, 63% (15) of the specimens were obscured by blood and 37% (9) were obscured by “other.” The term “other” was not defined further or explained on any cytology report. The 5 laboratories reporting obscuration by “other” were contacted, and all reported that this term defines obscuration by nonblood contaminants. Pregnant women accounted for 7% (2) of the obscured specimens, with 1 obscured by blood and 1 obscured by “other.” Women identified as posthysterectomy contributed 4% (1) of the obscured specimens; it was reported as obscured by “other.”
Reports identifying obscured or inadequate specimens and socioeconomic status were also cross-tabulated against type of lubricant used in consideration for possible bias. The outcome showed no identified indication.
No statistically significant difference was found in the likelihood of specimen obscuration or adequacy vs inadequacy between water, gel, or no lubricant. The occurrence of obscuration was lower with the use of water lubricant (3.2%) than with gel lubricant (6.2%) or no lubricant (6.5%). However, this difference was not statistically significant (P<.20).
TABLE
Lubricant use and cytology findings
| Total no. | Water lubricant, % (n) | Gel lubricant, % (n) | No lubricant, % (n) | |
|---|---|---|---|---|
| Lubricant use reported | 615 | 62 (379) | 13 (81) | 25 (155) |
| Adequate sample | 611 | 99.2 (376) | 98.8 (80) | 100 (155) |
| Inadequate sample | 4 | 0.08 (3) | 1 (1) | 0 (0) |
| Not obscured | 588 | 96.8 (367) | 93.8 (76) | 93.5 (145) |
| Obscured | 27 | 3 (12) | 6.2 (5) | 6.5 (10) |
| By blood | 16 | 58 (7) | 20 (1) | 80 (8) |
| By other* | 11 | 42 (5) | 80 (4) | 20 (2) |
| *Defined as obscuration by nonblood contaminant(s). | ||||
Discussion
The purpose of this study was to identify any differences in the occurrence of contamination or distortion of cervical cytology test results between water and gel as the lubricant. With a sample size that allowed us to detect an absolute difference as small as 7%, we found no significant difference between the use of gel or water lubricant in the likelihood of cell obscuration or inadequacy. These findings did not support current data reported in several publications and may explain the lack of publications describing specific adverse gel effects on sampling collection.
Inadequate specimens in postmenopausal women
The number of obscured and inadequate specimens found within the group of women who had reached menopause was not unexpected because of hormonal changes in cervical cells and the physical structure of the uterus. Although not unexpected, it is of concern that this group includes many older women who constitute an underscreened subgroup who frequently forego routine cervical cancer screening unless they have gynecologic problems.4
In recognizing the need for this group to obtain testing and maintain routine screening compliance, minimizing discomfort related to cervical cell acquisition procedure should be a primary consideration. Because lubricant minimizes friction and optimizes the ease of speculum insertion, gel can be considered an effective choice for these women.
Sampling errors
Nationally, approximately two thirds of false-negative smears are related to inadequate sampling, and the primary sampling error is the failure to obtain cells from the transformational zone, where cancer is known to develop.5,6 The high percentage of specimen adequacy (99% for the water and gel groups and 100% for the no-lubricant group) found during this study may be attributed to the homogeneity in clinical training of the participating residents.
Although different labs evaluated cytology specimens (depending on the payment source), all providers who performed cervical cell acquisition were considered influenced by similar training. Also, all of our residents are taught that when gel lubricant is used, a thin coat is to be placed only on the external speculum blade surfaces.
Limitations of this study
The size of the study population was limited by medical record completeness and the response rate for physician surveys. A larger study might have found a difference, although it is questionable whether such a difference would be statistically significant.
Reliance on a survey of the usual type of lubricant may be less accurate than direct observation; however, direct observation was not practical in our setting. The adequacy and quality of cytology specimens also could have been affected by cervicitis, vaginitis, interval from last menstrual period, and use of hormone therapy, but these conditions would not be expected to affect the patients of physicians using one type of lubricant more than those using another.
In addition, we were limited in designing the study by the lack of comparison literature. As with other studies of this size, further research is recommended, with additional clinicians and study populations to reinforce and elaborate on the current findings.
Conclusions
A thin coat of water-soluble gel on the external vaginal speculum blade surfaces did not compromise the adequacy or interpretation of cervical cytology. Gel should be considered an option in obtaining Pap smears to ease insertion, minimize discomfort, and perhaps help maintain regular interval sampling compliance. Physicians choosing to use gel should be careful to apply only a thin layer to the outer blades of the speculum.
Corresponding author
Pamela D. Connor, PhD, 66 N. Pauline, Memphis, TN 38163. E-mail: [email protected].
1. Katz A. Cervical cancer screening. Role of family physicians. Can Fam Phys 1998;44:1661-1665.
2. Ruffin MT. Papanicolaou smear. Letter to the editor. J Am Board Fam Pract 1988;1:225-226.
3. Casselman CW, Cruthcher RA, Jadusingh IH. Use of watersoluble gel in obtaining the cervical cytologic smear. Acta Cytol 1997;41:1861-1862.
4. Cervical cancer. NIH Consens Statement 1996;14(1):1-38.
5. Holmquist ND. Revisiting the effect of the Pap test on cervical cancer. Am J Public Health 2000;90:620-623.
6. Mayeaux EJ, Brotzman G. Cervical cytologic screening and adjunctive testing. Female Patient 1999;24:35-40.
Compared Efficacy and Safety of Tretinoin 0.1% Microsphere Gel Alone and in Combination With Benzoyl Peroxide 6% Cleanser for the Treatment of Acne Vulgaris
Clocortolone Pivalate Cream 0.1% Used Concomitantly With Tacrolimus Ointment 0.1% in Atopic Dermatitis
ADHD treatment and academic performance: A case series
- Most new cases of attention deficit– hyperactivity disorder (ADHD) are of the predominantly inattentive subtype. Research on the use of psychostimulants in these patients has shown a high rate of nonresponders.
- Although psychostimulants showed a short-term decrease in symptoms in students diagnosed with predominantly inattentive ADHD, they did not significantly improve grade-point averages.
To evaluate psychostimulants in the treatment of attention deficit–hyperactivity disorder (ADHD), predominantly inattentive subtype with coexisting academic impairment, a consecutive sample of 35 students from a private, primary care, office-based practice was followed for 1 year. All participants received psychostimulants, multimodal interventions, and treatment of comorbid disorders. Baseline mean grade-point averages (GPAs) from the preceding school year were compared with mean GPAs calculated at 1 year. Statistical analysis was by a paired samples t test.
Of 32 students who completed the study, 27 pupils’ GPAs did not improve (84.4%), while 5 pupils’ GPAs did improve (15.6%) (P=.176).
These findings call for additional research to further define predominantly inattentive ADHD in patients who present with inattention and academic concerns, and the role of stimulants in the treatment of this disorder.
Diagnostic criteria
In 1994, the 4th edition of the Diagnostic and Statistical Manual of Mental Disorders (DSM-IV) redefined the full syndrome of attention deficit hyperactivity disorder as combined ADHD, and introduced 2 new subtypes: predominantly inattentive and predominantly hyperactive-impulsive.1 Since publication, the majority of new cases identified by DSM-IV have been predominantly inattentive ADHD.2 Primary care physicians manage 86% of patients with ADHD.3
The clinical issues
The diagnostic criteria defining predominantly inattentive ADHD and the evidence supporting its inclusion as a separate subtype mainly involve students with academic impairment.4 Measuring the effect of pharmacologic intervention on ADHD and academic functioning is important.5,6
Research on the use of psychostimulants in patients with attention deficit disorder without hyperactivity as defined by the DSM-III7 showed a high rate of nonresponders and no evidence of long-term effects on academic achievement and learning.8-10 It is not clear whether these results apply to patients with predominantly inattentive ADHD.11 A recent National Institutes of Health Consensus Statement acknowledged the need for research that specifically targets predominantly inattentive ADHD and the effects of psychotropic therapy on school performance associated with the subtype.12
The following study was therefore designed to address these issues and determine the effect of psychostimulant treatment in patients with predominantly inattentive ADHD and academic impairment.
Methods
The 35 participants from the author’s rural, office-based practice, seen because of academic concerns and inattention, were consecutively diagnosed with predominantly inattentive ADHD based on information obtained from parents and teachers and application of the DSM-IV criteria.1 Clinical examinations ruled out physical or neurologic handicaps and uncorrected visual or hearing impairments ( Table 1).
Seven participants had academic impairment as the only comorbidity with predominantly inattentive ADHD. Twenty-eight had multiple comorbidities. These included anxiety symptoms (12), dysgraphia (12), psychosomatic complaints (11), social problems (6), communication disorders (4), learning disabilities (3), enuresis (3), and dysphoria (3). Six parents of the students had a history of anxiety–depression and 2 had generalized anxiety disorder.
Anxiety symptoms, psychosomatic complaints, dysphoria, and fine-motor dyspraxia were descriptive problems and not considered disorders using DSM-IV criteria.1 Learning disabilities and communication disorders were diagnosed by school psychologists and speech language pathologists, respectively. Social impairment was diagnosed using the asocial domain on the Conner’s Teacher Rating Scale13 and noting t scores of ≥1.5 standard deviations above the mean. Enuresis was diagnosed from information obtained from the history and physical exam. None of the cohort met DSM-IV criteria for oppositional defiant disorder or conduct disorder.1
The diagnostic protocol for ADHD and coexisting disorders used in this study was consistent with the recommendations endorsed by the American Academy of Pediatrics and the American Academy of Family Physicians.14
The baseline GPA for each participant was determined by taking the GPA from each report card of the preceding school year (either four 9-week report cards or six 6-week report cards) and calculating the mean GPA. The mean GPA after the school year following psychostimulant therapy was calculated for each student in the same manner and compared with his mean baseline GPA.
Participants were assessed every 6 to 9 weeks (when they brought their report cards to the office) for compliance and possible side effects of medication. Dosage adjustments were determined by using follow-up information obtained from parents and teachers, based on DSM-IV criteria for predominantly inattentive ADHD.
All patients, families, and school personnel received educational information on predominantly inattentive ADHD throughout the study. This is consistent with the practice parameters for ADHD from the American Academy of Child and Adolescent Psychiatry and a national perspective on ADHD treatment in primary care practice settings, which states: “providing information about symptoms of ADHD, areas of impairment, etiology, and principles of behavior management to parents and teachers constitutes sound clinical practice.”15 Statistical analysis was performed by a paired samples t test.
TABLE 1
Profile of participants in study of ADHD treatment and academic performance
| Participants | Nonparticipants | GPA not improved | GPA improved | |
|---|---|---|---|---|
| Gender | ||||
| Male | 23 | 2 | 18 | 5 |
| Female | 9 | 1 | 9 | 0 |
| Mean age(mo) | 125 ± 30 | 124 ± 9.2 | 127 ± 32 | 119 ± 10 |
| Race | ||||
| White | 28 | 3 | 24 | 4 |
| African American | 4 | 0 | 3 | 1 |
| Mean GPA | 2.26 ± .62 | 2.24 ± .54 | 2.26 ± .66 | 2.24 ± .42 |
| Family structure | ||||
| Both parents | 20 | 2 | 17 | 3 |
| Blended | 8 | 1 | 6 | 2 |
| Single parent | 4 | 0 | 4 | 0 |
| Parent psychopathology | 8 | 0 | 7 | 1 |
| Mean comorbidities | 1.53 | 1.67 | 1.59 | 1.20 |
| GPA, grade-point average | ||||
Results
Thirty-two of 35 students completed the study. Using a Mann-Whitney U test, no significant differences were found between these patients and those who did not complete the study (P=.80 for baseline GPA differences and P=.80 for age.)
According to follow-up information from parents and teachers, all participants exhibited short-term improvements in DSM-IV criteria for predominantly inattentive ADHD at some point during the study. Five pupils who completed the study had improved GPAs (15.6%), while the remaining 27 participants showed no change or decreased GPAs (84.4%).
Using students t tests to compare age, baseline GPAs, and number of comorbidities and χ2 for parental psychopathology, no significant differences were found between students with improved GPAs and those without improvement in their GPAs (P=.61 for age, P=.93 for baseline GPA differences, P=.53 for differences in comorbidities, and P=.70 for differences in parental psychopathology; see Table 1). Using a paired sample t test on data from all 32 participants showed that the overall treatment effect was not significant (P=.176; see Table 2).
TABLE 2
Grade-point averages at baseline and at the study’s conclusion*
| Student # | Baseline GPAs | Treatment GPAs | Change |
|---|---|---|---|
| 1 | 2.29 | 1.59 | –.70 |
| 2 | 3.00 | 2.40 | –.60 |
| 3 | 1.80 | 1.25 | –.55 |
| 4 | 2.50 | 1.96 | –.54 |
| 5 | 2.50 | 2.00 | –.50 |
| 6 | 1.80 | 1.50 | –.30 |
| 7 | 3.50 | 3.22 | –.28 |
| 8 | 2.57 | 2.35 | –.22 |
| 9 | 2.43 | 2.29 | –.14 |
| 10 | 3.00 | 2.86 | –.14 |
| 11 | 2.25 | 2.12 | –.13 |
| 12 | 2.57 | 2.45 | –.12 |
| 13 | 2.47 | 2.37 | –.10 |
| 14 | 2.71 | 2.61 | –.10 |
| 15 | 2.20 | 2.10 | –.10 |
| 16 | 2.27 | 2.20 | –.07 |
| 17 | 1.66 | 1.59 | –.07 |
| 18 | 1.87 | 1.80 | –.07 |
| 19 | 2.43 | 2.36 | –.07 |
| 20 | .71 | .67 | –.04 |
| 21 | 2.53 | 2.50 | –.03 |
| 22 | 2.10 | 2.07 | –.03 |
| 23 | .95 | .92 | –.03 |
| 24 | 2.53 | 2.52 | –.01 |
| 25 | 3.29 | 3.29 | 0 |
| 26 | .95 | .95 | 0 |
| 27 | 2.25 | 2.25 | 0 |
| 28 | 2.17 | 2.60 | +.43 |
| 29 | 2.66 | 3.09 | +.43 |
| 30 | 2.50 | 3.00 | +.50 |
| 31 | 1.57 | 2.12 | +.55 |
| 32 | 2.29 | 2.85 | +.56 |
| Mean ± SD | 2.26 ± .62 | 2.18 ± .65 | |
| *Post-treatment GPAs declined an average of .08 ± .32, 95% confidence interval, –.19 to .04. Paired samples test=1.385 (31 degrees of freedom) (P=.176). | |||
| GPA, grade-point average; SD, standard deviation | |||
Discussion
Psychostimulant therapy did not significantly improve the outcome measures (GPAs) in the cohort diagnosed with predominantly inattentive ADHD and academic impairment. Additional comorbidities were diagnosed and treated, but differences among participants were not statistically significant. Short-term decreases in DSM-IV symptoms of predominantly inattentive ADHD did not translate into academic gains.
Limitations to the present study include the small sample size and lack of a control group. Thus, the findings should be considered preliminary. GPAs are not standardized scores and are sensitive to varying influences. However, the American Academy of Pediatrics notes that even when standardized instruments are used to assess stimulant treatment for ADHD, there is “frequently no association with improvements in academic achievement.”16 Only short-term gains in academic efficiency have been reported.17
The average doses employed (methylphenidate 16.7 mg/d, dextroamphetamine 11 mg/d) were smaller than the starting doses used successfully in the Multimodal Treatment Study of Children with ADHD (methylphenidate 30.5 mg/d, dextroamphetamine 15.25 mg/d).18 However, this study excluded patients with predominantly inattentive ADHD.19 The lower dosages used in the present study are compatible with the practice parameters of the American Academy of Child and Adolescent Psychiatry for ADHD without hyperactivity.20
All participants in the study received educational assistance. Those students not attending resource classes qualified for accommodations and modifications under Section 504 of the Rehabilitation Act of 1973 guidelines. The small sample sizes precluded an analysis of the effects of these different educational interventions on GPAs. The input from multiple teachers and classroom settings could not be delineated. However, GPAs have the advantage of being readily accessible. In addition, the findings obtained from a community-based practice with patients and families in their natural environment support the study’s results.
How do the results of the present study correlate with the literature on predominantly inattentive ADHD, and how should clinicians incorporate these data into their evaluations of students who have inattention and academic concerns? Results from the Pediatric Research in Office Settings and the Ambulatory Sentinel Practice Network21 note that there is “a lack of standardization in the primary care evaluation of attentional problems.” Inattention is not unique to predominantly inattentive ADHD. Children and adolescents with language/learning disorders,22-24 anxiety/depression,25 and family dysfunction26 are also described as inattentive.
It is difficult to define accurately what is meant by inattention in predominantly inattentive ADHD because the psychological construct of attention is not the same as that being measured behaviorally in predominantly inattentive ADHD.27 In addition, the unifying theory on ADHD, which involves deficits in behavior inhibition and executive function, does not include predominantly inattentive ADHD in the definition.28,29 The American Academy of Pediatrics concludes that with ADHD the need “to develop more valid and precise diagnostic criteria is essential.”30
The present study should be considered an introductory step in the evaluation of psychostimulant treatment in predominantly inattentive ADHD. GPAs are easily obtained by busy clinicians and are time-efficient measures of treatment outcomes. Clearly, additional research, using larger groups and controls, is needed.
ACKNOWLEDGMENTS
The author thanks Glenn N. Jones, PhD, for his assistance with the statistical analysis.
1. American Psychiatric Association. Diagnostic and Statistical Manual of Mental Disorders. 4th ed. Washington, DC: American Psychiatric Association; 1994.
2. Gaub M, Carlson CL. Behavioral characteristics of DSM-IV ADHD subtypes in a school-based population. J Abnorm Child Psychol 1997;25:103-111.
3. Safer DJ. Attention deficit hyperactivity disorder: pinning down the diagnosis, implementing therapy. Consultant 1996;Mar:533-545.
4. Lahey BB, Applegate B, McBurnett K, et al. DSM-IV field trials for attention deficit hyperactivity disorder in children and adolescents. Am J Psychiatry 1994;151:1673-1685.
5. Rapport MD, Denney C, DuPaul GJ, Gardner MJ. Attention deficit disorder and methylphenidate: normalization rates, clinical effectiveness, and response prediction in 76 children. J Am Acad Child Adolesc Psychiatry 1994;33:882-893.
6. Weiss M, Jain U, Garland J. Clinical suggestions for management of stimulant treatment in adolescents. Can J Psychiatry 2000;45:717-723.
7. American Psychiatric Association. Diagnostic and Statistical Manual of Mental Disorders. 3rd ed. Washington, DC: American Psychiatric Association; 1980.
8. Cantwell DP, Baker L. Attention deficit disorder with and without hyperactivity: a review and comparison of matched groups. J Am Acad Child Adolesc Psychiatry 1992;31:432-438.
9. Barkley RA, DuPaul GJ, McMurray MB. Attention deficit disorder with and without hyperactivity: clinical response to three dose levels of methylphenidate. Pediatrics 1991;87:519-531.
10. Safer DJ. Major treatment considerations for attention-deficit hyperactivity disorder. Curr Probl Pediatr 1995;25:137-143.
11. Morgan AE, Hynd GW, Riccio CA, Hall J. Validity of DSM-IV ADHD predominantly inattentive and combined types: relationship to previous DSM diagnoses/subtype differences. J Am Acad Child Adolesc Psychiatry 1996;35:325-333.
12. National Institute of Health Consensus Development Conference Statement: diagnosis and Treatment of Attention-Deficit/Hyperactivity Disorder (ADHD). J Am Acad Child Adolesc Psychiatry 2000;39:182-193.
13. Conners CK. Conner’s Rating Scales. North Tonawanda, NY: Multi-Health Systems, Inc.; 1990.
14. Herrerias CT, Perrin JM, Stein MT. The child with ADHD: using the AAP clinical practice guideline. Am Fam Physician 2001;63:1803-1810.
15. Hoagwood K, Jensen PS, Feil M, Vitiello B, Bhatara VS. Medication management of stimulants in pediatric practice settings: a national perspective. J Dev Behav Pediatr 2000;21:322-331.
16. Committee on Quality Improvement. American Academy of Pediatrics. Clinical practice guideline: treatment of the school-aged child with attention-deficit/hyperactivity disorder. Pediatrics 2001;108:1033-1044.
17. Bennett FC, Brown RT, Craver J, Anderson D. Stimulant medication for the child with attention-deficit/hyperactivity disorder. Pediatr Clin N Am 1999;46:929-944.
18. The MTA Cooperative Group. A 14-month randomized clinical trial of treatment strategies for attention-deficit/hyperactivity disorder. Arch Gen Psychiatry 1999;56:1073-1086.
19. Arnold LE, Abikoff HB, Cantwell DP, et al. National Institute of Mental Health collaborative multimodal treatment study of children with ADHD (the MTA). Arch Gen Psychiatry 1997;54:865-870.
20. Dulcan MK, Benson RS. Summary of the practice parameters for the assessment and treatment of children, adolescents, and adults with ADHD. J Am Acad Child Adolesc Psychiatry 1997;36:1311-1317.
21. Wasserman RC, Kelleher KJ, Bocian A, et al. Identification of attentional and hyperactivity problems in primary care: a report from pediatric research in office settings and the ambulatory sentinel practice network. Pediatrics 1999;103:e38.-
22. Wolraich ML, Hannah JN, Baumgaertel A, Feurer ID. Examination of DSM-IV criteria for attention deficit/hyperactivity disorder in a county-wide sample. J Devel Behav Pediatr 1998;19:162-168.
23. Rielly NE, Cunningham CE, Richards JE, Elard H, Mahoney WJ. Detecting attention deficit hyperactivity disorder in a communications clinic; diagnostic utility of the Gordon Diagnostic System. J Clin Exper Neuropsychol 1999;21:685-700.
24. Beichman JH, Cantwell DP, Forness SR, Kavale KA, Kauffman JM. Practice parameters for the assessment and treatment of children and adolescents with language and learning disorders. J Am Acad Child Adolesc Psychiatry 1998;37(suppl 10):46s-62s.
25. Zametkin AD, Ernst M. Problems in the management of attention-deficit-hyperactivity disorder. N Engl J Med 1999;340:40-46.
26. Schneider SC, Tan G. Attention-deficit hyperactivity disorder in pursuit of diagnostic accuracy. Postgrad Med 1997;101:231-240.
27. Shaywitz BA, Fletcher JM, Shaywitz SE. Attention deficit hyperactivity disorder. Adv Pediatr 1997;44:331-367.
28. Barkley RA. Behavioral inhibition, sustained attention, and executive functions: constructing a unifying theory of ADHD. Psychol Bull 1997;121:65-94.
29. Houghton S, Douglas G, West J, et al. Differential patterns of executive function in children with attention-deficit hyperactivity disorder according to gender and subtype. J Child Neurol 1999;14:801-805.
30. Committee on Quality Improvement. American Academy of Pediatrics. Clinical practice guideline: diagnosis and evaluation of the child with attention-deficit/hyperactivity disorder. Pediatrics 2000;105:1158-1170.
Correspondence: 606 Haifleigh Street, PO Box 1186, Franklin, LA 70538, E-mail: [email protected].
- Most new cases of attention deficit– hyperactivity disorder (ADHD) are of the predominantly inattentive subtype. Research on the use of psychostimulants in these patients has shown a high rate of nonresponders.
- Although psychostimulants showed a short-term decrease in symptoms in students diagnosed with predominantly inattentive ADHD, they did not significantly improve grade-point averages.
To evaluate psychostimulants in the treatment of attention deficit–hyperactivity disorder (ADHD), predominantly inattentive subtype with coexisting academic impairment, a consecutive sample of 35 students from a private, primary care, office-based practice was followed for 1 year. All participants received psychostimulants, multimodal interventions, and treatment of comorbid disorders. Baseline mean grade-point averages (GPAs) from the preceding school year were compared with mean GPAs calculated at 1 year. Statistical analysis was by a paired samples t test.
Of 32 students who completed the study, 27 pupils’ GPAs did not improve (84.4%), while 5 pupils’ GPAs did improve (15.6%) (P=.176).
These findings call for additional research to further define predominantly inattentive ADHD in patients who present with inattention and academic concerns, and the role of stimulants in the treatment of this disorder.
Diagnostic criteria
In 1994, the 4th edition of the Diagnostic and Statistical Manual of Mental Disorders (DSM-IV) redefined the full syndrome of attention deficit hyperactivity disorder as combined ADHD, and introduced 2 new subtypes: predominantly inattentive and predominantly hyperactive-impulsive.1 Since publication, the majority of new cases identified by DSM-IV have been predominantly inattentive ADHD.2 Primary care physicians manage 86% of patients with ADHD.3
The clinical issues
The diagnostic criteria defining predominantly inattentive ADHD and the evidence supporting its inclusion as a separate subtype mainly involve students with academic impairment.4 Measuring the effect of pharmacologic intervention on ADHD and academic functioning is important.5,6
Research on the use of psychostimulants in patients with attention deficit disorder without hyperactivity as defined by the DSM-III7 showed a high rate of nonresponders and no evidence of long-term effects on academic achievement and learning.8-10 It is not clear whether these results apply to patients with predominantly inattentive ADHD.11 A recent National Institutes of Health Consensus Statement acknowledged the need for research that specifically targets predominantly inattentive ADHD and the effects of psychotropic therapy on school performance associated with the subtype.12
The following study was therefore designed to address these issues and determine the effect of psychostimulant treatment in patients with predominantly inattentive ADHD and academic impairment.
Methods
The 35 participants from the author’s rural, office-based practice, seen because of academic concerns and inattention, were consecutively diagnosed with predominantly inattentive ADHD based on information obtained from parents and teachers and application of the DSM-IV criteria.1 Clinical examinations ruled out physical or neurologic handicaps and uncorrected visual or hearing impairments ( Table 1).
Seven participants had academic impairment as the only comorbidity with predominantly inattentive ADHD. Twenty-eight had multiple comorbidities. These included anxiety symptoms (12), dysgraphia (12), psychosomatic complaints (11), social problems (6), communication disorders (4), learning disabilities (3), enuresis (3), and dysphoria (3). Six parents of the students had a history of anxiety–depression and 2 had generalized anxiety disorder.
Anxiety symptoms, psychosomatic complaints, dysphoria, and fine-motor dyspraxia were descriptive problems and not considered disorders using DSM-IV criteria.1 Learning disabilities and communication disorders were diagnosed by school psychologists and speech language pathologists, respectively. Social impairment was diagnosed using the asocial domain on the Conner’s Teacher Rating Scale13 and noting t scores of ≥1.5 standard deviations above the mean. Enuresis was diagnosed from information obtained from the history and physical exam. None of the cohort met DSM-IV criteria for oppositional defiant disorder or conduct disorder.1
The diagnostic protocol for ADHD and coexisting disorders used in this study was consistent with the recommendations endorsed by the American Academy of Pediatrics and the American Academy of Family Physicians.14
The baseline GPA for each participant was determined by taking the GPA from each report card of the preceding school year (either four 9-week report cards or six 6-week report cards) and calculating the mean GPA. The mean GPA after the school year following psychostimulant therapy was calculated for each student in the same manner and compared with his mean baseline GPA.
Participants were assessed every 6 to 9 weeks (when they brought their report cards to the office) for compliance and possible side effects of medication. Dosage adjustments were determined by using follow-up information obtained from parents and teachers, based on DSM-IV criteria for predominantly inattentive ADHD.
All patients, families, and school personnel received educational information on predominantly inattentive ADHD throughout the study. This is consistent with the practice parameters for ADHD from the American Academy of Child and Adolescent Psychiatry and a national perspective on ADHD treatment in primary care practice settings, which states: “providing information about symptoms of ADHD, areas of impairment, etiology, and principles of behavior management to parents and teachers constitutes sound clinical practice.”15 Statistical analysis was performed by a paired samples t test.
TABLE 1
Profile of participants in study of ADHD treatment and academic performance
| Participants | Nonparticipants | GPA not improved | GPA improved | |
|---|---|---|---|---|
| Gender | ||||
| Male | 23 | 2 | 18 | 5 |
| Female | 9 | 1 | 9 | 0 |
| Mean age(mo) | 125 ± 30 | 124 ± 9.2 | 127 ± 32 | 119 ± 10 |
| Race | ||||
| White | 28 | 3 | 24 | 4 |
| African American | 4 | 0 | 3 | 1 |
| Mean GPA | 2.26 ± .62 | 2.24 ± .54 | 2.26 ± .66 | 2.24 ± .42 |
| Family structure | ||||
| Both parents | 20 | 2 | 17 | 3 |
| Blended | 8 | 1 | 6 | 2 |
| Single parent | 4 | 0 | 4 | 0 |
| Parent psychopathology | 8 | 0 | 7 | 1 |
| Mean comorbidities | 1.53 | 1.67 | 1.59 | 1.20 |
| GPA, grade-point average | ||||
Results
Thirty-two of 35 students completed the study. Using a Mann-Whitney U test, no significant differences were found between these patients and those who did not complete the study (P=.80 for baseline GPA differences and P=.80 for age.)
According to follow-up information from parents and teachers, all participants exhibited short-term improvements in DSM-IV criteria for predominantly inattentive ADHD at some point during the study. Five pupils who completed the study had improved GPAs (15.6%), while the remaining 27 participants showed no change or decreased GPAs (84.4%).
Using students t tests to compare age, baseline GPAs, and number of comorbidities and χ2 for parental psychopathology, no significant differences were found between students with improved GPAs and those without improvement in their GPAs (P=.61 for age, P=.93 for baseline GPA differences, P=.53 for differences in comorbidities, and P=.70 for differences in parental psychopathology; see Table 1). Using a paired sample t test on data from all 32 participants showed that the overall treatment effect was not significant (P=.176; see Table 2).
TABLE 2
Grade-point averages at baseline and at the study’s conclusion*
| Student # | Baseline GPAs | Treatment GPAs | Change |
|---|---|---|---|
| 1 | 2.29 | 1.59 | –.70 |
| 2 | 3.00 | 2.40 | –.60 |
| 3 | 1.80 | 1.25 | –.55 |
| 4 | 2.50 | 1.96 | –.54 |
| 5 | 2.50 | 2.00 | –.50 |
| 6 | 1.80 | 1.50 | –.30 |
| 7 | 3.50 | 3.22 | –.28 |
| 8 | 2.57 | 2.35 | –.22 |
| 9 | 2.43 | 2.29 | –.14 |
| 10 | 3.00 | 2.86 | –.14 |
| 11 | 2.25 | 2.12 | –.13 |
| 12 | 2.57 | 2.45 | –.12 |
| 13 | 2.47 | 2.37 | –.10 |
| 14 | 2.71 | 2.61 | –.10 |
| 15 | 2.20 | 2.10 | –.10 |
| 16 | 2.27 | 2.20 | –.07 |
| 17 | 1.66 | 1.59 | –.07 |
| 18 | 1.87 | 1.80 | –.07 |
| 19 | 2.43 | 2.36 | –.07 |
| 20 | .71 | .67 | –.04 |
| 21 | 2.53 | 2.50 | –.03 |
| 22 | 2.10 | 2.07 | –.03 |
| 23 | .95 | .92 | –.03 |
| 24 | 2.53 | 2.52 | –.01 |
| 25 | 3.29 | 3.29 | 0 |
| 26 | .95 | .95 | 0 |
| 27 | 2.25 | 2.25 | 0 |
| 28 | 2.17 | 2.60 | +.43 |
| 29 | 2.66 | 3.09 | +.43 |
| 30 | 2.50 | 3.00 | +.50 |
| 31 | 1.57 | 2.12 | +.55 |
| 32 | 2.29 | 2.85 | +.56 |
| Mean ± SD | 2.26 ± .62 | 2.18 ± .65 | |
| *Post-treatment GPAs declined an average of .08 ± .32, 95% confidence interval, –.19 to .04. Paired samples test=1.385 (31 degrees of freedom) (P=.176). | |||
| GPA, grade-point average; SD, standard deviation | |||
Discussion
Psychostimulant therapy did not significantly improve the outcome measures (GPAs) in the cohort diagnosed with predominantly inattentive ADHD and academic impairment. Additional comorbidities were diagnosed and treated, but differences among participants were not statistically significant. Short-term decreases in DSM-IV symptoms of predominantly inattentive ADHD did not translate into academic gains.
Limitations to the present study include the small sample size and lack of a control group. Thus, the findings should be considered preliminary. GPAs are not standardized scores and are sensitive to varying influences. However, the American Academy of Pediatrics notes that even when standardized instruments are used to assess stimulant treatment for ADHD, there is “frequently no association with improvements in academic achievement.”16 Only short-term gains in academic efficiency have been reported.17
The average doses employed (methylphenidate 16.7 mg/d, dextroamphetamine 11 mg/d) were smaller than the starting doses used successfully in the Multimodal Treatment Study of Children with ADHD (methylphenidate 30.5 mg/d, dextroamphetamine 15.25 mg/d).18 However, this study excluded patients with predominantly inattentive ADHD.19 The lower dosages used in the present study are compatible with the practice parameters of the American Academy of Child and Adolescent Psychiatry for ADHD without hyperactivity.20
All participants in the study received educational assistance. Those students not attending resource classes qualified for accommodations and modifications under Section 504 of the Rehabilitation Act of 1973 guidelines. The small sample sizes precluded an analysis of the effects of these different educational interventions on GPAs. The input from multiple teachers and classroom settings could not be delineated. However, GPAs have the advantage of being readily accessible. In addition, the findings obtained from a community-based practice with patients and families in their natural environment support the study’s results.
How do the results of the present study correlate with the literature on predominantly inattentive ADHD, and how should clinicians incorporate these data into their evaluations of students who have inattention and academic concerns? Results from the Pediatric Research in Office Settings and the Ambulatory Sentinel Practice Network21 note that there is “a lack of standardization in the primary care evaluation of attentional problems.” Inattention is not unique to predominantly inattentive ADHD. Children and adolescents with language/learning disorders,22-24 anxiety/depression,25 and family dysfunction26 are also described as inattentive.
It is difficult to define accurately what is meant by inattention in predominantly inattentive ADHD because the psychological construct of attention is not the same as that being measured behaviorally in predominantly inattentive ADHD.27 In addition, the unifying theory on ADHD, which involves deficits in behavior inhibition and executive function, does not include predominantly inattentive ADHD in the definition.28,29 The American Academy of Pediatrics concludes that with ADHD the need “to develop more valid and precise diagnostic criteria is essential.”30
The present study should be considered an introductory step in the evaluation of psychostimulant treatment in predominantly inattentive ADHD. GPAs are easily obtained by busy clinicians and are time-efficient measures of treatment outcomes. Clearly, additional research, using larger groups and controls, is needed.
ACKNOWLEDGMENTS
The author thanks Glenn N. Jones, PhD, for his assistance with the statistical analysis.
1. American Psychiatric Association. Diagnostic and Statistical Manual of Mental Disorders. 4th ed. Washington, DC: American Psychiatric Association; 1994.
2. Gaub M, Carlson CL. Behavioral characteristics of DSM-IV ADHD subtypes in a school-based population. J Abnorm Child Psychol 1997;25:103-111.
3. Safer DJ. Attention deficit hyperactivity disorder: pinning down the diagnosis, implementing therapy. Consultant 1996;Mar:533-545.
4. Lahey BB, Applegate B, McBurnett K, et al. DSM-IV field trials for attention deficit hyperactivity disorder in children and adolescents. Am J Psychiatry 1994;151:1673-1685.
5. Rapport MD, Denney C, DuPaul GJ, Gardner MJ. Attention deficit disorder and methylphenidate: normalization rates, clinical effectiveness, and response prediction in 76 children. J Am Acad Child Adolesc Psychiatry 1994;33:882-893.
6. Weiss M, Jain U, Garland J. Clinical suggestions for management of stimulant treatment in adolescents. Can J Psychiatry 2000;45:717-723.
7. American Psychiatric Association. Diagnostic and Statistical Manual of Mental Disorders. 3rd ed. Washington, DC: American Psychiatric Association; 1980.
8. Cantwell DP, Baker L. Attention deficit disorder with and without hyperactivity: a review and comparison of matched groups. J Am Acad Child Adolesc Psychiatry 1992;31:432-438.
9. Barkley RA, DuPaul GJ, McMurray MB. Attention deficit disorder with and without hyperactivity: clinical response to three dose levels of methylphenidate. Pediatrics 1991;87:519-531.
10. Safer DJ. Major treatment considerations for attention-deficit hyperactivity disorder. Curr Probl Pediatr 1995;25:137-143.
11. Morgan AE, Hynd GW, Riccio CA, Hall J. Validity of DSM-IV ADHD predominantly inattentive and combined types: relationship to previous DSM diagnoses/subtype differences. J Am Acad Child Adolesc Psychiatry 1996;35:325-333.
12. National Institute of Health Consensus Development Conference Statement: diagnosis and Treatment of Attention-Deficit/Hyperactivity Disorder (ADHD). J Am Acad Child Adolesc Psychiatry 2000;39:182-193.
13. Conners CK. Conner’s Rating Scales. North Tonawanda, NY: Multi-Health Systems, Inc.; 1990.
14. Herrerias CT, Perrin JM, Stein MT. The child with ADHD: using the AAP clinical practice guideline. Am Fam Physician 2001;63:1803-1810.
15. Hoagwood K, Jensen PS, Feil M, Vitiello B, Bhatara VS. Medication management of stimulants in pediatric practice settings: a national perspective. J Dev Behav Pediatr 2000;21:322-331.
16. Committee on Quality Improvement. American Academy of Pediatrics. Clinical practice guideline: treatment of the school-aged child with attention-deficit/hyperactivity disorder. Pediatrics 2001;108:1033-1044.
17. Bennett FC, Brown RT, Craver J, Anderson D. Stimulant medication for the child with attention-deficit/hyperactivity disorder. Pediatr Clin N Am 1999;46:929-944.
18. The MTA Cooperative Group. A 14-month randomized clinical trial of treatment strategies for attention-deficit/hyperactivity disorder. Arch Gen Psychiatry 1999;56:1073-1086.
19. Arnold LE, Abikoff HB, Cantwell DP, et al. National Institute of Mental Health collaborative multimodal treatment study of children with ADHD (the MTA). Arch Gen Psychiatry 1997;54:865-870.
20. Dulcan MK, Benson RS. Summary of the practice parameters for the assessment and treatment of children, adolescents, and adults with ADHD. J Am Acad Child Adolesc Psychiatry 1997;36:1311-1317.
21. Wasserman RC, Kelleher KJ, Bocian A, et al. Identification of attentional and hyperactivity problems in primary care: a report from pediatric research in office settings and the ambulatory sentinel practice network. Pediatrics 1999;103:e38.-
22. Wolraich ML, Hannah JN, Baumgaertel A, Feurer ID. Examination of DSM-IV criteria for attention deficit/hyperactivity disorder in a county-wide sample. J Devel Behav Pediatr 1998;19:162-168.
23. Rielly NE, Cunningham CE, Richards JE, Elard H, Mahoney WJ. Detecting attention deficit hyperactivity disorder in a communications clinic; diagnostic utility of the Gordon Diagnostic System. J Clin Exper Neuropsychol 1999;21:685-700.
24. Beichman JH, Cantwell DP, Forness SR, Kavale KA, Kauffman JM. Practice parameters for the assessment and treatment of children and adolescents with language and learning disorders. J Am Acad Child Adolesc Psychiatry 1998;37(suppl 10):46s-62s.
25. Zametkin AD, Ernst M. Problems in the management of attention-deficit-hyperactivity disorder. N Engl J Med 1999;340:40-46.
26. Schneider SC, Tan G. Attention-deficit hyperactivity disorder in pursuit of diagnostic accuracy. Postgrad Med 1997;101:231-240.
27. Shaywitz BA, Fletcher JM, Shaywitz SE. Attention deficit hyperactivity disorder. Adv Pediatr 1997;44:331-367.
28. Barkley RA. Behavioral inhibition, sustained attention, and executive functions: constructing a unifying theory of ADHD. Psychol Bull 1997;121:65-94.
29. Houghton S, Douglas G, West J, et al. Differential patterns of executive function in children with attention-deficit hyperactivity disorder according to gender and subtype. J Child Neurol 1999;14:801-805.
30. Committee on Quality Improvement. American Academy of Pediatrics. Clinical practice guideline: diagnosis and evaluation of the child with attention-deficit/hyperactivity disorder. Pediatrics 2000;105:1158-1170.
Correspondence: 606 Haifleigh Street, PO Box 1186, Franklin, LA 70538, E-mail: [email protected].
Reducing emergency department visits among high-using patients
- Intervention using a real-time database system was accepted by physicians and reduced high-cost encounters.
- The risk of a high-cost encounter was significantly greater for the minimal intervention than for the moderate or maximal intervention groups.
- The probability of an emergency department visit was significantly reduced for minimal compared with moderate and maximal intervention. The risk for emergency department events was the same for the moderate and maximal intervention groups.
- Moderate intervention seems the most cost-effective because of reductions achieved with minimal staff involvement.
With escalating health care costs, primary care physicians need a simple way to monitor and modify the highusing behavior of their managed care patients. Several studies have shown that <20% of a primary care physician’s patient load will use 90% of the expended resources each year.1 Although many of these expenditures may be unavoidable due to acute injury or illness, many of these high-users are patients with chronic illnesses.
Most efforts to contain costs have focused on developing clinical care protocols for expensive illnesses (ie, coronary heart failure, diabetes)2 to reduce the need for inpatient management. Also, health maintenance organizations (HMOs) have developed incentive plans for physicians who hold down costs by reducing use of high-cost services.3 Several studies have shown that when realtime databases are used and available for feedback to physicians, quality improves and cost is contained.4,5
Other than descriptions of disease-focused case management, there is little information in the literature on methods primary care physicians can use themselves to monitor patients’ use patterns. Our recent study showed that physicians are often unaware of the activity of some of their highest-using patients and miss the opportunity to intervene.6
We conducted a randomized prospective trial comparing 3 different interventions that primary care physicians can use to monitor and modify their patients’ resource use patterns. The goal of this study was to find a relatively simple method that would be accepted by primary care physicians to lower high-cost encounters among their highest users of medical services.
Methods
Study sample
Sixteen primary care physicians—employed at least 5 years at 4 different satellite clinics of a large multispecialty clinic—were randomly divided into a 4-member control group and three 4-member intervention groups. Two-year retrospective financial data of each physician’s patient load were analyzed to determine which patients had been among the top 10% in resource use each of the last 2 years.
From the resulting group of 3200 patients, 100 patients of each primary care physician were chosen randomly to be followed for 1 year, along with their primary care physician in the 4-member groups. All 1600 cases were available for analysis, maintaining health plan enrollment throughout the study period. Fourteen patients died during the study period. Health plan financial data and clinic visit data were used. Table 1 shows physician and patient demographics.
TABLE 1
Physician and patient demographics
| Physicians | n=16 |
|---|---|
| Discipline | |
| Family medicine | n=8 |
| Internal medicine | n=8 |
| Average time in practice | 12 years |
| Average time at current site | 8.3 years |
| Practice type | |
| Ambulatory only | n=8 |
| Ambulatory and inpatient | n=8 |
| Patients | n=1600 |
| M/F (%) | 37%/63% |
| Average age | 62 years |
| Average time enrolled in health plan | 7.2 years |
Study design
Patients’ health care use for the study period was tracked through the information system of the multispecialty clinic. It was confirmed by reviewing charge data from the patients’ HMO billing record.
Data were analyzed on a quarterly basis, and then compiled for an annual figure at the end of the study. At the end of the study, all physicians in the 3 intervention groups (n=12) were surveyed about their acceptance of incorporating moderate or maximal intervention into their clinical practice. This study was approved by the Institutional Review Board.
The control group was unaware of the study and had no contact with study personnel until the study was completed. The 3 intervention groups were divided into minimal, moderate, and maximal intervention.
Minimal intervention. Primary care physicians received a list of 100 of their patients designated as high users with identifying information. General suggestions were given to primary care physicians on how they could monitor/modify high users’ behavior: make regular appointments, have the nurse call for follow-up after an emergency department visit or hospital admission.
Moderate intervention. Primary care physicians received the initial list and quarterly updates of patients on their lists who had an emergency department visit or inpatient admission or did not follow-up with them in the clinic within 2 weeks of the high-cost encounter.
Maximal intervention. Intervention in the maximal group was the same as for moderate intervention, except that patients who did not make a follow-up visit within 2 weeks were contacted by a case manager to determine barriers to access and to facilitate a follow-up visit with the primary care physician. Where appropriate, a follow-up visit was made with the primary care physician by the case manager.
Outcome measures
Emergency department visits and inpatient admissions were designated as high-cost encounters because of their potential for high use, accounting for a significant portion of non-surgical cost for HMO members, and a high likelihood of lack of follow-up after the encounter. Review of HMO financial data revealed these to be members’ highest (nonsurgical) costs. A calculated variable: A high-cost encounter was calculated by determining a binary outcome variable derived by aggregating emergency department and inpatient visits.
Data analysis
The study groups were compared by logistic regression. The 95% confidence intervals (CIs) accompanying the odds ratios (ORs) are the tests of significance. If the range of the CI includes the value 1, the difference between groups being compared is not statistically significant (α=.05).
Results
Table 2 shows the OR of a high-cost encounter (emergency department visit or inpatient admission) for each intervention group. The unit of measure for this table is patient-months.7,8 All ORs are read from left to right. For example, the minimal intervention group is 2.19 times more likely to have an emergency department event than maximal group.
The risk of a high-cost encounter was significantly greater for the minimal intervention than for the moderate or maximal intervention groups. The moderate group had a statistically significant greater risk of a high-cost encounter than the maximal intervention group, but the observed magnitude of the risk was small and the lower limit of the CI is very close to 1. The clinical importance of this finding may be questioned in light of the cost effectiveness of the maximal intervention.
The probability of an emergency department visit was significantly reduced for minimal compared with moderate and maximal intervention. The risk for emergency department events was the same for the moderate and maximal intervention groups.
The minimal group was more likely to have an admission than both the moderate and maximal intervention groups. The maximal group was also less likely to have an admission than the moderate intervention group. The moderate intervention appears to be the most costeffective because of reductions achieved with minimal staff involvement.
TABLE 2
Odds ratio of high-cost encounter* for each intervention group
| High-cost encounters (patient-months) | Emergency department use | Inpatient admissions | ||||
|---|---|---|---|---|---|---|
| Comparison | OR | 95% CI | OR | 95% CI | OR | 95% CI |
| Control vs minimal | 1.32 | (1.20–1.60) | 1.32 | (1.20–1.60) | 1.60 | (1.42–2.43) |
| Control vs moderate | 1.83 | (1.56–2.14) | 2.46 | (1.80–3.38) | 2.64 | (1.92–3.64) |
| Control vs maximal | 2.31 | (1.95–2.73) | 2.91 | (2.12–4.01) | 4.37 | (3.15–6.06) |
| Minimal vs moderate | 1.39 | (1.19–1.61) | 1.85 | (1.39–2.46) | 1.64 | (1.24–2.17) |
| Minimal vs maximum | 1.75 | (1.49–2.00) | 2.19 | (1.64–2.92) | 2.71 | (2.02–3.62) |
| Moderate vs maximum | 1.26 | (1.06–1.50) | 1.18† | (0.88–1.59) | 1.65 | (1.23–2.21) |
| *High-cost encounter defined as emergency department visit or inpatient admission. | ||||||
| †Nonsignificant. | ||||||
| OR, odds ratio; CI, confidence interval | ||||||
Physician acceptance
All physicians in the 3 intervention groups were surveyed after study completion. Ninety percent agreed with the statement “I will use the moderate intervention now that it is shown to reduce utilization.”
Maximal intervention was thought to be less useful because many patients contacted were under the care of specialists and had no intention of returning to the primary care physician for care. Most of these patients did not require the use of the care manager, so the primary care physicians considered this extra expense as unnecessary.
Discussion
Our results appear to support the contention that primary care physicians can use relatively simple methods to monitor and modify the highuse behavior of members of their managed care panels. By designating frequent users of medical services as “high risk” for future utilization, primary care physicians can track these patients in a proactive fashion using a real-time database system.
At least in this relatively large, vertically integrated, multispecialty health system, emergency department and inpatient admissions were significantly reduced using the database. The moderate intervention appeared to be relatively well accepted by the primary care physicians and able to be instituted within their practice without much difficulty.
If adopted by larger health care systems, this method should result in considerable savings. Other studies in different health care settings are needed before this method can be recommended on a wider basis.
1. Halpert AP, Pearson SD, LeWine HE, Mckean SC. The impact of an inpatient physician program on quality, utilization, and satisfaction. Am J Manag Care 2000;6:549-555.
2. Wolff M, Bower DJ, Marbella AM, Casanova JE. US family physicians’ experiences with practice guidelines. Fam Med 1998;30:117-121.
3. Zierler BK, Marcus-Smith MS, Cheadle A, et al. Effect of compensation method on the behavior of primary care physicians in managed care organizations: evidence from interviews with physicians and medical leaders in Washington State. Am J Manag Care 1998;4:209-220.
4. Realtime data, aggressive intervention slash diabetes costs and increase satisfaction. Data Strateg Benchmarks 1998;2:71-74.
5. Ignagni K. Health plans will use new tools to help physicians practice better. Manag Care 1999;8:27-28, 31.
6. Brandon WR, Chambers R. The validity and usage of resource utilization data among a group of primary care physicians. Am J Manag Care 1997;3:1369-1376.
7. Rothman KJ, Greenland S, eds. Measures of Disease Frequency Modern Epidemiology. 2nd ed. Philadelphia, Pa: Lippincott, Williams & Wilkins, 1998.
8. Sergeant PT, Blackstone EH. Closing the loop: optimizing physicians’ operational and strategic behavior. Ann Thorac Surg 1999;68:362-366.
- Intervention using a real-time database system was accepted by physicians and reduced high-cost encounters.
- The risk of a high-cost encounter was significantly greater for the minimal intervention than for the moderate or maximal intervention groups.
- The probability of an emergency department visit was significantly reduced for minimal compared with moderate and maximal intervention. The risk for emergency department events was the same for the moderate and maximal intervention groups.
- Moderate intervention seems the most cost-effective because of reductions achieved with minimal staff involvement.
With escalating health care costs, primary care physicians need a simple way to monitor and modify the highusing behavior of their managed care patients. Several studies have shown that <20% of a primary care physician’s patient load will use 90% of the expended resources each year.1 Although many of these expenditures may be unavoidable due to acute injury or illness, many of these high-users are patients with chronic illnesses.
Most efforts to contain costs have focused on developing clinical care protocols for expensive illnesses (ie, coronary heart failure, diabetes)2 to reduce the need for inpatient management. Also, health maintenance organizations (HMOs) have developed incentive plans for physicians who hold down costs by reducing use of high-cost services.3 Several studies have shown that when realtime databases are used and available for feedback to physicians, quality improves and cost is contained.4,5
Other than descriptions of disease-focused case management, there is little information in the literature on methods primary care physicians can use themselves to monitor patients’ use patterns. Our recent study showed that physicians are often unaware of the activity of some of their highest-using patients and miss the opportunity to intervene.6
We conducted a randomized prospective trial comparing 3 different interventions that primary care physicians can use to monitor and modify their patients’ resource use patterns. The goal of this study was to find a relatively simple method that would be accepted by primary care physicians to lower high-cost encounters among their highest users of medical services.
Methods
Study sample
Sixteen primary care physicians—employed at least 5 years at 4 different satellite clinics of a large multispecialty clinic—were randomly divided into a 4-member control group and three 4-member intervention groups. Two-year retrospective financial data of each physician’s patient load were analyzed to determine which patients had been among the top 10% in resource use each of the last 2 years.
From the resulting group of 3200 patients, 100 patients of each primary care physician were chosen randomly to be followed for 1 year, along with their primary care physician in the 4-member groups. All 1600 cases were available for analysis, maintaining health plan enrollment throughout the study period. Fourteen patients died during the study period. Health plan financial data and clinic visit data were used. Table 1 shows physician and patient demographics.
TABLE 1
Physician and patient demographics
| Physicians | n=16 |
|---|---|
| Discipline | |
| Family medicine | n=8 |
| Internal medicine | n=8 |
| Average time in practice | 12 years |
| Average time at current site | 8.3 years |
| Practice type | |
| Ambulatory only | n=8 |
| Ambulatory and inpatient | n=8 |
| Patients | n=1600 |
| M/F (%) | 37%/63% |
| Average age | 62 years |
| Average time enrolled in health plan | 7.2 years |
Study design
Patients’ health care use for the study period was tracked through the information system of the multispecialty clinic. It was confirmed by reviewing charge data from the patients’ HMO billing record.
Data were analyzed on a quarterly basis, and then compiled for an annual figure at the end of the study. At the end of the study, all physicians in the 3 intervention groups (n=12) were surveyed about their acceptance of incorporating moderate or maximal intervention into their clinical practice. This study was approved by the Institutional Review Board.
The control group was unaware of the study and had no contact with study personnel until the study was completed. The 3 intervention groups were divided into minimal, moderate, and maximal intervention.
Minimal intervention. Primary care physicians received a list of 100 of their patients designated as high users with identifying information. General suggestions were given to primary care physicians on how they could monitor/modify high users’ behavior: make regular appointments, have the nurse call for follow-up after an emergency department visit or hospital admission.
Moderate intervention. Primary care physicians received the initial list and quarterly updates of patients on their lists who had an emergency department visit or inpatient admission or did not follow-up with them in the clinic within 2 weeks of the high-cost encounter.
Maximal intervention. Intervention in the maximal group was the same as for moderate intervention, except that patients who did not make a follow-up visit within 2 weeks were contacted by a case manager to determine barriers to access and to facilitate a follow-up visit with the primary care physician. Where appropriate, a follow-up visit was made with the primary care physician by the case manager.
Outcome measures
Emergency department visits and inpatient admissions were designated as high-cost encounters because of their potential for high use, accounting for a significant portion of non-surgical cost for HMO members, and a high likelihood of lack of follow-up after the encounter. Review of HMO financial data revealed these to be members’ highest (nonsurgical) costs. A calculated variable: A high-cost encounter was calculated by determining a binary outcome variable derived by aggregating emergency department and inpatient visits.
Data analysis
The study groups were compared by logistic regression. The 95% confidence intervals (CIs) accompanying the odds ratios (ORs) are the tests of significance. If the range of the CI includes the value 1, the difference between groups being compared is not statistically significant (α=.05).
Results
Table 2 shows the OR of a high-cost encounter (emergency department visit or inpatient admission) for each intervention group. The unit of measure for this table is patient-months.7,8 All ORs are read from left to right. For example, the minimal intervention group is 2.19 times more likely to have an emergency department event than maximal group.
The risk of a high-cost encounter was significantly greater for the minimal intervention than for the moderate or maximal intervention groups. The moderate group had a statistically significant greater risk of a high-cost encounter than the maximal intervention group, but the observed magnitude of the risk was small and the lower limit of the CI is very close to 1. The clinical importance of this finding may be questioned in light of the cost effectiveness of the maximal intervention.
The probability of an emergency department visit was significantly reduced for minimal compared with moderate and maximal intervention. The risk for emergency department events was the same for the moderate and maximal intervention groups.
The minimal group was more likely to have an admission than both the moderate and maximal intervention groups. The maximal group was also less likely to have an admission than the moderate intervention group. The moderate intervention appears to be the most costeffective because of reductions achieved with minimal staff involvement.
TABLE 2
Odds ratio of high-cost encounter* for each intervention group
| High-cost encounters (patient-months) | Emergency department use | Inpatient admissions | ||||
|---|---|---|---|---|---|---|
| Comparison | OR | 95% CI | OR | 95% CI | OR | 95% CI |
| Control vs minimal | 1.32 | (1.20–1.60) | 1.32 | (1.20–1.60) | 1.60 | (1.42–2.43) |
| Control vs moderate | 1.83 | (1.56–2.14) | 2.46 | (1.80–3.38) | 2.64 | (1.92–3.64) |
| Control vs maximal | 2.31 | (1.95–2.73) | 2.91 | (2.12–4.01) | 4.37 | (3.15–6.06) |
| Minimal vs moderate | 1.39 | (1.19–1.61) | 1.85 | (1.39–2.46) | 1.64 | (1.24–2.17) |
| Minimal vs maximum | 1.75 | (1.49–2.00) | 2.19 | (1.64–2.92) | 2.71 | (2.02–3.62) |
| Moderate vs maximum | 1.26 | (1.06–1.50) | 1.18† | (0.88–1.59) | 1.65 | (1.23–2.21) |
| *High-cost encounter defined as emergency department visit or inpatient admission. | ||||||
| †Nonsignificant. | ||||||
| OR, odds ratio; CI, confidence interval | ||||||
Physician acceptance
All physicians in the 3 intervention groups were surveyed after study completion. Ninety percent agreed with the statement “I will use the moderate intervention now that it is shown to reduce utilization.”
Maximal intervention was thought to be less useful because many patients contacted were under the care of specialists and had no intention of returning to the primary care physician for care. Most of these patients did not require the use of the care manager, so the primary care physicians considered this extra expense as unnecessary.
Discussion
Our results appear to support the contention that primary care physicians can use relatively simple methods to monitor and modify the highuse behavior of members of their managed care panels. By designating frequent users of medical services as “high risk” for future utilization, primary care physicians can track these patients in a proactive fashion using a real-time database system.
At least in this relatively large, vertically integrated, multispecialty health system, emergency department and inpatient admissions were significantly reduced using the database. The moderate intervention appeared to be relatively well accepted by the primary care physicians and able to be instituted within their practice without much difficulty.
If adopted by larger health care systems, this method should result in considerable savings. Other studies in different health care settings are needed before this method can be recommended on a wider basis.
1. Halpert AP, Pearson SD, LeWine HE, Mckean SC. The impact of an inpatient physician program on quality, utilization, and satisfaction. Am J Manag Care 2000;6:549-555.
2. Wolff M, Bower DJ, Marbella AM, Casanova JE. US family physicians’ experiences with practice guidelines. Fam Med 1998;30:117-121.
3. Zierler BK, Marcus-Smith MS, Cheadle A, et al. Effect of compensation method on the behavior of primary care physicians in managed care organizations: evidence from interviews with physicians and medical leaders in Washington State. Am J Manag Care 1998;4:209-220.
4. Realtime data, aggressive intervention slash diabetes costs and increase satisfaction. Data Strateg Benchmarks 1998;2:71-74.
5. Ignagni K. Health plans will use new tools to help physicians practice better. Manag Care 1999;8:27-28, 31.
6. Brandon WR, Chambers R. The validity and usage of resource utilization data among a group of primary care physicians. Am J Manag Care 1997;3:1369-1376.
7. Rothman KJ, Greenland S, eds. Measures of Disease Frequency Modern Epidemiology. 2nd ed. Philadelphia, Pa: Lippincott, Williams & Wilkins, 1998.
8. Sergeant PT, Blackstone EH. Closing the loop: optimizing physicians’ operational and strategic behavior. Ann Thorac Surg 1999;68:362-366.