User login
Clinical Impact of Initiation of U-500 Insulin vs Continuation of U-100 Insulin in Subjects With Diabetes
More than 70% of Americans are overweight or obese and 1 in 10 has type 2 diabetes mellitus (T2DM). In the last 20 years, the prevalence of obesity and DM has each increased drastically according to the Centers for Disease Control and Prevention.1,2 Thus, an increase in severe insulin-resistant DM is predicted. Severe insulin resistance occurs when insulin doses exceed 200 units per day or 2 units/kg per day.3-5 Treating this condition demands large volumes of U-100 insulin and a high frequency of injections (usually 4-7 per day), which can lead to reduced patient adherence.8-10 Likewise, large injected volumes are more painful and can lead to altered absorption.3,9-11
U-500 insulin (500 units/mL) is 5 times more concentrated than U-100 insulin and has advantages in the management of severe insulin-resistant DM.11-13 Its pharmacokinetic profile is unique, for the clinical effect can last for up to 24 hours.4-6 U-500 can replace basal-bolus and other complex insulin regimens, offering convenient, effective glycemic control with 2 or 3 injections per day.11,14-20 U-500 can also improve the quality of life and adherence compared with formulations that require more frequent injections.7,14,21 Historically, only exceptional or “special” cases were treated with U-500, but demand for concentrated insulins has increased in the last decade as clinicians adjust their care for this growing patient population.17
The purpose of this study was to determine whether a population of subjects with severe insulin-resistant T2DM would benefit from the use of U-500 vs U-100 insulin regimens. The hypothesis was that this population would obtain equal or better glycemic control while achieving improved adherence. Other studies have demonstrated that U-500 yields improvements in glycemic control but also potentially increases hypoglycemic episodes.15-18,22-24 To our knowledge, this study is the first to evaluate the clinical outcomes of subjects with severe insulin-resistant T2DM who changed from U-100 to U-500 vs subjects who remained on high-dose U-100 insulin.
Methods
This was a single-site, retrospective chart review of subjects with T2DM who attended the endocrinology specialty clinic at the James A. Haley Veterans’ Hospital (JAHVA) in Tampa, Florida, between July 2002 and June 2011. The study included a group of subjects using U-500 insulin and a comparison group using U-100 insulin. The study was approved by the JAHVA Research & Development Committee and by the University of South Florida Institutional Review Board.
Inclusion criteria included diagnosis of T2DM, body mass index (BMI) of more than 30, use of U-500 insulin, or > 200 units daily of U-100 insulin. Exclusion criteria included hypoglycemia unawareness, type 1 DM, and use of an insulin pump. A total of 142 subjects met the inclusion criteria (68 in the U-500 group and 74 in the U-100 group).
All study subjects had at least 1 DM education session. U-500 subjects used insulin vials and 1-mL volumetric hypodermal syringes. All U-500 prescriptions were issued electronically in units and volume (U-500 insulin was available exclusively in vials during the time frame from which data were collected). Subjects in the U-100 group used insulin vials or pen devices. Laboratory studies were processed in house by the institution using high-pressure liquid chromatography to determine hemoglobin A1C (Hb A1C) levels. All study subjects required at least 2 Hb A1C measurements over the observed 12 months for inclusion.
Transition to U-500 Insulin
U-500 transition was considered routinely and presented as an option for patients requiring > 200 units of insulin daily. The transition criteria included adherence to medications, follow-up appointments, and glucose monitoring recommendations, and ability to learn and apply insulin self-adjustment instructions. All subjects were given an additional U-500 insulin education session before transition. The endocrinologist calculated all starting doses by reducing the total daily dose by 20%.
Data Collection
Data were collected using the automatic data mining tools within the JAHVA Computerized Patient Record System and confirmed individually by clinical staff. Demographic data included age, race, and sex. Other parameters were weight; BMI; Hb A1C; estimated glomerular filtration rate (eGFR); duration of DM; use of metformin and other oral agents; total daily insulin dose; number of daily injections; prior history of atherosclerotic cardiovascular disease (ASCVD), including coronary artery disease (CAD), cerebrovascular accident (CVA), or peripheral vascular disease (PVD); occurrence of severe hypoglycemia (symptomatic hypoglycemia requiring treatment assistance from another individual) and of new cardiovascular events, classified as CAD, CVA, or PVD.
For the U-500 group, data were collected and analyzed for the 3 months before (baseline) and the 12 months after the initiation of concentrated insulin. For the U-100 group, data were collected and analyzed for the comparable 3 months before (baseline) and the 12 months after the first clinic visit in which the subject started using more than 200 units per day of U-100. Frequency of follow-up visits was individualized according to clinical needs.
Clinical Endpoints
Primary outcomes included changes in Hb A1C from baseline to the following 12 months, and the occurrence of severe hypoglycemia. Secondary outcomes included the occurrence of new ASCVD events during the study, and changes in weight, BMI, and number of injections.
Statistical Analysis
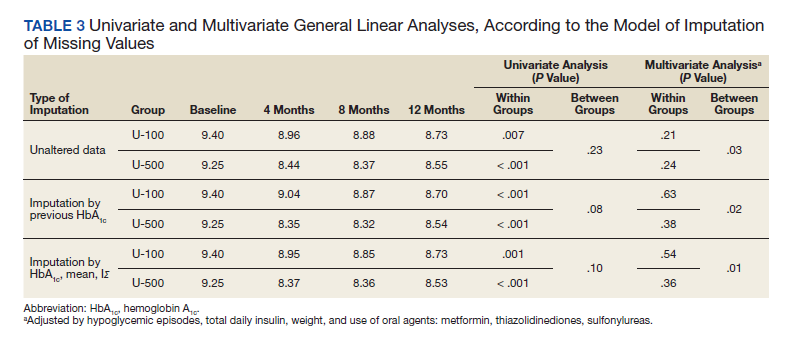
The primary and secondary outcomes were assessed through univariate and multivariate general linear models. Multivariate models were used to compare differences in the variation of Hb A1C over time. Data were incomplete for the Hb A1C in 27 subjects, 6% of the dataset (Each subject had more than one variable or observation). Therefore, a multiple imputation was used to account for the incompleteness on Hb A1C (value substitutions by the mean and by the prior Hb A1C and models were balanced against the unaltered data). A P value of ≤ .05 was used to determine statistical significance. The statistical analyses were performed using IBM SPSS Statistics 21.
Results
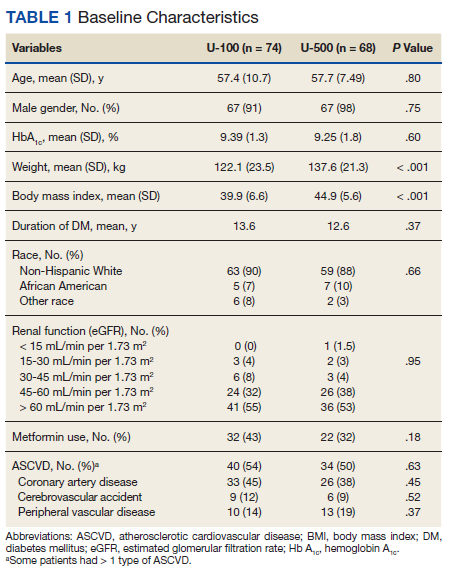
Most patients were male (94%) of white race (86%), with a mean age of 57 years and comparable duration of DM (Table 1). Demographics were balanced between the groups, except for weight and BMI, both higher in the U-500 group (P < .001). Use of oral antidiabetic agents was not significantly different between groups, nor were comorbid conditions, with nearly 50% of subjects in each group affected by CKD and ASCVD, of which CAD was the most common (approximately 40% of both groups). Only about one-third of subjects used metformin and/or other oral agents, likely due to the high prevalence of CKD (contraindicating metformin) and high insulin requirements (due to correlation with β cell failure). A subgroup analysis of subjects on metformin did not demonstrate significant differences in risk of severe hypoglycemia or in Hb A1C levels (data not shown).
Both groups had similar initial Hb A1C baselines (> 9%) and both improved glycemic control during the study period. However, the Hb A1C reduction was greater in the U-500 group (P= .034), 0.84% vs 0.56% for U-100 and the between-groups difference was 0.4%. (Figure 1, Tables 2 and 3).
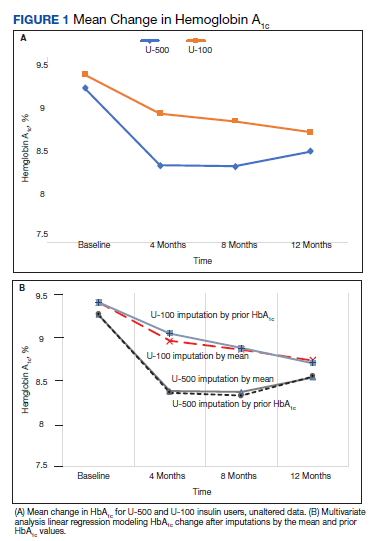
The univariate general linear model shows a statistically significant difference in the levels of Hb A1C within each treatment group, regardless of the imputation strategy. However, the differences were not significant when comparing postintervention Hb A1C means between groups with unaltered data (P = .23), because the U-500 group Hb A1C improvement gap narrowed at the end of study. In the multivariate analysis, irrespective of imputation method, the differences in Hb A1C between group treated with U-100 and U-500 were statistically significant (Table 3).
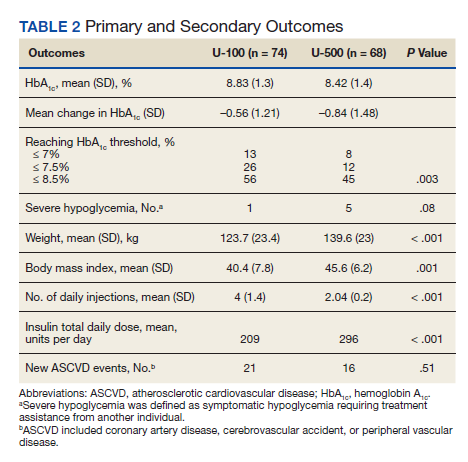
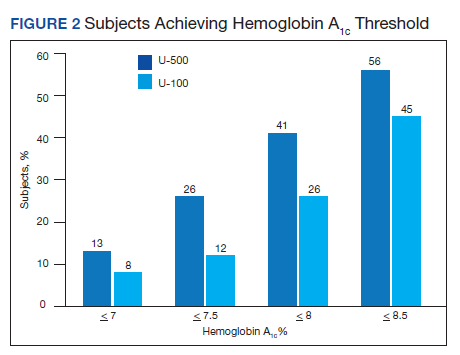
Overall, more subjects in the U-500 group than in the U-100 group achieved Hb A1C levels < 8.5% (56% vs 46%, respectively, P = .003) and the proportion of subjects achieving Hb A1C levels < 7.5% doubled that of the U-100 group (26% vs 12%; Figure 2). Five subjects in the U-500 group experienced severe hypoglycemia, compared with 1 in the U-100 group (P = .08). The total daily insulin dose was significantly higher in the U-500 group (296 units daily) than in the U-100 group (209 units daily) (P < .001) (Table 2). Baseline weight and BMI differences were also significant for the U-500 and U-100 groups (P < .001). Weight gain of approximately 2 kg occurred in both groups, a change that was not statistically significant (P = .79)
There were 21 new ASCVD events in the U-100 and 16 in the U-500 group (P = .51) and there were no statistically significant differences in the incidence of new CAD, PVD or CVA events. The U-500 group required significantly fewer injections than U-100 insulin users (2 vs 4; P < .001).
Discussion
The purpose of the study was to compare subjects with obesity and T2DM using U-500 concentrated insulin with similarly matched subjects using U-100 insulin. Available studies using U-500 insulin, including prospective trials, have reported the experience after transitioning patients who “failed” U-100 regimens.13-16,18,21-24 This failure is a relative and transient condition that, in theory, could be improved with medical intervention and lifestyle changes. Such changes cannot be easily quantified in a clinical trial or retrospective study without a control group. This study was an attempt to fill this knowledge gap.
The U-500 intervention resulted in a 0.8% overall reduction in Hb A1C and a significant 0.4% reduction compared to subjects using U-100. While both groups had improvement in Hb A1C , U-500 was associated with superior reductions in Hb A1C . This finding confirms prior assertions that U-500, compared with U-100, is associated with larger Hb A1C improvement.14-16
The preintervention and postintervention Hb A1C means were > 8% in both groups. This finding suggests that lowering Hb A1C is challenging, similar to published results demonstrating that Hb A1C levels < 7% are achieved by fewer than one-third of U-500 users.16-18 The explanation for this finding remains elusive, due to the methodologic limitations of a retrospective analysis. A possible explanation is the high prevalence of CKD and ASCVD among the study population, conditions which, according to guidelines justify less aggressive glycemic control efforts.25 Multiple prior studies using retrospective data8,13-16 and 2 prospective trials18,22 demonstrated similar Hb A1C reductions after failure of U-100 regimens.
In this study, U-500 resulted in a nominal increase in the risk of severe hypoglycemic episodes. A detailed review of the events found that most of these patients had preestablished CKD and ASCVD, and half of the subjects with sever hypoglycemic episodes had new vascular events during the study (Appendix). These findings suggest a possible correlation between CKD and ASCVD complications and the risk of severe hypoglycemic events. Pharmacokinetic profiles for U-500 have not been studied in subjects with CKD, but the clinical effect of CKD is likely prolonged by the expected reduction in insulin clearance. Similarly, the frailty associated with preexisting ASCVD, or the related polypharmacy, could be factors increasing the risk of hypoglycemia and deserve further study.
Most of the U-500 subjects used it twice daily in this study, which could have contributed to the higher hypoglycemia rate. In a prospective randomized trial Hood and colleagues reported a rate of symptomatic hypoglycemia exceeding 90% in the 2 study groups, and 8 subjects (of 325 total) had severe hypoglycemia during the 6-month observation. The group assigned to 2 daily injections had a significantly higher rate of hypoglycemic events compared with a group that had 3 injections per day.18 Additional studies are required to ascertain whether U-500, compared with specific U-100 regimens (basal-bolus vs premixed; human vs insulin analogs), results in a higher risk of severe hypoglycemia.
This study also investigated the incidence of new cardiovascular events, and no difference was found between the 2 groups. A longer observation would be required to better assess whether U-500 therapy can reduce the incidence of microvascular and macrovascular complications. The similar incidence of complications is further evidence of the similarity between the 2 studied groups. It was also reassuring to find that weight gains were small and nearly identical in both insulin groups.
Strengths and Limitations
This study has several limitations. Data about hospitalizations for congestive heart failure, amputations, progression of diabetic retinopathy, neuropathy, and nephropathy were not collected for this analysis. As both groups of subjects were relatively small, statistical power to assess outcomes is a concern. Retrospective chart reviews may also be affected by incomplete data collections and multiple biases. No data were available for other hypoglycemic episodes, especially to calculate the rate of the more common forms of hypoglycemia. The period of data analyzed spanned only about 15 months. A longer, longitudinal assessment of the differences between these 2 groups may yield more differences, and clearer results and conclusions. Moreover, the data set had aged before publication of this report; however, the authors think that the analysis and information remain highly clinically relevant. The uncommon use of U-500, and prominence as a “special case” insulin may also lead to a detection bias for severe hypoglycemia in the U-500 group. In contrast, lapses in documentation of hypoglycemia in subjects using U-100 could have occurred. Finally, the differences in total daily dose and body weight among groups were significant and may reflect on important physiologic differences between the 2 groups that may affect the reproducibility of our results.
Nevertheless, this study had notable strengths. Comparing U-500 insulin users with similar subjects using U-100 over a period of time provides head-to-head data with potentially important clinical utility. Also, we collected and analyzed a sizable number of clinically important variables, including cardiovascular risk factors, the occurrence of new cardiovascular events, and prevalence of renal disease. The use of linear regression and multivariate analysis using multiple models also strengthened the results. Previous studies compared the outcomes in subjects using U-500 insulin with only their historical selves.8,13-16,18,19,22-25 Therefore, these studies analyzed the data for preconversion and postconversion of U-500 only and consistently favored U-500. This design in a retrospective study cannot eliminate the selection and/or intervention biases, as the subjects of study had inevitably “failed” prior therapies. Similarly, there is no prospective clinical trial data comparing patients on U-500 with patients on high doses of U-100 insulin. Finally, the patients in our study had high rates of comorbidities, which may have increased the applicability of our results to those of “real-life” patients in the community. To our knowledge, no other study has attempted a similar study design approach either prospectively or retrospectively.
Conclusions
In this population of elderly veterans with severely insulin-resistant T2DM, with a high incidence of CKD and ASCVD, U-500 insulin was associated with significantly greater reductions in Hb A1C than U-100 insulin-based regimens, while requiring fewer injections. No difference was noted in the incidence of new ASCVD events. More studies are needed to assess whether U-500 may increase the risk of severe hypoglycemic episodes.
Acknowledgments
The authors recognize the invaluable help provided by the editorial staff of University of South Florida IMpact, the Intramural Review to Support Research and Scientific Publication, and especially to Richard F. Lockey, MD, who has mentored us in this beautiful journey of scientific writing and for his editorial assistance. A portion of this study preliminary data was presented as an abstract at ENDO 2013, The Endocrine Society Annual meeting in San Francisco, CA, June 15-18, 2013.
Appendix. Severe Hypoglycemic Events
Subject 1: U-500 user, 61-year-old African American male. Hypoglycemia occurred during fasting and was associated with a seizure-like event 9 months after transition to concentrated insulin. He was taken by ambulance to a local hospital. No additional data were obtained. Hb A1C was 8.2% in the month before the episode (lowest of the studied period) and increased to 9.1% in the last segment of the study.
Subject 2: U-500 user, 57-year-old white male. The severe hypoglycemic episode occurred approximately 8 months after transition. His Hb A1C was 5.6% around the time of the event, the lowest of the studied period, and increased to 6.8% over the next 4 months. No other data were available.
Subject 3: U-500 user, 67-year-old white male. The event occurred at home in the morning while fasting, 3 months after transition. He was assisted by his family. Hb A1C was 7.1% 10 weeks after the event and was 7% at the end of the studied period. He had a history of CKD and PVD.
Subject 4: U-500 user, 68-year-old white male. He presented with altered consciousness, hypoglycemia, and elevated troponin levels, which was later confirmed as a non-ST elevation myocardial infarction (NSTEMI), 7 months after transition. Hb A1C during the events was 7.1% and was followed by a 9.3% level 9 weeks later. He had history of CKD and PVD.
Subject 5: U-500 user, 67-year-old white man. Hypoglycemia occurred 6 months after transition to U-500. Hb A1C was 8.4% 2 months prior, and was followed by a 7% during the admission for severe hypoglycemia. 3 months later, his HbA1c rose to 8.2%. He had an extensive history of CAD and had a NSTEMI during the study period.
Subject 6: U-100 user, 65-year-old white man. He was found unconscious in the morning while fasting, 6 months after his first clinic visit. He had CKD and advanced ASCVD with prior CAD, PVD, and CVA. He had also had a recent CVA that had affected his movement and cognition.
1. Hales CM, Carroll MD, Fryar CD, Ogden CL. Prevalence of obesity among adults and youth: United States, 2015–2016. NCHS data brief no. 288. Published October 2017. Accessed January 29, 2021. https://www.cdc.gov/nchs/products/databriefs/db288.htm
2. Centers for Disease Control and Prevention. Diabetes and prediabetes: CDC works to prevent type 2 diabetes and improve the health of all people with diabetes. Updated November 30, 2020. Accessed February 17, 2021. https://www.cdc.gov/chronicdisease/resources/publications/factsheets/diabetes-prediabetes.htm
3. Cochran E, Gorden P. Use of U-500 insulin in the treatment of severe insulin resistance. Insulin. 2008;3(4):211-218 [Published correction appears in Insulin. 2009;4(1):81]. doi:10.1016/S1557-0843(08)80049-8
4. Shrestha RT, Kumar AF, Taddese A, et al. Duration and onset of action of high dose U-500 regular insulin in severely insulin resistant subjects with type 2 diabetes. Endocrinol Diabetes Metab. 2018;1(4):e00041. Published 2018 Sep 10. doi:10.1002/edm2.41
5. Dailey AM, Tannock LR. Extreme insulin resistance: indications and approaches to the use of U-500 insulin in type 2 diabetes mellitus. Curr Diab Rep. 2011;11(2):77-82. doi:10.1007/s11892-010-0167-6
6. de la Peña A, Riddle M, Morrow LA, et al. Pharmacokinetics and pharmacodynamics of high-dose human regular U-500 insulin versus human regular U-100 insulin in healthy obese subjects [published correction appears in Diabetes Care. 2014 Aug;37(8):2414]. Diabetes Care. 2011;34(12):2496-2501. doi:10.2337/dc11-0721
7. Brusko C, Jackson JA, de la Peña A. Comparative properties of U-500 and U-100 regular human insulin. Am J Health Syst Pharm. 2013;70(15):1283-1284. doi:10.2146/130117
8. Dailey AM, Williams S, Taneja D, Tannock LR. Clinical efficacy and patient satisfaction with U-500 insulin use. Diabetes Res Clin Pract. 2010;88(3):259-264. doi:10.1016/j.diabres.2010.02.012
9. Wysham C, Hood RC, Warren ML, Wang T, Morwick TM, Jackson JA. Effect of total daily dose on efficacy, dosing, and safety of 2 dose titration regimens of human regular U-500 insulin in severely insulin-resistant patients with type 2 diabetes. Endocr Pract. 2010;22(6):653-665. doi:10.4158/EP15959.OR
10. Gagnon-Auger M, du Souich P, Baillargeon JP, et al. Dose-dependent delay of the hypoglycemic effect of short-acting insulin analogs in obese subjects with type 2 diabetes: a pharmacokinetic and pharmacodynamic study. Diabetes Care. 2010;33(12):2502-2507. doi:10.2337/dc10-1126
11. Schloot NC, Hood RC, Corrigan SM, Panek RL, Heise T. Concentrated insulins in current clinical practice. Diabetes Res Clin Pract. 2019;148:93-101. doi:10.1016/j.diabres.2018.12.007
12. Lane WS, Cochran EK, Jackson JA, et al. High-dose insulin therapy: is it time for U-500 insulin?. Endocr Pract. 2009;15(1):71-79. doi:10.4158/EP.15.1.71
13. Boldo A, Comi RJ. Clinical experience with U500 insulin: risks and benefits. Endocr Pract. 2012;18(1):56-61. doi:10.4158/EP11163.OR
14. Granata JA, Nawarskas AD, Resch ND, Vigil JM. Evaluating the effect of u-500 insulin therapy on glycemic control in veterans with type 2 diabetes. Clin Diabetes. 2015;33(1):14-19. doi:10.2337/diaclin.33.1.14
15. Eby EL, Zagar AJ, Wang P, et al. Healthcare costs and adherence associated with human regular U-500 versus high-dose U-100 insulin in patients with diabetes. Endocr Pract. 2014;20(7):663-670. doi:10.4158/EP13407.OR
16. Eby EL, Curtis BH, Gelwicks SC, et al. Initiation of human regular U-500 insulin use is associated with improved glycemic control: a real-world US cohort study. BMJ Open Diabetes Res Care. 2015;3(1):e000074. Published 2015 Apr 30. doi:10.1136/bmjdrc-2014-000074
17. Jones P, Idris I. The use of U-500 regular insulin in the management of patients with obesity and insulin resistance. Diabetes Obes Metab. 2013;15(10):882-887. doi:10.1111/dom.12094
18. Hood RC, Arakaki RF, Wysham C, Li YG, Settles JA, Jackson JA. Two treatment approaches for human regular U-500 insulin in patients with type 2 diabetes not achieving adequate glycemic control on high-dose U-100 insulin therapy with or without oral agents: a randomized, titration-to-target clinical trial. Endocr Pract. 2015;21(7):782-793. doi: 10.4158/EP15612.OR
19. Ballani P, Tran MT, Navar MD, Davidson MB. Clinical experience with U-500 regular insulin in obese, markedly insulin-resistant type 2 diabetic patients [published correction appears in Diabetes Care. 2007 Feb;30(2):455]. Diabetes Care. 2006;29(11):2504-2505. doi:10.2337/dc06-1478
20. Davidson MB, Navar MD, Echeverry D, Duran P. U-500 regular insulin: clinical experience and pharmacokinetics in obese, severely insulin-resistant type 2 diabetic patients. Diabetes Care. 2010;33(2):281-283. doi:10.2337/dc09-1490
21. Bulchandani DG, Konrady T, Hamburg MS. Clinical efficacy and patient satisfaction with U-500 insulin pump therapy in patients with type 2 diabetes. Endocr Pract. 2007;13(7):721-725. doi:10.4158/EP.13.7.721
22. Lane WS, Weinrib SL, Rappaport JM, Przestrzelski T. A prospective trial of U500 insulin delivered by Omnipod in patients with type 2 diabetes mellitus and severe insulin resistance [published correction appears in Endocr Pract. 2010 Nov-Dec;16(6):1082]. Endocr Pract. 2010;16(5):778-784. doi:10.4158/EP10014.OR
23. Martin C, Perez-Molinar D, Shah M, Billington C. U500 Disposable Patch Insulin Pump: Results and Discussion of a Veterans Affairs Pilot Study. J Endocr Soc. 2018;2(11):1275-1283. Published 2018 Sep 17. doi:10.1210/js.2018-00198
24. Ziesmer AE, Kelly KC, Guerra PA, George KG, Dunn FL. U500 regular insulin use in insulin-resistant type 2 diabetic veteran patients. Endocr Pract. 2012;18(1):34-38. doi:10.4158/EP11043.OR
25. American Diabetes Association. 6. Glycemic Targets: Standards of Medical Care in Diabetes-2019. Diabetes Care. 2019;42(Suppl 1):S61-S70. doi:10.2337/dc19-S006
More than 70% of Americans are overweight or obese and 1 in 10 has type 2 diabetes mellitus (T2DM). In the last 20 years, the prevalence of obesity and DM has each increased drastically according to the Centers for Disease Control and Prevention.1,2 Thus, an increase in severe insulin-resistant DM is predicted. Severe insulin resistance occurs when insulin doses exceed 200 units per day or 2 units/kg per day.3-5 Treating this condition demands large volumes of U-100 insulin and a high frequency of injections (usually 4-7 per day), which can lead to reduced patient adherence.8-10 Likewise, large injected volumes are more painful and can lead to altered absorption.3,9-11
U-500 insulin (500 units/mL) is 5 times more concentrated than U-100 insulin and has advantages in the management of severe insulin-resistant DM.11-13 Its pharmacokinetic profile is unique, for the clinical effect can last for up to 24 hours.4-6 U-500 can replace basal-bolus and other complex insulin regimens, offering convenient, effective glycemic control with 2 or 3 injections per day.11,14-20 U-500 can also improve the quality of life and adherence compared with formulations that require more frequent injections.7,14,21 Historically, only exceptional or “special” cases were treated with U-500, but demand for concentrated insulins has increased in the last decade as clinicians adjust their care for this growing patient population.17
The purpose of this study was to determine whether a population of subjects with severe insulin-resistant T2DM would benefit from the use of U-500 vs U-100 insulin regimens. The hypothesis was that this population would obtain equal or better glycemic control while achieving improved adherence. Other studies have demonstrated that U-500 yields improvements in glycemic control but also potentially increases hypoglycemic episodes.15-18,22-24 To our knowledge, this study is the first to evaluate the clinical outcomes of subjects with severe insulin-resistant T2DM who changed from U-100 to U-500 vs subjects who remained on high-dose U-100 insulin.
Methods
This was a single-site, retrospective chart review of subjects with T2DM who attended the endocrinology specialty clinic at the James A. Haley Veterans’ Hospital (JAHVA) in Tampa, Florida, between July 2002 and June 2011. The study included a group of subjects using U-500 insulin and a comparison group using U-100 insulin. The study was approved by the JAHVA Research & Development Committee and by the University of South Florida Institutional Review Board.
Inclusion criteria included diagnosis of T2DM, body mass index (BMI) of more than 30, use of U-500 insulin, or > 200 units daily of U-100 insulin. Exclusion criteria included hypoglycemia unawareness, type 1 DM, and use of an insulin pump. A total of 142 subjects met the inclusion criteria (68 in the U-500 group and 74 in the U-100 group).
All study subjects had at least 1 DM education session. U-500 subjects used insulin vials and 1-mL volumetric hypodermal syringes. All U-500 prescriptions were issued electronically in units and volume (U-500 insulin was available exclusively in vials during the time frame from which data were collected). Subjects in the U-100 group used insulin vials or pen devices. Laboratory studies were processed in house by the institution using high-pressure liquid chromatography to determine hemoglobin A1C (Hb A1C) levels. All study subjects required at least 2 Hb A1C measurements over the observed 12 months for inclusion.
Transition to U-500 Insulin
U-500 transition was considered routinely and presented as an option for patients requiring > 200 units of insulin daily. The transition criteria included adherence to medications, follow-up appointments, and glucose monitoring recommendations, and ability to learn and apply insulin self-adjustment instructions. All subjects were given an additional U-500 insulin education session before transition. The endocrinologist calculated all starting doses by reducing the total daily dose by 20%.
Data Collection
Data were collected using the automatic data mining tools within the JAHVA Computerized Patient Record System and confirmed individually by clinical staff. Demographic data included age, race, and sex. Other parameters were weight; BMI; Hb A1C; estimated glomerular filtration rate (eGFR); duration of DM; use of metformin and other oral agents; total daily insulin dose; number of daily injections; prior history of atherosclerotic cardiovascular disease (ASCVD), including coronary artery disease (CAD), cerebrovascular accident (CVA), or peripheral vascular disease (PVD); occurrence of severe hypoglycemia (symptomatic hypoglycemia requiring treatment assistance from another individual) and of new cardiovascular events, classified as CAD, CVA, or PVD.
For the U-500 group, data were collected and analyzed for the 3 months before (baseline) and the 12 months after the initiation of concentrated insulin. For the U-100 group, data were collected and analyzed for the comparable 3 months before (baseline) and the 12 months after the first clinic visit in which the subject started using more than 200 units per day of U-100. Frequency of follow-up visits was individualized according to clinical needs.
Clinical Endpoints
Primary outcomes included changes in Hb A1C from baseline to the following 12 months, and the occurrence of severe hypoglycemia. Secondary outcomes included the occurrence of new ASCVD events during the study, and changes in weight, BMI, and number of injections.
Statistical Analysis
The primary and secondary outcomes were assessed through univariate and multivariate general linear models. Multivariate models were used to compare differences in the variation of Hb A1C over time. Data were incomplete for the Hb A1C in 27 subjects, 6% of the dataset (Each subject had more than one variable or observation). Therefore, a multiple imputation was used to account for the incompleteness on Hb A1C (value substitutions by the mean and by the prior Hb A1C and models were balanced against the unaltered data). A P value of ≤ .05 was used to determine statistical significance. The statistical analyses were performed using IBM SPSS Statistics 21.
Results
Most patients were male (94%) of white race (86%), with a mean age of 57 years and comparable duration of DM (Table 1). Demographics were balanced between the groups, except for weight and BMI, both higher in the U-500 group (P < .001). Use of oral antidiabetic agents was not significantly different between groups, nor were comorbid conditions, with nearly 50% of subjects in each group affected by CKD and ASCVD, of which CAD was the most common (approximately 40% of both groups). Only about one-third of subjects used metformin and/or other oral agents, likely due to the high prevalence of CKD (contraindicating metformin) and high insulin requirements (due to correlation with β cell failure). A subgroup analysis of subjects on metformin did not demonstrate significant differences in risk of severe hypoglycemia or in Hb A1C levels (data not shown).
Both groups had similar initial Hb A1C baselines (> 9%) and both improved glycemic control during the study period. However, the Hb A1C reduction was greater in the U-500 group (P= .034), 0.84% vs 0.56% for U-100 and the between-groups difference was 0.4%. (Figure 1, Tables 2 and 3).
The univariate general linear model shows a statistically significant difference in the levels of Hb A1C within each treatment group, regardless of the imputation strategy. However, the differences were not significant when comparing postintervention Hb A1C means between groups with unaltered data (P = .23), because the U-500 group Hb A1C improvement gap narrowed at the end of study. In the multivariate analysis, irrespective of imputation method, the differences in Hb A1C between group treated with U-100 and U-500 were statistically significant (Table 3).
Overall, more subjects in the U-500 group than in the U-100 group achieved Hb A1C levels < 8.5% (56% vs 46%, respectively, P = .003) and the proportion of subjects achieving Hb A1C levels < 7.5% doubled that of the U-100 group (26% vs 12%; Figure 2). Five subjects in the U-500 group experienced severe hypoglycemia, compared with 1 in the U-100 group (P = .08). The total daily insulin dose was significantly higher in the U-500 group (296 units daily) than in the U-100 group (209 units daily) (P < .001) (Table 2). Baseline weight and BMI differences were also significant for the U-500 and U-100 groups (P < .001). Weight gain of approximately 2 kg occurred in both groups, a change that was not statistically significant (P = .79)
There were 21 new ASCVD events in the U-100 and 16 in the U-500 group (P = .51) and there were no statistically significant differences in the incidence of new CAD, PVD or CVA events. The U-500 group required significantly fewer injections than U-100 insulin users (2 vs 4; P < .001).
Discussion
The purpose of the study was to compare subjects with obesity and T2DM using U-500 concentrated insulin with similarly matched subjects using U-100 insulin. Available studies using U-500 insulin, including prospective trials, have reported the experience after transitioning patients who “failed” U-100 regimens.13-16,18,21-24 This failure is a relative and transient condition that, in theory, could be improved with medical intervention and lifestyle changes. Such changes cannot be easily quantified in a clinical trial or retrospective study without a control group. This study was an attempt to fill this knowledge gap.
The U-500 intervention resulted in a 0.8% overall reduction in Hb A1C and a significant 0.4% reduction compared to subjects using U-100. While both groups had improvement in Hb A1C , U-500 was associated with superior reductions in Hb A1C . This finding confirms prior assertions that U-500, compared with U-100, is associated with larger Hb A1C improvement.14-16
The preintervention and postintervention Hb A1C means were > 8% in both groups. This finding suggests that lowering Hb A1C is challenging, similar to published results demonstrating that Hb A1C levels < 7% are achieved by fewer than one-third of U-500 users.16-18 The explanation for this finding remains elusive, due to the methodologic limitations of a retrospective analysis. A possible explanation is the high prevalence of CKD and ASCVD among the study population, conditions which, according to guidelines justify less aggressive glycemic control efforts.25 Multiple prior studies using retrospective data8,13-16 and 2 prospective trials18,22 demonstrated similar Hb A1C reductions after failure of U-100 regimens.
In this study, U-500 resulted in a nominal increase in the risk of severe hypoglycemic episodes. A detailed review of the events found that most of these patients had preestablished CKD and ASCVD, and half of the subjects with sever hypoglycemic episodes had new vascular events during the study (Appendix). These findings suggest a possible correlation between CKD and ASCVD complications and the risk of severe hypoglycemic events. Pharmacokinetic profiles for U-500 have not been studied in subjects with CKD, but the clinical effect of CKD is likely prolonged by the expected reduction in insulin clearance. Similarly, the frailty associated with preexisting ASCVD, or the related polypharmacy, could be factors increasing the risk of hypoglycemia and deserve further study.
Most of the U-500 subjects used it twice daily in this study, which could have contributed to the higher hypoglycemia rate. In a prospective randomized trial Hood and colleagues reported a rate of symptomatic hypoglycemia exceeding 90% in the 2 study groups, and 8 subjects (of 325 total) had severe hypoglycemia during the 6-month observation. The group assigned to 2 daily injections had a significantly higher rate of hypoglycemic events compared with a group that had 3 injections per day.18 Additional studies are required to ascertain whether U-500, compared with specific U-100 regimens (basal-bolus vs premixed; human vs insulin analogs), results in a higher risk of severe hypoglycemia.
This study also investigated the incidence of new cardiovascular events, and no difference was found between the 2 groups. A longer observation would be required to better assess whether U-500 therapy can reduce the incidence of microvascular and macrovascular complications. The similar incidence of complications is further evidence of the similarity between the 2 studied groups. It was also reassuring to find that weight gains were small and nearly identical in both insulin groups.
Strengths and Limitations
This study has several limitations. Data about hospitalizations for congestive heart failure, amputations, progression of diabetic retinopathy, neuropathy, and nephropathy were not collected for this analysis. As both groups of subjects were relatively small, statistical power to assess outcomes is a concern. Retrospective chart reviews may also be affected by incomplete data collections and multiple biases. No data were available for other hypoglycemic episodes, especially to calculate the rate of the more common forms of hypoglycemia. The period of data analyzed spanned only about 15 months. A longer, longitudinal assessment of the differences between these 2 groups may yield more differences, and clearer results and conclusions. Moreover, the data set had aged before publication of this report; however, the authors think that the analysis and information remain highly clinically relevant. The uncommon use of U-500, and prominence as a “special case” insulin may also lead to a detection bias for severe hypoglycemia in the U-500 group. In contrast, lapses in documentation of hypoglycemia in subjects using U-100 could have occurred. Finally, the differences in total daily dose and body weight among groups were significant and may reflect on important physiologic differences between the 2 groups that may affect the reproducibility of our results.
Nevertheless, this study had notable strengths. Comparing U-500 insulin users with similar subjects using U-100 over a period of time provides head-to-head data with potentially important clinical utility. Also, we collected and analyzed a sizable number of clinically important variables, including cardiovascular risk factors, the occurrence of new cardiovascular events, and prevalence of renal disease. The use of linear regression and multivariate analysis using multiple models also strengthened the results. Previous studies compared the outcomes in subjects using U-500 insulin with only their historical selves.8,13-16,18,19,22-25 Therefore, these studies analyzed the data for preconversion and postconversion of U-500 only and consistently favored U-500. This design in a retrospective study cannot eliminate the selection and/or intervention biases, as the subjects of study had inevitably “failed” prior therapies. Similarly, there is no prospective clinical trial data comparing patients on U-500 with patients on high doses of U-100 insulin. Finally, the patients in our study had high rates of comorbidities, which may have increased the applicability of our results to those of “real-life” patients in the community. To our knowledge, no other study has attempted a similar study design approach either prospectively or retrospectively.
Conclusions
In this population of elderly veterans with severely insulin-resistant T2DM, with a high incidence of CKD and ASCVD, U-500 insulin was associated with significantly greater reductions in Hb A1C than U-100 insulin-based regimens, while requiring fewer injections. No difference was noted in the incidence of new ASCVD events. More studies are needed to assess whether U-500 may increase the risk of severe hypoglycemic episodes.
Acknowledgments
The authors recognize the invaluable help provided by the editorial staff of University of South Florida IMpact, the Intramural Review to Support Research and Scientific Publication, and especially to Richard F. Lockey, MD, who has mentored us in this beautiful journey of scientific writing and for his editorial assistance. A portion of this study preliminary data was presented as an abstract at ENDO 2013, The Endocrine Society Annual meeting in San Francisco, CA, June 15-18, 2013.
Appendix. Severe Hypoglycemic Events
Subject 1: U-500 user, 61-year-old African American male. Hypoglycemia occurred during fasting and was associated with a seizure-like event 9 months after transition to concentrated insulin. He was taken by ambulance to a local hospital. No additional data were obtained. Hb A1C was 8.2% in the month before the episode (lowest of the studied period) and increased to 9.1% in the last segment of the study.
Subject 2: U-500 user, 57-year-old white male. The severe hypoglycemic episode occurred approximately 8 months after transition. His Hb A1C was 5.6% around the time of the event, the lowest of the studied period, and increased to 6.8% over the next 4 months. No other data were available.
Subject 3: U-500 user, 67-year-old white male. The event occurred at home in the morning while fasting, 3 months after transition. He was assisted by his family. Hb A1C was 7.1% 10 weeks after the event and was 7% at the end of the studied period. He had a history of CKD and PVD.
Subject 4: U-500 user, 68-year-old white male. He presented with altered consciousness, hypoglycemia, and elevated troponin levels, which was later confirmed as a non-ST elevation myocardial infarction (NSTEMI), 7 months after transition. Hb A1C during the events was 7.1% and was followed by a 9.3% level 9 weeks later. He had history of CKD and PVD.
Subject 5: U-500 user, 67-year-old white man. Hypoglycemia occurred 6 months after transition to U-500. Hb A1C was 8.4% 2 months prior, and was followed by a 7% during the admission for severe hypoglycemia. 3 months later, his HbA1c rose to 8.2%. He had an extensive history of CAD and had a NSTEMI during the study period.
Subject 6: U-100 user, 65-year-old white man. He was found unconscious in the morning while fasting, 6 months after his first clinic visit. He had CKD and advanced ASCVD with prior CAD, PVD, and CVA. He had also had a recent CVA that had affected his movement and cognition.
1. Hales CM, Carroll MD, Fryar CD, Ogden CL. Prevalence of obesity among adults and youth: United States, 2015–2016. NCHS data brief no. 288. Published October 2017. Accessed January 29, 2021. https://www.cdc.gov/nchs/products/databriefs/db288.htm
2. Centers for Disease Control and Prevention. Diabetes and prediabetes: CDC works to prevent type 2 diabetes and improve the health of all people with diabetes. Updated November 30, 2020. Accessed February 17, 2021. https://www.cdc.gov/chronicdisease/resources/publications/factsheets/diabetes-prediabetes.htm
3. Cochran E, Gorden P. Use of U-500 insulin in the treatment of severe insulin resistance. Insulin. 2008;3(4):211-218 [Published correction appears in Insulin. 2009;4(1):81]. doi:10.1016/S1557-0843(08)80049-8
4. Shrestha RT, Kumar AF, Taddese A, et al. Duration and onset of action of high dose U-500 regular insulin in severely insulin resistant subjects with type 2 diabetes. Endocrinol Diabetes Metab. 2018;1(4):e00041. Published 2018 Sep 10. doi:10.1002/edm2.41
5. Dailey AM, Tannock LR. Extreme insulin resistance: indications and approaches to the use of U-500 insulin in type 2 diabetes mellitus. Curr Diab Rep. 2011;11(2):77-82. doi:10.1007/s11892-010-0167-6
6. de la Peña A, Riddle M, Morrow LA, et al. Pharmacokinetics and pharmacodynamics of high-dose human regular U-500 insulin versus human regular U-100 insulin in healthy obese subjects [published correction appears in Diabetes Care. 2014 Aug;37(8):2414]. Diabetes Care. 2011;34(12):2496-2501. doi:10.2337/dc11-0721
7. Brusko C, Jackson JA, de la Peña A. Comparative properties of U-500 and U-100 regular human insulin. Am J Health Syst Pharm. 2013;70(15):1283-1284. doi:10.2146/130117
8. Dailey AM, Williams S, Taneja D, Tannock LR. Clinical efficacy and patient satisfaction with U-500 insulin use. Diabetes Res Clin Pract. 2010;88(3):259-264. doi:10.1016/j.diabres.2010.02.012
9. Wysham C, Hood RC, Warren ML, Wang T, Morwick TM, Jackson JA. Effect of total daily dose on efficacy, dosing, and safety of 2 dose titration regimens of human regular U-500 insulin in severely insulin-resistant patients with type 2 diabetes. Endocr Pract. 2010;22(6):653-665. doi:10.4158/EP15959.OR
10. Gagnon-Auger M, du Souich P, Baillargeon JP, et al. Dose-dependent delay of the hypoglycemic effect of short-acting insulin analogs in obese subjects with type 2 diabetes: a pharmacokinetic and pharmacodynamic study. Diabetes Care. 2010;33(12):2502-2507. doi:10.2337/dc10-1126
11. Schloot NC, Hood RC, Corrigan SM, Panek RL, Heise T. Concentrated insulins in current clinical practice. Diabetes Res Clin Pract. 2019;148:93-101. doi:10.1016/j.diabres.2018.12.007
12. Lane WS, Cochran EK, Jackson JA, et al. High-dose insulin therapy: is it time for U-500 insulin?. Endocr Pract. 2009;15(1):71-79. doi:10.4158/EP.15.1.71
13. Boldo A, Comi RJ. Clinical experience with U500 insulin: risks and benefits. Endocr Pract. 2012;18(1):56-61. doi:10.4158/EP11163.OR
14. Granata JA, Nawarskas AD, Resch ND, Vigil JM. Evaluating the effect of u-500 insulin therapy on glycemic control in veterans with type 2 diabetes. Clin Diabetes. 2015;33(1):14-19. doi:10.2337/diaclin.33.1.14
15. Eby EL, Zagar AJ, Wang P, et al. Healthcare costs and adherence associated with human regular U-500 versus high-dose U-100 insulin in patients with diabetes. Endocr Pract. 2014;20(7):663-670. doi:10.4158/EP13407.OR
16. Eby EL, Curtis BH, Gelwicks SC, et al. Initiation of human regular U-500 insulin use is associated with improved glycemic control: a real-world US cohort study. BMJ Open Diabetes Res Care. 2015;3(1):e000074. Published 2015 Apr 30. doi:10.1136/bmjdrc-2014-000074
17. Jones P, Idris I. The use of U-500 regular insulin in the management of patients with obesity and insulin resistance. Diabetes Obes Metab. 2013;15(10):882-887. doi:10.1111/dom.12094
18. Hood RC, Arakaki RF, Wysham C, Li YG, Settles JA, Jackson JA. Two treatment approaches for human regular U-500 insulin in patients with type 2 diabetes not achieving adequate glycemic control on high-dose U-100 insulin therapy with or without oral agents: a randomized, titration-to-target clinical trial. Endocr Pract. 2015;21(7):782-793. doi: 10.4158/EP15612.OR
19. Ballani P, Tran MT, Navar MD, Davidson MB. Clinical experience with U-500 regular insulin in obese, markedly insulin-resistant type 2 diabetic patients [published correction appears in Diabetes Care. 2007 Feb;30(2):455]. Diabetes Care. 2006;29(11):2504-2505. doi:10.2337/dc06-1478
20. Davidson MB, Navar MD, Echeverry D, Duran P. U-500 regular insulin: clinical experience and pharmacokinetics in obese, severely insulin-resistant type 2 diabetic patients. Diabetes Care. 2010;33(2):281-283. doi:10.2337/dc09-1490
21. Bulchandani DG, Konrady T, Hamburg MS. Clinical efficacy and patient satisfaction with U-500 insulin pump therapy in patients with type 2 diabetes. Endocr Pract. 2007;13(7):721-725. doi:10.4158/EP.13.7.721
22. Lane WS, Weinrib SL, Rappaport JM, Przestrzelski T. A prospective trial of U500 insulin delivered by Omnipod in patients with type 2 diabetes mellitus and severe insulin resistance [published correction appears in Endocr Pract. 2010 Nov-Dec;16(6):1082]. Endocr Pract. 2010;16(5):778-784. doi:10.4158/EP10014.OR
23. Martin C, Perez-Molinar D, Shah M, Billington C. U500 Disposable Patch Insulin Pump: Results and Discussion of a Veterans Affairs Pilot Study. J Endocr Soc. 2018;2(11):1275-1283. Published 2018 Sep 17. doi:10.1210/js.2018-00198
24. Ziesmer AE, Kelly KC, Guerra PA, George KG, Dunn FL. U500 regular insulin use in insulin-resistant type 2 diabetic veteran patients. Endocr Pract. 2012;18(1):34-38. doi:10.4158/EP11043.OR
25. American Diabetes Association. 6. Glycemic Targets: Standards of Medical Care in Diabetes-2019. Diabetes Care. 2019;42(Suppl 1):S61-S70. doi:10.2337/dc19-S006
Semaglutide for meaningful weight loss in obesity and diabetes?
A 2.4-mg weekly injection of the glucagon-like peptide-1 (GLP-1) receptor agonist semaglutide led to a clinically meaningful 5% loss in weight for roughly two-thirds of patients with both overweight/obesity and type 2 diabetes, researchers report.
These findings from the Semaglutide Treatment Effect in People With Obesity 2 (STEP 2) trial, one of four phase 3 trials of this drug, which is currently under regulatory review for weight loss, were published March 2 in The Lancet.
More than 1,000 patients (mean initial weight, 100 kg [220 pounds]) were randomly assigned to receive a lifestyle intervention plus a weekly injection of semaglutide 2.4 mg or semaglutide 1.0 mg or placebo. At 68 weeks, they had lost a mean of 9.6%, 7.0%, and 3.4%, respectively, of their starting weight.
In addition, 69% of patients who had received semaglutide 2.4 mg experienced a clinically meaningful 5% loss of weight, compared with 57% of patients who had received the lower dose and 29% of patients who had received placebo.
The higher dose of semaglutide was associated with a greater improvement in cardiometabolic risk factors. The safety profile was similar to that seen with other drugs in this class.
“By far the best results with any weight loss medicine in diabetes”
Importantly, “more than a quarter of participants lost over 15% of their body weight,” senior author Ildiko Lingvay, MD, stressed. This “is by far the best result we had with any weight loss medicine in patients with diabetes,” Dr. Lingvay, of the University of Texas, Dallas, said in a statement from the university.

“The drug works by suppressing appetite centers in the brain to reduce caloric intake,” she explained. “The medication continually tells the body that you just ate, you’re full.”
Similarly, lead author Melanie J. Davies, MD, said that the STEP 2 results “are exciting and represent a new era in weight management in people with type 2 diabetes.

“They mark a real paradigm shift in our ability to treat obesity,” with results closer to those achieved with bariatric surgery, Dr. Davies, of the University of Leicester, England, said in a statement from her institution.
“It is really encouraging,” she continued, “that along with the weight loss we saw real improvements in general health, with significant improvement in physical functioning scores, blood pressure, and blood glucose control.”
Dr. Lingvay noted that on average, patients in the four STEP clinical trials lost 10%-17% of their body weight, “which is a huge step forward compared with all other medications currently available to treat obesity.” She stressed that these results are comparable to the 20%-30% weight loss seen with bariatric surgery.
One of four trials under review
More than 90% of people with type 2 diabetes are overweight or have obesity, and more than 20% of people with obesity have diabetes, wrote Dr. Davies and colleagues.
Semaglutide (Ozempic), administered subcutaneously at a dose of 0.5 mg to 1 mg weekly, is approved by the Food and Drug Administration for the treatment of type 2 diabetes. Dosing studies indicated that it is associated with weight loss.
As previously reported, four trials of the use of semaglutide for weight loss (STEP 1, 2, 3, and 4) have been completed. The combined data were submitted to the FDA on Dec. 4, 2020 (a decision is expected within 6 months) and to the European Medicines Agency on Dec. 18, 2020.
The STEP 1 and STEP 3 trials of semaglutide 2.4 mg vs. placebo were recently published. The STEP 1 trial involved 1,961 adults with obesity or overweight; the STEP 3 trial, 611 adults with obesity or overweight. In each of the trials, some patients also underwent an intensive lifestyle intervention, and some did not. In both trials, patients with type 2 diabetes were excluded.
Topline results from STEP 2 were reported in June 2020.
STEP 2 enrolled patients with type 2 diabetes
STEP 2 involved 1,210 adults in 149 outpatient clinics in 12 countries in Europe, North America, South America, the Middle East, South Africa, and Asia. All participants had type 2 diabetes.
For all patients, the body mass index was ≥27 kg/m2, and the A1c concentration was 7%-10%. The mean BMI was 35.7 kg/m2, and the mean A1c was 8.1%.
The mean age of the patients was 55 years, and 51% were women; 62% were White, 26% were Asian, 13% were Hispanic, 8% were Black, and 4% were of other ethnicity.
Participants were managed with diet and exercise alone or underwent treatment with a stable dose of up to three oral glucose-lowering agents (metformin, sulfonylureas, SGLT2 inhibitors, or thiazolidinediones) for at least 90 days. They were then randomly assigned in 1:1:1 ratio to receive semaglutide 2.4 mg, semaglutide 1.0 mg, or placebo.
The starting dose of semaglutide was 0.25 mg/wk; the dose was escalated every 4 weeks to reach the target dose.
All patients received monthly counseling from a dietitian about calories (the goal was a 500-calorie/day deficit) and activity (the goal was 150 minutes of walking or stair climbing per week).
The mean A1c dropped by 1.6% and 1.5% in the semaglutide groups and by 0.4% in the placebo group.
Adverse events were more frequent among the patients who received semaglutide (88% and 82%) than in the placebo group (77%).
Gastrointestinal events that were mainly mild to moderate in severity were reported by 64% of patients in the 2.4-mg semaglutide group, 58% in the 1.0-mg semaglutide group, and 34% in the placebo group.
Semaglutide (Rybelsus) is approved in the United States as a once-daily oral agent for use in type 2 diabetes in doses of 7 mg and 14 mg to improve glycemic control along with diet and exercise. It is the first GLP-1 agonist available in tablet form.
The study was supported by Novo Nordisk. The authors’ relevant financial relationships are listed in the original article.
A version of this article first appeared on Medscape.com.
A 2.4-mg weekly injection of the glucagon-like peptide-1 (GLP-1) receptor agonist semaglutide led to a clinically meaningful 5% loss in weight for roughly two-thirds of patients with both overweight/obesity and type 2 diabetes, researchers report.
These findings from the Semaglutide Treatment Effect in People With Obesity 2 (STEP 2) trial, one of four phase 3 trials of this drug, which is currently under regulatory review for weight loss, were published March 2 in The Lancet.
More than 1,000 patients (mean initial weight, 100 kg [220 pounds]) were randomly assigned to receive a lifestyle intervention plus a weekly injection of semaglutide 2.4 mg or semaglutide 1.0 mg or placebo. At 68 weeks, they had lost a mean of 9.6%, 7.0%, and 3.4%, respectively, of their starting weight.
In addition, 69% of patients who had received semaglutide 2.4 mg experienced a clinically meaningful 5% loss of weight, compared with 57% of patients who had received the lower dose and 29% of patients who had received placebo.
The higher dose of semaglutide was associated with a greater improvement in cardiometabolic risk factors. The safety profile was similar to that seen with other drugs in this class.
“By far the best results with any weight loss medicine in diabetes”
Importantly, “more than a quarter of participants lost over 15% of their body weight,” senior author Ildiko Lingvay, MD, stressed. This “is by far the best result we had with any weight loss medicine in patients with diabetes,” Dr. Lingvay, of the University of Texas, Dallas, said in a statement from the university.
“The drug works by suppressing appetite centers in the brain to reduce caloric intake,” she explained. “The medication continually tells the body that you just ate, you’re full.”
Similarly, lead author Melanie J. Davies, MD, said that the STEP 2 results “are exciting and represent a new era in weight management in people with type 2 diabetes.
“They mark a real paradigm shift in our ability to treat obesity,” with results closer to those achieved with bariatric surgery, Dr. Davies, of the University of Leicester, England, said in a statement from her institution.
“It is really encouraging,” she continued, “that along with the weight loss we saw real improvements in general health, with significant improvement in physical functioning scores, blood pressure, and blood glucose control.”
Dr. Lingvay noted that on average, patients in the four STEP clinical trials lost 10%-17% of their body weight, “which is a huge step forward compared with all other medications currently available to treat obesity.” She stressed that these results are comparable to the 20%-30% weight loss seen with bariatric surgery.
One of four trials under review
More than 90% of people with type 2 diabetes are overweight or have obesity, and more than 20% of people with obesity have diabetes, wrote Dr. Davies and colleagues.
Semaglutide (Ozempic), administered subcutaneously at a dose of 0.5 mg to 1 mg weekly, is approved by the Food and Drug Administration for the treatment of type 2 diabetes. Dosing studies indicated that it is associated with weight loss.
As previously reported, four trials of the use of semaglutide for weight loss (STEP 1, 2, 3, and 4) have been completed. The combined data were submitted to the FDA on Dec. 4, 2020 (a decision is expected within 6 months) and to the European Medicines Agency on Dec. 18, 2020.
The STEP 1 and STEP 3 trials of semaglutide 2.4 mg vs. placebo were recently published. The STEP 1 trial involved 1,961 adults with obesity or overweight; the STEP 3 trial, 611 adults with obesity or overweight. In each of the trials, some patients also underwent an intensive lifestyle intervention, and some did not. In both trials, patients with type 2 diabetes were excluded.
Topline results from STEP 2 were reported in June 2020.
STEP 2 enrolled patients with type 2 diabetes
STEP 2 involved 1,210 adults in 149 outpatient clinics in 12 countries in Europe, North America, South America, the Middle East, South Africa, and Asia. All participants had type 2 diabetes.
For all patients, the body mass index was ≥27 kg/m2, and the A1c concentration was 7%-10%. The mean BMI was 35.7 kg/m2, and the mean A1c was 8.1%.
The mean age of the patients was 55 years, and 51% were women; 62% were White, 26% were Asian, 13% were Hispanic, 8% were Black, and 4% were of other ethnicity.
Participants were managed with diet and exercise alone or underwent treatment with a stable dose of up to three oral glucose-lowering agents (metformin, sulfonylureas, SGLT2 inhibitors, or thiazolidinediones) for at least 90 days. They were then randomly assigned in 1:1:1 ratio to receive semaglutide 2.4 mg, semaglutide 1.0 mg, or placebo.
The starting dose of semaglutide was 0.25 mg/wk; the dose was escalated every 4 weeks to reach the target dose.
All patients received monthly counseling from a dietitian about calories (the goal was a 500-calorie/day deficit) and activity (the goal was 150 minutes of walking or stair climbing per week).
The mean A1c dropped by 1.6% and 1.5% in the semaglutide groups and by 0.4% in the placebo group.
Adverse events were more frequent among the patients who received semaglutide (88% and 82%) than in the placebo group (77%).
Gastrointestinal events that were mainly mild to moderate in severity were reported by 64% of patients in the 2.4-mg semaglutide group, 58% in the 1.0-mg semaglutide group, and 34% in the placebo group.
Semaglutide (Rybelsus) is approved in the United States as a once-daily oral agent for use in type 2 diabetes in doses of 7 mg and 14 mg to improve glycemic control along with diet and exercise. It is the first GLP-1 agonist available in tablet form.
The study was supported by Novo Nordisk. The authors’ relevant financial relationships are listed in the original article.
A version of this article first appeared on Medscape.com.
Heart failure redefined with new classifications, staging
The terminology and classification scheme for heart failure (HF) is changing in ways that experts hope will directly impact patient outcomes.

In a new consensus statement, a multisociety group of experts proposed a new universal definition of heart failure and made substantial revisions to the way in which the disease is staged and classified.
The authors of the statement, led by writing committee chair and immediate past president of the Heart Failure Society of America Biykem Bozkurt, MD, PhD, hope their efforts will go far to improve standardization of terminology, but more importantly will facilitate better management of the disease in ways that keep pace with current knowledge and advances in the field.
“There is a great need for reframing and standardizing the terminology across societies and different stakeholders, and importantly for patients because a lot of the terminology we were using was understood by academicians, but were not being translated in important ways to ensure patients are being appropriately treated,” said Dr. Bozkurt, of Baylor College of Medicine, Houston.
The consensus statement was a group effort led by the HFSA, the Heart Failure Association of the European Society of Cardiology, and the Japanese Heart Failure Society, with endorsements from the Canadian Heart Failure Society, the Heart Failure Association of India, the Cardiac Society of Australia and New Zealand, and the Chinese Heart Failure Association.
The article was published March 1 in the Journal of Cardiac Failure and the European Journal of Heart Failure, authored by a writing committee of 38 individuals with domain expertise in HF, cardiomyopathy, and cardiovascular disease.
“This is a very thorough and very carefully written document that I think will be helpful for clinicians because they’ve tapped into important changes in the field that have occurred over the past 10 years and that now allow us to do more for patients than we could before,” Eugene Braunwald, MD, said in an interview.

Dr. Braunwald and Elliott M. Antman, MD, both from TIMI Study Group at Brigham and Women’s Hospital and Harvard Medical School in Boston, wrote an editorial that accompanied the European Journal of Heart Failure article.
A new universal definition
“[Heart failure] is a clinical syndrome with symptoms and or signs caused by a structural and/or functional cardiac abnormality and corroborated by elevated natriuretic peptide levels and/or objective evidence of pulmonary or systemic congestion.”
This proposed definition, said the authors, is designed to be contemporary and simple “but conceptually comprehensive, with near universal applicability, prognostic and therapeutic viability, and acceptable sensitivity and specificity.”
Both left and right HF qualifies under this definition, said the authors, but conditions that result in marked volume overload, such as chronic kidney disease, which may present with signs and symptoms of HF, do not.
“Although some of these patients may have concomitant HF, these patients have a primary abnormality that may require a specific treatment beyond that for HF,” said the consensus statement authors.
For his part, Douglas L. Mann, MD, is happy to see what he considers a more accurate and practical definition for heart failure.

“We’ve had some wacky definitions in heart failure that haven’t made sense for 30 years, the principal of which is the definition of heart failure that says it’s the inability of the heart to meet the metabolic demands of the body,” Dr. Mann, of Washington University, St. Louis, said in an interview.
“I think this description was developed thinking about people with end-stage heart failure, but it makes no sense in clinical practice. Does it make sense to say about someone with New York Heart Association class I heart failure that their heart can’t meet the metabolic demands of the body?” said Dr. Mann, who was not involved with the writing of the consensus statement.
Proposed revised stages of the HF continuum
Overall, minimal changes have been made to the HF stages, with tweaks intended to enhance understanding and address the evolving role of biomarkers.
The authors proposed an approach to staging of HF:
- At-risk for HF (stage A), for patients at risk for HF but without current or prior symptoms or signs of HF and without structural or biomarkers evidence of heart disease.
- Pre-HF (stage B), for patients without current or prior symptoms or signs of HF, but evidence of structural heart disease or abnormal cardiac function, or elevated natriuretic peptide levels.
- HF (stage C), for patients with current or prior symptoms and/or signs of HF caused by a structural and/or functional cardiac abnormality.
- Advanced HF (stage D), for patients with severe symptoms and/or signs of HF at rest, recurrent hospitalizations despite guideline-directed management and therapy (GDMT), refractory or intolerant to GDMT, requiring advanced therapies such as consideration for transplant, mechanical circulatory support, or palliative care.
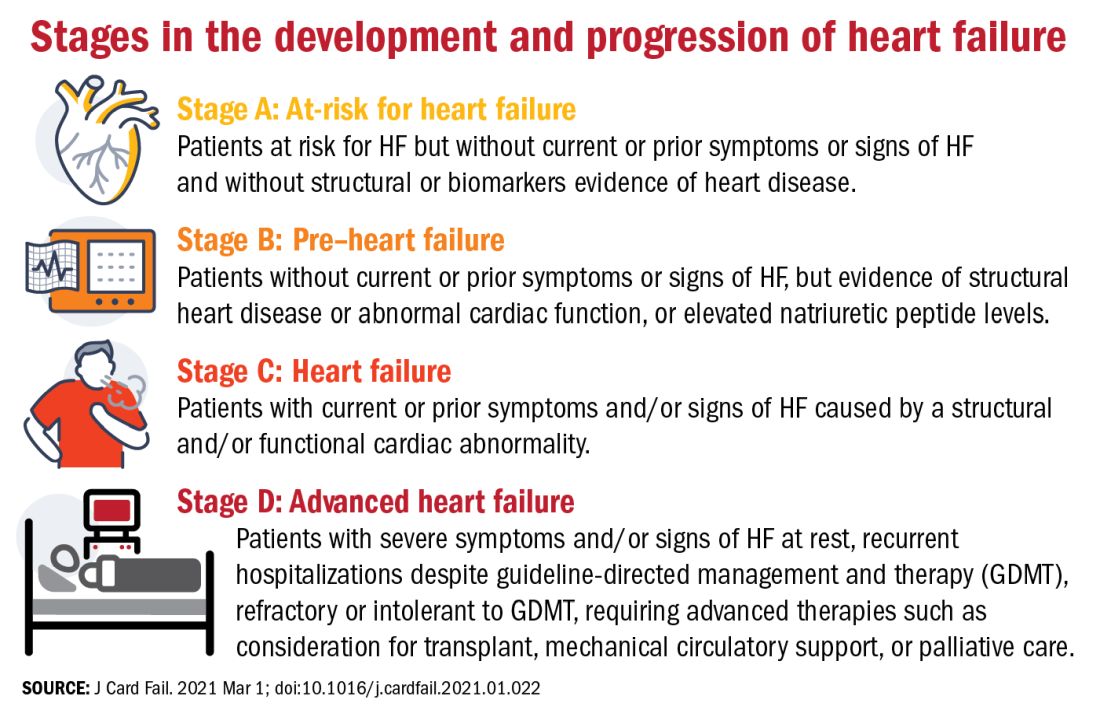
One notable change to the staging scheme is stage B, which the authors have reframed as “pre–heart failure.”
“Pre-cancer is a term widely understood and considered actionable and we wanted to tap into this successful messaging and embrace the pre–heart failure concept as something that is treatable and preventable,” said Dr. Bozkurt.
“We want patients and clinicians to understand that there are things we can do to prevent heart failure, strategies we didn’t have before, like SGLT2 inhibitors in patients with diabetes at risk for HF,” she added.
The revision also avoids the stigma of HF before the symptoms are manifest.
“Not calling it stage A and stage B heart failure you might say is semantics, but it’s important semantics,” said Dr. Braunwald. “When you’re talking to a patient or a relative and tell them they have stage A heart failure, it’s scares them unnecessarily. They don’t hear the stage A or B part, just the heart failure part.”
New classifications according to LVEF
And finally, in what some might consider the most obviously needed modification, the document proposes a new and revised classification of HF according to left ventricular ejection fraction (LVEF). Most agree on how to classify heart failure with reduced ejection fraction (HFrEF) and heart failure with preserved ejection fraction (HFpEF), but although the middle range has long been understood to be a clinically relevant, it has no proper name or clear delineation.
“For standardization across practice guidelines, to recognize clinical trajectories in HF, and to facilitate the recognition of different heart failure entities in a sensitive and specific manner that can guide therapy, we want to formalize the heart failure categories according to ejection fraction,” said Dr. Bozkurt.
To this end, the authors propose the following four classifications of EF:
- HF with reduced EF (HFrEF): LVEF of up to 40%.
- HF with mildly reduced EF (HFmrEF): LVEF of 41-49%.
- HF with preserved EF (HFpEF)HF with an LVEF of at least 50%.
- HF with improved EF (HFimpEF): HF with a baseline LVEF of 40% or less, an increase of at least 10 points from baseline LVEF, and a second measurement of LVEF of greater than 40%.
HFmrEF is usually a transition period, noted Dr. Bozkurt. “Patients with HF in this range may represent a population whose EF is likely to change, either increase or decrease over time and it’s important to be cognizant of that trajectory. Understanding where your patient is headed is crucial for prognosis and optimization of guideline-directed treatment,” she said.
Improved, not recovered, HF
The last classification of heart failure with improved ejection fraction (HFimpEF) represents an important change to the current classification scheme.
“We want to clarify what terms to use but also which not to use. For example, we don’t want people to use recovered heart failure or heart failure in remission, partly because we don’t want the medication to be stopped. We don’t want to give the false message that there has been full recovery,” said Dr. Bozkurt.
As seen in the TRED-HF trial, guideline-directed medical therapy should be continued in patients with HF with improved EF regardless of whether it has improved to a normal range of above 50% in subsequent measurements.
“This is a distinct group of people, and for a while the guidelines were lumping them in with HFpEF, which I think is totally wrong,” said Dr. Mann.
“I think it’s very important that we emphasize heart failure as a continuum, rather than a one-way street of [inevitable] progression. Because we do see improvements in ejection fraction and we do see that we can prevent heart failure if we do the right things, and this should be reflected in the terminology we use,” he added.
Dr. Bozkurt stressed that HFimpEF only applies if the EF improves to above 40%. A move from an EF of 10%-20% would still see the patient classified as having HFrEF, but a patient whose EF improved from, say, 30% to 45% would be classified as HFimpEF.
“The reason for this, again, is because a transition from, say an EF of 10%-20% does not change therapy, but a move upward over 40% might, especially regarding decisions for device therapies, so the trajectory as well as the absolute EF is important,” she added.
“Particularly in the early stages, people are responsive to therapy and it’s possible in some cases to reverse heart failure, so I think this change helps us understand when that’s happened,” said Dr. Braunwald.
One step toward universality
“The implementation of this terminology and nomenclature into practice will require a variety of tactics,” said Dr. Bozkurt. “For example, the current ICD 10 codes need to incorporate the at-risk and pre–heart failure categories, as well as the mid-range EF, preserved, and improved EF classifications, because the treatment differs between those three domains.”
In terms of how these proposed changes will be worked into practice guidelines, Dr. Bozkurt declined to comment on this to avoid any perception of conflict of interest as she is the cochair of the American College of Cardiology/American Heart Association HF guideline writing committee.
Dr. Braunwald and Dr. Antman suggest it may be premature to call the new terminology and classifications “universal.” In an interview, Dr. Braunwald lamented the absence of the World Heart Federation, the ACC, and the AHA as active participants in this effort and suggested this paper is only the first step of a multistep process that requires input from many stakeholders.
“It’s important that these organizations be involved, not just to bless it, but to contribute their expertise to the process,” he said.
For his part, Dr. Mann hopes these changes will gain widespread acceptance and clinical traction. “The problem sometimes with guidelines is that they’re so data driven that you just can’t come out and say the obvious, so making a position statement is a good first step. And they got good international representation on this, so I think these changes will be accepted in the next heart failure guidelines.”
To encourage further discussion and acceptance, Robert J. Mentz, MD, and Anuradha Lala, MD, editor-in-chief and deputy editor of the Journal of Cardiac Failure, respectively, announced a series of multidisciplinary perspective pieces to be published in the journal monthly, starting in May with editorials from Dr. Clyde W Yancy, MD, MSc, and Carolyn S.P. Lam, MBBS, PhD, both of whom were authors of the consensus statement.
Dr. Bozkurt reports being a consultant for Abbott, Amgen, Baxter, Bristol Myers Squibb, Liva Nova Relypsa/Vifor Pharma, Respicardia, and being on the registry steering committee for Sanofi-Aventis. Dr. Braunwald reports research grant support through Brigham and Women’s Hospital from AstraZeneca, Daiichi Sankyo, Merck, and Novartis; and consulting for Amgen, Boehringer-Ingelheim/Lilly, Cardurion, MyoKardia, Novo Nordisk, and Verve. Dr. Mann has been a consultant to Novartis, is on the steering committee for the PARADISE trial, and is on the scientific advisory board for MyoKardia/Bristol Myers Squibb.
The terminology and classification scheme for heart failure (HF) is changing in ways that experts hope will directly impact patient outcomes.
In a new consensus statement, a multisociety group of experts proposed a new universal definition of heart failure and made substantial revisions to the way in which the disease is staged and classified.
The authors of the statement, led by writing committee chair and immediate past president of the Heart Failure Society of America Biykem Bozkurt, MD, PhD, hope their efforts will go far to improve standardization of terminology, but more importantly will facilitate better management of the disease in ways that keep pace with current knowledge and advances in the field.
“There is a great need for reframing and standardizing the terminology across societies and different stakeholders, and importantly for patients because a lot of the terminology we were using was understood by academicians, but were not being translated in important ways to ensure patients are being appropriately treated,” said Dr. Bozkurt, of Baylor College of Medicine, Houston.
The consensus statement was a group effort led by the HFSA, the Heart Failure Association of the European Society of Cardiology, and the Japanese Heart Failure Society, with endorsements from the Canadian Heart Failure Society, the Heart Failure Association of India, the Cardiac Society of Australia and New Zealand, and the Chinese Heart Failure Association.
The article was published March 1 in the Journal of Cardiac Failure and the European Journal of Heart Failure, authored by a writing committee of 38 individuals with domain expertise in HF, cardiomyopathy, and cardiovascular disease.
“This is a very thorough and very carefully written document that I think will be helpful for clinicians because they’ve tapped into important changes in the field that have occurred over the past 10 years and that now allow us to do more for patients than we could before,” Eugene Braunwald, MD, said in an interview.
Dr. Braunwald and Elliott M. Antman, MD, both from TIMI Study Group at Brigham and Women’s Hospital and Harvard Medical School in Boston, wrote an editorial that accompanied the European Journal of Heart Failure article.
A new universal definition
“[Heart failure] is a clinical syndrome with symptoms and or signs caused by a structural and/or functional cardiac abnormality and corroborated by elevated natriuretic peptide levels and/or objective evidence of pulmonary or systemic congestion.”
This proposed definition, said the authors, is designed to be contemporary and simple “but conceptually comprehensive, with near universal applicability, prognostic and therapeutic viability, and acceptable sensitivity and specificity.”
Both left and right HF qualifies under this definition, said the authors, but conditions that result in marked volume overload, such as chronic kidney disease, which may present with signs and symptoms of HF, do not.
“Although some of these patients may have concomitant HF, these patients have a primary abnormality that may require a specific treatment beyond that for HF,” said the consensus statement authors.
For his part, Douglas L. Mann, MD, is happy to see what he considers a more accurate and practical definition for heart failure.
“We’ve had some wacky definitions in heart failure that haven’t made sense for 30 years, the principal of which is the definition of heart failure that says it’s the inability of the heart to meet the metabolic demands of the body,” Dr. Mann, of Washington University, St. Louis, said in an interview.
“I think this description was developed thinking about people with end-stage heart failure, but it makes no sense in clinical practice. Does it make sense to say about someone with New York Heart Association class I heart failure that their heart can’t meet the metabolic demands of the body?” said Dr. Mann, who was not involved with the writing of the consensus statement.
Proposed revised stages of the HF continuum
Overall, minimal changes have been made to the HF stages, with tweaks intended to enhance understanding and address the evolving role of biomarkers.
The authors proposed an approach to staging of HF:
- At-risk for HF (stage A), for patients at risk for HF but without current or prior symptoms or signs of HF and without structural or biomarkers evidence of heart disease.
- Pre-HF (stage B), for patients without current or prior symptoms or signs of HF, but evidence of structural heart disease or abnormal cardiac function, or elevated natriuretic peptide levels.
- HF (stage C), for patients with current or prior symptoms and/or signs of HF caused by a structural and/or functional cardiac abnormality.
- Advanced HF (stage D), for patients with severe symptoms and/or signs of HF at rest, recurrent hospitalizations despite guideline-directed management and therapy (GDMT), refractory or intolerant to GDMT, requiring advanced therapies such as consideration for transplant, mechanical circulatory support, or palliative care.
One notable change to the staging scheme is stage B, which the authors have reframed as “pre–heart failure.”
“Pre-cancer is a term widely understood and considered actionable and we wanted to tap into this successful messaging and embrace the pre–heart failure concept as something that is treatable and preventable,” said Dr. Bozkurt.
“We want patients and clinicians to understand that there are things we can do to prevent heart failure, strategies we didn’t have before, like SGLT2 inhibitors in patients with diabetes at risk for HF,” she added.
The revision also avoids the stigma of HF before the symptoms are manifest.
“Not calling it stage A and stage B heart failure you might say is semantics, but it’s important semantics,” said Dr. Braunwald. “When you’re talking to a patient or a relative and tell them they have stage A heart failure, it’s scares them unnecessarily. They don’t hear the stage A or B part, just the heart failure part.”
New classifications according to LVEF
And finally, in what some might consider the most obviously needed modification, the document proposes a new and revised classification of HF according to left ventricular ejection fraction (LVEF). Most agree on how to classify heart failure with reduced ejection fraction (HFrEF) and heart failure with preserved ejection fraction (HFpEF), but although the middle range has long been understood to be a clinically relevant, it has no proper name or clear delineation.
“For standardization across practice guidelines, to recognize clinical trajectories in HF, and to facilitate the recognition of different heart failure entities in a sensitive and specific manner that can guide therapy, we want to formalize the heart failure categories according to ejection fraction,” said Dr. Bozkurt.
To this end, the authors propose the following four classifications of EF:
- HF with reduced EF (HFrEF): LVEF of up to 40%.
- HF with mildly reduced EF (HFmrEF): LVEF of 41-49%.
- HF with preserved EF (HFpEF)HF with an LVEF of at least 50%.
- HF with improved EF (HFimpEF): HF with a baseline LVEF of 40% or less, an increase of at least 10 points from baseline LVEF, and a second measurement of LVEF of greater than 40%.
HFmrEF is usually a transition period, noted Dr. Bozkurt. “Patients with HF in this range may represent a population whose EF is likely to change, either increase or decrease over time and it’s important to be cognizant of that trajectory. Understanding where your patient is headed is crucial for prognosis and optimization of guideline-directed treatment,” she said.
Improved, not recovered, HF
The last classification of heart failure with improved ejection fraction (HFimpEF) represents an important change to the current classification scheme.
“We want to clarify what terms to use but also which not to use. For example, we don’t want people to use recovered heart failure or heart failure in remission, partly because we don’t want the medication to be stopped. We don’t want to give the false message that there has been full recovery,” said Dr. Bozkurt.
As seen in the TRED-HF trial, guideline-directed medical therapy should be continued in patients with HF with improved EF regardless of whether it has improved to a normal range of above 50% in subsequent measurements.
“This is a distinct group of people, and for a while the guidelines were lumping them in with HFpEF, which I think is totally wrong,” said Dr. Mann.
“I think it’s very important that we emphasize heart failure as a continuum, rather than a one-way street of [inevitable] progression. Because we do see improvements in ejection fraction and we do see that we can prevent heart failure if we do the right things, and this should be reflected in the terminology we use,” he added.
Dr. Bozkurt stressed that HFimpEF only applies if the EF improves to above 40%. A move from an EF of 10%-20% would still see the patient classified as having HFrEF, but a patient whose EF improved from, say, 30% to 45% would be classified as HFimpEF.
“The reason for this, again, is because a transition from, say an EF of 10%-20% does not change therapy, but a move upward over 40% might, especially regarding decisions for device therapies, so the trajectory as well as the absolute EF is important,” she added.
“Particularly in the early stages, people are responsive to therapy and it’s possible in some cases to reverse heart failure, so I think this change helps us understand when that’s happened,” said Dr. Braunwald.
One step toward universality
“The implementation of this terminology and nomenclature into practice will require a variety of tactics,” said Dr. Bozkurt. “For example, the current ICD 10 codes need to incorporate the at-risk and pre–heart failure categories, as well as the mid-range EF, preserved, and improved EF classifications, because the treatment differs between those three domains.”
In terms of how these proposed changes will be worked into practice guidelines, Dr. Bozkurt declined to comment on this to avoid any perception of conflict of interest as she is the cochair of the American College of Cardiology/American Heart Association HF guideline writing committee.
Dr. Braunwald and Dr. Antman suggest it may be premature to call the new terminology and classifications “universal.” In an interview, Dr. Braunwald lamented the absence of the World Heart Federation, the ACC, and the AHA as active participants in this effort and suggested this paper is only the first step of a multistep process that requires input from many stakeholders.
“It’s important that these organizations be involved, not just to bless it, but to contribute their expertise to the process,” he said.
For his part, Dr. Mann hopes these changes will gain widespread acceptance and clinical traction. “The problem sometimes with guidelines is that they’re so data driven that you just can’t come out and say the obvious, so making a position statement is a good first step. And they got good international representation on this, so I think these changes will be accepted in the next heart failure guidelines.”
To encourage further discussion and acceptance, Robert J. Mentz, MD, and Anuradha Lala, MD, editor-in-chief and deputy editor of the Journal of Cardiac Failure, respectively, announced a series of multidisciplinary perspective pieces to be published in the journal monthly, starting in May with editorials from Dr. Clyde W Yancy, MD, MSc, and Carolyn S.P. Lam, MBBS, PhD, both of whom were authors of the consensus statement.
Dr. Bozkurt reports being a consultant for Abbott, Amgen, Baxter, Bristol Myers Squibb, Liva Nova Relypsa/Vifor Pharma, Respicardia, and being on the registry steering committee for Sanofi-Aventis. Dr. Braunwald reports research grant support through Brigham and Women’s Hospital from AstraZeneca, Daiichi Sankyo, Merck, and Novartis; and consulting for Amgen, Boehringer-Ingelheim/Lilly, Cardurion, MyoKardia, Novo Nordisk, and Verve. Dr. Mann has been a consultant to Novartis, is on the steering committee for the PARADISE trial, and is on the scientific advisory board for MyoKardia/Bristol Myers Squibb.
FROM THE JOURNAL OF CARDIAC FAILURE
Anticipating the care adolescents will need
Adolescents are an increasingly diverse population reflecting changes in the racial, ethnic, and geopolitical milieus of the United States. The World Health Organization classifies adolescence as ages 10 to 19 years.1 However, given the complexity of adolescent development physically, behaviorally, emotionally, and socially, others propose that adolescence may extend to age 24.2
Recognizing the specific challenges adolescents face is key to providing comprehensive longitudinal health care. Moreover, creating an environment of trust helps to ensure open 2-way communication that can facilitate anticipatory guidance.
Our review focuses on common adolescent issues, including injury from vehicles and firearms, tobacco and substance misuse, obesity, behavioral health, sexual health, and social media use. We discuss current trends and recommend strategies to maximize health and wellness.
Start by framing the visit
Confidentiality
Laws governing confidentiality in adolescent health care vary by state. Be aware of the laws pertaining to your practice setting. In addition, health care facilities may have their own policies regarding consent and confidentiality in adolescent care. Discuss confidentiality with both an adolescent and the parent/guardian at the initial visit. And, to help avoid potential misunderstandings, let them know in advance what will (and will not) be divulged.
The American Academy of Pediatrics has developed a useful tip sheet regarding confidentiality laws (www.aap.org/en-us/advocacy-and-policy/aap-health-initiatives/healthy-foster-care-america/Documents/Confidentiality_Laws.pdf). Examples of required (conditional) disclosure include abuse and suicidal or homicidal ideations. Patients should understand that sexually transmitted infections (STIs) are reportable to public health authorities and that potentially injurious behaviors to self or others (eg, excessive drinking prior to driving) may also warrant disclosure(TABLE 13).

Privacy and general visit structure
Create a safe atmosphere where adolescents can discuss personal issues without fear of repercussion or judgment. While parents may prefer to be present during the visit, allowing for time to visit independently with an adolescent offers the opportunity to reinforce issues of privacy and confidentiality. Also discuss your office policies regarding electronic communication, phone communication, and relaying test results.

A useful paradigm for organizing a visit for routine adolescent care is to use an expanded version of the HEADSS mnemonic (TABLE 24,5), which includes questions about an adolescent’s Home, Education, Activities, Drug and alcohol use, Sexual behavior, Suicidality and depression, and other topics. Other validated screening tools include RAAPS (Rapid Adolescent Prevention Screening)6 (www.possibilitiesforchange.com/raaps/); the Guidelines for Adolescent Preventive Services7; and the Bright Futures recommendations for preventive care from the American Academy of Pediatrics.8 Below, we consider important topics addressed with the HEADSS approach.

Continue to: Injury from vehicles and firearms
Injury from vehicles and firearms
Motor vehicle accidents and firearm wounds are the 2 leading causes of adolescent injury. In 2016, of the more than 20,000 deaths in children and adolescents (ages 1-19 years), 20% were due to motor vehicle accidents (4074) and 15% were a result of firearm-related injuries (3143). Among firearm-related deaths, 60% were homicides, 35% were suicides, and 4% were due to accidental discharge.9 The rate of firearm-related deaths among American teens is 36 times greater than that of any other developed nation.9 Currently, 1 of every 3 US households with children younger than 18 has a firearm. Data suggest that in 43% of these households, the firearm is loaded and kept in an unlocked location.10
To aid anticipatory guidance, ask adolescents about firearm and seat belt use, drinking and driving, and suicidal thoughts (TABLE 24,5). Advise them to always wear seat belts whether driving or riding as a passenger. They should never drink and drive (or get in a car with someone who has been drinking). Advise parents that if firearms are present in the household, they should be kept in a secure, locked location. Weapons should be separated from ammunition and safety mechanisms should be engaged on all devices.
Tobacco and substance misuse
Tobacco use, the leading preventable cause of death in the United States,11 is responsible for more deaths than alcohol, motor vehicle accidents, suicides, homicides, and HIV disease combined.12 Most tobacco-associated mortality occurs in individuals who began smoking before the age of 18.12 Individuals who start smoking early are also more likely to continue smoking through adulthood.
Encouragingly, tobacco use has declined significantly among adolescents over the past several decades. Roughly 1 in 25 high school seniors reports daily tobacco use.13 Adolescent smoking behaviors are also changing dramatically with the increasing popularity of electronic cigarettes (“vaping”). Currently, more adolescents vape than smoke cigarettes.13 Vaping has additional health risks including toxic lung injury.
Multiple resources can help combat tobacco and nicotine use in adolescents. The US Preventive Services Task Force recommends that primary care clinicians intervene through education or brief counselling to prevent initiation of tobacco use in school-aged children and adolescents.14 Ask teens about tobacco and electronic cigarette use and encourage them to quit when use is acknowledged. Other helpful office-based tools are the “Quit Line” 800-QUIT-NOW and texting “Quit” to 47848. Smokefree teen (https://teen.smokefree.gov/) is a website that reviews the risks of tobacco and nicotine use and provides age-appropriate cessation tools and tips (including a smartphone app and a live-chat feature). Other useful information is available in a report from the Surgeon General on preventing tobacco use among young adults.15
Continue to: Alcohol use
Alcohol use. Three in 5 high school students report ever having used alcohol.13 As with tobacco, adolescent alcohol use has declined over the past decade. However, binge drinking (≥ 5 drinks on 1 occasion for males; ≥ 4 drinks on 1 occasion for females) remains a common high-risk behavior among adolescents (particularly college students). Based on the Monitoring the Future Survey, 1 in 6 high school seniors reported binge drinking in the past 2 weeks.13 While historically more common among males, rates of binge drinking are now basically similar between male and female adolescents.13
The National Institute on Alcohol Abuse and Alcoholism has a screening and intervention guide specifically for adolescents.16
Illicit drug use. Half of adolescents report using an illicit drug by their senior year in high school.13 Marijuana is the most commonly used substance, and laws governing its use are rapidly changing across the United States. Marijuana is illegal in 10 states and legal in 10 states (and the District of Columbia). The remaining states have varying policies on the medical use of marijuana and the decriminalization of marijuana. In addition, cannabinoid (CBD) products are increasingly available. Frequent cannabis use in adolescence has an adverse impact on general executive function (compared with adult users) and learning.17 Marijuana may serve as a gateway drug in the abuse of other substances,18 and its use should be strongly discouraged in adolescents.
Of note, there has been a sharp rise in the illicit use of prescription drugs, particularly opioids, creating a public health emergency across the United States.19 In 2015, more than 4000 young people, ages 15 to 24, died from a drug-related overdose (> 50% of these attributable to opioids).20 Adolescents with a history of substance abuse and behavioral illness are at particular risk. Many adolescents who misuse opioids and other prescription drugs obtain them from friends and relatives.21
The Substance Abuse and Mental Health Services Administration (SAMHSA) recommends universal screening of adolescents for substance abuse. This screening should be accompanied by a brief intervention to prevent, mitigate, or eliminate substance use, or a referral to appropriate treatment sources. This process of screening, brief intervention, and referral to treatment (SBIRT) is recommended as part of routine health care.22
Continue to: Obesity and physical activity
Obesity and physical activity
The percentage of overweight and obese adolescents in the United States has more than tripled over the past 40 years,23 and 1 in 5 US adolescents is obese.23 Obese teens are at higher risk for multiple chronic diseases, including type 2 diabetes, sleep apnea, and heart disease.24 They are also more likely to be bullied and to have poor self-esteem.25 Only 1 in 5 American high school students engages in 60 or more minutes of moderate-to-vigorous physical activity on 5 or more days per week.26
Regular physical activity is, of course, beneficial for cardiorespiratory fitness, bone health, weight control, and improved indices of behavioral health.26 Adolescents who are physically active consistently demonstrate better school attendance and grades.17 Higher levels of physical fitness are also associated with improved overall cognitive performance.24
General recommendations. The Department of Health and Human Services recommends that adolescents get at least 60 minutes of mostly moderate physical activity every day.26 Encourage adolescents to engage in vigorous physical activity (heavy breathing, sweating) at least 3 days a week. As part of their physical activity patterns, adolescents should also engage in muscle-strengthening and bone-strengthening activities on at least 3 days per week.
Behavioral health
As young people develop their sense of personal identity, they also strive for independence. It can be difficult, at times, to differentiate normal adolescent rebellion from true mental illness. An estimated 17% to 19% of adolescents meet criteria for mental illness, and about 7% have a severe psychiatric disorder.27 Only one-third of adolescents with mental illness receive any mental health services.28
Depression. The 1-year incidence of major depression in adolescents is 3% to 4%, and the lifetime prevalence of depressive symptoms is 25% in all high school students.27 Risk factors include ethnic minority status, poor self-esteem, poor health, recent personal crisis, insomnia, and alcohol/substance abuse. Depression in adolescent girls is correlated with becoming sexually active at a younger age, failure to use contraception, having an STI, and suicide attempts. Depressed boys are more likely to have unprotected intercourse and participate in physical fights.29 Depressed teens have a 2- to 3-fold greater risk for behavioral disorders, anxiety, and attention-deficit/hyperactivity disorder (ADHD).30
Continue to: Suicide
Suicide. Among individuals 15 to 29 years of age, suicide is the second leading cause of death globally, with an annual incidence of 11 to 15 per 100,000.31 Suicide attempts are 10 to 20 times more common than completed suicide.31 Males are more likely than females to die by suicide,32 and boys with a history of attempted suicide have a 30-fold increased risk of subsequent successful suicide.31 Hanging, drug poisoning, and firearms (particularly for males) are the most common means of suicide in adolescents. More than half of adolescents dying by suicide have coexisting depression.31
Characteristics associated with suicidal behaviors in adolescents include impulsivity, poor problem-solving skills, and dichotomous thinking.31 There may be a genetic component as well. In 1 of 5 teenage suicides, a precipitating life event such as the break-up of a relationship, cyber-bullying, or peer rejection is felt to contribute.31
ADHD. The prevalence of ADHD is 7% to 9% in US school-aged children.33 Boys more commonly exhibit hyperactive behaviors, while girls have more inattention. Hyperactivity often diminishes in teens, but inattention and impulsivity persist. Sequelae of ADHD include high-risk sexual behaviors, motor vehicle accidents, incarceration, and substance abuse.34 Poor self-esteem, suicidal ideation, smoking, and obesity are also increased.34 ADHD often persists into adulthood, with implications for social relationships and job performance.34
Eating disorders. The distribution of eating disorders is now known to increasingly include more minorities and males, the latter representing 5% to 10% of cases.35 Eating disorders show a strong genetic tendency and appear to be accelerated by puberty. The most common eating disorder (diagnosed in 0.8%-14% of teens) is eating disorder not otherwise specified (NOS).35 Anorexia nervosa is diagnosed in 0.5% of adolescent girls, and bulimia nervosa in 1% to 2%—particularly among athletes and performers.35 Unanticipated loss of weight, amenorrhea, excessive concern about weight, and deceleration in height/weight curves are potential indicators of an eating disorder. When identified, eating disorders are best managed by a trusted family physician, acting as a coordinator of a multidisciplinary team.
Sexual health
Girls begin to menstruate at an average age of 12, and it takes about 4 years for them to reach reproductive maturity.36 Puberty has been documented to start at younger ages over the past 30 years, likely due to an increase in average body mass index and a decrease in levels of physical activity.37 Girls with early maturation are often insecure and self-conscious, with higher levels of psychological distress.38 In boys, the average age for spermarche (first ejaculation) is 13.39 Boys who mature early tend to be taller, be more confident, and express a good body image.40 Those who have early puberty are more likely to be sexually active or participate in high-risk behaviors.41
Continue to: Pregnancy and contraception
Pregnancy and contraception
Over the past several decades, more US teens have been abstaining from sexual intercourse or have been using effective forms of birth control, particularly condoms and long-acting reversible contraceptives (LARCs).42 Teenage birth rates in girls ages 15 to 19 have declined significantly since the 1980s.42 Despite this, the teenage birth rate in the United States remains higher than in other industrialized nations, and most teen pregnancies are unintended.
There are numerous interventions to reduce teen pregnancy, including sex education, contraceptive counseling, the use of mobile apps that track a user’s monthly fertility cycle or issue reminders to take oral contraceptives,45 and the liberal distribution of contraceptives and condoms. The Contraceptive CHOICE Project shows that providing free (or low-cost) LARCs influences young women to choose these as their preferred contraceptive method.46 Other programs specifically empower girls to convince partners to use condoms and to resist unwanted sexual advances or intimate partner violence.
Adolescents prefer to have their health care providers address the topic of sexual health. Teens are more likely to share information with providers if asked directly about sexual behaviors.47TABLE 24,5 offers tips for anticipatory guidance and potential ways to frame questions with adolescents in this context. State laws vary with regard to the ability of minors to seek contraception, pregnancy testing, or care/screening for STIs without parental consent. Contraceptive counseling combined with effective screening decrease the incidence of STIs and pelvic inflammatory disease for sexually active teens.48

Sexually transmitted infections
Young adolescents often have a limited ability to imagine consequences related to specific actions. In general, there is also an increased desire to engage in experimental behaviors as an expression of developing autonomy, which may expose them to STIs. About half of all STIs contracted in the United States occur in individuals 15 to 24 years of age.49 Girls are at particular risk for the sequelae of these infections, including cervical dysplasia and infertility. Many teens erroneously believe that sexual activities other than intercourse decrease their risk of contracting an STI.50
Human papillomavirus (HPV) infection is the most common STI in adolescence.51 In most cases, HPV is transient and asymptomatic. Oncogenic strains may cause cervical cancer or cancers of the anogenital or oropharyngeal systems. Due to viral latency, it is not recommended to perform HPV typing in men or in women younger than 30 years of age; however, Pap tests are recommended every 3 years for women ages 21 to 29. Primary care providers are pivotal in the public health struggle to prevent HPV infection.
Continue to: Universal immunization of all children...
Universal immunization of all children older than 11 years of age against HPV is strongly advised as part of routine well-child care. Emphasize the proven role of HPV vaccination in preventing cervical52 and oropharyngeal53 cancers. And be prepared to address concerns raised by parents in the context of vaccine safety and the initiation of sexual behaviors (www.cdc.gov/hpv/hcp/answering-questions.html).
Chlamydia is the second most common STI in the United States, usually occurring in individuals younger than 24.54 The CDC estimates that more than 3 million new chlamydial infections occur yearly. These infections are often asymptomatic, particularly in females, but may cause urethritis, cervicitis, epididymitis, proctitis, or pelvic inflammatory disease. Indolent chlamydial infection is the leading cause of tubal infertility in women.54 Routine annual screening for chlamydia is recommended for all sexually active females ≤ 25 years (and for older women with specific risks).55 Annual screening is also recommended for men who have sex with men (MSM).55
Chlamydial infection may be diagnosed with first-catch urine sampling (men or women), urethral swab (men), endocervical swab (women), or self-collected vaginal swab. Nucleic acid amplification testing is the most sensitive test that is widely available.56 First-line treatment includes either azithromycin (1 g orally, single dose) or doxycycline (100 mg orally, twice daily for 7 days).56
Gonorrhea. In 2018, there were more than 500,000 annual cases of gonorrhea, with the majority occurring in those between 15 and 24 years of age.57 Gonorrhea may increase rates of HIV infection transmission up to 5-fold.57 As more adolescents practice oral sex, cases of pharyngeal gonorrhea (and oropharyngeal HPV) have increased. Symptoms of urethritis occur more frequently in men. Screening is recommended for all sexually active women younger than 25.56 Importantly, the organism Neisseria gonorrhoeae has developed significant antibiotic resistance over the past decade. The CDC currently recommends dual therapy for the treatment of gonorrhea using 250 mg of intramuscular ceftriaxone and 1 g of oral azithromycin.56
Syphilis. Rates of syphilis are increasing among individuals ages 15 to 24.51 Screening is particularly recommended for MSM and individuals infected with HIV. Benzathine penicillin G, 50,000 U/kg IM, remains the treatment of choice.56
Continue to: HIV
HIV. Globally, HIV impacts young people disproportionately. HIV infection also facilitates infection with other STIs. In the United States, the highest burden of HIV infection is borne by young MSM, with prevalence among those 18 to 24 years old varying between 26% to 30% (black) and 3% to 5.5% (non-Hispanic white).51 The use of emtricitabine/tenofovir disoproxil fumarate for pre-exposure prophylaxis (PrEP) has recently been approved for the prevention of HIV. PrEP reduces risk by up to 92% for MSM and transgender women.58
Sexual identity
One in 10 high school students self-identifies as “nonheterosexual,” and 1 in 15 reports same-sex sexual contact.59 The term LGBTQ+ includes the communities of lesbian, gay, bisexual, transgender, transsexual, queer, questioning, intersex, and asexual individuals. Developing a safe sense of sexual identity is fundamental to adolescent psychological development, and many adolescents struggle to develop a positive sexual identity. Suicide rates and self-harm behaviors among LGBTQ+ adolescents can be 4 times higher than among their heterosexual peers.60 Rates of mood disorders, substance abuse, and high-risk sexual behaviors are also increased in the LGBTQ+ population.61
The LGBTQ+ community often seeks health care advice and affirmation from primary care providers. Resources to enhance this care are available at www.lgbthealtheducation.org.
Social media
Adolescents today have more media exposure than any prior generation, with smartphone and computer use increasing exponentially. Most (95%) teens have access to a smartphone,62 45% describe themselves as constantly connected to the Internet, and 14% feel that social media is “addictive.”62 Most manage their social media portfolio on multiple sites. Patterns of adolescents' online activities show that boys prefer online gaming, while girls tend to spend more time on social networking.62
Whether extensive media use is psychologically beneficial or deleterious has been widely debated. Increased time online correlates with decreased levels of physical activity.63 And sleep disturbances have been associated with excessive screen time and the presence of mobile devices in the bedroom.64 The use of social media prior to bedtime also has an adverse impact on academic performance—particularly for girls. This adverse impact on academics persists after correcting for daytime sleepiness, body mass index, and number of hours spent on homework.64
Continue to: Due to growing concerns...
Due to growing concerns about the risks of social media in children and adolescents, the American Academy of Pediatrics has developed the Family Media Plan (www.healthychildren.org/English/media/Pages/default.aspx). Some specific questions that providers may ask are outlined in TABLE 3.64 The Family Media Plan can provide age-specific guidelines to assist parents or caregivers in answering these questions.
Cyber-bullying. One in 3 adolescents (primarily female) has been a victim of cyber-bullying.65 Sadly, 1 in 5 teens has received some form of electronic sexual solicitation.66 The likelihood of unsolicited stranger contact correlates with teens’ online habits and the amount of information disclosed. Predictors include female sex, visiting chat rooms, posting photos, and disclosing personal information. Restricting computer use to an area with parental supervision or installing monitoring programs does not seem to exert any protective influence on cyber-bullying or unsolicited stranger contact.65 While 63% of cyber-bullying victims feel upset, embarrassed, or stressed by these contacts,66 few events are actually reported. To address this, some states have adopted laws adding cyber-bullying to school disciplinary codes.
Negative health impacts associated with cyber-bullying include anxiety, sadness, and greater difficulty in concentrating on school work.65 Victims of bullying are more likely to have school disciplinary actions and depression and to be truant or to carry weapons to school.66 Cyber-bullying is uniquely destructive due to its ubiquitous presence. A sense of relative anonymity online may encourage perpetrators to act more cruelly, with less concern for punishment.
Young people are also more likely to share passwords as a sign of friendship. This may result in others assuming their identity online. Adolescents rarely disclose bullying to parents or other adults, fearing restriction of Internet access, and many of them think that adults may downplay the seriousness of the events.66
CORRESPONDENCE
Mark B. Stephens, MD, Penn State Health Medical Group, 1850 East Park Avenue, State College, PA 16803; [email protected].
1. World Health Organization. Adolescent health. Accessed February 23, 2021. www.who.int/maternal_child_adolescent/adolescence/en/
2. Sawyer SM, Azzopardi PS, Wickremarathne D, et al. The age of adolescence. Lancet Child Adolesc Health. 2018;2:223-228.
3. Pathak PR, Chou A. Confidential care for adoloscents in the U.S. healthcare system. J Patient Cent Res Rev. 2019;6:46-50.
4. AMA Journal of Ethics. HEADSS: the “review of systems” for adolescents. Accessed February 23, 2021. https://journalofethics.ama-assn.org/article/headss-review-systems-adolescents/2005-03
5. Cohen E, MacKenzie RG, Yates GL. HEADSS, a psychosocial risk assessment instrument: implications for designing effective intervention programs for runaway youth. J Adolesc Health. 1991;12:539-544.
6. Possibilities for Change. Rapid Adolescent Prevention Screening (RAAPS). Accessed February 23, 2021. www.possibilitiesforchange.com/raaps/
7. Elster AB, Kuznets NJ. AMA Guidelines for Adolescent Preventive Services (GAPS): Recommendations and Rationale. Williams & Wilkins; 1994.
8. AAP. Engaging patients and families - periodicity schedule. Accessed February 23, 2021. www.aap.org/en-us/professional-resources/practice-support/Pages/PeriodicitySchedule.aspx
9. Cunningham RM, Walton MA, Carter PM. The major causes of death in children and adolescents in the United States. N Eng J Med. 2018;379:2468-2475.
10. Schuster MA, Franke TM, Bastian AM, et al. Firearm storage patterns in US homes with children. Am J Public Health. 2000;90:588-594.
11. Mokdad AH, Marks JS, Stroup DF, et al. Actual causes of death in the United States. JAMA. 2004;291:1238-1245.
12. HHS. Health consequences of smoking, surgeon general fact sheet. Accessed February 23, 2021. www.hhs.gov/surgeongeneral/reports-and-publications/tobacco/consequences-smoking-factsheet/index.html
13. Johnston LD, Miech RA, O’Malley PM, et al. Monitoring the future: national survey results on drug use, 1975-2017. The University of Michigan. 2018. Accessed February 23, 2021. https://eric.ed.gov/?id=ED589762
14. US Preventive Services Task Force. Prevention and cessation of tobacco use in children and adolescents: primary care interventions. Accessed February 23, 2021. www.uspreventiveservicestaskforce.org/uspstf/recommendation/tobacco-and-nicotine-use-prevention-in-children-and-adolescents-primary-care-interventions
15. HHS. Preventing Tobacco Use Among Youth and Young Adults: A Report of the Surgeon General. Atlanta, GA: HHS, CDC, NCCDPHP, OSH; 2012. Accessed February 23, 2021. www.ncbi.nlm.nih.gov/books/NBK99237/
16. NIH. Alcohol screening and brief intervention for youth: a pocket guide. Accessed February 23, 2021. https://pubs.niaaa.nih.gov/publications/Practitioner/YouthGuide/YouthGuidePocket.pdf
17. Gorey C, Kuhns L, Smaragdi E, et al. Age-related differences in the impact of cannabis use on the brain and cognition: a systematic review. Eur Arch Psychiatry Clin Neurosci. 2019;269:37-58.
18. Secades-Villa R, Garcia-Rodriguez O, Jin CJ, et al. Probability and predictors of the cannabis gateway effect: a national study. Int J Drug Policy. 2015;26:135-142.
19. Kann L, McManus T, Harris WA, et al. Youth risk behavior surveillance—United States, 2017. MMWR Surveill Summ. 2018;67:1-114.
20. NIH. Drug overdoses in youth. How do drug overdoses happen?. Accessed February 23, 2021. https://teens.drugabuse.gov/drug-facts/drug-overdoses-youth
21. Branstetter SA, Low S, Furman W. The influence of parents and friends on adolescent substance use: a multidimensional approach. J Subst Use. 2011;162:150-160.
22. AAP. Committee on Substance Use and Prevention. Substance use screening, brief intervention, and referral to treatment. Pediatrics. 2016;138:e20161210.
23. Hales CM, Carroll MD, Fryar CD, et al. Prevalence of obesity among adults and youth: United States, 2015–2016. NCHS Data Brief. 2017;288:1-8.
24. Halfon N, Larson K, Slusser W. Associations between obesity and comorbid mental health, developmental and physical health conditions in a nationally representative sample of US children aged 10 to 17. Acad Pediatr. 2013;13:6-13.
25. Griffiths LJ, Parsons TJ, Hill AJ. Self-esteem and quality of life in obese children and adolescents: a systematic review. Int J Pediatr Obes. 2010;5:282-304.
26. National Physical Activity Plan Alliance. The 2018 United States report card on physical activity for children and youth. Accessed February 23, 2021. http://physicalactivityplan.org/projects/PA/2018/2018%20US%20Report%20Card%20Full%20Version_WEB.PDF?pdf=page-link
27. HHS. NIMH. Child and adolescent mental health. Accessed February 23, 2021. www.nimh.nih.gov/health/topics/child-and-adolescent-mental-health/index.shtml
28. Yonek JC, Jordan N, Dunlop D, et al. Patient-centered medical home care for adolescents in need of mental health treatment. J Adolesc Health. 2018;63:172-180.
29. Brooks TL, Harris SK, Thrall JS, et al. Association of adolescent risk behaviors with mental health symptoms in high school students. |J Adolesc Health. 2002;31:240-246.
30. Weller BE, Blanford KL, Butler AM. Estimated prevalence of psychiatric comorbidities in US adolescents with depression by race/ethnicity, 2011-2012. J Adolesc Health. 2018;62:716-721.
31. Bilsen J. Suicide and youth: risk factors. Front Psychiatry. 2018;9:540.
32. Shain B, AAP Committee on Adolescence. Suicide and suicide attempts in adolescents. Pediatrics. 2016;138:e20161420.
33. Brahmbhatt K, Hilty DM, Hah M, et al. Diagnosis and treatment of attention deficit hyperactivity disorder during adolescence in the primary care setting: review and future directions. J Adolesc Health. 2016;59:135-143.
34. Bravender T. Attention-deficit/hyperactivity disorder and disordered eating. [editorial] J Adolesc Health. 2017;61:125-126.
35. Rosen DS, AAP Committee on Adolescence. Identification and management of eating disorders in children and adolescents. Pediatrics. 2010;126:1240-1253.
36. Susman EJ, Houts RM, Steinberg L, et al. Longitudinal development of secondary sexual characteristics in girls and boys between ages 9 ½ and 15 ½ years. Arch Pediatr Adolesc Med. 2010;164:166-173.
37. Kaplowitz PB. Link between body fat and the timing of puberty. Pediatrics. 2008;121(suppl 3):S208-S217.
38. Ge X, Conger RD, Elder GH. Coming of age too early: pubertal influences on girl’s vulnerability to psychologic distress. Child Dev. 1996;67:3386-3400.
39. Jørgensen M, Keiding N, Skakkebaek NE. Estimation of spermarche from longitudinal spermaturia data. Biometrics. 1991;47:177-193.
40. Kar SK, Choudhury A, Singh AP. Understanding normal development of adolescent sexuality: a bumpy ride. J Hum Reprod Sci. 2015;8:70-74.
41. Susman EJ, Dorn LD, Schiefelbein VL. Puberty, sexuality and health. In: Lerner MA, Easterbrooks MA, Mistry J (eds). Comprehensive Handbook of Psychology. Wiley; 2003.
42. Lindberg LD, Santelli JS, Desai S. Changing patterns of contraceptive use and the decline in rates of pregnancy and birth among U.S. adolescents, 2007-2014. J Adolesc Health. 2018;63:253-256.
43. Guttmacher Institute. Teen pregnancy. www.guttmacher.org/united-states/teens/teen-pregnancy. Accessed February 23, 2021.
44. CDC. Social determinants and eliminating disparities in teen pregnancy. Accessed February 23, 2021. www.cdc.gov/teenpregnancy/about/social-determinants-disparities-teen-pregnancy.htm
45. Widman L, Nesi J, Kamke K, et al. Technology-based interventions to reduce sexually transmitted infection and unintended pregnancy among youth. J Adolesc Health. 2018;62:651-660.
46. Secura GM, Allsworth JE, Madden T, et al. The Contraceptive CHOICE Project: reducing barriers to long-acting reversible contraception. Am J Obstet Gynecol. 2010;203:115.e1-115.e7.
47. Ham P, Allen C. Adolescent health screening and counseling. Am Fam Physician. 2012;86:1109-1116.
48. ACOG. Committee on Adolescent Health Care. Adolescent pregnancy, contraception and sexual activity. 2017. Accessed February 23, 2021. www.acog.org/clinical/clinical-guidance/committee-opinion/articles/2017/05/adolescent-pregnancy-contraception-and-sexual-activity
49. Wangu Z, Burstein GR. Adolescent sexuality: updates to the sexually transmitted infection guidelines. Pediatr Clin N Am. 2017;64:389-411.
50. Holway GV, Hernandez SM. Oral sex and condom use in a U.S. national sample of adolescents and young adults. J Adolesc Health. 2018;62:402-410.
51. CDC. STDs in adults and adolescents. Accessed February 23, 2021. www.cdc.gov/std/stats17/adolescents.htm
52. McClung N, Gargano J, Bennett N, et al. Trends in human papillomavirus vaccine types 16 and 18 in cervical precancers, 2008-2014. Accessed February 23, 2021. https://cebp.aacrjournals.org/content/28/3/602
53. Timbang MR, Sim MW, Bewley AF, et al. HPV-related oropharyngeal cancer: a review on burden of the disease and opportunities for prevention and early detection. Hum Vaccin Immunother. 2019;15:1920-1928.
54. Carey AJ, Beagley KW. Chlamydia trachomatis, a hidden epidemic: effects on female reproduction and options for treatment. Am J Reprod Immunol. 2010;63:576-586.
55. USPSTF. Chlamydia and gonorrhea screening. Accessed February 23, 2021. www.uspreventiveservicestaskforce.org/Page/Document/RecommendationStatementFinal/chlamydia-and-gonorrhea-screening
56. Workowski KA, Bolan GA. Sexually transmitted diseases treatment guidelines, 2015. MMWR Morb Mortal Wkly Rep. 2015;64:1-135.
57. CDC. Sexually transmitted disease surveillance 2018. Accessed February 23, 2021. www.cdc.gov/std/stats18/gonorrhea.htm
5
59. Kann L, McManus T, Harris WA, et al. Youth risk behavior surveillance–United States, 2015. MMWR Surveill Summ. 2016;65:1-174.
60. CDC. LGBT youth. Accessed February 23, 2021. www.cdc.gov/lgbthealth/youth.htm
61. Johns MM, Lowry R, Rasberry CN, et al. Violence victimization, substance use, and suicide risk among sexual minority high school students – United States, 2015-2017. MMWR Morb Mortal Wkly Rep. 2018;67:1211-1215.
62. Pew Research Center. Teens, social media & technology 2018. . Accessed February 23, 2021. www.pewinternet.org/2018/05/31/teens-social-media-technology-2018/
63. Chassiakos YLR, Radesky J, Christakis D, et al. Children and adolescents and digital media. Pediatrics. 2016;138:e20162593.
64. Arora T, Albahri A, Omar OM, et al. The prospective association between electronic device use before bedtime and academic attainment in adolescents. J Adolesc Health. 2018;63:451-458.
65. Mishna F, Saini M, Solomon S. Ongoing and online: children and youth’s perceptions of cyber bullying. Child Youth Serv Rev. 2009;31:1222-1228.
66. Sengupta A, Chaudhuri A. Are social networking sites a source of online harassment for teens? Evidence from survey data. Child Youth Serv Rev. 2011;33:284-290.
Adolescents are an increasingly diverse population reflecting changes in the racial, ethnic, and geopolitical milieus of the United States. The World Health Organization classifies adolescence as ages 10 to 19 years.1 However, given the complexity of adolescent development physically, behaviorally, emotionally, and socially, others propose that adolescence may extend to age 24.2
Recognizing the specific challenges adolescents face is key to providing comprehensive longitudinal health care. Moreover, creating an environment of trust helps to ensure open 2-way communication that can facilitate anticipatory guidance.
Our review focuses on common adolescent issues, including injury from vehicles and firearms, tobacco and substance misuse, obesity, behavioral health, sexual health, and social media use. We discuss current trends and recommend strategies to maximize health and wellness.
Start by framing the visit
Confidentiality
Laws governing confidentiality in adolescent health care vary by state. Be aware of the laws pertaining to your practice setting. In addition, health care facilities may have their own policies regarding consent and confidentiality in adolescent care. Discuss confidentiality with both an adolescent and the parent/guardian at the initial visit. And, to help avoid potential misunderstandings, let them know in advance what will (and will not) be divulged.
The American Academy of Pediatrics has developed a useful tip sheet regarding confidentiality laws (www.aap.org/en-us/advocacy-and-policy/aap-health-initiatives/healthy-foster-care-america/Documents/Confidentiality_Laws.pdf). Examples of required (conditional) disclosure include abuse and suicidal or homicidal ideations. Patients should understand that sexually transmitted infections (STIs) are reportable to public health authorities and that potentially injurious behaviors to self or others (eg, excessive drinking prior to driving) may also warrant disclosure(TABLE 13).
Privacy and general visit structure
Create a safe atmosphere where adolescents can discuss personal issues without fear of repercussion or judgment. While parents may prefer to be present during the visit, allowing for time to visit independently with an adolescent offers the opportunity to reinforce issues of privacy and confidentiality. Also discuss your office policies regarding electronic communication, phone communication, and relaying test results.
A useful paradigm for organizing a visit for routine adolescent care is to use an expanded version of the HEADSS mnemonic (TABLE 24,5), which includes questions about an adolescent’s Home, Education, Activities, Drug and alcohol use, Sexual behavior, Suicidality and depression, and other topics. Other validated screening tools include RAAPS (Rapid Adolescent Prevention Screening)6 (www.possibilitiesforchange.com/raaps/); the Guidelines for Adolescent Preventive Services7; and the Bright Futures recommendations for preventive care from the American Academy of Pediatrics.8 Below, we consider important topics addressed with the HEADSS approach.
Continue to: Injury from vehicles and firearms
Injury from vehicles and firearms
Motor vehicle accidents and firearm wounds are the 2 leading causes of adolescent injury. In 2016, of the more than 20,000 deaths in children and adolescents (ages 1-19 years), 20% were due to motor vehicle accidents (4074) and 15% were a result of firearm-related injuries (3143). Among firearm-related deaths, 60% were homicides, 35% were suicides, and 4% were due to accidental discharge.9 The rate of firearm-related deaths among American teens is 36 times greater than that of any other developed nation.9 Currently, 1 of every 3 US households with children younger than 18 has a firearm. Data suggest that in 43% of these households, the firearm is loaded and kept in an unlocked location.10
To aid anticipatory guidance, ask adolescents about firearm and seat belt use, drinking and driving, and suicidal thoughts (TABLE 24,5). Advise them to always wear seat belts whether driving or riding as a passenger. They should never drink and drive (or get in a car with someone who has been drinking). Advise parents that if firearms are present in the household, they should be kept in a secure, locked location. Weapons should be separated from ammunition and safety mechanisms should be engaged on all devices.
Tobacco and substance misuse
Tobacco use, the leading preventable cause of death in the United States,11 is responsible for more deaths than alcohol, motor vehicle accidents, suicides, homicides, and HIV disease combined.12 Most tobacco-associated mortality occurs in individuals who began smoking before the age of 18.12 Individuals who start smoking early are also more likely to continue smoking through adulthood.
Encouragingly, tobacco use has declined significantly among adolescents over the past several decades. Roughly 1 in 25 high school seniors reports daily tobacco use.13 Adolescent smoking behaviors are also changing dramatically with the increasing popularity of electronic cigarettes (“vaping”). Currently, more adolescents vape than smoke cigarettes.13 Vaping has additional health risks including toxic lung injury.
Multiple resources can help combat tobacco and nicotine use in adolescents. The US Preventive Services Task Force recommends that primary care clinicians intervene through education or brief counselling to prevent initiation of tobacco use in school-aged children and adolescents.14 Ask teens about tobacco and electronic cigarette use and encourage them to quit when use is acknowledged. Other helpful office-based tools are the “Quit Line” 800-QUIT-NOW and texting “Quit” to 47848. Smokefree teen (https://teen.smokefree.gov/) is a website that reviews the risks of tobacco and nicotine use and provides age-appropriate cessation tools and tips (including a smartphone app and a live-chat feature). Other useful information is available in a report from the Surgeon General on preventing tobacco use among young adults.15
Continue to: Alcohol use
Alcohol use. Three in 5 high school students report ever having used alcohol.13 As with tobacco, adolescent alcohol use has declined over the past decade. However, binge drinking (≥ 5 drinks on 1 occasion for males; ≥ 4 drinks on 1 occasion for females) remains a common high-risk behavior among adolescents (particularly college students). Based on the Monitoring the Future Survey, 1 in 6 high school seniors reported binge drinking in the past 2 weeks.13 While historically more common among males, rates of binge drinking are now basically similar between male and female adolescents.13
The National Institute on Alcohol Abuse and Alcoholism has a screening and intervention guide specifically for adolescents.16
Illicit drug use. Half of adolescents report using an illicit drug by their senior year in high school.13 Marijuana is the most commonly used substance, and laws governing its use are rapidly changing across the United States. Marijuana is illegal in 10 states and legal in 10 states (and the District of Columbia). The remaining states have varying policies on the medical use of marijuana and the decriminalization of marijuana. In addition, cannabinoid (CBD) products are increasingly available. Frequent cannabis use in adolescence has an adverse impact on general executive function (compared with adult users) and learning.17 Marijuana may serve as a gateway drug in the abuse of other substances,18 and its use should be strongly discouraged in adolescents.
Of note, there has been a sharp rise in the illicit use of prescription drugs, particularly opioids, creating a public health emergency across the United States.19 In 2015, more than 4000 young people, ages 15 to 24, died from a drug-related overdose (> 50% of these attributable to opioids).20 Adolescents with a history of substance abuse and behavioral illness are at particular risk. Many adolescents who misuse opioids and other prescription drugs obtain them from friends and relatives.21
The Substance Abuse and Mental Health Services Administration (SAMHSA) recommends universal screening of adolescents for substance abuse. This screening should be accompanied by a brief intervention to prevent, mitigate, or eliminate substance use, or a referral to appropriate treatment sources. This process of screening, brief intervention, and referral to treatment (SBIRT) is recommended as part of routine health care.22
Continue to: Obesity and physical activity
Obesity and physical activity
The percentage of overweight and obese adolescents in the United States has more than tripled over the past 40 years,23 and 1 in 5 US adolescents is obese.23 Obese teens are at higher risk for multiple chronic diseases, including type 2 diabetes, sleep apnea, and heart disease.24 They are also more likely to be bullied and to have poor self-esteem.25 Only 1 in 5 American high school students engages in 60 or more minutes of moderate-to-vigorous physical activity on 5 or more days per week.26
Regular physical activity is, of course, beneficial for cardiorespiratory fitness, bone health, weight control, and improved indices of behavioral health.26 Adolescents who are physically active consistently demonstrate better school attendance and grades.17 Higher levels of physical fitness are also associated with improved overall cognitive performance.24
General recommendations. The Department of Health and Human Services recommends that adolescents get at least 60 minutes of mostly moderate physical activity every day.26 Encourage adolescents to engage in vigorous physical activity (heavy breathing, sweating) at least 3 days a week. As part of their physical activity patterns, adolescents should also engage in muscle-strengthening and bone-strengthening activities on at least 3 days per week.
Behavioral health
As young people develop their sense of personal identity, they also strive for independence. It can be difficult, at times, to differentiate normal adolescent rebellion from true mental illness. An estimated 17% to 19% of adolescents meet criteria for mental illness, and about 7% have a severe psychiatric disorder.27 Only one-third of adolescents with mental illness receive any mental health services.28
Depression. The 1-year incidence of major depression in adolescents is 3% to 4%, and the lifetime prevalence of depressive symptoms is 25% in all high school students.27 Risk factors include ethnic minority status, poor self-esteem, poor health, recent personal crisis, insomnia, and alcohol/substance abuse. Depression in adolescent girls is correlated with becoming sexually active at a younger age, failure to use contraception, having an STI, and suicide attempts. Depressed boys are more likely to have unprotected intercourse and participate in physical fights.29 Depressed teens have a 2- to 3-fold greater risk for behavioral disorders, anxiety, and attention-deficit/hyperactivity disorder (ADHD).30
Continue to: Suicide
Suicide. Among individuals 15 to 29 years of age, suicide is the second leading cause of death globally, with an annual incidence of 11 to 15 per 100,000.31 Suicide attempts are 10 to 20 times more common than completed suicide.31 Males are more likely than females to die by suicide,32 and boys with a history of attempted suicide have a 30-fold increased risk of subsequent successful suicide.31 Hanging, drug poisoning, and firearms (particularly for males) are the most common means of suicide in adolescents. More than half of adolescents dying by suicide have coexisting depression.31
Characteristics associated with suicidal behaviors in adolescents include impulsivity, poor problem-solving skills, and dichotomous thinking.31 There may be a genetic component as well. In 1 of 5 teenage suicides, a precipitating life event such as the break-up of a relationship, cyber-bullying, or peer rejection is felt to contribute.31
ADHD. The prevalence of ADHD is 7% to 9% in US school-aged children.33 Boys more commonly exhibit hyperactive behaviors, while girls have more inattention. Hyperactivity often diminishes in teens, but inattention and impulsivity persist. Sequelae of ADHD include high-risk sexual behaviors, motor vehicle accidents, incarceration, and substance abuse.34 Poor self-esteem, suicidal ideation, smoking, and obesity are also increased.34 ADHD often persists into adulthood, with implications for social relationships and job performance.34
Eating disorders. The distribution of eating disorders is now known to increasingly include more minorities and males, the latter representing 5% to 10% of cases.35 Eating disorders show a strong genetic tendency and appear to be accelerated by puberty. The most common eating disorder (diagnosed in 0.8%-14% of teens) is eating disorder not otherwise specified (NOS).35 Anorexia nervosa is diagnosed in 0.5% of adolescent girls, and bulimia nervosa in 1% to 2%—particularly among athletes and performers.35 Unanticipated loss of weight, amenorrhea, excessive concern about weight, and deceleration in height/weight curves are potential indicators of an eating disorder. When identified, eating disorders are best managed by a trusted family physician, acting as a coordinator of a multidisciplinary team.
Sexual health
Girls begin to menstruate at an average age of 12, and it takes about 4 years for them to reach reproductive maturity.36 Puberty has been documented to start at younger ages over the past 30 years, likely due to an increase in average body mass index and a decrease in levels of physical activity.37 Girls with early maturation are often insecure and self-conscious, with higher levels of psychological distress.38 In boys, the average age for spermarche (first ejaculation) is 13.39 Boys who mature early tend to be taller, be more confident, and express a good body image.40 Those who have early puberty are more likely to be sexually active or participate in high-risk behaviors.41
Continue to: Pregnancy and contraception
Pregnancy and contraception
Over the past several decades, more US teens have been abstaining from sexual intercourse or have been using effective forms of birth control, particularly condoms and long-acting reversible contraceptives (LARCs).42 Teenage birth rates in girls ages 15 to 19 have declined significantly since the 1980s.42 Despite this, the teenage birth rate in the United States remains higher than in other industrialized nations, and most teen pregnancies are unintended.
There are numerous interventions to reduce teen pregnancy, including sex education, contraceptive counseling, the use of mobile apps that track a user’s monthly fertility cycle or issue reminders to take oral contraceptives,45 and the liberal distribution of contraceptives and condoms. The Contraceptive CHOICE Project shows that providing free (or low-cost) LARCs influences young women to choose these as their preferred contraceptive method.46 Other programs specifically empower girls to convince partners to use condoms and to resist unwanted sexual advances or intimate partner violence.
Adolescents prefer to have their health care providers address the topic of sexual health. Teens are more likely to share information with providers if asked directly about sexual behaviors.47TABLE 24,5 offers tips for anticipatory guidance and potential ways to frame questions with adolescents in this context. State laws vary with regard to the ability of minors to seek contraception, pregnancy testing, or care/screening for STIs without parental consent. Contraceptive counseling combined with effective screening decrease the incidence of STIs and pelvic inflammatory disease for sexually active teens.48
Sexually transmitted infections
Young adolescents often have a limited ability to imagine consequences related to specific actions. In general, there is also an increased desire to engage in experimental behaviors as an expression of developing autonomy, which may expose them to STIs. About half of all STIs contracted in the United States occur in individuals 15 to 24 years of age.49 Girls are at particular risk for the sequelae of these infections, including cervical dysplasia and infertility. Many teens erroneously believe that sexual activities other than intercourse decrease their risk of contracting an STI.50
Human papillomavirus (HPV) infection is the most common STI in adolescence.51 In most cases, HPV is transient and asymptomatic. Oncogenic strains may cause cervical cancer or cancers of the anogenital or oropharyngeal systems. Due to viral latency, it is not recommended to perform HPV typing in men or in women younger than 30 years of age; however, Pap tests are recommended every 3 years for women ages 21 to 29. Primary care providers are pivotal in the public health struggle to prevent HPV infection.
Continue to: Universal immunization of all children...
Universal immunization of all children older than 11 years of age against HPV is strongly advised as part of routine well-child care. Emphasize the proven role of HPV vaccination in preventing cervical52 and oropharyngeal53 cancers. And be prepared to address concerns raised by parents in the context of vaccine safety and the initiation of sexual behaviors (www.cdc.gov/hpv/hcp/answering-questions.html).
Chlamydia is the second most common STI in the United States, usually occurring in individuals younger than 24.54 The CDC estimates that more than 3 million new chlamydial infections occur yearly. These infections are often asymptomatic, particularly in females, but may cause urethritis, cervicitis, epididymitis, proctitis, or pelvic inflammatory disease. Indolent chlamydial infection is the leading cause of tubal infertility in women.54 Routine annual screening for chlamydia is recommended for all sexually active females ≤ 25 years (and for older women with specific risks).55 Annual screening is also recommended for men who have sex with men (MSM).55
Chlamydial infection may be diagnosed with first-catch urine sampling (men or women), urethral swab (men), endocervical swab (women), or self-collected vaginal swab. Nucleic acid amplification testing is the most sensitive test that is widely available.56 First-line treatment includes either azithromycin (1 g orally, single dose) or doxycycline (100 mg orally, twice daily for 7 days).56
Gonorrhea. In 2018, there were more than 500,000 annual cases of gonorrhea, with the majority occurring in those between 15 and 24 years of age.57 Gonorrhea may increase rates of HIV infection transmission up to 5-fold.57 As more adolescents practice oral sex, cases of pharyngeal gonorrhea (and oropharyngeal HPV) have increased. Symptoms of urethritis occur more frequently in men. Screening is recommended for all sexually active women younger than 25.56 Importantly, the organism Neisseria gonorrhoeae has developed significant antibiotic resistance over the past decade. The CDC currently recommends dual therapy for the treatment of gonorrhea using 250 mg of intramuscular ceftriaxone and 1 g of oral azithromycin.56
Syphilis. Rates of syphilis are increasing among individuals ages 15 to 24.51 Screening is particularly recommended for MSM and individuals infected with HIV. Benzathine penicillin G, 50,000 U/kg IM, remains the treatment of choice.56
Continue to: HIV
HIV. Globally, HIV impacts young people disproportionately. HIV infection also facilitates infection with other STIs. In the United States, the highest burden of HIV infection is borne by young MSM, with prevalence among those 18 to 24 years old varying between 26% to 30% (black) and 3% to 5.5% (non-Hispanic white).51 The use of emtricitabine/tenofovir disoproxil fumarate for pre-exposure prophylaxis (PrEP) has recently been approved for the prevention of HIV. PrEP reduces risk by up to 92% for MSM and transgender women.58
Sexual identity
One in 10 high school students self-identifies as “nonheterosexual,” and 1 in 15 reports same-sex sexual contact.59 The term LGBTQ+ includes the communities of lesbian, gay, bisexual, transgender, transsexual, queer, questioning, intersex, and asexual individuals. Developing a safe sense of sexual identity is fundamental to adolescent psychological development, and many adolescents struggle to develop a positive sexual identity. Suicide rates and self-harm behaviors among LGBTQ+ adolescents can be 4 times higher than among their heterosexual peers.60 Rates of mood disorders, substance abuse, and high-risk sexual behaviors are also increased in the LGBTQ+ population.61
The LGBTQ+ community often seeks health care advice and affirmation from primary care providers. Resources to enhance this care are available at www.lgbthealtheducation.org.
Social media
Adolescents today have more media exposure than any prior generation, with smartphone and computer use increasing exponentially. Most (95%) teens have access to a smartphone,62 45% describe themselves as constantly connected to the Internet, and 14% feel that social media is “addictive.”62 Most manage their social media portfolio on multiple sites. Patterns of adolescents' online activities show that boys prefer online gaming, while girls tend to spend more time on social networking.62
Whether extensive media use is psychologically beneficial or deleterious has been widely debated. Increased time online correlates with decreased levels of physical activity.63 And sleep disturbances have been associated with excessive screen time and the presence of mobile devices in the bedroom.64 The use of social media prior to bedtime also has an adverse impact on academic performance—particularly for girls. This adverse impact on academics persists after correcting for daytime sleepiness, body mass index, and number of hours spent on homework.64
Continue to: Due to growing concerns...
Due to growing concerns about the risks of social media in children and adolescents, the American Academy of Pediatrics has developed the Family Media Plan (www.healthychildren.org/English/media/Pages/default.aspx). Some specific questions that providers may ask are outlined in TABLE 3.64 The Family Media Plan can provide age-specific guidelines to assist parents or caregivers in answering these questions.
Cyber-bullying. One in 3 adolescents (primarily female) has been a victim of cyber-bullying.65 Sadly, 1 in 5 teens has received some form of electronic sexual solicitation.66 The likelihood of unsolicited stranger contact correlates with teens’ online habits and the amount of information disclosed. Predictors include female sex, visiting chat rooms, posting photos, and disclosing personal information. Restricting computer use to an area with parental supervision or installing monitoring programs does not seem to exert any protective influence on cyber-bullying or unsolicited stranger contact.65 While 63% of cyber-bullying victims feel upset, embarrassed, or stressed by these contacts,66 few events are actually reported. To address this, some states have adopted laws adding cyber-bullying to school disciplinary codes.
Negative health impacts associated with cyber-bullying include anxiety, sadness, and greater difficulty in concentrating on school work.65 Victims of bullying are more likely to have school disciplinary actions and depression and to be truant or to carry weapons to school.66 Cyber-bullying is uniquely destructive due to its ubiquitous presence. A sense of relative anonymity online may encourage perpetrators to act more cruelly, with less concern for punishment.
Young people are also more likely to share passwords as a sign of friendship. This may result in others assuming their identity online. Adolescents rarely disclose bullying to parents or other adults, fearing restriction of Internet access, and many of them think that adults may downplay the seriousness of the events.66
CORRESPONDENCE
Mark B. Stephens, MD, Penn State Health Medical Group, 1850 East Park Avenue, State College, PA 16803; [email protected].
1. World Health Organization. Adolescent health. Accessed February 23, 2021. www.who.int/maternal_child_adolescent/adolescence/en/
2. Sawyer SM, Azzopardi PS, Wickremarathne D, et al. The age of adolescence. Lancet Child Adolesc Health. 2018;2:223-228.
3. Pathak PR, Chou A. Confidential care for adoloscents in the U.S. healthcare system. J Patient Cent Res Rev. 2019;6:46-50.
4. AMA Journal of Ethics. HEADSS: the “review of systems” for adolescents. Accessed February 23, 2021. https://journalofethics.ama-assn.org/article/headss-review-systems-adolescents/2005-03
5. Cohen E, MacKenzie RG, Yates GL. HEADSS, a psychosocial risk assessment instrument: implications for designing effective intervention programs for runaway youth. J Adolesc Health. 1991;12:539-544.
6. Possibilities for Change. Rapid Adolescent Prevention Screening (RAAPS). Accessed February 23, 2021. www.possibilitiesforchange.com/raaps/
7. Elster AB, Kuznets NJ. AMA Guidelines for Adolescent Preventive Services (GAPS): Recommendations and Rationale. Williams & Wilkins; 1994.
8. AAP. Engaging patients and families - periodicity schedule. Accessed February 23, 2021. www.aap.org/en-us/professional-resources/practice-support/Pages/PeriodicitySchedule.aspx
9. Cunningham RM, Walton MA, Carter PM. The major causes of death in children and adolescents in the United States. N Eng J Med. 2018;379:2468-2475.
10. Schuster MA, Franke TM, Bastian AM, et al. Firearm storage patterns in US homes with children. Am J Public Health. 2000;90:588-594.
11. Mokdad AH, Marks JS, Stroup DF, et al. Actual causes of death in the United States. JAMA. 2004;291:1238-1245.
12. HHS. Health consequences of smoking, surgeon general fact sheet. Accessed February 23, 2021. www.hhs.gov/surgeongeneral/reports-and-publications/tobacco/consequences-smoking-factsheet/index.html
13. Johnston LD, Miech RA, O’Malley PM, et al. Monitoring the future: national survey results on drug use, 1975-2017. The University of Michigan. 2018. Accessed February 23, 2021. https://eric.ed.gov/?id=ED589762
14. US Preventive Services Task Force. Prevention and cessation of tobacco use in children and adolescents: primary care interventions. Accessed February 23, 2021. www.uspreventiveservicestaskforce.org/uspstf/recommendation/tobacco-and-nicotine-use-prevention-in-children-and-adolescents-primary-care-interventions
15. HHS. Preventing Tobacco Use Among Youth and Young Adults: A Report of the Surgeon General. Atlanta, GA: HHS, CDC, NCCDPHP, OSH; 2012. Accessed February 23, 2021. www.ncbi.nlm.nih.gov/books/NBK99237/
16. NIH. Alcohol screening and brief intervention for youth: a pocket guide. Accessed February 23, 2021. https://pubs.niaaa.nih.gov/publications/Practitioner/YouthGuide/YouthGuidePocket.pdf
17. Gorey C, Kuhns L, Smaragdi E, et al. Age-related differences in the impact of cannabis use on the brain and cognition: a systematic review. Eur Arch Psychiatry Clin Neurosci. 2019;269:37-58.
18. Secades-Villa R, Garcia-Rodriguez O, Jin CJ, et al. Probability and predictors of the cannabis gateway effect: a national study. Int J Drug Policy. 2015;26:135-142.
19. Kann L, McManus T, Harris WA, et al. Youth risk behavior surveillance—United States, 2017. MMWR Surveill Summ. 2018;67:1-114.
20. NIH. Drug overdoses in youth. How do drug overdoses happen?. Accessed February 23, 2021. https://teens.drugabuse.gov/drug-facts/drug-overdoses-youth
21. Branstetter SA, Low S, Furman W. The influence of parents and friends on adolescent substance use: a multidimensional approach. J Subst Use. 2011;162:150-160.
22. AAP. Committee on Substance Use and Prevention. Substance use screening, brief intervention, and referral to treatment. Pediatrics. 2016;138:e20161210.
23. Hales CM, Carroll MD, Fryar CD, et al. Prevalence of obesity among adults and youth: United States, 2015–2016. NCHS Data Brief. 2017;288:1-8.
24. Halfon N, Larson K, Slusser W. Associations between obesity and comorbid mental health, developmental and physical health conditions in a nationally representative sample of US children aged 10 to 17. Acad Pediatr. 2013;13:6-13.
25. Griffiths LJ, Parsons TJ, Hill AJ. Self-esteem and quality of life in obese children and adolescents: a systematic review. Int J Pediatr Obes. 2010;5:282-304.
26. National Physical Activity Plan Alliance. The 2018 United States report card on physical activity for children and youth. Accessed February 23, 2021. http://physicalactivityplan.org/projects/PA/2018/2018%20US%20Report%20Card%20Full%20Version_WEB.PDF?pdf=page-link
27. HHS. NIMH. Child and adolescent mental health. Accessed February 23, 2021. www.nimh.nih.gov/health/topics/child-and-adolescent-mental-health/index.shtml
28. Yonek JC, Jordan N, Dunlop D, et al. Patient-centered medical home care for adolescents in need of mental health treatment. J Adolesc Health. 2018;63:172-180.
29. Brooks TL, Harris SK, Thrall JS, et al. Association of adolescent risk behaviors with mental health symptoms in high school students. |J Adolesc Health. 2002;31:240-246.
30. Weller BE, Blanford KL, Butler AM. Estimated prevalence of psychiatric comorbidities in US adolescents with depression by race/ethnicity, 2011-2012. J Adolesc Health. 2018;62:716-721.
31. Bilsen J. Suicide and youth: risk factors. Front Psychiatry. 2018;9:540.
32. Shain B, AAP Committee on Adolescence. Suicide and suicide attempts in adolescents. Pediatrics. 2016;138:e20161420.
33. Brahmbhatt K, Hilty DM, Hah M, et al. Diagnosis and treatment of attention deficit hyperactivity disorder during adolescence in the primary care setting: review and future directions. J Adolesc Health. 2016;59:135-143.
34. Bravender T. Attention-deficit/hyperactivity disorder and disordered eating. [editorial] J Adolesc Health. 2017;61:125-126.
35. Rosen DS, AAP Committee on Adolescence. Identification and management of eating disorders in children and adolescents. Pediatrics. 2010;126:1240-1253.
36. Susman EJ, Houts RM, Steinberg L, et al. Longitudinal development of secondary sexual characteristics in girls and boys between ages 9 ½ and 15 ½ years. Arch Pediatr Adolesc Med. 2010;164:166-173.
37. Kaplowitz PB. Link between body fat and the timing of puberty. Pediatrics. 2008;121(suppl 3):S208-S217.
38. Ge X, Conger RD, Elder GH. Coming of age too early: pubertal influences on girl’s vulnerability to psychologic distress. Child Dev. 1996;67:3386-3400.
39. Jørgensen M, Keiding N, Skakkebaek NE. Estimation of spermarche from longitudinal spermaturia data. Biometrics. 1991;47:177-193.
40. Kar SK, Choudhury A, Singh AP. Understanding normal development of adolescent sexuality: a bumpy ride. J Hum Reprod Sci. 2015;8:70-74.
41. Susman EJ, Dorn LD, Schiefelbein VL. Puberty, sexuality and health. In: Lerner MA, Easterbrooks MA, Mistry J (eds). Comprehensive Handbook of Psychology. Wiley; 2003.
42. Lindberg LD, Santelli JS, Desai S. Changing patterns of contraceptive use and the decline in rates of pregnancy and birth among U.S. adolescents, 2007-2014. J Adolesc Health. 2018;63:253-256.
43. Guttmacher Institute. Teen pregnancy. www.guttmacher.org/united-states/teens/teen-pregnancy. Accessed February 23, 2021.
44. CDC. Social determinants and eliminating disparities in teen pregnancy. Accessed February 23, 2021. www.cdc.gov/teenpregnancy/about/social-determinants-disparities-teen-pregnancy.htm
45. Widman L, Nesi J, Kamke K, et al. Technology-based interventions to reduce sexually transmitted infection and unintended pregnancy among youth. J Adolesc Health. 2018;62:651-660.
46. Secura GM, Allsworth JE, Madden T, et al. The Contraceptive CHOICE Project: reducing barriers to long-acting reversible contraception. Am J Obstet Gynecol. 2010;203:115.e1-115.e7.
47. Ham P, Allen C. Adolescent health screening and counseling. Am Fam Physician. 2012;86:1109-1116.
48. ACOG. Committee on Adolescent Health Care. Adolescent pregnancy, contraception and sexual activity. 2017. Accessed February 23, 2021. www.acog.org/clinical/clinical-guidance/committee-opinion/articles/2017/05/adolescent-pregnancy-contraception-and-sexual-activity
49. Wangu Z, Burstein GR. Adolescent sexuality: updates to the sexually transmitted infection guidelines. Pediatr Clin N Am. 2017;64:389-411.
50. Holway GV, Hernandez SM. Oral sex and condom use in a U.S. national sample of adolescents and young adults. J Adolesc Health. 2018;62:402-410.
51. CDC. STDs in adults and adolescents. Accessed February 23, 2021. www.cdc.gov/std/stats17/adolescents.htm
52. McClung N, Gargano J, Bennett N, et al. Trends in human papillomavirus vaccine types 16 and 18 in cervical precancers, 2008-2014. Accessed February 23, 2021. https://cebp.aacrjournals.org/content/28/3/602
53. Timbang MR, Sim MW, Bewley AF, et al. HPV-related oropharyngeal cancer: a review on burden of the disease and opportunities for prevention and early detection. Hum Vaccin Immunother. 2019;15:1920-1928.
54. Carey AJ, Beagley KW. Chlamydia trachomatis, a hidden epidemic: effects on female reproduction and options for treatment. Am J Reprod Immunol. 2010;63:576-586.
55. USPSTF. Chlamydia and gonorrhea screening. Accessed February 23, 2021. www.uspreventiveservicestaskforce.org/Page/Document/RecommendationStatementFinal/chlamydia-and-gonorrhea-screening
56. Workowski KA, Bolan GA. Sexually transmitted diseases treatment guidelines, 2015. MMWR Morb Mortal Wkly Rep. 2015;64:1-135.
57. CDC. Sexually transmitted disease surveillance 2018. Accessed February 23, 2021. www.cdc.gov/std/stats18/gonorrhea.htm
5
59. Kann L, McManus T, Harris WA, et al. Youth risk behavior surveillance–United States, 2015. MMWR Surveill Summ. 2016;65:1-174.
60. CDC. LGBT youth. Accessed February 23, 2021. www.cdc.gov/lgbthealth/youth.htm
61. Johns MM, Lowry R, Rasberry CN, et al. Violence victimization, substance use, and suicide risk among sexual minority high school students – United States, 2015-2017. MMWR Morb Mortal Wkly Rep. 2018;67:1211-1215.
62. Pew Research Center. Teens, social media & technology 2018. . Accessed February 23, 2021. www.pewinternet.org/2018/05/31/teens-social-media-technology-2018/
63. Chassiakos YLR, Radesky J, Christakis D, et al. Children and adolescents and digital media. Pediatrics. 2016;138:e20162593.
64. Arora T, Albahri A, Omar OM, et al. The prospective association between electronic device use before bedtime and academic attainment in adolescents. J Adolesc Health. 2018;63:451-458.
65. Mishna F, Saini M, Solomon S. Ongoing and online: children and youth’s perceptions of cyber bullying. Child Youth Serv Rev. 2009;31:1222-1228.
66. Sengupta A, Chaudhuri A. Are social networking sites a source of online harassment for teens? Evidence from survey data. Child Youth Serv Rev. 2011;33:284-290.
PRACTICE RECOMMENDATIONS
› Consider using a 2-question screening tool for adolescents that asks about personal use of alcohol and use of alcohol by friends; this resource offers a risk assessment with recommendations. C
› Consider using the American Academy of Pediatrics Family Media Plan to provide age-specific guidelines to help parents or caregivers establish rules for online activities. C
Strength of recommendation (SOR)
A Good-quality patient-oriented evidence
B Inconsistent or limited-quality patient-oriented evidence
C Consensus, usual practice, opinion, disease-oriented evidence, case series

New skin papules
A 49-year-old woman with a history of end-stage renal disease, uncontrolled type 2 diabetes, and congestive heart failure visited the hospital for an acute heart failure exacerbation secondary to missed dialysis appointments. On admission, her provider noted that she had tender, pruritic lesions on the extensor surface of her arms. She said they had appeared 2 to 3 months after she started dialysis. She had attempted to control the pain and pruritus with over-the-counter topical hydrocortisone and oral diphenhydramine but nothing provided relief. She was recommended for follow-up at the hospital for further examination and biopsy of one of her lesions.
At this follow-up visit, the patient noted that the lesions had spread to her left knee. Multiple firm discrete papules and nodules, with central hyperkeratotic plugs, were noted along the extensor surfaces of her forearms, left extensor knee, and around her ankles (FIGURES 1A and 1B). Some of the lesions were tender. Examination of the rest of her skin was normal. A punch biopsy was obtained.

WHAT IS YOUR DIAGNOSIS?
HOW WOULD YOU TREAT THIS PATIENT?
Diagnosis: Kyrle disease
The patient’s end-stage renal disease and type 2 diabetes—along with findings from the physical examination—led us to suspect Kyrle disease. The punch biopsy, as well as the characteristic keratotic plugs (FIGURE 2) within epidermal invagination that was bordered by hyperkeratotic epidermis, confirmed the diagnosis.

Kyrle disease (also known as hyperkeratosis follicularis et follicularis in cutem penetrans) is a rare skin condition. It is 1 of 4 skin conditions that are classified as perforating skin disorders; the other 3 are elastosis perforans serpiginosa, reactive perforating collagenosis, and perforating folliculitis (TABLE1,2).3 Perforating skin disorders share the common characteristic of transepidermal elimination of material from the upper dermis.4 These disorders are typically classified based on the nature of the eliminated material and the type of epidermal disruption.5

There are 2 forms of Kyrle disease: an inherited form often seen in childhood that is not associated with systemic disease and an acquired form that occurs in adulthood, most commonly among women ages 35 to 70 years who have systemic disease.3,4,6 The acquired form of Kyrle disease is associated with diabetes and renal failure, but there is a lack of data on its pathogenesis.7,8
Characteristic findings include discrete pruritic, dry papules and nodules with central keratotic plugs that are occasionally tender. These can manifest over the extensor surface of the extremities, trunk, face, and scalp.4,7,9 Lesions most commonly manifest on the extensor surfaces of the lower extremities.
Other conditions that feature pruritic lesions
In addition to the other perforating skin disorders described in the TABLE,1,2 the differential for Kyrle disease includes the following:
Prurigo nodularis (PN) is a skin disorder in which the manifestation of extremely pruritic nodules leads to vigorous scratching and secondary infections. These lesions typically have a grouped and symmetrically distributed appearance. They often appear on extensor surfaces of upper and lower extremities.10 PN has no known etiology, but like Kyrle disease, is associated with renal failure. Biopsy can help to distinguish PN from Kyrle disease.
Continue to: Hypertrophic lichen planus
Hypertrophic lichen planus is a pruritic skin disorder characterized by the “6 Ps”: planar, purple, polygonal, pruritic, papules, and plaques. These lesions can mimic the early stages of Kyrle disease.11 However, in the later stages of Kyrle disease, discrete papules with hyperkeratotic plugs develop, whereas large plaques will be seen with lichen planus.
Keratosis pilaris (KP) is an extremely common, yet benign, disorder in which hair follicles become keratinized.12 KP can feature rough papules that are often described as “goosebumps” or having a sandpaper–like appearance. These papules often affect the upper arms. KP usually manifests in adolescents or young adults and tends to improve with age.12 The lesions are typically smaller than those seen in Kyrle disease and are asymptomatic. In addition, KP is not associated with systemic disease.
Target symptoms and any underlying conditions
In patients who have an acquired form of the disease, symptoms may improve by
For patients whose Kyrle disease is inherited or whose underlying condition is not easily treated, there are a number of treatment options to consider. First-line treatment includes topical keratolytics (salicylic acid and urea), topical retinoids, and ultraviolet light therapy.5,7 Systemic retinoids, topical steroids, cryotherapy, electrosurgery, CO2 laser surgery, and surgical excision have also been used with some success.7,14 Oral histamines and emollients also may help to relieve the pruritus. Lesions often recur upon discontinuation of therapy.
Our patient was referred to Dermatology for ultraviolet light therapy. She was also treated with topical 12% ammonium lactate twice daily. Within a few months, she reported improvement of her symptoms.
1. Rapini R. Perforating disorders. Plastic Surgery Key. Published April 22, 2017. Accessed February 18, 2021. https://plasticsurgerykey.com/perforating-disorders/
2. Patterson JW. The perforating disorders. J Am Acad Dermatol. 1984;10:561-581
3. Azad K, Hajirnis K, Sawant S, et al. Kyrle’s disease. Indian Dermatol Online J. 2013;4:378-379.
4. Arora K, Hajirnis KA, Sawant S, et al. Perforating disorders of the skin. Indian J Pathol Microbiol. 2013;56:355-358.
5. Ataseven A, Ozturk P, Kucukosmanoglu I, et al. Kyrle’s disease. BMJ Case Rep. 2014;2014: bcr2013009905.
6. Cunningham SR, Walsh M, Matthews R. Kyrle’s disease. J Am Acad Dermatol. 1987;16(pt 1):117-123.
7. Nair PA, Jivani NB, Diwan NG. Kyrle’s disease in a patient of diabetes mellitus and chronic renal failure on dialysis. J Family Med Prim Care. 2015;4:284-286.
8. Hurwitz RM, Melton ME, Creech FT 3rd, et al. Perforating folliculitis in association with hemodialysis. Am J Dermatopathol. 1982;4:101-108.
9. Kolla PK, Desai M, Pathapati RM, et al. Cutaneous manifestations in patients with chronic kidney disease on maintenance hemodialysis. ISRN Dermatol. 2012;2012:679619.
10. Lee MR, Shumack S. Prurigo nodularis: a review. Australas J Dermatol. 2005;46:211-220.
11. Usatine RP, Tinitigan M. Diagnosis and treatment of lichen planus. Am Fam Physician. 2011;84:53-60.
12. Thomas M, Khopkar US. Keratosis pilaris revisited: is it more than just a follicular keratosis? Int J Trichology. 2012;4:255-258.
13. Chang P, Fernández V. Acquired perforating disease: report of nine cases. Int J Dermatol. 1993;32:874-876.
14. Wagner G, Sachse MM. Acquired reactive perforating dermatosis. J Dtsch Dermatol Ges. 2013;11:723-729.
A 49-year-old woman with a history of end-stage renal disease, uncontrolled type 2 diabetes, and congestive heart failure visited the hospital for an acute heart failure exacerbation secondary to missed dialysis appointments. On admission, her provider noted that she had tender, pruritic lesions on the extensor surface of her arms. She said they had appeared 2 to 3 months after she started dialysis. She had attempted to control the pain and pruritus with over-the-counter topical hydrocortisone and oral diphenhydramine but nothing provided relief. She was recommended for follow-up at the hospital for further examination and biopsy of one of her lesions.
At this follow-up visit, the patient noted that the lesions had spread to her left knee. Multiple firm discrete papules and nodules, with central hyperkeratotic plugs, were noted along the extensor surfaces of her forearms, left extensor knee, and around her ankles (FIGURES 1A and 1B). Some of the lesions were tender. Examination of the rest of her skin was normal. A punch biopsy was obtained.
WHAT IS YOUR DIAGNOSIS?
HOW WOULD YOU TREAT THIS PATIENT?
Diagnosis: Kyrle disease
The patient’s end-stage renal disease and type 2 diabetes—along with findings from the physical examination—led us to suspect Kyrle disease. The punch biopsy, as well as the characteristic keratotic plugs (FIGURE 2) within epidermal invagination that was bordered by hyperkeratotic epidermis, confirmed the diagnosis.
Kyrle disease (also known as hyperkeratosis follicularis et follicularis in cutem penetrans) is a rare skin condition. It is 1 of 4 skin conditions that are classified as perforating skin disorders; the other 3 are elastosis perforans serpiginosa, reactive perforating collagenosis, and perforating folliculitis (TABLE1,2).3 Perforating skin disorders share the common characteristic of transepidermal elimination of material from the upper dermis.4 These disorders are typically classified based on the nature of the eliminated material and the type of epidermal disruption.5
There are 2 forms of Kyrle disease: an inherited form often seen in childhood that is not associated with systemic disease and an acquired form that occurs in adulthood, most commonly among women ages 35 to 70 years who have systemic disease.3,4,6 The acquired form of Kyrle disease is associated with diabetes and renal failure, but there is a lack of data on its pathogenesis.7,8
Characteristic findings include discrete pruritic, dry papules and nodules with central keratotic plugs that are occasionally tender. These can manifest over the extensor surface of the extremities, trunk, face, and scalp.4,7,9 Lesions most commonly manifest on the extensor surfaces of the lower extremities.
Other conditions that feature pruritic lesions
In addition to the other perforating skin disorders described in the TABLE,1,2 the differential for Kyrle disease includes the following:
Prurigo nodularis (PN) is a skin disorder in which the manifestation of extremely pruritic nodules leads to vigorous scratching and secondary infections. These lesions typically have a grouped and symmetrically distributed appearance. They often appear on extensor surfaces of upper and lower extremities.10 PN has no known etiology, but like Kyrle disease, is associated with renal failure. Biopsy can help to distinguish PN from Kyrle disease.
Continue to: Hypertrophic lichen planus
Hypertrophic lichen planus is a pruritic skin disorder characterized by the “6 Ps”: planar, purple, polygonal, pruritic, papules, and plaques. These lesions can mimic the early stages of Kyrle disease.11 However, in the later stages of Kyrle disease, discrete papules with hyperkeratotic plugs develop, whereas large plaques will be seen with lichen planus.
Keratosis pilaris (KP) is an extremely common, yet benign, disorder in which hair follicles become keratinized.12 KP can feature rough papules that are often described as “goosebumps” or having a sandpaper–like appearance. These papules often affect the upper arms. KP usually manifests in adolescents or young adults and tends to improve with age.12 The lesions are typically smaller than those seen in Kyrle disease and are asymptomatic. In addition, KP is not associated with systemic disease.
Target symptoms and any underlying conditions
In patients who have an acquired form of the disease, symptoms may improve by
For patients whose Kyrle disease is inherited or whose underlying condition is not easily treated, there are a number of treatment options to consider. First-line treatment includes topical keratolytics (salicylic acid and urea), topical retinoids, and ultraviolet light therapy.5,7 Systemic retinoids, topical steroids, cryotherapy, electrosurgery, CO2 laser surgery, and surgical excision have also been used with some success.7,14 Oral histamines and emollients also may help to relieve the pruritus. Lesions often recur upon discontinuation of therapy.
Our patient was referred to Dermatology for ultraviolet light therapy. She was also treated with topical 12% ammonium lactate twice daily. Within a few months, she reported improvement of her symptoms.
1. Rapini R. Perforating disorders. Plastic Surgery Key. Published April 22, 2017. Accessed February 18, 2021. https://plasticsurgerykey.com/perforating-disorders/
2. Patterson JW. The perforating disorders. J Am Acad Dermatol. 1984;10:561-581
3. Azad K, Hajirnis K, Sawant S, et al. Kyrle’s disease. Indian Dermatol Online J. 2013;4:378-379.
4. Arora K, Hajirnis KA, Sawant S, et al. Perforating disorders of the skin. Indian J Pathol Microbiol. 2013;56:355-358.
5. Ataseven A, Ozturk P, Kucukosmanoglu I, et al. Kyrle’s disease. BMJ Case Rep. 2014;2014: bcr2013009905.
6. Cunningham SR, Walsh M, Matthews R. Kyrle’s disease. J Am Acad Dermatol. 1987;16(pt 1):117-123.
7. Nair PA, Jivani NB, Diwan NG. Kyrle’s disease in a patient of diabetes mellitus and chronic renal failure on dialysis. J Family Med Prim Care. 2015;4:284-286.
8. Hurwitz RM, Melton ME, Creech FT 3rd, et al. Perforating folliculitis in association with hemodialysis. Am J Dermatopathol. 1982;4:101-108.
9. Kolla PK, Desai M, Pathapati RM, et al. Cutaneous manifestations in patients with chronic kidney disease on maintenance hemodialysis. ISRN Dermatol. 2012;2012:679619.
10. Lee MR, Shumack S. Prurigo nodularis: a review. Australas J Dermatol. 2005;46:211-220.
11. Usatine RP, Tinitigan M. Diagnosis and treatment of lichen planus. Am Fam Physician. 2011;84:53-60.
12. Thomas M, Khopkar US. Keratosis pilaris revisited: is it more than just a follicular keratosis? Int J Trichology. 2012;4:255-258.
13. Chang P, Fernández V. Acquired perforating disease: report of nine cases. Int J Dermatol. 1993;32:874-876.
14. Wagner G, Sachse MM. Acquired reactive perforating dermatosis. J Dtsch Dermatol Ges. 2013;11:723-729.

Big data ‘clinch’ link between high glycemic index diets and CVD
People who mostly ate foods with a low glycemic index had a lower likelihood of premature death and major cardiovascular disease (CVD) events, compared with those whose diet included more “poor-quality” food with a high glycemic index.
The results from the global PURE study of nearly 120,000 people provide evidence that helps cement glycemic index as a key measure of dietary health.
This new analysis from PURE (Prospective Urban and Rural Epidemiological Study) – a massive prospective epidemiologic study – shows people with a diet in the highest quintile of glycemic index had a significant 25% higher rate of combined total deaths and major CVD events during a median follow-up of nearly 10 years, compared with those with a diet in the lowest glycemic index quintile, in the report published online on Feb. 24, 2021, in the New England Journal of Medicine.
David J.A. Jenkins, MD, PhD, DSc, lead author, said people do not necessarily need to closely track the glycemic index of what they eat to follow the guidance that lower is better.
The link between lower glycemic load and fewer CVD events was even stronger among people with an established history of CVD at study entry. In this subset, which included 9% of the total cohort, people in the highest quintile for glycemic index consumption had a 51% higher rate of the composite primary endpoint, compared with those in the lowest quintile, in an analysis that adjusted for several potential confounders.
A simple but accurate and effective public health message is to follow existing dietary recommendations to eat better-quality food – more unprocessed fruits, vegetables, legumes, and whole grains – Dr. Jenkins advised. Those who prefer a more detailed approach could use the comprehensive glycemic index tables compiled by researchers at the University of Sydney.
‘All carbohydrates are not the same’
“What we’re saying is that all carbohydrates are not the same. Some seem to increase the risk for CVD, and others seem protective. This is not new, but worth restating in an era of low-carb and no-carb diets,” said Dr. Jenkins.
Low-glycemic-index foods are generally unprocessed foods in their native state, including fruits, vegetables, legumes, and unrefined whole grains. High-glycemic-index foods contain processed and refined carbohydrates that deliver jolts of glucose soon after eating, as the sugar in these carbohydrates quickly moves from the gut to the bloodstream.
An association between a diet with a lower glycemic index and better outcomes had appeared in prior reports from other studies, but not as unambiguously as in the new data from PURE, likely because of fewer study participants in previous studies.
Another feature of PURE that adds to the generalizability of the findings is the diversity of adults included in the study, from 20 countries on five continents.
“This clinches it,” Dr. Jenkins declared in an interview.
New PURE data tip the evidence balance
The NEJM article includes a new meta-analysis that adds the PURE findings to data from two large prior reports that were each less conclusive. The new calculation with the PURE numbers helps establish a clearer association between a diet with a higher glycemic index and the endpoint of CVD death, showing an overall 26% increase in the outcome.
The PURE data are especially informative because the investigators collected additional information on a range of potential confounders they incorporated into their analyses.
“We were able to include a lot of documentation on many potential confounders. That’s a strength of our data,” noted Dr. Jenkins, a professor of nutritional science and medicine at the University of Toronto.

“The present data, along with prior publications from PURE and several other studies, emphasize that consumption of poor quality carbohydrates is likely to be more adverse than the consumption of most fats in the diet,” said senior author Salim Yusuf, MD, DPhil, professor of medicine and executive director of the Population Health Research Institute at McMaster University, Hamilton, Ont.
“This calls for a fundamental shift in our thinking of what types of diet are likely to be harmful and what types neutral or beneficial,” Dr. Yusuf said in a statement from his institution.
Higher BMI associated with greater glycemic index effect
Another important analysis in the new report calculated the impact of a higher glycemic index diet among people with a body mass index (BMI) of less than 25 kg/m2 as well as higher BMIs.
Among people in the lower BMI subgroup, greater intake of high-glycemic-index foods showed slightly more incident primary outcome events. In contrast, people with a BMI of 25 or greater showed a steady increment in primary outcome events as the glycemic index of their diet increased.
People with higher BMIs in the quartile that ate the greatest amount of high-glycemic =-index foods had a significant 38% higher rate of primary outcome events, compared with people with similar BMIs in the lowest quartile for high-glycemic-index intake.
However, the study showed no impact on the primary association of high glycemic index and increased adverse outcomes by exercise habits, smoking, use of blood pressure medications, or use of statins.
The new report complements a separate analysis from PURE published just a few weeks earlier in the BMJ that established a significant association between increased consumption of whole grains and fewer CVD events, compared with people who had more refined grains in their diet, as reported by this news organization.
This prior report on whole versus refined grains, which Dr. Jenkins coauthored, looked at carbohydrate quality using a two-pronged approach, while glycemic index is a continuous variable that provides more nuance and takes into account carbohydrates from sources other than grains, Dr. Jenkins said.
PURE enrolled roughly 225,000 people aged 35-70 years at entry. The glycemic index analysis focused on 119,575 people who had data available for the primary outcome. During a median follow-up of 9.5 years, these people had 14,075 primary outcome events, including 8,780 deaths.
Analyses that looked at the individual outcomes that comprised the composite endpoint showed significant associations between a high-glycemic-index diet and total mortality, CVD death, non-CVD death, and stroke, but showed no significant link with myocardial infarction or heart failure. These findings are consistent with prior results of other studies that showed a stronger link between stroke and a high glycemic index diet, compared with other nonfatal CVD events.
Dr. Jenkins suggested that the significant excess of non-CVD deaths linked with a high-glycemic-index diet may stem from the impact of this type of diet on cancer-associated mortality.
PURE received partial funding through unrestricted grants from several drug companies. Dr. Jenkins has reported receiving gifts from several food-related trade associations and food companies, as well as research grants from two legume-oriented trade associations.
A version of this article first appeared on Medscape.com.
People who mostly ate foods with a low glycemic index had a lower likelihood of premature death and major cardiovascular disease (CVD) events, compared with those whose diet included more “poor-quality” food with a high glycemic index.
The results from the global PURE study of nearly 120,000 people provide evidence that helps cement glycemic index as a key measure of dietary health.
This new analysis from PURE (Prospective Urban and Rural Epidemiological Study) – a massive prospective epidemiologic study – shows people with a diet in the highest quintile of glycemic index had a significant 25% higher rate of combined total deaths and major CVD events during a median follow-up of nearly 10 years, compared with those with a diet in the lowest glycemic index quintile, in the report published online on Feb. 24, 2021, in the New England Journal of Medicine.
David J.A. Jenkins, MD, PhD, DSc, lead author, said people do not necessarily need to closely track the glycemic index of what they eat to follow the guidance that lower is better.
The link between lower glycemic load and fewer CVD events was even stronger among people with an established history of CVD at study entry. In this subset, which included 9% of the total cohort, people in the highest quintile for glycemic index consumption had a 51% higher rate of the composite primary endpoint, compared with those in the lowest quintile, in an analysis that adjusted for several potential confounders.
A simple but accurate and effective public health message is to follow existing dietary recommendations to eat better-quality food – more unprocessed fruits, vegetables, legumes, and whole grains – Dr. Jenkins advised. Those who prefer a more detailed approach could use the comprehensive glycemic index tables compiled by researchers at the University of Sydney.
‘All carbohydrates are not the same’
“What we’re saying is that all carbohydrates are not the same. Some seem to increase the risk for CVD, and others seem protective. This is not new, but worth restating in an era of low-carb and no-carb diets,” said Dr. Jenkins.
Low-glycemic-index foods are generally unprocessed foods in their native state, including fruits, vegetables, legumes, and unrefined whole grains. High-glycemic-index foods contain processed and refined carbohydrates that deliver jolts of glucose soon after eating, as the sugar in these carbohydrates quickly moves from the gut to the bloodstream.
An association between a diet with a lower glycemic index and better outcomes had appeared in prior reports from other studies, but not as unambiguously as in the new data from PURE, likely because of fewer study participants in previous studies.
Another feature of PURE that adds to the generalizability of the findings is the diversity of adults included in the study, from 20 countries on five continents.
“This clinches it,” Dr. Jenkins declared in an interview.
New PURE data tip the evidence balance
The NEJM article includes a new meta-analysis that adds the PURE findings to data from two large prior reports that were each less conclusive. The new calculation with the PURE numbers helps establish a clearer association between a diet with a higher glycemic index and the endpoint of CVD death, showing an overall 26% increase in the outcome.
The PURE data are especially informative because the investigators collected additional information on a range of potential confounders they incorporated into their analyses.
“We were able to include a lot of documentation on many potential confounders. That’s a strength of our data,” noted Dr. Jenkins, a professor of nutritional science and medicine at the University of Toronto.
“The present data, along with prior publications from PURE and several other studies, emphasize that consumption of poor quality carbohydrates is likely to be more adverse than the consumption of most fats in the diet,” said senior author Salim Yusuf, MD, DPhil, professor of medicine and executive director of the Population Health Research Institute at McMaster University, Hamilton, Ont.
“This calls for a fundamental shift in our thinking of what types of diet are likely to be harmful and what types neutral or beneficial,” Dr. Yusuf said in a statement from his institution.
Higher BMI associated with greater glycemic index effect
Another important analysis in the new report calculated the impact of a higher glycemic index diet among people with a body mass index (BMI) of less than 25 kg/m2 as well as higher BMIs.
Among people in the lower BMI subgroup, greater intake of high-glycemic-index foods showed slightly more incident primary outcome events. In contrast, people with a BMI of 25 or greater showed a steady increment in primary outcome events as the glycemic index of their diet increased.
People with higher BMIs in the quartile that ate the greatest amount of high-glycemic =-index foods had a significant 38% higher rate of primary outcome events, compared with people with similar BMIs in the lowest quartile for high-glycemic-index intake.
However, the study showed no impact on the primary association of high glycemic index and increased adverse outcomes by exercise habits, smoking, use of blood pressure medications, or use of statins.
The new report complements a separate analysis from PURE published just a few weeks earlier in the BMJ that established a significant association between increased consumption of whole grains and fewer CVD events, compared with people who had more refined grains in their diet, as reported by this news organization.
This prior report on whole versus refined grains, which Dr. Jenkins coauthored, looked at carbohydrate quality using a two-pronged approach, while glycemic index is a continuous variable that provides more nuance and takes into account carbohydrates from sources other than grains, Dr. Jenkins said.
PURE enrolled roughly 225,000 people aged 35-70 years at entry. The glycemic index analysis focused on 119,575 people who had data available for the primary outcome. During a median follow-up of 9.5 years, these people had 14,075 primary outcome events, including 8,780 deaths.
Analyses that looked at the individual outcomes that comprised the composite endpoint showed significant associations between a high-glycemic-index diet and total mortality, CVD death, non-CVD death, and stroke, but showed no significant link with myocardial infarction or heart failure. These findings are consistent with prior results of other studies that showed a stronger link between stroke and a high glycemic index diet, compared with other nonfatal CVD events.
Dr. Jenkins suggested that the significant excess of non-CVD deaths linked with a high-glycemic-index diet may stem from the impact of this type of diet on cancer-associated mortality.
PURE received partial funding through unrestricted grants from several drug companies. Dr. Jenkins has reported receiving gifts from several food-related trade associations and food companies, as well as research grants from two legume-oriented trade associations.
A version of this article first appeared on Medscape.com.
Thirteen percent of patients with type 2 diabetes have major ECG abnormalities
Major ECG abnormalities were found in 13% of more than 8,000 unselected patients with type 2 diabetes, including a 9% prevalence in the subgroup of these patients without identified cardiovascular disease (CVD) in a community-based Dutch cohort. Minor ECG abnormalities were even more prevalent.

These prevalence rates were consistent with prior findings from patients with type 2 diabetes, but the current report is notable because “it provides the most thorough description of the prevalence of ECG abnormalities in people with type 2 diabetes,” and used an “unselected and large population with comprehensive measurements,” including many without a history of CVD, said Peter P. Harms, MSc, and associates noted in a recent report in the Journal of Diabetes and Its Complications.
The analysis also identified several parameters that significantly linked with the presence of a major ECG abnormality including hypertension, male sex, older age, and higher levels of hemoglobin A1c.
“Resting ECG abnormalities might be a useful tool for CVD screening in people with type 2 diabetes,” concluded Mr. Harms, a researcher at the Amsterdam University Medical Center, and coauthors.
Findings “not unexpected”
Patients with diabetes have a higher prevalence of ECG abnormalities “because of their higher likelihood of having hypertension and other CVD risk factors,” as well as potentially having subclinical CVD, said Fred M. Kusumoto, MD, so these findings are “not unexpected. The more risk factors a patient has for structural heart disease, atrial fibrillation (AFib), or stroke from AFib, the more a physician must consider whether a baseline ECG and future surveillance is appropriate,” Dr. Kusumoto said in an interview.
But he cautioned against seeing these findings as a rationale to routinely run a resting ECG examination on every adult with diabetes.
“Patients with diabetes are very heterogeneous,” which makes it “difficult to come up with a ‘one size fits all’ recommendation” for ECG screening of patients with diabetes, he said.
While a task force of the European Society of Cardiology and the European Association for the Study of Diabetes set a class I level C guideline for resting ECG screening of patients with diabetes if they also have either hypertension or suspected CVD, the American Diabetes Association has no specific recommendations on which patients with diabetes should receive ECG screening.
“The current absence of U.S. recommendations is reasonable, as it allows patients and physicians to discuss the issues and decide on the utility of an ECG in their specific situation,” said Dr. Kusumoto, director of heart rhythm services at the Mayo Clinic in Jacksonville, Fla. But he also suggested that “the more risk factors that a patient with diabetes has for structural heart disease, AFib, or stroke from AFib the more a physician must consider whether a baseline ECG and future surveillance is appropriate.”
Data from a Dutch prospective cohort
The new study used data collected from 8,068 patients with type 2 diabetes and enrolled in the prospective Hoorn Diabetes Care System cohort, which enrolled patients newly diagnosed with type 2 diabetes in the West Friesland region of the Netherlands starting in 1996. The study includes most of these patients in the region who are under regular care of a general practitioner, and the study protocol calls for an annual resting ECG examination.
The investigators used standard, 12-lead ECG readings taken for each patient during 2018, and classified abnormalities by the Minnesota Code criteria. They divided the abnormalities into major or minor groups “in accordance with consensus between previous studies who categorised abnormalities according to perceived importance and/or severity.” The major subgroup included major QS pattern abnormalities, major ST-segment abnormalities, complete left bundle branch block or intraventricular block, or atrial fibrillation or flutter. Minor abnormalities included minor QS pattern abnormalities, minor ST-segment abnormalities, complete right bundle branch block, or premature atrial or ventricular contractions.
The prevalence of a major abnormality in the entire cohort examined was 13%, and another 16% had a minor abnormality. The most common types of abnormalities were ventricular conduction defects, in 14%; and arrhythmias, in 11%. In the subgroup of 6,494 of these patients with no history of CVD, 9% had a major abnormality and 15% a minor abnormality. Within this subgroup, 23% also had no hypertension, and their prevalence of a major abnormality was 4%, while 9% had a minor abnormality.
A multivariable analysis of potential risk factors among the entire study cohort showed that patients with hypertension had nearly triple the prevalence of a major ECG abnormality as those without hypertension, and men had double the prevalence of a major abnormality compared with women. Other markers that significantly linked with a higher rate of a major abnormality were older age, higher body mass index, higher A1c levels, and moderately depressed renal function.
“While the criteria the authors used for differentiating major and minor criteria are reasonable, in an asymptomatic patient even the presence of frequent premature atrial contractions on a baseline ECG has been associated with the development of AFib and a higher risk for stroke. The presence of left or right bundle branch block could spur additional evaluation with an echocardiogram,” said Dr. Kusumoto, president-elect of the Heart Rhythm Society.
“Generally an ECG abnormality is supplemental to clinical data in deciding the choice and timing of next therapeutic steps or additional testing. Physicians should have a fairly low threshold for obtaining ECG in patients with diabetes since it is inexpensive and can provide supplemental and potentially actionable information,” he said. “The presence of ECG abnormalities increases the possibility of underlying cardiovascular disease. When taking care of patients with diabetes at initial evaluation or without prior cardiac history or symptoms referable to the heart, two main issues are identifying the likelihood of coronary artery disease and atrial fibrillation.”
Mr. Harms and coauthors, and Dr. Kusumoto, had no disclosures.
Major ECG abnormalities were found in 13% of more than 8,000 unselected patients with type 2 diabetes, including a 9% prevalence in the subgroup of these patients without identified cardiovascular disease (CVD) in a community-based Dutch cohort. Minor ECG abnormalities were even more prevalent.
These prevalence rates were consistent with prior findings from patients with type 2 diabetes, but the current report is notable because “it provides the most thorough description of the prevalence of ECG abnormalities in people with type 2 diabetes,” and used an “unselected and large population with comprehensive measurements,” including many without a history of CVD, said Peter P. Harms, MSc, and associates noted in a recent report in the Journal of Diabetes and Its Complications.
The analysis also identified several parameters that significantly linked with the presence of a major ECG abnormality including hypertension, male sex, older age, and higher levels of hemoglobin A1c.
“Resting ECG abnormalities might be a useful tool for CVD screening in people with type 2 diabetes,” concluded Mr. Harms, a researcher at the Amsterdam University Medical Center, and coauthors.
Findings “not unexpected”
Patients with diabetes have a higher prevalence of ECG abnormalities “because of their higher likelihood of having hypertension and other CVD risk factors,” as well as potentially having subclinical CVD, said Fred M. Kusumoto, MD, so these findings are “not unexpected. The more risk factors a patient has for structural heart disease, atrial fibrillation (AFib), or stroke from AFib, the more a physician must consider whether a baseline ECG and future surveillance is appropriate,” Dr. Kusumoto said in an interview.
But he cautioned against seeing these findings as a rationale to routinely run a resting ECG examination on every adult with diabetes.
“Patients with diabetes are very heterogeneous,” which makes it “difficult to come up with a ‘one size fits all’ recommendation” for ECG screening of patients with diabetes, he said.
While a task force of the European Society of Cardiology and the European Association for the Study of Diabetes set a class I level C guideline for resting ECG screening of patients with diabetes if they also have either hypertension or suspected CVD, the American Diabetes Association has no specific recommendations on which patients with diabetes should receive ECG screening.
“The current absence of U.S. recommendations is reasonable, as it allows patients and physicians to discuss the issues and decide on the utility of an ECG in their specific situation,” said Dr. Kusumoto, director of heart rhythm services at the Mayo Clinic in Jacksonville, Fla. But he also suggested that “the more risk factors that a patient with diabetes has for structural heart disease, AFib, or stroke from AFib the more a physician must consider whether a baseline ECG and future surveillance is appropriate.”
Data from a Dutch prospective cohort
The new study used data collected from 8,068 patients with type 2 diabetes and enrolled in the prospective Hoorn Diabetes Care System cohort, which enrolled patients newly diagnosed with type 2 diabetes in the West Friesland region of the Netherlands starting in 1996. The study includes most of these patients in the region who are under regular care of a general practitioner, and the study protocol calls for an annual resting ECG examination.
The investigators used standard, 12-lead ECG readings taken for each patient during 2018, and classified abnormalities by the Minnesota Code criteria. They divided the abnormalities into major or minor groups “in accordance with consensus between previous studies who categorised abnormalities according to perceived importance and/or severity.” The major subgroup included major QS pattern abnormalities, major ST-segment abnormalities, complete left bundle branch block or intraventricular block, or atrial fibrillation or flutter. Minor abnormalities included minor QS pattern abnormalities, minor ST-segment abnormalities, complete right bundle branch block, or premature atrial or ventricular contractions.
The prevalence of a major abnormality in the entire cohort examined was 13%, and another 16% had a minor abnormality. The most common types of abnormalities were ventricular conduction defects, in 14%; and arrhythmias, in 11%. In the subgroup of 6,494 of these patients with no history of CVD, 9% had a major abnormality and 15% a minor abnormality. Within this subgroup, 23% also had no hypertension, and their prevalence of a major abnormality was 4%, while 9% had a minor abnormality.
A multivariable analysis of potential risk factors among the entire study cohort showed that patients with hypertension had nearly triple the prevalence of a major ECG abnormality as those without hypertension, and men had double the prevalence of a major abnormality compared with women. Other markers that significantly linked with a higher rate of a major abnormality were older age, higher body mass index, higher A1c levels, and moderately depressed renal function.
“While the criteria the authors used for differentiating major and minor criteria are reasonable, in an asymptomatic patient even the presence of frequent premature atrial contractions on a baseline ECG has been associated with the development of AFib and a higher risk for stroke. The presence of left or right bundle branch block could spur additional evaluation with an echocardiogram,” said Dr. Kusumoto, president-elect of the Heart Rhythm Society.
“Generally an ECG abnormality is supplemental to clinical data in deciding the choice and timing of next therapeutic steps or additional testing. Physicians should have a fairly low threshold for obtaining ECG in patients with diabetes since it is inexpensive and can provide supplemental and potentially actionable information,” he said. “The presence of ECG abnormalities increases the possibility of underlying cardiovascular disease. When taking care of patients with diabetes at initial evaluation or without prior cardiac history or symptoms referable to the heart, two main issues are identifying the likelihood of coronary artery disease and atrial fibrillation.”
Mr. Harms and coauthors, and Dr. Kusumoto, had no disclosures.
FROM THE JOURNAL OF DIABETES AND ITS COMPLICATIONS
Obesity pegged as diabetes cause in almost half of U.S. cases
Roughly 40% of all U.S. cases of incident diabetes during 2013-2016 were directly attributable to obesity, a finding that further solidifies the major etiologic role for obesity in the current American diabetes epidemic.

Researchers used data from a diverse cohort of 4,200 American adults in the MESA study during 2000-2017 to calculate a relative risk for developing diabetes of 2.7 in people with obesity compared with similar participants without obesity.
They then applied this relative risk estimate to obesity prevalence rates during serial iterations of NHANES, the recurring U.S.-wide survey of vital statistics in a representative cross-sectional population.
Their calculations showed that, during 2013-2016, 41% of U.S. adults who developed new onset diabetes did so because of obesity, after the researchers adjusted for potential confounders.
This “population attributable fraction,” or disease burden attributable to obesity, varied somewhat by sex, and by racial and ethnic subgrouping. Obesity was linked with the highest attributable rate among non-Hispanic White women, a rate of 53%, and with the lowest rate among non-Hispanic Black men, with an attributable fraction of 30%, Natalie A. Cameron, MD, and colleagues reported in their study, published online Feb. 10 in the Journal of the American Heart Association.
Potential for “meaningful impact” by reducing obesity
“Our study highlights the meaningful impact that reducing obesity could have on type 2 diabetes prevention in the United States. Decreasing obesity needs to be a priority,” Dr. Cameron, of the McGaw Medical Center of Northwestern University in Chicago, said in a statement issued by the American Heart Association.
“Public health efforts that support healthy lifestyles, such as increasing access to nutritious foods, promoting physical activity, and developing community programs to prevent obesity, could substantially reduce new cases of type 2 diabetes,” she added.
MESA (Multi-Ethnic Study of Atherosclerosis) enrolled adults aged 45-84 years and free from clinical cardiovascular disease at six U.S. sites during 2000-2002, and then followed them with four additional examinations through 2017.
For the current study, researchers narrowed the cohort down to 4,200 participants who were aged 45-79 years and free from diabetes at entry, and also restricted this subgroup to participants classified as non-Hispanic White (54% of the cohort), non-Hispanic Black (33%), or Mexican American (13%). At entry, 34% of the cohort had obesity, with a body mass index of at least 30 kg/m2.
During a median follow-up of just over 9 years, 12% of the cohort developed incident diabetes. After adjustment for possible confounders, a hazard ratio model showed an overall 2.7-fold higher rate of incident diabetes among people with obesity compared to those without.
The researchers then applied this hazard ratio to obesity prevalence statistics from NHANES (National Health and Nutrition Examination Survey) during the same time period, with data from the biennial NHANES project collapsed into four time strata: 2001-2004, 2005-2008, 2009-2012, and 2013-2016. They again limited their analysis to NHANES data collected from people aged 45-79 years who self-reported categorization as non-Hispanic White, non-Hispanic Black, or Mexican American.
During the period from 2001-2004 to 2013-2016, overall obesity prevalence tallied by NHANES data rose from 34% to 41%. Among people with type 2 diabetes during 2013-2016, obesity prevalence was 65%.
To calculate the population attributable fraction researchers combined the MESA and NHANES estimates and adjusted for potential confounders and found that, overall, in 41% of people with incident diabetes during 2013-2016, the disease was attributable to obesity.
The study received no commercial funding, and none of the authors had disclosures.
A version of this article first appeared on Medscape.com.
Roughly 40% of all U.S. cases of incident diabetes during 2013-2016 were directly attributable to obesity, a finding that further solidifies the major etiologic role for obesity in the current American diabetes epidemic.
Researchers used data from a diverse cohort of 4,200 American adults in the MESA study during 2000-2017 to calculate a relative risk for developing diabetes of 2.7 in people with obesity compared with similar participants without obesity.
They then applied this relative risk estimate to obesity prevalence rates during serial iterations of NHANES, the recurring U.S.-wide survey of vital statistics in a representative cross-sectional population.
Their calculations showed that, during 2013-2016, 41% of U.S. adults who developed new onset diabetes did so because of obesity, after the researchers adjusted for potential confounders.
This “population attributable fraction,” or disease burden attributable to obesity, varied somewhat by sex, and by racial and ethnic subgrouping. Obesity was linked with the highest attributable rate among non-Hispanic White women, a rate of 53%, and with the lowest rate among non-Hispanic Black men, with an attributable fraction of 30%, Natalie A. Cameron, MD, and colleagues reported in their study, published online Feb. 10 in the Journal of the American Heart Association.
Potential for “meaningful impact” by reducing obesity
“Our study highlights the meaningful impact that reducing obesity could have on type 2 diabetes prevention in the United States. Decreasing obesity needs to be a priority,” Dr. Cameron, of the McGaw Medical Center of Northwestern University in Chicago, said in a statement issued by the American Heart Association.
“Public health efforts that support healthy lifestyles, such as increasing access to nutritious foods, promoting physical activity, and developing community programs to prevent obesity, could substantially reduce new cases of type 2 diabetes,” she added.
MESA (Multi-Ethnic Study of Atherosclerosis) enrolled adults aged 45-84 years and free from clinical cardiovascular disease at six U.S. sites during 2000-2002, and then followed them with four additional examinations through 2017.
For the current study, researchers narrowed the cohort down to 4,200 participants who were aged 45-79 years and free from diabetes at entry, and also restricted this subgroup to participants classified as non-Hispanic White (54% of the cohort), non-Hispanic Black (33%), or Mexican American (13%). At entry, 34% of the cohort had obesity, with a body mass index of at least 30 kg/m2.
During a median follow-up of just over 9 years, 12% of the cohort developed incident diabetes. After adjustment for possible confounders, a hazard ratio model showed an overall 2.7-fold higher rate of incident diabetes among people with obesity compared to those without.
The researchers then applied this hazard ratio to obesity prevalence statistics from NHANES (National Health and Nutrition Examination Survey) during the same time period, with data from the biennial NHANES project collapsed into four time strata: 2001-2004, 2005-2008, 2009-2012, and 2013-2016. They again limited their analysis to NHANES data collected from people aged 45-79 years who self-reported categorization as non-Hispanic White, non-Hispanic Black, or Mexican American.
During the period from 2001-2004 to 2013-2016, overall obesity prevalence tallied by NHANES data rose from 34% to 41%. Among people with type 2 diabetes during 2013-2016, obesity prevalence was 65%.
To calculate the population attributable fraction researchers combined the MESA and NHANES estimates and adjusted for potential confounders and found that, overall, in 41% of people with incident diabetes during 2013-2016, the disease was attributable to obesity.
The study received no commercial funding, and none of the authors had disclosures.
A version of this article first appeared on Medscape.com.
More from DAPA-HF: Dapagliflozin quickly reduces heart failure events
Dapagliflozin’s benefits in patients with heart failure with reduced ejection fraction appeared quickly after treatment began, and patients who had been hospitalized for heart failure within the prior year got the biggest boost from the drug, according to secondary analyses of the more than 4,700-patient DAPA-HF trial.

Dapagliflozin’s significant reduction of the incidence of cardiovascular death or worsening heart failure became apparent in DAPA-HF within 28 days after patients started treatment, by which time those on the study drug had a 49% cut in this combined endpoint, compared with patients on placebo, David D. Berg, MD, and associates said in a recent report published in JAMA Cardiology.
Their analyses also showed that the absolute reduction linked with dapagliflozin treatment for this primary endpoint of the study (which classified worsening heart failure as either hospitalization for heart failure or an urgent visit because of heart failure that required intravenous therapy) was greatest, 10% during 2 years of follow-up, among the roughly one-quarter of enrolled patients who had been hospitalized for heart failure within 12 months of entering the study. Patients previously hospitalized for heart failure more than 12 months before they entered DAPA-HF had a 4% absolute cut in their primary-outcome events during the trial, and those who had never been hospitalized for heart failure had a 2% absolute benefit, compared with placebo, during 2 years of follow-up.
These findings were consistent with the timing of benefits for patients with heart failure with reduced ejection fraction (HFrEF) in recent studies of two other drugs from the same class, the sodium-glucose cotransporter (SGLT) inhibitors, including empagliflozin (Jardiance, which inhibits SGLT-2) in the EMPEROR-Reduced trial, and sotagliflozin (Zynquista, which inhibits both SGLT1 and -2) in the SOLOIST-WHF trial, noted Gregg C. Fonarow, MD, and Clyde W. Yancy, MD, in an editor’s note that accompanied the new report.

The new findings show “the opportunity to expeditiously implement this remarkable class of therapy for HFrEF is now compelling and deserves disruptive efforts to ensure comprehensive treatment and the best patient outcomes,” wrote Dr. Fonarow, a professor of medicine at the University of California, Los Angeles, and Dr. Yancy, a professor of medicine at Northwestern University, Chicago.
But despite these new findings, their exact meaning remains unclear in terms of when to start dapagliflozin (or a different drug from the same class), compared with the other drug classes that have proven highly effective in patients with HFrEF, and exactly how long after hospitalization for heart failure dapagliflozin can safely and effectively begin.
Data needed on starting an SGLT inhibitor soon after hospitalization in patients without diabetes
“DAPA-HF showed that, in patients with or without diabetes, an SGLT2 inhibitor reduced the risk of cardiovascular death or worsening heart failure in patients with stable HFrEF. SOLOIST-WHF looked strictly at patients with diabetes, and showed that a combined SGLT1 and SGLT2 inhibitor could reduce the risk of cardiovascular death or worsening heart failure in patients with recently decompensated heart failure,” Dr. Berg, a cardiologist at Brigham and Women’s Hospital in Boston, noted in an interview. “What we don’t have is a trial focused exclusively on enrolling patients while hospitalized with acute heart failure, irrespective of whether they have diabetes, and testing the immediate clinical efficacy and safety of starting an SGLT2 inhibitor. That is what we are testing with the ongoing DAPA ACT HF-TIMI 68 trial.”
In addition, updated recommendations from the American College of Cardiology on initiating drug therapy in patients newly diagnosed with HFrEF that appeared in early 2021 promoted a sequence that starts most patients on sacubitril/valsartan (Entresto) and a beta-blocker, followed by a diuretic (when needed), a mineralocorticoid receptor agonist, and then an SGLT inhibitor. The recommendations note that starting a patient on all these drug classes could take 3-6 months.
“There are intense debates about the optimal sequence for introducing these therapies, and I don’t think we have solid data to suggest that one sequence is clearly better than another,” noted Dr. Berg. “A one-size-fits-all approach probably doesn’t make sense. For example, each of these therapies has a different set of effects on heart rate and blood pressure, and each has a unique side effect profile, so clinicians will often need to tailor the treatment approach to the patient. And, of course, cost is an important consideration. Although the optimal time to start an SGLT2 inhibitor remains uncertain, the results of our analysis suggest that waiting may result in preventable adverse heart failure events.”
DAPA-HF randomized 4,744 patients with HFrEF and in New York Heart Association functional class II-IV at 410 sites in 20 countries. The incidence of the primary, combined endpoint fell by 26% with dapagliflozin treatment, compared with placebo, during a median 18-month follow-up. Among the study cohort 27% of patients had been hospitalized for heart failure within a year of their entry, 20% had been hospitalized for heart failure more than 1 year before entry, and 53% had no history of a hospitalization for heart failure.
DAPA-HF was sponsored by AstraZeneca, the company that markets dapagliflozin (Farxiga). Dr. Berg has received research support through his institution from AstraZeneca. Dr. Fonarow has received personal fees from AstraZeneca and from numerous other companies. Dr. Yancy’s spouse works for Abbott Laboratories.
Dapagliflozin’s benefits in patients with heart failure with reduced ejection fraction appeared quickly after treatment began, and patients who had been hospitalized for heart failure within the prior year got the biggest boost from the drug, according to secondary analyses of the more than 4,700-patient DAPA-HF trial.
Dapagliflozin’s significant reduction of the incidence of cardiovascular death or worsening heart failure became apparent in DAPA-HF within 28 days after patients started treatment, by which time those on the study drug had a 49% cut in this combined endpoint, compared with patients on placebo, David D. Berg, MD, and associates said in a recent report published in JAMA Cardiology.
Their analyses also showed that the absolute reduction linked with dapagliflozin treatment for this primary endpoint of the study (which classified worsening heart failure as either hospitalization for heart failure or an urgent visit because of heart failure that required intravenous therapy) was greatest, 10% during 2 years of follow-up, among the roughly one-quarter of enrolled patients who had been hospitalized for heart failure within 12 months of entering the study. Patients previously hospitalized for heart failure more than 12 months before they entered DAPA-HF had a 4% absolute cut in their primary-outcome events during the trial, and those who had never been hospitalized for heart failure had a 2% absolute benefit, compared with placebo, during 2 years of follow-up.
These findings were consistent with the timing of benefits for patients with heart failure with reduced ejection fraction (HFrEF) in recent studies of two other drugs from the same class, the sodium-glucose cotransporter (SGLT) inhibitors, including empagliflozin (Jardiance, which inhibits SGLT-2) in the EMPEROR-Reduced trial, and sotagliflozin (Zynquista, which inhibits both SGLT1 and -2) in the SOLOIST-WHF trial, noted Gregg C. Fonarow, MD, and Clyde W. Yancy, MD, in an editor’s note that accompanied the new report.
The new findings show “the opportunity to expeditiously implement this remarkable class of therapy for HFrEF is now compelling and deserves disruptive efforts to ensure comprehensive treatment and the best patient outcomes,” wrote Dr. Fonarow, a professor of medicine at the University of California, Los Angeles, and Dr. Yancy, a professor of medicine at Northwestern University, Chicago.
But despite these new findings, their exact meaning remains unclear in terms of when to start dapagliflozin (or a different drug from the same class), compared with the other drug classes that have proven highly effective in patients with HFrEF, and exactly how long after hospitalization for heart failure dapagliflozin can safely and effectively begin.
Data needed on starting an SGLT inhibitor soon after hospitalization in patients without diabetes
“DAPA-HF showed that, in patients with or without diabetes, an SGLT2 inhibitor reduced the risk of cardiovascular death or worsening heart failure in patients with stable HFrEF. SOLOIST-WHF looked strictly at patients with diabetes, and showed that a combined SGLT1 and SGLT2 inhibitor could reduce the risk of cardiovascular death or worsening heart failure in patients with recently decompensated heart failure,” Dr. Berg, a cardiologist at Brigham and Women’s Hospital in Boston, noted in an interview. “What we don’t have is a trial focused exclusively on enrolling patients while hospitalized with acute heart failure, irrespective of whether they have diabetes, and testing the immediate clinical efficacy and safety of starting an SGLT2 inhibitor. That is what we are testing with the ongoing DAPA ACT HF-TIMI 68 trial.”
In addition, updated recommendations from the American College of Cardiology on initiating drug therapy in patients newly diagnosed with HFrEF that appeared in early 2021 promoted a sequence that starts most patients on sacubitril/valsartan (Entresto) and a beta-blocker, followed by a diuretic (when needed), a mineralocorticoid receptor agonist, and then an SGLT inhibitor. The recommendations note that starting a patient on all these drug classes could take 3-6 months.
“There are intense debates about the optimal sequence for introducing these therapies, and I don’t think we have solid data to suggest that one sequence is clearly better than another,” noted Dr. Berg. “A one-size-fits-all approach probably doesn’t make sense. For example, each of these therapies has a different set of effects on heart rate and blood pressure, and each has a unique side effect profile, so clinicians will often need to tailor the treatment approach to the patient. And, of course, cost is an important consideration. Although the optimal time to start an SGLT2 inhibitor remains uncertain, the results of our analysis suggest that waiting may result in preventable adverse heart failure events.”
DAPA-HF randomized 4,744 patients with HFrEF and in New York Heart Association functional class II-IV at 410 sites in 20 countries. The incidence of the primary, combined endpoint fell by 26% with dapagliflozin treatment, compared with placebo, during a median 18-month follow-up. Among the study cohort 27% of patients had been hospitalized for heart failure within a year of their entry, 20% had been hospitalized for heart failure more than 1 year before entry, and 53% had no history of a hospitalization for heart failure.
DAPA-HF was sponsored by AstraZeneca, the company that markets dapagliflozin (Farxiga). Dr. Berg has received research support through his institution from AstraZeneca. Dr. Fonarow has received personal fees from AstraZeneca and from numerous other companies. Dr. Yancy’s spouse works for Abbott Laboratories.
FROM JAMA CARDIOLOGY
ASDSA warns of rogue insulin pen use for DIY fillers
.
In the safety warning, issued on Feb. 18, the ASDSA reported that ASDSA members, all board-certified dermatologists, have seen evidence online of young people using so-called “hyaluron pens” to inject hyaluronic acid filler in the epidermal and upper dermal skin.
The pens being used and promoted in social media for do-it-yourself filler injections are medical devices originally developed for insulin injections. “The use of air pressure technology causes these pens to deliver the hyaluronic acid to insert nanoscale molecules of the filler through the skin,” according to the ASDSA statement. Marketing materials state that the pens can be used to create volume and shape in the lips, and to improve the appearance of nasolabial lines, marionette lines, brow lines known as “elevens,” and forehead wrinkles. Claims that the hyaluronic acid only reaches the papillary layer of the dermis, and is therefore safe, do not alleviate the risk of injury in inexperienced hands, the ASDSA statement points out.
“We are concerned about California children falling prey to products that are not appropriate and safe for them to use,” Elan Newland, MD, member of the ASDSA and the California Society for Dermatology and Dermatological Surgery (CalDerm), said in the statement. “The power of social media is very strong, especially for impressionable teenagers. CalDerm supports alerting consumers and regulators of the dangers of these pens,” he said.

“TikTok is proving to be an extremely powerful platform to communicate, entertain, and even educate, which is why many physicians are getting involved and finding success there. Unfortunately, just like the World Wide Web, there is misinformation there and even dangerous lies,” Sandra Lee, MD, who practices in Upland, Calif. (and is also known as “Dr. Pimple Popper”), said in the statement.
“It’s very concerning to see young people posting a How To on injecting their own lips with hyaluronic acid serum using an ‘airgun’ pen, which acts much like a BB gun to push with force the product under the skin,” she added. “So many things can go wrong.”
The ASDSA has contacted the Food and Drug Administration to report these safety concerns. “In addition, the ASDSA is alerting state medical and estheticians’ boards regarding these patient safety concerns and alerting consumers directly about the risks through social media and other education materials,” according to the statement.
.
In the safety warning, issued on Feb. 18, the ASDSA reported that ASDSA members, all board-certified dermatologists, have seen evidence online of young people using so-called “hyaluron pens” to inject hyaluronic acid filler in the epidermal and upper dermal skin.
The pens being used and promoted in social media for do-it-yourself filler injections are medical devices originally developed for insulin injections. “The use of air pressure technology causes these pens to deliver the hyaluronic acid to insert nanoscale molecules of the filler through the skin,” according to the ASDSA statement. Marketing materials state that the pens can be used to create volume and shape in the lips, and to improve the appearance of nasolabial lines, marionette lines, brow lines known as “elevens,” and forehead wrinkles. Claims that the hyaluronic acid only reaches the papillary layer of the dermis, and is therefore safe, do not alleviate the risk of injury in inexperienced hands, the ASDSA statement points out.
“We are concerned about California children falling prey to products that are not appropriate and safe for them to use,” Elan Newland, MD, member of the ASDSA and the California Society for Dermatology and Dermatological Surgery (CalDerm), said in the statement. “The power of social media is very strong, especially for impressionable teenagers. CalDerm supports alerting consumers and regulators of the dangers of these pens,” he said.
“TikTok is proving to be an extremely powerful platform to communicate, entertain, and even educate, which is why many physicians are getting involved and finding success there. Unfortunately, just like the World Wide Web, there is misinformation there and even dangerous lies,” Sandra Lee, MD, who practices in Upland, Calif. (and is also known as “Dr. Pimple Popper”), said in the statement.
“It’s very concerning to see young people posting a How To on injecting their own lips with hyaluronic acid serum using an ‘airgun’ pen, which acts much like a BB gun to push with force the product under the skin,” she added. “So many things can go wrong.”
The ASDSA has contacted the Food and Drug Administration to report these safety concerns. “In addition, the ASDSA is alerting state medical and estheticians’ boards regarding these patient safety concerns and alerting consumers directly about the risks through social media and other education materials,” according to the statement.