User login
EHRs and Burnout
Also today, a new risk-prediction model for diabetes under development, firibastat is looking good for difficult-to-treat hypertension, and differences in gut bacteria can distinguish IBD from IBS.
Amazon Alexa
Apple Podcasts
Google Podcasts
Spotify
Also today, a new risk-prediction model for diabetes under development, firibastat is looking good for difficult-to-treat hypertension, and differences in gut bacteria can distinguish IBD from IBS.
Amazon Alexa
Apple Podcasts
Google Podcasts
Spotify
Also today, a new risk-prediction model for diabetes under development, firibastat is looking good for difficult-to-treat hypertension, and differences in gut bacteria can distinguish IBD from IBS.
Amazon Alexa
Apple Podcasts
Google Podcasts
Spotify

‘Payoff will be great’ if we can conquer childhood obesity, expert says
LOS ANGELES – Mounting evidence indicates that obesity in childhood and adolescence increases the risk for future cardiovascular disease (CVD), according to Stephen R. Daniels, MD, PhD.

“Some of this increased risk is related to the high level of tracking of obesity from childhood to adolescence to adulthood,” Dr. Daniels, who chairs the department of pediatrics at the University of Colorado, Aurora, said at the World Congress on Insulin Resistance, Diabetes & Cardiovascular Disease. “But I think it’s also clear that childhood obesity is associated with risk factors for adult CVD, including hypertension, dyslipidemia, and type 2 diabetes. There’s a combination of things going on over the life course.”
Numerous studies have demonstrated a dose-response relationship between increased weight and all-cause mortality in cardiovascular disease for men and women. This operates through a variety of mechanisms, Dr. Daniels said, including hypertension, dyslipidemia, left ventricular hypertrophy, vascular inflammation, type 2 diabetes, and obstructive sleep apnea. “While overt cardiovascular disease does not occur in children, many of the mechanisms recognized in adults are also present in children and adolescents,” he said. “The trends for increasing prevalence and severity of obesity in children and the comorbid conditions associated with obesity are worrisome.”
The current prevalence of obesity in children and adolescents stands at about 18%, according to the latest National Health and Nutrition Examination Survey. However, the prevalence of severe obesity in youth aged 2-19 years has been increasing “fairly dramatically,” and now stands at 9% among girls and 8% among boys. Hispanics and non-Hispanic blacks are disproportionately affected. That may turn out to be important in terms of the future, Dr. Daniels said, because according to simulation models, childhood obesity and overweight will continue to be a major public health problem in the future (N Engl J Med. 2017;377:2145-53).
Direct evidence is also beginning to emerge of a link between obesity in youth and adult cardiovascular disease. The factors in childhood that predict adult obesity include a higher level of body mass index, obesity present at an older age (adolescence vs. childhood), and the presence of obesity in parents, which reflects both genes and environment. Researchers led by Paul W. Franks, PhD, evaluated 4,857 American Indian children without diabetes who were born between 1945 and 1984 and followed them for death before age 55 (N Engl J Med. 2010;362[6]:485-93). They assessed whether BMI, glucose tolerance, blood pressure, and cholesterol levels predicted premature death. There were 166 deaths from endogenous causes (3.4%) over a median follow-up of 24 years. Factors significantly associated with mortality included obesity (incident rate ratio 2.30), glucose tolerance (IRR 1.73), and hypertension (IRR 1.57).
In a separate analysis, researchers investigated the long-term effects of childhood weight on coronary heart disease (CHD) by studying 276,835 Danish schoolchildren for whom measurements of height and weight were available. They followed the individuals until they turned age 25 or older and used national registries to assess the fatal and nonfatal rates of CHD events (N Engl J Med. 2007;357:2329-37). The researchers found that higher BMI during childhood was associated with an increased risk of CVD in adulthood. However, they did not have data on BMI in adulthood, “which leaves open the question of whether childhood obesity works through adult obesity or also has an independent effect,” said Dr. Daniels, who is also pediatrician-in-chief at Children’s Hospital Colorado, Denver.
More recently, investigators studied 37,674 apparently healthy Israeli men from age 17 into adulthood (N Engl J Med. 2011;364:1315-25). Outcomes were coronary disease and diabetes. They found that an elevated BMI in adolescence is an independent risk factor for CVD in later life, while an elevated BMI in adulthood is an independent risk factor for both CVD and diabetes.
In the Fels Longitudinal Study, researchers enrolled 151 adults with metabolic syndrome and 154 without metabolic syndrome, with a mean age of 51 years (J Pediatr. 2008;152:191-200). “The idea was to look back at this cohort and see when the first differences might be observable between boys and girls who ultimately would develop metabolic syndrome and those who would not,” said Dr. Daniels, who was one of the study investigators. The first appearance of differences between adults with and without metabolic syndrome occurred at ages 8 and 13 for BMI and 6 and 13 for waist circumference in boys and girls, respectively. Odds ratios (ORs) for the metabolic syndrome in adulthood if BMI were elevated in childhood ranged from 1.4 to 1.9 in boys and from 0.8 to 2.8 in girls. At the same time, odds ratios for the metabolic syndrome in adulthood if waist circumference was elevated ranged from 2.5 to 31.4 in boys and 1.7 to 2.5 in girls.
“I think it’s safe to say that BMI and waist circumference may be important in predicting metabolic syndrome later in life and, ultimately, cardiovascular disease,” Dr. Daniels said.
He noted that as the prevalence and severity of obesity have increased in childhood, the prevalence of type 2 diabetes has also increased. “The time from diagnosis of diabetes to a CVD event is approximately 10-15 years in adults, and there is often a prediagnosis period of hyperglycemia, which ranges from 5-10 years,” Dr. Daniels said. “If the time course of CVD related to diabetes is the same for adolescents as adults, it is anticipated that adolescents with diabetes will begin having substantial CVD morbidity and mortality in their 30s or 40s. This will be a public health disaster. Emerging evidence from the TODAY study (Treatment Options for type 2 Diabetes in Adolescents and Youth) and other studies is emphasizing that at least some individuals with adolescent type 2 diabetes may have a more malignant form of disease than in adults. This is striking and important to consider as we look at how to prevent cardiovascular disease.”
Obesity in childhood is also associated with structural and functional abnormalities of the vasculature, according to studies that measure vascular structure via intima-media thickness of the carotid arteries, femoral arteries, abdominal aorta, or other arteries, as well as those that measure vascular stiffness via measures of intrinsic “visco-elastic” properties of the arterial wall. In one study of individuals aged 10-24 years, Dr. Daniels and his associates performed carotid ultrasound for carotid intima-media thickness on 182 patients who were lean, 136 who were obese, and 128 who had type 2 diabetes (Circulation 2009;119(22):2913-9). It demonstrated that youth with obesity and obesity-related type 2 diabetes have abnormalities in carotid thickness and stiffness that are only partially explained by traditional cardiovascular risk factors.
“We all know that obesity is very difficult to treat,” he concluded. “That’s true in children and adolescents as it is in adults. I think this argues for prevention of obesity, for us starting earlier, creating an optimal cardiovascular health situation that we can maintain during the course of childhood and adolescence. The payoff will be great if we can accomplish that.”
Dr. Daniels reported having no disclosures.
LOS ANGELES – Mounting evidence indicates that obesity in childhood and adolescence increases the risk for future cardiovascular disease (CVD), according to Stephen R. Daniels, MD, PhD.
“Some of this increased risk is related to the high level of tracking of obesity from childhood to adolescence to adulthood,” Dr. Daniels, who chairs the department of pediatrics at the University of Colorado, Aurora, said at the World Congress on Insulin Resistance, Diabetes & Cardiovascular Disease. “But I think it’s also clear that childhood obesity is associated with risk factors for adult CVD, including hypertension, dyslipidemia, and type 2 diabetes. There’s a combination of things going on over the life course.”
Numerous studies have demonstrated a dose-response relationship between increased weight and all-cause mortality in cardiovascular disease for men and women. This operates through a variety of mechanisms, Dr. Daniels said, including hypertension, dyslipidemia, left ventricular hypertrophy, vascular inflammation, type 2 diabetes, and obstructive sleep apnea. “While overt cardiovascular disease does not occur in children, many of the mechanisms recognized in adults are also present in children and adolescents,” he said. “The trends for increasing prevalence and severity of obesity in children and the comorbid conditions associated with obesity are worrisome.”
The current prevalence of obesity in children and adolescents stands at about 18%, according to the latest National Health and Nutrition Examination Survey. However, the prevalence of severe obesity in youth aged 2-19 years has been increasing “fairly dramatically,” and now stands at 9% among girls and 8% among boys. Hispanics and non-Hispanic blacks are disproportionately affected. That may turn out to be important in terms of the future, Dr. Daniels said, because according to simulation models, childhood obesity and overweight will continue to be a major public health problem in the future (N Engl J Med. 2017;377:2145-53).
Direct evidence is also beginning to emerge of a link between obesity in youth and adult cardiovascular disease. The factors in childhood that predict adult obesity include a higher level of body mass index, obesity present at an older age (adolescence vs. childhood), and the presence of obesity in parents, which reflects both genes and environment. Researchers led by Paul W. Franks, PhD, evaluated 4,857 American Indian children without diabetes who were born between 1945 and 1984 and followed them for death before age 55 (N Engl J Med. 2010;362[6]:485-93). They assessed whether BMI, glucose tolerance, blood pressure, and cholesterol levels predicted premature death. There were 166 deaths from endogenous causes (3.4%) over a median follow-up of 24 years. Factors significantly associated with mortality included obesity (incident rate ratio 2.30), glucose tolerance (IRR 1.73), and hypertension (IRR 1.57).
In a separate analysis, researchers investigated the long-term effects of childhood weight on coronary heart disease (CHD) by studying 276,835 Danish schoolchildren for whom measurements of height and weight were available. They followed the individuals until they turned age 25 or older and used national registries to assess the fatal and nonfatal rates of CHD events (N Engl J Med. 2007;357:2329-37). The researchers found that higher BMI during childhood was associated with an increased risk of CVD in adulthood. However, they did not have data on BMI in adulthood, “which leaves open the question of whether childhood obesity works through adult obesity or also has an independent effect,” said Dr. Daniels, who is also pediatrician-in-chief at Children’s Hospital Colorado, Denver.
More recently, investigators studied 37,674 apparently healthy Israeli men from age 17 into adulthood (N Engl J Med. 2011;364:1315-25). Outcomes were coronary disease and diabetes. They found that an elevated BMI in adolescence is an independent risk factor for CVD in later life, while an elevated BMI in adulthood is an independent risk factor for both CVD and diabetes.
In the Fels Longitudinal Study, researchers enrolled 151 adults with metabolic syndrome and 154 without metabolic syndrome, with a mean age of 51 years (J Pediatr. 2008;152:191-200). “The idea was to look back at this cohort and see when the first differences might be observable between boys and girls who ultimately would develop metabolic syndrome and those who would not,” said Dr. Daniels, who was one of the study investigators. The first appearance of differences between adults with and without metabolic syndrome occurred at ages 8 and 13 for BMI and 6 and 13 for waist circumference in boys and girls, respectively. Odds ratios (ORs) for the metabolic syndrome in adulthood if BMI were elevated in childhood ranged from 1.4 to 1.9 in boys and from 0.8 to 2.8 in girls. At the same time, odds ratios for the metabolic syndrome in adulthood if waist circumference was elevated ranged from 2.5 to 31.4 in boys and 1.7 to 2.5 in girls.
“I think it’s safe to say that BMI and waist circumference may be important in predicting metabolic syndrome later in life and, ultimately, cardiovascular disease,” Dr. Daniels said.
He noted that as the prevalence and severity of obesity have increased in childhood, the prevalence of type 2 diabetes has also increased. “The time from diagnosis of diabetes to a CVD event is approximately 10-15 years in adults, and there is often a prediagnosis period of hyperglycemia, which ranges from 5-10 years,” Dr. Daniels said. “If the time course of CVD related to diabetes is the same for adolescents as adults, it is anticipated that adolescents with diabetes will begin having substantial CVD morbidity and mortality in their 30s or 40s. This will be a public health disaster. Emerging evidence from the TODAY study (Treatment Options for type 2 Diabetes in Adolescents and Youth) and other studies is emphasizing that at least some individuals with adolescent type 2 diabetes may have a more malignant form of disease than in adults. This is striking and important to consider as we look at how to prevent cardiovascular disease.”
Obesity in childhood is also associated with structural and functional abnormalities of the vasculature, according to studies that measure vascular structure via intima-media thickness of the carotid arteries, femoral arteries, abdominal aorta, or other arteries, as well as those that measure vascular stiffness via measures of intrinsic “visco-elastic” properties of the arterial wall. In one study of individuals aged 10-24 years, Dr. Daniels and his associates performed carotid ultrasound for carotid intima-media thickness on 182 patients who were lean, 136 who were obese, and 128 who had type 2 diabetes (Circulation 2009;119(22):2913-9). It demonstrated that youth with obesity and obesity-related type 2 diabetes have abnormalities in carotid thickness and stiffness that are only partially explained by traditional cardiovascular risk factors.
“We all know that obesity is very difficult to treat,” he concluded. “That’s true in children and adolescents as it is in adults. I think this argues for prevention of obesity, for us starting earlier, creating an optimal cardiovascular health situation that we can maintain during the course of childhood and adolescence. The payoff will be great if we can accomplish that.”
Dr. Daniels reported having no disclosures.
EXPERT ANALYSIS FROM WCIRDC 2018
Societies refresh diabetes and PAD guidance
This week, the barbershop may become a key battleground in the fight against hypertension, the American Diabetes Association upgrades newer antihyperglycemics, refreshed appropriate use criteria for peripheral artery disease are released, and body mass index as a measure of cardiometabolic risk gets a boost.
Subscribe to Cardiocast wherever you get your podcasts.
Amazon Alexa

New risk-prediction model for diabetes under development
LOS ANGELES – Clinicians treating patients with diabetes rely heavily on the U.K. Prospective Diabetes Study (UKPDS) Risk Engine and the Framingham Risk Score to predict outcomes, but the populations used for developing these tools differ significantly from the current U.S. diabetes population.
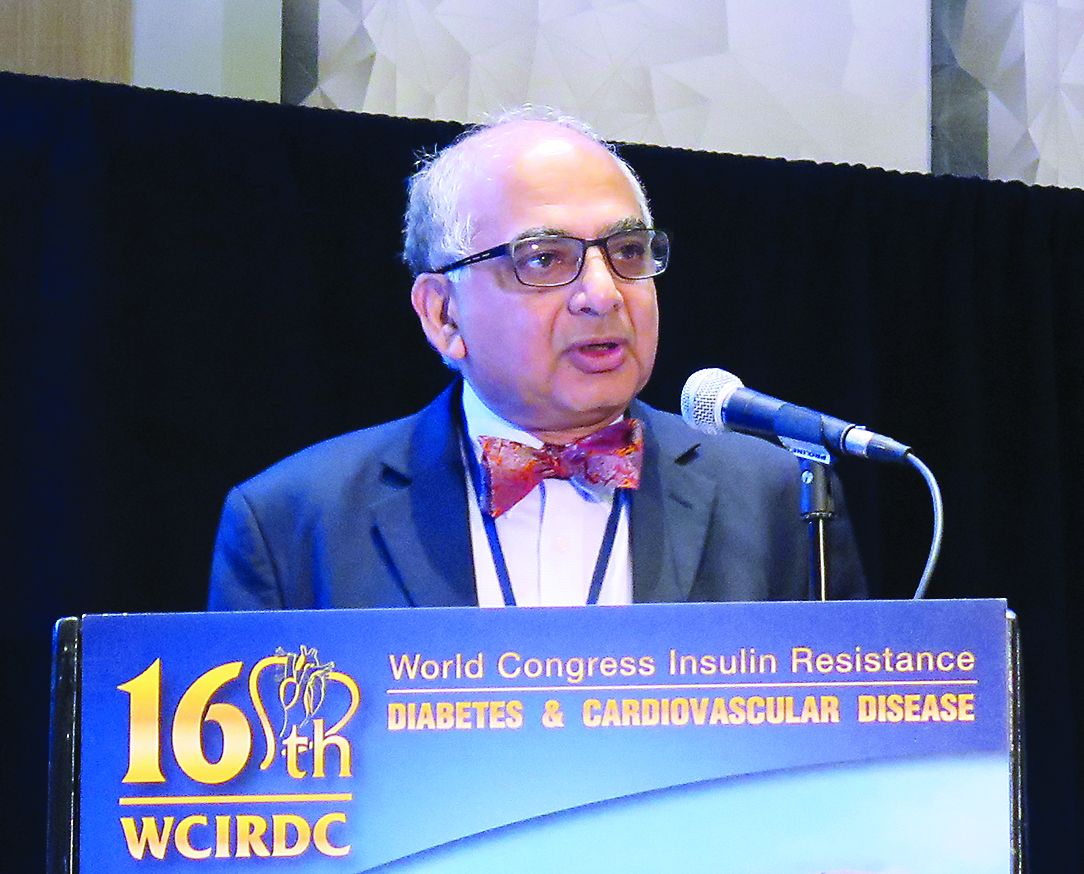
“All these risk engines have various degrees of accuracy along with several limitations, including that they are derived from data from various populations,” Vivian A. Fonseca, MD, said at the World Congress on Insulin Resistance, Diabetes & Cardiovascular Disease. “Sometimes the results may not be generalizable. That’s one of the big problems with the risk engines we’re using.”
To address these shortcomings, Dr. Fonseca, Hui Shao, PhD, and Lizheng Shi, PhD, have developed the Building, Relating, Assessing, Validating Outcomes (BRAVO) of Diabetes Model, a patient-level microsimulation model based on data from the ACCORD trial. The model predicts both primary and secondary CVD events, microvascular events, the progress of hemoglobin A1c and other key biomarkers over time, quality-adjusted life-year (QALY) function decrements associated with complications, and an ability to predict outcomes in patients from other regions in the world. The risk engine contains three modules for 17 equations in total, including angina, blindness, and hypoglycemia (Pharmacoeconomics. 2018;36[9]:1125-34). “There are lots of data now showing that if you get hypoglycemia, your risk of a cardiovascular event goes up greatly over the subsequent 2 years,” said Dr. Fonseca, who is chief of the section of endocrinology at Tulane University Health Science Center, New Orleans. “No other risk engine has that.”
When he and his associates applied the UKPDS Risk Engine to the ACCORD cohort, they found that the UPKDS Risk Engine overpredicted the risk of stroke (2.3% vs. 1.4% observed), MI (6.5% vs. 4.9% observed), and all-cause mortality (10.3% vs. 4% observed); yet it underpredicted congestive heart failure (2.2% vs. 4% observed), end-stage renal disease (0.5% vs. 3% observed), and blindness (1.35% vs. 8.1% observed). In the ACCORD cohort, baseline duration varied from 0 to 35 years. “Using left truncated regression, we can piece together the segmented follow-up times for 10,251 patients to a complete diabetes progression track from 0 years to 40 years after diabetes onset,” he said.
Dr. Fonseca said that Internal validations studies found that BRAVO predicted outcomes from the ACCORD trial, including congestive heart failure, MI, stroke, angina, blindness, end-stage renal disease, and neuropathy. Data from the ASPEN, CARDS, and ADVANCE trials were used to conduct external validation, and the incidence rates of 28 endpoints correlated with that of BRAVO “extremely well.” In addition, BRAVO has been calibrated against 18 large randomized, controlled trials conducted after the year 2000. “Regional variation in CVD [cardiovascular disease] outcomes were included as an important risk factor in the simulation,” said Dr. Fonseca, who is also assistant dean for clinical research at Tulane. Results to date show a high prediction accuracy (R-squared value = .91).
He and his associates are currently examining ways to apply BRAVO in clinical practice, including for risk stratification. “Let’s say you have a large health system, and you want to separate out your patients who have high, medium, or low risk for diabetes and make sure they get they get the right care according to their stratification,” he explained. “A couple of large health systems are trying this out right now.”
BRAVO can also be used as a tool for cost-effectiveness analysis and program evaluation. In fact, he and his colleagues at five medical centers are working with the American Diabetes Association “to see what effect a certain intervention will have on outcomes in people with diabetes over a number of years, and how cost effective it might be.”
Finally, BRAVO can be used for diabetes management in clinical practice. “Based on an individual’s characteristics, the BRAVO model potentially simulates future outcomes such as complications and mortality, providing a transparent platform for shared decision making,” he said.
Dr. Fonseca disclosed that he has an ownership interest in the development of BRAVO.
LOS ANGELES – Clinicians treating patients with diabetes rely heavily on the U.K. Prospective Diabetes Study (UKPDS) Risk Engine and the Framingham Risk Score to predict outcomes, but the populations used for developing these tools differ significantly from the current U.S. diabetes population.
“All these risk engines have various degrees of accuracy along with several limitations, including that they are derived from data from various populations,” Vivian A. Fonseca, MD, said at the World Congress on Insulin Resistance, Diabetes & Cardiovascular Disease. “Sometimes the results may not be generalizable. That’s one of the big problems with the risk engines we’re using.”
To address these shortcomings, Dr. Fonseca, Hui Shao, PhD, and Lizheng Shi, PhD, have developed the Building, Relating, Assessing, Validating Outcomes (BRAVO) of Diabetes Model, a patient-level microsimulation model based on data from the ACCORD trial. The model predicts both primary and secondary CVD events, microvascular events, the progress of hemoglobin A1c and other key biomarkers over time, quality-adjusted life-year (QALY) function decrements associated with complications, and an ability to predict outcomes in patients from other regions in the world. The risk engine contains three modules for 17 equations in total, including angina, blindness, and hypoglycemia (Pharmacoeconomics. 2018;36[9]:1125-34). “There are lots of data now showing that if you get hypoglycemia, your risk of a cardiovascular event goes up greatly over the subsequent 2 years,” said Dr. Fonseca, who is chief of the section of endocrinology at Tulane University Health Science Center, New Orleans. “No other risk engine has that.”
When he and his associates applied the UKPDS Risk Engine to the ACCORD cohort, they found that the UPKDS Risk Engine overpredicted the risk of stroke (2.3% vs. 1.4% observed), MI (6.5% vs. 4.9% observed), and all-cause mortality (10.3% vs. 4% observed); yet it underpredicted congestive heart failure (2.2% vs. 4% observed), end-stage renal disease (0.5% vs. 3% observed), and blindness (1.35% vs. 8.1% observed). In the ACCORD cohort, baseline duration varied from 0 to 35 years. “Using left truncated regression, we can piece together the segmented follow-up times for 10,251 patients to a complete diabetes progression track from 0 years to 40 years after diabetes onset,” he said.
Dr. Fonseca said that Internal validations studies found that BRAVO predicted outcomes from the ACCORD trial, including congestive heart failure, MI, stroke, angina, blindness, end-stage renal disease, and neuropathy. Data from the ASPEN, CARDS, and ADVANCE trials were used to conduct external validation, and the incidence rates of 28 endpoints correlated with that of BRAVO “extremely well.” In addition, BRAVO has been calibrated against 18 large randomized, controlled trials conducted after the year 2000. “Regional variation in CVD [cardiovascular disease] outcomes were included as an important risk factor in the simulation,” said Dr. Fonseca, who is also assistant dean for clinical research at Tulane. Results to date show a high prediction accuracy (R-squared value = .91).
He and his associates are currently examining ways to apply BRAVO in clinical practice, including for risk stratification. “Let’s say you have a large health system, and you want to separate out your patients who have high, medium, or low risk for diabetes and make sure they get they get the right care according to their stratification,” he explained. “A couple of large health systems are trying this out right now.”
BRAVO can also be used as a tool for cost-effectiveness analysis and program evaluation. In fact, he and his colleagues at five medical centers are working with the American Diabetes Association “to see what effect a certain intervention will have on outcomes in people with diabetes over a number of years, and how cost effective it might be.”
Finally, BRAVO can be used for diabetes management in clinical practice. “Based on an individual’s characteristics, the BRAVO model potentially simulates future outcomes such as complications and mortality, providing a transparent platform for shared decision making,” he said.
Dr. Fonseca disclosed that he has an ownership interest in the development of BRAVO.
EXPERT ANALYSIS FROM THE WCIRCD 2018
New diabetes guidelines downgrade insulin as first-line injectable treatment
The American Diabetes Association is out with new standard-of-care guidelines that – among other things – reject injectable insulin as the main first-line treatment for type 2 diabetes mellitus (T2DM), debut a cardiac risk calculator, and offer new recommendations regarding medications for patients with kidney disease, clogged arteries, and heart failure.
The ADA’s newly released 2019 Standards of Medical Care in Diabetes “emphasize a patient-centered approach that considers the multiple health and life factors of each person living with diabetes,” said William T. Cefalu, MD, the ADA’s chief scientific, medical, and mission officer, in a statement.
The 193-page guidelines are now available online at the Diabetes Care website and will be available via an app and the print edition of the journal.
Here’s a closer look at a few of the many new and revised recommendations in the 2019 Standards of Care.
Diabetes treatment
In a new guideline, the standards of care says glucagonlike peptide–1 (GLP-1) receptor agonists should be “a first-line treatment” – ahead of insulin – “for most [type 2] patients who need the greater efficacy of an injectable medication.”
However, the recommendations note that the “high costs and tolerability issues are important barriers to the use of GLP-1 receptor agonists.”
A new recommendation suggests the use of sodium-glucose cotransporter 2 inhibitors or GLP-1 receptor agonists “with demonstrated cardiovascular disease benefit” in patients with type 2 diabetes who have confirmed atherosclerotic cardiovascular disease.
A related new recommendation says sodium-glucose cotransporter 2 inhibitors are the preferred treatment for these patients who have heart failure or are at high risk of developing it.
In a new recommendation, the ADA suggests that patients with type 2 diabetes and chronic kidney disease potentially take a sodium-glucose cotransporter 2 inhibitor or a GLP-1 receptor agonist, which has been shown to reduce the risk of chronic kidney disease progression, cardiac events, or both.
There’s a greater focus on insulin as the preferred treatment for hyperglycemia in gestational diabetes mellitus “as it does not cross the placenta to a measurable extent.” The ADA also warns against metformin and glyburide as first-line agents because they “both cross the placenta to the fetus.”
Diabetes monitoring and screening
The ADA now recommends use of the American College of Cardiology’s atherosclerotic cardiovascular disease risk calculator, the ASCVD Risk Estimator Plus. The calculator assesses the risk of this disease over 10 years and is “generally a useful tool.”
The ACA recommends screening for cardiac risk factors at least once a year in patients with diabetes.
Physicians are no longer advised to check the feet of patients with diabetes at every visit; now the recommendation is for those at high risk of ulceration only. However, an annual examination of feet is recommended for all patients with diabetes.
The ADA now recommends that patients with type 2 diabetes or prediabetes undergo screening for nonalcoholic steatohepatitis and liver fibrosis if they have elevated liver enzymes or an ultrasound examination shows signs of fatty liver.
Gabapentin is now listed along with pregabalin and duloxetine as first-line drug treatments for neuropathic pain in diabetes.
FROM DIABETES CARE
Active migraine in women linked to lower risk of developing T2DM
Women with active migraines are less likely to have type 2 diabetes mellitus (T2DM) and show a decrease in migraine symptoms prior to diagnosis of T2DM, indicating an inverse relationship between hyperglycemia, hyperinsulinism, and migraines, according to recent research published in JAMA Neurology.

“Because plasma glucose concentration rises with time up to the point of type 2 diabetes occurrence, the prevalence of migraine symptoms may decrease,” Guy Fagherazzi, PhD, at the Center for Research in Epidemiology and Population Health at the Gustave Roussy Institute in Villejuif, France, and his colleagues wrote in their study. “Consequently, tracking the evolution and especially the decrease of migraine frequency in individuals with migraine at high risk of diabetes, such as individuals with obesity, irrespective of age could be the sign of an emerging increased blood glucose levels, prediabetes, or type 2 diabetes.”
The researchers used data from the prospective Etude Epidémiologique Auprès des Femmes de la Mutuelle Générale de l’Education Nationale (E3N) study, initiated in 1990 and identified 74,247 women (mean age, 61 years old) with self-reported migraine in a 2002 follow-up questionnaire who had 10-year follow-up data during 2004-2014. The women in the cohort were born during 1925-1950 and completed biennial questionnaires about their health, including migraine status and medications, since 1992. The participants were divided into groups based on no migraine (49,199 participants), active migraine (7,839 participants), or prior migraine history (17,209 participants), and patients with T2DM at baseline were excluded.
Dr. Fagherazzi and his colleagues found 2,372 cases of type 2 diabetes over the follow-up period. Women who had active migraine status were less likely to have T2DM (hazard ratio, 0.80; 95% confidence interval, 0.67-0.96) than were the participants who did not have migraines, and this inverse association persisted after the researchers adjusted for factors such as myocardial infarction, education level, family history of diabetes, body mass index, smoking status, hypertension, physical activity, oral contraceptive use, menopausal status, menopausal hormone therapy, handedness, antimigraine preparations, and other prescribed migraine drugs (HR, 0.70; 95% CI, 0.58-0.85).
In the participants who developed T2DM, the researchers also found that there was a decrease in the prevalence of active migraine in the 24 years prior to T2DM diagnosis from 22% (95% CI, 16%-27%) to 11% (95% CI, 10%-12%) after adjusting for T2DM risk factors, which was then followed by an up to 22-year plateau in migraine prevalence of 11% for these participants.
“The linear decrease of migraine prevalence long before and the plateau long after type 2 diabetes diagnosis is novel and the association deserves to be studied in other populations,” Dr. Fagherazzi and his colleagues wrote. “The potential beneficial role of both hyperglycemia and hyperinsulinism on migraine occurrence needs to be further explored.”
The researchers noted limitations in the study, such as self-reported migraine by participants in the cohort, exclusion of non–pharmacologically treated T2DM cases, observational nature of the study, and homogenized population in the E3N cohort consisting of mainly women in menopause who were teachers and belonged to the same health insurance plan.
This study was funded by a grant from the French Research agency. The E3N cohort study was funded by the “Mutuelle Générale de l’Education Nationale,” European Community, French League against Cancer, Gustave Roussy, and French Institute of Health and Medical Research. Dr. Kurth is an advisory board member for CoLucid and has received funding for a research project from Amgen, honoraria from Lilly, lecture support from Novartis and Daiichi Sankyo, and travel support from the International Headache Society, as well as provided BMJ with editorial services.
SOURCE: Fagherazzi G et al. JAMA Neurol. 2018. doi: 10.1001/jamaneurol.2018.3960.
Although it has been noted for some time in the clinical setting, researchers are still unsure why there is an inverse association between active migraine and type 2 diabetes mellitus, as noted by Fagherazzi et al. in a recent study.
One explanation is the presence of calcitonin gene–related peptide in both animal models of energy metabolism and the pathophysiology of migraine. It is possible that insulin resistance and hyperglycemia damage the sensory neurons that produce the peptide. If these damaged nerves are soothed, migraine may resolve.
Other silver linings associated with active migraine include an increased likelihood of having a healthy cardiovascular system and decreased alcohol consumption.
The epidemiology of migraine and findings like those in this study prompt the question: What is migraine good for?
Amy A. Gelfand, MD , of the University of California, San Francisco, and Elizabeth Loder, MD , MPH, of Harvard Medical School in Boston made these comments in an editorial accompanying Dr. Fagherazzi’s study. They disclosed a number of financial relationships with companies marketing treatments for migraine.
Women with active migraines are less likely to have type 2 diabetes mellitus (T2DM) and show a decrease in migraine symptoms prior to diagnosis of T2DM, indicating an inverse relationship between hyperglycemia, hyperinsulinism, and migraines, according to recent research published in JAMA Neurology.
“Because plasma glucose concentration rises with time up to the point of type 2 diabetes occurrence, the prevalence of migraine symptoms may decrease,” Guy Fagherazzi, PhD, at the Center for Research in Epidemiology and Population Health at the Gustave Roussy Institute in Villejuif, France, and his colleagues wrote in their study. “Consequently, tracking the evolution and especially the decrease of migraine frequency in individuals with migraine at high risk of diabetes, such as individuals with obesity, irrespective of age could be the sign of an emerging increased blood glucose levels, prediabetes, or type 2 diabetes.”
The researchers used data from the prospective Etude Epidémiologique Auprès des Femmes de la Mutuelle Générale de l’Education Nationale (E3N) study, initiated in 1990 and identified 74,247 women (mean age, 61 years old) with self-reported migraine in a 2002 follow-up questionnaire who had 10-year follow-up data during 2004-2014. The women in the cohort were born during 1925-1950 and completed biennial questionnaires about their health, including migraine status and medications, since 1992. The participants were divided into groups based on no migraine (49,199 participants), active migraine (7,839 participants), or prior migraine history (17,209 participants), and patients with T2DM at baseline were excluded.
Dr. Fagherazzi and his colleagues found 2,372 cases of type 2 diabetes over the follow-up period. Women who had active migraine status were less likely to have T2DM (hazard ratio, 0.80; 95% confidence interval, 0.67-0.96) than were the participants who did not have migraines, and this inverse association persisted after the researchers adjusted for factors such as myocardial infarction, education level, family history of diabetes, body mass index, smoking status, hypertension, physical activity, oral contraceptive use, menopausal status, menopausal hormone therapy, handedness, antimigraine preparations, and other prescribed migraine drugs (HR, 0.70; 95% CI, 0.58-0.85).
In the participants who developed T2DM, the researchers also found that there was a decrease in the prevalence of active migraine in the 24 years prior to T2DM diagnosis from 22% (95% CI, 16%-27%) to 11% (95% CI, 10%-12%) after adjusting for T2DM risk factors, which was then followed by an up to 22-year plateau in migraine prevalence of 11% for these participants.
“The linear decrease of migraine prevalence long before and the plateau long after type 2 diabetes diagnosis is novel and the association deserves to be studied in other populations,” Dr. Fagherazzi and his colleagues wrote. “The potential beneficial role of both hyperglycemia and hyperinsulinism on migraine occurrence needs to be further explored.”
The researchers noted limitations in the study, such as self-reported migraine by participants in the cohort, exclusion of non–pharmacologically treated T2DM cases, observational nature of the study, and homogenized population in the E3N cohort consisting of mainly women in menopause who were teachers and belonged to the same health insurance plan.
This study was funded by a grant from the French Research agency. The E3N cohort study was funded by the “Mutuelle Générale de l’Education Nationale,” European Community, French League against Cancer, Gustave Roussy, and French Institute of Health and Medical Research. Dr. Kurth is an advisory board member for CoLucid and has received funding for a research project from Amgen, honoraria from Lilly, lecture support from Novartis and Daiichi Sankyo, and travel support from the International Headache Society, as well as provided BMJ with editorial services.
SOURCE: Fagherazzi G et al. JAMA Neurol. 2018. doi: 10.1001/jamaneurol.2018.3960.
FROM JAMA NEUROLOGY
Key clinical point: There was an inverse association between active migraine and type 2 diabetes mellitus in women over 10 years of follow-up.
Major finding: Compared with women who had no history of active migraine, women with active migraine had a lower risk of developing type 2 diabetes (univariate hazard ratio, 0.80; 95% confidence interval, 0.67-0.96).
Study details: Results from a prospective, population-based study of 74,247 women with active migraines in the E3N cohort study in France.
Disclosures: This study was funded by a grant from the French Research agency. The E3N cohort study was funded by the Mutuelle Générale de l’Education Nationale, European Community, French League against Cancer, Gustave Roussy, and French Institute of Health and Medical Research. Dr. Kurth is an advisory board member for CoLucid and has received funding for a research project from Amgen, honoraria from Lilly, lecture support from Novartis and Daiichi Sankyo, and travel support from the International Headache Society, as well as provided the BMJ with editorial services.
Source: Fagherazzi G et al. JAMA Neurol. 2018. doi: 10.1001/jamaneurol.2018.3960.
ABIM sued over maintenance of certification
Also today, drug test results should not dictate treatment, duodenoscopes contain more bacteria than expected, and weight-loss medications may have a role following bariatric surgery.
Amazon Alexa
Apple Podcasts
Google Podcasts
Spotify
Also today, drug test results should not dictate treatment, duodenoscopes contain more bacteria than expected, and weight-loss medications may have a role following bariatric surgery.
Amazon Alexa
Apple Podcasts
Google Podcasts
Spotify
Also today, drug test results should not dictate treatment, duodenoscopes contain more bacteria than expected, and weight-loss medications may have a role following bariatric surgery.
Amazon Alexa
Apple Podcasts
Google Podcasts
Spotify

CABG surpasses PCI for diabetics out to 7.5 years
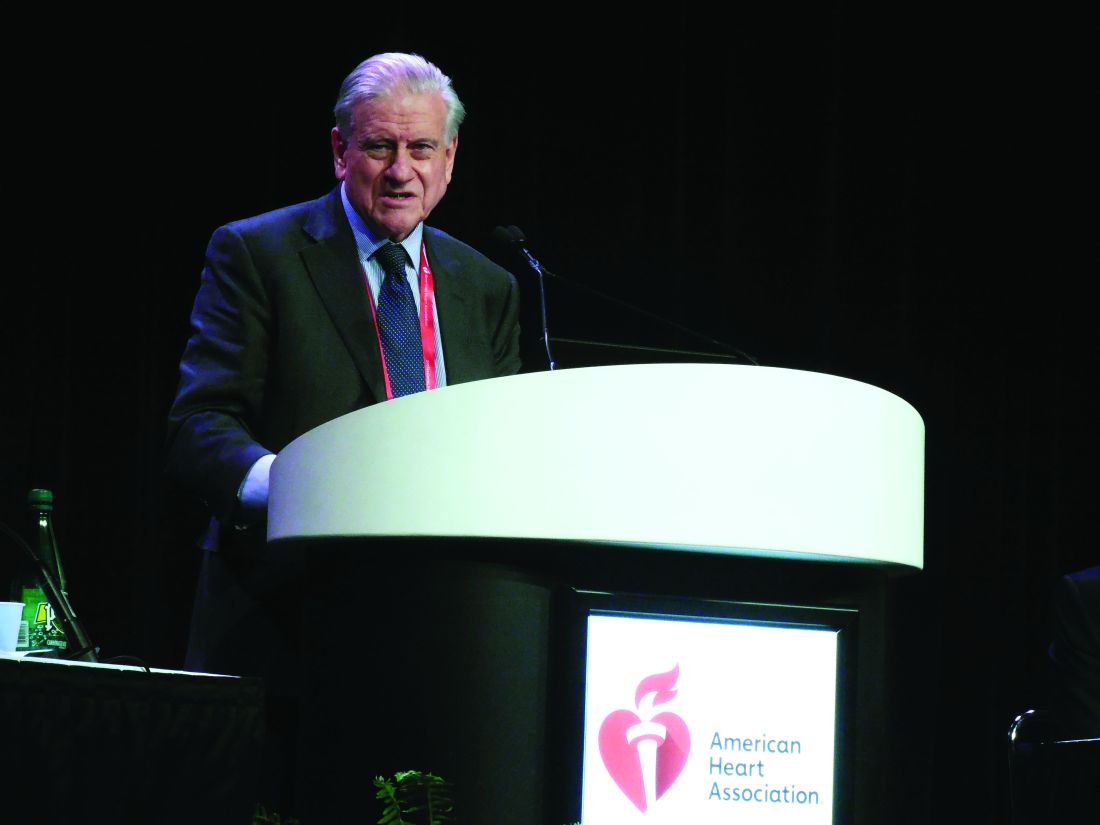
CHICAGO – Patients with diabetes who underwent coronary artery bypass grafting had significantly better survival than patients with diabetes who underwent percutaneous coronary intervention after a median 7.5 years of follow-up.
Those patients comprised about half the patients enrolled in the FREEDOM randomized trial.
Long-term follow-up was only possible for just under half the 1,900 patients with diabetes and multivessel coronary disease originally enrolled in FREEDOM, but when researchers combined the long-term results with the data collected in the original study that had a median 3.8-year follow-up, they found all-cause mortality occurred in 18.3% of the patients who underwent coronary artery bypass grafting (CABG) and in 24.3% of patients treated with percutaneous coronary intervention (PCI), a 6% absolute between-group difference that was statistically significant, Valentin Fuster, MD, said at the American Heart Association scientific sessions. This fully jibed with the primary FREEDOM results, which found after 5 years a statistically significant reduction in all-cause death with CABG, compared with PCI, and also a significant reduction in the study’s primary endpoint (a combination of all-cause death, MI, and stroke), which occurred in 18.7% of patients randomized to CABG and in 26.6% of those randomized to PCI (N Engl J Med. 2012 Dec 20;367[25]:2375-84).
The extended follow-up finding lent additional support to existing society recommendations that CABG is the preferred revascularization strategy for patients with diabetes and multivessel coronary disease, most recently from the European Society of Cardiology (Eur Heart J. 2018 Aug 25. doi: 10.1093/eurheartj/ehy394), said Dr. Fuster, professor of medicine at the Icahn School of Medicine at Mount Sinai and director of Mount Sinai Heart in New York. A subgroup analysis of the extended follow-up also suggested that the survival benefit from CABG, compared with PCI, was especially strong among patients at or below the study’s median age of 63 years. In the younger subgroup survival among patients treated with CABG was twice as good as it was among patients treated with PCI.
Dr. Fuster noted that few data have been previously reported for survival rates beyond 5 years after revascularization. “This was a difficult study. Following patients for more than 5 years is hard,” he said. Concurrently with his report at the meeting the results also appeared online (J Am Coll Cardiol. 2018 Nov 11. doi: 10.1016/j.jacc.2018.11.001).
The FREEDOM (Future Revascularization Evaluation in Patients with Diabetes Mellitus: Optimal Management of Multivessel Disease) trial enrolled patients at 140 participating centers during 2005-2010. A total of 25 sites agreed to participate in the extended follow-up and could track 943 patients, 50% of the starting cohort of 1,900 and 89% of the patients originally enrolled at these 25 centers. Dr. Fuster stressed that the 957 patients not included in the follow-up had not been lost, but rather had been managed at sites that declined to participate in this additional study.
Dr. Fuster acknowledged that methods and hardware for PCI have changed since the study ran a decade ago, as have options for medical management. He also highlighted that the long-term follow-up results had no data on rates of MIs and strokes.
FREEDOM had no commercial funding. Dr. Fuster reported no relevant disclosures.
SOURCE: Fuster V et al. AHA 2018, Abstract 18609.
These extended results from the FREEDOM trial that followed many patients for 10 years or longer add to the consistent evidence base that supports coronary artery bypass grafting (CABG) as the preferred revascularization strategy for patients with diabetes and multivessel coronary disease. The new findings support existing society guidelines that recommend CABG over percutaneous coronary intervention in these patients, most recently in the revascularization guidelines from the European Society of Cardiology (Eur Heart J. 2018 Aug 25. doi: 10.1093/eurheartj/ehy394). An update to the U.S. guidelines should appear in 2019.

Continued improvement of revascularization techniques, hardware, and medical management of patients with diabetes and multivessel coronary artery disease makes it challenging to apply the results of studies run in earlier eras to today’s practice. It is possible that continued evolution of coronary stent technology may reduce the differences in outcomes between bypass surgery and percutaneous coronary interventions, although this is less likely if much of CABG’s success relates to the protection it gives against new disease. Future comparisons of different approaches with revascularization will need to take into account the potential contribution of other procedures, other adverse outcomes aside from mortality during long-term follow-up, the consequences of incomplete revascularization, and the impact of new medications for treating diabetes that have been recently shown to also have cardiovascular disease effects. All these factors in concert will define the optimal approach to managing these patients.
Alice K. Jacobs, MD , is director of the cardiac catheterization laboratory at Boston Medical Center and a professor of medicine at Boston University. She has received research support from Abbott Vascular. She made these comments as designated discussant for the study.
These extended results from the FREEDOM trial that followed many patients for 10 years or longer add to the consistent evidence base that supports coronary artery bypass grafting (CABG) as the preferred revascularization strategy for patients with diabetes and multivessel coronary disease. The new findings support existing society guidelines that recommend CABG over percutaneous coronary intervention in these patients, most recently in the revascularization guidelines from the European Society of Cardiology (Eur Heart J. 2018 Aug 25. doi: 10.1093/eurheartj/ehy394). An update to the U.S. guidelines should appear in 2019.
Continued improvement of revascularization techniques, hardware, and medical management of patients with diabetes and multivessel coronary artery disease makes it challenging to apply the results of studies run in earlier eras to today’s practice. It is possible that continued evolution of coronary stent technology may reduce the differences in outcomes between bypass surgery and percutaneous coronary interventions, although this is less likely if much of CABG’s success relates to the protection it gives against new disease. Future comparisons of different approaches with revascularization will need to take into account the potential contribution of other procedures, other adverse outcomes aside from mortality during long-term follow-up, the consequences of incomplete revascularization, and the impact of new medications for treating diabetes that have been recently shown to also have cardiovascular disease effects. All these factors in concert will define the optimal approach to managing these patients.
Alice K. Jacobs, MD , is director of the cardiac catheterization laboratory at Boston Medical Center and a professor of medicine at Boston University. She has received research support from Abbott Vascular. She made these comments as designated discussant for the study.
CHICAGO – Patients with diabetes who underwent coronary artery bypass grafting had significantly better survival than patients with diabetes who underwent percutaneous coronary intervention after a median 7.5 years of follow-up.
Those patients comprised about half the patients enrolled in the FREEDOM randomized trial.
Long-term follow-up was only possible for just under half the 1,900 patients with diabetes and multivessel coronary disease originally enrolled in FREEDOM, but when researchers combined the long-term results with the data collected in the original study that had a median 3.8-year follow-up, they found all-cause mortality occurred in 18.3% of the patients who underwent coronary artery bypass grafting (CABG) and in 24.3% of patients treated with percutaneous coronary intervention (PCI), a 6% absolute between-group difference that was statistically significant, Valentin Fuster, MD, said at the American Heart Association scientific sessions. This fully jibed with the primary FREEDOM results, which found after 5 years a statistically significant reduction in all-cause death with CABG, compared with PCI, and also a significant reduction in the study’s primary endpoint (a combination of all-cause death, MI, and stroke), which occurred in 18.7% of patients randomized to CABG and in 26.6% of those randomized to PCI (N Engl J Med. 2012 Dec 20;367[25]:2375-84).
The extended follow-up finding lent additional support to existing society recommendations that CABG is the preferred revascularization strategy for patients with diabetes and multivessel coronary disease, most recently from the European Society of Cardiology (Eur Heart J. 2018 Aug 25. doi: 10.1093/eurheartj/ehy394), said Dr. Fuster, professor of medicine at the Icahn School of Medicine at Mount Sinai and director of Mount Sinai Heart in New York. A subgroup analysis of the extended follow-up also suggested that the survival benefit from CABG, compared with PCI, was especially strong among patients at or below the study’s median age of 63 years. In the younger subgroup survival among patients treated with CABG was twice as good as it was among patients treated with PCI.
Dr. Fuster noted that few data have been previously reported for survival rates beyond 5 years after revascularization. “This was a difficult study. Following patients for more than 5 years is hard,” he said. Concurrently with his report at the meeting the results also appeared online (J Am Coll Cardiol. 2018 Nov 11. doi: 10.1016/j.jacc.2018.11.001).
The FREEDOM (Future Revascularization Evaluation in Patients with Diabetes Mellitus: Optimal Management of Multivessel Disease) trial enrolled patients at 140 participating centers during 2005-2010. A total of 25 sites agreed to participate in the extended follow-up and could track 943 patients, 50% of the starting cohort of 1,900 and 89% of the patients originally enrolled at these 25 centers. Dr. Fuster stressed that the 957 patients not included in the follow-up had not been lost, but rather had been managed at sites that declined to participate in this additional study.
Dr. Fuster acknowledged that methods and hardware for PCI have changed since the study ran a decade ago, as have options for medical management. He also highlighted that the long-term follow-up results had no data on rates of MIs and strokes.
FREEDOM had no commercial funding. Dr. Fuster reported no relevant disclosures.
SOURCE: Fuster V et al. AHA 2018, Abstract 18609.
REPORTING FROM THE AHA SCIENTIFIC SESSIONS
Key clinical point:
Major finding: After 7.5 years, mortality in the full FREEDOM cohort was 18% after coronary artery bypass grafting and 24% after percutaneous coronary intervention.
Study details: An extended follow-up of 943 of patients enrolled in FREEDOM, a randomized, multicenter trial.
Disclosures: FREEDOM had no commercial funding. Dr. Fuster reported no relevant disclosures.
Source: Fuster V et al. AHA 2018, Abstract 18609.
Decreased insulin clearance may be first step on path to insulin resistance
LOS ANGELES – As obese, nondiabetic individuals become more insulin resistant, a decrease in insulin clearance is the first change to occur, according to Sun H. Kim, MD.

“You will often hear about how insulin resistance enhances demand on beta cells to increase insulin secretion, which leads to hyperinsulinemia,” Dr. Kim said at the World Congress on Insulin Resistance, Diabetes & Cardiovascular Disease. “While well accepted, this model ignores the role of insulin clearance rate in maintaining hyperinsulinemia in insulin resistance states.”
In an effort to understand the physiologic adaptation to insulin resistance prior to the development of type 2 diabetes mellitus, Dr. Kim, an associate professor of endocrinology at Stanford (Calif) University, Stanford, and her colleagues enrolled 91 adults who had a body mass index of at least 30 kg/m2. The study was published in the March 2018 issue of Diabetologia. Each subject underwent a 75-g oral glucose tolerance test as well as the insulin suppression test to measure insulin resistance and the graded glucose infusion test to determine each subject’s insulin secretion rate and insulin clearance rate. For the graded glucose infusion test, the researchers increased the glucose infusion rate every 40 minutes, from 1 mg/kg per minute up to 8 mg/kg per minute. Next, they divided the cohort of obese individuals into tertiles of insulin resistance as quantified by the steady-state plasma glucose (SSPG): less than 9.7 mmol/L (tertile 1), 9.7-12.7 mmol/L (tertile 2), and 12.8 mmol/L or greater (tertile 3).
The mean age of subjects was 54 years. The mean SSPG level was 7.2 mmol/L among subjects in tertile 1, 11.3 mmol/L among those in tertile 2, and 14.3 mmol/L among those in tertile 3. The remainder of the demographics was similar. “Most importantly, body mass index among tertiles was nearly identical,” Dr. Kim said. “The only biomarker that was different was ALT, which increased with increasing tertiles. The individuals who were more insulin resistant likely had more fatty liver. We didn’t do imaging in this particular study.”
When the researchers evaluated oral glucose tolerance test data, they observed that subjects who were most insulin resistant had slightly higher glucose levels, “which we often see,” she said. “The body does try to keep glucose in a narrow range. What was dramatic were the insulin levels. The most insulin-resistant subjects had insulin levels that were double those of the least insulin-resistant subjects in tertile 1 during the oral glucose tolerance test.”
During the intravenous glucose infusion test, glucose levels rose similarly in the three groups, but those in tertile 3 had slightly higher glucose levels (P = .04). The insulin secretion rate, meanwhile, was similar among subjects in tertiles 1 and 2 but was increased significantly among subjects in tertile 3 (P less than .001). In contrast, the researchers observed a stepwise decline in insulin clearance rate from tertiles 1 to 3. Thus the insulin clearance rate was significantly different between subjects in tertile 1 and tertile 2 (P = .04) as well as between subjects in tertile 2 and those in tertile 3 (P less than .001).
“We propose that insulin resistance leads to an increase in intrahepatic fat, which decreases the insulin clearance rate and helps maintain euglycemia,” Dr. Kim concluded. “In the most insulin-resistant tertile, a decrease in insulin clearance rate is not sufficient, and an increase in the insulin secretion rate is also required. If you look at the relationship between insulin resistance and insulin clearance rate, there is a negative correlation, so the more insulin resistant you are, the lower your insulin clearance rate. However, there are insulin-resistant individuals who perhaps have higher insulin clearance rates than we think they should have. Could those individuals be at the highest risk to develop diabetes? That’s the story to which I don’t yet have an ending.” She reported having no financial disclosures.
SOURCE: Jung SH et al. Diabetologia. 2018;61(3):681-7.
LOS ANGELES – As obese, nondiabetic individuals become more insulin resistant, a decrease in insulin clearance is the first change to occur, according to Sun H. Kim, MD.
“You will often hear about how insulin resistance enhances demand on beta cells to increase insulin secretion, which leads to hyperinsulinemia,” Dr. Kim said at the World Congress on Insulin Resistance, Diabetes & Cardiovascular Disease. “While well accepted, this model ignores the role of insulin clearance rate in maintaining hyperinsulinemia in insulin resistance states.”
In an effort to understand the physiologic adaptation to insulin resistance prior to the development of type 2 diabetes mellitus, Dr. Kim, an associate professor of endocrinology at Stanford (Calif) University, Stanford, and her colleagues enrolled 91 adults who had a body mass index of at least 30 kg/m2. The study was published in the March 2018 issue of Diabetologia. Each subject underwent a 75-g oral glucose tolerance test as well as the insulin suppression test to measure insulin resistance and the graded glucose infusion test to determine each subject’s insulin secretion rate and insulin clearance rate. For the graded glucose infusion test, the researchers increased the glucose infusion rate every 40 minutes, from 1 mg/kg per minute up to 8 mg/kg per minute. Next, they divided the cohort of obese individuals into tertiles of insulin resistance as quantified by the steady-state plasma glucose (SSPG): less than 9.7 mmol/L (tertile 1), 9.7-12.7 mmol/L (tertile 2), and 12.8 mmol/L or greater (tertile 3).
The mean age of subjects was 54 years. The mean SSPG level was 7.2 mmol/L among subjects in tertile 1, 11.3 mmol/L among those in tertile 2, and 14.3 mmol/L among those in tertile 3. The remainder of the demographics was similar. “Most importantly, body mass index among tertiles was nearly identical,” Dr. Kim said. “The only biomarker that was different was ALT, which increased with increasing tertiles. The individuals who were more insulin resistant likely had more fatty liver. We didn’t do imaging in this particular study.”
When the researchers evaluated oral glucose tolerance test data, they observed that subjects who were most insulin resistant had slightly higher glucose levels, “which we often see,” she said. “The body does try to keep glucose in a narrow range. What was dramatic were the insulin levels. The most insulin-resistant subjects had insulin levels that were double those of the least insulin-resistant subjects in tertile 1 during the oral glucose tolerance test.”
During the intravenous glucose infusion test, glucose levels rose similarly in the three groups, but those in tertile 3 had slightly higher glucose levels (P = .04). The insulin secretion rate, meanwhile, was similar among subjects in tertiles 1 and 2 but was increased significantly among subjects in tertile 3 (P less than .001). In contrast, the researchers observed a stepwise decline in insulin clearance rate from tertiles 1 to 3. Thus the insulin clearance rate was significantly different between subjects in tertile 1 and tertile 2 (P = .04) as well as between subjects in tertile 2 and those in tertile 3 (P less than .001).
“We propose that insulin resistance leads to an increase in intrahepatic fat, which decreases the insulin clearance rate and helps maintain euglycemia,” Dr. Kim concluded. “In the most insulin-resistant tertile, a decrease in insulin clearance rate is not sufficient, and an increase in the insulin secretion rate is also required. If you look at the relationship between insulin resistance and insulin clearance rate, there is a negative correlation, so the more insulin resistant you are, the lower your insulin clearance rate. However, there are insulin-resistant individuals who perhaps have higher insulin clearance rates than we think they should have. Could those individuals be at the highest risk to develop diabetes? That’s the story to which I don’t yet have an ending.” She reported having no financial disclosures.
SOURCE: Jung SH et al. Diabetologia. 2018;61(3):681-7.
REPORTING FROM WCIRDC 2018
Key clinical point:
Major finding: In the most insulin-resistant subgroup, the insulin secretion rate increases and the insulin clearance rate decreases to compensate for insulin resistance.
Study details: A study of 91 obese adults without diabetes.
Disclosures: Dr. Kim reported having no disclosures.
Source: Jung SH et al. Diabetologia. 2018;61(3):681-7.
Study investigates statin-diabetes link
LOS ANGELES – On any given day, type “statins” in the subject line of your favorite search engine and many results are likely to focus on risks: some based on science, others not so much.

“There is all kind of misinformation that are preventing people from taking statins,” Joshua W. Knowles, MD, said at the World Congress on Insulin Resistance, Diabetes & Cardiovascular Disease. “The most important side effects of statins are the increased lifespan and decreased risk of heart attacks, but that’s not what our patients are telling us. One of the things that is true is that .”
In 2016, Dr. Knowles, a cardiologist at the Stanford (Calif.) Center for Inherited Cardiovascular Disease, coauthored a retrospective analysis of data from subjects without diabetes in the Treating to New Targets (TNT) and the Stroke Prevention by Aggressive Reduction in Cholesterol Levels (SPARCL) randomized controlled trials (Am J Cardiol 2016;118[9]:1275-81). The authors found that statins particularly increase the risk of type 2 diabetes in those with prediabetes and insulin resistance. “That’s a risk group that we are all treating,” he said. “But that still doesn’t answer the question as to why this happens. Is this because statins increase insulin resistance, because they decrease beta cell function, or because they increase insulin clearance rate?”
In an effort to find out, Dr. Knowles and his colleagues have launched a clinical trial entitled “Relationship Between Insulin Resistance and Statin Induced Type 2 Diabetes, and Integrative Personal Omics Profiling” (NCT 02437084). Candidates do not have diabetes, yet qualify for statin therapy because they have a greater than 7.5% risk of cardiovascular disease over 10 years. To date, the researchers have enrolled 74 patients: 42 to the insulin-sensitive group (defined as having an LDL above 130 mg/dL and a triglyceride level below 150 mg/dL) and 11 to the insulin-resistant group (defined as having an LDL of 130 mg/dL or greater and a triglyceride level of 150 mg/dL or greater). Dr. Knowles said that about two-thirds of patients have been recruited and that full results are expected in late 2019.
At baseline, subjects underwent the insulin suppression test, the graded glucose infusion test, metabolic characterization, and integrated personal omics profiling (iPOP), a monitoring method. After 3 months of atorvastatin therapy 40 mg/day, the researchers repeated these measures and compared the results between groups. “Basically we were looking for changes in insulin resistance, secretion, and clearance between those groups over time,” said Dr. Knowles, who is the study’s principal investigator.
Of the 74 subjects, 13 decided that they did not want to participate and 6 are still undergoing baseline tests. In all, 55 started statin therapy, and 2 have dropped out. This left 42 in the low-triglyceride group and 11 in the high-triglyceride group.
The average age of the 52 individuals who have completed the study so far is 61 years, 30 are male, 35 are non-Hispanic white, their mean body mass index was 27.9 kg/m2, and their mean blood pressure was 127/79 mm Hg. By the end of statin therapy, body mass index did not change, but total cholesterol fell from a median of 234 mg/dL to a median of 150 mg/dL, triglycerides fell from a median of 109 mg/dL to a median of 78 mg/dL, LDL cholesterol fell from a median of 153 mg/dL to a median of 71 mg/dL, and mean high-sensitivity C-reactive protein dropped from a median of 1.2 mg/L to a median of 0.8 mg/L. All differences were statistically significant.
Fasting glucose levels have been completed on only 35 patients. “Two-hour glucose is going up, but it’s not yet significant, and on the oral glucose tolerance test, the curves are separating slightly but are not yet significant,” Dr. Knowles said.
On average, insulin resistance among the 35 patients worsened slightly, from 156 mg/dL before statin therapy to 170 mg/dL after initiation. “This is nominally significant (P = 0.03), and we’ll have to see if this holds up over time,” he said. The researchers also observed that statin use was associated with slight decreases in insulin secretion and clearance. Dr. Knowles emphasized that these are preliminary results and need to be further validated.
The study is funded by the Doris Duke Charitable Foundation. Dr. Knowles reported having no disclosures.
LOS ANGELES – On any given day, type “statins” in the subject line of your favorite search engine and many results are likely to focus on risks: some based on science, others not so much.
“There is all kind of misinformation that are preventing people from taking statins,” Joshua W. Knowles, MD, said at the World Congress on Insulin Resistance, Diabetes & Cardiovascular Disease. “The most important side effects of statins are the increased lifespan and decreased risk of heart attacks, but that’s not what our patients are telling us. One of the things that is true is that .”
In 2016, Dr. Knowles, a cardiologist at the Stanford (Calif.) Center for Inherited Cardiovascular Disease, coauthored a retrospective analysis of data from subjects without diabetes in the Treating to New Targets (TNT) and the Stroke Prevention by Aggressive Reduction in Cholesterol Levels (SPARCL) randomized controlled trials (Am J Cardiol 2016;118[9]:1275-81). The authors found that statins particularly increase the risk of type 2 diabetes in those with prediabetes and insulin resistance. “That’s a risk group that we are all treating,” he said. “But that still doesn’t answer the question as to why this happens. Is this because statins increase insulin resistance, because they decrease beta cell function, or because they increase insulin clearance rate?”
In an effort to find out, Dr. Knowles and his colleagues have launched a clinical trial entitled “Relationship Between Insulin Resistance and Statin Induced Type 2 Diabetes, and Integrative Personal Omics Profiling” (NCT 02437084). Candidates do not have diabetes, yet qualify for statin therapy because they have a greater than 7.5% risk of cardiovascular disease over 10 years. To date, the researchers have enrolled 74 patients: 42 to the insulin-sensitive group (defined as having an LDL above 130 mg/dL and a triglyceride level below 150 mg/dL) and 11 to the insulin-resistant group (defined as having an LDL of 130 mg/dL or greater and a triglyceride level of 150 mg/dL or greater). Dr. Knowles said that about two-thirds of patients have been recruited and that full results are expected in late 2019.
At baseline, subjects underwent the insulin suppression test, the graded glucose infusion test, metabolic characterization, and integrated personal omics profiling (iPOP), a monitoring method. After 3 months of atorvastatin therapy 40 mg/day, the researchers repeated these measures and compared the results between groups. “Basically we were looking for changes in insulin resistance, secretion, and clearance between those groups over time,” said Dr. Knowles, who is the study’s principal investigator.
Of the 74 subjects, 13 decided that they did not want to participate and 6 are still undergoing baseline tests. In all, 55 started statin therapy, and 2 have dropped out. This left 42 in the low-triglyceride group and 11 in the high-triglyceride group.
The average age of the 52 individuals who have completed the study so far is 61 years, 30 are male, 35 are non-Hispanic white, their mean body mass index was 27.9 kg/m2, and their mean blood pressure was 127/79 mm Hg. By the end of statin therapy, body mass index did not change, but total cholesterol fell from a median of 234 mg/dL to a median of 150 mg/dL, triglycerides fell from a median of 109 mg/dL to a median of 78 mg/dL, LDL cholesterol fell from a median of 153 mg/dL to a median of 71 mg/dL, and mean high-sensitivity C-reactive protein dropped from a median of 1.2 mg/L to a median of 0.8 mg/L. All differences were statistically significant.
Fasting glucose levels have been completed on only 35 patients. “Two-hour glucose is going up, but it’s not yet significant, and on the oral glucose tolerance test, the curves are separating slightly but are not yet significant,” Dr. Knowles said.
On average, insulin resistance among the 35 patients worsened slightly, from 156 mg/dL before statin therapy to 170 mg/dL after initiation. “This is nominally significant (P = 0.03), and we’ll have to see if this holds up over time,” he said. The researchers also observed that statin use was associated with slight decreases in insulin secretion and clearance. Dr. Knowles emphasized that these are preliminary results and need to be further validated.
The study is funded by the Doris Duke Charitable Foundation. Dr. Knowles reported having no disclosures.
REPORTING FROM WCIRDC 2018