User login
Anemia of chronic kidney disease: Treat it, but not too aggressively
Anemia is a frequent complication of chronic kidney disease, occurring in over 90% of patients receiving renal replacement therapy. It is associated with significant morbidity and mortality. While its pathogenesis is typically multifactorial, the predominant cause is failure of the kidneys to produce enough endogenous erythropoietin. The clinical approval of recombinant human erythropoietin in 1989 dramatically changed the treatment of anemia of chronic kidney disease, but randomized controlled trials yielded disappointing results when erythropoiesis-stimulating agents (ESAs) were used to raise hemoglobin to normal levels.
This article reviews the epidemiology and pathophysiology of anemia of chronic kidney disease and discusses the complicated and conflicting evidence regarding its treatment.
DEFINITION AND PREVALENCE
Anemia is defined as a hemoglobin concentration less than 13.0 g/dL for men and less than 12.0 g/dL for premenopausal women.1 It is more common in patients with impaired kidney function, especially when the glomerular filtration rate (GFR) falls below 60 mL/min. It is rare at GFRs higher than 80 mL/min,2 but as the GFR falls, the severity of the anemia worsens3 and its prevalence increases: almost 90% of patients with a GFR less than 30 mL/min are anemic.4
RENAL ANEMIA IS ASSOCIATED WITH BAD OUTCOMES
Anemia in chronic kidney disease is independently associated with risk of death. It is also an all-cause mortality multiplier, ie, it magnifies the risk of death from other disease states.5
In observational studies, anemia was associated with faster progression of left ventricular hypertrophy, inflammation, and increased myocardial and peripheral oxygen demand, thereby leading to worse cardiac outcomes with increased risk of myocardial infarction, coronary revascularization, and readmission for heart failure.6–8 Anemia is also associated with fatigue, depression, reduced exercise tolerance, stroke, and increased risk of rehospitalization.9–13
RENAL ANEMIA IS MULTIFACTORIAL
Anemia of chronic kidney disease is typically attributed to the decrease of erythropoietin production that accompanies the fall in GFR. However, the process is multifactorial, with several other contributing factors: absolute and functional iron deficiency, folate and vitamin B12 deficiencies, reduced red blood cell life span, and suppression of erythropoiesis by the uremic milieu.14
While it was once thought that chronic kidney disease leads to loss of erythropoietin-producing cells, it is now known that downregulation of hypoxia-inducible factor (HIF; a transcription factor) is at least partially responsible for the decrease in erythropoietin production15,16 and that this downregulation is reversible (see below).
ERYTHROPOIETIN, IRON, AND RED BLOOD CELLS
Erythropoietin production is triggered by hypoxia, mediated by HIF
Erythropoietin is produced primarily in the deep cortex and outer medulla of the kidneys by a special population of peritubular interstitial cells.17 The parenchymal cells of the liver also produce erythropoietin, but much less.18
The rate of renal erythropoietin synthesis is determined by tissue oxygenation rather than by renal blood flow; production increases as the hemoglobin concentration drops and the arterial oxygen tension decreases (Figure 1).19
The gene for erythropoietin is located on chromosome 7 and is regulated by HIF. HIF molecules are composed of an alpha subunit, which is unstable at high Po2, and a beta subunit, constitutively present in the nucleus.20
In hypoxic conditions, the HIF dimer is transcriptionally active and binds to specific DNA recognition sequences called hypoxia-response elements. Gene transcription is upregulated, leading to increased production of erythropoietin.21
Under normal oxygen tension, on the other hand, the proline residue of the HIF alpha subunit is hydroxylated. The hydroxylated HIF alpha subunit is then degraded by proteasomal ubiquitylation, which is mediated by the von Hippel-Lindau tumor-suppressor gene pVHL.22 Degradation of HIF alpha prevents formation of the HIF heterodimers. HIF therefore cannot bind to the hypoxia-response elements, and erythropoietin gene transcription does not occur.23
Thus, in states of hypoxia, erythropoietin production is upregulated, whereas with normal oxygen tension, production is downregulated.
Erythropoietin is essential for terminal maturation of erythrocytes
Erythropoietin is essential for terminal maturation of erythrocytes.24 It is thought to stimulate the growth of erythrogenic progenitors: burst-forming units-erythroid (BFU-E) and colony-forming units-erythroid (CFU-E). In the absence of erythropoietin, BFU-E and CFU-E fail to differentiate into mature erythrocytes.25
Binding of erythropoietin to its receptor sets off a series of downstream signals, the most important being the signal transducer and activator of transcription 5 (STAT5). In animal studies, STAT5 was found to inhibit apoptosis through the early induction of an antiapoptotic gene, Bcl-xL.26
Iron metabolism is controlled by several proteins
Iron is characterized by its capacity to accept or donate electrons. This unique property makes it a crucial element in many biochemical reactions such as enzymatic activity, DNA synthesis, oxygen transport, and cell respiration.
Iron metabolism is under the control of several proteins that play different roles in its absorption, recycling, and loss (Figure 2).27
Dietary iron exists primarily in its poorly soluble trivalent ferric form (Fe3+), and it needs to be reduced to its soluble divalent ferrous form (Fe2+) by ferric reductase to be absorbed. Ferrous iron is taken up at the apical side of enterocytes by a divalent metal transporter (DMT1) and is transported across the brush border.28
To enter the circulation, iron has to be transported across the basolateral membrane by a transporter called ferroportin.29 Ferroportin is also found in placental syncitiotrophoblasts, where it transfers iron from mother to fetus, and in macrophages, where it allows recycling of iron scavenged from damaged cells back into the circulation.30 Upon its release, the ferrous iron is oxidized to the ferric form and loaded onto transferrin. This oxidation process involves hephaestin, a homologue of the ferroxidase ceruloplasmin.31
In the plasma, iron is bound to transferrin, and under normal circumstances one-third of transferrin is saturated with iron.32 Transferrin receptors are present on most cells but are most dense on erythroid precursors. Each transferrin receptor can bind two transferrin molecules. After binding to transferrin, the transferrin receptor is endocytosed, and the iron is released into acidified vacuoles. The transferrin-receptor complex is then recycled to the surface.33
Ferritin is the cellular storage protein for iron, and it can store up to 4,500 atoms of iron within its spherical cavity.34 The serum level of ferritin reflects overall storage, with 1 ng/mL of ferritin indicating 10 mg of total iron stores.35 Ferritin is also an acute-phase reactant, and plasma levels can increase in inflammatory states such as infection or malignancy. As such, elevated ferritin does not necessarily indicate elevated iron stores.
Iron is lost in sweat, shed skin cells, and sloughed intestinal mucosal cells. However, there is no specific mechanism of iron excretion from the human body. Thus, iron is mainly regulated at the level of intestinal absorption. The iron exporter ferroportin is upregulated by the amount of available iron and is degraded by hepcidin.36
Hepcidin is a small cysteine-rich cationic peptide that is primarily produced in the liver, with some minor production also occurring in the kidneys.37 Transcription of the gene encoding hepcidin is downregulated by anemia and hypoxia and upregulated by inflammation and elevated iron levels.38 Transcription of hepcidin leads to degradation of ferroportin and a decrease in intestinal iron absorption. On the other hand, anemia and hypoxia inhibit hepcidin transcription, which allows ferroportin to facilitate intestinal iron absorption.
TREATMENT OF RENAL ANEMIA
Early enthusiasm for erythropoietin agents
Androgens started to be used to treat anemia of end-stage renal disease in 1970,39,40 and before the advent of recombinant human erythropoietin, they were a mainstay of nontransfusional therapy for anemic patients on dialysis.
The approval of recombinant human erythropoietin in 1989 drastically shifted the treatment of renal anemia. While the initial goal of treating anemia of chronic kidney disease with erythropoietin was to prevent blood transfusions,41 subsequent studies showed that the benefits might be far greater. Indeed, an initial observational trial showed that erythropoiesis-stimulating agents (ESAs) were associated with improved quality of life,42 improved neurocognitive function,43,44 and even cost savings.45 The benefits also extended to major outcomes such as regression of left ventricular hypertrophy,46 improvement in New York Heart Association class and cardiac function,47 fewer hospitalizations,48 and even reduction of cardiovascular mortality rates.49
As a result, ESA use gained popularity, and by 2006 an estimated 90% of dialysis patients were receiving these agents.50 The target and achieved hemoglobin levels also increased, with mean hemoglobin levels in hemodialysis patients being raised from 9.7 to 12 g/dL.51
Disappointing results in clinical trials of ESAs to normalize hemoglobin
To prospectively study the effects of normalized hemoglobin targets, four randomized controlled trials were conducted (Table 1):
- The Normal Hematocrit Study (NHCT)52
- The Correction of Hemoglobin and Outcomes in Renal Insufficiency (CHOIR) trial53
- The Cardiovascular Risk Reduction by Early Anemia Treatment (CREATE) trial54
- The Trial to Reduce Cardiovascular Events With Aranesp Therapy (TREAT).55
These trials randomized patients to either higher “normal-range” hemoglobin targets or to lower target hemoglobin levels.
Their findings were disappointing and raised several red flags about excessive use of ESAs. The trials found no benefit in higher hemoglobin targets, and in fact, some of them demonstrated harm in patients randomized to higher targets. Notably, higher hemoglobin targets were associated with significant side effects such as access-site thrombosis,52 strokes,55 and possibly cardiovascular events.54,55 Only the CREATE trial was able to demonstrate a quality-of-life benefit for the high-target group.54
It remains unclear whether these adverse events were from the therapy itself or from an increased morbidity burden in the treated patients. Erythropoietin use is associated with hypertension,56 thought to be related to endothelin-mediated vasoconstriction.57 In our experience, this is most evident when hemoglobin levels are normalized with ESA therapy. Cycling of erythropoietin levels between extreme levels can lead to vascular remodeling, which may also be related to its cardiovascular effects.57
A noticeable finding in several of these trials was that patients failed to achieve the higher hemoglobin target despite the use of very high doses of ESA. Reanalysis of data from the CHOIR and CREATE trials showed that the patients who had worse outcomes were more likely to have required very high doses without achieving their target hemoglobin.58,59 Indeed, patients who achieved the higher target hemoglobin levels, usually at lower ESA doses, had better outcomes. This suggested that the need for a higher dose was associated with poorer outcomes, either as a marker of comorbidity or due to yet undocumented side effects of such high doses.
General approach to therapy
Before attributing anemia to chronic kidney disease, a thorough evaluation should be conducted to look for any reversible process that could be contributing to the anemia.
The causes of anemia are numerous and beyond the scope of this review. However, among the common causes of anemia in chronic kidney disease are deficiencies of iron, vitamin B12, and folate. Therefore, guidelines recommend checking iron, vitamin B12, and folate levels in the initial evaluation of anemia.60
Iron deficiency in particular is very common in chronic kidney disease patients and is present in nearly all dialysis patients.61 Hemodialysis patients are estimated to lose 1 to 3 g of iron per year as a result of blood loss in the dialysis circuit and increased iron utilization secondary to ESA therapy.62
However, in contrast to the general population, in which the upper limits of normal for iron indices are well defined, high serum ferritin levels appear to be poorly predictive of hemoglobin responsiveness in dialysis patients.63,64 Thus, the cutoffs that define iron responsiveness are much higher than standard definitions for iron deficiency.65,66 The Dialysis Patients’ Response to IV Iron With Elevated Ferritin (DRIVE) study showed that dialysis patients benefit from intravenous iron therapy even if their ferritin is as high as 1,200 ng/mL, provided their transferrin saturation is below 30%.67
Of note, erythropoietin levels cannot be used to distinguish renal anemia from other causes of anemia. Indeed, patients with renal failure may have “relative erythropoietin deficiency,” ie, “normal” erythropoietin levels that are actually too low in view of the degree of anemia.68,69 In addition to the decreased production capacity by the kidney, there appears to be a component of resistance to the action of erythropoietin in the bone marrow.
For these reasons, there is no erythropoietin level that can be considered “inadequate” or defining of renal anemia. Thus, measuring erythropoietin levels is not routinely recommended in the evaluation of renal anemia.
Two ESA preparations
The two ESAs that have traditionally been used in the treatment of renal anemia are recombinant human erythropoietin and darbepoietin alfa. They appear to be equivalent in terms of safety and efficacy.70 However, darbepoietin alfa has more sialic acid molecules, giving it a higher potency and longer half-life and allowing for less-frequent injections.71,72
In nondialysis patients, recombinant human erythropoietin is typically given every 1 to 2 weeks, whereas darbepoietin alfa can be given every 2 to 4 weeks. In dialysis patients, recombinant human erythropoietin is typically given 3 times per week with every dialysis treatment, while darbepoietin alfa is given once a week.
Target hemoglobin levels: ≤ 11.5 g/dL
In light of the four trials described in Table 1, the international Kidney Disease: Improving Global Outcomes (KDIGO) guidelines60 recommend the following (Table 2):
For patients with chronic kidney disease who are not on dialysis, ESA therapy should not be initiated if the hemoglobin level is higher than 10 g/dL. If the hemoglobin level is lower than 10 g/dL, ESA therapy can be initiated, but the decision needs to be individualized based on the rate of fall of hemoglobin concentration, prior response to iron therapy, the risk of needing a transfusion, the risks related to ESA therapy, and the presence of symptoms attributable to anemia.
For patients on dialysis, ESA therapy should be used when the hemoglobin level is between 9 and 10 g/dL to avoid having the hemoglobin fall below 9 g/dL.
In all adult patients, ESAs should not be used to intentionally increase the hemoglobin level above 13 g/dL but rather to maintain levels no higher than 11.5 g/dL. This target is based on the observation that adverse outcomes were associated with ESA use with hemoglobin targets higher than 13 g/dL (Table 1).
Target iron levels
Regarding iron stores, the guidelines recommend the following:
For adult patients with chronic kidney disease who are not on dialysis, iron should be given to keep transferrin saturation above 20% and ferritin above 100 ng/mL. Transferrin saturation should not exceed 30%, and ferritin levels should not exceed 500 ng/mL.
For adult patients on dialysis, iron should be given to maintain transferrin saturation above 30% and ferritin above 200 ng/mL.
The upper limits of ferritin and transferrin saturation are somewhat controversial, as the safety of intentionally maintaining respective levels greater than 30% and 500 ng/mL has been studied in very few patients. Transferrin saturation should in general not exceed 50%.
High ferritin levels are associated with higher death rates, but whether elevation of ferritin levels is a marker of excessive iron administration rather than a nonspecific acute-phase reactant is not clear. The 2006 guidelines60 cited upper ferritin limits of 500 to 800 ng/mL. However, the more recent DRIVE trial67 showed that patients with ferritin levels of 500 to 1,200 ng/mL will respond to intravenous administration of iron with an increase in their hemoglobin levels. This has led many clinicians to adopt a higher ferritin limit of 1,200 ng/mL.
Hemosiderosis, or excess iron deposition, was a known consequence of frequent transfusions in patients with end-stage renal disease before ESA therapy was available. However, there have been no documented cases of clinical iron overload from iron therapy using current guidelines.73
These algorithms are nuanced, and the benefit of giving intravenous iron should always be weighed against the risks of short-term acute toxicity and infection. Treatment of renal anemia not only requires in-depth knowledge of the topic, but also familiarity with the patient’s specific situation. As such, it is not recommended that clinicians unfamiliar with the treatment of renal anemia manage its treatment.
PARTICULAR CIRCUMSTANCES
Inflammation and ESA resistance
While ESAs are effective in treating anemia in many cases, in many patients the anemia fails to respond. This is of particular importance, since ESA hyporesponsiveness has been found to be a powerful predictor of cardiovascular events and death.74 It is unclear, however, whether high doses of ESA are inherently toxic or whether hyporesponsiveness is a marker of adverse outcomes related to comorbidities.
KDIGO defines initial hyporesponsiveness as having no increase in hemoglobin concentration after the first month of appropriate weight-based dosing, and acquired hyporesponsiveness as requiring two increases in ESA doses up to 50% beyond the dose at which the patient had originally been stable.60 Identifying ESA hyporesponsiveness should lead to an intensive search for potentially correctable factors.
The two major factors accounting for the state of hyporesponsiveness are inflammation and iron deficiency.75,76
Inflammation. High C-reactive protein levels have been shown to predict resistance to erythropoietin in dialysis patients.77 The release of cytokines such as tumor necrosis factor alpha, interleukin 1, and interferon gamma has an inhibitory effect on erythropoiesis.78 Additionally, inflammation can alter the response to ESAs by disrupting the metabolism of iron79 through the release of hepcidin, as previously discussed.38 These reasons likely account for the observed lower response to ESAs in the setting of acute illness and explain why ESAs are not recommended for correcting acute anemia.80
Iron deficiency also can blunt the response to ESAs. Large amounts of iron are needed for effective erythropoietic bursts. As such, iron supplementation is now a recognized treatment of renal anemia.81
Other factors associated with hyporesponsiveness include chronic occult blood loss, aluminum toxicity, cobalamin or folate deficiencies, testosterone deficiency, inadequate dialysis, hyperparathyroidism, and superimposed primary bone marrow disease,82,83 and these should be addressed in patients whose anemia does not respond as expected to ESA therapy. A summary of the main causes of ESA hyporesponsiveness, their reversibility, and recommended treatments is presented in Table 3.
Antibody-mediated pure red-cell aplasia. Rarely, patients receiving ESA therapy develop antibodies that neutralize both the ESA and endogenous erythropoietin. The resulting syndrome, called antibody-mediated pure red-cell aplasia, is characterized by the sudden development of severe transfusion-dependent anemia. This has historically been connected to epoetin beta, a formulation not in use in the United States. However, cases have been documented with epoetin alfa and darbepoetin. The incidence rate is low with subcutaneous ESA use, estimated at 0.5 cases per 10,000 patient-years84 and anecdotal with intravenous ESA.85 The definitive diagnosis requires demonstration of neutralizing antibodies against erythropoietin. Parvovirus infection should be excluded as an alternative cause of pure redcell aplasia.
ANEMIA IN CANCER PATIENTS
ESAs are effective in raising hemoglobin levels and reducing transfusion requirements in patients with chemotherapy-induced anemia.86 However, there are data linking the use of ESAs to shortened survival in patients who have a variety of solid tumors.87
Several mechanisms have been proposed to explain this rapid disease progression, most notably acceleration in tumor growth88–90 by stimulation of erythropoietin receptors on the surface of the tumor cells, leading to increased tumor angiogenesis.91,92
For these reasons, treatment of renal anemia in the setting of active malignancy should be referred to an oncologist.
NOVEL TREATMENTS
Several new agents for treating renal anemia are currently under review.
Continuous erythropoiesis receptor activator
Continuous erythropoiesis receptor activator is a pegylated form of recombinant human erythropoietin that has the ability to repeatedly activate the erythropoietin receptor. It appears to be similar to the other forms of erythropoietin in terms of safety and efficacy in both end-stage renal disease93 and chronic kidney disease.94 It has the advantage of an extended serum half-life, which allows for longer dosing intervals, ie, every 2 weeks. Its use is currently gaining popularity in the dialysis community.
HIF stabilizers
Our growing understanding of the physiology of erythropoietin offers new potential treatment targets. As previously described, production of erythropoietin is stimulated by HIFs. In order to be degraded, these HIFs are hydroxylated at their proline residues by a prolyl hydroxylase. A new category of drugs called prolyl-hydroxylase inhibitors (PDIs) offers the advantage of stabilizing the HIFs, leading to an increase in erythropoietin production.
In phase 1 and 2 clinical trials, these agents have been shown to increase hemoglobin in both end-stage renal disease and chronic kidney disease patients15,16 but not in anephric patients, demonstrating a renal source of the erythropoietin production even in nonfunctioning kidneys. The study of one PDI agent (FG 2216) was halted temporarily after a report of death from fulminant hepatitis, but the other (FG 4592) continues to be studied in a phase 2 clinical trial.95,96
TAKE-HOME POINTS
- Anemia of renal disease is a common condition that is mainly caused by a decrease in erythropoietin production by the kidneys.
- While anemia of renal disease can be corrected with ESAs, it is necessary to investigate and rule out underlying treatable conditions such as iron or vitamin deficiencies before giving an ESA.
- Anemia of renal disease is associated with significant morbidity such as increased risk of left ventricular hypertrophy, myocardial infarction, and heart failure, and has been described as an all-cause mortality multiplier.
- Unfortunately, the only undisputed benefit of treatment to date remains the avoidance of blood transfusions. Furthermore, the large randomized controlled trials that looked at the benefits of ESA have shown that their use can be associated with increased risk of cardiovascular events. Therefore, use of an ESA in end-stage renal disease should never target a normal hemoglobin levels but rather aim for a hemoglobin level of no more than 11.5 g/dL.
- Use of an ESA in chronic kidney disease should be individualized and is not recommended to be started unless the hemoglobin level is less than 10 g/dL.
- Several newer agents for renal anemia are currently under review. A pegylated form of recombinant human erythropoietin has an extended half-life, and a new and promising category of drugs called HIF stabilizers is currently under study.
- World Health Organization (WHO). Nutritional anaemias: report of a WHO scientific group. Geneva, Switzerland: World Health Organization, 1968.
- Hsu CY, McCulloch CE, Curhan GC, et al. Epidemiology of anemia associated with chronic renal insufficiency among adults in the United States: results from the Third National Health and Nutrition Examination Survey. J Am Soc Nephrol 2002; 13:504–510.
- Radtke HW, Claussner A, Erbes PM, Scheuermann EH, Schoeppe W, Koch KM. Serum erythropoetin concentration in chronic renal failure: relationship to degree of anemia and excretory renal function. Blood 1979; 54:877–884.
- Kazmi WH, Kausz AT, Khan S, et al. Anemia: an early complication of chronic renal insufficiency. Am J Kidney Dis 2001; 38:803–812.
- United States Renal Data System. Chapter 3. Morbidity & mortality in patients with CKD. www.usrds.org/2012/view/v1_03.aspx. Accessed June 9, 2016.
- Horwich TB, Fonarow GC, Hamilton MA, MacLellan WR, Borenstein J. Anemia is associated with worse symptoms, greater impairment in functional capacity and a significant increase in mortality in patients with advanced heart failure. J Am Coll Cardiol 2002; 39:1780–1786.
- Mark DB, Felker GM. B-type natriuretic peptide: a biomarker for all seasons? N Engl J Med 2004; 350:718–720.
- Walker AM, Schneider G, Yeaw J, Nordstrom B, Robbins S, Pettitt D. Anemia as a predictor of cardiovascular events in patients with elevated serum creatinine. J Am Soc Nephrol 2006; 17:2293–2298.
- Abramson JL, Jurkovitz CT, Vaccarino V, Weintraub WS, McClellan W. Chronic kidney disease, anemia, and incident stroke in a middle-aged, community-based population: the ARIC Study. Kidney Int 2003; 64:610–615.
- Sarnak MJ, Tighiouart H, Manjunath G, et al. Anemia as a risk factor for cardiovascular disease in the Atherosclerosis Risk in Communities (ARIC) study. J Am Coll Cardiol 2002; 40:27–33.
- McClellan WM, Flanders WD, Langston RD, Jurkovitz C, Presley R. Anemia and renal insufficiency are independent risk factors for death among patients with congestive heart failure admitted to community hospitals: a population-based study. J Am Soc Nephrol 2002; 13:1928–1936.
- Xia H, Ebben J, Ma JZ, Collins AJ. Hematocrit levels and hospitalization risks in hemodialysis patients. J Am Soc Nephrol 1999; 10:1309–1316.
- Collins AJ, Li S, St Peter W, et al. Death, hospitalization, and economic associations among incident hemodialysis patients with hematocrit values of 36 to 39%. J Am Soc Nephrol 2001; 12:2465–2473.
- Agarwal AK. Practical approach to the diagnosis and treatment of anemia associated with CKD in elderly. J Am Med Dir Assoc 2006; 7(suppl 9):S7–S12.
- Bernhardt WM, Wiesener MS, Scigalla P, et al. Inhibition of prolyl hydroxylases increases erythropoietin production in ESRD. J Am Soc Nephrol 2010; 21:2151–2156.
- Provenzano R, Fadda G, Bernardo M, et al. FG-2216, a novel oral HIF-PHI, stimulates erythropoiesis and increases hemoglobin concentration in patients with non-dialysis CKD. Am J Kidney Dis 2008; 51:B80.
- Maxwell PH, Osmond MK, Pugh CW, et al. Identification of the renal erythropoietin-producing cells using transgenic mice. Kidney Int 1993; 44:1149–1162.
- Maxwell PH, Ferguson DJ, Nicholls LG, et al. Sites of erythropoietin production. Kidney Int 1997; 51:393–401.
- Jelkmann W. Erythropoeitin: structure, control of production and function. Physiol Rev 1992; 72:449–489.
- Wang GL, Jiang BH, Rue EA, Semenza GL. Hypoxia-inducible factor 1 is a basic-helix-loop-helix-PAS heterodimer regulated by cellular O2 tension. Proc Natl Acad Sci USA 1995; 92:5510–5514.
- Wang GL, Semenza GL. Purification and characterization of hypoxia-inducible factor 1. J Biol Chem 1995; 270:1230–1237.
- Maxwell PH, Wiesener MS, Chang GW, et al. The tumour suppressor protein VHL targets hypoxia-inducible factors for oxygen-dependent proteolysis. Nature 1999; 399:271–275.
- Salceda S, Caro J. Hypoxia-inducible factor 1alpha protein is rapidly degraded by the ubiquitin-proteasome system under normoxic conditions. Its stabilization by hypoxia depends on redox-induced changes. J Biol Chem 1997; 272:22642–22647.
- Malik J, Kim AR, Tyre KA, Cherukuri AR, Palis J. Erythropoietin critically regulates the terminal maturation of murine and human primitive erythroblasts. Haematologica 2013; 98:1778–1787.
- Wu H, Liu X, Jaenisch R, Lodish HF. Generation of committed erythroid BFU-E and CFU-E progenitors does not require erythropoietin or the erythropoietin receptor. Cell 1995; 83:59–67.
- Socolovsky M, Nam H, Fleming MD, Haase VH, Brugnara C, Lodish HF. Ineffective erythropoiesis in Stat5a(-/-)5b(-/-) mice due to decreased survival of early erythroblasts. Blood 2001; 98:3261–3273.
- Papanikolaou G, Pantopoulos K. Iron metabolism and toxicity. Toxicol Appl Pharmacol 2005; 202:199–211.
- Conrad ME, Umbreit JN. Pathways of iron absorption. Blood Cells Mol Dis 2002; 29:336–355.
- Frazer DM, Anderson GJ. The orchestration of body iron intake: how and where do enterocytes receive their cues? Blood Cells Moll Dis 2003; 30:288–297.
- Donovan A, Lima CA, Pinkus JL, et al. The iron exporter ferroportin/Slc40a1 is essential for iron homeostasis. Cell Metab 2005; 1:191–200.
- Vulpe CD, Kuo YM, Murphy TL, et al. Hephaestin, a ceruloplasmin homologue implicated in intestinal iron transport, is defective in the sla mouse. Nat Genet 1999; 21:195–199.
- Bothwell TH. Overview and mechanisms of iron regulation. Nutr Rev 1995: 53:237–245.
- Kawabata H, Nakamaki T, Ikonomi P, Smith RD, Germain RS, Koeffler HP. Expression of transferrin receptor 2 in normal and neoplastic hematopoietic cells. Blood 2001; 98:2714–2719.
- Arosio P, Levi S. Cytosolic and mitochondrial ferritins in the regulation of cellular iron homeostasis and oxidative damage. Biochim Biophys Acta 2010; 1800:783–792.
- Finch CA, Bellotti V, Stray S, et al. Plasma ferritin determination as a diagnostic tool. West J Med 1986; 145:657–663.
- Delaby C, Pilard N, Goncalves AS, Beaumont C, Canonne-Hergaux F. Presence of the iron exporter ferroportin at the plasma membrane of macrophages is enhanced by iron loading and down-regulated by hepcidin. Blood 2005; 106:3979–3984.
- Ganz T. Hepcidin, a key regulator of iron metabolism and mediator of anemia of inflammation. Blood 2003; 102:783–788.
- Nicolas G, Chauvet C, Viatte L, et al. The gene encoding the iron regulatory peptide hepcidin is regulated by anemia, hypoxia, and inflammation. J Clin Invest 2002; 110:1037–1044.
- DeGowin RL, Lavender AR, Forland M, Charleston D, Gottschalk A. Erythropoiesis and erythropoietin in patients with chronic renal failure treated with hemodialysis and testosterone. Ann Intern Med 1970; 72:913–918.
- Richardson JR Jr, Weinstein MB. Erythropoietic response of dialyzed patients to testosterone administration. Ann Intern Med 1970; 73:403–407
- Eschbach JW, Abdulhadi MH, Browne JK, et al. Recombinant human erythropoietin in anemic patients with end-stage renal disease. Results of a phase III multicenter clinical trial. Ann Intern Med 1989; 111:992–1000.
- Moreno F, Aracil FJ, Pérez R, Valderrábano F. Controlled study on the improvement of quality of life in elderly hemodialysis patients after correcting end-stage renal disease-related anemia with erythropoietin. Am J Kidney Dis 1996; 27:548–556.
- Nissenson AR, Nimer SD, Wolcott DL. Recombinant human erythropoietin and renal anemia: molecular biology, clinical efficacy, and nervous system effects. Ann Intern Med 1991; 114:402–416.
- Stivelman JC. Benefits of anaemia treatment on cognitive function. Nephrol Dial Transplant 2000; 15(suppl 3):29–35.
- Maddux FW, Shetty S, del Aguila MA, Nelson MA, Murray BM. Effect of erythropoiesis-stimulating agents on healthcare utilization, costs, and outcomes in chronic kidney disease. Ann Pharmacother 2007; 41:1761–1769.
- Macdougall IC, Lewis NP, Saunders MJ, et al. Long-term cardiorespiratory effects of amelioration of renal anaemia by erythropoietin. Lancet 1990; 335:489–493.
- Silverberg DS, Wexler D, Blum M, et al. Effects of treatment with epoetin beta on outcomes in patients with anaemia and chronic heart failure. Kidney Blood Press Res 2005; 28:41–47.
- Perkins R, Olson S, Hansen J, Lee J, Stiles K, Lebrun C. Impact of an anemia clinic on emergency room visits and hospitalizations in patients with anemia of CKD pre-dialysis. Nephrol Nurs J 2007; 34:167–173, 182.
- Locatelli F, Conte F, Marcelli D. The impact of haematocrit levels and erythropoietin treatment on overall and cardiovascular mortality and morbidity—the experience of the Lombardy Dialysis Registry. Nephrol Dial Transplant 1998; 13:1642–1644.
- Centers for Medicare and Medicaid Services; Kinney R. 2005 Annual Report: ESRD Clinical Performance Measures Project. Am J Kidney Dis 2006; 48(suppl 2):S1–S106.
- US Renal Data System. Annual Data Report 2006. www.usrds.org/adr.aspx. Accessed July 3, 2016.
- Besarab A, Bolton WK, Browne JK, et al. The effects of normal as compared with low hematocrit values in patients with cardiac disease who are receiving hemodialysis and epoetin. N Engl J Med 1998; 339:584–590.
- Singh AK, Szczech L, Tang KL, et al; CHOIR Investigators. Correction of anemia with epoetin alfa in chronic kidney disease. N Engl J Med 2006; 355:2085–2098.
- Drüeke TB, Locatelli F, Clyne N, et al; CREATE Investigators. Normalization of hemoglobin level in patients with chronic kidney disease and anemia. N Engl J Med 2006; 355:2071–2084.
- Pfeffer MA, Burdmann EA, Chen CY, et al; TREAT Investigators. A trial of darbepoetin alfa in type 2 diabetes and chronic kidney disease. N Engl J Med 2009; 361:2019–2032.
- Kirkpantur A, Kahraman S, Yilmaz R, et al. The effects of maintenance recombinant human erythropoietin therapy on ambulatory blood pressure recordings: conventional, Doppler, and tissue Doppler echocardiographic parameters. Artif Organs 2005; 29:965–972.
- Fishbane S, Berns JS. Hemoglobin cycling in hemodialysis patients treated with recombinant human erythropoietin. Kidney Int 2005; 68:1337–1343.
- Szczech LA, Barnhart HX, Inrig JK, et al. Secondary analysis of the CHOIR trial epoetin-alpha dose and achieved hemoglobin outcomes. Kidney Int 2008; 74:791–798.
- Solomon SD, Uno H, Lewis EF, et al; Trial to Reduce Cardiovascular Events with Aranesp Therapy (TREAT) Investigators. Erythropoietic response and outcomes in kidney disease and type 2 diabetes. N Engl J Med 2010; 363:1146–1155.
- Kidney Disease: Improving Global Outcomes (KDIGO). KDIGO Clinical Practice Guideline for Anemia in Chronic Kidney Disease. Kidney Int Suppl 2012; 2:279–335.
- Fernández-Rodríguez AM, Guindeo-Casasús MC, Molero-Labarta T, et al. Diagnosis of iron deficiency in chronic renal failure. Am J Kidney Dis 1999; 34:508–513.
- Eschbach JW, Cook JD, Scribner BH, Finch CA. Iron balance in hemodialysis patients. Ann Intern Med 1977; 87:710–713.
- Mittman N, Sreedhara R, Mushnick R, et al. Reticulocyte hemoglobin content predicts functional iron deficiency in hemodialysis patients receiving rHuEPO. Am J Kidney Dis 1997; 30:912–922.
- Tessitore N, Solero GP, Lippi G, et al. The role of iron status markers in predicting response to intravenous iron in haemodialysis patients on maintenance erythropoietin. Nephrol Dial Transplant 2001; 16:1416–1423.
- Coyne DW. Iron indices: what do they really mean? Kidney Int Suppl 2006; 101:S4–S8.
- Fishbane S, Kowalski EA, Imbriano LJ, Maesaka JK. The evaluation of iron status in hemodialysis patients. J Am Soc Nephrol 1996; 7:2654–2657.
- Coyne DW, Kapoian T, Suki W, et al; DRIVE Study Group. Ferric gluconate is highly efficacious in anemic hemodialysis patients with high serum ferritin and low transferrin saturation: results of the Dialysis Patients’ Response to IV Iron with Elevated Ferritin (DRIVE) Study. J Am Soc Nephrol 2007; 18:975–984.
- Radtke HW, Claussner A, Erbes PM, Scheuermann EH, Schoeppe W, Koch KM. Serum erythropoietin concentration in chronic renal failure: relationship to degree of anemia and excretory renal function. Blood 1979; 54:877–884.
- Korte W, Cogliatti SB, Jung K, Riesen W. Mild renal dysfunction is sufficient to induce erythropoietin deficiency in patients with unexplained anaemia. Clin Chim Acta 2000; 292:149–154.
- Locatelli F, Olivares J, Walker R, et al; European/Australian NESP 980202 Study Group. Novel erythropoiesis stimulating protein for treatment of anemia in chronic renal insufficiency. Kidney Int 2001; 60:741–747.
- Carrera F, Burnier M. Use of darbepoetin alfa in the treatment of anaemia of chronic kidney disease: clinical and pharmacoeconomic considerations. NDT Plus 2009; 2(suppl 1):i9–i17.
- Egrie JC, Browne JK. Development and characterization of novel erythropoiesis stimulating protein (NESP). Nephrol Dial Transplant 2001; 16(suppl 3):3–13.
- Nissenson AR, Charytan C. Controversies in iron management. Kidney Int Suppl 2003; 87:S64–S71.
- Kilpatrick RD, Critchlow CW, Fishbane S, et al. Greater epoetin alpha responsiveness is associated with improved survival in hemodialysis patients. Clin J Am Soc Nephrol 2008; 3:1077–1083.
- Locatelli F, Aljama P, Barany P, et al; European Best Practice Guidelines Working Group. Revised European best practice guidelines for the management of anaemia in patients with chronic renal failure. Nephrol Dial Transplant 2004; 19(suppl 2):ii1–ii47.
- Stenvinkel P. The role of inflammation in the anaemia of end-stage renal disease. Nephrol Dial Transplant 2001; 16(suppl 7):36–40.
- Barany P, Divino Filho JC, Bergstrom J. High C-reactive protein is a strong predictor of resistance to erythropoietin in hemodialysis patients. Am J Kidney Dis 1997; 29:565–568.
- Drueke T. Hyporesponsiveness to recombinant human erythropoietin. Nephrol Dial Transplant 2001; 16(suppl 7):25–28.
- Casadevall N. Cellular mechanism of resistance to erythropoietin. Nephrol Dial Transplant 1995; 10(suppl 6):27–30.
- Kraus E, Rabb H. EPO therapy during acute kidney disease: to use or not to use, that is the question. Am J Kidney Dis 2005; 46:967–969.
- Gotloib L, Silverberg D, Fudin R, Shostak A. Iron deficiency is a common cause of anemia in chronic kidney disease and can often be corrected with intravenous iron. J Nephrol 2006; 19:161–167.
- Tarng DC, Huang TP, Chen TW, Yang WC. Erythropoietin hyporesponsiveness: from iron deficiency to iron overload. Kidney Int Suppl 1999; 69:S107–S118.
- Drüeke TB. Modulating factors in the hematopoietic response to erythropoietin. Am J Kidney Dis 1991; 18(suppl 1):87–92.
- Boven K, Stryker S, Knight J, et al. The increased incidence of pure red cell aplasia with an Eprex formulation in uncoated rubber stopper syringes. Kidney Int 2005; 67:2346–2353.
- Shimizu H, Saitoh T, Ota F, et al. Pure red cell aplasia induced only by intravenous administration of recombinant human erythropoietin. Acta Haematol 2011; 126:114–118.
- Tonia T, Mettler A, Robert N, et al. Erythropoietin or darbepoetin for patients with cancer. Cochrane Database Syst Rev 2012; 12:CD003407.
- Bohlius J, Langensiepen S, Schwarzer G, et al. Recombinant human erythropoietin and overall survival in cancer patients: results of a comprehensive meta-analysis. J Natl Cancer Inst 2005; 97:489–498.
- Henke M, Laszig R, Rübe C, et al. Erythropoietin to treat head and neck cancer patients with anaemia undergoing radiotherapy: randomised, double-blind, placebo-controlled trial. Lancet 2003; 362:1255–1260.
- Leyland-Jones B, Semiglazov V, Pawlicki M, et al. Maintaining normal hemoglobin levels with epoetin alfa in mainly nonanemic patients with metastatic breast cancer receiving first-line chemotherapy: a survival study. J Clin Oncol 2005; 23:5960–5972.
- Brower V. Erythropoietin may impair, not improve, cancer survival. Nat Med 2003; 9:1439.
- Acs G, Acs P, Beckwith SM, et al. Erythropoietin and erythropoietin receptor expression in human cancer. Cancer Res 2001; 61:3561–3565.
- Yasuda Y, Fujita Y, Matsuo T, et al. Erythropoietin regulates tumour growth of human malignancies. Carcinogenesis 2003; 24:1021–1029.
- Levin NW, Fishbane S, Cañedo FV, et al; MAXIMA Study Investigators. Intravenous methoxy polyethylene glycol-epoetin beta for haemoglobin control in patients with chronic kidney disease who are on dialysis: a randomised non-inferiority trial (MAXIMA). Lancet 2007; 370:1415–1421.
- Macdougall IC, Walker R, Provenzano R, et al; ARCTOS Study Investigators. C.E.R.A. corrects anemia in patients with chronic kidney disease not on dialysis: results of a randomized clinical trial. Clin J Am Soc Nephrol 2008; 3:337–347.
- Frohna PA, Milwee S, Pinkett J, et al. Preliminary results from a randomized, single-blind, placebo-controlled trial of FG-4592, a novel hypoxia inducible factor prolyl hydroxylase inhibitor, in subjects with CKD anemia (abstract). J Am Soc Nephrol 2007; 18:763.
- Holdstock L, Meadowcroft AM, Maier R, et al. Four-week studies of oral hypoxia-inducible factor-prolyl hydroxylase inhibitor GSK1278863 for treatment of anemia. J Am Soc Nephrol 2016; 27:1234–1244.
Anemia is a frequent complication of chronic kidney disease, occurring in over 90% of patients receiving renal replacement therapy. It is associated with significant morbidity and mortality. While its pathogenesis is typically multifactorial, the predominant cause is failure of the kidneys to produce enough endogenous erythropoietin. The clinical approval of recombinant human erythropoietin in 1989 dramatically changed the treatment of anemia of chronic kidney disease, but randomized controlled trials yielded disappointing results when erythropoiesis-stimulating agents (ESAs) were used to raise hemoglobin to normal levels.
This article reviews the epidemiology and pathophysiology of anemia of chronic kidney disease and discusses the complicated and conflicting evidence regarding its treatment.
DEFINITION AND PREVALENCE
Anemia is defined as a hemoglobin concentration less than 13.0 g/dL for men and less than 12.0 g/dL for premenopausal women.1 It is more common in patients with impaired kidney function, especially when the glomerular filtration rate (GFR) falls below 60 mL/min. It is rare at GFRs higher than 80 mL/min,2 but as the GFR falls, the severity of the anemia worsens3 and its prevalence increases: almost 90% of patients with a GFR less than 30 mL/min are anemic.4
RENAL ANEMIA IS ASSOCIATED WITH BAD OUTCOMES
Anemia in chronic kidney disease is independently associated with risk of death. It is also an all-cause mortality multiplier, ie, it magnifies the risk of death from other disease states.5
In observational studies, anemia was associated with faster progression of left ventricular hypertrophy, inflammation, and increased myocardial and peripheral oxygen demand, thereby leading to worse cardiac outcomes with increased risk of myocardial infarction, coronary revascularization, and readmission for heart failure.6–8 Anemia is also associated with fatigue, depression, reduced exercise tolerance, stroke, and increased risk of rehospitalization.9–13
RENAL ANEMIA IS MULTIFACTORIAL
Anemia of chronic kidney disease is typically attributed to the decrease of erythropoietin production that accompanies the fall in GFR. However, the process is multifactorial, with several other contributing factors: absolute and functional iron deficiency, folate and vitamin B12 deficiencies, reduced red blood cell life span, and suppression of erythropoiesis by the uremic milieu.14
While it was once thought that chronic kidney disease leads to loss of erythropoietin-producing cells, it is now known that downregulation of hypoxia-inducible factor (HIF; a transcription factor) is at least partially responsible for the decrease in erythropoietin production15,16 and that this downregulation is reversible (see below).
ERYTHROPOIETIN, IRON, AND RED BLOOD CELLS
Erythropoietin production is triggered by hypoxia, mediated by HIF
Erythropoietin is produced primarily in the deep cortex and outer medulla of the kidneys by a special population of peritubular interstitial cells.17 The parenchymal cells of the liver also produce erythropoietin, but much less.18
The rate of renal erythropoietin synthesis is determined by tissue oxygenation rather than by renal blood flow; production increases as the hemoglobin concentration drops and the arterial oxygen tension decreases (Figure 1).19
The gene for erythropoietin is located on chromosome 7 and is regulated by HIF. HIF molecules are composed of an alpha subunit, which is unstable at high Po2, and a beta subunit, constitutively present in the nucleus.20
In hypoxic conditions, the HIF dimer is transcriptionally active and binds to specific DNA recognition sequences called hypoxia-response elements. Gene transcription is upregulated, leading to increased production of erythropoietin.21
Under normal oxygen tension, on the other hand, the proline residue of the HIF alpha subunit is hydroxylated. The hydroxylated HIF alpha subunit is then degraded by proteasomal ubiquitylation, which is mediated by the von Hippel-Lindau tumor-suppressor gene pVHL.22 Degradation of HIF alpha prevents formation of the HIF heterodimers. HIF therefore cannot bind to the hypoxia-response elements, and erythropoietin gene transcription does not occur.23
Thus, in states of hypoxia, erythropoietin production is upregulated, whereas with normal oxygen tension, production is downregulated.
Erythropoietin is essential for terminal maturation of erythrocytes
Erythropoietin is essential for terminal maturation of erythrocytes.24 It is thought to stimulate the growth of erythrogenic progenitors: burst-forming units-erythroid (BFU-E) and colony-forming units-erythroid (CFU-E). In the absence of erythropoietin, BFU-E and CFU-E fail to differentiate into mature erythrocytes.25
Binding of erythropoietin to its receptor sets off a series of downstream signals, the most important being the signal transducer and activator of transcription 5 (STAT5). In animal studies, STAT5 was found to inhibit apoptosis through the early induction of an antiapoptotic gene, Bcl-xL.26
Iron metabolism is controlled by several proteins
Iron is characterized by its capacity to accept or donate electrons. This unique property makes it a crucial element in many biochemical reactions such as enzymatic activity, DNA synthesis, oxygen transport, and cell respiration.
Iron metabolism is under the control of several proteins that play different roles in its absorption, recycling, and loss (Figure 2).27
Dietary iron exists primarily in its poorly soluble trivalent ferric form (Fe3+), and it needs to be reduced to its soluble divalent ferrous form (Fe2+) by ferric reductase to be absorbed. Ferrous iron is taken up at the apical side of enterocytes by a divalent metal transporter (DMT1) and is transported across the brush border.28
To enter the circulation, iron has to be transported across the basolateral membrane by a transporter called ferroportin.29 Ferroportin is also found in placental syncitiotrophoblasts, where it transfers iron from mother to fetus, and in macrophages, where it allows recycling of iron scavenged from damaged cells back into the circulation.30 Upon its release, the ferrous iron is oxidized to the ferric form and loaded onto transferrin. This oxidation process involves hephaestin, a homologue of the ferroxidase ceruloplasmin.31
In the plasma, iron is bound to transferrin, and under normal circumstances one-third of transferrin is saturated with iron.32 Transferrin receptors are present on most cells but are most dense on erythroid precursors. Each transferrin receptor can bind two transferrin molecules. After binding to transferrin, the transferrin receptor is endocytosed, and the iron is released into acidified vacuoles. The transferrin-receptor complex is then recycled to the surface.33
Ferritin is the cellular storage protein for iron, and it can store up to 4,500 atoms of iron within its spherical cavity.34 The serum level of ferritin reflects overall storage, with 1 ng/mL of ferritin indicating 10 mg of total iron stores.35 Ferritin is also an acute-phase reactant, and plasma levels can increase in inflammatory states such as infection or malignancy. As such, elevated ferritin does not necessarily indicate elevated iron stores.
Iron is lost in sweat, shed skin cells, and sloughed intestinal mucosal cells. However, there is no specific mechanism of iron excretion from the human body. Thus, iron is mainly regulated at the level of intestinal absorption. The iron exporter ferroportin is upregulated by the amount of available iron and is degraded by hepcidin.36
Hepcidin is a small cysteine-rich cationic peptide that is primarily produced in the liver, with some minor production also occurring in the kidneys.37 Transcription of the gene encoding hepcidin is downregulated by anemia and hypoxia and upregulated by inflammation and elevated iron levels.38 Transcription of hepcidin leads to degradation of ferroportin and a decrease in intestinal iron absorption. On the other hand, anemia and hypoxia inhibit hepcidin transcription, which allows ferroportin to facilitate intestinal iron absorption.
TREATMENT OF RENAL ANEMIA
Early enthusiasm for erythropoietin agents
Androgens started to be used to treat anemia of end-stage renal disease in 1970,39,40 and before the advent of recombinant human erythropoietin, they were a mainstay of nontransfusional therapy for anemic patients on dialysis.
The approval of recombinant human erythropoietin in 1989 drastically shifted the treatment of renal anemia. While the initial goal of treating anemia of chronic kidney disease with erythropoietin was to prevent blood transfusions,41 subsequent studies showed that the benefits might be far greater. Indeed, an initial observational trial showed that erythropoiesis-stimulating agents (ESAs) were associated with improved quality of life,42 improved neurocognitive function,43,44 and even cost savings.45 The benefits also extended to major outcomes such as regression of left ventricular hypertrophy,46 improvement in New York Heart Association class and cardiac function,47 fewer hospitalizations,48 and even reduction of cardiovascular mortality rates.49
As a result, ESA use gained popularity, and by 2006 an estimated 90% of dialysis patients were receiving these agents.50 The target and achieved hemoglobin levels also increased, with mean hemoglobin levels in hemodialysis patients being raised from 9.7 to 12 g/dL.51
Disappointing results in clinical trials of ESAs to normalize hemoglobin
To prospectively study the effects of normalized hemoglobin targets, four randomized controlled trials were conducted (Table 1):
- The Normal Hematocrit Study (NHCT)52
- The Correction of Hemoglobin and Outcomes in Renal Insufficiency (CHOIR) trial53
- The Cardiovascular Risk Reduction by Early Anemia Treatment (CREATE) trial54
- The Trial to Reduce Cardiovascular Events With Aranesp Therapy (TREAT).55
These trials randomized patients to either higher “normal-range” hemoglobin targets or to lower target hemoglobin levels.
Their findings were disappointing and raised several red flags about excessive use of ESAs. The trials found no benefit in higher hemoglobin targets, and in fact, some of them demonstrated harm in patients randomized to higher targets. Notably, higher hemoglobin targets were associated with significant side effects such as access-site thrombosis,52 strokes,55 and possibly cardiovascular events.54,55 Only the CREATE trial was able to demonstrate a quality-of-life benefit for the high-target group.54
It remains unclear whether these adverse events were from the therapy itself or from an increased morbidity burden in the treated patients. Erythropoietin use is associated with hypertension,56 thought to be related to endothelin-mediated vasoconstriction.57 In our experience, this is most evident when hemoglobin levels are normalized with ESA therapy. Cycling of erythropoietin levels between extreme levels can lead to vascular remodeling, which may also be related to its cardiovascular effects.57
A noticeable finding in several of these trials was that patients failed to achieve the higher hemoglobin target despite the use of very high doses of ESA. Reanalysis of data from the CHOIR and CREATE trials showed that the patients who had worse outcomes were more likely to have required very high doses without achieving their target hemoglobin.58,59 Indeed, patients who achieved the higher target hemoglobin levels, usually at lower ESA doses, had better outcomes. This suggested that the need for a higher dose was associated with poorer outcomes, either as a marker of comorbidity or due to yet undocumented side effects of such high doses.
General approach to therapy
Before attributing anemia to chronic kidney disease, a thorough evaluation should be conducted to look for any reversible process that could be contributing to the anemia.
The causes of anemia are numerous and beyond the scope of this review. However, among the common causes of anemia in chronic kidney disease are deficiencies of iron, vitamin B12, and folate. Therefore, guidelines recommend checking iron, vitamin B12, and folate levels in the initial evaluation of anemia.60
Iron deficiency in particular is very common in chronic kidney disease patients and is present in nearly all dialysis patients.61 Hemodialysis patients are estimated to lose 1 to 3 g of iron per year as a result of blood loss in the dialysis circuit and increased iron utilization secondary to ESA therapy.62
However, in contrast to the general population, in which the upper limits of normal for iron indices are well defined, high serum ferritin levels appear to be poorly predictive of hemoglobin responsiveness in dialysis patients.63,64 Thus, the cutoffs that define iron responsiveness are much higher than standard definitions for iron deficiency.65,66 The Dialysis Patients’ Response to IV Iron With Elevated Ferritin (DRIVE) study showed that dialysis patients benefit from intravenous iron therapy even if their ferritin is as high as 1,200 ng/mL, provided their transferrin saturation is below 30%.67
Of note, erythropoietin levels cannot be used to distinguish renal anemia from other causes of anemia. Indeed, patients with renal failure may have “relative erythropoietin deficiency,” ie, “normal” erythropoietin levels that are actually too low in view of the degree of anemia.68,69 In addition to the decreased production capacity by the kidney, there appears to be a component of resistance to the action of erythropoietin in the bone marrow.
For these reasons, there is no erythropoietin level that can be considered “inadequate” or defining of renal anemia. Thus, measuring erythropoietin levels is not routinely recommended in the evaluation of renal anemia.
Two ESA preparations
The two ESAs that have traditionally been used in the treatment of renal anemia are recombinant human erythropoietin and darbepoietin alfa. They appear to be equivalent in terms of safety and efficacy.70 However, darbepoietin alfa has more sialic acid molecules, giving it a higher potency and longer half-life and allowing for less-frequent injections.71,72
In nondialysis patients, recombinant human erythropoietin is typically given every 1 to 2 weeks, whereas darbepoietin alfa can be given every 2 to 4 weeks. In dialysis patients, recombinant human erythropoietin is typically given 3 times per week with every dialysis treatment, while darbepoietin alfa is given once a week.
Target hemoglobin levels: ≤ 11.5 g/dL
In light of the four trials described in Table 1, the international Kidney Disease: Improving Global Outcomes (KDIGO) guidelines60 recommend the following (Table 2):
For patients with chronic kidney disease who are not on dialysis, ESA therapy should not be initiated if the hemoglobin level is higher than 10 g/dL. If the hemoglobin level is lower than 10 g/dL, ESA therapy can be initiated, but the decision needs to be individualized based on the rate of fall of hemoglobin concentration, prior response to iron therapy, the risk of needing a transfusion, the risks related to ESA therapy, and the presence of symptoms attributable to anemia.
For patients on dialysis, ESA therapy should be used when the hemoglobin level is between 9 and 10 g/dL to avoid having the hemoglobin fall below 9 g/dL.
In all adult patients, ESAs should not be used to intentionally increase the hemoglobin level above 13 g/dL but rather to maintain levels no higher than 11.5 g/dL. This target is based on the observation that adverse outcomes were associated with ESA use with hemoglobin targets higher than 13 g/dL (Table 1).
Target iron levels
Regarding iron stores, the guidelines recommend the following:
For adult patients with chronic kidney disease who are not on dialysis, iron should be given to keep transferrin saturation above 20% and ferritin above 100 ng/mL. Transferrin saturation should not exceed 30%, and ferritin levels should not exceed 500 ng/mL.
For adult patients on dialysis, iron should be given to maintain transferrin saturation above 30% and ferritin above 200 ng/mL.
The upper limits of ferritin and transferrin saturation are somewhat controversial, as the safety of intentionally maintaining respective levels greater than 30% and 500 ng/mL has been studied in very few patients. Transferrin saturation should in general not exceed 50%.
High ferritin levels are associated with higher death rates, but whether elevation of ferritin levels is a marker of excessive iron administration rather than a nonspecific acute-phase reactant is not clear. The 2006 guidelines60 cited upper ferritin limits of 500 to 800 ng/mL. However, the more recent DRIVE trial67 showed that patients with ferritin levels of 500 to 1,200 ng/mL will respond to intravenous administration of iron with an increase in their hemoglobin levels. This has led many clinicians to adopt a higher ferritin limit of 1,200 ng/mL.
Hemosiderosis, or excess iron deposition, was a known consequence of frequent transfusions in patients with end-stage renal disease before ESA therapy was available. However, there have been no documented cases of clinical iron overload from iron therapy using current guidelines.73
These algorithms are nuanced, and the benefit of giving intravenous iron should always be weighed against the risks of short-term acute toxicity and infection. Treatment of renal anemia not only requires in-depth knowledge of the topic, but also familiarity with the patient’s specific situation. As such, it is not recommended that clinicians unfamiliar with the treatment of renal anemia manage its treatment.
PARTICULAR CIRCUMSTANCES
Inflammation and ESA resistance
While ESAs are effective in treating anemia in many cases, in many patients the anemia fails to respond. This is of particular importance, since ESA hyporesponsiveness has been found to be a powerful predictor of cardiovascular events and death.74 It is unclear, however, whether high doses of ESA are inherently toxic or whether hyporesponsiveness is a marker of adverse outcomes related to comorbidities.
KDIGO defines initial hyporesponsiveness as having no increase in hemoglobin concentration after the first month of appropriate weight-based dosing, and acquired hyporesponsiveness as requiring two increases in ESA doses up to 50% beyond the dose at which the patient had originally been stable.60 Identifying ESA hyporesponsiveness should lead to an intensive search for potentially correctable factors.
The two major factors accounting for the state of hyporesponsiveness are inflammation and iron deficiency.75,76
Inflammation. High C-reactive protein levels have been shown to predict resistance to erythropoietin in dialysis patients.77 The release of cytokines such as tumor necrosis factor alpha, interleukin 1, and interferon gamma has an inhibitory effect on erythropoiesis.78 Additionally, inflammation can alter the response to ESAs by disrupting the metabolism of iron79 through the release of hepcidin, as previously discussed.38 These reasons likely account for the observed lower response to ESAs in the setting of acute illness and explain why ESAs are not recommended for correcting acute anemia.80
Iron deficiency also can blunt the response to ESAs. Large amounts of iron are needed for effective erythropoietic bursts. As such, iron supplementation is now a recognized treatment of renal anemia.81
Other factors associated with hyporesponsiveness include chronic occult blood loss, aluminum toxicity, cobalamin or folate deficiencies, testosterone deficiency, inadequate dialysis, hyperparathyroidism, and superimposed primary bone marrow disease,82,83 and these should be addressed in patients whose anemia does not respond as expected to ESA therapy. A summary of the main causes of ESA hyporesponsiveness, their reversibility, and recommended treatments is presented in Table 3.
Antibody-mediated pure red-cell aplasia. Rarely, patients receiving ESA therapy develop antibodies that neutralize both the ESA and endogenous erythropoietin. The resulting syndrome, called antibody-mediated pure red-cell aplasia, is characterized by the sudden development of severe transfusion-dependent anemia. This has historically been connected to epoetin beta, a formulation not in use in the United States. However, cases have been documented with epoetin alfa and darbepoetin. The incidence rate is low with subcutaneous ESA use, estimated at 0.5 cases per 10,000 patient-years84 and anecdotal with intravenous ESA.85 The definitive diagnosis requires demonstration of neutralizing antibodies against erythropoietin. Parvovirus infection should be excluded as an alternative cause of pure redcell aplasia.
ANEMIA IN CANCER PATIENTS
ESAs are effective in raising hemoglobin levels and reducing transfusion requirements in patients with chemotherapy-induced anemia.86 However, there are data linking the use of ESAs to shortened survival in patients who have a variety of solid tumors.87
Several mechanisms have been proposed to explain this rapid disease progression, most notably acceleration in tumor growth88–90 by stimulation of erythropoietin receptors on the surface of the tumor cells, leading to increased tumor angiogenesis.91,92
For these reasons, treatment of renal anemia in the setting of active malignancy should be referred to an oncologist.
NOVEL TREATMENTS
Several new agents for treating renal anemia are currently under review.
Continuous erythropoiesis receptor activator
Continuous erythropoiesis receptor activator is a pegylated form of recombinant human erythropoietin that has the ability to repeatedly activate the erythropoietin receptor. It appears to be similar to the other forms of erythropoietin in terms of safety and efficacy in both end-stage renal disease93 and chronic kidney disease.94 It has the advantage of an extended serum half-life, which allows for longer dosing intervals, ie, every 2 weeks. Its use is currently gaining popularity in the dialysis community.
HIF stabilizers
Our growing understanding of the physiology of erythropoietin offers new potential treatment targets. As previously described, production of erythropoietin is stimulated by HIFs. In order to be degraded, these HIFs are hydroxylated at their proline residues by a prolyl hydroxylase. A new category of drugs called prolyl-hydroxylase inhibitors (PDIs) offers the advantage of stabilizing the HIFs, leading to an increase in erythropoietin production.
In phase 1 and 2 clinical trials, these agents have been shown to increase hemoglobin in both end-stage renal disease and chronic kidney disease patients15,16 but not in anephric patients, demonstrating a renal source of the erythropoietin production even in nonfunctioning kidneys. The study of one PDI agent (FG 2216) was halted temporarily after a report of death from fulminant hepatitis, but the other (FG 4592) continues to be studied in a phase 2 clinical trial.95,96
TAKE-HOME POINTS
- Anemia of renal disease is a common condition that is mainly caused by a decrease in erythropoietin production by the kidneys.
- While anemia of renal disease can be corrected with ESAs, it is necessary to investigate and rule out underlying treatable conditions such as iron or vitamin deficiencies before giving an ESA.
- Anemia of renal disease is associated with significant morbidity such as increased risk of left ventricular hypertrophy, myocardial infarction, and heart failure, and has been described as an all-cause mortality multiplier.
- Unfortunately, the only undisputed benefit of treatment to date remains the avoidance of blood transfusions. Furthermore, the large randomized controlled trials that looked at the benefits of ESA have shown that their use can be associated with increased risk of cardiovascular events. Therefore, use of an ESA in end-stage renal disease should never target a normal hemoglobin levels but rather aim for a hemoglobin level of no more than 11.5 g/dL.
- Use of an ESA in chronic kidney disease should be individualized and is not recommended to be started unless the hemoglobin level is less than 10 g/dL.
- Several newer agents for renal anemia are currently under review. A pegylated form of recombinant human erythropoietin has an extended half-life, and a new and promising category of drugs called HIF stabilizers is currently under study.
- World Health Organization (WHO). Nutritional anaemias: report of a WHO scientific group. Geneva, Switzerland: World Health Organization, 1968.
- Hsu CY, McCulloch CE, Curhan GC, et al. Epidemiology of anemia associated with chronic renal insufficiency among adults in the United States: results from the Third National Health and Nutrition Examination Survey. J Am Soc Nephrol 2002; 13:504–510.
- Radtke HW, Claussner A, Erbes PM, Scheuermann EH, Schoeppe W, Koch KM. Serum erythropoetin concentration in chronic renal failure: relationship to degree of anemia and excretory renal function. Blood 1979; 54:877–884.
- Kazmi WH, Kausz AT, Khan S, et al. Anemia: an early complication of chronic renal insufficiency. Am J Kidney Dis 2001; 38:803–812.
- United States Renal Data System. Chapter 3. Morbidity & mortality in patients with CKD. www.usrds.org/2012/view/v1_03.aspx. Accessed June 9, 2016.
- Horwich TB, Fonarow GC, Hamilton MA, MacLellan WR, Borenstein J. Anemia is associated with worse symptoms, greater impairment in functional capacity and a significant increase in mortality in patients with advanced heart failure. J Am Coll Cardiol 2002; 39:1780–1786.
- Mark DB, Felker GM. B-type natriuretic peptide: a biomarker for all seasons? N Engl J Med 2004; 350:718–720.
- Walker AM, Schneider G, Yeaw J, Nordstrom B, Robbins S, Pettitt D. Anemia as a predictor of cardiovascular events in patients with elevated serum creatinine. J Am Soc Nephrol 2006; 17:2293–2298.
- Abramson JL, Jurkovitz CT, Vaccarino V, Weintraub WS, McClellan W. Chronic kidney disease, anemia, and incident stroke in a middle-aged, community-based population: the ARIC Study. Kidney Int 2003; 64:610–615.
- Sarnak MJ, Tighiouart H, Manjunath G, et al. Anemia as a risk factor for cardiovascular disease in the Atherosclerosis Risk in Communities (ARIC) study. J Am Coll Cardiol 2002; 40:27–33.
- McClellan WM, Flanders WD, Langston RD, Jurkovitz C, Presley R. Anemia and renal insufficiency are independent risk factors for death among patients with congestive heart failure admitted to community hospitals: a population-based study. J Am Soc Nephrol 2002; 13:1928–1936.
- Xia H, Ebben J, Ma JZ, Collins AJ. Hematocrit levels and hospitalization risks in hemodialysis patients. J Am Soc Nephrol 1999; 10:1309–1316.
- Collins AJ, Li S, St Peter W, et al. Death, hospitalization, and economic associations among incident hemodialysis patients with hematocrit values of 36 to 39%. J Am Soc Nephrol 2001; 12:2465–2473.
- Agarwal AK. Practical approach to the diagnosis and treatment of anemia associated with CKD in elderly. J Am Med Dir Assoc 2006; 7(suppl 9):S7–S12.
- Bernhardt WM, Wiesener MS, Scigalla P, et al. Inhibition of prolyl hydroxylases increases erythropoietin production in ESRD. J Am Soc Nephrol 2010; 21:2151–2156.
- Provenzano R, Fadda G, Bernardo M, et al. FG-2216, a novel oral HIF-PHI, stimulates erythropoiesis and increases hemoglobin concentration in patients with non-dialysis CKD. Am J Kidney Dis 2008; 51:B80.
- Maxwell PH, Osmond MK, Pugh CW, et al. Identification of the renal erythropoietin-producing cells using transgenic mice. Kidney Int 1993; 44:1149–1162.
- Maxwell PH, Ferguson DJ, Nicholls LG, et al. Sites of erythropoietin production. Kidney Int 1997; 51:393–401.
- Jelkmann W. Erythropoeitin: structure, control of production and function. Physiol Rev 1992; 72:449–489.
- Wang GL, Jiang BH, Rue EA, Semenza GL. Hypoxia-inducible factor 1 is a basic-helix-loop-helix-PAS heterodimer regulated by cellular O2 tension. Proc Natl Acad Sci USA 1995; 92:5510–5514.
- Wang GL, Semenza GL. Purification and characterization of hypoxia-inducible factor 1. J Biol Chem 1995; 270:1230–1237.
- Maxwell PH, Wiesener MS, Chang GW, et al. The tumour suppressor protein VHL targets hypoxia-inducible factors for oxygen-dependent proteolysis. Nature 1999; 399:271–275.
- Salceda S, Caro J. Hypoxia-inducible factor 1alpha protein is rapidly degraded by the ubiquitin-proteasome system under normoxic conditions. Its stabilization by hypoxia depends on redox-induced changes. J Biol Chem 1997; 272:22642–22647.
- Malik J, Kim AR, Tyre KA, Cherukuri AR, Palis J. Erythropoietin critically regulates the terminal maturation of murine and human primitive erythroblasts. Haematologica 2013; 98:1778–1787.
- Wu H, Liu X, Jaenisch R, Lodish HF. Generation of committed erythroid BFU-E and CFU-E progenitors does not require erythropoietin or the erythropoietin receptor. Cell 1995; 83:59–67.
- Socolovsky M, Nam H, Fleming MD, Haase VH, Brugnara C, Lodish HF. Ineffective erythropoiesis in Stat5a(-/-)5b(-/-) mice due to decreased survival of early erythroblasts. Blood 2001; 98:3261–3273.
- Papanikolaou G, Pantopoulos K. Iron metabolism and toxicity. Toxicol Appl Pharmacol 2005; 202:199–211.
- Conrad ME, Umbreit JN. Pathways of iron absorption. Blood Cells Mol Dis 2002; 29:336–355.
- Frazer DM, Anderson GJ. The orchestration of body iron intake: how and where do enterocytes receive their cues? Blood Cells Moll Dis 2003; 30:288–297.
- Donovan A, Lima CA, Pinkus JL, et al. The iron exporter ferroportin/Slc40a1 is essential for iron homeostasis. Cell Metab 2005; 1:191–200.
- Vulpe CD, Kuo YM, Murphy TL, et al. Hephaestin, a ceruloplasmin homologue implicated in intestinal iron transport, is defective in the sla mouse. Nat Genet 1999; 21:195–199.
- Bothwell TH. Overview and mechanisms of iron regulation. Nutr Rev 1995: 53:237–245.
- Kawabata H, Nakamaki T, Ikonomi P, Smith RD, Germain RS, Koeffler HP. Expression of transferrin receptor 2 in normal and neoplastic hematopoietic cells. Blood 2001; 98:2714–2719.
- Arosio P, Levi S. Cytosolic and mitochondrial ferritins in the regulation of cellular iron homeostasis and oxidative damage. Biochim Biophys Acta 2010; 1800:783–792.
- Finch CA, Bellotti V, Stray S, et al. Plasma ferritin determination as a diagnostic tool. West J Med 1986; 145:657–663.
- Delaby C, Pilard N, Goncalves AS, Beaumont C, Canonne-Hergaux F. Presence of the iron exporter ferroportin at the plasma membrane of macrophages is enhanced by iron loading and down-regulated by hepcidin. Blood 2005; 106:3979–3984.
- Ganz T. Hepcidin, a key regulator of iron metabolism and mediator of anemia of inflammation. Blood 2003; 102:783–788.
- Nicolas G, Chauvet C, Viatte L, et al. The gene encoding the iron regulatory peptide hepcidin is regulated by anemia, hypoxia, and inflammation. J Clin Invest 2002; 110:1037–1044.
- DeGowin RL, Lavender AR, Forland M, Charleston D, Gottschalk A. Erythropoiesis and erythropoietin in patients with chronic renal failure treated with hemodialysis and testosterone. Ann Intern Med 1970; 72:913–918.
- Richardson JR Jr, Weinstein MB. Erythropoietic response of dialyzed patients to testosterone administration. Ann Intern Med 1970; 73:403–407
- Eschbach JW, Abdulhadi MH, Browne JK, et al. Recombinant human erythropoietin in anemic patients with end-stage renal disease. Results of a phase III multicenter clinical trial. Ann Intern Med 1989; 111:992–1000.
- Moreno F, Aracil FJ, Pérez R, Valderrábano F. Controlled study on the improvement of quality of life in elderly hemodialysis patients after correcting end-stage renal disease-related anemia with erythropoietin. Am J Kidney Dis 1996; 27:548–556.
- Nissenson AR, Nimer SD, Wolcott DL. Recombinant human erythropoietin and renal anemia: molecular biology, clinical efficacy, and nervous system effects. Ann Intern Med 1991; 114:402–416.
- Stivelman JC. Benefits of anaemia treatment on cognitive function. Nephrol Dial Transplant 2000; 15(suppl 3):29–35.
- Maddux FW, Shetty S, del Aguila MA, Nelson MA, Murray BM. Effect of erythropoiesis-stimulating agents on healthcare utilization, costs, and outcomes in chronic kidney disease. Ann Pharmacother 2007; 41:1761–1769.
- Macdougall IC, Lewis NP, Saunders MJ, et al. Long-term cardiorespiratory effects of amelioration of renal anaemia by erythropoietin. Lancet 1990; 335:489–493.
- Silverberg DS, Wexler D, Blum M, et al. Effects of treatment with epoetin beta on outcomes in patients with anaemia and chronic heart failure. Kidney Blood Press Res 2005; 28:41–47.
- Perkins R, Olson S, Hansen J, Lee J, Stiles K, Lebrun C. Impact of an anemia clinic on emergency room visits and hospitalizations in patients with anemia of CKD pre-dialysis. Nephrol Nurs J 2007; 34:167–173, 182.
- Locatelli F, Conte F, Marcelli D. The impact of haematocrit levels and erythropoietin treatment on overall and cardiovascular mortality and morbidity—the experience of the Lombardy Dialysis Registry. Nephrol Dial Transplant 1998; 13:1642–1644.
- Centers for Medicare and Medicaid Services; Kinney R. 2005 Annual Report: ESRD Clinical Performance Measures Project. Am J Kidney Dis 2006; 48(suppl 2):S1–S106.
- US Renal Data System. Annual Data Report 2006. www.usrds.org/adr.aspx. Accessed July 3, 2016.
- Besarab A, Bolton WK, Browne JK, et al. The effects of normal as compared with low hematocrit values in patients with cardiac disease who are receiving hemodialysis and epoetin. N Engl J Med 1998; 339:584–590.
- Singh AK, Szczech L, Tang KL, et al; CHOIR Investigators. Correction of anemia with epoetin alfa in chronic kidney disease. N Engl J Med 2006; 355:2085–2098.
- Drüeke TB, Locatelli F, Clyne N, et al; CREATE Investigators. Normalization of hemoglobin level in patients with chronic kidney disease and anemia. N Engl J Med 2006; 355:2071–2084.
- Pfeffer MA, Burdmann EA, Chen CY, et al; TREAT Investigators. A trial of darbepoetin alfa in type 2 diabetes and chronic kidney disease. N Engl J Med 2009; 361:2019–2032.
- Kirkpantur A, Kahraman S, Yilmaz R, et al. The effects of maintenance recombinant human erythropoietin therapy on ambulatory blood pressure recordings: conventional, Doppler, and tissue Doppler echocardiographic parameters. Artif Organs 2005; 29:965–972.
- Fishbane S, Berns JS. Hemoglobin cycling in hemodialysis patients treated with recombinant human erythropoietin. Kidney Int 2005; 68:1337–1343.
- Szczech LA, Barnhart HX, Inrig JK, et al. Secondary analysis of the CHOIR trial epoetin-alpha dose and achieved hemoglobin outcomes. Kidney Int 2008; 74:791–798.
- Solomon SD, Uno H, Lewis EF, et al; Trial to Reduce Cardiovascular Events with Aranesp Therapy (TREAT) Investigators. Erythropoietic response and outcomes in kidney disease and type 2 diabetes. N Engl J Med 2010; 363:1146–1155.
- Kidney Disease: Improving Global Outcomes (KDIGO). KDIGO Clinical Practice Guideline for Anemia in Chronic Kidney Disease. Kidney Int Suppl 2012; 2:279–335.
- Fernández-Rodríguez AM, Guindeo-Casasús MC, Molero-Labarta T, et al. Diagnosis of iron deficiency in chronic renal failure. Am J Kidney Dis 1999; 34:508–513.
- Eschbach JW, Cook JD, Scribner BH, Finch CA. Iron balance in hemodialysis patients. Ann Intern Med 1977; 87:710–713.
- Mittman N, Sreedhara R, Mushnick R, et al. Reticulocyte hemoglobin content predicts functional iron deficiency in hemodialysis patients receiving rHuEPO. Am J Kidney Dis 1997; 30:912–922.
- Tessitore N, Solero GP, Lippi G, et al. The role of iron status markers in predicting response to intravenous iron in haemodialysis patients on maintenance erythropoietin. Nephrol Dial Transplant 2001; 16:1416–1423.
- Coyne DW. Iron indices: what do they really mean? Kidney Int Suppl 2006; 101:S4–S8.
- Fishbane S, Kowalski EA, Imbriano LJ, Maesaka JK. The evaluation of iron status in hemodialysis patients. J Am Soc Nephrol 1996; 7:2654–2657.
- Coyne DW, Kapoian T, Suki W, et al; DRIVE Study Group. Ferric gluconate is highly efficacious in anemic hemodialysis patients with high serum ferritin and low transferrin saturation: results of the Dialysis Patients’ Response to IV Iron with Elevated Ferritin (DRIVE) Study. J Am Soc Nephrol 2007; 18:975–984.
- Radtke HW, Claussner A, Erbes PM, Scheuermann EH, Schoeppe W, Koch KM. Serum erythropoietin concentration in chronic renal failure: relationship to degree of anemia and excretory renal function. Blood 1979; 54:877–884.
- Korte W, Cogliatti SB, Jung K, Riesen W. Mild renal dysfunction is sufficient to induce erythropoietin deficiency in patients with unexplained anaemia. Clin Chim Acta 2000; 292:149–154.
- Locatelli F, Olivares J, Walker R, et al; European/Australian NESP 980202 Study Group. Novel erythropoiesis stimulating protein for treatment of anemia in chronic renal insufficiency. Kidney Int 2001; 60:741–747.
- Carrera F, Burnier M. Use of darbepoetin alfa in the treatment of anaemia of chronic kidney disease: clinical and pharmacoeconomic considerations. NDT Plus 2009; 2(suppl 1):i9–i17.
- Egrie JC, Browne JK. Development and characterization of novel erythropoiesis stimulating protein (NESP). Nephrol Dial Transplant 2001; 16(suppl 3):3–13.
- Nissenson AR, Charytan C. Controversies in iron management. Kidney Int Suppl 2003; 87:S64–S71.
- Kilpatrick RD, Critchlow CW, Fishbane S, et al. Greater epoetin alpha responsiveness is associated with improved survival in hemodialysis patients. Clin J Am Soc Nephrol 2008; 3:1077–1083.
- Locatelli F, Aljama P, Barany P, et al; European Best Practice Guidelines Working Group. Revised European best practice guidelines for the management of anaemia in patients with chronic renal failure. Nephrol Dial Transplant 2004; 19(suppl 2):ii1–ii47.
- Stenvinkel P. The role of inflammation in the anaemia of end-stage renal disease. Nephrol Dial Transplant 2001; 16(suppl 7):36–40.
- Barany P, Divino Filho JC, Bergstrom J. High C-reactive protein is a strong predictor of resistance to erythropoietin in hemodialysis patients. Am J Kidney Dis 1997; 29:565–568.
- Drueke T. Hyporesponsiveness to recombinant human erythropoietin. Nephrol Dial Transplant 2001; 16(suppl 7):25–28.
- Casadevall N. Cellular mechanism of resistance to erythropoietin. Nephrol Dial Transplant 1995; 10(suppl 6):27–30.
- Kraus E, Rabb H. EPO therapy during acute kidney disease: to use or not to use, that is the question. Am J Kidney Dis 2005; 46:967–969.
- Gotloib L, Silverberg D, Fudin R, Shostak A. Iron deficiency is a common cause of anemia in chronic kidney disease and can often be corrected with intravenous iron. J Nephrol 2006; 19:161–167.
- Tarng DC, Huang TP, Chen TW, Yang WC. Erythropoietin hyporesponsiveness: from iron deficiency to iron overload. Kidney Int Suppl 1999; 69:S107–S118.
- Drüeke TB. Modulating factors in the hematopoietic response to erythropoietin. Am J Kidney Dis 1991; 18(suppl 1):87–92.
- Boven K, Stryker S, Knight J, et al. The increased incidence of pure red cell aplasia with an Eprex formulation in uncoated rubber stopper syringes. Kidney Int 2005; 67:2346–2353.
- Shimizu H, Saitoh T, Ota F, et al. Pure red cell aplasia induced only by intravenous administration of recombinant human erythropoietin. Acta Haematol 2011; 126:114–118.
- Tonia T, Mettler A, Robert N, et al. Erythropoietin or darbepoetin for patients with cancer. Cochrane Database Syst Rev 2012; 12:CD003407.
- Bohlius J, Langensiepen S, Schwarzer G, et al. Recombinant human erythropoietin and overall survival in cancer patients: results of a comprehensive meta-analysis. J Natl Cancer Inst 2005; 97:489–498.
- Henke M, Laszig R, Rübe C, et al. Erythropoietin to treat head and neck cancer patients with anaemia undergoing radiotherapy: randomised, double-blind, placebo-controlled trial. Lancet 2003; 362:1255–1260.
- Leyland-Jones B, Semiglazov V, Pawlicki M, et al. Maintaining normal hemoglobin levels with epoetin alfa in mainly nonanemic patients with metastatic breast cancer receiving first-line chemotherapy: a survival study. J Clin Oncol 2005; 23:5960–5972.
- Brower V. Erythropoietin may impair, not improve, cancer survival. Nat Med 2003; 9:1439.
- Acs G, Acs P, Beckwith SM, et al. Erythropoietin and erythropoietin receptor expression in human cancer. Cancer Res 2001; 61:3561–3565.
- Yasuda Y, Fujita Y, Matsuo T, et al. Erythropoietin regulates tumour growth of human malignancies. Carcinogenesis 2003; 24:1021–1029.
- Levin NW, Fishbane S, Cañedo FV, et al; MAXIMA Study Investigators. Intravenous methoxy polyethylene glycol-epoetin beta for haemoglobin control in patients with chronic kidney disease who are on dialysis: a randomised non-inferiority trial (MAXIMA). Lancet 2007; 370:1415–1421.
- Macdougall IC, Walker R, Provenzano R, et al; ARCTOS Study Investigators. C.E.R.A. corrects anemia in patients with chronic kidney disease not on dialysis: results of a randomized clinical trial. Clin J Am Soc Nephrol 2008; 3:337–347.
- Frohna PA, Milwee S, Pinkett J, et al. Preliminary results from a randomized, single-blind, placebo-controlled trial of FG-4592, a novel hypoxia inducible factor prolyl hydroxylase inhibitor, in subjects with CKD anemia (abstract). J Am Soc Nephrol 2007; 18:763.
- Holdstock L, Meadowcroft AM, Maier R, et al. Four-week studies of oral hypoxia-inducible factor-prolyl hydroxylase inhibitor GSK1278863 for treatment of anemia. J Am Soc Nephrol 2016; 27:1234–1244.
KEY POINTS
- Before treating with ESAs, it is necessary to investigate and rule out underlying treatable conditions such as iron or vitamin deficiencies.
- Recognizing anemia in chronic kidney disease is important and often involves participation by the primary care physician, especially in early disease when chronic kidney disease may be mild.
- The only proven benefit of ESA therapy is avoidance of blood transfusions.
- ESAs should not be used to increase the hemoglobin concentration above 13 g/dL. In end-stage renal disease, the goal of therapy is to maintain levels at a target no higher than 11.5 g/dL. In nondialysis-dependent chronic kidney disease, the decision to prescribe ESA therapy should be individualized.
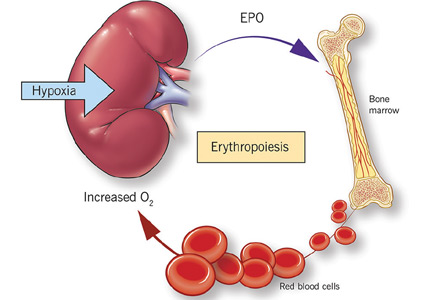
Is there a time limit for systemic menopausal hormone therapy?
The duration of hormone therapy needs to be an individualized decision, shared between the patient and her physician and assessed annually. Quality of life, vasomotor symptoms, current age, time since menopause, hysterectomy status, personal risks (of osteoporosis, breast cancer, heart disease, stroke, venous thromboembolism), and patient preferences need to be considered.
The North American Menopause Society (NAMS) and other organizations recommend that the lowest dose of hormone therapy be used for the shortest duration needed to manage menopausal symptoms.1–4 However, NAMS states that extending the duration of hormone therapy may be appropriate in women who have persistent symptoms or to prevent osteoporosis if the patient cannot tolerate alternative therapies.1
Forty-two percent of postmenopausal women continue to experience vasomotor symptoms at age 60 to 65.5 The median total duration of vasomotor symptoms is 7.4 years, and in black women and women with moderate or severe hot flashes the symptoms typically last 10 years.6 Vasomotor symptoms recur in 50% of women who discontinue hormone therapy, regardless of whether it is stopped abruptly or tapered.1
FACTORS TO CONSIDER WHEN PRESCRIBING HORMONE THERAPY
Bone health
A statement issued in 2013 by seven medical societies said that hormone therapy is effective and appropriate for preventing osteoporosis-related fracture in at-risk women under age 60 or within 10 years of menopause.7
The Women’s Health Initiative,8 a randomized placebo-controlled trial, showed a statistically significant lower risk of vertebral and nonvertebral fracture after 3 years of use of conjugated equine estrogen with medroxyprogesterone acetate than with placebo:
- Hazard ratio 0.76, 95% confidence interval (CI) 0.69–0.83.
It also showed a mean increase of 3.7% (P < .001) in total hip bone mineral density. By the end of the trial intervention, women receiving either this combined therapy or conjugated equine estrogen alone saw a 33% overall reduction in hip fracture risk. The absolute risk reduction was 5 per 10,000 years of use.9
Karim et al,10 in a large observational study that followed initial hormone therapy users over 6.5 years, found that those who stopped it had a 55% greater risk of hip fracture and experienced significant bone loss as measured by bone mineral density compared with women who continued hormone therapy, and that the protective effects of hormone therapy disappeared as early as 2 years after stopping treatment.10
NAMS also recommends that women with premature menopause (before age 40) be offered and encouraged to use hormone therapy to preserve bone density and manage vasomotor symptoms until the age of natural menopause (age 51).1,11
Cardiovascular health
Large observational studies have found that hormone therapy is associated with a 30% to 50% lower cardiovascular risk.12 Randomized controlled trials of hormone therapy for 7 to 11 years suggest that coronary heart disease risk is modified by age and time since menopause.13,14
The Women’s Health Initiative and other randomized controlled trials suggest a lower risk of coronary heart disease in women who begin hormone therapy before age 60 and within 10 years of the onset of menopause, but an increased risk for women over age 60 and more than 10 years since menopause. However, several of these trends have not reached statistical significance (Table 1).13–15
The Women’s Health Initiative9 published its long-term follow-up results in 2013, with data on both the intervention phase (median of 7.2 years for estrogen-only therapy and 5.6 years for estrogen-progestin therapy) and the post-stopping phase (median 6.6 years for the estrogen-only group and 8.2 years for the estrogen-progestin group), with a total cumulative follow-up of 13 years. The overall 13-year cumulative absolute risk of coronary heart disease was 4 fewer events per 10,000 years of estrogen-only therapy and 3 additional events per 10,000 years of estrogen-progestin therapy. Neither result was statistically significant:
- Hazard ratio with estrogen-only use 0.94, 95% CI 0.82–1.09
- Hazard ratio with estrogen-progestin use 1.09, 95% CI 0.92–1.24.
The Danish Osteoporosis Study was the first randomized controlled trial of hormone therapy in women ages 45 through 58 who were recently menopausal (average within 7 months of menopause).15 Women assigned to hormone therapy in the form of oral estradiol with or without norethisterone (known as norethindrone in the United States) had a statistically significant lower risk of the primary composite end point of heart failure and myocardial infarction after 11 years of hormone therapy, and this finding persisted through 16 years of follow-up (Table 1).
Stroke
Overall stroke risk was significantly increased with hormone therapy in the Women’s Health Initiative trial (hazard ratio 1.32, 95% CI 1.12–1.56); however, the absolute increase in risk was small in both estrogen-alone and estrogen-progestin therapy users, 11 and 8 events, respectively, among 10,000 users. Younger women (ages 50–59) saw a nonsignificantly lower risk (2 fewer cases per 10,000 years of use).14 After 13 years of cumulative follow-up (combined intervention and follow-up phase), the risk of stroke persisted at 5 cases per 10,000 users for both arms, but only the estrogen-progestin results were statistically significant.9
The Danish Osteoporosis Study15 found no increased risk of stroke after 16 years of follow-up in recently menopausal women:
- Hazard ratio 0.89, 95% CI 0.48–1.65.
Venous thromboembolism
Data from both observational and randomized controlled trials demonstrate an increased risk of venous thromboembolism with oral hormone therapy, and the risk appears to be highest during the first few years of use.1 The pooled cohort from the Women’s Health Initiative had 18 additional cases of venous thromboembolism per 10,000 women in estrogen-progestin users compared with nonusers, and 7 additional cases in those using estrogen-only therapy.
Breast health
Observational studies and randomized controlled trials have provided data on longer use of hormone therapy and breast cancer risk, but the true magnitude of this risk is unclear.
The Danish Osteoporosis Study,15 in a younger cohort of women, showed no increased risk of breast cancer after 16 years of follow-up:
- Hazard ratio 0.90, 95% CI 0.52–1.57.
The Women’s Health Initiative9 showed a statistically nonsignificant lower risk of breast cancer in women of all ages exposed to conjugated equine estrogen alone for 7.1 years (6 fewer cases per 10,000 women-years of use), and after 6 years of follow-up this developed statistical significance:
- Hazard ratio 0.79, 95% CI 0.65–0.97.
In contrast, those using conjugated equine estrogen plus medroxyprogesterone acetate had a statistically nonsignificant increase in the risk of new breast cancer after 3 to 5 years:
- 3-year relative risk 1.26, 95% CI 0.73–2.20
- 5-year relative risk 1.99, 95% CI 1.18–3.35
- Absolute risk 8 cases per 10,000 women-years of use.
The increased risk of breast cancer significantly declined within 3 years after stopping hormone therapy.
However, even after stopping hormone therapy, there remains a statistically small but significant increased risk of breast cancer, as demonstrated in the postintervention 13-year follow-up data on breast cancer risk and estrogen-progestin use from the Women’s Health Initiative9:
- Hazard ratio 1.28, 95% CI 1.11–1.48
- Absolute cumulative risk 9 cases per 10,000 women-years of use.
The Nurses’ Health Study, an observational study, prospectively followed 11,508 hysterectomized women on estrogen therapy and found that breast cancer risk increased with longer duration of use. An analysis by Chen et al16 found a trend toward increased breast cancer risk after 10 years of estrogen therapy, but this did not become statistically significant until 20 years of ongoing estrogen use. The risk of estrogen receptor-positive and progesterone receptor-positive breast cancer became statistically significant earlier, after 15 years. The relative risk associated with using estrogen for more than 15 years was 1.18, and the risk with using it for more than 20 years was 1.42.16
To put this in perspective, Chen et al17 found a similar breast cancer risk with alcohol consumption. The relative risk of invasive breast cancer was 1.15 in women who drank 3 to 6 servings of alcohol per week, 1 serving being equivalent to 4 oz of wine, which contains 11 g of alcohol.
Mortality
Studies have suggested that hormone therapy users have a lower mortality rate, even with long-term use.
A meta-analysis18 of 8 observational trials and 19 randomized controlled trials found that younger women (average age 54) on hormone therapy had a 28% lower total mortality rate compared with women not taking hormone therapy:
- Relative risk 0.72, 95% credible interval 0.62–0.82.
The Women’s Health Initiative19 suggested that the mortality rate was 30% lower in hormone therapy users younger than age 60 than in similar nonusers, though this difference did not reach statistical significance.
- Relative risk with estrogen-only therapy: 0.71, 95% CI 0.46–1.11
- Relative risk with combined estrogen-progestin therapy 0.69, 95% CI 0.44–1.07.
The Danish Osteoporosis Study,15 at 16 years of follow-up, similarly demonstrated a 34% lower mortality rate in hormone therapy users, which was not statistically significant:
- Relative risk 0.66, 95% CI 0.41–1.08.
A Cochrane review20 in 2015 found that the subgroup of women who started hormone therapy before age 60 or within 10 years of menopause saw an overall benefit in terms of survival and lower risk of coronary heart disease: RR 0.70, 95% CI 0.52–0.95 (moderate-quality evidence).
TYPE OF FORMULATION
Compared with estrogen-progestin therapy, estrogen-only therapy has a more favorable risk profile in terms of coronary heart disease and breast cancer, although stroke risk remains elevated in users of conjugated equine estrogen with or without medroxyprogesterone acetate.
There is limited evidence directly comparing different formulations of hormone therapy, although they all effectively treat vasomotor symptoms.1
Oral vs transdermal formulations
Canonico et al,21 in a meta-analysis of observational studies, found that oral estrogen was associated with a higher risk of venous thromboembolism than transdermal estrogen:
- Relative risk with oral estrogen 2.5, 95% CI 1.9–3.4
- Relative risk with transdermal estrogen 1.2, 95% CI 0.9–1.7.
The Estrogen and Thromboembolism Risk (ESTHER) study22 was a multicenter case-control study of women ages 45 to 70 that assessed risk of venous thromboembolism in oral vs transdermal estrogen users. Compared with women not taking hormone therapy, current users of oral estrogen had a significantly higher risk of venous thromboembolism, while transdermal estrogen users did not:
- Odds ratio with oral estrogen 4.2, 95% CI 1.5–11.6
- Odds ratio with transdermal estrogen 0.9, 95% CI 0.4–2.1.
The Kronos Early Estrogen Prevention Study (KEEPS)23 did not support these findings. This 4-year randomized controlled trial, published in 2014, was designed to assess the risk of atherosclerosis progression with early menopause initiation of placebo vs low-dose oral hormone therapy (conjugated equine estrogen 0.45 mg daily with cyclical micronized progesterone) or transdermal hormone therapy (estradiol 50 µg/week with cyclical micronized progesterone).
In the 727 women in the study, there was one transient ischemic attack in the oral hormone therapy group, one unconfirmed stroke in the transdermal hormone therapy group, and one case of venous thromboembolism in each group, findings that were underpowered for statistical significance. Both oral and transdermal hormonal therapy had neutral effects on atherosclerosis progression, as assessed by arterial imaging. Transdermal hormone therapy was associated with improvements in markers of insulin resistance and was not associated with an increase in triglycerides, C-reactive protein, or sex hormone-binding globulin, as would be expected with transdermal circumvention of the first-pass hepatic effect.
BALANCING THE RISKS AND BENEFITS FOR THE PATIENT
The most effective treatment for vasomotor symptoms in women at any age is hormone therapy, and the benefits are more likely to outweigh risks when initiated before age 60 or within 10 years of menopause.7 The Women’s Health Initiative randomized study was limited to 5.6 to 7.2 years of hormone therapy (13 years of cumulative follow-up), and the Danish Osteoporosis Study was limited to 11 years of use (16 years cumulative follow-up).
The coronary heart disease outcomes for longer durations of therapy remain uncertain. There is a small but statistically significant increased risk of stroke and venous thromboembolism with oral hormone therapy, and breast cancer risk is associated with long-term estrogen-progestin use.
Patients on hormone therapy should be evaluated annually regarding the need for ongoing therapy. Persistent moderate-severe vasomotor symptoms, quality of life benefits of hormone therapy, contraindications to its use (Table 2), and patient preference need to be assessed as well as baseline risks of cardiovascular disease, breast cancer, and fracture.
Risk calculators may facilitate the shared decision-making process. Examples are:
- The American College of Cardiology/American Heart association risk calculator for cardiovascular disease24 (www.cvriskcalculator.com)
- The World Health Organization Fracture Risk Assessment Tool (FRAX)25
(www.shef.ac.uk/FRAX/tool.jsp)
- The Gail model for breast cancer risk26 (www.cancer.gov/bcrisktool/).
- MenoPro, a menopause decision-support algorithm and companion mobile app developed by NAMS to help direct treatment decisions based on the 10-year risk of atherosclerotic cardiovascular disease (www.menopause.org/for-professionals/-i-menopro-i-mobile-app).27
The discussion of the risks of hormone therapy with patients should incorporate the perspective of absolute risk. For example, a woman wishing to continue estrogen-progestin therapy should be told that the Women’s Health Initiative data suggest that, after 5 years of use, breast cancer risk may be increased by 8 additional cases per 10,000 users per year. According to the World Health Organization, this magnitude of risk is defined as rare (less than 1 event per 1,000 women).28
A strategy of prescribing the lowest dose to achieve the desired clinical benefits is prudent and recommended.1–3 Table 3 outlines the estrogen formulations now available in the United States, with their doses and formulations.
Unless contraindications develop (Table 2), patients may elect to continue hormone therapy if its benefits outweigh its risks. The American College of Obstetricians and Gynecologists (ACOG) 2014 practice recommendations for management of menopausal symptoms31 and the 2015 NAMS statement both recommend that hormone therapy not be discontinued based solely on a woman’s age.29
Hormone therapy is on the Beer’s list of potentially inappropriate medications for older adults,30 which remains a hurdle to its long-term use and seems to be at odds with these ACOG and NAMS statements.
Patients who choose to discontinue hormone therapy need to be monitored for persistent bothersome vasomotor symptoms, bone loss, osteoporosis, and the genitourinary syndrome of menopause (previously referred to as vulvovaginal atrophy)31 and offered alternative therapies if needed.
- North American Menopause Society. The 2012 hormone therapy position statement of: The North American Menopause Society. Menopause 2012; 19:257–271.
- American College of Obstetricians and Gynecologists. Practice Bulletin No. 141: Management of menopausal symptoms. Obstet Gynecol 2014; 123:202–216.
- Stuenkel CA, Davis SR, Gompel A, et al. Treatment of symptoms of the menopause: an Endocrine Society clinical practice guideline. J Clin Endocrinol Metab 2015; 100:3975–4011.
- de Villiers TJ, Pines A, Panay N, et al; International Menopause Society. Updated 2013 International Menopause Society recommendations on menopausal hormone therapy and preventive strategies for midlife health. Climacteric 2013; 16:316–337.
- Gartoulla P, Worsley R, Robin J, Davis S. Moderate to severe vasomotor and sexual symptoms remain problematic for women aged 60 to 65 years. Menopause 2015; 22:694–701.
- Avis NE, Crawford SL, Greendale G, et al. Duration of menopausal vasomotor symptoms across the menopause transition. JAMA Intern Med 2015; 175:531–539.
- de Villiers TJ, Gass ML, Haines CJ, et al. Global consensus statement on menopausal hormone therapy. Climacteric 2013; 16:203–204.
- Cauley J, Robbins J, Chen Z, et al. Effects of estrogen plus progestin on risk of fracture and bone mineral density: the Women’s Health Initiative randomized trial. JAMA 2003; 290:1729–1738.
- Manson J, Chlebowski R, Stefanick M, et al. Menopausal hormone therapy and health outcomes during the intervention and extended poststopping phases of the Women’s Health Initiative randomized trials. JAMA 2013; 310:1353–1368.
- Karim R, Dell RM, Greene DF, et al. Hip fracture in postmenopausal women after cessation of hormone therapy: results from a prospective study in a large health management organization. Menopause 2011; 18:1172–1177.
- Shifren J, Gass M, and the NAMS Recommendations for Clinical Care of Midlife Women Working Group. The North American Menopause Society recommendations for clinical care of midlife women. Menopause 2014; 21:1038–1062.
- Hodis HN, Mack WJ. Hormone replacement therapy and the association with coronary heart disease and overall mortality: clinical application of the timing hypothesis. J Steroid Biochem Mol Biol 2014; 142:68–75.
- Salpeter SR, Walsh JM, Greyber E, et al. Brief report: coronary heart disease events associated with hormone therapy in younger and older women. A meta-analysis. J Gen Intern Med 2006; 21:363–366.
- Rossouw JE, Prentice RL, Manson JE, et al. Postmenopausal hormone therapy and risk of cardiovascular disease by age and years since menopause. JAMA 2007; 297:1465–1477.
- Schierbeck LL, Rejnmark L, Tofteng CL, et al. Effect of hormone replacement therapy on cardiovascular events in recently postmenopausal women: randomised trial. BMJ 2012; 345:e6409.
- Chen WY, Manson JE, Hankinson SE, et al. Unopposed estrogen therapy and the risk of breast cancer. Arch Intern Med 2006; 166:1027–1032.
- Chen W, Rosner B, Hankinson SE, et al. Moderate alcohol consumption during adult life, drinking patterns, and breast cancer risk. JAMA 2011; 306:1884–1890.
- Salpeter SR, Cheng J, Thabane L, et al. Bayesian meta-analysis of hormone therapy and mortality in younger postmenopausal women. Am J Med 2009; 122:1016–1022.
- Hodis HN, Collins P, Mack WJ, Schierbeck LL. The timing hypothesis for coronary heart disease prevention with hormone therapy: past, present and future in perspective. Climacteric 2012; 15:217–228.
- Boardman HM, Hartley L, Eisinga A, et al. Hormone therapy for preventing cardiovascular disease in post-menopausal women. Cochrane Database Syst Rev 2015;3:CD002229.
- Canonico M, Plu-Bureau G, Lowe GD, et al. Hormone replacement therapy and risk of venous thromboembolism in postmenopausal women: systemic review and meta-analysis. BMJ 2008; 336:1227–1231.
- Canonico M, Oger E, Plu-Bureau G, et al; Estrogen and Thromboembolism Risk (ESTHER) Study Group. Hormone therapy and venous thromboembolism among postmenopausal women: impact of the route of estrogen administration and progestogens: the ESTHER study. Circulation 2007; 115:840–845.
- Harman S, Black D, Naftolin F, et al. Arterial imaging outcomes and cardiovascular risk factors in recently menopausal women. Ann Intern Med 2014; 161:249–260.
- Goff DC Jr, Lloyd-Jones DM, Bennett G, et al. 2013 ACC/AHA guideline on the assessment of cardiovascular risk: a report of the American College of Cardiology/American Heart Association Task Force on Practice Guidelines. J Am Coll Cardiol 2014; 63:2935–2959.
- World Health Organization Collaborating Centre for Metabolic Bone Diseases. FRAX WHO fracture risk assessment tool. www.shef.ac.uk/FRAX/. Accessed May 27, 2016.
- Gail M, Brinton L, Byar D, et al. Projecting individualized probabilities of developing breast cancer for white females who are being examined annually. J Natl Cancer Inst 1989; 81:1879–1886.
- Manson J, Ames J, Shapiro M, et al. Algorithm and mobile app for menopausal symptom management and hormonal/non-hormonal therapy decision making: a clinical decision-support tool from the North American Menopause Society. Menopause 2015; 22:247–253.
- Hodis HN, Mack WJ. Postmenopausal hormone therapy in clinical perspective. Menopause 2007; 14:944–957.
- North American Menopause Society. The North American Menopause Society statement on continuing use of systemic hormone therapy after the age of 65. Menopause 2015; 22:693.
- American Geriatrics Society 2015 Beers Criteria Update Expert Panel. American Geriatrics Society 2015 updated Beers criteria for potentially inappropriate medication use in older adults. J Am Geriatr Soc 2015; 63:2227–2246.
- Portman DJ, Gass ML; Vulvovaginal Atrophy Terminology Consensus Conference Panel. Genitourinary syndrome of menopause: new terminology for vulvovaginal atrophy from the International Society for the Study of Women’s Sexual Health and the North American Menopause Society. Menopause 2014; 21:1063–1068.
The duration of hormone therapy needs to be an individualized decision, shared between the patient and her physician and assessed annually. Quality of life, vasomotor symptoms, current age, time since menopause, hysterectomy status, personal risks (of osteoporosis, breast cancer, heart disease, stroke, venous thromboembolism), and patient preferences need to be considered.
The North American Menopause Society (NAMS) and other organizations recommend that the lowest dose of hormone therapy be used for the shortest duration needed to manage menopausal symptoms.1–4 However, NAMS states that extending the duration of hormone therapy may be appropriate in women who have persistent symptoms or to prevent osteoporosis if the patient cannot tolerate alternative therapies.1
Forty-two percent of postmenopausal women continue to experience vasomotor symptoms at age 60 to 65.5 The median total duration of vasomotor symptoms is 7.4 years, and in black women and women with moderate or severe hot flashes the symptoms typically last 10 years.6 Vasomotor symptoms recur in 50% of women who discontinue hormone therapy, regardless of whether it is stopped abruptly or tapered.1
FACTORS TO CONSIDER WHEN PRESCRIBING HORMONE THERAPY
Bone health
A statement issued in 2013 by seven medical societies said that hormone therapy is effective and appropriate for preventing osteoporosis-related fracture in at-risk women under age 60 or within 10 years of menopause.7
The Women’s Health Initiative,8 a randomized placebo-controlled trial, showed a statistically significant lower risk of vertebral and nonvertebral fracture after 3 years of use of conjugated equine estrogen with medroxyprogesterone acetate than with placebo:
- Hazard ratio 0.76, 95% confidence interval (CI) 0.69–0.83.
It also showed a mean increase of 3.7% (P < .001) in total hip bone mineral density. By the end of the trial intervention, women receiving either this combined therapy or conjugated equine estrogen alone saw a 33% overall reduction in hip fracture risk. The absolute risk reduction was 5 per 10,000 years of use.9
Karim et al,10 in a large observational study that followed initial hormone therapy users over 6.5 years, found that those who stopped it had a 55% greater risk of hip fracture and experienced significant bone loss as measured by bone mineral density compared with women who continued hormone therapy, and that the protective effects of hormone therapy disappeared as early as 2 years after stopping treatment.10
NAMS also recommends that women with premature menopause (before age 40) be offered and encouraged to use hormone therapy to preserve bone density and manage vasomotor symptoms until the age of natural menopause (age 51).1,11
Cardiovascular health
Large observational studies have found that hormone therapy is associated with a 30% to 50% lower cardiovascular risk.12 Randomized controlled trials of hormone therapy for 7 to 11 years suggest that coronary heart disease risk is modified by age and time since menopause.13,14
The Women’s Health Initiative and other randomized controlled trials suggest a lower risk of coronary heart disease in women who begin hormone therapy before age 60 and within 10 years of the onset of menopause, but an increased risk for women over age 60 and more than 10 years since menopause. However, several of these trends have not reached statistical significance (Table 1).13–15
The Women’s Health Initiative9 published its long-term follow-up results in 2013, with data on both the intervention phase (median of 7.2 years for estrogen-only therapy and 5.6 years for estrogen-progestin therapy) and the post-stopping phase (median 6.6 years for the estrogen-only group and 8.2 years for the estrogen-progestin group), with a total cumulative follow-up of 13 years. The overall 13-year cumulative absolute risk of coronary heart disease was 4 fewer events per 10,000 years of estrogen-only therapy and 3 additional events per 10,000 years of estrogen-progestin therapy. Neither result was statistically significant:
- Hazard ratio with estrogen-only use 0.94, 95% CI 0.82–1.09
- Hazard ratio with estrogen-progestin use 1.09, 95% CI 0.92–1.24.
The Danish Osteoporosis Study was the first randomized controlled trial of hormone therapy in women ages 45 through 58 who were recently menopausal (average within 7 months of menopause).15 Women assigned to hormone therapy in the form of oral estradiol with or without norethisterone (known as norethindrone in the United States) had a statistically significant lower risk of the primary composite end point of heart failure and myocardial infarction after 11 years of hormone therapy, and this finding persisted through 16 years of follow-up (Table 1).
Stroke
Overall stroke risk was significantly increased with hormone therapy in the Women’s Health Initiative trial (hazard ratio 1.32, 95% CI 1.12–1.56); however, the absolute increase in risk was small in both estrogen-alone and estrogen-progestin therapy users, 11 and 8 events, respectively, among 10,000 users. Younger women (ages 50–59) saw a nonsignificantly lower risk (2 fewer cases per 10,000 years of use).14 After 13 years of cumulative follow-up (combined intervention and follow-up phase), the risk of stroke persisted at 5 cases per 10,000 users for both arms, but only the estrogen-progestin results were statistically significant.9
The Danish Osteoporosis Study15 found no increased risk of stroke after 16 years of follow-up in recently menopausal women:
- Hazard ratio 0.89, 95% CI 0.48–1.65.
Venous thromboembolism
Data from both observational and randomized controlled trials demonstrate an increased risk of venous thromboembolism with oral hormone therapy, and the risk appears to be highest during the first few years of use.1 The pooled cohort from the Women’s Health Initiative had 18 additional cases of venous thromboembolism per 10,000 women in estrogen-progestin users compared with nonusers, and 7 additional cases in those using estrogen-only therapy.
Breast health
Observational studies and randomized controlled trials have provided data on longer use of hormone therapy and breast cancer risk, but the true magnitude of this risk is unclear.
The Danish Osteoporosis Study,15 in a younger cohort of women, showed no increased risk of breast cancer after 16 years of follow-up:
- Hazard ratio 0.90, 95% CI 0.52–1.57.
The Women’s Health Initiative9 showed a statistically nonsignificant lower risk of breast cancer in women of all ages exposed to conjugated equine estrogen alone for 7.1 years (6 fewer cases per 10,000 women-years of use), and after 6 years of follow-up this developed statistical significance:
- Hazard ratio 0.79, 95% CI 0.65–0.97.
In contrast, those using conjugated equine estrogen plus medroxyprogesterone acetate had a statistically nonsignificant increase in the risk of new breast cancer after 3 to 5 years:
- 3-year relative risk 1.26, 95% CI 0.73–2.20
- 5-year relative risk 1.99, 95% CI 1.18–3.35
- Absolute risk 8 cases per 10,000 women-years of use.
The increased risk of breast cancer significantly declined within 3 years after stopping hormone therapy.
However, even after stopping hormone therapy, there remains a statistically small but significant increased risk of breast cancer, as demonstrated in the postintervention 13-year follow-up data on breast cancer risk and estrogen-progestin use from the Women’s Health Initiative9:
- Hazard ratio 1.28, 95% CI 1.11–1.48
- Absolute cumulative risk 9 cases per 10,000 women-years of use.
The Nurses’ Health Study, an observational study, prospectively followed 11,508 hysterectomized women on estrogen therapy and found that breast cancer risk increased with longer duration of use. An analysis by Chen et al16 found a trend toward increased breast cancer risk after 10 years of estrogen therapy, but this did not become statistically significant until 20 years of ongoing estrogen use. The risk of estrogen receptor-positive and progesterone receptor-positive breast cancer became statistically significant earlier, after 15 years. The relative risk associated with using estrogen for more than 15 years was 1.18, and the risk with using it for more than 20 years was 1.42.16
To put this in perspective, Chen et al17 found a similar breast cancer risk with alcohol consumption. The relative risk of invasive breast cancer was 1.15 in women who drank 3 to 6 servings of alcohol per week, 1 serving being equivalent to 4 oz of wine, which contains 11 g of alcohol.
Mortality
Studies have suggested that hormone therapy users have a lower mortality rate, even with long-term use.
A meta-analysis18 of 8 observational trials and 19 randomized controlled trials found that younger women (average age 54) on hormone therapy had a 28% lower total mortality rate compared with women not taking hormone therapy:
- Relative risk 0.72, 95% credible interval 0.62–0.82.
The Women’s Health Initiative19 suggested that the mortality rate was 30% lower in hormone therapy users younger than age 60 than in similar nonusers, though this difference did not reach statistical significance.
- Relative risk with estrogen-only therapy: 0.71, 95% CI 0.46–1.11
- Relative risk with combined estrogen-progestin therapy 0.69, 95% CI 0.44–1.07.
The Danish Osteoporosis Study,15 at 16 years of follow-up, similarly demonstrated a 34% lower mortality rate in hormone therapy users, which was not statistically significant:
- Relative risk 0.66, 95% CI 0.41–1.08.
A Cochrane review20 in 2015 found that the subgroup of women who started hormone therapy before age 60 or within 10 years of menopause saw an overall benefit in terms of survival and lower risk of coronary heart disease: RR 0.70, 95% CI 0.52–0.95 (moderate-quality evidence).
TYPE OF FORMULATION
Compared with estrogen-progestin therapy, estrogen-only therapy has a more favorable risk profile in terms of coronary heart disease and breast cancer, although stroke risk remains elevated in users of conjugated equine estrogen with or without medroxyprogesterone acetate.
There is limited evidence directly comparing different formulations of hormone therapy, although they all effectively treat vasomotor symptoms.1
Oral vs transdermal formulations
Canonico et al,21 in a meta-analysis of observational studies, found that oral estrogen was associated with a higher risk of venous thromboembolism than transdermal estrogen:
- Relative risk with oral estrogen 2.5, 95% CI 1.9–3.4
- Relative risk with transdermal estrogen 1.2, 95% CI 0.9–1.7.
The Estrogen and Thromboembolism Risk (ESTHER) study22 was a multicenter case-control study of women ages 45 to 70 that assessed risk of venous thromboembolism in oral vs transdermal estrogen users. Compared with women not taking hormone therapy, current users of oral estrogen had a significantly higher risk of venous thromboembolism, while transdermal estrogen users did not:
- Odds ratio with oral estrogen 4.2, 95% CI 1.5–11.6
- Odds ratio with transdermal estrogen 0.9, 95% CI 0.4–2.1.
The Kronos Early Estrogen Prevention Study (KEEPS)23 did not support these findings. This 4-year randomized controlled trial, published in 2014, was designed to assess the risk of atherosclerosis progression with early menopause initiation of placebo vs low-dose oral hormone therapy (conjugated equine estrogen 0.45 mg daily with cyclical micronized progesterone) or transdermal hormone therapy (estradiol 50 µg/week with cyclical micronized progesterone).
In the 727 women in the study, there was one transient ischemic attack in the oral hormone therapy group, one unconfirmed stroke in the transdermal hormone therapy group, and one case of venous thromboembolism in each group, findings that were underpowered for statistical significance. Both oral and transdermal hormonal therapy had neutral effects on atherosclerosis progression, as assessed by arterial imaging. Transdermal hormone therapy was associated with improvements in markers of insulin resistance and was not associated with an increase in triglycerides, C-reactive protein, or sex hormone-binding globulin, as would be expected with transdermal circumvention of the first-pass hepatic effect.
BALANCING THE RISKS AND BENEFITS FOR THE PATIENT
The most effective treatment for vasomotor symptoms in women at any age is hormone therapy, and the benefits are more likely to outweigh risks when initiated before age 60 or within 10 years of menopause.7 The Women’s Health Initiative randomized study was limited to 5.6 to 7.2 years of hormone therapy (13 years of cumulative follow-up), and the Danish Osteoporosis Study was limited to 11 years of use (16 years cumulative follow-up).
The coronary heart disease outcomes for longer durations of therapy remain uncertain. There is a small but statistically significant increased risk of stroke and venous thromboembolism with oral hormone therapy, and breast cancer risk is associated with long-term estrogen-progestin use.
Patients on hormone therapy should be evaluated annually regarding the need for ongoing therapy. Persistent moderate-severe vasomotor symptoms, quality of life benefits of hormone therapy, contraindications to its use (Table 2), and patient preference need to be assessed as well as baseline risks of cardiovascular disease, breast cancer, and fracture.
Risk calculators may facilitate the shared decision-making process. Examples are:
- The American College of Cardiology/American Heart association risk calculator for cardiovascular disease24 (www.cvriskcalculator.com)
- The World Health Organization Fracture Risk Assessment Tool (FRAX)25
(www.shef.ac.uk/FRAX/tool.jsp)
- The Gail model for breast cancer risk26 (www.cancer.gov/bcrisktool/).
- MenoPro, a menopause decision-support algorithm and companion mobile app developed by NAMS to help direct treatment decisions based on the 10-year risk of atherosclerotic cardiovascular disease (www.menopause.org/for-professionals/-i-menopro-i-mobile-app).27
The discussion of the risks of hormone therapy with patients should incorporate the perspective of absolute risk. For example, a woman wishing to continue estrogen-progestin therapy should be told that the Women’s Health Initiative data suggest that, after 5 years of use, breast cancer risk may be increased by 8 additional cases per 10,000 users per year. According to the World Health Organization, this magnitude of risk is defined as rare (less than 1 event per 1,000 women).28
A strategy of prescribing the lowest dose to achieve the desired clinical benefits is prudent and recommended.1–3 Table 3 outlines the estrogen formulations now available in the United States, with their doses and formulations.
Unless contraindications develop (Table 2), patients may elect to continue hormone therapy if its benefits outweigh its risks. The American College of Obstetricians and Gynecologists (ACOG) 2014 practice recommendations for management of menopausal symptoms31 and the 2015 NAMS statement both recommend that hormone therapy not be discontinued based solely on a woman’s age.29
Hormone therapy is on the Beer’s list of potentially inappropriate medications for older adults,30 which remains a hurdle to its long-term use and seems to be at odds with these ACOG and NAMS statements.
Patients who choose to discontinue hormone therapy need to be monitored for persistent bothersome vasomotor symptoms, bone loss, osteoporosis, and the genitourinary syndrome of menopause (previously referred to as vulvovaginal atrophy)31 and offered alternative therapies if needed.
- North American Menopause Society. The 2012 hormone therapy position statement of: The North American Menopause Society. Menopause 2012; 19:257–271.
- American College of Obstetricians and Gynecologists. Practice Bulletin No. 141: Management of menopausal symptoms. Obstet Gynecol 2014; 123:202–216.
- Stuenkel CA, Davis SR, Gompel A, et al. Treatment of symptoms of the menopause: an Endocrine Society clinical practice guideline. J Clin Endocrinol Metab 2015; 100:3975–4011.
- de Villiers TJ, Pines A, Panay N, et al; International Menopause Society. Updated 2013 International Menopause Society recommendations on menopausal hormone therapy and preventive strategies for midlife health. Climacteric 2013; 16:316–337.
- Gartoulla P, Worsley R, Robin J, Davis S. Moderate to severe vasomotor and sexual symptoms remain problematic for women aged 60 to 65 years. Menopause 2015; 22:694–701.
- Avis NE, Crawford SL, Greendale G, et al. Duration of menopausal vasomotor symptoms across the menopause transition. JAMA Intern Med 2015; 175:531–539.
- de Villiers TJ, Gass ML, Haines CJ, et al. Global consensus statement on menopausal hormone therapy. Climacteric 2013; 16:203–204.
- Cauley J, Robbins J, Chen Z, et al. Effects of estrogen plus progestin on risk of fracture and bone mineral density: the Women’s Health Initiative randomized trial. JAMA 2003; 290:1729–1738.
- Manson J, Chlebowski R, Stefanick M, et al. Menopausal hormone therapy and health outcomes during the intervention and extended poststopping phases of the Women’s Health Initiative randomized trials. JAMA 2013; 310:1353–1368.
- Karim R, Dell RM, Greene DF, et al. Hip fracture in postmenopausal women after cessation of hormone therapy: results from a prospective study in a large health management organization. Menopause 2011; 18:1172–1177.
- Shifren J, Gass M, and the NAMS Recommendations for Clinical Care of Midlife Women Working Group. The North American Menopause Society recommendations for clinical care of midlife women. Menopause 2014; 21:1038–1062.
- Hodis HN, Mack WJ. Hormone replacement therapy and the association with coronary heart disease and overall mortality: clinical application of the timing hypothesis. J Steroid Biochem Mol Biol 2014; 142:68–75.
- Salpeter SR, Walsh JM, Greyber E, et al. Brief report: coronary heart disease events associated with hormone therapy in younger and older women. A meta-analysis. J Gen Intern Med 2006; 21:363–366.
- Rossouw JE, Prentice RL, Manson JE, et al. Postmenopausal hormone therapy and risk of cardiovascular disease by age and years since menopause. JAMA 2007; 297:1465–1477.
- Schierbeck LL, Rejnmark L, Tofteng CL, et al. Effect of hormone replacement therapy on cardiovascular events in recently postmenopausal women: randomised trial. BMJ 2012; 345:e6409.
- Chen WY, Manson JE, Hankinson SE, et al. Unopposed estrogen therapy and the risk of breast cancer. Arch Intern Med 2006; 166:1027–1032.
- Chen W, Rosner B, Hankinson SE, et al. Moderate alcohol consumption during adult life, drinking patterns, and breast cancer risk. JAMA 2011; 306:1884–1890.
- Salpeter SR, Cheng J, Thabane L, et al. Bayesian meta-analysis of hormone therapy and mortality in younger postmenopausal women. Am J Med 2009; 122:1016–1022.
- Hodis HN, Collins P, Mack WJ, Schierbeck LL. The timing hypothesis for coronary heart disease prevention with hormone therapy: past, present and future in perspective. Climacteric 2012; 15:217–228.
- Boardman HM, Hartley L, Eisinga A, et al. Hormone therapy for preventing cardiovascular disease in post-menopausal women. Cochrane Database Syst Rev 2015;3:CD002229.
- Canonico M, Plu-Bureau G, Lowe GD, et al. Hormone replacement therapy and risk of venous thromboembolism in postmenopausal women: systemic review and meta-analysis. BMJ 2008; 336:1227–1231.
- Canonico M, Oger E, Plu-Bureau G, et al; Estrogen and Thromboembolism Risk (ESTHER) Study Group. Hormone therapy and venous thromboembolism among postmenopausal women: impact of the route of estrogen administration and progestogens: the ESTHER study. Circulation 2007; 115:840–845.
- Harman S, Black D, Naftolin F, et al. Arterial imaging outcomes and cardiovascular risk factors in recently menopausal women. Ann Intern Med 2014; 161:249–260.
- Goff DC Jr, Lloyd-Jones DM, Bennett G, et al. 2013 ACC/AHA guideline on the assessment of cardiovascular risk: a report of the American College of Cardiology/American Heart Association Task Force on Practice Guidelines. J Am Coll Cardiol 2014; 63:2935–2959.
- World Health Organization Collaborating Centre for Metabolic Bone Diseases. FRAX WHO fracture risk assessment tool. www.shef.ac.uk/FRAX/. Accessed May 27, 2016.
- Gail M, Brinton L, Byar D, et al. Projecting individualized probabilities of developing breast cancer for white females who are being examined annually. J Natl Cancer Inst 1989; 81:1879–1886.
- Manson J, Ames J, Shapiro M, et al. Algorithm and mobile app for menopausal symptom management and hormonal/non-hormonal therapy decision making: a clinical decision-support tool from the North American Menopause Society. Menopause 2015; 22:247–253.
- Hodis HN, Mack WJ. Postmenopausal hormone therapy in clinical perspective. Menopause 2007; 14:944–957.
- North American Menopause Society. The North American Menopause Society statement on continuing use of systemic hormone therapy after the age of 65. Menopause 2015; 22:693.
- American Geriatrics Society 2015 Beers Criteria Update Expert Panel. American Geriatrics Society 2015 updated Beers criteria for potentially inappropriate medication use in older adults. J Am Geriatr Soc 2015; 63:2227–2246.
- Portman DJ, Gass ML; Vulvovaginal Atrophy Terminology Consensus Conference Panel. Genitourinary syndrome of menopause: new terminology for vulvovaginal atrophy from the International Society for the Study of Women’s Sexual Health and the North American Menopause Society. Menopause 2014; 21:1063–1068.
KEY POINTS
- Hormone therapy is the most effective treatment available for the vasomotor symptoms of menopause, and it also is effective and appropriate for preventing osteoporosis-related fracture in at-risk women under age 60 or within 10 years of menopause.
- Oral hormone therapy is associated with a small but statistically significant increase in the risk of stroke and venous thromboembolism and breast cancer risk with combination therapy only.
- Extended hormone therapy may be appropriate to treat vasomotor symptoms or prevent osteoporosis when alternative therapies are not an option.
- The decision whether to continue hormone therapy should be revisited every year. Discussions with patients should include the perspective of absolute risk.

Is a serum TSH measurement sufficient to monitor the treatment of primary hypothyroidism?
A 28-year-old woman returns for follow-up of her hypothyroidism. She was diagnosed 4 years ago when she presented with fatigue, “foggy” thinking, poor concentration, cold intolerance, and constipation. Her thyroid-stimulating hormone (TSH) level at that time was elevated at 15 mIU/L (reference range 0.4–4). She was started on 50 µg of levothyroxine daily, which helped her symptoms, but she continued to complain of tiredness and the inability to lose weight. She has been on 100 µg of levothyroxine daily since her last visit 1 year ago.
On examination, she has a small, diffuse, and firm goiter; she has no Cushing-like features, visual field abnormalities, or signs of hypothyroidism.
Her TSH level today is 1.2 mIU/L. Based on this, you recommend no change in her daily levothyroxine dose. She expresses dissatisfaction that you had ordered only a TSH, and she asks you to order thyroxine (T4) and triiodothyronine (T3) measurements because she read on the Internet that those were needed to determine the appropriateness of the levothyroxine dose.
Should T4 or T3 be routinely measured when adjusting thyroid replacement therapy?
IN PRIMARY HYPOTHYROIDISM, TSH IS ENOUGH
In a patient with primary hypothyroidism and no suspicion of pituitary abnormality, a serum TSH is sufficient for monitoring thyroid status and adjusting the dose of thyroid hormone.
Hypothyroidism is one of the most common endocrine disorders, affecting about 4% of the adult US population.1 In areas of iodine sufficiency, primary hypothyroidism is due predominantly to Hashimoto thyroiditis.
The role of the lack of thyroid hormone in the pathogenesis of myxedema was recognized in the late 19th century through the observation of a “cretinoid” state occurring in middle-aged women, associated with atrophy of the thyroid gland and a similar severe state noted after total thyroidectomy.2
In 1891, George R. Murray was able to “cure” myxedema in a patient by injecting sheep thyroid extract subcutaneously. Thyroid extracts continued to be the only treatment for hypothyroidism until 1950, when levothyroxine was introduced and later became the main treatment. Around that time, T3 was discovered and was described as being the physiologically active thyroid hormone. Later, it was noted that 80% to 90% of circulating T3 is generated through peripheral deiodination of T4, the latter being considered a prohormone.2
The pituitary-thyroid axis is regulated through negative feedback. At concentrations of free T4 below normal, plasma TSH rises rapidly with small decrements in T4 levels.3 The opposite phenomenon occurs with free T4 concentrations above normal. Since T4 has a long disappearance half-time—about 7 days—a normal TSH tends to stay relatively stable in the same individual.4 The relationship between TSH and T4 was long thought to be inverse log-linear, but Hadlow et al5 found that it is complex and nonlinear and differs by age and sex. TSH and T4 concentrations have narrower within-individual variability than inter-individual variability. Although environmental factors may affect this hypothalamic-pituitary set-point, there is evidence that heritability is a major determinant of individual variability.6
GUIDELINES AND CHOOSING WISELY
In 2014, the American Thyroid Association published comprehensive, evidence-based guidelines for the treatment of hypothyroidism.7 The guidelines state that the goal of thyroid hormone replacement is to achieve clinical and biochemical euthyroidism.7 TSH continues to be the most reliable marker of adequacy of thyroid hormone replacement in primary hypothyroidism. The guidelines recommend aiming for a TSH in the normal range (generally 0.4–4 mIU/L).
Most studies of the risks associated with hypothyroidism or thyrotoxicosis have looked at TSH levels. Significantly increased risk of cardiovascular mortality and morbidity is seen in individuals with TSH levels higher than 10 mIU/L.8 On the other hand, excess thyroid hormone leading to a TSH level lower than 0.1 mIU/L has been associated with an increased risk of atrial fibrillation in older persons and osteoporosis in postmenopausal women.
The classic symptoms and signs of hypothyroidism correlate with biochemical hypothyroidism and usually improve with the restoration of euthyroidism. Some of these symptoms, however, lack sensitivity and specificity, especially with modest degrees of hypothyroidism.7 A randomized controlled trial showed that patients were unable to detect any difference in symptoms when the levothyroxine dose was changed by about 20%.9
HARMS ASSOCIATED WITH ORDERING T4 AND T3
Other than the financial burden to the patient and society, there is no major morbidity caused by obtaining T4 or T3 levels, or both. However, knowing the T4 or T3 level does not help with management beyond the information offered by the TSH value. Hypothyroid patients treated with levothyroxine to maintain a normal TSH generally have higher free T4 levels and lower free T3 levels than euthyroid patients with similar TSH values.10 Therefore, reacting to a high T4 level or a low T3 level in a treated hypothyroid patient with a normal TSH may lead to inappropriate dose adjustment. On the other hand, increasing the dose of thyroid hormone in a patient with a low TSH whose T3 level is low-normal may lead to morbidity.
SPECIAL SCENARIO: PITUITARY COMPROMISE
We assume that the patient described above has primary hypothyroidism and that her pituitary-thyroid axis is intact. Primary hypothyroidism is diagnosed by a high TSH along with a low or low-normal T4. In this typical case, TSH can be used to guide therapy without the need for other tests.
However, when there is pituitary compromise (hypopituitarism, congenital central hypothyroidism), the TSH will not be reliable to monitor the adequacy of thyroid hormone replacement therapy. The aim of levothyroxine management in these patients is to maintain a free T4 concentration in the upper half of the normal range. If the free T3 concentration is followed and is found to be elevated, the dose of levothyroxine should be reduced.11
CLINICAL BOTTOM LINE
Since our patient’s dose of levothyroxine has been stable and her TSH is not elevated, measuring serum levels of T4 and T3 would not contribute to her management. For such a patient, if the TSH were less than 3 mIU/L, increasing the dose would be unlikely to offer clinical benefit.
On the other hand, if her TSH was higher than 4 mIU/L, then it would be legitimate to tweak the dose upward and reassess her thyroid state clinically and biochemically 6 to 8 weeks later. One would need to be careful not to induce thyrotoxicosis through such an intervention because of the potential morbidity.
The TSH level is typically monitored every 6 to 12 months when the patient is clinically stable. It should be measured sooner in circumstances that include the following:
- Symptoms of hypothyroidism or thyrotoxicosis
- Starting a new medication known to affect thyroid hormone levels
- Significant weight change
- Hospitalization
- Pregnancy.
- Aoki Y, Belin RM, Clickner R, Jeffries R, Phillips L, Mahaffey KR. Serum TSH and total T4 in the United States population and their association with participant characteristics: National Health and Nutrition Examination Survey (NHANES 1999–2002). Thyroid 2007; 17:1211–1223.
- Kopp PE. Commentary on: guidelines for the treatment of hypothyroidism. Thyroid 2014; 24:1667–1669.
- Reichlin S, Utiger RD. Regulation of the pituitary-thyroid axis in man: relationship of TSH concentration to concentration of free and total thyroxine in plasma. J Clin Endocrinol Metab 1967; 27:251–255.
- Azukizawa M, Pekary AE, Hershman JM, Parker DC. Plasma thyrotropin, thyroxine, and triiodothyronine relationships in man. J Clin Endocrinol Metab 1976; 43:533–542.
- Hadlow NC, Rothacker KM, Wardrop R, Brown SJ, Mun Lim E, Walsh JP. The relationship between TSH and free T4 in a large population is complex and nonlinear and differs by age and sex. J Clin Endocrinol Metab 2013; 98:2936–2943.
- Clark PM, Holder RL, Haque SM, Hobbs FDR, Roberts LM, Franklyn JA. The relationship between serum TSH and free T4 in older people. J Clin Pathol 2012; 65:463–465.
- Jonklaas J, Bianco AC, Bauer AJ, et al; American Thyroid Association Task Force on Thyroid Hormone Replacement. Guidelines for the treatment of hypothyroidism. Thyroid 2014; 24:1670–1751.
- Rodondi N, den Elzen WP, Bauer DC, et al; Thyroid Studies Collaboration. Subclinical hypothyroidism and the risk of coronary heart disease and mortality. JAMA 2010; 304:1365–1374.
- Walsh JP, Ward LC, Burke V, et al. Small changes in thyroxine dosage do not produce measurable changes in hypothyroid symptoms, well-being, or quality of life: results of a double-blind, randomized clinical trial. J Clin Endocrinol Metab 2006; 91:2624–2630.
- Woeber KA. Levothyroxine therapy and serum free thyroxine and free triiodothyronine concentrations. J Endocrinol Invest 2002; 25:106–109.
- Grunenwald S, Caron P. Central hypothyroidism in adults: better understanding for better care. Pituitary 2015; 18:169–175.
A 28-year-old woman returns for follow-up of her hypothyroidism. She was diagnosed 4 years ago when she presented with fatigue, “foggy” thinking, poor concentration, cold intolerance, and constipation. Her thyroid-stimulating hormone (TSH) level at that time was elevated at 15 mIU/L (reference range 0.4–4). She was started on 50 µg of levothyroxine daily, which helped her symptoms, but she continued to complain of tiredness and the inability to lose weight. She has been on 100 µg of levothyroxine daily since her last visit 1 year ago.
On examination, she has a small, diffuse, and firm goiter; she has no Cushing-like features, visual field abnormalities, or signs of hypothyroidism.
Her TSH level today is 1.2 mIU/L. Based on this, you recommend no change in her daily levothyroxine dose. She expresses dissatisfaction that you had ordered only a TSH, and she asks you to order thyroxine (T4) and triiodothyronine (T3) measurements because she read on the Internet that those were needed to determine the appropriateness of the levothyroxine dose.
Should T4 or T3 be routinely measured when adjusting thyroid replacement therapy?
IN PRIMARY HYPOTHYROIDISM, TSH IS ENOUGH
In a patient with primary hypothyroidism and no suspicion of pituitary abnormality, a serum TSH is sufficient for monitoring thyroid status and adjusting the dose of thyroid hormone.
Hypothyroidism is one of the most common endocrine disorders, affecting about 4% of the adult US population.1 In areas of iodine sufficiency, primary hypothyroidism is due predominantly to Hashimoto thyroiditis.
The role of the lack of thyroid hormone in the pathogenesis of myxedema was recognized in the late 19th century through the observation of a “cretinoid” state occurring in middle-aged women, associated with atrophy of the thyroid gland and a similar severe state noted after total thyroidectomy.2
In 1891, George R. Murray was able to “cure” myxedema in a patient by injecting sheep thyroid extract subcutaneously. Thyroid extracts continued to be the only treatment for hypothyroidism until 1950, when levothyroxine was introduced and later became the main treatment. Around that time, T3 was discovered and was described as being the physiologically active thyroid hormone. Later, it was noted that 80% to 90% of circulating T3 is generated through peripheral deiodination of T4, the latter being considered a prohormone.2
The pituitary-thyroid axis is regulated through negative feedback. At concentrations of free T4 below normal, plasma TSH rises rapidly with small decrements in T4 levels.3 The opposite phenomenon occurs with free T4 concentrations above normal. Since T4 has a long disappearance half-time—about 7 days—a normal TSH tends to stay relatively stable in the same individual.4 The relationship between TSH and T4 was long thought to be inverse log-linear, but Hadlow et al5 found that it is complex and nonlinear and differs by age and sex. TSH and T4 concentrations have narrower within-individual variability than inter-individual variability. Although environmental factors may affect this hypothalamic-pituitary set-point, there is evidence that heritability is a major determinant of individual variability.6
GUIDELINES AND CHOOSING WISELY
In 2014, the American Thyroid Association published comprehensive, evidence-based guidelines for the treatment of hypothyroidism.7 The guidelines state that the goal of thyroid hormone replacement is to achieve clinical and biochemical euthyroidism.7 TSH continues to be the most reliable marker of adequacy of thyroid hormone replacement in primary hypothyroidism. The guidelines recommend aiming for a TSH in the normal range (generally 0.4–4 mIU/L).
Most studies of the risks associated with hypothyroidism or thyrotoxicosis have looked at TSH levels. Significantly increased risk of cardiovascular mortality and morbidity is seen in individuals with TSH levels higher than 10 mIU/L.8 On the other hand, excess thyroid hormone leading to a TSH level lower than 0.1 mIU/L has been associated with an increased risk of atrial fibrillation in older persons and osteoporosis in postmenopausal women.
The classic symptoms and signs of hypothyroidism correlate with biochemical hypothyroidism and usually improve with the restoration of euthyroidism. Some of these symptoms, however, lack sensitivity and specificity, especially with modest degrees of hypothyroidism.7 A randomized controlled trial showed that patients were unable to detect any difference in symptoms when the levothyroxine dose was changed by about 20%.9
HARMS ASSOCIATED WITH ORDERING T4 AND T3
Other than the financial burden to the patient and society, there is no major morbidity caused by obtaining T4 or T3 levels, or both. However, knowing the T4 or T3 level does not help with management beyond the information offered by the TSH value. Hypothyroid patients treated with levothyroxine to maintain a normal TSH generally have higher free T4 levels and lower free T3 levels than euthyroid patients with similar TSH values.10 Therefore, reacting to a high T4 level or a low T3 level in a treated hypothyroid patient with a normal TSH may lead to inappropriate dose adjustment. On the other hand, increasing the dose of thyroid hormone in a patient with a low TSH whose T3 level is low-normal may lead to morbidity.
SPECIAL SCENARIO: PITUITARY COMPROMISE
We assume that the patient described above has primary hypothyroidism and that her pituitary-thyroid axis is intact. Primary hypothyroidism is diagnosed by a high TSH along with a low or low-normal T4. In this typical case, TSH can be used to guide therapy without the need for other tests.
However, when there is pituitary compromise (hypopituitarism, congenital central hypothyroidism), the TSH will not be reliable to monitor the adequacy of thyroid hormone replacement therapy. The aim of levothyroxine management in these patients is to maintain a free T4 concentration in the upper half of the normal range. If the free T3 concentration is followed and is found to be elevated, the dose of levothyroxine should be reduced.11
CLINICAL BOTTOM LINE
Since our patient’s dose of levothyroxine has been stable and her TSH is not elevated, measuring serum levels of T4 and T3 would not contribute to her management. For such a patient, if the TSH were less than 3 mIU/L, increasing the dose would be unlikely to offer clinical benefit.
On the other hand, if her TSH was higher than 4 mIU/L, then it would be legitimate to tweak the dose upward and reassess her thyroid state clinically and biochemically 6 to 8 weeks later. One would need to be careful not to induce thyrotoxicosis through such an intervention because of the potential morbidity.
The TSH level is typically monitored every 6 to 12 months when the patient is clinically stable. It should be measured sooner in circumstances that include the following:
- Symptoms of hypothyroidism or thyrotoxicosis
- Starting a new medication known to affect thyroid hormone levels
- Significant weight change
- Hospitalization
- Pregnancy.
- Aoki Y, Belin RM, Clickner R, Jeffries R, Phillips L, Mahaffey KR. Serum TSH and total T4 in the United States population and their association with participant characteristics: National Health and Nutrition Examination Survey (NHANES 1999–2002). Thyroid 2007; 17:1211–1223.
- Kopp PE. Commentary on: guidelines for the treatment of hypothyroidism. Thyroid 2014; 24:1667–1669.
- Reichlin S, Utiger RD. Regulation of the pituitary-thyroid axis in man: relationship of TSH concentration to concentration of free and total thyroxine in plasma. J Clin Endocrinol Metab 1967; 27:251–255.
- Azukizawa M, Pekary AE, Hershman JM, Parker DC. Plasma thyrotropin, thyroxine, and triiodothyronine relationships in man. J Clin Endocrinol Metab 1976; 43:533–542.
- Hadlow NC, Rothacker KM, Wardrop R, Brown SJ, Mun Lim E, Walsh JP. The relationship between TSH and free T4 in a large population is complex and nonlinear and differs by age and sex. J Clin Endocrinol Metab 2013; 98:2936–2943.
- Clark PM, Holder RL, Haque SM, Hobbs FDR, Roberts LM, Franklyn JA. The relationship between serum TSH and free T4 in older people. J Clin Pathol 2012; 65:463–465.
- Jonklaas J, Bianco AC, Bauer AJ, et al; American Thyroid Association Task Force on Thyroid Hormone Replacement. Guidelines for the treatment of hypothyroidism. Thyroid 2014; 24:1670–1751.
- Rodondi N, den Elzen WP, Bauer DC, et al; Thyroid Studies Collaboration. Subclinical hypothyroidism and the risk of coronary heart disease and mortality. JAMA 2010; 304:1365–1374.
- Walsh JP, Ward LC, Burke V, et al. Small changes in thyroxine dosage do not produce measurable changes in hypothyroid symptoms, well-being, or quality of life: results of a double-blind, randomized clinical trial. J Clin Endocrinol Metab 2006; 91:2624–2630.
- Woeber KA. Levothyroxine therapy and serum free thyroxine and free triiodothyronine concentrations. J Endocrinol Invest 2002; 25:106–109.
- Grunenwald S, Caron P. Central hypothyroidism in adults: better understanding for better care. Pituitary 2015; 18:169–175.

Your patient has chronic leukemia: Now what?
The advent of targeted therapies has dramatically changed the management of chronic leukemia. Chemotherapy—highly toxic, nonspecific drugs that can be dangerous to patients and providers and result in only modest success—is gradually being replaced by biologic targeting of malignancy. Scientists are rapidly identifying extracellular and intracellular targets on tumor cells and are developing and testing promising new therapies aimed at these targets. Survival of cancer patients has become so common that clinicians outside the specialties of hematology and oncology are now caring for them.
This article describes new biologic therapies for chronic myelogenous leukemia (CML) and chronic lymphocytic leukemia (CLL), along with the diagnosis of these diseases and management of survivors in the primary care setting.
CHRONIC MYELOGENOUS LEUKEMIA
A seemingly healthy person needs laboratory blood work, perhaps for an insurance physical examination or for a preoperative workup. Or a patient comes to the emergency department with a sore throat and routine blood tests are ordered. Their laboratory values:
- White blood cell count 250 × 109/L (reference range 3–11)
- Neutrophils 70% (40%–70%)
- Blasts 1% (0)
- Metacytes and myelocytes 5% (0)
- Bands 5% (0)
- Lymphocytes 10% (22%–40%)
- Monocytes 5% (0–7%)
- Basophils 3% (0–1%)
- Eosinophils 1% (0–4%)
- Hemoglobin 12.1 g/dL (11.5–15.5 in women, 13.0–17.0 in men)
- Platelet count 525 × 109/L (150–400).
Leukocytosis and a ‘left shift’
Although this scenario often raises concern for acute leukemia, a careful look shows evidence of a chronic myeloproliferative disorder instead. Specifically, this patient’s laboratory values show a “left shift”—an increase in immature neutrophils, ie, blasts, myelocytes, and bands.
This picture is characteristic of CML, an uncommon leukemia with about 4,500 new cases annually in the United States. Patients can present at any age, but the disease occurs more often in older people, with a median age of 66.1
The presentation is usually subtle: about half of cases are detected by routine laboratory testing, which typically reveals a left-shifted leukocytosis with basophilia and a few blasts. Mild anemia is common. The platelet count is elevated in 30% to 50% of patients at diagnosis. Bone marrow aspirate shows significant myeloid hyperplasia without dysplasia, and sometimes shows mild fibrosis.
Philadelphia chromosome is diagnostic
A definitive diagnosis is made by demonstration of an abnormally short chromosome 22. Described in 1960 by Peter Nowell of the University of Pennsylvania and David Hugerford of the Institute for Cancer Research,2 this abnormality, called the Philadelphia chromosome, was the first specific genetic abnormality associated with a human cancer. Later, researchers used banding techniques to find that the Philadelphia chromosome results from a reciprocal translocation of genetic material between the BCR gene on chromosome 22 and the ABL1 gene on chromosome 9, t(9:22).3,4 The resulting chimeric gene, called BCR-ABL, codes for an oncogenic protein, a tyrosine kinase with constitutive activity.
The Philadelphia chromosome is present in 95% of patients with CML and can be found in all myeloid cell lineages, including erythrocytes, granulocytes, monocytes, and megakaryocytes as well as some cells of lymphocytic lineage, indicating that malignant transformation to CML takes place at the stem cell level.
The mutation causes several problems: the abnormal tyrosine kinase increases cell proliferation, inhibits apoptosis, and alters adhesion molecules in the stroma of the bone marrow, allowing immature cells to leak into the bloodstream. Most important, the mutation increases genomic instability so that additional mutations are likelier to occur over time, making it inevitable that, without treatment, the disease will progress to a fatal blast crisis within an average of 5 years of diagnosis.
CML has three clinical phases
Untreated, CML progresses through three distinct phases: chronic, accelerated, and blast crisis, defined by abnormalities in the blood smear and bone marrow (Table 1).5,6 Most patients (85%) are diagnosed during the chronic phase. The accelerated and blastic phases resemble acute leukemia.
Chronic phase management
Therapies over the years have included arsenic (Fowler solution), splenic radiotherapy, busulfan, hydroxyurea, cytarabine, and interferon. All had some palliative success, but usually did not suppress leukemic progression.7
In contrast, patients undergoing allogeneic bone marrow transplant had a 5-year survival rate of 60% to 80% during the chronic phase of CML, 40% to 60% during the accelerated phase, and 10% to 20% during a blast crisis.8 Long-term survival confirmed the ability of transplant to cure CML, and bone marrow transplant with matched donors was the standard of care for younger patients until the end of the 20th century.
Tyrosine kinase inhibition
A new paradigm in treatment began with the development of imatinib, a tyrosine kinase inhibitor that directly interferes with the product of the chimeric BCR-ABL gene.9
Patients treated with imatinib during the chronic phase of CML have survival rates similar to those of people without the disease, and they usually do not progress to the accelerated and blast phases. As a result of this success, the number of transplants for CML has fallen precipitously.
Other tyrosine kinase inhibitors (dasatinib, nilotinib) that have since been developed have shown even better results in achieving remission and preventing progression. Improved survival is more difficult to demonstrate because the control groups in studies receive imatinib and have 10-year survival rates of about 90%.10–12
With the tyrosine kinase inhibitors, CML can be regarded as functionally cured.13 Patients take these drugs for life and usually experience a relapse if they stop. Patients with CML are now more likely to die of a comorbidity than of CML.
Choose therapy by tolerability
Which tyrosine kinase inhibitor to use depends more on the side-effect profile of the drug than on its efficacy. Nilotinib should be avoided in patients with vascular disease, and dasatinib avoided in patients with pulmonary disease. Each drug may be associated with some degree of nausea, diarrhea, cramps, rash, and edema.10–12
CML is not an immunosuppressive disease, nor are the drugs used to treat it. Patients with CML have an intact immune system. Therefore, precautions taken for patients with acute leukemia or lymphoid malignancy are not required for patients with CML.
Managing survivors
Since imatinib was introduced in 2000, the US Food and Drug Administration (FDA) has approved approximately 20 tyrosine kinase inhibitors for various cancers. These drugs are improving survival rates so well that patients with cancer are increasingly being seen by their primary care doctors for their medical problems.
Some problems have emerged that are consequences of this successful therapy. Angiogenesis inhibitors such as bevacizumab affect vascular endothelial growth factors, which injure endothelial cells. These effects may result in high blood pressure and arterial occlusive disease. Algorithms have been proposed for managing cardiovascular complications for patients taking tyrosine kinase inhibitors.14 Further, cardiovascular risk factors such as hyperlipidemia, diabetes, and obesity must be aggressively managed in patients taking tyrosine kinase inhibitors.
Vascular effects, rashes, and drug interactions may best be managed by primary care physicians, cardiologists, and nephrologists, who deal with such problems regularly.
CHRONIC LYMPHOCYTIC LEUKEMIA
A patient undergoes routine laboratory blood work in the emergency department or clinic, with these results:
- White blood cell count 250 × 109/L
- Neutrophils 1%
- Lymphocytes 99%
- Hemoglobin 12.1 g/dL
- Platelet count 160 × 109/L.
Like patients with CML, those with CLL usually present with no symptoms. The complete blood cell count reveals numerous white blood cells and lymphocytosis. Patients may have painless lymphadenopathy, anemia, and thrombocytopenia, but they do not typically have fever, sweats, or weight loss.
The disease is characterized by clonal proliferation and accumulation of mature-appearing neoplastic B lymphocytes in the blood, bone marrow, lymph nodes, and spleen. The peripheral blood smear shows “smudge cells,” indicating fragile lymphocytes.
The median age at diagnosis is about 70, with fewer than 15% of newly diagnosed patients under age 50.
CLL is the most common leukemia in the Western world, accounting for about 30% of cases of leukemia in adults. It is rare in Asians, probably because of genetic differences.
Monoclonal B-cell lymphocytosis precedes CLL
Monoclonal B-cell lymphocytosis is related to CLL and always precedes it. It is a common condition, detectable in up to 5% of older adults. The differential count shows a less severe lymphocytosis than in CLL.
Because monoclonal B-cell lymphocytosis does not always convert to leukemia, it is important for insurance coverage purposes not to diagnose it as a leukemia. Treatment-free survival of patients diagnosed with monoclonal B-cell lymphocytosis is 87% at 5 years.15,16
Diagnosing CLL
Lymphocytosis can indicate other low-grade lymphoproliferative diseases and malignancies, so further evaluation is critical. To diagnose CLL, the B-cell count by flow cytometry (not the absolute lymphocyte count from the complete blood cell count) must be at least 5 × 10⁹/L. Below that threshold, monoclonal B-cell lymphocytosis is diagnosed unless lymphadenopathy is present, indicating small lymphocytic lymphoma. Unlike in benign lymphoproliferations, CLL lymphocytes coexpress the B-cell marker CD19 and the T-cell marker CD5.17 Bone marrow examination is rarely needed for the diagnosis of CLL.
Two types of CLL can be defined, depending on whether the B cells carry V genes that are mutated or unmutated. B cells expressing ZAP-70 and CD38 tend to carry the unmutated gene, which is associated with a worse prognosis.18 Regardless of which type a patient has, treatments and the indications for treatment are the same.
Increasing immune dysfunction
CLL is staged according to effects on lymph tissue and hematopoiesis. The Rai system for clinical staging of CLL has been used since 1975 with little alteration (Table 2).19
CLL is often an indolent lymphoproliferative malignancy and does not always progress to a fatal end stage. Therefore, treatment may be deferred, with a watch-and-wait approach until symptoms develop or the disease progresses. Approximately half of patients never require treatment.20 Progression involves increasing bone marrow impairment with greater susceptibility to infection (due to intrinsic features of CLL and its therapy) and hypogammaglobulinemia in advanced disease.21,22 Systemic infection is the cause of death for most patients.
Because CLL is a disease of the immune system, the development of autoantibodies is a cardinal feature. Autoimmune complications are almost exclusively limited to blood and can include hemolytic anemia, pure red cell aplasia, immune-mediated thrombocytopenia, and granulocytopenia. Other autoimmune diseases, such as rheumatoid arthritis, thyroiditis, and Addison disease, are uncommon.23,24
Other complications may occur in patients who have been treated with chemotherapy, and these are usually fatal. The Richter transformation (to an aggressive lymphoma) occurs in about 15%. Other less common complications include prolymphocytoid transformation and secondary malignancies, particularly carcinomas of the lung and gastrointestinal tract and acute (myeloid) leukemia.25
Survival rates in CLL have improved substantially over the past decades,26–28 with significant gains following the introduction of antibiotics and, to a lesser extent, transfusions. Median survival is generally between 6 and 9 years, but many patients live for years without requiring therapy.
Chemotherapy: The mainstay of treatment
When to begin therapy remains one of the most challenging issues of patient management. Unlike in CML, there is no advantage to starting at diagnosis when most patients are asymptomatic.29
In 1996, the National Cancer Institute issued guidelines for starting treatment, which were updated in 2008 with very little change (Table 3).30 In general, the onset of symptoms and evidence of impaired marrow function, including an abnormal hemoglobin level and platelet count, are indications. The white blood cell count continuously increases during the disease course but is not usually an important factor for initiating treatment.
The therapeutic goal for most patients who require treatment has historically been palliation of symptoms. Therapy must be individualized to a patient’s age and clinical status, with a heavier reliance on chemotherapeutic agents for patients who can tolerate it and on immunotherapy for others. General strategies are as follows:
- “Go-Go” patients—young, fit, with few comorbidities, good renal function—are the minority. Recommendation: combination chemotherapy with fludarabine, cyclophosphamide, and rituximab (FCR).
- “Slo-Go” patients are reasonably fit and can tolerate chemotherapy but not FCR. Recommendation: combination therapy with either bendamustine and rituximab or chlorambucil and rituximab (for less fit patients). Recent evidence indicates ibrutinib may be useful for such patients.31
- “No-Go” patients are frail with short life expectancy. Recommendation: rituximab or observation (see below)
All CLL treatments are potentially toxic. Chemotherapy damages DNA and often causes blood cell counts to fall. Immunosuppression worsens with almost any treatment, involving a substantial risk of secondary malignancy. Although survival improves with therapy, relapse is universal.
Targeting CLL pathways
The new paradigm for cancer therapy is to identify a cellular pathway that drives oncogenesis or proliferation and interfere with it. The B-cell receptor pathway is enormously complex with numerous complex factors, making it difficult to discern the critical mutation that drives the proliferation of lymphocytes.
Bruton tyrosine kinase (Btk) is one factor that is critical for CLL proliferation. Patients with congenitally mutated or dysfunctional Btk have lymphopenia and agammaglobulinemia, making it a promising target for patients with B-cell disorders. Other experimental therapies are based on other such identified factors.
In 2014, the FDA approved two drugs for CLL—ibrutinib, a Btk inhibitor, and idelalisib, an inhibitor of phosphoinositide 3-kinase—after they were shown in clinical trials to dramatically improve outcomes in patients with relapsed CLL.32,33 Trials with these drugs are ongoing. These drugs also inhibit tyrosine kinase and so have vascular side effects in addition to their own idiosyncratic effects.
Ibrutinib has anticoagulant effects and should be stopped before surgery. It also can cause or exacerbate atrial fibrillation, making management of CLL difficult. It is associated with hypogammaglobulinemia, often requiring ongoing immunoglobulin replacement.
Idelalisib tends to cause systemic autoimmune phenomena such as pneumonitis and colitis.
Using T cells as therapy
It has long been observed that patients who undergo bone marrow transplant for leukemia have lower relapse rates if the transplant is allogeneic rather than from a twin. Further, if T cells are removed from the donor graft, graft-vs-host disease may be prevented but the risk of relapses increases. Finally, the presence of graft-vs-host disease tends to reduce the risk of relapse.34 Therefore, T cells clearly are key ingredients for success in the setting of bone marrow transplant. In fact, merely providing T cells for a relapse after allogeneic transplant can induce remission. However, because donor T cells are not targeted, acute and chronic graft-vs-host disease often can ensue.
‘Designer’ monoclonal antibodies
The B lymphocyte has multiple potential targets for new therapies for CLL as well as other cancers involving B cells. CD20 was identified on the surface of B cells in 1988 and is the target protein of the monoclonal antibody drug rituximab. Monoclonal antibodies can be modified to target other surface antigens, to link radioisotopes to deliver radiation therapy, and to deliver drugs that would otherwise be too toxic to be given systemically.35 Monoclonal antibodies can also be modified to enhance function.
Antibodies alone, however, must often rely on the host T cells for cytotoxicity and they are often compromised by either the underlying disease or treatment. Adapting the targeting function of antibodies to enhance or genetically alter T cells to recognize cancer-specific antigens is now being explored for leukemias.36
In 2014, the FDA approved blinatumomab for the treatment of relapsed or refractory acute lymphoblastic leukemia. This biopharmaceutical agent recruits T cells with one antibody-like moiety and targets the CD19 receptor of B cells with another. Given as a single intravenous treatment without chemotherapy, it has an almost 50% response rate, and those who respond tend to stay in remission. Other similar drugs are being developed, and using them earlier in treatment and for other B-cell leukemias is being explored.
New B-cell targeted therapy with CAR-Ts
Newer treatments are being developed based on chimeric antigen receptor T (CAR-T) cells. These engineered T cells express an anti-CD19 moiety that targets B cells, but also activate upon binding to them.37 CAR-T technology is being refined and shows great promise for cancer treatment.
Multiple clinical trials are currently under way in which the investigators collect autologous T cells by leukopheresis from a patient with a relapsed or refractory B-cell malignancy, transduce the T cells with retroviral vectors into anti-CD19 CAR-T cells, and then reinfuse them into the patient following modest chemotherapy.38
Study results from a small number of patients with relapsing or refractory CLL showed that some patients achieved long-term, progression-free survival.39 The most success with this therapy, however, has been in acute lymphoblastic leukemia.40 Possibly, this treatment could be applied to other lymphoid malignancies that also express CD19.
More advances
CAR-T cell therapy has drawbacks. The cells attack only the target antigen, which currently limits their use mostly to hematologic malignancies. In addition, autologous T cells are not robust. Also, the use of allogeneic T cells is restricted by their major histocompatibility complex, and the cells will be rejected by the recipient if not matched.
An attempt to overcome some of these drawbacks is to develop T cells redirected for universal cytokine killing. CAR-T cells are modified with a gene that causes them to excrete interleukin 12, which attracts macrophages and natural killer cells to the environment to better fight the tumor.41
Other modifications include editing out certain genes including the major histocompatibility complex, which avoids the problem of rejection. Another modification is to insert a “suicide gene” that allows the engineered T cells to be killed with an antidote if they do not work as planned.
Such gene-editing techniques hold great promise for curing cancers without chemotherapy in the not so distant future.
- National Cancer Institute Surveillance, Epidemiology, and End Results Program. SEER Stat Fact Sheets: Chronic Myeloid Leukemia. http://seer.cancer.gov/statfacts/html/cmyl.html. Accessed July 1, 2016.
- Nowell PC, Hungerford DA. A minute chromosome in human chronic granulocytic leukemia. Science 1960; 132:1497.
- Melo JV. The diversity of BCR-ABL fusion proteins and their relationship to leukemia phenotype. Blood 1996; 88:2375–2384.
- Pasternak G, Hochhaus A, Schultheis B, Hehlmann R. Chronic myelogenous leukemia: molecular and cellular aspects. J Cancer Res Clin Oncol 1998; 124:643–660.
- Faderl S, Kantarjian HM, Talpaz M. Chronic myelogenous leukemia: update on biology and treatment. Oncology (Williston Park) 1999; 13:169–184.
- Sawyers CL. Chronic myeloid leukemia. N Engl J Med 1999; 340:1330–1340.
- Hehlmann R, Heimpel H, Hasford J, et al. Randomized comparison of interferon-alpha with busulfan and hydroxyurea in chronic myelogenous leukemia. The German CML Study Group. Blood 1994; 84:4064–4077.
- Radich JP, Olavarria E, Apperley JF. Allogeneic hematopoietic stem cell transplantation for chronic myeloid leukemia. Hematol Oncol Clin North Am 2004; 18:685–702.
- Druker BJ. Translation of the Philadelphia chromosome into therapy for CML. Blood 2008; 112:4808–4817.
- O’Brien SG, Guilhot F, Larson RA, et al; IRIS Investigators. Imatinib compared with interferon and low-dose cytarabine for newly diagnosed chronic-phase chronic myeloid leukemia. N Engl J Med 2003; 348:994-1004.
- Kantarjian H, Shah NP, Hochhaus A, et al. Dasatinib versus imatinib in newly diagnosed chronic-phase chronic myeloid leukemia. N Engl J Med 2010; 362:2260–2270.
- Saglio G, Kim DW, Issaragrisil S, et al; ENESTnd Investigators. Nilotinib versus imatinib for newly diagnosed chronic myeloid leukemia. N Engl J Med 2010; 362:2251–2259.
- Pfirrmann M, Baccarani M, Saussele S, et al. Prognosis of long-term survival considering disease-specific death in patients with chronic myeloid leukemia. Leukemia 2016; 30:48-56.
- Li W, Croce K, Steensma DP, McDermott DF, Ben-Yehuda O, Moslehi J. Vascular and metabolic implications of novel targeted cancer therapies: focus on kinase inhibitors. J Am Coll Cardiol 2015; 66:1160–1178.
- Rawstron AC, Bennett F, Hillmen P. The biological and clinical relationship between CD5+23+ monoclonal B-cell lymphocytosis and chronic lymphocytic leukaemia. Br J Haematol 2007; 139:724–729.
- Rawstron AC, Bennett FL, O’Connor SJ, et al. Monoclonal B-cell lymphocytosis and chronic lymphocytic leukemia. N Engl J Med 2008; 359:575–583.
- Hallek M, Cheson BD, Catovsky D, et al; International Workshop on Chronic Lymphocytic Leukemia. Guidelines for the diagnosis and treatment of chronic lymphocytic leukemia: a report from the International Workshop on Chronic Lymphocytic Leukemia updating the National Cancer Institute-Working Group 1996 guidelines. Blood 2008; 111:5446–5456.
- Chiorazzi N, Rai KR, Ferrarini M. Chronic lymphocytic leukemia. N Engl J Med 2005; 352:804–815.
- Rai KR, Sawitsky A, Cronkite EP, Chanana AD, Levy RN, Pasternack BS. Clinical staging of chronic lymphocytic leukemia. Blood 1975; 46:219–234.
- Dierlamm J, Michaux L, Criel A, Wlodarska I, Van den Berghe H, Hossfeld DK. Genetic abnormalities in chronic lymphocytic leukemia and their clinical and prognostic implications. Cancer Genet Cytogenet 1997; 94:27–35.
- Rozman C, Montserrat E. Chronic lymphocytic leukemia. N Engl J Med 1995; 333:1052–1057. Erratum in: N Engl J Med 1995; 333:1515.
- Jemal A, Thomas A, Murray T, Thun M. Cancer statistics, 2002. CA Cancer J Clin 2002; 52:23-47. Errata in: CA Cancer J Clin 2002; 52:119. CA Cancer J Clin 2002; 52:181–182.
- Caligaris-Cappio F, Hamblin TJ. B-cell chronic lymphocytic leukemia: a bird of a different feather. J Clin Oncol 1999; 17:399–408.
- Keating MJ. Chronic lymphocytic leukemia. Semin Oncol 1999; 26(suppl 14):107–114.
- Kalil N, Cheson BD. Management of chronic lymphocytic leukaemia. Drugs Aging 2000; 16:9–27.
- Minot GR, Buckman TE, Isaacs R. Chronic myelogenous leukemia: age incidence, duration, and benefit derived from irradiation. JAMA 1924; 82:1489–1494.
- Reinhard EH, Neely CL, Samples DM. Radioactive phosphorus in the treatment of chronic leukemias: long-term results over a period of 15 years. Cancer 1959; 50:942–958.
- Diehl LF, Karnell LH, Menck HR. The American College of Surgeons Commission on Cancer and the American Cancer Society. The National Cancer Data Base report on age, gender, treatment, and outcomes of patients with chronic lymphocytic leukemia. Cancer 1999; 86:2684–2692.
- Chemotherapeutic options in chronic lymphocytic leukemia: a meta-analysis of the randomized trials. CLL Trialists’ Collaborative Group. J Natl Cancer Inst 1999; 91:861–868.
- Cheson BD, Bennett JM, Grever M, et al. National Cancer Institute-sponsored working group guidelines for chronic lymphocytic leukemia: revised guidelines for diagnosis and treatment. Blood 1996; 87:4990–4997.
- Burger JA, Tedeschi A, Barr PM, et al; RESONATE-2 Investigators. Ibrutinib as initial therapy for patients with chronic lymphocytic leukemia. N Engl J Med 2015; 373:2425–2437.
- Byrd JC, Brown JR, O’Brien S, et al; RESONATE Investigators. Ibrutinib versus ofatumumab in previously treated chronic lymphoid leukemia. N Engl J Med 2014; 371:213–223.
- Furman RR, Sharman JP, Coutre SE, et al. Idelalisib and rituximab in relapsed chronic lymphocytic leukemia. N Engl J Med 2014; 370:997–1007.
- Horowitz MM, Gale RP, Sondel PM, et al. Graft-versus-leukemia reactions after bone marrow transplantation. Blood 1990; 75:555–562.
- Weiner GJ. Building better monoclonal antibody-based therapeutics. Nat Rev Cancer 2015; 15:361–370.
- Kershaw MH, Westwood JA, Darcy PK. Gene-engineered T cells for cancer therapy. Nat Rev Cancer 2013; 13:525–541.
- Urba WJ, Longo DL. Redirecting T cells. N Engl J Med 2011; 365:754–757.
- Klebanoff CA, Yamamoto TN, Restifo NP. Immunotherapy: treatment of aggressive lymphomas with anti-CD19 CAR T cells. Nat Rev Clin Oncol 2014; 11:685-686.
- Porter DL, Hwang WT, Frey NV, et al. Chimeric antigen receptor T cells persist and induce sustained remissions in relapsed refractory chronic lymphocytic leukemia. Sci Transl Med 2015; 7:303ra139.
- Lee DW, Kochenderfer JN, Stetler-Stevenson M, et al. T cells expressing CD19 chimeric antigen receptors for acute lymphoblastic leukaemia in children and young adults: a phase 1 dose-escalation trial. Lancet 2015; 385:517–528.
- Chmielewski M, Hombach AA, Abken H. Of CARs and TRUCKs: chimeric antigen receptor (CAR) T cells engineered with an inducible cytokine to modulate the tumor stroma. Immunol Rev 2014; 257:83–90.
The advent of targeted therapies has dramatically changed the management of chronic leukemia. Chemotherapy—highly toxic, nonspecific drugs that can be dangerous to patients and providers and result in only modest success—is gradually being replaced by biologic targeting of malignancy. Scientists are rapidly identifying extracellular and intracellular targets on tumor cells and are developing and testing promising new therapies aimed at these targets. Survival of cancer patients has become so common that clinicians outside the specialties of hematology and oncology are now caring for them.
This article describes new biologic therapies for chronic myelogenous leukemia (CML) and chronic lymphocytic leukemia (CLL), along with the diagnosis of these diseases and management of survivors in the primary care setting.
CHRONIC MYELOGENOUS LEUKEMIA
A seemingly healthy person needs laboratory blood work, perhaps for an insurance physical examination or for a preoperative workup. Or a patient comes to the emergency department with a sore throat and routine blood tests are ordered. Their laboratory values:
- White blood cell count 250 × 109/L (reference range 3–11)
- Neutrophils 70% (40%–70%)
- Blasts 1% (0)
- Metacytes and myelocytes 5% (0)
- Bands 5% (0)
- Lymphocytes 10% (22%–40%)
- Monocytes 5% (0–7%)
- Basophils 3% (0–1%)
- Eosinophils 1% (0–4%)
- Hemoglobin 12.1 g/dL (11.5–15.5 in women, 13.0–17.0 in men)
- Platelet count 525 × 109/L (150–400).
Leukocytosis and a ‘left shift’
Although this scenario often raises concern for acute leukemia, a careful look shows evidence of a chronic myeloproliferative disorder instead. Specifically, this patient’s laboratory values show a “left shift”—an increase in immature neutrophils, ie, blasts, myelocytes, and bands.
This picture is characteristic of CML, an uncommon leukemia with about 4,500 new cases annually in the United States. Patients can present at any age, but the disease occurs more often in older people, with a median age of 66.1
The presentation is usually subtle: about half of cases are detected by routine laboratory testing, which typically reveals a left-shifted leukocytosis with basophilia and a few blasts. Mild anemia is common. The platelet count is elevated in 30% to 50% of patients at diagnosis. Bone marrow aspirate shows significant myeloid hyperplasia without dysplasia, and sometimes shows mild fibrosis.
Philadelphia chromosome is diagnostic
A definitive diagnosis is made by demonstration of an abnormally short chromosome 22. Described in 1960 by Peter Nowell of the University of Pennsylvania and David Hugerford of the Institute for Cancer Research,2 this abnormality, called the Philadelphia chromosome, was the first specific genetic abnormality associated with a human cancer. Later, researchers used banding techniques to find that the Philadelphia chromosome results from a reciprocal translocation of genetic material between the BCR gene on chromosome 22 and the ABL1 gene on chromosome 9, t(9:22).3,4 The resulting chimeric gene, called BCR-ABL, codes for an oncogenic protein, a tyrosine kinase with constitutive activity.
The Philadelphia chromosome is present in 95% of patients with CML and can be found in all myeloid cell lineages, including erythrocytes, granulocytes, monocytes, and megakaryocytes as well as some cells of lymphocytic lineage, indicating that malignant transformation to CML takes place at the stem cell level.
The mutation causes several problems: the abnormal tyrosine kinase increases cell proliferation, inhibits apoptosis, and alters adhesion molecules in the stroma of the bone marrow, allowing immature cells to leak into the bloodstream. Most important, the mutation increases genomic instability so that additional mutations are likelier to occur over time, making it inevitable that, without treatment, the disease will progress to a fatal blast crisis within an average of 5 years of diagnosis.
CML has three clinical phases
Untreated, CML progresses through three distinct phases: chronic, accelerated, and blast crisis, defined by abnormalities in the blood smear and bone marrow (Table 1).5,6 Most patients (85%) are diagnosed during the chronic phase. The accelerated and blastic phases resemble acute leukemia.
Chronic phase management
Therapies over the years have included arsenic (Fowler solution), splenic radiotherapy, busulfan, hydroxyurea, cytarabine, and interferon. All had some palliative success, but usually did not suppress leukemic progression.7
In contrast, patients undergoing allogeneic bone marrow transplant had a 5-year survival rate of 60% to 80% during the chronic phase of CML, 40% to 60% during the accelerated phase, and 10% to 20% during a blast crisis.8 Long-term survival confirmed the ability of transplant to cure CML, and bone marrow transplant with matched donors was the standard of care for younger patients until the end of the 20th century.
Tyrosine kinase inhibition
A new paradigm in treatment began with the development of imatinib, a tyrosine kinase inhibitor that directly interferes with the product of the chimeric BCR-ABL gene.9
Patients treated with imatinib during the chronic phase of CML have survival rates similar to those of people without the disease, and they usually do not progress to the accelerated and blast phases. As a result of this success, the number of transplants for CML has fallen precipitously.
Other tyrosine kinase inhibitors (dasatinib, nilotinib) that have since been developed have shown even better results in achieving remission and preventing progression. Improved survival is more difficult to demonstrate because the control groups in studies receive imatinib and have 10-year survival rates of about 90%.10–12
With the tyrosine kinase inhibitors, CML can be regarded as functionally cured.13 Patients take these drugs for life and usually experience a relapse if they stop. Patients with CML are now more likely to die of a comorbidity than of CML.
Choose therapy by tolerability
Which tyrosine kinase inhibitor to use depends more on the side-effect profile of the drug than on its efficacy. Nilotinib should be avoided in patients with vascular disease, and dasatinib avoided in patients with pulmonary disease. Each drug may be associated with some degree of nausea, diarrhea, cramps, rash, and edema.10–12
CML is not an immunosuppressive disease, nor are the drugs used to treat it. Patients with CML have an intact immune system. Therefore, precautions taken for patients with acute leukemia or lymphoid malignancy are not required for patients with CML.
Managing survivors
Since imatinib was introduced in 2000, the US Food and Drug Administration (FDA) has approved approximately 20 tyrosine kinase inhibitors for various cancers. These drugs are improving survival rates so well that patients with cancer are increasingly being seen by their primary care doctors for their medical problems.
Some problems have emerged that are consequences of this successful therapy. Angiogenesis inhibitors such as bevacizumab affect vascular endothelial growth factors, which injure endothelial cells. These effects may result in high blood pressure and arterial occlusive disease. Algorithms have been proposed for managing cardiovascular complications for patients taking tyrosine kinase inhibitors.14 Further, cardiovascular risk factors such as hyperlipidemia, diabetes, and obesity must be aggressively managed in patients taking tyrosine kinase inhibitors.
Vascular effects, rashes, and drug interactions may best be managed by primary care physicians, cardiologists, and nephrologists, who deal with such problems regularly.
CHRONIC LYMPHOCYTIC LEUKEMIA
A patient undergoes routine laboratory blood work in the emergency department or clinic, with these results:
- White blood cell count 250 × 109/L
- Neutrophils 1%
- Lymphocytes 99%
- Hemoglobin 12.1 g/dL
- Platelet count 160 × 109/L.
Like patients with CML, those with CLL usually present with no symptoms. The complete blood cell count reveals numerous white blood cells and lymphocytosis. Patients may have painless lymphadenopathy, anemia, and thrombocytopenia, but they do not typically have fever, sweats, or weight loss.
The disease is characterized by clonal proliferation and accumulation of mature-appearing neoplastic B lymphocytes in the blood, bone marrow, lymph nodes, and spleen. The peripheral blood smear shows “smudge cells,” indicating fragile lymphocytes.
The median age at diagnosis is about 70, with fewer than 15% of newly diagnosed patients under age 50.
CLL is the most common leukemia in the Western world, accounting for about 30% of cases of leukemia in adults. It is rare in Asians, probably because of genetic differences.
Monoclonal B-cell lymphocytosis precedes CLL
Monoclonal B-cell lymphocytosis is related to CLL and always precedes it. It is a common condition, detectable in up to 5% of older adults. The differential count shows a less severe lymphocytosis than in CLL.
Because monoclonal B-cell lymphocytosis does not always convert to leukemia, it is important for insurance coverage purposes not to diagnose it as a leukemia. Treatment-free survival of patients diagnosed with monoclonal B-cell lymphocytosis is 87% at 5 years.15,16
Diagnosing CLL
Lymphocytosis can indicate other low-grade lymphoproliferative diseases and malignancies, so further evaluation is critical. To diagnose CLL, the B-cell count by flow cytometry (not the absolute lymphocyte count from the complete blood cell count) must be at least 5 × 10⁹/L. Below that threshold, monoclonal B-cell lymphocytosis is diagnosed unless lymphadenopathy is present, indicating small lymphocytic lymphoma. Unlike in benign lymphoproliferations, CLL lymphocytes coexpress the B-cell marker CD19 and the T-cell marker CD5.17 Bone marrow examination is rarely needed for the diagnosis of CLL.
Two types of CLL can be defined, depending on whether the B cells carry V genes that are mutated or unmutated. B cells expressing ZAP-70 and CD38 tend to carry the unmutated gene, which is associated with a worse prognosis.18 Regardless of which type a patient has, treatments and the indications for treatment are the same.
Increasing immune dysfunction
CLL is staged according to effects on lymph tissue and hematopoiesis. The Rai system for clinical staging of CLL has been used since 1975 with little alteration (Table 2).19
CLL is often an indolent lymphoproliferative malignancy and does not always progress to a fatal end stage. Therefore, treatment may be deferred, with a watch-and-wait approach until symptoms develop or the disease progresses. Approximately half of patients never require treatment.20 Progression involves increasing bone marrow impairment with greater susceptibility to infection (due to intrinsic features of CLL and its therapy) and hypogammaglobulinemia in advanced disease.21,22 Systemic infection is the cause of death for most patients.
Because CLL is a disease of the immune system, the development of autoantibodies is a cardinal feature. Autoimmune complications are almost exclusively limited to blood and can include hemolytic anemia, pure red cell aplasia, immune-mediated thrombocytopenia, and granulocytopenia. Other autoimmune diseases, such as rheumatoid arthritis, thyroiditis, and Addison disease, are uncommon.23,24
Other complications may occur in patients who have been treated with chemotherapy, and these are usually fatal. The Richter transformation (to an aggressive lymphoma) occurs in about 15%. Other less common complications include prolymphocytoid transformation and secondary malignancies, particularly carcinomas of the lung and gastrointestinal tract and acute (myeloid) leukemia.25
Survival rates in CLL have improved substantially over the past decades,26–28 with significant gains following the introduction of antibiotics and, to a lesser extent, transfusions. Median survival is generally between 6 and 9 years, but many patients live for years without requiring therapy.
Chemotherapy: The mainstay of treatment
When to begin therapy remains one of the most challenging issues of patient management. Unlike in CML, there is no advantage to starting at diagnosis when most patients are asymptomatic.29
In 1996, the National Cancer Institute issued guidelines for starting treatment, which were updated in 2008 with very little change (Table 3).30 In general, the onset of symptoms and evidence of impaired marrow function, including an abnormal hemoglobin level and platelet count, are indications. The white blood cell count continuously increases during the disease course but is not usually an important factor for initiating treatment.
The therapeutic goal for most patients who require treatment has historically been palliation of symptoms. Therapy must be individualized to a patient’s age and clinical status, with a heavier reliance on chemotherapeutic agents for patients who can tolerate it and on immunotherapy for others. General strategies are as follows:
- “Go-Go” patients—young, fit, with few comorbidities, good renal function—are the minority. Recommendation: combination chemotherapy with fludarabine, cyclophosphamide, and rituximab (FCR).
- “Slo-Go” patients are reasonably fit and can tolerate chemotherapy but not FCR. Recommendation: combination therapy with either bendamustine and rituximab or chlorambucil and rituximab (for less fit patients). Recent evidence indicates ibrutinib may be useful for such patients.31
- “No-Go” patients are frail with short life expectancy. Recommendation: rituximab or observation (see below)
All CLL treatments are potentially toxic. Chemotherapy damages DNA and often causes blood cell counts to fall. Immunosuppression worsens with almost any treatment, involving a substantial risk of secondary malignancy. Although survival improves with therapy, relapse is universal.
Targeting CLL pathways
The new paradigm for cancer therapy is to identify a cellular pathway that drives oncogenesis or proliferation and interfere with it. The B-cell receptor pathway is enormously complex with numerous complex factors, making it difficult to discern the critical mutation that drives the proliferation of lymphocytes.
Bruton tyrosine kinase (Btk) is one factor that is critical for CLL proliferation. Patients with congenitally mutated or dysfunctional Btk have lymphopenia and agammaglobulinemia, making it a promising target for patients with B-cell disorders. Other experimental therapies are based on other such identified factors.
In 2014, the FDA approved two drugs for CLL—ibrutinib, a Btk inhibitor, and idelalisib, an inhibitor of phosphoinositide 3-kinase—after they were shown in clinical trials to dramatically improve outcomes in patients with relapsed CLL.32,33 Trials with these drugs are ongoing. These drugs also inhibit tyrosine kinase and so have vascular side effects in addition to their own idiosyncratic effects.
Ibrutinib has anticoagulant effects and should be stopped before surgery. It also can cause or exacerbate atrial fibrillation, making management of CLL difficult. It is associated with hypogammaglobulinemia, often requiring ongoing immunoglobulin replacement.
Idelalisib tends to cause systemic autoimmune phenomena such as pneumonitis and colitis.
Using T cells as therapy
It has long been observed that patients who undergo bone marrow transplant for leukemia have lower relapse rates if the transplant is allogeneic rather than from a twin. Further, if T cells are removed from the donor graft, graft-vs-host disease may be prevented but the risk of relapses increases. Finally, the presence of graft-vs-host disease tends to reduce the risk of relapse.34 Therefore, T cells clearly are key ingredients for success in the setting of bone marrow transplant. In fact, merely providing T cells for a relapse after allogeneic transplant can induce remission. However, because donor T cells are not targeted, acute and chronic graft-vs-host disease often can ensue.
‘Designer’ monoclonal antibodies
The B lymphocyte has multiple potential targets for new therapies for CLL as well as other cancers involving B cells. CD20 was identified on the surface of B cells in 1988 and is the target protein of the monoclonal antibody drug rituximab. Monoclonal antibodies can be modified to target other surface antigens, to link radioisotopes to deliver radiation therapy, and to deliver drugs that would otherwise be too toxic to be given systemically.35 Monoclonal antibodies can also be modified to enhance function.
Antibodies alone, however, must often rely on the host T cells for cytotoxicity and they are often compromised by either the underlying disease or treatment. Adapting the targeting function of antibodies to enhance or genetically alter T cells to recognize cancer-specific antigens is now being explored for leukemias.36
In 2014, the FDA approved blinatumomab for the treatment of relapsed or refractory acute lymphoblastic leukemia. This biopharmaceutical agent recruits T cells with one antibody-like moiety and targets the CD19 receptor of B cells with another. Given as a single intravenous treatment without chemotherapy, it has an almost 50% response rate, and those who respond tend to stay in remission. Other similar drugs are being developed, and using them earlier in treatment and for other B-cell leukemias is being explored.
New B-cell targeted therapy with CAR-Ts
Newer treatments are being developed based on chimeric antigen receptor T (CAR-T) cells. These engineered T cells express an anti-CD19 moiety that targets B cells, but also activate upon binding to them.37 CAR-T technology is being refined and shows great promise for cancer treatment.
Multiple clinical trials are currently under way in which the investigators collect autologous T cells by leukopheresis from a patient with a relapsed or refractory B-cell malignancy, transduce the T cells with retroviral vectors into anti-CD19 CAR-T cells, and then reinfuse them into the patient following modest chemotherapy.38
Study results from a small number of patients with relapsing or refractory CLL showed that some patients achieved long-term, progression-free survival.39 The most success with this therapy, however, has been in acute lymphoblastic leukemia.40 Possibly, this treatment could be applied to other lymphoid malignancies that also express CD19.
More advances
CAR-T cell therapy has drawbacks. The cells attack only the target antigen, which currently limits their use mostly to hematologic malignancies. In addition, autologous T cells are not robust. Also, the use of allogeneic T cells is restricted by their major histocompatibility complex, and the cells will be rejected by the recipient if not matched.
An attempt to overcome some of these drawbacks is to develop T cells redirected for universal cytokine killing. CAR-T cells are modified with a gene that causes them to excrete interleukin 12, which attracts macrophages and natural killer cells to the environment to better fight the tumor.41
Other modifications include editing out certain genes including the major histocompatibility complex, which avoids the problem of rejection. Another modification is to insert a “suicide gene” that allows the engineered T cells to be killed with an antidote if they do not work as planned.
Such gene-editing techniques hold great promise for curing cancers without chemotherapy in the not so distant future.
- National Cancer Institute Surveillance, Epidemiology, and End Results Program. SEER Stat Fact Sheets: Chronic Myeloid Leukemia. http://seer.cancer.gov/statfacts/html/cmyl.html. Accessed July 1, 2016.
- Nowell PC, Hungerford DA. A minute chromosome in human chronic granulocytic leukemia. Science 1960; 132:1497.
- Melo JV. The diversity of BCR-ABL fusion proteins and their relationship to leukemia phenotype. Blood 1996; 88:2375–2384.
- Pasternak G, Hochhaus A, Schultheis B, Hehlmann R. Chronic myelogenous leukemia: molecular and cellular aspects. J Cancer Res Clin Oncol 1998; 124:643–660.
- Faderl S, Kantarjian HM, Talpaz M. Chronic myelogenous leukemia: update on biology and treatment. Oncology (Williston Park) 1999; 13:169–184.
- Sawyers CL. Chronic myeloid leukemia. N Engl J Med 1999; 340:1330–1340.
- Hehlmann R, Heimpel H, Hasford J, et al. Randomized comparison of interferon-alpha with busulfan and hydroxyurea in chronic myelogenous leukemia. The German CML Study Group. Blood 1994; 84:4064–4077.
- Radich JP, Olavarria E, Apperley JF. Allogeneic hematopoietic stem cell transplantation for chronic myeloid leukemia. Hematol Oncol Clin North Am 2004; 18:685–702.
- Druker BJ. Translation of the Philadelphia chromosome into therapy for CML. Blood 2008; 112:4808–4817.
- O’Brien SG, Guilhot F, Larson RA, et al; IRIS Investigators. Imatinib compared with interferon and low-dose cytarabine for newly diagnosed chronic-phase chronic myeloid leukemia. N Engl J Med 2003; 348:994-1004.
- Kantarjian H, Shah NP, Hochhaus A, et al. Dasatinib versus imatinib in newly diagnosed chronic-phase chronic myeloid leukemia. N Engl J Med 2010; 362:2260–2270.
- Saglio G, Kim DW, Issaragrisil S, et al; ENESTnd Investigators. Nilotinib versus imatinib for newly diagnosed chronic myeloid leukemia. N Engl J Med 2010; 362:2251–2259.
- Pfirrmann M, Baccarani M, Saussele S, et al. Prognosis of long-term survival considering disease-specific death in patients with chronic myeloid leukemia. Leukemia 2016; 30:48-56.
- Li W, Croce K, Steensma DP, McDermott DF, Ben-Yehuda O, Moslehi J. Vascular and metabolic implications of novel targeted cancer therapies: focus on kinase inhibitors. J Am Coll Cardiol 2015; 66:1160–1178.
- Rawstron AC, Bennett F, Hillmen P. The biological and clinical relationship between CD5+23+ monoclonal B-cell lymphocytosis and chronic lymphocytic leukaemia. Br J Haematol 2007; 139:724–729.
- Rawstron AC, Bennett FL, O’Connor SJ, et al. Monoclonal B-cell lymphocytosis and chronic lymphocytic leukemia. N Engl J Med 2008; 359:575–583.
- Hallek M, Cheson BD, Catovsky D, et al; International Workshop on Chronic Lymphocytic Leukemia. Guidelines for the diagnosis and treatment of chronic lymphocytic leukemia: a report from the International Workshop on Chronic Lymphocytic Leukemia updating the National Cancer Institute-Working Group 1996 guidelines. Blood 2008; 111:5446–5456.
- Chiorazzi N, Rai KR, Ferrarini M. Chronic lymphocytic leukemia. N Engl J Med 2005; 352:804–815.
- Rai KR, Sawitsky A, Cronkite EP, Chanana AD, Levy RN, Pasternack BS. Clinical staging of chronic lymphocytic leukemia. Blood 1975; 46:219–234.
- Dierlamm J, Michaux L, Criel A, Wlodarska I, Van den Berghe H, Hossfeld DK. Genetic abnormalities in chronic lymphocytic leukemia and their clinical and prognostic implications. Cancer Genet Cytogenet 1997; 94:27–35.
- Rozman C, Montserrat E. Chronic lymphocytic leukemia. N Engl J Med 1995; 333:1052–1057. Erratum in: N Engl J Med 1995; 333:1515.
- Jemal A, Thomas A, Murray T, Thun M. Cancer statistics, 2002. CA Cancer J Clin 2002; 52:23-47. Errata in: CA Cancer J Clin 2002; 52:119. CA Cancer J Clin 2002; 52:181–182.
- Caligaris-Cappio F, Hamblin TJ. B-cell chronic lymphocytic leukemia: a bird of a different feather. J Clin Oncol 1999; 17:399–408.
- Keating MJ. Chronic lymphocytic leukemia. Semin Oncol 1999; 26(suppl 14):107–114.
- Kalil N, Cheson BD. Management of chronic lymphocytic leukaemia. Drugs Aging 2000; 16:9–27.
- Minot GR, Buckman TE, Isaacs R. Chronic myelogenous leukemia: age incidence, duration, and benefit derived from irradiation. JAMA 1924; 82:1489–1494.
- Reinhard EH, Neely CL, Samples DM. Radioactive phosphorus in the treatment of chronic leukemias: long-term results over a period of 15 years. Cancer 1959; 50:942–958.
- Diehl LF, Karnell LH, Menck HR. The American College of Surgeons Commission on Cancer and the American Cancer Society. The National Cancer Data Base report on age, gender, treatment, and outcomes of patients with chronic lymphocytic leukemia. Cancer 1999; 86:2684–2692.
- Chemotherapeutic options in chronic lymphocytic leukemia: a meta-analysis of the randomized trials. CLL Trialists’ Collaborative Group. J Natl Cancer Inst 1999; 91:861–868.
- Cheson BD, Bennett JM, Grever M, et al. National Cancer Institute-sponsored working group guidelines for chronic lymphocytic leukemia: revised guidelines for diagnosis and treatment. Blood 1996; 87:4990–4997.
- Burger JA, Tedeschi A, Barr PM, et al; RESONATE-2 Investigators. Ibrutinib as initial therapy for patients with chronic lymphocytic leukemia. N Engl J Med 2015; 373:2425–2437.
- Byrd JC, Brown JR, O’Brien S, et al; RESONATE Investigators. Ibrutinib versus ofatumumab in previously treated chronic lymphoid leukemia. N Engl J Med 2014; 371:213–223.
- Furman RR, Sharman JP, Coutre SE, et al. Idelalisib and rituximab in relapsed chronic lymphocytic leukemia. N Engl J Med 2014; 370:997–1007.
- Horowitz MM, Gale RP, Sondel PM, et al. Graft-versus-leukemia reactions after bone marrow transplantation. Blood 1990; 75:555–562.
- Weiner GJ. Building better monoclonal antibody-based therapeutics. Nat Rev Cancer 2015; 15:361–370.
- Kershaw MH, Westwood JA, Darcy PK. Gene-engineered T cells for cancer therapy. Nat Rev Cancer 2013; 13:525–541.
- Urba WJ, Longo DL. Redirecting T cells. N Engl J Med 2011; 365:754–757.
- Klebanoff CA, Yamamoto TN, Restifo NP. Immunotherapy: treatment of aggressive lymphomas with anti-CD19 CAR T cells. Nat Rev Clin Oncol 2014; 11:685-686.
- Porter DL, Hwang WT, Frey NV, et al. Chimeric antigen receptor T cells persist and induce sustained remissions in relapsed refractory chronic lymphocytic leukemia. Sci Transl Med 2015; 7:303ra139.
- Lee DW, Kochenderfer JN, Stetler-Stevenson M, et al. T cells expressing CD19 chimeric antigen receptors for acute lymphoblastic leukaemia in children and young adults: a phase 1 dose-escalation trial. Lancet 2015; 385:517–528.
- Chmielewski M, Hombach AA, Abken H. Of CARs and TRUCKs: chimeric antigen receptor (CAR) T cells engineered with an inducible cytokine to modulate the tumor stroma. Immunol Rev 2014; 257:83–90.
KEY POINTS
- Chronic myelogenous leukemia (CML) can now be functionally cured with tyrosine kinase inhibitors, which interfere with the product of the oncogene causing the disease.
- Patients diagnosed with CML should begin therapy immediately even if they have no symptoms.
- Tyrosine kinase inhibitors have side effects that increase cardiovascular risk.
- Chronic lymphocytic leukemia (CLL) is an immunologic disease involving clonal proliferation of B cells. Chemotherapy for CLL should begin only when symptoms or indicators of impaired marrow function reach a certain threshold.
- New treatments for CLL increase the risk of atrial fibrillation and autoimmunity.
- Experimental B-cell–targeted therapies have demonstrated encouraging results even when chemotherapy fails in CLL and other B-cell cancers.

Anticoagulation in dental surgery: Is it rude to interrupt?
When I was growing up, my mother frequently told me that it was rude to interrupt. Although she was referring to conversations, she may have been onto something bigger.
In the nearly three quarters of a century since their discovery, vitamin K antagonist anticoagulant drugs have been used by millions of patients to prevent heart attack and stroke. Before these patients undergo surgery, a decision to continue or interrupt anticoagulation must be made, weighing the risks of postsurgical hemorrhage with continuation of anticoagulation against the risks of stroke or other embolic complications with interruption of anticoagulation. Bleeding after dental surgery when anticoagulation is continued is rarely or never life-threatening. On the other hand, embolic complications of interrupting anticoagulation are almost always consequential and often lead to death or disability. Although consideration may be different for other types of surgery, there is no need to interrupt lifesaving anticoagulation for dental surgery.
EVIDENCE THAT SUPPORTS CONTINUING ANTICOAGULATION
As early as 1957, there were reports of prolonged postoperative bleeding after dental extractions in patients taking anticoagulants. But there were also reports of embolic complications in patients whose anticoagulation was interrupted for dental procedures. Since then, there has been a plethora of literature in this area.
A review published in 2000 showed that of more than 950 anticoagulated patients undergoing more than 2,400 dental surgical procedures (including simple and surgical extraction, alveoplasty, and gingival surgery), only 12 (< 1.3%) required more than local measures for hemostasis (eg, fresh-frozen plasma, vitamin K), and no patient died,1 leading to the conclusion that the bleeding risk was not significant in anticoagulated dental patients. Other studies and systematic reviews have also concluded that anticoagulation for dental procedures should not be interrupted.2,3 In a recent review of 83 studies, only 31 (0.6%) of 5,431 patients taking warfarin suffered bleeding complications requiring more than local measures for hemostasis; there were no fatalities.4
The risk of embolism
There have been many reports of embolic complications in patients whose anticoagulation was interrupted for dental procedures. A 2000 review of 575 cases in 526 patients whose anticoagulation was interrupted for dental procedures showed that 5 patients (0.9%) had a serious embolic complication, and 4 died.1 In a more recent review of 64 studies and more than 2,673 patients whose anticoagulation was interrupted for dental procedures, 22 patients (0.8%) suffered embolic complications, and 6 (0.2%) died of the complications.4 Of those with embolic complications, the interruption period was often not reported; however; the interruption ranged from 1 to 4 days. A 2003 systematic review by Dunn and Turpie found a 0.4% embolic complication rate when anticoagulation was interrupted for dental surgery.2
BLEEDING AFTER DENTAL SURGERY
Bleeding after dental surgery can occur with either anticoagulation continuation or interruption, and minor postoperative bleeding requiring additional local hemostatic methods occurs at about the same rate in anticoagulated patients as in those whose anticoagulation is interrupted.
In our recent literature review,4 about 6% of patients in whom anticoagulation was interrupted (and 7% in whom it was not interrupted) had minor bleeding requiring additional local hemostasis, and only 0.2% of patients required more than hemostatic measures (eg, vitamin K injection, plasma transfusion), the same rate found by Dunn and Turpie.2 All patients who required more than local hemostatic measures presumably made a full recovery, while at least 6 who suffered postoperative embolic complications died, and the rest may have had permanent disabilities.
Although bridging therapy with low-molecular-weight heparin can decrease the time without anticoagulation for a dental procedure to only 12 hours, it can be complicated to implement, and there appears to be no benefit in terms of the rates of bleeding or embolic complications. Of the 64 anticoagulation interruption studies,4 17 used heparin or low-molecular-weight heparin in conjunction with temporary warfarin interruption. In 210 instances of bridging therapy in 202 patients undergoing dental procedures, there were 2 embolic complications (1% of bridging cases) and 20 bleeding complications, with 3 (1.4%) requiring hemostasis beyond local measures.4
Many of the studies analyzed independently showed there was no significant difference in postoperative bleeding with:
- Anticoagulation continuation vs interruption for a few days
- Lower vs higher international normalized ratio (INR), including some over 4.0
- Surgical vs nonsurgical extraction
- Few vs many extractions.4
Some studies of anticoagulation and anticoagulation interruption for dental surgery had important limitations. Many of the anticoagulation studies excluded patients at high risk of bleeding, those with a high INR (> 4.0), and those with severe liver or kidney disease, and their exclusion could have lowered the incidence of bleeding complications. Many studies of anticoagulation interruption excluded patients at high risk of embolism, including patients with a previous embolic event and patients with an artificial heart valve, and this could have skewed the results lower for embolic complications.
WHY DO SOME CLINICIANS STILL RECOMMEND INTERRUPTION?
The choice seems clear: for dental surgery in anticoagulated patients, the small risk of a nonfatal bleeding complication in anticoagulated patients is outweighed by the small risk of a disabling or fatal embolic complication when anticoagulation is interrupted. Most authors have concluded that anticoagulation should be continued for dental surgery. Yet surveys of dentists and physicians have shown that many still recommend interrupting anticoagulation for dental surgery.5,6
Medical and dental association positions
The American Academy of Neurology7 and the American Dental Association8 recommend continuing anticoagulant medications for dental surgery. The American College of Chest Physicians also recommends continuing anticoagulation but in 2012 added an option to interrupt or decrease anticoagulation for 2 to 3 days for dental surgery.9 Their recommendation was based partly on the results of four controlled prospective studies10–13 comparing anticoagulated dental surgical patients with patients whose anticoagulation was interrupted. In each study, there were no embolic or bleeding complications requiring more than local methods for hemostasis in the interruption groups, leading the American College of Chest Physicians to conclude that brief anticoagulation interruption for dental surgery is safe and effective.
But the results of these studies actually argue against interrupting anticoagulation for dental surgery. In each study, rates of postoperative bleeding complications and blood loss were similar in both groups, and there were no embolic complications. The authors of each study independently concluded that anticoagulation should not be interrupted for dental surgery.
The optimal INR range for anticoagulation therapy is widely accepted as 2.0 to 3.0, and 2.5 to 3.5 for patients with a mechanical mitral valve.14 Interrupting warfarin anticoagulation for 2 or 3 days leads to a suboptimal INR. Patel et al15 studied the incidence of embolic complications (including stroke, non-central nervous system embolism, myocardial infarction, and vascular death) within 30 days in 7,082 patients taking warfarin with and without an interruption of therapy of at least 3 days (median 6 days). The observed rate of embolic events in those with temporary interruption (10.75 events per 100 patient-years) was more than double the rate in those without interruption (4.03 per 100 patient-years).15 However, this study was designed to compare rivaroxaban vs warfarin, not interrupting vs not interrupting warfarin.
A DECISION-TREE REANALYSIS
In 2010, Balevi published a decision-tree analysis that slightly favored withdrawing warfarin for dental surgery, but he stated that the analysis “can be updated in the future as more accurate and up-to-date data for each of the variables in the model become available.”16 Now that there are more accurate and up-to-date data, it is time to revisit this decision-tree analysis.
In Balevi’s analysis, major bleeding is not defined. But major bleeding after dental surgery should be defined as any bleeding requiring more than local measures for hemostasis. In calculating probabilities for the analysis, Balevi cited studies allegedly showing high incidences of major bleeding after dental extractions with warfarin continuation.17,18 There were some minor bleeding complications necessitating additional local measures for hemostasis in these studies, but no major bleeding complications at all in the warfarin- continuation or warfarin-interruption group. There were no significant bleeding events in either study, and the differences in bleeding rates were not significantly different between the two groups. In both studies, the authors concluded that warfarin interruption for dental surgery should be reconsidered.
Similarly, Balevi accurately asserted that there has never been a reported case of fatal bleeding after a dental procedure in an anticoagulated patient, but “for the sake of creating balance,”16 his decision-tree analysis uses a fatal bleeding probability of 1%, based on an estimated 1% risk for nondental procedures (eg, colorectal surgery, major abdominal surgery). It is unclear how a 1% incidence creates “balance,” but dental surgery is unlike other types of surgery, and that is one reason there has never been a documented postdental fatal hemorrhage in an anticoagulated patient. Major vessels are unlikely to be encountered, and bleeding sites are easily accessible to local hemostatic methods.
Balevi used an embolic complication incidence of 0.059% with warfarin interruption of 3 days. Perhaps he used such a low embolic probability because of his incorrect assertion that “there has been no reported case of a dental extraction causing a cardiovascular accident in a patient whose warfarin was temporarily discontinued.”16 In fact, our group has now identified at least 22 reported cases of embolic complications after temporary interruption of warfarin therapy in patients undergoing dental surgery.4 These included 12 embolic complications (3 fatal) after interruption periods from 1 to 5 days.19,20 In addition, there are numerous cases of embolic complications reported in patients whose warfarin was temporarily interrupted for other types of surgery.21,22
The literature shows that embolic complications after temporary warfarin interruption occur at a much higher rate than 0.059%. Many documented embolic complications have occurred after relatively long warfarin interruption periods (greater than 5 days), but many have occurred with much shorter interruptions. Wysokinski et al21 showed that there was a 1.1% incidence of thromboembolic events, more than 18 times greater than Balevi’s incidence, in patients whose warfarin was interrupted for 4 or 5 days with or without bridging therapy. One of these patients developed an occipital infarct within 3 days after stopping warfarin without bridging (for a nondental procedure). Garcia et al22 showed that of 984 warfarin therapy interruptions of 5 days or less, there were 4 embolic complications, a rate (0.4%) more than 6 times greater than that reported by Balevi.
Even if one were to accept a 0.059% embolic risk from interruption of warfarin, that would mean for every 1,700 warfarin interruptions for dental procedures, there would be one possibly fatal embolic complication. On the other hand, if 1,700 dental surgeries were performed without warfarin interruption, based on the literature, there may be some bleeding complications, but none would be fatal. If airline flights had a 0.059% chance of crashing, far fewer people would choose to fly. (There are 87,000 airline flights in the US per day. A 0.059% crash rate would mean there would be 51 crashes per day in the United States alone.)
But regardless of whether the embolic risk is 0.059% or 1%, the question comes down to whether an anticoagulated patient should be subjected to a small but significant risk of death or permanent disability (if anticoagulation is interrupted) or to a small risk of a bleeding complication (if anticoagulation is continued), when 100% of cases up until now have apparently resulted in a full recovery.
As a result, the decision-tree analysis was fatally flawed by grossly overestimating the incidence of fatal bleeding when warfarin is continued, and by grossly underestimating the incidence of embolic complications when warfarin is interrupted.
IS WARFARIN CONTINUATION ‘TROUBLESOME’?
An oral surgeon stated, “My experience and that of many of my colleagues is that even though bleeding is never life-threatening [emphasis mine], it can be difficult to control at therapeutic levels of anticoagulation and can be troublesome, especially for elderly patients.”23 The American College of Chest Physicians stated that postoperative bleeding after dental procedures can cause “anxiety and distress.”3 Patients with even minor postoperative bleeding can be anxious, but surely, postoperative stroke is almost always far more troublesome than postoperative bleeding, which has never been life-threatening. Although other types of surgery may be different, there is no need to interrupt lifesaving anticoagulation for innocuous dental surgery.
My mother was right—it can be rude to interrupt. Anticoagulation should not be interrupted for dental surgery.
- Wahl MJ. Myths of dental surgery in patients receiving anticoagulant therapy. J Am Dent Assoc 2000; 131:77–81.
- Dunn AS, Turpie AG. Perioperative management of patients receiving oral anticoagulants: a systematic review. Arch Intern Med 2003; 163:901–908.
- Nematullah A, Alabousi A, Blanas N, Douketis JD, Sutherland SE. Dental surgery for patients on anticoagulant therapy with warfarin: a systematic review and meta-analysis. J Can Dent Assoc 2009; 75:41.
- Wahl MJ, Pintos A, Kilham J, Lalla RV. Dental surgery in anticoagulated patients—stop the interruption. Oral Surg Oral Med Oral Pathol Oral Radiol 2015; 119:136–157.
- van Diermen DE, van der Waal I, Hoogvliets MW, Ong FN, Hoogstraten J. Survey response of oral and maxillofacial surgeons on invasive procedures in patients using antithrombotic medication. Int J Oral Maxillofac Surg 2013; 42:502–507.
- Ward BB, Smith MH. Dentoalveolar procedures for the anticoagulated patient: literature recommendations versus current practice. J Oral Maxillofac Surg 2007; 65:1454–1460.
- Armstrong MJ, Gronseth G, Anderson DC, et al. Summary of evidence-based guideline: periprocedural management of antithrombotic medications in patients with ischemic cerebrovascular disease. Report of the Guideline Development Subcommittee of the American Academy of Neurology. Neurology 2013; 80:2065–2069.
- American Dental Association (ADA). Anticoagulant antiplatelet medications and dental procedures. www.ada.org/en/member-center/oral-health-topics/anticoagulant-antiplatelet-medications-and-dental-. Accessed May 16, 2016.
- Douketis JD, Spyropoulos AC, Spencer FA, et al; American College of Chest Physicians. Perioperative management of antithrombotic therapy. Antithrombotic therapy and prevention of thrombosis, 9th ed: American College of Chest Physicians evidence-based clinical practice guidelines. Chest 2012; 141(suppl 2):e326S–e350S.
- Campbell JH, Alvarado F, Murray RA. Anticoagulation and minor oral surgery: should the anticoagulation regimen be altered? J Oral Maxillofac Surg 2000; 58:131–135.
- Devani P, Lavery M, Howell CJT. Dental extractions in patients on warfarin: is alteration of anticoagulation regime necessary? Br J Oral Maxillofac Surg 1998; 36:107–111.
- Gaspar R, Brenner B, Ardekian L, Peled M, Laufer D. Use of tranexamic acid mouthwash to prevent postoperative bleeding in oral surgery patients on oral anticoagulant medication. Quintessence Int 1997; 28:375–379.
- Blinder D, Manor Y, Martinowitz U, Taicher S. Dental extractions in patients maintained on oral anticoagulant therapy: comparison of INR value with occurrence of postoperative bleeding. Int J Oral Maxillofac Surg 2001; 30:518–521.
- Whitlock RP, Sun JC, Fremes SE, Rubens FD, Teoh KH; American College of Chest Physicians. Antithrombotic and thrombolytic therapy for valvular disease: antithrombotic therapy and prevention of thrombosis, 9th ed: American College of Chest Physicians evidence-based clinical practice guidelines. Chest 2012; 141(suppl 2):e576S–e600S.
- Patel MR, Hellkamp AS, Lokhnygina Y, et al. Outcomes of discontinuing rivaroxaban compared with warfarin in patients with nonvalvular atrial fibrillation: analysis from the ROCKET AF trial (rivaroxaban once-daily, oral, direct factor Xa inhibition compared with vitamin K antagonism for prevention of stroke and embolism trial in atrial fibrillation). J Am Coll Cardiol 2013; 61:651–658.
- Balevi B. Should warfarin be discontinued before a dental extraction? A decision-tree analysis. Oral Surg Oral Med Oral Pathol Oral Radiol Endod 2010; 110:691–697.
- Al-Mubarak S, Al-Ali N, Abou Rass M, et al. Evaluation of dental extractions, suturing and INR on postoperative bleeding of patients maintained on oral anticoagulant therapy. Br Dent J 2007; 203:E15.
- Evans IL, Sayers MS, Gibbons AJ, Price G, Snooks H, Sugar AW. Can warfarin be continued during dental extraction? Results of a randomized controlled trial. Br J Oral Maxillofac Surg 2002; 40:248–252.
- Yasaka M, Naritomi H, Minematsu K. Ischemic stroke associated with brief cessation of warfarin. Thromb Res 2006; 118:290–293.
- Akopov SE, Suzuki S, Fredieu A, Kidwell CS, Saver JL, Cohen SN. Withdrawal of warfarin prior to a surgical procedure: time to follow the guidelines? Cerbrovasc Dis 2005; 19:337–342.
- Wysokinski WE, McBane RD, Daniels PR, et al. Periprocedural anticoagulation management of patients with nonvalvular atrial fibrillation. Mayo Clin Proc 2008; 83:639–645.
- Garcia DA, Regan S, Henault LE, et al. Risk of thromboembolism with short-term interruption of warfarin therapy. Arch Intern Med 2008; 168:63–69.
- Todd DW. Anticoagulated patients and oral surgery [letter]. Arch Intern Med 2003; 163:1242.
When I was growing up, my mother frequently told me that it was rude to interrupt. Although she was referring to conversations, she may have been onto something bigger.
In the nearly three quarters of a century since their discovery, vitamin K antagonist anticoagulant drugs have been used by millions of patients to prevent heart attack and stroke. Before these patients undergo surgery, a decision to continue or interrupt anticoagulation must be made, weighing the risks of postsurgical hemorrhage with continuation of anticoagulation against the risks of stroke or other embolic complications with interruption of anticoagulation. Bleeding after dental surgery when anticoagulation is continued is rarely or never life-threatening. On the other hand, embolic complications of interrupting anticoagulation are almost always consequential and often lead to death or disability. Although consideration may be different for other types of surgery, there is no need to interrupt lifesaving anticoagulation for dental surgery.
EVIDENCE THAT SUPPORTS CONTINUING ANTICOAGULATION
As early as 1957, there were reports of prolonged postoperative bleeding after dental extractions in patients taking anticoagulants. But there were also reports of embolic complications in patients whose anticoagulation was interrupted for dental procedures. Since then, there has been a plethora of literature in this area.
A review published in 2000 showed that of more than 950 anticoagulated patients undergoing more than 2,400 dental surgical procedures (including simple and surgical extraction, alveoplasty, and gingival surgery), only 12 (< 1.3%) required more than local measures for hemostasis (eg, fresh-frozen plasma, vitamin K), and no patient died,1 leading to the conclusion that the bleeding risk was not significant in anticoagulated dental patients. Other studies and systematic reviews have also concluded that anticoagulation for dental procedures should not be interrupted.2,3 In a recent review of 83 studies, only 31 (0.6%) of 5,431 patients taking warfarin suffered bleeding complications requiring more than local measures for hemostasis; there were no fatalities.4
The risk of embolism
There have been many reports of embolic complications in patients whose anticoagulation was interrupted for dental procedures. A 2000 review of 575 cases in 526 patients whose anticoagulation was interrupted for dental procedures showed that 5 patients (0.9%) had a serious embolic complication, and 4 died.1 In a more recent review of 64 studies and more than 2,673 patients whose anticoagulation was interrupted for dental procedures, 22 patients (0.8%) suffered embolic complications, and 6 (0.2%) died of the complications.4 Of those with embolic complications, the interruption period was often not reported; however; the interruption ranged from 1 to 4 days. A 2003 systematic review by Dunn and Turpie found a 0.4% embolic complication rate when anticoagulation was interrupted for dental surgery.2
BLEEDING AFTER DENTAL SURGERY
Bleeding after dental surgery can occur with either anticoagulation continuation or interruption, and minor postoperative bleeding requiring additional local hemostatic methods occurs at about the same rate in anticoagulated patients as in those whose anticoagulation is interrupted.
In our recent literature review,4 about 6% of patients in whom anticoagulation was interrupted (and 7% in whom it was not interrupted) had minor bleeding requiring additional local hemostasis, and only 0.2% of patients required more than hemostatic measures (eg, vitamin K injection, plasma transfusion), the same rate found by Dunn and Turpie.2 All patients who required more than local hemostatic measures presumably made a full recovery, while at least 6 who suffered postoperative embolic complications died, and the rest may have had permanent disabilities.
Although bridging therapy with low-molecular-weight heparin can decrease the time without anticoagulation for a dental procedure to only 12 hours, it can be complicated to implement, and there appears to be no benefit in terms of the rates of bleeding or embolic complications. Of the 64 anticoagulation interruption studies,4 17 used heparin or low-molecular-weight heparin in conjunction with temporary warfarin interruption. In 210 instances of bridging therapy in 202 patients undergoing dental procedures, there were 2 embolic complications (1% of bridging cases) and 20 bleeding complications, with 3 (1.4%) requiring hemostasis beyond local measures.4
Many of the studies analyzed independently showed there was no significant difference in postoperative bleeding with:
- Anticoagulation continuation vs interruption for a few days
- Lower vs higher international normalized ratio (INR), including some over 4.0
- Surgical vs nonsurgical extraction
- Few vs many extractions.4
Some studies of anticoagulation and anticoagulation interruption for dental surgery had important limitations. Many of the anticoagulation studies excluded patients at high risk of bleeding, those with a high INR (> 4.0), and those with severe liver or kidney disease, and their exclusion could have lowered the incidence of bleeding complications. Many studies of anticoagulation interruption excluded patients at high risk of embolism, including patients with a previous embolic event and patients with an artificial heart valve, and this could have skewed the results lower for embolic complications.
WHY DO SOME CLINICIANS STILL RECOMMEND INTERRUPTION?
The choice seems clear: for dental surgery in anticoagulated patients, the small risk of a nonfatal bleeding complication in anticoagulated patients is outweighed by the small risk of a disabling or fatal embolic complication when anticoagulation is interrupted. Most authors have concluded that anticoagulation should be continued for dental surgery. Yet surveys of dentists and physicians have shown that many still recommend interrupting anticoagulation for dental surgery.5,6
Medical and dental association positions
The American Academy of Neurology7 and the American Dental Association8 recommend continuing anticoagulant medications for dental surgery. The American College of Chest Physicians also recommends continuing anticoagulation but in 2012 added an option to interrupt or decrease anticoagulation for 2 to 3 days for dental surgery.9 Their recommendation was based partly on the results of four controlled prospective studies10–13 comparing anticoagulated dental surgical patients with patients whose anticoagulation was interrupted. In each study, there were no embolic or bleeding complications requiring more than local methods for hemostasis in the interruption groups, leading the American College of Chest Physicians to conclude that brief anticoagulation interruption for dental surgery is safe and effective.
But the results of these studies actually argue against interrupting anticoagulation for dental surgery. In each study, rates of postoperative bleeding complications and blood loss were similar in both groups, and there were no embolic complications. The authors of each study independently concluded that anticoagulation should not be interrupted for dental surgery.
The optimal INR range for anticoagulation therapy is widely accepted as 2.0 to 3.0, and 2.5 to 3.5 for patients with a mechanical mitral valve.14 Interrupting warfarin anticoagulation for 2 or 3 days leads to a suboptimal INR. Patel et al15 studied the incidence of embolic complications (including stroke, non-central nervous system embolism, myocardial infarction, and vascular death) within 30 days in 7,082 patients taking warfarin with and without an interruption of therapy of at least 3 days (median 6 days). The observed rate of embolic events in those with temporary interruption (10.75 events per 100 patient-years) was more than double the rate in those without interruption (4.03 per 100 patient-years).15 However, this study was designed to compare rivaroxaban vs warfarin, not interrupting vs not interrupting warfarin.
A DECISION-TREE REANALYSIS
In 2010, Balevi published a decision-tree analysis that slightly favored withdrawing warfarin for dental surgery, but he stated that the analysis “can be updated in the future as more accurate and up-to-date data for each of the variables in the model become available.”16 Now that there are more accurate and up-to-date data, it is time to revisit this decision-tree analysis.
In Balevi’s analysis, major bleeding is not defined. But major bleeding after dental surgery should be defined as any bleeding requiring more than local measures for hemostasis. In calculating probabilities for the analysis, Balevi cited studies allegedly showing high incidences of major bleeding after dental extractions with warfarin continuation.17,18 There were some minor bleeding complications necessitating additional local measures for hemostasis in these studies, but no major bleeding complications at all in the warfarin- continuation or warfarin-interruption group. There were no significant bleeding events in either study, and the differences in bleeding rates were not significantly different between the two groups. In both studies, the authors concluded that warfarin interruption for dental surgery should be reconsidered.
Similarly, Balevi accurately asserted that there has never been a reported case of fatal bleeding after a dental procedure in an anticoagulated patient, but “for the sake of creating balance,”16 his decision-tree analysis uses a fatal bleeding probability of 1%, based on an estimated 1% risk for nondental procedures (eg, colorectal surgery, major abdominal surgery). It is unclear how a 1% incidence creates “balance,” but dental surgery is unlike other types of surgery, and that is one reason there has never been a documented postdental fatal hemorrhage in an anticoagulated patient. Major vessels are unlikely to be encountered, and bleeding sites are easily accessible to local hemostatic methods.
Balevi used an embolic complication incidence of 0.059% with warfarin interruption of 3 days. Perhaps he used such a low embolic probability because of his incorrect assertion that “there has been no reported case of a dental extraction causing a cardiovascular accident in a patient whose warfarin was temporarily discontinued.”16 In fact, our group has now identified at least 22 reported cases of embolic complications after temporary interruption of warfarin therapy in patients undergoing dental surgery.4 These included 12 embolic complications (3 fatal) after interruption periods from 1 to 5 days.19,20 In addition, there are numerous cases of embolic complications reported in patients whose warfarin was temporarily interrupted for other types of surgery.21,22
The literature shows that embolic complications after temporary warfarin interruption occur at a much higher rate than 0.059%. Many documented embolic complications have occurred after relatively long warfarin interruption periods (greater than 5 days), but many have occurred with much shorter interruptions. Wysokinski et al21 showed that there was a 1.1% incidence of thromboembolic events, more than 18 times greater than Balevi’s incidence, in patients whose warfarin was interrupted for 4 or 5 days with or without bridging therapy. One of these patients developed an occipital infarct within 3 days after stopping warfarin without bridging (for a nondental procedure). Garcia et al22 showed that of 984 warfarin therapy interruptions of 5 days or less, there were 4 embolic complications, a rate (0.4%) more than 6 times greater than that reported by Balevi.
Even if one were to accept a 0.059% embolic risk from interruption of warfarin, that would mean for every 1,700 warfarin interruptions for dental procedures, there would be one possibly fatal embolic complication. On the other hand, if 1,700 dental surgeries were performed without warfarin interruption, based on the literature, there may be some bleeding complications, but none would be fatal. If airline flights had a 0.059% chance of crashing, far fewer people would choose to fly. (There are 87,000 airline flights in the US per day. A 0.059% crash rate would mean there would be 51 crashes per day in the United States alone.)
But regardless of whether the embolic risk is 0.059% or 1%, the question comes down to whether an anticoagulated patient should be subjected to a small but significant risk of death or permanent disability (if anticoagulation is interrupted) or to a small risk of a bleeding complication (if anticoagulation is continued), when 100% of cases up until now have apparently resulted in a full recovery.
As a result, the decision-tree analysis was fatally flawed by grossly overestimating the incidence of fatal bleeding when warfarin is continued, and by grossly underestimating the incidence of embolic complications when warfarin is interrupted.
IS WARFARIN CONTINUATION ‘TROUBLESOME’?
An oral surgeon stated, “My experience and that of many of my colleagues is that even though bleeding is never life-threatening [emphasis mine], it can be difficult to control at therapeutic levels of anticoagulation and can be troublesome, especially for elderly patients.”23 The American College of Chest Physicians stated that postoperative bleeding after dental procedures can cause “anxiety and distress.”3 Patients with even minor postoperative bleeding can be anxious, but surely, postoperative stroke is almost always far more troublesome than postoperative bleeding, which has never been life-threatening. Although other types of surgery may be different, there is no need to interrupt lifesaving anticoagulation for innocuous dental surgery.
My mother was right—it can be rude to interrupt. Anticoagulation should not be interrupted for dental surgery.
- Wahl MJ. Myths of dental surgery in patients receiving anticoagulant therapy. J Am Dent Assoc 2000; 131:77–81.
- Dunn AS, Turpie AG. Perioperative management of patients receiving oral anticoagulants: a systematic review. Arch Intern Med 2003; 163:901–908.
- Nematullah A, Alabousi A, Blanas N, Douketis JD, Sutherland SE. Dental surgery for patients on anticoagulant therapy with warfarin: a systematic review and meta-analysis. J Can Dent Assoc 2009; 75:41.
- Wahl MJ, Pintos A, Kilham J, Lalla RV. Dental surgery in anticoagulated patients—stop the interruption. Oral Surg Oral Med Oral Pathol Oral Radiol 2015; 119:136–157.
- van Diermen DE, van der Waal I, Hoogvliets MW, Ong FN, Hoogstraten J. Survey response of oral and maxillofacial surgeons on invasive procedures in patients using antithrombotic medication. Int J Oral Maxillofac Surg 2013; 42:502–507.
- Ward BB, Smith MH. Dentoalveolar procedures for the anticoagulated patient: literature recommendations versus current practice. J Oral Maxillofac Surg 2007; 65:1454–1460.
- Armstrong MJ, Gronseth G, Anderson DC, et al. Summary of evidence-based guideline: periprocedural management of antithrombotic medications in patients with ischemic cerebrovascular disease. Report of the Guideline Development Subcommittee of the American Academy of Neurology. Neurology 2013; 80:2065–2069.
- American Dental Association (ADA). Anticoagulant antiplatelet medications and dental procedures. www.ada.org/en/member-center/oral-health-topics/anticoagulant-antiplatelet-medications-and-dental-. Accessed May 16, 2016.
- Douketis JD, Spyropoulos AC, Spencer FA, et al; American College of Chest Physicians. Perioperative management of antithrombotic therapy. Antithrombotic therapy and prevention of thrombosis, 9th ed: American College of Chest Physicians evidence-based clinical practice guidelines. Chest 2012; 141(suppl 2):e326S–e350S.
- Campbell JH, Alvarado F, Murray RA. Anticoagulation and minor oral surgery: should the anticoagulation regimen be altered? J Oral Maxillofac Surg 2000; 58:131–135.
- Devani P, Lavery M, Howell CJT. Dental extractions in patients on warfarin: is alteration of anticoagulation regime necessary? Br J Oral Maxillofac Surg 1998; 36:107–111.
- Gaspar R, Brenner B, Ardekian L, Peled M, Laufer D. Use of tranexamic acid mouthwash to prevent postoperative bleeding in oral surgery patients on oral anticoagulant medication. Quintessence Int 1997; 28:375–379.
- Blinder D, Manor Y, Martinowitz U, Taicher S. Dental extractions in patients maintained on oral anticoagulant therapy: comparison of INR value with occurrence of postoperative bleeding. Int J Oral Maxillofac Surg 2001; 30:518–521.
- Whitlock RP, Sun JC, Fremes SE, Rubens FD, Teoh KH; American College of Chest Physicians. Antithrombotic and thrombolytic therapy for valvular disease: antithrombotic therapy and prevention of thrombosis, 9th ed: American College of Chest Physicians evidence-based clinical practice guidelines. Chest 2012; 141(suppl 2):e576S–e600S.
- Patel MR, Hellkamp AS, Lokhnygina Y, et al. Outcomes of discontinuing rivaroxaban compared with warfarin in patients with nonvalvular atrial fibrillation: analysis from the ROCKET AF trial (rivaroxaban once-daily, oral, direct factor Xa inhibition compared with vitamin K antagonism for prevention of stroke and embolism trial in atrial fibrillation). J Am Coll Cardiol 2013; 61:651–658.
- Balevi B. Should warfarin be discontinued before a dental extraction? A decision-tree analysis. Oral Surg Oral Med Oral Pathol Oral Radiol Endod 2010; 110:691–697.
- Al-Mubarak S, Al-Ali N, Abou Rass M, et al. Evaluation of dental extractions, suturing and INR on postoperative bleeding of patients maintained on oral anticoagulant therapy. Br Dent J 2007; 203:E15.
- Evans IL, Sayers MS, Gibbons AJ, Price G, Snooks H, Sugar AW. Can warfarin be continued during dental extraction? Results of a randomized controlled trial. Br J Oral Maxillofac Surg 2002; 40:248–252.
- Yasaka M, Naritomi H, Minematsu K. Ischemic stroke associated with brief cessation of warfarin. Thromb Res 2006; 118:290–293.
- Akopov SE, Suzuki S, Fredieu A, Kidwell CS, Saver JL, Cohen SN. Withdrawal of warfarin prior to a surgical procedure: time to follow the guidelines? Cerbrovasc Dis 2005; 19:337–342.
- Wysokinski WE, McBane RD, Daniels PR, et al. Periprocedural anticoagulation management of patients with nonvalvular atrial fibrillation. Mayo Clin Proc 2008; 83:639–645.
- Garcia DA, Regan S, Henault LE, et al. Risk of thromboembolism with short-term interruption of warfarin therapy. Arch Intern Med 2008; 168:63–69.
- Todd DW. Anticoagulated patients and oral surgery [letter]. Arch Intern Med 2003; 163:1242.

The fifth vital sign: A complex story of politics and patient care

In this issue of the Journal, Dr. Marissa Galicia-Castillo discusses the use of opioids in older patients with persistent (formerly known as chronic) pain. Even though she devotes one and a half pages to the side effects of chronic opioid therapy, I am sure that in the current environment many readers will perceive her as expressing a surprisingly supportive tone regarding the use of these medications. The times have changed, and the difficulties and complexities of trying to help patients with ongoing pain have increased.
In the mid-1990s, the American Pain Society aggressively pushed the concept of pain as the fifth vital sign.1 Their stated goals included raising awareness that patients with pain were undertreated, in large part because in the Society’s opinion pain was not regularly assessed at physician office visits or even in the hospital after surgery. Half a decade later the Joint Commission and others hopped on this train, emphasizing that pain needs to be regularly assessed in all patients, that pain is a subjective measure, unlike the heart rate or blood pressure, and that physicians must accept and respect patient self-reporting of pain. Concurrent with these efforts was the enhanced promotion of pain medications—new highly touted and frequently prescribed narcotics as well as nonnarcotic medications re-marketed as analgesics. Opportunistically, or perhaps wielding inappropriate and sketchy influence, some drug manufacturers in the early 2000s funded publications and physician presentations to encourage the expanded use of opioids and other medications for pain control. In a recent CNN report on the opioid epidemic, it was noted that the Joint Commission published a book in 2000 for purchase by doctors as part of required continuing education seminars, and that the book cited studies claiming “there is no evidence that addiction is a significant issue when persons are given opioids for pain control.”2 According to the CNN report, the book was sponsored by a manufacturer of narcotic analgesics.2 Lack of evidence is not evidence supporting a lack of known concern.
Step forward in time, and pain control has become a measure of patient satisfaction, and thus potentially another physician and institutional rating score that can be linked to reimbursement. This despite reports suggesting that incorporation of this required pain scale did not actually improve the quality of pain management.3 I suspect that most of my peers function in the outpatient clinic as I do, without much interest in what was recorded on the intake pain scale, since I will be taking a more focused and detailed history from the patient if pain is any part of the reason for visiting with me. The goal of alleviating a patient’s pain, whenever reasonable, must always be on our agenda. Yet, while we need to respond to scores on a somewhat silly screening pain scale, the hurdles to prescribing analgesics are getting higher.
The latest data on opioid-related deaths are sobering and scary. Organized medicine must absolutely push to close the pain-pill mills, but is the link really so strong between thoughtful prescribing of short- or even long-term opioids and the escalating “epidemic” of opioid complications that we should not prescribe these drugs? Does the fact that we don’t have good data demonstrating long-term efficacy mean that these drugs are not effective in appropriately selected patients? Is it warranted to require regular database reviews of all patients who are prescribed these medications? Is it warranted, as one patient said to me, that she be treated like a potential criminal begging for drugs when her prescriptions are up, and that she be “looked at funny” by the pharmacist when she fills them?
An increasingly discussed concept is that of central generalization of pain, and patients who have this may be opioid-resistant and, perhaps, prone to developing opioid hyperalgesia. It has been studied in patients with fibromyalgia and is now felt by some to include patients with osteoarthritis and other initially localized painful conditions. Whether or not this concept ultimately turns out to be correct, it adds another dimension to our assessment of patients with pain.
The time has come to move past using a one-size-fits-all fifth vital sign (“How would you rate your pain on a scale of 1 to 10?”) and reflexively prescribing an opioid when pain is characterized as severe. But, if the patient truly needs the drug, we also need to move past not writing that prescription because of headlines and administrative hurdles. This is a much more complex story.
- American Pain Society Quality of Care Committee. Quality improvement guidelines for the treatment of acute pain and cancer pain. JAMA 1995; 274:1874–1880.
- Moghe S. Opioid history: from ‘wonder drug’ to abuse epidemic. www.cnn.com/2016/05/12/health/opioid-addiction-history/. Accessed May 16, 2016.
- Mularski RA, White-Chu F, Overbay D, et al. Measuring pain as the 5th vital sign does not improve quality of pain management. J Gen Intern Med 2006; 21:607–612.
In this issue of the Journal, Dr. Marissa Galicia-Castillo discusses the use of opioids in older patients with persistent (formerly known as chronic) pain. Even though she devotes one and a half pages to the side effects of chronic opioid therapy, I am sure that in the current environment many readers will perceive her as expressing a surprisingly supportive tone regarding the use of these medications. The times have changed, and the difficulties and complexities of trying to help patients with ongoing pain have increased.
In the mid-1990s, the American Pain Society aggressively pushed the concept of pain as the fifth vital sign.1 Their stated goals included raising awareness that patients with pain were undertreated, in large part because in the Society’s opinion pain was not regularly assessed at physician office visits or even in the hospital after surgery. Half a decade later the Joint Commission and others hopped on this train, emphasizing that pain needs to be regularly assessed in all patients, that pain is a subjective measure, unlike the heart rate or blood pressure, and that physicians must accept and respect patient self-reporting of pain. Concurrent with these efforts was the enhanced promotion of pain medications—new highly touted and frequently prescribed narcotics as well as nonnarcotic medications re-marketed as analgesics. Opportunistically, or perhaps wielding inappropriate and sketchy influence, some drug manufacturers in the early 2000s funded publications and physician presentations to encourage the expanded use of opioids and other medications for pain control. In a recent CNN report on the opioid epidemic, it was noted that the Joint Commission published a book in 2000 for purchase by doctors as part of required continuing education seminars, and that the book cited studies claiming “there is no evidence that addiction is a significant issue when persons are given opioids for pain control.”2 According to the CNN report, the book was sponsored by a manufacturer of narcotic analgesics.2 Lack of evidence is not evidence supporting a lack of known concern.
Step forward in time, and pain control has become a measure of patient satisfaction, and thus potentially another physician and institutional rating score that can be linked to reimbursement. This despite reports suggesting that incorporation of this required pain scale did not actually improve the quality of pain management.3 I suspect that most of my peers function in the outpatient clinic as I do, without much interest in what was recorded on the intake pain scale, since I will be taking a more focused and detailed history from the patient if pain is any part of the reason for visiting with me. The goal of alleviating a patient’s pain, whenever reasonable, must always be on our agenda. Yet, while we need to respond to scores on a somewhat silly screening pain scale, the hurdles to prescribing analgesics are getting higher.
The latest data on opioid-related deaths are sobering and scary. Organized medicine must absolutely push to close the pain-pill mills, but is the link really so strong between thoughtful prescribing of short- or even long-term opioids and the escalating “epidemic” of opioid complications that we should not prescribe these drugs? Does the fact that we don’t have good data demonstrating long-term efficacy mean that these drugs are not effective in appropriately selected patients? Is it warranted to require regular database reviews of all patients who are prescribed these medications? Is it warranted, as one patient said to me, that she be treated like a potential criminal begging for drugs when her prescriptions are up, and that she be “looked at funny” by the pharmacist when she fills them?
An increasingly discussed concept is that of central generalization of pain, and patients who have this may be opioid-resistant and, perhaps, prone to developing opioid hyperalgesia. It has been studied in patients with fibromyalgia and is now felt by some to include patients with osteoarthritis and other initially localized painful conditions. Whether or not this concept ultimately turns out to be correct, it adds another dimension to our assessment of patients with pain.
The time has come to move past using a one-size-fits-all fifth vital sign (“How would you rate your pain on a scale of 1 to 10?”) and reflexively prescribing an opioid when pain is characterized as severe. But, if the patient truly needs the drug, we also need to move past not writing that prescription because of headlines and administrative hurdles. This is a much more complex story.
- American Pain Society Quality of Care Committee. Quality improvement guidelines for the treatment of acute pain and cancer pain. JAMA 1995; 274:1874–1880.
- Moghe S. Opioid history: from ‘wonder drug’ to abuse epidemic. www.cnn.com/2016/05/12/health/opioid-addiction-history/. Accessed May 16, 2016.
- Mularski RA, White-Chu F, Overbay D, et al. Measuring pain as the 5th vital sign does not improve quality of pain management. J Gen Intern Med 2006; 21:607–612.
Navigating pneumococcal vaccination in adults
Streptococcus pneumoniae (the “pneumococcus”) causes a variety of clinical syndromes that range from otitis media to bacteremia, meningitis, and pneumonia. Hardest hit are immunocompromised people and those at the extremes of age. Therefore, preventing disease through pneumococcal vaccination is very important in these groups.
This review summarizes the current guidelines from the Advisory Committee on Immunization Practices (ACIP) of the US Centers for Disease Control and Prevention (CDC) for pneumococcal immunization in adults.
STRIKES THE VERY YOUNG, VERY OLD, AND IMMUNOCOMPROMISED
Invasive pneumococcal disease is defined as infection in which S pneumoniae can be found in a normally sterile site such as the cerebrospinal fluid or blood, and it includes bacteremic pneumonia.1 By far the most common type of pneumococcal disease is pneumonia, followed by bacteremia and meningitis (Figure 1)2,3; about 25% of patients with pneumococcal pneumonia also have bacteremia.2
Invasive pneumococcal disease most often occurs in children age 2 and younger, adults age 65 and older, and people who are immunocompromised. In 2010, the incidence was 3.8 per 100,000 in people ages 18 to 34 but was 10 times higher in the elderly and those with compromised immunity.1
Even now that vaccines are available, invasive pneumococcal disease continues to cause 4,000 deaths per year in the United States.1
TWO INACTIVATED VACCINES
S pneumoniae is a gram-positive coccus with an outer capsule composed of polysaccharides that protect the bacterium from being ingested and killed by host phagocytic cells. Some 91 serotypes of this organism have been identified on the basis of genetic differences in capsular polysaccharide composition.
Currently, two inactivated vaccines are available that elicit antibody responses to the most common pneumococcal serotypes that infect humans.
- PPSV23 (pneumococcal polysaccharide vaccine-23, or Pneumovax 23) contains purified capsular polysaccharides from 23 pneumococcal serotypes.
- PCV13 (pneumococcal conjugate vaccine-13, or Prevnar 13) contains purified capsular polysaccharides from 13 serotypes that are covalently bound to (conjugated with) a carrier protein.
PPSV23 AND PCV13 ARE NOT THE SAME
Apart from the number of serotypes covered, the two vaccines differ in important ways. Both of them elicit a B-cell-mediated immune response, but only PCV13 produces a T-cell-dependent response, which is essential for maturation of the B-cell response and development of immune memory.
PPSV23 generally provides 3 to 5 years of immunity, and repeat doses do not offer additive or “boosted” protection. It is ineffective in children under 2 years of age.
Pneumococcal conjugate vaccine has been available since 2000 for children starting at 2 months of age. Since then it has directly reduced the incidence of invasive pneumococcal disease in children and indirectly in adults. The impact on pneumococcal disease rates in adults has probably been related to reduction in rates of pneumococcal nasopharyngeal carriage in children, another unique benefit of conjugated vaccines.3
In December 2011, the US Food and Drug Administration (FDA) approved PCV13 for adults on the basis of immunologic studies and anticipation that clinical efficacy would be similar to that observed in children.
HOW EFFECTIVE ARE THEY?
The efficacy and safety of PPSV23 and PCV13 have been studied in a variety of patient populations. Though antibody responses to PCV13 were similar to or better than those with PPSV23, no studies of specific correlations between immunologic responses and disease outcomes are available.4,5
In large studies in healthy adults, both vaccines reduced the incidence of invasive pneumococcal disease. A study in more than 47,000 adults age 65 and older showed a significant reduction in pneumococcal bacteremia (hazard ratio 0.56, 95% confidence interval 0.33–0.93) in those who received PPSV23 compared with those who received placebo.6 However, PPSV23 was not effective in preventing nonbacteremic and noninvasive pneumococcal community-acquired pneumonia when all bacterial serotypes were considered.6
In a placebo-controlled trial in more than 84,000 people age 65 and older, PCV13 prevented both nonbacteremic and bacteremic community-acquired pneumococcal pneumonia due to serotypes included in the vaccine (relative risk reduction 45%, P < .007) and overall invasive pneumococcal disease due to serotypes included in the vaccine (relative risk reduction 70%, P < .001).7
Both vaccines have also demonstrated efficacy in immunocompromised adults. Several studies showed an equivalent or superior antibody response to a seven-valent pneumococcal conjugate vaccine (PCV7, which has been replaced by PCV13) compared with PPSV23 in adults with human immunodeficiency virus (HIV) infection.8,9 While specific clinical studies of the efficacy of PCV13 among immunocompromised people are not available, a study of vaccination with PCV7 in 496 people in Malawi, of whom 88% were infected with HIV, found that the vaccine was effective in preventing invasive pneumococcal disease (hazard ratio 26%, 95% confidence interval 0.10–0.70).10
AT-RISK PATIENT POPULATIONS
Since both PPSV23 and PCV13 are approved for use in adults, it is important to understand appropriate indications for their use. The ACIP recommends pneumococcal vaccination in adults at an increased risk of invasive pneumococcal disease: ie, people age 65 and older, at-risk people ages 19 to 64, and people who are immunocompromised or asplenic.
A more robust antibody response has been shown with PCV13 compared to PPSV23 in healthy people.5 Of note, when PPSV23 is given before PCV13, there is a diminished immune response to PCV13.11,12 Therefore, unvaccinated people who will receive both PCV13 and PPSV23 should be given the conjugate vaccine PCV13 first. (See Commonly asked questions.)
ADULTS AGE 65 AND OLDER: ONE DOSE EACH OF PCV13 AND PPSV23
Before September 2014, the ACIP recommended one dose of PPSV23 for adults age 65 and older to prevent invasive pneumococcal disease.13 With evidence that PCV13 also produces an antibody response and is clinically effective against pneumococcal pneumonia in older people, the ACIP now recommends that all adults age 65 and older receive one dose of PCV13 and one dose of PPSV23.3, 14
Based on antibody studies, the ACIP recommends giving PCV13 first and PPSV23 12 months after.11,12 Patients who received PPSV23 at age 65 or older should receive PCV13 at least 1 year after PPSV23 (Figure 2).3,14 Patients who had previously received one dose of PPSV23 before age 65 who are now age 65 or older should receive one dose of PCV13 at least 1 year after PPSV23 and an additional dose of PPSV23 at least 5 years after the first dose of PPSV23 and at least 1 year after the dose of PCV13.3 Patients who received a dose of PCV13 before age 65 do not need an additional dose after age 65.
The Centers for Medicare and Medicaid Services have updated the reimbursement for pneumococcal vaccines to include both PCV13 and PPSV23. Patients can receive one dose of pneumococcal vaccine followed by a different, second pneumococcal vaccine at least 11 full months after the month in which the first pneumococcal vaccine was administered.15
AT-RISK PATIENTS AGES 19 TO 64
Before 2012, the ACIP recommended that patients at risk, including immunocompromised patients and those without a spleen, with cerebrospinal fluid leaks, or with cochlear implants, receive only PPSV23 before age 65.13 In 2010, 50% of cases of invasive pneumococcal disease in immunocompromised adults were due to serotypes contained in PCV13.16 Additionally, according to CDC data from 2013, in adults ages 19 to 64 at risk of pneumococcal disease, only 21.2% had received pneumococcal vaccine.17 With information on epidemiology, safety, and efficacy, as well as expanded FDA approval of PCV13 for adults in 2011, the ACIP updated its guidelines for pneumococcal immunization of adults with immunocompromising conditions in October 2012.16 The updated guidelines now include giving PCV13 to adults at increased risk of invasive pneumococcal disease.16
Adults under age 65 at risk of invasive pneumococcal disease can be further divided into those who are immunocompetent with comorbid conditions, and those with cochlear implants or cerebrospinal fluid leak. (Table 1).16
Patients with cochlear implants or cerebrospinal fluid leaks should receive one dose of PCV13 followed by one dose of PPSV23 8 weeks later. If PPSV23 is given first in this group, PCV13 can be given 1 year later.
Immunocompetent patients with comorbid conditions, including cigarette smoking, chronic heart, liver, or lung disease, asthma, cirrhosis, and diabetes mellitus, should receive one dose of PPSV23 before age 65 (Table 1).16
IMMUNOCOMPROMISED AND ASPLENIC PATIENTS
Immunocompromised patients at risk for invasive pneumococcal disease include patients with functional or anatomic asplenia or immunocompromising conditions such as HIV infection, chronic renal failure, generalized malignancy, solid organ transplant, iatrogenic immunosuppression (eg, due to corticosteroid therapy), and other immunocompromising conditions.16 Patients on corticosteroid therapy are considered immunosuppressed if they take 20 mg or more of prednisone daily (or an equivalent corticosteroid dose) for at least 14 days.16 These immunocompromised patients should receive one dose of PCV13, followed by a PPSV23 dose 8 weeks later and a second PPSV23 dose 5 years after the first.16
The time between vaccinations is also important. If PCV13 is given first, PPSV23 can be given after at least 8 weeks. If PPSV23 is given first, PCV13 should be given after 12 months. The time between PPSV23 doses is 5 years (Figure 3).16
ADDRESSING BARRIERS TO PNEUMOCOCCAL VACCINATION
In 2013, only 59.7% of adults age 65 and older and 21.1% of younger, at-risk adults with immunocompromising conditions had received pneumococcal vaccination.17 Healthcare providers have the opportunity to improve pneumococcal vaccination rates. The National Foundation for Infectious Diseases (www.nfid.org) summarized challenges in vaccinating at-risk patients and recommended strategies to overcome barriers.18
Challenges include the cost of vaccine coverage, limited time (with competing priorities during office appointments or hospitalizations), patient refusal, and knowledge gaps.
Strategies to overcome barriers include incorporating vaccination into protocols and procedures; educating healthcare providers and patients about pneumococcal disease, vaccines, costs, and reimbursement; engaging nonclinical staff members; and monitoring local vaccination rates. However, the most important factor affecting whether adults are vaccinated is whether the healthcare provider recommends it.
AN OPPORTUNITY TO IMPROVE
In the last 30 years, great strides have been made in recognizing and preventing pneumococcal disease, but challenges remain. Adherence to the new ACIP guidelines for pneumococcal vaccination in immunocompromised, at risk and elderly patients is important in reducing invasive pneumococcal disease.
Healthcare providers have the opportunity to improve pneumococcal vaccination rates at outpatient appointments to decrease the burden of invasive pneumococcal disease in at-risk populations. A comprehensive understanding of the guideline recommendations for pneumococcal vaccination can aid the provider in identifying patients who are eligible for vaccination.
Adult pneumococcal immunization rates are low due to missed opportunities. Healthcare providers can improve these rates by viewing every patient encounter as a chance to provide vaccination.
- Centers for Disease Control and Prevention (CDC). Active Bacterial Core surveillance report (ABCs). ABCs Report: Streptococcus pneumoniae, 2010. www.cdc.gov/abcs/reports-findings/survreports/spneu10-orig.html. Accessed May 13, 2016.
- Said MA, Johnson, HL, Nonyane BA, et al. Estimating the burden of pneumococcal pneumonia among adults: a systematic review and meta-analysis of diagnostic techniques. Plos One 2013; 8:e60273.
- Tomczyk S, Bennett NM, Stoecker C, et al; Centers for Disease Control and Prevention (CDC). Use of 13-valent pneumococcal conjugate vaccine and 23-valent pneumococcal polysaccharide vaccine among adults aged ≥ 65 years: recommendations of the Advisory Committee on Immunization Practices (ACIP). MMWR Morb Mortal Wkly Rep 2014; 63:822–825.
- Crum-Cianflone NF, Huppler Hullsiek K, Roediger M, et al; Infectious Disease Clinical Research Program HIV Working Group. A randomized clinical trial comparing revaccination with pneumococcal conjugate vaccine to polysaccharide vaccine among HIV-infected adults. J Infect Dis 2010: 202:1114–1125.
- Jackson LA, Gurtman A, van Cleeff M, et al. Immunogenicity and safety of a 13-valent pneumococcal conjugate vaccine compared to a 23-valent pneumococcal polysaccharide vaccine in pneumococcal vaccine-naïve adults. Vaccine 2013; 31:3577–3584.
- Jackson LA, Neuzil KM, Yu O, et al; Vaccine Safety Datalink. Effectiveness of pneumococcal polysaccharide vaccine in older adults. N Engl J Med 2003; 348:1747–1755.
- Bonten M, Huijts S, Bolkenbaas M, et al. Polysaccharide conjugate vaccine against pneumococcal pneumonia in adults. N Engl J Med 2015; 372:1114–1125.
- Lesprit P, Pedrono G, Molina JM, et al; ANRS 114-Pneumovac Study Group. Immunological efficacy of a prime-boosted pneumococcal vaccination in HIV-infected adults. AIDS 2007; 21:2425–2434.
- Feikin DR, Elie CM, Goetz MB, et al. Randomized trial of the quantitative and functional antibody responses to a 7-valent pneumococcal conjugate vaccine and/or 23-valent polysaccharide vaccine among HIV-infected adults. Vaccine 2001; 20:545–553.
- French N, Gordon SB, Mwalukomo T, et al. A trial of a 7-valent pneumococcal conjugate vaccine in HIV-infected adults. N Engl J Med 2010; 362:812–822.
- Jackson LA, Gurtman A, Rice K, et al. Immunogenicity and safety of a 13-valent pneumococcal conjugate vaccine in adults 70 years of age and older previously vaccinated with 23-valent pneumococcal polysaccharide vaccine. Vaccine 2013; 31:3585–3593.
- Greenberg RN, Gurtman A, French RW, et al. Sequential administration of 13-valent pneumococcal conjugate vaccine and 23-valent pneumococcal polysaccharide vaccine in pneumococcal vaccine-naïve adults 60-64 years of age. Vaccine 2014; 32:2364–2374.
- Centers for Disease Control and Prevention (CDC); Advisory Committee on Immunization Practices. Updated recommendations for prevention of invasive pneumococcal disease among adults using the 23-valent pneumococcal polysaccharide vaccine (PPSV23). MMWR Morb Mortal Wkly Rep 2010: 59:1102–1106.
- Kobayashi M, Bennett NM, Gierke R, et al. Centers for Disease Control and Prevention (CDC). Intervals between PCV13 and PPSV23; Recommendations of the Advisory Committee on Immunization Practices (ACIP). MMWR Morbid Mortal Wkly Rep 2015;64:944-947.
- Department of Health and Human Services; Centers for Medicare and Medicaid Services. Modifications to Medicare Part B coverage of pneumococcal vaccinations. www.cms.gov/Outreach-and-Education/Medicare-Learning-Network-MLN/MLNMattersArticles/Downloads/MM9051.pdf. Accessed May 13, 2016.
- Centers for Disease Control and Prevention (CDC). Use of 13-valent pneumococcal conjugate vaccine and 23-valent pneumococcal polysaccharide vaccine for adults with immunocompromising conditions: recommendations of the Advisory Committee on Immunization Practices (ACIP). MMWR Morb Mortal Wkly Rep 2012; 61:816–819.
- Williams WW, Lu PJ, O’Halloran A, et al; Centers for Disease Control and Prevention (CDC). Noninfluenza vaccination coverage among adults - United States, 2013. MMWR Morb Mortal Wkly Rep 2015; 64:95–102.
- Rehm SJ, File TM, Metersky M, Nichol KL, Schaffner W; National Foundation for Infectious Diseases Pneumococcal Disease Advisory Board. Identifying barriers to adult pneumococcal vaccination: an NFID task force meeting. Postgrad Med 2012; 124:71–79.
- Centers for Disease Control and Prevention (CDC). Vaccines and immunizations. PCV13 (pneumococcal conjugate) vaccine. Recommendations, scenarios and Q&As for healthcare professionals about PCV13 for adults. www.cdc.gov/vaccines/vpd-vac/pneumo/vac-PCV13-adults.htm. Accessed May 13, 2016.
- Harpaz R, Ortega-Sanchez IR, Seward JF; Advisory Committee on Immunization Practices (ACIP) Centers for Disease Control and Prevention (CDC). Prevention of herpes zoster: recommendations of the Advisory Committee on Immunization Practices (ACIP). MMWR Morb Mortal Wkly Rep 2008; 57:1–30.
- Immunization Action Coalition. Ask the experts: diseases & vaccines. Pneumococcal vaccines (PCV13 and PPSV23). www.immunize.org/askexperts/experts_pneumococcal_vaccines.asp. Accessed May 13, 2016.
Streptococcus pneumoniae (the “pneumococcus”) causes a variety of clinical syndromes that range from otitis media to bacteremia, meningitis, and pneumonia. Hardest hit are immunocompromised people and those at the extremes of age. Therefore, preventing disease through pneumococcal vaccination is very important in these groups.
This review summarizes the current guidelines from the Advisory Committee on Immunization Practices (ACIP) of the US Centers for Disease Control and Prevention (CDC) for pneumococcal immunization in adults.
STRIKES THE VERY YOUNG, VERY OLD, AND IMMUNOCOMPROMISED
Invasive pneumococcal disease is defined as infection in which S pneumoniae can be found in a normally sterile site such as the cerebrospinal fluid or blood, and it includes bacteremic pneumonia.1 By far the most common type of pneumococcal disease is pneumonia, followed by bacteremia and meningitis (Figure 1)2,3; about 25% of patients with pneumococcal pneumonia also have bacteremia.2
Invasive pneumococcal disease most often occurs in children age 2 and younger, adults age 65 and older, and people who are immunocompromised. In 2010, the incidence was 3.8 per 100,000 in people ages 18 to 34 but was 10 times higher in the elderly and those with compromised immunity.1
Even now that vaccines are available, invasive pneumococcal disease continues to cause 4,000 deaths per year in the United States.1
TWO INACTIVATED VACCINES
S pneumoniae is a gram-positive coccus with an outer capsule composed of polysaccharides that protect the bacterium from being ingested and killed by host phagocytic cells. Some 91 serotypes of this organism have been identified on the basis of genetic differences in capsular polysaccharide composition.
Currently, two inactivated vaccines are available that elicit antibody responses to the most common pneumococcal serotypes that infect humans.
- PPSV23 (pneumococcal polysaccharide vaccine-23, or Pneumovax 23) contains purified capsular polysaccharides from 23 pneumococcal serotypes.
- PCV13 (pneumococcal conjugate vaccine-13, or Prevnar 13) contains purified capsular polysaccharides from 13 serotypes that are covalently bound to (conjugated with) a carrier protein.
PPSV23 AND PCV13 ARE NOT THE SAME
Apart from the number of serotypes covered, the two vaccines differ in important ways. Both of them elicit a B-cell-mediated immune response, but only PCV13 produces a T-cell-dependent response, which is essential for maturation of the B-cell response and development of immune memory.
PPSV23 generally provides 3 to 5 years of immunity, and repeat doses do not offer additive or “boosted” protection. It is ineffective in children under 2 years of age.
Pneumococcal conjugate vaccine has been available since 2000 for children starting at 2 months of age. Since then it has directly reduced the incidence of invasive pneumococcal disease in children and indirectly in adults. The impact on pneumococcal disease rates in adults has probably been related to reduction in rates of pneumococcal nasopharyngeal carriage in children, another unique benefit of conjugated vaccines.3
In December 2011, the US Food and Drug Administration (FDA) approved PCV13 for adults on the basis of immunologic studies and anticipation that clinical efficacy would be similar to that observed in children.
HOW EFFECTIVE ARE THEY?
The efficacy and safety of PPSV23 and PCV13 have been studied in a variety of patient populations. Though antibody responses to PCV13 were similar to or better than those with PPSV23, no studies of specific correlations between immunologic responses and disease outcomes are available.4,5
In large studies in healthy adults, both vaccines reduced the incidence of invasive pneumococcal disease. A study in more than 47,000 adults age 65 and older showed a significant reduction in pneumococcal bacteremia (hazard ratio 0.56, 95% confidence interval 0.33–0.93) in those who received PPSV23 compared with those who received placebo.6 However, PPSV23 was not effective in preventing nonbacteremic and noninvasive pneumococcal community-acquired pneumonia when all bacterial serotypes were considered.6
In a placebo-controlled trial in more than 84,000 people age 65 and older, PCV13 prevented both nonbacteremic and bacteremic community-acquired pneumococcal pneumonia due to serotypes included in the vaccine (relative risk reduction 45%, P < .007) and overall invasive pneumococcal disease due to serotypes included in the vaccine (relative risk reduction 70%, P < .001).7
Both vaccines have also demonstrated efficacy in immunocompromised adults. Several studies showed an equivalent or superior antibody response to a seven-valent pneumococcal conjugate vaccine (PCV7, which has been replaced by PCV13) compared with PPSV23 in adults with human immunodeficiency virus (HIV) infection.8,9 While specific clinical studies of the efficacy of PCV13 among immunocompromised people are not available, a study of vaccination with PCV7 in 496 people in Malawi, of whom 88% were infected with HIV, found that the vaccine was effective in preventing invasive pneumococcal disease (hazard ratio 26%, 95% confidence interval 0.10–0.70).10
AT-RISK PATIENT POPULATIONS
Since both PPSV23 and PCV13 are approved for use in adults, it is important to understand appropriate indications for their use. The ACIP recommends pneumococcal vaccination in adults at an increased risk of invasive pneumococcal disease: ie, people age 65 and older, at-risk people ages 19 to 64, and people who are immunocompromised or asplenic.
A more robust antibody response has been shown with PCV13 compared to PPSV23 in healthy people.5 Of note, when PPSV23 is given before PCV13, there is a diminished immune response to PCV13.11,12 Therefore, unvaccinated people who will receive both PCV13 and PPSV23 should be given the conjugate vaccine PCV13 first. (See Commonly asked questions.)
ADULTS AGE 65 AND OLDER: ONE DOSE EACH OF PCV13 AND PPSV23
Before September 2014, the ACIP recommended one dose of PPSV23 for adults age 65 and older to prevent invasive pneumococcal disease.13 With evidence that PCV13 also produces an antibody response and is clinically effective against pneumococcal pneumonia in older people, the ACIP now recommends that all adults age 65 and older receive one dose of PCV13 and one dose of PPSV23.3, 14
Based on antibody studies, the ACIP recommends giving PCV13 first and PPSV23 12 months after.11,12 Patients who received PPSV23 at age 65 or older should receive PCV13 at least 1 year after PPSV23 (Figure 2).3,14 Patients who had previously received one dose of PPSV23 before age 65 who are now age 65 or older should receive one dose of PCV13 at least 1 year after PPSV23 and an additional dose of PPSV23 at least 5 years after the first dose of PPSV23 and at least 1 year after the dose of PCV13.3 Patients who received a dose of PCV13 before age 65 do not need an additional dose after age 65.
The Centers for Medicare and Medicaid Services have updated the reimbursement for pneumococcal vaccines to include both PCV13 and PPSV23. Patients can receive one dose of pneumococcal vaccine followed by a different, second pneumococcal vaccine at least 11 full months after the month in which the first pneumococcal vaccine was administered.15
AT-RISK PATIENTS AGES 19 TO 64
Before 2012, the ACIP recommended that patients at risk, including immunocompromised patients and those without a spleen, with cerebrospinal fluid leaks, or with cochlear implants, receive only PPSV23 before age 65.13 In 2010, 50% of cases of invasive pneumococcal disease in immunocompromised adults were due to serotypes contained in PCV13.16 Additionally, according to CDC data from 2013, in adults ages 19 to 64 at risk of pneumococcal disease, only 21.2% had received pneumococcal vaccine.17 With information on epidemiology, safety, and efficacy, as well as expanded FDA approval of PCV13 for adults in 2011, the ACIP updated its guidelines for pneumococcal immunization of adults with immunocompromising conditions in October 2012.16 The updated guidelines now include giving PCV13 to adults at increased risk of invasive pneumococcal disease.16
Adults under age 65 at risk of invasive pneumococcal disease can be further divided into those who are immunocompetent with comorbid conditions, and those with cochlear implants or cerebrospinal fluid leak. (Table 1).16
Patients with cochlear implants or cerebrospinal fluid leaks should receive one dose of PCV13 followed by one dose of PPSV23 8 weeks later. If PPSV23 is given first in this group, PCV13 can be given 1 year later.
Immunocompetent patients with comorbid conditions, including cigarette smoking, chronic heart, liver, or lung disease, asthma, cirrhosis, and diabetes mellitus, should receive one dose of PPSV23 before age 65 (Table 1).16
IMMUNOCOMPROMISED AND ASPLENIC PATIENTS
Immunocompromised patients at risk for invasive pneumococcal disease include patients with functional or anatomic asplenia or immunocompromising conditions such as HIV infection, chronic renal failure, generalized malignancy, solid organ transplant, iatrogenic immunosuppression (eg, due to corticosteroid therapy), and other immunocompromising conditions.16 Patients on corticosteroid therapy are considered immunosuppressed if they take 20 mg or more of prednisone daily (or an equivalent corticosteroid dose) for at least 14 days.16 These immunocompromised patients should receive one dose of PCV13, followed by a PPSV23 dose 8 weeks later and a second PPSV23 dose 5 years after the first.16
The time between vaccinations is also important. If PCV13 is given first, PPSV23 can be given after at least 8 weeks. If PPSV23 is given first, PCV13 should be given after 12 months. The time between PPSV23 doses is 5 years (Figure 3).16
ADDRESSING BARRIERS TO PNEUMOCOCCAL VACCINATION
In 2013, only 59.7% of adults age 65 and older and 21.1% of younger, at-risk adults with immunocompromising conditions had received pneumococcal vaccination.17 Healthcare providers have the opportunity to improve pneumococcal vaccination rates. The National Foundation for Infectious Diseases (www.nfid.org) summarized challenges in vaccinating at-risk patients and recommended strategies to overcome barriers.18
Challenges include the cost of vaccine coverage, limited time (with competing priorities during office appointments or hospitalizations), patient refusal, and knowledge gaps.
Strategies to overcome barriers include incorporating vaccination into protocols and procedures; educating healthcare providers and patients about pneumococcal disease, vaccines, costs, and reimbursement; engaging nonclinical staff members; and monitoring local vaccination rates. However, the most important factor affecting whether adults are vaccinated is whether the healthcare provider recommends it.
AN OPPORTUNITY TO IMPROVE
In the last 30 years, great strides have been made in recognizing and preventing pneumococcal disease, but challenges remain. Adherence to the new ACIP guidelines for pneumococcal vaccination in immunocompromised, at risk and elderly patients is important in reducing invasive pneumococcal disease.
Healthcare providers have the opportunity to improve pneumococcal vaccination rates at outpatient appointments to decrease the burden of invasive pneumococcal disease in at-risk populations. A comprehensive understanding of the guideline recommendations for pneumococcal vaccination can aid the provider in identifying patients who are eligible for vaccination.
Adult pneumococcal immunization rates are low due to missed opportunities. Healthcare providers can improve these rates by viewing every patient encounter as a chance to provide vaccination.
- Centers for Disease Control and Prevention (CDC). Active Bacterial Core surveillance report (ABCs). ABCs Report: Streptococcus pneumoniae, 2010. www.cdc.gov/abcs/reports-findings/survreports/spneu10-orig.html. Accessed May 13, 2016.
- Said MA, Johnson, HL, Nonyane BA, et al. Estimating the burden of pneumococcal pneumonia among adults: a systematic review and meta-analysis of diagnostic techniques. Plos One 2013; 8:e60273.
- Tomczyk S, Bennett NM, Stoecker C, et al; Centers for Disease Control and Prevention (CDC). Use of 13-valent pneumococcal conjugate vaccine and 23-valent pneumococcal polysaccharide vaccine among adults aged ≥ 65 years: recommendations of the Advisory Committee on Immunization Practices (ACIP). MMWR Morb Mortal Wkly Rep 2014; 63:822–825.
- Crum-Cianflone NF, Huppler Hullsiek K, Roediger M, et al; Infectious Disease Clinical Research Program HIV Working Group. A randomized clinical trial comparing revaccination with pneumococcal conjugate vaccine to polysaccharide vaccine among HIV-infected adults. J Infect Dis 2010: 202:1114–1125.
- Jackson LA, Gurtman A, van Cleeff M, et al. Immunogenicity and safety of a 13-valent pneumococcal conjugate vaccine compared to a 23-valent pneumococcal polysaccharide vaccine in pneumococcal vaccine-naïve adults. Vaccine 2013; 31:3577–3584.
- Jackson LA, Neuzil KM, Yu O, et al; Vaccine Safety Datalink. Effectiveness of pneumococcal polysaccharide vaccine in older adults. N Engl J Med 2003; 348:1747–1755.
- Bonten M, Huijts S, Bolkenbaas M, et al. Polysaccharide conjugate vaccine against pneumococcal pneumonia in adults. N Engl J Med 2015; 372:1114–1125.
- Lesprit P, Pedrono G, Molina JM, et al; ANRS 114-Pneumovac Study Group. Immunological efficacy of a prime-boosted pneumococcal vaccination in HIV-infected adults. AIDS 2007; 21:2425–2434.
- Feikin DR, Elie CM, Goetz MB, et al. Randomized trial of the quantitative and functional antibody responses to a 7-valent pneumococcal conjugate vaccine and/or 23-valent polysaccharide vaccine among HIV-infected adults. Vaccine 2001; 20:545–553.
- French N, Gordon SB, Mwalukomo T, et al. A trial of a 7-valent pneumococcal conjugate vaccine in HIV-infected adults. N Engl J Med 2010; 362:812–822.
- Jackson LA, Gurtman A, Rice K, et al. Immunogenicity and safety of a 13-valent pneumococcal conjugate vaccine in adults 70 years of age and older previously vaccinated with 23-valent pneumococcal polysaccharide vaccine. Vaccine 2013; 31:3585–3593.
- Greenberg RN, Gurtman A, French RW, et al. Sequential administration of 13-valent pneumococcal conjugate vaccine and 23-valent pneumococcal polysaccharide vaccine in pneumococcal vaccine-naïve adults 60-64 years of age. Vaccine 2014; 32:2364–2374.
- Centers for Disease Control and Prevention (CDC); Advisory Committee on Immunization Practices. Updated recommendations for prevention of invasive pneumococcal disease among adults using the 23-valent pneumococcal polysaccharide vaccine (PPSV23). MMWR Morb Mortal Wkly Rep 2010: 59:1102–1106.
- Kobayashi M, Bennett NM, Gierke R, et al. Centers for Disease Control and Prevention (CDC). Intervals between PCV13 and PPSV23; Recommendations of the Advisory Committee on Immunization Practices (ACIP). MMWR Morbid Mortal Wkly Rep 2015;64:944-947.
- Department of Health and Human Services; Centers for Medicare and Medicaid Services. Modifications to Medicare Part B coverage of pneumococcal vaccinations. www.cms.gov/Outreach-and-Education/Medicare-Learning-Network-MLN/MLNMattersArticles/Downloads/MM9051.pdf. Accessed May 13, 2016.
- Centers for Disease Control and Prevention (CDC). Use of 13-valent pneumococcal conjugate vaccine and 23-valent pneumococcal polysaccharide vaccine for adults with immunocompromising conditions: recommendations of the Advisory Committee on Immunization Practices (ACIP). MMWR Morb Mortal Wkly Rep 2012; 61:816–819.
- Williams WW, Lu PJ, O’Halloran A, et al; Centers for Disease Control and Prevention (CDC). Noninfluenza vaccination coverage among adults - United States, 2013. MMWR Morb Mortal Wkly Rep 2015; 64:95–102.
- Rehm SJ, File TM, Metersky M, Nichol KL, Schaffner W; National Foundation for Infectious Diseases Pneumococcal Disease Advisory Board. Identifying barriers to adult pneumococcal vaccination: an NFID task force meeting. Postgrad Med 2012; 124:71–79.
- Centers for Disease Control and Prevention (CDC). Vaccines and immunizations. PCV13 (pneumococcal conjugate) vaccine. Recommendations, scenarios and Q&As for healthcare professionals about PCV13 for adults. www.cdc.gov/vaccines/vpd-vac/pneumo/vac-PCV13-adults.htm. Accessed May 13, 2016.
- Harpaz R, Ortega-Sanchez IR, Seward JF; Advisory Committee on Immunization Practices (ACIP) Centers for Disease Control and Prevention (CDC). Prevention of herpes zoster: recommendations of the Advisory Committee on Immunization Practices (ACIP). MMWR Morb Mortal Wkly Rep 2008; 57:1–30.
- Immunization Action Coalition. Ask the experts: diseases & vaccines. Pneumococcal vaccines (PCV13 and PPSV23). www.immunize.org/askexperts/experts_pneumococcal_vaccines.asp. Accessed May 13, 2016.
KEY POINTS
- At highest risk of invasive pneumococcal disease are people who are immunocompromised, very young, or very old.
- Pneumococcal polysaccharide vaccine-23 (PPSV23) covers more serotypes of S pneumoniae than pneumococcal conjugate vaccine-13 (PCV13), but the latter induces a stronger antibody response.
- The combination of both vaccines in sequence produces a better antibody response than either vaccine alone.
- The Advisory Committee on Immunization Practices now recommends that immunocompromised and asplenic adults who need pneumococcal vaccination receive both vaccines, preferably PCV13 first, followed by PPSV23 8 weeks later. Those who have already received PPSV23 can receive PCV13 after at least 1 year has passed.
- People with asplenia or immunocompromising conditions should receive a second dose of PPSV23 at least 5 years after the first dose.
- Vaccination schedules and information are available from the US Centers for Disease Control and Prevention at www.cdc.gov.

How can I predict bleeding in my elderly patient taking anticoagulants?
We have tools to predict bleeding risk, but their predictive value is modest, and the estimated risk of bleeding is often outweighed by the benefits of anticoagulant therapy.
Anticoagulant therapy is commonly prescribed for conditions that disproportionately affect the elderly, including atrial fibrillation, venous thromboembolism, and valvular heart disease. Though anticoagulants are highly effective in preventing clots, they also significantly increase the risk of bleeding. Since older age is a risk factor for bleeding as well as thrombosis, it is essential to weigh the risks and benefits of anticoagulants for each patient.
WHAT KINDS OF BLEEDING DEVELOP IN PATIENTS ON ANTICOAGULANTS?
Patients taking anticoagulants have roughly double the risk of bleeding compared with patients not on anticoagulants.1 Bleeding rates tend to be slightly higher in patients taking anticoagulants for venous thromboembolism than in those taking them for atrial fibrillation. The average yearly risk of a “major” anticoagulant-associated bleeding event (eg, requiring transfusion or intervention or occurring in a critical anatomic site) is about 2% to 3%, with most of the bleeding being gastrointestinal.2
Intracranial hemorrhage is by far the most deadly complication of anticoagulant therapy: it causes 90% of deaths and disability from warfarin-associated hemorrhage and is associated with a death rate over 50%; however, it is much less common than gastrointestinal bleeding.3 Anticoagulant therapy increases the risk of intracranial hemorrhage by only 0.2% per year.1
RISK-PREDICTION TOOLS HAVE LIMITATIONS
Not all patients have the same risk of bleeding when taking anticoagulants. Many factors in addition to advanced age have been associated with increased bleeding risk, including coexisting medical conditions (such as malignancy, prior stroke or bleeding event, and renal insufficiency), medications (particularly aspirin, nonsteroidal anti-inflammatory drugs, and other antiplatelet drugs), and the timing and intensity of anticoagulation therapy.4
Scoring tools have been developed to identify patients at higher risk of bleeding (Table 1).4–9 The various schemes incorporate many of the same variables, such as older age, renal impairment, and history of bleeding, but some include additional risk factors while others are more parsimonious. They also differ in how individual risk factors are weighted to generate a final risk score.
In terms of predictive ability, none of the available risk schemes appears to be vastly superior, and their ability to predict hemorrhage is modest at best. There is also no universal or well-established threshold at which the risk of bleeding is so high that one would not consider anticoagulants. In fact, a “high-risk” patient may have an aggregate bleeding rate of only 4% to 6% per year. Using risk schemes such as ATRIA,5 HEMORR2HAGES,6 and HAS-BLED7 may be more useful because they provide an estimate of bleeding risk for each point on the scale.
Moreover, the current tools to predict bleeding risk have several other limitations. They were developed in patients already taking anticoagulants and so probably underestimate the actual risk of hemorrhage, as people who could not take anticoagulants were excluded, most likely because they were at high risk of bleeding. Therefore, bleeding risk tools probably apply best to a patient for whom anticoagulation can be considered.
Some clinical variables are necessarily broad. For example, “prior bleeding” is a risk factor included in several risk scores, but does not distinguish between massive variceal bleeding and minor hemorrhoidal bleeding.
Risk scores do not effectively predict intracranial hemorrhage.
Finally, these risk tools were developed in patients taking vitamin K antagonists, and it is not yet established that they can effectively predict hemorrhage related to other, newer anticoagulants.
WHEN DOES BLEEDING RISK OUTWEIGH ANTICOAGULATION BENEFIT?
For patients with atrial fibrillation, the net clinical benefit of anticoagulation (strokes prevented minus bleeding events induced) increases as the risk of stroke rises. Updated guidelines for managing atrial fibrillation now recommend anticoagulation for most patients.10
For most older patients with atrial fibrillation, the decision to anticoagulate may not change even if a bleeding risk tool indicates a high bleeding risk.11 For example, a patient with a history of ischemic stroke will generally derive more benefit than harm from anticoagulants. The primary exception is in patients with prior lobar intracranial hemorrhage, because of the high risk of rebleeding and the worse outcomes associated with intracranial hemorrhage.12 As a general rule, most patients with atrial fibrillation and an additional risk factor for stroke should be considered for anticoagulant therapy unless they have a history of lobar intracranial hemorrhage.
Anticoagulation may be deferred if the patient is at the lower end of the stroke risk spectrum and if the bleeding risk is calculated to be high. However, as noted before, current bleeding risk tools probably do not capture the experiences of patients at the extremes of high bleeding risk, so clinical judgment continues to be important. In addition, forgoing anticoagulation could be reasonable even in patients at high risk for recurrent stroke if their life expectancy is limited, if anticoagulation is unacceptably burdensome, or if it is not within their goals and preferences.
WHAT ABOUT FALL RISK?
Fall risk commonly deters clinicians from prescribing anticoagulants because of the fear of causing intracranial hemorrhage. In particular, falls increase the risk for subdural hematoma, which has a death rate comparable to that of ischemic stroke.13
Studies have had difficulty quantifying the exact risk associated with falls because these patients are less likely to be prescribed anticoagulants. One decision analysis estimated that a person would have to fall about 300 times per year before the risk of intracranial hemorrhage outweighed the benefits from stroke reduction.14 Studies have found that patients at high risk of falls have a higher risk of intracranial hemorrhage, but that this risk is counterbalanced by an even greater risk of ischemic stroke.15
Therefore, if the baseline risk of ischemic stroke is high, anticoagulation is still favored.
WHEN SHOULD I USE A BLEEDING RISK TOOL?
Despite their limitations, bleeding risk tools are useful in clinical practice when estimates of bleeding risk affect clinical behavior. They are most helpful for patients at the lower end of the stroke or thromboembolism risk spectrum, where the decision to anticoagulate is strongly influenced by bleeding risk. Risk tools may also be helpful when counseling patients about their bleeding risk off and on anticoagulants.
Finally, recognizing that a patient is at high bleeding risk may lead the clinician to consider closer monitoring of anticoagulants or to implement strategies to reduce the risk.
- Hart RG, Pearce LA, Aguilar MI. Meta-analysis: antithrombotic therapy to prevent stroke in patients who have nonvalvular atrial fibrillation. Ann Intern Med 2007; 146:857–867.
- Lopes LC, Spencer FA, Neumann I, et al. Bleeding risk in atrial fibrillation patients taking vitamin K antagonists: systematic review and meta-analysis. Clin Pharmacol Ther 2013; 94:367–375.
- Fang MC, Go AS, Chang Y, et al. Death and disability from warfarin-associated intracranial and extracranial hemorrhages. Am J Med 2007; 120:700–705.
- Lopes RD, Crowley MJ, Shah BR, et al. Stroke prevention in atrial fibrillation. Rockville (MD): Agency for Healthcare Research and Quality (US); 2013 Aug. Report No.: 13-EHC113-EF.
- Fang MC, Go AS, Chang Y, et al. A new risk scheme to predict warfarin-associated hemorrhage: the ATRIA (Anticoagulation and Risk Factors in Atrial Fibrillation) Study. J Am Coll Cardiol 2011; 58:395–401.
- Gage BF, Yan Y, Milligan PE, et al. Clinical classification schemes for predicting hemorrhage: results from the National Registry of Atrial Fibrillation (NRAF) Am Heart J 2006; 151:713–719.
- Pisters R, Lane DA, Nieuwlaat R, de Vos CB, Crijns HJ, Lip GY. A novel user-friendly score (HAS-BLED) to assess 1-year risk of major bleeding in patients with atrial fibrillation: the Euro Heart Survey. Chest 2010; 138:1093–1100.
- Beyth RJ, Quinn LM, Landefeld CS. Prospective evaluation of an index for predicting the risk of major bleeding in outpatients treated with warfarin. Am J Med 1998; 105:91–99.
- Nieto JA, Solano R, Iglesias NT, et al, for the RIETE Investigators. Validation of a score for predicting fatal bleeding in patients receiving anticoagulation for venous thromboembolism. Thrombosis Res 2013; 132:175–179.
- January CT, Wann LS, Alpert JS, et al; ACC/AHA Task Force Members. 2014 AHA/ACC/HRS guideline for the management of patients with atrial fibrillation: executive summary: a report of the American College of Cardiology/American Heart Association Task Force on practice guidelines and the Heart Rhythm Society. Circulation 2014; 130:2071–2104.
- Singer DE, Chang Y, Fang MC, et al. The net clinical benefit of warfarin anticoagulation in atrial fibrillation. Ann Intern Med 2009; 151:297–305.
- Eckman MH, Rosand J, Knudsen KA, Singer DE, Greenberg SM. Can patients be anticoagulated after intracerebral hemorrhage? A decision analysis. Stroke 2003; 34:1710–1716.
- Fang MC, Go AS, Chang Y, et al. Thirty-day mortality after ischemic stroke and intracranial hemorrhage in patients with atrial fibrillation on and off anticoagulants. Stroke 2012; 43:1795–1799.
- Man-Son-Hing M, Laupacis A. Anticoagulant-related bleeding in older persons with atrial fibrillation: physicians' fears often unfounded. Arch Intern Med 2003; 163:1580–1586.
- Gage BF, Birman-Deych E, Kerzner R, Radford MJ, Nilasena DS, Rich MW. Incidence of intracranial hemorrhage in patients with atrial fibrillation who are prone to fall. Am J Med 2005; 118:612–617.
We have tools to predict bleeding risk, but their predictive value is modest, and the estimated risk of bleeding is often outweighed by the benefits of anticoagulant therapy.
Anticoagulant therapy is commonly prescribed for conditions that disproportionately affect the elderly, including atrial fibrillation, venous thromboembolism, and valvular heart disease. Though anticoagulants are highly effective in preventing clots, they also significantly increase the risk of bleeding. Since older age is a risk factor for bleeding as well as thrombosis, it is essential to weigh the risks and benefits of anticoagulants for each patient.
WHAT KINDS OF BLEEDING DEVELOP IN PATIENTS ON ANTICOAGULANTS?
Patients taking anticoagulants have roughly double the risk of bleeding compared with patients not on anticoagulants.1 Bleeding rates tend to be slightly higher in patients taking anticoagulants for venous thromboembolism than in those taking them for atrial fibrillation. The average yearly risk of a “major” anticoagulant-associated bleeding event (eg, requiring transfusion or intervention or occurring in a critical anatomic site) is about 2% to 3%, with most of the bleeding being gastrointestinal.2
Intracranial hemorrhage is by far the most deadly complication of anticoagulant therapy: it causes 90% of deaths and disability from warfarin-associated hemorrhage and is associated with a death rate over 50%; however, it is much less common than gastrointestinal bleeding.3 Anticoagulant therapy increases the risk of intracranial hemorrhage by only 0.2% per year.1
RISK-PREDICTION TOOLS HAVE LIMITATIONS
Not all patients have the same risk of bleeding when taking anticoagulants. Many factors in addition to advanced age have been associated with increased bleeding risk, including coexisting medical conditions (such as malignancy, prior stroke or bleeding event, and renal insufficiency), medications (particularly aspirin, nonsteroidal anti-inflammatory drugs, and other antiplatelet drugs), and the timing and intensity of anticoagulation therapy.4
Scoring tools have been developed to identify patients at higher risk of bleeding (Table 1).4–9 The various schemes incorporate many of the same variables, such as older age, renal impairment, and history of bleeding, but some include additional risk factors while others are more parsimonious. They also differ in how individual risk factors are weighted to generate a final risk score.
In terms of predictive ability, none of the available risk schemes appears to be vastly superior, and their ability to predict hemorrhage is modest at best. There is also no universal or well-established threshold at which the risk of bleeding is so high that one would not consider anticoagulants. In fact, a “high-risk” patient may have an aggregate bleeding rate of only 4% to 6% per year. Using risk schemes such as ATRIA,5 HEMORR2HAGES,6 and HAS-BLED7 may be more useful because they provide an estimate of bleeding risk for each point on the scale.
Moreover, the current tools to predict bleeding risk have several other limitations. They were developed in patients already taking anticoagulants and so probably underestimate the actual risk of hemorrhage, as people who could not take anticoagulants were excluded, most likely because they were at high risk of bleeding. Therefore, bleeding risk tools probably apply best to a patient for whom anticoagulation can be considered.
Some clinical variables are necessarily broad. For example, “prior bleeding” is a risk factor included in several risk scores, but does not distinguish between massive variceal bleeding and minor hemorrhoidal bleeding.
Risk scores do not effectively predict intracranial hemorrhage.
Finally, these risk tools were developed in patients taking vitamin K antagonists, and it is not yet established that they can effectively predict hemorrhage related to other, newer anticoagulants.
WHEN DOES BLEEDING RISK OUTWEIGH ANTICOAGULATION BENEFIT?
For patients with atrial fibrillation, the net clinical benefit of anticoagulation (strokes prevented minus bleeding events induced) increases as the risk of stroke rises. Updated guidelines for managing atrial fibrillation now recommend anticoagulation for most patients.10
For most older patients with atrial fibrillation, the decision to anticoagulate may not change even if a bleeding risk tool indicates a high bleeding risk.11 For example, a patient with a history of ischemic stroke will generally derive more benefit than harm from anticoagulants. The primary exception is in patients with prior lobar intracranial hemorrhage, because of the high risk of rebleeding and the worse outcomes associated with intracranial hemorrhage.12 As a general rule, most patients with atrial fibrillation and an additional risk factor for stroke should be considered for anticoagulant therapy unless they have a history of lobar intracranial hemorrhage.
Anticoagulation may be deferred if the patient is at the lower end of the stroke risk spectrum and if the bleeding risk is calculated to be high. However, as noted before, current bleeding risk tools probably do not capture the experiences of patients at the extremes of high bleeding risk, so clinical judgment continues to be important. In addition, forgoing anticoagulation could be reasonable even in patients at high risk for recurrent stroke if their life expectancy is limited, if anticoagulation is unacceptably burdensome, or if it is not within their goals and preferences.
WHAT ABOUT FALL RISK?
Fall risk commonly deters clinicians from prescribing anticoagulants because of the fear of causing intracranial hemorrhage. In particular, falls increase the risk for subdural hematoma, which has a death rate comparable to that of ischemic stroke.13
Studies have had difficulty quantifying the exact risk associated with falls because these patients are less likely to be prescribed anticoagulants. One decision analysis estimated that a person would have to fall about 300 times per year before the risk of intracranial hemorrhage outweighed the benefits from stroke reduction.14 Studies have found that patients at high risk of falls have a higher risk of intracranial hemorrhage, but that this risk is counterbalanced by an even greater risk of ischemic stroke.15
Therefore, if the baseline risk of ischemic stroke is high, anticoagulation is still favored.
WHEN SHOULD I USE A BLEEDING RISK TOOL?
Despite their limitations, bleeding risk tools are useful in clinical practice when estimates of bleeding risk affect clinical behavior. They are most helpful for patients at the lower end of the stroke or thromboembolism risk spectrum, where the decision to anticoagulate is strongly influenced by bleeding risk. Risk tools may also be helpful when counseling patients about their bleeding risk off and on anticoagulants.
Finally, recognizing that a patient is at high bleeding risk may lead the clinician to consider closer monitoring of anticoagulants or to implement strategies to reduce the risk.
- Hart RG, Pearce LA, Aguilar MI. Meta-analysis: antithrombotic therapy to prevent stroke in patients who have nonvalvular atrial fibrillation. Ann Intern Med 2007; 146:857–867.
- Lopes LC, Spencer FA, Neumann I, et al. Bleeding risk in atrial fibrillation patients taking vitamin K antagonists: systematic review and meta-analysis. Clin Pharmacol Ther 2013; 94:367–375.
- Fang MC, Go AS, Chang Y, et al. Death and disability from warfarin-associated intracranial and extracranial hemorrhages. Am J Med 2007; 120:700–705.
- Lopes RD, Crowley MJ, Shah BR, et al. Stroke prevention in atrial fibrillation. Rockville (MD): Agency for Healthcare Research and Quality (US); 2013 Aug. Report No.: 13-EHC113-EF.
- Fang MC, Go AS, Chang Y, et al. A new risk scheme to predict warfarin-associated hemorrhage: the ATRIA (Anticoagulation and Risk Factors in Atrial Fibrillation) Study. J Am Coll Cardiol 2011; 58:395–401.
- Gage BF, Yan Y, Milligan PE, et al. Clinical classification schemes for predicting hemorrhage: results from the National Registry of Atrial Fibrillation (NRAF) Am Heart J 2006; 151:713–719.
- Pisters R, Lane DA, Nieuwlaat R, de Vos CB, Crijns HJ, Lip GY. A novel user-friendly score (HAS-BLED) to assess 1-year risk of major bleeding in patients with atrial fibrillation: the Euro Heart Survey. Chest 2010; 138:1093–1100.
- Beyth RJ, Quinn LM, Landefeld CS. Prospective evaluation of an index for predicting the risk of major bleeding in outpatients treated with warfarin. Am J Med 1998; 105:91–99.
- Nieto JA, Solano R, Iglesias NT, et al, for the RIETE Investigators. Validation of a score for predicting fatal bleeding in patients receiving anticoagulation for venous thromboembolism. Thrombosis Res 2013; 132:175–179.
- January CT, Wann LS, Alpert JS, et al; ACC/AHA Task Force Members. 2014 AHA/ACC/HRS guideline for the management of patients with atrial fibrillation: executive summary: a report of the American College of Cardiology/American Heart Association Task Force on practice guidelines and the Heart Rhythm Society. Circulation 2014; 130:2071–2104.
- Singer DE, Chang Y, Fang MC, et al. The net clinical benefit of warfarin anticoagulation in atrial fibrillation. Ann Intern Med 2009; 151:297–305.
- Eckman MH, Rosand J, Knudsen KA, Singer DE, Greenberg SM. Can patients be anticoagulated after intracerebral hemorrhage? A decision analysis. Stroke 2003; 34:1710–1716.
- Fang MC, Go AS, Chang Y, et al. Thirty-day mortality after ischemic stroke and intracranial hemorrhage in patients with atrial fibrillation on and off anticoagulants. Stroke 2012; 43:1795–1799.
- Man-Son-Hing M, Laupacis A. Anticoagulant-related bleeding in older persons with atrial fibrillation: physicians' fears often unfounded. Arch Intern Med 2003; 163:1580–1586.
- Gage BF, Birman-Deych E, Kerzner R, Radford MJ, Nilasena DS, Rich MW. Incidence of intracranial hemorrhage in patients with atrial fibrillation who are prone to fall. Am J Med 2005; 118:612–617.
Predicting is tough, especially about the future
Quinn and Fang, in this issue of the Journal discuss efforts to predict bleeding complications associated with anticoagulant therapy in elderly patients. They note, as others have suggested, that we may fear the risk of severe anticoagulant-associated bleeding more than is warranted based on the data. The level of that fear and the risk of bleeding depend on the specific need for anticoagulant therapy in a given patient and on the risk of serious adverse outcomes from thrombosis that the anticoagulation is supposed to prevent. All prediction models are based on an “average” patient with certain characteristics. But of course none of our patients are average.
The studies Quinn and Fang discuss focus on vitamin K antagonist therapy. There is probably not enough practice-based or trial-based evidence yet to evaluate the risks associated with the new generation of anticoagulants.
All prediction models have limitations. The recent discussion on establishing a risk-based strategy to guide institution of lipid-lowering therapy highlights the challenges inherent in trying to base therapeutic decisions on predictive models. But however imperfect, models are still widely used to predict fracture risk in patients being considered for bone antiresorptive therapy and to predict the need for anticoagulation therapy or further diagnostic testing in patients with potential deep vein thrombosis or atrial fibrillation.
The decision to start anticoagulation in an elderly patient is often informed by the possibility of an easily recognized and feared risk factor for bleeding complications—falling. Falls are certainly important and are a major contributor to subdural hematoma and complicated hip fracture. But there are more common causes of severe bleeding complications that are less easily predicted by functional assessment of the patient. Nonetheless, fall risk can be lessened by prescribing exercise programs such as tai chi to improve balance, limiting the use of drugs associated with falls in the elderly, perhaps correcting hyponatremia, and testing for orthostatic hypotension as part of the physical examination. (Mild compression stockings and medication adjustment may reduce orthostasis.) Some of these interventions are easily accomplished, and probably should be done with all of our elderly and frail patients.
As we build more risk calculators into our electronic medical records, we must continue to consider their limitations as well as their specific utility. To paraphrase Yogi Berra, making predictions is tough, especially about the future.

Self-monitoring of blood glucose: Advice for providers and patients
Self-monitoring of blood glucose is a critical part of diabetes management, with many benefits. It promotes personal responsibility and provides opportunities for better control. It allows for detection of blood glucose extremes, thus helping to reduce blood glucose fluctuations. It also helps both the patient and the provider make informed decisions and can help reduce microvascular and macrovascular complications.
Studies have shown that hemoglobin A1c levels are lower if glucose is tested more frequently.1 Most people with type 1 diabetes and many with type 2 diabetes self-monitor their blood glucose levels.
This article discusses who should monitor their blood glucose and how often, types of meters and supplies available, advances in technology, and limitations of current blood glucose meters.
WHETHER AND HOW OFTEN TO MONITOR
In clinical practice, advice about whether patients should monitor their blood glucose levels and how often to do it depends on the type of diabetes therapy, the need to titrate the dose or change the regimen, and the patient’s preferences, dexterity, and visual acuity. The frequency of testing also often depends on financial considerations and insurance coverage.
In patients with type 1 diabetes and insulin-treated type 2 diabetes, the role of glucose self-monitoring is clear. The American Diabetes Association (ADA) recommends that patients receiving multiple insulin injections daily or on an insulin pump measure their blood glucose at least before meals and snacks, occasionally after meals, at bedtime, before exercise, when they suspect their blood glucose level is low, after treating low blood glucose until they are normoglycemic, and before critical tasks such as driving.2
The Diabetes Control and Complications Trial (DCCT)3 and the DCCT/Epidemiology of Diabetes Interventions and Complications (DCCT/EDIC) study4 showed that intensive insulin therapy effectively delays the onset and slows the progression of microvascular and macrovacscular disease. Self-monitoring of blood glucose is an integral part of intensive insulin therapy, allowing for dose adjustments based on immediate blood glucose readings, thereby reducing the risks of hyperglycemia and hypoglycemia.
For patients taking a single daily dose of basal insulin, fasting blood glucose values are often used to titrate the basal insulin dose.3
Patients with type 2 diabetes on oral hypoglycemic agents such as sulfonylureas and meglitinides are at risk of hypoglycemia. Although a review of the literature could find no studies to support recommendations for specific testing frequency for patients taking these medications, it stands to reason that the potential for hypoglycemia would indicate a clear need for regular self-monitoring. Checking the blood glucose once or twice daily, typically fasting, 2 hours after the largest meal or at bedtime, provides useful data points for the patient and the provider. As with patients on insulin, testing before driving also reduces the risk of a motor vehicle accident caused by hypoglycemia.
In any patient who is testing one or two times per day, staggering the testing time on different days can give valuable insight into glucose control at different times of day, including after meals and at night.
In patients on nonintensive regimens and at low risk of hypoglycemia, glucose self-monitoring may be less critical. Nonintensive regimens with a low risk of hypoglycemia include diet and exercise alone and diet and exercise with a medication that is not insulin or an insulin secretagogue. In these cases, self-monitoring is often not seen as clinically useful or cost-effective, and hemoglobin A1c is used as a marker.
Admittedly, few randomized controlled trials have been done in which patients were treated according to identical protocols except for glucose self-monitoring, but outcomes from the published studies support the use of structured self-monitoring of blood glucose for improvement in clinical outcomes and quality of life when self-monitoring is incorporated into a comprehensive management plan.5–9 By providing feedback, self-monitoring encourages patients to actively participate in controlling and treating their disease. It helps them to recognize the impact of blood glucose on their own self-management decisions in the areas of diet, exercise, stress management, and medications. Therefore, the ADA recommends that healthcare providers encourage their patients to perform self-monitoring even if on nonintensive regimens. For these patients, checking even two or three times per week can help them to learn about the factors that affect their blood glucose.2
BLOOD GLUCOSE TARGETS
The ADA2 recommends the following glycemic goals for most nonpregnant adults:
- Fasting and premeal—80–130 mg/dL
- 2-hour postprandial—less than 180 mg/dL
- Bedtime—100–150 mg/dL.
However, diabetes management should be individualized on the basis of age and other comorbidities. For example, geriatric patients who have frequent episodes of hypoglycemia are prone to more harm than benefit from intensifying therapy to achieve these targets. Consequently, they may be candidates for more relaxed goals to avoid episodes of dangerous hypoglycemia.
When discussing blood glucose targets, an important but often overlooked concern is how the patient perceives the results. Providers and patients alike often describe readings as “good” or “bad.” This interpretation can lead to feelings of disappointment and failure in the patient and frustration in the provider. Instead, high blood glucose readings should be viewed as a way to identify opportunities for change. Patients may be more willing to check and even log their blood glucose levels if they see this information as an instrument to be used in the collaborative relationship with their provider.
CHOOSING A BLOOD GLUCOSE METER
Barring any special needs of the patient, meters are often selected on the basis of the patients’ insurance coverage for self-monitoring supplies (test strips and lancets), because of the high cost of test strips when purchased out-of-pocket. Meters themselves are usually relatively inexpensive, since the manufacturers commonly give them away as free samples to providers, who pass them along to patients. They also can often be purchased using coupons at a significant discount.
Without insurance coverage, test strips can cost $0.83 to $1.76 per strip for the most popular brands of meters. For patients without insurance coverage for supplies, the lowest-cost test strips currently available are for the ReliOn Prime Blood Glucose Monitoring System (ie, meter) sold at Walmart. Although ReliOn meters are not given out as samples in providers’ offices, the manufacturer’s suggested retail price is $16.24. More importantly, the suggested retail price for ReliOn Prime test strips is $9.00 for a bottle of 50 strips, or $0.18 per strip.10
For patients with special needs
For patients with special needs, there are meters that can make self-monitoring more convenient. For a patient who has problems with dexterity, grasping small test strips may be difficult. Two options are:
- Accu-Chek Compact Plus, which uses a 17-strip drum loaded into the meter
- Bayer Breeze2, which uses a 10-strip disk.
Both of the above dispense one strip at a time and eliminate the need to handle individual test strips.
Patients with poor visual acuity also face challenges with self-monitoring. Meters with options such as a backlight, a color screen, or a large display can help. Other meters talk, allowing patients to hear settings and blood glucose results. Examples are:
- Prodigy Autocode
- Prodigy Voice
- Embrace.
Other meter options depend on patient preference. Features that can affect patient choice include the ability to flag readings (eg, premeal, postmeal, exercise) and transfer data to other devices, blood sample size, meter size, touchscreen, meter memory and storage, rechargeable vs replaceable batteries, and the time it takes the meter to display the glucose reading.
Meters with advanced functions
For patients who want or need more advanced options, meters are now offering more feedback.
The OneTouch Verio family of meters helps patients spot patterns in their blood glucose levels. In addition, the Verio Flex and Verio Sync meters can sync with the OneTouch Reveal mobile app, which provides reports for the patient to view and send to the healthcare provider.
The Accu-Chek Aviva Expert has a bolus calculation function. Settings such as carbohydrate ratios, insulin sensitivity, targets, and active insulin can be programmed into the meter, which uses this information to give the patient dosing suggestions for rapid-acting insulin when carbohydrate intake is entered or blood glucose levels are checked. Another Accu-Chek meter, the Aviva Connect, can wirelessly transmit blood glucose results to the Accu-Chek Connect mobile app.
For a complete and regularly updated list of meters and their features, we encourage patients and healthcare providers to refer to the ADA’s Diabetes Forecast magazine. The magazine publishes a consumer guide every January that includes a comprehensive list of blood glucose meters. Past issues of the guide are available at www.diabetesforecast.org/past-issues-archive.html.
METER ACCURACY
Even though patients and providers use glucose self-monitoring results to make important decisions about diabetes management, the meters have limitations in accuracy. Accuracy comparisons from third-party sources are rare due to the cost of accuracy testing. However, the US Food and Drug Administration (FDA) requires all home glucose meters to meet accuracy standards set by the International Organization for Standardization (ISO). Currently, the FDA uses ISO standard 15197:2003, but ISO has published a revision, ISO standard 15197:2013, with stricter guidelines that have yet to be adopted by the FDA.10,11 Current and future guidelines are shown in Table 1.10
In addition to variations in accuracy that are deemed acceptable by the FDA, there are other more controllable factors that can further affect the accuracy of glucose meter results. Expired test strips, unwashed hands, poor sampling technique, storage of test strips in extreme temperatures or humidity, and a low hematocrit level all can cause inaccurate readings.
If the patient has a low hematocrit, consider recommending a meter proven to have stable performance in the setting of low hematocrit. These meters are highlighted in a 2013 study by Ramljak et al.12
LANCETS, LANCING DEVICES, AND TECHNIQUES
Along with a variety of meters, patients also have an array of lancets and lancing devices from which to choose. Many patients use the brand of lancet device and lancets that come in their meter starter kit, but they can use other brands if desired. For cost-conscious patients, lancets are significantly more affordable than test strips, even for those without insurance coverage. Prices can be as low as $0.03 per lancet for some store-brand 33-gauge lancets. Name-brand lancets are more expensive than store-brand, but at $0.06 to $0.16 per lancet, many patients will even find these to be affordable if they must pay out of pocket.
Special needs may also prompt patients to choose a different lancet device than the one that came with their meter. For patients who have poor dexterity or are afraid to look at needles, the Accu-Chek FastClix lancing device uses drums with six preloaded lancets, eliminating the need to see and handle individual lancets. The FastClix device is included in the starter kits for the Accu-Chek Nano and Accu-Chek Connect meters and can also be ordered separately at pharmacies.
Reducing pain when testing
A common complaint about glucose self-monitoring is that it hurts. Below are some tips for reducing pain when testing:
- Use a new lancet for each blood glucose check.
- Choose a lancet device with a depth gauge and select the lowest setting that allows for a sufficient sample size.
- Lancets come in a variety of sizes, typically from 28 gauge to 33 gauge, so choose a lancet with a smaller gauge (ie, a higher gauge number).
- Poke the side of the fingertip instead of the end or the middle.
- Alternate the fingers instead of repeatedly using the same finger.
- To minimize pain from forceful squeezing of the fingertip to get a sufficient blood sample, start squeezing the palm and push the blood progressively into the fingertip.
- Consider alternate-site testing, especially if you have painful upper-extremity neuropathy.
LOGGING BLOOD GLUCOSE READINGS
Although many meters can automatically transfer their data to mobile devices or computers, patients are still encouraged to log their glucose readings manually. Not only does this give feedback to the provider in the event that the downloading software is not available in that provider’s office, it also allows patients to learn how to identify patterns in their readings and make changes in their diabetes self-management.
In the past, all logging was done on paper forms or in log books, but today’s technology offers other options. Several meters offer downloading software for home use that displays the data in a usable format. Some smartphone apps allow patients to enter glucose readings and other useful diabetes information such as food intake and exercise. Below are examples of smartphone apps that can help patients track glucose levels and much more:
- mySugr (iPhone and Android)
- Glucose Buddy (iPhone and Android)
- OnTrack Diabetes (Android)
- Glucool Diabetes (Android) (also available in a premium version).
- Glooko (iPhone and Android). This app requires purchase of a compatible cable to connect the patient’s phone to the meter, which then allows readings to be transferred directly to the app.
THE ROLE OF THE CERTIFIED DIABETES EDUCATOR
One of the most useful resources available to providers is the assistance of a certified diabetes educator, who can teach a patient the basic operation of a blood glucose meter and educate the patient on all topics discussed in this article and more.
Certified diabetes educators are instrumental in helping patients understand blood glucose targets, the rationale for glucose self-monitoring, logging, pattern management, special features in meters, control testing, and alternate-site testing, and using the results of testing to make meaningful changes in how they self-manage their diabetes. Education should include discussions about topics such as meal planning, exercise, and medications to help patients fully grasp the impact of their daily decisions on their blood glucose control.
- Polonsky WH, Fisher L, Schikman CH, et al. Structured self-monitoring of blood glucose significantly reduces A1C levels in poorly controlled, noninsulin-treated type 2 diabetes: results from the Structured Testing Program study. Diabetes Care 2011; 34:262–267.
- American Diabetes Association (ADA). Standards of medical care in diabetes—2016. Glycemic targets. Diabetes Care 2016; 39(suppl):S39–S46.
- The Diabetes Control and Complications Trial Research Group. The effect of intensive treatment of diabetes on the development and progression of long-term complications in insulin-dependent diabetes mellitus. N Engl J Med 1993; 329:977–986.
- Nathan DM, Cleary PA, Backlund JY, et al; Diabetes Control and Complications Trial/Epidemiology of Diabetes Interventions and Complications (DCCT/EDIC) Study Research Group. Intensive diabetes treatment and cardiovascular disease in patients with type 1 diabetes. N Engl J Med 2005; 353:2643–2653.
- International Diabetes Federation (IDF). IDF guideline on self-monitoring of blood glucose in non-insulin treated type 2 diabetes. www.idf.org/guidelines/self-monitoring. Accessed April 8, 2016.
- Bosi E, Scavini M, Ceriello A, et al; PRISMA Study Group. Intensive structured self-monitoring of blood glucose and glycemic control in noninsulin-treated type 2 diabetes: the PRISMA randomized trial. Diabetes Care 2013; 36:2887–2894.
- Franciosi M, Lucisano G, Pellegrini F, et al; ROSES Study Group. ROSES: role of self-monitoring of blood glucose and intensive education in patients with type 2 diabetes not receiving insulin. A pilot randomized clinical trial. Diabet Med 2011; 28:789–796.
- Durán A, Martín P, Runkle I, et al. Benefits of self-monitoring blood glucose in the management of new-onset type 2 diabetes mellitus: the St Carlos Study, a prospective randomized clinic-based interventional study with parallel groups. J Diabetes 2010; 2:203–211.
- Kempf K, Kruse J, Martin S. ROSSO-in-praxi: a self-monitoring of blood glucose-structured 12-week lifestyle intervention significantly improves glucometabolic control of patients with type 2 diabetes mellitus. Diabetes Technol Ther 2010; 12:547–553.
- Wahowiak L; American Diabetes Association (ADA). Blood glucose meters 2014. www.diabetesforecast.org/2014/Jan/blood-glucose-meters-2014.html. Accessed April 10, 2016.
- International Organization for Standardization (ISO). ISO 15197:2013. In vitro diagnostic test systems—requirements for blood-glucose monitoring systems for self-testing in managing diabetes mellitus. www.iso.org/obp/ui/#iso:std:iso:15197:ed-2:v1:en. Accessed April 8, 2016.
- Ramljak S, Lock JP, Schipper C, et al. Hematocrit interference of blood glucose meters for patient self-measurement. J Diabetes Sci Technol 2013; 7:179–189.
Self-monitoring of blood glucose is a critical part of diabetes management, with many benefits. It promotes personal responsibility and provides opportunities for better control. It allows for detection of blood glucose extremes, thus helping to reduce blood glucose fluctuations. It also helps both the patient and the provider make informed decisions and can help reduce microvascular and macrovascular complications.
Studies have shown that hemoglobin A1c levels are lower if glucose is tested more frequently.1 Most people with type 1 diabetes and many with type 2 diabetes self-monitor their blood glucose levels.
This article discusses who should monitor their blood glucose and how often, types of meters and supplies available, advances in technology, and limitations of current blood glucose meters.
WHETHER AND HOW OFTEN TO MONITOR
In clinical practice, advice about whether patients should monitor their blood glucose levels and how often to do it depends on the type of diabetes therapy, the need to titrate the dose or change the regimen, and the patient’s preferences, dexterity, and visual acuity. The frequency of testing also often depends on financial considerations and insurance coverage.
In patients with type 1 diabetes and insulin-treated type 2 diabetes, the role of glucose self-monitoring is clear. The American Diabetes Association (ADA) recommends that patients receiving multiple insulin injections daily or on an insulin pump measure their blood glucose at least before meals and snacks, occasionally after meals, at bedtime, before exercise, when they suspect their blood glucose level is low, after treating low blood glucose until they are normoglycemic, and before critical tasks such as driving.2
The Diabetes Control and Complications Trial (DCCT)3 and the DCCT/Epidemiology of Diabetes Interventions and Complications (DCCT/EDIC) study4 showed that intensive insulin therapy effectively delays the onset and slows the progression of microvascular and macrovacscular disease. Self-monitoring of blood glucose is an integral part of intensive insulin therapy, allowing for dose adjustments based on immediate blood glucose readings, thereby reducing the risks of hyperglycemia and hypoglycemia.
For patients taking a single daily dose of basal insulin, fasting blood glucose values are often used to titrate the basal insulin dose.3
Patients with type 2 diabetes on oral hypoglycemic agents such as sulfonylureas and meglitinides are at risk of hypoglycemia. Although a review of the literature could find no studies to support recommendations for specific testing frequency for patients taking these medications, it stands to reason that the potential for hypoglycemia would indicate a clear need for regular self-monitoring. Checking the blood glucose once or twice daily, typically fasting, 2 hours after the largest meal or at bedtime, provides useful data points for the patient and the provider. As with patients on insulin, testing before driving also reduces the risk of a motor vehicle accident caused by hypoglycemia.
In any patient who is testing one or two times per day, staggering the testing time on different days can give valuable insight into glucose control at different times of day, including after meals and at night.
In patients on nonintensive regimens and at low risk of hypoglycemia, glucose self-monitoring may be less critical. Nonintensive regimens with a low risk of hypoglycemia include diet and exercise alone and diet and exercise with a medication that is not insulin or an insulin secretagogue. In these cases, self-monitoring is often not seen as clinically useful or cost-effective, and hemoglobin A1c is used as a marker.
Admittedly, few randomized controlled trials have been done in which patients were treated according to identical protocols except for glucose self-monitoring, but outcomes from the published studies support the use of structured self-monitoring of blood glucose for improvement in clinical outcomes and quality of life when self-monitoring is incorporated into a comprehensive management plan.5–9 By providing feedback, self-monitoring encourages patients to actively participate in controlling and treating their disease. It helps them to recognize the impact of blood glucose on their own self-management decisions in the areas of diet, exercise, stress management, and medications. Therefore, the ADA recommends that healthcare providers encourage their patients to perform self-monitoring even if on nonintensive regimens. For these patients, checking even two or three times per week can help them to learn about the factors that affect their blood glucose.2
BLOOD GLUCOSE TARGETS
The ADA2 recommends the following glycemic goals for most nonpregnant adults:
- Fasting and premeal—80–130 mg/dL
- 2-hour postprandial—less than 180 mg/dL
- Bedtime—100–150 mg/dL.
However, diabetes management should be individualized on the basis of age and other comorbidities. For example, geriatric patients who have frequent episodes of hypoglycemia are prone to more harm than benefit from intensifying therapy to achieve these targets. Consequently, they may be candidates for more relaxed goals to avoid episodes of dangerous hypoglycemia.
When discussing blood glucose targets, an important but often overlooked concern is how the patient perceives the results. Providers and patients alike often describe readings as “good” or “bad.” This interpretation can lead to feelings of disappointment and failure in the patient and frustration in the provider. Instead, high blood glucose readings should be viewed as a way to identify opportunities for change. Patients may be more willing to check and even log their blood glucose levels if they see this information as an instrument to be used in the collaborative relationship with their provider.
CHOOSING A BLOOD GLUCOSE METER
Barring any special needs of the patient, meters are often selected on the basis of the patients’ insurance coverage for self-monitoring supplies (test strips and lancets), because of the high cost of test strips when purchased out-of-pocket. Meters themselves are usually relatively inexpensive, since the manufacturers commonly give them away as free samples to providers, who pass them along to patients. They also can often be purchased using coupons at a significant discount.
Without insurance coverage, test strips can cost $0.83 to $1.76 per strip for the most popular brands of meters. For patients without insurance coverage for supplies, the lowest-cost test strips currently available are for the ReliOn Prime Blood Glucose Monitoring System (ie, meter) sold at Walmart. Although ReliOn meters are not given out as samples in providers’ offices, the manufacturer’s suggested retail price is $16.24. More importantly, the suggested retail price for ReliOn Prime test strips is $9.00 for a bottle of 50 strips, or $0.18 per strip.10
For patients with special needs
For patients with special needs, there are meters that can make self-monitoring more convenient. For a patient who has problems with dexterity, grasping small test strips may be difficult. Two options are:
- Accu-Chek Compact Plus, which uses a 17-strip drum loaded into the meter
- Bayer Breeze2, which uses a 10-strip disk.
Both of the above dispense one strip at a time and eliminate the need to handle individual test strips.
Patients with poor visual acuity also face challenges with self-monitoring. Meters with options such as a backlight, a color screen, or a large display can help. Other meters talk, allowing patients to hear settings and blood glucose results. Examples are:
- Prodigy Autocode
- Prodigy Voice
- Embrace.
Other meter options depend on patient preference. Features that can affect patient choice include the ability to flag readings (eg, premeal, postmeal, exercise) and transfer data to other devices, blood sample size, meter size, touchscreen, meter memory and storage, rechargeable vs replaceable batteries, and the time it takes the meter to display the glucose reading.
Meters with advanced functions
For patients who want or need more advanced options, meters are now offering more feedback.
The OneTouch Verio family of meters helps patients spot patterns in their blood glucose levels. In addition, the Verio Flex and Verio Sync meters can sync with the OneTouch Reveal mobile app, which provides reports for the patient to view and send to the healthcare provider.
The Accu-Chek Aviva Expert has a bolus calculation function. Settings such as carbohydrate ratios, insulin sensitivity, targets, and active insulin can be programmed into the meter, which uses this information to give the patient dosing suggestions for rapid-acting insulin when carbohydrate intake is entered or blood glucose levels are checked. Another Accu-Chek meter, the Aviva Connect, can wirelessly transmit blood glucose results to the Accu-Chek Connect mobile app.
For a complete and regularly updated list of meters and their features, we encourage patients and healthcare providers to refer to the ADA’s Diabetes Forecast magazine. The magazine publishes a consumer guide every January that includes a comprehensive list of blood glucose meters. Past issues of the guide are available at www.diabetesforecast.org/past-issues-archive.html.
METER ACCURACY
Even though patients and providers use glucose self-monitoring results to make important decisions about diabetes management, the meters have limitations in accuracy. Accuracy comparisons from third-party sources are rare due to the cost of accuracy testing. However, the US Food and Drug Administration (FDA) requires all home glucose meters to meet accuracy standards set by the International Organization for Standardization (ISO). Currently, the FDA uses ISO standard 15197:2003, but ISO has published a revision, ISO standard 15197:2013, with stricter guidelines that have yet to be adopted by the FDA.10,11 Current and future guidelines are shown in Table 1.10
In addition to variations in accuracy that are deemed acceptable by the FDA, there are other more controllable factors that can further affect the accuracy of glucose meter results. Expired test strips, unwashed hands, poor sampling technique, storage of test strips in extreme temperatures or humidity, and a low hematocrit level all can cause inaccurate readings.
If the patient has a low hematocrit, consider recommending a meter proven to have stable performance in the setting of low hematocrit. These meters are highlighted in a 2013 study by Ramljak et al.12
LANCETS, LANCING DEVICES, AND TECHNIQUES
Along with a variety of meters, patients also have an array of lancets and lancing devices from which to choose. Many patients use the brand of lancet device and lancets that come in their meter starter kit, but they can use other brands if desired. For cost-conscious patients, lancets are significantly more affordable than test strips, even for those without insurance coverage. Prices can be as low as $0.03 per lancet for some store-brand 33-gauge lancets. Name-brand lancets are more expensive than store-brand, but at $0.06 to $0.16 per lancet, many patients will even find these to be affordable if they must pay out of pocket.
Special needs may also prompt patients to choose a different lancet device than the one that came with their meter. For patients who have poor dexterity or are afraid to look at needles, the Accu-Chek FastClix lancing device uses drums with six preloaded lancets, eliminating the need to see and handle individual lancets. The FastClix device is included in the starter kits for the Accu-Chek Nano and Accu-Chek Connect meters and can also be ordered separately at pharmacies.
Reducing pain when testing
A common complaint about glucose self-monitoring is that it hurts. Below are some tips for reducing pain when testing:
- Use a new lancet for each blood glucose check.
- Choose a lancet device with a depth gauge and select the lowest setting that allows for a sufficient sample size.
- Lancets come in a variety of sizes, typically from 28 gauge to 33 gauge, so choose a lancet with a smaller gauge (ie, a higher gauge number).
- Poke the side of the fingertip instead of the end or the middle.
- Alternate the fingers instead of repeatedly using the same finger.
- To minimize pain from forceful squeezing of the fingertip to get a sufficient blood sample, start squeezing the palm and push the blood progressively into the fingertip.
- Consider alternate-site testing, especially if you have painful upper-extremity neuropathy.
LOGGING BLOOD GLUCOSE READINGS
Although many meters can automatically transfer their data to mobile devices or computers, patients are still encouraged to log their glucose readings manually. Not only does this give feedback to the provider in the event that the downloading software is not available in that provider’s office, it also allows patients to learn how to identify patterns in their readings and make changes in their diabetes self-management.
In the past, all logging was done on paper forms or in log books, but today’s technology offers other options. Several meters offer downloading software for home use that displays the data in a usable format. Some smartphone apps allow patients to enter glucose readings and other useful diabetes information such as food intake and exercise. Below are examples of smartphone apps that can help patients track glucose levels and much more:
- mySugr (iPhone and Android)
- Glucose Buddy (iPhone and Android)
- OnTrack Diabetes (Android)
- Glucool Diabetes (Android) (also available in a premium version).
- Glooko (iPhone and Android). This app requires purchase of a compatible cable to connect the patient’s phone to the meter, which then allows readings to be transferred directly to the app.
THE ROLE OF THE CERTIFIED DIABETES EDUCATOR
One of the most useful resources available to providers is the assistance of a certified diabetes educator, who can teach a patient the basic operation of a blood glucose meter and educate the patient on all topics discussed in this article and more.
Certified diabetes educators are instrumental in helping patients understand blood glucose targets, the rationale for glucose self-monitoring, logging, pattern management, special features in meters, control testing, and alternate-site testing, and using the results of testing to make meaningful changes in how they self-manage their diabetes. Education should include discussions about topics such as meal planning, exercise, and medications to help patients fully grasp the impact of their daily decisions on their blood glucose control.
- Polonsky WH, Fisher L, Schikman CH, et al. Structured self-monitoring of blood glucose significantly reduces A1C levels in poorly controlled, noninsulin-treated type 2 diabetes: results from the Structured Testing Program study. Diabetes Care 2011; 34:262–267.
- American Diabetes Association (ADA). Standards of medical care in diabetes—2016. Glycemic targets. Diabetes Care 2016; 39(suppl):S39–S46.
- The Diabetes Control and Complications Trial Research Group. The effect of intensive treatment of diabetes on the development and progression of long-term complications in insulin-dependent diabetes mellitus. N Engl J Med 1993; 329:977–986.
- Nathan DM, Cleary PA, Backlund JY, et al; Diabetes Control and Complications Trial/Epidemiology of Diabetes Interventions and Complications (DCCT/EDIC) Study Research Group. Intensive diabetes treatment and cardiovascular disease in patients with type 1 diabetes. N Engl J Med 2005; 353:2643–2653.
- International Diabetes Federation (IDF). IDF guideline on self-monitoring of blood glucose in non-insulin treated type 2 diabetes. www.idf.org/guidelines/self-monitoring. Accessed April 8, 2016.
- Bosi E, Scavini M, Ceriello A, et al; PRISMA Study Group. Intensive structured self-monitoring of blood glucose and glycemic control in noninsulin-treated type 2 diabetes: the PRISMA randomized trial. Diabetes Care 2013; 36:2887–2894.
- Franciosi M, Lucisano G, Pellegrini F, et al; ROSES Study Group. ROSES: role of self-monitoring of blood glucose and intensive education in patients with type 2 diabetes not receiving insulin. A pilot randomized clinical trial. Diabet Med 2011; 28:789–796.
- Durán A, Martín P, Runkle I, et al. Benefits of self-monitoring blood glucose in the management of new-onset type 2 diabetes mellitus: the St Carlos Study, a prospective randomized clinic-based interventional study with parallel groups. J Diabetes 2010; 2:203–211.
- Kempf K, Kruse J, Martin S. ROSSO-in-praxi: a self-monitoring of blood glucose-structured 12-week lifestyle intervention significantly improves glucometabolic control of patients with type 2 diabetes mellitus. Diabetes Technol Ther 2010; 12:547–553.
- Wahowiak L; American Diabetes Association (ADA). Blood glucose meters 2014. www.diabetesforecast.org/2014/Jan/blood-glucose-meters-2014.html. Accessed April 10, 2016.
- International Organization for Standardization (ISO). ISO 15197:2013. In vitro diagnostic test systems—requirements for blood-glucose monitoring systems for self-testing in managing diabetes mellitus. www.iso.org/obp/ui/#iso:std:iso:15197:ed-2:v1:en. Accessed April 8, 2016.
- Ramljak S, Lock JP, Schipper C, et al. Hematocrit interference of blood glucose meters for patient self-measurement. J Diabetes Sci Technol 2013; 7:179–189.
KEY POINTS
- Glucose self-monitoring not only yields valuable information on which to base diabetes treatment, it also helps motivate patients and keep them engaged in and adherent to their care.
- The cost of test strips varies widely and can be a burden for some patients.
- Meters come with many different features, which patients may or may not need.
- One of the most useful resources at the disposal of providers is the assistance of a certified diabetes educator.