User login
Can higher MAP post cardiac arrest improve neurologic outcomes?
CHICAGO – A European clinical trial that targeted a mean arterial blood pressure after cardiac arrest higher than what the existing guidelines recommend found that the approach was safe, improved blood flow and oxygen to the brain, helped patients recover quicker, and reduced the number of adverse cardiac events, although it did not reduce the extent of anoxic brain damage or improve functional outcomes, the lead investigator reported at the American Heart Association scientific sessions.

The Neuroprotect trial randomly assigned 112 adult survivors of an out-of-hospital cardiac arrest who were unconscious upon admission to two study groups: early goal-directed hemodynamic optimization (EGDHO), in which researchers used a targeted mean arterial pressure (MAP) of 85-100 mm Hg and mixed venous oxygen saturation between 65% and 75% during the first 36 hours after ICU admission; and the standard care group, in which they used the guideline-recommended MAP target of 65 mm Hg, said Koen Ameloot, MD, of East Limburg Hospital in Genk, Belgium.
“EGDHO clearly improved cerebral perfusion and oxygenation, thereby for the first time providing the proof of concept for this new hemodynamic target,” Dr. Ameloot said. “However, this did not result in the reduction of the extent of anoxic brain hemorrhage or effusion rate on MRI or an improvement in functional outcome at 180 days.”
He noted the trial was predicated on improving upon the so-called “two-hit” model of cardiac arrest sequelae: the first hit being the no-flow and low-flow period before achieving restoration of spontaneous circulation; the second hit being hypoperfusion and reperfusion injury during ICU stay.
Dr. Ameloot referenced a study in which he and other coauthors reported that patients with a MAP target of 65 mm Hg “experience a profound drop of cerebral oxygen saturation during the first 12 hours of ICU stay that may cause additional brain damage” (Resuscitation. 2018;123:92-7).
The researchers explored the question of what is the optimal MAP if a target of 65 mm Hg is too low, Dr. Ameloot said. “We showed that maximal brain oxygenation is achieved with a MAP of 100 mm Hg, while lower MAPs were associated with submaximal brain perfusion and higher MAPs with excessive after-load, a reduction in stroke volume, and suboptimal cerebral oxygenation.”
During the 36-hour intervention period, the EGDHO patients received higher doses of norepinephrine, Dr. Ameloot said. “This resulted in significant improvement of cerebral oxygenation during the first 12 hours and was paralleled by significantly higher cerebral perfusion in the subset of patients in whom Doppler measurements were performed,” he said. “While patients allocated to the MAP 65 mm Hg target experienced a profound drop of cerebral oxygenation during the critical first 6-12 hours of ICU stay, cerebral oxygenation was maintained at 67% in patients assigned to EGDHO.”
However, the rate of anoxic brain damage, measured as the percentage of irreversibly damaged anoxic voxels on diffusion-weighted MRI – the primary endpoint of the study – was actually higher in the EGDHO group, 16% vs. 12%, Dr. Ameloot said. “The percentage of anoxic voxels was only a poor predictor of favorable neurological outcome at 180 days, questioning the validity of the primary endpoint,” he said. He also noted that 23% of the trial participants did not have an MRI scan because of higher than expected 5-day rates of death.
“The percentage of patients with favorable neurological outcome tended to be somewhat higher in the intervention arm, although this did not reach statistical significance at ICU discharge and at 180 days,” Dr. Ameloot said. He noted that 42% of the intervention group and 33% of controls in the full-analysis set (P = .30) and 43% and 27%, respectively, in the per-protocol set (P = .15) had a favorable neurological outcome, as calculated using the Glasgow-Pittsburgh Cerebral Performance Category scores of 1 or 2, at 180 days.
The study did not reveal any noteworthy differences in ICU stay (7 vs. 8 days, P = .13) or days on mechanical ventilation (5 vs. 7, P = .31), although fewer patients in the EGDHO group required a tracheostomy (4% vs. 18%, P = .02). The intervention group also had lower rates of cardiac events, including recurrent cardiac arrest, limb ischemia, new atrial fibrillation, and pulmonary edema (13% vs. 33%; P = .02), Dr. Ameloot said.
Future post-hoc analyses of the data will explore the hypothesis that higher blood pressure leads to improved coronary perfusion and reduced infarct size, thus improving prognosis, he added.
“Should this trial therefore be the definite end to the promising hypothesis that improving brain oxygenation might reduce the second hit in post–cardiac arrest patients? I don’t think so,” Dr. Ameloot said. He noted a few limits to the study: that the perfusion rate on MRI was a poor predictor of 180-day outcome; that more patients than expected entered the trial without receiving basic life support and with nonshockable rhythms; and that there was possibly less extensive brain damage among controls at baseline. “Only an adequately powered clinical trial can provide an answer about the effects of EGDHO in post–cardiac arrest patients,” Dr. Ameloot said.
Dr. Ameloot had no financial relationships to disclose.
SOURCE: Ameloot K et al. AHA 2018, Abstract 18620
CHICAGO – A European clinical trial that targeted a mean arterial blood pressure after cardiac arrest higher than what the existing guidelines recommend found that the approach was safe, improved blood flow and oxygen to the brain, helped patients recover quicker, and reduced the number of adverse cardiac events, although it did not reduce the extent of anoxic brain damage or improve functional outcomes, the lead investigator reported at the American Heart Association scientific sessions.
The Neuroprotect trial randomly assigned 112 adult survivors of an out-of-hospital cardiac arrest who were unconscious upon admission to two study groups: early goal-directed hemodynamic optimization (EGDHO), in which researchers used a targeted mean arterial pressure (MAP) of 85-100 mm Hg and mixed venous oxygen saturation between 65% and 75% during the first 36 hours after ICU admission; and the standard care group, in which they used the guideline-recommended MAP target of 65 mm Hg, said Koen Ameloot, MD, of East Limburg Hospital in Genk, Belgium.
“EGDHO clearly improved cerebral perfusion and oxygenation, thereby for the first time providing the proof of concept for this new hemodynamic target,” Dr. Ameloot said. “However, this did not result in the reduction of the extent of anoxic brain hemorrhage or effusion rate on MRI or an improvement in functional outcome at 180 days.”
He noted the trial was predicated on improving upon the so-called “two-hit” model of cardiac arrest sequelae: the first hit being the no-flow and low-flow period before achieving restoration of spontaneous circulation; the second hit being hypoperfusion and reperfusion injury during ICU stay.
Dr. Ameloot referenced a study in which he and other coauthors reported that patients with a MAP target of 65 mm Hg “experience a profound drop of cerebral oxygen saturation during the first 12 hours of ICU stay that may cause additional brain damage” (Resuscitation. 2018;123:92-7).
The researchers explored the question of what is the optimal MAP if a target of 65 mm Hg is too low, Dr. Ameloot said. “We showed that maximal brain oxygenation is achieved with a MAP of 100 mm Hg, while lower MAPs were associated with submaximal brain perfusion and higher MAPs with excessive after-load, a reduction in stroke volume, and suboptimal cerebral oxygenation.”
During the 36-hour intervention period, the EGDHO patients received higher doses of norepinephrine, Dr. Ameloot said. “This resulted in significant improvement of cerebral oxygenation during the first 12 hours and was paralleled by significantly higher cerebral perfusion in the subset of patients in whom Doppler measurements were performed,” he said. “While patients allocated to the MAP 65 mm Hg target experienced a profound drop of cerebral oxygenation during the critical first 6-12 hours of ICU stay, cerebral oxygenation was maintained at 67% in patients assigned to EGDHO.”
However, the rate of anoxic brain damage, measured as the percentage of irreversibly damaged anoxic voxels on diffusion-weighted MRI – the primary endpoint of the study – was actually higher in the EGDHO group, 16% vs. 12%, Dr. Ameloot said. “The percentage of anoxic voxels was only a poor predictor of favorable neurological outcome at 180 days, questioning the validity of the primary endpoint,” he said. He also noted that 23% of the trial participants did not have an MRI scan because of higher than expected 5-day rates of death.
“The percentage of patients with favorable neurological outcome tended to be somewhat higher in the intervention arm, although this did not reach statistical significance at ICU discharge and at 180 days,” Dr. Ameloot said. He noted that 42% of the intervention group and 33% of controls in the full-analysis set (P = .30) and 43% and 27%, respectively, in the per-protocol set (P = .15) had a favorable neurological outcome, as calculated using the Glasgow-Pittsburgh Cerebral Performance Category scores of 1 or 2, at 180 days.
The study did not reveal any noteworthy differences in ICU stay (7 vs. 8 days, P = .13) or days on mechanical ventilation (5 vs. 7, P = .31), although fewer patients in the EGDHO group required a tracheostomy (4% vs. 18%, P = .02). The intervention group also had lower rates of cardiac events, including recurrent cardiac arrest, limb ischemia, new atrial fibrillation, and pulmonary edema (13% vs. 33%; P = .02), Dr. Ameloot said.
Future post-hoc analyses of the data will explore the hypothesis that higher blood pressure leads to improved coronary perfusion and reduced infarct size, thus improving prognosis, he added.
“Should this trial therefore be the definite end to the promising hypothesis that improving brain oxygenation might reduce the second hit in post–cardiac arrest patients? I don’t think so,” Dr. Ameloot said. He noted a few limits to the study: that the perfusion rate on MRI was a poor predictor of 180-day outcome; that more patients than expected entered the trial without receiving basic life support and with nonshockable rhythms; and that there was possibly less extensive brain damage among controls at baseline. “Only an adequately powered clinical trial can provide an answer about the effects of EGDHO in post–cardiac arrest patients,” Dr. Ameloot said.
Dr. Ameloot had no financial relationships to disclose.
SOURCE: Ameloot K et al. AHA 2018, Abstract 18620
REPORTING FROM THE AHA SCIENTIFIC SESSIONS
Key clinical point:
Major finding: Forty-three percent of patients in the intervention group had a favorable neurological outcome vs. 27% of controls (P = .15).
Study details: The Neuroprotect trial was a multicenter, randomized, open-label, assessor-blinded trial of 112 post–cardiac arrest patients.
Disclosures: Dr. Ameloot had no financial relationships to disclose.
Source: Ameloot K et al. AHA 2018, Abstract 18620
ICYMI: EP 01 Lorenzo Norris

Playing by the Rules: Using Decision Rules Wisely Part 2, Nontraumatic Conditions
In this second part of “Playing by the Rules,” we will examine validated clinical decision rules that assist emergency physicians (EPs) in the diagnosis and treatment of nontraumatic conditions. Most trauma rules seek to answer a yes or no question regarding the utility of testing for specific disease states when the diagnosis is not clinically apparent.
For example, the Canadian CT Head Rule describes a number of conditions that, if met, can predict the absence of traumatic lesions requiring neurosurgical intervention in the alert patient with head injury, and thus obviate the need for imaging in those instances. In contrast, many medical rules are actually risk stratification scales for treatment and diagnosis, categorizing patients into low- to high-risk groups based on clinical factors. While traumatic conditions are linked to a specific inciting event or “trauma,” medical diseases may have multiple causative factors or may be delayed in presentation to the emergency department (ED), which subsequently increases the complexity of these decision instruments.
Rather than an exhaustive list of all clinical decision rules or risk stratification scales relevant to emergency medicine, this installment will provide EPs with a review of common instruments and the evidence behind them.
Central Nervous System
Ottawa Subarachnoid Hemorrhage Rule
The Ottawa Subarachnoid Hemorrhage Rule offers guidance for diagnosing atraumatic subarachnoid hemorrhage (SAH) in alert, neurologically intact adult patients presenting to the ED with a headache reaching maximal intensity within 1 hour of onset. The rule states that if none of the following conditions are present, then the diagnosis of SAH can be excluded without further testing:
Symptom of neck pain or stiffness
Age greater than 40 years old
Witnessed loss of consciousness
Onset during exertion
Thunderclap headache with peak pain instantly
Limited neck flexion on exam
The validation study prospectively enrolled 1153 adults of whom 67 had a positive workup for SAH (defined as subarachnoid blood visible on noncontrast CT scan of the head, xanthochromia of cerebrospinal fluid on visual inspection, or the presence of >1 million erythrocytes in the final tube of cerebrospinal fluid with an aneurysm or arteriovenous malformation confirmed on cerebral angiography).1 Of note, patients with prior history of cerebral aneurysm or SAH were excluded, as were patients with recurrent headaches similar to the presenting complaint, patients with focal neurologic deficits or papilledema, or patients with a history of brain neoplasm, ventricular shunt, or hydrocephalus. The authors found that the rule was 100% sensitive and 13% specific for detecting SAH, with a kappa of 0.82, which suggests good interrater reliability.1
Comment: It is important to note that the authors excluded patients with a history of cerebral aneurysm or prior SAH, and therefore the rule should not be applied to these patients in clinical practice. The utility of this rule is somewhat limited secondary to the age cutoff, as the incidence of aneurysmal SAH increases considerably after the fifth decade of life.2 Ultimately, this rule—combined with the authors’ previous work showing that CT performed within 6 hours of headache onset can rule out SAH—provides a powerful diagnostic tool for EPs considering SAH in the ED.3
ABCD2 Score
The ABCD2 score was developed to identify transient ischemic attack (TIA) patients at risk for early stroke, and thus inform decisions regarding admission and resource utilization in the ED and outpatient clinic setting.4 The score was created by combining elements of two previously existing rules, the California and the ABCD scales. Patients presenting with TIA symptoms are assigned points based on:
Age: 1 point if ≥ 60 years
Blood Pressure: 1 point if ≥ 140/90
Clinical Deficit: 2 points for unilateral weakness, 1 point for speech impairment without unilateral weakness
Duration: 2 points for ≥ 60 minutes, 1 point for 10 to 59 minutes
Diabetes: 1 point if diabetic
The greater the number of points, the higher the risk for imminent stroke, from low (0-3 points) to moderate (4-5 points) to high (6-7 points). The initial retrospective internal validation study found that the low, moderate, and high groups correlated to 7-day stroke risk of 1.2%, 5.9%, and 11.7%, respectively. Subsequently, the ABCD2 score was rapidly incorporated into institutional and national protocols for assessing risk for stroke and featured prominently in the 2009 American Heart Association guidelines on TIA, which recommend hospitalization for a score of 3 or greater.4,5
More recently, a multicenter prospective external validation study of more than 2000 TIA patients found that using the American Heart Association recommended cutoff of 3 or greater resulted in a sensitivity of 94.7% for detecting those patients who sustained a stroke within 7 days, but a specificity of only 12.5%.6 The investigators concluded that a specificity this low would require “almost all” of the TIA patients in their cohort (87.6%) to be admitted to the hospital—even though only 3.2% of their patients had a stroke within 90 days.6 Even when examined at other cutoff scores, the investigators found the ABCD2 score to have poor accuracy.6
Comment: Decreasing resource utilization is a laudable goal, but it does not appear that the ABCD2 score provides much guidance on which TIA patients can safely go home. Moreover, the increasing availability of advanced imaging and tele-neurology consultation in the ED have changed the landscape of TIA and stroke care. Many EPs have since argued that the ABCD2 score adds little to their evaluation.7
Abdomen
Alvarado Score
There are multiple clinical prediction rules for appendicitis. Among the most commonly utilized by EPs and surgical consultants are the Alvarado score and the Appendicitis Inflammatory Response Score. The Alvarado score was derived in 1986 based on a retrospective review of 305 abdominal pain patients of whom 227 (aged 4 to 80 years) had appendicitis.8 Factors were identified and weighted, which can be recalled through the mnemonic MANTRELS:
Migration of pain to the right lower quadrant: 1 point
Anorexia or acetone in urine: 1 point
Nausea or vomiting: 1 point
Tenderness in the right lower quadrant: 2 points
Rebound tenderness: 1 point
Elevation of the temperature > 37.3°C: 1 point
Leukocytosis >10K X 109/L: 2 points
Shift to the left of neutrophils (>75%): 1 point
The original article posited that a score of 5 or 6 was “compatible” with the diagnosis of acute appendicitis—necessitating further observation for possible appendicitis—and that higher scores indicated an increasing probability of disease.8 Of note, the rule has also been adapted for clinical settings where differentials are not easily obtainable with the left shift criterion removed; this is known as the modified Alvarado score and calculated out at a maximum of 9.9
Since the original Alvarado study was published, multiple small studies have attempted to validate or otherwise retrospectively assess the utility of this rule. A frequently cited systematic review of 42 prospective and retrospective studies by Ohle et al found that a score of <5 showed a sensitivity of 99% overall (96% in men, 99% in women, and 99% in children) for ruling out admission/observation of patient with suspected appendicitis, though the specificity for ruling in the diagnosis at scores 7 and higher was only 81% overall.10
However, a more recent prospective observational study of adult abdominal pain patients presenting to large American urban EDs found the modified Alvarado rule at cutoff levels of 3, 4, and 5 had sensitivities of only 72%, 55%, and 36%, respectively, of ruling out the diagnosis.11 In comparison, the study found that physicians’ clinical judgement of appendicitis being the first or second most likely diagnosis had a sensitivity of 93% for predicting appendicitis.11
Comment: The Alvarado score was developed to help rule out and rule in the diagnosis of appendicitis. However, with the increasing availability of CT scanning in EDs, the diagnostic pathway in unclear cases has shifted from admission/observation to CT scanning, which has the benefit of elucidating other pathology as well. The utility of the Alvarado rule has been called into question. Ultimately, there is data in support of the Alvarado rule from older articles and studies in resource-poor environments, and newer studies may reflect less rigorous application of the rule when CT scanning is the default clinical pathway. Further studies that focus specifically on the Alvarado score as a rule out test to decrease CT utilization may be instructive.
Appendicitis Inflammatory Response (AIR) score
The appendicitis inflammatory response (AIR) score was derived in a cohort of 316 patients and validated on a sample of 229 adults and children with suspected appendicitis.12 The authors specifically sought to create a rule that outperformed the Alvarado score; the criteria are:
Vomiting: 1 point
Right iliac fossa pain: 1 point
Rebound tenderness: 1 point for light, 2 for medium, 3 for strong
Temperature >38.5°C: 1 point
Polymorphonuclear leukocytes: 1 point for 70%-84%, 2 for 85% or greater
White blood cell count: 1 point for 10,000-14,900, 2 for 15,000 or greater
C-reactive protein level (mg/dL): 1 point for 10-49, 2 for 50 or greater
Patients with a score of 0-4 were classified as low risk, with recommendation for outpatient follow-up if general condition unchanged; a score of 5-8 as indeterminate risk, with recommendation for active observation with serial exams, imaging, or diagnostic laparoscopy; or a score of 9-12 as high risk, with recommendation for surgical exploration.12 In the validation cohort, the investigators found an AIR score or Alvarado score greater than 4 to have, respectively, 96% or 97% sensitivity and 73% or 61% specificity for detecting appendicitis.12 A high score of greater than 8 on either the AIR or Alvarado had respectively 37% or 28% sensitivity but specificity of 99% for detecting appendicitis with either instrument.12
In an external validation study, the AIR and Alvarado scores were calculated on a series of 941 patients (aged 1 to 97 years) being evaluated for possible appendicitis; 201 patients were younger than 18.13 At a cutoff of greater than 4, the sensitivity and specificity were found to be 93% and 85% for the AIR and 90% and 55% for Alvarado.13 In a cohort of 182 patients (aged 4 to 75 years), a score of 4 or greater on the AIR and Alvarado was found to have comparable sensitivity to that of a senior surgical consultant for detecting appendicitis—with sensitivities of 94%, 93%, and 90% respectively.14 Subsequently, the original investigators undertook a large multicenter implementation study of the AIR at 24 hospitals of patients (aged 5 to 96 years) with suspected appendicitis. As compared to the pre-implementation group, using AIR to categorize patients as low risk resulted in significantly fewer imaging studies, admissions, and surgical explorations.15
Comment: The AIR has the benefit of recent prospective studies that assess performance of the rule in settings that mirror the practice environments of most EPs today. The classification of rebound tenderness as light, medium, or strong may be difficult to ascertain. Ultimately, reductions in imaging, admissions, and surgical explorations are important goals and EPs might benefit from using this rule to guide imaging.
CHEST
HEART Score
The increasingly popular HEART score, first developed by physicians in the Netherlands in 2008, seeks to risk-stratify patients presenting to the ED with suspected cardiac chest pain without ST-elevation myocardial infarction (STEMI). It scores patients 0 to 2 on 5 different characteristics (with a total scored of 10 possible points):
History: 2 points for highly suspicious, 1 point for moderately suspicious
EKG: 2 points for significant ST deviation, 1 point for nonspecific repolarization disturbance
Age: 2 points for age 65 years or greater, 1 point for age 45-64 years
Risk Factors: 2 points for 3 or more risk factors or history of atherosclerotic disease, 1 point for 1 to 2 risk factors
Troponin: 2 points for troponin value >3 times the normal limit, 1 point for value 1-3 times the normal limit.
The authors developed these 5 categories “based on clinical experience and current medical literature,” and then applied the rule to 122 chest pain patients in the ED, finding a higher incidence of major adverse coronary events (MACE) with increasing score: 2.5% for low risk score of 0-3, 20.3% for intermediate risk score of 4-6, and 72.7% for score 7 or higher.16 The score has been retrospectively and prospectively validated.17,18 In a study of 2440 patients, the low risk group had a MACE of 1.7%, and the score had a c-statistic of 0.83, outperforming Thrombolysis in Myocardial Infarction (TIMI) and GRACE c-statistics of 0.75 and 0.70, respectively.18 In 2013, investigators calculated the HEART score on a multinational database of 2906 chest pain patients, finding a negative predictive value of 98.3% for MACE with HEART score less than or equal to 3.19
In the United States, Mahler et al have produced a series of 3 articles validating the HEART score and demonstrating its use in reducing cardiac testing and length of stay. In 1070 patients admitted to their observation unit, who were deemed low risk by physician assessment and TIMI <2, a score of less than or equal to 3 had a negative predictive value of 99.4% for MACE; the inclusion of serial troponins resulted in sensitivity of 100%, specificity of 83.1%, and negative predictive value of 100%.20 The team then conducted a secondary analysis of chest pain patients enrolled in a large multicenter trial (MIDAS) and compared HEART score, the North American Chest Pain Rule, and unstructured clinical assessment.21 Both rules had high sensitivities, but the HEART score identified 20% of patients suitable for early discharge, as compared to 4% for the North American Chest Pain Rule.21 Finally, Mahler’s team performed a randomized control trial of 282 patients investigating whether the HEART score with serial troponins compared with usual care could safely reduce cardiac testing.22 The HEART pathway resulted in an absolute reduction of 12.1% in cardiac testing, and median reduction in length of stay by 12 hours, with no missed MACE in discharged patients.22
Most recently, a stepped-wedge, cluster randomized trial across 9 hospitals published in 2017 investigated the utility of the HEART score. Despite enrolling only 3648 patients out of the statistically required sample size of 6600, they found that the HEART score was not inferior to usual care and there was no significant difference in median length of stay, but health care resources were typically lower in the HEART score group.23
Comment: While derived in a less conventional manner, the HEART score has held up in several validation studies and appears poised to safely decrease health care costs and increase ED efficiency and throughput. As more US EDs look to adopt high sensitivity troponin biomarkers, prospective studies will be needed to determine the role of the HEART score in this setting.
Thrombolysis in Myocardial Infarction (TIMI) score
The Thrombolysis in Myocardial Infarction (TIMI) score was developed in 2000 as a tool to risk-stratify patients with a diagnosis of unstable angina (UA) and non–ST-elevation myocardial infarction (NSTEMI). The score was derived from 1 arm (2047 patients) of a study comparing heparin with enoxaparin for treatment of NSTEMI, and validated in the other 3 arms of the study (5124 patients). Multivariate logistic regression was used to develop 7 variables of equal weight:
Age greater than or equal to 65yo
Three or more cardiac risk factors
Known coronary artery disease (with stenosis greater than or equal to 50%)
Aspirin use in the past 7 days
Severe angina (2 or more episodes in the past 24 hours)
EKG ST changes greater than or equal to 0.5 mm
Positive serum cardiac biomarkers
The investigators found that with a higher score, there was progressive increase in adverse cardiac outcomes, with a c-statistic of 0.65.24 This score was subsequently validated across several existing databases evaluating various therapeutic interventions for UA/NSTEMI and remained statistically significant, with increasing risk for MI and mortality with increasing score.25,26
Given the success in predicting patient outcomes and identifying patients who could benefit from more aggressive care, the TIMI risk score was then applied to unselected ED chest pain patients. In a secondary analysis of a prospective observational cohort of 3929 patient visits, the TIMI score correlated to the risk for adverse outcomes, with a risk of 2.1% at score 0.27
In a second prospective observational cohort of 1458 patient visits, a score of 0 correlated to a 1.7% incidence of adverse outcomes.28 In 2008, Body et al sought to increase the relative weight of EKG and biomarker factors to 5 (instead of 1) in a study of 796 patients, positing that these factors have more importance in the ED setting.29 Comparing the modified TIMI to the original, the modified instrument improved the area under curve (AUC) from 0.77 to 0.87.29 In follow-up validation studies, the modified score has an improved AUC, but the incidence of adverse outcomes at score 0 remains at about 2% for both modified and original score.30,31
In 2010, Hess et al performed a systematic review and meta-analysis of the studies that prospectively validated the TIMI score. They evaluated 10 validation studies, encompassing 17,265 patients across 5 countries, and found a strong linear relation between the TIMI score and adverse cardiac events.32 At TIMI score of 0, the incidence of cardiac events was 1.8%, with sensitivity of 97.2% and specificity of 25%. Subsequently, the ADAPT trial designed a diagnostic protocol consisting of TIMI risk assessment, EKG, and 0- and 2-hour troponin I biomarkers to find ED patients eligible for safe, early discharge.33 Of the 1975 patients, 20% were classified as low risk and eligible for early discharge, in that they had TIMI score of 0, a non-ischemic ECG, and negative troponins. Only one patient had a MACE at 30 days, giving the protocol a sensitivity of 99.7%, specificity of 23.4%, and negative predictive value of 99.7%.33
As the TIMI and HEART scores are both used to evaluate ED chest pain patients, several studies have sought to compare them. In 2015, Cartlon et al published a comparison of 5 established risk scores and 2 troponin assays in 963 patients: modified Goldman, TIMI, GRACE, HEART, and Vancouver Chest Pain Rule in combination with troponin T and I.34 The investigators found that a negative troponin T plus either TIMI score of 0 or a HEART score ≤3 gave a negative predictive value of greater than 99.5% with more than 30% of patients able to be discharged safely.34 In 2017, a comparison of the GRACE, HEART, and TIMI scores in 1833 chest pain patients found the HEART score identified more low risk patients than either of its comparators and had the highest AUC at 0.86.35 Other trials have similarly found HEART outperforming TIMI.36
Comment: The TIMI score was not specifically designed for ED use but has been adapted to serve this purpose. To the EP assessing the undifferentiated chest pain patient, the TIMI score uses clinical variables that may seem curious (eg, aspirin use) or impossible for EPs to ascertain (eg, presence or degree of stenosis). Even for patients with a score of 0, the risk for adverse outcomes remains stubbornly at the 2% level, similar to the original low risk HEART score findings.
Wells’ Criteria for Pulmonary Embolism
The diagnosis of pulmonary embolism (PE) is often challenging, requiring the use of multiple ED resources for timely diagnosis, and is therefore well suited for clinical decision instruments. The Wells’ Criteria were derived from a cohort of 1260 patients using logistic regression to identify 7 significant variables:
Clinical signs and symptoms of deep vein thrombosis (DVT): 3
PE is the most likely diagnosis: 3
Heart rate >100: 1.5
Immobilization or surgery in the previous 4 weeks: 1.5
Previously diagnosed DVT or PE: 1.5
Hemoptysis: 1
Malignancy with treatment within 6 months or palliative: 1
The investigators specifically linked the use of their instrument to the D-dimer assay, using their score to determine pretest probability and seeking to exclude the diagnosis in patients with low pretest probability and negative D-dimer result.37,38 They reported a three-tiered classification, with low risk at a score less than 2, moderate risk at scores from 2-6, and high risk at scores greater than 6. The risk for PE with a low risk score coupled with a negative D-dimer result were 1.5% and 2.7% in the derivation and validation cohorts. Using a two-tiered classification of PE unlikely at scores less than or equal to 4 and PE likely at scores 5 or greater, a PE unlikely score and a negative D-dimer had a 2.2% and 1.7% risk in the derivation and validation cohorts.
A subsequent study by Wells et al on 930 ED patients using the score plus D-dimer found a negative predictive value of 99.5% for a low risk score and a negative D-dimer.39 This allowed for reduced imaging in 53% of patients.39 Another external validation study found acceptable interrater agreement between physicians for the Wells’ score at kappa 0.62 for the three-tiered system and 0.7 for the two-tiered system.40 The Wells’ Criteria has been compared against the Geneva score with receiver operating characteristic curve analysis showing no difference between the two rules.41 In a large cohort of 3306 patients being evaluated for PE using the Wells’ score and D-dimer, for the 1028 patients with PE unlikely and a negative D-dimer, there was a 3-month incidence of venous thromboembolism (VTE) of 0.5%—none of which were fatal events.42
Comment: The Wells’ Criteria for pulmonary embolism combined with D-dimer is now the preferred approach for many EPs seeking to risk-stratify their patients for PE. Advances in age-adjusted cutoffs for D-dimer provide additional support for this powerful tool.
Pulmonary Embolism Rule-Out Criteria (PERC)
Given the low specificity of the D-dimer assay for VTE, researchers post–Wells’ Criteria have sought to further reduce unnecessary testing by reassessing the D-dimer’s role in the diagnostic pathway. The PERC rule was designed to reduce D-dimer use—and downstream CT scan testing—in low-risk patients. The investigators derived the rule from a population of patients for whom the pretest probability of PE was less than 15%, seeking a risk for PE less than 2% if the rule was satisfied. Using logistic regression in 3148 ED patients, 8 clinical criteria were obtained:
Age < 50 years Pulse <100
Pulse oximetry >94%
No unilateral leg swelling
No hemoptysis
No recent surgery
No prior PE/DVT
No hormone use
The variables were tested in 1427 low-risk and 382 very-low-risk patients (defined as being evaluated for dyspnea, but not part of the derivation or low-risk validation groups). In the low-risk group, the sensitivity, specificity, and false-negative rate was 96%, 27%, and 1.4% respectively. In the very-low-risk group, the sensitivity, specificity, and false-negative rate was 100%, 15%, and 0% respectively.43 The rule was further validated in a prospective multicenter study of 8138 patients; among patients with pretest probability less than 15% who were PERC negative, 1% had PE/DVT within 45 days.44 The large PERCEPIC trial on 1757 patients found low pretest probability patients who were PERC negative had a false-negative rate of 1.2% and estimated that the use of PERC could decrease the median length of stay in the ED by at least 2 hours.45 The PROPER study, a non-inferiority, crossover cluster-randomized trial in 14 EDs across France, found that use of the PERC rule was not inferior to conventional care and that it was associated with reduced ED length of stay and CT use.45,46
There has been criticism from some European studies that the PERC rule misses too many PEs. A provocatively titled multinational study from Hugli et al examined patients suspected to have PE in Switzerland, France, and Belgium. The investigators applied the PERC rule and then stratified the patients by pretest probability as defined by the Geneva score, which includes many of the same criteria as PERC. They found the PERC rule identified a small proportion of patients with suspected PE as very low risk (13.2%) and that the prevalence of PE among these patients was 5.4%. Critics of this study have noted that the PERC rule was designed to be applied in low-risk patients, not to define the low-risk population.47 Another study examined a retrospective cohort of patients in whom a D-dimer was ordered to exclude PE, and then calculated the Wells’ and PERC score from the medical record. The investigators found that the combination of Wells and PERC missed 2 PEs out of their population of 377 patients.48 However, a subsequent meta-analysis analyzed 11 studies—including the two negative studies—and found a pooled sensitivity of 97%, specificity of 23%, and negative likelihood ratio of 0.18, concluding that when the pretest probability is low, PERC is sensitive enough to exclude D-dimer testing.49
Comment: Given the number of disease states and sampling techniques that can cause nonspecific elevation in D-dimer assay, the PERC rule provides a useful tool in low-risk populations for excluding PE without laboratory testing. The key is applying the rule to the appropriate population, as stratified by gestalt or clinical score.
Infectious Disease
Mortality in Emergency Department Sepsis (MEDS) score
The Mortality in Emergency Department Sepsis (MEDS) score was developed as a risk stratification tool for patients presenting to the ED with concern for sepsis. This score was prospectively derived from a population of 3301 ED patient encounters during which a blood culture was ordered. Charts were reviewed and several data points extracted and analyzed to determine the following univariate predictors of 28-day mortality: terminal illness, tachypnea or hypoxia, septic shock, platelets <150,000/mm3, bands >5%, age >65 years, lower respiratory infection, nursing home residence, and altered mental status. These predictors were assigned point values based on their odds ratios, and points are added to generate a total score. Mortality risk was stratified into groups based on total score, with percentage mortality as follows: score 0-4: 0.9%; 5-7: 2.0%; 8-12: 7.8%; 13-15: 20.2%; >15: 50%. A separate validation cohort had the following mortality rates: score 0-4: 1.1%; 5-7: 4.4%; 8-12: 9.3%; 13-15: 16.1%; >15: 39%.50
The MEDS score was subsequently shown to also be predictive for 1-year mortality as well, with an area under receiver operating curve (AUROC) of 0.76 for 1-year mortality.51 A subsequent study showed similar mortality rates when expanding the patient population to include all patients with systemic inflammatory response syndrome (SIRS), potentially broadening the potential application of MEDS in ED risk stratification.52 However, the score was shown to be less predictive in patients with severe sepsis and septic shock, underestimating mortality in all MEDS score groups.53 Still, the MEDS score was demonstrated in multiple validation studies as a reliable risk stratification tool in patients with suspected infection or SIRS.54,55
Comment: The MEDS score is not as well studied in the literature as the SIRS criteria or QuickSOFA but is a validated risk stratification tool in patients with suspected infection and is ED specific. This tool, similar to Pneumonia Severity Index and CURB-65 (discussed below), can guide management of patients from the ED. Very-low-risk (score 0-4) patients can be treated as outpatients, low risk (score 5-7) patients warranting consideration of a short inpatient stay, and moderate to high risk (>8) requiring inpatient management. At present, there is insufficient evidence regarding the role of the MEDS score to guide inpatient disposition of floor vs. ICU in moderate to high-risk patients.
Pneumonia Severity Index
The Pneumonia Severity Index (PSI) was developed as a tool to predict mortality risk from pneumonia, allowing providers to appropriately manage care for these patients in the hospital or as outpatients. A derivation cohort of 14199 patients was utilized to create a prediction rule in two steps meant to parallel a clinician’s decision-making process. The first step identified a population of patients that were at low risk for death, which were assigned to class I. The second step quantified the risk for death in the remaining patients using weighted factors including demographics, comorbidities, exam findings, and clinical data. In all, 20 variables were used and assigned corresponding points, the sum of which would assign a patient to a particular risk for mortality (class II-V).56
Mortality risk was relatively low for patients in class I and II (0.4 and 0.7%, respectively). Class III carried a mortality risk of 2.8%. Mortality increased with class IV and class V classification: 8.5% and 31.1%, respectively. These data were replicated with a separate validation cohort of 38039 patients, with similar mortality rates in each class. This study concluded with the recommendation that patients diagnosed with pneumonia falling into class I and II mortality risk should be managed as outpatients, possible brief inpatient observation for class III, and class IV and V managed as inpatients.56
Subsequent trials evaluating the utility of the PSI score in the management of patients diagnosed with pneumonia randomized low-risk patients (class I-III PSI) to treatment as outpatients vs inpatients. There were no statistical differences in adverse outcomes (ICU admission, hospital readmission, mortality, complications), with notable improvements in hospital admission rates and patient satisfaction.57,58 A meta-analysis of 6 studies that used a clinical decision tools to identify low-risk patients to treat pneumonia as outpatients showed no significant difference in mortality, patient readmissions, or patient satisfaction. Low-risk patients that required admission often included comorbid illnesses not included in the PSI, inability to take oral medications, barriers to compliance, or hypoxemia.59
Though the PSI has been shown to successfully identify patients at low risk for mortality, it has been less accurate at predicting and stratifying classes of severe pneumonia. A meta-analysis by Loke et al showed that PSI class IV or V had pooled sensitivity of 0.90 and specificity 0.53 for 30-day mortality, which was significantly better than the CURB-65 rule (discussed below).60 However, a subsequent large meta-analysis showed that PSI class IV or V had a sensitivity of 75% and specificity 40% for requiring ICU intervention or admission, which are not sufficient to guide disposition decisions.61
CURB-65
One of the criticisms of PSI included its complexity, with inclusion of 20 factors making it impractical for use as a bedside tool. The CURB-65 score was developed with a similar goal of identifying low-risk patients with pneumonia who would be candidates for outpatient management, but also patients at high risk for mortality or ICU admission. Criteria for severe pneumonia published by the British Thoracic Society include: respiratory rate ≥ 30 breaths/min, diastolic blood pressure ≤60 mmHg, and blood urea nitrogen >7 mmol/L. The presence of 2 criteria was 88% sensitive and 72% specific for mortality or ICU admission.62 The CURB-65 tool was based on these criteria, with the addition of age ≥65 years, which was found to be a separate independent predictor of mortality. Thus, the 5 criteria making up the score are as follows (1 point each, 0-5 total):
Confusion, meaning Mental Test Score ≤8, or disorientation to person, place, or time
Urea >7 mmol/L (>19.6 mg/dL)
Respiratory rate ≥ 30 breaths/minute
Blood pressure (systolic < 90 mmHg or diastolic ≤ 60 mmHg)
Age ≥ 65 years
A score of 0-1 of these criteria characterized low mortality risk (<1.5%) in the test group, a score of 2 was intermediate mortality risk (9.2%), and a score of 3 or more associated with high mortality risk (22%). A score ≥ 2 was 93% sensitive and 49% specific for 30-day mortality.63
A subsequent prospective validation study by Aujesky et al that included 3181 patients with community-acquired pneumonia demonstrated slightly higher mortality rates for each CURB-65 score (0.6%, 3%, 6.1%, 13%, 17%, 43% mortality in scores of 0-5, respectively).64 In particular, the 3% mortality rate in CURB-65 scores of 1 is similar to PSI class III mortality rates, suggesting a lower threshold (CURB-65 ≥1) for consideration of admission for management. Another validation study by Capelastegui et al showed similar mortality rates to the derivation study for specific CURB-65 scores, but noted 53% of patients with a score of 1 also were found to have characteristics that were independent for a poor prognosis, and should be considered in the decision for outpatient or inpatient treatment.65 Furthermore, a recent study found that of patients in the ED with a CURB-65 score of 1, 8% still required critical care intervention.66 Thus, use of CURB-65 in screening for low-risk patients with community-acquired pneumonia is recommended to be limited to scores of 0. However, as with PSI, validation studies have yet to show predictive utility of scores suggesting severe pneumonia (CURB-65 ≥3) in predicting mortality or ICU requirement.60,61
As validation studies have suggested only patients with a CURB-65 score of 0 are screened low risk enough for outpatient treatment, greater weight may be placed on utility of CRB-65 as a tool. This rule, initially proposed in the same study as CURB-65, omits blood urea nitrogen as a factor to only rely on history and physical exam data with a score of 0 indicating low risk.63 In initial derivation and validation studies, this rule demonstrated <1.6% mortality risk with a score of 0, with risk increasing to 4-8.6% in scores of 1.63,65 Multiple studies have compared CRB-65 and CURB-65, with only marginal but not statistically significant improvement in prognostic utility of CURB-65.65,67 A meta-analysis of 1648 patients even showed only 0.5% mortality risk in CRB-65 ≤1; potentially including CRB-65 0-1 as low risk, though, would require further study.68 Although multiple validation studies have also successfully stratified low risk to similar mortality risk (<1.6%), accuracy wanes with higher CRB-65 scores.69
Several studies have directly compared CURB-65 and PSI both in terms of identifying low-risk patients and stratifying disease severity.60,61,64,68,70-72 Multiple studies have shown similar mortality risk in low-risk populations and have demonstrated sensitivities for mortality greater than 96% for CURB-65/CRB-65 = 0 and PSI class I-III, albeit with specificities ranging from 18-65%.64,68,70 In stratifying patients into different levels of severity (ward vs ICU patients), PSI has shown slightly better sensitivity/specificity for mortality and/or ICU intervention, though neither is strong enough to significantly stratify severe pneumonia to serve as tools for directing inpatient management.60,61
Comment: PSI, CRB-65, and CURB-65 have been well validated as screening tools for low-risk patients who should be treated as outpatients (CURB-65 or CRB-65 = 0, PSI class I and II). A moderate-risk population (CURB-65 = 1 or 2, PSI class III) may benefit from treatment as inpatient or outpatient at clinician judgement. Use of these tools for determining disease severity and possible ICU requirement is not as reliable, and other clinical factors should be considered.
Conclusion
This article provides an overview of several common clinical decision instruments and the evidence behind them. Ultimately, many institutions have incorporated clinical decision rules directly into the electronic medical record, and this strategy will not only increase their use, but hopefully collect further data on whether the instruments truly perform better than unstructured clinical judgement.
1. Perry JJ, Sivilotti MLA, Sutherland J, et al. Validation of the Ottawa Subarachnoid Hemorrhage Rule in patients with acute headache. CMAJ. 2017;189(45):E1379-E1385.
2. de Rooij NK, Linn FH, van der Plas JA, Algra A, Rinkel GJ. Incidence of subarachnoid haemorrhage: a systematic review with emphasis on region, age, gender and time trends. J Neurol Neurosurg Psychiatry. 2007;78(12):1365-1372.
3. Perry JJ, Stiell IG, Sivilotti ML, et al. Sensitivity of computed tomography performed within six hours of onset of headache for diagnosis of subarachnoid haemorrhage: prospective cohort study. BMJ. 2011;343:d4277.
4. Johnston SC, Rothwell PM, Nguyen-Huynh MN, et al. Validation and refinement of scores to predict very early stroke risk after transient ischaemic attack. Lancet. 2007;369(9558):283-292.
5. Easton JD, Saver JL, Albers GW, et al. Definition and evaluation of transient ischemic attack: a scientific statement for healthcare professionals from the American Heart Association/American Stroke Association Stroke Council; Council on Cardiovascular Surgery and Anesthesia; Council on Cardiovascular Radiology and Intervention; Council on Cardiovascular Nursing; and the Interdisciplinary Council on Peripheral Vascular Disease. The American Academy of Neurology affirms the value of this statement as an educational tool for neurologists. Stroke. 2009;40:2276-2293
6. Perry JJ, Sharma M, Sivilotti ML, et al. Prospective validation of the ABCD2 score for patients in the emergency department with transient ischemic attack. CMAJ. 2011;183(10):1137-1145.
7. Stead LG, Suravaram S, Bellolio MF, et al. An assessment of the incremental value of the ABCD2 score in the emergeny department evaluation of transient ischemic attack. Ann Emerg Med. 2011;57(1):46-51.
8. Alvarado A. A practical score for the early diagnosis of acute appendicitis. Ann Emerg Med. 1986;15(5):557-564.
9. Kalan M, Talbot D, Cunliffe WJ, Rich AJ. Evaluation of the modified Alvarado score in the diagnosis of acute appendicitis: a prospective study. Ann R Coll Surg Engl. 1994;76(6):418-419.
10. Ohle R, O'Reilly F, O'Brien KK, Fahey T, Dimitrov BD. The Alvarado score for predicting acute appendicitis: a systematic review. BMC Med. 2011;9:139.
11. Meltzer AC, Baumann BM, Chen EH, Shofer FS, Mills AM. Poor sensitivity of a modified Alvarado score in adults with suspected appendicitis. Ann Emerg Med. 2013;62(2):126-31.
12. Andersson M, Andersson RE. The appendicitis inflammatory response score: a tool for the diagnosis of acute appendicitis that outperforms the Alvarado score. World J Surg. 2008;32(8):1843-1849.
13. de Castro SM, Ünlü C, Steller EP, van Wagensveld BA, Vrouenraets BC. Evaluation of the appendicitis inflammatory response score for patients with acute appendicitis. World J Surg. 2012;36(7):1540-1545.
14. Kollár D, McCartan DP, Bourke M, Cross KS, Dowdall J. Predicting acute appendicitis? A comparison of the Alvarado score, the Appendicitis Inflammatory Response Score and clinical assessment. World J Surg. 2015;39(1):104-109.
15. Andersson M, Kolodziej B, Andersson RE; STRAPPSCORE Study Group. Randomized clinical trial of Appendicitis Inflammatory Response score-based management of patients with suspected appendicitis. Br J Surg. 2017;104(11):1451-1461.
16. Six AJ, Backus BE, Kelder JC. Chest pain in the emergency room: value of the HEART score. Netherlands Heart J. 2008;16(6):191-196.
17. Backus BE, Six AJ, Kelder JC, et al. Chest Pain in the Emergency Room. A Multicenter Validation of the HEART Score. Crit Pathways Cardiol. 2010;9:164-169.
18. Backus BE, Six AJ, Kelder JC, et al. A prospective validation of the HEART score for chest pain patients at the emergency department. In J Cardiol. 2013;168:2153-2158.
19. Six AJ, Cullen L, Backus BE, et al. The HEART score for the assessment of patients with chest pain in the emergency department. Crit Pathways Cardiol. 2013;12:121-126.
20. Mahler SA, Hiestand BC, Goff DC, Hoekstra JW, Miller CD. Can the HEART score safely reduce stress testing and cardiac imaging in patients at low risk for acute coronary syndrome? Crit Pathw Cardiol. 2011:10(3):128-133.
21. Mahler SA, Miller CD, Hollander JE, et al. Identifying patients for early discharge: performance of decision rules among patients with acute chest pain. Int J Cardiol. 2013;168(2):795-802.
22. Mahler SA, Riley RF, Hiestand BC, et al. The HEART Pathway Randomized Trial: identifying emergency department patients with acute chest pain for early discharge. Circ Cardiovasc Qual Outcomes. 2015;8(2):195-203.
23. Poldervaart JM, Reitsma JB, Backus BE, et al. Effect of using the HEART score in patients with chest pain in the emergency department: a stepped-wedge, cluster randomized trial. Ann Intern Med. 2017;166:687-697.
24. Antman EM, Cohen M, Bernink PJLM, et al. The TIMI risk score for unstable angina/non-ST eevation MI. JAMA. 2000;284:835-842.
25. Scirica BM, Cannon CP, Antman EM, et al. Validation of the Thrombolysis In Myocardial Infarction (TIMI) risk score for unstable angina pectoris and non-ST-elevation myocardial infarction in the TIMI III registry. Am J Cardiol. 2002;90:303-305.
26. Morrow DA, Antman EM, Snapinn SM, McCabe CH, Theroux P, Braunwald E. An integrated clinical approach to predicting the benefit of tirofiban in non-ST elevation acute coronary syndromes. Eur Heart J. 2002;23:223-229.
27. Pollack CV, Sites FD, Shofer FS, Sease KL, Hollander JE. Application of the TIMI risk score for unstable angina and non–ST-elevation acute coronary syndrome to an unselected emergency department chest pain population. Acad Emerg Med. 2006:13(1):13-18.
28. Chase M, Robey JL, Zogby KE, Sease KL, Shofer FS, Hollander JE. Prospective validation of the Thrombolysis in Myocardial Infarction risk score in the emergency department chest pain population. Ann Emerg Med. 2006;48(3):252-259.
29. Body R, Carley S, McDowell G, Ferguson J, Mackway-Jones K. Can a modified thrombolysis in myocardial infarction risk score outperform the original for risk stratifying emergency department patients with chest pain? Emerg Med J. 2009;26:95-99.
30. Hess EP, Perry JJ, Calder LA, et al. Prospective validation of a modified Thrombolysis In Myocardial Infarction risk score in emergency department patients with chest pain and possible acute coronary syndrome. Acad Emerg Med. 2010;17(4):368-375.
31. Macdonald SPJ, Nagree Y, Fatovich DM, ad Brown SGA. Modified TIMI risk score cannot be used to identify low-risk chest pain in the emergency department: a multicenter validation study. Emerg Med J. 2014;31:281-285.
32. Hess EP, Agarwal D, Chandra S, et al. Diagnostic accuracy of the TIMI risk score in patients with chest pain in the emergency department: a meta-analysis. CMAJ. 2010;182(10):1039-1044.
33. Than, M, Cullen L, Aldous S, et al. 2-Hour accelerated diagnostic protocol to assess patients with chest pain symptoms using contemporary troponins as the only biomarker: the ADAPT trial. JACC. 2012;59(23):2091-2098.
34. Carlton EW, Khattab A, Greaves K. Identifying patients suitable for discharge after a single-presentation high-sensitivity Troponin result: a comparison of five established risk scores and two high-sensitivity assays. Ann Emerg Med. 2015;66(6):635-645.
35. Poldervaart JM, Langedijk M, Backus BE, et al. Comparison of the GRACE, HEART and TIMI score to predict major adverse cardiac events in chest pain patients at the emergency department. Int J Cardiol. 2017;227:656-661.
36. Nieuwets A, Poldervaart JM, Reitsma JB, et al. Medical consumption compared for TIMI and HEART score in chest pain patients at the emergency department: a retrospective cost analysis. BMJ Open. 2016;6:e010694.
37. Wells PS, Ginsberg JS, Anderson DR, et al. Use of a clinical model for safe management of patients with suspected pulmonary embolism. Ann Intern Med. 1998;129:997-1005.
38. Wells PS, Anderson DR, Rodger M, et al. Derivation of a simple clinical model to categorize patients’ probability of pulmonary embolism: increasing the model’s utility with the SimpliRED D-dimer. Thromb Haemost. 2000;83(3):416-420.
39. Wells PS, Anderson DR, Rodger M, et al. Excluding pulmonary embolism at the bedside without diagnostic imaging: management of patients with suspected pulmonary embolism presenting to the emergency department by using a simple clinical model and D-dimer. Ann Intern Med. 2001;135:98-107.
40. Wolf SJ, McCubbin TR, Feldhaus KM, Faragher JP, Adcock DM. Prospective validation of Wells’ criteria in the evaluation of patients with suspected pulmonary embolism. Ann Emerg Med. 2004;44:503-510.
41. Chagnon I, Bounameaux H, Aujesky D, et al. Comparison of two clinical prediction rules and implicit assessment among patients with suspected pulmonary embolism. Am J Med. 2002;113:269-275.
42. Christopher Study Investigators. Effectiveness of managing suspected pulmonary embolism using an algorithm combining clinical probability, D-dimer testing, and computed tomography. JAMA. 2006;295:172-179.
43. Kline JA, Mitchell AM, Kabrhel C, Richman PB, Courtney DM. Clinical criteria to prevent unnecessary diagnostic testing in emergency department patients with suspected pulmonary embolism. J Thromb Haemost. 2004;2:1247-1255.
44. Kline JA, Courtney DM, Kabrhel C, et al. Propsective multicenter evaluation of the pulmonary embolism rule-out criteria. J Thromb Haemost. 2008;6:772-780.
45. Penaloza A, Soulie C, Moumneh T, et al. Pulmonary embolism rule-out criteria (PERC) rule in European patients with low implicit clinical probability (PERCEPIC): a multicenter, prospective, observational study. Lancet Haematol. 2017;4:e615-e621.
46. Freund Y, Cachanado M, Aubry A, et al. Effect of the Pulmonary Embolism Rule-Out Criteria on subsequent thromboembolic events among low-risk emergency department patients. The PROPER randomized clinical trial. JAMA. 2018;319(6):559-566.
47. Hugli O, Righini M, Le Gal G, et al. The pulmonary embolism rule-out criteria (PERC) rule does not safely exclude pulmonary embolism. J Thromb Haemost. 2011;9:300-4.
48. Theunissen JMG, Scholing C, van Hasselt WE, van der Maten J, ter Avest E. A retrospective analysis of the combined use of PERC rule and Wells score to exclude pulmonary embolism in the Emergency Department. Emerg Med J. 2016;33:696-701.
49. Singh B, Parsaik AK, Aharwal D, Surana A, Mascarenhas SS, Chandra S. Diagnostic accuracy of Pulmonary Embolism Rule-Out Criteria: a systematic review and meta-analysis. Ann Emerg Med. 2012;59(6):517-520.
50. Shapiro NI, Wolfe RE, Moore RB, Smith E, Burdick E, Bates DW. Mortality in Emergency Department Sepsis (MEDS) score: a prospectively derived and validated clinical prediction rule. Crit Care Med. 2003;31(3):670-675.
51. Shapiro NI, Howell MD, Talmor D, Donnino M, Ngo L, Bates DW. Mortality in Emergency Department Sepsis (MEDS) score predicts 1-year mortality. Crit Care Med. 2007;35(1):192-198.
52. Sankoff JD, Goyal M, Gaieski DF, et al. Validation of the Mortality in Emergency Department Sepsis (MEDS) score in patients with the systemic inflammatory response syndrome (SIRS). Crit Care Med. 2008;36(2):421-26.
53. Jones AE, Saak K, Kline JA. Performance of the Mortality in Emergency Department Sepsis score for predicting hospital mortality among patients with severe sepsis and septic shock. Am J Emerg Med. 2008;26(6):689-692.
54. Carpenter CR., Keim SM, Upadhye S, Nguyen HB. Risk stratification of the potentially septic patient in the emergency department: the Mortality in the Emergency Department Sepsis (MEDS) score. J Emerg Med. 2009;37(3):319-327.
55. Hermans MAW, Leffers P, Jansen LM, Keulemans YC, Stassen PM. The value of the Mortality in Emergency Department Sepsis (MEDS) score, C reactive protein and lactate in predicting 28-day mortality of sepsis in a Dutch emergency department. Emerg Med J. 2012;29(4):295–300.
56. Fine MJ, Auble TE, Yealy DM, et al. A Prediction Rule to Identify Low-Risk Patients with Community Acquired Pneumonia. N Engl J Med. 1997;326(4):243-250.
57. Marrie TJ, Lau CY, Wheeler SL, et al. A controlled trial of a critical pathway for treatment of community-acquired pneumonia. JAMA. 2000;283(6):749-755. doi:10.1001/jama.283.6.749.
58. Carratalà J, Fernandez-Sabe N. Outpatient care compared with hospitalization for community-acquired pneumonia: a randomized trial in low-risk patients . Ann Intern Med. 2005;142:165-172. doi:10.7326/0003-4819-142-3-200502010-00006.
59. Chalmers JD, Akram AR, Hill AT. Increasing outpatient treatment of mild community-acquired pneumonia: Systematic review and meta-analysis. Eur Respir J. 2011;37(4):858-864. doi:10.1183/09031936.00065610.
60. Loke YK, Kwok CS, Niruban A, Myint PK. Value of severity scales in predicting mortality from community-acquired pneumonia: systematic review and meta-analysis. Thorax. 2010;65(10):884-890. doi:10.1136/thx.2009.134072.
61. Marti C, Garin N, Grosgurin O, et al. Prediction of severe community-acquired pneumonia: A systematic review and meta-analysis. Crit Care. 2012;16(4):R141. doi:10.1186/cc11447.
62. Neill AM, Martin IR, Weir R, et al. Community-acquired pneumonia: aetiology and usefulness of severity criteria on admission. Thorax. 1996;51(10):1010-1016. doi:10.1136/thx.51.10.1010.
63. Lim WS, Van Der Eerden MM, Laing R, et al. Defining community acquired pneumonia severity on presentation to hospital: An international derivation and validation study. Thorax. 2003;58(5):377-382. doi:10.1136/thorax.58.5.377.
64. Aujesky D, Auble TE, Yealy DM, et al. Prospective comparison of three validated prediction rules for prognosis in community-acquired pneumonia. Am J Med. 2005;118(4):384-392. doi:10.1016/j.amjmed.2005.01.006.
65. Capelastegui A, España PP, Quintana JM, et al. Validation of a predictive rule for the management of community-acquired pneumonia. Eur Respir J. 2006;27(1):151-157. doi:10.1183/09031936.06.00062505.
66. Ilg A, Moskowitz A, Konanki V, et al. Performance of the CURB-65 score in predicting critical care interventions in patients admitted with community-acquired pneumonia. Ann Emerg Med. 2018. doi:10.1016/j.annemergmed.2018.06.017.
67. Bauer TT, Ewig S, Marre R, Suttorp N, Welte T. CRB-65 predicts death from community-acquired pneumonia. J Intern Med. 2006;260(1):93-101. doi:10.1111/j.1365-2796.2006.01657.x.
68. Akram AR, Chalmers JD, Hill AT. Predicting mortality with severity assessment tools in out-patients with community-acquired pneumonia. QJM. 2011;104(10):871-879. doi:10.1093/qjmed/hcr088.
69. McNally M, Curtain J, O’Brien KK, Dimitrov BD, Fahey T. Validity of British Thoracic Society guidance (the CRB-65 rule) for predicting the severity of pneumonia in general practice: Systematic review and meta-analysis. Br J Gen Pract. 2010;60(579):423-433. doi:10.3399/bjgp10X532422.
70. Shah BA, Ahmed W, Dhobi GN, Shah NN, Khursheed SQ, Haq I. Validity of Pneumonia Severity Index and CURB-65 severity scoring systems in community acquired pneumonia in an Indian Setting. Indian J Chest Dis Allied Sci. 2010;52(1):9-17.
71. Noguchi S, Yatera K, Kawanami T, et al. Pneumonia severity assessment tools for predicting mortality in patients with cealthcare-associated pneumonia: a systematic review and meta-analysis. Respiration. 2017;93(6):441-450. doi:10.1159/000470915.
72. Kolditz M, Braeken D, Ewig S, Rohde G. Severity assessment and the immediate and long-term prognosis in community-acquired pneumonia. Semin Respir Crit Care Med. 2016;37(6):886-896. doi:http://dx.doi.org/10.1055/s-0036-1592127.
In this second part of “Playing by the Rules,” we will examine validated clinical decision rules that assist emergency physicians (EPs) in the diagnosis and treatment of nontraumatic conditions. Most trauma rules seek to answer a yes or no question regarding the utility of testing for specific disease states when the diagnosis is not clinically apparent.
For example, the Canadian CT Head Rule describes a number of conditions that, if met, can predict the absence of traumatic lesions requiring neurosurgical intervention in the alert patient with head injury, and thus obviate the need for imaging in those instances. In contrast, many medical rules are actually risk stratification scales for treatment and diagnosis, categorizing patients into low- to high-risk groups based on clinical factors. While traumatic conditions are linked to a specific inciting event or “trauma,” medical diseases may have multiple causative factors or may be delayed in presentation to the emergency department (ED), which subsequently increases the complexity of these decision instruments.
Rather than an exhaustive list of all clinical decision rules or risk stratification scales relevant to emergency medicine, this installment will provide EPs with a review of common instruments and the evidence behind them.
Central Nervous System
Ottawa Subarachnoid Hemorrhage Rule
The Ottawa Subarachnoid Hemorrhage Rule offers guidance for diagnosing atraumatic subarachnoid hemorrhage (SAH) in alert, neurologically intact adult patients presenting to the ED with a headache reaching maximal intensity within 1 hour of onset. The rule states that if none of the following conditions are present, then the diagnosis of SAH can be excluded without further testing:
Symptom of neck pain or stiffness
Age greater than 40 years old
Witnessed loss of consciousness
Onset during exertion
Thunderclap headache with peak pain instantly
Limited neck flexion on exam
The validation study prospectively enrolled 1153 adults of whom 67 had a positive workup for SAH (defined as subarachnoid blood visible on noncontrast CT scan of the head, xanthochromia of cerebrospinal fluid on visual inspection, or the presence of >1 million erythrocytes in the final tube of cerebrospinal fluid with an aneurysm or arteriovenous malformation confirmed on cerebral angiography).1 Of note, patients with prior history of cerebral aneurysm or SAH were excluded, as were patients with recurrent headaches similar to the presenting complaint, patients with focal neurologic deficits or papilledema, or patients with a history of brain neoplasm, ventricular shunt, or hydrocephalus. The authors found that the rule was 100% sensitive and 13% specific for detecting SAH, with a kappa of 0.82, which suggests good interrater reliability.1
Comment: It is important to note that the authors excluded patients with a history of cerebral aneurysm or prior SAH, and therefore the rule should not be applied to these patients in clinical practice. The utility of this rule is somewhat limited secondary to the age cutoff, as the incidence of aneurysmal SAH increases considerably after the fifth decade of life.2 Ultimately, this rule—combined with the authors’ previous work showing that CT performed within 6 hours of headache onset can rule out SAH—provides a powerful diagnostic tool for EPs considering SAH in the ED.3
ABCD2 Score
The ABCD2 score was developed to identify transient ischemic attack (TIA) patients at risk for early stroke, and thus inform decisions regarding admission and resource utilization in the ED and outpatient clinic setting.4 The score was created by combining elements of two previously existing rules, the California and the ABCD scales. Patients presenting with TIA symptoms are assigned points based on:
Age: 1 point if ≥ 60 years
Blood Pressure: 1 point if ≥ 140/90
Clinical Deficit: 2 points for unilateral weakness, 1 point for speech impairment without unilateral weakness
Duration: 2 points for ≥ 60 minutes, 1 point for 10 to 59 minutes
Diabetes: 1 point if diabetic
The greater the number of points, the higher the risk for imminent stroke, from low (0-3 points) to moderate (4-5 points) to high (6-7 points). The initial retrospective internal validation study found that the low, moderate, and high groups correlated to 7-day stroke risk of 1.2%, 5.9%, and 11.7%, respectively. Subsequently, the ABCD2 score was rapidly incorporated into institutional and national protocols for assessing risk for stroke and featured prominently in the 2009 American Heart Association guidelines on TIA, which recommend hospitalization for a score of 3 or greater.4,5
More recently, a multicenter prospective external validation study of more than 2000 TIA patients found that using the American Heart Association recommended cutoff of 3 or greater resulted in a sensitivity of 94.7% for detecting those patients who sustained a stroke within 7 days, but a specificity of only 12.5%.6 The investigators concluded that a specificity this low would require “almost all” of the TIA patients in their cohort (87.6%) to be admitted to the hospital—even though only 3.2% of their patients had a stroke within 90 days.6 Even when examined at other cutoff scores, the investigators found the ABCD2 score to have poor accuracy.6
Comment: Decreasing resource utilization is a laudable goal, but it does not appear that the ABCD2 score provides much guidance on which TIA patients can safely go home. Moreover, the increasing availability of advanced imaging and tele-neurology consultation in the ED have changed the landscape of TIA and stroke care. Many EPs have since argued that the ABCD2 score adds little to their evaluation.7
Abdomen
Alvarado Score
There are multiple clinical prediction rules for appendicitis. Among the most commonly utilized by EPs and surgical consultants are the Alvarado score and the Appendicitis Inflammatory Response Score. The Alvarado score was derived in 1986 based on a retrospective review of 305 abdominal pain patients of whom 227 (aged 4 to 80 years) had appendicitis.8 Factors were identified and weighted, which can be recalled through the mnemonic MANTRELS:
Migration of pain to the right lower quadrant: 1 point
Anorexia or acetone in urine: 1 point
Nausea or vomiting: 1 point
Tenderness in the right lower quadrant: 2 points
Rebound tenderness: 1 point
Elevation of the temperature > 37.3°C: 1 point
Leukocytosis >10K X 109/L: 2 points
Shift to the left of neutrophils (>75%): 1 point
The original article posited that a score of 5 or 6 was “compatible” with the diagnosis of acute appendicitis—necessitating further observation for possible appendicitis—and that higher scores indicated an increasing probability of disease.8 Of note, the rule has also been adapted for clinical settings where differentials are not easily obtainable with the left shift criterion removed; this is known as the modified Alvarado score and calculated out at a maximum of 9.9
Since the original Alvarado study was published, multiple small studies have attempted to validate or otherwise retrospectively assess the utility of this rule. A frequently cited systematic review of 42 prospective and retrospective studies by Ohle et al found that a score of <5 showed a sensitivity of 99% overall (96% in men, 99% in women, and 99% in children) for ruling out admission/observation of patient with suspected appendicitis, though the specificity for ruling in the diagnosis at scores 7 and higher was only 81% overall.10
However, a more recent prospective observational study of adult abdominal pain patients presenting to large American urban EDs found the modified Alvarado rule at cutoff levels of 3, 4, and 5 had sensitivities of only 72%, 55%, and 36%, respectively, of ruling out the diagnosis.11 In comparison, the study found that physicians’ clinical judgement of appendicitis being the first or second most likely diagnosis had a sensitivity of 93% for predicting appendicitis.11
Comment: The Alvarado score was developed to help rule out and rule in the diagnosis of appendicitis. However, with the increasing availability of CT scanning in EDs, the diagnostic pathway in unclear cases has shifted from admission/observation to CT scanning, which has the benefit of elucidating other pathology as well. The utility of the Alvarado rule has been called into question. Ultimately, there is data in support of the Alvarado rule from older articles and studies in resource-poor environments, and newer studies may reflect less rigorous application of the rule when CT scanning is the default clinical pathway. Further studies that focus specifically on the Alvarado score as a rule out test to decrease CT utilization may be instructive.
Appendicitis Inflammatory Response (AIR) score
The appendicitis inflammatory response (AIR) score was derived in a cohort of 316 patients and validated on a sample of 229 adults and children with suspected appendicitis.12 The authors specifically sought to create a rule that outperformed the Alvarado score; the criteria are:
Vomiting: 1 point
Right iliac fossa pain: 1 point
Rebound tenderness: 1 point for light, 2 for medium, 3 for strong
Temperature >38.5°C: 1 point
Polymorphonuclear leukocytes: 1 point for 70%-84%, 2 for 85% or greater
White blood cell count: 1 point for 10,000-14,900, 2 for 15,000 or greater
C-reactive protein level (mg/dL): 1 point for 10-49, 2 for 50 or greater
Patients with a score of 0-4 were classified as low risk, with recommendation for outpatient follow-up if general condition unchanged; a score of 5-8 as indeterminate risk, with recommendation for active observation with serial exams, imaging, or diagnostic laparoscopy; or a score of 9-12 as high risk, with recommendation for surgical exploration.12 In the validation cohort, the investigators found an AIR score or Alvarado score greater than 4 to have, respectively, 96% or 97% sensitivity and 73% or 61% specificity for detecting appendicitis.12 A high score of greater than 8 on either the AIR or Alvarado had respectively 37% or 28% sensitivity but specificity of 99% for detecting appendicitis with either instrument.12
In an external validation study, the AIR and Alvarado scores were calculated on a series of 941 patients (aged 1 to 97 years) being evaluated for possible appendicitis; 201 patients were younger than 18.13 At a cutoff of greater than 4, the sensitivity and specificity were found to be 93% and 85% for the AIR and 90% and 55% for Alvarado.13 In a cohort of 182 patients (aged 4 to 75 years), a score of 4 or greater on the AIR and Alvarado was found to have comparable sensitivity to that of a senior surgical consultant for detecting appendicitis—with sensitivities of 94%, 93%, and 90% respectively.14 Subsequently, the original investigators undertook a large multicenter implementation study of the AIR at 24 hospitals of patients (aged 5 to 96 years) with suspected appendicitis. As compared to the pre-implementation group, using AIR to categorize patients as low risk resulted in significantly fewer imaging studies, admissions, and surgical explorations.15
Comment: The AIR has the benefit of recent prospective studies that assess performance of the rule in settings that mirror the practice environments of most EPs today. The classification of rebound tenderness as light, medium, or strong may be difficult to ascertain. Ultimately, reductions in imaging, admissions, and surgical explorations are important goals and EPs might benefit from using this rule to guide imaging.
CHEST
HEART Score
The increasingly popular HEART score, first developed by physicians in the Netherlands in 2008, seeks to risk-stratify patients presenting to the ED with suspected cardiac chest pain without ST-elevation myocardial infarction (STEMI). It scores patients 0 to 2 on 5 different characteristics (with a total scored of 10 possible points):
History: 2 points for highly suspicious, 1 point for moderately suspicious
EKG: 2 points for significant ST deviation, 1 point for nonspecific repolarization disturbance
Age: 2 points for age 65 years or greater, 1 point for age 45-64 years
Risk Factors: 2 points for 3 or more risk factors or history of atherosclerotic disease, 1 point for 1 to 2 risk factors
Troponin: 2 points for troponin value >3 times the normal limit, 1 point for value 1-3 times the normal limit.
The authors developed these 5 categories “based on clinical experience and current medical literature,” and then applied the rule to 122 chest pain patients in the ED, finding a higher incidence of major adverse coronary events (MACE) with increasing score: 2.5% for low risk score of 0-3, 20.3% for intermediate risk score of 4-6, and 72.7% for score 7 or higher.16 The score has been retrospectively and prospectively validated.17,18 In a study of 2440 patients, the low risk group had a MACE of 1.7%, and the score had a c-statistic of 0.83, outperforming Thrombolysis in Myocardial Infarction (TIMI) and GRACE c-statistics of 0.75 and 0.70, respectively.18 In 2013, investigators calculated the HEART score on a multinational database of 2906 chest pain patients, finding a negative predictive value of 98.3% for MACE with HEART score less than or equal to 3.19
In the United States, Mahler et al have produced a series of 3 articles validating the HEART score and demonstrating its use in reducing cardiac testing and length of stay. In 1070 patients admitted to their observation unit, who were deemed low risk by physician assessment and TIMI <2, a score of less than or equal to 3 had a negative predictive value of 99.4% for MACE; the inclusion of serial troponins resulted in sensitivity of 100%, specificity of 83.1%, and negative predictive value of 100%.20 The team then conducted a secondary analysis of chest pain patients enrolled in a large multicenter trial (MIDAS) and compared HEART score, the North American Chest Pain Rule, and unstructured clinical assessment.21 Both rules had high sensitivities, but the HEART score identified 20% of patients suitable for early discharge, as compared to 4% for the North American Chest Pain Rule.21 Finally, Mahler’s team performed a randomized control trial of 282 patients investigating whether the HEART score with serial troponins compared with usual care could safely reduce cardiac testing.22 The HEART pathway resulted in an absolute reduction of 12.1% in cardiac testing, and median reduction in length of stay by 12 hours, with no missed MACE in discharged patients.22
Most recently, a stepped-wedge, cluster randomized trial across 9 hospitals published in 2017 investigated the utility of the HEART score. Despite enrolling only 3648 patients out of the statistically required sample size of 6600, they found that the HEART score was not inferior to usual care and there was no significant difference in median length of stay, but health care resources were typically lower in the HEART score group.23
Comment: While derived in a less conventional manner, the HEART score has held up in several validation studies and appears poised to safely decrease health care costs and increase ED efficiency and throughput. As more US EDs look to adopt high sensitivity troponin biomarkers, prospective studies will be needed to determine the role of the HEART score in this setting.
Thrombolysis in Myocardial Infarction (TIMI) score
The Thrombolysis in Myocardial Infarction (TIMI) score was developed in 2000 as a tool to risk-stratify patients with a diagnosis of unstable angina (UA) and non–ST-elevation myocardial infarction (NSTEMI). The score was derived from 1 arm (2047 patients) of a study comparing heparin with enoxaparin for treatment of NSTEMI, and validated in the other 3 arms of the study (5124 patients). Multivariate logistic regression was used to develop 7 variables of equal weight:
Age greater than or equal to 65yo
Three or more cardiac risk factors
Known coronary artery disease (with stenosis greater than or equal to 50%)
Aspirin use in the past 7 days
Severe angina (2 or more episodes in the past 24 hours)
EKG ST changes greater than or equal to 0.5 mm
Positive serum cardiac biomarkers
The investigators found that with a higher score, there was progressive increase in adverse cardiac outcomes, with a c-statistic of 0.65.24 This score was subsequently validated across several existing databases evaluating various therapeutic interventions for UA/NSTEMI and remained statistically significant, with increasing risk for MI and mortality with increasing score.25,26
Given the success in predicting patient outcomes and identifying patients who could benefit from more aggressive care, the TIMI risk score was then applied to unselected ED chest pain patients. In a secondary analysis of a prospective observational cohort of 3929 patient visits, the TIMI score correlated to the risk for adverse outcomes, with a risk of 2.1% at score 0.27
In a second prospective observational cohort of 1458 patient visits, a score of 0 correlated to a 1.7% incidence of adverse outcomes.28 In 2008, Body et al sought to increase the relative weight of EKG and biomarker factors to 5 (instead of 1) in a study of 796 patients, positing that these factors have more importance in the ED setting.29 Comparing the modified TIMI to the original, the modified instrument improved the area under curve (AUC) from 0.77 to 0.87.29 In follow-up validation studies, the modified score has an improved AUC, but the incidence of adverse outcomes at score 0 remains at about 2% for both modified and original score.30,31
In 2010, Hess et al performed a systematic review and meta-analysis of the studies that prospectively validated the TIMI score. They evaluated 10 validation studies, encompassing 17,265 patients across 5 countries, and found a strong linear relation between the TIMI score and adverse cardiac events.32 At TIMI score of 0, the incidence of cardiac events was 1.8%, with sensitivity of 97.2% and specificity of 25%. Subsequently, the ADAPT trial designed a diagnostic protocol consisting of TIMI risk assessment, EKG, and 0- and 2-hour troponin I biomarkers to find ED patients eligible for safe, early discharge.33 Of the 1975 patients, 20% were classified as low risk and eligible for early discharge, in that they had TIMI score of 0, a non-ischemic ECG, and negative troponins. Only one patient had a MACE at 30 days, giving the protocol a sensitivity of 99.7%, specificity of 23.4%, and negative predictive value of 99.7%.33
As the TIMI and HEART scores are both used to evaluate ED chest pain patients, several studies have sought to compare them. In 2015, Cartlon et al published a comparison of 5 established risk scores and 2 troponin assays in 963 patients: modified Goldman, TIMI, GRACE, HEART, and Vancouver Chest Pain Rule in combination with troponin T and I.34 The investigators found that a negative troponin T plus either TIMI score of 0 or a HEART score ≤3 gave a negative predictive value of greater than 99.5% with more than 30% of patients able to be discharged safely.34 In 2017, a comparison of the GRACE, HEART, and TIMI scores in 1833 chest pain patients found the HEART score identified more low risk patients than either of its comparators and had the highest AUC at 0.86.35 Other trials have similarly found HEART outperforming TIMI.36
Comment: The TIMI score was not specifically designed for ED use but has been adapted to serve this purpose. To the EP assessing the undifferentiated chest pain patient, the TIMI score uses clinical variables that may seem curious (eg, aspirin use) or impossible for EPs to ascertain (eg, presence or degree of stenosis). Even for patients with a score of 0, the risk for adverse outcomes remains stubbornly at the 2% level, similar to the original low risk HEART score findings.
Wells’ Criteria for Pulmonary Embolism
The diagnosis of pulmonary embolism (PE) is often challenging, requiring the use of multiple ED resources for timely diagnosis, and is therefore well suited for clinical decision instruments. The Wells’ Criteria were derived from a cohort of 1260 patients using logistic regression to identify 7 significant variables:
Clinical signs and symptoms of deep vein thrombosis (DVT): 3
PE is the most likely diagnosis: 3
Heart rate >100: 1.5
Immobilization or surgery in the previous 4 weeks: 1.5
Previously diagnosed DVT or PE: 1.5
Hemoptysis: 1
Malignancy with treatment within 6 months or palliative: 1
The investigators specifically linked the use of their instrument to the D-dimer assay, using their score to determine pretest probability and seeking to exclude the diagnosis in patients with low pretest probability and negative D-dimer result.37,38 They reported a three-tiered classification, with low risk at a score less than 2, moderate risk at scores from 2-6, and high risk at scores greater than 6. The risk for PE with a low risk score coupled with a negative D-dimer result were 1.5% and 2.7% in the derivation and validation cohorts. Using a two-tiered classification of PE unlikely at scores less than or equal to 4 and PE likely at scores 5 or greater, a PE unlikely score and a negative D-dimer had a 2.2% and 1.7% risk in the derivation and validation cohorts.
A subsequent study by Wells et al on 930 ED patients using the score plus D-dimer found a negative predictive value of 99.5% for a low risk score and a negative D-dimer.39 This allowed for reduced imaging in 53% of patients.39 Another external validation study found acceptable interrater agreement between physicians for the Wells’ score at kappa 0.62 for the three-tiered system and 0.7 for the two-tiered system.40 The Wells’ Criteria has been compared against the Geneva score with receiver operating characteristic curve analysis showing no difference between the two rules.41 In a large cohort of 3306 patients being evaluated for PE using the Wells’ score and D-dimer, for the 1028 patients with PE unlikely and a negative D-dimer, there was a 3-month incidence of venous thromboembolism (VTE) of 0.5%—none of which were fatal events.42
Comment: The Wells’ Criteria for pulmonary embolism combined with D-dimer is now the preferred approach for many EPs seeking to risk-stratify their patients for PE. Advances in age-adjusted cutoffs for D-dimer provide additional support for this powerful tool.
Pulmonary Embolism Rule-Out Criteria (PERC)
Given the low specificity of the D-dimer assay for VTE, researchers post–Wells’ Criteria have sought to further reduce unnecessary testing by reassessing the D-dimer’s role in the diagnostic pathway. The PERC rule was designed to reduce D-dimer use—and downstream CT scan testing—in low-risk patients. The investigators derived the rule from a population of patients for whom the pretest probability of PE was less than 15%, seeking a risk for PE less than 2% if the rule was satisfied. Using logistic regression in 3148 ED patients, 8 clinical criteria were obtained:
Age < 50 years Pulse <100
Pulse oximetry >94%
No unilateral leg swelling
No hemoptysis
No recent surgery
No prior PE/DVT
No hormone use
The variables were tested in 1427 low-risk and 382 very-low-risk patients (defined as being evaluated for dyspnea, but not part of the derivation or low-risk validation groups). In the low-risk group, the sensitivity, specificity, and false-negative rate was 96%, 27%, and 1.4% respectively. In the very-low-risk group, the sensitivity, specificity, and false-negative rate was 100%, 15%, and 0% respectively.43 The rule was further validated in a prospective multicenter study of 8138 patients; among patients with pretest probability less than 15% who were PERC negative, 1% had PE/DVT within 45 days.44 The large PERCEPIC trial on 1757 patients found low pretest probability patients who were PERC negative had a false-negative rate of 1.2% and estimated that the use of PERC could decrease the median length of stay in the ED by at least 2 hours.45 The PROPER study, a non-inferiority, crossover cluster-randomized trial in 14 EDs across France, found that use of the PERC rule was not inferior to conventional care and that it was associated with reduced ED length of stay and CT use.45,46
There has been criticism from some European studies that the PERC rule misses too many PEs. A provocatively titled multinational study from Hugli et al examined patients suspected to have PE in Switzerland, France, and Belgium. The investigators applied the PERC rule and then stratified the patients by pretest probability as defined by the Geneva score, which includes many of the same criteria as PERC. They found the PERC rule identified a small proportion of patients with suspected PE as very low risk (13.2%) and that the prevalence of PE among these patients was 5.4%. Critics of this study have noted that the PERC rule was designed to be applied in low-risk patients, not to define the low-risk population.47 Another study examined a retrospective cohort of patients in whom a D-dimer was ordered to exclude PE, and then calculated the Wells’ and PERC score from the medical record. The investigators found that the combination of Wells and PERC missed 2 PEs out of their population of 377 patients.48 However, a subsequent meta-analysis analyzed 11 studies—including the two negative studies—and found a pooled sensitivity of 97%, specificity of 23%, and negative likelihood ratio of 0.18, concluding that when the pretest probability is low, PERC is sensitive enough to exclude D-dimer testing.49
Comment: Given the number of disease states and sampling techniques that can cause nonspecific elevation in D-dimer assay, the PERC rule provides a useful tool in low-risk populations for excluding PE without laboratory testing. The key is applying the rule to the appropriate population, as stratified by gestalt or clinical score.
Infectious Disease
Mortality in Emergency Department Sepsis (MEDS) score
The Mortality in Emergency Department Sepsis (MEDS) score was developed as a risk stratification tool for patients presenting to the ED with concern for sepsis. This score was prospectively derived from a population of 3301 ED patient encounters during which a blood culture was ordered. Charts were reviewed and several data points extracted and analyzed to determine the following univariate predictors of 28-day mortality: terminal illness, tachypnea or hypoxia, septic shock, platelets <150,000/mm3, bands >5%, age >65 years, lower respiratory infection, nursing home residence, and altered mental status. These predictors were assigned point values based on their odds ratios, and points are added to generate a total score. Mortality risk was stratified into groups based on total score, with percentage mortality as follows: score 0-4: 0.9%; 5-7: 2.0%; 8-12: 7.8%; 13-15: 20.2%; >15: 50%. A separate validation cohort had the following mortality rates: score 0-4: 1.1%; 5-7: 4.4%; 8-12: 9.3%; 13-15: 16.1%; >15: 39%.50
The MEDS score was subsequently shown to also be predictive for 1-year mortality as well, with an area under receiver operating curve (AUROC) of 0.76 for 1-year mortality.51 A subsequent study showed similar mortality rates when expanding the patient population to include all patients with systemic inflammatory response syndrome (SIRS), potentially broadening the potential application of MEDS in ED risk stratification.52 However, the score was shown to be less predictive in patients with severe sepsis and septic shock, underestimating mortality in all MEDS score groups.53 Still, the MEDS score was demonstrated in multiple validation studies as a reliable risk stratification tool in patients with suspected infection or SIRS.54,55
Comment: The MEDS score is not as well studied in the literature as the SIRS criteria or QuickSOFA but is a validated risk stratification tool in patients with suspected infection and is ED specific. This tool, similar to Pneumonia Severity Index and CURB-65 (discussed below), can guide management of patients from the ED. Very-low-risk (score 0-4) patients can be treated as outpatients, low risk (score 5-7) patients warranting consideration of a short inpatient stay, and moderate to high risk (>8) requiring inpatient management. At present, there is insufficient evidence regarding the role of the MEDS score to guide inpatient disposition of floor vs. ICU in moderate to high-risk patients.
Pneumonia Severity Index
The Pneumonia Severity Index (PSI) was developed as a tool to predict mortality risk from pneumonia, allowing providers to appropriately manage care for these patients in the hospital or as outpatients. A derivation cohort of 14199 patients was utilized to create a prediction rule in two steps meant to parallel a clinician’s decision-making process. The first step identified a population of patients that were at low risk for death, which were assigned to class I. The second step quantified the risk for death in the remaining patients using weighted factors including demographics, comorbidities, exam findings, and clinical data. In all, 20 variables were used and assigned corresponding points, the sum of which would assign a patient to a particular risk for mortality (class II-V).56
Mortality risk was relatively low for patients in class I and II (0.4 and 0.7%, respectively). Class III carried a mortality risk of 2.8%. Mortality increased with class IV and class V classification: 8.5% and 31.1%, respectively. These data were replicated with a separate validation cohort of 38039 patients, with similar mortality rates in each class. This study concluded with the recommendation that patients diagnosed with pneumonia falling into class I and II mortality risk should be managed as outpatients, possible brief inpatient observation for class III, and class IV and V managed as inpatients.56
Subsequent trials evaluating the utility of the PSI score in the management of patients diagnosed with pneumonia randomized low-risk patients (class I-III PSI) to treatment as outpatients vs inpatients. There were no statistical differences in adverse outcomes (ICU admission, hospital readmission, mortality, complications), with notable improvements in hospital admission rates and patient satisfaction.57,58 A meta-analysis of 6 studies that used a clinical decision tools to identify low-risk patients to treat pneumonia as outpatients showed no significant difference in mortality, patient readmissions, or patient satisfaction. Low-risk patients that required admission often included comorbid illnesses not included in the PSI, inability to take oral medications, barriers to compliance, or hypoxemia.59
Though the PSI has been shown to successfully identify patients at low risk for mortality, it has been less accurate at predicting and stratifying classes of severe pneumonia. A meta-analysis by Loke et al showed that PSI class IV or V had pooled sensitivity of 0.90 and specificity 0.53 for 30-day mortality, which was significantly better than the CURB-65 rule (discussed below).60 However, a subsequent large meta-analysis showed that PSI class IV or V had a sensitivity of 75% and specificity 40% for requiring ICU intervention or admission, which are not sufficient to guide disposition decisions.61
CURB-65
One of the criticisms of PSI included its complexity, with inclusion of 20 factors making it impractical for use as a bedside tool. The CURB-65 score was developed with a similar goal of identifying low-risk patients with pneumonia who would be candidates for outpatient management, but also patients at high risk for mortality or ICU admission. Criteria for severe pneumonia published by the British Thoracic Society include: respiratory rate ≥ 30 breaths/min, diastolic blood pressure ≤60 mmHg, and blood urea nitrogen >7 mmol/L. The presence of 2 criteria was 88% sensitive and 72% specific for mortality or ICU admission.62 The CURB-65 tool was based on these criteria, with the addition of age ≥65 years, which was found to be a separate independent predictor of mortality. Thus, the 5 criteria making up the score are as follows (1 point each, 0-5 total):
Confusion, meaning Mental Test Score ≤8, or disorientation to person, place, or time
Urea >7 mmol/L (>19.6 mg/dL)
Respiratory rate ≥ 30 breaths/minute
Blood pressure (systolic < 90 mmHg or diastolic ≤ 60 mmHg)
Age ≥ 65 years
A score of 0-1 of these criteria characterized low mortality risk (<1.5%) in the test group, a score of 2 was intermediate mortality risk (9.2%), and a score of 3 or more associated with high mortality risk (22%). A score ≥ 2 was 93% sensitive and 49% specific for 30-day mortality.63
A subsequent prospective validation study by Aujesky et al that included 3181 patients with community-acquired pneumonia demonstrated slightly higher mortality rates for each CURB-65 score (0.6%, 3%, 6.1%, 13%, 17%, 43% mortality in scores of 0-5, respectively).64 In particular, the 3% mortality rate in CURB-65 scores of 1 is similar to PSI class III mortality rates, suggesting a lower threshold (CURB-65 ≥1) for consideration of admission for management. Another validation study by Capelastegui et al showed similar mortality rates to the derivation study for specific CURB-65 scores, but noted 53% of patients with a score of 1 also were found to have characteristics that were independent for a poor prognosis, and should be considered in the decision for outpatient or inpatient treatment.65 Furthermore, a recent study found that of patients in the ED with a CURB-65 score of 1, 8% still required critical care intervention.66 Thus, use of CURB-65 in screening for low-risk patients with community-acquired pneumonia is recommended to be limited to scores of 0. However, as with PSI, validation studies have yet to show predictive utility of scores suggesting severe pneumonia (CURB-65 ≥3) in predicting mortality or ICU requirement.60,61
As validation studies have suggested only patients with a CURB-65 score of 0 are screened low risk enough for outpatient treatment, greater weight may be placed on utility of CRB-65 as a tool. This rule, initially proposed in the same study as CURB-65, omits blood urea nitrogen as a factor to only rely on history and physical exam data with a score of 0 indicating low risk.63 In initial derivation and validation studies, this rule demonstrated <1.6% mortality risk with a score of 0, with risk increasing to 4-8.6% in scores of 1.63,65 Multiple studies have compared CRB-65 and CURB-65, with only marginal but not statistically significant improvement in prognostic utility of CURB-65.65,67 A meta-analysis of 1648 patients even showed only 0.5% mortality risk in CRB-65 ≤1; potentially including CRB-65 0-1 as low risk, though, would require further study.68 Although multiple validation studies have also successfully stratified low risk to similar mortality risk (<1.6%), accuracy wanes with higher CRB-65 scores.69
Several studies have directly compared CURB-65 and PSI both in terms of identifying low-risk patients and stratifying disease severity.60,61,64,68,70-72 Multiple studies have shown similar mortality risk in low-risk populations and have demonstrated sensitivities for mortality greater than 96% for CURB-65/CRB-65 = 0 and PSI class I-III, albeit with specificities ranging from 18-65%.64,68,70 In stratifying patients into different levels of severity (ward vs ICU patients), PSI has shown slightly better sensitivity/specificity for mortality and/or ICU intervention, though neither is strong enough to significantly stratify severe pneumonia to serve as tools for directing inpatient management.60,61
Comment: PSI, CRB-65, and CURB-65 have been well validated as screening tools for low-risk patients who should be treated as outpatients (CURB-65 or CRB-65 = 0, PSI class I and II). A moderate-risk population (CURB-65 = 1 or 2, PSI class III) may benefit from treatment as inpatient or outpatient at clinician judgement. Use of these tools for determining disease severity and possible ICU requirement is not as reliable, and other clinical factors should be considered.
Conclusion
This article provides an overview of several common clinical decision instruments and the evidence behind them. Ultimately, many institutions have incorporated clinical decision rules directly into the electronic medical record, and this strategy will not only increase their use, but hopefully collect further data on whether the instruments truly perform better than unstructured clinical judgement.
1. Perry JJ, Sivilotti MLA, Sutherland J, et al. Validation of the Ottawa Subarachnoid Hemorrhage Rule in patients with acute headache. CMAJ. 2017;189(45):E1379-E1385.
2. de Rooij NK, Linn FH, van der Plas JA, Algra A, Rinkel GJ. Incidence of subarachnoid haemorrhage: a systematic review with emphasis on region, age, gender and time trends. J Neurol Neurosurg Psychiatry. 2007;78(12):1365-1372.
3. Perry JJ, Stiell IG, Sivilotti ML, et al. Sensitivity of computed tomography performed within six hours of onset of headache for diagnosis of subarachnoid haemorrhage: prospective cohort study. BMJ. 2011;343:d4277.
4. Johnston SC, Rothwell PM, Nguyen-Huynh MN, et al. Validation and refinement of scores to predict very early stroke risk after transient ischaemic attack. Lancet. 2007;369(9558):283-292.
5. Easton JD, Saver JL, Albers GW, et al. Definition and evaluation of transient ischemic attack: a scientific statement for healthcare professionals from the American Heart Association/American Stroke Association Stroke Council; Council on Cardiovascular Surgery and Anesthesia; Council on Cardiovascular Radiology and Intervention; Council on Cardiovascular Nursing; and the Interdisciplinary Council on Peripheral Vascular Disease. The American Academy of Neurology affirms the value of this statement as an educational tool for neurologists. Stroke. 2009;40:2276-2293
6. Perry JJ, Sharma M, Sivilotti ML, et al. Prospective validation of the ABCD2 score for patients in the emergency department with transient ischemic attack. CMAJ. 2011;183(10):1137-1145.
7. Stead LG, Suravaram S, Bellolio MF, et al. An assessment of the incremental value of the ABCD2 score in the emergeny department evaluation of transient ischemic attack. Ann Emerg Med. 2011;57(1):46-51.
8. Alvarado A. A practical score for the early diagnosis of acute appendicitis. Ann Emerg Med. 1986;15(5):557-564.
9. Kalan M, Talbot D, Cunliffe WJ, Rich AJ. Evaluation of the modified Alvarado score in the diagnosis of acute appendicitis: a prospective study. Ann R Coll Surg Engl. 1994;76(6):418-419.
10. Ohle R, O'Reilly F, O'Brien KK, Fahey T, Dimitrov BD. The Alvarado score for predicting acute appendicitis: a systematic review. BMC Med. 2011;9:139.
11. Meltzer AC, Baumann BM, Chen EH, Shofer FS, Mills AM. Poor sensitivity of a modified Alvarado score in adults with suspected appendicitis. Ann Emerg Med. 2013;62(2):126-31.
12. Andersson M, Andersson RE. The appendicitis inflammatory response score: a tool for the diagnosis of acute appendicitis that outperforms the Alvarado score. World J Surg. 2008;32(8):1843-1849.
13. de Castro SM, Ünlü C, Steller EP, van Wagensveld BA, Vrouenraets BC. Evaluation of the appendicitis inflammatory response score for patients with acute appendicitis. World J Surg. 2012;36(7):1540-1545.
14. Kollár D, McCartan DP, Bourke M, Cross KS, Dowdall J. Predicting acute appendicitis? A comparison of the Alvarado score, the Appendicitis Inflammatory Response Score and clinical assessment. World J Surg. 2015;39(1):104-109.
15. Andersson M, Kolodziej B, Andersson RE; STRAPPSCORE Study Group. Randomized clinical trial of Appendicitis Inflammatory Response score-based management of patients with suspected appendicitis. Br J Surg. 2017;104(11):1451-1461.
16. Six AJ, Backus BE, Kelder JC. Chest pain in the emergency room: value of the HEART score. Netherlands Heart J. 2008;16(6):191-196.
17. Backus BE, Six AJ, Kelder JC, et al. Chest Pain in the Emergency Room. A Multicenter Validation of the HEART Score. Crit Pathways Cardiol. 2010;9:164-169.
18. Backus BE, Six AJ, Kelder JC, et al. A prospective validation of the HEART score for chest pain patients at the emergency department. In J Cardiol. 2013;168:2153-2158.
19. Six AJ, Cullen L, Backus BE, et al. The HEART score for the assessment of patients with chest pain in the emergency department. Crit Pathways Cardiol. 2013;12:121-126.
20. Mahler SA, Hiestand BC, Goff DC, Hoekstra JW, Miller CD. Can the HEART score safely reduce stress testing and cardiac imaging in patients at low risk for acute coronary syndrome? Crit Pathw Cardiol. 2011:10(3):128-133.
21. Mahler SA, Miller CD, Hollander JE, et al. Identifying patients for early discharge: performance of decision rules among patients with acute chest pain. Int J Cardiol. 2013;168(2):795-802.
22. Mahler SA, Riley RF, Hiestand BC, et al. The HEART Pathway Randomized Trial: identifying emergency department patients with acute chest pain for early discharge. Circ Cardiovasc Qual Outcomes. 2015;8(2):195-203.
23. Poldervaart JM, Reitsma JB, Backus BE, et al. Effect of using the HEART score in patients with chest pain in the emergency department: a stepped-wedge, cluster randomized trial. Ann Intern Med. 2017;166:687-697.
24. Antman EM, Cohen M, Bernink PJLM, et al. The TIMI risk score for unstable angina/non-ST eevation MI. JAMA. 2000;284:835-842.
25. Scirica BM, Cannon CP, Antman EM, et al. Validation of the Thrombolysis In Myocardial Infarction (TIMI) risk score for unstable angina pectoris and non-ST-elevation myocardial infarction in the TIMI III registry. Am J Cardiol. 2002;90:303-305.
26. Morrow DA, Antman EM, Snapinn SM, McCabe CH, Theroux P, Braunwald E. An integrated clinical approach to predicting the benefit of tirofiban in non-ST elevation acute coronary syndromes. Eur Heart J. 2002;23:223-229.
27. Pollack CV, Sites FD, Shofer FS, Sease KL, Hollander JE. Application of the TIMI risk score for unstable angina and non–ST-elevation acute coronary syndrome to an unselected emergency department chest pain population. Acad Emerg Med. 2006:13(1):13-18.
28. Chase M, Robey JL, Zogby KE, Sease KL, Shofer FS, Hollander JE. Prospective validation of the Thrombolysis in Myocardial Infarction risk score in the emergency department chest pain population. Ann Emerg Med. 2006;48(3):252-259.
29. Body R, Carley S, McDowell G, Ferguson J, Mackway-Jones K. Can a modified thrombolysis in myocardial infarction risk score outperform the original for risk stratifying emergency department patients with chest pain? Emerg Med J. 2009;26:95-99.
30. Hess EP, Perry JJ, Calder LA, et al. Prospective validation of a modified Thrombolysis In Myocardial Infarction risk score in emergency department patients with chest pain and possible acute coronary syndrome. Acad Emerg Med. 2010;17(4):368-375.
31. Macdonald SPJ, Nagree Y, Fatovich DM, ad Brown SGA. Modified TIMI risk score cannot be used to identify low-risk chest pain in the emergency department: a multicenter validation study. Emerg Med J. 2014;31:281-285.
32. Hess EP, Agarwal D, Chandra S, et al. Diagnostic accuracy of the TIMI risk score in patients with chest pain in the emergency department: a meta-analysis. CMAJ. 2010;182(10):1039-1044.
33. Than, M, Cullen L, Aldous S, et al. 2-Hour accelerated diagnostic protocol to assess patients with chest pain symptoms using contemporary troponins as the only biomarker: the ADAPT trial. JACC. 2012;59(23):2091-2098.
34. Carlton EW, Khattab A, Greaves K. Identifying patients suitable for discharge after a single-presentation high-sensitivity Troponin result: a comparison of five established risk scores and two high-sensitivity assays. Ann Emerg Med. 2015;66(6):635-645.
35. Poldervaart JM, Langedijk M, Backus BE, et al. Comparison of the GRACE, HEART and TIMI score to predict major adverse cardiac events in chest pain patients at the emergency department. Int J Cardiol. 2017;227:656-661.
36. Nieuwets A, Poldervaart JM, Reitsma JB, et al. Medical consumption compared for TIMI and HEART score in chest pain patients at the emergency department: a retrospective cost analysis. BMJ Open. 2016;6:e010694.
37. Wells PS, Ginsberg JS, Anderson DR, et al. Use of a clinical model for safe management of patients with suspected pulmonary embolism. Ann Intern Med. 1998;129:997-1005.
38. Wells PS, Anderson DR, Rodger M, et al. Derivation of a simple clinical model to categorize patients’ probability of pulmonary embolism: increasing the model’s utility with the SimpliRED D-dimer. Thromb Haemost. 2000;83(3):416-420.
39. Wells PS, Anderson DR, Rodger M, et al. Excluding pulmonary embolism at the bedside without diagnostic imaging: management of patients with suspected pulmonary embolism presenting to the emergency department by using a simple clinical model and D-dimer. Ann Intern Med. 2001;135:98-107.
40. Wolf SJ, McCubbin TR, Feldhaus KM, Faragher JP, Adcock DM. Prospective validation of Wells’ criteria in the evaluation of patients with suspected pulmonary embolism. Ann Emerg Med. 2004;44:503-510.
41. Chagnon I, Bounameaux H, Aujesky D, et al. Comparison of two clinical prediction rules and implicit assessment among patients with suspected pulmonary embolism. Am J Med. 2002;113:269-275.
42. Christopher Study Investigators. Effectiveness of managing suspected pulmonary embolism using an algorithm combining clinical probability, D-dimer testing, and computed tomography. JAMA. 2006;295:172-179.
43. Kline JA, Mitchell AM, Kabrhel C, Richman PB, Courtney DM. Clinical criteria to prevent unnecessary diagnostic testing in emergency department patients with suspected pulmonary embolism. J Thromb Haemost. 2004;2:1247-1255.
44. Kline JA, Courtney DM, Kabrhel C, et al. Propsective multicenter evaluation of the pulmonary embolism rule-out criteria. J Thromb Haemost. 2008;6:772-780.
45. Penaloza A, Soulie C, Moumneh T, et al. Pulmonary embolism rule-out criteria (PERC) rule in European patients with low implicit clinical probability (PERCEPIC): a multicenter, prospective, observational study. Lancet Haematol. 2017;4:e615-e621.
46. Freund Y, Cachanado M, Aubry A, et al. Effect of the Pulmonary Embolism Rule-Out Criteria on subsequent thromboembolic events among low-risk emergency department patients. The PROPER randomized clinical trial. JAMA. 2018;319(6):559-566.
47. Hugli O, Righini M, Le Gal G, et al. The pulmonary embolism rule-out criteria (PERC) rule does not safely exclude pulmonary embolism. J Thromb Haemost. 2011;9:300-4.
48. Theunissen JMG, Scholing C, van Hasselt WE, van der Maten J, ter Avest E. A retrospective analysis of the combined use of PERC rule and Wells score to exclude pulmonary embolism in the Emergency Department. Emerg Med J. 2016;33:696-701.
49. Singh B, Parsaik AK, Aharwal D, Surana A, Mascarenhas SS, Chandra S. Diagnostic accuracy of Pulmonary Embolism Rule-Out Criteria: a systematic review and meta-analysis. Ann Emerg Med. 2012;59(6):517-520.
50. Shapiro NI, Wolfe RE, Moore RB, Smith E, Burdick E, Bates DW. Mortality in Emergency Department Sepsis (MEDS) score: a prospectively derived and validated clinical prediction rule. Crit Care Med. 2003;31(3):670-675.
51. Shapiro NI, Howell MD, Talmor D, Donnino M, Ngo L, Bates DW. Mortality in Emergency Department Sepsis (MEDS) score predicts 1-year mortality. Crit Care Med. 2007;35(1):192-198.
52. Sankoff JD, Goyal M, Gaieski DF, et al. Validation of the Mortality in Emergency Department Sepsis (MEDS) score in patients with the systemic inflammatory response syndrome (SIRS). Crit Care Med. 2008;36(2):421-26.
53. Jones AE, Saak K, Kline JA. Performance of the Mortality in Emergency Department Sepsis score for predicting hospital mortality among patients with severe sepsis and septic shock. Am J Emerg Med. 2008;26(6):689-692.
54. Carpenter CR., Keim SM, Upadhye S, Nguyen HB. Risk stratification of the potentially septic patient in the emergency department: the Mortality in the Emergency Department Sepsis (MEDS) score. J Emerg Med. 2009;37(3):319-327.
55. Hermans MAW, Leffers P, Jansen LM, Keulemans YC, Stassen PM. The value of the Mortality in Emergency Department Sepsis (MEDS) score, C reactive protein and lactate in predicting 28-day mortality of sepsis in a Dutch emergency department. Emerg Med J. 2012;29(4):295–300.
56. Fine MJ, Auble TE, Yealy DM, et al. A Prediction Rule to Identify Low-Risk Patients with Community Acquired Pneumonia. N Engl J Med. 1997;326(4):243-250.
57. Marrie TJ, Lau CY, Wheeler SL, et al. A controlled trial of a critical pathway for treatment of community-acquired pneumonia. JAMA. 2000;283(6):749-755. doi:10.1001/jama.283.6.749.
58. Carratalà J, Fernandez-Sabe N. Outpatient care compared with hospitalization for community-acquired pneumonia: a randomized trial in low-risk patients . Ann Intern Med. 2005;142:165-172. doi:10.7326/0003-4819-142-3-200502010-00006.
59. Chalmers JD, Akram AR, Hill AT. Increasing outpatient treatment of mild community-acquired pneumonia: Systematic review and meta-analysis. Eur Respir J. 2011;37(4):858-864. doi:10.1183/09031936.00065610.
60. Loke YK, Kwok CS, Niruban A, Myint PK. Value of severity scales in predicting mortality from community-acquired pneumonia: systematic review and meta-analysis. Thorax. 2010;65(10):884-890. doi:10.1136/thx.2009.134072.
61. Marti C, Garin N, Grosgurin O, et al. Prediction of severe community-acquired pneumonia: A systematic review and meta-analysis. Crit Care. 2012;16(4):R141. doi:10.1186/cc11447.
62. Neill AM, Martin IR, Weir R, et al. Community-acquired pneumonia: aetiology and usefulness of severity criteria on admission. Thorax. 1996;51(10):1010-1016. doi:10.1136/thx.51.10.1010.
63. Lim WS, Van Der Eerden MM, Laing R, et al. Defining community acquired pneumonia severity on presentation to hospital: An international derivation and validation study. Thorax. 2003;58(5):377-382. doi:10.1136/thorax.58.5.377.
64. Aujesky D, Auble TE, Yealy DM, et al. Prospective comparison of three validated prediction rules for prognosis in community-acquired pneumonia. Am J Med. 2005;118(4):384-392. doi:10.1016/j.amjmed.2005.01.006.
65. Capelastegui A, España PP, Quintana JM, et al. Validation of a predictive rule for the management of community-acquired pneumonia. Eur Respir J. 2006;27(1):151-157. doi:10.1183/09031936.06.00062505.
66. Ilg A, Moskowitz A, Konanki V, et al. Performance of the CURB-65 score in predicting critical care interventions in patients admitted with community-acquired pneumonia. Ann Emerg Med. 2018. doi:10.1016/j.annemergmed.2018.06.017.
67. Bauer TT, Ewig S, Marre R, Suttorp N, Welte T. CRB-65 predicts death from community-acquired pneumonia. J Intern Med. 2006;260(1):93-101. doi:10.1111/j.1365-2796.2006.01657.x.
68. Akram AR, Chalmers JD, Hill AT. Predicting mortality with severity assessment tools in out-patients with community-acquired pneumonia. QJM. 2011;104(10):871-879. doi:10.1093/qjmed/hcr088.
69. McNally M, Curtain J, O’Brien KK, Dimitrov BD, Fahey T. Validity of British Thoracic Society guidance (the CRB-65 rule) for predicting the severity of pneumonia in general practice: Systematic review and meta-analysis. Br J Gen Pract. 2010;60(579):423-433. doi:10.3399/bjgp10X532422.
70. Shah BA, Ahmed W, Dhobi GN, Shah NN, Khursheed SQ, Haq I. Validity of Pneumonia Severity Index and CURB-65 severity scoring systems in community acquired pneumonia in an Indian Setting. Indian J Chest Dis Allied Sci. 2010;52(1):9-17.
71. Noguchi S, Yatera K, Kawanami T, et al. Pneumonia severity assessment tools for predicting mortality in patients with cealthcare-associated pneumonia: a systematic review and meta-analysis. Respiration. 2017;93(6):441-450. doi:10.1159/000470915.
72. Kolditz M, Braeken D, Ewig S, Rohde G. Severity assessment and the immediate and long-term prognosis in community-acquired pneumonia. Semin Respir Crit Care Med. 2016;37(6):886-896. doi:http://dx.doi.org/10.1055/s-0036-1592127.
Hippocampal abnormalities seen in epilepsy subtypes may be congenital
NEW ORLEANS – , although to a lesser extent, based on findings from two studies presented at the annual meeting of the American Epilepsy Society.
While the studies suggest an imaging endophenotype associated with these disorders, it’s unclear if a larger degree of abnormality causes disease manifestation, or whether there are other predisposing actors at work.
“What our study tells us is that hippocampal abnormalities can occur in the absence of seizure,” Marian Galovic, MD, said in an interview. “It may be that, in some cases, hippocampal abnormalities could be the cause, rather than the consequence, of seizures.”
Dr. Galovic of University College London was on hand to discuss the work of his colleague, Lili Long, MD, PhD, of the Xiangya Hospital of Central South University, Changsha, China. Visa issues prevented her from attending the meeting.
The study included 18 sibling pairs in which the affected siblings had sporadic, nonlesional temporal lobe epilepsy (TLE), involving the right lobe in 12 and the left in 6. The patients, siblings, and 18 healthy, age-matched controls underwent clinical, electrophysiologic, and high-resolution structural neuroimaging.
The researchers compared overall hippocampal volumes between groups and determined the subregional extent of hippocampal abnormalities using shape analysis. They also looked at whole-brain differences in cortical thickness and folding complexity.
As expected, median hippocampal volumes were largest in the healthy controls (left = 2.82 mL, right = 2.94 mL), and smallest in patients. Patients with left TLE had a median left hippocampal volume of 2.23 mL, while those with right TLE had a median right hippocampal volume of 1.92 mL.
However, volume in the unaffected siblings was a surprise. Like the patients, these subjects also had significant reductions in hippocampal volume when compared with controls (left = 2.47 mL, right = 2.65 mL). “The atrophy was relatively similar in siblings and patients, although not as pronounced in siblings,” Dr. Galovic said. “It was mostly unilateral in the siblings and bilateral in the patients, but it was still more pronounced on the side where the epilepsy of the affected sibling was coming from.”
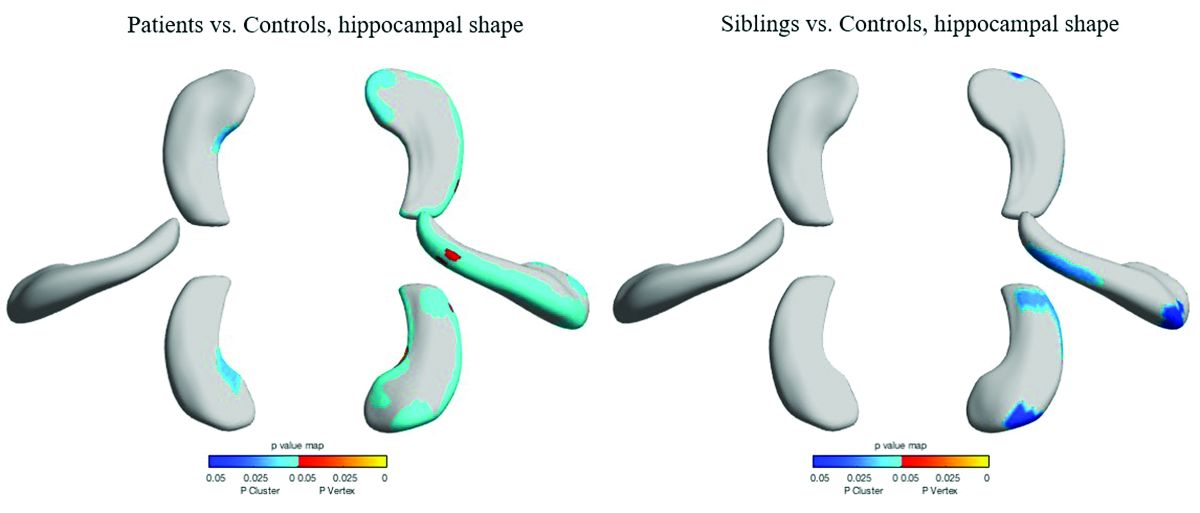
Patients and siblings also shared morphologic variations of the hippocampus, with atrophy more pronounced on the right than the left. The right lateral body and anterior head of the hippocampus were most affected, Dr. Galovic said, with reductions in the right cornu ammonis 1 subfield and subiculum.
Widespread cortical thinning was present in patients, including the pericentral, frontal, and temporal areas. Unaffected siblings also showed cortical thinning, but this was mostly restricted to the right postcentral gyrus. Patients and siblings also demonstrated increased cortical folding complexity, but in different areas: predominantly frontal in patients, but predominantly parieto-occipital in siblings. Both were significantly different than healthy control subjects.
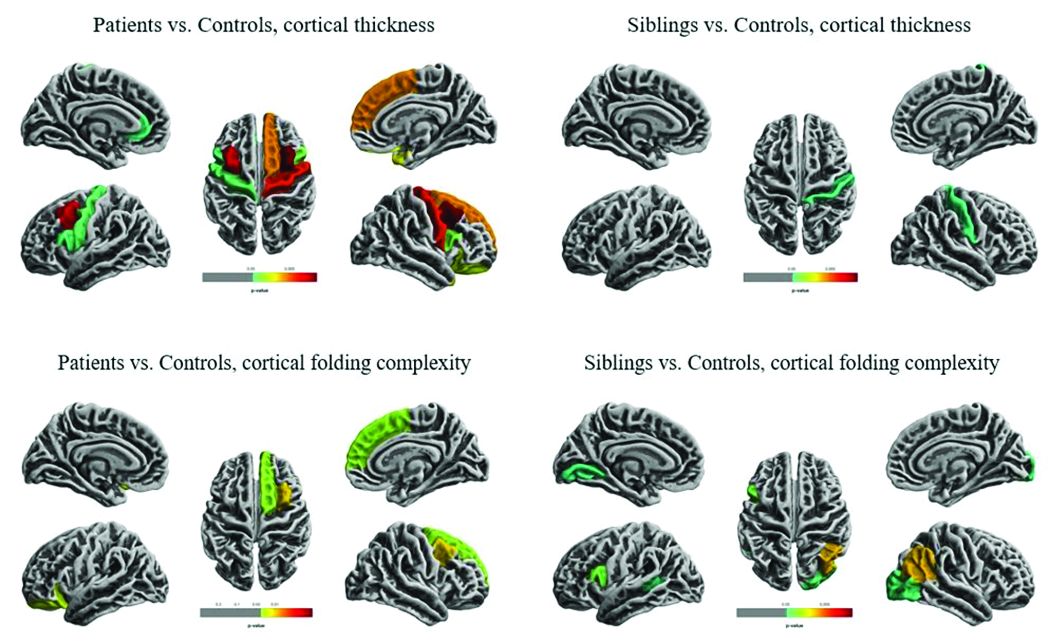
The study didn’t examine any association with memory, which is often impaired in patients with TLE. However, Dr. Galovic said, “We have just submitted for publication a study in which we did find an association between focal hippocampal atrophy and memory performance.”
A different study by a team at University College London looked at hippocampal structure and function in patients with juvenile myoclonic epilepsy (JME) and their unaffected siblings. The imaging study, lead by Lorenzo Caciagli, MD, of the university comprised 37 patients with JME, 16 unaffected siblings, and 20 healthy controls. It employed multimodal MRI and neuropsychological measures to examine the form and function of the mesiotemporal lobe.
The subjects were matched for age, sex, handedness, and hemispheric dominance, which was assessed with language lateralization indices. This measures the number of active voxels on functional MRI, showing which hemisphere is dominant for language.
Both patients and their siblings showed reductions in left hippocampal volume on the order of 5%-8%, significantly smaller than the volumes seen in healthy controls. About half of patients and half of siblings also showed either unilateral or bilateral hippocampal malrotation. This was present in just 15% of controls, another significant difference. The structural differences weren’t associated with seizure control or age at disease onset, or with any impairments in verbal or visual memory. But when the investigators performed functional mapping, they found unusual patterns of hippocampal activation in both patients and siblings, pointing to a dysfunction of verbal encoding. In patients, there appeared to be distinct patterns of underactivation along the hippocampal long axis, regardless of whether malrotation was present. But among patients who had malrotation, the left posterior hippocampus showed more activation during visual memory.
The team concluded that the hippocampal abnormalities in volume, shape, and positioning in patients with JME and their siblings are related to functional reorganization. The abnormalities probably occur during prenatal neurodevelopment, they noted.
“Cosegregation of imaging patterns in patients and their siblings is suggestive of genetic imaging phenotypes, and independent of disease activity,” Dr. Caciagli and his coinvestigators wrote in their abstract.
Funding for the TLE study came from the National Natural Science Foundation of China, the Ministry of Science and Technology of China, and Xiangya Hospital. Funding for the JME study came from a variety of U.K. charities and government agencies.
SOURCES: Long L et al. AES 2018, Abstract 2.183; Caciagli L et al. AES 2018, Abstract 2.166.
NEW ORLEANS – , although to a lesser extent, based on findings from two studies presented at the annual meeting of the American Epilepsy Society.
While the studies suggest an imaging endophenotype associated with these disorders, it’s unclear if a larger degree of abnormality causes disease manifestation, or whether there are other predisposing actors at work.
“What our study tells us is that hippocampal abnormalities can occur in the absence of seizure,” Marian Galovic, MD, said in an interview. “It may be that, in some cases, hippocampal abnormalities could be the cause, rather than the consequence, of seizures.”
Dr. Galovic of University College London was on hand to discuss the work of his colleague, Lili Long, MD, PhD, of the Xiangya Hospital of Central South University, Changsha, China. Visa issues prevented her from attending the meeting.
The study included 18 sibling pairs in which the affected siblings had sporadic, nonlesional temporal lobe epilepsy (TLE), involving the right lobe in 12 and the left in 6. The patients, siblings, and 18 healthy, age-matched controls underwent clinical, electrophysiologic, and high-resolution structural neuroimaging.
The researchers compared overall hippocampal volumes between groups and determined the subregional extent of hippocampal abnormalities using shape analysis. They also looked at whole-brain differences in cortical thickness and folding complexity.
As expected, median hippocampal volumes were largest in the healthy controls (left = 2.82 mL, right = 2.94 mL), and smallest in patients. Patients with left TLE had a median left hippocampal volume of 2.23 mL, while those with right TLE had a median right hippocampal volume of 1.92 mL.
However, volume in the unaffected siblings was a surprise. Like the patients, these subjects also had significant reductions in hippocampal volume when compared with controls (left = 2.47 mL, right = 2.65 mL). “The atrophy was relatively similar in siblings and patients, although not as pronounced in siblings,” Dr. Galovic said. “It was mostly unilateral in the siblings and bilateral in the patients, but it was still more pronounced on the side where the epilepsy of the affected sibling was coming from.”
Patients and siblings also shared morphologic variations of the hippocampus, with atrophy more pronounced on the right than the left. The right lateral body and anterior head of the hippocampus were most affected, Dr. Galovic said, with reductions in the right cornu ammonis 1 subfield and subiculum.
Widespread cortical thinning was present in patients, including the pericentral, frontal, and temporal areas. Unaffected siblings also showed cortical thinning, but this was mostly restricted to the right postcentral gyrus. Patients and siblings also demonstrated increased cortical folding complexity, but in different areas: predominantly frontal in patients, but predominantly parieto-occipital in siblings. Both were significantly different than healthy control subjects.
The study didn’t examine any association with memory, which is often impaired in patients with TLE. However, Dr. Galovic said, “We have just submitted for publication a study in which we did find an association between focal hippocampal atrophy and memory performance.”
A different study by a team at University College London looked at hippocampal structure and function in patients with juvenile myoclonic epilepsy (JME) and their unaffected siblings. The imaging study, lead by Lorenzo Caciagli, MD, of the university comprised 37 patients with JME, 16 unaffected siblings, and 20 healthy controls. It employed multimodal MRI and neuropsychological measures to examine the form and function of the mesiotemporal lobe.
The subjects were matched for age, sex, handedness, and hemispheric dominance, which was assessed with language lateralization indices. This measures the number of active voxels on functional MRI, showing which hemisphere is dominant for language.
Both patients and their siblings showed reductions in left hippocampal volume on the order of 5%-8%, significantly smaller than the volumes seen in healthy controls. About half of patients and half of siblings also showed either unilateral or bilateral hippocampal malrotation. This was present in just 15% of controls, another significant difference. The structural differences weren’t associated with seizure control or age at disease onset, or with any impairments in verbal or visual memory. But when the investigators performed functional mapping, they found unusual patterns of hippocampal activation in both patients and siblings, pointing to a dysfunction of verbal encoding. In patients, there appeared to be distinct patterns of underactivation along the hippocampal long axis, regardless of whether malrotation was present. But among patients who had malrotation, the left posterior hippocampus showed more activation during visual memory.
The team concluded that the hippocampal abnormalities in volume, shape, and positioning in patients with JME and their siblings are related to functional reorganization. The abnormalities probably occur during prenatal neurodevelopment, they noted.
“Cosegregation of imaging patterns in patients and their siblings is suggestive of genetic imaging phenotypes, and independent of disease activity,” Dr. Caciagli and his coinvestigators wrote in their abstract.
Funding for the TLE study came from the National Natural Science Foundation of China, the Ministry of Science and Technology of China, and Xiangya Hospital. Funding for the JME study came from a variety of U.K. charities and government agencies.
SOURCES: Long L et al. AES 2018, Abstract 2.183; Caciagli L et al. AES 2018, Abstract 2.166.
REPORTING FROM AES 2018
How does CBD compare and interact with other AEDs?
according to a review published in Developmental Medicine & Child Neurology. “Careful down-titration of benzodiazepines is essential to minimize sedation with adjunctive CBD,” the authors said.
Although CBD’s antiepileptic mechanisms “are not fully elucidated, it is clear that administration of CBD as adjunct therapy decreases seizure frequency in patients with Dravet syndrome and Lennox-Gastaut syndrome,” wrote Shayma Ali, a doctoral student in the department of pediatrics and child health at the University of Otago in Wellington, New Zealand, and her colleagues. “Contrary to public expectation of miraculous results, CBD has a similar antiepileptic and side effect profile to other AEDs. Nevertheless, as individual children with these developmental and epileptic encephalopathies are often refractory to available AEDs, the addition of another potentially effective therapeutic medicine will be warmly welcomed by families and physicians.”
The FDA approved Epidiolex, a pharmaceutical-grade oral solution that is 98% CBD, in June of 2018. In September of 2018, the Drug Enforcement Administration classified it as a Schedule V controlled substance. Patients’ use of nonpharmaceutical grade CBD products, including those combined with tetrahydrocannabinol (THC), “raises concerns about the use of products with THC on the developing brain,” the review authors said.
Randomized trials
Three randomized, controlled, double-blind trials in patients with Dravet syndrome and Lennox-Gastaut syndrome found that CBD, compared with placebo, results in greater median seizure reductions (38%-41% vs. 13%-19%) and responder rates (i.e., the proportion of patients with 50% reductions in convulsive or drop seizures; 39%-46% vs. 14%-27%).
Common adverse effects include somnolence, diarrhea, decreased appetite, fatigue, lethargy, pyrexia, and vomiting. Hepatic transaminases became elevated in some patients, and this result occurred more often in patients taking valproate.
No phase 2 or phase 3 trials have assessed the efficacy of CBD without coadministration of other AEDs, and CBD’s efficacy may relate to its impact on the pharmacokinetics of coadministered AEDs. “The most important clinical interaction is between CBD and clobazam, as [the dose of] clobazam often needs to be lowered because of excessive sedation,” wrote Ms. Ali and her colleagues. CBD inhibits CYP2C19 and CYP3A4 – enzymes that are involved in clobazam metabolism – which results in high plasma concentrations of clobazam’s active metabolite, norclobazam. Plasma levels of topiramate, rufinamide, zonisamide, and eslicarbazepine also may increase when these drugs are taken with CBD.
Challenges and opportunities
Of the hundreds of compounds in the marijuana plant, CBD “has the most evidence of antiepileptic efficacy and does not have the psychoactive effects” of THC, the authors said. Little evidence supports the combination of THC and CBD for the treatment of epilepsy. In addition, research indicates that THC can have a proconvulsive effect in animal models and harm the development of the human brain.
Investigators are evaluating alternative routes of CBD delivery to avoid first-pass metabolism, such as oromucosal sprays, transdermal gels, eye drops, intranasal sprays, and rectal suppositories. “Alternative methods of administration ... deserve consideration, particularly for the developmental and epileptic encephalopathies population, as administration of oral medication can be challenging,” they said.
SOURCE: Ali S et al. Dev Med Child Neurol. 2018. doi: 10.1111/dmcn.14087.
FROM DEVELOPMENTAL MEDICINE & CHILD NEUROLOGY
Key clinical point: Cannabidiol’s efficacy is similar to that of other antiepileptic drugs.
Major finding: Cannabidiol inhibits CYP2C19 and CYP3A4, which are involved in clobazam metabolism.
Study details: An invited review.
Disclosures: No disclosures were reported.
Source: Ali S et al. Dev Med Child Neurol. 2018. doi: 10.1111/dmcn.14087.
Insulin loses its starting spot
, fewer migraines in women are linked to increased type 2 diabetes risk, the U.S. Preventive Services Task Force looks to prevent opioid abuse in primary care, and there’s an uncomfortable truth in new guidelines for posttraumatic stress disorder.
Amazon Alexa
Apple Podcasts
Google Podcasts
Spotify
, fewer migraines in women are linked to increased type 2 diabetes risk, the U.S. Preventive Services Task Force looks to prevent opioid abuse in primary care, and there’s an uncomfortable truth in new guidelines for posttraumatic stress disorder.
Amazon Alexa
Apple Podcasts
Google Podcasts
Spotify
, fewer migraines in women are linked to increased type 2 diabetes risk, the U.S. Preventive Services Task Force looks to prevent opioid abuse in primary care, and there’s an uncomfortable truth in new guidelines for posttraumatic stress disorder.
Amazon Alexa
Apple Podcasts
Google Podcasts
Spotify

Opioid benefit small in chronic noncancer pain
Compared with placebo, opioids provide very modest improvements in chronic noncancer pain and physical functioning that decrease over time, according to the authors of a systematic review and meta-analysis of nearly 100 randomized clinical trials.

There was little difference in pain control between opioids and nonopioid alternatives such as NSAIDs in a subset of nine such comparative trials, reported the authors, led by Jason W. Busse, DC, PhD, of the department of anesthesia at McMaster University, Hamilton, Ont.
Pain benefits of opioids decreased over time in longer trials, possibly because of opioid tolerance or hyperalgesia, a condition marked by hypersensitivity to pain. “A reduced association with benefit over time might lead to prescription of higher opioid doses and consequent harms,” Dr. Busse and his coauthors wrote in JAMA.
The meta-analysis included 96 randomized clinical trials including 26,169 patients with chronic noncancer pain.
Opioid treatment did significantly improve pain and physical function versus placebo, though the magnitude of benefit was small, according to the investigators. The reduction in pain was –0.69 cm on a 10-cm visual analog scale (P less than .001), based on high-quality evidence from 42 randomized, controlled trials that followed patients for at least 3 months.
The improvement in physical functioning was likewise significant but small at 2.04 out of 100 points on the SF-36 physical component score (P less than .001). Emotional and role functioning were not significantly improved by opioid use.
Opioid use was linked to increased vomiting incidence versus placebo, with a relative risk of 4.12 (95% CI, 3.34-5.07; P less than .001) for patients in “nonenrichment” trials – those studies that included all patients regardless of whether or not they reported lack of improvement or had substantial adverse events during a study run-in period.
Nausea, constipation, dizziness, drowsiness, pruritus, and dry mouth were also linked to opioid use as compared with placebo, Dr. Busse and his colleagues reported.
The benefit of opioids and nonopioid alternatives appeared to be similar in this meta-analysis, though the available evidence from comparative studies was of low to moderate quality, the authors advised.
In moderate-quality evidence from nine clinical trials of opioids versus NSAIDs including 1,431 patients, there was no difference in pain relief between the two interventions, the investigators said. Moreover, comparisons of physician functioning also suggested no difference, while opioids were associated with more vomiting.
Both tricyclic antidepressants and synthetic cannabinoids offered similar pain relief, compared with opioids, based on low-quality clinical trial evidence, they added, while moderate-quality evidence suggested opioids offered superior pain relief, compared with anticonvulsants.
Support for the study came from the Canadian Institutes of Health Research and Health Canada. One study coauthor reported receiving personal fees from Purdue Pharma and the Nova Scotia College of Physicians and Surgeons.
SOURCE: Busse JW et al. JAMA. 2018;320(23):2448-60.
This meta-analysis suggests that most patients receiving opioids for chronic noncancer pain will not benefit from them, according to Michael A. Ashburn, MD, MPH, and Lee A. Fleisher, MD.
Outcomes of the study, which suggest opioids produce modest benefits over placebo in pain and physical functioning, and no difference in pain relief versus NSAIDs, are likely to represent the best case scenario, the authors wrote.
That’s because most trials excluded patients with substance use disorder and nearly half excluded patients with mental illness or those taking psychotropic medications, they explained.
In the clinical setting, many patients will have depression, anxiety, sleep-disordered breathing, and other conditions that could increase the potential risk of harm with opioids, according to the authors.
That said, when proper monitoring is incorporated into care, opioid treatment can be safe and effective for selected patients. “Diligent opioid prescribing to carefully selected patients will lower the risk of harm to patients, their families, and the community,” the authors wrote in their editorial.
Dr. Ashburn and Dr. Fleisher are with the department of anesthesiology and critical care at the University of Pennsylvania, Philadelphia. Their editorial appears in JAMA. Dr. Ashburn reported receiving personal fees from Teva, the Department of Justice, the Attorney General for the State of Maryland, the Department of State for the Commonwealth of Pennsylvania, the Montgomery County District Attorney, and the Carolinas Pain Society. He also reported several patents related to drug delivery systems and methods.
Compared with placebo, opioids provide very modest improvements in chronic noncancer pain and physical functioning that decrease over time, according to the authors of a systematic review and meta-analysis of nearly 100 randomized clinical trials.
There was little difference in pain control between opioids and nonopioid alternatives such as NSAIDs in a subset of nine such comparative trials, reported the authors, led by Jason W. Busse, DC, PhD, of the department of anesthesia at McMaster University, Hamilton, Ont.
Pain benefits of opioids decreased over time in longer trials, possibly because of opioid tolerance or hyperalgesia, a condition marked by hypersensitivity to pain. “A reduced association with benefit over time might lead to prescription of higher opioid doses and consequent harms,” Dr. Busse and his coauthors wrote in JAMA.
The meta-analysis included 96 randomized clinical trials including 26,169 patients with chronic noncancer pain.
Opioid treatment did significantly improve pain and physical function versus placebo, though the magnitude of benefit was small, according to the investigators. The reduction in pain was –0.69 cm on a 10-cm visual analog scale (P less than .001), based on high-quality evidence from 42 randomized, controlled trials that followed patients for at least 3 months.
The improvement in physical functioning was likewise significant but small at 2.04 out of 100 points on the SF-36 physical component score (P less than .001). Emotional and role functioning were not significantly improved by opioid use.
Opioid use was linked to increased vomiting incidence versus placebo, with a relative risk of 4.12 (95% CI, 3.34-5.07; P less than .001) for patients in “nonenrichment” trials – those studies that included all patients regardless of whether or not they reported lack of improvement or had substantial adverse events during a study run-in period.
Nausea, constipation, dizziness, drowsiness, pruritus, and dry mouth were also linked to opioid use as compared with placebo, Dr. Busse and his colleagues reported.
The benefit of opioids and nonopioid alternatives appeared to be similar in this meta-analysis, though the available evidence from comparative studies was of low to moderate quality, the authors advised.
In moderate-quality evidence from nine clinical trials of opioids versus NSAIDs including 1,431 patients, there was no difference in pain relief between the two interventions, the investigators said. Moreover, comparisons of physician functioning also suggested no difference, while opioids were associated with more vomiting.
Both tricyclic antidepressants and synthetic cannabinoids offered similar pain relief, compared with opioids, based on low-quality clinical trial evidence, they added, while moderate-quality evidence suggested opioids offered superior pain relief, compared with anticonvulsants.
Support for the study came from the Canadian Institutes of Health Research and Health Canada. One study coauthor reported receiving personal fees from Purdue Pharma and the Nova Scotia College of Physicians and Surgeons.
SOURCE: Busse JW et al. JAMA. 2018;320(23):2448-60.
FROM JAMA
Key clinical point: A meta-analysis showed that, in patients with chronic noncancer pain, opioids provided modest improvements versus placebo that receded with time, and comparable benefits versus nonopioid alternatives.
Major finding: The reduction in pain for opioids versus placebo was significant but small, at –0.69 cm on a 10-cm visual analog scale (P less than .001), in randomized, controlled trials following patients for at least 3 months.
Study details: A systematic review and meta-analysis of 96 randomized clinical trials for noncancer pain.
Disclosures: Support for the study came from the Canadian Institutes of Health Research and Health Canada. One study author reported receiving personal fees from Purdue Pharma and the Nova Scotia College of Physicians and Surgeons.
Source: Busse JW et al. JAMA. 2018;320(23):2448-60.
Chronic opioid use during pregnancy linked with reduced head circumference in NAS newborns
(HC), reported Craig V. Towers, MD, and his associates at the University of Tennessee Medical Center in Knoxville in Pediatrics.
In the first large prospective cohort study to compare HC in newborns being treated for NAS, a total of 858 neonates, including 429 with NAS and 429 controls, were enrolled and assessed at the University of Tennessee Medical Center, Knoxville, from April 1, 2014, to Dec. 31, 2016.
Dr. Towers and his associates found that mean HC in those neonates with NAS was significantly smaller, by 9.5 mm, than it was in controls. Of the 429 newborns with NAS, 62% had a normal HC, 30% had an HC less than the 10th percentile, and 8% had an HC less than or equal to the third percentile. Of the controls, 12% had an HC less than the 10th percentile.
The authors identified a significant 3% reduction in mean HC as well as a 2% reduction in mean birth weight. “Because newborn HC is an indirect measure of brain volume, further research is necessary to determine if this finding increases the risk for long-term neurodevelopmental delay,” they said.
Even though the newborns with NAS were found to experience greater coexposure to benzodiazepines, stimulants, marijuana, gabapentin, tobacco, and SSRIs, compared with controls, none of these coexposures was determined to be a significant risk factor for smaller head circumference at birth when individual drug exposure relationships within the newborn population alone were assessed, the researchers observed.
Dr. Towers and his associates did consider it noteworthy, however, that the majority of NAS cases included in the study were born to mothers receiving opioid agonist medication–assisted treatment (MAT), which is the recommended treatment in cases where opioid use disorder is addressed during pregnancy. Among the 429 NAS cases, the mothers of 372 (87%) were on opioid agonist MAT (320 buprenorphine and 52 methadone); the remaining 13% were born to mothers who were prescribed other opioid drugs.
There is limited data available to determine whether detoxification during pregnancy for patients with opioid use disorder (OUD) has any effect on lessening the risk of lower HC. In fact, the authors caution that detoxification during pregnancy is not recommended for managing OUD. To date, there are only a few locations in the United States and other countries offering such treatment. If the practice becomes more widespread, they cautioned, further research examining new born HC and long-term outcomes “is of paramount importance.”
Further prospective studies evaluating the effects of opioid exposure in newborns who do not develop NAS also are needed. Such data could provide clues concerning whether there is a crucial period of exposure that leads to reduced HC or whether the effects of opioid exposure are in fact cumulative. In cases where newborns are exposed as a result of maintenance MAT, through illicit use, or as a result of maternal detoxification, such studies also could assist with determining whether it is necessary to reconsider current practices for managing OUD in pregnancy.
The study was partially funded through the Blue Cross Blue Shield Research Foundation. The authors reported no relevant financial disclosures.
SOURCE: Towers CV et al. Pediatrics. 2019;143(1):e20180541.
At a time when more people in the United States are dying from opioid overdose than from automobile trauma, the number of newborns with NAS has virtually exploded, rising fivefold since 2000. In some states, more than 30 infants per 1,000 live births develop NAS “effectively transforming some NICUs into NAS wards,” Mark L. Hudak, MD, and Kartikeya Makker, MD, wrote in an accompanying editorial.
Among the strengths of the current study, they cited “universal dating of pregnancies by early ultrasound, multiple antenatal maternal urine drug tests for exposures in both cases and controls, and the use of a fairly robust statistical methodology to account for confounding exposures.”
Among the findings of the study were that, “compared with well-matched controls, newborns with NAS demonstrated a highly significant (nearly 1 cm) decrease in the mean head circumference. Another finding was that newborns with NAS showed proportionately greater decreases in head circumference than in birth weight,” the editorialists said.
Dr. Hadak and Dr. Makker noted that, while NAS can be challenging to manage, the acute effects of withdrawal are transient. The more important questions, they propose are: “What are the best methods to prevent NAS?” and “What, if any, are the long-term effects of fetal and neonatal opioid exposure on the developing child?”
Dr. Hudak and Dr. Makker question the practicality of closely following maternal opioid usage during pregnancy, but they do foresee value in the anticipated findings of a current study in which Dr. Towers and his associates are observing newborns with reduced fetal exposure to opioids who have not developed NAS.
“Additional evidence revealing that the reduction of maternal opioid use can protect normal fetal head and brain growth should energize discussion about refining the management of the opioid-maintained maternal-fetal dyad, with the goal not solely to prevent NAS but more importantly to optimize the outcome of the child,” they said.
Dr. Hudak and Dr. Makker are affiliated with the department of pediatrics at the University of Florida, Jacksonville. These comments are summarized from an editorial commenting on the study by Towers et al. (Pediatrics. 2019;143[1]:e20183376). Dr. Hudak and Dr. Makker said they had no relevant financial disclosures.
(HC), reported Craig V. Towers, MD, and his associates at the University of Tennessee Medical Center in Knoxville in Pediatrics.
In the first large prospective cohort study to compare HC in newborns being treated for NAS, a total of 858 neonates, including 429 with NAS and 429 controls, were enrolled and assessed at the University of Tennessee Medical Center, Knoxville, from April 1, 2014, to Dec. 31, 2016.
Dr. Towers and his associates found that mean HC in those neonates with NAS was significantly smaller, by 9.5 mm, than it was in controls. Of the 429 newborns with NAS, 62% had a normal HC, 30% had an HC less than the 10th percentile, and 8% had an HC less than or equal to the third percentile. Of the controls, 12% had an HC less than the 10th percentile.
The authors identified a significant 3% reduction in mean HC as well as a 2% reduction in mean birth weight. “Because newborn HC is an indirect measure of brain volume, further research is necessary to determine if this finding increases the risk for long-term neurodevelopmental delay,” they said.
Even though the newborns with NAS were found to experience greater coexposure to benzodiazepines, stimulants, marijuana, gabapentin, tobacco, and SSRIs, compared with controls, none of these coexposures was determined to be a significant risk factor for smaller head circumference at birth when individual drug exposure relationships within the newborn population alone were assessed, the researchers observed.
Dr. Towers and his associates did consider it noteworthy, however, that the majority of NAS cases included in the study were born to mothers receiving opioid agonist medication–assisted treatment (MAT), which is the recommended treatment in cases where opioid use disorder is addressed during pregnancy. Among the 429 NAS cases, the mothers of 372 (87%) were on opioid agonist MAT (320 buprenorphine and 52 methadone); the remaining 13% were born to mothers who were prescribed other opioid drugs.
There is limited data available to determine whether detoxification during pregnancy for patients with opioid use disorder (OUD) has any effect on lessening the risk of lower HC. In fact, the authors caution that detoxification during pregnancy is not recommended for managing OUD. To date, there are only a few locations in the United States and other countries offering such treatment. If the practice becomes more widespread, they cautioned, further research examining new born HC and long-term outcomes “is of paramount importance.”
Further prospective studies evaluating the effects of opioid exposure in newborns who do not develop NAS also are needed. Such data could provide clues concerning whether there is a crucial period of exposure that leads to reduced HC or whether the effects of opioid exposure are in fact cumulative. In cases where newborns are exposed as a result of maintenance MAT, through illicit use, or as a result of maternal detoxification, such studies also could assist with determining whether it is necessary to reconsider current practices for managing OUD in pregnancy.
The study was partially funded through the Blue Cross Blue Shield Research Foundation. The authors reported no relevant financial disclosures.
SOURCE: Towers CV et al. Pediatrics. 2019;143(1):e20180541.
FROM PEDIATRICS
Key clinical point: Detoxification during pregnancy may be ill advised for patients with opioid use disorder.
Major finding: Head circumference was smaller by a mean 9.5 mm.
Study details: Prospective cohort study of 429 NAS neonates and 429 controls.
Disclosures: The study was partially funded through the Blue Cross Blue Shield Research Foundation. The authors reported no relevant financial disclosures.
Source: Towers CV et al. Pediatrics. 2019;143(1):e20180541.
USPSTF issues draft research plan on opioid use disorder prevention
The U.S. Preventive Services Task Force posted a draft research plan on opioid use disorder prevention for public comment on Dec. 13, according to a USPSTF bulletin.
An estimated 2.1 million persons aged 12 years and older had an opioid use disorder in 2017, and opioids were involved in nearly two-thirds of more than 70,000 fatal drug overdoses, according to the task force. Prevention of unnecessary opioid use, opioid misuse, and opioid use disorder in primary care settings is necessary to effectively respond to the ongoing crisis.
In an extensive literature review, an independent research team will look for evidence on strategies for people not currently receiving opioids that can be implemented on the primary care level. The public is invited to submit comments on the research plan that will help focus and guide the literature review.
The USPSTF also will be updating the current 2008 recommendation statement on screening for illicit drugs and nonmedical prescription drugs in adolescents and young adults, including pregnant and postpartum women.
Comments can be submitted until Jan. 16, 2019, on the USPSTF website.
Active migraine in women linked to lower risk of developing T2DM
Women with active migraines are less likely to have type 2 diabetes mellitus (T2DM) and show a decrease in migraine symptoms prior to diagnosis of T2DM, indicating an inverse relationship between hyperglycemia, hyperinsulinism, and migraines, according to recent research published in JAMA Neurology.

“Because plasma glucose concentration rises with time up to the point of type 2 diabetes occurrence, the prevalence of migraine symptoms may decrease,” Guy Fagherazzi, PhD, at the Center for Research in Epidemiology and Population Health at the Gustave Roussy Institute in Villejuif, France, and his colleagues wrote in their study. “Consequently, tracking the evolution and especially the decrease of migraine frequency in individuals with migraine at high risk of diabetes, such as individuals with obesity, irrespective of age could be the sign of an emerging increased blood glucose levels, prediabetes, or type 2 diabetes.”
The researchers used data from the prospective Etude Epidémiologique Auprès des Femmes de la Mutuelle Générale de l’Education Nationale (E3N) study, initiated in 1990 and identified 74,247 women (mean age, 61 years old) with self-reported migraine in a 2002 follow-up questionnaire who had 10-year follow-up data during 2004-2014. The women in the cohort were born during 1925-1950 and completed biennial questionnaires about their health, including migraine status and medications, since 1992. The participants were divided into groups based on no migraine (49,199 participants), active migraine (7,839 participants), or prior migraine history (17,209 participants), and patients with T2DM at baseline were excluded.
Dr. Fagherazzi and his colleagues found 2,372 cases of type 2 diabetes over the follow-up period. Women who had active migraine status were less likely to have T2DM (hazard ratio, 0.80; 95% confidence interval, 0.67-0.96) than were the participants who did not have migraines, and this inverse association persisted after the researchers adjusted for factors such as myocardial infarction, education level, family history of diabetes, body mass index, smoking status, hypertension, physical activity, oral contraceptive use, menopausal status, menopausal hormone therapy, handedness, antimigraine preparations, and other prescribed migraine drugs (HR, 0.70; 95% CI, 0.58-0.85).
In the participants who developed T2DM, the researchers also found that there was a decrease in the prevalence of active migraine in the 24 years prior to T2DM diagnosis from 22% (95% CI, 16%-27%) to 11% (95% CI, 10%-12%) after adjusting for T2DM risk factors, which was then followed by an up to 22-year plateau in migraine prevalence of 11% for these participants.
“The linear decrease of migraine prevalence long before and the plateau long after type 2 diabetes diagnosis is novel and the association deserves to be studied in other populations,” Dr. Fagherazzi and his colleagues wrote. “The potential beneficial role of both hyperglycemia and hyperinsulinism on migraine occurrence needs to be further explored.”
The researchers noted limitations in the study, such as self-reported migraine by participants in the cohort, exclusion of non–pharmacologically treated T2DM cases, observational nature of the study, and homogenized population in the E3N cohort consisting of mainly women in menopause who were teachers and belonged to the same health insurance plan.
This study was funded by a grant from the French Research agency. The E3N cohort study was funded by the “Mutuelle Générale de l’Education Nationale,” European Community, French League against Cancer, Gustave Roussy, and French Institute of Health and Medical Research. Dr. Kurth is an advisory board member for CoLucid and has received funding for a research project from Amgen, honoraria from Lilly, lecture support from Novartis and Daiichi Sankyo, and travel support from the International Headache Society, as well as provided BMJ with editorial services.
SOURCE: Fagherazzi G et al. JAMA Neurol. 2018. doi: 10.1001/jamaneurol.2018.3960.
Although it has been noted for some time in the clinical setting, researchers are still unsure why there is an inverse association between active migraine and type 2 diabetes mellitus, as noted by Fagherazzi et al. in a recent study.
One explanation is the presence of calcitonin gene–related peptide in both animal models of energy metabolism and the pathophysiology of migraine. It is possible that insulin resistance and hyperglycemia damage the sensory neurons that produce the peptide. If these damaged nerves are soothed, migraine may resolve.
Other silver linings associated with active migraine include an increased likelihood of having a healthy cardiovascular system and decreased alcohol consumption.
The epidemiology of migraine and findings like those in this study prompt the question: What is migraine good for?
Amy A. Gelfand, MD , of the University of California, San Francisco, and Elizabeth Loder, MD , MPH, of Harvard Medical School in Boston made these comments in an editorial accompanying Dr. Fagherazzi’s study. They disclosed a number of financial relationships with companies marketing treatments for migraine.
Women with active migraines are less likely to have type 2 diabetes mellitus (T2DM) and show a decrease in migraine symptoms prior to diagnosis of T2DM, indicating an inverse relationship between hyperglycemia, hyperinsulinism, and migraines, according to recent research published in JAMA Neurology.
“Because plasma glucose concentration rises with time up to the point of type 2 diabetes occurrence, the prevalence of migraine symptoms may decrease,” Guy Fagherazzi, PhD, at the Center for Research in Epidemiology and Population Health at the Gustave Roussy Institute in Villejuif, France, and his colleagues wrote in their study. “Consequently, tracking the evolution and especially the decrease of migraine frequency in individuals with migraine at high risk of diabetes, such as individuals with obesity, irrespective of age could be the sign of an emerging increased blood glucose levels, prediabetes, or type 2 diabetes.”
The researchers used data from the prospective Etude Epidémiologique Auprès des Femmes de la Mutuelle Générale de l’Education Nationale (E3N) study, initiated in 1990 and identified 74,247 women (mean age, 61 years old) with self-reported migraine in a 2002 follow-up questionnaire who had 10-year follow-up data during 2004-2014. The women in the cohort were born during 1925-1950 and completed biennial questionnaires about their health, including migraine status and medications, since 1992. The participants were divided into groups based on no migraine (49,199 participants), active migraine (7,839 participants), or prior migraine history (17,209 participants), and patients with T2DM at baseline were excluded.
Dr. Fagherazzi and his colleagues found 2,372 cases of type 2 diabetes over the follow-up period. Women who had active migraine status were less likely to have T2DM (hazard ratio, 0.80; 95% confidence interval, 0.67-0.96) than were the participants who did not have migraines, and this inverse association persisted after the researchers adjusted for factors such as myocardial infarction, education level, family history of diabetes, body mass index, smoking status, hypertension, physical activity, oral contraceptive use, menopausal status, menopausal hormone therapy, handedness, antimigraine preparations, and other prescribed migraine drugs (HR, 0.70; 95% CI, 0.58-0.85).
In the participants who developed T2DM, the researchers also found that there was a decrease in the prevalence of active migraine in the 24 years prior to T2DM diagnosis from 22% (95% CI, 16%-27%) to 11% (95% CI, 10%-12%) after adjusting for T2DM risk factors, which was then followed by an up to 22-year plateau in migraine prevalence of 11% for these participants.
“The linear decrease of migraine prevalence long before and the plateau long after type 2 diabetes diagnosis is novel and the association deserves to be studied in other populations,” Dr. Fagherazzi and his colleagues wrote. “The potential beneficial role of both hyperglycemia and hyperinsulinism on migraine occurrence needs to be further explored.”
The researchers noted limitations in the study, such as self-reported migraine by participants in the cohort, exclusion of non–pharmacologically treated T2DM cases, observational nature of the study, and homogenized population in the E3N cohort consisting of mainly women in menopause who were teachers and belonged to the same health insurance plan.
This study was funded by a grant from the French Research agency. The E3N cohort study was funded by the “Mutuelle Générale de l’Education Nationale,” European Community, French League against Cancer, Gustave Roussy, and French Institute of Health and Medical Research. Dr. Kurth is an advisory board member for CoLucid and has received funding for a research project from Amgen, honoraria from Lilly, lecture support from Novartis and Daiichi Sankyo, and travel support from the International Headache Society, as well as provided BMJ with editorial services.
SOURCE: Fagherazzi G et al. JAMA Neurol. 2018. doi: 10.1001/jamaneurol.2018.3960.
FROM JAMA NEUROLOGY
Key clinical point: There was an inverse association between active migraine and type 2 diabetes mellitus in women over 10 years of follow-up.
Major finding: Compared with women who had no history of active migraine, women with active migraine had a lower risk of developing type 2 diabetes (univariate hazard ratio, 0.80; 95% confidence interval, 0.67-0.96).
Study details: Results from a prospective, population-based study of 74,247 women with active migraines in the E3N cohort study in France.
Disclosures: This study was funded by a grant from the French Research agency. The E3N cohort study was funded by the Mutuelle Générale de l’Education Nationale, European Community, French League against Cancer, Gustave Roussy, and French Institute of Health and Medical Research. Dr. Kurth is an advisory board member for CoLucid and has received funding for a research project from Amgen, honoraria from Lilly, lecture support from Novartis and Daiichi Sankyo, and travel support from the International Headache Society, as well as provided the BMJ with editorial services.
Source: Fagherazzi G et al. JAMA Neurol. 2018. doi: 10.1001/jamaneurol.2018.3960.