User login
Is Life Expectancy Different for Patients Beginning Osteoporosis Treatment?
A new trial has found that life expectancy of newly diagnosed and treated osteoporosis patients is in excess of 15 years in women younger than 75, and in men younger than 60, according to a study published online ahead of print May 21 in Journal of Bone and Mineral Research.
“How best to treat patients with osteoporosis is a really simple issue when it comes to beginning treatment, but deciding how long to treat for is really very challenging,” said lead author Bo Abrahamsen, MD, PhD, Professor and Consultant Endocrinologist at Glostrup Hospital in Copenhagen.

Researchers conducted an observational study in Danish national registries tracking prescriptions for osteoporosis drugs, comorbid conditions, and deaths. Investigators included 58,637 patients and 225,084 age- and gender-matched control subjects. Information on deaths until the end of 2013 was retrieved, providing a follow-up period of 10 to 17 years.
In men younger than 80 and women younger than 60, the relative risk of dying declined from being strongly increased in the first year to a stable but elevated level in subsequent years. In women older than 65 through 70, there was only a small elevation in risk in the first year of treatment followed by lower than background mortality.
The residual life expectancy of a 50-year-old man beginning osteoporosis treatment was estimated to be 18.2 years; for a 75-year-old man it was 7.5 years. Estimates in women were 26.4 years and 13.5 years for the same age groups, respectively.
According to the researchers, their findings show an excess mortality in men and in women below age 70 who are treated for osteoporosis, compared with the background population. This excess risk, they said, is more pronounced in the first few years on treatment. The average life expectancy of osteoporosis patients is in excess of 15 years in women below the age of 75 and in men below the age of 60, highlighting the importance of developing tools for long-term management.
“The present study shows that most of the patients we treat have a long life expectancy. Therefore it is absolutely vital that we are not complacent but develop evidence-based strategies for the long-term management of osteoporosis,” stated Dr. Abrahamsen.
Suggested Reading
Abrahamsen B, Osmond C, Cooper C. Life expectancy in patients treated for osteoporosis: observational cohort study using national Danish prescription data. J Bone Miner Res. 2015 May 21. [Epub ahead of print]
A new trial has found that life expectancy of newly diagnosed and treated osteoporosis patients is in excess of 15 years in women younger than 75, and in men younger than 60, according to a study published online ahead of print May 21 in Journal of Bone and Mineral Research.
“How best to treat patients with osteoporosis is a really simple issue when it comes to beginning treatment, but deciding how long to treat for is really very challenging,” said lead author Bo Abrahamsen, MD, PhD, Professor and Consultant Endocrinologist at Glostrup Hospital in Copenhagen.
Researchers conducted an observational study in Danish national registries tracking prescriptions for osteoporosis drugs, comorbid conditions, and deaths. Investigators included 58,637 patients and 225,084 age- and gender-matched control subjects. Information on deaths until the end of 2013 was retrieved, providing a follow-up period of 10 to 17 years.
In men younger than 80 and women younger than 60, the relative risk of dying declined from being strongly increased in the first year to a stable but elevated level in subsequent years. In women older than 65 through 70, there was only a small elevation in risk in the first year of treatment followed by lower than background mortality.
The residual life expectancy of a 50-year-old man beginning osteoporosis treatment was estimated to be 18.2 years; for a 75-year-old man it was 7.5 years. Estimates in women were 26.4 years and 13.5 years for the same age groups, respectively.
According to the researchers, their findings show an excess mortality in men and in women below age 70 who are treated for osteoporosis, compared with the background population. This excess risk, they said, is more pronounced in the first few years on treatment. The average life expectancy of osteoporosis patients is in excess of 15 years in women below the age of 75 and in men below the age of 60, highlighting the importance of developing tools for long-term management.
“The present study shows that most of the patients we treat have a long life expectancy. Therefore it is absolutely vital that we are not complacent but develop evidence-based strategies for the long-term management of osteoporosis,” stated Dr. Abrahamsen.
Suggested Reading
Abrahamsen B, Osmond C, Cooper C. Life expectancy in patients treated for osteoporosis: observational cohort study using national Danish prescription data. J Bone Miner Res. 2015 May 21. [Epub ahead of print]
Suggested Reading
Abrahamsen B, Osmond C, Cooper C. Life expectancy in patients treated for osteoporosis: observational cohort study using national Danish prescription data. J Bone Miner Res. 2015 May 21. [Epub ahead of print]

Co-Management Arrangements in Orthopedic Surgery
In the post–Affordable Care Act landscape of American health care, an explosion of alternative payment methods and other creative initiatives has occurred as patients, providers, and payers all seek higher-quality care at lower costs.1 These factors impact every level of the health care system, from large academic medical institutions in major cities to small single hospitals in rural community settings.2 Co-management arrangements are among the many innovative organizational structures that have arisen with the goals of efficiency and quality. For many reasons, a co-management arrangement has specific applicability and appeal in orthopedic surgery, and the popularity of this form of physician–hospital alignment is growing.3
Definition
In health care, and particularly even within orthopedic surgery, the term co-management can have multiple definitions. It can refer to shared responsibility for patient care across service lines—such as the “co-management” by both hospitalists and orthopedic surgeons of elderly patients with multiple chronic medical comorbidities as well as an acute hip fracture or a total knee replacement.4-7 In academic settings, it may refer to the delegation of duties from attending professors to residents in co-managing patients.
In the realm of health care business and finance, however, the term co-management arrangement (CMA) refers to the shared responsibility for a hospital service line by the hospital administration and the physicians involved in that service line. While the basic concept is not necessarily a new one, it is growing in popularity and expanding in scope, creative application, and effectiveness within the current post-reform environment.8 This model of clinical and financial integration has been implemented in multiple different medical subspecialties, from cardiology and oncology to gastroenterology and vision care.9,10 As applied to orthopedic surgery, CMAs create a situation in which orthopedic surgeons participate intimately in the management of the entire musculoskeletal service line, including inpatient and outpatient services. Orthopedics was identified as 1 of the top 3 specialties for clinical CMAs (after cardiology and imaging) in a recent survey of more than 258 hospital executives.11 Because orthopedic surgery represents an extremely profitable service line for most hospitals, it becomes an ideal target for optimization under a CMA because even relatively small percentage increases in efficiency or profitability can pay relatively large dividends for the hospital.12
Under a CMA, the physicians are compensated for their time and efforts, and they provide services across clinical and nonclinical areas. Because orthopedic surgeons are most familiar with the details of their specialty and the unique needs of their patients, they are the best suited to make decisions, both clinical and nonclinical, that impact the provision of that care. The details of individual CMAs will vary based on specific situational factors, but the common goal of improved patient care and greater economic efficiency drive the underlying theme of shared responsibility and physician–hospital alignment.13
A CMA is different from some other recent innovative forms of organizational or financial structure. A CMA is not the same as direct employment14,15 or “pay-for-performance,”16 because both of these methods of physician–hospital alignment lack the incentivized structure of a CMA. While a CMA is similar to a “gainsharing” arrangement because both hospitals and physicians benefit, it has a very different legal structure.17 A CMA also resembles a joint venture, but it differs in its goal of a focus on management roles.18 Bundled-pricing arrangements tend to focus on the end-price of an “episode of care” rather than the system that provides it.19 While CMAs may be more involved than many other forms of organizational structure, a CMA does not have the level of complexity and interaction required for a formal accountable care organization (ACO).20
Principles of Co-Management Arrangements
Because countless variances exist across the country within local and regional orthopedic markets, no single prescription for success exists to guide co-management arrangements for every potential situation.21,22 Several basic principles, however, should characterize any attempted CMA. Without a foundation in these principles, the CMA may risk suboptimal performance or overt failure.
Focus on the Patient
The most basic shared concern of the 2 parties of a CMA (surgeons and hospitals) is the patient. While each side may have different strengths and varying methods of reaching clinical and financial goals, they should be able to agree on the fundamental idea of patient-centered care. Indeed, the patient experience has become a popular buzzword in many areas of medicine,23 and it particularly applies as a foundational principle of CMAs. A focus on the patient does not directly guarantee success, because there are numerous other details and features of a productive CMA. Failure to focus on the patient, however, will lead to problems.
Evidence-Based Decision-Making
As the information age progresses, clinical, operational, and financial decisions are all best made based on data. Over the last 10 years, evidence-based medicine (EBM) has become the norm in orthopedic surgery for the evaluation of techniques, implants, medications, and other treatment options.24 This data-based clinical concept parallels the development of its cousin on the administrative side, evidence-based management.25 Both forms of “EBM” focus on using a synthesis of the best available data to inform decision-making to maximize outcomes. In a CMA, evidence-based decision-making should pervade all aspects of the endeavor.
Physician Leadership
Co-management arrangements cannot succeed with involvement and input exclusively from hospital officials. Physicians must not only participate in these arrangements, but they must take the key leadership roles.26 Physicians can learn relevant skills in business administration much quicker and easier than administrators can gain clinical skill and experience. Therefore, effective CMAs should have appropriately qualified physicians in essential leadership positions whenever possible.27,28
Appropriate Physician Compensation
While physicians may benefit from CMAs in many intangible economic ways, such as increased volume or increased time efficiency, the process of creating and operating a CMA does not inherently generate any revenue for the physicians involved. Indeed, the primary raw materials that an orthopedic surgeon possesses are time and expertise. Investment of an orthopedist’s time and expertise represents utilization of a considerably valuable resource that demands commensurate compensation.29 Hospitals can save exponentially more money through a robust CMA than they might spend for the surgeon’s time and efforts to create it,23 and they should expect returns commensurate with the amount invested.30 Stated simply, the CMA will not work unless physicians are compensated to make it work.
While appropriate compensation for time and effort may seem an obvious and basic element of success for any endeavor, the determination of such compensation for a CMA is fraught with difficulty and danger.3 The primary concern is the calculation of “fair market value” or “commercial reasonableness” of the management services provided by the orthopedic surgeon to the hospital.23,31-33 Any amount perceived as too low may discourage surgeon participation. On the other hand, amounts that exceed fair market value may constitute remuneration that can result in severe federal legal penalties. Any compensation agreement must comply with provisions of the Stark laws and the federal Anti-Kickback Statute, as well as the Civil Monetary Penalties Statute, the more recent Sunshine Act, and other laws.34-37
Consequently, creation of a well-designed compensation plan is thus one of the most critical principles of a CMA.38 Physician compensation for participation in a CMA should focus on 2 major areas—a base payment for time spent in design and management of the arrangement, and a bonus payment for reaching certain predefined quality and efficiency goals through the arrangement.3,22,27,32,34,39 As mentioned above, physicians must, at a minimum, receive fair compensation for their time and efforts. In addition, creation of incentives through a clearly defined, performance-based reward structure can further drive surgeons’ motivation for dedicated effort and creativity.9 It is critical to note that a CMA differs from a gainsharing arrangement because physicians usually do not share a percentage of actual hospital savings under a CMA.31 A gainsharing arrangement, however, usually involves physicians receiving a defined percentage of any real dollar savings created for the hospital through the relationship.17
Transparency
Transparency is a common feature of any business relationship in which 2 distinct entities must work together to achieve a mutual goal. Co-management arrangements are no exception to this rule; multiple experts have identified transparency and trust as foundational elements for success.30,40 To ensure transparency without compromising patient confidentiality, trade secrets, or other valuable restricted information from unnecessary or potentially dangerous exposure, participants in the CMA should develop a transparency plan in the early stages of the relationship. This plan should expressly state exactly what information is to be shared, when, with whom, and in what manner. By balancing information sharing with information security, CMA participants can more comfortably communicate and develop trust.
Reasonable and Modifiable Goals
While the overarching raison d’être of a CMA is to increase efficiency and improve quality, these worthy purposes must be broken down into specific, measurable goals that are unique to each arrangement. These goals should be aggressive enough to make an impact, but they should also be reasonably achievable within a designated period. In many cases, these goals will reflect or follow the regulatory stipulations of various governing bodies, such as the Centers for Medicare and Medicaid Services (CMS) or The Joint Commission.31 Because these entities may frequently change or update their rules (and even their own institutional names!), the CMA must also have a structure that can rapidly respond to alterations in the regulatory landscape.31 The goals should be modifiable and amendable on an as-needed basis with an appropriate vote of the CMA stakeholders, rather than renewable only when the arrangement’s term ends. Without such situational responsiveness, the rapidly undulating world of health care may render the CMA’s goals either laughably low or impossibly high.
Accountability
A CMA must incorporate the concept of accountability throughout its organizational structure. Although this principle will take many different forms and have different applications, it is critical to the effectiveness of a CMA. Traditional hospital management often focuses on financial goals rather than patient-care goals, and physicians must be able to hold management accountable when these goals conflict. A CMA’s legal structure must have elements of accountability and methods of resolving conflict, such as provisions for arbitration or mediation by a designated third party. When goals are not met or if they are exceeded, there must be ways of both disciplining and rewarding those responsible. Ultimately, accountability must be woven into the culture created under the CMA, and this process flows through every element of the agreement, from its contractual legal and leadership structure to its operational and financial logistics.
General Operational Elements of Co-Management Arrangements
While CMAs must be governed by basic principles, they must also involve several general operational elements. The specifics of these elements will vary by situation, but surgeons must consider each in the creation and operation of a CMA.
Legal Structure
Most CMAs involve the creation of a separate legal structural entity that will assume responsibility for management of the hospital’s service line.37,39 This entity often takes the form of a limited liability company (LLC).33 Its members may be all physicians, or it may be jointly owned by the hospital and the physicians.39 The legal structure of the company will depend on state laws and local precedent, and a lawyer with extensive experience in health care law should create it and its governing documents.37 Alternatively, some hospitals may consider directly employing physicians to co-manage a service line, but this simpler model may prove less effective than a true CMA because of the lack of independence for the physicians involved.30,36 Indeed, the maintenance of physician independence is one of the strongest features of a CMA, and it should be carefully protected in the entity’s legal structure.
Like any relationship, a CMA may end, and its creators need to “begin with the end in mind” when creating its formative documents. Physicians should engage expert legal assistance in the structuring of the parts of the contract that govern the unwinding of the agreement. If the CMA performs poorly, or if the hospital becomes insolvent in spite of the CMA, the involved physicians may face liability charges or other legal entanglements. Because the escape clause of the CMA contract may be the doctors’ only shield in such situations, this part of the agreement should be meticulously reviewed by the physicians and by knowledgeable legal counsel.
Legal Compliance
Ultimately, the CMA may implicate federal Stark laws, anti-kickback laws, antitrust laws, Civil Monetary Penalties Statute, the False Claims Act, 501(c)(3) tax exemption rules, and provider-based status rules. These may have severe penalties, including imprisonment, if violated.32,34,36,37 As such, the participants in any arrangement must make certain that the CMA complies with all applicable regulations in both its composition and function.38,41 Participants in CMAs should make all efforts to avoid such legal pitfalls through investigation of safe harbor provisions, special exemptions, and other key features of the relevant laws.37,42 While these regulations will remain in constant flux, governmental regulatory agencies have given guidelines about acceptable structure for CMAs.43,44
For CMAs, a critical feature is the level of participation of the LLC members in the defined activities of the CMA.42 Participation requirements, such as meeting attendance, changes in practice based on defined goals and metrics, and financial contributions, must be included in the operating agreement of the LLC.33 Compliance of all active members with these clearly defined requirements will both improve operations and morale and also decrease legal risk for both the CMA and its individual members.28 Furthermore, certain conduct that may run afoul of regulations should be very specifically prohibited in the member contracts. Such behavior may include pay-for-referral arrangements rather than pay-for-performance, asymmetric income distribution through the LLC, and other activities that limit patient choice.37 The salary and bonus structure must be very carefully designed and monitored, because they can have significant legal implications if not managed correctly. Independent audits should be part of the compliance plan for any CMA, and many authorities recommend limits on the total compensation to physicians as part of a CMA, as well as time limits on the agreement itself.44
Leadership and Reporting Structure
All CMAs should have a medical director who is responsible for the success of the operation. Beneath the medical director, the leadership and reporting structure will vary based on the size of the hospital and the number of surgeons. In some situations, single individuals may assume multiple roles; other situations may dictate the need for many more people. The structure may take the shape of multiple directors and even a committee for the principal areas in a large institution, but only 1 or 2 additional individuals may be required in a small hospital setting. In any case, the leadership and reporting structure should be established as part of the basic formative documents of the CMA, with all duties and responsibilities of each participant clearly defined.
Facilities Management
Management of the physical and operational aspects of the site of service is a core component of any CMA. While the hospital usually owns the facilities, it is the surgeons who must work within them. The specifics of the physical plant can impact issues such as infection rate, inventory availability, maximum volume levels, and patient perception or satisfaction. The manner in which the facilities management conducts operations is also important; large size and nice equipment do not necessarily translate into efficiency or quality. A CMA should, therefore, have a surgeon or committee whose primary role is to oversee the relevant details of the hospital’s physical and operational issues. These details will include topics such as assignment of operative suites, choices of implants, room turnover, supplies, antibiotic availability, and other matters. Because of their experience and knowledge of the operational effects of administrative decisions, orthopedic surgeons are uniquely positioned to maximize the value of existing facilities and to oversee updates or changes as needed.
Personnel Management
Even in disadvantaged or smaller facilities, maximization of human resources can often overcome challenges of inadequate physical plant or tight finances. Alternatively, poor management of staff can thwart the efforts of even the largest and best-endowed hospitals. Because practicing orthopedists are likely to know the talents and skills of key local personnel from having worked alongside them, surgeons are well suited to help direct placement and management of personnel as part of a CMA. Surgeons can effectively identify behaviors that deserve reward and can identify staff members that refuse to be team players or otherwise do not help meet larger goals. Involvement of surgeons in personnel management also helps speed the ability to have near real-time responsiveness to issues that may arise.
Clinical Data Management
Ultimately, quality metrics become the grading scale for the clinical aspects of the CMA. Selection of appropriate metrics constitutes a foundational element of the overall process and demands meticulous attention to detail.38 Multiple site-specific clinical scoring systems exist in orthopedic surgery, from the International Knee Documentation Committee (IKDC) score for knees to the American Shoulder and Elbow Surgeons (ASES) score for shoulders.45,46 Additional quality metrics exist for more generalized clinical success measurement, such as the Short Form–36 Health Survey (SF-36) score.47 Governmental agencies and other national organizations have also mandated certain clinical metrics through programs such as the Surgical Care Improvement Project (SCIP).48 Once the type and manner of desired clinical data are identified, they must be collected, processed, stored, and evaluated. Surgeon participation in and oversight of clinical data management is crucial, because orthopedists will be the best suited to interpret and apply the data and relevant trends and conclusions.
Financial Data Management
Financial concerns constitute perhaps the strongest driving force behind many of the current reform initiatives and alternative payment options in the health care landscape. For a CMA, financial success must be clearly and constantly measured and displayed for the endeavor to be successful. Since both sides have a large potential for financial gain and loss in a CMA, surgeons and hospitals must ensure that the best-qualified and most dedicated individuals oversee financial issues. Although transparency is important in all areas of a CMA, it is imperative and must be a dominating feature of the arrangement’s financial management. Financial goals, furthermore, must be clearly defined and realistic, with continuous reevaluation as the relationship moves forward. As part of the transparency plan, relevant financial data should be shared and discussed at regular intervals.
Quality and Effectiveness Reporting
An ideal co-management agreement not only reaches its goals of improved patient care and increased financial efficiency, but it can document and report achievement of these goals as well. Just as corporations must report their financial effectiveness to their shareholders, CMAs must report their own overall effectiveness to their respective stakeholders. Payers, patients, providers, and participant hospitals all have a stake in proving that the CMA has been successful—and that it will continue to be successful. Effectiveness reporting becomes the most important element of all, because the ultimate purpose is self-preservation of the CMA. Reporting should document successes and failures in all relevant elements of the arrangement, with a focus on clinical and financial data. Reports should employ both internal and external benchmarks as a means of evaluating results. Most CMAs will have a designated officer or committee tasked with the responsibility for measurement and reporting of quality and effectiveness.26 Clinical and financial data are combined into an overall big picture of the achievements of the CMA.
Conclusion
Co-management arrangements represent a popular current option for physicians and surgeons to increase alignment and achieve the mutually beneficial goals of increased quality and efficiency. In orthopedics, CMAs essentially consist of surgeons and hospital administrators working together to manage the musculoskeletal service line at a hospital. While the details of specific arrangements will vary according to individual situations, certain basic principles and important general operational elements characterize most successful CMAs. Since physician ownership of hospitals is now banned under the Affordable Care Act, CMAs can be seen as a physician-managed hospital within a hospital, with many of the benefits that have historically resulted from physician ownership and participation in management.27,49 As health care reform progresses, CMAs will likely become more widespread, more refined, more effective, and more profitable.
1. Payton B. Physician-hospital relationships: from historical failures to successful “new kids on the block.” J Med Pract Manage. 2012;27(6):359-364.
2. Kauk JR, Bray TJ. Orthopaedist-hospital alignment in a community setting. Clin Orthop. 2013;471(6):1837-1845.
3. Kaufman N. The co-management conundrum. Hosp Health Netw Daily. http://www.hhnmag.com/display/HHN-news-article.dhtml?dcrPath=/templatedata/HF_Common/NewsArticle/data/HHN/Daily/2012/Sep/kaufman092612-3960003111. Published September 26, 2012. Accessed April 22, 2015.
4. The Society of Hospital Medicine’s Co-Management Advisory Panel. A white paper on a guide to hospitalist/orthopedic surgery co-management. www.hospitalmedicine.org/AM/Template.cfm?Section=White_Papers&Template=/CM/ContentDisplay.cfm&ContentID=25864. Accessed April 22, 2015.
5. Bushnell BD, Horton JK, McDonald MF, Robertson PG. Perioperative medical comorbidities in the orthopaedic patient. J Am Acad Orthop Surg. 2008;16(4):216-227.
6. Huddleston JM, Long KH, Naessens JM, et al. Medical and surgical comanagement after elective hip and knee arthroplasty: a randomized, controlled trial. Ann Intern Med. 2004;141(1):26-38.
7. Friedman SM, Mendelson DA, Kates SL, McCann RM. Geriatric co-management of proximal femur fractures: total quality management and protocol-driven care result in better outcomes for a frail patient population. J Am Geriatrics Soc. 2008;56(7):1349-1356.
8. Steckler D, Epstein F, Riner RN. Getting ready for EHR, RHIOs and next-generation co-management agreements. Physician Exec. 2009;35(6):48, 50-42.
9. Danello PF. Clinical co-management: hospitals and oncologists working together. J Oncol Pract. 2006;2(1):21.
10. Schryer CF, Gladkova O, Spafford MM, Lingard L. Co-management in healthcare: negotiating professional boundaries. Discourse Commun. 2007;1(4):452-479.
11. Cantlupe J. Physican alignment in an era of change. HealthLeaders Media: Intell Reps. content.hcpro.com/pdf/content/256536.pdf. Published September 2010. Accessed April 22, 2015.
12. Olson SA, Mather RC 3rd. Understanding how orthopaedic surgery practices generate value for healthcare systems. Clin Orthop. 2013;471(6):1801-1808.
13. Page AE, Butler CA, Bozic KJ. Factors driving physician-hospital alignment in orthopaedic surgery. Clin Orthop. 2013;471(6):1809-1817.
14. Jackson DW. Understand the trend, considerations for hospital-based employment. Orthop Today. http://www.healio.com/orthopedics/business-of-orthopedics/news/print/orthopedics-today/%7Bf955b32f-9209-4f66-91f7-b26eb00d3cfa%7D/understand-the-trend-considerations-for-hospital-based-employment. Published March 2013. Accessed April 22, 2015.
15. Porucznik MA. What is the future of orthopaedics? AAOS Now. 2013;7(1). http://www.aaos.org/news/aaosnow/jan13/advocacy9.asp. Accssed April 22, 2015.
16. Marcus RE, Zenty TF 3rd, Adelman HG. Aligning incentives in orthopaedics: opportunities and challenges - the Case Medical Center experience. Clin Orthop. 2009;467(10):2525-2534.
17. Roche J. AAOS takes stance on bundled payments and gainsharing. AAOS Now. 2009;3(5). http://www.aaos.org/news/aaosnow/may09/reimbursement3.asp. Accessed April 28, 2015.
18. Grogan TJ. Tips for marketing your orthopedic practice. AAOS Now. 2007;1(8). http://www.aaos.org/news/bulletin/oct07/managing7.asp. Accessed April 28, 2015.
19. Bushnell BD. Developing a bundled pricing strategy. AAOS Now. 2014;8(3):16-17. http://www.aaos.org/news/aaosnow/mar14/advocacy1.asp. Accessed April 21, 2015.
20. Accountable care organizations (ACO). Centers for Medicare and Medicaid Services website. http://www.cms.gov/Medicare/Medicare-Fee-for-Service-Payment/ACO/index.html?redirect=/aco. Updated January 6, 2015. Accessed April 22, 2015.
21. Sowers KW, Newman PR, Langdon JC. Evolution of physician-hospital alignment models: a case study of comanagement. Clin Orthop. 2013;471(6):1818-1823.
22. Leahy M. Is a clinical comanagement agreement right for your practice? AAOS Now. 2013;7(7). http://www.aaos.org/news/aaosnow/jul13/managing6.asp. Accessed April 22, 2015.
23. Nahm S. Top 10 features and benefits of co-management arrangements. The Camden Group website. http://www.thecamdengroup.com/thought-leadership/top-ten/top-10-features-and-benefits-of-co-management-arrangements. Published May 2010. Accessed April 22, 2015.
24. Spindler KP, Kuhn JE, Dunn W, Matthews CE, Harrell FE Jr, Dittus RS. Reading and reviewing the orthopaedic literature: a systematic, evidence-based medicine approach. J Am Acad Orthop Surg. 2005;13(4):220-229.
25. Pfeffer J, Sutton RI. Evidence-based management. Harvard Business Rev website. https://hbr.org/2006/01/evidence-based-management/ar/1. Published January 2006. Accessed April 22, 2015.
26. Erickson JC III. What in the world is medical “co-management”? Physicians Pract. http://www.physicianspractice.com/blog/what-world-medical-%E2%80%98co-management%E2%80%99. Published October 14, 2011. Accessed April 22, 2015.
27. Steinmann J. Hospital co-management agreements and surgeon owned distribution: the two most important new models for the private practice orthopedic group. Talk presented at: California Orthopaedic Association Annual Meeting; May 20, 2011; Dana Point, CA. http://www.coa.org/docs/2011-Annual-Meeting/Friday/Steinmann.pdf. Accessed April 22, 2015.
28. Nagele RL. Hospital-physician relationships after national health reform: moving from competition to collaboration. Pa Bar Assoc Q. 2011;82(1):1-15. http://www.postschell.com/site/files/556.pdf. Accessed April 22, 2015.
29. Dyrda L. 5 Benefits and challenges of co-management agreements for orthopedic surgeons. Becker’s Spine Rev. http://www.beckersspine.com/orthopedic-spine-practices-improving-profits/item/2294-5-benefits-and-challenges-of-co-management-agreements-for-orthopedic-surgeons. Published October 21, 2010. Updated November 8, 2010. Accessed April 22, 2015.
30. Aston G. Are you ready for physician co-management? Association for Healthcare Resource & Materials Management website. http://www.ahrmm.org/ahrmm/news_and_issues/strategies_solutions_homepage/nov12_physician_comanagement.jsp. Accessed April 22, 2015.
31. Top 10 lessons learned from “mature” co-management arrangements. The Camden Group website. http://www.thecamdengroup.com/thought-leadership/blog/top-10-lessons-learned-from-mature-co-management-arrangements/. Accessed April 22, 2015.
32. Anderson GD, Brandt AS. Co-management arrangements and their continuing evolution. HealthCare Appraisers, Inc., website. http://www.healthcareappraisers.com/presentations/BVR_Webinar_Co-mgmt_AB_0611.pdf. Published 2011. Accessed April 22, 2015.
33. Colyvas N. Establishing a service line co-management agreement. AAOS Now. March 2013;7(3). http://www.aaos.org/news/aaosnow/mar13/managing1.asp. Accessed April 22, 2015.
34. Safriet SM, Werling K. The evolution of service line co-management relationships with physicians - Key observations on relationships and fair market value. Health Care Appraisers, Inc., website. http://www.healthcareappraisers.com/presentations/HAI-MGW_Co-Management_Presentation.pdf. Published 2014. Accessed April 22, 2015.
35. Bilazarian S. Sunshine act: the intersection of federal law, physicians, and corporate attorneys. Practitioner’s Corner with Dr. Seth Bilazarian. Medscape website. www.medscape.com/viewarticle/821855. Published March 24, 2014. Accessed April 22, 2015.
36. Del Negro PH. Service line co-management arrangements: models and practicalities. ABA Health eSource. 2012;9(2). http://www.americanbar.org/content/newsletter/publications/aba_health_esource_home/aba_health_law_esource_1012_delnegro.html. Published October 2012. Accessed April 22, 2015.
37. Blau ML, Romano DH, Safriet SM. Co-management arrangements in healthcare: complying with regulatory requirements in structuring hospital-physician arrangements. Health Care Appraisers, Inc., website. http://www.healthcareappraisers.com/presentations/Co-Mgmt_Arrangements_Webinar_12-1-09.pdf. Published 2009. Accessed April 22, 2015.
38. Johnson J. 5 things you should know about co-management arrangements. Healthcare Financial Manage. 2011;65(7):74-78, 80.
39. Mertz G. Co-management models can be profitable for physicians. Physicians Pract. http://www.physicianspractice.com/blog/co-management-models-can-be-profitable-physicians. Published May 5, 2013. Accessed April 22, 2015.
40. Gamble M. Co-management agreements 101: basic principles to know. Becker’s Hosp Rev. http://www.beckershospitalreview.com/hospital-transactions-and-valuation/co-management-agreements-101-basic-principles-to-know.html. Published November 28, 2011. Accessed April 22, 2015.
41. Werling K, Carnell H, Szabad M. Regulatory considerations for structuring physician/hospital co-management agreements. Health Care Law Mon. 2010;2010(9):2-6.
42. Punke H. Hospital-physician co-management agreements: how to avoid a major pitfall. Becker’s Hosp Rev. http://www.beckershospitalreview.com/hospital-physician-relationships/hospital-physician-co-management-agreements-how-to-avoid-a-major-pitfall.html. Published November 1, 2013. Accessed April 22, 2015.
43. Burack MR. OIG approves co-management arrangement. Akerman Health Law Rx website. http://www.healthlawrx.com/2013/02/oig-approves-co-management-arrangement-2/. Published February 1, 2013. Accessed April 22, 2015.
44. Greaves C. Five common sense strategies for structuring co-management agreements after advisory opinion 12-22. ABA Health eSource. 2013;9(7). http://www.americanbar.org/content/newsletter/publications/aba_health_esource_home/aba_health_law_esource_1303_greaves.html. Published March 2013. Accessed April 22, 2015.
45. Hefti F, Müller W, Jakob RP, Stäubli HU. Evaluation of knee ligament injuries with the IKDC form. Knee Surg Sports Traumatol Arthrosc. 1993;1(3-4):226-234.
46. Richards RR, An KN, Bigliani LU, et al. A standardized method for the assessment of shoulder function. J Shoulder Elbow Surg. 1994;3(6):347-352.
47. Patel AA, Donegan D, Albert T. The 36-item short form. J Am Acad Orthop Surg. 2007;15(2):126-134.
48. Surgical Care Improvement Project. The Joint Commission website. http://www.jointcommission.org/surgical_care_improvement_project/. Published October 16, 2014. Accessed April 22, 2015.
49. Pennington WT. Emulating a physician-owned hospital. Hosp Health Netw Daily. http://www.hhnmag.com/display/HHN-news-article.dhtml?dcrPath=/templatedata/HF_Common/NewsArticle/data/HHN/Daily/2013/Jul/blog072513-5840005536. Published July 25, 2013. Accessed April 22, 2015.
In the post–Affordable Care Act landscape of American health care, an explosion of alternative payment methods and other creative initiatives has occurred as patients, providers, and payers all seek higher-quality care at lower costs.1 These factors impact every level of the health care system, from large academic medical institutions in major cities to small single hospitals in rural community settings.2 Co-management arrangements are among the many innovative organizational structures that have arisen with the goals of efficiency and quality. For many reasons, a co-management arrangement has specific applicability and appeal in orthopedic surgery, and the popularity of this form of physician–hospital alignment is growing.3
Definition
In health care, and particularly even within orthopedic surgery, the term co-management can have multiple definitions. It can refer to shared responsibility for patient care across service lines—such as the “co-management” by both hospitalists and orthopedic surgeons of elderly patients with multiple chronic medical comorbidities as well as an acute hip fracture or a total knee replacement.4-7 In academic settings, it may refer to the delegation of duties from attending professors to residents in co-managing patients.
In the realm of health care business and finance, however, the term co-management arrangement (CMA) refers to the shared responsibility for a hospital service line by the hospital administration and the physicians involved in that service line. While the basic concept is not necessarily a new one, it is growing in popularity and expanding in scope, creative application, and effectiveness within the current post-reform environment.8 This model of clinical and financial integration has been implemented in multiple different medical subspecialties, from cardiology and oncology to gastroenterology and vision care.9,10 As applied to orthopedic surgery, CMAs create a situation in which orthopedic surgeons participate intimately in the management of the entire musculoskeletal service line, including inpatient and outpatient services. Orthopedics was identified as 1 of the top 3 specialties for clinical CMAs (after cardiology and imaging) in a recent survey of more than 258 hospital executives.11 Because orthopedic surgery represents an extremely profitable service line for most hospitals, it becomes an ideal target for optimization under a CMA because even relatively small percentage increases in efficiency or profitability can pay relatively large dividends for the hospital.12
Under a CMA, the physicians are compensated for their time and efforts, and they provide services across clinical and nonclinical areas. Because orthopedic surgeons are most familiar with the details of their specialty and the unique needs of their patients, they are the best suited to make decisions, both clinical and nonclinical, that impact the provision of that care. The details of individual CMAs will vary based on specific situational factors, but the common goal of improved patient care and greater economic efficiency drive the underlying theme of shared responsibility and physician–hospital alignment.13
A CMA is different from some other recent innovative forms of organizational or financial structure. A CMA is not the same as direct employment14,15 or “pay-for-performance,”16 because both of these methods of physician–hospital alignment lack the incentivized structure of a CMA. While a CMA is similar to a “gainsharing” arrangement because both hospitals and physicians benefit, it has a very different legal structure.17 A CMA also resembles a joint venture, but it differs in its goal of a focus on management roles.18 Bundled-pricing arrangements tend to focus on the end-price of an “episode of care” rather than the system that provides it.19 While CMAs may be more involved than many other forms of organizational structure, a CMA does not have the level of complexity and interaction required for a formal accountable care organization (ACO).20
Principles of Co-Management Arrangements
Because countless variances exist across the country within local and regional orthopedic markets, no single prescription for success exists to guide co-management arrangements for every potential situation.21,22 Several basic principles, however, should characterize any attempted CMA. Without a foundation in these principles, the CMA may risk suboptimal performance or overt failure.
Focus on the Patient
The most basic shared concern of the 2 parties of a CMA (surgeons and hospitals) is the patient. While each side may have different strengths and varying methods of reaching clinical and financial goals, they should be able to agree on the fundamental idea of patient-centered care. Indeed, the patient experience has become a popular buzzword in many areas of medicine,23 and it particularly applies as a foundational principle of CMAs. A focus on the patient does not directly guarantee success, because there are numerous other details and features of a productive CMA. Failure to focus on the patient, however, will lead to problems.
Evidence-Based Decision-Making
As the information age progresses, clinical, operational, and financial decisions are all best made based on data. Over the last 10 years, evidence-based medicine (EBM) has become the norm in orthopedic surgery for the evaluation of techniques, implants, medications, and other treatment options.24 This data-based clinical concept parallels the development of its cousin on the administrative side, evidence-based management.25 Both forms of “EBM” focus on using a synthesis of the best available data to inform decision-making to maximize outcomes. In a CMA, evidence-based decision-making should pervade all aspects of the endeavor.
Physician Leadership
Co-management arrangements cannot succeed with involvement and input exclusively from hospital officials. Physicians must not only participate in these arrangements, but they must take the key leadership roles.26 Physicians can learn relevant skills in business administration much quicker and easier than administrators can gain clinical skill and experience. Therefore, effective CMAs should have appropriately qualified physicians in essential leadership positions whenever possible.27,28
Appropriate Physician Compensation
While physicians may benefit from CMAs in many intangible economic ways, such as increased volume or increased time efficiency, the process of creating and operating a CMA does not inherently generate any revenue for the physicians involved. Indeed, the primary raw materials that an orthopedic surgeon possesses are time and expertise. Investment of an orthopedist’s time and expertise represents utilization of a considerably valuable resource that demands commensurate compensation.29 Hospitals can save exponentially more money through a robust CMA than they might spend for the surgeon’s time and efforts to create it,23 and they should expect returns commensurate with the amount invested.30 Stated simply, the CMA will not work unless physicians are compensated to make it work.
While appropriate compensation for time and effort may seem an obvious and basic element of success for any endeavor, the determination of such compensation for a CMA is fraught with difficulty and danger.3 The primary concern is the calculation of “fair market value” or “commercial reasonableness” of the management services provided by the orthopedic surgeon to the hospital.23,31-33 Any amount perceived as too low may discourage surgeon participation. On the other hand, amounts that exceed fair market value may constitute remuneration that can result in severe federal legal penalties. Any compensation agreement must comply with provisions of the Stark laws and the federal Anti-Kickback Statute, as well as the Civil Monetary Penalties Statute, the more recent Sunshine Act, and other laws.34-37
Consequently, creation of a well-designed compensation plan is thus one of the most critical principles of a CMA.38 Physician compensation for participation in a CMA should focus on 2 major areas—a base payment for time spent in design and management of the arrangement, and a bonus payment for reaching certain predefined quality and efficiency goals through the arrangement.3,22,27,32,34,39 As mentioned above, physicians must, at a minimum, receive fair compensation for their time and efforts. In addition, creation of incentives through a clearly defined, performance-based reward structure can further drive surgeons’ motivation for dedicated effort and creativity.9 It is critical to note that a CMA differs from a gainsharing arrangement because physicians usually do not share a percentage of actual hospital savings under a CMA.31 A gainsharing arrangement, however, usually involves physicians receiving a defined percentage of any real dollar savings created for the hospital through the relationship.17
Transparency
Transparency is a common feature of any business relationship in which 2 distinct entities must work together to achieve a mutual goal. Co-management arrangements are no exception to this rule; multiple experts have identified transparency and trust as foundational elements for success.30,40 To ensure transparency without compromising patient confidentiality, trade secrets, or other valuable restricted information from unnecessary or potentially dangerous exposure, participants in the CMA should develop a transparency plan in the early stages of the relationship. This plan should expressly state exactly what information is to be shared, when, with whom, and in what manner. By balancing information sharing with information security, CMA participants can more comfortably communicate and develop trust.
Reasonable and Modifiable Goals
While the overarching raison d’être of a CMA is to increase efficiency and improve quality, these worthy purposes must be broken down into specific, measurable goals that are unique to each arrangement. These goals should be aggressive enough to make an impact, but they should also be reasonably achievable within a designated period. In many cases, these goals will reflect or follow the regulatory stipulations of various governing bodies, such as the Centers for Medicare and Medicaid Services (CMS) or The Joint Commission.31 Because these entities may frequently change or update their rules (and even their own institutional names!), the CMA must also have a structure that can rapidly respond to alterations in the regulatory landscape.31 The goals should be modifiable and amendable on an as-needed basis with an appropriate vote of the CMA stakeholders, rather than renewable only when the arrangement’s term ends. Without such situational responsiveness, the rapidly undulating world of health care may render the CMA’s goals either laughably low or impossibly high.
Accountability
A CMA must incorporate the concept of accountability throughout its organizational structure. Although this principle will take many different forms and have different applications, it is critical to the effectiveness of a CMA. Traditional hospital management often focuses on financial goals rather than patient-care goals, and physicians must be able to hold management accountable when these goals conflict. A CMA’s legal structure must have elements of accountability and methods of resolving conflict, such as provisions for arbitration or mediation by a designated third party. When goals are not met or if they are exceeded, there must be ways of both disciplining and rewarding those responsible. Ultimately, accountability must be woven into the culture created under the CMA, and this process flows through every element of the agreement, from its contractual legal and leadership structure to its operational and financial logistics.
General Operational Elements of Co-Management Arrangements
While CMAs must be governed by basic principles, they must also involve several general operational elements. The specifics of these elements will vary by situation, but surgeons must consider each in the creation and operation of a CMA.
Legal Structure
Most CMAs involve the creation of a separate legal structural entity that will assume responsibility for management of the hospital’s service line.37,39 This entity often takes the form of a limited liability company (LLC).33 Its members may be all physicians, or it may be jointly owned by the hospital and the physicians.39 The legal structure of the company will depend on state laws and local precedent, and a lawyer with extensive experience in health care law should create it and its governing documents.37 Alternatively, some hospitals may consider directly employing physicians to co-manage a service line, but this simpler model may prove less effective than a true CMA because of the lack of independence for the physicians involved.30,36 Indeed, the maintenance of physician independence is one of the strongest features of a CMA, and it should be carefully protected in the entity’s legal structure.
Like any relationship, a CMA may end, and its creators need to “begin with the end in mind” when creating its formative documents. Physicians should engage expert legal assistance in the structuring of the parts of the contract that govern the unwinding of the agreement. If the CMA performs poorly, or if the hospital becomes insolvent in spite of the CMA, the involved physicians may face liability charges or other legal entanglements. Because the escape clause of the CMA contract may be the doctors’ only shield in such situations, this part of the agreement should be meticulously reviewed by the physicians and by knowledgeable legal counsel.
Legal Compliance
Ultimately, the CMA may implicate federal Stark laws, anti-kickback laws, antitrust laws, Civil Monetary Penalties Statute, the False Claims Act, 501(c)(3) tax exemption rules, and provider-based status rules. These may have severe penalties, including imprisonment, if violated.32,34,36,37 As such, the participants in any arrangement must make certain that the CMA complies with all applicable regulations in both its composition and function.38,41 Participants in CMAs should make all efforts to avoid such legal pitfalls through investigation of safe harbor provisions, special exemptions, and other key features of the relevant laws.37,42 While these regulations will remain in constant flux, governmental regulatory agencies have given guidelines about acceptable structure for CMAs.43,44
For CMAs, a critical feature is the level of participation of the LLC members in the defined activities of the CMA.42 Participation requirements, such as meeting attendance, changes in practice based on defined goals and metrics, and financial contributions, must be included in the operating agreement of the LLC.33 Compliance of all active members with these clearly defined requirements will both improve operations and morale and also decrease legal risk for both the CMA and its individual members.28 Furthermore, certain conduct that may run afoul of regulations should be very specifically prohibited in the member contracts. Such behavior may include pay-for-referral arrangements rather than pay-for-performance, asymmetric income distribution through the LLC, and other activities that limit patient choice.37 The salary and bonus structure must be very carefully designed and monitored, because they can have significant legal implications if not managed correctly. Independent audits should be part of the compliance plan for any CMA, and many authorities recommend limits on the total compensation to physicians as part of a CMA, as well as time limits on the agreement itself.44
Leadership and Reporting Structure
All CMAs should have a medical director who is responsible for the success of the operation. Beneath the medical director, the leadership and reporting structure will vary based on the size of the hospital and the number of surgeons. In some situations, single individuals may assume multiple roles; other situations may dictate the need for many more people. The structure may take the shape of multiple directors and even a committee for the principal areas in a large institution, but only 1 or 2 additional individuals may be required in a small hospital setting. In any case, the leadership and reporting structure should be established as part of the basic formative documents of the CMA, with all duties and responsibilities of each participant clearly defined.
Facilities Management
Management of the physical and operational aspects of the site of service is a core component of any CMA. While the hospital usually owns the facilities, it is the surgeons who must work within them. The specifics of the physical plant can impact issues such as infection rate, inventory availability, maximum volume levels, and patient perception or satisfaction. The manner in which the facilities management conducts operations is also important; large size and nice equipment do not necessarily translate into efficiency or quality. A CMA should, therefore, have a surgeon or committee whose primary role is to oversee the relevant details of the hospital’s physical and operational issues. These details will include topics such as assignment of operative suites, choices of implants, room turnover, supplies, antibiotic availability, and other matters. Because of their experience and knowledge of the operational effects of administrative decisions, orthopedic surgeons are uniquely positioned to maximize the value of existing facilities and to oversee updates or changes as needed.
Personnel Management
Even in disadvantaged or smaller facilities, maximization of human resources can often overcome challenges of inadequate physical plant or tight finances. Alternatively, poor management of staff can thwart the efforts of even the largest and best-endowed hospitals. Because practicing orthopedists are likely to know the talents and skills of key local personnel from having worked alongside them, surgeons are well suited to help direct placement and management of personnel as part of a CMA. Surgeons can effectively identify behaviors that deserve reward and can identify staff members that refuse to be team players or otherwise do not help meet larger goals. Involvement of surgeons in personnel management also helps speed the ability to have near real-time responsiveness to issues that may arise.
Clinical Data Management
Ultimately, quality metrics become the grading scale for the clinical aspects of the CMA. Selection of appropriate metrics constitutes a foundational element of the overall process and demands meticulous attention to detail.38 Multiple site-specific clinical scoring systems exist in orthopedic surgery, from the International Knee Documentation Committee (IKDC) score for knees to the American Shoulder and Elbow Surgeons (ASES) score for shoulders.45,46 Additional quality metrics exist for more generalized clinical success measurement, such as the Short Form–36 Health Survey (SF-36) score.47 Governmental agencies and other national organizations have also mandated certain clinical metrics through programs such as the Surgical Care Improvement Project (SCIP).48 Once the type and manner of desired clinical data are identified, they must be collected, processed, stored, and evaluated. Surgeon participation in and oversight of clinical data management is crucial, because orthopedists will be the best suited to interpret and apply the data and relevant trends and conclusions.
Financial Data Management
Financial concerns constitute perhaps the strongest driving force behind many of the current reform initiatives and alternative payment options in the health care landscape. For a CMA, financial success must be clearly and constantly measured and displayed for the endeavor to be successful. Since both sides have a large potential for financial gain and loss in a CMA, surgeons and hospitals must ensure that the best-qualified and most dedicated individuals oversee financial issues. Although transparency is important in all areas of a CMA, it is imperative and must be a dominating feature of the arrangement’s financial management. Financial goals, furthermore, must be clearly defined and realistic, with continuous reevaluation as the relationship moves forward. As part of the transparency plan, relevant financial data should be shared and discussed at regular intervals.
Quality and Effectiveness Reporting
An ideal co-management agreement not only reaches its goals of improved patient care and increased financial efficiency, but it can document and report achievement of these goals as well. Just as corporations must report their financial effectiveness to their shareholders, CMAs must report their own overall effectiveness to their respective stakeholders. Payers, patients, providers, and participant hospitals all have a stake in proving that the CMA has been successful—and that it will continue to be successful. Effectiveness reporting becomes the most important element of all, because the ultimate purpose is self-preservation of the CMA. Reporting should document successes and failures in all relevant elements of the arrangement, with a focus on clinical and financial data. Reports should employ both internal and external benchmarks as a means of evaluating results. Most CMAs will have a designated officer or committee tasked with the responsibility for measurement and reporting of quality and effectiveness.26 Clinical and financial data are combined into an overall big picture of the achievements of the CMA.
Conclusion
Co-management arrangements represent a popular current option for physicians and surgeons to increase alignment and achieve the mutually beneficial goals of increased quality and efficiency. In orthopedics, CMAs essentially consist of surgeons and hospital administrators working together to manage the musculoskeletal service line at a hospital. While the details of specific arrangements will vary according to individual situations, certain basic principles and important general operational elements characterize most successful CMAs. Since physician ownership of hospitals is now banned under the Affordable Care Act, CMAs can be seen as a physician-managed hospital within a hospital, with many of the benefits that have historically resulted from physician ownership and participation in management.27,49 As health care reform progresses, CMAs will likely become more widespread, more refined, more effective, and more profitable.
1. Payton B. Physician-hospital relationships: from historical failures to successful “new kids on the block.” J Med Pract Manage. 2012;27(6):359-364.
2. Kauk JR, Bray TJ. Orthopaedist-hospital alignment in a community setting. Clin Orthop. 2013;471(6):1837-1845.
3. Kaufman N. The co-management conundrum. Hosp Health Netw Daily. http://www.hhnmag.com/display/HHN-news-article.dhtml?dcrPath=/templatedata/HF_Common/NewsArticle/data/HHN/Daily/2012/Sep/kaufman092612-3960003111. Published September 26, 2012. Accessed April 22, 2015.
4. The Society of Hospital Medicine’s Co-Management Advisory Panel. A white paper on a guide to hospitalist/orthopedic surgery co-management. www.hospitalmedicine.org/AM/Template.cfm?Section=White_Papers&Template=/CM/ContentDisplay.cfm&ContentID=25864. Accessed April 22, 2015.
5. Bushnell BD, Horton JK, McDonald MF, Robertson PG. Perioperative medical comorbidities in the orthopaedic patient. J Am Acad Orthop Surg. 2008;16(4):216-227.
6. Huddleston JM, Long KH, Naessens JM, et al. Medical and surgical comanagement after elective hip and knee arthroplasty: a randomized, controlled trial. Ann Intern Med. 2004;141(1):26-38.
7. Friedman SM, Mendelson DA, Kates SL, McCann RM. Geriatric co-management of proximal femur fractures: total quality management and protocol-driven care result in better outcomes for a frail patient population. J Am Geriatrics Soc. 2008;56(7):1349-1356.
8. Steckler D, Epstein F, Riner RN. Getting ready for EHR, RHIOs and next-generation co-management agreements. Physician Exec. 2009;35(6):48, 50-42.
9. Danello PF. Clinical co-management: hospitals and oncologists working together. J Oncol Pract. 2006;2(1):21.
10. Schryer CF, Gladkova O, Spafford MM, Lingard L. Co-management in healthcare: negotiating professional boundaries. Discourse Commun. 2007;1(4):452-479.
11. Cantlupe J. Physican alignment in an era of change. HealthLeaders Media: Intell Reps. content.hcpro.com/pdf/content/256536.pdf. Published September 2010. Accessed April 22, 2015.
12. Olson SA, Mather RC 3rd. Understanding how orthopaedic surgery practices generate value for healthcare systems. Clin Orthop. 2013;471(6):1801-1808.
13. Page AE, Butler CA, Bozic KJ. Factors driving physician-hospital alignment in orthopaedic surgery. Clin Orthop. 2013;471(6):1809-1817.
14. Jackson DW. Understand the trend, considerations for hospital-based employment. Orthop Today. http://www.healio.com/orthopedics/business-of-orthopedics/news/print/orthopedics-today/%7Bf955b32f-9209-4f66-91f7-b26eb00d3cfa%7D/understand-the-trend-considerations-for-hospital-based-employment. Published March 2013. Accessed April 22, 2015.
15. Porucznik MA. What is the future of orthopaedics? AAOS Now. 2013;7(1). http://www.aaos.org/news/aaosnow/jan13/advocacy9.asp. Accssed April 22, 2015.
16. Marcus RE, Zenty TF 3rd, Adelman HG. Aligning incentives in orthopaedics: opportunities and challenges - the Case Medical Center experience. Clin Orthop. 2009;467(10):2525-2534.
17. Roche J. AAOS takes stance on bundled payments and gainsharing. AAOS Now. 2009;3(5). http://www.aaos.org/news/aaosnow/may09/reimbursement3.asp. Accessed April 28, 2015.
18. Grogan TJ. Tips for marketing your orthopedic practice. AAOS Now. 2007;1(8). http://www.aaos.org/news/bulletin/oct07/managing7.asp. Accessed April 28, 2015.
19. Bushnell BD. Developing a bundled pricing strategy. AAOS Now. 2014;8(3):16-17. http://www.aaos.org/news/aaosnow/mar14/advocacy1.asp. Accessed April 21, 2015.
20. Accountable care organizations (ACO). Centers for Medicare and Medicaid Services website. http://www.cms.gov/Medicare/Medicare-Fee-for-Service-Payment/ACO/index.html?redirect=/aco. Updated January 6, 2015. Accessed April 22, 2015.
21. Sowers KW, Newman PR, Langdon JC. Evolution of physician-hospital alignment models: a case study of comanagement. Clin Orthop. 2013;471(6):1818-1823.
22. Leahy M. Is a clinical comanagement agreement right for your practice? AAOS Now. 2013;7(7). http://www.aaos.org/news/aaosnow/jul13/managing6.asp. Accessed April 22, 2015.
23. Nahm S. Top 10 features and benefits of co-management arrangements. The Camden Group website. http://www.thecamdengroup.com/thought-leadership/top-ten/top-10-features-and-benefits-of-co-management-arrangements. Published May 2010. Accessed April 22, 2015.
24. Spindler KP, Kuhn JE, Dunn W, Matthews CE, Harrell FE Jr, Dittus RS. Reading and reviewing the orthopaedic literature: a systematic, evidence-based medicine approach. J Am Acad Orthop Surg. 2005;13(4):220-229.
25. Pfeffer J, Sutton RI. Evidence-based management. Harvard Business Rev website. https://hbr.org/2006/01/evidence-based-management/ar/1. Published January 2006. Accessed April 22, 2015.
26. Erickson JC III. What in the world is medical “co-management”? Physicians Pract. http://www.physicianspractice.com/blog/what-world-medical-%E2%80%98co-management%E2%80%99. Published October 14, 2011. Accessed April 22, 2015.
27. Steinmann J. Hospital co-management agreements and surgeon owned distribution: the two most important new models for the private practice orthopedic group. Talk presented at: California Orthopaedic Association Annual Meeting; May 20, 2011; Dana Point, CA. http://www.coa.org/docs/2011-Annual-Meeting/Friday/Steinmann.pdf. Accessed April 22, 2015.
28. Nagele RL. Hospital-physician relationships after national health reform: moving from competition to collaboration. Pa Bar Assoc Q. 2011;82(1):1-15. http://www.postschell.com/site/files/556.pdf. Accessed April 22, 2015.
29. Dyrda L. 5 Benefits and challenges of co-management agreements for orthopedic surgeons. Becker’s Spine Rev. http://www.beckersspine.com/orthopedic-spine-practices-improving-profits/item/2294-5-benefits-and-challenges-of-co-management-agreements-for-orthopedic-surgeons. Published October 21, 2010. Updated November 8, 2010. Accessed April 22, 2015.
30. Aston G. Are you ready for physician co-management? Association for Healthcare Resource & Materials Management website. http://www.ahrmm.org/ahrmm/news_and_issues/strategies_solutions_homepage/nov12_physician_comanagement.jsp. Accessed April 22, 2015.
31. Top 10 lessons learned from “mature” co-management arrangements. The Camden Group website. http://www.thecamdengroup.com/thought-leadership/blog/top-10-lessons-learned-from-mature-co-management-arrangements/. Accessed April 22, 2015.
32. Anderson GD, Brandt AS. Co-management arrangements and their continuing evolution. HealthCare Appraisers, Inc., website. http://www.healthcareappraisers.com/presentations/BVR_Webinar_Co-mgmt_AB_0611.pdf. Published 2011. Accessed April 22, 2015.
33. Colyvas N. Establishing a service line co-management agreement. AAOS Now. March 2013;7(3). http://www.aaos.org/news/aaosnow/mar13/managing1.asp. Accessed April 22, 2015.
34. Safriet SM, Werling K. The evolution of service line co-management relationships with physicians - Key observations on relationships and fair market value. Health Care Appraisers, Inc., website. http://www.healthcareappraisers.com/presentations/HAI-MGW_Co-Management_Presentation.pdf. Published 2014. Accessed April 22, 2015.
35. Bilazarian S. Sunshine act: the intersection of federal law, physicians, and corporate attorneys. Practitioner’s Corner with Dr. Seth Bilazarian. Medscape website. www.medscape.com/viewarticle/821855. Published March 24, 2014. Accessed April 22, 2015.
36. Del Negro PH. Service line co-management arrangements: models and practicalities. ABA Health eSource. 2012;9(2). http://www.americanbar.org/content/newsletter/publications/aba_health_esource_home/aba_health_law_esource_1012_delnegro.html. Published October 2012. Accessed April 22, 2015.
37. Blau ML, Romano DH, Safriet SM. Co-management arrangements in healthcare: complying with regulatory requirements in structuring hospital-physician arrangements. Health Care Appraisers, Inc., website. http://www.healthcareappraisers.com/presentations/Co-Mgmt_Arrangements_Webinar_12-1-09.pdf. Published 2009. Accessed April 22, 2015.
38. Johnson J. 5 things you should know about co-management arrangements. Healthcare Financial Manage. 2011;65(7):74-78, 80.
39. Mertz G. Co-management models can be profitable for physicians. Physicians Pract. http://www.physicianspractice.com/blog/co-management-models-can-be-profitable-physicians. Published May 5, 2013. Accessed April 22, 2015.
40. Gamble M. Co-management agreements 101: basic principles to know. Becker’s Hosp Rev. http://www.beckershospitalreview.com/hospital-transactions-and-valuation/co-management-agreements-101-basic-principles-to-know.html. Published November 28, 2011. Accessed April 22, 2015.
41. Werling K, Carnell H, Szabad M. Regulatory considerations for structuring physician/hospital co-management agreements. Health Care Law Mon. 2010;2010(9):2-6.
42. Punke H. Hospital-physician co-management agreements: how to avoid a major pitfall. Becker’s Hosp Rev. http://www.beckershospitalreview.com/hospital-physician-relationships/hospital-physician-co-management-agreements-how-to-avoid-a-major-pitfall.html. Published November 1, 2013. Accessed April 22, 2015.
43. Burack MR. OIG approves co-management arrangement. Akerman Health Law Rx website. http://www.healthlawrx.com/2013/02/oig-approves-co-management-arrangement-2/. Published February 1, 2013. Accessed April 22, 2015.
44. Greaves C. Five common sense strategies for structuring co-management agreements after advisory opinion 12-22. ABA Health eSource. 2013;9(7). http://www.americanbar.org/content/newsletter/publications/aba_health_esource_home/aba_health_law_esource_1303_greaves.html. Published March 2013. Accessed April 22, 2015.
45. Hefti F, Müller W, Jakob RP, Stäubli HU. Evaluation of knee ligament injuries with the IKDC form. Knee Surg Sports Traumatol Arthrosc. 1993;1(3-4):226-234.
46. Richards RR, An KN, Bigliani LU, et al. A standardized method for the assessment of shoulder function. J Shoulder Elbow Surg. 1994;3(6):347-352.
47. Patel AA, Donegan D, Albert T. The 36-item short form. J Am Acad Orthop Surg. 2007;15(2):126-134.
48. Surgical Care Improvement Project. The Joint Commission website. http://www.jointcommission.org/surgical_care_improvement_project/. Published October 16, 2014. Accessed April 22, 2015.
49. Pennington WT. Emulating a physician-owned hospital. Hosp Health Netw Daily. http://www.hhnmag.com/display/HHN-news-article.dhtml?dcrPath=/templatedata/HF_Common/NewsArticle/data/HHN/Daily/2013/Jul/blog072513-5840005536. Published July 25, 2013. Accessed April 22, 2015.
Investigational Osteoporosis Drug Lowers Fracture Risk
Abaloparatide-SC, an injectable drug being studied for the treatment of postmenopausal osteoporosis, reduces the rate of new spinal fractures by 86%, as well as provide statistically significant reductions in the fracture rate at other parts of the body, according to data from the phase 3 ACTIVE fracture prevention trial (ACTIVE trial). Results from the ACTIVE trial were reported at the Endocrine Society’s 97th Annual Meeting in San Diego.
“The investigational drug abaloparatide-SC, if approved, may offer patients the potential to reduce their risk of fracture and increase bone density at all sites, even the most difficult to treat, such as the hip and wrist,” said lead investigator Paul Miller, MD, Medical Director of the Colorado Center for Bone Research in Lakewood.

Abaloparatide-SC is a new manmade form of human parathyroid hormone-related protein that is manufactured by Radius Health (Waltham, Massachusetts). The drugmaker is studying the medication in various forms, including a transdermal patch, in addition to the subcutaneous injection studied in the ACTIVE trial.
During the ACTIVE trial, researchers studied whether abaloparatide-SC can reduce fractures in postmenopausal women with severe osteoporosis who have a high fracture risk. The investigators compared rates of new fractures in 690 women who received a daily injection of abaloparatide-SC (80 mcg) and 711 women who received inactive placebo shots. Neither group of women knew which treatment they received. A third group of 717 women received a daily injection of teriparatide (20 mcg) in an unblinded fashion. All patients also received calcium and vitamin D supplements.
Over 18 months of treatment, the abaloparatide-SC-treated group had the greatest reduction in the rate of new vertebral fractures shown on x-ray, Dr. Miller reported. Compared with the placebo group’s new vertebral fracture rate of 4.2%, women who were treated with abaloparatide-SC had a new vertebral fracture rate of about 0.58%, representing an 86% reduction in the rate of broken bones at the spine, according to Dr. Miller.
“We believe this reduction seen in the abaloparatide-SC-treated group could be the largest reduction ever demonstrated in the vertebral fracture rate for any potential therapeutic drug being researched for the treatment of postmenopausal osteoporosis,” Dr. Miller said.
For nonvertebral fractures, Dr. Miller said abaloparatide-SC treatment had a 43% fracture-rate reduction compared to that of placebo. The rate of vertebral and nonvertebral fractures combined decreased by 45% in the abaloparatide-SC-treated group versus the placebo group. Additionally, the time to the first nonvertebral fracture was significantly delayed for women receiving abaloparatide-SC than for those who received a placebo, he said.
Results of patients’ bone mineral density tests also were compared between the two drug treatment groups. “Abaloparatide-SC resulted in more bone growth, at a faster rate, at more skeletal sites, and in more patients than teriparatide,” stated Dr. Miller.
Abaloparatide-SC, an injectable drug being studied for the treatment of postmenopausal osteoporosis, reduces the rate of new spinal fractures by 86%, as well as provide statistically significant reductions in the fracture rate at other parts of the body, according to data from the phase 3 ACTIVE fracture prevention trial (ACTIVE trial). Results from the ACTIVE trial were reported at the Endocrine Society’s 97th Annual Meeting in San Diego.
“The investigational drug abaloparatide-SC, if approved, may offer patients the potential to reduce their risk of fracture and increase bone density at all sites, even the most difficult to treat, such as the hip and wrist,” said lead investigator Paul Miller, MD, Medical Director of the Colorado Center for Bone Research in Lakewood.
Abaloparatide-SC is a new manmade form of human parathyroid hormone-related protein that is manufactured by Radius Health (Waltham, Massachusetts). The drugmaker is studying the medication in various forms, including a transdermal patch, in addition to the subcutaneous injection studied in the ACTIVE trial.
During the ACTIVE trial, researchers studied whether abaloparatide-SC can reduce fractures in postmenopausal women with severe osteoporosis who have a high fracture risk. The investigators compared rates of new fractures in 690 women who received a daily injection of abaloparatide-SC (80 mcg) and 711 women who received inactive placebo shots. Neither group of women knew which treatment they received. A third group of 717 women received a daily injection of teriparatide (20 mcg) in an unblinded fashion. All patients also received calcium and vitamin D supplements.
Over 18 months of treatment, the abaloparatide-SC-treated group had the greatest reduction in the rate of new vertebral fractures shown on x-ray, Dr. Miller reported. Compared with the placebo group’s new vertebral fracture rate of 4.2%, women who were treated with abaloparatide-SC had a new vertebral fracture rate of about 0.58%, representing an 86% reduction in the rate of broken bones at the spine, according to Dr. Miller.
“We believe this reduction seen in the abaloparatide-SC-treated group could be the largest reduction ever demonstrated in the vertebral fracture rate for any potential therapeutic drug being researched for the treatment of postmenopausal osteoporosis,” Dr. Miller said.
For nonvertebral fractures, Dr. Miller said abaloparatide-SC treatment had a 43% fracture-rate reduction compared to that of placebo. The rate of vertebral and nonvertebral fractures combined decreased by 45% in the abaloparatide-SC-treated group versus the placebo group. Additionally, the time to the first nonvertebral fracture was significantly delayed for women receiving abaloparatide-SC than for those who received a placebo, he said.
Results of patients’ bone mineral density tests also were compared between the two drug treatment groups. “Abaloparatide-SC resulted in more bone growth, at a faster rate, at more skeletal sites, and in more patients than teriparatide,” stated Dr. Miller.

Osteoporosis Diagnosis Linked to Increased Risk of Hearing Loss?
Patients who have osteoporosis face a 1.76-fold higher risk of developing sudden sensorineural hearing loss (SSHL) than those who do not have the bone disease, according to a study published online ahead of print April 16 in the Journal of Clinical Endocrinology & Metabolism.
“A growing body of evidence indicates that osteoporosis affects not only bone health, but the cardiovascular and cerebrovascular systems,” said study author Kai-Jen Tien, MD, from the Chi Mei Medical Center in Taiwan.

SSHL, also called sudden deafness, is an unexplained, rapid loss of hearing that typically happens in one ear, according to the National Institute on Deafness and Other Communication Disorders. It can happen at once or over the course of several days. Although about half of the people who develop SSHL will spontaneously regain their hearing, immediate treatment is recommended. About 85% of those who are treated for the condition recover some hearing.
This retrospective cohort study examined medical records for 10,660 Taiwan residents who were diagnosed with osteoporosis between 1999 and 2008, and compared them to 31,980 controls who did not have the condition. Using national insurance records, the researchers analyzed how many participants were diagnosed with sudden deafness by the end of 2011.
The participants who were diagnosed with osteoporosis had a much higher risk of developing SSHL than the control group. Among the participants who had osteoporosis, 91 were diagnosed with SSHL during the follow-up period. In comparison, the control group, which was triple the size, included 155 people who were diagnosed with SSHL.
Dr. Tien and colleagues theorized that cardiovascular risk factors, bone demineralization, inflammation, and endothelial dysfunction may contribute to the association between osteoporosis and SSHL.
“More people worldwide are suffering from osteoporosis, and our work shows they are at risk of sensorineural hearing loss, as well as bone fracture and other problems,” Dr. Tien said. “Patients who have osteoporosis should be aware they need to seek medical help immediately if they experience hearing loss.”
Dr. Tien stated, “Our findings suggest sudden sensorineural hearing loss can be another broader health problem connected to osteoporosis.”
Suggested Reading
Yeh MC, Weng SF, Shen YC, et al. Increased risk of sudden sensorineural hearing loss in patients with osteoporosis: a population-based, propensity score-matched, longitudinal follow-up study. J Clin Endocrinol Metab. 2015 Apr 16:jc20144316. [Epub ahead of print]
Patients who have osteoporosis face a 1.76-fold higher risk of developing sudden sensorineural hearing loss (SSHL) than those who do not have the bone disease, according to a study published online ahead of print April 16 in the Journal of Clinical Endocrinology & Metabolism.
“A growing body of evidence indicates that osteoporosis affects not only bone health, but the cardiovascular and cerebrovascular systems,” said study author Kai-Jen Tien, MD, from the Chi Mei Medical Center in Taiwan.
SSHL, also called sudden deafness, is an unexplained, rapid loss of hearing that typically happens in one ear, according to the National Institute on Deafness and Other Communication Disorders. It can happen at once or over the course of several days. Although about half of the people who develop SSHL will spontaneously regain their hearing, immediate treatment is recommended. About 85% of those who are treated for the condition recover some hearing.
This retrospective cohort study examined medical records for 10,660 Taiwan residents who were diagnosed with osteoporosis between 1999 and 2008, and compared them to 31,980 controls who did not have the condition. Using national insurance records, the researchers analyzed how many participants were diagnosed with sudden deafness by the end of 2011.
The participants who were diagnosed with osteoporosis had a much higher risk of developing SSHL than the control group. Among the participants who had osteoporosis, 91 were diagnosed with SSHL during the follow-up period. In comparison, the control group, which was triple the size, included 155 people who were diagnosed with SSHL.
Dr. Tien and colleagues theorized that cardiovascular risk factors, bone demineralization, inflammation, and endothelial dysfunction may contribute to the association between osteoporosis and SSHL.
“More people worldwide are suffering from osteoporosis, and our work shows they are at risk of sensorineural hearing loss, as well as bone fracture and other problems,” Dr. Tien said. “Patients who have osteoporosis should be aware they need to seek medical help immediately if they experience hearing loss.”
Dr. Tien stated, “Our findings suggest sudden sensorineural hearing loss can be another broader health problem connected to osteoporosis.”
Suggested Reading
Yeh MC, Weng SF, Shen YC, et al. Increased risk of sudden sensorineural hearing loss in patients with osteoporosis: a population-based, propensity score-matched, longitudinal follow-up study. J Clin Endocrinol Metab. 2015 Apr 16:jc20144316. [Epub ahead of print]
Suggested Reading
Yeh MC, Weng SF, Shen YC, et al. Increased risk of sudden sensorineural hearing loss in patients with osteoporosis: a population-based, propensity score-matched, longitudinal follow-up study. J Clin Endocrinol Metab. 2015 Apr 16:jc20144316. [Epub ahead of print]

Young Patients Who Undergo ACL Surgery May Drastically Improve Physical Health and Function
Most patients who underwent surgery to repair and rebuild an anterior cruciate ligament (ACL) tear showed significant improvement in physical function at 2 years, which continued for at least 6 years following surgery, according to a study published April 1 in the Journal of Bone & Joint Surgery. Younger patient age, lower body mass index, and having the remnants of the torn ACL completely excised during surgery were among the strongest predictors of positive, long-term outcome.
In this study, researchers reviewed and evaluated the outcomes of 1,411 patients (44% female; average patient age at enrollment, 23) who underwent ACL surgery between 2002 and 2004 at four major medical centers. Each patient completed questionnaires that assessed health, well-being, and function prior to surgery, and again at 2 and 6 years after surgery.
“We found that health-related quality of life was significantly improved following ACL reconstruction, and this improvement was still present 6 years following surgery,” said lead study author Warren R. Dunn, MD, MPH, an orthopedic surgeon at the University of Wisconsin in Madison.

At baseline, the average physical health score was 41.9 and the mean mental health score was 51.7. At 2 years after surgery, the physical and mental health scores were stable at 53.6 and 52 points, respectively, and 54 and 52.4 points at year 6.
Among the study’s findings:
• ACL reconstruction resulted in large improvements in the physical function scores, with a mean improvement of 12 points (out of 100) at 2 years and 6 years following surgery.
• At 6 years following ACL surgery, patients gained a mean 5.3 quality-adjusted life years.
• Baseline activity level was a significant predictor of mental health scores, but not physical function scores.
• Predictors of worse postoperative outcomes were a shorter follow-up time post-surgery, revision ACL reconstruction, smoking at baseline, fewer years of education, and damage to the cartilage under the chondromalacia patella.
• Physical function continued to improve over the long term following reconstruction. Patients requiring a revision reconstruction did not fare as well as patients undergoing a single reconstruction.
• Mental health scores over the 6-year period did not significantly change, but scores consistently remained above the population norm of 50 points.
“The predictors for good and poorer outcomes may be helpful when counseling patients who are considering ACL surgery,” stated Dr. Dunn.
Suggested Reading
Dunn WR, Wolf BR, Harrell FE Jr, et al. Baseline predictors of health-related quality of life after anterior cruciate ligament reconstruction: a longitudinal analysis of a multicenter cohort at two and six years. J Bone Joint Surg Am. 2015;97(7):551-557.
Most patients who underwent surgery to repair and rebuild an anterior cruciate ligament (ACL) tear showed significant improvement in physical function at 2 years, which continued for at least 6 years following surgery, according to a study published April 1 in the Journal of Bone & Joint Surgery. Younger patient age, lower body mass index, and having the remnants of the torn ACL completely excised during surgery were among the strongest predictors of positive, long-term outcome.
In this study, researchers reviewed and evaluated the outcomes of 1,411 patients (44% female; average patient age at enrollment, 23) who underwent ACL surgery between 2002 and 2004 at four major medical centers. Each patient completed questionnaires that assessed health, well-being, and function prior to surgery, and again at 2 and 6 years after surgery.
“We found that health-related quality of life was significantly improved following ACL reconstruction, and this improvement was still present 6 years following surgery,” said lead study author Warren R. Dunn, MD, MPH, an orthopedic surgeon at the University of Wisconsin in Madison.
At baseline, the average physical health score was 41.9 and the mean mental health score was 51.7. At 2 years after surgery, the physical and mental health scores were stable at 53.6 and 52 points, respectively, and 54 and 52.4 points at year 6.
Among the study’s findings:
• ACL reconstruction resulted in large improvements in the physical function scores, with a mean improvement of 12 points (out of 100) at 2 years and 6 years following surgery.
• At 6 years following ACL surgery, patients gained a mean 5.3 quality-adjusted life years.
• Baseline activity level was a significant predictor of mental health scores, but not physical function scores.
• Predictors of worse postoperative outcomes were a shorter follow-up time post-surgery, revision ACL reconstruction, smoking at baseline, fewer years of education, and damage to the cartilage under the chondromalacia patella.
• Physical function continued to improve over the long term following reconstruction. Patients requiring a revision reconstruction did not fare as well as patients undergoing a single reconstruction.
• Mental health scores over the 6-year period did not significantly change, but scores consistently remained above the population norm of 50 points.
“The predictors for good and poorer outcomes may be helpful when counseling patients who are considering ACL surgery,” stated Dr. Dunn.
Suggested Reading
Dunn WR, Wolf BR, Harrell FE Jr, et al. Baseline predictors of health-related quality of life after anterior cruciate ligament reconstruction: a longitudinal analysis of a multicenter cohort at two and six years. J Bone Joint Surg Am. 2015;97(7):551-557.
Suggested Reading
Dunn WR, Wolf BR, Harrell FE Jr, et al. Baseline predictors of health-related quality of life after anterior cruciate ligament reconstruction: a longitudinal analysis of a multicenter cohort at two and six years. J Bone Joint Surg Am. 2015;97(7):551-557.

Hibernoma
Hibernomas are rare benign soft-tissue tumors originally described as pseudolipomas by Merkel1 in 1906. Gery coined the term hibernoma in 1914, after noting the multivacuolated cytoplasm of the tumor cells and its resemblance to normal brown fat found in hibernating animals.2
Hibernomas represent 2% of all benign fat-containing tumors and are composed of brown adipocytes, which are histologically different from the white fat of lipomas. Hibernomas usually develop between ages 20 and 40 years, and their incidence is slightly higher in males.
Diffusely present in human newborns, brown fat usually regresses by 8 weeks of age.3 Residual brown fat deposits may remain in the neck, axilla, shoulder, thorax, thigh, retroperitoneum, and periscapular/interscapular regions.4 All these vestigial areas are therefore common locations of hibernomas, with the thigh accounting for up to 30% of cases.5 These tumors are seldom identified in the abdomen, popliteal fossa, or even intracranially. Injury to brown fat cells in these locations, either by infection, inflammation, or trauma, is considered a predisposing risk factor for development of hibernomas.6
Clinical Presentation
Clinically, hibernomas present as slow-growing, painless soft-tissue masses. Physical examination usually reveals a palpable, solitary, soft, and rubbery mass within the subcutaneous fat, which is freely mobile and not attached to deep layers. These tumors may rarely produce steroid hormones and result in a paraneoplastic syndrome. Even though these tumors are usually large at presentation, compression of adjacent structures seldom occurs.
Histology and Differential Diagnosis
The characteristic hibernoma cell is a multivacuolated adipocyte with centrally located nucleus, indistinct nucleolus, and coarsely granular eosinophilic (or pale) cytoplasm (Figure 1). Cytoplasmic vacuoles are uniform, round, regular, and small and stain for neutral fat. Nuclei are usually small with no or rare atypia. These multivacuolated brown fat–like tumor cells usually stain positive for S100 and CD31, usually stain negative for CD34 and p53, and can show 11q13-21 rearrangements, also seen in lipomas and liposarcomas. Hibernomas have 4 histologic variants: typical (classic), myxoid, lipoma-like, and spindle-cell.5 The typical hibernoma, the most common, contains a varying mixture of brown and white fat cells. The myxoid type, second most common, is composed of hibernoma cells floating in a loose acellular myxoid stroma. The lipoma-like variant consists of a few scattered hibernoma cells in a predominance of white fat cells. The spindle-cell variant, the rarest, has features of typical hibernoma and spindle-cell lipoma.7
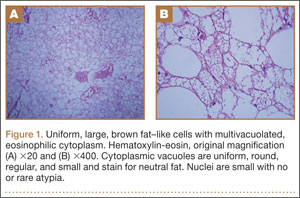
Grossly, hibernomas are well encapsulated, soft, and lobular with prominent feeding vessels.8 They typically are tan or brown because of their hypervascularity and abundant mitochondria. Tumor size ranges from 1 to 24 cm (mean, 9.4 cm).9 These tumors are well-defined intermuscular/intramuscular, subcutaneous, or retroperitoneal lesions that tend to grow along fascial planes and displace surrounding structures rather than invade them. Delicate branching capillaries are usually seen within the tumor.
Although rare, hibernoma should be included in the differential diagnosis of lipomatous soft-tissue tumors.10 Imaging findings of hibernoma are not specific; other differential diagnostic considerations for a mass with a signal similar to that of fat or containing large intratumoral vessels include angiolipoma, intramuscular hemangioma with fat, spindle-cell lipoma, pleomorphic lipoma, lipoblastoma, hemangiopericytoma, and hemangioblastoma,11-15 as well as malignant processes, including lipoma-like well-differentiated liposarcoma and myxoid liposarcoma.16 Other entities that should be considered include residual brown fat and rhabdomyoma.
Hibernomas are histologically distinguished from well-differentiated liposarcomas by location (liposarcomas tend to be deep), atypia, presence of a prominent “plexiform” capillary pattern, and specific molecular translocations, including t (12;16). Lipomas have lipocytes that are not multivacuolated, and residual brown fat does not present as a distinct mass. Rhabdomyomas are distinguished by an absence of cytoplasmic lipid vacuoles.
Imaging
Conventional radiography may show a radiolucent mass without internal mineralization or associated osseous abnormalities4 (Figure 2). Calcifications are notably absent.17 Sonographically, hibernomas are well-circumscribed, solid, hyperechoic masses with increased internal vascular flow on both grayscale and color Doppler sampling; however their appearance is not pathognomonic (Figure 3). Angiography reveals a hypervascular tumor that may have internal arteriovenous shunting.18 Hibernomas have a heterogeneous appearance on computed tomography (CT) and magnetic resonance imaging (MRI) because of the variable distribution of brown fat cells, white fat cells, myxoid material, and spindle cells within the individual tumor subtypes.5 CT of these tumors shows internal septations and low attenuation values, between those of fat and muscle19 (Figure 4). Intravenous contrast enhances internal septa, but enhancement varies from none to intense, and from generalized to focal, depending on internal tumor composition.3,17,20-22
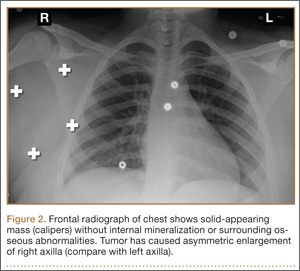
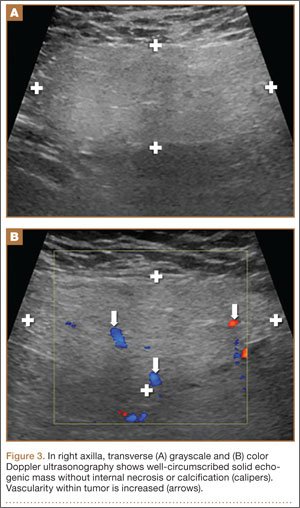
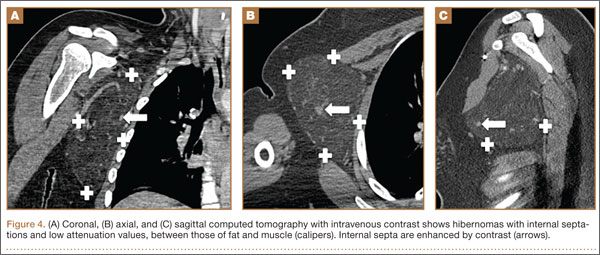
Hibernomas are usually hyperintense to skeletal muscle on T1-weighted MRI but slightly hypointense to subcutaneous fat because of the different gyromagnetic ratios and precessional frequencies of protons in white fat versus those in brown fat17 (Figure 5). Rarely, lesions are isointense to skeletal muscle on T1-weighted images.23 On T2-weighted images, high signal intensity similar to that of subcutaneous fat is typical.24 Flow voids can be readily identified.25 Short tau inversion recovery (STIR) MRI shows some areas with signal intensity higher than that of subcutaneous fat, and other areas of fat suppression.9 Ritchie and colleagues21 reported that hibernomas histologically composed of more than 70% multivacuolated adipocytes tended to have MRI signal characteristics different from those of subcutaneous fat, and those with less than 70% multivacuolated adipocytes tended to have signal characteristics paralleling those of subcutaneous fat. Myxoid hibernomas have higher signal intensity on T2-weighted and STIR MRI because of high water content.17,21,26,27
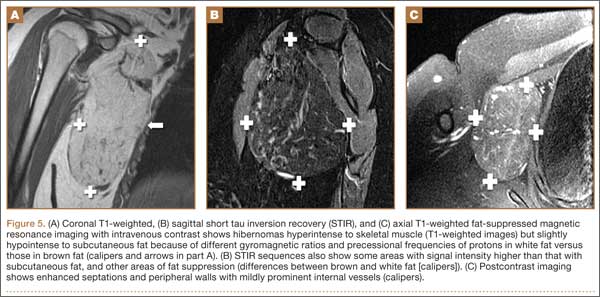
Hibernomas demonstrate moderate uptake on bone scintigraphy blood pool images and mild uptake on delayed images.4 Positron emission tomography (PET) is useful in differentiating hibernomas from other fat-containing lesions.9 Hibernomas demonstrate intense fluorine-18 fluorodeoxyglucose uptake because, unlike other adipogenic tumors, hibernomas contain abundant mitochondria and are highly metabolically active.28
Treatment and Prognosis
Complete surgical excision is the treatment of choice; given the behavior of the benign tumor, marginal complete excision is considered curative.5 Intralesional excision may be the only option for large tumors that are near nerves or vessels. However, intralesional excision may result in continued growth and local recurrence.
At surgery, these tumors usually are encapsulated and/or adherent to skeletal muscle or bone, without invasion, and easily separated from surrounding soft tissues.29 No specific surgical considerations are required beyond standard oncological principles, including careful dissection of adjacent nerves and vessels, and hemostasis. Hibernomas have the potential for significant bleeding during surgical excision. In this setting, embolization becomes a consideration, given the identification of large intratumoral vessels and the benign course of these lesions.
1. Merkel H. On a pseudolipoma of the breast. Beitr Pathol Anat. 1906;39:152-157.
2. Enzinger FM, Weiss SW. Benign lipomatous tumors. In: Enzinger FM, Weiss SW, eds. Soft Tissue Tumors. 3rd ed. St. Louis, MO: Mosby-Yearbook; 1994:420-423.
3. Alvine G, Rosenthal H, Murphey M, Huntrakoon M. Hibernoma. Skeletal Radiol. 1996;25(5):493-496.
4. Kumazoe H, Nagamatsu Y, Nishi T, Kimura YN, Nakazono T, Kudo S. Dumbbell-shaped thoracic hibernoma: computed tomography and magnetic resonance imaging findings. Jpn J Radiol. 2009;27(1):37-40.
5. Furlong MA, Fanburg-Smith JC, Miettinen M. The morphologic spectrum of hibernoma: a clinicopathologic study of 170 cases. Am J Surg Pathol. 2001;25(6):809-814.
6. Ucak A, Inan K, Onan B, Yilmaz AT. Resection of intrapericardial hibernoma associated with constrictive pericarditis. Interact Cardiovasc Thorac Surg. 2009;9(4):717-719.
7. Tomihama RT, Lindskog DM, Ahrens W, Haims AH. Hibernoma: a case report demonstrating usefulness of MR angiography in characterizing the tumor. Skeletal Radiol. 2007;36(6):541-545.
8. Choi J, Heiner J, Agni R, Hafez GR. Case of the season. Hibernoma. Semin Roentgenol. 2002;37(2):99-101.
9. Craig WD, Fanburg-Smith JC, Henry LR, Guerrero R, Barton JH. Fat-containing lesions of the retroperitoneum: radiologic-pathologic correlation. Radiographics. 2009;29(1):261-290.
10. Vassos N, Lell M, Hohenberger W, Croner RS, Agaimy A. Deep-seated huge hibernoma of soft tissue: a rare differential diagnosis of atypical lipomatous tumor/well differentiated liposarcoma. Int J Clin Exp Pathol. 2013;6(10):2178-2184.
11. Mugel T, Ghossain MA, Guinet C, et al. MR and CT findings in a case of hibernoma of the thigh extending into the pelvis. Eur Radiol. 1998;8(3):476-478.
12. Kallas KM, Vaughan L, Haghighi P, Resnick D. Hibernoma of the left axilla; a case report and review of MR imaging. Skeletal Radiol. 2003;32(5):290-294.
13. Suh JS, Cho J, Lee SH, et al. Alveolar soft part sarcoma: MR and angiographic findings. Skeletal Radiol. 2000;29(12):680-689.
14. De Beuckeleer LH, De Schepper AM, Vandevenne JE, et al. MR imaging of clear cell sarcoma (malignant melanoma of the soft parts): a multicenter correlative MRI-pathology study of 21 cases and literature review. Skeletal Radiol. 2000;29(4):187-195.
15. Chu BC, Terae S, Hida K, Furukawa M, Abe S, Miyasaka K. MR findings in spinal hemangioblastoma: correlation with symptoms and with angiographic and surgical findings. AJNR Am J Neuroradiol. 2001;22(1):206-217.
16. Cypess AM, Lehman S, Williams G, et al. Identification and importance of brown adipose tissue in adult humans. N Engl J Med. 2009;360(15):1509-1517.
17. Anderson SE, Schwab C, Stauffer E, Banic A, Steinbach LS. Hibernoma: imaging characteristics of a rare benign soft tissue tumor. Skeletal Radiol. 2001;30(10):590-595.
18. Angervall L, Nilsson L, Stener B. Microangiographic and histological studies in 2 cases of hibernoma. Cancer. 1964;17:685-692.
19. Sansom HE, Blunt DM, Moskovic EC. Large retroperitoneal hibernoma—CT findings with pathological correlation. Clin Radiol. 1999;54(9):625-627.
20. Dursun M, Agayev A, Bakir B, et al. CT and MR characteristics of hibernoma: six cases. Clin Imaging. 2008;32(1):42-47.
21. Ritchie DA, Aniq H, Davies AM, Mangham DC, Helliwell TR. Hibernoma—correlation of histopathology and magnetic-resonance-imaging features in 10 cases. Skeletal Radiol. 2006;35(8):579-589.
22. Lee JC, Gupta A, Saifuddin A, et al. Hibernoma: MRI features in eight consecutive cases. Clin Radiol. 2006;61(12):1029-1034.
23. Chitoku S, Kawai S, Watabe Y, et al. Intradural spinal hibernoma: case report. Surg Neurol. 1998;49(5):509-513.
24. Baskurt E, Padgett DM, Matsumoto JA. Multiple hibernomas in a 1-month-old female infant. AJNR Am J Neuroradiol. 2004;25(8):1443-1445.
25. da Motta AC, Tunkel DE, Westra WH, Yousem DM. Imaging findings of a hibernoma of the neck. AJNR Am J Neuroradiol. 2006;27(8):1658-1659.
26. Cook MA, Stern M, de Siva RD. MRI of a hibernoma. J Comput Assist Tomogr. 1996;20(2):333-335.
27. Murphey MD, Carroll JF, Flemming DJ, Pope TL, Gannon FH, Kransdorf MJ. From the archives of the AFIP: benign musculoskeletal lipomatous lesions. Radiographics. 2004;24(5):1433-1466.
28. Robison S, Rapmund A, Hemmings C, Fulham M, Barry P. False-positive diagnosis of metastasis on positron emission tomography–computed tomography imaging due to hibernoma. J Clin Oncol. 2009;27(6):994-995.
29. Kallas KM, Vaughan L, Haghighi P, Resnick D. Hibernoma of the left axilla; a case report and review of MR imaging. Skeletal Radiol. 2003;32(5):290-294.
Hibernomas are rare benign soft-tissue tumors originally described as pseudolipomas by Merkel1 in 1906. Gery coined the term hibernoma in 1914, after noting the multivacuolated cytoplasm of the tumor cells and its resemblance to normal brown fat found in hibernating animals.2
Hibernomas represent 2% of all benign fat-containing tumors and are composed of brown adipocytes, which are histologically different from the white fat of lipomas. Hibernomas usually develop between ages 20 and 40 years, and their incidence is slightly higher in males.
Diffusely present in human newborns, brown fat usually regresses by 8 weeks of age.3 Residual brown fat deposits may remain in the neck, axilla, shoulder, thorax, thigh, retroperitoneum, and periscapular/interscapular regions.4 All these vestigial areas are therefore common locations of hibernomas, with the thigh accounting for up to 30% of cases.5 These tumors are seldom identified in the abdomen, popliteal fossa, or even intracranially. Injury to brown fat cells in these locations, either by infection, inflammation, or trauma, is considered a predisposing risk factor for development of hibernomas.6
Clinical Presentation
Clinically, hibernomas present as slow-growing, painless soft-tissue masses. Physical examination usually reveals a palpable, solitary, soft, and rubbery mass within the subcutaneous fat, which is freely mobile and not attached to deep layers. These tumors may rarely produce steroid hormones and result in a paraneoplastic syndrome. Even though these tumors are usually large at presentation, compression of adjacent structures seldom occurs.
Histology and Differential Diagnosis
The characteristic hibernoma cell is a multivacuolated adipocyte with centrally located nucleus, indistinct nucleolus, and coarsely granular eosinophilic (or pale) cytoplasm (Figure 1). Cytoplasmic vacuoles are uniform, round, regular, and small and stain for neutral fat. Nuclei are usually small with no or rare atypia. These multivacuolated brown fat–like tumor cells usually stain positive for S100 and CD31, usually stain negative for CD34 and p53, and can show 11q13-21 rearrangements, also seen in lipomas and liposarcomas. Hibernomas have 4 histologic variants: typical (classic), myxoid, lipoma-like, and spindle-cell.5 The typical hibernoma, the most common, contains a varying mixture of brown and white fat cells. The myxoid type, second most common, is composed of hibernoma cells floating in a loose acellular myxoid stroma. The lipoma-like variant consists of a few scattered hibernoma cells in a predominance of white fat cells. The spindle-cell variant, the rarest, has features of typical hibernoma and spindle-cell lipoma.7
Grossly, hibernomas are well encapsulated, soft, and lobular with prominent feeding vessels.8 They typically are tan or brown because of their hypervascularity and abundant mitochondria. Tumor size ranges from 1 to 24 cm (mean, 9.4 cm).9 These tumors are well-defined intermuscular/intramuscular, subcutaneous, or retroperitoneal lesions that tend to grow along fascial planes and displace surrounding structures rather than invade them. Delicate branching capillaries are usually seen within the tumor.
Although rare, hibernoma should be included in the differential diagnosis of lipomatous soft-tissue tumors.10 Imaging findings of hibernoma are not specific; other differential diagnostic considerations for a mass with a signal similar to that of fat or containing large intratumoral vessels include angiolipoma, intramuscular hemangioma with fat, spindle-cell lipoma, pleomorphic lipoma, lipoblastoma, hemangiopericytoma, and hemangioblastoma,11-15 as well as malignant processes, including lipoma-like well-differentiated liposarcoma and myxoid liposarcoma.16 Other entities that should be considered include residual brown fat and rhabdomyoma.
Hibernomas are histologically distinguished from well-differentiated liposarcomas by location (liposarcomas tend to be deep), atypia, presence of a prominent “plexiform” capillary pattern, and specific molecular translocations, including t (12;16). Lipomas have lipocytes that are not multivacuolated, and residual brown fat does not present as a distinct mass. Rhabdomyomas are distinguished by an absence of cytoplasmic lipid vacuoles.
Imaging
Conventional radiography may show a radiolucent mass without internal mineralization or associated osseous abnormalities4 (Figure 2). Calcifications are notably absent.17 Sonographically, hibernomas are well-circumscribed, solid, hyperechoic masses with increased internal vascular flow on both grayscale and color Doppler sampling; however their appearance is not pathognomonic (Figure 3). Angiography reveals a hypervascular tumor that may have internal arteriovenous shunting.18 Hibernomas have a heterogeneous appearance on computed tomography (CT) and magnetic resonance imaging (MRI) because of the variable distribution of brown fat cells, white fat cells, myxoid material, and spindle cells within the individual tumor subtypes.5 CT of these tumors shows internal septations and low attenuation values, between those of fat and muscle19 (Figure 4). Intravenous contrast enhances internal septa, but enhancement varies from none to intense, and from generalized to focal, depending on internal tumor composition.3,17,20-22
Hibernomas are usually hyperintense to skeletal muscle on T1-weighted MRI but slightly hypointense to subcutaneous fat because of the different gyromagnetic ratios and precessional frequencies of protons in white fat versus those in brown fat17 (Figure 5). Rarely, lesions are isointense to skeletal muscle on T1-weighted images.23 On T2-weighted images, high signal intensity similar to that of subcutaneous fat is typical.24 Flow voids can be readily identified.25 Short tau inversion recovery (STIR) MRI shows some areas with signal intensity higher than that of subcutaneous fat, and other areas of fat suppression.9 Ritchie and colleagues21 reported that hibernomas histologically composed of more than 70% multivacuolated adipocytes tended to have MRI signal characteristics different from those of subcutaneous fat, and those with less than 70% multivacuolated adipocytes tended to have signal characteristics paralleling those of subcutaneous fat. Myxoid hibernomas have higher signal intensity on T2-weighted and STIR MRI because of high water content.17,21,26,27
Hibernomas demonstrate moderate uptake on bone scintigraphy blood pool images and mild uptake on delayed images.4 Positron emission tomography (PET) is useful in differentiating hibernomas from other fat-containing lesions.9 Hibernomas demonstrate intense fluorine-18 fluorodeoxyglucose uptake because, unlike other adipogenic tumors, hibernomas contain abundant mitochondria and are highly metabolically active.28
Treatment and Prognosis
Complete surgical excision is the treatment of choice; given the behavior of the benign tumor, marginal complete excision is considered curative.5 Intralesional excision may be the only option for large tumors that are near nerves or vessels. However, intralesional excision may result in continued growth and local recurrence.
At surgery, these tumors usually are encapsulated and/or adherent to skeletal muscle or bone, without invasion, and easily separated from surrounding soft tissues.29 No specific surgical considerations are required beyond standard oncological principles, including careful dissection of adjacent nerves and vessels, and hemostasis. Hibernomas have the potential for significant bleeding during surgical excision. In this setting, embolization becomes a consideration, given the identification of large intratumoral vessels and the benign course of these lesions.
1. Merkel H. On a pseudolipoma of the breast. Beitr Pathol Anat. 1906;39:152-157.
2. Enzinger FM, Weiss SW. Benign lipomatous tumors. In: Enzinger FM, Weiss SW, eds. Soft Tissue Tumors. 3rd ed. St. Louis, MO: Mosby-Yearbook; 1994:420-423.
3. Alvine G, Rosenthal H, Murphey M, Huntrakoon M. Hibernoma. Skeletal Radiol. 1996;25(5):493-496.
4. Kumazoe H, Nagamatsu Y, Nishi T, Kimura YN, Nakazono T, Kudo S. Dumbbell-shaped thoracic hibernoma: computed tomography and magnetic resonance imaging findings. Jpn J Radiol. 2009;27(1):37-40.
5. Furlong MA, Fanburg-Smith JC, Miettinen M. The morphologic spectrum of hibernoma: a clinicopathologic study of 170 cases. Am J Surg Pathol. 2001;25(6):809-814.
6. Ucak A, Inan K, Onan B, Yilmaz AT. Resection of intrapericardial hibernoma associated with constrictive pericarditis. Interact Cardiovasc Thorac Surg. 2009;9(4):717-719.
7. Tomihama RT, Lindskog DM, Ahrens W, Haims AH. Hibernoma: a case report demonstrating usefulness of MR angiography in characterizing the tumor. Skeletal Radiol. 2007;36(6):541-545.
8. Choi J, Heiner J, Agni R, Hafez GR. Case of the season. Hibernoma. Semin Roentgenol. 2002;37(2):99-101.
9. Craig WD, Fanburg-Smith JC, Henry LR, Guerrero R, Barton JH. Fat-containing lesions of the retroperitoneum: radiologic-pathologic correlation. Radiographics. 2009;29(1):261-290.
10. Vassos N, Lell M, Hohenberger W, Croner RS, Agaimy A. Deep-seated huge hibernoma of soft tissue: a rare differential diagnosis of atypical lipomatous tumor/well differentiated liposarcoma. Int J Clin Exp Pathol. 2013;6(10):2178-2184.
11. Mugel T, Ghossain MA, Guinet C, et al. MR and CT findings in a case of hibernoma of the thigh extending into the pelvis. Eur Radiol. 1998;8(3):476-478.
12. Kallas KM, Vaughan L, Haghighi P, Resnick D. Hibernoma of the left axilla; a case report and review of MR imaging. Skeletal Radiol. 2003;32(5):290-294.
13. Suh JS, Cho J, Lee SH, et al. Alveolar soft part sarcoma: MR and angiographic findings. Skeletal Radiol. 2000;29(12):680-689.
14. De Beuckeleer LH, De Schepper AM, Vandevenne JE, et al. MR imaging of clear cell sarcoma (malignant melanoma of the soft parts): a multicenter correlative MRI-pathology study of 21 cases and literature review. Skeletal Radiol. 2000;29(4):187-195.
15. Chu BC, Terae S, Hida K, Furukawa M, Abe S, Miyasaka K. MR findings in spinal hemangioblastoma: correlation with symptoms and with angiographic and surgical findings. AJNR Am J Neuroradiol. 2001;22(1):206-217.
16. Cypess AM, Lehman S, Williams G, et al. Identification and importance of brown adipose tissue in adult humans. N Engl J Med. 2009;360(15):1509-1517.
17. Anderson SE, Schwab C, Stauffer E, Banic A, Steinbach LS. Hibernoma: imaging characteristics of a rare benign soft tissue tumor. Skeletal Radiol. 2001;30(10):590-595.
18. Angervall L, Nilsson L, Stener B. Microangiographic and histological studies in 2 cases of hibernoma. Cancer. 1964;17:685-692.
19. Sansom HE, Blunt DM, Moskovic EC. Large retroperitoneal hibernoma—CT findings with pathological correlation. Clin Radiol. 1999;54(9):625-627.
20. Dursun M, Agayev A, Bakir B, et al. CT and MR characteristics of hibernoma: six cases. Clin Imaging. 2008;32(1):42-47.
21. Ritchie DA, Aniq H, Davies AM, Mangham DC, Helliwell TR. Hibernoma—correlation of histopathology and magnetic-resonance-imaging features in 10 cases. Skeletal Radiol. 2006;35(8):579-589.
22. Lee JC, Gupta A, Saifuddin A, et al. Hibernoma: MRI features in eight consecutive cases. Clin Radiol. 2006;61(12):1029-1034.
23. Chitoku S, Kawai S, Watabe Y, et al. Intradural spinal hibernoma: case report. Surg Neurol. 1998;49(5):509-513.
24. Baskurt E, Padgett DM, Matsumoto JA. Multiple hibernomas in a 1-month-old female infant. AJNR Am J Neuroradiol. 2004;25(8):1443-1445.
25. da Motta AC, Tunkel DE, Westra WH, Yousem DM. Imaging findings of a hibernoma of the neck. AJNR Am J Neuroradiol. 2006;27(8):1658-1659.
26. Cook MA, Stern M, de Siva RD. MRI of a hibernoma. J Comput Assist Tomogr. 1996;20(2):333-335.
27. Murphey MD, Carroll JF, Flemming DJ, Pope TL, Gannon FH, Kransdorf MJ. From the archives of the AFIP: benign musculoskeletal lipomatous lesions. Radiographics. 2004;24(5):1433-1466.
28. Robison S, Rapmund A, Hemmings C, Fulham M, Barry P. False-positive diagnosis of metastasis on positron emission tomography–computed tomography imaging due to hibernoma. J Clin Oncol. 2009;27(6):994-995.
29. Kallas KM, Vaughan L, Haghighi P, Resnick D. Hibernoma of the left axilla; a case report and review of MR imaging. Skeletal Radiol. 2003;32(5):290-294.
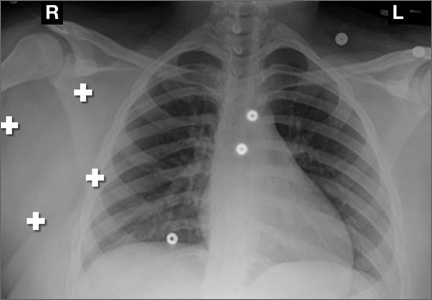
Technique for Lumbar Pedicle Subtraction Osteotomy for Sagittal Plane Deformity in Revision
Pedicle subtraction osteotomies (PSOs) have been used in the treatment of multiple spinal conditions involving a fixed sagittal imbalance, such as degenerative scoliosis, idiopathic scoliosis, posttraumatic deformities, iatrogenic flatback syndrome, and ankylosing spondylitis. The procedure was first described by Thomasen1 for the treatment of ankylosing spondylitis. More recently, multiple centers have reported the expanded use and good success of PSO in the treatment of fixed sagittal imbalance of other etiologies.2,3 According to Bridwell and colleagues,2 lumbar lordosis can be increased 34.1°, and sagittal plumb line can be improved 13.5 cm.
PSO is a complex, extensive surgery most often performed in the revision setting. Multiple authors have described the technique for PSO.4,5 There are significant technical challenges and many complications, including neurologic deficits, pseudarthrosis of adjacent levels, and wound infections.6 Short-term challenges include a large loss of blood, 2.4 L on average, according to Bridwell and colleagues.6 Time of closure of the osteotomy gap is a crucial point in the surgery. Blood loss, often large, slows only after the gap is closed and stabilized.
In this article, we describe a technique in which an additional rod or pedicle screw construct is used at the periosteotomy levels to close the osteotomy gap during PSO and simplify subsequent instrumentation. In addition, we report our experience with the procedure.
Materials and Methods
Seventeen consecutive patients (mean age, 58 years; range, 12-81 years) with fixed sagittal imbalance were treated with lumbar PSO. The indication in all cases was flatback syndrome after previous spinal surgery. Mean follow-up was 13 months. Mean number of prior surgeries was 3. Thirteen PSOs were performed at L3, and 4 were performed at L2.
Radiographic data were collected from before surgery, in the immediate postoperative period, and at final follow-up. All the radiographs were standing films. Established radiographic parameters were measured: thoracic kyphosis from T5 to T12, lumbar lordosis from L1 to S1, PSO angle (1 level above to 1 level below osteotomy level), sagittal plumb line (from center of C7 body to posterosuperior aspect of S1 body), and coronal plumb line (from center of C7 body to center of S1 body).2
Good clinical outcomes in the treatment of spinal disorders require careful attention to the alignment of the spine in the sagittal plane.7,8 When evaluating the preoperative radiographs, we measured and documented pelvic parameters. Figure 1A shows how pelvic incidence was determined. We measured this as the angle between a line drawn from the center of the S1 endplate to the center of the femoral head and the perpendicular off the S1 endplate. Figure 1B shows pelvic tilt as determined by the angle between a line drawn from the center of S1 to the femoral head and a vertical line originating from the center of the femoral head. Figure 1C shows the sacral slope, which we measured as the angle between a line drawn parallel to the endplate of S1 and its intersection with a horizontal line.
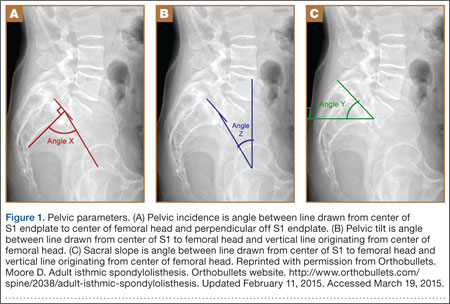
Surgical Technique
The overall surgical technique for PSO has been well described.4,5 Here we describe the “outrigger” modification to osteotomy closure (Figures 2, 3).
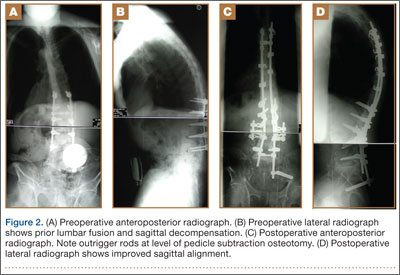
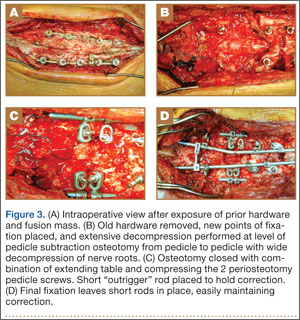
Most of our 17 cases were revisions. In these cases, new fixation points are first established. All fixation points that will be needed for the final fusion are placed. If a pedicle above or below the osteotomy level is not suitable for a screw, it can be skipped.
Wide decompression of the involved level is performed from pedicle to pedicle, ensuring that the nerve roots are completely decompressed. The dissection is then continued around the lateral wall of the vertebral body. While the neural elements are protected with gentle retraction, the pedicle and a portion of the posterior aspect of the vertebral body are removed with a combination of a rongeur and reverse-angle curettes. Resection of the vertebral body can be facilitated by attaching a short rod to the pedicle screws on either side of the osteotomy level and using it to provide gentle distraction.
Once sufficient bone has been removed to close the osteotomy, short rods are placed in the pedicle screws in the level above and the level below the osteotomy site. These rods are attached with offset connectors that allow the rods to be placed lateral to the screws. Before the surgical procedure is started, the patient is positioned on 2 sets of posts separated by the break in the table. The break in the table allows flexion to accommodate the preoperative kyphosis and allows hyperextension to help close the osteotomy site. Now, with the osteotomy site ready for closure, the table is gradually positioned in extension along with a combination of posterior pressure and compression between the pedicle screws above and below the osteotomy. Once the osteotomy is adequately compressed, the short rods are tightened, holding the osteotomy in good position. With the osteotomy held by the short rods and table positioning, decompression of the neural elements is confirmed and hemostasis obtained.
Final instrumentation is then performed with long rods that can bypass the osteotomized levels, allowing for simpler contouring. If desired, a cross connector can be placed between the long rod of the fusion construct and the short rod holding the osteotomy. The rest of the fusion procedure is completed in standard fashion with at least 1 subfascial drain.
Results
Our 17 patients’ results are summarized in the Table. Mean sagittal plumb line improved from 17.7 cm (range, 5.9 to 29 cm) before surgery to 4.5 cm (range, –0.2 to 12.9 cm) after surgery, for a mean improvement of 13.2 cm. At final follow-up, mean sagittal plumb line was 5.1 cm (range, –1.4 to 10.2 cm).
Mean lumbar lordosis improved from 10° (range, –14° to 34°) before surgery to 49° (range, 36° to 63°) after surgery, for a mean improvement of 39°. Mean PSO angle improved from 3° (range, –36° to 23°) before surgery to 41° (range, 25° to 65°) after surgery, for a mean improvement of 38°. At final follow-up, mean lumbar lordosis remained at 47° (range, 26° to 64°), and mean PSO angle was 39° (range, 24° to 59°).
Mean thoracic kyphosis improved from 18° (range, –8° to 52°) before surgery to 30° (range, 3° to 58°) after surgery, for a mean improvement of 12°. At final follow-up, mean thoracic kyphosis was 31° (range, 2° to 57°).
Fourteen patients did not have complications during the study period. Of the 3 patients with complications, 1 had an early infection, treated effectively with irrigation and débridement and intravenous antibiotics; 1 had a late deep infection, treated with multiple débridements, hardware removal, and, eventually, suppressive antibiotics; and 1 had cauda equina syndrome (caused by extensive scar tissue on the dura, which buckled with restoration of lordosis leading to cord compression), treated with duraplasty, which resulted in full neurologic recovery.
Discussion
In the present series of patients, the described technique for facilitating PSO for correction of sagittal imbalance was effective, and complications were similar to those previously reported.
The benefit of the outrigger construct is that it allows controlled compression of the osteotomy site and can be left in place at time of final instrumentation, locking in compression and correction. Other techniques involve removing the temporary rod and replacing it with final instrumentation4,5—an extra step that complicates instrumentation of the additional levels of the fusion construct and possibly adds pedicle screw stress and contributes to loosening when the new rod is reduced to the pedicle screw. The final long rod construct can bypass the osteotomy levels and allow for simpler instrumentation.
Mean age was 58 years in this series versus 52.4 years in the series reported by Bridwell and colleagues.2 Given the higher mean age of our patients, though no objective measures of bone quality were available, this technique is likely applicable to patients with poor bone quality.
The complications we have reported are in line with those reported in previous series, and maintenance of radiographic parameters at final follow-up indicates that this osteotomy technique allows for solid fusion constructs.
The outrigger technique for controlling PSO closure is an effective method that simplifies instrumentation during a complex revision case.
1. Thomasen E. Vertebral osteotomy for correction of kyphosis in ankylosing spondylitis. Clin Orthop. 1985;(194):142-152.
2. Bridwell KH, Lewis SJ, Lenke LG, Baldus C, Blanke K. Pedicle subtraction osteotomy for the treatment of fixed sagittal imbalance. J Bone Joint Surg Am. 2003;85(3):454-463.
3. Berven SH, Deviren V, Smith JA, Emami A, Hu SS, Bradford DS. Management of fixed sagittal plane deformity: results of the transpedicular wedge resection osteotomy. Spine. 2001;26(18):2036-2043.
4. Bridwell KH, Lewis SJ, Rinella A, Lenke LG, Baldus C, Blanke K. Pedicle subtraction osteotomy for the treatment of fixed sagittal imbalance. Surgical technique. J Bone Joint Surg Am. 2004;86(suppl 1):44-50.
5. Wang MY, Berven SH. Lumbar pedicle subtraction osteotomy. Neurosurgery. 2007;60(2 suppl 1):ONS140-ONS146.
6. Bridwell KH, Lewis SJ, Edwards C, et al. Complications and outcomes of pedicle subtraction osteotomies for fixed sagittal imbalance. Spine. 2003;28(18):2093-2101.
7. Vialle R, Levassor N, Rillardon L, Templier A, Skalli W, Guigui P. Radiographic analysis of the sagittal alignment and balance of the spine in asymptomatic subjects. J Bone Joint Surg Am. 2005;87(2):260-267.
8. Schwab F, Lafage V, Patel A, Farcy JP. Sagittal plane considerations and the pelvis in the adult patient. Spine. 2009;34(17):1828-1833.
Pedicle subtraction osteotomies (PSOs) have been used in the treatment of multiple spinal conditions involving a fixed sagittal imbalance, such as degenerative scoliosis, idiopathic scoliosis, posttraumatic deformities, iatrogenic flatback syndrome, and ankylosing spondylitis. The procedure was first described by Thomasen1 for the treatment of ankylosing spondylitis. More recently, multiple centers have reported the expanded use and good success of PSO in the treatment of fixed sagittal imbalance of other etiologies.2,3 According to Bridwell and colleagues,2 lumbar lordosis can be increased 34.1°, and sagittal plumb line can be improved 13.5 cm.
PSO is a complex, extensive surgery most often performed in the revision setting. Multiple authors have described the technique for PSO.4,5 There are significant technical challenges and many complications, including neurologic deficits, pseudarthrosis of adjacent levels, and wound infections.6 Short-term challenges include a large loss of blood, 2.4 L on average, according to Bridwell and colleagues.6 Time of closure of the osteotomy gap is a crucial point in the surgery. Blood loss, often large, slows only after the gap is closed and stabilized.
In this article, we describe a technique in which an additional rod or pedicle screw construct is used at the periosteotomy levels to close the osteotomy gap during PSO and simplify subsequent instrumentation. In addition, we report our experience with the procedure.
Materials and Methods
Seventeen consecutive patients (mean age, 58 years; range, 12-81 years) with fixed sagittal imbalance were treated with lumbar PSO. The indication in all cases was flatback syndrome after previous spinal surgery. Mean follow-up was 13 months. Mean number of prior surgeries was 3. Thirteen PSOs were performed at L3, and 4 were performed at L2.
Radiographic data were collected from before surgery, in the immediate postoperative period, and at final follow-up. All the radiographs were standing films. Established radiographic parameters were measured: thoracic kyphosis from T5 to T12, lumbar lordosis from L1 to S1, PSO angle (1 level above to 1 level below osteotomy level), sagittal plumb line (from center of C7 body to posterosuperior aspect of S1 body), and coronal plumb line (from center of C7 body to center of S1 body).2
Good clinical outcomes in the treatment of spinal disorders require careful attention to the alignment of the spine in the sagittal plane.7,8 When evaluating the preoperative radiographs, we measured and documented pelvic parameters. Figure 1A shows how pelvic incidence was determined. We measured this as the angle between a line drawn from the center of the S1 endplate to the center of the femoral head and the perpendicular off the S1 endplate. Figure 1B shows pelvic tilt as determined by the angle between a line drawn from the center of S1 to the femoral head and a vertical line originating from the center of the femoral head. Figure 1C shows the sacral slope, which we measured as the angle between a line drawn parallel to the endplate of S1 and its intersection with a horizontal line.
Surgical Technique
The overall surgical technique for PSO has been well described.4,5 Here we describe the “outrigger” modification to osteotomy closure (Figures 2, 3).
Most of our 17 cases were revisions. In these cases, new fixation points are first established. All fixation points that will be needed for the final fusion are placed. If a pedicle above or below the osteotomy level is not suitable for a screw, it can be skipped.
Wide decompression of the involved level is performed from pedicle to pedicle, ensuring that the nerve roots are completely decompressed. The dissection is then continued around the lateral wall of the vertebral body. While the neural elements are protected with gentle retraction, the pedicle and a portion of the posterior aspect of the vertebral body are removed with a combination of a rongeur and reverse-angle curettes. Resection of the vertebral body can be facilitated by attaching a short rod to the pedicle screws on either side of the osteotomy level and using it to provide gentle distraction.
Once sufficient bone has been removed to close the osteotomy, short rods are placed in the pedicle screws in the level above and the level below the osteotomy site. These rods are attached with offset connectors that allow the rods to be placed lateral to the screws. Before the surgical procedure is started, the patient is positioned on 2 sets of posts separated by the break in the table. The break in the table allows flexion to accommodate the preoperative kyphosis and allows hyperextension to help close the osteotomy site. Now, with the osteotomy site ready for closure, the table is gradually positioned in extension along with a combination of posterior pressure and compression between the pedicle screws above and below the osteotomy. Once the osteotomy is adequately compressed, the short rods are tightened, holding the osteotomy in good position. With the osteotomy held by the short rods and table positioning, decompression of the neural elements is confirmed and hemostasis obtained.
Final instrumentation is then performed with long rods that can bypass the osteotomized levels, allowing for simpler contouring. If desired, a cross connector can be placed between the long rod of the fusion construct and the short rod holding the osteotomy. The rest of the fusion procedure is completed in standard fashion with at least 1 subfascial drain.
Results
Our 17 patients’ results are summarized in the Table. Mean sagittal plumb line improved from 17.7 cm (range, 5.9 to 29 cm) before surgery to 4.5 cm (range, –0.2 to 12.9 cm) after surgery, for a mean improvement of 13.2 cm. At final follow-up, mean sagittal plumb line was 5.1 cm (range, –1.4 to 10.2 cm).
Mean lumbar lordosis improved from 10° (range, –14° to 34°) before surgery to 49° (range, 36° to 63°) after surgery, for a mean improvement of 39°. Mean PSO angle improved from 3° (range, –36° to 23°) before surgery to 41° (range, 25° to 65°) after surgery, for a mean improvement of 38°. At final follow-up, mean lumbar lordosis remained at 47° (range, 26° to 64°), and mean PSO angle was 39° (range, 24° to 59°).
Mean thoracic kyphosis improved from 18° (range, –8° to 52°) before surgery to 30° (range, 3° to 58°) after surgery, for a mean improvement of 12°. At final follow-up, mean thoracic kyphosis was 31° (range, 2° to 57°).
Fourteen patients did not have complications during the study period. Of the 3 patients with complications, 1 had an early infection, treated effectively with irrigation and débridement and intravenous antibiotics; 1 had a late deep infection, treated with multiple débridements, hardware removal, and, eventually, suppressive antibiotics; and 1 had cauda equina syndrome (caused by extensive scar tissue on the dura, which buckled with restoration of lordosis leading to cord compression), treated with duraplasty, which resulted in full neurologic recovery.
Discussion
In the present series of patients, the described technique for facilitating PSO for correction of sagittal imbalance was effective, and complications were similar to those previously reported.
The benefit of the outrigger construct is that it allows controlled compression of the osteotomy site and can be left in place at time of final instrumentation, locking in compression and correction. Other techniques involve removing the temporary rod and replacing it with final instrumentation4,5—an extra step that complicates instrumentation of the additional levels of the fusion construct and possibly adds pedicle screw stress and contributes to loosening when the new rod is reduced to the pedicle screw. The final long rod construct can bypass the osteotomy levels and allow for simpler instrumentation.
Mean age was 58 years in this series versus 52.4 years in the series reported by Bridwell and colleagues.2 Given the higher mean age of our patients, though no objective measures of bone quality were available, this technique is likely applicable to patients with poor bone quality.
The complications we have reported are in line with those reported in previous series, and maintenance of radiographic parameters at final follow-up indicates that this osteotomy technique allows for solid fusion constructs.
The outrigger technique for controlling PSO closure is an effective method that simplifies instrumentation during a complex revision case.
1. Thomasen E. Vertebral osteotomy for correction of kyphosis in ankylosing spondylitis. Clin Orthop. 1985;(194):142-152.
2. Bridwell KH, Lewis SJ, Lenke LG, Baldus C, Blanke K. Pedicle subtraction osteotomy for the treatment of fixed sagittal imbalance. J Bone Joint Surg Am. 2003;85(3):454-463.
3. Berven SH, Deviren V, Smith JA, Emami A, Hu SS, Bradford DS. Management of fixed sagittal plane deformity: results of the transpedicular wedge resection osteotomy. Spine. 2001;26(18):2036-2043.
4. Bridwell KH, Lewis SJ, Rinella A, Lenke LG, Baldus C, Blanke K. Pedicle subtraction osteotomy for the treatment of fixed sagittal imbalance. Surgical technique. J Bone Joint Surg Am. 2004;86(suppl 1):44-50.
5. Wang MY, Berven SH. Lumbar pedicle subtraction osteotomy. Neurosurgery. 2007;60(2 suppl 1):ONS140-ONS146.
6. Bridwell KH, Lewis SJ, Edwards C, et al. Complications and outcomes of pedicle subtraction osteotomies for fixed sagittal imbalance. Spine. 2003;28(18):2093-2101.
7. Vialle R, Levassor N, Rillardon L, Templier A, Skalli W, Guigui P. Radiographic analysis of the sagittal alignment and balance of the spine in asymptomatic subjects. J Bone Joint Surg Am. 2005;87(2):260-267.
8. Schwab F, Lafage V, Patel A, Farcy JP. Sagittal plane considerations and the pelvis in the adult patient. Spine. 2009;34(17):1828-1833.
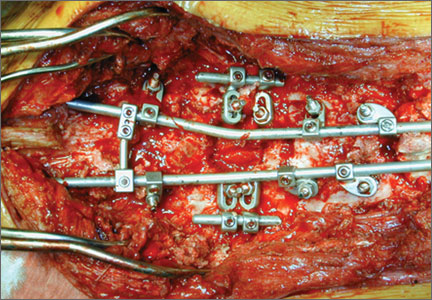
Rationale for Strategic Graft Placement in Anterior Cruciate Ligament Reconstruction: I.D.E.A.L. Femoral Tunnel Position
In the United States, surgeons perform an estimated 200,000 anterior cruciate ligament reconstructions (ACLRs) each year. Over the past decade, there has been a surge in interest in defining anterior cruciate ligament (ACL) anatomy to guide ACLR. With this renewed interest in the anatomical features of the ACL, particularly the insertion site, many authors have advocated an approach for complete or near-complete “footprint restoration” for anatomical ACLR.1,2 Some have recommended a double-bundle (DB) technique that completely “fills” the footprint, but it is seldom used. Others have proposed centralizing the femoral tunnel position within the ACL footprint in the hope of capturing the function of both the anteromedial (AM) and posterolateral (PL) bundles.1,3,4 Indeed, a primary surgical goal of most anatomical ACLR techniques is creation of a femoral tunnel based off the anatomical centrum (center point) of the ACL femoral footprint.3,5 With a single-bundle technique, the femoral socket is localized in the center of the entire footprint; with a DB technique, sockets are created in the centrums of both the AM and PL bundles.
Because of the complex shape of the native ACL, however, the strategy of restoring the femoral footprint with use of either a central tunnel or a DB approach has been challenged. The femoral footprint is 3.5 times larger than the midsubstance of the ACL.6 Detailed anatomical dissections have recently demonstrated that the femoral origin of the ACL has a stout anterior band of fibers with a fanlike extension posteriorly.7 As the ACL fibers extend off the bony footprint, they form a flat, ribbonlike structure 9 to 16 mm wide and only 2 to 4 mm thick.2,8 Within this structure, there is no clear separation of the AM and PL bundles. The presence of this structure makes sense given the anatomical constraints inherent in the notch. Indeed, the space for the native ACL is narrow, as the posterior cruciate ligament (PCL) occupies that largest portion of the notch with the knee in full extension, leaving only a thin, 5-mm slot through which the ACL must pass.9 Therefore, filling the femoral footprint with a tubular ACL graft probably does not reproduce the dynamic 3-dimensional morphology of the ACL.
In light of the discrepancy between the sizes of the femoral footprint and the midsubstance of the native ACL, it seems reasonable that optimizing the position of the ACL femoral tunnel may be more complex than simply centralizing the tunnel within the footprint or attempting to maximize footprint coverage. In this article, we amalgamate the lessons of 4 decades of ACL research into 5 points for strategic femoral tunnel positioning, based on anatomical, histologic, isometric, biomechanical, and clinical data. These points are summarized by the acronym I.D.E.A.L., which refers to placing a femoral tunnel in a position that reproduces the Isometry of the native ACL, that covers the fibers of the Direct insertion histologically, that is Eccentrically located in the anterior (high) and proximal (deep) region of the footprint, that is Anatomical (within the footprint), and that replicates the Low tension-flexion pattern of the native ACL throughout the range of flexion and extension.
1. Anatomy Considerations
In response to study results demonstrating that some transtibial ACLRs were associated with nonanatomical placement of the femoral tunnel—resulting in vertical graft placement, PCL impingement, and recurrent rotational instability10-16—investigators have reexamined both the anatomy of the femoral origin of the native ACL and the ACL graft. Specifically, a large body of research has been devoted to characterizing the osseous landmarks of the femoral origin of the ACL17 and the dimensions of the femoral footprint.3 In addition, authors have supported the concept that the ACL contains 2 functional bundles, AM and PL.5,17 Several osseous landmarks have been identified as defining the boundaries of the femoral footprint. The lateral intercondylar ridge is the most anterior aspect of the femoral footprint and was first defined by Clancy.18 More recently, the lateral bifurcate ridge, which separates the AM and PL bundle insertion sites, was described19 (Figure 1A).
These osseous ridges delineate the location of the femoral footprint. Studies have shown that ACL fibers attach from the lateral intercondylar ridge on the anterior border of the femoral footprint and extend posteriorly to the cartilage of the lateral femoral condyle (Figure 1B).
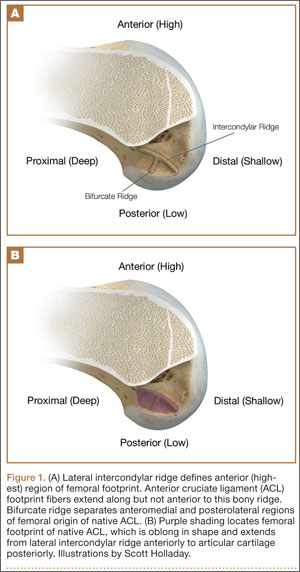
ACL fibers from this oblong footprint are organized such that the midsubstance of the ACL is narrower than the femoral footprint. Anatomical dissections have demonstrated that, though the femoral footprint is oval, the native ACL forms a flat, ribbonlike structure 9 to 16 mm wide and only 2 to 4 mm thick as it takes off from the bone.8,20 There is a resulting discrepancy between the femoral footprint size and shape and the morphology of the native ACL, and placing a tunnel in the center of the footprint or “filling the footprint” with ACL graft may not reproduce the morphology or function of the native ACL. Given this size mismatch, strategic decisions need to be made to place the femoral tunnel in a specific region of the femoral footprint to optimize its function.
2. Histologic Findings
Histologic analysis has further clarified the relationship between the femoral footprint and functional aspects of the native ACL. The femoral origin of the ACL has distinct direct and indirect insertions, as demonstrated by histology and 3-dimensional volume-rendered computed tomography.21 The direct insertion consists of dense collagen fibers anterior in the footprint that is attached to a bony depression immediately posterior to the lateral intercondylar ridge.19 Sasaki and colleagues22 found that these direct fibers extended a mean (SD) of 5.3 (1.1) mm posteriorly but did not continue to the posterior femoral articular cartilage. The indirect insertion consists of more posterior collagen fibers that extend to and blend into the articular cartilage of the posterior aspect of the lateral femoral condyle. Mean (SD) width of this membrane-like tissue, located between the direct insertion and the posterior femoral articular cartilage, was found by Sasaki and colleagues22 to be 4.4 (0.5) mm anteroposteriorly(Figure 2). This anterior band of ACL tissue with the direct insertion histologically corresponds to the fibers in the anterior, more isometric region of the femoral footprint. Conversely, the more posterior band of fibers with its indirect insertion histologically corresponds to the more anisometric region and is seen macroscopically as a fanlike projection extending to the posterior articular cartilage.7

The dense collagen fibers of the direct insertion and the more membrane-like indirect insertion regions of the femoral footprint of the native ACL suggest that these regions have different load-sharing characteristics. The direct fibers of the insertion form a firm, fixed attachment that allows for gradual load distribution into the subchondral bone. From a biomechanical point of view, this attachment is extremely important, a key ligament–bone link transmitting mechanical load to the joint.23 A recent kinematic analysis revealed that the indirect fibers in the posterior region of the footprint, adjacent to the posterior articular cartilage, contribute minimally to restraint of tibial translation and rotations during stability examination.24 This suggests it may be strategically wise to place a tunnel in the direct insertion region of the footprint—eccentrically anterior (high) in the footprint rather than in the centrum.
3. Isometric Considerations
Forty years ago, Artmann and Wirth25 reported that a nearly isometric region existed in the femur such that there is minimal elongation of the native ACL during knee motion. The biomechanical rationale for choosing an isometric region of an ACL graft is that it will maintain function throughout the range of flexion and extension. A nonisometric graft would be expected to slacken during a large portion of the flexion cycle and not restrain anterior translation of the tibia, or, if fixed at the wrong flexion angle, it could capture the knee and cause graft failure by excessive tension. These 2 theoretical undesirable effects from nonisometric graft placement are supported by many experimental and clinical studies demonstrating that nonisometric femoral tunnel placement at time of surgery can cause recurrent anterior laxity of the knee.26-28 Multiple studies have further clarified that the isometric characteristics of an ACL graft are largely determined by femoral positioning. The most isometric region of the femoral footprint is consistently shown to be localized eccentrically within the footprint, in a relatively narrow bandlike region that is proximal (deep) and anterior (along the lateral intercondylar ridge within the footprint)19,29,30 (Figure 3).
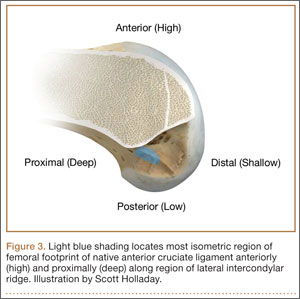
A large body of literature has demonstrated that a tunnel placed in the center of the femoral footprint is less isometric than a tunnel in the more anterior region.25,29,31,32 Indeed, the anterior position (high in the footprint) identified by Hefzy and colleagues29 demonstrated minimal anisometry with 1 to 4 mm of length change through the range of motion. In contrast, a central tunnel would be expected to demonstrate 5 to 7 mm of length change, whereas a lower graft (in the PL region of the footprint) would demonstrate about 1 cm of length change through the range of motion.31,32 As such, central grafts, or grafts placed in the PL portion of the femoral footprint, would be expected to see high tension or graft forces as the knee is flexed, or to lose tension completely if the graft is fixed at full extension.32
Importantly, Markolf and colleagues33 reported that the native ACL does not behave exactly in a so-called isometric fashion during the last 30° of extension. They showed that about 3 mm of retraction of a trial wire into the joint during the last 30° of extension (as measured with an isometer) is reasonable to achieve graft length changes approximating those of the intact ACL. Given this important caveat, a primary goal for ACLR is placement of the femoral tunnel within this isometric region so that the length change in the ACL graft is minimized to 3 mm from 30° to full flexion. In addition, results of a time-zero biomechanical study suggested better rotational control with anatomical femoral tunnel position than with an isometric femoral tunnel34 placed outside the femoral footprint. Therefore, maximizing isometry alone is not the goal; placing the graft in the most isometric region within the anatomical femoral footprint is desired. This isometric region in the footprint is in the histologic region that corresponds to the direct fibers. Again, this region is eccentrically located in the anterior (high) and proximal (deep) portion of the footprint.
4. Biomechanical Considerations
Multiple cadaveric studies have investigated the relationship between femoral tunnel positioning and time-zero stability. These studies often demonstrated superior time-zero control of knee stability, particularly in pivot type maneuvers, with a femoral tunnel placed more centrally in the femoral footprint than with a tunnel placed outside the footprint.34-37 However, an emerging body of literature is finding no significant difference in time-zero stability between an anteriorly placed femoral tunnel within the anatomical footprint (eccentrically located in the footprint) and a centrally placed graft.38,39 Returning to the more isometric tunnel position, still within the femoral footprint, would be expected to confer the benefits of an anatomically based graft position with the advantageous profile of improved isometry, as compared with a centrally placed or PL graft. Biomechanical studies40 have documented that ACL graft fibers placed posteriorly (low) in the footprint cause high graft forces in extension and, in some cases, graft rupture (Figure 4). Accordingly, the importance of reconstructing the posterior region of the footprint to better control time-zero stability is questioned.41
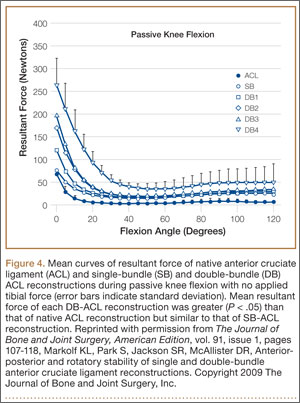
In addition to time-zero control of the stability examination, restoring the low tension-flexion pattern in the ACL graft to replicate the tension-flexion behavior of the native ACL is a fundamental biomechanical principle of ACLR.15,33,42,43 These studies have demonstrated that a femoral tunnel localized anterior (high) and proximal (deep) within the footprint better replicates the tension-flexion behavior of the native ACL, as compared with strategies that attempt to anatomically “fill the footprint.”40 Together, these studies have demonstrated that an eccentric position in the footprint, in the anterior (high) and proximal (deep) region, not only maximizes isometry and restores the direct fibers, but provides favorable time-zero stability and a low tension-flexion pattern biomechanically, particularly as compared with a tunnel in the more central or posterior region of the footprint.
5. Clinical Data
Clinical studies of the traditional transtibial ACLR have shown good results.44,45 However, when the tibial tunnel in the coronal plane was drilled vertical with respect to the medial joint line of the tibia, the transtibially placed femoral tunnel migrated anterior to the anatomical femoral footprint, often on the roof of the notch.10,14 This nonanatomical, vertical placement of the femoral tunnel led to failed normalization of knee kinematics.46-50 Indeed, a higher tension-flexion pattern was found in this nonanatomical “roof” position for the femoral tunnel as compared with the native ACL—a pattern that can result in either loss of flexion or recurrent instability.13,15,51
Clinical results of techniques used to create an anatomical ACLR centrally within the footprint have been mixed. Registry data showed that the revision rate at 4 years was higher with the AM portal technique (5.16%) than with transtibial drilling (3.20%).52 This higher rate may be associated with the more central placement of the femoral tunnel with the AM portal technique than with the transtibial technique, as shown in vivo with high-resolution magnetic resonance imaging.12 Recent reports have documented a higher rate of failure with DB or central ACLR approaches than with traditional transtibial techniques.53 As mentioned, in contrast to a more isometric position, a central femoral tunnel position would be expected to demonstrate 5 to 7 mm of length change, whereas moving the graft more posterior in the footprint (closer to the articular cartilage) would result in more than 1 cm of length change through the range of motion.31,32 As such, these more central grafts, or grafts placed even lower (more posterior) in the footprint, would be expected to see high tension in extension (if fixed in flexion), or to lose tension completely during flexion (if the graft is fixed at full extension).32 This may be a mechanistic cause of the high failure rate in the more posterior bundles of the DB approach.54
Together, these clinical data suggest that the femoral tunnel should be placed within the anatomical footprint of the ACL. However, within the footprint, a more eccentric femoral tunnel position capturing the isometric and direct region of the insertion may be preferable to a more central or posterior (low region) position.
Summary
Anatomical, histologic, isometric, biomechanical, and clinical data from more than 4 decades collectively point to an optimal position for the femoral tunnel within the femoral footprint. This position can be summarized by the acronym I.D.E.A.L., which refers to placing a femoral tunnel in a position that reproduces the Isometry of the native ACL, that covers the fibers of the Direct insertion histologically, that is Eccentrically located in the anterior (high) and proximal (deep) region of the footprint, that is Anatomical (within the footprint), and that replicates the Low tension-flexion pattern of the native ACL throughout the range of flexion and extension (Figure 5).
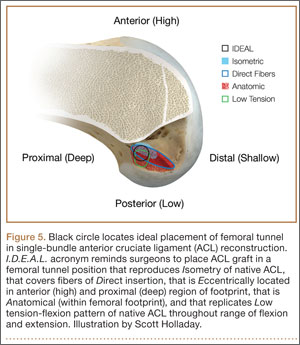
In vivo and in vitro studies as well as surgical experience suggest a need to avoid both (a) the nonanatomical vertical (roof) femoral tunnel placement that causes PCL impingement, high tension in the ACL graft in flexion, and ultimately graft stretch-out with instability and (b) the femoral tunnel placement in the posterior (lowest) region of the footprint that causes high tension in extension and can result in graft stretch-out with instability.13,15,39,40 The transtibial and AM portal techniques can both be effective in properly placing the femoral tunnel and restoring motion, stability, and function to the knee. Their effectiveness, however, depends on correct placement of the femoral tunnel. We think coming studies will focus on single-bundle ACLR and will be designed to improve the reliability of the transtibial and AM portal techniques for placing a femoral tunnel in keeping with the principles summarized by the I.D.E.A.L. acronym.
1. Siebold R. The concept of complete footprint restoration with guidelines for single- and double-bundle ACL reconstruction. Knee Surg Sports Traumatol Arthrosc. 2011;19(5):699-706.
2. Siebold R, Schuhmacher P. Restoration of the tibial ACL footprint area and geometry using the modified insertion site table. Knee Surg Sports Traumatol Arthrosc. 2012;20(9):1845-1849.
3. Piefer JW, Pflugner TR, Hwang MD, Lubowitz JH. Anterior cruciate ligament femoral footprint anatomy: systematic review of the 21st century literature. Arthroscopy. 2012;28(6):872-881.
4. Wilson AJ, Yasen SK, Nancoo T, Stannard R, Smith JO, Logan JS. Anatomic all-inside anterior cruciate ligament reconstruction using the translateral technique. Arthrosc Tech. 2013;2(2):e99-e104.
5. Colombet P, Robinson J, Christel P, et al. Morphology of anterior cruciate ligament attachments for anatomic reconstruction: a cadaveric dissection and radiographic study. Arthroscopy. 2006;22(9):984-992.
6. Harner CD, Baek GH, Vogrin TM, Carlin GJ, Kashiwaguchi S, Woo SL. Quantitative analysis of human cruciate ligament insertions. Arthroscopy. 1999;15(7):741-749.
7. Mochizuki T, Fujishiro H, Nimura A, et al. Anatomic and histologic analysis of the mid-substance and fan-like extension fibres of the anterior cruciate ligament during knee motion, with special reference to the femoral attachment. Knee Surg Sports Traumatol Arthrosc. 2014;22(2):336-344.
8. Siebold R, Schuhmacher P, Fernandez F, et al. Flat midsubstance of the anterior cruciate ligament with tibial “C”-shaped insertion site [published correction appears in Knee Surg Sports Traumatol Arthrosc. 2014 Aug 23. Epub ahead of print]. Knee Surg Sports Traumatol Arthrosc. 2014 May 20. [Epub ahead of print]
9. Triantafyllidi E, Paschos NK, Goussia A, et al. The shape and the thickness of the anterior cruciate ligament along its length in relation to the posterior cruciate ligament: a cadaveric study. Arthroscopy. 2013;29(12):1963-1973.
10. Arnold MP, Kooloos J, van Kampen A. Single-incision technique misses the anatomical femoral anterior cruciate ligament insertion: a cadaver study. Knee Surg Sports Traumatol Arthrosc. 2001;9(4):194-199.
11. Ayerza MA, Múscolo DL, Costa-Paz M, Makino A, Rondón L. Comparison of sagittal obliquity of the reconstructed anterior cruciate ligament with native anterior cruciate ligament using magnetic resonance imaging. Arthroscopy. 2003;19(3):257-261.
12. Bowers AL, Bedi A, Lipman JD, et al. Comparison of anterior cruciate ligament tunnel position and graft obliquity with transtibial and anteromedial portal femoral tunnel reaming techniques using high-resolution magnetic resonance imaging. Arthroscopy. 2011;27(11):1511-1522.
13. Howell SM, Gittins ME, Gottlieb JE, Traina SM, Zoellner TM. The relationship between the angle of the tibial tunnel in the coronal plane and loss of flexion and anterior laxity after anterior cruciate ligament reconstruction. Am J Sports Med. 2001;29(5):567-574.
14. Kopf S, Forsythe B, Wong AK, et al. Nonanatomic tunnel position in traditional transtibial single-bundle anterior cruciate ligament reconstruction evaluated by three-dimensional computed tomography. J Bone Joint Surg Am. 2010;92(6):1427-1431.
15. Simmons R, Howell SM, Hull ML. Effect of the angle of the femoral and tibial tunnels in the coronal plane and incremental excision of the posterior cruciate ligament on tension of an anterior cruciate ligament graft: an in vitro study. J Bone Joint Surg Am. 2003;85(6):1018-1029.
16. Stanford FC, Kendoff D, Warren RF, Pearle AD. Native anterior cruciate ligament obliquity versus anterior cruciate ligament graft obliquity: an observational study using navigated measurements. Am J Sports Med. 2009;37(1):114-119.
17. Ferretti M, Ekdahl M, Shen W, Fu FH. Osseous landmarks of the femoral attachment of the anterior cruciate ligament: an anatomic study. Arthroscopy. 2007;23(11):1218-1225.
18. Hutchinson MR, Ash SA. Resident’s ridge: assessing the cortical thickness of the lateral wall and roof of the intercondylar notch. Arthroscopy. 2003;19(9):931-935.
19. Fu FH, Jordan SS. The lateral intercondylar ridge—a key to anatomic anterior cruciate ligament reconstruction. J Bone Joint Surg Am. 2007;89(10):2103-2104.
20. Smigielski R, Zdanowicz U, Drwięga M, Ciszek B, Ciszkowska-Łysoń B, Siebold R. Ribbon like appearance of the midsubstance fibres of the anterior cruciate ligament close to its femoral insertion site: a cadaveric study including 111 knees. Knee Surg Sports Traumatol Arthrosc. 2014 Jun 28. [Epub ahead of print]
21. Iwahashi T, Shino K, Nakata K, et al. Direct anterior cruciate ligament insertion to the femur assessed by histology and 3-dimensional volume-rendered computed tomography. Arthroscopy. 2010;26(9 suppl):S13-S20.
22. Sasaki N, Ishibashi Y, Tsuda E, et al. The femoral insertion of the anterior cruciate ligament: discrepancy between macroscopic and histological observations. Arthroscopy. 2012;28(8):1135-1146.
23. Benjamin M, Moriggl B, Brenner E, Emery P, McGonagle D, Redman S. The “enthesis organ” concept: why enthesopathies may not present as focal insertional disorders. Arthritis Rheum. 2004;50(10):3306-3313.
24. Pathare NP, Nicholas SJ, Colbrunn R, McHugh MP. Kinematic analysis of the indirect femoral insertion of the anterior cruciate ligament: implications for anatomic femoral tunnel placement. Arthroscopy. 2014;30(11):1430-1438.
25. Artmann M, Wirth CJ. Investigation of the appropriate functional replacement of the anterior cruciate ligament (author’s transl) [in German]. Z Orthop Ihre Grenzgeb. 1974;112(1):160-165.
26. Amis AA, Jakob RP. Anterior cruciate ligament graft positioning, tensioning and twisting. Knee Surg Sports Traumatol Arthrosc. 1998;(6 suppl 1):S2-S12.
27. Beynnon BD, Uh BS, Johnson RJ, Fleming BC, Renström PA, Nichols CE. The elongation behavior of the anterior cruciate ligament graft in vivo. A long-term follow-up study. Am J Sports Med. 2001;29(2):161-166.
28. O’Meara PM, O’Brien WR, Henning CE. Anterior cruciate ligament reconstruction stability with continuous passive motion. The role of isometric graft placement. Clin Orthop. 1992;(277):201-209.
29. Hefzy MS, Grood ES, Noyes FR. Factors affecting the region of most isometric femoral attachments. Part II: the anterior cruciate ligament. Am J Sports Med. 1989;17(2):208-216.
30. Zavras TD, Race A, Bull AM, Amis AA. A comparative study of ‘isometric’ points for anterior cruciate ligament graft attachment. Knee Surg Sports Traumatol Arthrosc. 2001;9(1):28-33.
31. Pearle AD, Shannon FJ, Granchi C, Wickiewicz TL, Warren RF. Comparison of 3-dimensional obliquity and anisometric characteristics of anterior cruciate ligament graft positions using surgical navigation. Am J Sports Med. 2008;36(8):1534-1541.
32. Lubowitz JH. Anatomic ACL reconstruction produces greater graft length change during knee range-of-motion than transtibial technique. Knee Surg Sports Traumatol Arthrosc. 2014;22(5):1190-1195.
33. Markolf KL, Burchfield DM, Shapiro MM, Davis BR, Finerman GA, Slauterbeck JL. Biomechanical consequences of replacement of the anterior cruciate ligament with a patellar ligament allograft. Part I: insertion of the graft and anterior-posterior testing. J Bone Joint Surg Am. 1996;78(11):1720-1727.
34. Musahl V, Plakseychuk A, VanScyoc A, et al. Varying femoral tunnels between the anatomical footprint and isometric positions: effect on kinematics of the anterior cruciate ligament-reconstructed knee. Am J Sports Med. 2005;33(5):712-718.
35. Bedi A, Musahl V, Steuber V, et al. Transtibial versus anteromedial portal reaming in anterior cruciate ligament reconstruction: an anatomic and biomechanical evaluation of surgical technique. Arthroscopy. 2011;27(3):380-390.
36. Lim HC, Yoon YC, Wang JH, Bae JH. Anatomical versus non-anatomical single bundle anterior cruciate ligament reconstruction: a cadaveric study of comparison of knee stability. Clin Orthop Surg. 2012;4(4):249-255.
37. Loh JC, Fukuda Y, Tsuda E, Steadman RJ, Fu FH, Woo SL. Knee stability and graft function following anterior cruciate ligament reconstruction: comparison between 11 o’clock and 10 o’clock femoral tunnel placement. 2002 Richard O’Connor Award paper. Arthroscopy. 2003;19(3):297-304.
38. Cross MB, Musahl V, Bedi A, et al. Anteromedial versus central single-bundle graft position: which anatomic graft position to choose? Knee Surg Sports Traumatol Arthrosc. 2012;20(7):1276-1281.
39. Markolf KL, Jackson SR, McAllister DR. A comparison of 11 o’clock versus oblique femoral tunnels in the anterior cruciate ligament–reconstructed knee: knee kinematics during a simulated pivot test. Am J Sports Med. 2010;38(5):912-917.
40. Markolf KL, Park S, Jackson SR, McAllister DR. Anterior-posterior and rotatory stability of single and double-bundle anterior cruciate ligament reconstructions. J Bone Joint Surg Am. 2009;91(1):107-118.
41. Markolf KL, Park S, Jackson SR, McAllister DR. Contributions of the posterolateral bundle of the anterior cruciate ligament to anterior-posterior knee laxity and ligament forces. Arthroscopy. 2008;24(7):805-809.
42. Markolf KL, Burchfield DM, Shapiro MM, Cha CW, Finerman GA, Slauterbeck JL. Biomechanical consequences of replacement of the anterior cruciate ligament with a patellar ligament allograft. Part II: forces in the graft compared with forces in the intact ligament. J Bone Joint Surg Am. 1996;78(11):1728-1734.
43. Wallace MP, Howell SM, Hull ML. In vivo tensile behavior of a four-bundle hamstring graft as a replacement for the anterior cruciate ligament. J Orthop Res. 1997;15(4):539-545.
44. Harner CD, Marks PH, Fu FH, Irrgang JJ, Silby MB, Mengato R. Anterior cruciate ligament reconstruction: endoscopic versus two-incision technique. Arthroscopy. 1994;10(5):502-512.
45. Howell SM, Deutsch ML. Comparison of endoscopic and two-incision technique for reconstructing a torn anterior cruciate ligament using hamstring tendons. J Arthroscopy. 1999;15(6):594-606.
46. Chouliaras V, Ristanis S, Moraiti C, Stergiou N, Georgoulis AD. Effectiveness of reconstruction of the anterior cruciate ligament with quadrupled hamstrings and bone–patellar tendon–bone autografts: an in vivo study comparing tibial internal–external rotation. Am J Sports Med. 2007;35(2):189-196.
47. Logan MC, Williams A, Lavelle J, Gedroyc W, Freeman M. Tibiofemoral kinematics following successful anterior cruciate ligament reconstruction using dynamic multiple resonance imaging. Am J Sports Med. 2004;32(4):984-992.
48. Papannagari R, Gill TJ, Defrate LE, Moses JM, Petruska AJ, Li G. In vivo kinematics of the knee after anterior cruciate ligament reconstruction: a clinical and functional evaluation. Am J Sports Med. 2006;34(12):2006-2012.
49. Tashman S, Collon D, Anderson K, Kolowich P, Anderst W. Abnormal rotational knee motion during running after anterior cruciate ligament reconstruction. Am J Sports Med. 2004;32(4):975-983.
50. Tashman S, Kolowich P, Collon D, Anderson K, Anderst W. Dynamic function of the ACL-reconstructed knee during running. Clin Orthop. 2007;(454):66-73.
51. Wallace MP, Hull ML, Howell SM. Can an isometer predict the tensile behavior of a double-looped hamstring graft during anterior cruciate ligament reconstruction? J Orthop Res. 1998;16(3):386-393.
52. Rahr-Wagner L, Thillemann TM, Pedersen AB, Lind MC. Increased risk of revision after anteromedial compared with transtibial drilling of the femoral tunnel during primary anterior cruciate ligament reconstruction: results from the Danish Knee Ligament Reconstruction Register. Arthroscopy. 2013;29(1):98-105.
53. van Eck CF, Schkrohowsky JG, Working ZM, Irrgang JJ, Fu FH. Prospective analysis of failure rate and predictors of failure after anatomic anterior cruciate ligament reconstruction with allograft. Am J Sports Med. 2012;40(4):800-807.
54. Ahn JH, Choi SH, Wang JH, Yoo JC, Yim HS, Chang MJ. Outcomes and second-look arthroscopic evaluation after double-bundle anterior cruciate ligament reconstruction with use of a single tibial tunnel. J Bone Joint Surg Am. 2011;93(20):1865-1872.
In the United States, surgeons perform an estimated 200,000 anterior cruciate ligament reconstructions (ACLRs) each year. Over the past decade, there has been a surge in interest in defining anterior cruciate ligament (ACL) anatomy to guide ACLR. With this renewed interest in the anatomical features of the ACL, particularly the insertion site, many authors have advocated an approach for complete or near-complete “footprint restoration” for anatomical ACLR.1,2 Some have recommended a double-bundle (DB) technique that completely “fills” the footprint, but it is seldom used. Others have proposed centralizing the femoral tunnel position within the ACL footprint in the hope of capturing the function of both the anteromedial (AM) and posterolateral (PL) bundles.1,3,4 Indeed, a primary surgical goal of most anatomical ACLR techniques is creation of a femoral tunnel based off the anatomical centrum (center point) of the ACL femoral footprint.3,5 With a single-bundle technique, the femoral socket is localized in the center of the entire footprint; with a DB technique, sockets are created in the centrums of both the AM and PL bundles.
Because of the complex shape of the native ACL, however, the strategy of restoring the femoral footprint with use of either a central tunnel or a DB approach has been challenged. The femoral footprint is 3.5 times larger than the midsubstance of the ACL.6 Detailed anatomical dissections have recently demonstrated that the femoral origin of the ACL has a stout anterior band of fibers with a fanlike extension posteriorly.7 As the ACL fibers extend off the bony footprint, they form a flat, ribbonlike structure 9 to 16 mm wide and only 2 to 4 mm thick.2,8 Within this structure, there is no clear separation of the AM and PL bundles. The presence of this structure makes sense given the anatomical constraints inherent in the notch. Indeed, the space for the native ACL is narrow, as the posterior cruciate ligament (PCL) occupies that largest portion of the notch with the knee in full extension, leaving only a thin, 5-mm slot through which the ACL must pass.9 Therefore, filling the femoral footprint with a tubular ACL graft probably does not reproduce the dynamic 3-dimensional morphology of the ACL.
In light of the discrepancy between the sizes of the femoral footprint and the midsubstance of the native ACL, it seems reasonable that optimizing the position of the ACL femoral tunnel may be more complex than simply centralizing the tunnel within the footprint or attempting to maximize footprint coverage. In this article, we amalgamate the lessons of 4 decades of ACL research into 5 points for strategic femoral tunnel positioning, based on anatomical, histologic, isometric, biomechanical, and clinical data. These points are summarized by the acronym I.D.E.A.L., which refers to placing a femoral tunnel in a position that reproduces the Isometry of the native ACL, that covers the fibers of the Direct insertion histologically, that is Eccentrically located in the anterior (high) and proximal (deep) region of the footprint, that is Anatomical (within the footprint), and that replicates the Low tension-flexion pattern of the native ACL throughout the range of flexion and extension.
1. Anatomy Considerations
In response to study results demonstrating that some transtibial ACLRs were associated with nonanatomical placement of the femoral tunnel—resulting in vertical graft placement, PCL impingement, and recurrent rotational instability10-16—investigators have reexamined both the anatomy of the femoral origin of the native ACL and the ACL graft. Specifically, a large body of research has been devoted to characterizing the osseous landmarks of the femoral origin of the ACL17 and the dimensions of the femoral footprint.3 In addition, authors have supported the concept that the ACL contains 2 functional bundles, AM and PL.5,17 Several osseous landmarks have been identified as defining the boundaries of the femoral footprint. The lateral intercondylar ridge is the most anterior aspect of the femoral footprint and was first defined by Clancy.18 More recently, the lateral bifurcate ridge, which separates the AM and PL bundle insertion sites, was described19 (Figure 1A).
These osseous ridges delineate the location of the femoral footprint. Studies have shown that ACL fibers attach from the lateral intercondylar ridge on the anterior border of the femoral footprint and extend posteriorly to the cartilage of the lateral femoral condyle (Figure 1B).
ACL fibers from this oblong footprint are organized such that the midsubstance of the ACL is narrower than the femoral footprint. Anatomical dissections have demonstrated that, though the femoral footprint is oval, the native ACL forms a flat, ribbonlike structure 9 to 16 mm wide and only 2 to 4 mm thick as it takes off from the bone.8,20 There is a resulting discrepancy between the femoral footprint size and shape and the morphology of the native ACL, and placing a tunnel in the center of the footprint or “filling the footprint” with ACL graft may not reproduce the morphology or function of the native ACL. Given this size mismatch, strategic decisions need to be made to place the femoral tunnel in a specific region of the femoral footprint to optimize its function.
2. Histologic Findings
Histologic analysis has further clarified the relationship between the femoral footprint and functional aspects of the native ACL. The femoral origin of the ACL has distinct direct and indirect insertions, as demonstrated by histology and 3-dimensional volume-rendered computed tomography.21 The direct insertion consists of dense collagen fibers anterior in the footprint that is attached to a bony depression immediately posterior to the lateral intercondylar ridge.19 Sasaki and colleagues22 found that these direct fibers extended a mean (SD) of 5.3 (1.1) mm posteriorly but did not continue to the posterior femoral articular cartilage. The indirect insertion consists of more posterior collagen fibers that extend to and blend into the articular cartilage of the posterior aspect of the lateral femoral condyle. Mean (SD) width of this membrane-like tissue, located between the direct insertion and the posterior femoral articular cartilage, was found by Sasaki and colleagues22 to be 4.4 (0.5) mm anteroposteriorly(Figure 2). This anterior band of ACL tissue with the direct insertion histologically corresponds to the fibers in the anterior, more isometric region of the femoral footprint. Conversely, the more posterior band of fibers with its indirect insertion histologically corresponds to the more anisometric region and is seen macroscopically as a fanlike projection extending to the posterior articular cartilage.7
The dense collagen fibers of the direct insertion and the more membrane-like indirect insertion regions of the femoral footprint of the native ACL suggest that these regions have different load-sharing characteristics. The direct fibers of the insertion form a firm, fixed attachment that allows for gradual load distribution into the subchondral bone. From a biomechanical point of view, this attachment is extremely important, a key ligament–bone link transmitting mechanical load to the joint.23 A recent kinematic analysis revealed that the indirect fibers in the posterior region of the footprint, adjacent to the posterior articular cartilage, contribute minimally to restraint of tibial translation and rotations during stability examination.24 This suggests it may be strategically wise to place a tunnel in the direct insertion region of the footprint—eccentrically anterior (high) in the footprint rather than in the centrum.
3. Isometric Considerations
Forty years ago, Artmann and Wirth25 reported that a nearly isometric region existed in the femur such that there is minimal elongation of the native ACL during knee motion. The biomechanical rationale for choosing an isometric region of an ACL graft is that it will maintain function throughout the range of flexion and extension. A nonisometric graft would be expected to slacken during a large portion of the flexion cycle and not restrain anterior translation of the tibia, or, if fixed at the wrong flexion angle, it could capture the knee and cause graft failure by excessive tension. These 2 theoretical undesirable effects from nonisometric graft placement are supported by many experimental and clinical studies demonstrating that nonisometric femoral tunnel placement at time of surgery can cause recurrent anterior laxity of the knee.26-28 Multiple studies have further clarified that the isometric characteristics of an ACL graft are largely determined by femoral positioning. The most isometric region of the femoral footprint is consistently shown to be localized eccentrically within the footprint, in a relatively narrow bandlike region that is proximal (deep) and anterior (along the lateral intercondylar ridge within the footprint)19,29,30 (Figure 3).
A large body of literature has demonstrated that a tunnel placed in the center of the femoral footprint is less isometric than a tunnel in the more anterior region.25,29,31,32 Indeed, the anterior position (high in the footprint) identified by Hefzy and colleagues29 demonstrated minimal anisometry with 1 to 4 mm of length change through the range of motion. In contrast, a central tunnel would be expected to demonstrate 5 to 7 mm of length change, whereas a lower graft (in the PL region of the footprint) would demonstrate about 1 cm of length change through the range of motion.31,32 As such, central grafts, or grafts placed in the PL portion of the femoral footprint, would be expected to see high tension or graft forces as the knee is flexed, or to lose tension completely if the graft is fixed at full extension.32
Importantly, Markolf and colleagues33 reported that the native ACL does not behave exactly in a so-called isometric fashion during the last 30° of extension. They showed that about 3 mm of retraction of a trial wire into the joint during the last 30° of extension (as measured with an isometer) is reasonable to achieve graft length changes approximating those of the intact ACL. Given this important caveat, a primary goal for ACLR is placement of the femoral tunnel within this isometric region so that the length change in the ACL graft is minimized to 3 mm from 30° to full flexion. In addition, results of a time-zero biomechanical study suggested better rotational control with anatomical femoral tunnel position than with an isometric femoral tunnel34 placed outside the femoral footprint. Therefore, maximizing isometry alone is not the goal; placing the graft in the most isometric region within the anatomical femoral footprint is desired. This isometric region in the footprint is in the histologic region that corresponds to the direct fibers. Again, this region is eccentrically located in the anterior (high) and proximal (deep) portion of the footprint.
4. Biomechanical Considerations
Multiple cadaveric studies have investigated the relationship between femoral tunnel positioning and time-zero stability. These studies often demonstrated superior time-zero control of knee stability, particularly in pivot type maneuvers, with a femoral tunnel placed more centrally in the femoral footprint than with a tunnel placed outside the footprint.34-37 However, an emerging body of literature is finding no significant difference in time-zero stability between an anteriorly placed femoral tunnel within the anatomical footprint (eccentrically located in the footprint) and a centrally placed graft.38,39 Returning to the more isometric tunnel position, still within the femoral footprint, would be expected to confer the benefits of an anatomically based graft position with the advantageous profile of improved isometry, as compared with a centrally placed or PL graft. Biomechanical studies40 have documented that ACL graft fibers placed posteriorly (low) in the footprint cause high graft forces in extension and, in some cases, graft rupture (Figure 4). Accordingly, the importance of reconstructing the posterior region of the footprint to better control time-zero stability is questioned.41
In addition to time-zero control of the stability examination, restoring the low tension-flexion pattern in the ACL graft to replicate the tension-flexion behavior of the native ACL is a fundamental biomechanical principle of ACLR.15,33,42,43 These studies have demonstrated that a femoral tunnel localized anterior (high) and proximal (deep) within the footprint better replicates the tension-flexion behavior of the native ACL, as compared with strategies that attempt to anatomically “fill the footprint.”40 Together, these studies have demonstrated that an eccentric position in the footprint, in the anterior (high) and proximal (deep) region, not only maximizes isometry and restores the direct fibers, but provides favorable time-zero stability and a low tension-flexion pattern biomechanically, particularly as compared with a tunnel in the more central or posterior region of the footprint.
5. Clinical Data
Clinical studies of the traditional transtibial ACLR have shown good results.44,45 However, when the tibial tunnel in the coronal plane was drilled vertical with respect to the medial joint line of the tibia, the transtibially placed femoral tunnel migrated anterior to the anatomical femoral footprint, often on the roof of the notch.10,14 This nonanatomical, vertical placement of the femoral tunnel led to failed normalization of knee kinematics.46-50 Indeed, a higher tension-flexion pattern was found in this nonanatomical “roof” position for the femoral tunnel as compared with the native ACL—a pattern that can result in either loss of flexion or recurrent instability.13,15,51
Clinical results of techniques used to create an anatomical ACLR centrally within the footprint have been mixed. Registry data showed that the revision rate at 4 years was higher with the AM portal technique (5.16%) than with transtibial drilling (3.20%).52 This higher rate may be associated with the more central placement of the femoral tunnel with the AM portal technique than with the transtibial technique, as shown in vivo with high-resolution magnetic resonance imaging.12 Recent reports have documented a higher rate of failure with DB or central ACLR approaches than with traditional transtibial techniques.53 As mentioned, in contrast to a more isometric position, a central femoral tunnel position would be expected to demonstrate 5 to 7 mm of length change, whereas moving the graft more posterior in the footprint (closer to the articular cartilage) would result in more than 1 cm of length change through the range of motion.31,32 As such, these more central grafts, or grafts placed even lower (more posterior) in the footprint, would be expected to see high tension in extension (if fixed in flexion), or to lose tension completely during flexion (if the graft is fixed at full extension).32 This may be a mechanistic cause of the high failure rate in the more posterior bundles of the DB approach.54
Together, these clinical data suggest that the femoral tunnel should be placed within the anatomical footprint of the ACL. However, within the footprint, a more eccentric femoral tunnel position capturing the isometric and direct region of the insertion may be preferable to a more central or posterior (low region) position.
Summary
Anatomical, histologic, isometric, biomechanical, and clinical data from more than 4 decades collectively point to an optimal position for the femoral tunnel within the femoral footprint. This position can be summarized by the acronym I.D.E.A.L., which refers to placing a femoral tunnel in a position that reproduces the Isometry of the native ACL, that covers the fibers of the Direct insertion histologically, that is Eccentrically located in the anterior (high) and proximal (deep) region of the footprint, that is Anatomical (within the footprint), and that replicates the Low tension-flexion pattern of the native ACL throughout the range of flexion and extension (Figure 5).
In vivo and in vitro studies as well as surgical experience suggest a need to avoid both (a) the nonanatomical vertical (roof) femoral tunnel placement that causes PCL impingement, high tension in the ACL graft in flexion, and ultimately graft stretch-out with instability and (b) the femoral tunnel placement in the posterior (lowest) region of the footprint that causes high tension in extension and can result in graft stretch-out with instability.13,15,39,40 The transtibial and AM portal techniques can both be effective in properly placing the femoral tunnel and restoring motion, stability, and function to the knee. Their effectiveness, however, depends on correct placement of the femoral tunnel. We think coming studies will focus on single-bundle ACLR and will be designed to improve the reliability of the transtibial and AM portal techniques for placing a femoral tunnel in keeping with the principles summarized by the I.D.E.A.L. acronym.
1. Siebold R. The concept of complete footprint restoration with guidelines for single- and double-bundle ACL reconstruction. Knee Surg Sports Traumatol Arthrosc. 2011;19(5):699-706.
2. Siebold R, Schuhmacher P. Restoration of the tibial ACL footprint area and geometry using the modified insertion site table. Knee Surg Sports Traumatol Arthrosc. 2012;20(9):1845-1849.
3. Piefer JW, Pflugner TR, Hwang MD, Lubowitz JH. Anterior cruciate ligament femoral footprint anatomy: systematic review of the 21st century literature. Arthroscopy. 2012;28(6):872-881.
4. Wilson AJ, Yasen SK, Nancoo T, Stannard R, Smith JO, Logan JS. Anatomic all-inside anterior cruciate ligament reconstruction using the translateral technique. Arthrosc Tech. 2013;2(2):e99-e104.
5. Colombet P, Robinson J, Christel P, et al. Morphology of anterior cruciate ligament attachments for anatomic reconstruction: a cadaveric dissection and radiographic study. Arthroscopy. 2006;22(9):984-992.
6. Harner CD, Baek GH, Vogrin TM, Carlin GJ, Kashiwaguchi S, Woo SL. Quantitative analysis of human cruciate ligament insertions. Arthroscopy. 1999;15(7):741-749.
7. Mochizuki T, Fujishiro H, Nimura A, et al. Anatomic and histologic analysis of the mid-substance and fan-like extension fibres of the anterior cruciate ligament during knee motion, with special reference to the femoral attachment. Knee Surg Sports Traumatol Arthrosc. 2014;22(2):336-344.
8. Siebold R, Schuhmacher P, Fernandez F, et al. Flat midsubstance of the anterior cruciate ligament with tibial “C”-shaped insertion site [published correction appears in Knee Surg Sports Traumatol Arthrosc. 2014 Aug 23. Epub ahead of print]. Knee Surg Sports Traumatol Arthrosc. 2014 May 20. [Epub ahead of print]
9. Triantafyllidi E, Paschos NK, Goussia A, et al. The shape and the thickness of the anterior cruciate ligament along its length in relation to the posterior cruciate ligament: a cadaveric study. Arthroscopy. 2013;29(12):1963-1973.
10. Arnold MP, Kooloos J, van Kampen A. Single-incision technique misses the anatomical femoral anterior cruciate ligament insertion: a cadaver study. Knee Surg Sports Traumatol Arthrosc. 2001;9(4):194-199.
11. Ayerza MA, Múscolo DL, Costa-Paz M, Makino A, Rondón L. Comparison of sagittal obliquity of the reconstructed anterior cruciate ligament with native anterior cruciate ligament using magnetic resonance imaging. Arthroscopy. 2003;19(3):257-261.
12. Bowers AL, Bedi A, Lipman JD, et al. Comparison of anterior cruciate ligament tunnel position and graft obliquity with transtibial and anteromedial portal femoral tunnel reaming techniques using high-resolution magnetic resonance imaging. Arthroscopy. 2011;27(11):1511-1522.
13. Howell SM, Gittins ME, Gottlieb JE, Traina SM, Zoellner TM. The relationship between the angle of the tibial tunnel in the coronal plane and loss of flexion and anterior laxity after anterior cruciate ligament reconstruction. Am J Sports Med. 2001;29(5):567-574.
14. Kopf S, Forsythe B, Wong AK, et al. Nonanatomic tunnel position in traditional transtibial single-bundle anterior cruciate ligament reconstruction evaluated by three-dimensional computed tomography. J Bone Joint Surg Am. 2010;92(6):1427-1431.
15. Simmons R, Howell SM, Hull ML. Effect of the angle of the femoral and tibial tunnels in the coronal plane and incremental excision of the posterior cruciate ligament on tension of an anterior cruciate ligament graft: an in vitro study. J Bone Joint Surg Am. 2003;85(6):1018-1029.
16. Stanford FC, Kendoff D, Warren RF, Pearle AD. Native anterior cruciate ligament obliquity versus anterior cruciate ligament graft obliquity: an observational study using navigated measurements. Am J Sports Med. 2009;37(1):114-119.
17. Ferretti M, Ekdahl M, Shen W, Fu FH. Osseous landmarks of the femoral attachment of the anterior cruciate ligament: an anatomic study. Arthroscopy. 2007;23(11):1218-1225.
18. Hutchinson MR, Ash SA. Resident’s ridge: assessing the cortical thickness of the lateral wall and roof of the intercondylar notch. Arthroscopy. 2003;19(9):931-935.
19. Fu FH, Jordan SS. The lateral intercondylar ridge—a key to anatomic anterior cruciate ligament reconstruction. J Bone Joint Surg Am. 2007;89(10):2103-2104.
20. Smigielski R, Zdanowicz U, Drwięga M, Ciszek B, Ciszkowska-Łysoń B, Siebold R. Ribbon like appearance of the midsubstance fibres of the anterior cruciate ligament close to its femoral insertion site: a cadaveric study including 111 knees. Knee Surg Sports Traumatol Arthrosc. 2014 Jun 28. [Epub ahead of print]
21. Iwahashi T, Shino K, Nakata K, et al. Direct anterior cruciate ligament insertion to the femur assessed by histology and 3-dimensional volume-rendered computed tomography. Arthroscopy. 2010;26(9 suppl):S13-S20.
22. Sasaki N, Ishibashi Y, Tsuda E, et al. The femoral insertion of the anterior cruciate ligament: discrepancy between macroscopic and histological observations. Arthroscopy. 2012;28(8):1135-1146.
23. Benjamin M, Moriggl B, Brenner E, Emery P, McGonagle D, Redman S. The “enthesis organ” concept: why enthesopathies may not present as focal insertional disorders. Arthritis Rheum. 2004;50(10):3306-3313.
24. Pathare NP, Nicholas SJ, Colbrunn R, McHugh MP. Kinematic analysis of the indirect femoral insertion of the anterior cruciate ligament: implications for anatomic femoral tunnel placement. Arthroscopy. 2014;30(11):1430-1438.
25. Artmann M, Wirth CJ. Investigation of the appropriate functional replacement of the anterior cruciate ligament (author’s transl) [in German]. Z Orthop Ihre Grenzgeb. 1974;112(1):160-165.
26. Amis AA, Jakob RP. Anterior cruciate ligament graft positioning, tensioning and twisting. Knee Surg Sports Traumatol Arthrosc. 1998;(6 suppl 1):S2-S12.
27. Beynnon BD, Uh BS, Johnson RJ, Fleming BC, Renström PA, Nichols CE. The elongation behavior of the anterior cruciate ligament graft in vivo. A long-term follow-up study. Am J Sports Med. 2001;29(2):161-166.
28. O’Meara PM, O’Brien WR, Henning CE. Anterior cruciate ligament reconstruction stability with continuous passive motion. The role of isometric graft placement. Clin Orthop. 1992;(277):201-209.
29. Hefzy MS, Grood ES, Noyes FR. Factors affecting the region of most isometric femoral attachments. Part II: the anterior cruciate ligament. Am J Sports Med. 1989;17(2):208-216.
30. Zavras TD, Race A, Bull AM, Amis AA. A comparative study of ‘isometric’ points for anterior cruciate ligament graft attachment. Knee Surg Sports Traumatol Arthrosc. 2001;9(1):28-33.
31. Pearle AD, Shannon FJ, Granchi C, Wickiewicz TL, Warren RF. Comparison of 3-dimensional obliquity and anisometric characteristics of anterior cruciate ligament graft positions using surgical navigation. Am J Sports Med. 2008;36(8):1534-1541.
32. Lubowitz JH. Anatomic ACL reconstruction produces greater graft length change during knee range-of-motion than transtibial technique. Knee Surg Sports Traumatol Arthrosc. 2014;22(5):1190-1195.
33. Markolf KL, Burchfield DM, Shapiro MM, Davis BR, Finerman GA, Slauterbeck JL. Biomechanical consequences of replacement of the anterior cruciate ligament with a patellar ligament allograft. Part I: insertion of the graft and anterior-posterior testing. J Bone Joint Surg Am. 1996;78(11):1720-1727.
34. Musahl V, Plakseychuk A, VanScyoc A, et al. Varying femoral tunnels between the anatomical footprint and isometric positions: effect on kinematics of the anterior cruciate ligament-reconstructed knee. Am J Sports Med. 2005;33(5):712-718.
35. Bedi A, Musahl V, Steuber V, et al. Transtibial versus anteromedial portal reaming in anterior cruciate ligament reconstruction: an anatomic and biomechanical evaluation of surgical technique. Arthroscopy. 2011;27(3):380-390.
36. Lim HC, Yoon YC, Wang JH, Bae JH. Anatomical versus non-anatomical single bundle anterior cruciate ligament reconstruction: a cadaveric study of comparison of knee stability. Clin Orthop Surg. 2012;4(4):249-255.
37. Loh JC, Fukuda Y, Tsuda E, Steadman RJ, Fu FH, Woo SL. Knee stability and graft function following anterior cruciate ligament reconstruction: comparison between 11 o’clock and 10 o’clock femoral tunnel placement. 2002 Richard O’Connor Award paper. Arthroscopy. 2003;19(3):297-304.
38. Cross MB, Musahl V, Bedi A, et al. Anteromedial versus central single-bundle graft position: which anatomic graft position to choose? Knee Surg Sports Traumatol Arthrosc. 2012;20(7):1276-1281.
39. Markolf KL, Jackson SR, McAllister DR. A comparison of 11 o’clock versus oblique femoral tunnels in the anterior cruciate ligament–reconstructed knee: knee kinematics during a simulated pivot test. Am J Sports Med. 2010;38(5):912-917.
40. Markolf KL, Park S, Jackson SR, McAllister DR. Anterior-posterior and rotatory stability of single and double-bundle anterior cruciate ligament reconstructions. J Bone Joint Surg Am. 2009;91(1):107-118.
41. Markolf KL, Park S, Jackson SR, McAllister DR. Contributions of the posterolateral bundle of the anterior cruciate ligament to anterior-posterior knee laxity and ligament forces. Arthroscopy. 2008;24(7):805-809.
42. Markolf KL, Burchfield DM, Shapiro MM, Cha CW, Finerman GA, Slauterbeck JL. Biomechanical consequences of replacement of the anterior cruciate ligament with a patellar ligament allograft. Part II: forces in the graft compared with forces in the intact ligament. J Bone Joint Surg Am. 1996;78(11):1728-1734.
43. Wallace MP, Howell SM, Hull ML. In vivo tensile behavior of a four-bundle hamstring graft as a replacement for the anterior cruciate ligament. J Orthop Res. 1997;15(4):539-545.
44. Harner CD, Marks PH, Fu FH, Irrgang JJ, Silby MB, Mengato R. Anterior cruciate ligament reconstruction: endoscopic versus two-incision technique. Arthroscopy. 1994;10(5):502-512.
45. Howell SM, Deutsch ML. Comparison of endoscopic and two-incision technique for reconstructing a torn anterior cruciate ligament using hamstring tendons. J Arthroscopy. 1999;15(6):594-606.
46. Chouliaras V, Ristanis S, Moraiti C, Stergiou N, Georgoulis AD. Effectiveness of reconstruction of the anterior cruciate ligament with quadrupled hamstrings and bone–patellar tendon–bone autografts: an in vivo study comparing tibial internal–external rotation. Am J Sports Med. 2007;35(2):189-196.
47. Logan MC, Williams A, Lavelle J, Gedroyc W, Freeman M. Tibiofemoral kinematics following successful anterior cruciate ligament reconstruction using dynamic multiple resonance imaging. Am J Sports Med. 2004;32(4):984-992.
48. Papannagari R, Gill TJ, Defrate LE, Moses JM, Petruska AJ, Li G. In vivo kinematics of the knee after anterior cruciate ligament reconstruction: a clinical and functional evaluation. Am J Sports Med. 2006;34(12):2006-2012.
49. Tashman S, Collon D, Anderson K, Kolowich P, Anderst W. Abnormal rotational knee motion during running after anterior cruciate ligament reconstruction. Am J Sports Med. 2004;32(4):975-983.
50. Tashman S, Kolowich P, Collon D, Anderson K, Anderst W. Dynamic function of the ACL-reconstructed knee during running. Clin Orthop. 2007;(454):66-73.
51. Wallace MP, Hull ML, Howell SM. Can an isometer predict the tensile behavior of a double-looped hamstring graft during anterior cruciate ligament reconstruction? J Orthop Res. 1998;16(3):386-393.
52. Rahr-Wagner L, Thillemann TM, Pedersen AB, Lind MC. Increased risk of revision after anteromedial compared with transtibial drilling of the femoral tunnel during primary anterior cruciate ligament reconstruction: results from the Danish Knee Ligament Reconstruction Register. Arthroscopy. 2013;29(1):98-105.
53. van Eck CF, Schkrohowsky JG, Working ZM, Irrgang JJ, Fu FH. Prospective analysis of failure rate and predictors of failure after anatomic anterior cruciate ligament reconstruction with allograft. Am J Sports Med. 2012;40(4):800-807.
54. Ahn JH, Choi SH, Wang JH, Yoo JC, Yim HS, Chang MJ. Outcomes and second-look arthroscopic evaluation after double-bundle anterior cruciate ligament reconstruction with use of a single tibial tunnel. J Bone Joint Surg Am. 2011;93(20):1865-1872.
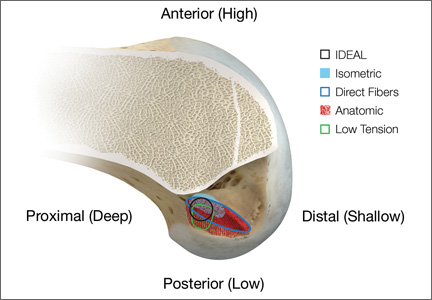
Alignment Analyses in the Varus Osteoarthritic Knee Using Computer Navigation
Osteoarthritic (OA) knees with varus deformities commonly present with tight, contracted medial collateral ligaments and soft-tissue sleeves.1 More severe varus deformities require more extensive medial releases on the concave side to optimize flexion-extension gaps. Excessive soft-tissue releases in milder varus deformities can result in medial instability in flexion and extension.2-4 Misjudgments in soft-tissue release can therefore lead to knee instability, an important cause of early total knee arthroplasty (TKA) failures.2,5,6 Some authors have reported difficulty in coronal plane balancing in knees with preoperative varus deformity of more than 20°.4,7
Surgeons often refer to varus as a description of coronal malalignment, mainly with the knee in extension. In the surgical setting, however, descriptions are given regarding differential medial soft-tissue tightness in extension and flexion. Balancing the knee in extension may not necessarily balance the knee in flexion. Thus, there is the concept of extension and flexion varus, which has not been well described in the literature. Releases on the anterior medial and posterior medial aspects of the proximal tibia have differential effects on flexion and extension gaps, respectively.2
Intraoperative alignment certainly has a pivotal role in component longevity.8 Since its advent in the 1990s, use of computer navigation in TKA has offered new hope for improving component alignment. Some authors routinely use computer navigation for intraoperative soft-tissue releases.9 A recent meta-analysis found that computer-navigated surgery is associated with fewer outliers in final component alignment compared with conventional TKA.10
Increased use of computer navigation in TKA at our institution in recent years has come with the observation that knees with severe extension varus seem to have correspondingly more severe flexion varus. Before computer navigation, coronal alignment of knees in flexion was almost impossible to measure because of the spatial alignment of the knees in that position.
We conducted a study to evaluate the relationship of extension and flexion varus in OA knees and to determine whether severity of fixed flexion deformity (FFD) in the sagittal plane correlates with severity of coronal plane varus deformity. We hypothesized that there would be differential varus in flexion and extension and that increasing knee extension varus would correlate closely with knee flexion varus beyond a certain tibiofemoral angle. We also hypothesized that severity of sagittal plane deformity will correlate with the severity of coronal plane deformity.
Patients and Methods
Data Collection
After this study was approved by our institution’s ethics review committee, we prospectively collected data from 403 consecutive computer-navigated TKAs performed at our institution between November 2008 and August 2011. Dr. Tan, who was not the primary physician, retrospectively analyzed the radiographic and navigation data.
Each patient’s knee varus-valgus angles were captured by Dr. Teo, an adult reconstruction surgeon, in standard fashion from maximal extension to 0º, 30º, 45º, 60º, 90º, and maximal flexion. An example of standard data capture appears in Table 1. With varus-hyperextension defined as –0.5° or less (more negative), neutral as 0°, and valgus-flexion as 0.5° or more, there were 362 varus knees, 41 valgus knees, and no neutral knees.
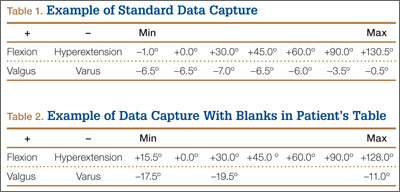
Study inclusion criteria were OA and varus deformity. Exclusion criteria were rheumatoid arthritis, other types of inflammatory arthritis, neuromuscular disorders, knees with valgus angulation, and incomplete data (Table 2). Figure 1 summarizes the inclusion/exclusion process, which left 317 knees available for study. Cases of incomplete data were likely due to computer errors or to inadvertent movement when navigation data were being acquired during surgery.
![]()
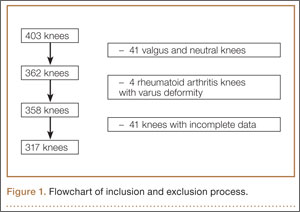
In conventional TKA, the main objective is to equalize flexion-extension gaps with knee at 90° flexion and 0° extension. The ability to achieve this often implies the knee will be balanced throughout its range of motion (ROM). From the data for the 317 study knees, 3 sets of values were extracted: varus angles from maximal knee extension (extension varus), varus angles from 90° knee flexion (flexion varus), and maximal knee extension. All knees were able to achieve 90° flexion.
Power Calculation
Our analysis used a correlation coefficient (r) of at least 0.5 at a 5% level of significance and power of 80%. With 317 knees, the study was more than adequately powered for significance.
Surgical and Navigation Technique
All patients underwent either general or regional anesthesia for their surgeries, which were performed by Dr. Teo. Standard medial parapatellar arthrotomy was performed. Navigation pins were then inserted into the femur and tibia outside the knee wound. Anatomical reference points were digitized per routine navigation requirements. (The reference for varus-valgus alignment of the femur is the mechanical femur axis defined by the digitized hip center and knee center, and the reference for varus-valgus alignment of the tibia is the mechanical tibia axis defined by the digitized tibia center and calculated ankle center. The ankle center is calculated by dividing the digitized transmalleolar axis according to a ratio of 56% lateral to 44% medial with the inherent navigation software.) Our institution uses an imageless navigation system (Navigation System II; Stryker Orthopedics, Mahwah, New Jersey).
The leg was then brought from maximal knee extension to maximal knee flexion to assess preoperative ROM, which indicates inherent flexion contracture or hyperextension. Varus-valgus measurements of the knee were then generated as part of the navigation software protocol. These measurements were obtained without additional varus or valgus stress applied to the knee and before any bony resection. The rest of the operation was completed using navigation to guide bony resection and soft-tissue balancing. The final components used were all cemented cruciate-substituting TKA implants. After component insertion, the knee was again brought through ROM from maximal knee extension to maximal knee flexion to assess postoperative ROM before wound closure.
Extension and Flexion Varus
As none of the patients in the flexion varus dataset (range, –0.5° to –19°) had a varus deformity of more than 20° at 90° flexion, we used a cutoff of 10° to divide these patients into 2 subgroups: less than 10° (237 knees) and 10° or more (80 knees). The extension varus dataset ranged from –0.5° to –24°. Incremental values of –0.5° to –24° in this dataset were then analyzed against the 90° flexion varus subgroups using logistic regression. A scatterplot of the relationship between extension and flexion varus is shown in Figure 2. The probability function was then derived and a probability graph plotted.
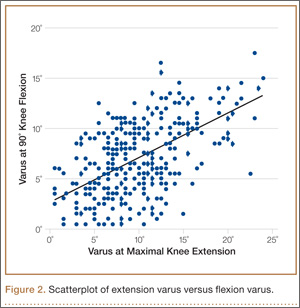
FFD and Extension and Flexion Varus
Maximal knee extension, obtained from intraoperative navigation measurements, ranged from –9° (hyperextension) to 33° (FFD) and maximal knee flexion ranged from 90° to 146°. Ninety-two knees had slight hyperextension, and 6 were neutral. Of the 317 OA knees with varus deformity, 219 (69%) had FFD. This sagittal plane alignment parameter was analyzed against coronal plane alignment in maximal knee extension and 90° knee flexion to determine if increasing severity of FFD corresponds with increasing extension or flexion varus.
Statistical Analysis
Statistical analysis was performed with Stata 10.1 (Statacorp, College Station, Texas). Significance was set at P < .05.
Results
Extension and Flexion Varus
Patient demographic data are listed in Table 3. Univariate logistic regression analysis revealed that age (P = .110), body mass index (P = .696), and sex (P = .584) did not affect the association between preoperative extension and flexion varus.
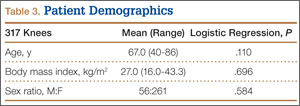
Mean (SD) preoperative extension varus was –9.9° (4.80°), and mean (SD) preoperative flexion 90° varus was –7.02° (3.74°). Linear regression of the data showed a significant positive correlation between preoperative extension varus and flexion varus (Pearson correlation coefficient, 0.57; P < .0001). The probability function was determined as follows: Probability of having flexion varus of more than 10° = 1 / (1 + e–z), where z = –4.014 – 0.265 × extension varus. Plotting the probability graph of flexion varus against varus angles at maximal knee extension from the probability formula yielded a sigmoid graph (Figure 3). The most linear part of the graph corresponds to the 10° to 20° of extension varus (solid line), demonstrating an almost linear increase in the probability of having more than 10° flexion varus with increasing extension varus from 10° to 20°. For extension varus of 20° or more, the probability of having flexion varus of more than 10° approaches 1.
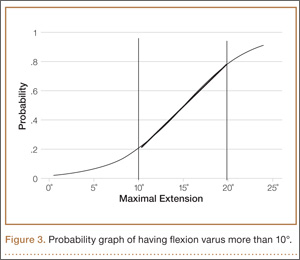
FFD and Extension and Flexion Varus
Mean (SD) preoperative maximal knee extension (analogous to FFD) was 4.41° (7.50°), mean (SD) extension varus was –9.9° (4.80°), and mean (SD) 90° flexion varus was –7.02° (3.74°). We did not find any correlation between preoperative FFD and preoperative flexion varus (r = –0.02; P = .6583) or extension varus (r = –0.11; P = .046) (Figure 4).
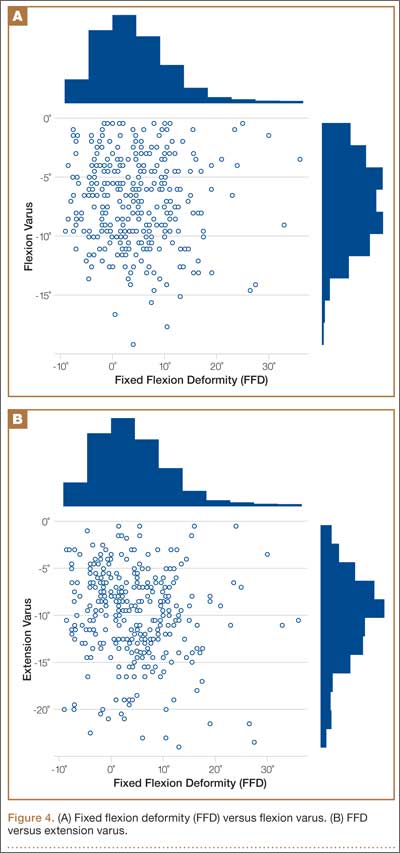
Postoperative Alignment
Of the 317 OA knees, 18 had incomplete navigation-acquired postoperative alignment data. The postoperative alignment of the other 299 knees at various degrees of knee flexion is illustrated with a box-and-whisker plot (Figure 5).
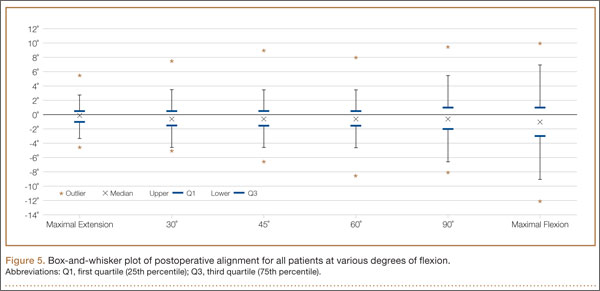
Knees With Severe Extension Varus
Fourteen of the 15 knees with severe extension varus (>20°) had flexion varus of more than 9° (range, –9° to –17.5°, with only 1 outlier, at –5°). For the 15 patients, maximal knee extension ranged from –9° hyperextension to 27.5° FFD. Six knees had slight hyperextension, and 9 had FFD demonstrating large variability in sagittal alignment. Despite severe preoperative coronal deformity, all 15 knees had satisfactory deformity correction. Preoperative and postoperative knee alignment data for these 15 knees appear in Table 4 and Figure 6, respectively.
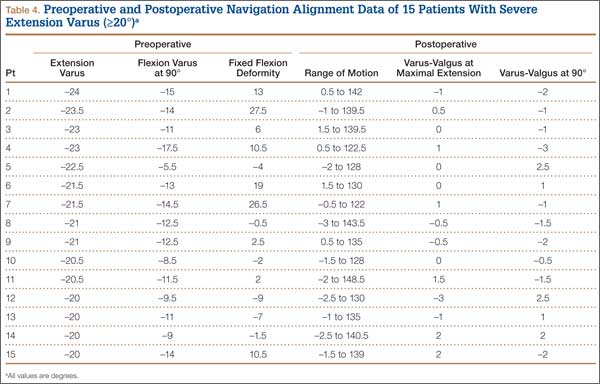
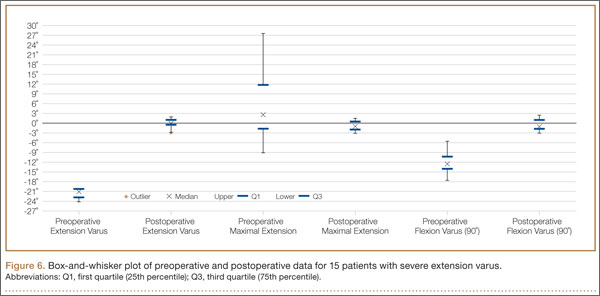
Discussion
OA varus knees represent a majority of the cases being managed by orthopedic surgeons. Soft-tissue contractures involving the medial collateral ligament (MCL), posteromedial capsule, pes anserinus, and semimembranosus muscle are commonly encountered. Bone loss may also occur on the tibial and femoral joint surfaces in knees with severe angular deformity. In an OA varus knee, bone loss tends to be mainly on the medial tibial plateau and usually on the posterior aspect of the tibia because flexion contractures often are concomitant with these marked deformities.11 Therefore, a varus deformity is apparent whether the knee is extended or flexed. Our results showed a correlation between extension and flexion varus in OA varus knees. In contrast, for a valgus deformity, as bone loss can occur on both the tibial and femoral surfaces,11 a similar correlation may not be seen. For that reason, and because there were only 41 valgus knees in this study, they were excluded. For FFD, soft-tissue contractures often involve both the posterior capsule and the posterior cruciate ligament (PCL). Posterior osteophytes often cause tenting of the posterior capsule in knees with FFD. Anteriorly, growth of osteophytes at the tibial spine and intercondylar notch of the femur can result in bony causes of restricted knee extension.12
One would expect increased coronal plane angular deformity to correspond to more severe FFD in the sagittal plane because the same pathology affects soft tissue or bones in an OA knee in both planes. Interestingly, our study results proved otherwise. FFD did not correlate with degree of extension or flexion varus severity. This phenomenon has not been described in the literature likely because clinical measurements of flexion varus and FFD were difficult to perform because of the spatial alignment of the knee in flexion. In recent years, however, computer navigation technology has made such measurements possible.
Mihalko and colleagues2 established that soft-tissue releases on different parts of the proximal tibia have different effects on soft-tissue balancing in flexion and extension. In knees with extension varus, more releases are required on the posterior medial aspect of the tibia (the posterior oblique fibers of the superficial MCL, the posteromedial capsule, and, sometimes, the semimembranosus), whereas knees with flexion varus require more releases on the anterior medial aspect of the tibia (the deep MCL, the anterior fibers of the superficial MCL, and, sometimes, the pes anserinus attachment).13 Consequently, soft-tissue stabilizers seem to have different functions in flexion and extension and cannot reliably be released solely in extension or flexion for optimal gap balancing during TKA.2 Other authors, in cadaveric studies, have found that a larger amount of coronal deformity correction is achieved with more distal soft-tissue releases from the joint line.9,14 Surgical techniques for correcting FFD include removal of prominent anterior and posterior osteophytes, posterior capsular releases, sometimes PCL sacrifices, and even gastrocnemius recession.12
In our study, all 14 patients with severe extension and correspondingly severe flexion varus needed not only modest posterior medial soft-tissue releases for the severe extension varus, but also modest anterior medial releases for the flexion varus. The respective soft-tissue releases were confirmed in real time with computer navigation sequentially after bony resection and osteophyte removal. With this method, we restored final postoperative alignment to within 3° of the mechanical axis (Figure 6). Our experience here led us to believe that, with these patients, modest anterior medial and posterior medial releases could be performed at the start of surgery, as severe extension varus (>20°) almost certainly equates to severe flexion varus (>10°). Therein lies the clinical relevance of our study. However, not all patients with severe coronal plane deformity have correspondingly severe sagittal plane deformity in the form of FFD, as illustrated in our study. Therefore, not all patients with severe varus knee deformity need aggressive posterior capsular release or PCL recession to correct FFD. Some patients have mild hyperextension, which can be attributed partly to the postanesthesia effects of soft-tissue laxity. It is unclear exactly how much anesthesia contributes to this difference in sagittal alignment, though the majority of our patients had FFD. It is not our intent here to discuss the surgical techniques of soft-tissue balancing or to advocate routine use of computer navigation.
Many factors (eg, medial femoral condyle bone loss, medial tibial plateau bone loss, femur or tibia bowing, medial soft-tissue contracture) can contribute to varus malalignment. Current navigation technology cannot isolate the causes of varus alignment, and we did not intend to investigate them in this study. Our primary aim was to assess for a correlation between overall extension varus alignment and expected flexion varus. We also wanted to analyze the correlation between FFD and the coronal plane alignment, in extension and flexion, contributed by the combined bony and soft-tissue components in OA varus knees.
The strengths of this study are that it was a single-surgeon series with knee data from consecutive patients who had computer-navigated TKA. Patient data were prospectively generated from the navigation software and retrospectively analyzed. All navigation alignment was performed by a single surgeon, thereby eliminating examination bias during the time knee alignment data were being obtained. The study was adequately powered and had a large number of patients for data analysis. The authors believe that this is the first study to analyze alignment in both the coronal and sagittal plane in varus OA knees.
We acknowledge a few limitations in our study. Although several investigators have found that navigation can be used to achieve accurate postoperative alignment,10,15,16 subtle errors may be inadvertently introduced at different points of alignment measurement. These error points include identification of visually selected anatomical landmarks; kinematic registration of hip, knee, and ankle; and intraoperative changes in the navigation environment (eg, inadvertent movement of pins or rigid bodies). In addition, different surgeons have different techniques for kinematic registration. However, the surgeries in our study were performed by the same surgeon, so this confounding factor was effectively removed. Another limitation was that navigation alignment was obtained during surgery, when patients were under anesthesia and in a supine, non-weight-bearing position, whereas routine clinical weight-bearing radiographs are taken with nonanesthetized patients and this might overestimate the deformities intraoperatively. However, all parameters were measured in the same patient under the same anesthetic effects, so this should not have affected the analyses. Most surgeons would make an intraoperative assessment of the severity of any deformity before the surgery proper anyway. Nevertheless, some authors have found that knee alignment obtained with intraoperative navigation correlated well with alignment obtained with weight-bearing radiographs.17,18
Conclusion
Our study results showed that, in OA varus knees, extension varus highly correlated with flexion varus. However, there was no correlation between FFD and coronal plane varus deformity.
1. Engh GA. The difficult knee: severe varus and valgus. Clin Orthop. 2003;(416):58-63.
2. Mihalko WM, Saleh KJ, Krackow KA, Whiteside LA. Soft-tissue balancing during total knee arthroplasty in the varus knee. J Am Acad Orthop Surg. 2009;17(12):766-774.
3. Ranawat CS, Flynn WF Jr, Saddler S, Hansraj KK, Maynard MJ. Long-term results of the total condylar knee arthroplasty. A 15-year survivorship study. Clin Orthop. 1993;(286):94-102.
4. Ritter MA, Faris GW, Faris PM, Davis KE. Total knee arthroplasty in patients with angular varus or valgus deformities of > or = 20 degrees. J Arthroplasty. 2004;19(7):862-866.
5. Parratte S, Pagnano MW. Instability after total knee arthroplasty. J Bone Joint Surg Am. 2008;90(1):184-194.
6. Sharkey PF, Hozack WJ, Rothman RH, Shastri S, Jacoby SM. Insall Award paper. Why are total knee arthroplasties failing today? Clin Orthop. 2002;(404):7-13.
7. Mullaji AB, Padmanabhan V, Jindal G. Total knee arthroplasty for profound varus deformity: technique and radiological results in 173 knees with varus of more than 20 degrees. J Arthroplasty. 2005;20(5):550-561.
8. Jeffery RS, Morris RW, Denham RA. Coronal alignment after total knee replacement. J Bone Joint Surg Br. 1991;73(5):709-714.
9. Luring C, Hüfner T, Perlick L, Bäthis H, Krettek C, Grifka J. The effectiveness of sequential medial soft tissue release on coronal alignment in total knee arthroplasty: using a computer navigation model. J Arthroplasty. 2006;21(3):428-434.
10. Hetaimish BM, Khan MM, Simunovic N, Al-Harbi HH, Bhandari M, Zalzal PK. Meta-analysis of navigation vs conventional total knee arthroplasty. J Arthroplasty. 2012;27(6):1177-1182.
11. Insall JN, Easley ME. Surgical techniques and instrumentation in total knee arthroplasty. In: Insall JN, Scott WN, eds. Surgery of the Knee. Vol 2. 3rd ed. New York, NY: Churchill Livingstone; 2001:1553-1620.
12. Scuderi GR, Tria AJ, eds. Surgical Techniques in Total Knee Arthroplasty. New York, NY: Springer-Verlag; 2002.
13. Whiteside LA, Saeki K, Mihalko WM. Functional medial ligament balancing in total knee arthroplasty. Clin Orthop. 2000;(380):45-57.
14. Matsueda M, Gengerke TR, Murphy M, Lew WD, Gustilo RB. Soft tissue release in total knee arthroplasty. Cadaver study using knees without deformities. Clin Orthop. 1999;(366):264-273.
15. Haaker RG, Stockheim M, Kamp M, Proff G, Breitenfelder J, Ottersbach A. Computer-assisted navigation increases precision of component placement in total knee arthroplasty. Clin Orthop. 2005;(433):152-159.
16. Mullaji AB, Kanna R, Marawar S, Kohli A, Sharma A. Comparison of limb and component alignment using computer-assisted navigation versus image intensifier–guided conventional total knee arthroplasty: a prospective, randomized, single-surgeon study of 467 knees. J Arthroplasty. 2007;22(7):953-959.
17. Colebatch AN, Hart DJ, Zhai G, Williams FM, Spector TD, Arden NK. Effective measurement of knee alignment using AP knee radiographs. Knee. 2009;16(1):42-45.
18. Yaffe MA, Koo SS, Stulberg SD. Radiographic and navigation measurements of TKA limb alignment do not correlate. Clin Orthop. 2008;466(11):2736-2744.
Osteoarthritic (OA) knees with varus deformities commonly present with tight, contracted medial collateral ligaments and soft-tissue sleeves.1 More severe varus deformities require more extensive medial releases on the concave side to optimize flexion-extension gaps. Excessive soft-tissue releases in milder varus deformities can result in medial instability in flexion and extension.2-4 Misjudgments in soft-tissue release can therefore lead to knee instability, an important cause of early total knee arthroplasty (TKA) failures.2,5,6 Some authors have reported difficulty in coronal plane balancing in knees with preoperative varus deformity of more than 20°.4,7
Surgeons often refer to varus as a description of coronal malalignment, mainly with the knee in extension. In the surgical setting, however, descriptions are given regarding differential medial soft-tissue tightness in extension and flexion. Balancing the knee in extension may not necessarily balance the knee in flexion. Thus, there is the concept of extension and flexion varus, which has not been well described in the literature. Releases on the anterior medial and posterior medial aspects of the proximal tibia have differential effects on flexion and extension gaps, respectively.2
Intraoperative alignment certainly has a pivotal role in component longevity.8 Since its advent in the 1990s, use of computer navigation in TKA has offered new hope for improving component alignment. Some authors routinely use computer navigation for intraoperative soft-tissue releases.9 A recent meta-analysis found that computer-navigated surgery is associated with fewer outliers in final component alignment compared with conventional TKA.10
Increased use of computer navigation in TKA at our institution in recent years has come with the observation that knees with severe extension varus seem to have correspondingly more severe flexion varus. Before computer navigation, coronal alignment of knees in flexion was almost impossible to measure because of the spatial alignment of the knees in that position.
We conducted a study to evaluate the relationship of extension and flexion varus in OA knees and to determine whether severity of fixed flexion deformity (FFD) in the sagittal plane correlates with severity of coronal plane varus deformity. We hypothesized that there would be differential varus in flexion and extension and that increasing knee extension varus would correlate closely with knee flexion varus beyond a certain tibiofemoral angle. We also hypothesized that severity of sagittal plane deformity will correlate with the severity of coronal plane deformity.
Patients and Methods
Data Collection
After this study was approved by our institution’s ethics review committee, we prospectively collected data from 403 consecutive computer-navigated TKAs performed at our institution between November 2008 and August 2011. Dr. Tan, who was not the primary physician, retrospectively analyzed the radiographic and navigation data.
Each patient’s knee varus-valgus angles were captured by Dr. Teo, an adult reconstruction surgeon, in standard fashion from maximal extension to 0º, 30º, 45º, 60º, 90º, and maximal flexion. An example of standard data capture appears in Table 1. With varus-hyperextension defined as –0.5° or less (more negative), neutral as 0°, and valgus-flexion as 0.5° or more, there were 362 varus knees, 41 valgus knees, and no neutral knees.
Study inclusion criteria were OA and varus deformity. Exclusion criteria were rheumatoid arthritis, other types of inflammatory arthritis, neuromuscular disorders, knees with valgus angulation, and incomplete data (Table 2). Figure 1 summarizes the inclusion/exclusion process, which left 317 knees available for study. Cases of incomplete data were likely due to computer errors or to inadvertent movement when navigation data were being acquired during surgery.
![]()
In conventional TKA, the main objective is to equalize flexion-extension gaps with knee at 90° flexion and 0° extension. The ability to achieve this often implies the knee will be balanced throughout its range of motion (ROM). From the data for the 317 study knees, 3 sets of values were extracted: varus angles from maximal knee extension (extension varus), varus angles from 90° knee flexion (flexion varus), and maximal knee extension. All knees were able to achieve 90° flexion.
Power Calculation
Our analysis used a correlation coefficient (r) of at least 0.5 at a 5% level of significance and power of 80%. With 317 knees, the study was more than adequately powered for significance.
Surgical and Navigation Technique
All patients underwent either general or regional anesthesia for their surgeries, which were performed by Dr. Teo. Standard medial parapatellar arthrotomy was performed. Navigation pins were then inserted into the femur and tibia outside the knee wound. Anatomical reference points were digitized per routine navigation requirements. (The reference for varus-valgus alignment of the femur is the mechanical femur axis defined by the digitized hip center and knee center, and the reference for varus-valgus alignment of the tibia is the mechanical tibia axis defined by the digitized tibia center and calculated ankle center. The ankle center is calculated by dividing the digitized transmalleolar axis according to a ratio of 56% lateral to 44% medial with the inherent navigation software.) Our institution uses an imageless navigation system (Navigation System II; Stryker Orthopedics, Mahwah, New Jersey).
The leg was then brought from maximal knee extension to maximal knee flexion to assess preoperative ROM, which indicates inherent flexion contracture or hyperextension. Varus-valgus measurements of the knee were then generated as part of the navigation software protocol. These measurements were obtained without additional varus or valgus stress applied to the knee and before any bony resection. The rest of the operation was completed using navigation to guide bony resection and soft-tissue balancing. The final components used were all cemented cruciate-substituting TKA implants. After component insertion, the knee was again brought through ROM from maximal knee extension to maximal knee flexion to assess postoperative ROM before wound closure.
Extension and Flexion Varus
As none of the patients in the flexion varus dataset (range, –0.5° to –19°) had a varus deformity of more than 20° at 90° flexion, we used a cutoff of 10° to divide these patients into 2 subgroups: less than 10° (237 knees) and 10° or more (80 knees). The extension varus dataset ranged from –0.5° to –24°. Incremental values of –0.5° to –24° in this dataset were then analyzed against the 90° flexion varus subgroups using logistic regression. A scatterplot of the relationship between extension and flexion varus is shown in Figure 2. The probability function was then derived and a probability graph plotted.
FFD and Extension and Flexion Varus
Maximal knee extension, obtained from intraoperative navigation measurements, ranged from –9° (hyperextension) to 33° (FFD) and maximal knee flexion ranged from 90° to 146°. Ninety-two knees had slight hyperextension, and 6 were neutral. Of the 317 OA knees with varus deformity, 219 (69%) had FFD. This sagittal plane alignment parameter was analyzed against coronal plane alignment in maximal knee extension and 90° knee flexion to determine if increasing severity of FFD corresponds with increasing extension or flexion varus.
Statistical Analysis
Statistical analysis was performed with Stata 10.1 (Statacorp, College Station, Texas). Significance was set at P < .05.
Results
Extension and Flexion Varus
Patient demographic data are listed in Table 3. Univariate logistic regression analysis revealed that age (P = .110), body mass index (P = .696), and sex (P = .584) did not affect the association between preoperative extension and flexion varus.
Mean (SD) preoperative extension varus was –9.9° (4.80°), and mean (SD) preoperative flexion 90° varus was –7.02° (3.74°). Linear regression of the data showed a significant positive correlation between preoperative extension varus and flexion varus (Pearson correlation coefficient, 0.57; P < .0001). The probability function was determined as follows: Probability of having flexion varus of more than 10° = 1 / (1 + e–z), where z = –4.014 – 0.265 × extension varus. Plotting the probability graph of flexion varus against varus angles at maximal knee extension from the probability formula yielded a sigmoid graph (Figure 3). The most linear part of the graph corresponds to the 10° to 20° of extension varus (solid line), demonstrating an almost linear increase in the probability of having more than 10° flexion varus with increasing extension varus from 10° to 20°. For extension varus of 20° or more, the probability of having flexion varus of more than 10° approaches 1.
FFD and Extension and Flexion Varus
Mean (SD) preoperative maximal knee extension (analogous to FFD) was 4.41° (7.50°), mean (SD) extension varus was –9.9° (4.80°), and mean (SD) 90° flexion varus was –7.02° (3.74°). We did not find any correlation between preoperative FFD and preoperative flexion varus (r = –0.02; P = .6583) or extension varus (r = –0.11; P = .046) (Figure 4).
Postoperative Alignment
Of the 317 OA knees, 18 had incomplete navigation-acquired postoperative alignment data. The postoperative alignment of the other 299 knees at various degrees of knee flexion is illustrated with a box-and-whisker plot (Figure 5).
Knees With Severe Extension Varus
Fourteen of the 15 knees with severe extension varus (>20°) had flexion varus of more than 9° (range, –9° to –17.5°, with only 1 outlier, at –5°). For the 15 patients, maximal knee extension ranged from –9° hyperextension to 27.5° FFD. Six knees had slight hyperextension, and 9 had FFD demonstrating large variability in sagittal alignment. Despite severe preoperative coronal deformity, all 15 knees had satisfactory deformity correction. Preoperative and postoperative knee alignment data for these 15 knees appear in Table 4 and Figure 6, respectively.
Discussion
OA varus knees represent a majority of the cases being managed by orthopedic surgeons. Soft-tissue contractures involving the medial collateral ligament (MCL), posteromedial capsule, pes anserinus, and semimembranosus muscle are commonly encountered. Bone loss may also occur on the tibial and femoral joint surfaces in knees with severe angular deformity. In an OA varus knee, bone loss tends to be mainly on the medial tibial plateau and usually on the posterior aspect of the tibia because flexion contractures often are concomitant with these marked deformities.11 Therefore, a varus deformity is apparent whether the knee is extended or flexed. Our results showed a correlation between extension and flexion varus in OA varus knees. In contrast, for a valgus deformity, as bone loss can occur on both the tibial and femoral surfaces,11 a similar correlation may not be seen. For that reason, and because there were only 41 valgus knees in this study, they were excluded. For FFD, soft-tissue contractures often involve both the posterior capsule and the posterior cruciate ligament (PCL). Posterior osteophytes often cause tenting of the posterior capsule in knees with FFD. Anteriorly, growth of osteophytes at the tibial spine and intercondylar notch of the femur can result in bony causes of restricted knee extension.12
One would expect increased coronal plane angular deformity to correspond to more severe FFD in the sagittal plane because the same pathology affects soft tissue or bones in an OA knee in both planes. Interestingly, our study results proved otherwise. FFD did not correlate with degree of extension or flexion varus severity. This phenomenon has not been described in the literature likely because clinical measurements of flexion varus and FFD were difficult to perform because of the spatial alignment of the knee in flexion. In recent years, however, computer navigation technology has made such measurements possible.
Mihalko and colleagues2 established that soft-tissue releases on different parts of the proximal tibia have different effects on soft-tissue balancing in flexion and extension. In knees with extension varus, more releases are required on the posterior medial aspect of the tibia (the posterior oblique fibers of the superficial MCL, the posteromedial capsule, and, sometimes, the semimembranosus), whereas knees with flexion varus require more releases on the anterior medial aspect of the tibia (the deep MCL, the anterior fibers of the superficial MCL, and, sometimes, the pes anserinus attachment).13 Consequently, soft-tissue stabilizers seem to have different functions in flexion and extension and cannot reliably be released solely in extension or flexion for optimal gap balancing during TKA.2 Other authors, in cadaveric studies, have found that a larger amount of coronal deformity correction is achieved with more distal soft-tissue releases from the joint line.9,14 Surgical techniques for correcting FFD include removal of prominent anterior and posterior osteophytes, posterior capsular releases, sometimes PCL sacrifices, and even gastrocnemius recession.12
In our study, all 14 patients with severe extension and correspondingly severe flexion varus needed not only modest posterior medial soft-tissue releases for the severe extension varus, but also modest anterior medial releases for the flexion varus. The respective soft-tissue releases were confirmed in real time with computer navigation sequentially after bony resection and osteophyte removal. With this method, we restored final postoperative alignment to within 3° of the mechanical axis (Figure 6). Our experience here led us to believe that, with these patients, modest anterior medial and posterior medial releases could be performed at the start of surgery, as severe extension varus (>20°) almost certainly equates to severe flexion varus (>10°). Therein lies the clinical relevance of our study. However, not all patients with severe coronal plane deformity have correspondingly severe sagittal plane deformity in the form of FFD, as illustrated in our study. Therefore, not all patients with severe varus knee deformity need aggressive posterior capsular release or PCL recession to correct FFD. Some patients have mild hyperextension, which can be attributed partly to the postanesthesia effects of soft-tissue laxity. It is unclear exactly how much anesthesia contributes to this difference in sagittal alignment, though the majority of our patients had FFD. It is not our intent here to discuss the surgical techniques of soft-tissue balancing or to advocate routine use of computer navigation.
Many factors (eg, medial femoral condyle bone loss, medial tibial plateau bone loss, femur or tibia bowing, medial soft-tissue contracture) can contribute to varus malalignment. Current navigation technology cannot isolate the causes of varus alignment, and we did not intend to investigate them in this study. Our primary aim was to assess for a correlation between overall extension varus alignment and expected flexion varus. We also wanted to analyze the correlation between FFD and the coronal plane alignment, in extension and flexion, contributed by the combined bony and soft-tissue components in OA varus knees.
The strengths of this study are that it was a single-surgeon series with knee data from consecutive patients who had computer-navigated TKA. Patient data were prospectively generated from the navigation software and retrospectively analyzed. All navigation alignment was performed by a single surgeon, thereby eliminating examination bias during the time knee alignment data were being obtained. The study was adequately powered and had a large number of patients for data analysis. The authors believe that this is the first study to analyze alignment in both the coronal and sagittal plane in varus OA knees.
We acknowledge a few limitations in our study. Although several investigators have found that navigation can be used to achieve accurate postoperative alignment,10,15,16 subtle errors may be inadvertently introduced at different points of alignment measurement. These error points include identification of visually selected anatomical landmarks; kinematic registration of hip, knee, and ankle; and intraoperative changes in the navigation environment (eg, inadvertent movement of pins or rigid bodies). In addition, different surgeons have different techniques for kinematic registration. However, the surgeries in our study were performed by the same surgeon, so this confounding factor was effectively removed. Another limitation was that navigation alignment was obtained during surgery, when patients were under anesthesia and in a supine, non-weight-bearing position, whereas routine clinical weight-bearing radiographs are taken with nonanesthetized patients and this might overestimate the deformities intraoperatively. However, all parameters were measured in the same patient under the same anesthetic effects, so this should not have affected the analyses. Most surgeons would make an intraoperative assessment of the severity of any deformity before the surgery proper anyway. Nevertheless, some authors have found that knee alignment obtained with intraoperative navigation correlated well with alignment obtained with weight-bearing radiographs.17,18
Conclusion
Our study results showed that, in OA varus knees, extension varus highly correlated with flexion varus. However, there was no correlation between FFD and coronal plane varus deformity.
1. Engh GA. The difficult knee: severe varus and valgus. Clin Orthop. 2003;(416):58-63.
2. Mihalko WM, Saleh KJ, Krackow KA, Whiteside LA. Soft-tissue balancing during total knee arthroplasty in the varus knee. J Am Acad Orthop Surg. 2009;17(12):766-774.
3. Ranawat CS, Flynn WF Jr, Saddler S, Hansraj KK, Maynard MJ. Long-term results of the total condylar knee arthroplasty. A 15-year survivorship study. Clin Orthop. 1993;(286):94-102.
4. Ritter MA, Faris GW, Faris PM, Davis KE. Total knee arthroplasty in patients with angular varus or valgus deformities of > or = 20 degrees. J Arthroplasty. 2004;19(7):862-866.
5. Parratte S, Pagnano MW. Instability after total knee arthroplasty. J Bone Joint Surg Am. 2008;90(1):184-194.
6. Sharkey PF, Hozack WJ, Rothman RH, Shastri S, Jacoby SM. Insall Award paper. Why are total knee arthroplasties failing today? Clin Orthop. 2002;(404):7-13.
7. Mullaji AB, Padmanabhan V, Jindal G. Total knee arthroplasty for profound varus deformity: technique and radiological results in 173 knees with varus of more than 20 degrees. J Arthroplasty. 2005;20(5):550-561.
8. Jeffery RS, Morris RW, Denham RA. Coronal alignment after total knee replacement. J Bone Joint Surg Br. 1991;73(5):709-714.
9. Luring C, Hüfner T, Perlick L, Bäthis H, Krettek C, Grifka J. The effectiveness of sequential medial soft tissue release on coronal alignment in total knee arthroplasty: using a computer navigation model. J Arthroplasty. 2006;21(3):428-434.
10. Hetaimish BM, Khan MM, Simunovic N, Al-Harbi HH, Bhandari M, Zalzal PK. Meta-analysis of navigation vs conventional total knee arthroplasty. J Arthroplasty. 2012;27(6):1177-1182.
11. Insall JN, Easley ME. Surgical techniques and instrumentation in total knee arthroplasty. In: Insall JN, Scott WN, eds. Surgery of the Knee. Vol 2. 3rd ed. New York, NY: Churchill Livingstone; 2001:1553-1620.
12. Scuderi GR, Tria AJ, eds. Surgical Techniques in Total Knee Arthroplasty. New York, NY: Springer-Verlag; 2002.
13. Whiteside LA, Saeki K, Mihalko WM. Functional medial ligament balancing in total knee arthroplasty. Clin Orthop. 2000;(380):45-57.
14. Matsueda M, Gengerke TR, Murphy M, Lew WD, Gustilo RB. Soft tissue release in total knee arthroplasty. Cadaver study using knees without deformities. Clin Orthop. 1999;(366):264-273.
15. Haaker RG, Stockheim M, Kamp M, Proff G, Breitenfelder J, Ottersbach A. Computer-assisted navigation increases precision of component placement in total knee arthroplasty. Clin Orthop. 2005;(433):152-159.
16. Mullaji AB, Kanna R, Marawar S, Kohli A, Sharma A. Comparison of limb and component alignment using computer-assisted navigation versus image intensifier–guided conventional total knee arthroplasty: a prospective, randomized, single-surgeon study of 467 knees. J Arthroplasty. 2007;22(7):953-959.
17. Colebatch AN, Hart DJ, Zhai G, Williams FM, Spector TD, Arden NK. Effective measurement of knee alignment using AP knee radiographs. Knee. 2009;16(1):42-45.
18. Yaffe MA, Koo SS, Stulberg SD. Radiographic and navigation measurements of TKA limb alignment do not correlate. Clin Orthop. 2008;466(11):2736-2744.
Targeting a New Safe Zone: A Step in the Development of Patient-Specific Component Positioning for Total Hip Arthroplasty
Postoperative dislocation remains a common complication of primary total hip arthroplasties (THAs), affecting less than 1% to more than 10% in reported series.1,2 In large datasets for modern implants, the incidence of dislocation is 2% to 4%.3,4 Given that more than 200,000 THAs are performed in the United States each year,5 these low percentages represent a large number of patients. The multiplex patient variables that affect THA stability include age, sex, body mass index (BMI), and comorbid conditions.6-8 Surgical approach, restoration of leg length and femoral offset, femoral head size, and component positioning are also important surgical factors that can increase or decrease the incidence of dislocation.3,8,9 In particular, appropriate acetabular component orientation is crucial; surgeons can control this factor and thereby limit the occurrence of dislocation.10 Furthermore, acetabular malpositioning can increase the risk of liner fractures and accelerate bearing-surface wear.11-14
To minimize the risk of postoperative dislocation, surgeons traditionally have targeted the Lewinnek safe zone, with its mean (SD) inclination of 40° (10°) and mean (SD) anteversion of 15° (10°), for acetabular component orientation.15 However, the applicability of this target zone to preventing hip instability using modern implant designs, components, and surgical techniques remains unknown. Achieving acetabular orientation based on maximizing range of motion (ROM) before impingement may be optimal, with anteversion from 20° to 30° and inclination from 40° to 45°.16,17 Furthermore, mean (SD) native acetabular anteversion ranges from 21.3° (6.2°) for men to 24.6° (6.6°) for women.18 Placing THA acetabular components near the native range for anteversion may best provide impingement-free ROM and thus optimize THA stability,16,19 but this has not been proved in a clinical study.
Early dislocation is typically classified as occurring within 6 months after surgery,9 with almost 80% of dislocations occurring within 3 months after surgery.10 Surgeon-specific factors, such as acetabular component positioning, are thought to have a predominant effect on dislocations in the early postoperative period.10 Computer-assisted surgery (CAS), such as imageless navigation, is more accurate than conventional methods for acetabular component placement,20-23 but the clinical relevance of improving accuracy for acetabular component placement has not been shown with respect to altering patient outcomes.23
We conducted a study in a large single-surgeon patient cohort to determine the incidence of early postoperative dislocation with target anteversion increased to 25°, approximating mean native acetabular anteversion.16,19 In addition, we sought to determine the accuracy of imageless navigation in achieving target acetabular component placement.
Materials and Methods
After obtaining institutional review board approval for this retrospective clinical study, we reviewed 671 consecutive cases of primary THA performed by a single surgeon using an imageless CAS system (AchieveCAS; Smith & Nephew, Memphis, Tennessee) between July 2006 and October 2012. THAs were excluded if a metal-on-metal bearing surface was used, if an adequate 6-week postoperative supine anteroposterior (AP) pelvis radiograph was unavailable, or if 6-month clinical follow-up findings were not available (Figure 1). The quality of AP radiographs was deemed poor if they were not centered on the symphysis pubis and if the sacrococcygeal joint was not centered over the symphysis pubis. After exclusion criteria were applied, 553 arthroplasties (479 patients) with a mean (SD) follow-up of 2.4 (1.4) years remained. Perioperative demographic data and component sizes are listed in Table 1.
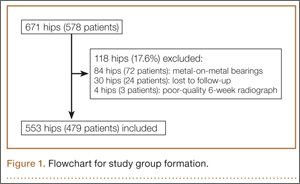
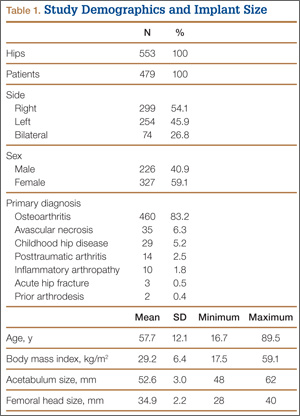
During surgery, the anterior pelvic plane, defined by the anterior-superior iliac spines and pubic tubercle, was registered with the CAS system with the patient in the supine position. THA was performed with the patient in the lateral decubitus position using a posterolateral technique. For all patients, the surgeon used a hemispherical acetabular component (R3 Acetabular System; Smith & Nephew); bearings that were either metal on highly cross-linked polyethylene (XLPE) or Oxinium (Smith & Nephew) on XLPE; and neutral XLPE acetabular inserts. The goals for acetabular inclination and anteversion were 40° and 25°, respectively, with ±10° each for the target zone. The CAS system was used to adjust target anteversion for sagittal pelvic tilt.24 Uncemented femoral components were used for all patients, and the goal for femoral component anteversion was 15°. Transosseous repair of the posterior capsule and short external rotators was performed after component implantation.25
On each 6-week postoperative radiograph, acetabular orientation was measured with Ein-Bild-Röntgen-Analyse (EBRA; University of Innsbruck, Austria) software, which provides a validated method for measuring acetabular inclination and anteversion on supine AP pelvis radiographs.10,26 Pelvic boundaries were delineated with grid lines defining pelvic position. Reference points around the projections of the prosthetic femoral head, the hemispherical cup, and the rim of the cup were marked (Figure 2). EBRA calculated radiographic inclination and anteversion of the acetabular component based on the spatial position of the cup center in relation to the plane of the radiograph and the pelvic position.26
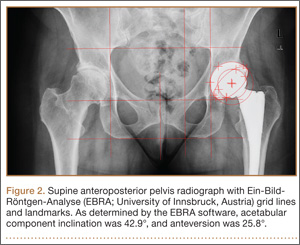
Charts were reviewed to identify patients with early postoperative dislocations, as well as dislocation timing, recurrence, and other characteristics. We defined early dislocation as instability occurring within 6 months after surgery. Revision surgery for instability was also identified.
For the statistical analysis, orientation error was defined as the absolute value of the difference between target orientation (40° inclination, 25° anteversion) and radiographic measurements. Repeated-measures multiple regression with the generalized estimating equations approach was used to identify baseline patient characteristics (age, sex, BMI, primary diagnosis, laterality) associated with component positioning outside of our targeted ranges for inclination and anteversion. Fisher exact tests were used to examine the relationship between dislocation and component placement in either the Lewinnek safe zone or our targeted zone. All tests were 2-sided with a significance level of .05. All analyses were performed with SAS for Windows 9.3 (SAS Institute, Cary, North Carolina).
Results
Mean (SD) acetabular inclination was 42.2° (4.9°) (range, 27.6°-65.0°), with a mean (SD) orientation error of 4.2° (3.4°) (Figure 3A). Mean (SD) anteversion was 23.9° (6.5°) (range, 6.2°-48.0°), with a mean (SD) orientation error of 5.2° (4.1°) (Figure 3B). Components were placed outside the Lewinnek safe zone for inclination or anteversion in 46.5% of cases and outside the target zone in 17.7% of cases (Figure 4). Variation in acetabular anteversion alone accounted for 67.3% of target zone outliers (Table 2). Only 0.9% of components were placed outside the target ranges for both inclination and anteversion.
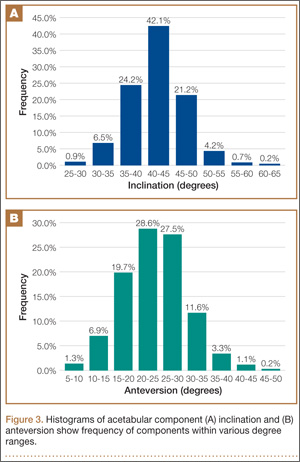
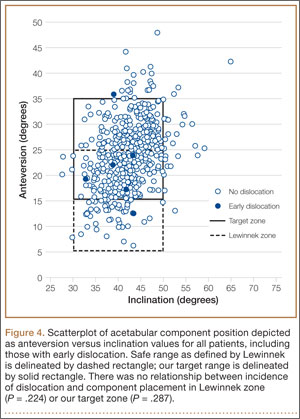
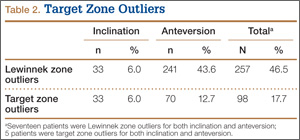
Regression analysis was performed separately for inclination and anteversion to determine the risk factors for placing the acetabular component outside the target orientation ranges. Only higher BMI was associated with malposition with respect to inclination (hazard ratio [HR], 1.059; 95% confidence interval [CI], 1.011-1.111; P = .017). Of obese patients with inclination outside the target range, 90.9% had an inclination angle of more than 50°. Associations between inclination outside the target range and age (P = .769), sex (P = .217), preoperative diagnosis (P > .99), and laterality (P = .106) were statistically insignificant. Only female sex was associated with position of the acetabular component outside the target range for anteversion (HR, 1.871; 95% CI, 1.061-3.299; P = .030). Of female patients with anteversion outside the target range, 70.0% had anteversion of less than 15°. Associations between anteversion outside the target range and age (P = .762), BMI (P = .583), preoperative diagnosis (P > .99), and laterality (P = .235) were statistically insignificant.
Six THAs (1.1%) in 6 patients experienced dislocation within 6 months after surgery (Table 3); mean (SD) time of dislocation was 58.3 (13.8) days after surgery. There was no relationship between dislocation incidence and component placement in the Lewinnek zone (P = .224) or our target zone (P = .287). Of the dislocation cases, 50% involved female patients, and 50% involved right hips. Mean (SD) age of these patients was 53.3 (7.6) years. Mean (SD) BMI was 25.4 (0.9) kg/m2. Osteoarthritis was the primary diagnosis for all patients with early dislocation; 32- or 36-mm femoral heads were used in these cases. Two patients had acetabular components placed outside of our target zone. One patient, who had abnormal pelvic obliquity and sagittal tilt from scoliosis (Figures 5A, 5B), had an acetabular component placed outside both the target zone and the Lewinnek safe zone. Mean (SD) acetabular inclination was 39.8° (3.6°), and mean (SD) anteversion was 21.8° (7.3°) (Figure 5C). Two dislocations resulted from trauma, 1 dislocation was related to hyperlaxity, 1 patient had cerebral palsy, and 1 patient had no evident predisposing risk factors. Three patients (0.54%) had multiple episodes of instability requiring revision during the follow-up period.
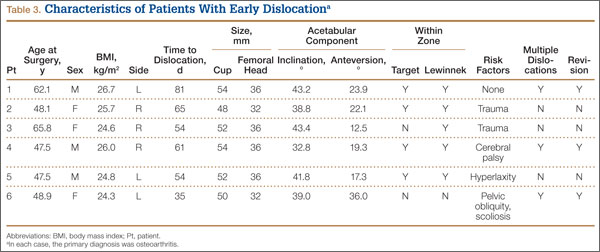
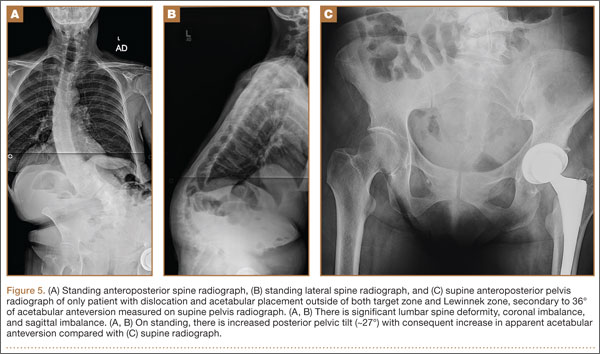
Discussion
To our knowledge, this study represents the largest cohort of primary THAs performed with an imageless navigation system. Our results showed that increasing targeted acetabular anteversion to 25° using a posterolateral surgical approach and modern implants resulted in a 1.1% incidence of early dislocation and a 0.54% incidence of recurrent instability requiring reoperation. Of the patients with a dislocation, only 1 did not experience trauma and did not have a risk factor for dislocation. Only 1 patient with a dislocation had acetabular components positioned outside both the target zone and the Lewinnek safe zone. The acetabular component was placed within the target zone in 82.3% of cases in which the imageless navigation system was used. In our cohort, BMI was the only risk factor for placement of the acetabular component outside our target range for inclination, and sex was associated with components outside the target range for anteversion.
Early dislocation after THA is often related to improper implant orientation, inadequate restoration of offset and myofascial tension, and decreased femoral head–neck ratio.8 Although dislocation rates in the literature vary widely,1,2 Medicare data suggest that the rate for the first 6 months after surgery can be as high as 4.21%.3,4 Although use of femoral heads with a diameter of 32 mm or larger may decrease this rate to 2.14%,3 accurate acetabular component orientation helps prevent postoperative dislocation.10 Using an imageless navigation system to target 25° of anteversion and 40° of inclination resulted in an early-dislocation rate about 49% less than the rate in a Medicare population treated with similar, modern implants.3
Callanan and colleagues11 found that freehand techniques were inaccurate for acetabular positioning in up to 50% of cases, and several studies have demonstrated that imageless navigation systems were more accurate than conventional guides.20,21,27-29 Higher BMI has been implicated as a risk factor for acetabular malpositioning in several studies of the accuracy of freehand techniques11 and imageless navigation techniques.23,30 Soft-tissue impediment to the component insertion handle poses a risk of increased inclination and inadequate anteversion, regardless of method used (conventional, CAS). When the acetabular component is placed freehand in obese patients, it is difficult to judge the position of the pelvis on the operating room table. For imageless navigation, a larger amount of adipose tissue over bony landmarks may limit the accuracy of anterior pelvic plane registration.30 Sex typically is not cited as a risk factor for inaccurate acetabular component positioning. We speculate that omitted-variable bias may explain the observed association between female sex and anteversion. For example, changes in postoperative pelvic tilt alter apparent anteversion on plain radiographs,31-34 but preoperative and postoperative sagittal pelvic tilt was not recorded in this study.
The proper position of the acetabular component has been debated.15,16,35,36 Although it is generally agreed that inclination of 40° ± 10° balances ROM, stability, and bearing-surface wear,12,13,15,16 proposed targets for anteversion vary widely, from 0° to 40°.35,36 Patel and colleagues16 formulated computer models based on cadaveric specimens to determine that THA impingement was minimized when the acetabular component was placed to match the native anteversion of the acetabulum.In their study model, 20° of anteversion paralleled native acetabular orientation. Tohtz and colleagues18 reviewed computed tomography scans of 144 female hips and 192 male hips and found that mean (SD) anteversion was 24.6° (6.6°) for women and 21.3° (6.2°) for men. Whether native anatomy is a valid reference for acetabular anteversion is controversial,19 and definitive recommendations for target anteversion cannot be made, as the effect of acetabular anteversion on the wear of various bearing materials is unknown.14 Yet, as with inclination, ideal anteversion is likely a compromise between maximizing impingement-free ROM and minimizing wear.
The present study had several limitations. A single-surgeon patient series was reviewed retrospectively, and there was no control group. We determined the incidence only of early dislocation, and 5.3% of THAs that were not metal-on-metal were either lost to follow-up or had inadequate radiographs. However, of the patients excluded for inadequate radiographs, none had an early dislocation. The effects of our surgical techniques on long-term outcomes, bearing wear, and dislocation are unknown. We were not able to comment on the direction of dislocation for any of the 6 patients with early dislocation, as all dislocations were reduced at facilities other than our hospital. Therefore, we cannot determine whether increasing acetabular anteversion resulted in a larger number of anterior versus posterior dislocations.15
We did not use CAS to place any of the femoral components. Therefore, we could not accurately target combined anteversion, defined as the sum of acetabular and femoral version, which may be an important determinant of THA stability.28 Although restoration of femoral offset and leg length is important in preventing THA dislocation,8 the CAS techniques used did not influence these parameters, and they were not measured.
As an imageless navigation system was used, there were no preoperative axial images, which could have been used to assess native acetabular orientation. This limited our assessment with respect to matching each patient’s natural anteversion. Imageless navigation, which references only the anterior pelvic plane, may not be reliable in patients with excessive sagittal pelvic tilt.37 Furthermore, changes in the functional position of the pelvis from supine to sitting to standing were not accounted for, and changes in sagittal tilt between these positions can be significant.38 Changes in sagittal pelvic tilt affect measurement of acetabular anteversion on plain radiographs, with anterior tilt reducing apparent anteversion and posterior tilt increasing it.32,34 Although postoperative computed tomography is the gold standard for assessing acetabular component orientation, EBRA significantly reduces errors of measurement on plain radiographs.10 Some variability in measured anteversion may be explained by our surgical technique. In particular, if the cup was uncovered anteriorly, additional anteversion was usually accepted during surgery to minimize anterior impingement and limit the risk of iliopsoas tendonitis.16,39
Our study results suggested that increasing target acetabular anteversion to 25° may reduce the incidence of early postoperative instability relative to rates reported in the literature. Despite the higher accuracy of component placement with an imageless navigation system, dislocations occurred in patients with acetabular components positioned in our target zone and in the historical safe zone. These dislocations support the notion that there likely is no absolute safe range for acetabular component positioning, as THA stability depends on many factors. Ideal targets for implant orientation for acetabulum and femur may be patient-specific.16,19 Investigators should prospectively evaluate patient-specific THA component positioning and determine its effect on postoperative dislocation and bearing-surface wear. As specific implant targets are further defined, tools that are more precise and accurate than conventional techniques will be needed to achieve goal component positioning. Our study results confirmed that imageless navigation is an accurate method for achieving acetabular orientation targets.
1. Kwon MS, Kuskowski M, Mulhall KJ, Macaulay W, Brown TE, Saleh KJ. Does surgical approach affect total hip arthroplasty dislocation rates? Clin Orthop. 2006;(447):34-38.
2. Sierra RJ, Raposo JM, Trousdale RT, Cabanela ME. Dislocation of primary THA done through a posterolateral approach in the elderly. Clin Orthop. 2005;(441):262-267.
3. Malkani AL, Ong KL, Lau E, Kurtz SM, Justice BJ, Manley MT. Early- and late-term dislocation risk after primary hip arthroplasty in the Medicare population. J Arthroplasty. 2010;25(6 suppl):21-25.
4. Berry DJ, von Knoch M, Schleck CD, Harmsen WS. Effect of femoral head diameter and operative approach on risk of dislocation after primary total hip arthroplasty. J Bone Joint Surg Am. 2005;87(11):2456-2463.
5. Nho SJ, Kymes SM, Callaghan JJ, Felson DT. The burden of hip osteoarthritis in the United States: epidemiologic and economic considerations. J Am Acad Orthop Surg. 2013;21(suppl 1):S1-S6.
6. Sadr Azodi O, Adami J, Lindstrom D, Eriksson KO, Wladis A, Bellocco R. High body mass index is associated with increased risk of implant dislocation following primary total hip replacement: 2,106 patients followed for up to 8 years. Acta Orthop. 2008;79(1):141-147.
7. Conroy JL, Whitehouse SL, Graves SE, Pratt NL, Ryan P, Crawford RW. Risk factors for revision for early dislocation in total hip arthroplasty. J Arthroplasty. 2008;23(6):867-872.
8. Morrey BF. Difficult complications after hip joint replacement. Dislocation. Clin Orthop. 1997;(344):179-187.
9. Ho KW, Whitwell GS, Young SK. Reducing the rate of early primary hip dislocation by combining a change in surgical technique and an increase in femoral head diameter to 36 mm. Arch Orthop Trauma Surg. 2012;132(7):1031-1036.
10. Biedermann R, Tonin A, Krismer M, Rachbauer F, Eibl G, Stockl B. Reducing the risk of dislocation after total hip arthroplasty: the effect of orientation of the acetabular component. J Bone Joint Surg Br. 2005;87(6):762-769.
11. Callanan MC, Jarrett B, Bragdon CR, et al. The John Charnley Award: risk factors for cup malpositioning: quality improvement through a joint registry at a tertiary hospital. Clin Orthop. 2011;469(2):319-329.
12. Gallo J, Havranek V, Zapletalova J. Risk factors for accelerated polyethylene wear and osteolysis in ABG I total hip arthroplasty. Int Orthop. 2010;34(1):19-26.
13. Leslie IJ, Williams S, Isaac G, Ingham E, Fisher J. High cup angle and microseparation increase the wear of hip surface replacements. Clin Orthop. 2009;467(9):2259-2265.
14. Esposito CI, Walter WL, Roques A, et al. Wear in alumina-on-alumina ceramic total hip replacements: a retrieval analysis of edge loading. J Bone Joint Surg Br. 2012;94(7):901-907.
15. Lewinnek GE, Lewis JL, Tarr R, Compere CL, Zimmerman JR. Dislocations after total hip-replacement arthroplasties. J Bone Joint Surg Am. 1978;60(2):217-220.
16. Patel AB, Wagle RR, Usrey MM, Thompson MT, Incavo SJ, Noble PC. Guidelines for implant placement to minimize impingement during activities of daily living after total hip arthroplasty. J Arthroplasty. 2010;25(8):1275-1281.e1.
17. Widmer KH, Zurfluh B. Compliant positioning of total hip components for optimal range of motion. J Orthop Res. 2004;22(4):815-821.
18. Tohtz SW, Sassy D, Matziolis G, Preininger B, Perka C, Hasart O. CT evaluation of native acetabular orientation and localization: sex-specific data comparison on 336 hip joints. Technol Health Care. 2010;18(2):129-136.
19. Merle C, Grammatopoulos G, Waldstein W, et al. Comparison of native anatomy with recommended safe component orientation in total hip arthroplasty for primary osteoarthritis. J Bone Joint Surg Am. 2013;95(22):e172.
20. Nogler M, Kessler O, Prassl A, et al. Reduced variability of acetabular cup positioning with use of an imageless navigation system. Clin Orthop. 2004;(426):159-163.
21. Wixson RL, MacDonald MA. Total hip arthroplasty through a minimal posterior approach using imageless computer-assisted hip navigation. J Arthroplasty. 2005;20(7 suppl 3):51-56.
22. Jolles BM, Genoud P, Hoffmeyer P. Computer-assisted cup placement techniques in total hip arthroplasty improve accuracy of placement. Clin Orthop. 2004;(426):174-179.
23. Lass R, Kubista B, Olischar B, Frantal S, Windhager R, Giurea A. Total hip arthroplasty using imageless computer-assisted hip navigation: a prospective randomized study. J Arthroplasty. 2014;29(4):786-791.
24. Babisch JW, Layher F, Amiot LP. The rationale for tilt-adjusted acetabular cup navigation. J Bone Joint Surg Am. 2008;90(2):357-365.
25. Pellicci PM, Bostrom M, Poss R. Posterior approach to total hip replacement using enhanced posterior soft tissue repair. Clin Orthop. 1998;(355):224-228.
26. Krismer M, Bauer R, Tschupik J, Mayrhofer P. EBRA: a method to measure migration of acetabular components. J Biomech. 1995;28(10):1225-1236.
27. Parratte S, Argenson JN. Validation and usefulness of a computer-assisted cup-positioning system in total hip arthroplasty. A prospective, randomized, controlled study. J Bone Joint Surg Am. 2007;89(3):494-499.
28. Dorr LD, Malik A, Wan Z, Long WT, Harris M. Precision and bias of imageless computer navigation and surgeon estimates for acetabular component position. Clin Orthop. 2007;(465):92-99.
29. Najarian BC, Kilgore JE, Markel DC. Evaluation of component positioning in primary total hip arthroplasty using an imageless navigation device compared with traditional methods. J Arthroplasty. 2009;24(1):15-21.
30. Hohmann E, Bryant A, Tetsworth K. Anterior pelvic soft tissue thickness influences acetabular cup positioning with imageless navigation. J Arthroplasty. 2012;27(6):945-952.
31. Nguyen AD, Shultz SJ. Sex differences in clinical measures of lower extremity alignment. J Orthop Sports Phys Ther. 2007;37(7):389-398.
32. Malik A, Wan Z, Jaramaz B, Bowman G, Dorr LD. A validation model for measurement of acetabular component position. J Arthroplasty. 2010;25(5):812-819.
33. Tannast M, Murphy SB, Langlotz F, Anderson SE, Siebenrock KA. Estimation of pelvic tilt on anteroposterior X-rays—a comparison of six parameters. Skeletal Radiol. 2006;35(3):149-155.
34. Parratte S, Pagnano MW, Coleman-Wood K, Kaufman KR, Berry DJ. The 2008 Frank Stinchfield Award: variation in postoperative pelvic tilt may confound the accuracy of hip navigation systems. Clin Orthop. 2009;467(1):43-49.
35. McCollum DE, Gray WJ. Dislocation after total hip arthroplasty. Causes and prevention. Clin Orthop. 1990;(261):159-170.
36. Kummer FJ, Shah S, Iyer S, DiCesare PE. The effect of acetabular cup orientations on limiting hip rotation. J Arthroplasty. 1999;14(4):509-513.
37. Lin F, Lim D, Wixson RL, Milos S, Hendrix RW, Makhsous M. Limitations of imageless computer-assisted navigation for total hip arthroplasty. J Arthroplasty. 2011;26(4):596-605.
38. Lazennec JY, Riwan A, Gravez F, et al. Hip spine relationships: application to total hip arthroplasty. Hip Int. 2007;17(suppl 5):S91-S104.
39. Trousdale RT, Cabanela ME, Berry DJ. Anterior iliopsoas impingement after total hip arthroplasty. J Arthroplasty. 1995;10(4):546-549.
Postoperative dislocation remains a common complication of primary total hip arthroplasties (THAs), affecting less than 1% to more than 10% in reported series.1,2 In large datasets for modern implants, the incidence of dislocation is 2% to 4%.3,4 Given that more than 200,000 THAs are performed in the United States each year,5 these low percentages represent a large number of patients. The multiplex patient variables that affect THA stability include age, sex, body mass index (BMI), and comorbid conditions.6-8 Surgical approach, restoration of leg length and femoral offset, femoral head size, and component positioning are also important surgical factors that can increase or decrease the incidence of dislocation.3,8,9 In particular, appropriate acetabular component orientation is crucial; surgeons can control this factor and thereby limit the occurrence of dislocation.10 Furthermore, acetabular malpositioning can increase the risk of liner fractures and accelerate bearing-surface wear.11-14
To minimize the risk of postoperative dislocation, surgeons traditionally have targeted the Lewinnek safe zone, with its mean (SD) inclination of 40° (10°) and mean (SD) anteversion of 15° (10°), for acetabular component orientation.15 However, the applicability of this target zone to preventing hip instability using modern implant designs, components, and surgical techniques remains unknown. Achieving acetabular orientation based on maximizing range of motion (ROM) before impingement may be optimal, with anteversion from 20° to 30° and inclination from 40° to 45°.16,17 Furthermore, mean (SD) native acetabular anteversion ranges from 21.3° (6.2°) for men to 24.6° (6.6°) for women.18 Placing THA acetabular components near the native range for anteversion may best provide impingement-free ROM and thus optimize THA stability,16,19 but this has not been proved in a clinical study.
Early dislocation is typically classified as occurring within 6 months after surgery,9 with almost 80% of dislocations occurring within 3 months after surgery.10 Surgeon-specific factors, such as acetabular component positioning, are thought to have a predominant effect on dislocations in the early postoperative period.10 Computer-assisted surgery (CAS), such as imageless navigation, is more accurate than conventional methods for acetabular component placement,20-23 but the clinical relevance of improving accuracy for acetabular component placement has not been shown with respect to altering patient outcomes.23
We conducted a study in a large single-surgeon patient cohort to determine the incidence of early postoperative dislocation with target anteversion increased to 25°, approximating mean native acetabular anteversion.16,19 In addition, we sought to determine the accuracy of imageless navigation in achieving target acetabular component placement.
Materials and Methods
After obtaining institutional review board approval for this retrospective clinical study, we reviewed 671 consecutive cases of primary THA performed by a single surgeon using an imageless CAS system (AchieveCAS; Smith & Nephew, Memphis, Tennessee) between July 2006 and October 2012. THAs were excluded if a metal-on-metal bearing surface was used, if an adequate 6-week postoperative supine anteroposterior (AP) pelvis radiograph was unavailable, or if 6-month clinical follow-up findings were not available (Figure 1). The quality of AP radiographs was deemed poor if they were not centered on the symphysis pubis and if the sacrococcygeal joint was not centered over the symphysis pubis. After exclusion criteria were applied, 553 arthroplasties (479 patients) with a mean (SD) follow-up of 2.4 (1.4) years remained. Perioperative demographic data and component sizes are listed in Table 1.
During surgery, the anterior pelvic plane, defined by the anterior-superior iliac spines and pubic tubercle, was registered with the CAS system with the patient in the supine position. THA was performed with the patient in the lateral decubitus position using a posterolateral technique. For all patients, the surgeon used a hemispherical acetabular component (R3 Acetabular System; Smith & Nephew); bearings that were either metal on highly cross-linked polyethylene (XLPE) or Oxinium (Smith & Nephew) on XLPE; and neutral XLPE acetabular inserts. The goals for acetabular inclination and anteversion were 40° and 25°, respectively, with ±10° each for the target zone. The CAS system was used to adjust target anteversion for sagittal pelvic tilt.24 Uncemented femoral components were used for all patients, and the goal for femoral component anteversion was 15°. Transosseous repair of the posterior capsule and short external rotators was performed after component implantation.25
On each 6-week postoperative radiograph, acetabular orientation was measured with Ein-Bild-Röntgen-Analyse (EBRA; University of Innsbruck, Austria) software, which provides a validated method for measuring acetabular inclination and anteversion on supine AP pelvis radiographs.10,26 Pelvic boundaries were delineated with grid lines defining pelvic position. Reference points around the projections of the prosthetic femoral head, the hemispherical cup, and the rim of the cup were marked (Figure 2). EBRA calculated radiographic inclination and anteversion of the acetabular component based on the spatial position of the cup center in relation to the plane of the radiograph and the pelvic position.26
Charts were reviewed to identify patients with early postoperative dislocations, as well as dislocation timing, recurrence, and other characteristics. We defined early dislocation as instability occurring within 6 months after surgery. Revision surgery for instability was also identified.
For the statistical analysis, orientation error was defined as the absolute value of the difference between target orientation (40° inclination, 25° anteversion) and radiographic measurements. Repeated-measures multiple regression with the generalized estimating equations approach was used to identify baseline patient characteristics (age, sex, BMI, primary diagnosis, laterality) associated with component positioning outside of our targeted ranges for inclination and anteversion. Fisher exact tests were used to examine the relationship between dislocation and component placement in either the Lewinnek safe zone or our targeted zone. All tests were 2-sided with a significance level of .05. All analyses were performed with SAS for Windows 9.3 (SAS Institute, Cary, North Carolina).
Results
Mean (SD) acetabular inclination was 42.2° (4.9°) (range, 27.6°-65.0°), with a mean (SD) orientation error of 4.2° (3.4°) (Figure 3A). Mean (SD) anteversion was 23.9° (6.5°) (range, 6.2°-48.0°), with a mean (SD) orientation error of 5.2° (4.1°) (Figure 3B). Components were placed outside the Lewinnek safe zone for inclination or anteversion in 46.5% of cases and outside the target zone in 17.7% of cases (Figure 4). Variation in acetabular anteversion alone accounted for 67.3% of target zone outliers (Table 2). Only 0.9% of components were placed outside the target ranges for both inclination and anteversion.
Regression analysis was performed separately for inclination and anteversion to determine the risk factors for placing the acetabular component outside the target orientation ranges. Only higher BMI was associated with malposition with respect to inclination (hazard ratio [HR], 1.059; 95% confidence interval [CI], 1.011-1.111; P = .017). Of obese patients with inclination outside the target range, 90.9% had an inclination angle of more than 50°. Associations between inclination outside the target range and age (P = .769), sex (P = .217), preoperative diagnosis (P > .99), and laterality (P = .106) were statistically insignificant. Only female sex was associated with position of the acetabular component outside the target range for anteversion (HR, 1.871; 95% CI, 1.061-3.299; P = .030). Of female patients with anteversion outside the target range, 70.0% had anteversion of less than 15°. Associations between anteversion outside the target range and age (P = .762), BMI (P = .583), preoperative diagnosis (P > .99), and laterality (P = .235) were statistically insignificant.
Six THAs (1.1%) in 6 patients experienced dislocation within 6 months after surgery (Table 3); mean (SD) time of dislocation was 58.3 (13.8) days after surgery. There was no relationship between dislocation incidence and component placement in the Lewinnek zone (P = .224) or our target zone (P = .287). Of the dislocation cases, 50% involved female patients, and 50% involved right hips. Mean (SD) age of these patients was 53.3 (7.6) years. Mean (SD) BMI was 25.4 (0.9) kg/m2. Osteoarthritis was the primary diagnosis for all patients with early dislocation; 32- or 36-mm femoral heads were used in these cases. Two patients had acetabular components placed outside of our target zone. One patient, who had abnormal pelvic obliquity and sagittal tilt from scoliosis (Figures 5A, 5B), had an acetabular component placed outside both the target zone and the Lewinnek safe zone. Mean (SD) acetabular inclination was 39.8° (3.6°), and mean (SD) anteversion was 21.8° (7.3°) (Figure 5C). Two dislocations resulted from trauma, 1 dislocation was related to hyperlaxity, 1 patient had cerebral palsy, and 1 patient had no evident predisposing risk factors. Three patients (0.54%) had multiple episodes of instability requiring revision during the follow-up period.
Discussion
To our knowledge, this study represents the largest cohort of primary THAs performed with an imageless navigation system. Our results showed that increasing targeted acetabular anteversion to 25° using a posterolateral surgical approach and modern implants resulted in a 1.1% incidence of early dislocation and a 0.54% incidence of recurrent instability requiring reoperation. Of the patients with a dislocation, only 1 did not experience trauma and did not have a risk factor for dislocation. Only 1 patient with a dislocation had acetabular components positioned outside both the target zone and the Lewinnek safe zone. The acetabular component was placed within the target zone in 82.3% of cases in which the imageless navigation system was used. In our cohort, BMI was the only risk factor for placement of the acetabular component outside our target range for inclination, and sex was associated with components outside the target range for anteversion.
Early dislocation after THA is often related to improper implant orientation, inadequate restoration of offset and myofascial tension, and decreased femoral head–neck ratio.8 Although dislocation rates in the literature vary widely,1,2 Medicare data suggest that the rate for the first 6 months after surgery can be as high as 4.21%.3,4 Although use of femoral heads with a diameter of 32 mm or larger may decrease this rate to 2.14%,3 accurate acetabular component orientation helps prevent postoperative dislocation.10 Using an imageless navigation system to target 25° of anteversion and 40° of inclination resulted in an early-dislocation rate about 49% less than the rate in a Medicare population treated with similar, modern implants.3
Callanan and colleagues11 found that freehand techniques were inaccurate for acetabular positioning in up to 50% of cases, and several studies have demonstrated that imageless navigation systems were more accurate than conventional guides.20,21,27-29 Higher BMI has been implicated as a risk factor for acetabular malpositioning in several studies of the accuracy of freehand techniques11 and imageless navigation techniques.23,30 Soft-tissue impediment to the component insertion handle poses a risk of increased inclination and inadequate anteversion, regardless of method used (conventional, CAS). When the acetabular component is placed freehand in obese patients, it is difficult to judge the position of the pelvis on the operating room table. For imageless navigation, a larger amount of adipose tissue over bony landmarks may limit the accuracy of anterior pelvic plane registration.30 Sex typically is not cited as a risk factor for inaccurate acetabular component positioning. We speculate that omitted-variable bias may explain the observed association between female sex and anteversion. For example, changes in postoperative pelvic tilt alter apparent anteversion on plain radiographs,31-34 but preoperative and postoperative sagittal pelvic tilt was not recorded in this study.
The proper position of the acetabular component has been debated.15,16,35,36 Although it is generally agreed that inclination of 40° ± 10° balances ROM, stability, and bearing-surface wear,12,13,15,16 proposed targets for anteversion vary widely, from 0° to 40°.35,36 Patel and colleagues16 formulated computer models based on cadaveric specimens to determine that THA impingement was minimized when the acetabular component was placed to match the native anteversion of the acetabulum.In their study model, 20° of anteversion paralleled native acetabular orientation. Tohtz and colleagues18 reviewed computed tomography scans of 144 female hips and 192 male hips and found that mean (SD) anteversion was 24.6° (6.6°) for women and 21.3° (6.2°) for men. Whether native anatomy is a valid reference for acetabular anteversion is controversial,19 and definitive recommendations for target anteversion cannot be made, as the effect of acetabular anteversion on the wear of various bearing materials is unknown.14 Yet, as with inclination, ideal anteversion is likely a compromise between maximizing impingement-free ROM and minimizing wear.
The present study had several limitations. A single-surgeon patient series was reviewed retrospectively, and there was no control group. We determined the incidence only of early dislocation, and 5.3% of THAs that were not metal-on-metal were either lost to follow-up or had inadequate radiographs. However, of the patients excluded for inadequate radiographs, none had an early dislocation. The effects of our surgical techniques on long-term outcomes, bearing wear, and dislocation are unknown. We were not able to comment on the direction of dislocation for any of the 6 patients with early dislocation, as all dislocations were reduced at facilities other than our hospital. Therefore, we cannot determine whether increasing acetabular anteversion resulted in a larger number of anterior versus posterior dislocations.15
We did not use CAS to place any of the femoral components. Therefore, we could not accurately target combined anteversion, defined as the sum of acetabular and femoral version, which may be an important determinant of THA stability.28 Although restoration of femoral offset and leg length is important in preventing THA dislocation,8 the CAS techniques used did not influence these parameters, and they were not measured.
As an imageless navigation system was used, there were no preoperative axial images, which could have been used to assess native acetabular orientation. This limited our assessment with respect to matching each patient’s natural anteversion. Imageless navigation, which references only the anterior pelvic plane, may not be reliable in patients with excessive sagittal pelvic tilt.37 Furthermore, changes in the functional position of the pelvis from supine to sitting to standing were not accounted for, and changes in sagittal tilt between these positions can be significant.38 Changes in sagittal pelvic tilt affect measurement of acetabular anteversion on plain radiographs, with anterior tilt reducing apparent anteversion and posterior tilt increasing it.32,34 Although postoperative computed tomography is the gold standard for assessing acetabular component orientation, EBRA significantly reduces errors of measurement on plain radiographs.10 Some variability in measured anteversion may be explained by our surgical technique. In particular, if the cup was uncovered anteriorly, additional anteversion was usually accepted during surgery to minimize anterior impingement and limit the risk of iliopsoas tendonitis.16,39
Our study results suggested that increasing target acetabular anteversion to 25° may reduce the incidence of early postoperative instability relative to rates reported in the literature. Despite the higher accuracy of component placement with an imageless navigation system, dislocations occurred in patients with acetabular components positioned in our target zone and in the historical safe zone. These dislocations support the notion that there likely is no absolute safe range for acetabular component positioning, as THA stability depends on many factors. Ideal targets for implant orientation for acetabulum and femur may be patient-specific.16,19 Investigators should prospectively evaluate patient-specific THA component positioning and determine its effect on postoperative dislocation and bearing-surface wear. As specific implant targets are further defined, tools that are more precise and accurate than conventional techniques will be needed to achieve goal component positioning. Our study results confirmed that imageless navigation is an accurate method for achieving acetabular orientation targets.
1. Kwon MS, Kuskowski M, Mulhall KJ, Macaulay W, Brown TE, Saleh KJ. Does surgical approach affect total hip arthroplasty dislocation rates? Clin Orthop. 2006;(447):34-38.
2. Sierra RJ, Raposo JM, Trousdale RT, Cabanela ME. Dislocation of primary THA done through a posterolateral approach in the elderly. Clin Orthop. 2005;(441):262-267.
3. Malkani AL, Ong KL, Lau E, Kurtz SM, Justice BJ, Manley MT. Early- and late-term dislocation risk after primary hip arthroplasty in the Medicare population. J Arthroplasty. 2010;25(6 suppl):21-25.
4. Berry DJ, von Knoch M, Schleck CD, Harmsen WS. Effect of femoral head diameter and operative approach on risk of dislocation after primary total hip arthroplasty. J Bone Joint Surg Am. 2005;87(11):2456-2463.
5. Nho SJ, Kymes SM, Callaghan JJ, Felson DT. The burden of hip osteoarthritis in the United States: epidemiologic and economic considerations. J Am Acad Orthop Surg. 2013;21(suppl 1):S1-S6.
6. Sadr Azodi O, Adami J, Lindstrom D, Eriksson KO, Wladis A, Bellocco R. High body mass index is associated with increased risk of implant dislocation following primary total hip replacement: 2,106 patients followed for up to 8 years. Acta Orthop. 2008;79(1):141-147.
7. Conroy JL, Whitehouse SL, Graves SE, Pratt NL, Ryan P, Crawford RW. Risk factors for revision for early dislocation in total hip arthroplasty. J Arthroplasty. 2008;23(6):867-872.
8. Morrey BF. Difficult complications after hip joint replacement. Dislocation. Clin Orthop. 1997;(344):179-187.
9. Ho KW, Whitwell GS, Young SK. Reducing the rate of early primary hip dislocation by combining a change in surgical technique and an increase in femoral head diameter to 36 mm. Arch Orthop Trauma Surg. 2012;132(7):1031-1036.
10. Biedermann R, Tonin A, Krismer M, Rachbauer F, Eibl G, Stockl B. Reducing the risk of dislocation after total hip arthroplasty: the effect of orientation of the acetabular component. J Bone Joint Surg Br. 2005;87(6):762-769.
11. Callanan MC, Jarrett B, Bragdon CR, et al. The John Charnley Award: risk factors for cup malpositioning: quality improvement through a joint registry at a tertiary hospital. Clin Orthop. 2011;469(2):319-329.
12. Gallo J, Havranek V, Zapletalova J. Risk factors for accelerated polyethylene wear and osteolysis in ABG I total hip arthroplasty. Int Orthop. 2010;34(1):19-26.
13. Leslie IJ, Williams S, Isaac G, Ingham E, Fisher J. High cup angle and microseparation increase the wear of hip surface replacements. Clin Orthop. 2009;467(9):2259-2265.
14. Esposito CI, Walter WL, Roques A, et al. Wear in alumina-on-alumina ceramic total hip replacements: a retrieval analysis of edge loading. J Bone Joint Surg Br. 2012;94(7):901-907.
15. Lewinnek GE, Lewis JL, Tarr R, Compere CL, Zimmerman JR. Dislocations after total hip-replacement arthroplasties. J Bone Joint Surg Am. 1978;60(2):217-220.
16. Patel AB, Wagle RR, Usrey MM, Thompson MT, Incavo SJ, Noble PC. Guidelines for implant placement to minimize impingement during activities of daily living after total hip arthroplasty. J Arthroplasty. 2010;25(8):1275-1281.e1.
17. Widmer KH, Zurfluh B. Compliant positioning of total hip components for optimal range of motion. J Orthop Res. 2004;22(4):815-821.
18. Tohtz SW, Sassy D, Matziolis G, Preininger B, Perka C, Hasart O. CT evaluation of native acetabular orientation and localization: sex-specific data comparison on 336 hip joints. Technol Health Care. 2010;18(2):129-136.
19. Merle C, Grammatopoulos G, Waldstein W, et al. Comparison of native anatomy with recommended safe component orientation in total hip arthroplasty for primary osteoarthritis. J Bone Joint Surg Am. 2013;95(22):e172.
20. Nogler M, Kessler O, Prassl A, et al. Reduced variability of acetabular cup positioning with use of an imageless navigation system. Clin Orthop. 2004;(426):159-163.
21. Wixson RL, MacDonald MA. Total hip arthroplasty through a minimal posterior approach using imageless computer-assisted hip navigation. J Arthroplasty. 2005;20(7 suppl 3):51-56.
22. Jolles BM, Genoud P, Hoffmeyer P. Computer-assisted cup placement techniques in total hip arthroplasty improve accuracy of placement. Clin Orthop. 2004;(426):174-179.
23. Lass R, Kubista B, Olischar B, Frantal S, Windhager R, Giurea A. Total hip arthroplasty using imageless computer-assisted hip navigation: a prospective randomized study. J Arthroplasty. 2014;29(4):786-791.
24. Babisch JW, Layher F, Amiot LP. The rationale for tilt-adjusted acetabular cup navigation. J Bone Joint Surg Am. 2008;90(2):357-365.
25. Pellicci PM, Bostrom M, Poss R. Posterior approach to total hip replacement using enhanced posterior soft tissue repair. Clin Orthop. 1998;(355):224-228.
26. Krismer M, Bauer R, Tschupik J, Mayrhofer P. EBRA: a method to measure migration of acetabular components. J Biomech. 1995;28(10):1225-1236.
27. Parratte S, Argenson JN. Validation and usefulness of a computer-assisted cup-positioning system in total hip arthroplasty. A prospective, randomized, controlled study. J Bone Joint Surg Am. 2007;89(3):494-499.
28. Dorr LD, Malik A, Wan Z, Long WT, Harris M. Precision and bias of imageless computer navigation and surgeon estimates for acetabular component position. Clin Orthop. 2007;(465):92-99.
29. Najarian BC, Kilgore JE, Markel DC. Evaluation of component positioning in primary total hip arthroplasty using an imageless navigation device compared with traditional methods. J Arthroplasty. 2009;24(1):15-21.
30. Hohmann E, Bryant A, Tetsworth K. Anterior pelvic soft tissue thickness influences acetabular cup positioning with imageless navigation. J Arthroplasty. 2012;27(6):945-952.
31. Nguyen AD, Shultz SJ. Sex differences in clinical measures of lower extremity alignment. J Orthop Sports Phys Ther. 2007;37(7):389-398.
32. Malik A, Wan Z, Jaramaz B, Bowman G, Dorr LD. A validation model for measurement of acetabular component position. J Arthroplasty. 2010;25(5):812-819.
33. Tannast M, Murphy SB, Langlotz F, Anderson SE, Siebenrock KA. Estimation of pelvic tilt on anteroposterior X-rays—a comparison of six parameters. Skeletal Radiol. 2006;35(3):149-155.
34. Parratte S, Pagnano MW, Coleman-Wood K, Kaufman KR, Berry DJ. The 2008 Frank Stinchfield Award: variation in postoperative pelvic tilt may confound the accuracy of hip navigation systems. Clin Orthop. 2009;467(1):43-49.
35. McCollum DE, Gray WJ. Dislocation after total hip arthroplasty. Causes and prevention. Clin Orthop. 1990;(261):159-170.
36. Kummer FJ, Shah S, Iyer S, DiCesare PE. The effect of acetabular cup orientations on limiting hip rotation. J Arthroplasty. 1999;14(4):509-513.
37. Lin F, Lim D, Wixson RL, Milos S, Hendrix RW, Makhsous M. Limitations of imageless computer-assisted navigation for total hip arthroplasty. J Arthroplasty. 2011;26(4):596-605.
38. Lazennec JY, Riwan A, Gravez F, et al. Hip spine relationships: application to total hip arthroplasty. Hip Int. 2007;17(suppl 5):S91-S104.
39. Trousdale RT, Cabanela ME, Berry DJ. Anterior iliopsoas impingement after total hip arthroplasty. J Arthroplasty. 1995;10(4):546-549.