User login
Official news magazine of the Society of Hospital Medicine
Copyright by Society of Hospital Medicine or related companies. All rights reserved. ISSN 1553-085X
nav[contains(@class, 'nav-ce-stack nav-ce-stack__large-screen')]
header[@id='header']
div[contains(@class, 'header__large-screen')]
div[contains(@class, 'read-next-article')]
div[contains(@class, 'main-prefix')]
div[contains(@class, 'nav-primary')]
nav[contains(@class, 'nav-primary')]
section[contains(@class, 'footer-nav-section-wrapper')]
footer[@id='footer']
section[contains(@class, 'nav-hidden')]
div[contains(@class, 'ce-card-content')]
nav[contains(@class, 'nav-ce-stack')]
div[contains(@class, 'view-medstat-quiz-listing-panes')]
div[contains(@class, 'pane-article-sidebar-latest-news')]
div[contains(@class, 'pane-pub-article-hospitalist')]

In the Literature: Short Takes
A second medical emergency team (MET) activation more likely in patients with recent MET activation
A prospective cohort study examined 471 MET activatios where the patient was not transferred to a higher level of care found that 18% had a second MET event. These second events were more likely to occur in the first 8-12 hours and to occur in patients recently discharged from the ICU.
Citation: Still MD et al. Predictors of a second medical emergency team activation within 24 hours of index event. J Nurs Care Qual 2018;33(2): 157-65
Risk of CV events in patients with TIA or minor stroke decreases significantly after first year
A prospective cohort study following TIA or minor stroke patients from the TIAregistry.org project shows that the risk of additional events (death from cardiovascular cause, nonfatal stroke, or nonfatal acute coronary syndrome) in the following 5 years is 12.9% with half of those events occuring in the first year.
Citation: Amarenco P et al. Five-year risk of stroke after TIA or minor ischemic stroke. N Engl J Med. 2018;378:2182-90.
Maintenance of certification associated with better physician performance scores
Physicians who still participated in Maintenance of Certification (MOC) programs 20 years after their initial certification scored higher on a variety of physician performance scores on Medicare patients.
Citation: Gray BG et al. Associations between American Board of Internal Medicine Maintenance of Certificate status and performance on a set of healthcare effectiveness data and information set (HEDIS) process measures. Ann Intern Med. 2018;169(2):97-105.
CTPA may not rule out VTE in high-risk patients
Clinical question: Does a negative computed tomography pulmonary angiography rule out venous thromboembolism (VTE)?
Background: Computed tomography pulmonary angiography (CTPA) is the most common diagnostic modality used to diagnose pulmonary embolism (PE) and has a high negative predictive value in patients with a low 3-month risk of VTE. In patients with higher pretest probability of PE, it is unknown whether CTPA is sufficient to rule out VTE.

Study design: Meta-analysis.
Setting: Published prospective outcome studies of patients with suspected PE using CTPA as a diagnostic strategy.
Synopsis: The authors reviewed 3,143 publications from MEDLINE, EMBASE, and the Cochrane Library and identified 22 prospective outcome studies to include in their meta-analysis. A VTE was diagnosed in 3,923 out of 11,872 participants (33%) using CTPA. Of the 7,863 patients with a negative CTPA, 148 patients had an acute VTE confirmed by venous ultrasound, ventilation/perfusion scan, or angiography, and 74 patients experienced VTE during a 3-month follow-up period, yielding an overall proportion of 2.4% of patients (95% confidence interval, 1.3%-3.8%).
Subgroup analysis showed that cumulative occurrence of VTE was related to pretest prevalence. In the subgroup of patients with a VTE prevalence greater than 40%, VTE was observed in 8.1% of patients with a negative CTPA (95% CI, 3.4%-14.5%).
Bottom line: CTPA may be insufficient to rule out VTE in patients with a high pretest probability of PE.
Citation: Belzile D et al. Outcomes following a negative computed tomography pulmonary angiography according to pulmonary embolism prevalence: a meta-analysisof the management outcome studies. J Thromb Haemost. 2018 Jun;16(6):1107-20.
Dr. Jenkins is assistant professor of medicine and an academic hospitalist, University of Utah, Salt Lake City.
Clinical question: Does a negative computed tomography pulmonary angiography rule out venous thromboembolism (VTE)?
Background: Computed tomography pulmonary angiography (CTPA) is the most common diagnostic modality used to diagnose pulmonary embolism (PE) and has a high negative predictive value in patients with a low 3-month risk of VTE. In patients with higher pretest probability of PE, it is unknown whether CTPA is sufficient to rule out VTE.
Study design: Meta-analysis.
Setting: Published prospective outcome studies of patients with suspected PE using CTPA as a diagnostic strategy.
Synopsis: The authors reviewed 3,143 publications from MEDLINE, EMBASE, and the Cochrane Library and identified 22 prospective outcome studies to include in their meta-analysis. A VTE was diagnosed in 3,923 out of 11,872 participants (33%) using CTPA. Of the 7,863 patients with a negative CTPA, 148 patients had an acute VTE confirmed by venous ultrasound, ventilation/perfusion scan, or angiography, and 74 patients experienced VTE during a 3-month follow-up period, yielding an overall proportion of 2.4% of patients (95% confidence interval, 1.3%-3.8%).
Subgroup analysis showed that cumulative occurrence of VTE was related to pretest prevalence. In the subgroup of patients with a VTE prevalence greater than 40%, VTE was observed in 8.1% of patients with a negative CTPA (95% CI, 3.4%-14.5%).
Bottom line: CTPA may be insufficient to rule out VTE in patients with a high pretest probability of PE.
Citation: Belzile D et al. Outcomes following a negative computed tomography pulmonary angiography according to pulmonary embolism prevalence: a meta-analysisof the management outcome studies. J Thromb Haemost. 2018 Jun;16(6):1107-20.
Dr. Jenkins is assistant professor of medicine and an academic hospitalist, University of Utah, Salt Lake City.
Flu activity down for second consecutive week
The second week of the new year brought a second straight week of declining activity for the 2018-2019 flu season, according to the Centers for Disease Control and Prevention.
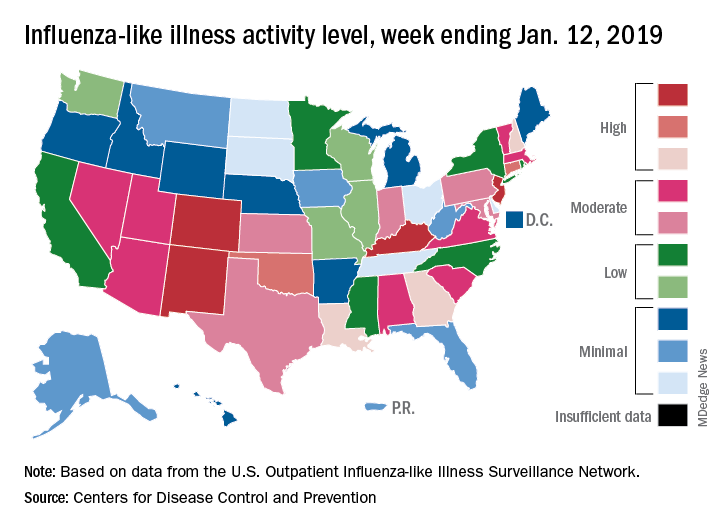
The proportion of outpatient visits for influenza-like illness (ILI) was 3.1% for the week ending Jan. 12, 2019, down from 3.5% the previous week but still above the national baseline level of 2.2%, the CDC’s influenza division reported Jan. 18.
Activity was also down at the state level. There were 4 states – Colorado, Kentucky, New Jersey, and New Mexico – at level 10 on the CDC’s 1-10 scale for ILI activity, compared with 10 the week before, and a total of 9 were in the high range from 8 to 10, compared with 15 the previous week, data from the influenza division show.
Reports of total influenza deaths, which lag a week behind other measures, continue to rise: 111 for the week ending Jan. 5, although reporting is only 72% complete. There were 89 deaths during the previous week, with reporting 82% complete so far. Total flu-related deaths among children are up to 19 for the 2018-2019 season after three more were reported during the week ending Jan. 12, the CDC said. Influenza deaths from the comparable weeks of the much more severe 2017-2018 season were 1,163 for all ages and 10 for children.
The second week of the new year brought a second straight week of declining activity for the 2018-2019 flu season, according to the Centers for Disease Control and Prevention.
The proportion of outpatient visits for influenza-like illness (ILI) was 3.1% for the week ending Jan. 12, 2019, down from 3.5% the previous week but still above the national baseline level of 2.2%, the CDC’s influenza division reported Jan. 18.
Activity was also down at the state level. There were 4 states – Colorado, Kentucky, New Jersey, and New Mexico – at level 10 on the CDC’s 1-10 scale for ILI activity, compared with 10 the week before, and a total of 9 were in the high range from 8 to 10, compared with 15 the previous week, data from the influenza division show.
Reports of total influenza deaths, which lag a week behind other measures, continue to rise: 111 for the week ending Jan. 5, although reporting is only 72% complete. There were 89 deaths during the previous week, with reporting 82% complete so far. Total flu-related deaths among children are up to 19 for the 2018-2019 season after three more were reported during the week ending Jan. 12, the CDC said. Influenza deaths from the comparable weeks of the much more severe 2017-2018 season were 1,163 for all ages and 10 for children.
Intramuscular midazolam superior in sedating acutely agitated adults
Clinical question: How effective are intramuscular midazolam, olanzapine, ziprasidone, and haloperidol at sedating acutely agitated adults in the emergency department?
Background: Acute agitation is commonly seen in the ED and sometimes requires parenteral medications to keep patients and staff safe. Although many medications, including benzodiazepines and antipsychotics, are used, there is no consensus regarding which medications are most effective and safe for acute agitation.
Study design: Prospective observational study.
Setting: Emergency department of an inner-city Level 1 adult and pediatric trauma center.
Synopsis: This study enrolled 737 adults in the ED who presented with acute agitation and treated them with either haloperidol 5 mg, ziprasidone 20 mg, olanzapine 10 mg, midazolam 5 mg, or haloperidol 10 mg intramuscularly, based on predetermined 3-week blocks. The main outcome was the proportion of patients adequately sedated at 15 minutes, based on Altered Mental Status Scale score less than 1. A total of 650 patients (88%) were agitated from alcohol intoxication.

Midazolam resulted in a statistically higher proportion of patients adequately sedated, compared with ziprasidone (difference, 18%; 95% confidence interval, 6%-29%), haloperidol 5 mg (difference, 30%; 95% CI, 19%-41%), and haloperidol 10 mg (difference, 28%; 95% CI,17%-39%). Midazolam resulted in a higher proportion of patients adequately sedated, compared with olanzapine (difference 9%), but this difference was not statistically significant because the confidence interval crossed 1 (95% CI, –1%-20%). Olanzapine resulted in a statistically higher proportion of patients adequately sedated, compared with haloperidol 5 mg (difference 20%; 95% CI, 10%-31%) and 10 mg (difference 18%; 95% CI, 7%-29%). Adverse effects were rare.
Bottom line: Intramuscular midazolam is safe and may be more effective for treating acute agitation in the emergency department than standard antipsychotics.
Citation: Klein LR et al. Intramuscular midazolam, olanzapine, ziprasidone, or haloperidol for treating acute agitation in the emergency department. Ann Emerg Med. 2018 Jun 6. doi: https://doi.org/10.1016/j.annemergmed.2018.04.027.
Dr. Jenkins is assistant professor of medicine and an academic hospitalist, University of Utah, Salt Lake City.
Clinical question: How effective are intramuscular midazolam, olanzapine, ziprasidone, and haloperidol at sedating acutely agitated adults in the emergency department?
Background: Acute agitation is commonly seen in the ED and sometimes requires parenteral medications to keep patients and staff safe. Although many medications, including benzodiazepines and antipsychotics, are used, there is no consensus regarding which medications are most effective and safe for acute agitation.
Study design: Prospective observational study.
Setting: Emergency department of an inner-city Level 1 adult and pediatric trauma center.
Synopsis: This study enrolled 737 adults in the ED who presented with acute agitation and treated them with either haloperidol 5 mg, ziprasidone 20 mg, olanzapine 10 mg, midazolam 5 mg, or haloperidol 10 mg intramuscularly, based on predetermined 3-week blocks. The main outcome was the proportion of patients adequately sedated at 15 minutes, based on Altered Mental Status Scale score less than 1. A total of 650 patients (88%) were agitated from alcohol intoxication.
Midazolam resulted in a statistically higher proportion of patients adequately sedated, compared with ziprasidone (difference, 18%; 95% confidence interval, 6%-29%), haloperidol 5 mg (difference, 30%; 95% CI, 19%-41%), and haloperidol 10 mg (difference, 28%; 95% CI,17%-39%). Midazolam resulted in a higher proportion of patients adequately sedated, compared with olanzapine (difference 9%), but this difference was not statistically significant because the confidence interval crossed 1 (95% CI, –1%-20%). Olanzapine resulted in a statistically higher proportion of patients adequately sedated, compared with haloperidol 5 mg (difference 20%; 95% CI, 10%-31%) and 10 mg (difference 18%; 95% CI, 7%-29%). Adverse effects were rare.
Bottom line: Intramuscular midazolam is safe and may be more effective for treating acute agitation in the emergency department than standard antipsychotics.
Citation: Klein LR et al. Intramuscular midazolam, olanzapine, ziprasidone, or haloperidol for treating acute agitation in the emergency department. Ann Emerg Med. 2018 Jun 6. doi: https://doi.org/10.1016/j.annemergmed.2018.04.027.
Dr. Jenkins is assistant professor of medicine and an academic hospitalist, University of Utah, Salt Lake City.
Obesity paradox applies to post-stroke mortality
CHICAGO – Overweight and obese military veterans who experienced an in-hospital stroke had a lower 30-day and 1-year all-cause mortality than did those who were normal weight in a large national study, Lauren Costa reported at the American Heart Association scientific sessions.
Underweight patients had a significantly increased mortality risk, added Ms. Costa of the VA Boston Healthcare System.
It’s yet another instance of what is known as the obesity paradox, which has also been described in patients with heart failure, acute coronary syndrome, MI, chronic obstructive pulmonary disease, and other conditions.
Ms. Costa presented a retrospective study of 26,267 patients in the Veterans Health Administration database who had a first stroke in-hospital during 2002-2012. There were subsequently 14,166 deaths, including 2,473 within the first 30 days and 5,854 in the first year post stroke.
Each patient’s body mass index was calculated based on the average of all BMI measurements obtained 1-24 months prior to the stroke. The analysis of the relationship between BMI and poststroke mortality included extensive statistical adjustment for potential confounders, including age, sex, smoking, cancer, dementia, peripheral artery disease, diabetes, coronary heart disease, atrial fibrillation, chronic kidney disease, use of statins, and antihypertensive therapy.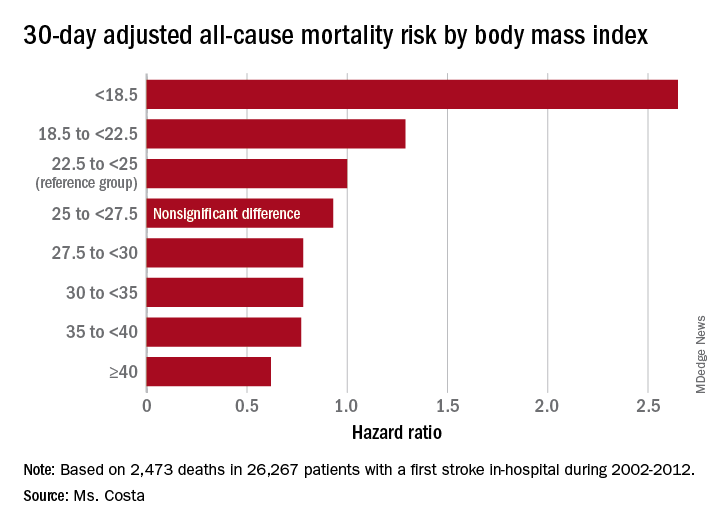
Breaking down the study population into eight BMI categories, Ms. Costa found that the adjusted risk of 30-day all-cause mortality post stroke was reduced by 22%-38% in patients in the overweight or obese groupings, compared with the reference population with a normal-weight BMI of 22.5 to less than 25 kg/m2.
One-year, all-cause mortality showed the same pattern of BMI-based significant differences.
Of deaths within 30 days post stroke, 34% were stroke-related. In an analysis restricted to that group, the evidence of an obesity paradox was attenuated. Indeed, the only BMI group with an adjusted 30-day stroke-related mortality significantly different from the normal-weight reference group were patients with Class III obesity, defined as a BMI of 40 or more. Their risk was reduced by 45%.
The obesity paradox remains a controversial issue among epidemiologists. The increased mortality associated with being underweight among patients with diseases where the obesity paradox has been documented is widely thought to be caused by frailty and/or an underlying illness not adjusted for in analyses. But the mechanism for the reduced mortality risk in overweight and obese patients seen in the VA stroke study and other studies remains unknown despite much speculation.
Ms. Costa reported having no financial conflicts regarding her study, which was supported by the Department of Veterans Affairs.
SOURCE: Costa L. Circulation. 2018;138(suppl 1): Abstract 14288.
REPORTING FROM THE AHA SCIENTIFIC SESSIONS
Key clinical point: Heavier stroke patients have lower 30-day and 1-year all-cause mortality.
Major finding: The 30-day stroke-related mortality rate after in-hospital stroke was reduced by 45% in VA patients with Class III obesity.
Study details: This retrospective study looked at the relationship between body mass index and post-stroke mortality in more than 26,000 veterans who had an inpatient stroke, with extensive adjustments made for potential confounders.
Disclosures: The presenter reported having no financial conflicts regarding the study, which was sponsored by the Department of Veterans Affairs.
Source: Costa L. Circulation. 2018;138(suppl 1): Abstract 14288.
Metformin associated with acidosis only in patients with eGFR 30 mL/min per 1.73 m 2
Clinical question: Does metformin increase the risk of lactic acidosis in chronic kidney disease (CKD)?
Background: Metformin is first-line therapy for type 2 diabetes mellitus (DM) because of its low cost, safety, and potential cardiovascular benefit, but fear of lactic acidosis has limited its use in CKD. The risk of acidosis in CKD patients with varying levels of renal function has not been clearly defined.
Study design: Retrospective community-based cohort study.
Setting: Geisinger Health System in Pennsylvania.
Synopsis: A total of 75,413 patients were identified with diagnostic codes or medication prescriptions indicating DM. Forty-five percent of patients were taking metformin at enrollment, increasing by 18% over the 5.7 years of median follow-up. The primary outcome was inpatient acidosis, defined by an ICD-9-CM code capturing multiple forms of acidosis but excluding diabetic ketoacidosis.
When metformin users and nonusers were compared, risk of acidosis was similar for the entire cohort and for subgroups of patients with an estimated glomerular filtration rate (eGFR) greater than 90, 60-89, 45-59, and 30-44. Conversely, metformin use was associated with a higher risk of acidosis in patients with eGFR less than 30 (adjusted hazard ratio, 2.07; 95% confidence interval, 1.33-3.22). Metformin not increasing the risk of acidosis at eGFR greater than 30 also was noted in an additional analysis using sulfonylurea medications as an active comparator and was replicated in a separate database with 82,000 patients from 350 private health systems. As with all observational studies, this study is limited by the potential for residual confounding.
Bottom line: Metformin appears to be safe in CKD patients with eGFR above 30 mL/min per 1.73 m2.
Citation: Lazarus B et al. Association of metformin use with risk of lactic acidosis across the range of kidney function: A community- based cohort study. JAMA Int Med. 2018;178(7):903-10.
Dr. Wanner is director, hospital medicine section, and associate chief, division of general internal medicine, University of Utah, Salt Lake City.
More than 23% of antibiotic fills deemed unnecessary
More than 23% of all antibiotic prescriptions filled in 2016 were medically unnecessary, and another 36% were questionable, according to an analysis of prescribing data for 19.2 million children and nonelderly adults.
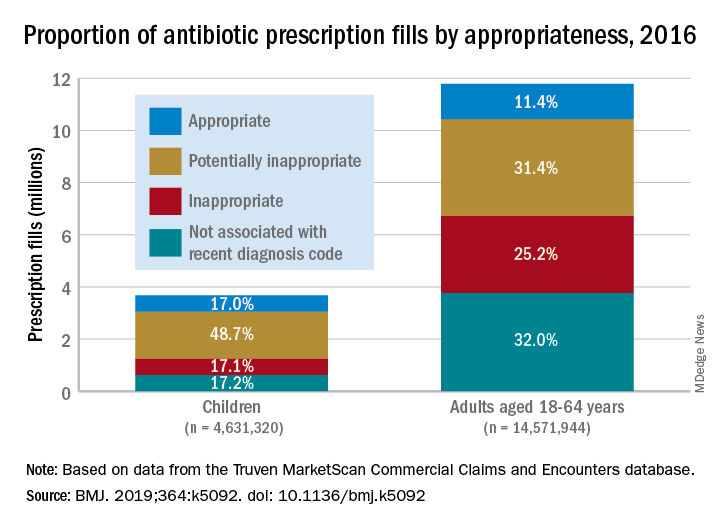
Based on the diagnosis codes for 15.5 million prescriptions filled that year, at least 3.6 million (23.2%) were “inappropriate” – prescribed for conditions for which an antibiotic is almost never recommended, such as acute upper respiratory conditions – and 5.5 million (35.5%) were “potentially inappropriate” – conditions such as acute sinusitis or otitis media, for which an antibiotic is only sometimes recommended, Kao-Ping Chua, MD, PhD, of the University of Michigan, Ann Arbor, and his associates reported in the BMJ.
Only 12.8% of filled prescriptions for the 39 oral antibiotics assessed were classified as “appropriate” under the investigators’ scheme, which assigned an antibiotic appropriateness level to all 91,738 diagnostic codes in the 2016 ICD-10-CM. Finally, 28.5% of antibiotic fills were not associated with a recent diagnosis code, suggesting that they involved phone consultations that did not result in claims or visits that were paid out of pocket and did not make it into the Truven MarketScan Commercial Claims and Encounters database used in the study, the investigators said.
The three highest levels of inappropriate fills were 70.7% in office-based settings, 6.2% in urgent care centers, and 4.7% in emergency departments.
“The unacceptable scale of inappropriate antibiotic prescribing in the United States ... underscores the need to learn more about prescriptions that aren’t justified by a diagnosis – or are written after no diagnosis at all,” coinvestigator Jeffrey Linder, MD, of Northwestern University, Chicago, said in a written statement.
Prescriptions for children, who represented almost a quarter of all antibiotic fills, were less likely to be inappropriate than those for adults aged 18-64 years. Proportions for children were 17.1% inappropriate, 48.7% potentially inappropriate, and 17.0% appropriate, compared with 25.2%, 31.4%, and 11.4%, respectively, for adults, Dr. Chua and his associates said.
“This study shows how data and analytics can help us identify and understand important challenges facing the American health care system,” said Gopal Khanna, director of the Agency for Healthcare Research and Quality, which funded the study. “We now need to use these data to spur change in the prescribing of these very common medications.”
SOURCE: Chua K-P et al. BMJ. 2019;364:k5092. doi: 10.1136/bmj.k5092.
More than 23% of all antibiotic prescriptions filled in 2016 were medically unnecessary, and another 36% were questionable, according to an analysis of prescribing data for 19.2 million children and nonelderly adults.
Based on the diagnosis codes for 15.5 million prescriptions filled that year, at least 3.6 million (23.2%) were “inappropriate” – prescribed for conditions for which an antibiotic is almost never recommended, such as acute upper respiratory conditions – and 5.5 million (35.5%) were “potentially inappropriate” – conditions such as acute sinusitis or otitis media, for which an antibiotic is only sometimes recommended, Kao-Ping Chua, MD, PhD, of the University of Michigan, Ann Arbor, and his associates reported in the BMJ.
Only 12.8% of filled prescriptions for the 39 oral antibiotics assessed were classified as “appropriate” under the investigators’ scheme, which assigned an antibiotic appropriateness level to all 91,738 diagnostic codes in the 2016 ICD-10-CM. Finally, 28.5% of antibiotic fills were not associated with a recent diagnosis code, suggesting that they involved phone consultations that did not result in claims or visits that were paid out of pocket and did not make it into the Truven MarketScan Commercial Claims and Encounters database used in the study, the investigators said.
The three highest levels of inappropriate fills were 70.7% in office-based settings, 6.2% in urgent care centers, and 4.7% in emergency departments.
“The unacceptable scale of inappropriate antibiotic prescribing in the United States ... underscores the need to learn more about prescriptions that aren’t justified by a diagnosis – or are written after no diagnosis at all,” coinvestigator Jeffrey Linder, MD, of Northwestern University, Chicago, said in a written statement.
Prescriptions for children, who represented almost a quarter of all antibiotic fills, were less likely to be inappropriate than those for adults aged 18-64 years. Proportions for children were 17.1% inappropriate, 48.7% potentially inappropriate, and 17.0% appropriate, compared with 25.2%, 31.4%, and 11.4%, respectively, for adults, Dr. Chua and his associates said.
“This study shows how data and analytics can help us identify and understand important challenges facing the American health care system,” said Gopal Khanna, director of the Agency for Healthcare Research and Quality, which funded the study. “We now need to use these data to spur change in the prescribing of these very common medications.”
SOURCE: Chua K-P et al. BMJ. 2019;364:k5092. doi: 10.1136/bmj.k5092.
FROM THE BMJ
Prioritize oral route for inpatient opioids with subcutaneous route as alternative
Clinical question: Can adoption of a local opioid standard of practice for hospitalized patients reduce intravenous and overall opioid exposure while providing effective pain control?
Background: Inpatient use of intravenous opioids may be excessive, considering that oral opioids may provide more consistent pain control with less risk of adverse effects. If oral treatment is not possible, subcutaneous administration of opioids is an effective and possibly less addictive alternative to the intravenous route.
Study design: Historical control pilot study.
Setting: Single adult general medicine unit in an urban academic medical center.

Synopsis: A 6-month historical period with 287 patients was compared with a 3-month intervention period with 127 patients. The intervention consisted of a clinical practice standard that was presented to medical and nursing staff via didactic sessions and email. The standard recommended the oral route for opioids in patients tolerating oral intake and endorsed subcutaneous over intravenous administration.
Intravenous doses decreased by 84% (0.06 vs. 0.39 doses/patient-day; P less than .001), the daily rate of patients receiving any parenteral opioid decreased by 57% (6% vs. 14%; P less than .001), and the mean daily overall morphine-milligram equivalents decreased by 31% (6.30 vs. 9.11). Pain scores were unchanged for hospital days 1 through 3 but were significantly improved on day 4 (P = .004) and day 5 (P = .009).
Limitations of this study include the small number of patients on one unit, in one institution, with one clinician group. Attractive features of the intervention include its scalability and potential for augmentation via additional processes such as EHR changes, prescribing restrictions, and pharmacy monitoring.
Bottom line: A standard of practice intervention with peer-to-peer education was associated with decreased intravenous opioid exposure, decreased total opioid exposure, and effective pain control.
Citation: Ackerman AL et al. Association of an opioid standard of practice intervention with intravenous opioid exposure in hospitalized patients. JAMA Int Med. 2018;178(6):759-63.
Dr. Wanner is director, hospital medicine section, and associate chief, division of general internal medicine, University of Utah, Salt Lake City.
Clinical question: Can adoption of a local opioid standard of practice for hospitalized patients reduce intravenous and overall opioid exposure while providing effective pain control?
Background: Inpatient use of intravenous opioids may be excessive, considering that oral opioids may provide more consistent pain control with less risk of adverse effects. If oral treatment is not possible, subcutaneous administration of opioids is an effective and possibly less addictive alternative to the intravenous route.
Study design: Historical control pilot study.
Setting: Single adult general medicine unit in an urban academic medical center.
Synopsis: A 6-month historical period with 287 patients was compared with a 3-month intervention period with 127 patients. The intervention consisted of a clinical practice standard that was presented to medical and nursing staff via didactic sessions and email. The standard recommended the oral route for opioids in patients tolerating oral intake and endorsed subcutaneous over intravenous administration.
Intravenous doses decreased by 84% (0.06 vs. 0.39 doses/patient-day; P less than .001), the daily rate of patients receiving any parenteral opioid decreased by 57% (6% vs. 14%; P less than .001), and the mean daily overall morphine-milligram equivalents decreased by 31% (6.30 vs. 9.11). Pain scores were unchanged for hospital days 1 through 3 but were significantly improved on day 4 (P = .004) and day 5 (P = .009).
Limitations of this study include the small number of patients on one unit, in one institution, with one clinician group. Attractive features of the intervention include its scalability and potential for augmentation via additional processes such as EHR changes, prescribing restrictions, and pharmacy monitoring.
Bottom line: A standard of practice intervention with peer-to-peer education was associated with decreased intravenous opioid exposure, decreased total opioid exposure, and effective pain control.
Citation: Ackerman AL et al. Association of an opioid standard of practice intervention with intravenous opioid exposure in hospitalized patients. JAMA Int Med. 2018;178(6):759-63.
Dr. Wanner is director, hospital medicine section, and associate chief, division of general internal medicine, University of Utah, Salt Lake City.
Lower grip strength associated with worse health outcomes
Background: Previous studies have shown that lower muscle function is associated with increased mortality; however, studies have not been able to fully examine associations with age and disease-specific mortality.
Study design: Prospective, population-based study.
Setting: Large population cohort in the United Kingdom (UK Biobank).
Synopsis: The UK Biobank population included 502,293 individuals, aged 40-69 years, recruited during April 2007–December 2010, with grip strength data available. Mean follow-up was 7.1 years for all-cause and disease-specific mortality. Cox proportional hazard models were used to report hazard ratios (HR) per 5-kg decrease in grip strength and were controlled for multiple sociodemographic and lifestyle factors. A lower grip strength was found to correlate with all-cause mortality (HR, 1.16 in women; HR, 1.20 in men) as well as incidence of and mortality from cardiovascular disease, respiratory disease, and cancer. Hazard ratios were higher among younger age groups with similar lower grip strength. The use of grip strength also improved the prediction of an office-based mortality risk score from cardiovascular disease.
Bottom line: Grip strength is a useful and easy-to-obtain measurement that is associated with all-cause and disease-specific morbidity and can be used to improve the prediction of an office-based risk score.
Citation: Celis-Morales CA et al. Associations of grip strength with cardiovascular, respiratory, and cancer outcomes and all-cause mortality: Prospective cohort study of half a million UK Biobank participants. BMJ. 2018;361:k1651.
Dr. Marr is assistant professor of medicine and an academic hospitalist, University of Utah, Salt Lake City.
NIH announces new clinical trial assessing FMT for recurrent CDAD
A clinical trial has begun which will examine whether fecal microbiota transplantation (FMT) by enema is safe and can prevent recurrent Clostridium difficile–associated disease (CDAD), according to a press release from the National Institutes of Health.

CDAD is normally treated with antibiotics such as vancomycin or fidaxomicin; however, it recurs in about 20% of people who receive this treatment. FMT is effective at curing patients with recurring C. diff infections, but long-term safety and a standardized process have yet to be established.
An estimated 162 people aged 18 years or older who have had two or more episodes of CDAD within the previous 6 months will be included in the clinical trial. These patients will be split into two groups: The first will receive an antidiarrheal medication and an FMT delivered by retention enema; the second will receive an antidiarrheal and a placebo colored to look like an active stool sample.
All patients will provide stool and blood samples at designated time points for 1 year after they undergo treatment for CDAD. Stool samples will be examined for gut microbial diversity changes and infectious pathogens; blood samples will be examined for metabolic syndrome markers.
“Clostridium difficile–associated disease, a significant problem in health care facilities, causes an estimated 15,000 deaths in the United States each year. This randomized, controlled trial aims to provide critical data on the efficacy and long-term safety of using fecal microbiota transplants by enema to cure C. diff infections,” NIAID director Anthony S. Fauci, MD, said in the press release.
The full trial page can be found at Clinicaltrials.gov.
A clinical trial has begun which will examine whether fecal microbiota transplantation (FMT) by enema is safe and can prevent recurrent Clostridium difficile–associated disease (CDAD), according to a press release from the National Institutes of Health.
CDAD is normally treated with antibiotics such as vancomycin or fidaxomicin; however, it recurs in about 20% of people who receive this treatment. FMT is effective at curing patients with recurring C. diff infections, but long-term safety and a standardized process have yet to be established.
An estimated 162 people aged 18 years or older who have had two or more episodes of CDAD within the previous 6 months will be included in the clinical trial. These patients will be split into two groups: The first will receive an antidiarrheal medication and an FMT delivered by retention enema; the second will receive an antidiarrheal and a placebo colored to look like an active stool sample.
All patients will provide stool and blood samples at designated time points for 1 year after they undergo treatment for CDAD. Stool samples will be examined for gut microbial diversity changes and infectious pathogens; blood samples will be examined for metabolic syndrome markers.
“Clostridium difficile–associated disease, a significant problem in health care facilities, causes an estimated 15,000 deaths in the United States each year. This randomized, controlled trial aims to provide critical data on the efficacy and long-term safety of using fecal microbiota transplants by enema to cure C. diff infections,” NIAID director Anthony S. Fauci, MD, said in the press release.
The full trial page can be found at Clinicaltrials.gov.