User login
Pigmented palmar lesions

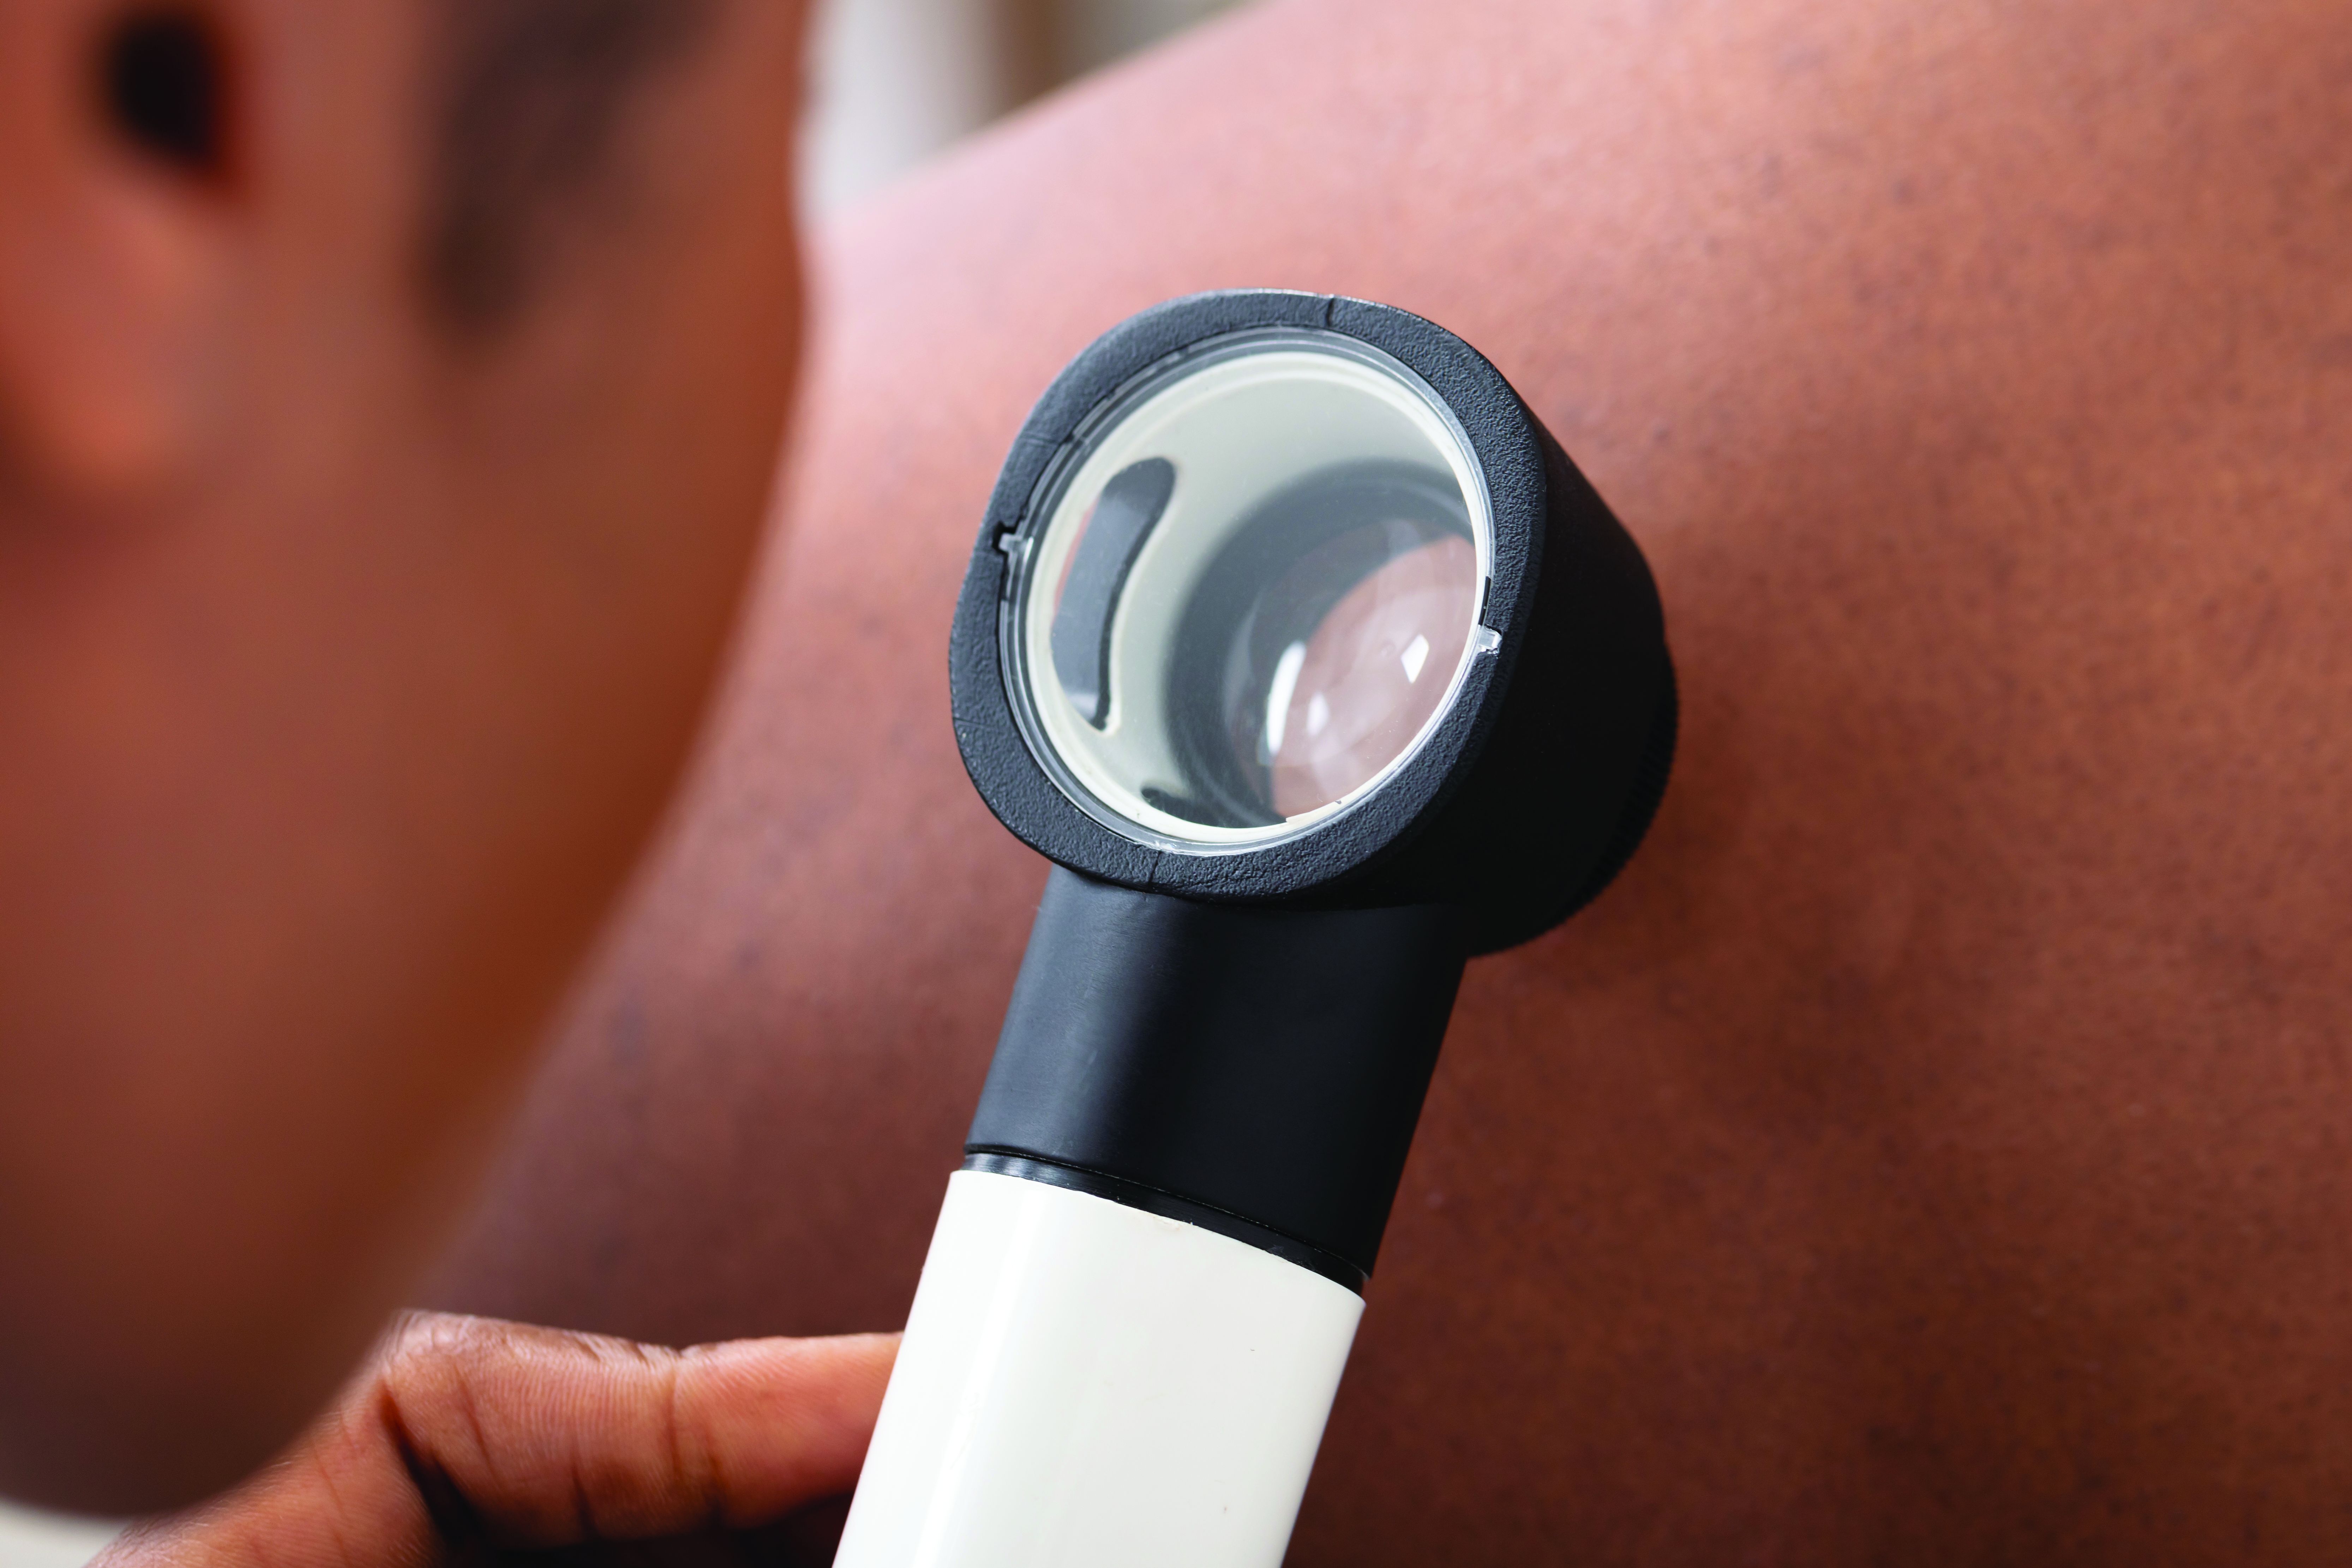
Fortunately, the dermoscopy images of these 2 small palmar lesions showed a pattern of pigmentation that aligned in the furrows and was consistent with benign palmar nevi.
It is not uncommon to have nevi on the palms or soles of the feet, so it is important to distinguish between acral lentiginous melanoma (ALM) and benign nevi. ALM is the least common form of melanoma. In contrast to other types of melanoma, it is not considered secondary to excessive sun exposure. Clinically, ALM presents with irregular, enlarging pigmentation that follows, or crosses, the raised ridges of the palms or soles.1 The pigmented areas can progress to ulcerated or bleeding lesions. As with other melanomas, early diagnosis and removal is important to optimize prognosis.
Removal of lesions suspicious for ALM can be achieved in several ways: deep shave biopsy, punch excision if the lesion is small, excision with narrow margins, or, if the lesion is large, by a selective punch biopsy of the most suspicious portion of the lesion (typically the thickest and most irregular area). Larger diameter lesions that are raised and irregular are more worrisome than this patient’s 2-mm macular lesions.
In this case, the patient was reassured that the lesions did not require excision. She was advised to continue to monitor her lesions for growth or changes over time and to return for evaluation, as needed. She was also counseled regarding the American Cancer Society’s ABCDE rules (Asymmetry, Border irregularity, Color, Diameter, Elevation or Evolving) regarding melanomas.
Photo and text courtesy of Daniel Stulberg, MD, FAAFP, Department of Family and Community Medicine, University of New Mexico School of Medicine, Albuquerque
1. Hall KH, Rapini RP. Acral lentiginous melanoma. In: StatPearls [Internet]. StatPearls Publishing; 2020. Accessed April 5, 2021. https://www.ncbi.nlm.nih.gov/books/NBK559113/
Fortunately, the dermoscopy images of these 2 small palmar lesions showed a pattern of pigmentation that aligned in the furrows and was consistent with benign palmar nevi.
It is not uncommon to have nevi on the palms or soles of the feet, so it is important to distinguish between acral lentiginous melanoma (ALM) and benign nevi. ALM is the least common form of melanoma. In contrast to other types of melanoma, it is not considered secondary to excessive sun exposure. Clinically, ALM presents with irregular, enlarging pigmentation that follows, or crosses, the raised ridges of the palms or soles.1 The pigmented areas can progress to ulcerated or bleeding lesions. As with other melanomas, early diagnosis and removal is important to optimize prognosis.
Removal of lesions suspicious for ALM can be achieved in several ways: deep shave biopsy, punch excision if the lesion is small, excision with narrow margins, or, if the lesion is large, by a selective punch biopsy of the most suspicious portion of the lesion (typically the thickest and most irregular area). Larger diameter lesions that are raised and irregular are more worrisome than this patient’s 2-mm macular lesions.
In this case, the patient was reassured that the lesions did not require excision. She was advised to continue to monitor her lesions for growth or changes over time and to return for evaluation, as needed. She was also counseled regarding the American Cancer Society’s ABCDE rules (Asymmetry, Border irregularity, Color, Diameter, Elevation or Evolving) regarding melanomas.
Photo and text courtesy of Daniel Stulberg, MD, FAAFP, Department of Family and Community Medicine, University of New Mexico School of Medicine, Albuquerque
1. Hall KH, Rapini RP. Acral lentiginous melanoma. In: StatPearls [Internet]. StatPearls Publishing; 2020. Accessed April 5, 2021. https://www.ncbi.nlm.nih.gov/books/NBK559113/
1. Hall KH, Rapini RP. Acral lentiginous melanoma. In: StatPearls [Internet]. StatPearls Publishing; 2020. Accessed April 5, 2021. https://www.ncbi.nlm.nih.gov/books/NBK559113/

Cushing’s death rate ‘unacceptable,’ triple that of general population
Excess mortality among people with endogenous Cushing’s syndrome (CS) has declined in the past 20 years yet remains three times higher than in the general population, new research finds.
Among more than 90,000 individuals with endogenous CS, the overall proportion of mortality – defined as the ratio of the number of deaths from CS divided by the total number of CS patients – was 0.05, and the standardized mortality rate was an “unacceptable” three times that of the general population, Padiporn Limumpornpetch, MD, reported on March 20 at ENDO 2021: The Endocrine Society Annual Meeting.
Excess deaths were higher among those with adrenal CS, compared with those with Cushing’s disease. The most common causes of death among those with CS were cardiovascular diseases, cerebrovascular accident, infection, and malignancy, noted Dr. Limumpornpetch, of Songkla University, Hat Yai, Thailand, who is also a PhD student at the University of Leeds, United Kingdom.
“While mortality has improved since 2000, it is still significantly compromised compared to the background population ... The causes of death highlight the need for aggressive management of cardiovascular risk, prevention of thromboembolism, infection control, and a normalized cortisol level,” she said.
Asked to comment, Maria Fleseriu, MD, told this news organization that the new data show “we are making improvements in the care of patients with CS and thus outcomes, but we are not there yet ... This meta-analysis highlights the whole spectrum of acute and life-threatening complications in CS and their high prevalence, even before disease diagnosis and after successful surgery.”
She noted that although she wasn’t surprised by the overall results, “the improvement over time was indeed lower than I expected. However, interestingly here, the risk of mortality in adrenal Cushing’s was unexpectedly high despite patients with adrenal cancer being excluded.”
Dr. Fleseriu, who is director of the Pituitary Center at Oregon Health and Science University, Portland, advised, “Management of hyperglycemia and diabetes, hypertension, hypokalemia, hyperlipidemia, and other cardiovascular risk factors is generally undertaken in accordance with standard of clinical care.”
“But we should focus more on optimizing more aggressively this care in addition to the specific Cushing’s treatment,” she stressed.
In addition, she noted, “Medical therapy for CS may be needed even prior to surgery in severe and/or prolonged hypercortisolism to decrease complications ... We definitely need a multidisciplinary approach to address complications and etiologic treatment as well as the reduced long-term quality of life in patients with CS.”
Largest study in scale and scope of Cushing’s syndrome mortality
Endogenous Cushing’s syndrome occurs when the body overproduces cortisol. The most common cause of the latter is a tumor of the pituitary gland (Cushing’s disease), but another cause is a usually benign tumor of the adrenal glands (adrenal Cushing’s syndrome). Surgery is the mainstay of initial treatment of Cushing’s syndrome. If an operation to remove the tumor fails to cause remission, medications are available.
Prior to this new meta-analysis, there had been limited data on mortality among patients with endogenous CS. Research has mostly been limited to single-cohort studies. A previous systematic review/meta-analysis comprised only seven articles with 780 patients. All the studies were conducted prior to 2012, and most were limited to Cushing’s disease.
“In 2021, we lacked a detailed understanding of patient outcomes and mortality because of the rarity of Cushing’s syndrome,” Dr. Limumpornpetch noted.
The current meta-analysis included 91 articles that reported mortality among patients with endogenous CS. There was a total of 19,181 patients from 92 study cohorts, including 49 studies on CD (n = 14,971), 24 studies on adrenal CS (n = 2304), and 19 studies that included both (n = 1906).
Among 21 studies that reported standardized mortality rate (SMR) data, including 13 CD studies (n = 2160) and seven on adrenal CS (n = 1531), the overall increase in mortality compared to the background population was a significant 3.00 (range, 1.15-7.84).
This SMR was higher among patients with adrenal Cushing’s syndrome (3.3) versus Cushing’s disease (2.8) (P = .003) and among patients who had active disease (5.7) versus those whose disease was in remission (2.3) (P < .001).
The SMR was also worse among patients with Cushing’s disease with larger tumors (macroadenomas), at 7.4, than among patients with very small tumors (microadenomas), at 1.9 (P = .004).
The proportion of death was 0.05 for CS overall, with 0.04 for CD and 0.02 for adrenal adenomas.
Compared to studies published prior to the year 2000, more recent studies seem to reflect advances in treatment and care. The overall proportion of death for all CS cohorts dropped from 0.10 to 0.03 (P < .001); for all CD cohorts, it dropped from 0.14 to 0.03; and for adrenal CS cohorts, it dropped from 0.09 to 0.03 (P = .04).
Causes of death were cardiovascular diseases (29.5% of cases), cerebrovascular accident (11.5%), infection (10.5%), and malignancy (10.1%). Less common causes of death were gastrointestinal bleeding and acute pancreatitis (3.7%), active CS (3.5%), adrenal insufficiency (2.5%), suicide (2.5%), and surgery (1.6%).
Overall, in the CS groups, the proportion of deaths within 30 days of surgery dropped from 0.04 prior to 2000 to 0.01 since (P = .07). For CD, the proportion dropped from 0.02 to 0.01 (P = .25).
Preventing perioperative mortality: Consider thromboprophylaxis
Dr. Fleseriu told this news organization that she believes hypercoagulability is “the least recognized complication with a big role in mortality.” Because most of the perioperative mortality is due to venous thromboembolism and infections, “thromboprophylaxis should be considered for CS patients with severe hypercortisolism and/or postoperatively, based on individual risk factors of thromboembolism and bleeding.”
Recently, Dr. Fleseriu’s group showed in a single retrospective study that the risk for arterial and venous thromboembolic events among patients with CS was approximately 20%. Many patients experienced more than one event. Risk was higher 30 to 60 days postoperatively.
The odds ratio of venous thromoboembolism among patients with CS was 18 times higher than in the normal population.
“Due to the additional thrombotic risk of surgery or any invasive procedure, anticoagulation prophylaxis should be at least considered in all patients with Cushing’s syndrome and balanced with individual bleeding risk,” Dr. Fleseriu advised.
A recent Pituitary Society workshop discussed the management of complications of CS at length; proceedings will be published soon, she noted.
Dr. Limumpornpetch commented, “We look forward to the day when our interdisciplinary approach to managing these challenging patients can deliver outcomes similar to the background population.”
Dr. Limumpornpetch has disclosed no relevant financial relationships. Dr. Fleseriu has been a scientific consultant to Recordati, Sparrow, and Strongbridge and has received grants (inst) from Novartis and Strongbridge.
A version of this article first appeared on Medscape.com.
Boosting the presence of darker skin in rheumatology education
Studies are flagging racial and ethnic disparities in rheumatology training materials, pointing to a need to boost representation of darker skin tones and better educate physicians in evaluating this cohort.
Not enough is known about these disparities in rheumatology education, despite the fact that minorities make up 40% of the population in the United States.
The problem starts with books and references used in medical schools, Lynn McKinley-Grant, MD, immediate past president of the Skin of Color Society and associate professor of dermatology at Howard University, Washington, said in an interview. “In the medical literature there has been a dearth of images in skin of color in all specialties,” she said. With an increased diversity in the U.S. population, there is a need for health care providers to be able to recognize disease patterns in all skin types.” If a physician is training at an institution where there are not many patients of color in the community, the rheumatologists are even more limited in terms of their clinical experience.
This lack of training in diagnosis of disease has serious clinical repercussions, as seen in COVID cases, Dr. McKinley-Grant noted. “You end up not being able to recognize early erythema, jaundice, anemia, or hypoxemia because those conditions are a different color or pattern in the darker skin types. This can lead to errors in treatment, diagnosis, and medical care, resulting in increased morbidity and mortality.”
Studies point to education gaps
A team of researchers from Washington University in St. Louis called attention to this issue at the American College of Rhematology’s Convergence 2020 conference.
“Patients of color with lupus are especially vulnerable as they often carry a greater disease burden, yet studies show that individuals with darker skin tones are underrepresented in medical educational materials,” Vijay Kannuthurai, MD, and colleagues wrote in their study abstract. The team surveyed 132 providers in St. Louis, Mo., on their confidence in evaluating any rash, and rashes in patients with lupus and varied skin tones.
Participating clinicians, mostly rheumatologists, dermatologists, or internists, had a higher confidence level in diagnosing any rash versus lupus rashes, but were considerably less confident in diagnosing lupus rash on darker skin, compared with those on fair skin. This represents “a disparity between provider confidence and the patient population lupus traditionally affects,” the investigators concluded.
Another recent study found evidence of disparities in clinical education resources. “The lack of dark skin representation among rheumatology educational materials contributes to the implicit bias and structural racism present in medical education by promoting White-only models of disease,” lead author Adrienne Strait, a medical student at the University of California, San Francisco, said in an interview. “Given that rheumatic diseases disproportionately impact racial and ethnic minorities, we felt it was important to examine the representation of these groups within rheumatology training resources.”

She and her colleagues gathered images of rheumatic diseases from four major databases: the American College of Rheumatology’s Image Library, UpToDate, the New England Journal of Medicine Images in Clinical Medicine and Clinical Cases filtered by “Rheumatology,” and the 9th edition of Kelley’s Textbook of Rheumatology. They used Fitzpatrick’s skin phototypes to independently code images depicting skin as “light” (skin types I-IV), “dark” (skin types V-VI), or “indeterminate,” focusing on systemic lupus erythematosus (SLE) and rheumatoid arthritis, two conditions with a known connection to racial and ethnic health disparities.
Taking into account the high incidence of sarcoidosis and SLE in Black patients when compared with White patients, the investigators did a secondary analysis that excluded these cases.
Among 1,043 patient images studied, just 13.4% represented dark skin, compared with 84% that represented light skin. More than 2% represented an indeterminate skin color. Comparing dark-skin representation in the clinical images and SLE images with the representation of Asian, Native American, and Black individuals in the United States and within lupus cases nationally, the investigators found significant underrepresentation of dark skin.
Only 4.2% of RA images had dark-skin representation, making RA one of the diseases with the lowest representation in the study, along with juvenile idiopathic arthritis, the spondyloarthropathies, and Kawasaki disease. “Representation of dark skin in SLE was also lower than the proportion of Black individuals in SLE studies,” the investigators noted. Overall, representation of dark skin in SLE images was just 22.6%. Sarcoidosis comparatively had the largest representation of dark-skin images (69.6%, n = 32).
“Excluding sarcoidosis and SLE images, the overall representation of dark skin was 9.4% (n = 84), which was significantly lower than the proportion of Asian, Native American, and Black individuals within the U.S. Census population,” according to Ms. Strait and her associates. UpToDate contained the largest proportion of images of dark skin respective to other databases, whereas Kelley’s Textbook had the smallest.
Actionable steps
Many physicians are willing to improve upon their skills in identifying conditions on darker skin, as the study by Dr. Kannuthurai and associates suggests. Overall, 93% of the survey’s participants wanted to learn more about rashes in patients of color. “Future educational interventions may help practitioners improve their confidence when diagnosing rashes in lupus patients” with darker skin, they suggested.
Ms. Strait and her colleagues recommended a series of actionable steps to improve diversity and equity of dark skin tone representation in rheumatology curricula.
Editors of educational resources, for example, should make image diversity a priority for those diseases that are most commonly associated with cutaneous manifestations, such as SLE, vasculitis, inflammatory myopathies, systemic sclerosis, sarcoidosis, and psoriasis. They also called for educators in academic rheumatology programs to collaborate to improve diversity in resources used at the undergraduate and graduate medical education level.
Efforts should take place at the local, regional, and national level to publicly discuss and educate clinicians about rheumatic diseases in individuals of color. Speakers at rheumatology conferences should strive to educate learners about presentations of rheumatic diseases in individuals of color. The ACR in the meantime could establish a task force to enhance racial and ethnic diversity in their image library and other published resources.
“These steps may improve provider recognition and diagnosis of rheumatic disease manifestations in skin of color, which may in turn reduce health disparities among racial and ethnic minority groups,” Ms. Strait said.
Beth L. Jonas, MD, chair of the ACR’s Committee on Rheumatology Training and Workforce Issues, called the findings of this study “timely and important.” The researchers highlighted a deficiency in rheumatology training materials that needs addressing, she said in an interview. “I definitely agree that ACR needs to be mindful of this. There’s no doubt that we need to take these recommendations and move along these lines.”
The ACR took a first step in 2020 with the creation of a diversity, equity, and inclusion committee. “We are undergoing a college-wide look at what we do, with an eye toward inclusion. There is a strong interest in addressing health disparities and being an equitable and inclusive community of rheumatology health care professionals,” said Dr. Jonas, chief of the University of North Carolina at Chapel Hill’s division of rheumatology, allergy, and immunology.
The American Academy of Dermatology is also working to improve the image library with images of disease in skin of color. “Everyone’s jumping on this now,” Dr. McKinley-Grant observed. The medical profession can’t afford not to. It’s a life-threatening issue when rheumatoid arthritis and other diseases in people of color aren’t diagnosed early and correctly, she added.
Technologies seek to reduce bias
While many organizations are taking steps to improve representation of darker skin images, VisualDx has taken the lead on this, she said. “They’ve been doing this for years now. There are over 14,000 images of disease in skin of color, including all the rheumatologic diseases. There’s a mobile app and desktop decision support system, and it is very popular. A majority of medical schools have this as a library resource, and hospital systems license it for EHR integration.” Doctors can also get it individually. This enables them to share images and handouts of a diagnosis and select images of patients of color, said Dr. McKinley-Grant, who uses the VisualDx smartphone app DermExpert, which is an app for nondermatologists that features an image library of skin lesions, including darker-skin images.

ProjectIMPACT, powered by VisualDx, is another effort to support reducing health care bias in darker skin. The project is a collaboration between the New England Journal of Medicine Group and the Skin Of Color Society. According to Dr. McKinley-Grant, the organizers are building awareness of the importance of reducing the educational and clinical gaps in diagnosing patients of color and trying to get students and educators to pledge to take meaningful steps and to have real-world impact.
This isn’t just exclusive to dermatology and rheumatology – it involves all medical specialties, she stressed.
ProjectIMPACT isn’t just a resource for physicians, she continued. Librarians can also use it to develop more resources on skin of color.
The Skin Of Color Society and VisualDx have also partnered with the NEJM Group to develop a comprehensive virtual series on the impact of skin color and ethnicity on clinical research. The four-part series addresses structural racism and racial bias in medicine, hair disorders in people of color, pigmentary disorders, keloids, COVID-19 comorbidities, and cutaneous manifestations of systemic diseases in children and adults.
Nuances of recognizing disease
As a medical student, Dr. McKinley-Grant said she was fortunate to attend the Albert Schweitzer Hospital in Lambarene, Gabon, on a fellowship. For 3 months, she gained a wealth of experience examining only African patients with brown skin.
In her other training in medicine, “I’ve been at institutions with diverse populations, in Boston, New York, and Washington,” learning more about all different skin pigments.
This type of training should be more widely available, especially now, with COVID-19 producing new manifestations of skin lesions, she emphasized. Such efforts involve a diversification of images physicians are being trained on so that they can recognize the same disease in a person of color.
“Doctors have to be able to recognize different colors, different shades of brown and shades of white. Not all white skin is the same color,” she noted. In looking at a rash or lesion, “you have to learn how to discern differences in the background color of the skin, which is determined by melanin in the skin (Fitzpatrick skin types I-VI) and by what’s going on in the blood, such as how much oxygen and hemoglobin the patient has in their blood.” Inflammation and infection (erythema) will appear more violaceous in IV-VI skin types, for example.
At the University of North Carolina at Chapel Hill, a group of students and faculty have created a dermatology image library to address the deficiency in the availability of images for teaching purposes. “Our medical students recognized the gap and started this,” Dr. Jonas said. Julie Mervak, MD, assistant professor of dermatology, is spearheading this effort, with students Linnea Westerkam and Anuj Pranav Sanghvi.
“I understand that others around the country are working on similar initiatives,” Dr. Jonas said.
None of the sources for this story had any relevant disclosures.
Studies are flagging racial and ethnic disparities in rheumatology training materials, pointing to a need to boost representation of darker skin tones and better educate physicians in evaluating this cohort.
Not enough is known about these disparities in rheumatology education, despite the fact that minorities make up 40% of the population in the United States.
The problem starts with books and references used in medical schools, Lynn McKinley-Grant, MD, immediate past president of the Skin of Color Society and associate professor of dermatology at Howard University, Washington, said in an interview. “In the medical literature there has been a dearth of images in skin of color in all specialties,” she said. With an increased diversity in the U.S. population, there is a need for health care providers to be able to recognize disease patterns in all skin types.” If a physician is training at an institution where there are not many patients of color in the community, the rheumatologists are even more limited in terms of their clinical experience.
This lack of training in diagnosis of disease has serious clinical repercussions, as seen in COVID cases, Dr. McKinley-Grant noted. “You end up not being able to recognize early erythema, jaundice, anemia, or hypoxemia because those conditions are a different color or pattern in the darker skin types. This can lead to errors in treatment, diagnosis, and medical care, resulting in increased morbidity and mortality.”
Studies point to education gaps
A team of researchers from Washington University in St. Louis called attention to this issue at the American College of Rhematology’s Convergence 2020 conference.
“Patients of color with lupus are especially vulnerable as they often carry a greater disease burden, yet studies show that individuals with darker skin tones are underrepresented in medical educational materials,” Vijay Kannuthurai, MD, and colleagues wrote in their study abstract. The team surveyed 132 providers in St. Louis, Mo., on their confidence in evaluating any rash, and rashes in patients with lupus and varied skin tones.
Participating clinicians, mostly rheumatologists, dermatologists, or internists, had a higher confidence level in diagnosing any rash versus lupus rashes, but were considerably less confident in diagnosing lupus rash on darker skin, compared with those on fair skin. This represents “a disparity between provider confidence and the patient population lupus traditionally affects,” the investigators concluded.
Another recent study found evidence of disparities in clinical education resources. “The lack of dark skin representation among rheumatology educational materials contributes to the implicit bias and structural racism present in medical education by promoting White-only models of disease,” lead author Adrienne Strait, a medical student at the University of California, San Francisco, said in an interview. “Given that rheumatic diseases disproportionately impact racial and ethnic minorities, we felt it was important to examine the representation of these groups within rheumatology training resources.”
She and her colleagues gathered images of rheumatic diseases from four major databases: the American College of Rheumatology’s Image Library, UpToDate, the New England Journal of Medicine Images in Clinical Medicine and Clinical Cases filtered by “Rheumatology,” and the 9th edition of Kelley’s Textbook of Rheumatology. They used Fitzpatrick’s skin phototypes to independently code images depicting skin as “light” (skin types I-IV), “dark” (skin types V-VI), or “indeterminate,” focusing on systemic lupus erythematosus (SLE) and rheumatoid arthritis, two conditions with a known connection to racial and ethnic health disparities.
Taking into account the high incidence of sarcoidosis and SLE in Black patients when compared with White patients, the investigators did a secondary analysis that excluded these cases.
Among 1,043 patient images studied, just 13.4% represented dark skin, compared with 84% that represented light skin. More than 2% represented an indeterminate skin color. Comparing dark-skin representation in the clinical images and SLE images with the representation of Asian, Native American, and Black individuals in the United States and within lupus cases nationally, the investigators found significant underrepresentation of dark skin.
Only 4.2% of RA images had dark-skin representation, making RA one of the diseases with the lowest representation in the study, along with juvenile idiopathic arthritis, the spondyloarthropathies, and Kawasaki disease. “Representation of dark skin in SLE was also lower than the proportion of Black individuals in SLE studies,” the investigators noted. Overall, representation of dark skin in SLE images was just 22.6%. Sarcoidosis comparatively had the largest representation of dark-skin images (69.6%, n = 32).
“Excluding sarcoidosis and SLE images, the overall representation of dark skin was 9.4% (n = 84), which was significantly lower than the proportion of Asian, Native American, and Black individuals within the U.S. Census population,” according to Ms. Strait and her associates. UpToDate contained the largest proportion of images of dark skin respective to other databases, whereas Kelley’s Textbook had the smallest.
Actionable steps
Many physicians are willing to improve upon their skills in identifying conditions on darker skin, as the study by Dr. Kannuthurai and associates suggests. Overall, 93% of the survey’s participants wanted to learn more about rashes in patients of color. “Future educational interventions may help practitioners improve their confidence when diagnosing rashes in lupus patients” with darker skin, they suggested.
Ms. Strait and her colleagues recommended a series of actionable steps to improve diversity and equity of dark skin tone representation in rheumatology curricula.
Editors of educational resources, for example, should make image diversity a priority for those diseases that are most commonly associated with cutaneous manifestations, such as SLE, vasculitis, inflammatory myopathies, systemic sclerosis, sarcoidosis, and psoriasis. They also called for educators in academic rheumatology programs to collaborate to improve diversity in resources used at the undergraduate and graduate medical education level.
Efforts should take place at the local, regional, and national level to publicly discuss and educate clinicians about rheumatic diseases in individuals of color. Speakers at rheumatology conferences should strive to educate learners about presentations of rheumatic diseases in individuals of color. The ACR in the meantime could establish a task force to enhance racial and ethnic diversity in their image library and other published resources.
“These steps may improve provider recognition and diagnosis of rheumatic disease manifestations in skin of color, which may in turn reduce health disparities among racial and ethnic minority groups,” Ms. Strait said.
Beth L. Jonas, MD, chair of the ACR’s Committee on Rheumatology Training and Workforce Issues, called the findings of this study “timely and important.” The researchers highlighted a deficiency in rheumatology training materials that needs addressing, she said in an interview. “I definitely agree that ACR needs to be mindful of this. There’s no doubt that we need to take these recommendations and move along these lines.”
The ACR took a first step in 2020 with the creation of a diversity, equity, and inclusion committee. “We are undergoing a college-wide look at what we do, with an eye toward inclusion. There is a strong interest in addressing health disparities and being an equitable and inclusive community of rheumatology health care professionals,” said Dr. Jonas, chief of the University of North Carolina at Chapel Hill’s division of rheumatology, allergy, and immunology.
The American Academy of Dermatology is also working to improve the image library with images of disease in skin of color. “Everyone’s jumping on this now,” Dr. McKinley-Grant observed. The medical profession can’t afford not to. It’s a life-threatening issue when rheumatoid arthritis and other diseases in people of color aren’t diagnosed early and correctly, she added.
Technologies seek to reduce bias
While many organizations are taking steps to improve representation of darker skin images, VisualDx has taken the lead on this, she said. “They’ve been doing this for years now. There are over 14,000 images of disease in skin of color, including all the rheumatologic diseases. There’s a mobile app and desktop decision support system, and it is very popular. A majority of medical schools have this as a library resource, and hospital systems license it for EHR integration.” Doctors can also get it individually. This enables them to share images and handouts of a diagnosis and select images of patients of color, said Dr. McKinley-Grant, who uses the VisualDx smartphone app DermExpert, which is an app for nondermatologists that features an image library of skin lesions, including darker-skin images.
ProjectIMPACT, powered by VisualDx, is another effort to support reducing health care bias in darker skin. The project is a collaboration between the New England Journal of Medicine Group and the Skin Of Color Society. According to Dr. McKinley-Grant, the organizers are building awareness of the importance of reducing the educational and clinical gaps in diagnosing patients of color and trying to get students and educators to pledge to take meaningful steps and to have real-world impact.
This isn’t just exclusive to dermatology and rheumatology – it involves all medical specialties, she stressed.
ProjectIMPACT isn’t just a resource for physicians, she continued. Librarians can also use it to develop more resources on skin of color.
The Skin Of Color Society and VisualDx have also partnered with the NEJM Group to develop a comprehensive virtual series on the impact of skin color and ethnicity on clinical research. The four-part series addresses structural racism and racial bias in medicine, hair disorders in people of color, pigmentary disorders, keloids, COVID-19 comorbidities, and cutaneous manifestations of systemic diseases in children and adults.
Nuances of recognizing disease
As a medical student, Dr. McKinley-Grant said she was fortunate to attend the Albert Schweitzer Hospital in Lambarene, Gabon, on a fellowship. For 3 months, she gained a wealth of experience examining only African patients with brown skin.
In her other training in medicine, “I’ve been at institutions with diverse populations, in Boston, New York, and Washington,” learning more about all different skin pigments.
This type of training should be more widely available, especially now, with COVID-19 producing new manifestations of skin lesions, she emphasized. Such efforts involve a diversification of images physicians are being trained on so that they can recognize the same disease in a person of color.
“Doctors have to be able to recognize different colors, different shades of brown and shades of white. Not all white skin is the same color,” she noted. In looking at a rash or lesion, “you have to learn how to discern differences in the background color of the skin, which is determined by melanin in the skin (Fitzpatrick skin types I-VI) and by what’s going on in the blood, such as how much oxygen and hemoglobin the patient has in their blood.” Inflammation and infection (erythema) will appear more violaceous in IV-VI skin types, for example.
At the University of North Carolina at Chapel Hill, a group of students and faculty have created a dermatology image library to address the deficiency in the availability of images for teaching purposes. “Our medical students recognized the gap and started this,” Dr. Jonas said. Julie Mervak, MD, assistant professor of dermatology, is spearheading this effort, with students Linnea Westerkam and Anuj Pranav Sanghvi.
“I understand that others around the country are working on similar initiatives,” Dr. Jonas said.
None of the sources for this story had any relevant disclosures.
Early pediatric rheumatology residency exposure key to solving workforce shortages
The biggest factors that attract medical students to enter pediatric rheumatology are interest in disease pathology, the patient-physician relationship, and clinical exposure in residency, according to preliminary research shared at the annual scientific meeting of the Childhood Arthritis and Rheumatology Research Alliance.

A shortage in pediatric rheumatology already exists and is expected to worsen to 61% by 2030, noted the authors. About one-third (32%) of current pediatric rheumatologists will retire in the next decade, and less than two-thirds of fellowship slots have filled in the past 5 years.
Katherine Schultz, MD, a clinical fellow in the division of rheumatology at Cincinnati Children’s Medical Center, led the study and said she was surprised that medical school exposure did not play a bigger role in attracting people to the field, but perhaps that’s because too few people received that early exposure.
“If we had earlier exposure, maybe that wouldn’t be definitive for saying, ‘yes, I want to do this subspecialty of pediatric rheumatology,’ but it would open the door, so when you hit residency, you can explore it further,” Dr. Schultz said in an interview.
Dr. Schultz and her colleagues conducted a survey using the CARRA registry during September-December 2020. Respondents included pediatric rheumatology clinical fellows, early-career pediatric rheumatology faculty with less than 7 years practice experience, and mid- to late-career pediatric rheumatology faculty – those with more than 7 years of practice. They are currently in the process of analyzing additional qualitative data.
Of the 428 clinicians recruited to complete the study, 92 did so, for a response rate of 21%. Most respondents were female and non-Hispanic White. A total of 40% were clinical fellows, 41% were early-career faculty, and 18% were mid- to late-career faculty.
Positive factors for choosing the field
More than 80% of respondents across all three experience levels cited disease pathology as a positive attribute of pediatric rheumatology, something that Dr. Schultz mentioned as well.
“The rewarding part of pediatric rheumatology is we take these complex diseases and we help give kids their life back,” she said.
Nearly all the clinical fellows who responded said the patient-physician relationship was important, which early- and mid- and late-career faculty mentioned as well, although to a slightly lesser extent.
Other factors following closely behind disease pathology, patient-physician relationship, and clinical exposure in residency were having a role model in the field – cited by more than three-quarters of clinical fellows and early-career faculty – and having mentorship during residency.
“One of the strengths of our field and one of the things I love about pediatric rheumatology is our community is so close-knit, so kind, and so welcoming,” Dr. Schultz said. “If students can have that exposure and they can see the kind of people who are in this field, that’s our greatest power to draw people to our field.”
Low compensation is a deterrent
The least frequently mentioned positive factors were research opportunities and income. In fact, income was by far the most commonly cited negative attribute of pediatric rheumatology, reported by nearly half of clinical fellows and more than a quarter of early- and mid- and late-career faculty.
“We are one of the lowest paid specialties in pediatrics. We often make [income] comparable to or less than a general pediatrician,” Dr. Schultz said. One reason for that is the difficulty of doing pediatric rheumatology in private practice. Most positions are at academic institutions, which will nearly always involve lower pay scales, she said. The field is also not a procedure-based one, which makes billing more difficult to quantify.
“If I spend an hour thinking about a patient’s diagnosis and interpreting their labs, how do we quantify that?” she asked. “Our field is so cognitive that it makes it hard to bill in the same manner” as fields who bill more procedures, she said.

Colleen Correll, MD, MPH, an assistant professor of pediatric rheumatology at the University of Minnesota in Minneapolis, was also not surprised to see salary listed as the biggest deterrent to the field.
“Unfortunately, compared to other specialties, our compensation is lower, and this can be a real barrier for people who have large medical student loans to repay and for those providing for their families,” Dr. Correll said in an interview. She and Dr. Schultz both said that workforce advocacy groups are working on ways to compensate for that difference, including loan repayment programs.
The other specialties that respondents considered before choosing pediatric rheumatology varied by generation, but allergy and immunology and endocrinology were among the most cited by early-, mid-, and late-career faculty. Clinical fellows’ responses were more evenly distributed across a range of different subspecialties.
Early exposure is key
A large proportion of all three groups, including almost 90% of early-career faculty and clinical fellows, said they received exposure to pediatric rheumatology during residency. However, only a little more than two-thirds of clinical fellows had exposure to the field in medical school, and fewer than that reported medical school exposure among both faculty groups.
Both Dr. Correll and Dr. Schultz said that early exposure to pediatric rheumatology was key to bringing more people into the workforce.
“I believe that once a medical student or resident has an opportunity to work with a pediatric rheumatologist, they are able to see the many reasons for which this is a great career choice,” Dr. Correll said. “Pediatric rheumatologists are seen as positive role models. We love what we do, we have great patient-physician relationships, and we see interesting disease pathophysiology on a regular basis.”
Although earlier exposure to the field is primarily an institutional issue, clinicians can play a role as well.
“For the individual practitioners, the biggest way they can make an impact is to make themselves visible,” Dr. Schultz said. Although the subspecialty is stretched thin, she encouraged pediatric rheumatologists to do med school and resident lectures, volunteer to do feedback sessions, offer residents opportunities to rotate with them, and generally make themselves more visible. “It’s going to take the community to really make the change we need,” she said.
She and Dr. Correll both cited the American College of Rheumatology and CARRA pediatric residency programs as helpful, but there’s more to do. Other ways to increase exposure to the field include creating medical student rotations in pediatric rheumatology, working on case reports or small research projects with new learners, and requesting that pediatric rheumatology be a mandatory rotation in pediatrics training, Dr. Correll said.
“We absolutely have a responsibility to promote our field because if we don’t, the workforce supply issue will continue to worsen,” Dr. Correll said. “We already have a workforce shortage, and models show this shortage will only worsen if we don’t improve recruitment into the field, especially with many pediatric rheumatologists coming up on retirement. Once we are able to expose medical students and residents to the field, I think they easily see our passion and our love for the field, and it’s easy to recruit them.”
The research was funded by CARRA, which receives funding from the Arthritis Foundation. Dr. Schultz and Dr. Correll had no disclosures.
The biggest factors that attract medical students to enter pediatric rheumatology are interest in disease pathology, the patient-physician relationship, and clinical exposure in residency, according to preliminary research shared at the annual scientific meeting of the Childhood Arthritis and Rheumatology Research Alliance.
A shortage in pediatric rheumatology already exists and is expected to worsen to 61% by 2030, noted the authors. About one-third (32%) of current pediatric rheumatologists will retire in the next decade, and less than two-thirds of fellowship slots have filled in the past 5 years.
Katherine Schultz, MD, a clinical fellow in the division of rheumatology at Cincinnati Children’s Medical Center, led the study and said she was surprised that medical school exposure did not play a bigger role in attracting people to the field, but perhaps that’s because too few people received that early exposure.
“If we had earlier exposure, maybe that wouldn’t be definitive for saying, ‘yes, I want to do this subspecialty of pediatric rheumatology,’ but it would open the door, so when you hit residency, you can explore it further,” Dr. Schultz said in an interview.
Dr. Schultz and her colleagues conducted a survey using the CARRA registry during September-December 2020. Respondents included pediatric rheumatology clinical fellows, early-career pediatric rheumatology faculty with less than 7 years practice experience, and mid- to late-career pediatric rheumatology faculty – those with more than 7 years of practice. They are currently in the process of analyzing additional qualitative data.
Of the 428 clinicians recruited to complete the study, 92 did so, for a response rate of 21%. Most respondents were female and non-Hispanic White. A total of 40% were clinical fellows, 41% were early-career faculty, and 18% were mid- to late-career faculty.
Positive factors for choosing the field
More than 80% of respondents across all three experience levels cited disease pathology as a positive attribute of pediatric rheumatology, something that Dr. Schultz mentioned as well.
“The rewarding part of pediatric rheumatology is we take these complex diseases and we help give kids their life back,” she said.
Nearly all the clinical fellows who responded said the patient-physician relationship was important, which early- and mid- and late-career faculty mentioned as well, although to a slightly lesser extent.
Other factors following closely behind disease pathology, patient-physician relationship, and clinical exposure in residency were having a role model in the field – cited by more than three-quarters of clinical fellows and early-career faculty – and having mentorship during residency.
“One of the strengths of our field and one of the things I love about pediatric rheumatology is our community is so close-knit, so kind, and so welcoming,” Dr. Schultz said. “If students can have that exposure and they can see the kind of people who are in this field, that’s our greatest power to draw people to our field.”
Low compensation is a deterrent
The least frequently mentioned positive factors were research opportunities and income. In fact, income was by far the most commonly cited negative attribute of pediatric rheumatology, reported by nearly half of clinical fellows and more than a quarter of early- and mid- and late-career faculty.
“We are one of the lowest paid specialties in pediatrics. We often make [income] comparable to or less than a general pediatrician,” Dr. Schultz said. One reason for that is the difficulty of doing pediatric rheumatology in private practice. Most positions are at academic institutions, which will nearly always involve lower pay scales, she said. The field is also not a procedure-based one, which makes billing more difficult to quantify.
“If I spend an hour thinking about a patient’s diagnosis and interpreting their labs, how do we quantify that?” she asked. “Our field is so cognitive that it makes it hard to bill in the same manner” as fields who bill more procedures, she said.
Colleen Correll, MD, MPH, an assistant professor of pediatric rheumatology at the University of Minnesota in Minneapolis, was also not surprised to see salary listed as the biggest deterrent to the field.
“Unfortunately, compared to other specialties, our compensation is lower, and this can be a real barrier for people who have large medical student loans to repay and for those providing for their families,” Dr. Correll said in an interview. She and Dr. Schultz both said that workforce advocacy groups are working on ways to compensate for that difference, including loan repayment programs.
The other specialties that respondents considered before choosing pediatric rheumatology varied by generation, but allergy and immunology and endocrinology were among the most cited by early-, mid-, and late-career faculty. Clinical fellows’ responses were more evenly distributed across a range of different subspecialties.
Early exposure is key
A large proportion of all three groups, including almost 90% of early-career faculty and clinical fellows, said they received exposure to pediatric rheumatology during residency. However, only a little more than two-thirds of clinical fellows had exposure to the field in medical school, and fewer than that reported medical school exposure among both faculty groups.
Both Dr. Correll and Dr. Schultz said that early exposure to pediatric rheumatology was key to bringing more people into the workforce.
“I believe that once a medical student or resident has an opportunity to work with a pediatric rheumatologist, they are able to see the many reasons for which this is a great career choice,” Dr. Correll said. “Pediatric rheumatologists are seen as positive role models. We love what we do, we have great patient-physician relationships, and we see interesting disease pathophysiology on a regular basis.”
Although earlier exposure to the field is primarily an institutional issue, clinicians can play a role as well.
“For the individual practitioners, the biggest way they can make an impact is to make themselves visible,” Dr. Schultz said. Although the subspecialty is stretched thin, she encouraged pediatric rheumatologists to do med school and resident lectures, volunteer to do feedback sessions, offer residents opportunities to rotate with them, and generally make themselves more visible. “It’s going to take the community to really make the change we need,” she said.
She and Dr. Correll both cited the American College of Rheumatology and CARRA pediatric residency programs as helpful, but there’s more to do. Other ways to increase exposure to the field include creating medical student rotations in pediatric rheumatology, working on case reports or small research projects with new learners, and requesting that pediatric rheumatology be a mandatory rotation in pediatrics training, Dr. Correll said.
“We absolutely have a responsibility to promote our field because if we don’t, the workforce supply issue will continue to worsen,” Dr. Correll said. “We already have a workforce shortage, and models show this shortage will only worsen if we don’t improve recruitment into the field, especially with many pediatric rheumatologists coming up on retirement. Once we are able to expose medical students and residents to the field, I think they easily see our passion and our love for the field, and it’s easy to recruit them.”
The research was funded by CARRA, which receives funding from the Arthritis Foundation. Dr. Schultz and Dr. Correll had no disclosures.
FROM CARRA 2021
Chauvin guilty verdict: Now it’s time to get to work
On Tuesday, April 20, the country braced for the impact of the trial verdict in death of George Floyd. Despite the case having what many would consider an overwhelming amount of evidence pointing toward conviction, if we’re completely honest, the country – and particularly the African American community – had significant doubts that the jury would render a guilty verdict.

In the hour leading up to the announcement, people and images dominated my thoughts; Tamir Rice, Breonna Taylor, Eric Garner, Rashard Brooks, and most recently, Daunte Wright. With the deaths of these Black Americans and many others as historical context, I took a stoic stance and held my breath as the verdict was read. Former Minneapolis Police Officer Derek Chauvin was found guilty of second-degree murder, third-degree murder, and second-degree manslaughter.
As Mr. Chauvin was remanded to custody and led away in handcuffs, it was clear there were no “winners” in this verdict. Mr. Floyd is still dead, and violent encounters experienced by Black Americans continue at a vastly disproportionate rate. The result is far from true justice, but what we as a country do have is a moment of accountability – and perhaps an opportunity for true system-level reform.
The final report of the President’s Task Force on 21st Century Policing, released in May 2015, recommended major policy changes at the federal level and developed key pillars aimed at promoting effective crime reduction while building public trust. Based on this report, four key takeaways are relevant to any discussion of police reform. All are vitally important, but two stand out as particularly relevant in the aftermath of the verdict. One of the key recommendations was “embracing a guardian – rather than a warrior mindset” in an effort to build trust and legitimacy. Another was ensuring that “peace officer and standards training (POST) boards include mandatory Crisis Intervention Training.”
As health professionals, we know that the ultimate effectiveness of any intervention is based upon the amount of shared trust and collaboration in the patient-physician relationship. As a consultation-liaison psychiatrist, I’ve been trained to recognize that, when requested to consult on a case, I’m frequently not making a medical diagnosis or delivering an intervention; I’m helping the team and patient reestablish trust in each other. Communication skills and techniques help start a dialogue, but you will ultimately fall short of shared understanding without trust. The underpinning of trust could begin with a commitment to procedural justice. Procedural justice, as described in The Justice Collaboratory of Yale Law School, “speaks to the idea of fair processes and how the quality of their experiences strongly impacts people’s perception of fairness.” There are four central tenets of procedural justice:
- Whether they were treated with dignity and respect.
- Whether they were given voice.
- Whether the decision-maker was neutral and transparent.
- Whether the decision-maker conveyed trustworthy motives.
These four tenets have been researched and shown to improve the trust and confidence a community has in police, and lay the foundation for creating a standard set of shared interests and values.

As health professionals, there are many aspects of procedural justice that we can and should embrace, particularly as we come to our reckoning with the use of restraints in medical settings.
Building on the work of the Task Force on 21st Century Policing, the National Initiative for Building Community Trust and Justice, from January 2015 through December 2018, implemented a six-city intervention aimed at generating measurable improvements in officer behavior, public safety, and community trust in police. The National Initiative was organized around three principal ideas: procedural justice, implicit bias training, and reconciliation and candid conversations about law enforcement’s historic role in racial tensions.
In addition to the recommendations of the federal government and independent institutions, national-level health policy organizations have made clear statements regarding police brutality and the need for systemic reform to address police brutality and systemic racism. In 2018, the American Psychiatric Association released a position statement on Police Brutality and Black Males. This was then followed in 2020 with a joint statement from the National Medical Association and the APA condemning systemic racism and police violence against Black Americans. Other health policy associations, including the American Medical Association and the American Association of Medical Colleges, have made clear statements condemning systemic racism and police brutality.
In the aftermath of the verdict, we also saw something very different. In our partisan country, there appeared to be uniform common ground. Statements were made acknowledging the importance of this historic moment, from police unions, and both political parties, and various invested grassroots organizations. In short, we may have true agreement and motivation to take the next hard steps in police reform for this country. There will be policy discussions and new mandates for training, and certainly a push to ban the use of lethal techniques, such as choke holds. While helpful, these will ultimately fall short unless we hold ourselves accountable for a true culture change.
The challenge of implementing procedural justice shouldn’t be just a law enforcement challenge, and it shouldn’t fall on the shoulders of communities with high crime areas. In other words, no single racial group should own it. Ultimately, procedural justice will need to be embraced by all of us.
On April 20, as I watched the verdict, my oldest daughter watched with me, and she asked, “What do you think, Dad?” I responded: “It’s accountability and an opportunity.” She nodded her head with resolve. She then grabbed her smartphone and jumped into social media and proclaimed in her very knowledgeable teenage voice, “See Dad, one voice is cool, but many voices in unison is better; time to get to work!” To Darnella Frazier, who captured the crime on video at age 17, and all in your generation who dare to hold us accountable, I salute you. I thank you for forcing us to look even when it was painful and not ignore the humanity of our fellow man. It is indeed time to get to work.
Dr. Norris is associate dean of student affairs and administration at George Washington University, Washington. He has no disclosures.
On Tuesday, April 20, the country braced for the impact of the trial verdict in death of George Floyd. Despite the case having what many would consider an overwhelming amount of evidence pointing toward conviction, if we’re completely honest, the country – and particularly the African American community – had significant doubts that the jury would render a guilty verdict.
In the hour leading up to the announcement, people and images dominated my thoughts; Tamir Rice, Breonna Taylor, Eric Garner, Rashard Brooks, and most recently, Daunte Wright. With the deaths of these Black Americans and many others as historical context, I took a stoic stance and held my breath as the verdict was read. Former Minneapolis Police Officer Derek Chauvin was found guilty of second-degree murder, third-degree murder, and second-degree manslaughter.
As Mr. Chauvin was remanded to custody and led away in handcuffs, it was clear there were no “winners” in this verdict. Mr. Floyd is still dead, and violent encounters experienced by Black Americans continue at a vastly disproportionate rate. The result is far from true justice, but what we as a country do have is a moment of accountability – and perhaps an opportunity for true system-level reform.
The final report of the President’s Task Force on 21st Century Policing, released in May 2015, recommended major policy changes at the federal level and developed key pillars aimed at promoting effective crime reduction while building public trust. Based on this report, four key takeaways are relevant to any discussion of police reform. All are vitally important, but two stand out as particularly relevant in the aftermath of the verdict. One of the key recommendations was “embracing a guardian – rather than a warrior mindset” in an effort to build trust and legitimacy. Another was ensuring that “peace officer and standards training (POST) boards include mandatory Crisis Intervention Training.”
As health professionals, we know that the ultimate effectiveness of any intervention is based upon the amount of shared trust and collaboration in the patient-physician relationship. As a consultation-liaison psychiatrist, I’ve been trained to recognize that, when requested to consult on a case, I’m frequently not making a medical diagnosis or delivering an intervention; I’m helping the team and patient reestablish trust in each other. Communication skills and techniques help start a dialogue, but you will ultimately fall short of shared understanding without trust. The underpinning of trust could begin with a commitment to procedural justice. Procedural justice, as described in The Justice Collaboratory of Yale Law School, “speaks to the idea of fair processes and how the quality of their experiences strongly impacts people’s perception of fairness.” There are four central tenets of procedural justice:
- Whether they were treated with dignity and respect.
- Whether they were given voice.
- Whether the decision-maker was neutral and transparent.
- Whether the decision-maker conveyed trustworthy motives.
These four tenets have been researched and shown to improve the trust and confidence a community has in police, and lay the foundation for creating a standard set of shared interests and values.
As health professionals, there are many aspects of procedural justice that we can and should embrace, particularly as we come to our reckoning with the use of restraints in medical settings.
Building on the work of the Task Force on 21st Century Policing, the National Initiative for Building Community Trust and Justice, from January 2015 through December 2018, implemented a six-city intervention aimed at generating measurable improvements in officer behavior, public safety, and community trust in police. The National Initiative was organized around three principal ideas: procedural justice, implicit bias training, and reconciliation and candid conversations about law enforcement’s historic role in racial tensions.
In addition to the recommendations of the federal government and independent institutions, national-level health policy organizations have made clear statements regarding police brutality and the need for systemic reform to address police brutality and systemic racism. In 2018, the American Psychiatric Association released a position statement on Police Brutality and Black Males. This was then followed in 2020 with a joint statement from the National Medical Association and the APA condemning systemic racism and police violence against Black Americans. Other health policy associations, including the American Medical Association and the American Association of Medical Colleges, have made clear statements condemning systemic racism and police brutality.
In the aftermath of the verdict, we also saw something very different. In our partisan country, there appeared to be uniform common ground. Statements were made acknowledging the importance of this historic moment, from police unions, and both political parties, and various invested grassroots organizations. In short, we may have true agreement and motivation to take the next hard steps in police reform for this country. There will be policy discussions and new mandates for training, and certainly a push to ban the use of lethal techniques, such as choke holds. While helpful, these will ultimately fall short unless we hold ourselves accountable for a true culture change.
The challenge of implementing procedural justice shouldn’t be just a law enforcement challenge, and it shouldn’t fall on the shoulders of communities with high crime areas. In other words, no single racial group should own it. Ultimately, procedural justice will need to be embraced by all of us.
On April 20, as I watched the verdict, my oldest daughter watched with me, and she asked, “What do you think, Dad?” I responded: “It’s accountability and an opportunity.” She nodded her head with resolve. She then grabbed her smartphone and jumped into social media and proclaimed in her very knowledgeable teenage voice, “See Dad, one voice is cool, but many voices in unison is better; time to get to work!” To Darnella Frazier, who captured the crime on video at age 17, and all in your generation who dare to hold us accountable, I salute you. I thank you for forcing us to look even when it was painful and not ignore the humanity of our fellow man. It is indeed time to get to work.
Dr. Norris is associate dean of student affairs and administration at George Washington University, Washington. He has no disclosures.

US methods of delivery, a snapshot
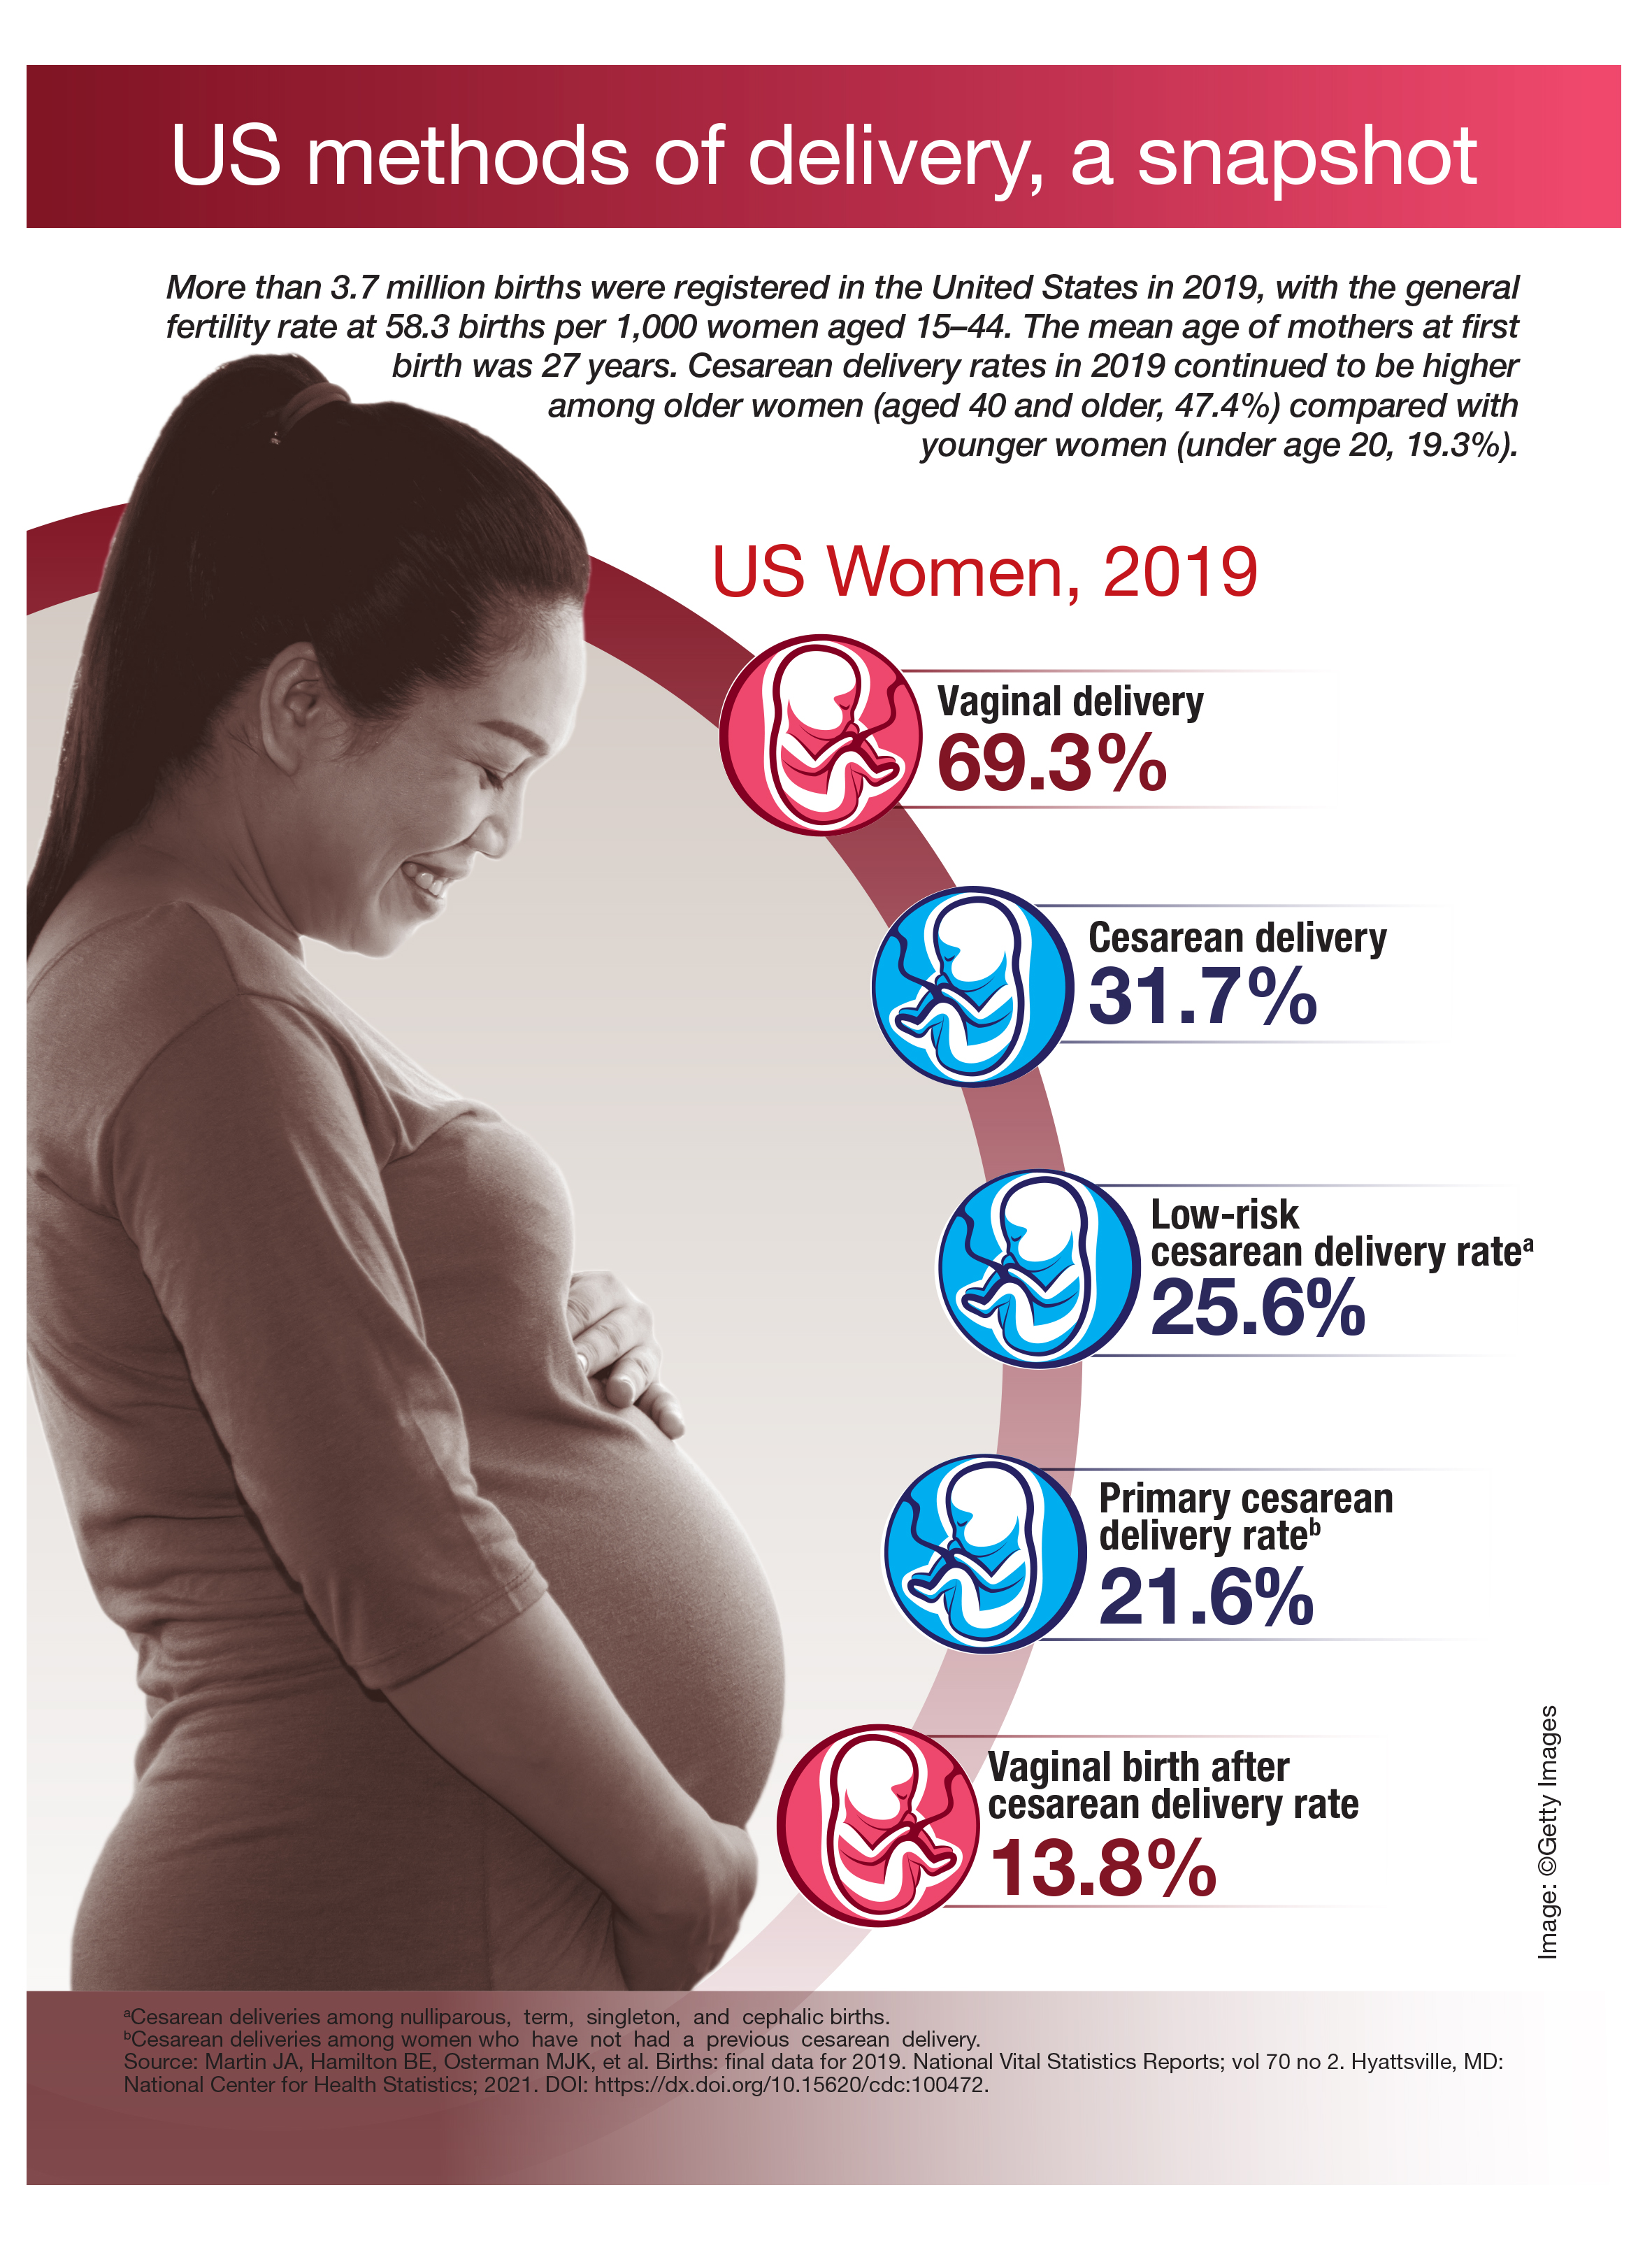
Psilocybin matches SSRI for moderate to severe depression in phase 2 study
The psychedelic drug psilocybin performed just as well as a widely used antidepressant in easing the symptoms of major depression, and outperformed the selective serotonin reuptake inhibitor on a range of secondary measures, results of a small-scale, phase 2 study show.

In a 6-week trial that included 59 patients with moderate to severe depression, there was no significant difference between the impact of high-dose psilocybin on the study’s primary yardstick – the 16-item Quick Inventory of Depressive Symptomatology–Self-Report – and that of the SSRI escitalopram.
Patients in the psilocybin cohort did show a much more rapid improvement in the main measure than those taking escitalopram, but this gap narrowed over the span of the trial until it was no longer statistically significant.
“It’s very clear that psilocybin therapy has a faster antidepressant onset than escitalopram. And psilocybin was consistently superior on the ancillary outcomes, but it wasn’t different on the primary,” the study’s lead author Robin Carhart-Harris, PhD, head of the Centre for Psychedelic Research at Imperial College London, told reporters attending a news briefing.
Results of the phase 2, double-blind, randomized study were published online April 15, 2021, in the New England Journal of Medicine.
Secondary outcomes
Investigators found that psilocybin bested escitalopram in several secondary outcomes, including feelings of well-being, the ability to express emotion, and social functioning.

Still, Larger and longer trials are required.
“But the secondaries were highly suggestive – tantalizingly suggestive – of the potential superiority of psilocybin therapy to treat not just depression, but these ancillary symptoms,” Dr. Carhart-Harris said.
After they were selected from 1000 screening calls, the 59 patients were randomly assigned to receive psilocybin and 29 patients to receive escitalopram. Every procedure was mirrored in both groups.
At the 2 “dosing days” scheduled during the 6-week trial, all patients received an oral dose of psilocybin in a clinical setting. However, the escitalopram group received 1 mg versus 25 mg for the psilocybin group.
“And the reason why we did that is because we can standardize expectation. We say to everyone, you will receive psilocybin. It’s just the dosage might differ,” Dr. Carhart-Harris said.
He conceded that most patients – though not all – were able to determine which group they were in following the first dosing day based on the drugs’ effects.
Supportive therapy
Following the oral dose, volunteers would spend 6 hours reclining on a bed, surrounded by pillows and a curated selection of music and supported by two “guides” or therapists. The guides were on hand to support patients through their psychedelic experience but did not chat or otherwise interfere.
The next day, patients attended a session with their two therapists to talk through their experiences.
Between dosing days, patients in the high-dose psilocybin group would take daily capsules containing a placebo. The low-dose group received a course of escitalopram.
The incidence of adverse effects was similar in each group. None was serious.
The study’s principal investigator David Nutt, DM, FRCP, FRCPsych, FSB, FMedSci, the Edmond J. Safra Chair in Neuropsychopharmacology at Imperial College London, said that many patients in the psilocybin group reported revelatory insights during dosing days.
“Very often, for the first time, people have actually come to understand why they’re depressed,” he said.
The word psychedelic, coined in 1957 by psychiatrist Humphry Osmond, derives from the Greek words “psyche,” which means “soul” or “mind,” and “delos,” which means “reveal.”
'Profound experiences'
Certainly, patients in the psilocybin group received enough of the compound to induce what Dr. Carhart-Harris called “very profound experiences.”
The researchers said that the results, while promising, should not encourage anyone to self-medicate with psychedelic substances, which are still illegal in most jurisdictions.
“I view this very much – and I think most colleagues do as well – as a combination treatment,” Dr. Carhart-Harris said. “And we strongly believe that the psychotherapy component is as important as the drug action.”
He said the study was inspired by his earlier research into the effects of psilocybin on brain function along with a small open-label trial of the compound’s effects on treatment-resistant depression published in The Lancet Psychiatry in July 2016.
The team stressed that the cohort and the absence of an entirely placebo group limit conclusions that can be drawn about either treatment.
Dr. Carhart-Harris also said he would have liked a more diverse group of patients. Participants were mostly White and mostly male, with a mean age of 41, and a high educational attainment. Of the 59 enrolled, only 34% were women.
Volunteers underwent functional MRI scans at the start and end of the trial. The team will now analyze these results to gain insight into impact on brain function and will gather and assess follow-up data. They also plan a trial examining the effect of psilocybin on anorexia.
“I think it’s fair to say the results signal hope that we may be looking at a promising alternative treatment for depression,” Dr. Carhart-Harris said. “It’s often said that we need novel treatments to treat depression because too many new drugs are what [are] sometimes called ‘me too’ drugs: They work in the same way as drugs that have preceded them. Psilocybin therapy seems to work fundamentally in a different way to SSRIs.”
Unanswered questions
In an accompanying editorial, Jeffrey A. Lieberman, MD, Lawrence C. Kolb Professor and chairman of the department of psychiatry at Columbia University, New York, warned that there remain many unanswered questions about using psychedelics for medical purposes.
They were considered potential miracle cures for a range of mental disorders in the 1960s, only to be banned in 1970s America because of “the perceived dangers and corrosive effects” on society, he wrote.
“The Carhart-Harris study notwithstanding, we are still awaiting definitive proof of the therapeutic efficacy of psychedelics and their capacity to improve the human condition,” Dr. Lieberman wrote. “Should the mind-bending properties of the psychedelics prove to be the panacea their proponents professed, informed consent and safety standards must be established. How do we explain mystical, ineffable, and potentially transformative experiences to patients, particularly if they are in a vulnerable state of mind? What is their potential for addiction?”
David Owens, MD, PhD, professor emeritus of clinical psychiatry at the University of Edinburgh, described Lieberman’s comments as “spot on.”
“This is a small, exploratory study with numbers too small to analyze fully,” he said. “The population is not recruited randomly from, for example, consecutive admissions or presentations, and screening of volunteers was by telephone, not face to face. One might say this is an ‘interested’ population, willing to go for novel approaches and with no placebo group, the extent of the placebo response cannot be assessed.”
The study was funded by the Alexander Mosley Charitable Trust and the founders of the Centre for Psychedelic Research. Infrastructure support was provided by the National Institute for Health Research Imperial Biomedical Research Centre and NIHR Imperial Clinical Research Facility.
A version of this article first appeared on Medscape.com.
The psychedelic drug psilocybin performed just as well as a widely used antidepressant in easing the symptoms of major depression, and outperformed the selective serotonin reuptake inhibitor on a range of secondary measures, results of a small-scale, phase 2 study show.
In a 6-week trial that included 59 patients with moderate to severe depression, there was no significant difference between the impact of high-dose psilocybin on the study’s primary yardstick – the 16-item Quick Inventory of Depressive Symptomatology–Self-Report – and that of the SSRI escitalopram.
Patients in the psilocybin cohort did show a much more rapid improvement in the main measure than those taking escitalopram, but this gap narrowed over the span of the trial until it was no longer statistically significant.
“It’s very clear that psilocybin therapy has a faster antidepressant onset than escitalopram. And psilocybin was consistently superior on the ancillary outcomes, but it wasn’t different on the primary,” the study’s lead author Robin Carhart-Harris, PhD, head of the Centre for Psychedelic Research at Imperial College London, told reporters attending a news briefing.
Results of the phase 2, double-blind, randomized study were published online April 15, 2021, in the New England Journal of Medicine.
Secondary outcomes
Investigators found that psilocybin bested escitalopram in several secondary outcomes, including feelings of well-being, the ability to express emotion, and social functioning.
Still, Larger and longer trials are required.
“But the secondaries were highly suggestive – tantalizingly suggestive – of the potential superiority of psilocybin therapy to treat not just depression, but these ancillary symptoms,” Dr. Carhart-Harris said.
After they were selected from 1000 screening calls, the 59 patients were randomly assigned to receive psilocybin and 29 patients to receive escitalopram. Every procedure was mirrored in both groups.
At the 2 “dosing days” scheduled during the 6-week trial, all patients received an oral dose of psilocybin in a clinical setting. However, the escitalopram group received 1 mg versus 25 mg for the psilocybin group.
“And the reason why we did that is because we can standardize expectation. We say to everyone, you will receive psilocybin. It’s just the dosage might differ,” Dr. Carhart-Harris said.
He conceded that most patients – though not all – were able to determine which group they were in following the first dosing day based on the drugs’ effects.
Supportive therapy
Following the oral dose, volunteers would spend 6 hours reclining on a bed, surrounded by pillows and a curated selection of music and supported by two “guides” or therapists. The guides were on hand to support patients through their psychedelic experience but did not chat or otherwise interfere.
The next day, patients attended a session with their two therapists to talk through their experiences.
Between dosing days, patients in the high-dose psilocybin group would take daily capsules containing a placebo. The low-dose group received a course of escitalopram.
The incidence of adverse effects was similar in each group. None was serious.
The study’s principal investigator David Nutt, DM, FRCP, FRCPsych, FSB, FMedSci, the Edmond J. Safra Chair in Neuropsychopharmacology at Imperial College London, said that many patients in the psilocybin group reported revelatory insights during dosing days.
“Very often, for the first time, people have actually come to understand why they’re depressed,” he said.
The word psychedelic, coined in 1957 by psychiatrist Humphry Osmond, derives from the Greek words “psyche,” which means “soul” or “mind,” and “delos,” which means “reveal.”
'Profound experiences'
Certainly, patients in the psilocybin group received enough of the compound to induce what Dr. Carhart-Harris called “very profound experiences.”
The researchers said that the results, while promising, should not encourage anyone to self-medicate with psychedelic substances, which are still illegal in most jurisdictions.
“I view this very much – and I think most colleagues do as well – as a combination treatment,” Dr. Carhart-Harris said. “And we strongly believe that the psychotherapy component is as important as the drug action.”
He said the study was inspired by his earlier research into the effects of psilocybin on brain function along with a small open-label trial of the compound’s effects on treatment-resistant depression published in The Lancet Psychiatry in July 2016.
The team stressed that the cohort and the absence of an entirely placebo group limit conclusions that can be drawn about either treatment.
Dr. Carhart-Harris also said he would have liked a more diverse group of patients. Participants were mostly White and mostly male, with a mean age of 41, and a high educational attainment. Of the 59 enrolled, only 34% were women.
Volunteers underwent functional MRI scans at the start and end of the trial. The team will now analyze these results to gain insight into impact on brain function and will gather and assess follow-up data. They also plan a trial examining the effect of psilocybin on anorexia.
“I think it’s fair to say the results signal hope that we may be looking at a promising alternative treatment for depression,” Dr. Carhart-Harris said. “It’s often said that we need novel treatments to treat depression because too many new drugs are what [are] sometimes called ‘me too’ drugs: They work in the same way as drugs that have preceded them. Psilocybin therapy seems to work fundamentally in a different way to SSRIs.”
Unanswered questions
In an accompanying editorial, Jeffrey A. Lieberman, MD, Lawrence C. Kolb Professor and chairman of the department of psychiatry at Columbia University, New York, warned that there remain many unanswered questions about using psychedelics for medical purposes.
They were considered potential miracle cures for a range of mental disorders in the 1960s, only to be banned in 1970s America because of “the perceived dangers and corrosive effects” on society, he wrote.
“The Carhart-Harris study notwithstanding, we are still awaiting definitive proof of the therapeutic efficacy of psychedelics and their capacity to improve the human condition,” Dr. Lieberman wrote. “Should the mind-bending properties of the psychedelics prove to be the panacea their proponents professed, informed consent and safety standards must be established. How do we explain mystical, ineffable, and potentially transformative experiences to patients, particularly if they are in a vulnerable state of mind? What is their potential for addiction?”
David Owens, MD, PhD, professor emeritus of clinical psychiatry at the University of Edinburgh, described Lieberman’s comments as “spot on.”
“This is a small, exploratory study with numbers too small to analyze fully,” he said. “The population is not recruited randomly from, for example, consecutive admissions or presentations, and screening of volunteers was by telephone, not face to face. One might say this is an ‘interested’ population, willing to go for novel approaches and with no placebo group, the extent of the placebo response cannot be assessed.”
The study was funded by the Alexander Mosley Charitable Trust and the founders of the Centre for Psychedelic Research. Infrastructure support was provided by the National Institute for Health Research Imperial Biomedical Research Centre and NIHR Imperial Clinical Research Facility.
A version of this article first appeared on Medscape.com.
PTSD linked to ischemic heart disease
A study using data from Veterans Health Administration (VHA) electronic medical records shows a significant association between posttraumatic stress disorder (PTSD) among female veterans and an increased risk for incident ischemic heart disease (IHD).
The increased risk for IHD was highest among women younger than 40 with PTSD, and among racial and ethnic minorities.
“These women have been emerging as important targets for cardiovascular prevention, and our study suggests that PTSD may be an important psychosocial risk factor for IHD in these individuals,” wrote the researchers, led by Ramin Ebrahimi, MD, department of medicine, cardiology section, Veterans Affairs Greater Los Angeles Health Care System. “With the number of women veterans growing, it is critical to appreciate the health care needs of this relatively young and diverse patient population.”
The study results also have “important implications for earlier and more aggressive IHD risk assessment, monitoring and management in vulnerable women veterans,” they added. “Indeed, our findings support recent calls for cardiovascular risk screening in younger individuals and for the need to harness a broad range of clinicians who routinely treat younger women to maximize prevention efforts.”
The article was published online in JAMA Cardiology on March 17.
Increasing number of VHA users
“As an interventional cardiologist and the director of the cardiac catheterization laboratory, I noticed a significant number of the patients referred to the cath lab carried a diagnosis of posttraumatic stress disorder,” Dr. Ebrahimi said in an interview. “This intrigued me and started my journey into trying to understand how psychiatric disorders in general, and PTSD, may impact/interact with cardiovascular disorders,” he added.
The number of female veterans in the military has been increasing, and they now make up about 10% of the 20 million American veterans; that number is projected to exceed 2.2 million in the next 20 years, the authors wrote. Female veterans are also the fastest growing group of users of the VHA, they added.
IHD is the leading cause of death in women in the United States, despite the advancements in prevention and treatment. Although women are twice as likely to develop PTSD as are men, and it is even more likely in female veterans, much of the research has predominately been on male veterans, the authors wrote.
For this retrospective study, which used data from the VHA Corporate Data Warehouse, the authors examined a cohort of female veterans who were 18 years or older who had used the VHA health care system between Jan. 1, 2000, and Dec. 31, 2017.
Of the 828,997 female veterans, 151,030 had PTSD. Women excluded from the study were those who did not have any clinical encounters after their index visit, participants who had a diagnosis of IHD at or before the index visit, and those with incident IHD within 90 days of the index visit, allowing time between a PTSD diagnosis and IHD.
Propensity score matching on age at index visit, the number of previous visits, and the presence of traditional and female-specific cardiovascular risk factors, as well as mental and physical health conditions, was conducted to identify female veterans ever diagnosed with PTSD, who were matched in a 1:2 ratio to those never diagnosed with PTSD. In all, 132,923 women with PTSD and 265,846 women without PTSD were included, and data were analyzed for the period of Oct. 1, 2018, to Oct. 30, 2020.
IHD was defined as new-onset coronary artery disease, angina, or myocardial infarction–based ICD-9 and ICD-10 diagnostic codes. Age, race, and ethnicity were self-reported.
The analytic sample consisted of relatively young female veterans (mean [SD] age at baseline, 40.1 [12.2] years) of various races (White, 57.6%; Black, 29.8%) and ethnicities, the authors reported.
Of the 9,940 women who experienced incident IHD during follow-up, 5,559 did not have PTSD (2.1% of the overall population examined) and 4,381 had PTSD (3.3%). PTSD was significantly associated with an increased risk for IHD. Over the median follow-up of 4.9 years, female veterans with PTSD had a 44% higher rate of developing incident IHD compared with the female veterans without PTSD (hazard ratio [HR], 1.44; 95% confidence interval [CI], 1.38-1.50).
In addition, those with PTSD who developed IHD were younger at diagnosis (mean [SD] age, 55.5 [9.7]) than were patients without PTSD (mean [SD] age, 57.8 [10.7]). Effect sizes were largest in the group younger than 40 years (HR, 1.72; 95% CI, 1.55-1.90) and decreased for older participants (HR for those ≥60 years, 1.24; 95% CI, 1.12-1.38)
The authors found a 49% to 66% increase in risk for IHD associated with PTSD in Black women (HR, 1.49; 95% CI, 1.38-1.62) and those identified as non-White and non-Black (HR, 1.66; 95%, 1.33-2.08).
Women of all ethnic groups with PTSD were at higher risk of developing IHD, but this was especially true for Hispanic/Latina women (HR, 1.50; 95% CI 1.22-1.84), they noted.
The authors reported some limitations to their findings. The analytic sample could result in a lower ascertainment of certain conditions, such as psychiatric disorders, they wrote. Substance disorders were low in this study, possibly because of the younger age of female veterans in the sample. Because this study used VHA electronic medical records data, medical care outside of the VHA that was not paid for by the VHA could not be considered.
In addition, although this study used a large sample of female veterans, the findings cannot be generalized to female veterans outside of the VHA system, nonveteran women, or men, the researchers wrote.
A call to action
In an accompanying comment, Beth E. Cohen, MD, of the University of California, San Francisco, and the San Francisco Veterans Affairs Health Care System, points out that the physical implications for psychosocial conditions, including depression and PTSD, have been recognized for quite some time. For example, results of the INTERHEART case-control study of 30,000 people showed stress, depression, and stressful life events accounted for one-third the population-attributable risk for myocardial infarction.
As was also noted by Dr. Ebrahimi and colleagues, much of the current research has been on male veterans, yet types of trauma differ among genders; women experience higher rates of military sexual trauma but lower rates of combat trauma, Dr. Cohen wrote. The PTSD symptoms, trajectory, and biological effects can differ for women and men, as can the pathogenesis, presentation, and outcomes of cardiovascular disease (CVD).
These findings, she said, “are an important extension of the prior literature and represent the largest study in female veterans to date. Although methods differ across studies, the magnitude of risk associated with PTSD was consistent with that found in prior studies of male veterans and nonveteran samples.”
The assessment of age-specific risk is also a strength of the study, “and has implications for clinical practice, because PTSD-associated risk was greatest in a younger group in whom CVD may be overlooked.”
Dr. Cohen addressed the limitations outlined by the authors, including ascertainment bias, severity of PTSD symptoms, and their chronicity, but added that “even in the context of these limitations, this study illustrates the importance of PTSD to the health of women veterans and the additional work needed to reduce their CVD risk.”
Clinical questions remain, she added. Screens for PTSD are widely used in the VHA, yet no studies have examined whether screening or early detection decrease CVD risk. In addition, no evidence suggests that screening for or treatment of PTSD improves cardiovascular outcomes.
“Given the challenges of answering these questions in observational studies, it will be important to incorporate measures of CVD risk and outcomes in trials of behavioral and medical therapies for patients with PTSD,” she wrote.
She added that collaborations among multidisciplinary patient care teams will be important. “The findings of this study represent a call to action for this important work to understand the cardiovascular effects of PTSD and improve the health and well-being of women veterans,” Dr. Cohen concluded.
This research was supported by Investigator-Initiated Research Award from the Department of Defense U.S. Army Medical Research and Material Command Congressionally Directed Medical Research Programs (Dr. Ebrahimi) and in part by grants from the VA Informatics and Computing Infrastructure and the Offices of Research and Development at the Northport, Durham, and Greater Los Angeles Veterans Affairs medical centers. Dr. Ebrahimi reported receiving grants from the Department of Defense during the conduct of the study. Disclosures for other authors are available in the paper. Dr. Cohen reports no disclosures.
A version of this article first appeared on Medscape.com.
Transgender hormone therapy linked to blood pressure changes
Transgender people treated with gender-affirming hormone therapy show distinctive changes in blood pressure that begin soon after treatment initiation and do not subside over years of treatment, according to the largest and longest observational study to date to look at the issue.
“Many physicians may not be aware of the changes to blood pressure in trans patients who start hormone therapy,” senior author Michael S. Irwig, MD, director of transgender medicine at Beth Israel Deaconess Medical Center in Boston, told this news organization.
“The take-away message for physicians is to monitor blood pressure both before and after starting hormone therapy in transgender patients, as over a third of transgender individuals had stage 1 hypertension before starting hormone therapy, and many had their blood pressure increase after starting hormone therapy.”
Mean blood pressure increases in transgender males, decreases in females
In the study, published in Hypertension, Katherine Banks, MD, George Washington University, Washington, and colleagues, followed 470 transgender adult patients for up to 5 years.
The mean systolic blood pressure levels in transgender female patients (male at birth) significantly decreased compared with baseline within a few months of them starting gender-affirming hormone treatment.
Conversely, the systolic blood pressure levels in transgender males (females at birth) who were treated with testosterone increased over the same period.
There were no significant changes in the groups in terms of diastolic blood pressure, consistent with other studies.
“Our study is the first to describe the time course of the blood pressure effects of gender-affirming hormone therapy and to compare the rates of elevated blood pressure and stage 1 and stage 2 hypertension using blood pressure readings from gender-diverse individuals pre- and post–gender-affirming hormone therapy,” the authors note.
Gender-affirming hormone therapy – which has been prescribed to transgender patients for more than 25 years – typically involves a combination of estrogen and an anti-androgen for males transitioning to female, while the therapy for those transitioning to male generally only involves testosterone.
The therapy has previously been linked to various cardiac effects, with evidence showing transgender men have as much as a 5-times greater risk of heart attack versus cisgender women, the authors note.
Although the American Heart Association issued a 2020 Scientific Statement addressing the cardiovascular disease risk, evidence on the effects specifically on blood pressure in transgender patients has been inconsistent.
For the new study, Dr. Banks and colleagues enrolled 247 transgender females and 223 transgender males who were treated between 2007 and 2015 at two medical centers in Washington, D.C. Of the individuals, who had a mean age of 27.8, about 27% were non-White and 16% were Latinx.
They had blood pressure measurements taken at baseline and at follow-up clinical visits for up to 57 months following the initiation of gender-affirming hormone therapy.
Over the follow-up period, the transgender females had decreases in mean systolic blood pressure of 4.0 mm Hg within 2 to 4 months of starting hormone therapy (P < .0001) and mean declines of 6.0 mm Hg were further observed at 11 to 21 months compared with baseline.
In transgender males, the mean systolic blood pressure increased by 2.6 mm Hg at 2 to 4 months (P = .02), and by 2.9 mm Hg at 11 to 21 months after starting therapy.
Furthermore, “although the average increase in systolic blood pressure was 2.6 mm Hg in transgender men within 2 to 4 months, some patients had much higher increases,” Dr. Irwig noted.
As many as 40% of transgender men had stage 1 hypertension after 11 to 21 months of hormone therapy.
The blood pressure changes in transgender males and females were observed across all three racial ethnic groups of Whites, Blacks, and Latinx, and the changes remained consistent throughout the entire follow-up period of approximately 5 years while hormone therapy was continued.
In addition to the changes after therapy initiation, the researchers note that more than one-third of individuals in both groups had stage 1 hypertension even before starting hormone therapy.
The findings are a concern in light of “clear evidence linking hypertension and higher blood pressure with cardiovascular events such as stroke and heart attacks,” Dr. Irwig said.
Protective effects for transgender females?
Transgender females showed as much as a 47% decrease in the prevalence of stage 2 hypertension, from 19% to 10%, within 2 to 4 months of treatment with gender-affirming hormone therapy (P = .001), and the rate declined further to 8% at 11 to 21 months, suggesting a protective effect of the treatment.
“The rate of stage 2 hypertension did drop in transgender feminine individuals, which could be protective and lower their risk for cardiovascular events,” Dr. Irwig said.
“This was not a surprise, as lowering testosterone and the use of spironolactone can lower blood pressure,” he noted.
Exceptions in both groups
Of note, a sizable proportion of patients had blood pressure changes that were in fact the opposite of the patterns seen in the majority of their gender group.
Specifically, while 42% to 53% of the transgender females had systolic blood pressure readings of at least 5 mm Hg lower than their baseline readings, up to 32% had increases of at least 5 mm Hg compared to baseline readings.
Likewise, whereas 41% to 59% of transgender males had increases of at least 5 mm Hg compared with baseline, up to 35% had levels that were at least 5 mm Hg lower than baseline.
“It was a surprise that over a quarter of individuals had changes opposite to the mean changes,” Dr. Irwig said.
The differing blood pressure changes underscore that “more research is needed to determine which formulations of estrogen, testosterone, and antiandrogens are optimal regarding blood pressure and cardiovascular health, especially in older individuals,” the authors note.
Gender-affirming hormone therapy formulations differ
Various formulations for gender-affirming hormone regimens are available, including oral, transdermal, sublingual, and intramuscular preparations.
In the study, 77% to 91% of transgender males were on intramuscular testosterone injections, with the rest on transdermal formulations, and 92% of transgender female patients were started on oral estradiol, with mean doses generally increasing over time.
The study’s results are consistent with evidence from other studies, with 7 of 8 involving transgender males showing mean increases in systolic blood pressure ranging from 1 to 14 mm Hg.
Previous research supports cardiovascular risk
As reported by this news organization, other emerging research on cardiovascular risks to transgender people include a recent study showing more than 10% of transgender males were found to have hematocrit levels that could put them at risk for blood clots.
And further research on transgender youth also shows concerning elevations in lipids and other cardiovascular risks.
The authors have disclosed no relevant financial relationships.
A version of this article first appeared on Medscape.com.
Cell-free DNA improves response prediction in breast cancer
When the two techniques were in agreement, the accuracy of response prediction was 92.6% in the study, with a predictive value for complete response of 87.5% and a predictive value for absence of complete response of 94.7%, which was substantially better than either method alone.
“Our work identifies a new parameter that is easily combinable with MRI for a more accurate prediction of response following neoadjuvant treatment, with possible implications for current protocols for the evaluation of nodal residual disease,” researcher Francesco Ravera, MD, PhD, of the University of Genoa (Italy), said in a press release.
Dr. Ravera and colleagues presented their research in a poster at the American Association for Cancer Research Annual Meeting 2021: Week 1 (Abstract LB063).
Accurate response prediction is important because it guides subsequent surgical management, Dr. Ravera and colleagues noted. Pathological complete responders – generally about 25% of patients after neoadjuvant therapy – typically undergo a sentinel lymph node biopsy to ensure cancer hasn’t spread, while incomplete responders often have a complete axillary lymph node dissection.
Response is currently assessed by MRI, but accuracy is suboptimal, the researchers noted. A more accurate method might “allow the omission of sentinel lymph node biopsy in complete responders, which could be replaced by longitudinal radiologic monitoring. This would represent substantial progress in the pursuit of an effective, minimally invasive treatment,” Dr. Ravera said.
He and his colleagues turned to plasma cfDNA because it has shown potential for providing useful diagnostic, recurrence, and treatment response information in neoplastic patients.
When healthy cells die, they release similarly sized DNA fragments into the blood, but cancer cells release fragments of varying sizes. The heart of the research was using electrophoresis to assess the degree of fragmentation – called cfDNA integrity – in plasma samples from 38 patients after anthracycline/taxane-based regimens.
The researchers compared how well cfDNA, preoperative MRI, and the combination of the two methods predicted response according to surgical histology.
A total of 11 patients had pathological complete responses to neoadjuvant therapy.
The ratio of large 321-1,000 base pair sized fragments to smaller 150-220 base pair sized fragments, which the team dubbed the “cfDNA integrity index,” best predicted response. At a cutoff above 2.71, the index was 81.6% accurate in predicting pathological complete response, with a sensitivity of 81.8% and specificity of 81.5%.
The predictive power wasn’t much better than MRI, which was 77.1% accurate, with a sensitivity of 72.7% and a specificity of 81.5%.
The two techniques were concordant in their prediction in over two-thirds of patients. When the techniques agreed, accuracy was over 90%.
Prospective studies are needed to evaluate the cfDNA integrity index in combination with MRI, the researchers concluded.
The study was sponsored by the University of Genoa and others. Dr. Ravera disclosed no conflicts of interest.
FROM AACR 2021