User login
Intranasal third-generation CGRP effective for acute migraine
, new research shows. In a randomized dose-ranging, placebo-controlled, phase 2/3 trial, investigators found both the 10- and 20-mg doses of the drug were associated with pain freedom in more than 20% of patients and alleviated the most bothersome symptom, defined as photophobia, phonophobia, or nausea, in more than 40% of patients.
Most adverse events associated with zavegepant were mild or moderate. The drug is not associated with liver toxicity.

“The intranasal formulation demonstrated some separation on pain relief as early as 15 minutes, though in terms of the statistical hierarchy, those differences were not significant,” said study investigator Richard B. Lipton, MD, professor and vice chair of neurology at Albert Einstein College of Medicine, New York, who presented the findings at the American Academy of Neurology’s 2021 annual meeting.
“Sustained pain freedom was observed from 2 to 48 hours post-dose,” Dr. Lipton added. A phase 3 clinical trial has been initiated to compare the efficacy of the 10-mg dose with that of placebo for the acute treatment of migraine.
Three doses
Zavegepant is the only intranasal CGRP receptor antagonist undergoing late-stage development for the acute treatment of migraine. A previous single ascending dose study suggested the drug provided systemic exposure and had potentially therapeutic effects.
The study included participants age 18 years or older who had a diagnosis of migraine for at least 1 year, had two to eight migraine attacks of moderate or severe intensity and fewer than 15 monthly headache days over the previous 3 months.
The investigators randomly assigned participants in this phase 2/3 trial to placebo or a 5-mg, 10-mg, or 20-mg dose of intranasal zavegepant. Participants treated a single attack of moderate to severe pain with their assigned treatment.
The study’s two primary endpoints were freedom from pain and freedom from the most bothersome symptom at 2 hours after dosing.
The investigators randomly assigned 1,673 participants to treatment. Of this group, 1,588 treated an attack with study medication. The researchers also included 1,581 participants in the modified intention-to-treat population. Of this group, 387 received the 5-mg dose, 391 received the 10-mg dose, 402 received the 20-mg dose, and 401 received placebo.
Pain freedom
The population’s median age was approximately 41 years, 86% of participants were female, and 14% were taking preventive migraine medication. Participants’ mean number of moderate or severe attacks per month was 4.9 overall. The most common most bothersome symptom was photophobia.
The researchers observed a difference in outcome between the active and placebo arms as early as 15 minutes post-dose, but this difference was not statistically significant. At 2 hours, the rate of pain freedom was 15.5% in the placebo group, 22.5% in the 10-mg group (P = .0113), and 23.1% in the 20-mg group (P = .0055). The result for the 5-mg group (19.6%) was not significantly different from that of the placebo group.
The rate of freedom from the most bothersome symptom was 33.7% in the placebo group, 41.9% in the 10-mg group (P = .0155), and 42.5% in the 20-mg group (P = .0094). For this endpoint as well, the result of the 5-mg group (39%) was not significantly different from that among controls.
The most common adverse events were dysgeusia (impaired sense of taste) and nasal discomfort. The rate of dysgeusia ranged from 13.5% to 16.1% in the zavegepant groups, compared with 3.5% among controls. The rate of nasal discomfort ranged from 1.3% to 5.2% in the zavegepant groups, compared with 0.2% among controls. The investigators concluded that intranasal zavegepant had a favorable safety profile.
‘Exciting potential addition’
Commenting on the findings, Alan M. Rapoport, MD, clinical professor of neurology at the University of California, Los Angeles, said: “Zavegepant is an exciting potential addition to rimegepant for the acute care of migraine.”

Many patients like the orally dissolving tablet formulation of rimegepant (Nurtec), but some have nausea and do not absorb oral preparations well, said Dr. Rapoport, who is editor-in-chief of Neurology Reviews and a past president of the International Headache Society. “So, it makes sense to have a gepant, which is not a vasoconstrictor and has few adverse events, developed as a nasal spray.” Nasal preparations often work more quickly than oral preparations, he added.
Other intranasal treatments available for migraine include dihydroergotamine (Migranal), zolmitriptan (Zomig), sumatriptan (Imitrex), and ketorolac (Sprix). It is not possible to compare zavegepant with these medications, or with other CGRP receptor antagonists, because they have not been studied in head-to-head trials, said Dr. Rapoport, who was not involved in the study but has previously consulted for Biohaven Pharmaceuticals, the drug’s manufacturer.
“I would predict a nasal spray would work somewhat faster and better in some patients with nausea or poor absorption, so I would be happy to have it approved and available.”
The current study uses endpoints typically prescribed by the U.S. Food and Drug Administration and includes a large sample size, said Dr. Rapoport.
“During the informed consent [stage], the patients in this trial would be told that there is a 3-in-4 chance that they would be getting an active drug versus placebo, and that often increases the placebo response,” he added. “In this trial, a placebo response of 15.5% is slightly high, but not atypical,” he added.
This study raises the question of whether other acute-care migraine medications should be studied as nasal preparations. “I think the answer is yes,” said Dr. Rapoport. “Fast-acting, effective nasal preparations that are easy to use and cause few adverse events [are] what we need.”
Biohaven Pharmaceuticals sponsored the study. Dr. Lipton has been a consultant for Biohaven, has conducted studies funded by the company, and has stock in the company. Dr. Rapoport has consulted and spoken for Biohaven, but did not participate in the current study.
A version of this article first appeared on Medscape.com.
, new research shows. In a randomized dose-ranging, placebo-controlled, phase 2/3 trial, investigators found both the 10- and 20-mg doses of the drug were associated with pain freedom in more than 20% of patients and alleviated the most bothersome symptom, defined as photophobia, phonophobia, or nausea, in more than 40% of patients.
Most adverse events associated with zavegepant were mild or moderate. The drug is not associated with liver toxicity.
“The intranasal formulation demonstrated some separation on pain relief as early as 15 minutes, though in terms of the statistical hierarchy, those differences were not significant,” said study investigator Richard B. Lipton, MD, professor and vice chair of neurology at Albert Einstein College of Medicine, New York, who presented the findings at the American Academy of Neurology’s 2021 annual meeting.
“Sustained pain freedom was observed from 2 to 48 hours post-dose,” Dr. Lipton added. A phase 3 clinical trial has been initiated to compare the efficacy of the 10-mg dose with that of placebo for the acute treatment of migraine.
Three doses
Zavegepant is the only intranasal CGRP receptor antagonist undergoing late-stage development for the acute treatment of migraine. A previous single ascending dose study suggested the drug provided systemic exposure and had potentially therapeutic effects.
The study included participants age 18 years or older who had a diagnosis of migraine for at least 1 year, had two to eight migraine attacks of moderate or severe intensity and fewer than 15 monthly headache days over the previous 3 months.
The investigators randomly assigned participants in this phase 2/3 trial to placebo or a 5-mg, 10-mg, or 20-mg dose of intranasal zavegepant. Participants treated a single attack of moderate to severe pain with their assigned treatment.
The study’s two primary endpoints were freedom from pain and freedom from the most bothersome symptom at 2 hours after dosing.
The investigators randomly assigned 1,673 participants to treatment. Of this group, 1,588 treated an attack with study medication. The researchers also included 1,581 participants in the modified intention-to-treat population. Of this group, 387 received the 5-mg dose, 391 received the 10-mg dose, 402 received the 20-mg dose, and 401 received placebo.
Pain freedom
The population’s median age was approximately 41 years, 86% of participants were female, and 14% were taking preventive migraine medication. Participants’ mean number of moderate or severe attacks per month was 4.9 overall. The most common most bothersome symptom was photophobia.
The researchers observed a difference in outcome between the active and placebo arms as early as 15 minutes post-dose, but this difference was not statistically significant. At 2 hours, the rate of pain freedom was 15.5% in the placebo group, 22.5% in the 10-mg group (P = .0113), and 23.1% in the 20-mg group (P = .0055). The result for the 5-mg group (19.6%) was not significantly different from that of the placebo group.
The rate of freedom from the most bothersome symptom was 33.7% in the placebo group, 41.9% in the 10-mg group (P = .0155), and 42.5% in the 20-mg group (P = .0094). For this endpoint as well, the result of the 5-mg group (39%) was not significantly different from that among controls.
The most common adverse events were dysgeusia (impaired sense of taste) and nasal discomfort. The rate of dysgeusia ranged from 13.5% to 16.1% in the zavegepant groups, compared with 3.5% among controls. The rate of nasal discomfort ranged from 1.3% to 5.2% in the zavegepant groups, compared with 0.2% among controls. The investigators concluded that intranasal zavegepant had a favorable safety profile.
‘Exciting potential addition’
Commenting on the findings, Alan M. Rapoport, MD, clinical professor of neurology at the University of California, Los Angeles, said: “Zavegepant is an exciting potential addition to rimegepant for the acute care of migraine.”
Many patients like the orally dissolving tablet formulation of rimegepant (Nurtec), but some have nausea and do not absorb oral preparations well, said Dr. Rapoport, who is editor-in-chief of Neurology Reviews and a past president of the International Headache Society. “So, it makes sense to have a gepant, which is not a vasoconstrictor and has few adverse events, developed as a nasal spray.” Nasal preparations often work more quickly than oral preparations, he added.
Other intranasal treatments available for migraine include dihydroergotamine (Migranal), zolmitriptan (Zomig), sumatriptan (Imitrex), and ketorolac (Sprix). It is not possible to compare zavegepant with these medications, or with other CGRP receptor antagonists, because they have not been studied in head-to-head trials, said Dr. Rapoport, who was not involved in the study but has previously consulted for Biohaven Pharmaceuticals, the drug’s manufacturer.
“I would predict a nasal spray would work somewhat faster and better in some patients with nausea or poor absorption, so I would be happy to have it approved and available.”
The current study uses endpoints typically prescribed by the U.S. Food and Drug Administration and includes a large sample size, said Dr. Rapoport.
“During the informed consent [stage], the patients in this trial would be told that there is a 3-in-4 chance that they would be getting an active drug versus placebo, and that often increases the placebo response,” he added. “In this trial, a placebo response of 15.5% is slightly high, but not atypical,” he added.
This study raises the question of whether other acute-care migraine medications should be studied as nasal preparations. “I think the answer is yes,” said Dr. Rapoport. “Fast-acting, effective nasal preparations that are easy to use and cause few adverse events [are] what we need.”
Biohaven Pharmaceuticals sponsored the study. Dr. Lipton has been a consultant for Biohaven, has conducted studies funded by the company, and has stock in the company. Dr. Rapoport has consulted and spoken for Biohaven, but did not participate in the current study.
A version of this article first appeared on Medscape.com.
From AAN 2021

Female genital cutting: Caring for patients through the lens of health care equity
Female genital cutting (FGC), also known as female circumcision or female genital mutilation, is defined by the World Health Organization (WHO) as “the partial or total removal of the external female genitalia, or other injury to the female genital organs for non-medical reasons.”1 It is a culturally determined practice that is mainly concentrated in certain parts of Africa, the Middle East, and Asia and now is observed worldwide among migrants from those areas.1 Approximately 200 million women and girls alive today have undergone FGC in 31 countries, although encouragingly the practice’s prevalence seems to be declining, especially among younger women.2
Too often, FGC goes unrecognized in women who present for medical care, even in cases where a genitourinary exam is performed and documented.3,4 As a result, patients face delays in diagnosis and management of associated complications and symptoms. Female genital cutting is usually excluded from medical school or residency training curricula,5 and physicians often lack familiarity with the necessary clinical or surgical management of patients who have had the procedure.6 It is crucial, however, that ObGyns feel comfortable recognizing FGC and clinically caring for pregnant and nonpregnant patients who have undergone the procedure. The obstetric-gynecologic setting should be the clinical space in which FGC is correctly diagnosed and from where patients with complications can be referred for appropriate care.
FGC: Through the lens of inequity
Providing culturally competent and sensitive care to women who have undergone FGC is paramount to reducing health care inequities for these patients. Beyond the medical recommendations we review below, we suggest the following considerations when approaching care for these patients.
Acknowledge our biases. It is paramount for us, as providers, to acknowledge our own biases and how these might affect our relationship with the patient and how our care is received. This starts with our language and terminology: The term female genital mutilation can be judgmental or offensive to our patients, many of whom do not consider themselves to have been mutilated. This is why we prefer to use the term female genital cutting, or whichever word the patient uses, so as not to alienate a patient who might already face many other barriers and microaggressions in seeking health care.
Control our responses. Another way we must check our bias is by controlling our reactions during history taking or examining patients who have undergone FGC. Understandably, providers might be shocked to hear patients recount their childhood experiences of FGC or by examining an infibulated scar, but patients report noticing and experiencing hurt, distress, and shame when providers display judgment, horror, or disgust.7 Patients have reported that they are acutely aware that they might be viewed as “backward” and “primitive” in US health care settings.8 These kinds of feelings and experiences can further exacerbate patients’ distrust and avoidance of the health care system altogether. Therefore, providers should acknowledge their own biases regarding the issue as well as those of their staff and work to mitigate them.
Avoid stigmatization. While FGC can have long-term effects (discussed below), it is important to remember that many women who have undergone FGC do not experience symptoms that are bothersome or feel that FGC is central to their lives or lived experiences. While we must be thorough in our history taking to explore possible urinary, gynecologic, and sexual symptoms of concern and bother to the patient, we must avoid stigmatizing our patients by assuming that all who have undergone FGC are “sexually disabled,” which may lead a provider to recommend medically unindicated intervention, such as clitoral reconstruction.9
Continue to: Classifying FGC types...
Classifying FGC types
The WHO has classified FGC into 4 different types1:
- type 1, partial or total removal of the clitoris or prepuce
- type 2, partial or total removal of part of the clitoris and labia minora
- type 3 (also known as infibulation), the narrowing of the vaginal orifice by cutting, removing, and/or repositioning the labia, and
- type 4, all other procedures to the female genitalia for nonmedical reasons.
Long-term complications
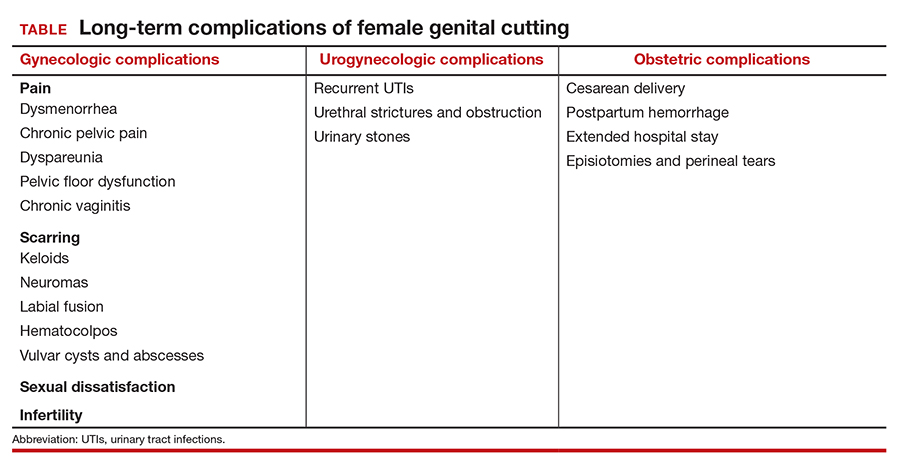
Female genital cutting, especially types 2 and 3, can lead to long-term obstetric and gynecologic complications that the ObGyn should be able to diagnose and manage (TABLE).
The most common long-term complications of FGC are dysmenorrhea, dyspareunia, recurrent vaginal and urinary tract infections, and sexual dysfunction/dissatisfaction.10 One recent cross-sectional study that used validated questionnaires on pelvic floor and psychosexual symptoms found that women with FGC had higher distress scores than women who had not undergone FGC, indicating various pelvic floor symptoms responsible for impact on their daily lives.11
Infertility can result from a combination of physical barriers (vaginal stenosis and an infibulated scar) and psychologic barriers secondary to dyspareunia, for example.12 Labor and delivery also presents a challenge to both patients and providers, especially in cases of infibulation. Studies show that patients who have undergone FGC are at increased risk of adverse obstetric outcomes, including postpartum hemorrhage, episiotomy, cesarean delivery, and extended hospital stay.13 Neonatal complications, including infant resuscitation and perinatal death, are more commonly reported in studies outside the United States.13
Clinical management recommendations
It is important to be aware of the WHO FCG classifications and be able to recognize evidence of the procedure on examination. The ObGyn should perform a detailed physical exam of the external genitalia as well as a pelvic floor exam of every patient. If the patient does not disclose a history of FGC but it is suspected based on the examination, the clinician should inquire sensitively if the patient is aware of having undergone any genital procedures.
Especially when a history of FGC has been confirmed, clinicians should ask patients sensitively about their urinary and sexual function and satisfaction. Validated tools, such as the Female Sexual Function Index, the Female Sexual Distress Scale, and the Pelvic Floor Disability Index, may be helpful in gathering an objective and detailed assessment of the patient’s symptoms and level of distress.14 Clinicians also should ask about the patient’s detailed obstetric history, particularly regarding the second stage, delivery, and postpartum complications. The clinician also should specifically inquire about a history of defibulation or additional genital procedures.
Patients with urethral strictures or stenosis may require an exam under anesthesia, cystoscopy, urethral dilation, or urethroplasty.12 Those with chronic urinary tract or vaginal infections may require chronic oral suppressive therapy or defibulation (described below). Defibulation also may be considered for relief of severe dysmenorrhea and menorrhagia that may be resulting from hematocolpos. The ObGyn also should make certain to evaluate for other common causes of these symptoms that may be unrelated to FGC, such as endometriosis.
Many women who have undergone FGC do not report dyspareunia or sexual dissatisfaction; however, infibulation especially has been associated with higher rates of these sequelae.12 In addition to defibulation, pelvic floor physical therapy with an experienced therapist may be helpful for patients with pelvic floor dysfunction, vaginismus, and/or dyspareunia.
The defibulation procedure
Defibulation (or deinfibulation) is a surgical reconstructive procedure that opens the infibulated scar of patients who have undergone type 3 FGC (infibulation), thus exposing the urethra and introitus, and in almost half of cases an intact clitoris.15 Defibulation may be specifically requested by a patient or it may be recommended by the ObGyn either for reducing complications of pregnancy or to address the patient’s gynecologic, sexual, or urogynecologic symptoms by allowing penetrative intercourse, urinary flow, physiologic delivery, and menstruation.16
Defibulation should be performed under regional or general anesthesia and can be performed during pregnancy (or even in labor). An anterior incision is made on the infibulated scar, creating a new labia major, and the edges are sutured separately. Postoperatively, patients should be instructed to perform sitz baths and to expect a change in their urinary voiding stream.12 The few studies that have evaluated defibulation have shown high rates of success in addressing preoperative symptoms; the complication rates of defibulation are low and the satisfaction rates are high.16
The ethical conundrum of reinfibulation
Reinfibulation is defined as the restitching or reapproximation of scar tissue or the labia after delivery or a gynecologic procedure, and it is often performed routinely after every delivery in patients’ countries of origin.17
Postpartum reinfibulation on patient request raises legal and ethical issues for the ObGyn. In the United Kingdom, reinfibulation is illegal, and some international organizations, including the International Federation of Gynecology and Obstetrics and the WHO, have recommended against the practice. In the United States, reinfibulation of an adult is legal, as it falls under the umbrella of elective female genital cosmetic surgery.18,19
The procedure could create or exacerbate long-term complications and should generally be discouraged. However, if despite extensive counseling (preferably in the prenatal period) a patient insists on having the procedure, the ObGyn may need to elevate the principle of patient autonomy and either comply or find a practitioner who is comfortable performing it. One retrospective review in Switzerland suggested that specific care and informative counseling prenatally with the inclusion of a patient’s partner in the discussion can improve the acceptability of defibulation without reinfibulation.20
Conclusion
It is important for ObGyns to be familiar with the practice of FGC and to be trained in its recognition on examination and care for the long-term complications that can result from the practice. At the same time, ObGyns should be especially conscious of their biases in order to provide culturally competent care and reduce health care stigmatization and inequities for these patients.
- World Health Organization. Female genital mutilation. February 3, 2020. https://www.who.int/news-room/fact-sheets/detail/female-genital-mutilation. Accessed February 22, 2021.
- UNICEF. Female genital mutilation (FGM). February 2020. https://data.unicef.org/topic/child-protection/female-genital-mutilation/. Accessed February 22, 2021.
- Stoklosa H, Nour NM. The eye cannot see what the mind does not know: female genital mutilation. Emerg Med J. 2018;35:585-586. doi: 10.1136/emermed-2018-207994.
- Abdulcadir J, Dugerdil A, Boulvain M, et al. Missed opportunities for diagnosis of female genital mutilation. Int J Gynaecol Obstet. 2014;125:256-260. doi: 10.1016/j.ijgo.2013.11.016.
- Jäger F, Schulze S, Hohlfeld P. Female genital mutilation in Switzerland: a survey among gynaecologists. Swiss Med Wkly. 2002;132:259-264.
- Zaidi N, Khalil A, Roberts C, et al. Knowledge of female genital mutilation among healthcare professionals. J Obstet Gynaecol. 2007;27:161-164. doi: 10.1080/01443610601124257.
- Chalmers B, Hashi KO. 432 Somali women’s birth experiences in Canada after earlier female genital mutilation. Birth. 2000;27:227-234. doi: 10.1046/j.1523-536x.2000.00227.x.
- Shahawy S, Amanuel H, Nour NM. Perspectives on female genital cutting among immigrant women and men in Boston. Soc Sci Med. 2019;220:331-339. doi: 10.1016/j.socscimed.2018.11.030.
- Sharif Mohamed F, Wild V, Earp BD, et al. Clitoral reconstruction after female genital mutilation/cutting: a review of surgical techniques and ethical debate. J Sex Med. 2020;17:531-542. doi: 10.1016/j.jsxm.2019.12.004.
- Nour NM. Female genital cutting: a persisting practice. Rev Obstet Gynecol. 2008 Summer;1(3):135-139.
- Binkova A, Uebelhart M, Dällenbach P, et al. A cross-sectional study on pelvic floor symptoms in women living with female genital mutilation/cutting. Reprod Health. 2021;18:39. doi: 10.1186/s12978-021-01097-9.
- Nour NM. Female genital cutting: clinical and cultural guidelines. Obstet Gynecol Surv. 2004;59:272-279. doi: 10.1097/01.ogx.0000118939.19371.af.
- WHO Study Group on Female Genital Mutilation and Obstetric Outcome; Banks E, Meirik O, Farley T, et al. Female genital mutilation and obstetric outcome: WHO collaborative prospective study in six African countries. Lancet. 2006;367:1835-1841. doi: 10.1016/S0140-6736(06)68805-3.
- American College of Obstetricians and Gynecologists. ACOG practice bulletin no. 119: female sexual dysfunction. Obstet Gynecol. 2011;117:996-1007. doi: 10.1097/AOG.0b013e31821921ce.
- Nour NM, Michels KB, Bryant AE. Defibulation to treat female genital cutting: effect on symptoms and sexual function. Obstet Gynecol. 2006;108:55-60. doi: 10.1097/01.AOG.0000224613.72892.77.
- Johnson C, Nour NM. Surgical techniques: defibulation of type III female genital cutting. J Sex Med. 2007;4:1544-1547. doi: 10.1111/j.1743-6109.2007.00616.x.
- Serour GI. The issue of reinfibulation. Int J Gynaecol Obstet. 2010;109:93-96. doi: 10.1016/j.ijgo.2010.01.001.
- Shahawy S, Deshpande NA, Nour NM. Cross-cultural obstetric and gynecologic care of Muslim patients. Obstet Gynecol. 2015;126:969-973. doi: 10.1097/AOG.0000000000001112.
- American College of Obstetricians and Gynecologists. Elective female genital cosmetic surgery: ACOG committee opinion summary, number 795. Obstet Gynecol. 2020;135:249-250. doi: 10.1097/AOG.0000000000003617.
- Abdulcadir J, McLaren S, Boulvain M, et al. Health education and clinical care of immigrant women with female genital mutilation/cutting who request postpartum reinfibulation. Int J Gynaecol Obstet. 2016;135:69-72. doi: 10.1016/j.ijgo.2016.03.027.
Female genital cutting (FGC), also known as female circumcision or female genital mutilation, is defined by the World Health Organization (WHO) as “the partial or total removal of the external female genitalia, or other injury to the female genital organs for non-medical reasons.”1 It is a culturally determined practice that is mainly concentrated in certain parts of Africa, the Middle East, and Asia and now is observed worldwide among migrants from those areas.1 Approximately 200 million women and girls alive today have undergone FGC in 31 countries, although encouragingly the practice’s prevalence seems to be declining, especially among younger women.2
Too often, FGC goes unrecognized in women who present for medical care, even in cases where a genitourinary exam is performed and documented.3,4 As a result, patients face delays in diagnosis and management of associated complications and symptoms. Female genital cutting is usually excluded from medical school or residency training curricula,5 and physicians often lack familiarity with the necessary clinical or surgical management of patients who have had the procedure.6 It is crucial, however, that ObGyns feel comfortable recognizing FGC and clinically caring for pregnant and nonpregnant patients who have undergone the procedure. The obstetric-gynecologic setting should be the clinical space in which FGC is correctly diagnosed and from where patients with complications can be referred for appropriate care.
FGC: Through the lens of inequity
Providing culturally competent and sensitive care to women who have undergone FGC is paramount to reducing health care inequities for these patients. Beyond the medical recommendations we review below, we suggest the following considerations when approaching care for these patients.
Acknowledge our biases. It is paramount for us, as providers, to acknowledge our own biases and how these might affect our relationship with the patient and how our care is received. This starts with our language and terminology: The term female genital mutilation can be judgmental or offensive to our patients, many of whom do not consider themselves to have been mutilated. This is why we prefer to use the term female genital cutting, or whichever word the patient uses, so as not to alienate a patient who might already face many other barriers and microaggressions in seeking health care.
Control our responses. Another way we must check our bias is by controlling our reactions during history taking or examining patients who have undergone FGC. Understandably, providers might be shocked to hear patients recount their childhood experiences of FGC or by examining an infibulated scar, but patients report noticing and experiencing hurt, distress, and shame when providers display judgment, horror, or disgust.7 Patients have reported that they are acutely aware that they might be viewed as “backward” and “primitive” in US health care settings.8 These kinds of feelings and experiences can further exacerbate patients’ distrust and avoidance of the health care system altogether. Therefore, providers should acknowledge their own biases regarding the issue as well as those of their staff and work to mitigate them.
Avoid stigmatization. While FGC can have long-term effects (discussed below), it is important to remember that many women who have undergone FGC do not experience symptoms that are bothersome or feel that FGC is central to their lives or lived experiences. While we must be thorough in our history taking to explore possible urinary, gynecologic, and sexual symptoms of concern and bother to the patient, we must avoid stigmatizing our patients by assuming that all who have undergone FGC are “sexually disabled,” which may lead a provider to recommend medically unindicated intervention, such as clitoral reconstruction.9
Continue to: Classifying FGC types...
Classifying FGC types
The WHO has classified FGC into 4 different types1:
- type 1, partial or total removal of the clitoris or prepuce
- type 2, partial or total removal of part of the clitoris and labia minora
- type 3 (also known as infibulation), the narrowing of the vaginal orifice by cutting, removing, and/or repositioning the labia, and
- type 4, all other procedures to the female genitalia for nonmedical reasons.
Long-term complications
Female genital cutting, especially types 2 and 3, can lead to long-term obstetric and gynecologic complications that the ObGyn should be able to diagnose and manage (TABLE).
The most common long-term complications of FGC are dysmenorrhea, dyspareunia, recurrent vaginal and urinary tract infections, and sexual dysfunction/dissatisfaction.10 One recent cross-sectional study that used validated questionnaires on pelvic floor and psychosexual symptoms found that women with FGC had higher distress scores than women who had not undergone FGC, indicating various pelvic floor symptoms responsible for impact on their daily lives.11
Infertility can result from a combination of physical barriers (vaginal stenosis and an infibulated scar) and psychologic barriers secondary to dyspareunia, for example.12 Labor and delivery also presents a challenge to both patients and providers, especially in cases of infibulation. Studies show that patients who have undergone FGC are at increased risk of adverse obstetric outcomes, including postpartum hemorrhage, episiotomy, cesarean delivery, and extended hospital stay.13 Neonatal complications, including infant resuscitation and perinatal death, are more commonly reported in studies outside the United States.13
Clinical management recommendations
It is important to be aware of the WHO FCG classifications and be able to recognize evidence of the procedure on examination. The ObGyn should perform a detailed physical exam of the external genitalia as well as a pelvic floor exam of every patient. If the patient does not disclose a history of FGC but it is suspected based on the examination, the clinician should inquire sensitively if the patient is aware of having undergone any genital procedures.
Especially when a history of FGC has been confirmed, clinicians should ask patients sensitively about their urinary and sexual function and satisfaction. Validated tools, such as the Female Sexual Function Index, the Female Sexual Distress Scale, and the Pelvic Floor Disability Index, may be helpful in gathering an objective and detailed assessment of the patient’s symptoms and level of distress.14 Clinicians also should ask about the patient’s detailed obstetric history, particularly regarding the second stage, delivery, and postpartum complications. The clinician also should specifically inquire about a history of defibulation or additional genital procedures.
Patients with urethral strictures or stenosis may require an exam under anesthesia, cystoscopy, urethral dilation, or urethroplasty.12 Those with chronic urinary tract or vaginal infections may require chronic oral suppressive therapy or defibulation (described below). Defibulation also may be considered for relief of severe dysmenorrhea and menorrhagia that may be resulting from hematocolpos. The ObGyn also should make certain to evaluate for other common causes of these symptoms that may be unrelated to FGC, such as endometriosis.
Many women who have undergone FGC do not report dyspareunia or sexual dissatisfaction; however, infibulation especially has been associated with higher rates of these sequelae.12 In addition to defibulation, pelvic floor physical therapy with an experienced therapist may be helpful for patients with pelvic floor dysfunction, vaginismus, and/or dyspareunia.
The defibulation procedure
Defibulation (or deinfibulation) is a surgical reconstructive procedure that opens the infibulated scar of patients who have undergone type 3 FGC (infibulation), thus exposing the urethra and introitus, and in almost half of cases an intact clitoris.15 Defibulation may be specifically requested by a patient or it may be recommended by the ObGyn either for reducing complications of pregnancy or to address the patient’s gynecologic, sexual, or urogynecologic symptoms by allowing penetrative intercourse, urinary flow, physiologic delivery, and menstruation.16
Defibulation should be performed under regional or general anesthesia and can be performed during pregnancy (or even in labor). An anterior incision is made on the infibulated scar, creating a new labia major, and the edges are sutured separately. Postoperatively, patients should be instructed to perform sitz baths and to expect a change in their urinary voiding stream.12 The few studies that have evaluated defibulation have shown high rates of success in addressing preoperative symptoms; the complication rates of defibulation are low and the satisfaction rates are high.16
The ethical conundrum of reinfibulation
Reinfibulation is defined as the restitching or reapproximation of scar tissue or the labia after delivery or a gynecologic procedure, and it is often performed routinely after every delivery in patients’ countries of origin.17
Postpartum reinfibulation on patient request raises legal and ethical issues for the ObGyn. In the United Kingdom, reinfibulation is illegal, and some international organizations, including the International Federation of Gynecology and Obstetrics and the WHO, have recommended against the practice. In the United States, reinfibulation of an adult is legal, as it falls under the umbrella of elective female genital cosmetic surgery.18,19
The procedure could create or exacerbate long-term complications and should generally be discouraged. However, if despite extensive counseling (preferably in the prenatal period) a patient insists on having the procedure, the ObGyn may need to elevate the principle of patient autonomy and either comply or find a practitioner who is comfortable performing it. One retrospective review in Switzerland suggested that specific care and informative counseling prenatally with the inclusion of a patient’s partner in the discussion can improve the acceptability of defibulation without reinfibulation.20
Conclusion
It is important for ObGyns to be familiar with the practice of FGC and to be trained in its recognition on examination and care for the long-term complications that can result from the practice. At the same time, ObGyns should be especially conscious of their biases in order to provide culturally competent care and reduce health care stigmatization and inequities for these patients.
- World Health Organization. Female genital mutilation. February 3, 2020. https://www.who.int/news-room/fact-sheets/detail/female-genital-mutilation. Accessed February 22, 2021.
- UNICEF. Female genital mutilation (FGM). February 2020. https://data.unicef.org/topic/child-protection/female-genital-mutilation/. Accessed February 22, 2021.
- Stoklosa H, Nour NM. The eye cannot see what the mind does not know: female genital mutilation. Emerg Med J. 2018;35:585-586. doi: 10.1136/emermed-2018-207994.
- Abdulcadir J, Dugerdil A, Boulvain M, et al. Missed opportunities for diagnosis of female genital mutilation. Int J Gynaecol Obstet. 2014;125:256-260. doi: 10.1016/j.ijgo.2013.11.016.
- Jäger F, Schulze S, Hohlfeld P. Female genital mutilation in Switzerland: a survey among gynaecologists. Swiss Med Wkly. 2002;132:259-264.
- Zaidi N, Khalil A, Roberts C, et al. Knowledge of female genital mutilation among healthcare professionals. J Obstet Gynaecol. 2007;27:161-164. doi: 10.1080/01443610601124257.
- Chalmers B, Hashi KO. 432 Somali women’s birth experiences in Canada after earlier female genital mutilation. Birth. 2000;27:227-234. doi: 10.1046/j.1523-536x.2000.00227.x.
- Shahawy S, Amanuel H, Nour NM. Perspectives on female genital cutting among immigrant women and men in Boston. Soc Sci Med. 2019;220:331-339. doi: 10.1016/j.socscimed.2018.11.030.
- Sharif Mohamed F, Wild V, Earp BD, et al. Clitoral reconstruction after female genital mutilation/cutting: a review of surgical techniques and ethical debate. J Sex Med. 2020;17:531-542. doi: 10.1016/j.jsxm.2019.12.004.
- Nour NM. Female genital cutting: a persisting practice. Rev Obstet Gynecol. 2008 Summer;1(3):135-139.
- Binkova A, Uebelhart M, Dällenbach P, et al. A cross-sectional study on pelvic floor symptoms in women living with female genital mutilation/cutting. Reprod Health. 2021;18:39. doi: 10.1186/s12978-021-01097-9.
- Nour NM. Female genital cutting: clinical and cultural guidelines. Obstet Gynecol Surv. 2004;59:272-279. doi: 10.1097/01.ogx.0000118939.19371.af.
- WHO Study Group on Female Genital Mutilation and Obstetric Outcome; Banks E, Meirik O, Farley T, et al. Female genital mutilation and obstetric outcome: WHO collaborative prospective study in six African countries. Lancet. 2006;367:1835-1841. doi: 10.1016/S0140-6736(06)68805-3.
- American College of Obstetricians and Gynecologists. ACOG practice bulletin no. 119: female sexual dysfunction. Obstet Gynecol. 2011;117:996-1007. doi: 10.1097/AOG.0b013e31821921ce.
- Nour NM, Michels KB, Bryant AE. Defibulation to treat female genital cutting: effect on symptoms and sexual function. Obstet Gynecol. 2006;108:55-60. doi: 10.1097/01.AOG.0000224613.72892.77.
- Johnson C, Nour NM. Surgical techniques: defibulation of type III female genital cutting. J Sex Med. 2007;4:1544-1547. doi: 10.1111/j.1743-6109.2007.00616.x.
- Serour GI. The issue of reinfibulation. Int J Gynaecol Obstet. 2010;109:93-96. doi: 10.1016/j.ijgo.2010.01.001.
- Shahawy S, Deshpande NA, Nour NM. Cross-cultural obstetric and gynecologic care of Muslim patients. Obstet Gynecol. 2015;126:969-973. doi: 10.1097/AOG.0000000000001112.
- American College of Obstetricians and Gynecologists. Elective female genital cosmetic surgery: ACOG committee opinion summary, number 795. Obstet Gynecol. 2020;135:249-250. doi: 10.1097/AOG.0000000000003617.
- Abdulcadir J, McLaren S, Boulvain M, et al. Health education and clinical care of immigrant women with female genital mutilation/cutting who request postpartum reinfibulation. Int J Gynaecol Obstet. 2016;135:69-72. doi: 10.1016/j.ijgo.2016.03.027.
Can we get to ‘COVID zero’? Experts predict the next 8 months
COVID-19 is likely to follow a seasonal pattern – similar to some other respiratory viruses – with fewer cases come summer 2021 followed by a jump next winter, experts predicted in a Thursday briefing.
If that pattern holds, it could mean a need to reinforce the mask-wearing message as the weather gets colder and people once again congregate indoors.
“Right now, we are projecting the United States all the way to Aug. 1 [will have] 619,000 deaths from COVID-19, with 4.7 million globally,” said Ali H. Mokdad, PhD, professor of health metrics sciences at the Institute for Health Metrics and Evaluation at the University of Washington, Seattle, during today’s media briefing sponsored by the Infectious Diseases Society of America and IHME.
The encouraging news is the vaccines appear to be working, and more Americans are getting them. “If you look at the data for these vaccines, they are extremely safe, they are extremely efficacious, and they make you basically impervious – for the most part – to getting serious disease, hospitalization, or death,” said Amesh Adalja, MD, senior scholar at Johns Hopkins University Center for Health Security in Baltimore.
“These vaccines do what they were meant to do: defang this virus,” said Dr. Adalja, who is an IDSA Fellow and adjunct assistant professor at Johns Hopkins Bloomberg School of Public Health. Emerging data out of Israel and other countries suggest a vaccinated person is less likely to transmit the virus as well, he added.
Still aiming for herd immunity
Furthermore, the U.S. Food and Drug Administration is likely to approve emergency use authorization (EUA) among teenagers 12-15 years old “imminently,” thereby expanding the pool of people potentially protected by vaccines.
Such authorization could help with overall public health efforts. “That’s simply a mathematical formula,” Dr. Adalja said. “The more people that are vaccinated, including children, the quicker we’ll get to herd immunity.”
In addition, with lower case numbers expected this summer, herd immunity might become more achievable, said Dr. Mokdad, who is also chief strategy officer for population health at the University of Washington.
As important as herd immunity is, so-called decoupling is “more important to me,” Dr. Adalja said. Decoupling refers to separating infections from the more severe outcomes, so people who get COVID-19 are less likely to need hospitalization or die from it.
Vaccines get the credit here, he added, including with the variants. “Even if you get a breakthrough infection with a variant, it’s not likely to land you in the hospital or cause serious disease or death,” Dr. Adalja said.
Masks and the uncommon cold
Wearing a mask until we reach herd immunity is important because it’s not possible to tell who is vaccinated and who isn’t, Dr. Mokdad said. “Remember, as many people are waiting to get a vaccine, all of us have access to a mask,” he said.
Dr. Adalja agreed, adding that public health guidance on masks will likely stay in place until we cross that herd immunity threshold and community circulation of the virus goes down.
“People are probably going to want to continue wearing masks, at least some proportion, because they see the benefit for other respiratory viruses,” Dr. Adalja said. “How many of you had a common cold this year?”
Variants: Some good news?
Experts are monitoring the spread of variants of concern in the United States and abroad. On a positive note, the B.1.1.7 variant first identified in the United Kingdom appears to be dominant in the United States at this time, which is potentially good for two reasons. One is that the available COVID-19 vaccines show sufficient efficacy against the strain, Dr. Mokdad said.
Second, a predominance of B.1.1.7 makes it more difficult for other emerging variants of concern like P1 [Brazil] or B.1.351 [South Africa] to gain control, Dr. Adalja said.
“B.1.1.7 is such an efficient transmitter,” he said. “That’s kind of an advantage … because the more B.1.1.7, you have the less opportunity B.1.351 and P1 have to set up shop.”
Hesitancy from misinformation
Vaccine hesitancy remains a concern, particularly at a time when some predict a drop in the number of Americans seeking vaccination. Although needle phobia plays a role in dissuading some from vaccination, the bigger issue is vaccine misinformation, Dr. Adalja said.
“Some people are just terrified when they see the needle. That’s a small part of the proportion of people who don’t want to get vaccinated,” Dr. Adalja said. In contrast, he attributed most hesitancy to misinformation about the vaccine, including reports that the vaccines are fake.
Even celebrities are getting drawn into the misinformation.
“I just had to answer something about Mariah Carey’s vaccination,” he said. Someone believed “that it was done with a retractable needle that didn’t really go into her arm.”
Vaccine hesitancy is more about people not understanding the risk-benefit analysis, taking side effects out of out of context if there are side effects, or being influenced by “arbitrary statements about microchips, infertility, or whatever it might be,” Dr. Adalja said.
The future is subject to change
“We’re expecting another rise in cases and more mortality in our winter season here in the United States,” Dr. Mokdad said, adding that the efficacy of the vaccines is likely to attenuate the mortality rate in particular.
However, as the epidemiology of the pandemic evolves, so too will the long-term predictions. Factors that could influence future numbers include the expansion of vaccination to teens 12-15 years old and (eventually) younger children, a need for booster vaccines, emerging variants, and the changing proportion of the population who are fully vaccinated or were previously infected.
Again, getting people to adhere to mask wearing come winter could be challenging if the scenario over the summer is “close to normal with less than 200 deaths a day in the United States,” he added. Asking people to wear masks again will be like “swimming upstream.”
“I think it’s a mistake to think that we’re going to get to ‘COVID zero,’ ” Dr. Adalja said. “This is not an eradicable disease. There’s only been one human infectious disease eradicated from the planet, and that’s smallpox, and it had very different characteristics.”
A version of this article first appeared on Medscape.com.
Small clinics, practices key to COVID-19 vaccine success: State officials
Primary care physicians and providers in small offices and clinics are going to be key to ensuring that the remaining half of the nation receives a COVID-19 vaccination, state health officials said Wednesday, and the federal government will soon start shipping smaller packages of the Pfizer/BioNTech vaccine that can be more readily used by individual doctors.
According to the Centers for Disease Control and Prevention, as of April 21, more than 215 million doses have been administered. About 40% – 134 million Americans – have had at least one dose of a vaccine.
Among those who still haven’t received a shot are people who don’t have the time, may be homebound, or who have questions about the vaccine, or might say they will never be vaccinated, said Nirav Shah, MD, JD, president of the Association of State and Territorial Health Officials and director of the Maine Center for Disease Control and Prevention, on a call with reporters.
Especially for those who fall into the “not-ever” category, state officials “are working to find trusted messengers like doctors” who can connect with these individuals and give them information, he said.
Primary care physicians’ offices and other small practice settings are “where we are most likely to reach many of the remaining 50%,” Steven Stack, MD, MBA, FACEP, commissioner of the Kentucky Department for Public Health, said on the briefing.
State officials also “need to support all people to consult their personal physicians in whom they have confidence and trust to be informed of the benefits of COVID vaccination and the safety of this vaccination,” he said, adding that “this is the way we put this pandemic in the rearview mirror and move on with our lives.”
Dr. Stack said the federal government is starting by working with Pfizer to slim down its packages from 1,170 doses to 450 doses. That should happen before June, said Dr. Stack, adding that state health officials will be able to distribute the smaller packages “more widely and to smaller settings.”
Ideally, packaging for all vaccines will get down to single-dose, pre-filled syringes, he said. But that is a “journey” that the federal government has just begun, said Dr. Stack.
The White House had not responded to a request from this news organization for comment by press time.
Having vaccines onsite in a physician’s office is important, Dr. Stack said, adding that doctors “need to reach people in their persuadable moment.”
Bringing pediatricians on board
Illinois state health officials have begun a process that will let pediatricians have weekly vaccination clinics and also have vaccine on hand to meet patients in the moment, said Ngozi Ezike, MD, director of the Illinois Department of Public Health, on the briefing.
She said the distribution can start even before the Pfizer vaccine is shipped in smaller packages – and as soon as the Food and Drug Administration authorizes the vaccine for adolescents. Pfizer applied for emergency use approval for children aged 12-15 on April 9.
Local health departments will store the vaccine in their ultra-cold freezers. Pediatricians will identify how many people they hope to vaccinate each week and receive the doses on Monday, with the understanding that they must use the vaccine within 5 days, said Dr. Ezike.
The aim is to support vaccination clinics but also to ensure doctors have “doses on hand,” so that a parent or adolescent could opt for vaccination during a visit.
Although estimating the number of doses required will be difficult and likely involve some waste, Dr. Ezike said it’s important to be able to offer a vaccine in the office instead of having to refer someone elsewhere.
A version of this article first appeared on Medscape.com.
Lower target LDL-C cuts risk of CV events in ischemic stroke patients
Background: The beneficial role of high-intensity statins in secondary prevention of recurrent atherosclerotic stroke is well established. It is uncertain whether the observed benefit was from a reduction in the cholesterol level or to other pleotropic effects of atorvastatin. The ideal target cholesterol level for secondary prevention is unclear. This trial was conducted to help determine an ideal target LDL-C level in the prevention of CV events following ischemic stroke.

Study design: Randomized, parallel-group, event-driven trial.
Setting: Conducted in France and South Korea.
Synopsis: In this study, patients with an ischemic stroke within the last 3 months or TIAs within 15 days were randomly assigned to receive statins with or without ezetimibe (Zetia) to achieve a higher-target LDL-C level (90-110 mg/dL) vs. lower-target LDL-C (less than 70 mg/dL). The composite primary endpoint was a major cardiovascular event, which included ischemic stroke, MI, new symptoms leading to urgent coronary or carotid revascularization, or death from CV causes.
There were 2,860 patients enrolled, 1,430 were assigned to each target group. At the end of 3.5 years, the primary endpoint occurred in 8.5% of patients in the lower target group, compared with 10.9% in the higher target group (hazard ratio, 0.78; 95% confidence interval, 0.61-0.98; P = .04). Unfortunately, the trial was stopped early because of a lack of funding.
Bottom line: Using medications including statins to lower the LDL-C to less than 70 mg/dL leads to better cardiovascular outcomes following ischemic stroke.
Citation: Amarenco P et al. A comparison of two LDL cholesterol targets after ischemic stroke. N Engl J Med. 2020 Jan 2;382:9-19.
Dr. Garg is assistant professor in the division of hospital medicine, Loyola University Medical Center, Maywood, Ill.
Background: The beneficial role of high-intensity statins in secondary prevention of recurrent atherosclerotic stroke is well established. It is uncertain whether the observed benefit was from a reduction in the cholesterol level or to other pleotropic effects of atorvastatin. The ideal target cholesterol level for secondary prevention is unclear. This trial was conducted to help determine an ideal target LDL-C level in the prevention of CV events following ischemic stroke.
Study design: Randomized, parallel-group, event-driven trial.
Setting: Conducted in France and South Korea.
Synopsis: In this study, patients with an ischemic stroke within the last 3 months or TIAs within 15 days were randomly assigned to receive statins with or without ezetimibe (Zetia) to achieve a higher-target LDL-C level (90-110 mg/dL) vs. lower-target LDL-C (less than 70 mg/dL). The composite primary endpoint was a major cardiovascular event, which included ischemic stroke, MI, new symptoms leading to urgent coronary or carotid revascularization, or death from CV causes.
There were 2,860 patients enrolled, 1,430 were assigned to each target group. At the end of 3.5 years, the primary endpoint occurred in 8.5% of patients in the lower target group, compared with 10.9% in the higher target group (hazard ratio, 0.78; 95% confidence interval, 0.61-0.98; P = .04). Unfortunately, the trial was stopped early because of a lack of funding.
Bottom line: Using medications including statins to lower the LDL-C to less than 70 mg/dL leads to better cardiovascular outcomes following ischemic stroke.
Citation: Amarenco P et al. A comparison of two LDL cholesterol targets after ischemic stroke. N Engl J Med. 2020 Jan 2;382:9-19.
Dr. Garg is assistant professor in the division of hospital medicine, Loyola University Medical Center, Maywood, Ill.
Evobrutinib may lower nerve damage biomarker levels
(MS), based on how it’s been found to lower levels of a key blood biomarker, according to a post hoc analysis of a placebo-controlled clinical trial reported at the American Academy of Neurology’s 2021 annual meeting.

Jens Kuhle, MD, of the department of biomedicine at University Hospital Basel, Switzerland, said the conclusion was based on reductions in blood levels of neurofilament light chain (NfL), a biomarker of neuroaxonal damage, in treated patients. “These data on the effect of evobrutinib on NfL dynamics are the first to be reported for a BTK inhibitor investigated for MS,” Dr. Kuhle said. Evobrutinib targets beta cells and myeloid cells, including macrophages and microglia, to disrupt NfL production.
The analysis consisted of three treatment arms in addition to the placebo arm: 25 and 75 mg daily, and 75 mg twice daily. The post hoc analysis included 166 patients across all arms, with 148 being evaluated at week 24.
Dr. Kuhle said the 75-mg twice-daily group exhibited significantly lower blood NfL levels as early as week 12 with lowered levels maintained to week 24, the last time point the study evaluated – specifically reductions of 18.9% (P = .01) and 16.8% (P = .040) compared with placebo, respectively.
However, the 75-mg once daily dose also showed meaningful reductions when compared with placebo: 15.4% (P = .043) and 14.1% (P = .10) at 12 and 24 weeks, respectively, Dr. Kuhle said. “There were no significant differences seen with the 25-mg once-daily group,” he said.
“These results are promising and indicate evobrutinib at an efficacious dose of 75 mg twice daily has a beneficial effect on reducing neuroaxonal damage in MS,” he said.
In an interview, Dr. Kuhle explained the importance of lower NfL levels. “The hope is that detecting subclinical disease activity in a sensitive and comprehensive way will lead to more effective treatment of the individual MS patient,” he said.
The findings may also inform future studies of evobrutinib in MS, he said. “Neurofilaments and neurons are the key substrate of permanent disability in MS and other neurodegenerative diseases,” Dr. Kuhle said. “It is anticipated that normalization of NfL to levels in same-age healthy controls should be the adequate treatment target for individual patients.”
NfL could be an “easily accessible and modifiable biomarker” for use in clinical trials of relapsing and progressive MS, he said. The researchers plan to use NfL measurements in the extension phase of the trial.
“An important next step is the development of reliable and age-adjusted reference values for NfL measurements in blood to move this biomarker further toward individual application in clinical practice,” he added, noting that his group has already collected more than 10,000 serum samples from more than 5,000 healthy controls to do that.
The analysis adds to the growing body of evidence supporting the use of blood NfL levels to gauge the effectiveness of disease-modifying therapies on neuroaxonal degeneration in MS, said Fredrik Piehl, MD, PhD, a professor at Karolinska University Hospital in Stockholm.

“However,” he added, “this is a short-term phase 2 trial lacking an active comparator. Inhibitors of BTK have been suggested to have a dual action, acting both in the periphery on the adaptive immune response, but also ameliorating local brain tissue inflammation.”
Additional studies with longer duration, active comparators and advanced neuroimaging will be needed to validate the effect of BTKs on NfL levels in MS, Dr. Piehl said.
The study was sponsored by EMD Serono Research and Development Institute, a Merck affiliate. Dr. Kuhle has no relevant financial relationships to disclose. Dr. Piehl reported financial relationships with Biogen, Novartis, Sanofi, Merck, Actelion, Alexion, Argenx, Roche/Genentech, Genzyme, UCB and Parexel.
(MS), based on how it’s been found to lower levels of a key blood biomarker, according to a post hoc analysis of a placebo-controlled clinical trial reported at the American Academy of Neurology’s 2021 annual meeting.
Jens Kuhle, MD, of the department of biomedicine at University Hospital Basel, Switzerland, said the conclusion was based on reductions in blood levels of neurofilament light chain (NfL), a biomarker of neuroaxonal damage, in treated patients. “These data on the effect of evobrutinib on NfL dynamics are the first to be reported for a BTK inhibitor investigated for MS,” Dr. Kuhle said. Evobrutinib targets beta cells and myeloid cells, including macrophages and microglia, to disrupt NfL production.
The analysis consisted of three treatment arms in addition to the placebo arm: 25 and 75 mg daily, and 75 mg twice daily. The post hoc analysis included 166 patients across all arms, with 148 being evaluated at week 24.
Dr. Kuhle said the 75-mg twice-daily group exhibited significantly lower blood NfL levels as early as week 12 with lowered levels maintained to week 24, the last time point the study evaluated – specifically reductions of 18.9% (P = .01) and 16.8% (P = .040) compared with placebo, respectively.
However, the 75-mg once daily dose also showed meaningful reductions when compared with placebo: 15.4% (P = .043) and 14.1% (P = .10) at 12 and 24 weeks, respectively, Dr. Kuhle said. “There were no significant differences seen with the 25-mg once-daily group,” he said.
“These results are promising and indicate evobrutinib at an efficacious dose of 75 mg twice daily has a beneficial effect on reducing neuroaxonal damage in MS,” he said.
In an interview, Dr. Kuhle explained the importance of lower NfL levels. “The hope is that detecting subclinical disease activity in a sensitive and comprehensive way will lead to more effective treatment of the individual MS patient,” he said.
The findings may also inform future studies of evobrutinib in MS, he said. “Neurofilaments and neurons are the key substrate of permanent disability in MS and other neurodegenerative diseases,” Dr. Kuhle said. “It is anticipated that normalization of NfL to levels in same-age healthy controls should be the adequate treatment target for individual patients.”
NfL could be an “easily accessible and modifiable biomarker” for use in clinical trials of relapsing and progressive MS, he said. The researchers plan to use NfL measurements in the extension phase of the trial.
“An important next step is the development of reliable and age-adjusted reference values for NfL measurements in blood to move this biomarker further toward individual application in clinical practice,” he added, noting that his group has already collected more than 10,000 serum samples from more than 5,000 healthy controls to do that.
The analysis adds to the growing body of evidence supporting the use of blood NfL levels to gauge the effectiveness of disease-modifying therapies on neuroaxonal degeneration in MS, said Fredrik Piehl, MD, PhD, a professor at Karolinska University Hospital in Stockholm.
“However,” he added, “this is a short-term phase 2 trial lacking an active comparator. Inhibitors of BTK have been suggested to have a dual action, acting both in the periphery on the adaptive immune response, but also ameliorating local brain tissue inflammation.”
Additional studies with longer duration, active comparators and advanced neuroimaging will be needed to validate the effect of BTKs on NfL levels in MS, Dr. Piehl said.
The study was sponsored by EMD Serono Research and Development Institute, a Merck affiliate. Dr. Kuhle has no relevant financial relationships to disclose. Dr. Piehl reported financial relationships with Biogen, Novartis, Sanofi, Merck, Actelion, Alexion, Argenx, Roche/Genentech, Genzyme, UCB and Parexel.
FROM AAN 2021
Percentage of doctors who are Black barely changed in 120 years
according to a new study.
In 1900, 1.3% of physicians were Black. In 1940, 2.8% of physicians were Black, and by 2018 – when almost 13% of the population was Black – 5.4% of doctors were Black, reports Dan Ly, MD, PhD, MPP, an assistant professor of medicine at the University of California, Los Angeles, in a study published online April 19, 2021, in the Journal of General Internal Medicine.
The proportion of male Black physicians was 2.7% in 1940 and 2.6% in 2018.
Dr. Ly also found a significant wage gap. The median income earned by White doctors was $50,000 more than the median income of Black physicians in 2018. Dr. Ly based his findings on the U.S. Census Decennial Census long form, accessed via IPUMS, a free database funded by the National Institutes of Health and other organizations.
“If we care about the health of the population, particularly the health of Black patients, we should care about how small the proportion of our physicians who are Black is and the extremely slow progress we have made as a medical system in increasing that proportion,” Dr. Ly said in an interview.
Dr. Ly said he took on this research in part because previous studies have shown that Black patients are more likely to seek preventive care from Black doctors. Thus, increasing the numbers of Black physicians could narrow gaps in life expectancy between Whites and Blacks.
He also wanted to see whether progress had been made as a result of various medical organizations and the Association of American Medical Colleges undertaking initiatives to increase workforce diversity. There has been “very, very little” progress, he said.
Norma Poll-Hunter, PhD, the AAMC’s senior director of workforce diversity, said Dr. Ly’s report “was not surprising at all.”
The AAMC reported in 2014 that the number of Black men who apply to and matriculate into medical schools has been declining since 1978. That year, there were 1,410 Black male applicants and 542 Black enrollees. In 2014, there were 1,337 applicants and 515 enrollees.
Since 2014, Black male enrollment has increased slightly, rising from 2.4% in the 2014-2015 school year to 2.9% in the 2019-2020 year, the AAMC reported last year.
In addition, among other historically underrepresented minorities, “we really have seen very small progress” despite the increase in the number of medical schools, Dr. Poll-Hunter said in an interview.
The AAMC and the National Medical Association consider the lack of Black male applicants and matriculants to be a national crisis. The two groups started an alliance in 2020 aimed at finding ways to amplify and support Black men’s interest in medicine and the biomedical sciences and to “develop systems-based solutions to address exclusionary practices that create barriers for Black men and prevent them from having equitable opportunities to successfully enroll in medical school.”
Solutions include requiring medical school admissions committees and application screeners to undergo implicit bias awareness and mitigation training, adopting holistic admissions reviews, and incentivizing institutions of higher learning to partner with Black communities in urban and rural school systems to establish K-12 health sciences academies, said NMA President Leon McDougle, MD, MPH.
“There are the systems factors, and racism is a big one that we have to tackle,” said Dr. Poll-Hunter.
Diversity isn’t just about numbers, said Dr. McDougle, a professor of family medicine and associate dean for diversity and inclusion at Ohio State University, Columbus. “We know that medical school graduates who are African American or Black, Hispanic or Latinx, or American Indian or Alaskan Native are more likely to serve those communities as practicing physicians.
“The COVID-19 pandemic highlighted the urgent need for more African American or Black, Hispanic or Latinx, or American Indian or Alaskan Native physicians,” he said. “Inadequate access to culturally competent care has exacerbated existing health disparities, resulting in death and hospitalization rates up to three to four times the rates of European American or White people.”
Dr. Poll-Hunter also said that studies have shown that diversity in the classroom creates a more enriched learning environment and increases civic mindedness and cognitive complexity, “as well as helps us understand people who are different than ourselves.”
The diversity goal “is not about quotas, it’s about excellence,” she said. “We know that there’s talent that exists, and we want to make sure that everyone has an opportunity to be successful.”
Dr. Ly has disclosed no relevant financial relationships.
A version of this article first appeared on Medscape.com.
FDA expands use of SLIT pollen allergy treatment to children
The Food and Drug Administration has approved a new indication for ALK’s under-the-tongue immunotherapy tablet Ragwitek (Ambrosia artemisiifolia) to treat ragweed pollen–induced hay fever in children aged 5-17 years.

Ragwitek received FDA approval in 2014 to treat short ragweed pollen–induced hay fever, with or without allergic rhinoconjunctivitis, in adults aged 18-65 years.
The approval for Ragwitek comes with a boxed warning regarding a risk for life-threatening allergic reactions associated with the immunotherapy treatment, including anaphylaxis and severe laryngopharyngeal restriction. The package insert specifies that physicians should prescribe autoinjectable epinephrine with the drug.
“Ragwitek tablets provide a new immunotherapy treatment option for children and adolescents with seasonal ragweed allergies which often causes uncomfortable nasal symptoms and red, itchy eyes during the late summer and early fall,” David I. Bernstein, MD, University of Cincinnati, Bernstein Clinical Research, said in a company press release.
Short ragweed pollen is one of the most common weed allergies. Allergic rhinitis, or hay fever, affects 10%-30% of the population worldwide, according to the American Academy of Allergy Asthma & Immunology. In the United States, approximately 7.7% of adults and 7.2% of children were diagnosed with it annually, according to the Centers for Disease Control and Prevention.
The new indication was based partly on data from a phase 3 clinical trial in children with short ragweed–induced allergic rhinitis, or hay fever, published in the Journal of Allergy and Clinical Immunology. In the study, researchers evaluated the efficacy and safety of the treatment in 1,022 participants aged 5-17 years with a history of ragweed-induced rhinoconjunctivitis and sensitivity to ragweed over a 20- to 28-week treatment period.
Researchers found that Ragwitek improved symptoms in children and adolescents and decreased their use of symptom-relieving medication, compared with placebo.
Among children and adolescents aged 5-17 years, the most common adverse reactions reported were throat irritation/tickle (48.3% in the Ragwitek group vs. 17.7% in the placebo group), itching in the mouth (47.8% vs. 11.2%), itching in the ear (33.9% vs. 6.3%), mouth pain (18.9% vs. 4.5%), swelling of the lips (13.8% vs. 1.2%), nausea (11.5% vs. 3.3%), swelling of the tongue (11.3% vs. 0.8%), throat swelling (10.7% vs. 1.6%), and stomach pain (10.1% vs. 4.5%).
The FDA also recommends that Ragwitek not be prescribed to people with severe, unstable, or uncontrolled asthma, those with a history of severe systemic allergic reactions, and those with a history of eosinophilic esophagitis. The immunotherapy treatment also may not be suitable for people who are unresponsive to epinephrine or inhaled bronchodilators.
In addition, the treatment is not approved for the immediate relief of allergic symptoms in children or adults. The once-daily treatment, which contains an extract from short ragweed pollen, should begin 12 weeks before the start of ragweed pollen season and continue throughout the season, according to the FDA.
Dr. Bernstein said that the under-the-tongue immunotherapy works by targeting the specific allergy trigger and reducing allergy symptoms by “stimulating the immune system.”
A version of this article first appeared on Medscape.com.
The Food and Drug Administration has approved a new indication for ALK’s under-the-tongue immunotherapy tablet Ragwitek (Ambrosia artemisiifolia) to treat ragweed pollen–induced hay fever in children aged 5-17 years.
Ragwitek received FDA approval in 2014 to treat short ragweed pollen–induced hay fever, with or without allergic rhinoconjunctivitis, in adults aged 18-65 years.
The approval for Ragwitek comes with a boxed warning regarding a risk for life-threatening allergic reactions associated with the immunotherapy treatment, including anaphylaxis and severe laryngopharyngeal restriction. The package insert specifies that physicians should prescribe autoinjectable epinephrine with the drug.
“Ragwitek tablets provide a new immunotherapy treatment option for children and adolescents with seasonal ragweed allergies which often causes uncomfortable nasal symptoms and red, itchy eyes during the late summer and early fall,” David I. Bernstein, MD, University of Cincinnati, Bernstein Clinical Research, said in a company press release.
Short ragweed pollen is one of the most common weed allergies. Allergic rhinitis, or hay fever, affects 10%-30% of the population worldwide, according to the American Academy of Allergy Asthma & Immunology. In the United States, approximately 7.7% of adults and 7.2% of children were diagnosed with it annually, according to the Centers for Disease Control and Prevention.
The new indication was based partly on data from a phase 3 clinical trial in children with short ragweed–induced allergic rhinitis, or hay fever, published in the Journal of Allergy and Clinical Immunology. In the study, researchers evaluated the efficacy and safety of the treatment in 1,022 participants aged 5-17 years with a history of ragweed-induced rhinoconjunctivitis and sensitivity to ragweed over a 20- to 28-week treatment period.
Researchers found that Ragwitek improved symptoms in children and adolescents and decreased their use of symptom-relieving medication, compared with placebo.
Among children and adolescents aged 5-17 years, the most common adverse reactions reported were throat irritation/tickle (48.3% in the Ragwitek group vs. 17.7% in the placebo group), itching in the mouth (47.8% vs. 11.2%), itching in the ear (33.9% vs. 6.3%), mouth pain (18.9% vs. 4.5%), swelling of the lips (13.8% vs. 1.2%), nausea (11.5% vs. 3.3%), swelling of the tongue (11.3% vs. 0.8%), throat swelling (10.7% vs. 1.6%), and stomach pain (10.1% vs. 4.5%).
The FDA also recommends that Ragwitek not be prescribed to people with severe, unstable, or uncontrolled asthma, those with a history of severe systemic allergic reactions, and those with a history of eosinophilic esophagitis. The immunotherapy treatment also may not be suitable for people who are unresponsive to epinephrine or inhaled bronchodilators.
In addition, the treatment is not approved for the immediate relief of allergic symptoms in children or adults. The once-daily treatment, which contains an extract from short ragweed pollen, should begin 12 weeks before the start of ragweed pollen season and continue throughout the season, according to the FDA.
Dr. Bernstein said that the under-the-tongue immunotherapy works by targeting the specific allergy trigger and reducing allergy symptoms by “stimulating the immune system.”
A version of this article first appeared on Medscape.com.
COVID-19 infection conveys imperfect immunity in young adults
Do your patients think that getting COVID-19 is fully protective against subsequent reinfection? Tell it to the Marines.
A study of U.S. Marine recruits on their way to boot camp at Parris Island, S.C., showed that those who were seropositive at baseline, indicating prior exposure to SARS-CoV-2, remained at some risk for reinfection. They had about one-fifth the risk of subsequent infection, compared with seronegative recruits during basic training, but reinfections did occur.
The study, by Stuart C. Sealfon, MD, of Icahn School of Medicine at Mount Sinai in New York, and colleagues, was published in The Lancet Respiratory Medicine.
“Although antibodies induced by initial infection are largely protective, they do not guarantee effective SARS-CoV-2 neutralization activity or immunity against subsequent infection,” they wrote.
An infectious disease specialist who was not involved in the study said that the findings provide further evidence about the level of immunity acquired after an infection.
“It’s quite clear that reinfections do occur, they are of public health importance, and they’re something we need to be mindful of in terms of advising patients about whether a prior infection protects them from reinfection,” Mark Siedner, MD, MPH, a clinician and researcher in the division of infectious diseases at Massachusetts General Hospital, Boston, said in an interview.
The study results reinforce that “not all antibodies are the same,” said Sachin Gupta, MD, an attending physician in pulmonary and critical care medicine at Alameda Health System in Oakland, Calif. “We’re seeing still that 10% of folks who have antibodies can get infected again,” he said in an interview.

CHARM initiative
Dr. Sealfon and colleagues presented an analysis of data from the ironically named CHARM (COVID-19 Health Action Response for Marines) prospective study.
CHARM included U.S. Marine recruits, most of them male, aged 18-20 years, who were instructed to follow a 2-week unsupervised quarantine at home, after which they reported to a Marine-supervised facility for an additional 2-week quarantine.
At baseline, participants were tested for SARS-CoV-2 immunoglobulin G (IgG) seropositivity, defined as a dilution of 1:150 or more on receptor-binding domain and full-length spike protein enzyme-linked immunosorbent assay (ELISA).
The recruits filled out questionnaires asking them to report any of 14 specific COVID-19–related symptoms or any other unspecified symptom, as well as demographic information, risk factors, and a brief medical history.
Investigators tested recruits for SARS-CoV-2 infection by polymerase chain reaction (PCR) assay at weeks 0, 1, and 2 of quarantine, and any who had positive PCR results during quarantine were excluded.
Participants who had three negative swab PCR results during quarantine and a baseline serology test at the beginning of the supervised quarantine period – either seronegative or seropositive – then went on to enjoy their basic training at the Marine Corps Recruit Depot, Parris Island, S.C.
The participants were followed prospectively with PCR tests at weeks 2, 4, and 6 in both the seropositive and seronegative groups, and sera were obtained at the same time.
Holes in immunologic armor
Full data were available for a total of 189 participants who were seropositive and 2,247 who were seronegative at enrollment.
In all, 19 of 189 seropositive recruits (10%) had at least one PCR test positive for SARS-CoV-2 infection during the 6-week follow-up period. This translated into an incidence of 1.1 cases per person-year.
Of the 2,247 participants seronegative at baseline, 1,079 tested positive (6.2 cases per person-year; incidence rate ratio 0.18).
It appeared that antibodies provided some protection for seropositive recruits, as evidenced by a higher likelihood of infection among those with lower baseline full-length spike protein IgG titers than in those with higher baseline titers (hazard ratio 0.4, P < .001).
Among the seropositive participants who did acquire a second SARS-CoV-2 infection, viral loads in mid-turbinate nasal swabs were about 10-fold lower than in seronegative recruits who acquired infections during follow-up.
“This finding suggests that some reinfected individuals could have a similar capacity to transmit infection as those who are infected for the first time. The rate at which reinfection occurs after vaccines and natural immunity is important for estimating the proportion of the population that needs to be vaccinated to suppress the pandemic,” the investigators wrote.
Baseline neutralizing antibody titers were detected in 45 of the first 54 seropositive recruits who remained PCR negative throughout follow-up, but also in 6 of 19 seropositive participants who became infected during the 6 weeks of observation.
Lessons
Both Dr. Siedner and Dr. Gupta agreed with the authors that the risks for reinfection that were observed in young, physically fit people may differ for other populations, such as women (only 10% of seropositive recruits and 8% of seronegative recruits were female), older patients, or those who are immunocompromised.
Given that the adjusted odds ratio for reinfection in this study was nearly identical to that of a recent British study comparing infection rates between seropositive and seronegative health care workers, the risk of reinfection for other young adults and for the general population may be similar, Dr. Sealfon and colleagues wrote.
Adding to the challenge of reaching herd immunity is the observation that some patients who have recovered from COVID-19 are skeptical about the need for further protection.
“There are patients who feel like vaccination is of low benefit to them, and I think these are the same people who would be hesitant to get the vaccine anyway,” Dr. Gupta said.
Although no vaccine is perfect – the vaccine failure rate from the mRNA-based vaccines from Moderna and Pfizer/Biontech is about 5% – the protections they afford are unmistakable, Dr. Siedner said.
“I think it’s important to make the distinction that most postvaccination infections by and large have been very mild,” he said. “In people with normal immune systems, we have not seen an onslaught of postvaccination infections requiring hospitalization. Even if people do get infected after vaccination, the vaccines protect people from severe infection, and that’s what we want them to do.”
The investigators stated, “Young adults, of whom a high proportion are asymptomatically infected and become seropositive in the absence of known infection, can be an important source of transmission to more vulnerable populations. Evaluating the protection against subsequent SARS-CoV-2 infection conferred by seropositivity in young adults is important for determining the need for vaccinating previously infected individuals in this age group.”
The study was funded by the Defense Health Agency and Defense Advanced Research Projects Agency. Dr. Sealfon, Dr. Siedner, and Dr. Gupta have no conflicts of interest to report. Dr. Gupta is a member of the editorial advisory board for this publication.
Do your patients think that getting COVID-19 is fully protective against subsequent reinfection? Tell it to the Marines.
A study of U.S. Marine recruits on their way to boot camp at Parris Island, S.C., showed that those who were seropositive at baseline, indicating prior exposure to SARS-CoV-2, remained at some risk for reinfection. They had about one-fifth the risk of subsequent infection, compared with seronegative recruits during basic training, but reinfections did occur.
The study, by Stuart C. Sealfon, MD, of Icahn School of Medicine at Mount Sinai in New York, and colleagues, was published in The Lancet Respiratory Medicine.
“Although antibodies induced by initial infection are largely protective, they do not guarantee effective SARS-CoV-2 neutralization activity or immunity against subsequent infection,” they wrote.
An infectious disease specialist who was not involved in the study said that the findings provide further evidence about the level of immunity acquired after an infection.
“It’s quite clear that reinfections do occur, they are of public health importance, and they’re something we need to be mindful of in terms of advising patients about whether a prior infection protects them from reinfection,” Mark Siedner, MD, MPH, a clinician and researcher in the division of infectious diseases at Massachusetts General Hospital, Boston, said in an interview.
The study results reinforce that “not all antibodies are the same,” said Sachin Gupta, MD, an attending physician in pulmonary and critical care medicine at Alameda Health System in Oakland, Calif. “We’re seeing still that 10% of folks who have antibodies can get infected again,” he said in an interview.
CHARM initiative
Dr. Sealfon and colleagues presented an analysis of data from the ironically named CHARM (COVID-19 Health Action Response for Marines) prospective study.
CHARM included U.S. Marine recruits, most of them male, aged 18-20 years, who were instructed to follow a 2-week unsupervised quarantine at home, after which they reported to a Marine-supervised facility for an additional 2-week quarantine.
At baseline, participants were tested for SARS-CoV-2 immunoglobulin G (IgG) seropositivity, defined as a dilution of 1:150 or more on receptor-binding domain and full-length spike protein enzyme-linked immunosorbent assay (ELISA).
The recruits filled out questionnaires asking them to report any of 14 specific COVID-19–related symptoms or any other unspecified symptom, as well as demographic information, risk factors, and a brief medical history.
Investigators tested recruits for SARS-CoV-2 infection by polymerase chain reaction (PCR) assay at weeks 0, 1, and 2 of quarantine, and any who had positive PCR results during quarantine were excluded.
Participants who had three negative swab PCR results during quarantine and a baseline serology test at the beginning of the supervised quarantine period – either seronegative or seropositive – then went on to enjoy their basic training at the Marine Corps Recruit Depot, Parris Island, S.C.
The participants were followed prospectively with PCR tests at weeks 2, 4, and 6 in both the seropositive and seronegative groups, and sera were obtained at the same time.
Holes in immunologic armor
Full data were available for a total of 189 participants who were seropositive and 2,247 who were seronegative at enrollment.
In all, 19 of 189 seropositive recruits (10%) had at least one PCR test positive for SARS-CoV-2 infection during the 6-week follow-up period. This translated into an incidence of 1.1 cases per person-year.
Of the 2,247 participants seronegative at baseline, 1,079 tested positive (6.2 cases per person-year; incidence rate ratio 0.18).
It appeared that antibodies provided some protection for seropositive recruits, as evidenced by a higher likelihood of infection among those with lower baseline full-length spike protein IgG titers than in those with higher baseline titers (hazard ratio 0.4, P < .001).
Among the seropositive participants who did acquire a second SARS-CoV-2 infection, viral loads in mid-turbinate nasal swabs were about 10-fold lower than in seronegative recruits who acquired infections during follow-up.
“This finding suggests that some reinfected individuals could have a similar capacity to transmit infection as those who are infected for the first time. The rate at which reinfection occurs after vaccines and natural immunity is important for estimating the proportion of the population that needs to be vaccinated to suppress the pandemic,” the investigators wrote.
Baseline neutralizing antibody titers were detected in 45 of the first 54 seropositive recruits who remained PCR negative throughout follow-up, but also in 6 of 19 seropositive participants who became infected during the 6 weeks of observation.
Lessons
Both Dr. Siedner and Dr. Gupta agreed with the authors that the risks for reinfection that were observed in young, physically fit people may differ for other populations, such as women (only 10% of seropositive recruits and 8% of seronegative recruits were female), older patients, or those who are immunocompromised.
Given that the adjusted odds ratio for reinfection in this study was nearly identical to that of a recent British study comparing infection rates between seropositive and seronegative health care workers, the risk of reinfection for other young adults and for the general population may be similar, Dr. Sealfon and colleagues wrote.
Adding to the challenge of reaching herd immunity is the observation that some patients who have recovered from COVID-19 are skeptical about the need for further protection.
“There are patients who feel like vaccination is of low benefit to them, and I think these are the same people who would be hesitant to get the vaccine anyway,” Dr. Gupta said.
Although no vaccine is perfect – the vaccine failure rate from the mRNA-based vaccines from Moderna and Pfizer/Biontech is about 5% – the protections they afford are unmistakable, Dr. Siedner said.
“I think it’s important to make the distinction that most postvaccination infections by and large have been very mild,” he said. “In people with normal immune systems, we have not seen an onslaught of postvaccination infections requiring hospitalization. Even if people do get infected after vaccination, the vaccines protect people from severe infection, and that’s what we want them to do.”
The investigators stated, “Young adults, of whom a high proportion are asymptomatically infected and become seropositive in the absence of known infection, can be an important source of transmission to more vulnerable populations. Evaluating the protection against subsequent SARS-CoV-2 infection conferred by seropositivity in young adults is important for determining the need for vaccinating previously infected individuals in this age group.”
The study was funded by the Defense Health Agency and Defense Advanced Research Projects Agency. Dr. Sealfon, Dr. Siedner, and Dr. Gupta have no conflicts of interest to report. Dr. Gupta is a member of the editorial advisory board for this publication.
FROM THE LANCET RESPIRATORY MEDICINE
Mitochondrial DNA predicts survival in pediatric acute myeloid leukemia
Mitochondrial DNA (mtDNA) copy number alterations are known to occur in acute myeloid leukemia (AML), however their biological significance has not been well studied. Pediatric AML has a distinct biology, different from adults, and with heterogeneous clinical outcomes, the biological basis of which are not well understood, according to researchers Shilpi Chaudhary, PhD, of the All India Institute of Medical Sciences, New Delhi, and colleagues.

Their analysis of 123 pediatric patients with AML found that mtDNA copy number was an independent predictor of aggressive disease, lower event-free survival, and overall survival, according to a report published in Mitochondrion.
In an attempt to find the biological factors involved in the increased mtDNA copy numbers and their effect on the development and aggressiveness of pediatric AML, the researchers studied the regulation and significance of mtDNA copy number in pediatric AML patients using quantitative real time–polymerase chain reaction, as well as in vitro studies. For patients, results were correlated with clinical outcomes.
Mitochondrial biogenesis genes (TFAM, POLG, POLRMT) and two regulator of mitochondrial biogenesis, MYC and PGC1A, were also assessed, according to Dr. Chaudhary and colleagues.
Predictive results
MtDNA copy number was significantly higher in patients, compared with controls (P < .001) and was found to be an independent predictor of aggressive disease (P = .006), lower event-free survival (P = .033), and overall survival (P = .007).
TFAM, POLG & POLRMT and ND3 were also found to be significantly up-regulated in patients, compared with controls as was the expression of the mitochondrial biogenesis regulator MYC (P < .001). However, correlation analysis showed that mtDNA copy number was not associated with the expression of these genes.
In contrast, PGC1A expression was not significantly different in patients, compared with controls overall, although there was a subset of patients whose PGC1A expression was extremely high, according to the researchers.
Importantly, however, in the subset of patients with high PGC1A expression (n = 28), mtDNA copy number had a positive correlation with PGC1A expression (P = .013). On the other hand, among patients with low MYC expression (n = 27), there was no correlation of mtDNA copy number with either PGC1A or MYC expression.
These results were corroborated in in vitro studies, where treatment with the inhibitor tigecycline led to a significant decrease in expression of MYC (P < .001), TFAM (P = .037) and ND3 (P = .010) but resulted in no significant change in mtDNA copy number (P = .23) or expression of PGC1A (P = .10).
Therapeutic candidate?
In contrast to the case of MYC, in vitro PGC1A inhibition significantly reduced mtDNA copy number in along with expression of TFAM and even expression of POLG and POLRMT at higher concentration.
“This observation is in line with our finding in patient samples as well that PGC1A expression positively correlated with mtDNA copy number, more so in patients with higher PGC1A expression,” the researchers stated.
“This makes it plausible to infer that PGC1A may have a possible role in enhancing mtDNA copy number in AML patients, likely independent of MYC,” they added. “Therefore, a strategy of designing therapeutics using already approved inhibitors targeting PGC1A may be an exciting area of therapeutic intervention.”
The authors reported that they have no competing financial conflicts of interests.
Mitochondrial DNA (mtDNA) copy number alterations are known to occur in acute myeloid leukemia (AML), however their biological significance has not been well studied. Pediatric AML has a distinct biology, different from adults, and with heterogeneous clinical outcomes, the biological basis of which are not well understood, according to researchers Shilpi Chaudhary, PhD, of the All India Institute of Medical Sciences, New Delhi, and colleagues.
Their analysis of 123 pediatric patients with AML found that mtDNA copy number was an independent predictor of aggressive disease, lower event-free survival, and overall survival, according to a report published in Mitochondrion.
In an attempt to find the biological factors involved in the increased mtDNA copy numbers and their effect on the development and aggressiveness of pediatric AML, the researchers studied the regulation and significance of mtDNA copy number in pediatric AML patients using quantitative real time–polymerase chain reaction, as well as in vitro studies. For patients, results were correlated with clinical outcomes.
Mitochondrial biogenesis genes (TFAM, POLG, POLRMT) and two regulator of mitochondrial biogenesis, MYC and PGC1A, were also assessed, according to Dr. Chaudhary and colleagues.
Predictive results
MtDNA copy number was significantly higher in patients, compared with controls (P < .001) and was found to be an independent predictor of aggressive disease (P = .006), lower event-free survival (P = .033), and overall survival (P = .007).
TFAM, POLG & POLRMT and ND3 were also found to be significantly up-regulated in patients, compared with controls as was the expression of the mitochondrial biogenesis regulator MYC (P < .001). However, correlation analysis showed that mtDNA copy number was not associated with the expression of these genes.
In contrast, PGC1A expression was not significantly different in patients, compared with controls overall, although there was a subset of patients whose PGC1A expression was extremely high, according to the researchers.
Importantly, however, in the subset of patients with high PGC1A expression (n = 28), mtDNA copy number had a positive correlation with PGC1A expression (P = .013). On the other hand, among patients with low MYC expression (n = 27), there was no correlation of mtDNA copy number with either PGC1A or MYC expression.
These results were corroborated in in vitro studies, where treatment with the inhibitor tigecycline led to a significant decrease in expression of MYC (P < .001), TFAM (P = .037) and ND3 (P = .010) but resulted in no significant change in mtDNA copy number (P = .23) or expression of PGC1A (P = .10).
Therapeutic candidate?
In contrast to the case of MYC, in vitro PGC1A inhibition significantly reduced mtDNA copy number in along with expression of TFAM and even expression of POLG and POLRMT at higher concentration.
“This observation is in line with our finding in patient samples as well that PGC1A expression positively correlated with mtDNA copy number, more so in patients with higher PGC1A expression,” the researchers stated.
“This makes it plausible to infer that PGC1A may have a possible role in enhancing mtDNA copy number in AML patients, likely independent of MYC,” they added. “Therefore, a strategy of designing therapeutics using already approved inhibitors targeting PGC1A may be an exciting area of therapeutic intervention.”
The authors reported that they have no competing financial conflicts of interests.
FROM MITOCHONDRION