User login
Bispecific CAR T-cells yield high response rate in relapsed/refractory myeloma
ORLANDO – A dual-targeted chimeric antigen receptor (CAR) T-cell therapy has demonstrated a high overall response rate, a long response duration, and manageable safety in patients with relapsed or refractory multiple myeloma, according to an investigator in a phase 1 study.
The overall response rate exceeded 90%, and about three-quarters of patients remained progression-free at 9 months after treatment with the CAR T-cell therapy, which targets both B-cell maturation antigen (BCMA) and CD38, the study investigator reported.
Grade 3 or greater cytokine release syndrome (CRS) occurred in about one-quarter of the patients, and no neurotoxicity was observed, according to investigator Yu Hu, MD, of Tongji Medical College in Hubei, China.
“,” Dr. Hu said in a press conference.
Short-term relapse has been a “major challenge” with current CAR T-cell therapies currently under investigation for myeloma, most of which target BCMA, according to Dr. Hu.
He said the bispecific CAR T-cell therapy under investigation, known as BM38, was designed to target antigen loss and increase persistence of effector cells. According to the investigator, this was the first study to focus on an anti-BCMA and CD38 dual-targeted CAR T-cell therapy for patients with relapsed or refractory multiple myeloma.
Gary J. Schiller, MD, of UCLA Health, who moderated the press conference, said that while dual-targeting is a potentially “attractive” approach in these hard-to-treat patients, further follow-up is needed to see duration of response and to see if antigen escape re-emerges.
“Cellular therapy is costly, in terms of toxicity as well as financial costs, so you would like to see what the durability of responses is before engaging in that as a late-stage therapy, not to mention moving it up front,” Dr. Schiller said in an interview.
The median progression-free survival (PFS) duration had not been reached at the time of this report, though the 9-month PFS rate was 78.87%, according to the data presented by Dr. Hu.
In the phase 1 study, 22 patients received BM38 CAR T-cell infusions following a fludarabine and cyclophosphamide preconditioning regimen. The median patient age was 59 years, and 50% were male. Nearly three-quarters (72%) had a cytogenetic abnormality, and the median number of prior therapies approached four (range, two to nine prior therapies).
Twenty of the patients (90.9%) had a response: 12 who achieved stringent complete remission, 2 with very good partial response, 5 with partial responses, and 1 with a minimal response.
Of 9 patients with extramedullary disease, 8 achieved partial or complete elimination of tumors, Dr. Hu said in his presentation.
Cytokine release syndrome occurred in 20 patients (90.91%), 5 of whom experienced severe cases (22.73%), according to the reported data. There was no observed neurotoxicity, according to the report, while almost all had hematologic toxicities. Three experienced hepatotoxicity and one had nephrotoxicity, according to Dr. Hu.
The phase 1 study was supported by the National Natural Science Foundation of China, the Major Technological Innovation Special Project Fund of Hubei Province of China, and Cellyan Therapeutics. The senior author of the study was affiliated with Cellyan Therapeutics. Dr. Hu and coauthors reported that they had no relevant conflicts of interest to declare.
SOURCE: Li C et al. ASH 2019. Abstract 930.
REPORTING FROM ASH 2019
High complete response rate seen with novel CAR-T for myeloma
ORLANDO – A novel chimeric antigen receptor T (CAR T) cell construct is associated with deep clinical responses in patients with multiple myeloma for whom prior lines of therapy – some numbering in the double digits – have failed.
Among 29 patients with multiple myeloma enrolled in a phase 1b/2 trial of JNJ-4528, the overall response rate (ORR) at 6 months median follow-up was 100%, including 69% complete responses, with 27 patients remaining free of disease progression at a median of 6 months, reported Deepu Madduri, MD, of Icahn School of Medicine at Mount Sinai, New York.
“These are very heavily pretreated patients, and so getting early and deep responses is quite amazing,” she said at a briefing prior to presentation of the data at the annual meeting of the American Society of Hematology.
JNJ-4528 is a second-generation CAR T containing two single-domain antibodies targeted against B-cell maturation protein (BCMA). As previously reported, an identical CAR T cell construct showed a high overall response with manageable toxicities in 74 patients with relapsed/refractory multiple myeloma. JNJ-4528 was granted a breakthrough therapy designation for relapsed/refractory multiple myeloma by the Food and Drug Administration on Dec. 6, 2019, and a priority medicines (PRIME) designation by the European Medicines Agency in April 2019.
BCMA was first described in myeloma in 2004 as a mechanism for the growth and survival of malignant plasma cells. Several research groups are currently investigating CAR T cells or monoclonal antibodies targeted to BCMA. The product closest to receiving FDA approval is likely BB2121.
At ASH 2019, Dr. Madduri presented results from the phase 1b portion of the CARTITUDE-1 trial. The investigators enrolled patients with multiple myeloma with measurable diseases as assessed by M-protein or serum free light chain levels who had experienced disease progression on at least 3 prior lines of therapy, or whose disease was refractory to at least two lines of therapy with a proteasome inhibitor, immunomodulatory drug (IMiD), and an anti-CD38 antibody.
Patients underwent apheresis for T-cell collection, with bridging therapy allowed until the expanded T cells could be delivered.
Following T-cell depletion with cyclophosphamide 300 mg/m2 and fludarabine 30 mg/m2 over 3 days, patients received a single weight-based infusion (compared with fixed-dose infusions used with other CAR T cell constructs).
The dose was targeted at 0.75x10⁶ CAR-positive cells/kg, with a target range of 0.5–1.0x10⁶, administered 5-7 days after the start of the conditioning regimen.
A total of 29 patients, median age 60, were evaluable for the safety and efficacy endpoints. One-fourth of the patients had a high-risk cytogenetic profile. The patients had received a median of 5 prior lines of therapy, with one patient receiving 18 prior lines. Of the 29 patients, 25 (86%) had previously undergone autologous transplantation.
As noted before, the ORR after a median follow-up of 6 months was 100%, with 69% completer responses, 17% very good partial responses, and 14% partial responses. The median time to complete response was 1 month (range 1 to 9 months). All but two patients remained free of disease progression at the median 6-month follow-up.
Nearly all patients (27) developed cytokine release syndrome (CRS), and one patient with prolonged grade 4 CRS died from related complications 99 days after infusion.
The median time to onset of CRS was 7 days with more than 90% of cases occurring between days 5 and 9.
Neurotoxicities, specifically immune effector cell–associated neurotoxicity syndrome (ICANS), were infrequent in CRS, and when they did occur were generally low grade, with only 1 grade 3 ICANS event.
Asked in an interview whether the impressive response rates seen with JNJ-4528 might persist over time, Dr. Madduri acknowledged that follow-up is still relatively short.
“This product is unique in that has a CD8 central memory phenotype preferentially, and we’re hoping that this would play a central role in the durability of response because they’re memory cells, but I think at this time we don’t know,” she said.
The CARTITUDE-1 trial is funded by Janssen Research & Development. Dr. Madduri disclosed serving as a consultant to Janssen and to Takeda, Foundation Medicine, AbbVie, and Celgene.
SOURCE: Madduri D et al. ASH 2019. Abstract 577.
REPORTING FROM ASH 2019
Women with epilepsy less likely than controls to breastfeed
BALTIMORE – , according to data presented at the annual meeting of the American Epilepsy Society. Seizure control, education by the treating neurologist, and postpartum lactation consultative support are associated with adherence to breastfeeding, said the researchers.

“We need to understand and address the challenges that women with epilepsy face beyond seizure control and medication management when they are being seen by various health care providers to ensure the best quality of life for them and their babies,” Abrar Al-Faraj, MD, instructor of neurology at Boston University, said in a press release. “The strong efforts to advocate for breastfeeding in the general population should include women with chronic diseases such as epilepsy.”
A retrospective study of women who underwent pregnancy
Data have established the benefits of breastfeeding in the general population. Recent studies have confirmed that for women with epilepsy and their children, breastfeeding is safe and may provide neurodevelopmental benefits. Data also indicate, however, that rates of breastfeeding are significantly lower in women with epilepsy than in the general population. Dr. Al-Faraj and colleagues sought to compare the rates of initiation of and adherence to breastfeeding in women with epilepsy with those in healthy controls. They also intended to identify the factors that affect breastfeeding in women with epilepsy and assess the influence of support systems (e.g., lactation consult services) on breastfeeding.
The investigators retrospectively studied 102 women with epilepsy who were treated at the Beth Israel Deaconess Medical Center (BIDMC) Epilepsy Clinic and underwent pregnancies between 2009 and 2018. They compared these women to 113 healthy controls without epilepsy who were treated at the obstetrical service at BIDMC during the same period. Dr. Al-Faraj and colleagues reviewed patients’ medical records for demographic information, epilepsy type, degree of seizure control during pregnancy and post partum, number of antiepileptic medications (AEDs), breastfeeding education by providers (i.e., neurologists and epilepsy nurses), lactation consult, and rate of initiation of and adherence to breastfeeding at 6 weeks and 3 and 6 months. The investigators excluded from their analysis patients with other chronic medical conditions, those taking medications other than AEDs that may affect breastfeeding, and those with limited follow-up during pregnancy and post partum.
Education and support were correlated with breastfeeding
Participants’ ages ranged from 20 years to 40 years. The rate of breastfeeding initiation was significantly lower in women with epilepsy (51%) than in controls (87%). The rate declined significantly to 38.2% at 6 weeks in women with epilepsy, compared to 76% in controls. The rate of adherence at 3 months was 36.2% in women with epilepsy, and adherence at 6 months was 18.6%.
The reasons for not breastfeeding were known for 17.6% of women with epilepsy. These reasons included fear of AED exposure through breast milk, recommendations by providers (e.g., pediatricians and obstetricians) not to breastfeed, failed breastfeeding attempts because of technical difficulties (e.g., the baby’s inability to latch), and lack of milk supply. Treating neurologists discussed breastfeeding with 52.9% of women with epilepsy, and epilepsy nurses discussed it with 91% of women with epilepsy. Among the 66% of patients who received obstetrical care at BIDMC, 13% of women with epilepsy had lactation consultation post partum, compared with 58% of controls. Breastfeeding education by the treating neurologist was significantly and positively correlated with decision to breastfeed and initiation of breastfeeding. Postpartum lactation consult support was also associated with a significantly higher rate of breastfeeding initiation, adherence at 6 weeks, adherence at 3 months, and adherence at 6 months. Women with well-controlled seizures were more likely to continue breastfeeding at 6 weeks, compared with women with uncontrolled seizures. The researchers found no statistically significant difference in the breastfeeding initiation rate, however, between women with controlled seizures and those with uncontrolled seizures.
“Women with poor seizure control are a particularly vulnerable group and have the greatest need for intervention to improve breastfeeding rates,” said Dr. Al-Faraj and colleagues. Focused physician education and support measures such as lactation consultation may be potential interventions to improve the treatment of women with epilepsy, they added. “Further prospective investigations are needed to identify other factors that prevent the decision to initiate or adhere to breastfeeding in women with epilepsy and evaluate interventions that may be implemented as a public health measure to support this vulnerable population.”
The study did not have external funding, and the investigators reported no disclosures.
SOURCE: Al-Faraj AO et al. AES 2019, Abstract 1.246.
BALTIMORE – , according to data presented at the annual meeting of the American Epilepsy Society. Seizure control, education by the treating neurologist, and postpartum lactation consultative support are associated with adherence to breastfeeding, said the researchers.
“We need to understand and address the challenges that women with epilepsy face beyond seizure control and medication management when they are being seen by various health care providers to ensure the best quality of life for them and their babies,” Abrar Al-Faraj, MD, instructor of neurology at Boston University, said in a press release. “The strong efforts to advocate for breastfeeding in the general population should include women with chronic diseases such as epilepsy.”
A retrospective study of women who underwent pregnancy
Data have established the benefits of breastfeeding in the general population. Recent studies have confirmed that for women with epilepsy and their children, breastfeeding is safe and may provide neurodevelopmental benefits. Data also indicate, however, that rates of breastfeeding are significantly lower in women with epilepsy than in the general population. Dr. Al-Faraj and colleagues sought to compare the rates of initiation of and adherence to breastfeeding in women with epilepsy with those in healthy controls. They also intended to identify the factors that affect breastfeeding in women with epilepsy and assess the influence of support systems (e.g., lactation consult services) on breastfeeding.
The investigators retrospectively studied 102 women with epilepsy who were treated at the Beth Israel Deaconess Medical Center (BIDMC) Epilepsy Clinic and underwent pregnancies between 2009 and 2018. They compared these women to 113 healthy controls without epilepsy who were treated at the obstetrical service at BIDMC during the same period. Dr. Al-Faraj and colleagues reviewed patients’ medical records for demographic information, epilepsy type, degree of seizure control during pregnancy and post partum, number of antiepileptic medications (AEDs), breastfeeding education by providers (i.e., neurologists and epilepsy nurses), lactation consult, and rate of initiation of and adherence to breastfeeding at 6 weeks and 3 and 6 months. The investigators excluded from their analysis patients with other chronic medical conditions, those taking medications other than AEDs that may affect breastfeeding, and those with limited follow-up during pregnancy and post partum.
Education and support were correlated with breastfeeding
Participants’ ages ranged from 20 years to 40 years. The rate of breastfeeding initiation was significantly lower in women with epilepsy (51%) than in controls (87%). The rate declined significantly to 38.2% at 6 weeks in women with epilepsy, compared to 76% in controls. The rate of adherence at 3 months was 36.2% in women with epilepsy, and adherence at 6 months was 18.6%.
The reasons for not breastfeeding were known for 17.6% of women with epilepsy. These reasons included fear of AED exposure through breast milk, recommendations by providers (e.g., pediatricians and obstetricians) not to breastfeed, failed breastfeeding attempts because of technical difficulties (e.g., the baby’s inability to latch), and lack of milk supply. Treating neurologists discussed breastfeeding with 52.9% of women with epilepsy, and epilepsy nurses discussed it with 91% of women with epilepsy. Among the 66% of patients who received obstetrical care at BIDMC, 13% of women with epilepsy had lactation consultation post partum, compared with 58% of controls. Breastfeeding education by the treating neurologist was significantly and positively correlated with decision to breastfeed and initiation of breastfeeding. Postpartum lactation consult support was also associated with a significantly higher rate of breastfeeding initiation, adherence at 6 weeks, adherence at 3 months, and adherence at 6 months. Women with well-controlled seizures were more likely to continue breastfeeding at 6 weeks, compared with women with uncontrolled seizures. The researchers found no statistically significant difference in the breastfeeding initiation rate, however, between women with controlled seizures and those with uncontrolled seizures.
“Women with poor seizure control are a particularly vulnerable group and have the greatest need for intervention to improve breastfeeding rates,” said Dr. Al-Faraj and colleagues. Focused physician education and support measures such as lactation consultation may be potential interventions to improve the treatment of women with epilepsy, they added. “Further prospective investigations are needed to identify other factors that prevent the decision to initiate or adhere to breastfeeding in women with epilepsy and evaluate interventions that may be implemented as a public health measure to support this vulnerable population.”
The study did not have external funding, and the investigators reported no disclosures.
SOURCE: Al-Faraj AO et al. AES 2019, Abstract 1.246.
REPORTING FROM AES 2019
Is strict glycemic control meaningless for older adults?
AT THE IDF CONGRESS 2019
BUSAN, SOUTH KOREA – The question of whether or not strict glycemic control is appropriate for older adults was the subject of a debate between two experts at the 2019 congress of the International Diabetes Federation.
Current guidelines from the Endocrine Society addressing diabetes management in older adults call for shared decision making and individualized approaches, taking into account comorbidities, complications, and special situations.
Medha Munshi, MD, and Ryo Suzuki, MD, PhD, took differing approaches to the risk-versus-benefit equation for older patients.
The case against ...
Dr. Munshi, director of the Joslin geriatric diabetes program at Beth Israel Deaconess Medical Center, Boston, started the debate by stating, “Yes, strict glycemic control in the elderly is meaningless.”
She based this on two main points: The benefits of strict glycemic control in older adults are not clear, and the risks are “catastrophic and well documented.”
The first problem, said Dr. Munshi, is that there is a dearth of data in older adults. In a 2013 review of 2,484 diabetes-focused studies registered on clinicaltrials.gov, just 0.6% included participants who were older than 65 years, whereas 30.8% specifically excluded that age group, and 54.9% excluded people older than 70 years.
Another analysis of 440 studies that investigated treatments for type 2 diabetes showed that, of trials that did include older adults, more than three-quarters (76.8%) excluded those with comorbidities, nearly a third (29.5%) excluded people with polypharmacy or specific drugs, and 18.4% excluded those with cognitive impairment.
“So, the trials are not targeted toward older adults, and those that are, exclude people with multiple comorbidities, so the [participants] who are left in the trials are not [representative of the patients] we see in the clinic,” Dr. Munshi emphasized.
Among the major trials that evaluated intensive treatment versus usual care in type 2 diabetes – including the UK Prospective Diabetes Study (UKPDS), the Veterans Administration Diabetes Trial (VADT), and the Action to Control Cardiovascular Risk in Diabetes (ACCORD) trial – no macrovascular benefits were found except in UKPDS, and evidence of harm was found in ACCORD.
What those trials suggested, said Dr. Munshi, is that the patients who do better with intensive glycemic control are younger, have a shorter duration of disease, fewer complications and comorbidities at baseline, better overall health, and longer life expectancy.
In contrast, those at greater risk from the hypoglycemia associated with intensive glycemic control are people who are older and frail, have longer duration of diabetes, have macro- and microvascular complications and comorbidities, are unable to safely follow complex regimens, and have shorter life expectancy.
She also pointed to a 2010 retrospective cohort study that identified a U-shaped curve relationship between hemoglobin A1c and all-cause mortality and cardiac events, suggesting that “there is a threshold beyond which, if the control is tighter, then the risk of mortality increases.”
Medications used by older adults with diabetes also pose risks, as shown in a study published in 2011 of 99,628 emergency hospitalizations for adverse drug events among U.S. adults aged 65 years and older conducted during 2007-2009.
In that study, warfarin topped the list, but insulin was the second most common, and oral hypoglycemic agents were also in the top 5.
And those episodes of emergency hospitalization, another study found, were associated with a 3.4-fold increased risk for 5-year mortality.
“ It increases the risk of cognitive decline, depression, frailty, falls and fractures, functional decline, anxiety, and fear of hypoglycemia; and it lowers quality of life,” Dr. Munshi explained.
Other unintended consequences of strict glycemic control in older adults include difficulty coping with complex regimens, increased caregiver burden, loss of independence, and increased financial burden, she added.
Control in healthy adults
A valid question, Dr. Munshi said, is whether strict glycemic control might be appropriate for older adults who are still healthy.
She responded to that by explaining that there is a phenomenon of aging called homeostenosis, a physical limit beyond which homeostasis cannot be restored in the presence of stressors, such as hypoglycemia leading to a fall, hospitalization, delirium, and poor outcome.
Another reasonable question, she added, was whether strict glycemic control in older adults could be achieved more safely and with greater benefit by using newer agents with lower risks for hypoglycemia that have been found to have cardiovascular and renal benefits.
To that, she noted that it’s not clear whether those benefits are a result of glycemic control, that the duration of the trials has been short (2-3 years), and drug interactions and side effects in populations with multiple morbidities have not been studied. Moreover, “cost and availability need consideration,” she said.
And so, she concluded, “Is strict glycemic control in the elderly really worth the risk? My answer would be no.”
The case for ...
Dr. Suzuki, a professor in the division of diabetes, metabolism, endocrinology, rheumatology, and collagen diseases at Tokyo Medical University, argued that strict glycemic control in the elderly is not “meaningless.”
He began by pointing out that his country, Japan, is “one of the most highly aging societies in the world.”
His arguments were based on three points: The elderly population is “full of diversity;” HbA1c is “not a perfect marker of glycemic control;” and new glucose-lowering drug classes may have benefits beyond reduction of blood glucose levels.
He also noted that there is no consensus on the definition of “elderly.”
Most developed countries use age 65 years and older as the cut-off, but the United Nations defines being elderly as 60 years and older, whereas the International Diabetes Federation’s guideline for managing older people with type 2 diabetes, uses 70 and older. These differences, he asserted, emphasize “the difficulty to generalize the gap between calendar age and biological age.”
Dr. Suzuki also pointed out that the American Diabetes Association’s Standards of Medical Care in Diabetes 2019 does not mention age as a consideration in individualizing glycemic targets.
Instead, factors such as risk for hypoglycemia, disease duration, life expectancy, comorbidities, established vascular complications, patient preference, and resources/support systems are listed. “We need to evaluate and assess these factors individually for every patient,” he asserted.
“Older age is very heterogeneous. Some people are very robust and active, while others are sick and frail ... We need to be careful about the active, healthy people because sometimes they need more intensified treatment to prevent complications of diabetes.”
Dr. Suzuki also pointed out that people hold important positions that require good health well into their 60s and 70s. “In many countries, many older individuals with or without diabetes have responsibilities and play important roles in their societies. Diabetes can be a big barrier for them ... Sometimes it requires hospitalizations, and they need to stop business.”
He cited an observational study from a Swedish national database showing a significant difference in hospitalizations for heart failure for older adults with diabetes and HbA1c of between 6% and 7%, compared with 7%-8%, among both men and women aged 71-75 and 61-65 years. In that study, investigators found that poor glycemic control (HbA1c of more than 7%) was associated with an increased risk of hospitalization for heart failure in patients with type 2 diabetes.
“This is, of course, an observational study, so we cannot draw a conclusion, but still, it strongly suggests that lower than 7% may prevent hospitalization for heart failure in elderly people.”
Glycemic variability
Another point is that HbA1c does not reflect glycemic variability, so it’s impossible to tell just from that measure the extent to which an individual is experiencing hypoglycemia – that is, two people can have the same A1c level, yet one experiences frequent hypoglycemia whereas the other never does.
“So, determining treatment based solely on A1c may be risky,” Dr. Suzuki noted.
And recently, the availability of continuous glucose monitoring is shifting the definition of “strict” glycemic control from “average” glucose to “time in range,” which also allows for a determination of the key metric “time below range.”
Recent international guidelines advise that, for older adults, fewer than 1% of readings should be below 70 mg/dL (3.9 mmol/L), compared with fewer than 4% for most other individuals with diabetes.
Thus, “in terms of avoiding hypoglycemia, older adults have a ‘stricter’ range. In other words, less stringency for high-risk people does not always mean broader allowance range in any glycemic profiles,” Dr. Suzuki noted.
However, newer drugs that don’t increase the risk for hypoglycemia are available for patients with type 2 diabetes.
Dr. Suzuki pointed to his own 2018 study demonstrating that the dipeptidyl peptidase‐4 (DPP-4) inhibitor sitagliptin had a greater ability to reduce daily glucose fluctuations in drug-naive Japanese patients with type 2 diabetes, compared with the sulfonylurea glibenclamide.
Similarly, in the Trial Evaluating Cardiovascular Outcomes with Sitagliptin (TECOS), the DPP-4 inhibitor did not increase severe hypoglycemia in the subgroup of participants aged 75 years and older.
And in several of the recent cardiovascular outcomes trials demonstrating cardiovascular benefit for type 2 diabetes agents, those benefits have been just as robust among older participants, he stressed.
These include the Researching Cardiovascular Events With a Weekly Incretin in Diabetes (REWIND) trial, in which those aged above and below 66 years experienced similar results with dulaglutide, a GLP-1 agonist.
And the landmark Empagliflozin Cardiovascular Outcome Event Trial in Type 2 Diabetes Mellitus Patients (EMPA-REG OUTCOME), which actually showed even greater protection against cardiovascular events among subjects aged 65 and older (hazard ratio, 0.86).
Also in the Dapagliflozin-Heart Failure (Dapa-HF) study, the SGLT-2 inhibitor reduced worsening of heart failure in patients with heart failure with reduced ejection fraction, regardless of age or presence of diabetes.
“I argue that older patients have rights to receive appropriate and effective treatment to prevent diabetes complications,” Dr. Suzuki concluded.
Dr. Munshi is a consultant for Sanofi and Lilly. Dr. Suzuki has received honoraria from MSD, Novo Nordisk, Novartis Pharma, Takeda, Mitsubishi Tanabe, and Eli Lilly Japan.
A version of this story originally appeared on Medscape.com.
Social anxiety more likely with inattentive ADHD, psychiatric comorbidities
Social anxiety is more likely in adolescents aged 12-18 years with predominantly inattentive ADHD and psychiatric comorbidities, according to María Jesús Mardomingo-Sanz, MD, PhD, and associates.
A total of 234 ADHD patients with a mean age of 14.9 years were recruited for the cross-sectional, observational study, and social anxiety was assessed using the Social Anxiety Scale for Adolescents (SAS-A). Just under 70% were male; 37.2% had predominantly inattentive disease, 9% had predominantly hyperactive-impulsive disease, and 51.7% had combined-type disease. , reported Dr. Mardomingo-Sanz, of the child psychiatry and psychology section at the Hospital General Universitario Gregorio Marañón in Madrid, and associates. The study was published in Anales de Pediatría.
The investigators found that 50.4% of patients had a psychiatric comorbidity. Learning and communication disorders, and anxiety disorders were the most common, occurring in 20.1% and 19.2% of all patients, respectively. Patients within the cohort scored significantly higher on the SAS-A, compared with reference values in a healthy population.
Patients with predominantly inattentive disease had significantly higher scores in the SAS-A, compared with those with predominantly hyperactive-impulsive disease (P = .015). Comorbid anxiety disorder was associated with the worst SAS-A scores (P less than .001).
“Social anxiety greatly influences the way in which children and adolescents interact with the surrounding environment and react to it, and therefore can contribute to the development of psychiatric comorbidities. Social anxiety detected by the SAS-A questionnaire is not diagnostic of an anxiety disorder, but detecting it is important, as it can contribute to the secondary prevention of future comorbidities that could lead to less favorable outcomes of these stage of development in patients with ADHD,” the investigators concluded.
Laboratorios Farmacéuticos funded the study, and the investigators reported receiving fees and being employed by Laboratorios Farmacéuticos.
SOURCE: Mardomingo-Sanz MJ et al. An Pediatr (Barc). 2019;90(6):349-61.
FROM ANALES DE PEDIATRÍA
Influenza already in midseason form
It’s been a decade since flu activity levels were this high this early in the season.
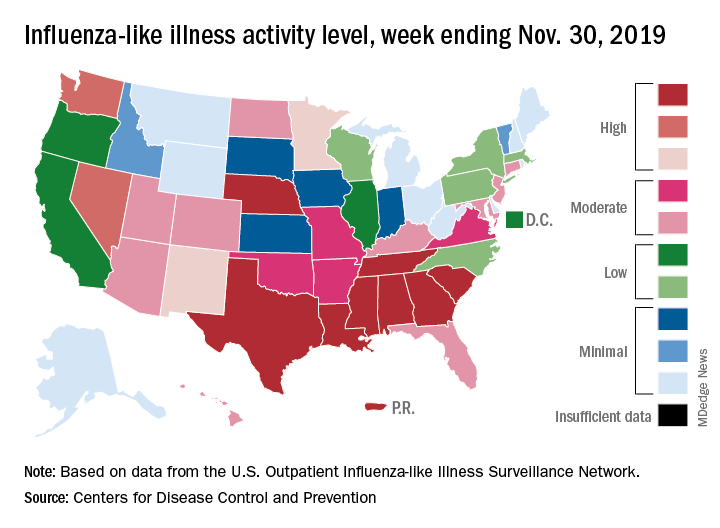
For the week ending Nov. 30, outpatient visits for influenza-like illness reached 3.5% of all visits to health care providers, the Centers for Disease Control and Prevention reported Dec. 6. That is the highest pre-December rate since the pandemic of 2009-2010, when the rate peaked at 7.7% in mid-October, CDC data show.
For the last week of November, eight states and Puerto Rico reported activity levels at the high point of the CDC’s 1-10 scale, which is at least five more states than any of the past five flu seasons. Three of the last five seasons had no states at level 10 this early in the season.
Another 4 states at levels 8 and 9 put a total of 13 jurisdictions in the “high” range of flu activity, with another 14 states in the “moderate” range of levels 6 and 7. Geographically speaking, 24 jurisdictions are experiencing regional or widespread activity, which is up from the 15 reported last week, the CDC’s influenza division said.
The hospitalization rate to date for the 2019-2020 season – 2.7 per 100,000 population – is “similar to what has been seen at this time during other recent seasons,” the CDC said.
One influenza-related pediatric death was reported during the week ending Nov. 30, which brings the total for the season to six, according to the CDC report.
It’s been a decade since flu activity levels were this high this early in the season.
For the week ending Nov. 30, outpatient visits for influenza-like illness reached 3.5% of all visits to health care providers, the Centers for Disease Control and Prevention reported Dec. 6. That is the highest pre-December rate since the pandemic of 2009-2010, when the rate peaked at 7.7% in mid-October, CDC data show.
For the last week of November, eight states and Puerto Rico reported activity levels at the high point of the CDC’s 1-10 scale, which is at least five more states than any of the past five flu seasons. Three of the last five seasons had no states at level 10 this early in the season.
Another 4 states at levels 8 and 9 put a total of 13 jurisdictions in the “high” range of flu activity, with another 14 states in the “moderate” range of levels 6 and 7. Geographically speaking, 24 jurisdictions are experiencing regional or widespread activity, which is up from the 15 reported last week, the CDC’s influenza division said.
The hospitalization rate to date for the 2019-2020 season – 2.7 per 100,000 population – is “similar to what has been seen at this time during other recent seasons,” the CDC said.
One influenza-related pediatric death was reported during the week ending Nov. 30, which brings the total for the season to six, according to the CDC report.
First generics for Gilenya approved by FDA
The Food and Drug Administration has approved the first generics of fingolimod (Gilenya) for the treatment of relapsing forms of multiple sclerosis.
The three generic fingolimod applications came from HEC Pharm, Biocon, and Sun Pharmaceutical Industries.
Fingolimod is a widely used, orally administered treatment option for relapsing forms of multiple sclerosis in adults. The most common adverse events associated with fingolimod in clinical trials include headache, elevation of liver enzymes, diarrhea, cough, influenza, sinusitis, back pain, abdominal pain, and pain in the extremities.
The drug must be dispensed with a medication guide that contains important information on its usage and risk, the FDA noted. Serious risks associated with fingolimod include slowing of the heart rate, vision problems, posterior reversible encephalopathy syndrome, respiratory problems, liver injury, increased blood pressure, skin cancer, and risk of serious infection including a rare and often deadly brain infection called progressive multifocal leukoencephalopathy. Fingolimod can also cause harm to a developing fetus.
Find the full press release on the FDA website.
Pruritic and Erythematous Rash Resembling Marks Caused by a Lashing
Shiitake Mushroom Dermatitis
Given the scattered and erythematous 1- to 2-mm macules and patches in a flagellate pattern on the shoulders, back, and neck, the differential diagnosis included shiitake mushroom dermatitis, bleomycin-induced flagellate dermatitis, dermatomyositis flagellate erythema, excoriation disorder, dermatographism, and keratosis lichenoides chronica. On further questioning, the patient indicated that he had consumed raw shiitake mushrooms 3 days before the onset of the rash. Although the clinical variability for all the conditions on the differential is notable, our patient had a history of consuming raw shiitake mushrooms, denied taking any medications, reported no repeated trauma, and had no muscular involvement or systemic symptoms, making shiitake mushroom dermatitis the most likely diagnosis.1 Skin biopsy and blood tests were deemed unnecessary. Instead, the patient was prescribed triamcinolone cream 0.1%, counseled to avoid raw or undercooked shiitake mushrooms in the future, and told to follow-up if symptoms did not resolve. The patient's symptoms resolved, as expected.
Nakamura2 first described shiitake mushroom dermatitis in 1977. The condition also is known as flagellate mushroom dermatitis or shiitake toxicoderma. It classically manifests in susceptible patients as a pruritic, linear, flagellated dermatitis within 24 to 48 hours after the consumption of raw or undercooked shiitake mushrooms (Lentinula edodes).3 Although the complete pathogenesis remains unclear, research suggests that either a toxic reaction or a type IV hypersensitivity reaction to lentinan causes the eruption. Lentinan is a thermolabile polysaccharide within the mushroom that is believed to increase the production of IL-1 and cause vasodilatation.4
Shiitake mushroom dermatitis is a clinical diagnosis based on the most common findings of a flagellate-pattern dermatitis consisting of pruritic and erythematous papular or urticarial lesions, usually found on the trunk. Laboratory tests, skin biopsies, and allergy tests have been shown to be nonspecific and inconsistent.5
Shiitake mushroom dermatitis is a self-limiting condition, with the majority of symptoms resolving after one to several weeks.5 The mainstay of treatment is aimed at symptomatic management and usually consists of topical corticosteroids and antihistamines.3 More rapid resolution of symptoms has been reported with the use of short-term balneo-psoralen plus UVA therapy.6
Although a 2017 review of the literature described only 9 published cases of shiitake mushroom dermatitis within the United States as of July 2015, this number may be misleading given the possibility of more variable and subtle presentations misdiagnosed as a nonspecific dermatitis.5 Given this information and the fact that shiitake mushrooms continue to be a popular choice in American cuisine, this case reminds health care providers of the clinical manifestations, differential diagnosis, and management of flagellate dermatitis caused by consuming shiitake mushrooms.
- Adler MJ, Larsen WG. Clinical variability of shiitake dermatitis. J Am Acad Dermatol. 2012;67:e140-e141.
- Nakamura T. Toxicoderma caused by Shiitake (Lentinus edodes). Japan J Clin Dermatol. 1977;31:65-68.
- Nakamura T. Shiitake (Lentinus edodes) dermatitis. Contact Dermatitis. 1992;27:65-70.
- Corazza M, Zauli S, Ricci M, et al. Shiitake dermatitis: toxic or allergic reaction? J Eur Acad Dermatol Venereol. 2015;29:1449-1451.
- Nguyen AH, Gonzaga MI, Lim VM, et al. Clinical features of shiitake dermatitis: a systematic review. Int J Dermatol. 2017;56:610-616.
- Scheiba N, Andrulis M, Helmbold P. Treatment of shiitake dermatitis by balneo PUVA therapy. J Am Acad Dermatol. 2011;65:453-455.
Shiitake Mushroom Dermatitis
Given the scattered and erythematous 1- to 2-mm macules and patches in a flagellate pattern on the shoulders, back, and neck, the differential diagnosis included shiitake mushroom dermatitis, bleomycin-induced flagellate dermatitis, dermatomyositis flagellate erythema, excoriation disorder, dermatographism, and keratosis lichenoides chronica. On further questioning, the patient indicated that he had consumed raw shiitake mushrooms 3 days before the onset of the rash. Although the clinical variability for all the conditions on the differential is notable, our patient had a history of consuming raw shiitake mushrooms, denied taking any medications, reported no repeated trauma, and had no muscular involvement or systemic symptoms, making shiitake mushroom dermatitis the most likely diagnosis.1 Skin biopsy and blood tests were deemed unnecessary. Instead, the patient was prescribed triamcinolone cream 0.1%, counseled to avoid raw or undercooked shiitake mushrooms in the future, and told to follow-up if symptoms did not resolve. The patient's symptoms resolved, as expected.
Nakamura2 first described shiitake mushroom dermatitis in 1977. The condition also is known as flagellate mushroom dermatitis or shiitake toxicoderma. It classically manifests in susceptible patients as a pruritic, linear, flagellated dermatitis within 24 to 48 hours after the consumption of raw or undercooked shiitake mushrooms (Lentinula edodes).3 Although the complete pathogenesis remains unclear, research suggests that either a toxic reaction or a type IV hypersensitivity reaction to lentinan causes the eruption. Lentinan is a thermolabile polysaccharide within the mushroom that is believed to increase the production of IL-1 and cause vasodilatation.4
Shiitake mushroom dermatitis is a clinical diagnosis based on the most common findings of a flagellate-pattern dermatitis consisting of pruritic and erythematous papular or urticarial lesions, usually found on the trunk. Laboratory tests, skin biopsies, and allergy tests have been shown to be nonspecific and inconsistent.5
Shiitake mushroom dermatitis is a self-limiting condition, with the majority of symptoms resolving after one to several weeks.5 The mainstay of treatment is aimed at symptomatic management and usually consists of topical corticosteroids and antihistamines.3 More rapid resolution of symptoms has been reported with the use of short-term balneo-psoralen plus UVA therapy.6
Although a 2017 review of the literature described only 9 published cases of shiitake mushroom dermatitis within the United States as of July 2015, this number may be misleading given the possibility of more variable and subtle presentations misdiagnosed as a nonspecific dermatitis.5 Given this information and the fact that shiitake mushrooms continue to be a popular choice in American cuisine, this case reminds health care providers of the clinical manifestations, differential diagnosis, and management of flagellate dermatitis caused by consuming shiitake mushrooms.
- Adler MJ, Larsen WG. Clinical variability of shiitake dermatitis. J Am Acad Dermatol. 2012;67:e140-e141.
- Nakamura T. Toxicoderma caused by Shiitake (Lentinus edodes). Japan J Clin Dermatol. 1977;31:65-68.
- Nakamura T. Shiitake (Lentinus edodes) dermatitis. Contact Dermatitis. 1992;27:65-70.
- Corazza M, Zauli S, Ricci M, et al. Shiitake dermatitis: toxic or allergic reaction? J Eur Acad Dermatol Venereol. 2015;29:1449-1451.
- Nguyen AH, Gonzaga MI, Lim VM, et al. Clinical features of shiitake dermatitis: a systematic review. Int J Dermatol. 2017;56:610-616.
- Scheiba N, Andrulis M, Helmbold P. Treatment of shiitake dermatitis by balneo PUVA therapy. J Am Acad Dermatol. 2011;65:453-455.
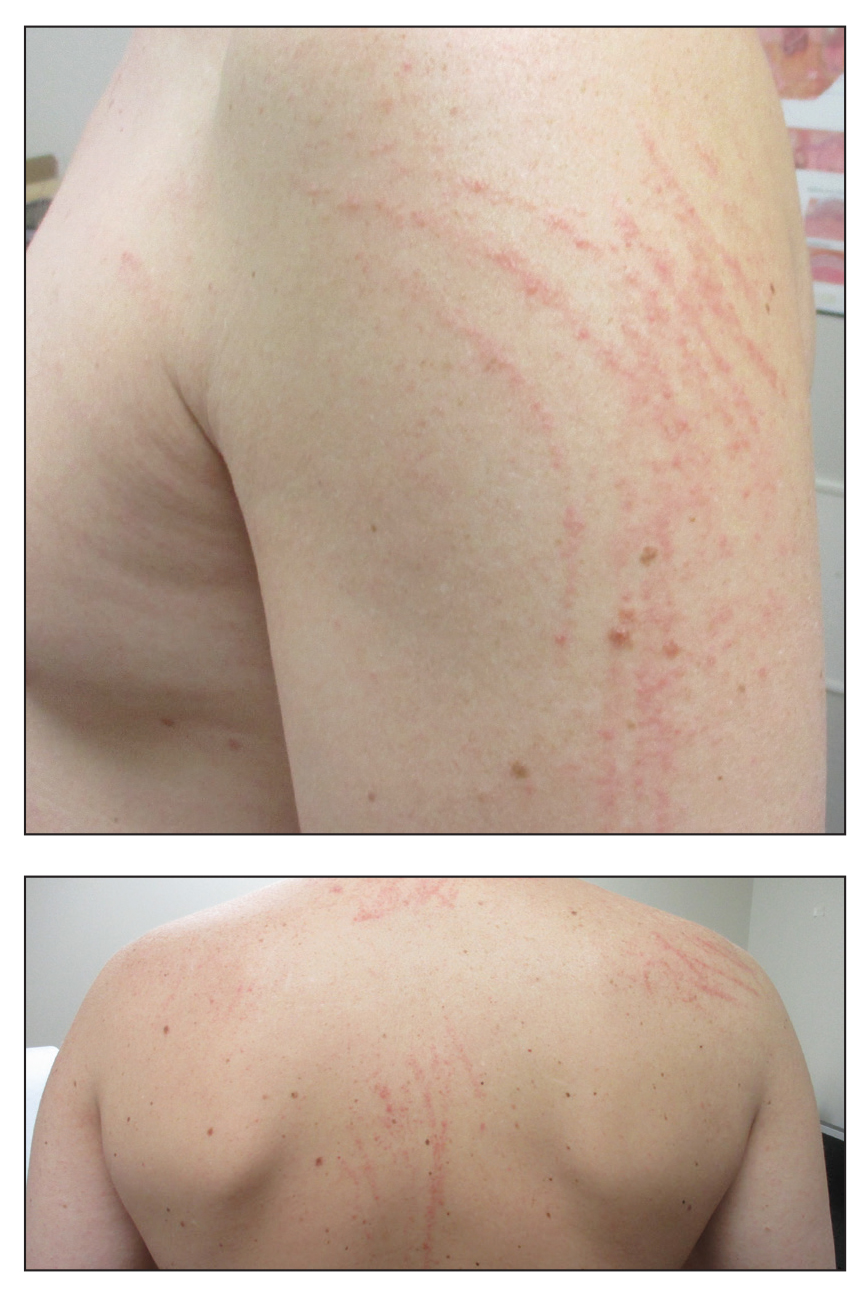
A 40-year-old man presented to the clinic with a sudden-onset pruritic rash of 4 days' duration. He denied any trauma and had no notable medical history. Furthermore, he denied taking any prescription or over-the-counter medications and had no known food or drug allergies. A review of systems was negative. He appeared well on physical examination with normal vital signs. A full-body skin examination displayed no mucosal lesions, but he had multiple areas of scattered and erythematous 1- to 2-mm macules and patches in a curvilinear parallel array on the shoulders (top), back (bottom), and neck.
Depression and Suicidality in Psoriasis and Clinical Studies of Brodalumab: A Narrative Review
Psoriasis is a chronic inflammatory skin disorder that affects patients’ quality of life and social interactions.1 Several studies have shown a strong consistent association between psoriasis and depression as well as possible suicidal ideation and behavior (SIB).1-13 Notable findings from a 2018 review found depression prevalence ranged from 2.1% to 33.7% among patients with psoriasis vs 0% to 22.7% among unaffected patients.7 In a 2017 meta-analysis, Singh et al2 found increased odds of SIB (odds ratio [OR], 2.05), attempted suicide (OR, 1.32), and completed suicide (OR, 1.20) in patients with psoriasis compared to those without psoriasis. In 2018, Wu and colleagues7 reported that odds of SIB among patients with psoriasis ranged from 1.01 to 1.94 times those of patients without psoriasis, and SIB and suicide attempts were more common than in patients with other dermatologic conditions. Koo and colleagues1 reached similar conclusions. At the same time, the occurrence of attempted and completed suicides among patients in psoriasis clinical trials has raised concerns about whether psoriasis medications also may increase the risk for SIB.7
We review research on the effects of psoriasis treatment on patients’ symptoms of depression and SIB, with a focus on recent analyses of depressive symptoms and SIB among patients with psoriasis who received brodalumab in clinical trials. Finally, we suggest approaches clinicians may consider when caring for patients with psoriasis who may be at risk for depression and SIB.
We reviewed research on the effects of biologic therapy for psoriasis on depression and SIB, with a primary focus on recent large meta-analyses. Published findings on the pattern of SIB in brodalumab clinical trials and effects of brodalumab treatment on symptoms of depression and anxiety are summarized. The most recent evidence (January 2014–December 2018) regarding the mental health comorbidities of psoriasis was assessed using published English-language research data and review articles according to a PubMed search of articles indexed for MEDLINE using the following terms: depression, anxiety, suicide, suicidal ideation and behavior, SIB, brodalumab, or psoriasis. We also reviewed citations within articles to identify relevant sources. Implications for clinical care of patients with psoriasis are discussed based on expert recommendations and the authors’ clinical experience.
RESULTS
Effects of Psoriasis Treatment on Symptoms of Depression and Suicidality
Occurrences of attempted suicide and completed suicide have been reported during treatment with several psoriasis medications,7,9 raising concerns about whether these medications increase the risk for depression and SIB in an already vulnerable population. Wu and colleagues7 reviewed 11 studies published from 2006 to 2017 reporting the effects of medications for the treatment of psoriasis—adalimumab, apremilast, brodalumab, etanercept, and ustekinumab—on measures of depression and anxiety such as the Beck Depression Inventory, the Hospital Anxiety and Depression Scale (HADS), and the Patient Health Questionnaire (PHQ) 8. In each of the 11 studies, symptoms of depression improved after treatment, over time, or compared to placebo. Notably, the magnitude of improvement in symptoms of depression was not strongly linked to the magnitude of clinical improvement.7 Other recent studies have reported reductions in symptoms of depression with biologic therapies, including adalimumab, etanercept, guselkumab, ixekizumab, secukinumab, and ustekinumab.14-21
With respect to suicidality, an analysis of publicly available data found low rates of completed and attempted suicides (point estimates of 0.0–0.15 per 100 patient-years) in clinical development programs of apremilast, brodalumab, ixekizumab, and secukinumab. Patient suicidality in these trials often occurred in the context of risk factors or stressors such as work, financial difficulties, depression, and substance abuse.7 In a detailed 2016 analysis of suicidal behaviors during clinical trials of apremilast, brodalumab, etanercept, infliximab, ixekizumab, secukinumab, tofacitinib, ustekinumab, and other investigational agents, Gooderham and colleagues9 concluded that the behaviors may have resulted from the disease or patients’ psychosocial status rather than from treatment and that treatment with biologics does not increase the risk for SIB. Improvements in symptoms of depression during treatment suggest the potential to improve patients’ psychiatric outcomes with biologic treatment.9
Evidence From Brodalumab Studies
Intensive efforts have been made to assess the effect of brodalumab, a fully human anti–IL-17RA monoclonal antibody shown to be efficacious in the treatment of moderate to severe plaque psoriasis, on symptoms of depression and to understand the incidence of SIB among patients receiving brodalumab in clinical trials.22-27
To examine the effects of brodalumab on symptoms of depression, the HADS questionnaire28 was administered to patients in 1 of 3 phase 3 clinical trials of brodalumab.23 A HADS score of 0 to 7 is considered normal, 8 to 10 is mild, 11 to 14 is moderate, and 15 to 21 is severe.23 The HADS questionnaire was administered to evaluate the presence and severity of depression and anxiety symptoms at baseline and at weeks 12, 24, 36, and 52.25 This scale was not used in the other 2 phase 3 studies of brodalumab because at the time those studies were initiated, there was no indication to include mental health screenings as part of the study protocol.
Patients were initially randomized to placebo (n=220), brodalumab 140 mg every 2 weeks (Q2W; n=219), or brodalumab 210 mg Q2W (the eventual approved dose; n=222) for 12 weeks.23 At week 12, patients initially randomized to placebo were switched to brodalumab through week 52. Patients initially randomized to brodalumab 210 mg Q2W were re-randomized to either placebo or brodalumab 210 mg Q2W.23 Depression and anxiety were common at baseline. Based on HADS scores, depression occurred among 27% and 26% of patients randomized to brodalumab and placebo, respectively; anxiety occurred in 36% of patients in each group.22 Among patients receiving brodalumab 210 mg Q2W from baseline to week 12, HADS depression scores improved in 67% of patients and worsened in 19%. In contrast, the proportion of patients receiving placebo whose depression scores improved (45%) was similar to the proportion whose scores worsened (38%). Hospital Anxiety and Depression Scale anxiety scores also improved more often with brodalumab than with placebo.22
Furthermore, among patients who had moderate or severe depression or anxiety at baseline, a greater percentage experienced improvement with brodalumab than placebo.23 Among 30 patients with moderate to severe HADS depression scores at baseline who were treated with brodalumab 210 mg Q2W, 22 (73%) improved by at least 1 depression category by week 12; in the placebo group, 10 of 22 (45%) improved. Among patients with moderate or severe anxiety scores, 28 of 42 patients (67%) treated with brodalumab 210 mg Q2W improved by at least 1 anxiety category compared to 8 of 27 (30%) placebo-treated patients.23
Over 52 weeks, HADS depression and anxiety scores continued to show a pattern of improvement among patients receiving brodalumab vs placebo.25 Among patients initially receiving placebo, mean HADS depression scores were unchanged from baseline (5.3) to week 12 (5.5). After patients were switched to brodalumab 210 mg Q2W, there was a trend toward improvement between week 12 (5.4) and week 52 (3.1). Among patients initially treated with brodalumab 210 mg Q2W, mean depression scores fell from baseline (5.5) to week 12 (3.4), then rose again between weeks 12 (2.9) and 52 (3.5) in patients switched to placebo (Figure, A). The pattern of findings was similar for HADS anxiety scores (Figure, B).25 Overall,
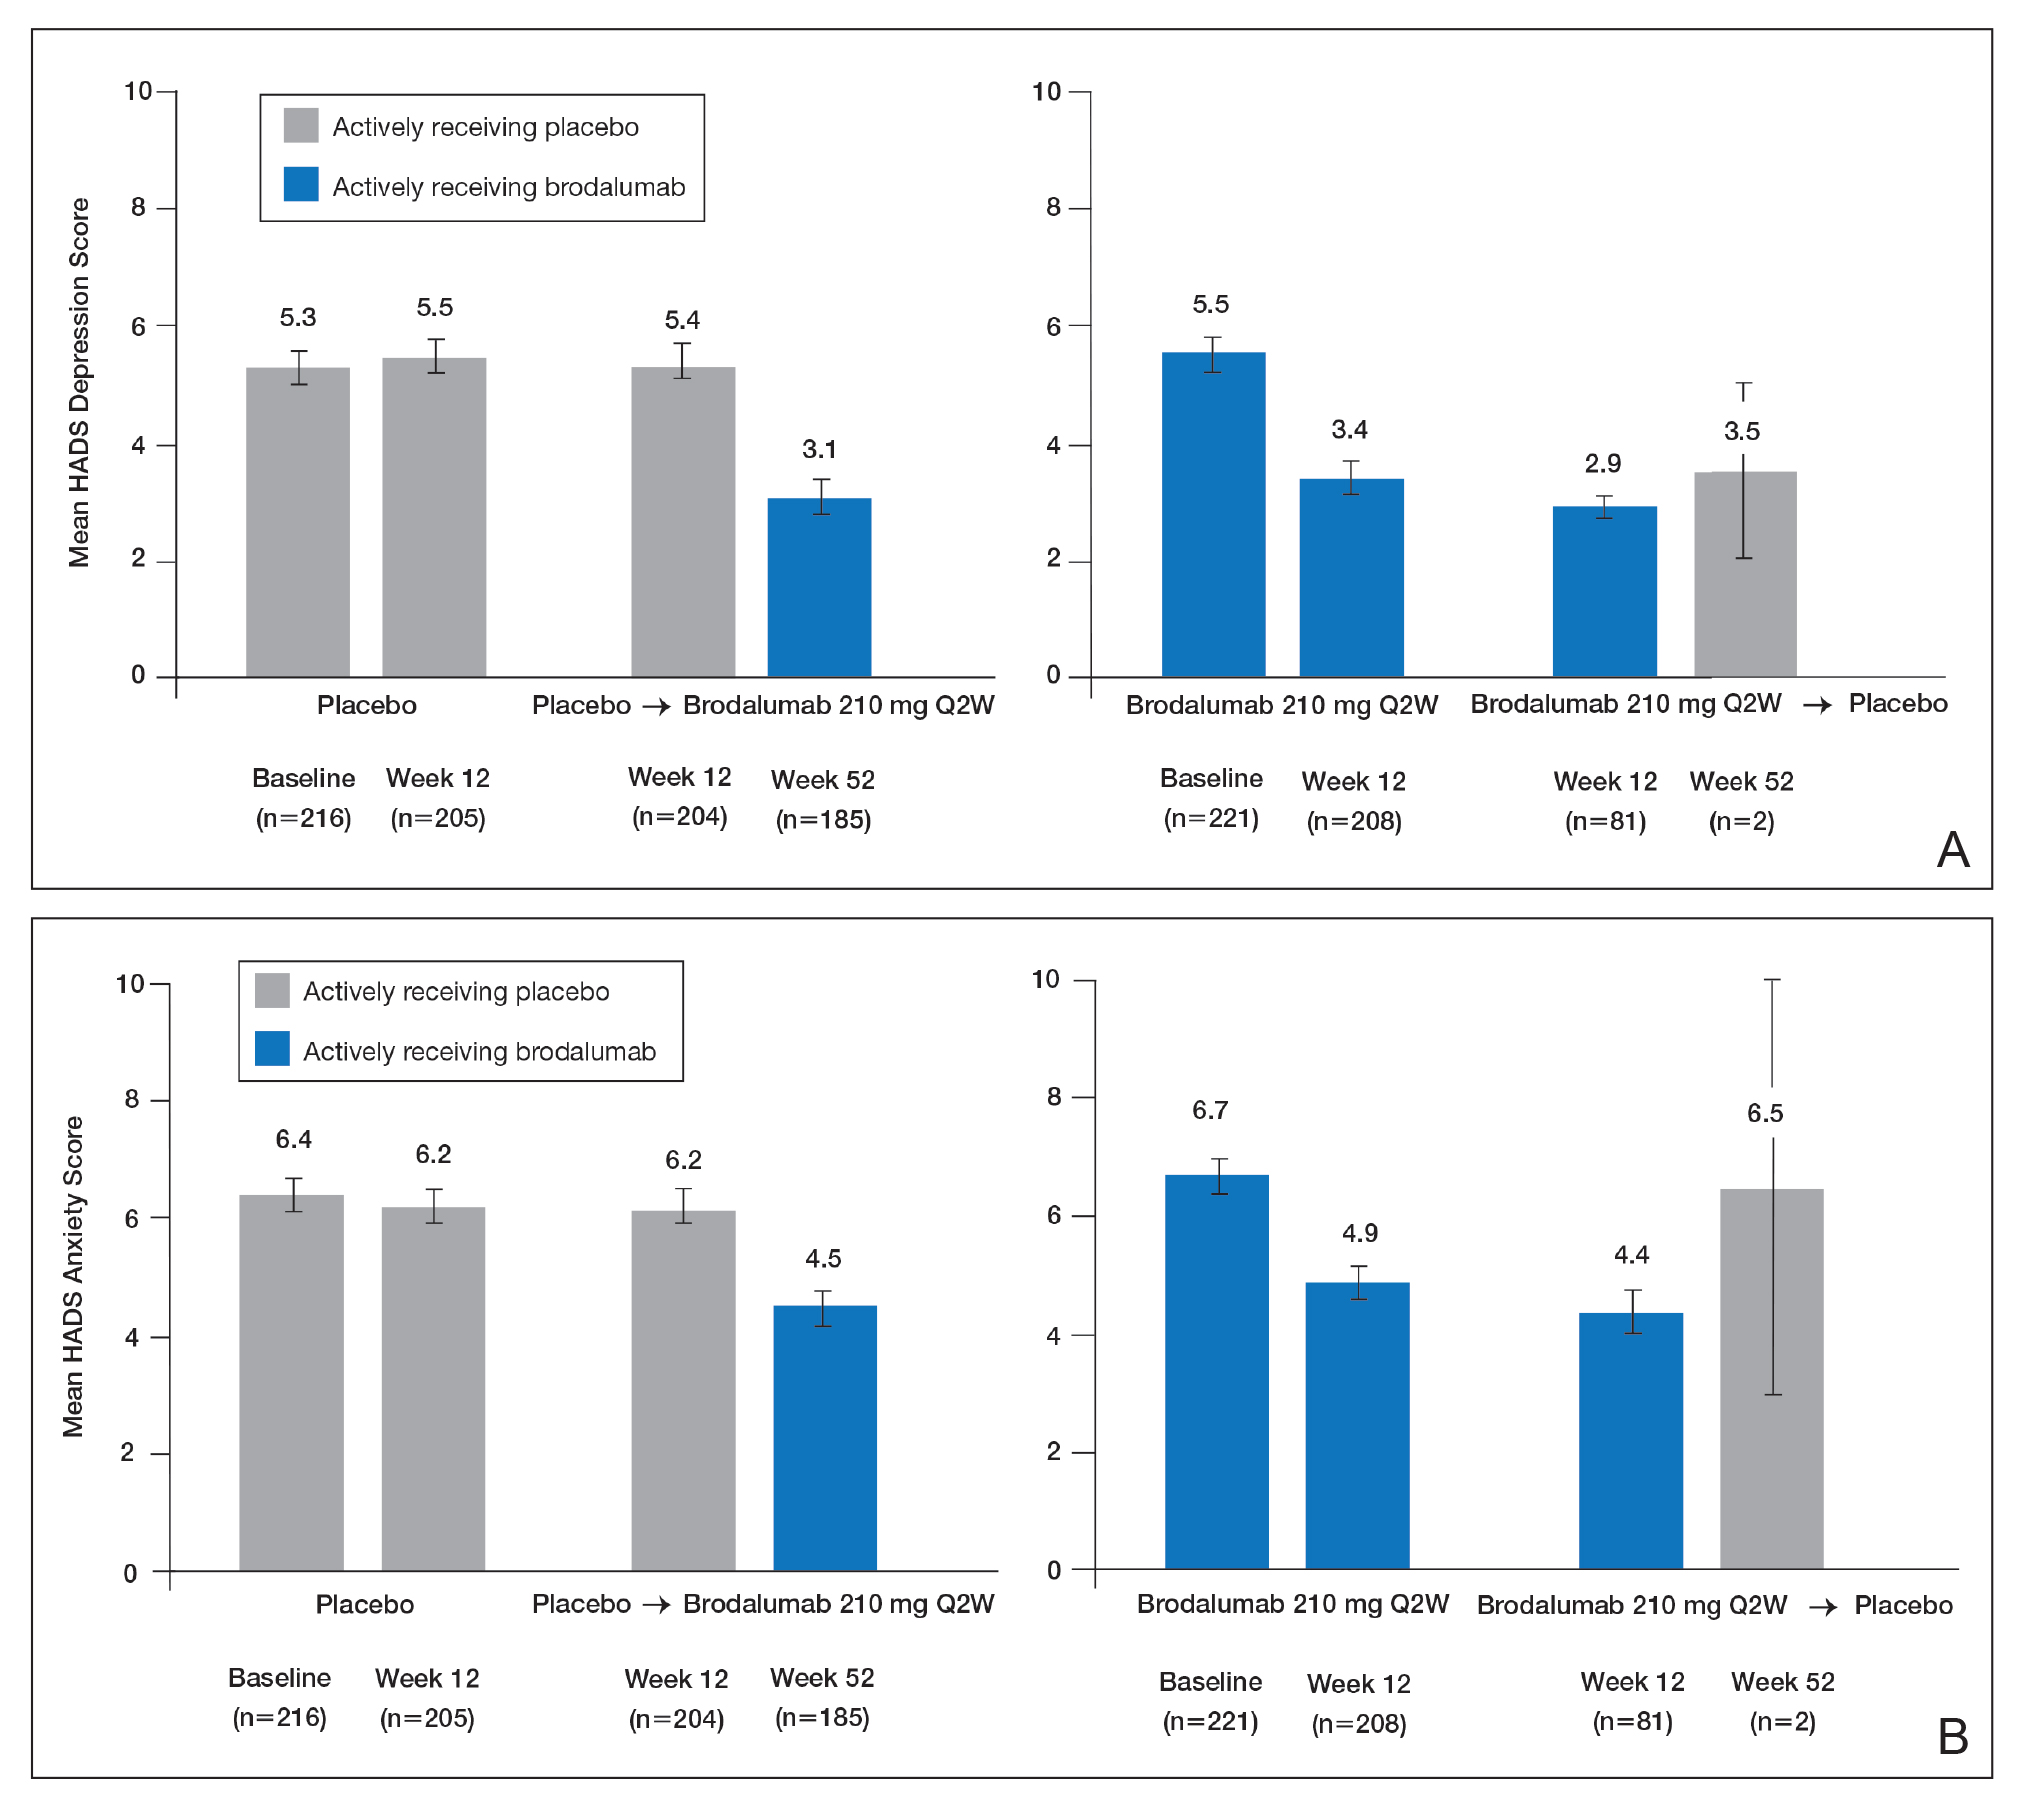
SIB in Studies of Brodalumab
In addition to assessing the effect of brodalumab treatment on symptoms of depression and anxiety in patients with psoriasis, the brodalumab clinical trial program also tracked patterns of SIB among enrolled patients. In contrast with other clinical trials in which patients with a history of psychiatric disorders or substance abuse were excluded, clinical trials of brodalumab did not exclude patients with psychiatric disorders (eg, SIB, depression) and were therefore reflective of the real-world population of patients with moderate to severe psoriasis.22
In a recently published, detailed analysis of psychiatric adverse events (AEs) in the brodalumab clinical trials, data related to SIB in patients with moderate to severe psoriasis were analyzed from the placebo-controlled phases and open-label, long-term extensions of a placebo-controlled phase 2 clinical trial and from the previously mentioned 3 phase 3 clinical trials.22 From the initiation of the clinical trial program, AEs were monitored during all trials. In response to completed suicides during some studies, additional SIB evaluations were later added at the request of the US Food and Drug Administration, including the Columbia Suicide Severity Rating Scale, the PHQ-8, and the Columbia Classification Algorithm for Suicide Assessment, to independently adjudicate SIB events.22
In total, 4464 patients in the brodalumab clinical trials received at least 1 dose of brodalumab, and 4126 of these patients received at least 1 dose of brodalumab 210 mg Q2W.22 Total exposure was 9174 patient-years of brodalumab, and mean exposure was 23 months. During the 52-week controlled phases of the clinical trials, 7 patients receiving brodalumab experienced any form of SIB event, representing a time-adjusted incidence rate of 0.20 events (95% confidence interval [CI], 0.08-0.41 events) per 100 patient-years of exposure. During the same 52-week period, patients receiving the comparator drug ustekinumab had an SIB rate of 0.60 events (95% CI, 0.12-1.74 events) per 100 patient-years, which was numerically higher than the rate with brodalumab. Inferential statistical analyses were not performed, but overlapping 95% CIs around these point estimates imply a similar level of SIB risk associated with each agent in these studies. During controlled and uncontrolled treatment periods in all studies, the SIB rate among brodalumab-treated patients was 0.37 events per 100 patient-years.22
Over all study phases, 3 completed suicides and 1 case adjudicated as indeterminate by the Columbia Classification Algorithm for Suicide Assessment review board were reported.22 All occurred in men aged 39 to 59 years. Of 6 patients with an AE of suicide attempt, all patients had at least 1 SIB risk factor and 3 had a history of SIB. The rate of SIB events was greater in patients with a history of depression (1.42) or suicidality (3.21) compared to those without any history of depression or suicidality (0.21 and 0.20, respectively).22 An examination of the regions in which the brodalumab studies were conducted showed generally consistent SIB incidence rates: 0.52, 0.29, 0.77, and 0 events per 100 patient-years in North America, Europe, Australia, and Russia, respectively.24
As previously described, depression and other risk factors for SIB are prevalent among patients with psoriasis. In addition, the rate of suicide mortality has increased substantially over the last decade in the general population, particularly among middle-aged white men,29 who made up much of the brodalumab clinical trial population.22 Therefore, even without treatment, it would not be surprising that SIB events occurred during the brodalumab trials. Most patients with SIB events during the trials had a history of predisposing risk factors.22 Prescribing information for brodalumab in the United States includes a boxed warning advising physicians to be aware of the risk of SIB as well as a statement that a causal relationship between SIB and brodalumab treatment has not been established.27
Despite the boxed warning in the brodalumab package insert concerning suicidality, a causal relationship between brodalumab treatment and increased risk of SIB has not been firmly established.27 The US boxed warning is based on 3 completed suicides and 1 case adjudicated as indeterminate among more than 4000 patients who received at least 1 dose of brodalumab during global clinical trials (0.07% [3/4464]). Compliance in the Risk Evaluation and Mitigation Strategy (REMS) program is mandatory, and patient screening and counseling should not be minimized.27 The 3 completed suicides occurred in patients who reported a history of financial stressors, legal difficulties, or depression and anxiety, and they occurred at least 140 days after initiation of treatment with brodalumab, a chronology that does not support a strong association between brodalumab exposure and SIB.22 Taking into consideration the increased risk for depression among individuals with psoriasis and the details surrounding the 3 completed suicides, an evidence-based causal relationship between brodalumab and increased risk for suicidality cannot be concluded. However, physicians must assess risks and benefits of any therapy in the context of the individual patient’s preferences, risk factors, and response to treatment.
Dermatologists who are aware of the comorbidity between psoriasis and mood disorders play an important role in evaluating patients with psoriasis for psychiatric risk factors.30-32 The dermatologist should discuss with patients the relationship between psoriasis and depression, assess for any history of depression and SIB, and evaluate for signs and symptoms of depression and current SIB.33 Screening tools, including the HADS or the short, easily administered PHQ-234 or PHQ-4,35 can be used to assess whether patients have symptoms of depression.1,36,37 Patients at risk for depression or SIB should be referred to their primary care physician or a mental health care practitioner.37 Currently, there is a gap in knowledge in screening patients for psychiatric issues within the dermatology community33,38; however, health care providers can give support to help bridge this gap.
Acknowledgments
This study was sponsored by Amgen Inc. Medical writing support was provided under the direction of the authors by Lisa Baker, PhD, and Rebecca E. Slager, PhD, of MedThink SciCom (Cary, North Carolina) and funded by Ortho Dermatologics, a division of Bausch Health US, LLC.
- Koo J, Marangell LB, Nakamura M, et al. Depression and suicidality in psoriasis: review of the literature including the cytokine theory of depression. J Eur Acad Dermatol Venereol. 2017;31:1999-2009.
- Singh S, Taylor C, Kornmehl H, et al. Psoriasis and suicidality: a systematic review and meta-analysis. J Am Acad Dermatol. 2017;77:425-440.e2.
- Chi CC, Chen TH, Wang SH, et al. Risk of suicidality in people with psoriasis: a systematic review and meta-analysis of cohort studies. Am J Clin Dermatol. 2017;18:621-627.
- Dalgard FJ, Gieler U, Tomas-Aragones L, et al. The psychological burden of skin diseases: a cross-sectional multicenter study among dermatological out-patients in 13 European countries. J Invest Dermatol. 2015;135:984-991.
- Pompili M, Innamorati M, Trovarelli S, et al. Suicide risk and psychiatric comorbidity in patients with psoriasis. J Int Med Res. 2016;44:61-66.
- Pompili M, Innamorati M, Forte A, et al. Psychiatric comorbidity and suicidal ideation in psoriasis, melanoma and allergic disorders. Int J Psychiatry Clin Pract. 2017;21:209-214.
- Wu JJ, Feldman SR, Koo J, et al. Epidemiology of mental health comorbidity in psoriasis. J Dermatolog Treat. 2018;29:487-495.
- Dowlatshahi EA, Wakkee M, Arends LR, et al. The prevalence and odds of depressive symptoms and clinical depression in psoriasis patients: a systematic review and meta-analysis. J Invest Dermatol. 2014;134:1542-1551.
- Gooderham M, Gavino-Velasco J, Clifford C, et al. A review of psoriasis, therapies, and suicide. J Cutan Med Surg. 2016;20:293-303.
- Shah K, Mellars L, Changolkar A, et al. Real-world burden of comorbidities in US patients with psoriasis. J Am Acad Dermatol. 2017;77:287-292.e4.
- Cohen BE, Martires KJ, Ho RS. Psoriasis and the risk of depression in the US population: National Health and Nutrition Examination Survey 2009-2012. JAMA Dermatol. 2016;152:73-79.
- Wu JJ, Penfold RB, Primatesta P, et al. The risk of depression, suicidal ideation and suicide attempt in patients with psoriasis, psoriatic arthritis or ankylosing spondylitis. J Eur Acad Dermatol Venereol. 2017;31:1168-1175.
- Pietrzak D, Pietrzak A, Krasowska D, et al. Depressiveness, measured with Beck Depression Inventory, in patients with psoriasis. J Affect Disord. 2017;209:229-234.
- Sator P. Safety and tolerability of adalimumab for the treatment of psoriasis: a review summarizing 15 years of real-life experience. Ther Adv Chronic Dis. 2018;9:147-158.
- Wu CY, Chang YT, Juan CK, et al. Depression and insomnia in patients with psoriasis and psoriatic arthritis taking tumor necrosis factor antagonists. Medicine (Baltimore). 2016;95:E3816.
- Gordon KB, Blauvelt A, Foley P, et al. Efficacy of guselkumab in subpopulations of patients with moderate-to-severe plaque psoriasis: a pooled analysis of the phase III VOYAGE 1 and VOYAGE 2 studies. Br J Dermatol. 2018;178:132-139.
- Strober B, Gooderham M, de Jong EMGJ, et al. Depressive symptoms, depression, and the effect of biologic therapy among patients in Psoriasis Longitudinal Assessment and Registry (PSOLAR). J Am Acad Dermatol. 2018;78:70-80.
- Griffiths CEM, Fava M, Miller AH, et al. Impact of ixekizumab treatment on depressive symptoms and systemic inflammation in patients with moderate-to-severe psoriasis: an integrated analysis of three phase 3 clinical studies. Psychother Psychosom. 2017;86:260-267.
- Salame N, Ehsani-Chimeh N, Armstrong AW. Comparison of mental health outcomes among adults with psoriasis on biologic versus oral therapies: a population-based study. J Dermatolog Treat. 2019;30:135-140.
- Strober BE, Langley RGB, Menter A, et al. No elevated risk for depression, anxiety or suicidality with secukinumab in a pooled analysis of data from 10 clinical studies in moderate-to-severe plaque psoriasis. Br J Dermatol. 2018;178:E105-E107.
- Kim SJ, Park MY, Pak K, et al. Improvement of depressive symptoms in patients with moderate-to-severe psoriasis treated with ustekinumab: an open label trial validated using Beck Depression Inventory, Hamilton Depression Rating scale measures and 18fluorodeoxyglucose (FDG) positron emission tomography (PET). J Dermatolog Treat. 2018;29:761-768.
- Lebwohl MG, Papp KA, Marangell LB, et al. Psychiatric adverse events during treatment with brodalumab: analysis of psoriasis clinical trials. J Am Acad Dermatol. 2018;78:81-89.e5.
- Papp KA, Reich K, Paul C, et al. A prospective phase III, randomized, double-blind, placebo-controlled study of brodalumab in patients with moderate-to-severe plaque psoriasis. Br J Dermatol. 2016;175:273-286.
- Feldman SR, Harris S, Rastogi S, et al. Distribution of depression and suicidality in a psoriasis clinical trial population. Poster presented at: Winter Clinical Dermatology Conference; January 12-17, 2018; Lahaina, HI.
- Gooderham M, Feldman SR, Harris S, et al. Effects of brodalumab on anxiety and depression in patients with psoriasis: results from a phase 3, randomized, controlled clinical trial (AMAGINE-1). Poster presented at: 76th Annual Meeting of the American Academy of Dermatology; February 16-20, 2018; San Diego, CA.
- Lebwohl M, Strober B, Menter A, et al. Phase 3 studies comparing brodalumab with ustekinumab in psoriasis. N Engl J Med. 2015;373:1318-1328.
- Siliq (brodalumab)[package insert]. Bridgewater, NJ: Bausch Health US, LLC; 2017.
- Zigmond AS, Snaith RP. The hospital anxiety and depression scale. Acta Psychiatr Scand. 1983;67:361-370.
- Hashim PW, Chen T, Lebwohl MG, et al. What lies beneath the face value of a box warning: a deeper look at brodalumab. J Drugs Dermatol. 2018;17:S29-S34.
- Roubille C, Richer V, Starnino T, et al. Evidence-based recommendations for the management of comorbidities in rheumatoid arthritis, psoriasis, and psoriatic arthritis: expert opinion of the Canadian Dermatology-Rheumatology Comorbidity Initiative. J Rheumatol. 2015;42:1767-1780.
- Takeshita J, Grewal S, Langan SM, et al. Psoriasis and comorbid diseases: implications for management. J Am Acad Dermatol. 2017;76:393-403.
- Gupta MA, Pur DR, Vujcic B, et al. Suicidal behaviors in the dermatology patient. Clin Dermatol. 2017;35:302-311.
- Wu JJ. Contemporary management of moderate to severe plaque psoriasis. Am J Manag Care. 2017;23(21 suppl):S403-S416.
- Manea L, Gilbody S, Hewitt C, et al. Identifying depression with the PHQ-2: a diagnostic meta-analysis. J Affect Disord. 2016;203:382-395.
- Kroenke K, Spitzer RL, Williams JB, et al. An ultra-brief screening scale for anxiety and depression: the PHQ-4. Psychosomatics. 2009;50:613-621.
- Lamb RC, Matcham F, Turner MA, et al. Screening for anxiety and depression in people with psoriasis: a cross-sectional study in a tertiary referral setting. Br J Dermatol. 2017;176:1028-1034.
- Dauden E, Blasco AJ, Bonanad C, et al. Position statement for the management of comorbidities in psoriasis. J Eur Acad Dermatol Venereol. 2018;32:2058-2073.
- Moon HS, Mizara A, McBride SR. Psoriasis and psycho-dermatology. Dermatol Ther (Heidelb). 2013;3:117-130.
Psoriasis is a chronic inflammatory skin disorder that affects patients’ quality of life and social interactions.1 Several studies have shown a strong consistent association between psoriasis and depression as well as possible suicidal ideation and behavior (SIB).1-13 Notable findings from a 2018 review found depression prevalence ranged from 2.1% to 33.7% among patients with psoriasis vs 0% to 22.7% among unaffected patients.7 In a 2017 meta-analysis, Singh et al2 found increased odds of SIB (odds ratio [OR], 2.05), attempted suicide (OR, 1.32), and completed suicide (OR, 1.20) in patients with psoriasis compared to those without psoriasis. In 2018, Wu and colleagues7 reported that odds of SIB among patients with psoriasis ranged from 1.01 to 1.94 times those of patients without psoriasis, and SIB and suicide attempts were more common than in patients with other dermatologic conditions. Koo and colleagues1 reached similar conclusions. At the same time, the occurrence of attempted and completed suicides among patients in psoriasis clinical trials has raised concerns about whether psoriasis medications also may increase the risk for SIB.7
We review research on the effects of psoriasis treatment on patients’ symptoms of depression and SIB, with a focus on recent analyses of depressive symptoms and SIB among patients with psoriasis who received brodalumab in clinical trials. Finally, we suggest approaches clinicians may consider when caring for patients with psoriasis who may be at risk for depression and SIB.
We reviewed research on the effects of biologic therapy for psoriasis on depression and SIB, with a primary focus on recent large meta-analyses. Published findings on the pattern of SIB in brodalumab clinical trials and effects of brodalumab treatment on symptoms of depression and anxiety are summarized. The most recent evidence (January 2014–December 2018) regarding the mental health comorbidities of psoriasis was assessed using published English-language research data and review articles according to a PubMed search of articles indexed for MEDLINE using the following terms: depression, anxiety, suicide, suicidal ideation and behavior, SIB, brodalumab, or psoriasis. We also reviewed citations within articles to identify relevant sources. Implications for clinical care of patients with psoriasis are discussed based on expert recommendations and the authors’ clinical experience.
RESULTS
Effects of Psoriasis Treatment on Symptoms of Depression and Suicidality
Occurrences of attempted suicide and completed suicide have been reported during treatment with several psoriasis medications,7,9 raising concerns about whether these medications increase the risk for depression and SIB in an already vulnerable population. Wu and colleagues7 reviewed 11 studies published from 2006 to 2017 reporting the effects of medications for the treatment of psoriasis—adalimumab, apremilast, brodalumab, etanercept, and ustekinumab—on measures of depression and anxiety such as the Beck Depression Inventory, the Hospital Anxiety and Depression Scale (HADS), and the Patient Health Questionnaire (PHQ) 8. In each of the 11 studies, symptoms of depression improved after treatment, over time, or compared to placebo. Notably, the magnitude of improvement in symptoms of depression was not strongly linked to the magnitude of clinical improvement.7 Other recent studies have reported reductions in symptoms of depression with biologic therapies, including adalimumab, etanercept, guselkumab, ixekizumab, secukinumab, and ustekinumab.14-21
With respect to suicidality, an analysis of publicly available data found low rates of completed and attempted suicides (point estimates of 0.0–0.15 per 100 patient-years) in clinical development programs of apremilast, brodalumab, ixekizumab, and secukinumab. Patient suicidality in these trials often occurred in the context of risk factors or stressors such as work, financial difficulties, depression, and substance abuse.7 In a detailed 2016 analysis of suicidal behaviors during clinical trials of apremilast, brodalumab, etanercept, infliximab, ixekizumab, secukinumab, tofacitinib, ustekinumab, and other investigational agents, Gooderham and colleagues9 concluded that the behaviors may have resulted from the disease or patients’ psychosocial status rather than from treatment and that treatment with biologics does not increase the risk for SIB. Improvements in symptoms of depression during treatment suggest the potential to improve patients’ psychiatric outcomes with biologic treatment.9
Evidence From Brodalumab Studies
Intensive efforts have been made to assess the effect of brodalumab, a fully human anti–IL-17RA monoclonal antibody shown to be efficacious in the treatment of moderate to severe plaque psoriasis, on symptoms of depression and to understand the incidence of SIB among patients receiving brodalumab in clinical trials.22-27
To examine the effects of brodalumab on symptoms of depression, the HADS questionnaire28 was administered to patients in 1 of 3 phase 3 clinical trials of brodalumab.23 A HADS score of 0 to 7 is considered normal, 8 to 10 is mild, 11 to 14 is moderate, and 15 to 21 is severe.23 The HADS questionnaire was administered to evaluate the presence and severity of depression and anxiety symptoms at baseline and at weeks 12, 24, 36, and 52.25 This scale was not used in the other 2 phase 3 studies of brodalumab because at the time those studies were initiated, there was no indication to include mental health screenings as part of the study protocol.
Patients were initially randomized to placebo (n=220), brodalumab 140 mg every 2 weeks (Q2W; n=219), or brodalumab 210 mg Q2W (the eventual approved dose; n=222) for 12 weeks.23 At week 12, patients initially randomized to placebo were switched to brodalumab through week 52. Patients initially randomized to brodalumab 210 mg Q2W were re-randomized to either placebo or brodalumab 210 mg Q2W.23 Depression and anxiety were common at baseline. Based on HADS scores, depression occurred among 27% and 26% of patients randomized to brodalumab and placebo, respectively; anxiety occurred in 36% of patients in each group.22 Among patients receiving brodalumab 210 mg Q2W from baseline to week 12, HADS depression scores improved in 67% of patients and worsened in 19%. In contrast, the proportion of patients receiving placebo whose depression scores improved (45%) was similar to the proportion whose scores worsened (38%). Hospital Anxiety and Depression Scale anxiety scores also improved more often with brodalumab than with placebo.22
Furthermore, among patients who had moderate or severe depression or anxiety at baseline, a greater percentage experienced improvement with brodalumab than placebo.23 Among 30 patients with moderate to severe HADS depression scores at baseline who were treated with brodalumab 210 mg Q2W, 22 (73%) improved by at least 1 depression category by week 12; in the placebo group, 10 of 22 (45%) improved. Among patients with moderate or severe anxiety scores, 28 of 42 patients (67%) treated with brodalumab 210 mg Q2W improved by at least 1 anxiety category compared to 8 of 27 (30%) placebo-treated patients.23
Over 52 weeks, HADS depression and anxiety scores continued to show a pattern of improvement among patients receiving brodalumab vs placebo.25 Among patients initially receiving placebo, mean HADS depression scores were unchanged from baseline (5.3) to week 12 (5.5). After patients were switched to brodalumab 210 mg Q2W, there was a trend toward improvement between week 12 (5.4) and week 52 (3.1). Among patients initially treated with brodalumab 210 mg Q2W, mean depression scores fell from baseline (5.5) to week 12 (3.4), then rose again between weeks 12 (2.9) and 52 (3.5) in patients switched to placebo (Figure, A). The pattern of findings was similar for HADS anxiety scores (Figure, B).25 Overall,
SIB in Studies of Brodalumab
In addition to assessing the effect of brodalumab treatment on symptoms of depression and anxiety in patients with psoriasis, the brodalumab clinical trial program also tracked patterns of SIB among enrolled patients. In contrast with other clinical trials in which patients with a history of psychiatric disorders or substance abuse were excluded, clinical trials of brodalumab did not exclude patients with psychiatric disorders (eg, SIB, depression) and were therefore reflective of the real-world population of patients with moderate to severe psoriasis.22
In a recently published, detailed analysis of psychiatric adverse events (AEs) in the brodalumab clinical trials, data related to SIB in patients with moderate to severe psoriasis were analyzed from the placebo-controlled phases and open-label, long-term extensions of a placebo-controlled phase 2 clinical trial and from the previously mentioned 3 phase 3 clinical trials.22 From the initiation of the clinical trial program, AEs were monitored during all trials. In response to completed suicides during some studies, additional SIB evaluations were later added at the request of the US Food and Drug Administration, including the Columbia Suicide Severity Rating Scale, the PHQ-8, and the Columbia Classification Algorithm for Suicide Assessment, to independently adjudicate SIB events.22
In total, 4464 patients in the brodalumab clinical trials received at least 1 dose of brodalumab, and 4126 of these patients received at least 1 dose of brodalumab 210 mg Q2W.22 Total exposure was 9174 patient-years of brodalumab, and mean exposure was 23 months. During the 52-week controlled phases of the clinical trials, 7 patients receiving brodalumab experienced any form of SIB event, representing a time-adjusted incidence rate of 0.20 events (95% confidence interval [CI], 0.08-0.41 events) per 100 patient-years of exposure. During the same 52-week period, patients receiving the comparator drug ustekinumab had an SIB rate of 0.60 events (95% CI, 0.12-1.74 events) per 100 patient-years, which was numerically higher than the rate with brodalumab. Inferential statistical analyses were not performed, but overlapping 95% CIs around these point estimates imply a similar level of SIB risk associated with each agent in these studies. During controlled and uncontrolled treatment periods in all studies, the SIB rate among brodalumab-treated patients was 0.37 events per 100 patient-years.22
Over all study phases, 3 completed suicides and 1 case adjudicated as indeterminate by the Columbia Classification Algorithm for Suicide Assessment review board were reported.22 All occurred in men aged 39 to 59 years. Of 6 patients with an AE of suicide attempt, all patients had at least 1 SIB risk factor and 3 had a history of SIB. The rate of SIB events was greater in patients with a history of depression (1.42) or suicidality (3.21) compared to those without any history of depression or suicidality (0.21 and 0.20, respectively).22 An examination of the regions in which the brodalumab studies were conducted showed generally consistent SIB incidence rates: 0.52, 0.29, 0.77, and 0 events per 100 patient-years in North America, Europe, Australia, and Russia, respectively.24
As previously described, depression and other risk factors for SIB are prevalent among patients with psoriasis. In addition, the rate of suicide mortality has increased substantially over the last decade in the general population, particularly among middle-aged white men,29 who made up much of the brodalumab clinical trial population.22 Therefore, even without treatment, it would not be surprising that SIB events occurred during the brodalumab trials. Most patients with SIB events during the trials had a history of predisposing risk factors.22 Prescribing information for brodalumab in the United States includes a boxed warning advising physicians to be aware of the risk of SIB as well as a statement that a causal relationship between SIB and brodalumab treatment has not been established.27
Despite the boxed warning in the brodalumab package insert concerning suicidality, a causal relationship between brodalumab treatment and increased risk of SIB has not been firmly established.27 The US boxed warning is based on 3 completed suicides and 1 case adjudicated as indeterminate among more than 4000 patients who received at least 1 dose of brodalumab during global clinical trials (0.07% [3/4464]). Compliance in the Risk Evaluation and Mitigation Strategy (REMS) program is mandatory, and patient screening and counseling should not be minimized.27 The 3 completed suicides occurred in patients who reported a history of financial stressors, legal difficulties, or depression and anxiety, and they occurred at least 140 days after initiation of treatment with brodalumab, a chronology that does not support a strong association between brodalumab exposure and SIB.22 Taking into consideration the increased risk for depression among individuals with psoriasis and the details surrounding the 3 completed suicides, an evidence-based causal relationship between brodalumab and increased risk for suicidality cannot be concluded. However, physicians must assess risks and benefits of any therapy in the context of the individual patient’s preferences, risk factors, and response to treatment.
Dermatologists who are aware of the comorbidity between psoriasis and mood disorders play an important role in evaluating patients with psoriasis for psychiatric risk factors.30-32 The dermatologist should discuss with patients the relationship between psoriasis and depression, assess for any history of depression and SIB, and evaluate for signs and symptoms of depression and current SIB.33 Screening tools, including the HADS or the short, easily administered PHQ-234 or PHQ-4,35 can be used to assess whether patients have symptoms of depression.1,36,37 Patients at risk for depression or SIB should be referred to their primary care physician or a mental health care practitioner.37 Currently, there is a gap in knowledge in screening patients for psychiatric issues within the dermatology community33,38; however, health care providers can give support to help bridge this gap.
Acknowledgments
This study was sponsored by Amgen Inc. Medical writing support was provided under the direction of the authors by Lisa Baker, PhD, and Rebecca E. Slager, PhD, of MedThink SciCom (Cary, North Carolina) and funded by Ortho Dermatologics, a division of Bausch Health US, LLC.
- Koo J, Marangell LB, Nakamura M, et al. Depression and suicidality in psoriasis: review of the literature including the cytokine theory of depression. J Eur Acad Dermatol Venereol. 2017;31:1999-2009.
- Singh S, Taylor C, Kornmehl H, et al. Psoriasis and suicidality: a systematic review and meta-analysis. J Am Acad Dermatol. 2017;77:425-440.e2.
- Chi CC, Chen TH, Wang SH, et al. Risk of suicidality in people with psoriasis: a systematic review and meta-analysis of cohort studies. Am J Clin Dermatol. 2017;18:621-627.
- Dalgard FJ, Gieler U, Tomas-Aragones L, et al. The psychological burden of skin diseases: a cross-sectional multicenter study among dermatological out-patients in 13 European countries. J Invest Dermatol. 2015;135:984-991.
- Pompili M, Innamorati M, Trovarelli S, et al. Suicide risk and psychiatric comorbidity in patients with psoriasis. J Int Med Res. 2016;44:61-66.
- Pompili M, Innamorati M, Forte A, et al. Psychiatric comorbidity and suicidal ideation in psoriasis, melanoma and allergic disorders. Int J Psychiatry Clin Pract. 2017;21:209-214.
- Wu JJ, Feldman SR, Koo J, et al. Epidemiology of mental health comorbidity in psoriasis. J Dermatolog Treat. 2018;29:487-495.
- Dowlatshahi EA, Wakkee M, Arends LR, et al. The prevalence and odds of depressive symptoms and clinical depression in psoriasis patients: a systematic review and meta-analysis. J Invest Dermatol. 2014;134:1542-1551.
- Gooderham M, Gavino-Velasco J, Clifford C, et al. A review of psoriasis, therapies, and suicide. J Cutan Med Surg. 2016;20:293-303.
- Shah K, Mellars L, Changolkar A, et al. Real-world burden of comorbidities in US patients with psoriasis. J Am Acad Dermatol. 2017;77:287-292.e4.
- Cohen BE, Martires KJ, Ho RS. Psoriasis and the risk of depression in the US population: National Health and Nutrition Examination Survey 2009-2012. JAMA Dermatol. 2016;152:73-79.
- Wu JJ, Penfold RB, Primatesta P, et al. The risk of depression, suicidal ideation and suicide attempt in patients with psoriasis, psoriatic arthritis or ankylosing spondylitis. J Eur Acad Dermatol Venereol. 2017;31:1168-1175.
- Pietrzak D, Pietrzak A, Krasowska D, et al. Depressiveness, measured with Beck Depression Inventory, in patients with psoriasis. J Affect Disord. 2017;209:229-234.
- Sator P. Safety and tolerability of adalimumab for the treatment of psoriasis: a review summarizing 15 years of real-life experience. Ther Adv Chronic Dis. 2018;9:147-158.
- Wu CY, Chang YT, Juan CK, et al. Depression and insomnia in patients with psoriasis and psoriatic arthritis taking tumor necrosis factor antagonists. Medicine (Baltimore). 2016;95:E3816.
- Gordon KB, Blauvelt A, Foley P, et al. Efficacy of guselkumab in subpopulations of patients with moderate-to-severe plaque psoriasis: a pooled analysis of the phase III VOYAGE 1 and VOYAGE 2 studies. Br J Dermatol. 2018;178:132-139.
- Strober B, Gooderham M, de Jong EMGJ, et al. Depressive symptoms, depression, and the effect of biologic therapy among patients in Psoriasis Longitudinal Assessment and Registry (PSOLAR). J Am Acad Dermatol. 2018;78:70-80.
- Griffiths CEM, Fava M, Miller AH, et al. Impact of ixekizumab treatment on depressive symptoms and systemic inflammation in patients with moderate-to-severe psoriasis: an integrated analysis of three phase 3 clinical studies. Psychother Psychosom. 2017;86:260-267.
- Salame N, Ehsani-Chimeh N, Armstrong AW. Comparison of mental health outcomes among adults with psoriasis on biologic versus oral therapies: a population-based study. J Dermatolog Treat. 2019;30:135-140.
- Strober BE, Langley RGB, Menter A, et al. No elevated risk for depression, anxiety or suicidality with secukinumab in a pooled analysis of data from 10 clinical studies in moderate-to-severe plaque psoriasis. Br J Dermatol. 2018;178:E105-E107.
- Kim SJ, Park MY, Pak K, et al. Improvement of depressive symptoms in patients with moderate-to-severe psoriasis treated with ustekinumab: an open label trial validated using Beck Depression Inventory, Hamilton Depression Rating scale measures and 18fluorodeoxyglucose (FDG) positron emission tomography (PET). J Dermatolog Treat. 2018;29:761-768.
- Lebwohl MG, Papp KA, Marangell LB, et al. Psychiatric adverse events during treatment with brodalumab: analysis of psoriasis clinical trials. J Am Acad Dermatol. 2018;78:81-89.e5.
- Papp KA, Reich K, Paul C, et al. A prospective phase III, randomized, double-blind, placebo-controlled study of brodalumab in patients with moderate-to-severe plaque psoriasis. Br J Dermatol. 2016;175:273-286.
- Feldman SR, Harris S, Rastogi S, et al. Distribution of depression and suicidality in a psoriasis clinical trial population. Poster presented at: Winter Clinical Dermatology Conference; January 12-17, 2018; Lahaina, HI.
- Gooderham M, Feldman SR, Harris S, et al. Effects of brodalumab on anxiety and depression in patients with psoriasis: results from a phase 3, randomized, controlled clinical trial (AMAGINE-1). Poster presented at: 76th Annual Meeting of the American Academy of Dermatology; February 16-20, 2018; San Diego, CA.
- Lebwohl M, Strober B, Menter A, et al. Phase 3 studies comparing brodalumab with ustekinumab in psoriasis. N Engl J Med. 2015;373:1318-1328.
- Siliq (brodalumab)[package insert]. Bridgewater, NJ: Bausch Health US, LLC; 2017.
- Zigmond AS, Snaith RP. The hospital anxiety and depression scale. Acta Psychiatr Scand. 1983;67:361-370.
- Hashim PW, Chen T, Lebwohl MG, et al. What lies beneath the face value of a box warning: a deeper look at brodalumab. J Drugs Dermatol. 2018;17:S29-S34.
- Roubille C, Richer V, Starnino T, et al. Evidence-based recommendations for the management of comorbidities in rheumatoid arthritis, psoriasis, and psoriatic arthritis: expert opinion of the Canadian Dermatology-Rheumatology Comorbidity Initiative. J Rheumatol. 2015;42:1767-1780.
- Takeshita J, Grewal S, Langan SM, et al. Psoriasis and comorbid diseases: implications for management. J Am Acad Dermatol. 2017;76:393-403.
- Gupta MA, Pur DR, Vujcic B, et al. Suicidal behaviors in the dermatology patient. Clin Dermatol. 2017;35:302-311.
- Wu JJ. Contemporary management of moderate to severe plaque psoriasis. Am J Manag Care. 2017;23(21 suppl):S403-S416.
- Manea L, Gilbody S, Hewitt C, et al. Identifying depression with the PHQ-2: a diagnostic meta-analysis. J Affect Disord. 2016;203:382-395.
- Kroenke K, Spitzer RL, Williams JB, et al. An ultra-brief screening scale for anxiety and depression: the PHQ-4. Psychosomatics. 2009;50:613-621.
- Lamb RC, Matcham F, Turner MA, et al. Screening for anxiety and depression in people with psoriasis: a cross-sectional study in a tertiary referral setting. Br J Dermatol. 2017;176:1028-1034.
- Dauden E, Blasco AJ, Bonanad C, et al. Position statement for the management of comorbidities in psoriasis. J Eur Acad Dermatol Venereol. 2018;32:2058-2073.
- Moon HS, Mizara A, McBride SR. Psoriasis and psycho-dermatology. Dermatol Ther (Heidelb). 2013;3:117-130.
Practice Points
- Psoriasis elevates the risk for depression and possible suicide.
- Dermatologists should be aware that the brodalumab package insert has a boxed warning stating that there is no established causal association between treatment with brodalumab and increased risk for suicidal ideation and behavior.
- Clinicians are urged to evaluate patients with psoriasis for psychiatric risk factors regardless of their therapy.

What’s Eating You? Blister Beetles Revisited
Classification
Blister beetles are both a scourge and the source of medical cantharidin (Figure 1). The term blister beetle refers to 3 families of the order Coleoptera: Meloidae, Oedemeridae, and Staphylinidae (Figure 2).
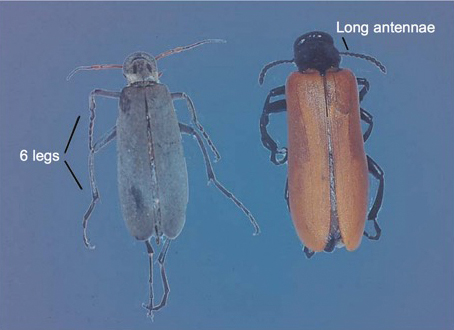
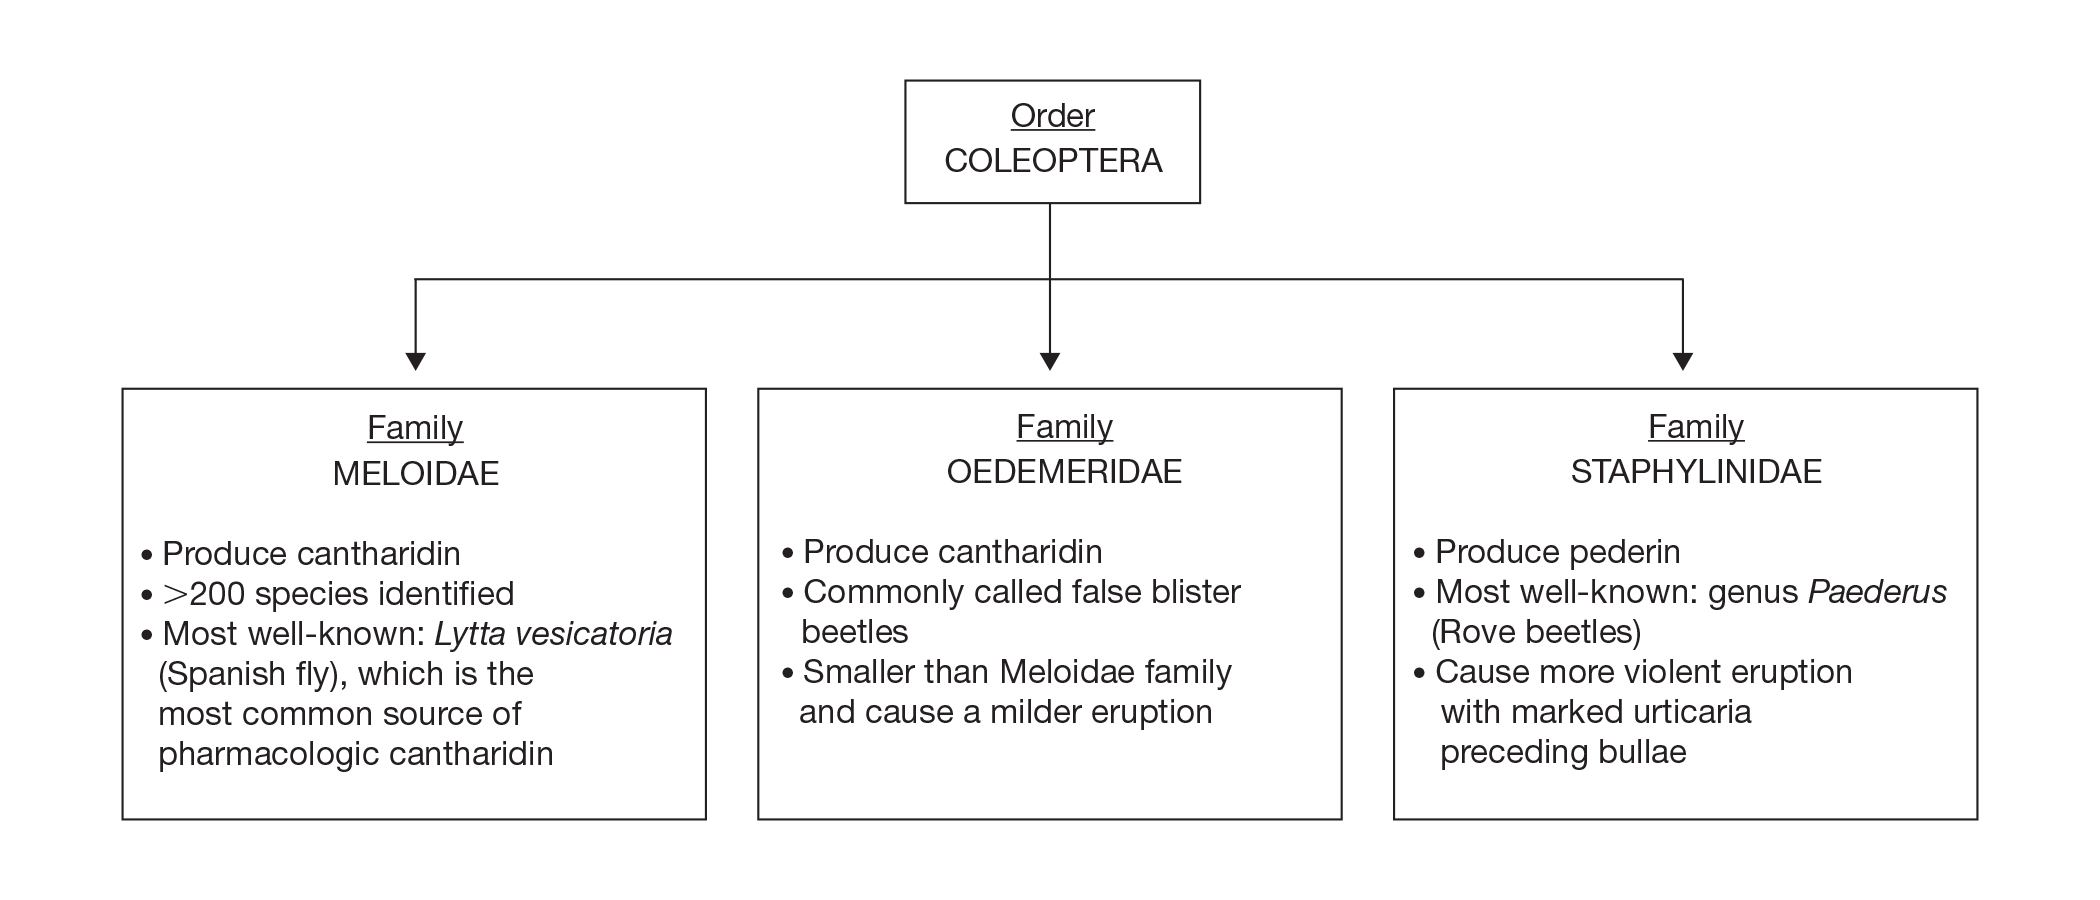
Meloidae is the most well-known family of blister beetles, with more than 200 species worldwide identified as a cause of blistering dermatitis.1 The most notorious is Lytta vesicatoria, also known as the Spanish fly. Although some blister beetles are inconspicuous in appearance, most are brightly colored and easily spotted, making them attractive to small children.2 They may be attracted to fluorescent lighting and commonly enter through open windows.3 Blister beetles do not bite or sting; rather, they release cantharidin via hemolymph, an oily yellow substance that is copiously expressed from the leg joints when disturbed by rubbing or pressing.1,3-5 Blistering also is associated with exposure to the contents of crushed beetles, which is the source of pharmacologic cantharidin.2,4,6
Oedemeridae are the smallest and least known beetles within the Coleoptera family. They often are called false blister beetles, which is a misnomer. Oedemeridae beetles also produce cantharidin, similar to Meloidae beetles; however, because Oedemeridae beetles are smaller, the vesiculobullous eruptions also are less pronounced.1
A third well-known family of blister beetles is the Staphylinidae family. Rove beetles (genus Paederus) differ from the Meloidae and Oedemeridae families in that they produce the vesicant pederin rather than cantharidin. Pederin causes a more violent eruption called dermatitis linearis, which often is associated with intense urticaria prior to blistering.1 Rove beetles are found in moist environments and tend to favor tropical and subtropical climates. They may emerge in large numbers after heavy rainfall.
Clinical Presentation
Blistering dermatitis—caused by exposure to cantharidin (families Meloidae and Oedemeridae) or pederin (genus Paederus)—begins as burning and tingling within minutes of exposure. Bullae later develop, often in a linear fashion, with subsequent bursting and crust formation.1,3 Secondary infection can occur.5 Exposure occurring on the elbows, knees, or mirroring skin folds results in lesions on opposing surfaces that come into contact, otherwise known as kissing lesions.1,3 Acantholysis of suprabasal keratinocytes can be seen on histologic sections of blisters (Figure 3)1,7 due to cantharidin activation of the serine/threonine protein phosphatases that cause detachment of tonofilaments from desmosomes.1,8 Washing of exposed sites with soap or alcohol can potentially prevent development of blistering dermatitis; however, lesions usually heal without complication when treated with topical antibiotics.3
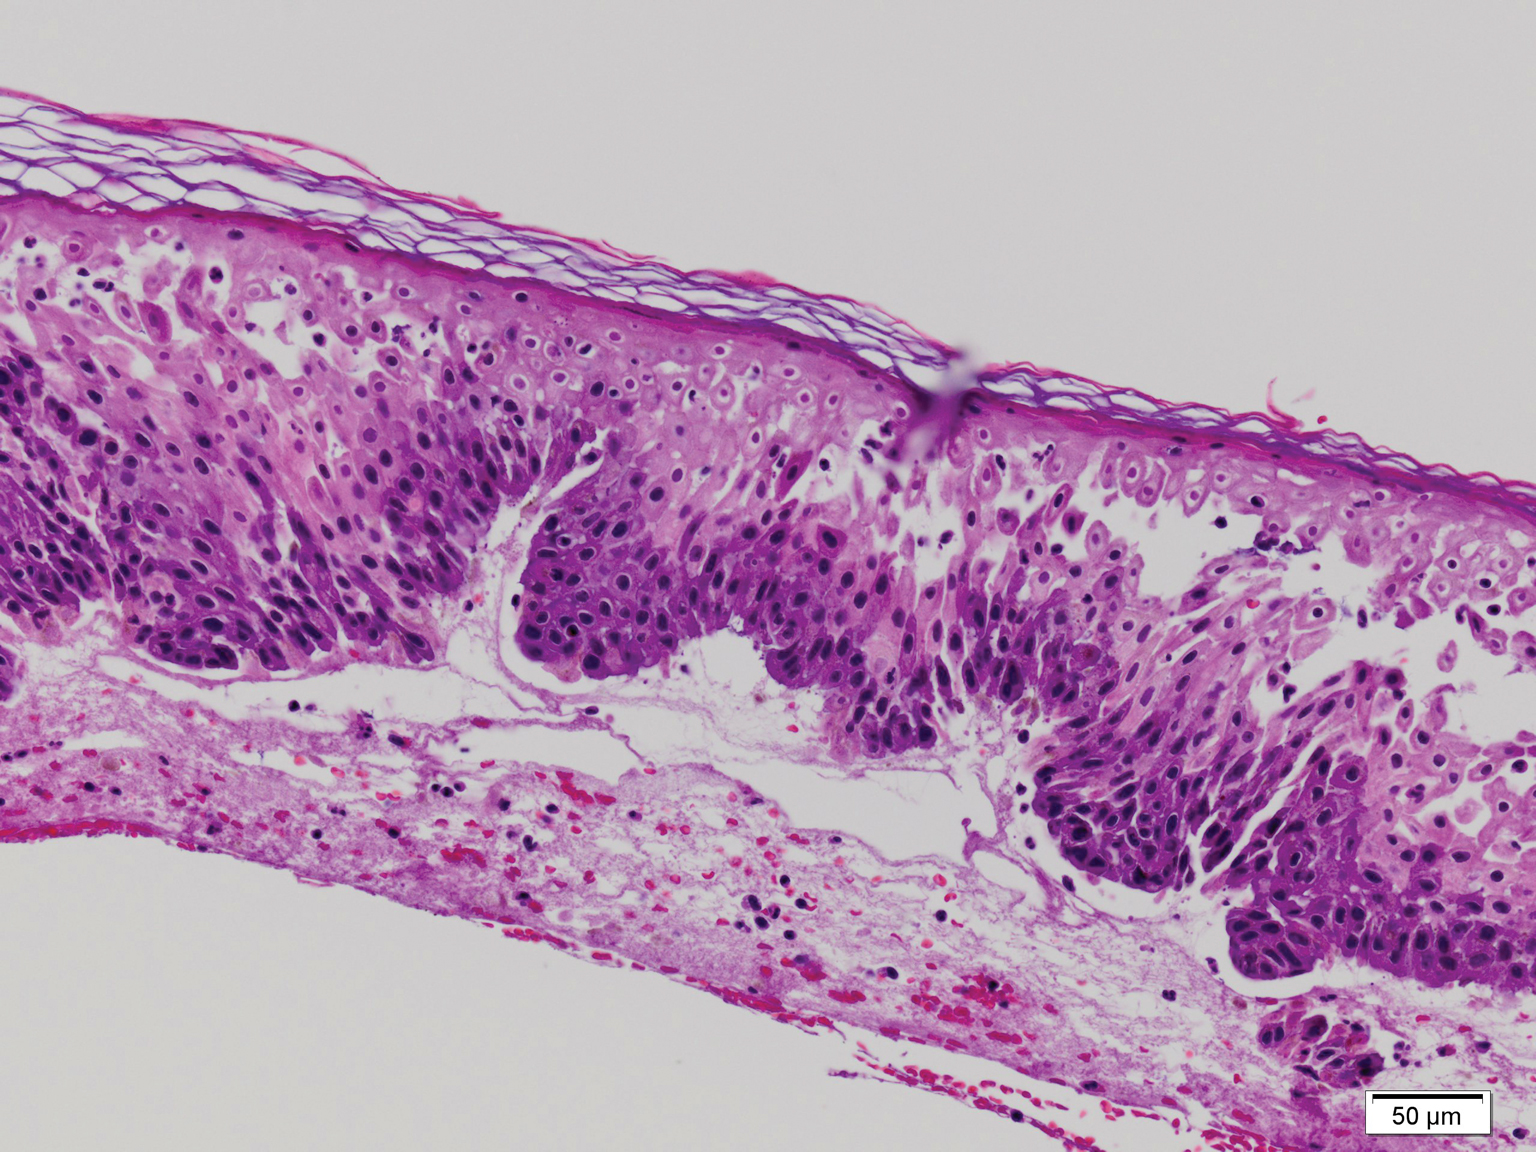
If blister beetles are ingested, they can cause poisoning characterized by abdominal pain and hematuria.1,3,9,10 In fact, blister beetle ingestion by animals consuming baled hay is an important agricultural and economical implication. Several cases of fatal farm animal ingestion resulting in gastrointestinal erosion have been reported.4,6
Medicinal Properties
Medicinal use of cantharidin has been recorded as early as the 19th century and is believed to have been part of ancient medicinal practices in China, Spain, South Africa, and pre-Columbian America for its vesicant, abortifacient, and supposed aphrodisiac properties.2,4,8
Toxicity from internal ingestion has been well documented.1,3,9,10 The Mylabris and Epicauta genera of the family Meloidae, most commonly the Spanish fly, are used for modern extraction of cantharidin. Up to 5% of the dry weight of a blister beetle can be constituted by cantharidin.4
Although its use has diminished due to limited availability, cantharidin is still used for treatment of common warts, periungual warts, and molluscum contagiosum. It is a favorable choice for treating pediatric patients because of the tolerability and painlessness of application. Due to its acantholytic properties, warts generally slough with the cantharidin-induced blister.11
In recent years, cantharidin has been studied for its anticancer properties. It has been shown to weaken cancer cell antioxidant properties by interfering with glutathione-related enzymes, thus inducing oxidative damage. Additionally, cantharidin is associated with decreased mitochondrial cytochrome C and increased cytosolic cytochrome C, an important signal for apoptosis.12 Furthermore, cantharidin recently was shown to increase expression of proapoptotic proteins and decrease expression of antiapoptotic proteins causing cell death in nasopharyngeal carcinoma, making it a potential anticancer treatment.13
Conclusion
Blister beetles, long known for their production of vesicant agents, are both a cause of as well as a potential treatment of dermatologic disease. The blistering associated with exposure to a disturbed beetle generally is mild and heals without scarring if vital areas such as the eyelids are not affected.
- Nicholls DS, Christmas TI, Greig DE. Oedemerid blister beetle dermatosis: a review. J Am Acad Dermatol. 1990;22:815-819.
- Percino-Daniel N, Buckley D, García-París M. Pharmacological properties of blister beetles (Coleoptera: Meloidae) promoted their integration into the cultural heritage of native rural Spain as inferred by vernacular names diversity, traditions, and mitochondrial DNA. J Ethnopharmacol. 2013;147:570-583.
- James WD, Berger TG, Elston DM. Parasitic infestations, stings, and bites. In: James WD, Berger TG, Elston DM, eds. Andrew’s Diseases of the Skin: Clinical Dermatology. 12th ed. Philadelphia, PA: Elsevier; 2016:418-450.
- Selander RB, Fasulo TR. Featured creatures: blister beetles. University of Florida/IFAS Entomology and Nematology website. http://entnemdept.ufl.edu/creatures/urban/medical/blister_beetles.htm. Published October 2000. Revised September 2010. Accessed November 12, 2019.
- Wijerathne BTB. Blister mystery. Wilderness Environ Med. 2017;28:271-272.
- Penrith ML, Naude TW. Mortality in chickens associated with blister beetle consumption. J S Afr Vet Assoc. 1996;67:97-99.
- Yell JA, Burge SM, Dean D. Cantharidin-induced acantholysis: adhesion molecules, proteases, and related proteins. Br J Dermatol. 1994;130:148-157.
- Honkanen RE. Cantharidin, another natural toxin that inhibits the activity of serine-threonine protein phosphatases types 1 and 2a. FEBS Letters. 1993;330:283-286.
- Al-Binali AM, Shabana M, Al-Fifi S, et al. Cantharidin poisoning due to blister beetle ingestion in children: two case reports and a review of clinical presentations. Sultan Qaboos Univ Med J. 2010;10:258-261.
- Tagwireyi D, Ball DE, Loga PJ, et al. Cantharidin poisoning due to “blister beetle” ingestion. Toxicon. 2000;38:1865-1869.
- Al-Dawsari NA, Masterpol KS. Cantharidin in dermatology. Skinmed. 2016;14:111-114.
- Verma AK, Prasad SB. Changes in glutathione, oxidative stress and mitochondrial membrane potential in apoptosis involving the anticancer activity of cantharidin isolated from redheaded blister beetles, epicauta hirticornis. Anticancer Agents Med Chem. 2013;13:1096-1114.
- Chen AW, Tseng YS, Lin CC, et al. Norcantharidin induce apoptosis in human nasopharyngeal carcinoma through caspase and mitochondrial pathway. Environ Toxicol. 2018;33:343-350.
Classification
Blister beetles are both a scourge and the source of medical cantharidin (Figure 1). The term blister beetle refers to 3 families of the order Coleoptera: Meloidae, Oedemeridae, and Staphylinidae (Figure 2).
Meloidae is the most well-known family of blister beetles, with more than 200 species worldwide identified as a cause of blistering dermatitis.1 The most notorious is Lytta vesicatoria, also known as the Spanish fly. Although some blister beetles are inconspicuous in appearance, most are brightly colored and easily spotted, making them attractive to small children.2 They may be attracted to fluorescent lighting and commonly enter through open windows.3 Blister beetles do not bite or sting; rather, they release cantharidin via hemolymph, an oily yellow substance that is copiously expressed from the leg joints when disturbed by rubbing or pressing.1,3-5 Blistering also is associated with exposure to the contents of crushed beetles, which is the source of pharmacologic cantharidin.2,4,6
Oedemeridae are the smallest and least known beetles within the Coleoptera family. They often are called false blister beetles, which is a misnomer. Oedemeridae beetles also produce cantharidin, similar to Meloidae beetles; however, because Oedemeridae beetles are smaller, the vesiculobullous eruptions also are less pronounced.1
A third well-known family of blister beetles is the Staphylinidae family. Rove beetles (genus Paederus) differ from the Meloidae and Oedemeridae families in that they produce the vesicant pederin rather than cantharidin. Pederin causes a more violent eruption called dermatitis linearis, which often is associated with intense urticaria prior to blistering.1 Rove beetles are found in moist environments and tend to favor tropical and subtropical climates. They may emerge in large numbers after heavy rainfall.
Clinical Presentation
Blistering dermatitis—caused by exposure to cantharidin (families Meloidae and Oedemeridae) or pederin (genus Paederus)—begins as burning and tingling within minutes of exposure. Bullae later develop, often in a linear fashion, with subsequent bursting and crust formation.1,3 Secondary infection can occur.5 Exposure occurring on the elbows, knees, or mirroring skin folds results in lesions on opposing surfaces that come into contact, otherwise known as kissing lesions.1,3 Acantholysis of suprabasal keratinocytes can be seen on histologic sections of blisters (Figure 3)1,7 due to cantharidin activation of the serine/threonine protein phosphatases that cause detachment of tonofilaments from desmosomes.1,8 Washing of exposed sites with soap or alcohol can potentially prevent development of blistering dermatitis; however, lesions usually heal without complication when treated with topical antibiotics.3
If blister beetles are ingested, they can cause poisoning characterized by abdominal pain and hematuria.1,3,9,10 In fact, blister beetle ingestion by animals consuming baled hay is an important agricultural and economical implication. Several cases of fatal farm animal ingestion resulting in gastrointestinal erosion have been reported.4,6
Medicinal Properties
Medicinal use of cantharidin has been recorded as early as the 19th century and is believed to have been part of ancient medicinal practices in China, Spain, South Africa, and pre-Columbian America for its vesicant, abortifacient, and supposed aphrodisiac properties.2,4,8
Toxicity from internal ingestion has been well documented.1,3,9,10 The Mylabris and Epicauta genera of the family Meloidae, most commonly the Spanish fly, are used for modern extraction of cantharidin. Up to 5% of the dry weight of a blister beetle can be constituted by cantharidin.4
Although its use has diminished due to limited availability, cantharidin is still used for treatment of common warts, periungual warts, and molluscum contagiosum. It is a favorable choice for treating pediatric patients because of the tolerability and painlessness of application. Due to its acantholytic properties, warts generally slough with the cantharidin-induced blister.11
In recent years, cantharidin has been studied for its anticancer properties. It has been shown to weaken cancer cell antioxidant properties by interfering with glutathione-related enzymes, thus inducing oxidative damage. Additionally, cantharidin is associated with decreased mitochondrial cytochrome C and increased cytosolic cytochrome C, an important signal for apoptosis.12 Furthermore, cantharidin recently was shown to increase expression of proapoptotic proteins and decrease expression of antiapoptotic proteins causing cell death in nasopharyngeal carcinoma, making it a potential anticancer treatment.13
Conclusion
Blister beetles, long known for their production of vesicant agents, are both a cause of as well as a potential treatment of dermatologic disease. The blistering associated with exposure to a disturbed beetle generally is mild and heals without scarring if vital areas such as the eyelids are not affected.
- Nicholls DS, Christmas TI, Greig DE. Oedemerid blister beetle dermatosis: a review. J Am Acad Dermatol. 1990;22:815-819.
- Percino-Daniel N, Buckley D, García-París M. Pharmacological properties of blister beetles (Coleoptera: Meloidae) promoted their integration into the cultural heritage of native rural Spain as inferred by vernacular names diversity, traditions, and mitochondrial DNA. J Ethnopharmacol. 2013;147:570-583.
- James WD, Berger TG, Elston DM. Parasitic infestations, stings, and bites. In: James WD, Berger TG, Elston DM, eds. Andrew’s Diseases of the Skin: Clinical Dermatology. 12th ed. Philadelphia, PA: Elsevier; 2016:418-450.
- Selander RB, Fasulo TR. Featured creatures: blister beetles. University of Florida/IFAS Entomology and Nematology website. http://entnemdept.ufl.edu/creatures/urban/medical/blister_beetles.htm. Published October 2000. Revised September 2010. Accessed November 12, 2019.
- Wijerathne BTB. Blister mystery. Wilderness Environ Med. 2017;28:271-272.
- Penrith ML, Naude TW. Mortality in chickens associated with blister beetle consumption. J S Afr Vet Assoc. 1996;67:97-99.
- Yell JA, Burge SM, Dean D. Cantharidin-induced acantholysis: adhesion molecules, proteases, and related proteins. Br J Dermatol. 1994;130:148-157.
- Honkanen RE. Cantharidin, another natural toxin that inhibits the activity of serine-threonine protein phosphatases types 1 and 2a. FEBS Letters. 1993;330:283-286.
- Al-Binali AM, Shabana M, Al-Fifi S, et al. Cantharidin poisoning due to blister beetle ingestion in children: two case reports and a review of clinical presentations. Sultan Qaboos Univ Med J. 2010;10:258-261.
- Tagwireyi D, Ball DE, Loga PJ, et al. Cantharidin poisoning due to “blister beetle” ingestion. Toxicon. 2000;38:1865-1869.
- Al-Dawsari NA, Masterpol KS. Cantharidin in dermatology. Skinmed. 2016;14:111-114.
- Verma AK, Prasad SB. Changes in glutathione, oxidative stress and mitochondrial membrane potential in apoptosis involving the anticancer activity of cantharidin isolated from redheaded blister beetles, epicauta hirticornis. Anticancer Agents Med Chem. 2013;13:1096-1114.
- Chen AW, Tseng YS, Lin CC, et al. Norcantharidin induce apoptosis in human nasopharyngeal carcinoma through caspase and mitochondrial pathway. Environ Toxicol. 2018;33:343-350.
Practice Points
- Exposure to cantharidin presents initially with burning and tingling before progressing to bullae formation, sometimes in a linear fashion. Rupture of bullae and crust formation can occur.
- Washing of the exposed skin with soap and water may prevent development of blistering dermatitis.
- Clinical use of cantharidin is favorable in treating pediatric patients with common warts and molluscum contagiosum due to tolerability and painlessness of application.