User login
Global Polio Vaccine “Switch” a Success
Type 2 circulating vaccine-derived polioviruses (cVDPV) have caused hundreds of cases of paralytic poliomyelitis and now accounts for > 94% of polio cases since 2006. To address cVDPV and the risk of vaccine-derived polioviruses, the World Health Organization (WHO) scheduled the type 2 component of oral poliovirus vaccine (OPV) for global withdrawal and planned a synchronized switch from trivalent oral poliovirus vaccine (tOPV) to bivalent oral poliovirus vaccine (bOPV), which only types 1 and 3 attenuated polioviruses. The switch is one step in the WHO Polio Eradication and Endgame Strategic Plan 2013-2018, which describes specific steps to take to successfully achieve eradication.
Related: Comparing Pneumococcal Vaccines
The 155 countries and territories that used OPV in immunization programs now report that they completely stopped using tOPV in May 2016. (All manufacturers of OPV ended production of tOPV before the switch.) All countries not already using inactivated polio vaccine (IPV) have committed to introducing it. As of August 2016, 173 of 194 WHO countries introduced IPV into their immunization programs—despite a global shortage of IPV.
According to the CDC, the global cooperation in stopping tOPV use has gone smoothly and is, in fact, “unprecedented.” Although this represents a milestone in the effort to eradicate polio, the CDC warns that vigilance is still needed. For example, clinicians should destroy any remaining tOPV found in a vaccine storage refrigerator or freezer. All remaining type 2 polioviruses, including type 2 wild poliovirus, type 2 vaccine-derived polioviruses, and the type 2 Sabin polioviruses used in tOPV and monovalent OPV type 2, also should be destroyed or appropriately contained in certified poliovirus-essential facilities.
Related: Can Hepatitis B and C Be Eliminated?
If type 2 poliovirus outbreaks occur, the United Nations Children’s Fund has a global stockpile of approximately 36 million doses of monovalent OPV type 2, with 100 million more to become available soon. Hundreds of millions of doses stored in bulk form also are available for conversion, the CDC says.
Ultimately, the CDC claims that it will not know how well the process went until it knows the number of polio cases caused by cVDPV2s that arise after the tOPV withdrawal, “with fewer cases indicating a greater success.” As of August 31, 2016, no new cVDPV outbreaks have been identified in 2016.
Development of Bullous Pemphigoid in a Patient With Psoriasis and Metabolic Syndrome
Bullous pemphigoid (BP) is an autoimmune subepidermal blistering disease.1 The majority of BP cases are idiopathic and occur in patients older than 60 years. The disease is characterized by the development of circulating IgG autoantibodies reacting with the BP180 antigen of the basement membrane zone.1 Psoriasis vulgaris (PV) is a common, chronic, immune-mediated disease affecting approximately 2% of the world’s population including children and adults.2 Both entities may coexist with internal disorders such as hypertension, diabetes mellitus, coronary heart disease, congestive heart failure, hyperlipidemia, and cerebrovascular accident. It has been postulated that BP more often coexists with neurological disorders, such as stroke and Parkinson disease,3 whereas PV usually is associated with cardiovascular disorders and diabetes mellitus.2 We report the case of a 35-year-old man with chronic PV and metabolic syndrome who developed BP that was successfully treated with methotrexate (MTX).
Case Report
A 35-year-old man with a 15-year history of PV, class 3 obesity (body mass index, 69.2), and thrombosis of the left leg was referred to the dermatology department due to a sudden extensive erythematous and bullous eruption located on the trunk, arms, and legs with involvement of the oral mucosa that had started 4 weeks prior. The skin lesions were accompanied by severe pruritus. On admission to the hospital, the patient presented with stable psoriatic plaques located on the trunk, arms, and proximal part of the lower legs with a psoriasis area severity index score of 11.8 (Figure 1A). He also had disseminated tense blisters and erosions partially arranged in an annular pattern located on the border of the psoriatic plaques as well as on an erythematous base or within unaffected skin (Figure 1B). Additionally, a few small erosions were present on the oral mucosa.
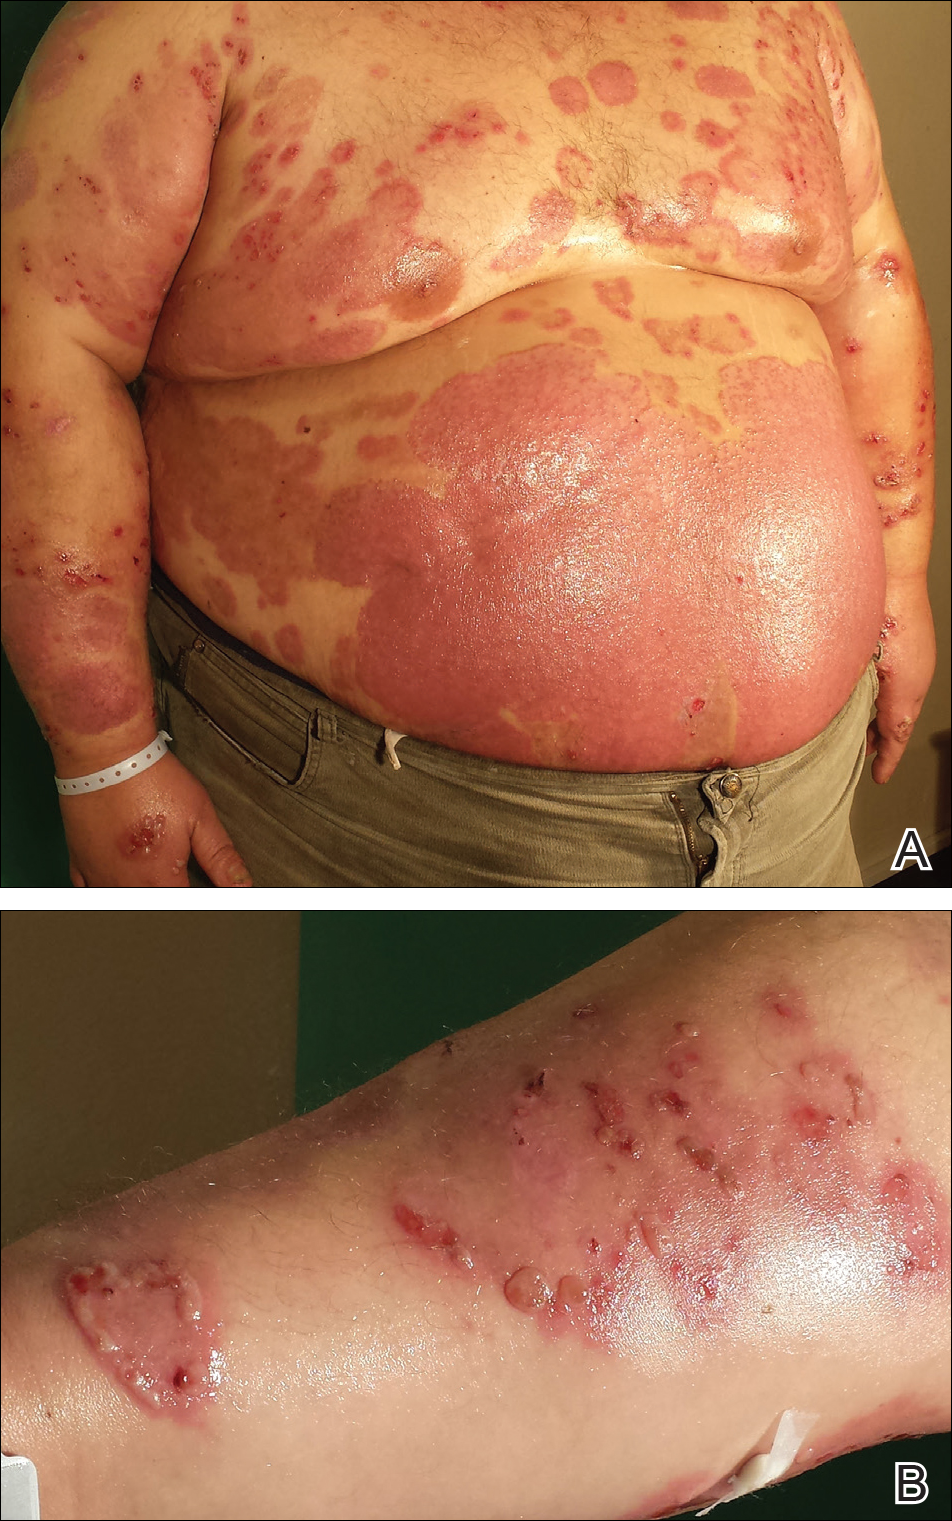
The patient’s father had a history of PV, but there was no family history of obesity or autoimmune blistering disorders. On physical examination, central obesity was noted with a waist circumference of 180 cm and a body mass index of 69.2; his blood pressure was 220/150 mm Hg. Laboratory tests revealed leukocytosis (20.06×10⁹/L [reference range, 4.5–11.0×10⁹/L]) with neutrophilia (16.2×10⁹/L [reference range, 1.6–7.6×10⁹/L]; 80.9% [reference range, 40.0%–70.0%]), eosinophilia (1.01×10⁹/L [reference range, 0–0.5×10⁹/L]), elevated C-reactive protein levels (49.4 mg/L [reference range, 0.0–9.0 mg/L]), elevated erythrocyte sedimentation rate (35 mm/h [reference range, 0–12 mm/h]), elevated γ-glutamyltransferase (66 U/L [reference range, 0–55 U/L]), decreased high-density lipoprotein levels (38 mg/dL [reference range, ≥40 mg/dL]), elevated fasting plasma glucose (116 mg/dL or 6.4 mmol/L [reference range, 70–99 mg/dL or 3.9–5.5 mmol/L]), elevated total IgE (1540 µg/L [reference range, 0–1000 µg/L]), elevated D-dimer (3.21 µg/mL [reference range, <0.5 µg/mL]), and low free triiodothyronine levels (130 pg/dL [reference range, 171–371 pg/dL]). The total protein level was 6.5 g/dL (reference range, 6.0–8.0 g/dL) and albumin level was 3.2 g/dL (reference range, 4.02–4.76 g/dL). A chest radiograph showed no abnormalities.
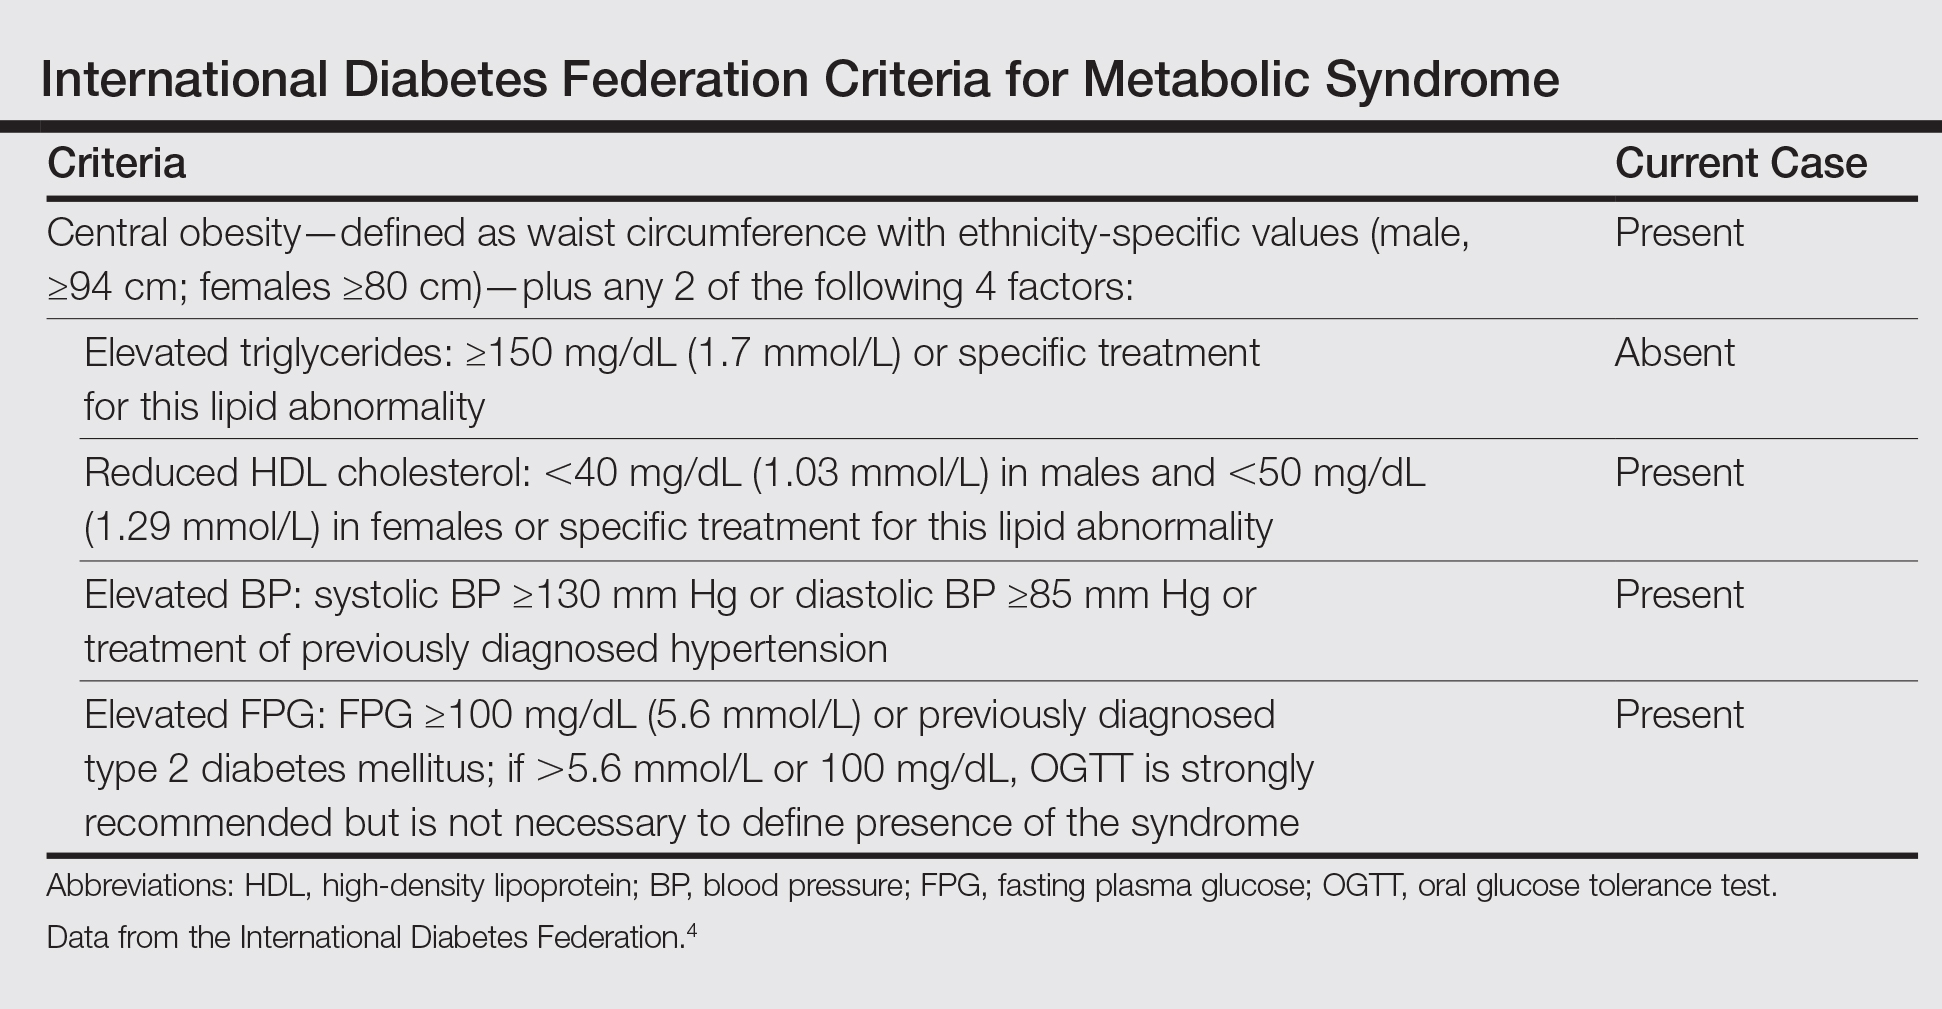
Based on the physical examination and laboratory testing, it was determined that the patient fulfilled 4 of 5 criteria for metabolic syndrome described by the International Diabetes Federation in 2006 (Table).4 Direct immunofluorescence performed on normal-appearing perilesional skin demonstrated linear IgG and C3 deposits along the basement membrane zone. Indirect immunofluorescence detected circulating IgG autoantibodies at a titer of 1:80. Serum studies using biochip mosaics5 revealed the reactivity of circulating IgG antibodies to the epidermal side of salt-split skin and with antigen dots of tetrameric BP180-NC16a, which prompted the diagnosis of BP (Figure 2).

Oral treatment with MTX 12.5 mg once weekly with clobetasol propionate cream applied to affected skin was initiated for 4 weeks. The PV resolved completely and blister formation stopped. A few weeks later BP reappeared, even though the patient was still taking MTX. The treatment failure may have been related to the patient’s class 3 obesity; therefore, the dose was increased to 20 mg once weekly for 8 weeks, which led to rapid healing of BP erosions. The patient was monitored for 2 months with no symptoms of recurrence.
Comment
Psoriasis Comorbidities
The correlation between PV and cardiovascular disorders such as myocardial infarction, cerebrovascular accident, and pulmonary embolism has been well established and is widely accepted.2 It also has been documented that the risk for metabolic syndrome with components such as diabetes mellitus, hypertension, lipid abnormalities, obesity, and arteriosclerosis is notably increased in PV patients.6 Moreover, associated internal disorders are responsible for a 3- to 4-year reduction in life expectancy in patients with moderate to severe PV.7
Correlation of PV and BP
Psoriasis also may coexist with autoimmune disorders such as rheumatoid arthritis, lupus erythematosus, and blistering disorders.8 There are more than 60 known cases reporting PV in association with various types of subepidermal blistering diseases, including pemphigus vulgaris, epidermolysis bullosa acquisita, anti-p200 pemphigoid, and BP.8,9 The pathogenetic relationship between BP and PV remains obscure. In most published cases, PV preceded BP by 5 to 30 years, possibly ascribable to patients being diagnosed with PV at a younger age.9 In general, patients with BP and PV are younger than patients with BP only, with a mean age of 62 years.9 Because our patient was in his mid-30s when he developed BP, in such cases physicians should take under consideration any triggering factors (eg, drugs). Physical examination and detailed laboratory findings allowed us to make the patient aware of the potential for development of metabolic syndrome. This condition in combination with PV could be a predisposing factor for BP development. According to more recent research, PV is considered a generalized inflammatory process rather than a disorder limited to the skin and joints.10 The chronic inflammatory process in psoriatic skin results in exposure of autoantigens, leading to an immune response and the production of BP antibodies. The neutrophil elastase enzyme present in psoriatic lesions also may take part in dermoepidermal junction degradation and blister formation of BP.11 According to other observations, some antipsoriatic therapies (eg, psoralen plus UVA, UVB, dithranol, coal tar) could be associated with development of BP.12 Moreover, it was shown that psoralen plus UVA therapy, which is widely used in PV treatment, alters the cytokine profile from helper T cells TH1 to TH2.12 TH2-dependent cytokines predominate the sera and erosions in BP patients and seem to be notably relevant to the pathophysiology of the disease.13 The history of our patient’s psoriatic treatment included only topical corticosteroids, keratolytic agents, and occasionally dithranol and coal tar; however, UV phototherapy or any other systemic therapies had never been utilized. Three previously reported cases of patients with PV and BP also revealed no history of UV phototherapy,8,9 which suggests that mechanisms responsible for coexistence of PV and BP are more complex. It has been proven that proinflammatory cytokines secreted by TH1 and TH17 cells, in particular tumor necrosis factor α, IL-17, IL-22, and IL-23, play an important role in the development of psoriatic lesions.10 On the other hand, these cytokines are known to contribute to vascular inflammation, leading to development of arteriosclerosis, as well as to regulate adipogenesis and obesity.14,15 Arakawa et al16 reported increased expression of IL-17 in lesional skin in BP. They concluded that IL-17 may contribute to the recruitment of eosinophils and neutrophils and tissue damage in BP. Therefore, it is highly likely that IL-17 might be a common factor underlying the coexistence of BP with PV and metabolic syndrome. More such reports are required for better understanding this association.
BP Treatment
Selecting a therapy for BP with coexistent PV is challenging, especially in patients with extreme obesity and metabolic syndrome. It is well established that obesity correlates with a higher incidence of PV and more severe disease. On the other hand, obesity also influences response to therapy. Systemic corticosteroids are contraindicated in psoriasis patients because of severe side effects, such as rebound phenomenon of psoriatic lesions and risk for development of generalized pustular PV. Although systemic corticosteroids are effective in BP, high-dose therapy may potentially be life-threatening, particularly in these obese patients with conditions such as hypertension and diabetes mellitus, among others,1 as was observed in our case. Taking into consideration the above mentioned conditions and our experience on such cases, the current patient had received MTX (12.5 mg once weekly) and clobetasol propionate cream, which led to the rapid healing of the psoriatic plaques, whereas BP was more resistant to this therapy. This response may be explained by our patient’s class 3 obesity (body mass index, 69.2). Therefore, the dose of MTX was increased to 20 mg once weekly and was successful. The decision to use MTX was supported by evidence that this medicine may reduce the risk for arteriosclerosis and cardiovascular disorders.17
There are some alternative therapeutic options for patients with coexisting BP and PV, such as cyclosporine,18 combination low-dose cyclosporine and low-dose systemic corticosteroids,19 dapsone,20 azathioprine,21 mycophenolate mofetil,22 and acitretin.23 It also has been shown that biologics (eg, ustekinumab) may be a successful solution in patients with PV and antilaminin-γ1 pemphigoid.24 However, these alternative therapeutic regimens could not be considered in our patient because of serious coexisting internal disorders.
Conclusion
We present a case of concomitant BP and PV in a patient with metabolic syndrome. Although the pathogenic role of this unique coexistence is not fully understood, MTX proved suitable and effective in this single case. Further studies should be performed to elucidate the pathogenic relationship and therapeutic solutions for cases with coexisting PV, BP, and metabolic syndrome.
- Rzany B, Partscht K, Jung M, et al. Risk factors for lethal outcome in patients with bullous pemphigoid: low serum albumin level, high dosage of gluco-corticosteroids, and old age. Arch Dermatol. 2002;138:903-908.
- Pietrzak A, Bartosinska J, Chodorowska G, et al. Cardiovascular aspects of psoriasis vulgaris. Int J Dermatol. 2013;52:153-162.
- Stinco G, Codutti R, Scarbolo M, et al. A retrospective epidemiological study on the association of bullous pemphigoid and neurological diseases. Acta Derm Venereol. 2005;85:136-139.
- International Diabetes Federation. The IDF Consensus Worldwide Definition of the Metabolic Syndrome. Brussels, Belgium: International Diabetes Foundation; 2006. http://www.idf.org/webdata/docs/IDF_Meta_def_final.pdf. Accessed September 14, 2016.
- Van Beek N, Rentzsch K, Probst C, et al. Serological diagnosis of autoimmune bullous skin diseases: prospective comparison of the BIOCHIP mosaic-based indirect immunofluorescence technique with the conventional multi-step single test strategy. Orphanet J Rare Dis. 2012;7:49.
- Sommer DM, Jenisch S, Suchan M, et al. Increased prevalence of the metabolic syndrome in patients with moderate to severe psoriasis. Arch Dermatol Res. 2006;298:321-328.
- Gelfand JM, Troxel AB, Lewis JD, et al. The risk of mortality in patients with psoriasis: results from a population-based study. Arch Dermatol. 2007;143:1493-1499.
- Lazarczyk M, Wozniak K, Ishii N, et al. Coexistence of psoriasis and pemphigoid—only a coincidence? Int J Mol Med. 2006;18:619-623.
- Yasuda H, Tomita Y, Shibaki A, et al. Two cases of subepidermal blistering disease with anti-p200 or 180-kD bullous pemphigoid antigen associated with psoriasis. Dermatology. 2004;209:149-155.
- Malakouti M, Brown GE, Wang E, et al. The role of IL-17 in psoriasis [published online February 20, 2014]. J Dermatolog Treat. 2015;26:41-44.
- Glinski W, Jarzabek-Chorzelska M, Pierozynska-Dubowska M, et al. Basement membrane zone as a target for human neutrophil elastase in psoriasis. Arch Dermatol Res. 1990;282:506-511.
- Klosner G, Trautinger F, Knobler R, et al. Treatment of peripheral blood mononuclear cells with 8-methoxypsoralen plus ultraviolet A radiation induces a shift in cytokine expression from a Th1 to a Th2 response. J Invest Dermatol. 2001;116:459-462.
- Gounni AS, Wellemans V, Agouli M, et al. Increased expression of Th2-associated chemokines in bullous pemphigoid disease. role of eosinophils in the production and release of these chemokines. Clin Immunol. 2006;120:220-231.
- Gao Q, Jiang Y, Ma T, et al. A critical function of Th17 proinflammatory cells in the development of atherosclerotic plaque in mice. J Immunol. 2010;185:5820-5827.
- Zúñiga LA, Shen WJ, Joyce-Shaikh B, et al. IL-17 regulates adipogenesis, glucose homeostasis, and obesity. J Immunol. 2010;185:6947-6959.
- Arakawa M, Dainichi T, Ishii N, et al. Lesional Th17 cells and regulatory T cells in bullous pemphigoid. Exp Dermatol. 2011;20:1022-1024.
- Everett BM, Pradhan AD, Solomon DH, et al. Rationale and design of the Cardiovascular Inflammation Reduction Trial: a test of the inflammatory hypothesis of atherothrombosis. Am Heart J. 2013;166:199-207.
- Boixeda JP, Soria C, Medina S, et al. Bullous pemphigoid and psoriasis: treatment with cyclosporine. J Am Acad Dermatol. 1991;24:152.
- Bianchi L, Gatti S, Nini G. Bullous pemphigoid and severe erythrodermic psoriasis: combined low-dose treatment with cyclosporine and systemic steroids. J Am Acad Dermatol. 1992;27(2, pt 1):278.
- Hisler BM, Blumenthal NC, Aronson PJ, et al. Bullous pemphigoid in psoriatic lesions. J Am Acad Dermatol. 1989;20:683-684.
- Primka EJ III, Camisa C. Psoriasis and bullous pemphigoid treated with azathioprine. J Am Acad Dermatol. 1998;39:121-123.
- Nousari HC, Sragovich A, Kimyai-Asadi A, et al. Mycophenolate mofetil in autoimmune and inflammatory skin disorders. J Am Acad Dermatol. 1999;40:265-268.
- Kobayashi TT, Elston DM, Libow LF, et al. A case of bullous pemphigoid limited to psoriatic plaques. Cutis. 2002;70:283-287.
- Maijima Y, Yagi H, Tateishi C, et al. A successful treatment with ustekinumab in case of antilaminin-γ1 pemphigoid associated with psoriasis. Br J Dermatol. 2013;168:1367-1369.
Bullous pemphigoid (BP) is an autoimmune subepidermal blistering disease.1 The majority of BP cases are idiopathic and occur in patients older than 60 years. The disease is characterized by the development of circulating IgG autoantibodies reacting with the BP180 antigen of the basement membrane zone.1 Psoriasis vulgaris (PV) is a common, chronic, immune-mediated disease affecting approximately 2% of the world’s population including children and adults.2 Both entities may coexist with internal disorders such as hypertension, diabetes mellitus, coronary heart disease, congestive heart failure, hyperlipidemia, and cerebrovascular accident. It has been postulated that BP more often coexists with neurological disorders, such as stroke and Parkinson disease,3 whereas PV usually is associated with cardiovascular disorders and diabetes mellitus.2 We report the case of a 35-year-old man with chronic PV and metabolic syndrome who developed BP that was successfully treated with methotrexate (MTX).
Case Report
A 35-year-old man with a 15-year history of PV, class 3 obesity (body mass index, 69.2), and thrombosis of the left leg was referred to the dermatology department due to a sudden extensive erythematous and bullous eruption located on the trunk, arms, and legs with involvement of the oral mucosa that had started 4 weeks prior. The skin lesions were accompanied by severe pruritus. On admission to the hospital, the patient presented with stable psoriatic plaques located on the trunk, arms, and proximal part of the lower legs with a psoriasis area severity index score of 11.8 (Figure 1A). He also had disseminated tense blisters and erosions partially arranged in an annular pattern located on the border of the psoriatic plaques as well as on an erythematous base or within unaffected skin (Figure 1B). Additionally, a few small erosions were present on the oral mucosa.
The patient’s father had a history of PV, but there was no family history of obesity or autoimmune blistering disorders. On physical examination, central obesity was noted with a waist circumference of 180 cm and a body mass index of 69.2; his blood pressure was 220/150 mm Hg. Laboratory tests revealed leukocytosis (20.06×10⁹/L [reference range, 4.5–11.0×10⁹/L]) with neutrophilia (16.2×10⁹/L [reference range, 1.6–7.6×10⁹/L]; 80.9% [reference range, 40.0%–70.0%]), eosinophilia (1.01×10⁹/L [reference range, 0–0.5×10⁹/L]), elevated C-reactive protein levels (49.4 mg/L [reference range, 0.0–9.0 mg/L]), elevated erythrocyte sedimentation rate (35 mm/h [reference range, 0–12 mm/h]), elevated γ-glutamyltransferase (66 U/L [reference range, 0–55 U/L]), decreased high-density lipoprotein levels (38 mg/dL [reference range, ≥40 mg/dL]), elevated fasting plasma glucose (116 mg/dL or 6.4 mmol/L [reference range, 70–99 mg/dL or 3.9–5.5 mmol/L]), elevated total IgE (1540 µg/L [reference range, 0–1000 µg/L]), elevated D-dimer (3.21 µg/mL [reference range, <0.5 µg/mL]), and low free triiodothyronine levels (130 pg/dL [reference range, 171–371 pg/dL]). The total protein level was 6.5 g/dL (reference range, 6.0–8.0 g/dL) and albumin level was 3.2 g/dL (reference range, 4.02–4.76 g/dL). A chest radiograph showed no abnormalities.
Based on the physical examination and laboratory testing, it was determined that the patient fulfilled 4 of 5 criteria for metabolic syndrome described by the International Diabetes Federation in 2006 (Table).4 Direct immunofluorescence performed on normal-appearing perilesional skin demonstrated linear IgG and C3 deposits along the basement membrane zone. Indirect immunofluorescence detected circulating IgG autoantibodies at a titer of 1:80. Serum studies using biochip mosaics5 revealed the reactivity of circulating IgG antibodies to the epidermal side of salt-split skin and with antigen dots of tetrameric BP180-NC16a, which prompted the diagnosis of BP (Figure 2).
Oral treatment with MTX 12.5 mg once weekly with clobetasol propionate cream applied to affected skin was initiated for 4 weeks. The PV resolved completely and blister formation stopped. A few weeks later BP reappeared, even though the patient was still taking MTX. The treatment failure may have been related to the patient’s class 3 obesity; therefore, the dose was increased to 20 mg once weekly for 8 weeks, which led to rapid healing of BP erosions. The patient was monitored for 2 months with no symptoms of recurrence.
Comment
Psoriasis Comorbidities
The correlation between PV and cardiovascular disorders such as myocardial infarction, cerebrovascular accident, and pulmonary embolism has been well established and is widely accepted.2 It also has been documented that the risk for metabolic syndrome with components such as diabetes mellitus, hypertension, lipid abnormalities, obesity, and arteriosclerosis is notably increased in PV patients.6 Moreover, associated internal disorders are responsible for a 3- to 4-year reduction in life expectancy in patients with moderate to severe PV.7
Correlation of PV and BP
Psoriasis also may coexist with autoimmune disorders such as rheumatoid arthritis, lupus erythematosus, and blistering disorders.8 There are more than 60 known cases reporting PV in association with various types of subepidermal blistering diseases, including pemphigus vulgaris, epidermolysis bullosa acquisita, anti-p200 pemphigoid, and BP.8,9 The pathogenetic relationship between BP and PV remains obscure. In most published cases, PV preceded BP by 5 to 30 years, possibly ascribable to patients being diagnosed with PV at a younger age.9 In general, patients with BP and PV are younger than patients with BP only, with a mean age of 62 years.9 Because our patient was in his mid-30s when he developed BP, in such cases physicians should take under consideration any triggering factors (eg, drugs). Physical examination and detailed laboratory findings allowed us to make the patient aware of the potential for development of metabolic syndrome. This condition in combination with PV could be a predisposing factor for BP development. According to more recent research, PV is considered a generalized inflammatory process rather than a disorder limited to the skin and joints.10 The chronic inflammatory process in psoriatic skin results in exposure of autoantigens, leading to an immune response and the production of BP antibodies. The neutrophil elastase enzyme present in psoriatic lesions also may take part in dermoepidermal junction degradation and blister formation of BP.11 According to other observations, some antipsoriatic therapies (eg, psoralen plus UVA, UVB, dithranol, coal tar) could be associated with development of BP.12 Moreover, it was shown that psoralen plus UVA therapy, which is widely used in PV treatment, alters the cytokine profile from helper T cells TH1 to TH2.12 TH2-dependent cytokines predominate the sera and erosions in BP patients and seem to be notably relevant to the pathophysiology of the disease.13 The history of our patient’s psoriatic treatment included only topical corticosteroids, keratolytic agents, and occasionally dithranol and coal tar; however, UV phototherapy or any other systemic therapies had never been utilized. Three previously reported cases of patients with PV and BP also revealed no history of UV phototherapy,8,9 which suggests that mechanisms responsible for coexistence of PV and BP are more complex. It has been proven that proinflammatory cytokines secreted by TH1 and TH17 cells, in particular tumor necrosis factor α, IL-17, IL-22, and IL-23, play an important role in the development of psoriatic lesions.10 On the other hand, these cytokines are known to contribute to vascular inflammation, leading to development of arteriosclerosis, as well as to regulate adipogenesis and obesity.14,15 Arakawa et al16 reported increased expression of IL-17 in lesional skin in BP. They concluded that IL-17 may contribute to the recruitment of eosinophils and neutrophils and tissue damage in BP. Therefore, it is highly likely that IL-17 might be a common factor underlying the coexistence of BP with PV and metabolic syndrome. More such reports are required for better understanding this association.
BP Treatment
Selecting a therapy for BP with coexistent PV is challenging, especially in patients with extreme obesity and metabolic syndrome. It is well established that obesity correlates with a higher incidence of PV and more severe disease. On the other hand, obesity also influences response to therapy. Systemic corticosteroids are contraindicated in psoriasis patients because of severe side effects, such as rebound phenomenon of psoriatic lesions and risk for development of generalized pustular PV. Although systemic corticosteroids are effective in BP, high-dose therapy may potentially be life-threatening, particularly in these obese patients with conditions such as hypertension and diabetes mellitus, among others,1 as was observed in our case. Taking into consideration the above mentioned conditions and our experience on such cases, the current patient had received MTX (12.5 mg once weekly) and clobetasol propionate cream, which led to the rapid healing of the psoriatic plaques, whereas BP was more resistant to this therapy. This response may be explained by our patient’s class 3 obesity (body mass index, 69.2). Therefore, the dose of MTX was increased to 20 mg once weekly and was successful. The decision to use MTX was supported by evidence that this medicine may reduce the risk for arteriosclerosis and cardiovascular disorders.17
There are some alternative therapeutic options for patients with coexisting BP and PV, such as cyclosporine,18 combination low-dose cyclosporine and low-dose systemic corticosteroids,19 dapsone,20 azathioprine,21 mycophenolate mofetil,22 and acitretin.23 It also has been shown that biologics (eg, ustekinumab) may be a successful solution in patients with PV and antilaminin-γ1 pemphigoid.24 However, these alternative therapeutic regimens could not be considered in our patient because of serious coexisting internal disorders.
Conclusion
We present a case of concomitant BP and PV in a patient with metabolic syndrome. Although the pathogenic role of this unique coexistence is not fully understood, MTX proved suitable and effective in this single case. Further studies should be performed to elucidate the pathogenic relationship and therapeutic solutions for cases with coexisting PV, BP, and metabolic syndrome.
- Rzany B, Partscht K, Jung M, et al. Risk factors for lethal outcome in patients with bullous pemphigoid: low serum albumin level, high dosage of gluco-corticosteroids, and old age. Arch Dermatol. 2002;138:903-908.
- Pietrzak A, Bartosinska J, Chodorowska G, et al. Cardiovascular aspects of psoriasis vulgaris. Int J Dermatol. 2013;52:153-162.
- Stinco G, Codutti R, Scarbolo M, et al. A retrospective epidemiological study on the association of bullous pemphigoid and neurological diseases. Acta Derm Venereol. 2005;85:136-139.
- International Diabetes Federation. The IDF Consensus Worldwide Definition of the Metabolic Syndrome. Brussels, Belgium: International Diabetes Foundation; 2006. http://www.idf.org/webdata/docs/IDF_Meta_def_final.pdf. Accessed September 14, 2016.
- Van Beek N, Rentzsch K, Probst C, et al. Serological diagnosis of autoimmune bullous skin diseases: prospective comparison of the BIOCHIP mosaic-based indirect immunofluorescence technique with the conventional multi-step single test strategy. Orphanet J Rare Dis. 2012;7:49.
- Sommer DM, Jenisch S, Suchan M, et al. Increased prevalence of the metabolic syndrome in patients with moderate to severe psoriasis. Arch Dermatol Res. 2006;298:321-328.
- Gelfand JM, Troxel AB, Lewis JD, et al. The risk of mortality in patients with psoriasis: results from a population-based study. Arch Dermatol. 2007;143:1493-1499.
- Lazarczyk M, Wozniak K, Ishii N, et al. Coexistence of psoriasis and pemphigoid—only a coincidence? Int J Mol Med. 2006;18:619-623.
- Yasuda H, Tomita Y, Shibaki A, et al. Two cases of subepidermal blistering disease with anti-p200 or 180-kD bullous pemphigoid antigen associated with psoriasis. Dermatology. 2004;209:149-155.
- Malakouti M, Brown GE, Wang E, et al. The role of IL-17 in psoriasis [published online February 20, 2014]. J Dermatolog Treat. 2015;26:41-44.
- Glinski W, Jarzabek-Chorzelska M, Pierozynska-Dubowska M, et al. Basement membrane zone as a target for human neutrophil elastase in psoriasis. Arch Dermatol Res. 1990;282:506-511.
- Klosner G, Trautinger F, Knobler R, et al. Treatment of peripheral blood mononuclear cells with 8-methoxypsoralen plus ultraviolet A radiation induces a shift in cytokine expression from a Th1 to a Th2 response. J Invest Dermatol. 2001;116:459-462.
- Gounni AS, Wellemans V, Agouli M, et al. Increased expression of Th2-associated chemokines in bullous pemphigoid disease. role of eosinophils in the production and release of these chemokines. Clin Immunol. 2006;120:220-231.
- Gao Q, Jiang Y, Ma T, et al. A critical function of Th17 proinflammatory cells in the development of atherosclerotic plaque in mice. J Immunol. 2010;185:5820-5827.
- Zúñiga LA, Shen WJ, Joyce-Shaikh B, et al. IL-17 regulates adipogenesis, glucose homeostasis, and obesity. J Immunol. 2010;185:6947-6959.
- Arakawa M, Dainichi T, Ishii N, et al. Lesional Th17 cells and regulatory T cells in bullous pemphigoid. Exp Dermatol. 2011;20:1022-1024.
- Everett BM, Pradhan AD, Solomon DH, et al. Rationale and design of the Cardiovascular Inflammation Reduction Trial: a test of the inflammatory hypothesis of atherothrombosis. Am Heart J. 2013;166:199-207.
- Boixeda JP, Soria C, Medina S, et al. Bullous pemphigoid and psoriasis: treatment with cyclosporine. J Am Acad Dermatol. 1991;24:152.
- Bianchi L, Gatti S, Nini G. Bullous pemphigoid and severe erythrodermic psoriasis: combined low-dose treatment with cyclosporine and systemic steroids. J Am Acad Dermatol. 1992;27(2, pt 1):278.
- Hisler BM, Blumenthal NC, Aronson PJ, et al. Bullous pemphigoid in psoriatic lesions. J Am Acad Dermatol. 1989;20:683-684.
- Primka EJ III, Camisa C. Psoriasis and bullous pemphigoid treated with azathioprine. J Am Acad Dermatol. 1998;39:121-123.
- Nousari HC, Sragovich A, Kimyai-Asadi A, et al. Mycophenolate mofetil in autoimmune and inflammatory skin disorders. J Am Acad Dermatol. 1999;40:265-268.
- Kobayashi TT, Elston DM, Libow LF, et al. A case of bullous pemphigoid limited to psoriatic plaques. Cutis. 2002;70:283-287.
- Maijima Y, Yagi H, Tateishi C, et al. A successful treatment with ustekinumab in case of antilaminin-γ1 pemphigoid associated with psoriasis. Br J Dermatol. 2013;168:1367-1369.
Practice Points
- Metabolic syndrome and psoriasis vulgaris (PV) may promote development of bullous pemphigoid (BP) in patients younger than 60 years.
- Methotrexate may be a therapeutic solution for BP coexisting with PV and metabolic syndrome.

COPD patient characteristics predict response to maintenance drug
LONDON – Maintenance azithromycin may be best reserved for patients with mild to moderate chronic obstructive pulmonary disease (COPD) who also have few symptoms, according to an analysis from the COLUMBUS randomized controlled trial.
Significantly fewer exacerbations (1.06 vs. 2.62; P = .02) occurred at 1 year in patients treated with the macrolide antibiotic azithromycin rather than placebo if they were classified as having GOLD [Global Initiative for Chronic Obstructive Lung Disease] stage 1 or 2 versus stage 4.

Study participants who were classified as being part of GOLD group C (which includes patients with a high risk of COPD exacerbation but a low level of COPD symptoms) who were treated with maintenance azithromycin were also more likely to have fewer exacerbations at 1 year, compared with patients classified as being part of GOLD group D (which includes patients with a high risk of COPD exacerbation and a high level of COPD symptoms), who took the same antibiotic (0.45 vs. 2.18; P less than .01).
Having a high serum eosinophil level (2% or higher) was a third factor found in COPD patients that was predictive of fewer exacerbations following azithromycin use (1.26 vs. 2.5; P = .02).
“Azithromycin maintenance therapy should not be given to every COPD patient,” Remco Djamin, MD, of Amphia Hospital Breda in the Netherlands said in an interview at the annual congress of the European Respiratory Society. There is, of course, the concern over antibiotic resistance developing and macrolide antibiotic use has been linked with heart problems such as arrhythmia.
These data show, however, that there are certain predictors that might help clinicians decide if long-term antibiotic therapy might be beneficial for their patients who are experiencing frequent acute exacerbations of COPD.
Further research should look at the dosing and duration of azithromycin, Dr. Djamin suggested. Perhaps reducing the dose by half to 250 mg three times per week would be just as good; maybe 6 months’ rather than 12 months’ treatment would be sufficient, or perhaps it could be given intermittently. The aim is to ensure that patients are not being exposed unnecessarily, as there is concern over antibiotic resistance.
The use of azithromycin is not currently recommended in guidelines for COPD management to prevent exacerbations, but it is something that is likely to be added to the guidelines, as the evidence for its benefit mounts, Dr. Djamin said.
In addition to COLUMBUS, there have been at least two other studies looking at long-term antibiotic use to prevent exacerbations in patients with COPD. One (Am J Respir Crit Care Med. 2008;178:1139-47) showed erythromycin could decrease the exacerbation rate at 1 year by 36%, compared with placebo, while the other (N Engl J Med. 2011;365:689-8) again showed a benefit for azithromycin, with a 27% decrease in the 1-year exacerbation rate.
In COLUMBUS, 92 patients who had experienced at least three or more acute COPD exacerbations in the previous year were randomized to treatment with azithromycin 500 mg or placebo, taken three times per week for 12 months. This was a single-center, double-blind trial conducted in the Netherlands that showed a 42% reduction in the 1-year exacerbation rate could be achieved with the antibiotic treatment (Lancet Respir Med. 2014;2:361-8).
An additional benefit to using the antibiotic was seen in patients with GOLD stage 1-2 over patients with GOLD stage 4 and in patients with a higher percentage of serum eosinophils. The GOLD stage 1-2 patients experienced fewer exacerbations leading to hospitalization, compared with patients with GOLD stage 4 (0.31 vs. 1.00; P = .04), while the patients with higher levels of eosinophils experienced fewer exacerbations requiring hospitalization than those patients with lower percentages of eosinophils (0.26 vs. 1.07; P = 0.01).
“What you should consider is that this is a group of patients who have frequent exacerbations, and most of these exacerbations are caused by infections,” Dr. Djamin said, during a poster presentation at the conference. “Their exacerbations are often already being treated with antibiotics and so maintaining treatment has become one possible way of perhaps preventing exacerbations in the future.”
The study received no industry funding. Dr. Djamin had no competing interests to disclose.
LONDON – Maintenance azithromycin may be best reserved for patients with mild to moderate chronic obstructive pulmonary disease (COPD) who also have few symptoms, according to an analysis from the COLUMBUS randomized controlled trial.
Significantly fewer exacerbations (1.06 vs. 2.62; P = .02) occurred at 1 year in patients treated with the macrolide antibiotic azithromycin rather than placebo if they were classified as having GOLD [Global Initiative for Chronic Obstructive Lung Disease] stage 1 or 2 versus stage 4.
Study participants who were classified as being part of GOLD group C (which includes patients with a high risk of COPD exacerbation but a low level of COPD symptoms) who were treated with maintenance azithromycin were also more likely to have fewer exacerbations at 1 year, compared with patients classified as being part of GOLD group D (which includes patients with a high risk of COPD exacerbation and a high level of COPD symptoms), who took the same antibiotic (0.45 vs. 2.18; P less than .01).
Having a high serum eosinophil level (2% or higher) was a third factor found in COPD patients that was predictive of fewer exacerbations following azithromycin use (1.26 vs. 2.5; P = .02).
“Azithromycin maintenance therapy should not be given to every COPD patient,” Remco Djamin, MD, of Amphia Hospital Breda in the Netherlands said in an interview at the annual congress of the European Respiratory Society. There is, of course, the concern over antibiotic resistance developing and macrolide antibiotic use has been linked with heart problems such as arrhythmia.
These data show, however, that there are certain predictors that might help clinicians decide if long-term antibiotic therapy might be beneficial for their patients who are experiencing frequent acute exacerbations of COPD.
Further research should look at the dosing and duration of azithromycin, Dr. Djamin suggested. Perhaps reducing the dose by half to 250 mg three times per week would be just as good; maybe 6 months’ rather than 12 months’ treatment would be sufficient, or perhaps it could be given intermittently. The aim is to ensure that patients are not being exposed unnecessarily, as there is concern over antibiotic resistance.
The use of azithromycin is not currently recommended in guidelines for COPD management to prevent exacerbations, but it is something that is likely to be added to the guidelines, as the evidence for its benefit mounts, Dr. Djamin said.
In addition to COLUMBUS, there have been at least two other studies looking at long-term antibiotic use to prevent exacerbations in patients with COPD. One (Am J Respir Crit Care Med. 2008;178:1139-47) showed erythromycin could decrease the exacerbation rate at 1 year by 36%, compared with placebo, while the other (N Engl J Med. 2011;365:689-8) again showed a benefit for azithromycin, with a 27% decrease in the 1-year exacerbation rate.
In COLUMBUS, 92 patients who had experienced at least three or more acute COPD exacerbations in the previous year were randomized to treatment with azithromycin 500 mg or placebo, taken three times per week for 12 months. This was a single-center, double-blind trial conducted in the Netherlands that showed a 42% reduction in the 1-year exacerbation rate could be achieved with the antibiotic treatment (Lancet Respir Med. 2014;2:361-8).
An additional benefit to using the antibiotic was seen in patients with GOLD stage 1-2 over patients with GOLD stage 4 and in patients with a higher percentage of serum eosinophils. The GOLD stage 1-2 patients experienced fewer exacerbations leading to hospitalization, compared with patients with GOLD stage 4 (0.31 vs. 1.00; P = .04), while the patients with higher levels of eosinophils experienced fewer exacerbations requiring hospitalization than those patients with lower percentages of eosinophils (0.26 vs. 1.07; P = 0.01).
“What you should consider is that this is a group of patients who have frequent exacerbations, and most of these exacerbations are caused by infections,” Dr. Djamin said, during a poster presentation at the conference. “Their exacerbations are often already being treated with antibiotics and so maintaining treatment has become one possible way of perhaps preventing exacerbations in the future.”
The study received no industry funding. Dr. Djamin had no competing interests to disclose.
AT THE ERS CONGRESS 2016
Key clinical point: Maintenance azithromycin may be best reserved for patients with more mild to moderate chronic obstructive pulmonary disease and few symptoms.
Major finding: Fewer exacerbations at 1 year occurred in patients with higher vs. lower serum eosinophil levels, GOLD stage 1-2 vs. GOLD stage 4, and GOLD group C vs. group D COPD.
Data source: Analysis of the COLUMBUS randomized, double-blind, placebo-controlled trial of 92 COPD patients with frequent exacerbations who were treated with maintenance azithromycin or placebo for 1 year.
Disclosures: The study received no industry funding. Dr. Djamin had no competing interests to disclose.

Biologic mesh for ventral hernia repair compared for recurrence, cost
The porcine acellular dermal mesh product Strattice was associated with significantly lower odds of hernia recurrence, compared with several other biologic mesh products, in a study of 223 patients who underwent open ventral hernia repair.
Prospective operative outcomes data from a tertiary referral hernia center showed that at a mean follow-up of 18.2 months, the rate of hernia recurrence was 35% in 40 patients who were treated with Alloderm (LifeCell Corporation), 34.5% in 23 patients treated with AlloMax (Bard/Davol), 37.1% in 70 patients treated with FlexHD (Ethicon), and 59.1% in 22 patients treated with Xenmatrix (Bard/Davol), compared with 14.7% in 68 patients treated with Strattice (LifeCell Corporation). Alloderm, AlloMax, and FlexHD are all human acellular dermal mesh products, and Strattice and Xenmatrix are both porcine acellular dermal mesh products, Ciara R. Huntington, MD, and her colleagues at the Carolinas Medical Center in Charlotte, N.C., reported.

|
| Photo courtesy Acelity. STRATTICETM Reconstructive Tissue Matrix |
After multivariate analysis to adjust for factors such as comorbidities, hernia size, and intraoperative techniques, the odds ratios for recurrence with each product as compared with Strattice were 2.4 with Alloderm, 2.9 with FlexHD, 3.4 with AlloMax, and 7.8 with Xenmatrix. The odds for recurrence were significantly greater with all except Alloderm, the investigators said (Surgery. 2016. doi: 10.1016/j.surg.2016.07.008).
The significant differences between the two porcine acellular dermal meshes (Xenmatrix and Strattice) may reflect variation in tissue processing and design in biomesh engineering, they noted.
Study subjects were adults with a mean age of 57.7 years and mean body mass index of 34.8 kg/m2. Overall, 9.8% had an American Society of Anesthesiology classification of 4, 54.6% had a classification of 3, and 35.6% had a classification of 1 or 2. Average operative time was 241 minutes with estimated blood loss of 202 mL.
Average hernia defect size was 257 cm2, with average mesh size of 384 cm2.
“Component separation was performed in 47.5% of cases, and abdomen was left open prior to definitive closure in 10.7%. Biologic mesh was used to bridge fascial defects in 19.6% of cases. The mesh was placed in the preperitoneal space in 38.2% of cases,” the investigators wrote, noting that a concomitant procedure was performed in 82% of cases.
Sepsis developed in 6.7% of patients, 36.3% had a wound infection, and 24.3% required a negative pressure dressing for healing. The inpatient mortality rate was 1.4%.
However, mesh infections requiring explantation occurred in less than 1% of cases.
On adjusted analysis, Xenmatrix was the most expensive mesh and AlloMax was the least expensive (mean of $59,122 and $22,304, respectively). Strattice costs averaged $40,490.
Ventral hernia repair (VHR) is a common operation, with about 350,000 performed each year. Rates of postoperative wound infection and hernia recurrence vary widely, but may be improved with appropriate mesh selection. However, prospective data to guide selection are lacking, the investigators said.
“The great number of meshes available for use complicates the debate surrounding the best timing and use of biologic mesh in VHR, and the search for the better mesh for use in the abdominal wall reconstruction continues. Biologic mesh usually is reserved for the patients at the highest risk for developing a postoperative wound complication, and although there is a current dearth of high-level evidence supporting its use, this report confirms that complications are low despite obvious surgical complexity presented herein,” they wrote.
The findings of this study – the largest report of outcomes with biologic mesh in ventral hernia repair to date, according to the authors – support the safety of using biologic mesh in high-risk patients, they said.
They noted, however, that the study may still be underpowered to make final clinical decisions.
“Although our study provides useful information to the practicing surgeon, there is much work to be done regarding the selection of biologic mesh,” they wrote, adding that while “a well-performing biologic mesh should be in the toolkit of every general surgeon who may face complex abdominal walls requiring reconstruction in patients that are at high risk for a postoperative wound complication,” additional research is necessary to further clarify the role of biologic mesh in these operations.
Dr. Huntington reported having no disclosures. Other authors reported having been awarded honoraria, speaking fees, surgical research funding, and education grants from W.L. Gore and Associates, Ethicon, Novadaq, Bard/Davol, and LifeCell Corporation.
The porcine acellular dermal mesh product Strattice was associated with significantly lower odds of hernia recurrence, compared with several other biologic mesh products, in a study of 223 patients who underwent open ventral hernia repair.
Prospective operative outcomes data from a tertiary referral hernia center showed that at a mean follow-up of 18.2 months, the rate of hernia recurrence was 35% in 40 patients who were treated with Alloderm (LifeCell Corporation), 34.5% in 23 patients treated with AlloMax (Bard/Davol), 37.1% in 70 patients treated with FlexHD (Ethicon), and 59.1% in 22 patients treated with Xenmatrix (Bard/Davol), compared with 14.7% in 68 patients treated with Strattice (LifeCell Corporation). Alloderm, AlloMax, and FlexHD are all human acellular dermal mesh products, and Strattice and Xenmatrix are both porcine acellular dermal mesh products, Ciara R. Huntington, MD, and her colleagues at the Carolinas Medical Center in Charlotte, N.C., reported.
|
|
| Photo courtesy Acelity. STRATTICETM Reconstructive Tissue Matrix |
After multivariate analysis to adjust for factors such as comorbidities, hernia size, and intraoperative techniques, the odds ratios for recurrence with each product as compared with Strattice were 2.4 with Alloderm, 2.9 with FlexHD, 3.4 with AlloMax, and 7.8 with Xenmatrix. The odds for recurrence were significantly greater with all except Alloderm, the investigators said (Surgery. 2016. doi: 10.1016/j.surg.2016.07.008).
The significant differences between the two porcine acellular dermal meshes (Xenmatrix and Strattice) may reflect variation in tissue processing and design in biomesh engineering, they noted.
Study subjects were adults with a mean age of 57.7 years and mean body mass index of 34.8 kg/m2. Overall, 9.8% had an American Society of Anesthesiology classification of 4, 54.6% had a classification of 3, and 35.6% had a classification of 1 or 2. Average operative time was 241 minutes with estimated blood loss of 202 mL.
Average hernia defect size was 257 cm2, with average mesh size of 384 cm2.
“Component separation was performed in 47.5% of cases, and abdomen was left open prior to definitive closure in 10.7%. Biologic mesh was used to bridge fascial defects in 19.6% of cases. The mesh was placed in the preperitoneal space in 38.2% of cases,” the investigators wrote, noting that a concomitant procedure was performed in 82% of cases.
Sepsis developed in 6.7% of patients, 36.3% had a wound infection, and 24.3% required a negative pressure dressing for healing. The inpatient mortality rate was 1.4%.
However, mesh infections requiring explantation occurred in less than 1% of cases.
On adjusted analysis, Xenmatrix was the most expensive mesh and AlloMax was the least expensive (mean of $59,122 and $22,304, respectively). Strattice costs averaged $40,490.
Ventral hernia repair (VHR) is a common operation, with about 350,000 performed each year. Rates of postoperative wound infection and hernia recurrence vary widely, but may be improved with appropriate mesh selection. However, prospective data to guide selection are lacking, the investigators said.
“The great number of meshes available for use complicates the debate surrounding the best timing and use of biologic mesh in VHR, and the search for the better mesh for use in the abdominal wall reconstruction continues. Biologic mesh usually is reserved for the patients at the highest risk for developing a postoperative wound complication, and although there is a current dearth of high-level evidence supporting its use, this report confirms that complications are low despite obvious surgical complexity presented herein,” they wrote.
The findings of this study – the largest report of outcomes with biologic mesh in ventral hernia repair to date, according to the authors – support the safety of using biologic mesh in high-risk patients, they said.
They noted, however, that the study may still be underpowered to make final clinical decisions.
“Although our study provides useful information to the practicing surgeon, there is much work to be done regarding the selection of biologic mesh,” they wrote, adding that while “a well-performing biologic mesh should be in the toolkit of every general surgeon who may face complex abdominal walls requiring reconstruction in patients that are at high risk for a postoperative wound complication,” additional research is necessary to further clarify the role of biologic mesh in these operations.
Dr. Huntington reported having no disclosures. Other authors reported having been awarded honoraria, speaking fees, surgical research funding, and education grants from W.L. Gore and Associates, Ethicon, Novadaq, Bard/Davol, and LifeCell Corporation.
FROM SURGERY
Key clinical point: The porcine acellular dermal mesh product Strattice was associated with significantly lower odds of hernia recurrence, compared with several other biologic mesh products, in a study of 223 patients who underwent open ventral hernia repair.
Major finding: The adjusted odds ratios for recurrence, compared with Strattice, were 2.4 with Alloderm, 2.9 with FlexHD, 3.4 with AlloMax, and 7.8 with Xenmatrix.
Data source: 223 cases from a prospective operative outcomes database.
Disclosures: Dr. Huntington reported having no disclosures. Other authors reported having been awarded honoraria, speaking fees, surgical research funding, and education grants from W.L. Gore and Associates, Ethicon, Novadaq, Bard/Davol, and LifeCell Corporation.

‘Unprecedented’ Study Sheds Light on Origins of Diabetes
An international study “unprecedented in both scale and scope” has provided some important answers to the mysteries of how diabetes develops—not least, the answer to a century-old debate about whether genetic differences are shared and common or rare and individual.
Led by researchers from University of Michigan, University of Oxford, Massachusetts Institute of Technology (MIT), Harvard University, and Massachusetts General Hospital, more than 300 scientists from 22 countries used DNA from 120,000 individuals to pinpoint genes and their variants.
Related: A Window Into the Genetics Behind Diabetes
The collaboration brought together 2 research projects: GoT2D and T2D-DENES. The research teams completed whole genome sequencing of more than 2,600 people and exome sequencing of 12,940, as well as genome- or exomewide array genotyping of 111,548 people. Unlike most previous studies, which involved people only of European ancestry, this study included people with ancestral origins in Europe, South and East Asia, the Americas, and Africa.
The researchers were able to highlight “with unprecedented precision” a number of genes directly involved in the development of type 2 diabetes mellitus (T2DM)—promising new avenues for research into treatment or prevention. They also identified more than a dozen genetic regions that harbor variants that influence risk of T2DM. Most were common to all human populations and had previously been detected by other genomewide association studies.
Related: Confronting the Diabetes Epidemic
“While rare variants certainly influence type 2 diabetes risk, our results demonstrate that common variants shared across populations explain most of the genetic risk,” said Michael Boehnke, director of the Center for Statistical Genetics at the University of Michigan School of Public Health and one of the study’s 3 senior authors.
“The conclusions seem clear,” agreed Mark McCarthy, Group Head, Wellcome Trust Centre for Human Genetics. He noted, “[T]he evidence is increasingly stacking up in favor of the view that most of the genetic risk of T2D can be attributed to common alleles that are widely shared within, and between, human populations.”
Related: Thanks to IHS Funding Program, “Sustained Achievements” in Diabetes Prevention
“While this large range of genetic risk may challenge our efforts at precision medicine,” said Jason Flannick, co-lead author and senior group leader at the Broad Institute of Harvard and MIT and research associate at the Massachusetts General Hospital, “our consortium also offers a publicly accessible dataset, unprecedented in scope, for researchers around the world to advance our molecular understanding of type 2 diabetes.”
Study reveals potential treatment for AML
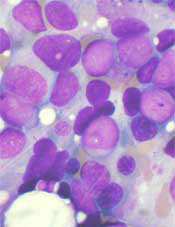
Compounds that inhibit the metabolic enzyme dihydroorotate dehydrogenase (DHODH) may be effective in treating acute myeloid leukemia (AML), according to preclinical research.
Investigators found that inhibiting DHODH enables myeloid differentiation in AML cells.
In mouse models of AML, treatment with a DHODH inhibitor reduced leukemia burden, decreased leukemia-initiating cell activity, and improved survival.
David Scadden, MD, of Massachusetts General Hospital in Boston, and his colleagues conducted this research and reported the results in Cell.
The research began with the observation that HoxA9, which is normally downregulated during myeloid differentiation, is expressed in roughly 70% of AML patients.
Since no inhibitors of HoxA9 have been identified, Dr Scadden and his colleagues set out to identify compounds that could overcome the differentiation blockade characteristic of AML cells.
The investigators first set up a cellular model of AML by inducing HoxA9 overexpression in mouse myeloid cells genetically engineered to fluoresce if they reached maturity.
The team then screened more than 330,000 small molecules, looking for those that would cause the cells to fluoresce, indicating that the HoxA9-induced differentiation blockade had been overcome.
Only 12 compounds produced the desired result. Eleven of these compounds were found to act by suppressing DHODH, which was not previously known to have a role in myeloid differentiation.
Further experiments showed that DHODH inhibition could induce differentiation in both mouse and human AML cells.
The investigators then tested BRQ, a known DHODH inhibitor, in several mouse models of AML.
Treatment with BRQ led to differentiation, reduced leukemia burden, decreased activity of leukemia-initiating cells, and prolonged survival when compared to treatment with cytarabine and doxorubicin.
“Drug companies tend to be skeptical of the kind of functional screening we used to identify DHODH as a target because it can be complicated and imprecise,” Dr Scadden noted.
“We think that, with modern tools, we may be able to improve target identification, so applying this approach to a broader range of cancers may be justified.” ![]()
Hematology analyzer cleared for use in US

Photo by William Weinert
The US Food and Drug Administration has granted 510(k) clearance for the BC-5390 Hematology Analyzer.
The product is designed to meet the testing needs of mid-volume hematology laboratories but offers features commonly found on large-volume analyzers.
The BC-5390 Hematology Analyzer provides a complete blood count with 21 parameters and a 5-part differential from a venous or capillary blood sample.
The product’s built-in autoloader has a 40-sample capacity, but it processes up to 60 samples per hour and stores up to 100,000 results with histograms.
The BC-5390 Hematology Analyzer’s barcode reader and optional laboratory information system connectivity enables seamless sample data transmission.
And nearly all scheduled maintenance procedures are automated by touch buttons.
The BC-5390 Hematology Analyzer is manufactured by Mindray, and MedTest will be the primary distributor of the analyzer in the US.
“We are excited to launch the BC-5390 Hematology Analyzer into the United States laboratory market,” said Caroline Li, general manager of Mindray IVD North America.
“The commercialization of the BC-5390 Hematology Analyzer in the US represents the first analyzer with a 5-part differential from Mindray.” ![]()
AAP report flags risks of prescribing codeine for children
The risks of using codeine to treat pain or cough in children may often outweigh the benefits, sometimes even leading to death, and call into question whether its widespread use should continue in pediatric patients, according to an American Academy of Pediatrics technical report.
“It is clear that one of the keys to improving analgesia and reducing opioid-related adverse effects is both provider and parental education regarding the effective use of nonopioid analgesics,” wrote Joseph D. Tobias, MD, and his colleagues from the AAP Committee on Drugs’ Section on Anesthesiology and Pain Medicine (Pediatrics 2016 Sept 19. doi: 10.1542/peds.2016-2396). “The answer may not lie in using more medication or different medications but merely using more effectively other options that are currently available.”
Individual patients respond differently to codeine because the conversion rates of the liver enzyme that metabolizes codeine into morphine, CYP2D6, vary greatly according to genetic differences. Some children experience no therapeutic effect at all while others have stopped breathing or died, particularly those who metabolize the drug extremely rapidly. Those with at least two copies of the CYP2D6 gene have a particularly elevated level of enzyme activity. Also at high risk for respiratory depression or death are children with obstructive sleep apnea.
Poor metabolizers, who therefore experience less effect from codeine, include disproportionately more individuals of Northern European descent. Ultrarapid metabolizers, on the other hand, comprise approximately 29% of patients of African/Ethiopian heritage and 21% from Middle Eastern countries. An estimated 3.4%-6.5% of African Americans and whites are ultrafast metabolizers. Genetic tests can identify those at higher risk, but even children with normal metabolism can experience severe adverse effects.
The World Health Organization removed codeine from its list of essential medications, the U.S. Food and Drug Administration added a black box warning to labels of codeine formulations used for tonsillectomy and/or adenoidectomy in children, and the European Medicines Agency recommended against using codeine in children under age 12 years and in those between 12 and 18 years who have breathing difficulties.
Yet research has shown that the use of codeine for pain relief in children remains very common; codeine is prescribed more than any other opioid in some studies. Otolaryngologists, dentists, pediatricians, and family practice physicians, respectively, prescribe it most often, likely because few safe, effective therapeutics exist for treating pain or cough in children. Oxycodone has been used as an alternative, but this drug also lacks adequate data on its use, and hydrocodone has similar concerns with rapid metabolizers.
Although most of the serious adverse events resulting in codeine use in children have followed adenotonsillectomy in children with disordered breathing, the authors warned that “physicians cannot assume such problems will occur only” after such procedures.
“Given the increasing prevalence of obesity in the United States, it is likely that some patients presenting for nonotolaryngologic procedures may have undiagnosed sleep-disordered breathing and may also be at risk if they require extended postoperative analgesia,” they wrote. They called for better parental education regarding pain relief and more formal restrictions for its use in pediatrics.
The report did not use external funding, and the authors reported no relevant financial disclosures.
Our scientific understanding of the underlying mechanism for respiratory suppression sometimes seen in children taking codeine is increasing, but these safety concerns aren’t new. The clinical report from Tobias et al. provides a timeline for our awareness of, and organizational response to, the reports of adverse events that goes back several years. Sadly, the investigators also provide evidence that codeine prescription patterns haven’t significantly changed, even among pediatric medical professionals.
Change is difficult in all aspects of life, and medical practice is no different. But as pediatric caregivers, the burden is on us to model safe and effective pain management. There is simply no excuse for our continued prescription of a drug with questionable benefit that, in many patients, has such an unfavorable risk-benefit ratio. And this concern is even greater when codeine is recommended for pediatric cough, an indication lacking solid evidence of benefit.
Unfortunately, there are limited pharmaceutical options for treating pediatric pain and cough, and we are often compelled to attempt to fit our square pegs into the round hole of adult medicine. The report’s authors point out that perhaps maximizing the effectiveness of drugs with proven track records in children should be the focus of our efforts. Although not mentioned in the report, benefits from the low-hanging fruit of science-based nonpharmaceutical approaches should be similarly prioritized.
These comments were provided by Clay Jones, M.D., a neonatal hospitalist at Wellesley (Mass.) Hospital. Dr. Jones had no relevant financial disclosures.
The risks of using codeine to treat pain or cough in children may often outweigh the benefits, sometimes even leading to death, and call into question whether its widespread use should continue in pediatric patients, according to an American Academy of Pediatrics technical report.
“It is clear that one of the keys to improving analgesia and reducing opioid-related adverse effects is both provider and parental education regarding the effective use of nonopioid analgesics,” wrote Joseph D. Tobias, MD, and his colleagues from the AAP Committee on Drugs’ Section on Anesthesiology and Pain Medicine (Pediatrics 2016 Sept 19. doi: 10.1542/peds.2016-2396). “The answer may not lie in using more medication or different medications but merely using more effectively other options that are currently available.”
Individual patients respond differently to codeine because the conversion rates of the liver enzyme that metabolizes codeine into morphine, CYP2D6, vary greatly according to genetic differences. Some children experience no therapeutic effect at all while others have stopped breathing or died, particularly those who metabolize the drug extremely rapidly. Those with at least two copies of the CYP2D6 gene have a particularly elevated level of enzyme activity. Also at high risk for respiratory depression or death are children with obstructive sleep apnea.
Poor metabolizers, who therefore experience less effect from codeine, include disproportionately more individuals of Northern European descent. Ultrarapid metabolizers, on the other hand, comprise approximately 29% of patients of African/Ethiopian heritage and 21% from Middle Eastern countries. An estimated 3.4%-6.5% of African Americans and whites are ultrafast metabolizers. Genetic tests can identify those at higher risk, but even children with normal metabolism can experience severe adverse effects.
The World Health Organization removed codeine from its list of essential medications, the U.S. Food and Drug Administration added a black box warning to labels of codeine formulations used for tonsillectomy and/or adenoidectomy in children, and the European Medicines Agency recommended against using codeine in children under age 12 years and in those between 12 and 18 years who have breathing difficulties.
Yet research has shown that the use of codeine for pain relief in children remains very common; codeine is prescribed more than any other opioid in some studies. Otolaryngologists, dentists, pediatricians, and family practice physicians, respectively, prescribe it most often, likely because few safe, effective therapeutics exist for treating pain or cough in children. Oxycodone has been used as an alternative, but this drug also lacks adequate data on its use, and hydrocodone has similar concerns with rapid metabolizers.
Although most of the serious adverse events resulting in codeine use in children have followed adenotonsillectomy in children with disordered breathing, the authors warned that “physicians cannot assume such problems will occur only” after such procedures.
“Given the increasing prevalence of obesity in the United States, it is likely that some patients presenting for nonotolaryngologic procedures may have undiagnosed sleep-disordered breathing and may also be at risk if they require extended postoperative analgesia,” they wrote. They called for better parental education regarding pain relief and more formal restrictions for its use in pediatrics.
The report did not use external funding, and the authors reported no relevant financial disclosures.
FROM PEDIATRICS
Key clinical point: Codeine use in children carries significant risks, such as breathing depression and death.
Major finding: Children with African/Ethiopian and Middle Eastern descent are more likely to be rapid metabolizers of codeine and at greater risk for serious adverse effects.
Data source: A review of the most current literature on the adverse effects of codeine use in pediatric patients and guidance issued by regulatory and professional medical organizations.
Disclosures: The report did not use external funding, and the authors reported no relevant financial disclosures.
New Carotid Artery Stent Procedure to be Evaluated by SVS PSO
A surveillance project to evaluate the safety and effectiveness of transcarotid artery revascularization (TCAR) in comparison with carotid endarterectomy (CEA) is being launched by the Society for Vascular Surgery Patient Safety Organization (SVS PSO). Carotid artery stenting (CAS) and CEA are performed in patients with atherosclerotic narrowing of the carotid artery in order to reduce stroke risk.
In the TCAR procedure, a stent is inserted into the common carotid artery through a small neck incision (transcarotid), whereas typical carotid stents are inserted with a long catheter inserted in a groin artery (transfemoral) that must pass through the aorta to reach the carotid artery which is a potential source of stroke with the trans-femoral approach. During TCAR, stroke risk is also reduced by temporarily reversing blood flow direction in the carotid artery, so that any debris dislodged by the procedure will not travel to the brain where it could cause stroke. Initial publications suggest that TCAR may have a lower stroke rate than standard transfemoral CAS, potentially due to avoidance of a catheter manipulation in the aorta combined with carotid artery flow reversal.
The TCAR Surveillance Project is designed to obtain more data about real-world outcomes of TCAR in comparison with CEA as performed by centers participating in the Vascular Quality Initiative (VQI). The TCAR Surveillance Project will be directed by an SVS PSO Steering Committee that will make periodic analyses of data collected in the VQI CAS and CEA Registries.
The TCAR Surveillance Project was evaluated by the US Food and Drug Administration (FDA) and found scientifically valid and clinically relevant. Based on this, reimbursement for TCAR procedures performed by centers participating in the VQI TCAR Surveillance Project was approved on Sept. 1, 2016, by the Centers for Medicare and Medicaid Services (CMS) under the current National Coverage Determination.
The project requires that the procedure be performed in high surgical risk patients (asymptomatic or symptomatic) using FDA-approved or FDA-cleared devices labeled for the transcarotid approach and that data about the procedure and one-year follow-up be submitted to the VQI CAS Registry in order to qualify for Medicare coverage.
“We are very pleased about this collaboration between the SVS PSO, CMS and the FDA that has enabled this important study,” said Dr. Larry Kraiss, Chair of the PSO Governing Council. “It is through initiatives like the TCAR Surveillance Project that we can accomplish the SVS PSO mission, by using real-world registry data to evaluate and improve the care of our patients with carotid artery disease.”
Sites interested in participating in the project can enroll in the VQI CAS Registry if they do not already participate and obtain the National Clinical Trial identifier required for billing.
“The SVS applauds the efforts of its PSO to continually explore new and innovative ways to improve patient care,” said Dr. R. Clement Darling, President-Elect of the Society for Vascular Surgery. “We are excited to learn what this study will find, and encourage participation in the TCAR Surveillance Project.”
For further information about participating in the VQI CAS registry, please contact [email protected] or call (603) 298-5509.

CHMP recommends approval of ixazomib for MM

The European Medicines Agency’s Committee for Medicinal Products for Human Use (CHMP) has recommended that ixazomib (NinlaroTM) receive conditional marketing authorization.
The recommendation is for ixazomib in combination with lenalidomide and dexamethasone as a treatment for adults with multiple myeloma (MM) who have received at least 1 prior therapy.
The CHMP’s recommendation will be reviewed by the European Commission (EC).
If the EC grants the authorization, ixazomib will be the first oral proteasome inhibitor approved for use across the European Economic Area.
Ixazomib is being developed by Takeda Pharmaceutical Company Limited.
Phase 3 trial
The CHMP’s positive opinion of ixazomib is based on results from the phase 3 TOURMALINE-MM1 trial, which were presented at the 2015 ASH Annual Meeting.
The trial included 722 patients with relapsed or refractory MM. The patients were randomized to receive ixazomib, lenalidomide, and dexamethasone (IRd, n=360) or placebo, lenalidomide, and dexamethasone (Rd, n=362).
Baseline patient characteristics were similar between the treatment arms. Fifty-nine percent of patients in both arms had received 1 prior line of therapy, and 41% in both arms had 2 or 3 prior lines of therapy.
Seventy-eight percent of patients responded to IRd, and 72% responded to Rd (P=0.035). The rates of complete response were 12% and 7%, respectively (P=0.019).
At a median follow-up of about 15 months, the median progression-free survival was 20.6 months in the IRd arm and 14.7 months in the Rd arm. The hazard ratio was 0.742 (P=0.012).
At a median follow-up of about 23 months, the median overall survival had not been reached in either treatment arm.
The incidence of adverse events (AEs) was 98% in the IRd arm and 99% in the Rd arm. The incidence of grade 3 or higher AEs was 74% and 69%, respectively. The incidence of serious AEs was 47% and 49%, respectively.
Common AEs in the IRd and Rd arms, respectively, were diarrhea (45% vs 39%), constipation (35% vs 26%), nausea (29% vs 22%), vomiting (23% vs 12%), rash (36% vs 23%), back pain (24% vs 17%), upper respiratory tract infection (23% vs 19%), thrombocytopenia (31% vs 16%), peripheral neuropathy (27% vs 22%), peripheral edema (28% vs 20%), thromboembolism (8% vs 11%), and neutropenia (33% vs 31%).
About conditional authorization
Conditional marketing authorization represents an expedited path for approval. The EC grants this type of authorization before pivotal registration studies are completed.
Conditional marketing authorization is granted to products whose benefits are thought to outweigh their risks, products that address unmet needs, and products that are expected to provide a significant public health benefit.
If ixazomib receives conditional marketing authorization, Takeda will be required to provide post-approval updates on safety and efficacy analyses for TOURMALINE-MM1 and some other ongoing studies to demonstrate the treatment’s long-term effects. ![]()